downer edi limited abn 97 003 872 848 triniti business ... · 8/29/2017 · edinburgh business...
TRANSCRIPT

Page 1 of 1
29 August 2017
Company Announcements Office ASX Limited Exchange Centre Level 4, 20 Bridge Street SYDNEY NSW 2000
Dear Sir/Madam
Please find attached the following documents:
1. Appendix 4E – results for announcement to the market for the year ended 30 June 2017;
2. 2017 Annual Report;
3. Market release dated 29 August 2017;
4. Investor Presentation; and
5. Appendix 4G – Key to Disclosures Corporate Governance Principles and Recommendations.
Yours sincerely, Downer EDI Limited
Peter Tompkins Company Secretary
Downer EDI LimitedABN 97 003 872 848
Triniti Business Campus39 Delhi Road
North Ryde NSW 2113
1800 DOWNERwww.downergroup.com
For
per
sona
l use
onl
y

Results for announcement to the marketfor the year ended 30 June 2017
Appendix 4E
2017 2016 % $'m $'m change
Revenue from ordinary activities 7,267.1 6,846.2 Other income 20.3 3.8 Total revenue and other income from ordinary activities 7,287.4 6,850.0 6.4%
Total revenue including joint ventures and other income 7,812.3 7,393.9 5.7%
277.8 276.9 0.3%
181.5 180.6 0.5%
2017 2016 % cents cents change
Basic earnings per share (i) 35.8 38.0 (5.8%)
Diluted earnings per share (i) 35.0 35.9 (2.5%)
Net tangible asset backing per ordinary share 119.0 263.3 (54.8%)
Dividend 2017 2016Final Final
Dividend per share (cents) 12.0 12.0Franked amount per share (cents) 12.0 12.0Dividend record date 12/09/2017 18/08/2016Dividend payable date 10/10/2017 15/09/2016
Redeemable Optionally Adjustable Distributing Securities (ROADS)Dividend per ROADS (in Australian cents) 4.28 4.81 New Zealand imputation credit percentage per ROADS 100% 100%
ROADS payment date Quarter 1 Quarter 2 Quarter 3 Quarter 4Instalment date FY2017 15/09/2016 15/12/2016 15/03/2017 15/06/2017Instalment date FY2016 15/09/2015 15/12/2015 15/03/2016 15/06/2016
For commentary on the results for the year and review of operations, please refer to the Directors' Report andseparate media release attached.
Earnings before interest and tax
Profit from ordinary activities after tax attributable to members of the parent entity
(i) Basic and diluted earnings per share calculations for FY16 were restated to exclude the bonus element of the 169.9 million new shares issued from the capital raising made as part of the Spotless Group Holdings Limited takeover offer announced on 21 March 2017.
Downer EDI's Dividend Reinvestment Plan (DRP) has been suspended.For
per
sona
l use
onl
y

Dow
ner Annual Report 2017
Annual Report 2017
Relationships Creating Success
For
per
sona
l use
onl
y

For
per
sona
l use
onl
y

Annual Report 2017 1
Contents
Directors’ Report
Page 2
Auditor’s signed reports
Page 46 Auditor’s Independence Declaration Page 47 Independent Auditor’s Report
Financial Statements
Page 53 Consolidated Statement of Profit or Loss and Other Comprehensive Income Page 54 Consolidated Statement of Financial Position Page 55 Consolidated Statement of Changes in Equity Page 56 Consolidated Statement of Cash Flows
Notes to the consolidated financial statements
AAbout this report
Page 57-58
BBusiness performance
Page 59 -67
COperating assets and liabilities
Page 68-76
DEmployee benefits
Page 77
ECapital structure and financing
Page 78-86
FGroup structure
Page 87-96
GOther
Page 97-107
B1Segment information
C1Reconciliation of cash and cash equivalents
D1Employee benefits
E1Borrowings
F1Joint arrangements and associate entities
G1New accounting standards
B2Profit from ordinary activities
C2Trade and other receivables
D2Key management personnel compensation
E2Financing facilities
F2Acquisition of businesses
G2Capital and financial risk management
B3Earnings per share
C3Rendering of services and construction contracts
D3Employee discount share plan
E3Commitments
F3Disposal of subsidiary
G3Other financial assets and liabilities
B4Taxation
C4Inventories
E4Issued capital
F4Controlled entities
B5Remuneration of auditors
C5Trade and other payables
E5Reserves
F5Related party information
B6Subsequent events
C6Property, plant and equipment
E6Dividends
F6Parent entity disclosures
C7Intangible assets
C8Provisions
C9Contingent liabilities
Page 108 Directors’ Declaration
Other information
Page 109 Sustainability Performance Summary 2017Page 111 Corporate GovernancePage 119 Information for Investors
For
per
sona
l use
onl
y

2 Downer EDI Limited
Directors’ Reportfor the year ended 30 June 2017
The Directors of Downer EDI Limited submit the Annual Financial Report of the Company for the financial year ended 30 June 2017. In compliance with the provisions of the Corporations Act 2001 (Cth), the Directors’ Report is set out below.
Board of Directors
R M HARDING (68)
Chairman since November 2010, Independent Non‑executive Director since July 2008
Mr Harding has held management positions around the world with British Petroleum (BP), including President and General Manager of BP Exploration Australia.
Mr Harding is currently the Chairman of Lynas Limited and a Director of Cleanaway Waste Management Limited, a former Chairman of Roc Oil Company Limited and Clough Limited and a former Director of Santos Limited.
Mr Harding holds a Masters in Science, majoring in Mechanical Engineering.
Mr Harding lives in Sydney.
G A FENN (52)
Managing Director and Chief Executive Officer since July 2010
Mr Fenn has over 20 years’ experience in operational and financial management as well as strategic development. He joined Downer in October 2009 as Chief Financial Officer and was appointed Chief Executive Officer in July 2010.
Prior to joining Downer, Mr Fenn had a 14 year career at Qantas Airways Limited during which he held a number of senior roles and was a Member of the Executive Committee for 10 years. These roles included Executive General Manager of Strategy and Investments and Executive General Manager – Associated Businesses, responsible for the Airports, Freight, Flight Catering and Qantas Holidays businesses.
Mr Fenn is currently a Director of Sydney Airport Limited and he was previously Chairman of Star Track Express and a Director of Australian Air Express.
Mr Fenn holds a Bachelor of Economics from Macquarie University and is a member of the Australian Institute of Chartered Accountants. He worked at KPMG for eight years before he joined Qantas.
Mr Fenn lives in Sydney.
S A CHAPLAIN (59)
Independent Non‑executive Director since July 2008
Ms Chaplain is a former investment banker with extensive experience in public and private sector debt financing. She also has considerable experience as a Director of local and state government-owned corporations involved in road, water and port infrastructure.
Ms Chaplain is Chairman of Queensland Airports Limited and a Director of Seven Group Holdings Limited. Ms Chaplain is also Chairman of Canstar Pty Ltd, a financial services research and ratings company and a Director of The Australian Ballet. Her former Board roles include being a member of the Board of Taxation and a Director of PanAust Limited and EFIC, Australia’s export credit agency.
A Fellow of the Australian Institute of Company Directors, Ms Chaplain holds a Bachelor of Arts degree majoring in Economics and Mandarin in addition to a Masters of Business Administration (MBA) from the University of Melbourne. She holds an honorary doctorate from Griffith University for her service to banking and finance, and to the Gold Coast community.
Ms Chaplain lives on the Gold Coast.
P S GARLING (63)
Independent Non‑executive Director since November 2011
Mr Garling has over 35 years’ experience in the infrastructure, construction, development and investment sectors. He was the Global Head of Infrastructure at AMP Capital Investors, a role he held for nine years. Prior to this, Mr Garling was CEO of Tenix Infrastructure and a long-term senior executive at the Lend Lease Group, including five years as CEO of Lend Lease Capital Services.
Mr Garling is currently the Chairman of Tellus Holdings Limited and Energy Queensland Limited and a Director of Charter Hall Limited, Spotless Group Holdings Limited and the NSW electricity distributor, Essential Energy. Mr Garling is also the President of Water Polo Australia Limited.
Mr Garling holds a Bachelor of Building from the University of New South Wales and the Advanced Diploma from the Australian Institute of Company Directors. He is a Fellow of the Australian Institute of Building, Australian Institute of Company Directors and Institution of Engineers Australia.
Mr Garling lives in Sydney.For
per
sona
l use
onl
y

Annual Report 2017 3
T G HANDICOTT (54)
Independent Non‑executive Director since September 2016
Ms Handicott is a former corporate lawyer with over 30 years’ experience in mergers and acquisitions, capital markets and corporate governance. She was a partner of national law firm Corrs Chambers Westgarth for 22 years, serving as a member of its National Board for seven years including four years as National Chairman. She also has extensive experience in governance of local and state government organisations.
Ms Handicott is a Director of PWR Holdings Limited, LGE Holding Company Pty Ltd trading as Peak Services, a subsidiary of the Local Government Association of Queensland that is responsible for its commercial operations and Bangarra Dance Theatre. Ms Handicott is also a Divisional Councillor of the Queensland Division of the Australian Institute of Company Directors and a member of the Queensland University of Technology (QUT) Council and Sunshine Coast Council Economic Futures Advisory Board.
Ms Handicott is a former Director of CS Energy Limited, former member of the Takeovers Panel and Corporations and Markets Advisory Committee and a former Associate Member of the Australian Competition and Consumer Commission.
A Senior Fellow of Finsia and Member of the Australian Institute of Company Directors and Chief Executive Women, Ms Handicott holds a Bachelor of Laws (Hons) degree from the Queensland University of Technology.
Ms Handicott lives in Brisbane.
E A HOWELL (71)
Independent Non‑executive Director since January 2012
Ms Howell has over 40 years’ experience in the oil and gas industry in a number of technical and managerial roles. She was most recently Executive Vice President for Health, Safety & Security at Woodside Energy Limited and served as Executive Vice President of North West Shelf at Woodside. Before joining Woodside she was Managing Director of Apache Energy Ltd.
Ms Howell is currently a Director of MMA Offshore Limited and Buru Energy Limited. She is a Senior Advisor of African Geopolitics.
She has previously served on a number of Boards, including EMR Resources Pty Ltd where she held the position of Chairman, Tangiers Petroleum Limited where she held the position of Executive Chair, the Fremantle Port Authority, the Australian Petroleum Production & Exploration Association where she chaired the Environmental Affairs Committee and as a Board member and President of the Australian Mines and Metals Association.
Ms Howell holds a Bachelor of Science (with Honours in Geology and Mathematics) from the University of London, an MBA from Edinburgh Business School and is a Graduate of the Australian Institute of Company Directors.
Ms Howell lives in Perth.
C G THORNE (67)
Independent Non‑executive Director since July 2010
Dr Thorne has over 36 years’ experience in the mining and extraction industry, specifically in senior operational and executive roles with Rio Tinto. His experience spanned a range of product groups and functional activities in Australia and overseas. After serving in London as Group Mining Executive from 1996 to 1998, Dr Thorne moved to Indonesia as President Director of Kaltim Prima Coal and then returned to Australia to manage Rio Tinto’s Australian coal business as Managing Director of Rio Tinto Coal Australia and the publicly listed Coal and Allied Industries. He was President of the Queensland Resources Council in 2001-2003.
In 2006, Dr Thorne was appointed global head of Rio Tinto’s technology, innovation and project engineering functions, reporting to the Chief Executive. He was a member of Rio Tinto’s Executive Committee and Investment Committee. He retired from Rio Tinto in 2011.
Dr Thorne is a Director of Spotless Group Holdings Limited and a former Director of Wesley Research Institute, JK Tech and Queensland Energy Resources Limited. He is a Fellow of the Australasian Institute of Mining and Metallurgy.
Dr Thorne also holds directorships with a number of private companies.
He holds Bachelor and Doctoral degrees in Metallurgy from the University of Queensland and is a Graduate of the Australian Institute of Company Directors.
Dr Thorne lives on the Sunshine Coast.
For
per
sona
l use
onl
y

4 Downer EDI Limited
Directors’ Report – continuedfor the year ended 30 June 2017
Directors’ shareholdings
The following table sets out each Director’s relevant interest (direct and indirect) in shares, debentures, and rights or options in shares or debentures (if any) of the Company at the date of this report. No Director has any relevant interest in shares, debentures and rights or options in shares or debentures, of a related body corporate as at the date of this report.
DirectorNumber of Fully Paid
Ordinary SharesNumber of Fully Paid Performance Rights
Number of Fully Paid Performance Options
R M Harding 14,210 – –
G A Fenn* 826,226 1,757,163 –
S A Chaplain 103,799 – –
P S Garling 16,940 – –
T G Handicott 14,000 – –
E A Howell 14,000 – –
C G Thorne 82,922 – –
* Performance rights granted to Mr Fenn are subject to performance and/or service period conditions over the period 2014 to 2019. Further details regarding the conditions relating to these restricted shares and performance rights are outlined in sections 6.4 and 9.2 of the Remuneration Report.
Company Secretary
The Company Secretarial function is responsible for ensuring that the Company complies with its statutory duties and maintains proper documentation, registers and records. It also provides advice to Directors and officers about corporate governance and gives practical effect to any decisions made by the Board.
Mr Peter Tompkins was appointed Company Secretary on 27 July 2011. He has qualifications in law and commerce from Deakin University and corporate governance from the Governance Institute of Australia and is an admitted solicitor in New South Wales. Mr Tompkins joined Downer in 2008 and was appointed General Counsel in 2010.
Mr Peter Lyons was appointed joint Company Secretary on 27 July 2011. A member of CPA Australia and the Governance Institute of Australia, he has qualifications in commerce from the University of Western Sydney and corporate governance from the Governance Institute of Australia. Mr Lyons was previously Deputy Company Secretary and has been in financial and secretarial roles at Downer for over 15 years.
Review of operations
Principal Activities
Downer EDI Limited (Downer) is a leading provider of services to customers in markets including: Transport; Utilities; Rail; Engineering, Construction and Maintenance (EC&M); and Mining. Downer employs about 20,000 people, mostly in Australia and New Zealand but also in the Asia-Pacific region, South America and Southern Africa.
On 21 March 2017, Downer announced an offer, through its wholly owned subsidiary Downer EDI Services Pty Ltd, to acquire all of the issued share capital of Spotless Group Holdings Limited (Spotless) which it did not already own. Spotless employs over 30,000 people in Australia and New Zealand and provides outsourced facility services, catering and laundry services, technical and engineering services and refrigeration solutions to its customers in various industries.
The acquisition of Spotless delivers on Downer’s strategic objectives because it:
– continues Downer’s transformation towards a more services-focused business with resilient earnings;
– enhances the Group’s contract portfolio, with long-term contracts that provide high certainty over revenues;
– contributes a complementary, high quality customer base; and
– creates an integrated services provider with a comprehensive range of capabilities.
Divisional Activities
Downer reports its financial results under five service lines: Transport; Utilities; Rail; EC&M; and Mining.
The Utilities service line includes both the Utilities and Technology & Communications businesses.
For
per
sona
l use
onl
y
Annual Report 2017 5
On 27 June 2017, the Group’s ownership interest in Spotless Group Holdings Limited (Spotless) exceeded 50%, requiring the consolidation of Spotless’ financial statements from that time. The Directors have concluded that the profit or loss and cash flow impact attributable to Spotless for the three days to 30 June 2017 is not material to the Downer Group. Consequently, no revenue or earnings before interest and tax (EBIT) contribution from Spotless is included in the service lines outlined below.
A review of the operations and the performance of the five service lines is as follows:
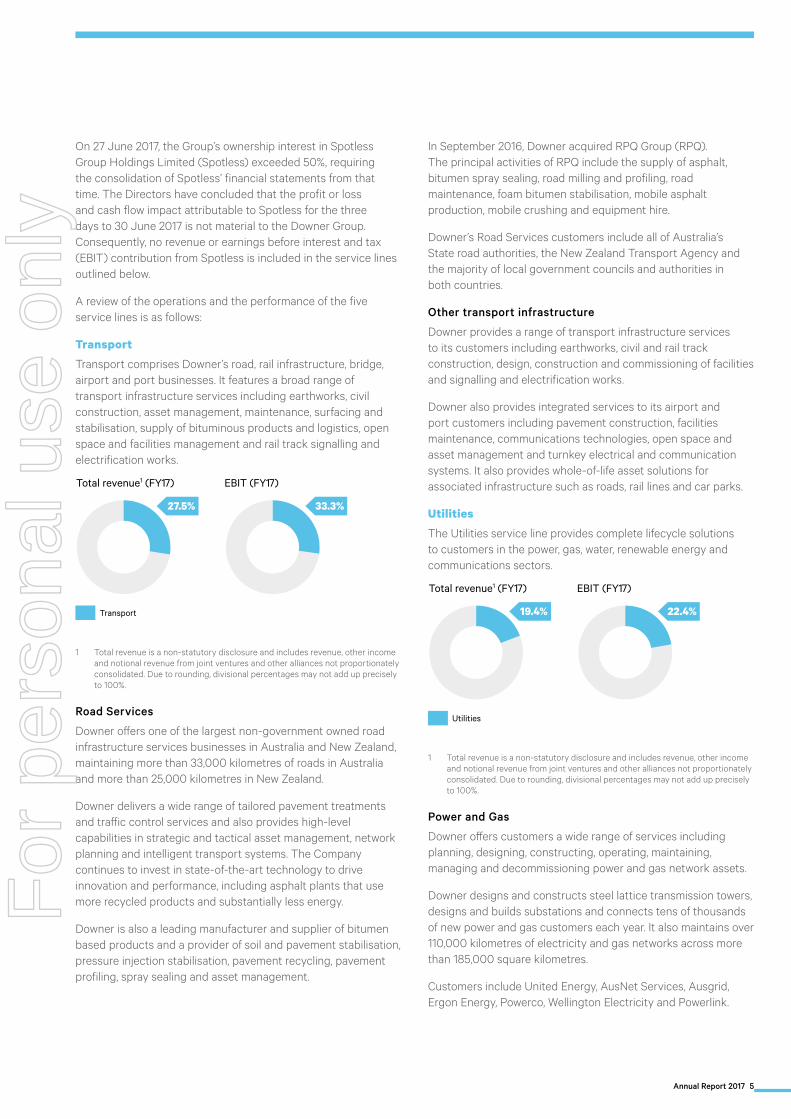
Transport
Transport comprises Downer’s road, rail infrastructure, bridge, airport and port businesses. It features a broad range of transport infrastructure services including earthworks, civil construction, asset management, maintenance, surfacing and stabilisation, supply of bituminous products and logistics, open space and facilities management and rail track signalling and electrification works.
Total revenue1 (FY17)
Transport
EBIT (FY17)
27.5% 33.3%
1 Total revenue is a non-statutory disclosure and includes revenue, other income and notional revenue from joint ventures and other alliances not proportionately consolidated. Due to rounding, divisional percentages may not add up precisely to 100%.
Road Services
Downer offers one of the largest non-government owned road infrastructure services businesses in Australia and New Zealand, maintaining more than 33,000 kilometres of roads in Australia and more than 25,000 kilometres in New Zealand.
Downer delivers a wide range of tailored pavement treatments and traffic control services and also provides high-level capabilities in strategic and tactical asset management, network planning and intelligent transport systems. The Company continues to invest in state-of-the-art technology to drive innovation and performance, including asphalt plants that use more recycled products and substantially less energy.
Downer is also a leading manufacturer and supplier of bitumen based products and a provider of soil and pavement stabilisation, pressure injection stabilisation, pavement recycling, pavement profiling, spray sealing and asset management.
In September 2016, Downer acquired RPQ Group (RPQ). The principal activities of RPQ include the supply of asphalt, bitumen spray sealing, road milling and profiling, road maintenance, foam bitumen stabilisation, mobile asphalt production, mobile crushing and equipment hire.
Downer’s Road Services customers include all of Australia’s State road authorities, the New Zealand Transport Agency and the majority of local government councils and authorities in both countries.
Other transport infrastructure
Downer provides a range of transport infrastructure services to its customers including earthworks, civil and rail track construction, design, construction and commissioning of facilities and signalling and electrification works.
Downer also provides integrated services to its airport and port customers including pavement construction, facilities maintenance, communications technologies, open space and asset management and turnkey electrical and communication systems. It also provides whole-of-life asset solutions for associated infrastructure such as roads, rail lines and car parks.
Utilities
The Utilities service line provides complete lifecycle solutions to customers in the power, gas, water, renewable energy and communications sectors.
Total revenue1 (FY17)
Utilities
EBIT (FY17)
19.4% 22.4%
1 Total revenue is a non-statutory disclosure and includes revenue, other income and notional revenue from joint ventures and other alliances not proportionately consolidated. Due to rounding, divisional percentages may not add up precisely to 100%.
Power and Gas
Downer offers customers a wide range of services including planning, designing, constructing, operating, maintaining, managing and decommissioning power and gas network assets.
Downer designs and constructs steel lattice transmission towers, designs and builds substations and connects tens of thousands of new power and gas customers each year. It also maintains over 110,000 kilometres of electricity and gas networks across more than 185,000 square kilometres.
Customers include United Energy, AusNet Services, Ausgrid, Ergon Energy, Powerco, Wellington Electricity and Powerlink.
For
per
sona
l use
onl
y

6 Downer EDI Limited
Directors’ Report – continuedfor the year ended 30 June 2017
Water
Downer provides complete water lifecycle solutions for municipal and industrial water users, with expertise including waste and waste water treatment, pumping and water transfer, desalination and water re-use, and abstraction and dewatering.
Downer supports its customers across the full asset lifecycle from the conceptual development of a project through design, construction, commissioning and optimisation, providing complete water lifecycle solutions for municipal and industrial water users including pipe bursting and civil maintenance. Downer also operates and maintains treatment, storage, pump station and network assets.
In March 2017, Downer acquired ITS PipeTech Pty Ltd (ITS). The principal activities of ITS include pipe bursting and civil maintenance.
Customers include Logan City Council, Mackay Regional Council, Melbourne Water, Queensland Urban Utilities, Tauranga City Council, Yarra Valley Water, Wagga Wagga City Council and Watercare.
Renewable energy
Downer is one of Australia’s largest and most experienced providers in the renewable energy market, offering design, build and maintenance services for wind farms, wind turbine sites and solar farms.
Downer offers the services required for the entire asset lifecycle including procurement, assembly, construction and commissioning.
Downer is currently working on the Clare and Ross River Solar Farms in Queensland, while having completed the Ararat Wind Farm Project (Victoria), and the Sunshine Coast Solar Farm (Queensland) during the year.
Communications
Downer provides an end-to-end service offering comprising feasibility, design, civil construction, network construction, commissioning, testing, operations and maintenance across fibre, copper and radio networks in Australia and New Zealand.
Customers include nbn™, Telstra, Chorus, Spark and Vodafone.
Rail
Downer provides total rail asset solutions including freight and passenger build, operations and maintenance, component overhauls and after-market services.
Total revenue1 (FY17)
Rail
EBIT (FY17)
10.9% 8.1%
1 Total revenue is a non-statutory disclosure and includes revenue, other income and notional revenue from joint ventures and other alliances not proportionately consolidated. Due to rounding, divisional percentages may not add up precisely to 100%.
Downer provides services to a range of public and private sector rail customers with capabilities spanning the provision, maintenance and overhaul of passenger and freight rolling stock, as well as importing and commissioning completed locomotive units for use in the resources sector.
Downer operates two fleet control centres, focused on monitoring and management of passenger and freight fleets on behalf of its customers; and four manufacturing plants.
Downer has formed strategic joint ventures and relationships with leading technology and knowledge providers to support its growth objectives in the passenger and freight market. These include Keolis, Electro-Motive Diesel (owned by Caterpillar), and CRRC Changchun Railway Vehicles (CRRC).
The Keolis Downer joint venture is Australia’s largest private provider of multi-modal public transport solutions, with contracts to operate and maintain Yarra Trams in Melbourne, the Gold Coast light rail system in Queensland and a new integrated public transport system for the city of Newcastle. Keolis Downer also owns Australian Transit Enterprises (ATE), one of Australia’s largest route, school and charter bus businesses. ATE operates a fleet of over 900 buses in South Australia, Western Australia and Queensland.
Customers include Sydney Trains, Transport for NSW, Queensland Rail, Public Transport Authority (WA), Metro Trains Melbourne, Public Transport Victoria, Pacific National, Aurizon, BHP Billiton, Genesee & Wyoming and SCT Logistics.
Downer is currently working on the Sydney Growth Trains (SGT) project in New South Wales and the High Capacity Metro Trains (HCMT) project in Victoria.
For
per
sona
l use
onl
y

Annual Report 2017 7
Engineering, Construction and Maintenance (EC&M)
Downer works with customers in the public and private sectors delivering services including design, engineering, construction, maintenance and ongoing management of critical assets.
Total revenue1 (FY17)
EC&M
EBIT (FY17)
25.6% 14.0%
1 Total revenue is a non-statutory disclosure and includes revenue, other income and notional revenue from joint ventures and other alliances not proportionately consolidated. Due to rounding, divisional percentages may not add up precisely to 100%.
Multi-disciplined teams project manage and self-execute a wide range of services for greenfield and brownfield projects across a range of industry sectors including: oil and gas; power generation; commercial / non-residential; iron ore; coal; and industrial materials. These services are delivered on complex mining and industrial sites as well as commercial operations with critical infrastructure requirements such as data centres, airport facilities and hospitals.
Downer supports customers across all stages of the project lifecycles with services including:
– feasibility studies;
– engineering design;
– civil works;
– structural, mechanical and piping;
– electrical and instrumentation;
– mineral process equipment design and manufacture;
– commissioning;
– operations maintenance;
– shutdowns, turnarounds and outages;
– strategic asset management; and
– decommissioning.
In March 2017, Downer acquired the businesses of Hawkins. The principal activities of Hawkins include construction, infrastructure development and project management throughout New Zealand.
Customers in Australia include Alcoa, Bechtel, BHP Billiton, Chevron, Landcorp, Newcrest, Orica, Origin Energy, POSCO, Powerlink Queensland, Rio Tinto, Santos, Transgrid, Wesfarmers and Woodside Energy.
Key customers in New Zealand include Christchurch and Auckland City Councils, Auckland University, Auckland and Wellington Airports and the Ministry of Education.
Mining
Downer is one of Australia’s leading diversified mining contractors serving its customers across more than 50 sites in Australia, Papua New Guinea, South America and Southern Africa.
Total revenue1 (FY17)
Mining
EBIT (FY17)
16.6% 22.3%
1 Total revenue is a non-statutory disclosure and includes revenue, other income and notional revenue from joint ventures and other alliances not proportionately consolidated. Due to rounding, divisional percentages may not add up precisely to 100%.
Downer’s Mining division generates its revenues primarily from open cut mining and blasting services, with contributions also from tyre management and underground mining. Downer supports its customers at all stages of the mining lifecycle including:
– asset management;
– blasting services, explosives manufacture and supply;
– civil projects (mine site infrastructure);
– crushing;
– exploration drilling;
– mine closure and mine site rehabilitation;
– mobile plant maintenance;
– open cut mining;
– training and development for ATSI employees;
– tyre management (through the subsidiary Otraco International); and
– underground mining.
Customers include BHP Mitsubishi Alliance, Glencore, Idemitsu Australia Resources, Karara Mining, Milmerran Power Partners, Newmarket Gold, Newmont, Rio Tinto, Roy Hill Iron Ore, Stanwell Corporation and Yancoal Australia.
For
per
sona
l use
onl
y

8 Downer EDI Limited
Directors’ Report – continuedfor the year ended 30 June 2017
Spotless
Spotless operates in Australia and New Zealand and provides outsourced facility services, catering and laundry services, technical and engineering services, maintenance and asset management services and refrigeration solutions to various industries. Its customers include corporations and government departments, agencies and authorities at the Federal, State and Municipal level.
The financial results of Spotless will be reported as a separate service line from 1 July 2017.
Group Financial Performance
For the 12 months ended 30 June 2017, Downer reported increases in total revenue, earnings before interest and tax (EBIT) and net profit after tax (NPAT).
As stated above, the Directors have concluded that the profit or loss and cash flow impact attributable to Spotless for the three days to 30 June 2017 is not material to the Downer Group, and have commenced the consolidation of Spotless with effect from 30 June 2017.
The consolidated profit or loss and consolidated cash flow of the Group for the year ended 30 June 2017 does not include any trading performance for Spotless.
Revenue and other income
Total revenue for the Group increased by $0.4 billion, or 5.7%, to $7.8 billion.
Transport revenue increased 16.4% to $2.2 billion. This was due to continuing strong performance on existing contracts, improved contribution from Infrastructure Projects, including Newcastle Light Rail, and the acquisition of RPQ.
Utilities revenue increased 19.1% to $1.5 billion, due to new contracts in the renewable energy, power and gas, and water sectors in Australia and New Zealand and strong contributions from nbn™ contracts in Australia and the Chorus contract in New Zealand.
Rail revenue increased 2.9% to $850.2 million driven by the Sydney Growth Trains (SGT) and High Capacity Metro Trains (HCMT) projects and the sale of locomotives. These improvements were offset by the completion of freight build manufacturing contracts.
EC&M revenue increased 6.2% to $2.0 billion due to increased activities on the Wheatstone project and contribution from the Hawkins acquisition, offset by significant projects completed in the prior year not being fully replaced.
Mining revenue decreased 18.5% to $1.3 billion mainly as a result of the completion of the Christmas Creek contract in September 2016.
Unallocated includes intersegment sales elimination and $19.8 million other income and fair value gain on revaluation of the initial 19.99% interest equivalent in Spotless.
Expenses
Total expenses increased by 6.7% which is in line with the 5.7% increase in total revenue.
Employee benefits expenses increased by 1.0% to $2.8 billion and represent 39.6% of Downer’s cost base. This increase is mainly due to higher activity across the Group and a more labour intensive contract base compared to the prior period. In addition, the Group Risk Management and business development functions have increased commensurate with the additional bidding and projects activities.
Subcontractor costs increased by 19.6% to $1.7 billion and represent 24.8% of Downer’s cost base. The increase is as a result of higher activities and the change in the subcontractor mix on some contracts. The continued use of subcontracting accords with the Group’s strategy to retain cost base variability.
Raw materials and consumables expense increased 15.5% to $1.4 billion and represents 19.3% of Downer’s cost base. The increase is the net impact of raw material requirements for new projects (particularly in Utilities, Transport and Rail) offset by lower requirements in Mining.
Plant and equipment costs decreased 13.3% to $502.8 million and represents 7.2% of Downer’s cost base. The reduction largely reflects the continued reduction in operating leased assets coupled with increased utilisation of owned assets, more efficient maintenance practices and scope reduction on some Mining contracts.
Depreciation and amortisation decreased by 14.9% to $220.2 million and represents 3.1% of Downer’s cost base. This decrease is predominantly due to reduced activities in the Mining business.
Other expenses, communication, travel, occupancy and professional fees have increased by 16.7% to $424.0 million and represent 6.0% of Downer’s cost base. Other expenses include $15.2 million of transaction costs relating to Spotless and $13.0 million of bid costs written-off.
For
per
sona
l use
onl
y

Annual Report 2017 9
Earnings
EBIT for the Group increased 0.3% to $277.8 million, with increased earnings in Transport and Rail offset by the impact of contract completions not fully replaced in Mining and EC&M. Statutory Net Profit After Tax (NPAT) for the Group increased 0.5% to $181.5 million. This included a pre-tax $19.8 million fair value gain on revaluation of the initial 19.99% investment in Spotless and other income, offset by $15.2 million of Spotless transaction costs. Excluding the impact of the Spotless transaction, NPAT was $181.4 million with no operating earnings from Spotless included in this result as it is considered not material to the Downer Group.
Details of the impact of the Spotless transaction on the Group’s EBIT and NPAT are set out below and also disclosed in Note B2(b) in this Annual Report:
2017 $’m
Earnings before interest and tax
Net finance (cost) / income
Income tax expense
Profit after income tax
Underlying results 273.2 (28.5) (63.3) 181.4Spotless transaction costs (15.2) – – (15.2)
Gains and other income related to Spotless 19.8 1.7 (6.2) 15.3
4.6 1.7 (6.2) 0.1 Statutory results 277.8 (26.8) (69.5) 181.5
Transport EBIT increased 20.2% to $124.6 million due to strong performances in Road Services, including the successful integration of RPQ, and in Infrastructure Projects.
Utilities EBIT increased 17.8% to $84.1 million driven by continued strong performance in Australia from renewable energy projects and nbn™, and improved performance in New Zealand.
Rail EBIT increased $15.9 million to $30.3 million reflecting improved profitability across contracts, benefits from cost saving initiatives following a restructure in the prior period, and improved performance by joint venture operations.
EC&M EBIT increased 8.5% to $52.3 million with continued strong performance on the Wheatstone project, improved results from the resources related consultancies (QCC Resources and Mineral Technologies), and contributions from the Hawkins acquisition and new contracts in New Zealand.
Mining EBIT decreased 35.8% to $83.4 million predominantly due to the completion of the Christmas Creek contract.
Corporate costs increased by $5.7 million, or 7.3%, to $83.5 million, due to consultancy costs and investment in the IT Transformation program.
Net finance costs decreased by $6.2 million, or 18.8%, to $26.8 million due to a lower average net debt balance during the year following amortisation of facilities in the normal course, higher monthly cash balances and higher yields on term deposits.
The effective tax rate of 27.7% is lower than the statutory rate of 30.0% due to non-assessable R&D incentives, non-taxable distributions from joint ventures and lower overseas tax rates.
For
per
sona
l use
onl
y

10 Downer EDI Limited
Directors’ Report – continuedfor the year ended 30 June 2017
Divisional Financial Performance
Transport
($m) (%)
FY13 FY14 FY15 FY16 FY17
EBIT marginRevenue
6.0
5.0
4.0
3.0
2.0
1.0
0.0
2,400
1,800
1,200
600
0
– Total revenue of $2.2 billion, up 16.4%;
– EBIT of $124.6 million, up 20.2%;
– EBIT margin of 5.8%, up 0.2 ppts;
– ROFE of 22.2%, up from 19.3%; and
– Work-in-hand of $6.3 billion.
Utilities
($m) (%)
EBIT marginRevenue
1,600
1,200
800
400
0FY13 FY14 FY15 FY16 FY17
6.0
5.0
4.0
3.0
2.0
1.0
0.0
– Total revenue of $1.5 billion, up 19.1%;
– EBIT of $84.1 million, up 17.8%;
– EBIT margin of 5.5%, down 0.1 ppts;
– ROFE of 22.7%, up from 18.6%; and
– Work-in-hand of $3.6 billion.
Rail
($m) (%)
EBIT marginRevenue
5.0
4.0
3.0
2.0
1.0
0.0
1,600
1,200
800
400
0FY13 FY14 FY15 FY16 FY17
– Total revenue of $850.2 million, up 2.9%;
– EBIT of $30.3 million, up 110.4%;
– EBIT margin of 3.6%, up from 1.7%;
– ROFE of 7.3%, up from 3.4%; and
– Work-in-hand of $8.0 billion.
Engineering, Construction and Maintenance (EC&M)
($m) (%)
EBIT marginRevenue
3,000
2,000
1,000
0FY13 FY14 FY15 FY16 FY17
6.0
5.0
4.0
3.0
2.0
1.0
0.0
– Total revenue of $2.0 billion, up 6.2%;
– EBIT of $52.3 million, up 8.5%;
– EBIT margin of 2.6%, unchanged;
– ROFE of 22.9%, unchanged; and
– Work-in-hand of $2.6 billion.
Mining
($m) (%)
EBIT marginRevenue
10.0
8.0
6.0
4.0
2.0
0.0
3,000
2,000
1,000
0FY13 FY14 FY15 FY16 FY17
– Total revenue of $1.3 billion, down 18.5%;
– EBIT of $83.4 million, down 35.8%;
– EBIT margin of 6.4%, down 1.7 ppts
– ROFE of 13.2%, down from 19.0%; and
– Work-in-hand of $2.0 billion.
For
per
sona
l use
onl
y

Annual Report 2017 11
Group Financial Position
Funding, liquidity and capital are managed at Group level, with Divisions focused on working capital and operating cash flow management.
As previously mentioned, the Group obtained control of Spotless from 27 June 2017 and the Directors have concluded that Spotless’ profit or loss and cash flow impact for the three days to 30 June 2017 is not material to the Downer Group. Consequently, the following commentary on operating and investing cash flow does not include any contribution from Spotless, while debt and bonding and the financial position commentary below is inclusive of Spotless’ balance sheet contribution, given that the Spotless balance sheet has been consolidated into the Downer Group.
Operating Cash Flow
Operating cash flow was strong at $441.6 million, though down 1.4% from last year due to completion of contracts, and higher taxes paid. Operating cash flow / EBITDA conversion remained strong at 103.1%, showing a high correlation between earnings and cash.
Investing Cash
Total investing cash flow was $995.8 million, up $790.3 million. The increase was driven by the acquisitions of Spotless, Hawkins, RPQ, ITS and AGIS in the current year for a combined total net cash consideration of $779.3 million.
Excluding acquisitions, investing cash flow would have been $216.5 million, $12.1 million higher than prior year, primarily due to capital expenditure in Mining and the acquisition of an asphalt plant in Western Australia.
Debt And Bonding
The Group’s performance bonding facilities totalled $1,923.8 million at 30 June 2017. With $738.3 million undrawn, there is sufficient capacity to support the ongoing operations of the Group.
As at 30 June 2017, Downer had liquidity of $2,034.6 million comprising cash balances of $844.6 million and undrawn committed debt facilities of $1,190.0 million.
The Group continues to be rated BBB (Stable) by Fitch Ratings.
Balance Sheet
The net assets of Downer increased by 71.7% to $3.6 billion as a result of the consolidation of Spotless’ balance sheet, following the Group obtaining control of Spotless on 27 June 2017. Consequently, the following commentary is inclusive of Spotless’ acquired assets and liabilities.
Cash and cash equivalents increased by $275.2 million, or 48.3%, to $844.6 million. The increase reflects strong cash contributions from operations, $66.0 million of Spotless cash at 30 June 2017, and $279.2 million of unutilised funds from the capital raising of $989.9 million to fund the Spotless takeover.
Net debt increased from $87.4 million at 30 June 2016 to $620.2 million at 30 June 2017 primarily due to $787.5 million net debt from Spotless. The strong cash and increased net debt position resulted in 14.7% gearing (net debt to net debt plus equity) at 30 June 2017, up from 4.0% in the prior year. The present value of operating lease commitments for plant and equipment also increased from $128.5 million at June 2016 to $151.5 million, representing an off balance sheet gearing of 17.7%, up from 9.4% in the prior year.
Trade and other receivables increased $689.7 million, of which $486.1 million was attributable to the Spotless acquisition. Excluding Spotless, trade debtor days (excluding WIP) for the Group increased by 3.7 days, from 23.6 to 27.3 days. Trade debtor days (including WIP) for the Group increased by 5.7 days, from 57.7 days at June 2016 to 63.4 days.
Inventories were $301.7 million at June 2017, including $32.0 million attributable to Spotless. The decrease of $25.5 million reflects a reduction in components and spare parts as a result of project completions, tight inventory management, and the sale of locomotives.
Current tax assets decreased by $0.8 million to $45.5 million due to the timing of cash tax payments.
Interest in joint ventures and associates increased by $6.4 million, as $17.9 million of distributions received were offset by Downer’s share of net profits from joint ventures and associates of $22.5 million with an additional $1.8 million from the Spotless acquisition.
The net value of Property Plant and Equipment increased by $306.9 million, principally due to $281.2 million following the consolidation of Spotless, and $26.2 million from other acquisitions, with capex spend in the year exceeding depreciation in response to the change in market conditions.F
or p
erso
nal u
se o
nly

12 Downer EDI Limited
Directors’ Report – continuedfor the year ended 30 June 2017
Intangible assets increased by $1.9 billion due to goodwill and other acquired intangible assets following the acquisitions of Spotless, Hawkins, RPQ, ITS and AGIS, as well as the Group’s investment in IT systems.
Deferred tax assets increased by $59.4 million and relates to Spotless tax losses and temporary differences for employee and other provisions.
Trade and other payables increased by $768.0 million, including a $393.2 million increase from the consolidation of Spotless. This increase is primarily as a result of higher business activities and includes $110.8 million in relation to Spotless share acceptances unpaid at 30 June 2017. Excluding Spotless, trade creditor days decreased by 9.0 days from 37.2 days at June 2016 to 28.2 days. Trade and other payables represents 46.3% of Downer’s total liabilities.
Total drawn borrowings of $1,445.0 million represent 37.3% of Downer’s total liabilities and has increased by $795.0 million mainly as a result of $848.3 million debt that has been assumed pursuant to the consolidation of Spotless, offset by repayments of debt in the normal course.
Other financial liabilities of $45.5 million increased by $29.7 million and represents 1.2% of Downer’s total liabilities. The increase reflects $20.2 million of contingent consideration payable through the business acquisitions of AGIS, RPQ and ITS, further advances from JVs and a higher mark to market revaluation on cross-currency and interest rate swaps.
Deferred tax liability decreased by $1.5 million to $56.2 million and is primarily due to temporary differences in WIP and accrued income.
Provisions of $523.4 million increased by $159.2 million ($162.7 million from the Spotless acquisition) and represents 13.5% of Downer’s total liabilities. Employee provisions (annual leave and long service leave) made up 77.1% of this balance with the remainder covering onerous contracts provisions and return conditions obligations for leased assets and property and warranty obligations.
Shareholder equity increased by $1.5 billion as a result of the $993.0 million capital raising (net of equity raising costs and tax), a $435.2 million non-controlling interest in Spotless and $181.5 million net profit after tax. This was partially offset by $110.6 million of dividend payments made during the year.
Dividends
The Downer Board resolved to pay a fully franked final dividend of 12.0 cents per share (12.0 cents per share in the prior corresponding period), payable on 10 October 2017 to shareholders on the register at 12 September 2017.
The Board also determined to continue to pay a fully imputed dividend on the ROADS security, which having been reset on 15 June 2017 has a yield of 6.05% per annum payable quarterly in arrears, with the next payment due on 15 September 2017. As this dividend is fully imputed (the New Zealand equivalent of being fully franked), the actual cash yield paid by Downer will be 4.36% per annum for the next 12 months.
Zero Harm
Downer’s Lost Time Injury Frequency Rate (LTIFR) reduced from 0.66 to 0.55 while Total Recordable Injury Frequency Rate (TRIFR) increased from 3.32 to 3.50 per million hours worked.
TRIFRLTIFR
LTIF
R
TRI
FR
Downer Group Safety Performance (12-month rolling frequency rates)
Jun-
16
Sep-
16
Dec
-16
Mar
-17
Jun-
17
0.0
0.1
0.2
0.3
0.4
0.5
0.6
0.7
0.8
3.0
3.2
3.4
3.6
3.8
4.0
4.2
0.66 0.55
3.32
3.50
For
per
sona
l use
onl
y

Annual Report 2017 13
Group Business Strategies and Prospects for Future Financial Years
Downer’s strategy focuses on safety, driving improvement in existing businesses, investing in growth, and creating new positions. Downer’s strategic objectives, prospects, and the risks that could adversely affect the achievement of these objectives, are set out in the table below.
Strategic Objective Prospects Risks and risk management
Maintain focus on Zero Harm
Zero Harm is embedded in Downer’s culture and is fundamental to the Company’s future success. It requires constant vigilance and focus at all levels of the Downer business to ensure the Company meets its desired objective of ensuring that all staff, suppliers and subcontractors return home each night incident and injury free.
Downer has sought to mitigate risks by assessing, understanding and mitigating the “critical risks” facing Downer and implementing Cardinal Rules which provide direction and guidance on these critical risks.
Improve value and service for customers and their customers
Providing valuable and reliable products and services to Downer’s customers, and their customers, is at the very heart of Downer’s culture. It enables Downer’s customers to focus more on their core expertise whilst Downer delivers non-core operational services.
Through ongoing analysis of markets, customers and competitors, Downer is well positioned to improve value and service for its customers and their customers.
Relationships creating success continues to be Downer’s core operating philosophy that drives delivery of projects and services. It helps to ensure investment, initiatives and activities are focused on helping the Group’s customers to succeed. Risks to be managed include:
– commoditisation of core products and services, which affects margins;
– not keeping pace with changing customer expectations for service improvements; and
– lack of focus on customer feedback channels.
Position for greater government outsourcing
Following the acquisition of Spotless, Downer is the largest and most diverse services contractor in the Asia-Pacific region with over $10 billion in annual revenues. This scale and breadth gives Downer greater resilience to withstand economic headwinds when they arise.
Downer is well positioned to pursue government outsourcing opportunities in the Australian and New Zealand markets now and into the future.
Government outsourcing provides a high level of opportunity for Downer as budgets tighten and citizens desire more service from less spend. Risks to be managed include:
– longer procurement contract durations reducing opportunities to tender for new opportunities;
– commoditisation of long-term contracts; and
– introduction of foreign and technology based competitors that bring a different value proposition.
Leverage opportunities that will emerge from greater urbanisation in major cities
As cities become larger and more complex, opportunities will emerge for Downer in connecting, managing and monitoring their core infrastructure. This will include transport infrastructure, public transport, utilities, telecommunications, and other technology platforms.
Downer is well positioned to work with governments and citizens to understand and shape the infrastructure and networks that will underpin the megacities of the future.
Greater urbanisation is likely to result in a consolidation of competition, opportunities, and capital. Risks to be managed include:
– intensification of competition as customers converge into large single market procurement channels;
– introduction of foreign and technology based competitors that bring a different value proposition; and
– greater investment in technology.
For
per
sona
l use
onl
y
14 Downer EDI Limited
Directors’ Report – continuedfor the year ended 30 June 2017
Strategic Objective Prospects Risks and risk management
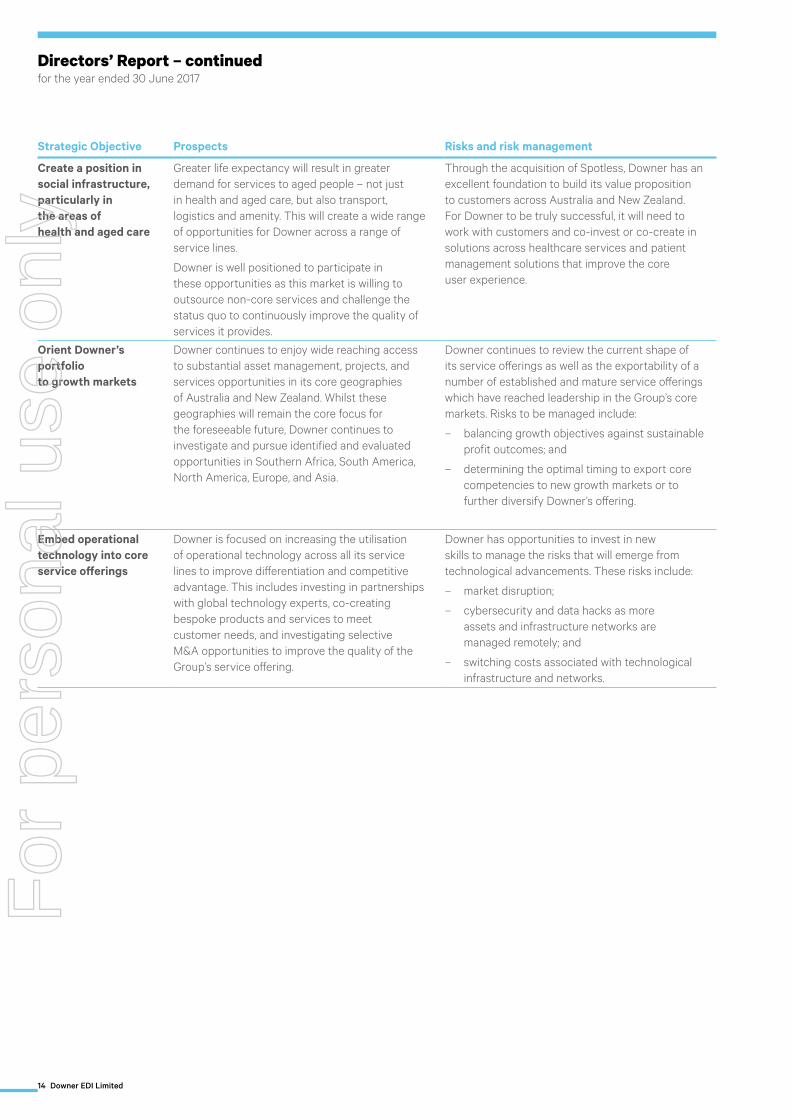
Create a position in social infrastructure, particularly in the areas of health and aged care
Greater life expectancy will result in greater demand for services to aged people – not just in health and aged care, but also transport, logistics and amenity. This will create a wide range of opportunities for Downer across a range of service lines.
Downer is well positioned to participate in these opportunities as this market is willing to outsource non-core services and challenge the status quo to continuously improve the quality of services it provides.
Through the acquisition of Spotless, Downer has an excellent foundation to build its value proposition to customers across Australia and New Zealand. For Downer to be truly successful, it will need to work with customers and co-invest or co-create in solutions across healthcare services and patient management solutions that improve the core user experience.
Orient Downer’s portfolio to growth markets
Downer continues to enjoy wide reaching access to substantial asset management, projects, and services opportunities in its core geographies of Australia and New Zealand. Whilst these geographies will remain the core focus for the foreseeable future, Downer continues to investigate and pursue identified and evaluated opportunities in Southern Africa, South America, North America, Europe, and Asia.
Downer continues to review the current shape of its service offerings as well as the exportability of a number of established and mature service offerings which have reached leadership in the Group’s core markets. Risks to be managed include:
– balancing growth objectives against sustainable profit outcomes; and
– determining the optimal timing to export core competencies to new growth markets or to further diversify Downer’s offering.
Embed operational technology into core service offerings
Downer is focused on increasing the utilisation of operational technology across all its service lines to improve differentiation and competitive advantage. This includes investing in partnerships with global technology experts, co-creating bespoke products and services to meet customer needs, and investigating selective M&A opportunities to improve the quality of the Group’s service offering.
Downer has opportunities to invest in new skills to manage the risks that will emerge from technological advancements. These risks include:
– market disruption;
– cybersecurity and data hacks as more assets and infrastructure networks are managed remotely; and
– switching costs associated with technological infrastructure and networks.
For
per
sona
l use
onl
y

Annual Report 2017 15
The following table provides an overview of the key prospects relevant to each of Downer’s service lines and summarises Downer’s intended strategic response across each sector to maximise the Company’s performance and realise future opportunities.
Service line Prospects Downer’s response
Transport The market for transport infrastructure and services continues to exhibit good growth in both Australia and New Zealand, as respective governments invest in a range of projects to reduce congestion, improve mobility, and provide better linkages between communities.
The urban nature of this investment allows Downer to leverage core resources into these opportunities and build a strong pipeline of revenue.
As a market leader in Australia and New Zealand, Downer is well positioned to capitalise on future transport opportunities. In particular, focus will be upon the markets for road maintenance services, road surfacing and bitumen supply, and rail infrastructure delivery.
Downer continues to innovate across its core service offerings, to ensure it brings to customers global insights and competitively benchmarked solutions. It also continues to selectively acquire scale where this creates value for shareholders.
Utilities Growth across power and gas utility markets is multi-faceted with a good pipeline of prospects in both Australia and New Zealand. In Australia, growth will be driven by prospects in electricity transmission and distribution, as well as significant new capital projects in the renewable energy market. In New Zealand, increasing demand from a growing population is seeing higher levels of activity across the water and power & gas sectors.
Activity in telecommunications markets continues to be dynamic, with large capital builds in both Australia and New Zealand coming to a close. However, increasing demand for data services will see a solid baseload of activity in this sector remain.
Downer has market leading positions in the electricity, water, gas and telecommunications sectors in both Australia and New Zealand.
Downer is strongly positioned to take advantage of the growth opportunities available in these sectors, with a demonstrable track record of excellence in service delivery, and a greater focus on introducing operational technology to improve the value we bring to customers.
The business is focused on maximising its share of the outsourced ‘poles and wires’ services market. It is also turning its attention towards participating in the market for the ‘Internet of Things’, such as through the installation and monitoring of sensors on critical infrastructure.
Rail The manufacture and associated servicing of rail rolling stock continues to be a strong growth market for Downer. Major procurement activities have been undertaken in Queensland, NSW and Victoria in recent years, with the resulting volume of work continuing to permeate the market.
Looking forward, potential outsourcing and franchising opportunities may further expand Downer’s portfolio in public transport operations.
Downer’s rail asset management model is a clear market leader which brings a strong focus on ‘return on investment’ – i.e. increasing fleet availability and reliability for customers’ customers.
Downer maintains strong strategic partnerships with leading global transport solutions providers and, through this model, is pursuing opportunities in rolling stock manufacture and maintenance and transport network operations and maintenance.
The Keolis Downer joint venture is a leading Australian multi-modal transport operator, through its light rail and bus operations.
For
per
sona
l use
onl
y

16 Downer EDI Limited
Directors’ Report – continuedfor the year ended 30 June 2017
Service line Prospects Downer’s response
EC&M EC&M comprises resources-related infrastructure, infrastructure projects, and non-residential building.
Resources-related infrastructure continues to be impacted by a prolonged downturn and high volatility in commodity prices, with investment focus on sustaining capital projects rather than new production infrastructure.
Good growth prospects in the commercial sector are expected as business confidence remains high in both Australia and New Zealand, while investment into social infrastructure continues with particular focus on health and education.
Downer is the market leader in electrical and instrumentation work, particularly in the Oil & Gas sector, and is growing its structural mechanical piping business. Downer is currently working on all of the major Oil & Gas developments in Australia and Papua New Guinea.
Outside of Oil & Gas, Downer continues to be a major player in the delivery of resources related engineering, construction and maintenance services with long and enduring relationships with all of Australia’s major mining and industrial customers.
This year Downer increased its presence in the growing market for infrastructure and building in New Zealand through the acquisition of Hawkins, the country’s second-largest builder.
Mining The market continues to be impacted by depressed commodity prices, particularly across bulk commodities, resulting in a prolonged focus on cost reduction by mine owners. However, opportunities for mining contractors remain with an outlook of further growth in export volumes as miners look to optimise unit costs.
Some mine owners are currently shifting their operating models to maximise supply chain benefits, which opens opportunities for contractors to work collaboratively to drive productivity improvements and reduce production costs.
Mining continues to perform well despite the constraints in the operating environment. While greenfield iron ore and coal opportunities are at their lowest point in a decade, green shoots of growth have emerged in gold, lithium and precious metals in Australia, Southern Africa and South America.
The Mining division continues to profit from the diversity of its operations. With an open cut, underground, mining services, tyre management, drill and blast, and engineering and technology offering, Downer brings to market the largest end-to-end capability in the world.
Spotless The facilities management and services market is undergoing consolidation, as operators look to leverage scale across multiple service lines. The proliferation of operational technology to enable real-time performance monitoring is shaping the future of outsourcing, leading to bundling services and the provision of ‘anything as a service’.
The Defence, Health, Education, Corrections, and Commercial markets continue to grow with a strong pipeline of opportunities in both Australia and New Zealand.
The acquisition of Spotless is now largely complete. Downer is now a major force in both Australia and New Zealand with market leading positions across key sectors including: Defence; Health; Education; Corrections; Commercial; Stadia and Open Space Management; Leisure; and Resources.
For
per
sona
l use
onl
y

Annual Report 2017 17
Outlook
With the acquisition of Spotless, the Downer Group is now well positioned for expected growth in the transport infrastructure, health, education, corrections, defence, utilities and other government service markets across Australia and New Zealand.
The Group’s strong competitive position in all of its major markets, coupled with market growth, is driving significant opportunities across all businesses.
Excluding Spotless earnings and any costs or synergies related to the acquisition, Downer is targeting NPAT of around $190 million for the 2018 financial year, an increase of 5%.
In its Target’s Statement dated 27 April 2017, the Spotless Board provided earnings guidance of between $85 million and $100 million NPAT for the 2018 financial year1.
Once Downer completes its review of the Spotless business planning, budgeting and target setting process, updated guidance will be provided for the entire Downer Group, including Spotless.
Subsequent events
There have been no matters or circumstances other than those referred to in the financial statements or notes thereto, that have arisen since the end of the financial year, that have significantly affected, or may significantly affect, the operations of the Group, the results of those operations, or the state of affairs of the Group in subsequent financial years.
Changes in state of affairs
During the financial year there was no significant change in the state of affairs of the Group other than that referred to in the financial statements or notes thereto.
Environmental
Downer recognises its obligation to stakeholders – customers, shareholders, employees, contractors and the community – to operate in a way that advances sustainability and mitigates the Company’s environmental impact. As a corporate citizen Downer respects the places and communities in which it operates. Downer’s values and beliefs are the spirit that underpins everything it does and it is committed to conducting its operations in a manner that is environmentally responsible and sustainable.
The Board oversees the Company’s environmental performance. It has established a sustainability charter and strategy and has allocated internal responsibilities for reducing the impact of its operations and business activities on the environment. In addition, all Downer Divisions conduct regular environmental audits by independent third parties.
The international environmental standard, ISO 14001, is used as a benchmark in assessing, improving and maintaining the environmental integrity of its business management systems. The Company’s Divisions also adhere to environmental management requirements established by customers in addition to all applicable licence and regulatory requirements.
Dividends
In respect of the financial year ended 30 June 2017, the Board:
– declared a fully franked interim dividend of 12.0 cents per share that was paid on 16 March 2017 to shareholders on the register at 16 February 2017; and
– declared a fully franked final dividend of 12.0 cents per share, payable on 10 October 2017 to shareholders on the register at 12 September 2017.
Due to the strength of Downer’s balance sheet, the Company’s Dividend Reinvestment Plan remains suspended.
As detailed in the Directors’ Report for the 2016 financial year, the Board declared a fully franked final dividend of 12.0 cents per share, that was paid on 15 September 2016 to shareholders on the register at 18 August 2016.
1 For further information regarding the basis of preparation of this guidance, including key assumptions and other discussion, see section 5.4 and section 7 of Spotless’ Target’s Statement dated 27 April 2017.
For
per
sona
l use
onl
y

18 Downer EDI Limited
Directors’ Report – continuedfor the year ended 30 June 2017
Employee Discount Share Plan (ESP)
An ESP was instituted in June 2005. In accordance with the provisions of the plan, as approved by shareholders at the 1998 Annual General Meeting, permanent full-time and part-time employees of Downer EDI Limited and its subsidiary companies who have completed six months service may be invited to participate.
No shares were issued under the ESP during the years ended 30 June 2017 or 30 June 2016.
There are no performance rights or performance options, in relation to unissued shares, that are outstanding.
Directors’ meetings
The following table sets out the number of Directors’ meetings (including meetings of Board Committees) held during the 2017 financial year and the number of meetings attended by each Director (while they were a Director or Board Committee member). During the year, 22 Board meetings, six Audit and Risk Committee meetings, three Remuneration Committee meetings, four Zero Harm Committee meetings and two Nominations and Corporate Governance Committee meetings were held. In addition, 37 ad hoc meetings (attended by various Directors) were held in relation to various matters including tender reviews, major projects, treasury matters and the Due Diligence Committee for the Spotless takeover offer and Entitlement Offer.
BoardAudit and
Risk CommitteeRemuneration
Committee
Director Held1 Attended Held1 Attended Held1 AttendedR M Harding 22 22 – – 3 3
G A Fenn 22 22 – – – –
S A Chaplain 22 21 6 6 – –
P S Garling2 22 21 6 5 3 3
T G Handicott3 21 20 4 4 3 3
E A Howell 22 20 – – – –
J S Humphrey4 3 3 2 2 2 2
C G Thorne5 22 22 6 6 – –
Zero Harm Committee
Nominations and Corporate Governance
Committee
Director Held1 Attended Held1 AttendedR M Harding – – 2 2
G A Fenn 4 3 – –
S A Chaplain 4 4 2 2
P S Garling2 – – – –
T G Handicott3 – – – –
E A Howell 4 4 – –
J S Humphrey4 – – 2 2
C G Thorne5 4 3 – –
1 These columns indicate the number of meetings held during the period each person listed was a Director or member of the Board or relevant Board Committee.2 Mr Garling is also Chairman of the Rail Projects Committee.3 Ms Handicott is also Chairman of the Disclosure Committee which meets on an unscheduled basis and was Chairman of the Due Diligence Committee for the Spotless
takeover offer and Entitlement Offer.4 Mr Humphrey was also Chairman of the Disclosure Committee, Buy-back Committee and IT Transformation Committee which meet on an unscheduled basis.5 Dr Thorne is also Chairman of the Tender Risk Evaluation Committee which meets on an unscheduled basis.F
or p
erso
nal u
se o
nly

Annual Report 2017 19
Indemnification of officers and auditors
During the financial year, the Company paid a premium in respect of a contract insuring the Directors of the Company (as named above), the Company Secretary, all officers of the Company and of any related body corporate against a liability incurred as a Director, secretary or executive officer to the extent permitted by the Corporations Act 2001 (Cth).
The contract of insurance prohibits disclosure of the nature of the liability and the amount of the premium.
Downer’s Constitution includes indemnities, to the extent permitted by law, for each Director and Company Secretary of Downer and its subsidiaries against liability incurred in the performance of their roles as officers. The Directors and the Company Secretaries listed on pages 2 to 4, individuals who act as a Director or Company Secretary of Downer’s subsidiaries and certain individuals who formerly held any of these roles also have the benefit of the indemnity in the Constitution.
The Company has not otherwise, during or since the financial year, indemnified or agreed to indemnify an officer or auditor of the Company or of any related body corporate against a liability incurred as such an officer or auditor.
Corporate Governance
In recognising the need for the highest standards of corporate behaviour and accountability, the Board endorses the ASX Corporate Governance Council’s Corporate Governance Principles and Recommendations (ASX Principles). The Group’s corporate governance statement is set out on pages 111 to 118 of this Annual Report.
Non-audit services
Downer is committed to audit independence. The Audit and Risk Committee reviews the independence of the external auditors on an annual basis. This process includes confirmation from the auditors that, in their professional judgement, they are independent of the Group. To ensure that there is no potential conflict of interest in work undertaken by Downer’s external auditors, KPMG, they may only provide services that are consistent with the role of the Company’s auditor.
The Board has considered the position and, in accordance with the advice from the Audit and Risk Committee, is satisfied that the provision of non-audit services during the year is compatible with the general standard of independence for auditors imposed by the Corporations Act 2001 (Cth).
The Directors are of the opinion that the services as disclosed below do not compromise the external auditor’s independence, based on advice received from the Audit and Risk Committee, for the following reasons:
– All non-audit services have been reviewed and approved to ensure that they do not impact the integrity and objectivity of the auditor; and
– None of the services undermine the general principles relating to auditor independence as set out in the Institute of Chartered Accountants in Australia and CPA Australia’s Code of Conduct APES 110 Code of Ethics for Professional Accountants issued by the Accounting Professional & Ethical Standards Board, including reviewing or auditing the auditor’s own work, acting in a management or decision-making capacity for the Company, acting as advocate for the Company or jointly sharing economic risks and rewards.
A copy of the auditor’s independence declaration is set out on page 46 of this Annual Report.
During the year, details of the fees paid or payable for non-audit services provided by the auditor of the parent entity, its related practices and related audit firms were as follows:
June 2017 $
June 2016 $
Non-audit servicesTax services 719,955 743,567
Sustainability assurance 217,000 107,500
Due diligence and other non-audit services 1,066,814 306,842
2,003,769 1,157,909
Rounding of amounts
Downer is a company of the kind referred to in ASIC Corporations (Rounding in Financial/Directors’ reports) Instrument 2016/191, relating to the “rounding off” of amounts in the Directors’ Report and consolidated financial statements. Unless otherwise expressly stated, amounts have been rounded off to the nearest whole number of millions of dollars and one place of decimals representing hundreds of thousands of dollars.
For
per
sona
l use
onl
y

20 Downer EDI Limited
Directors’ Report – continuedfor the year ended 30 June 2017
Remuneration Report – AUDITED
Chairman’s letter
Dear Shareholders,
Downer’s 2017 Remuneration Report provides information about the remuneration of its most senior executives and explains how performance has been linked to reward outcomes at Downer this financial year.
Strong financial and safety performance
Downer has once again delivered strong financial and safety performance in 2017 and has continued to deliver on its promises:
– Total Revenue was $7,812.3 million, an increase of 5.7% from 2016;
– Net Profit After Tax was $181.5 million, an increase of $11.5 million over guidance given at the start of the year;
– Conversion of EBITDA (earnings before interest, tax, depreciation and amortisation) to cash continued to be strong at 103.1%; and
– Lost Time Injury Frequency Rate was 0.55, a reduction of 16.7% from 2016 and Total Recordable Injury Frequency Rate was 3.50.
Downer’s Zero Harm performance is pleasing. Many of the activities that Downer’s people perform every day are inherently dangerous and ensuring they remain safe is of paramount importance. Focus on Zero Harm is a key part of Downer’s culture and the drive for continued improvement of systems and performance makes Downer a Zero Harm leader and provides a source of competitive advantage.
Downer’s work-in-hand is now $22.5 billion (excluding Spotless), up 21% from 2016, which demonstrates the fact that Downer’s businesses operate in a range of growth sectors and that Downer’s people are seen as being committed to working closely with customers to help them succeed using world leading insights and solutions.
Downer’s strong performance in the areas highlighted above is reflected in Downer’s Total Shareholder Return over the three years to 30 June 2017, being 29.2% higher than the ASX 100 median.
Key remuneration issues in 2017
Downer continued to invest in the future through strategic acquisitions that enhance the geographic footprint of the existing business, grow capability and create new market positions. These include the acquisitions of AAA (asphalt plant in Western Australia), AGIS Group, Hawkins, ITS and RPQ as well as the takeover of Spotless which was funded through an Entitlement Offer to shareholders.
The acquisition of a controlling interest in Spotless represents a significant investment in growth and creates new positions for Downer in adjacent sectors such as Defence, Health, Education and Corrections. It is another example of Downer delivering on its strategy to maximise long term shareholder value.
The impact of these major transactions on executive remuneration can be significant. The Board’s overarching concern is to ensure executives:
– Are accountable for delivery of the annual budget and business plan; and
– Consider potential acquisition or divestment opportunities without the influence of their impact on remuneration outcomes.
For these and other reasons, where a transaction is both material and unbudgeted, the Board’s policy is that it should remove the impact of the transaction when calculating the key performance indicators on which executive performance is measured. This ensures that executives are ‘no better or worse off’ as a result of the transaction.
In 2017, adjustments were made in respect of the Entitlement Offer and AAA asphalt plant, Hawkins, ITS and Spotless transactions so that executives were rewarded for performance against the targets set at the beginning of the year. These adjustments comprised the exclusion of items such as transaction costs as well as the contribution of those businesses to the Group’s profit and cash flow results. The adjustments resulted in the full achievement of the Free Cash Flow measure but for other measures had no or an immaterial impact on reward outcomes.
More information on the Board’s approach to major transactions and their impact in 2017 can be found at sections 6.5 and 7.4 of the Remuneration Report.
Link between Downer performance and reward outcomes
Downer’s remuneration framework for key senior employees supports the achievement of Downer’s strategy and the creation of alignment between senior executives and shareholders. As set out in this Remuneration Report, Downer’s remuneration strategy continues to provide:
– A significant proportion of remuneration being at risk linked to clear, objective measures;
– A profitability gateway as a precondition to any short term incentive entitlement;
– For deferral of 50% of short term incentive payments over a further two year period; and
– The delivery of a significant proportion of pay in equity.
We trust that this overview and the accompanying detailed analysis are helpful when forming your own views on Downer’s remuneration arrangements.
R M Harding T G Handicott Chairman Remuneration Committee Chairman
For
per
sona
l use
onl
y

Annual Report 2017 21
The Remuneration Report provides information about the remuneration arrangements for Key Management Personnel (KMP), which means Non-executive Directors and the Group’s most senior executives, for the year to 30 June 2017. The term “executive” in this Report means KMPs who are not Non-executive Directors.
The Report covers the following matters:
1. Year in review;
2. Details of Key Management Personnel;
3. Remuneration policy, principles and practices;
4. Relationship between remuneration policy and company performance;
5. The Board’s role in remuneration;
6. Description of executive remuneration;
7. Details of executive remuneration;
8. Executive equity ownership;
9. Key terms of employment contracts;
10. Related party information; and
11. Description of Non-executive Director remuneration.
1. Year in review
1.1 Summary of changes to remuneration policy
Downer has continued to refine its remuneration policy during the period. The Board considered Company strategy and reward plans based on performance measurement, competitive position and stakeholder feedback. Changes to policy are noted in the relevant sections of this Report and are summarised in the table below.
Policy Change in policy from 2016
Short-term incentive (STI) plan – The Safety measures have been further refined, building upon previous improvements to move with and support growth in organisational maturity and ensure continual stretch and ongoing Zero Harm improvement through:
– Requiring the implementation of critical control verification reporting and action plans;
– Implementation of critical control verification programs; and
– Targeting high potential incidents for Action Close Outs.
– The Environmental measure has been focused on sustainable development by requiring review of targets for greenhouse gas emission reduction and energy efficiency as well as the achievement of energy efficiency targets.
– The People measure has been enhanced, reflecting continued organisational development. It now requires the achievement of a set level of employee engagement, measured through a Company-wide employee engagement survey.
For
per
sona
l use
onl
y

22 Downer EDI Limited
Directors’ Report – continuedfor the year ended 30 June 2017
2. Details of Key Management Personnel
The following persons acted as Directors of the Company during or since the end of the most recent financial year:
Director Role
R M Harding Chairman, Independent Non-executive Director
G A Fenn Managing Director and Chief Executive Officer
S A Chaplain Independent Non-executive Director
P S Garling Independent Non-executive Director
T G Handicott Independent Non-executive Director, from 21 September 2016
E A Howell Independent Non-executive Director
J S Humphrey Independent Non-executive Director, to 3 November 2016
C G Thorne Independent Non-executive Director
The named persons held their current executive position for the whole of the most recent financial year, except as noted:
Executive Role
C W Bruyn Chief Executive Officer – New Zealand, to 16 January 2017
S Cinerari Chief Executive Officer – Infrastructure Services
M J Ferguson Chief Financial Officer
S L Killeen Chief Executive Officer – New Zealand, from 16 January 2017
M J Miller Chief Executive Officer – Rail
D J Overall Chief Executive Officer – Mining
B C Petersen Chief Executive Officer – Engineering, Construction & Maintenance
For
per
sona
l use
onl
y

Annual Report 2017 23
3. Remuneration policy, principles and practices
3.1 Executive remuneration policy
Downer’s executive remuneration policy and practices are summarised in the table below.
Policy Practices aligned with policy
Retain experienced, proven performers, and those considered to have high potential for succession
– Provide remuneration that is internally fair;
– Ensure remuneration is competitive with the external market; and
– Defer a substantial part of pay contingent on continuing service and sustained performance.
Focus performance – Provide a substantial component of pay contingent on performance against targets;
– Focus attention on the most important drivers of value by linking pay to their achievement;
– Require profitability to reach a challenging level before any bonus payments can be made; and
– Provide a LTI plan component that rewards consistent Scorecard performance over multiple years and over which executives have a clear line of sight.
Provide a Zero Harm environment
– Incorporate measures that embody “Zero Harm” for Downer’s employees, contractors, communities and the environment as a significant component of reward.
Manage risk – Encourage sustainability by balancing incentives for achieving both short-term and longer-term results, and deferring equity based reward vesting after performance has been initially tested;
– Set stretch targets that finely balance returns with reasonable but not excessive risk taking and cap maximum incentive payments;
– Do not provide excessive “cliff” reward vesting that may encourage excessive risk taking as a performance threshold is approached;
– Diversify risk and limit the prospects of unintended consequences from focusing on just one measure in both short-term and long-term incentive plans;
– Stagger vesting of deferred short term incentive payments to encourage retention and allow forfeiture of rewards that are the result of misconduct or material adjustments;
– Retain full Board discretion to vary incentive payments, including in the event of excessive risk taking; and
– Restrict trading of vested equity rewards to ensure compliance with the Company’s Securities Trading Policy.
Align executive interests with those of shareholders
– Provide that a significant proportion of pay is delivered as equity so part of executive reward is linked to shareholder value performance;
– Provide a long-term incentive that is based on consistent Scorecard performance against challenging targets set each year that reflect sector volatility and prevailing economic conditions as well as relative TSR and earnings per share measures directly related to shareholder value;
– Maintain a guideline minimum shareholding requirement for the Managing Director;
– Exclude the short-term impact of unbudgeted and opportunistic acquisitions and divestments from performance assessment to encourage agility and responsiveness;
– Encourage holding of shares after vesting via a trading restriction for all executives and payment of LTI components in shares; and
– Prohibit hedging of unvested equity and equity subject to a trading lock to ensure alignment with shareholder outcomes.
Attract experienced, proven performers
– Provide a total remuneration opportunity sufficient to attract proven and experienced executives from secure positions in other companies and retain existing executives.
For
per
sona
l use
onl
y

24 Downer EDI Limited
Directors’ Report – continuedfor the year ended 30 June 2017
4. Relationship between remuneration policy and company performance
4.1 Company strategy and remuneration
Downer’s business strategy includes:
– Maintaining focus on Zero Harm by continually improving health, safety and environmental performance to achieve Downer’s goal of zero work-related injuries and environmental incidents;
– Driving growth in core markets through focusing on serving existing customers better across multiple products and service offerings, growing capabilities and investing in innovation, research and development and community and indigenous partnerships;
– Creating new strategic positions through enhanced value add services that improve propositions for customers and exporting established core competencies into new overseas markets with current customers of the Company;
– Reducing risk and enhancing the Company’s capability to withstand threats, take advantage of opportunities and reduce cyclical volatility;
– Obtaining better utilisation of assets and improved margins through simplifying and driving efficiency;
– Identifying opportunities to manage the Downer portfolio through partnering, acquisition and divestment that deliver long-term shareholder value; and
– Maintaining flexibility to be able to adapt to the changing economic and competitive environment to ensure Downer delivers shareholder value.
The Company’s remuneration policy complements this strategy by:
– Incorporating Company-wide performance requirements for both STI and LTI reward vesting for NPAT, Free Cash Flow (FFO) and People measures to encourage cross-divisional collaboration;
– Incorporating performance metrics that focus on cash flow to reduce working capital and debt exposure;
– Setting NPAT, EBIT and FFO STI performance and gateway requirements based on effective application of funds employed to run the business for better capital efficiency;
– Employing FFO as the cash measure for the STI to provide more emphasis on control of capital expenditure;
– Excluding the short term impacts of opportunistic and unbudgeted acquisitions and divestments on incentive outcomes to encourage flexibility, responsiveness and growth consistent with strategy;
– Deferring 50% of STI awards to encourage sustainable performance and a longer-term focus;
– Incorporating consistent financial performance in the LTIP Scorecard measure;
– Emphasis on Zero Harm measures in the STI to maintain the Company’s position as a Zero Harm leader and employer and service provider of choice, thereby delivering a competitive advantage; and
– Encouraging engagement with and the development and retention of its people to help maintain a sustainable supply of talent.
4.2 Remuneration linked to performance
The link to performance is provided by:
– Requiring a significant portion of executive remuneration to vary with short-term and long-term performance;
– Applying a profitability gateway to be achieved before an STI calculation for executives is made;
– Applying further Zero Harm gateways to be achieved before calculating any reward for safety or environmental performance;
– Applying challenging financial and non-financial measures to assess performance;
– Ensuring that these measures focus management on strategic business objectives that create shareholder value; and
– Delivering a significant proportion of payment in equity for alignment with shareholder interests.
Downer measures performance on the following key corporate measures:
– Earnings per share (EPS) growth;
– Total shareholder return (TSR) relative to other ASX100 companies (excluding ASX “Financials” sector companies);
– Group NPAT;
– Divisional EBIT;
– FFO;
– Engagement with Downer’s people; and
– “Zero Harm” measures of safety and environmental sustainability.
Remuneration for all executives varies with performance on these key measures.
For
per
sona
l use
onl
y

Annual Report 2017 25
The following graph shows the Company’s performance compared to the median performance of the ASX100 over the three year period to 30 June 2017.
The graphs below illustrate Downer’s performance against key financial and non-financial performance indicators over the last five years.
0
50
100
150
200
250
204.0216.0 210.2
180.6 181.5
$’m
Net profit after tax
2013 2014 20162015 2017
0
10
20
30
40
50
43.045.5 43.9
38.035.8
Cen
ts p
er s
hare
Basic earnings per share (ii)
2013 2014 20162015 2017
(ii) Historical basic earnings per share were restated as a result of 169.9 million shares issued from the capital raising made as part of the Spotless takeover offer announced on 21 March 2017. The weighted average number of shares (WANOS) to calculate EPS was adjusted by an adjustment factor of 0.943.
0
100
200
300
400
304.6
159.7
344.3
242.3
203.0
$’m
Free cash flow (i)
2013 2014 20162015 2017
(i) Adjusted for material unbudgeted transactions.
0.0
0.2
0.4
0.6
0.8
1.0
1.2
Lost
Tim
e In
juri
es p
er 1,
000,
000
hour
s
Tota
l Rec
orda
ble
Inju
ries
per
1,00
0,00
0 ho
urs
0
2
4
6
8
10
12
TRIFRLTIFRSafety
0.70
1.08
0.87
0.66
0.55
2013 2014 20162015 2017
0
* S&P/ASX 100 companies as at 30/06/2014
Tota
l Sha
reho
lder
Ret
urn
(Ind
exed
to 10
0)
S&P/ASX 100 median TSRDowner EDI TSR
Downer EDI TSR compared to S&P/ASX 100 median*
50
100
150
200
250
Jun2014
Sep2014
Dec2014
Mar2015
Jun2015
Sep2015
Dec2015
Mar2016
Jun2016
Sep2016
Dec2016
Mar2017
Jun2017
For
per
sona
l use
onl
y

26 Downer EDI Limited
Directors’ Report – continuedfor the year ended 30 June 2017
5. The Board’s role in remuneration
The Board engages with shareholders, management and other stakeholders as required, to continuously refine and improve executive and Director remuneration policies and practices.
Two Board Committees deal with remuneration matters. They are the Remuneration Committee and the Nominations and Corporate Governance Committee.
The role of the Remuneration Committee is to review and make recommendations to the Board in relation to executives in respect of:
– Executive remuneration and incentive policy;
– Remuneration of senior executives of the Company;
– Executive reward and its impact on risk management;
– Executive incentive plans;
– Equity-based incentive plans;
– Superannuation arrangements;
– Recruitment, retention, performance measurement and termination policies and procedures for all Key Management Personnel and senior executives reporting directly to the Managing Director;
– Disclosure of remuneration in the Company’s public materials including ASX filings and the Annual Report; and
– Retirement payments for all Key Management Personnel and senior executives reporting directly to the Managing Director.
The Nominations and Corporate Governance Committee is responsible for recommending and reviewing remuneration arrangements for the Executive Director and Non-executive Directors of the Company.
Each Committee has the authority to engage external professional advisers without seeking approval of the Board or management. During the reporting period, the Remuneration Committee retained Guerdon Associates Pty Ltd as its adviser. Guerdon Associates Pty Ltd does not provide services to management and is considered to be independent.
6. Description of executive remuneration
6.1 Executive remuneration structure
Executive remuneration has a fixed component and a component that varies with performance.
The variable component ensures that a proportion of pay varies with performance. Performance is assessed annually for performance periods covering one year and three years. Payment for performance assessed over one year is an STI. Payment for performance over a three-year period is an LTI.
In order for maximum STIs to be awarded, performance must achieve a stretch goal that is a clear margin above the planned budget for the period. This enables the Company to attract and retain better performing executives, and ensures pay outcomes are aligned with shareholder returns.
Target STIs are less than the maximum STI. Target STI is payable on achievement of planned objectives. For executives the target STI is 75% of the maximum STI. The maximum total remuneration that can be earned by an executive is capped. The maximums are determined as a percentage of fixed remuneration.
Executive position
Target STI % of
fixed remuneration
Maximum STI % of
fixed remuneration
Maximum LTI % of
fixed remuneration
Maximum total performance
based pay as a % offixed remuneration
Managing Director 75 100 100 200
Executives appointed prior to 2011 75 100 75 175
Executives appointed from 2011 56.25 75 50 125
For
per
sona
l use
onl
y

Annual Report 2017 27
The proportions of STI to LTI take into account:
– Market practice;
– The service period before executives can receive equity rewards;
– The behaviours that the Board seeks to encourage through direct key performance indicators; and
– The guideline for the Managing Director to maintain a shareholding as a multiple of pay after long-term incentive rewards have vested.
6.2 Fixed remuneration
Fixed remuneration is the sum of salary and the direct cost of providing employee benefits, including superannuation, motor vehicles, car parking, living away from home expenses and fringe benefits tax.
The level of remuneration is set to be able to retain proven performers and when necessary to attract the most suitable external candidates from secure employment elsewhere.
Remuneration is benchmarked against a peer group of direct competitors and a sector peer group. While market levels of remuneration are monitored on a regular basis, there is no contractual requirement or expectation that any adjustments will be made.
No KMP received an adjustment to fixed remuneration in the 2017 financial year or in the past four years, other than M J Ferguson, S L Killeen and M J Miller on their appointment to KMP roles, all having been internal appointments.
6.3 Short-term incentive
6.3.1 STI tabular summary
The following table outlines the major features of the 2017 LTI plan.
Purpose of STI plan – Focus performance on drivers of shareholder value over 12 month period;
– Improve “Zero Harm” and people related results; and
– Ensure a part of remuneration costs varies with the Company’s 12 month performance.
Minimum performance “gateway” before any payments can be made
Achievement of a gateway based on budgeted Group NPAT for corporate executives and Division EBIT for divisional heads.
Maximum STI that can be earned – KMP appointed pre 2011: up to 100% of fixed remuneration; and
– KMP appointed from 2011: up to 75% of fixed remuneration.
Percentage of STI that can be earned on achieving target expectations
75% of the maximum. For an executive to receive more, performance in excess of target expectations will be required.
Individual Performance Modifier (IPM)
– An IPM may be applied based on an executive’s individual key performance indicators and relative performance;
– Moderate individual performance may result in an IPM of less than 1 or outstanding performance may result in an IPM greater than 1. The IPM must average 1 across all participants; and
– Application of an IPM cannot result in an award greater than the maximum STI% level set out in section 6.1.
Discretion to vary payments The Board, in its discretion, may vary STI payments by up to + or – 100% from the payment applicable to the level of performance achieved, up to the maximum for that executive.
Performance period 1 July 2016 to 30 June 2017.
Performance assessed August 2017, following audit of accounts.
Additional service period after performance period for payment to be made
50% of the award is deferred with the first tranche of 25% vesting one year following award and the second tranche of 25% vesting two years following award.
Payment timing August 2017 for the first cash payment of 50% of the award. The deferred components of the STI payments will be paid one and two years following the award, in equal tranches of 25% of the award.
For
per
sona
l use
onl
y

28 Downer EDI Limited
Directors’ Report – continuedfor the year ended 30 June 2017
Form of payment Cash for initial payment.
The value of deferred components will be settled in cash or shares, net of personal tax. An eligible leaver’s deferred components will be settled in shares or in cash in the sole and absolute discretion of the Board.
Performance requirements Group NPAT and divisional EBIT, FFO, Zero Harm and people measures.
Board discretion The Board may exercise discretion to:
– Reduce partly or fully the value of the deferred components that are due to vest in certain circumstances, including where an executive has acted inappropriately or where the Board considers that the financial results against which the STIP performance measures were tested were incorrect in a material respect or have been reversed or restated; and
– Settle deferred components in shares or cash.
New recruits New executives (either new starts or promoted employees) are eligible to participate in the STI in the year in which they commence in their position with a pro-rata entitlement.
Terminating executives There is no STI entitlement where an executive’s employment terminates prior to the end of the financial year. Where an executive’s employment terminates prior to the vesting date, the unvested deferred components will be forfeited. However, the Board has retained discretion to vest deferred awards, in the form of shares or cash, in their ordinary course where the executive is judged to be an eligible leaver.
6.3.2 STI overview
The STI plan provides for an annual payment that varies with annual performance. This has been applied to performance measured over the Company’s financial year to 30 June 2017.
The basis of the plan is designed to align STI outcomes with financial results. No STI is paid unless a minimum profit gateway is met. For corporate executives, the gateway is based on the Group budgeted profit target. For divisional executives, the gateway is based on the division budgeted profit target. Profit for this purpose is defined as NPAT for corporate executives and EBIT for divisional executives. This minimum must be at a challenging level to justify the payment of STI to an executive, and deliver an acceptable return for the funds employed in running the business. Positive and negative impacts from material but unbudgeted and opportunistic transactions are excluded from gateway assessment.
As noted in section 6.1, the maximum STI that can be earned is capped to minimise excessive risk taking.
Deferral is a key feature as part of the STI structure. Payment of 50% of the award is paid at the time of award in cash and the remaining 50% of the award earned is deferred over two years.
The first payment of 50% of the award will be in cash after finalisation of the annual audited results. The payment of the deferred component of the award will be in the form of two tranches, each to the value of 25% of the award.
The deferred components represent an entitlement to cash or shares, subject to the satisfaction of a continued employment condition. The first tranche will vest one year following award and the second tranche will vest two years following award, provided an executive remains employed by the Group at the time of vesting.
The value of deferred components will generally be settled in shares, net of applicable personal tax. This is designed to encourage executive share ownership, and not adversely impact executives who have to meet their taxation obligations arising from the vesting of the deferred components. However, the Board retains the discretion to vest deferred awards, in the form of shares or cash, having regard to an executive’s individual circumstances and existing level of equity ownership.
No dividend entitlements are attached to the deferred components during the vesting period.
Where an executive ceases employment with the Group prior to the vesting date, the deferred components will be forfeited. However, the Board has retained the discretion to vest deferred awards, in the form of shares or cash, in their ordinary course where the executive is judged to be an eligible leaver.
For
per
sona
l use
onl
y

Annual Report 2017 29
6.3.3 How STI payments are assessed
Target STI plan percentage of pay An individual’s target incentive under the STI plan is expressed as a percentage of fixed remuneration. The STI plan percentage is set according to policy tabulated in section 6.1.
Organisational or divisional scorecard result
As a principle, “target” achievement would be represented at budget. Thresholds and maximums are also set.
Individual Performance Modifier (IPM)
At the end of the plan year, eligible employees are provided with an IPM against their key performance indicators and relative performance. Individual key performance indicators are set between the individual and the Managing Director (if reporting to the Managing Director) or the Board (if the Managing Director) at the start of the performance period. IPMs must average to 1.
STI plan incentive calculation Fixed remuneration x maximum STI plan percent x scorecard result x IPM.
6.3.4 STI performance requirements
Overall performance is assessed on NPAT, EBIT, FFO, Zero Harm and a measure of employee engagement.
NPAT and EBIT include joint ventures and associates and include, inter alia, changes in accounting policy.
FFO is defined as net cash from operating activities (i.e. EBIT plus non-cash items in operating profit plus distributions received from JVs or associates plus movements in working capital plus movements in operating assets less net interest less tax paid), less investing cash flow.
Zero Harm reflects Downer’s commitment to safety and environmental, social and governance matters. The Zero Harm element includes safety and environmental measures, underscoring Downer’s commitment to customers, employees, regulators and the communities in which it operates.
For 2017, the Board introduced the Zero Harm Leadership measure and targeted the Action Close Outs safety measure on high potential incidents and further developed the Safety Critical Risk and Environmental Sustainable Development measures to ensure Downer continues to focus on effective risk controls and visible leadership.
The measures for the Zero Harm element of the scorecard are as follows:
Measure Target
Safety
TRIFR (total recordable injury frequency rate)
LTIFR (lost time injury frequency rate)
Achieve a defined TRIFR target at level of responsibility. TRIFR is calculated as the number of recordable injuries x 1,000,000/the hours worked in 12 months. In addition LTIFR must be retained below a threshold level for area of responsibility. LTIFR is calculated as the number of lost time injuries x 1,000,000/the hours worked in 12 months.
Critical risks High potential incident Action Close Outs, critical control verification reporting and action plans and the implementation of critical control verification programs.
Zero Harm Leadership Performance of a minimum number of critical risk observations by senior executives within the relevant area of control by the senior executives of that area and in other areas of Downer by the executive.
Environmental
Sustainable development Review of targets for greenhouse gas reduction and energy efficiency and the achievement of energy efficiency targets for the area of control.
Should a workplace fatality or serious environmental incident occur, the relevant safety or environmental portion of the STI is foregone. For
per
sona
l use
onl
y

30 Downer EDI Limited
Directors’ Report – continuedfor the year ended 30 June 2017
For 2017, the Board introduced a new People measure requiring the achievement of a set level of employee engagement, based on a Group-wide employee engagement survey.
Weightings applied to the 2017 STI scorecard measures for all executives, including the Managing Director, are set out in the table below.
Executive Group NPAT Divisional EBIT Free cash flow Zero Harm People
Corporate 30% – 30% 30% 10%
Business unit 7.5% 22.5% 30%(7.5% Group,
22.5% division)
30% 10%(3% Group,7% division)
The Board has discretion to vary STI payments by up to + or – 100% from the payment applicable to the level of performance achieved, up to the maximum for that executive.
Specific details of STI performance requirements are set out in section 7.3.
The Board retains the right to vary from policy in exceptional circumstances. However, any variation from policy and the reasons for it will be disclosed.
6.4 Long-term incentive
6.4.1 LTI tabular summary
The following table outlines the major features of the 2017 LTI plan.
Purpose of LTI plan – Focus performance on drivers of shareholder value over three-year period;
– Manage risk by countering any tendency to over-emphasise short-term performance to the detriment of longer-term growth and sustainability; and
– Ensure a part of remuneration costs varies with the Company’s longer-term performance.
Maximum value of equity that can be granted
– Managing Director: 100% of fixed remuneration;
– KMP appointed pre-2011: 75% of fixed remuneration; and
– KMP appointed from 2011: 50% of fixed remuneration.
Performance period 1 July 2016 to 30 June 2019.
Performance assessed September 2019.
Additional service period after performance period for shares to vest
Performance rights for which the relevant performance vesting condition is satisfied will not vest unless executives remain employed with the Group on 30 June 2019.
Performance rights vest 1 July 2020.
Form of award and payment Performance rights.
For
per
sona
l use
onl
y

Annual Report 2017 31
Performance conditions There are three performance conditions. Each applies to one-third of the performance rights granted to each executive.
Relative TSR
The relative TSR performance condition is based on the Company’s TSR performance relative to the TSR of companies comprising the ASX100 index, excluding financial services companies, at the start of the performance period, measured over the three years to 30 June 2019.
The performance vesting scale that will apply to the performance rights subject to the relative TSR test is shown in the table below:
Downer EDI Limited’s TSR Ranking
Percentage of performance rights subject to TSR condition that qualify for vesting
< 50th percentile 0%
50th percentile 30%
Above 50th and below 75th percentile
Pro rata so that 2.8% of the performance rights in the tranche will vest for every 1 percentile increase between the 50th percentile and 75th percentile
75th percentile and above 100%
EPS growth
The EPS growth performance condition is based on the Company’s compound annual EPS growth over the three years to 30 June 2019.
The performance vesting scale that will apply to the performance rights subject to the EPS growth test is shown in the table below:
Downer EDI Limited’s EPS compound annual growth
Percentage of performance rights subject to EPS condition that qualify for vesting
< 5% 0%
5% 30%
Above 5% to < 10% Pro rata so that 14% of the performance rights in the tranche will vest for every 1% increase in EPS growth between 5% and 10%
10% or more 100%
Scorecard
The Scorecard performance condition is based on the Group’s NPAT and FFO for each of the three years to 30 June 2019.
The performance vesting scale that will apply to the performance rights subject to the Scorecard test is shown in the table below:
Scorecard resultPercentage of performance rights subject to Scorecard condition that qualify for vesting
< 90% 0%
90% 30%
Above 90% to < 110% Pro rata so that 3.5% of the performance rights in the tranche will vest for every 1% increase in the Scorecard result between 90% and 110%
110% or more 100%
How performance rights and shares are acquired
The rights are issued by the Company and held by the participant subject to the satisfaction of the vesting conditions. The number of rights held may be adjusted pro-rata, consistent with ASX adjustment factors, for any capital re-structures. If the rights vest, executives can exercise them to receive shares that are normally acquired on-market.
For
per
sona
l use
onl
y

32 Downer EDI Limited
Directors’ Report – continuedfor the year ended 30 June 2017
Treatment of dividends and voting rights on performance rights
Performance rights do not have voting rights or accrue dividends.
Restriction on hedging Hedging of entitlements under the plan by executives is not permitted.
Restriction on trading Vested shares arising from the rights may only be traded with the approval of the Remuneration Committee. Approval requires that trading comply with the Company’s Securities Trading Policy.
New participants New executives (either new starts or promoted employees) are eligible to participate in the LTI on the first grant date applicable to all executives after they commence in their position. An additional pro-rata entitlement if their employment commenced after the grant date in the prior calendar year may be made on a discretionary basis.
Terminating executives Where an executive ceases employment with the Group prior to the vesting date, the rights will be forfeited. However, the Board will retain the discretion to retain executives in the plan in certain circumstances including the death, total and permanent disability or retirement of an executive. In these circumstances, the Board will also retain the discretion to vest awards in the form of cash.
Change of control On the occurrence of a change of control event, and providing at least 12 months of the grants’ performance period have elapsed, unvested performance rights pro rated with the elapsed service period are tested for vesting with performance against the relevant relative TSR, EPS growth or Scorecard requirements for that relevant period. Vesting will occur to the extent the performance conditions are met. Performance rights that have already been tested, have met performance requirements and are subject to the completion of the service condition, fully vest.
6.4.2 LTI overview
Executives participate in a LTI plan. This is an equity-based plan that provides for a reward that varies with Company performance over three-year measures of performance. Three-year measures of performance are considered to be the maximum reasonable time period for setting incentive targets for earnings per share and are generally consistent with market practice in the Company’s sector.
The payment is in the form of performance rights. The performance rights do not have any dividend entitlements or voting rights. If all the vesting requirements are satisfied, the performance rights will vest and the executives will receive shares in the Company or cash at the discretion of the Board.
The 2017 LTI represents an entitlement to performance rights to ordinary shares exercisable subject to satisfaction of both a performance condition and a continued employment condition. Grants will be in three equal tranches, with each tranche subject to an independent performance requirement. The performance requirements for each tranche will share two common features:
– Once minimum performance conditions are met, the proportion of performance rights that qualify for vesting commences at 30% and gradually increases pro rata with performance. This approach provides a strong motivation for meeting minimum performance, but avoids a large “cliff” which may encourage excessive risk taking; and
– The maximum reward is capped at a “stretch” performance level that is considered attainable without excessive risk taking.
Performance for the 2017 LTI grants will be measured over the three-year period to 30 June 2019.
The proportion of performance rights that can vest will be calculated in September 2019, but executives will be required to remain in service until 30 June 2020 to be eligible to receive any shares.
Where an executive ceases employment with the Group prior to the vesting date, the rights will be forfeited. However, the Board will retain the discretion to retain executives in the plan in certain circumstances such as the death, total and permanent disability or retirement of an executive. In these circumstances, the Board will also retain the discretion to vest awards in the form of cash.
After vesting, any shares will remain subject to a trading restriction that is governed by the Company’s Securities Trading Policy.
All unvested performance rights will be forfeited if the Board determines that an executive has committed an act of fraud, defalcation or gross misconduct or in other circumstances at the discretion of the Board.
For
per
sona
l use
onl
y

Annual Report 2017 33
6.4.3 Performance requirements
One tranche of performance rights in the 2017 LTI grant will qualify for vesting subject to performance relative to other companies, while the other two tranches of performance rights will qualify for vesting subject to separate, independent absolute performance requirements.
The relative performance requirement applicable to the first tranche of performance rights is based on total shareholder return (TSR). TSR is calculated as the difference in share price over the performance period, plus the value of shares earned from reinvesting dividends received over this period, expressed as a percentage of the share price at the beginning of the performance period. If the TSR for each company in the comparator group is ranked from highest to lowest, the median TSR is the percentage return to shareholders that exceeds the TSR for half of the comparison companies. The 75th percentile TSR is the percentage return required to exceed the TSR for 75% of the comparison companies.
Performance rights in the tranche to which the relative TSR performance requirement applies will vest pro rata between the median and 75th percentile. That is, 30% of the tranche vest at the 50th percentile, 32.8% at the 51st percentile, 35.6% at the 52nd percentile and so on until 100% vest at the 75th percentile.
The comparator group for the 2017 LTI grants will be the companies, excluding financial services companies, in the ASX100 index as at the start of the performance period on 1 July 2016. Consideration has been given to using a smaller group of direct competitors for comparison, however:
– Limiting the comparator group to a small number of direct competitors could result in very volatile outcomes from period to period; and
– Management’s strong focus on improving the Company’s ranking among ASX100 companies has become embedded in Company culture, so reinforcing this rather than trying to dislodge it with another focus was considered desirable.
The absolute performance requirement applicable to the second tranche of performance rights is based on Earnings per Share (EPS) growth over the three year performance period to 30 June 2019. The EPS measure is based on AASB 133 Earnings per Share.
The tranche of performance rights dependent on the EPS performance condition will vest pro rata between 5% compound annual EPS growth and 10% compound annual EPS growth.
Vesting applies on a pro rata basis from 30% upon meeting the minimum compound annual EPS growth performance level of 5% to 100% at 10% annual compound annual EPS growth. Capping reduces the tendency for excessive risk taking and volatility that may be encouraged if the annual compound EPS growth bar is set above 10%.
The absolute performance requirement applicable to the third tranche of performance rights is based on the Scorecard condition over the three year performance period to 30 June 2019.
The Scorecard condition is designed to:
– Strengthen retention through the setting of challenging targets on an annual basis that reflect prevailing market conditions, for a portion of LTI awards;
– Align with the STI plan to encourage a long-term approach to achieving annual financial performance targets;
– Improve the line of sight for executives so as to increase motivation and focus on consistent performance; and
– Focus on performance sustainability through reward of consistent achievement of absolute performance targets over the long term.
The Scorecard condition is comprised of two independent absolute components of equal weighting. These components are based on Group NPAT and Group FFO.
The performance of each component will be measured over the three year period to 30 June 2019.
NPAT and FFO targets are set at the beginning of each of the three financial years. The performance of each component will be assessed each year relative to the targets. Performance of each component will be determined as the average of the annual performance assessments for the three years. The performance rights will vest on a pro-rata basis from 30% upon meeting the minimum three-year average component performance level of 90% of target to 100% at the capped maximum three-year average component performance level of 110% of target.
The processes and timing applicable for the Scorecard measure are outlined below:
Timing Actions
At the beginning of the plan
Weighting of components is determined. In 2017 the components are equally weighted.
At the beginning of each financial year
NPAT and FFO target performance levels are set.
At the end of each financial year
– Calculate actual performance; and
– Assess actual performance compared to target to determine performance percentage for the year.
At the end of three years
– Calculate average annual performance for each component; and
– Calculate award based on performance against the vesting range.
At the end of four years
Consider the continued service condition and determine vesting.
For
per
sona
l use
onl
y

34 Downer EDI Limited
Directors’ Report – continuedfor the year ended 30 June 2017
6.4.4 Post‑vesting shareholding guideline
The Managing Director is required to continue holding shares after they have vested until the shareholding guideline has been attained. This guideline requires that the Managing Director holds vested long-term incentive shares equal in value to 100% of his fixed remuneration.
The Remuneration Committee has discretion to allow variations from this guideline requirement. The guideline requirement has been developed to reinforce alignment with shareholder interests.
The Board retains the right to vary from policy in exceptional circumstances. However, any variation from policy and the reasons for it will be disclosed.
6.5 Treatment of major transactions
Downer has delivered significant shareholder value through a long history of strategic mergers, acquisitions and divestments. On each occasion, the Board considers the impact of these transactions. Where a transaction is both material and unbudgeted, the Board considers whether it is appropriate to adjust for its impact on the key performance indicators on which executive performance is measured. The objective of any adjustment is to ensure that opportunities to add value through an opportunistic divestment or acquisition should not be fettered by consideration of the impact on incentive payments. That is, executives should be ‘no better or worse off’ as a result of the transaction. No adjustments are made for market reactions to a transaction as the Board believes that management is accountable for those outcomes.
This Board considers this approach to be appropriate as it:
– Ensures that executives and the Board consider these transactions solely based on the best interests of Downer;
– Means executives remain accountable for transaction execution and post-transaction performance from the next budget cycle;
– Ensures that executives complete opportunistic transactions that are in the long-term interest of shareholders;
– Is consistent with the Board’s long-term view when considering the value of major transactions to Downer’s shareholders; and
– Ensures Downer remains agile and responsive in managing its portfolio by pursuing opportunities as and when they emerge rather than be constrained by the annual budget process.
In assessing Zero Harm performance of executives, the results of acquired businesses are excluded for a period of twelve months post-acquisition to ensure that management is accountable for the objectives set in the annual business planning process and in recognition that an integration period during which Downer’s Zero Harm framework (including systems, processes, definitions and measurement and reporting methods) is implemented through the acquired business is appropriate.
For
per
sona
l use
onl
y

Annual Report 2017 35
7. Details of executive remuneration
7.1 Remuneration received in relation to the 2017 financial year
Executives receive a mix of remuneration during the year, comprising fixed remuneration, an STI paid in cash and an LTI in the form of performance rights that vest four years later, subject to meeting performance and continued employment conditions.
The table below lists the remuneration actually received in relation to the 2017 financial year, comprising fixed remuneration, cash STIs relating to 2017, deferred STIs payable in 2017 in respect of prior years and the value of LTI grants that vested during the 2017 financial year. This information differs to that provided in the statutory remuneration table at section 7.2 which shows the accounting expense of LTIs and deferred STIs for 2017 determined in accordance with accounting standards rather than the value of LTI grants that vested during the year.
FixedRemuneration1
$
Cash Bonus paid or
payable in respect of
current year$
Deferred Bonus paid or payable
in respect of prior years
$
Other Benefits
$
Totalpayments
$
Equity that vested
during 20173
$
Total remuneration
received$
G A Fenn2,4 2,083,050 964,100 722,350 – 3,769,500 – 3,769,500
C W Bruyn 601,252 – – – 601,252 – 601,252
S Cinerari2,4 1,026,576 495,550 425,500 – 1,947,626 – 1,947,626
M J Ferguson2 687,500 271,153 – – 958,653 – 958,653
S L Killeen2 302,791 66,129 – – 368,920 – 368,920
M J Miller2 675,000 232,444 – – 907,444 – 907,444
D J Overall2,4,6 1,354,308 568,277 598,063 1,248,000 3,768,648 – 3,768,648
B C Petersen2,5 850,000 315,913 31,597 – 1,197,510 – 1,197,510
7,580,477 2,913,566 1,777,510 1,248,000 13,519,553 – 13,519,553
1 Fixed remuneration comprises salary and fees, payment of leave entitlements, non-monetary benefits and superannuation payments.2 Cash Bonus paid or payable in respect of current year represents cash payments in relation to the 2017 financial year. These comprise the 50% cash component of the
award. The remaining 50% of the total award is deferred as described in section 6.3.3 Represents the value of performance rights granted in previous years that vested during the year, calculated as the number of performance rights that vested multiplied by
the closing market prices of Downer shares on the vesting date.4 Deferred Bonus represents the deferred cash bonus amount to be paid in August 2017, being the second deferred component of the 2015 award and the first deferred
component of the 2016 award, being 25% of each award.5 Deferred Bonus represents the deferred cash bonus amount to be paid in August 2017, being the first deferred component of the 2016 award (being 25% of the total
2016 award).6 D J Overall: Other benefit represents the actual cash retention benefit paid in May 2017, being 12 months’ fixed remuneration.
For
per
sona
l use
onl
y

36 Downer EDI Limited
Directors’ Report – continuedfor the year ended 30 June 2017
7.2 Remuneration of executive key management personnel required under the Corporations Act 2001 (Cth)
2017Short-term
employee benefitsPost-employment
benefits
Salaryand fees
$
Cash Bonus paid or
payable in respect
of current year
$
Deferred Bonus paid or payable4
$
Non-monetary
$
Super-annuation
$
Other benefits
$Subtotal
$
Share-basedpaymenttransac-
tions3
$Total
$
G A Fenn2 1,775,384 964,100 803,667 288,050 19,616 – 3,850,817 1,656,713 5,507,530C W Bruyn1 583,278 – (100,821) 17,974 – – 500,431 (232,346) 268,085S Cinerari2 980,384 495,550 467,313 19,916 26,276 – 1,989,439 593,437 2,582,876M J Ferguson2 659,616 271,153 112,980 8,268 19,616 – 1,071,633 119,473 1,191,106S L Killeen1,2 289,648 66,129 28,639 2,351 10,792 – 397,559 – 397,559M J Miller2 638,762 232,444 96,852 16,622 19,616 – 1,004,296 111,507 1,115,803D J Overall2,5 1,326,197 568,277 584,940 8,495 19,616 395,708 2,903,233 496,208 3,399,441B C Petersen2 810,235 315,913 157,961 20,149 19,616 – 1,323,874 184,604 1,508,478
7,063,504 2,913,566 2,151,531 381,825 135,148 395,708 13,041,282 2,929,596 15,970,878
1 Amounts represent the payments relating to the period during which the individuals were KMP.2 Cash Bonus paid or payable in respect of current year represents cash payments in relation to the 2017 financial year. These comprise the 50% cash component of
the award.3 Represents the value of vested and unvested equity expensed during the period including reversal for forfeited equity incentives and the probability of the incentives
vesting, in accordance with AASB 2 Share-based Payment, related to grants made to the executive, as outlined in section 8.2. Vesting of the majority of securities remains subject to significant performance and service conditions as outlined in section 6.4.
4 Deferred Bonus represents the value of deferred components attributable to the 2017 financial year based on amortisation of deferred components over the period from the commencement of the relevant performance year to the end of financial year to which payment of the relevant deferred component relates and the reversal for forfeited deferred components.
5 D J Overall: Other benefits represents the accrual of the cash retention benefit paid on 21 May 2017 ($395,708), being 12 months’ fixed remuneration.
2016Short-term
employee benefitsPost-employment
benefits
Salaryand fees
$
Cash Bonuspaid or
payable inrespect of
current year3
$
DeferredBonus paidor payable4
$
Non-monetary
$
Super-annuation
$
Other benefits
$Subtotal
$
Share-based
paymenttransac-
tions5
$Total
$
G A Fenn2 1,817,359 644,700 735,192 176,733 19,308 – 3,393,292 803,143 4,196,435C W Bruyn2 794,942 – 126,027 31,230 – – 952,199 252,173 1,204,372S Cinerari2 1,006,980 476,000 354,583 23,046 26,581 – 1,887,190 252,990 2,140,180M J Ferguson1,3,8 108,728 35,670 – – 4,367 – 148,765 – 148,765K J Fletcher7 870,784 631,806 261,285 86,492 31,530 – 1,881,897 775,973 2,657,870M J Miller3 536,446 – – 14,246 19,308 – 570,000 – 570,000L A Nucifora1 402,019 – – 9,143 7,574 – 418,736 – 418,736D J Overall2,6 1,305,647 595,213 594,700 – 19,308 445,627 2,960,495 375,871 3,336,366B C Petersen1,2 339,406 63,194 26,331 6,716 8,045 – 443,692 – 443,692
7,182,311 2,446,583 2,098,118 347,606 136,021 445,627 12,656,266 2,460,150 15,116,416
1 Amounts represent the payments relating to the period during which the individuals were KMP.2 Cash Bonus paid or payable in respect of current year represents cash payments in relation to the 2016 financial year. These comprise the 50% cash component of
the award.3 Cash Bonus paid or payable in respect of current year represents cash payments in relation to the 2016 financial year. These comprise 100% of the award as the executive is
currently serving in an ‘Acting’ capacity and accordingly STI deferral does not apply.4 Deferred Bonus represents the value of deferred components attributable to the 2016 financial year based on amortisation of deferred components over the period from the
commencement of the relevant performance year to the end of financial year to which payment of the relevant deferred component relates.5 Represents the value of vested and unvested equity expensed during the period including reversal for forfeited equity incentives and the probability of the incentives
vesting, in accordance with AASB 2 Share-based Payment, related to grants made to the executive. Vesting of the majority of securities remains subject to significant performance and service conditions as outlined in section 6.4.
6 D J Overall: Other benefits represents the accrual of the cash retention benefit paid on 21 May 2017 ($445,627), being 12 months’ fixed remuneration. 7 Mr K J Fletcher passed away on 10 April 2016. Salary and fees includes $140,015 in accrued leave benefits paid in relation to cessation of employment. The Board
determined that Mr Fletcher’s full 2016 STI award and unvested deferred STI entitlements (being the second deferred component of the 2014 award and the first and second deferred components of the 2015 award) be paid to his estate. All unvested STI and LTI entitlements were expensed in the 2016 financial year.
8 Mr M J Ferguson’s current annual fixed remuneration is $500,000. Amounts represent the portion of his remuneration earned as a member of the KMP in his role as Acting Chief Financial Officer.
For
per
sona
l use
onl
y

Annual Report 2017 37
7.3 Performance related remuneration
7.3.1 Performance outcomes required under the Corporations Act 2001 (Cth)
The table below lists the proportions of remuneration paid during the year ended 30 June 2017 that are performance and non-performance related and the proportion of STIs that were earned during the year ended 30 June 2017 due to the achievement of the relevant performance targets.
Proportion of 2017 remuneration
2017 Short-term incentive
PerformanceRelated
%
Non-performance
Related%
Paid%
Forfeited%
G A Fenn1 62 38 96 4
S Cinerari1 60 40 99 1
M J Ferguson 36 64 96 4
S L Killeen 18 82 52 48
M J Miller 34 66 89 11
D J Overall1 39 61 91 9
B C Petersen 37 63 99 1
1 Performance related portion includes the reversal of expense for forfeited equity incentives described in section 6.4.
7.3.2 STI performance outcomes
Specific STI financial and commercial targets remain commercially sensitive and so have not been reported.
In order for an STI to be paid, a minimum of 90% of the budgeted profit target must be met. For corporate executives, the hurdle is 90% of the Group budgeted profit target. Profit for this purpose is defined as NPAT. For divisional executives, the hurdle is 90% of the division budgeted profit target. Profit for this purpose is defined as EBIT.
The following table summarises the average performance achieved by the KMP across each element of the scorecard.
Group NPAT
DivisionalEBIT
GroupFFO
DivisionalFFO
Zero Harm People
Weighting of scorecard element Corporate 30.0 30.0 30.0 10.0
Division 7.5 22.5 7.5 22.5 30.0 10.0
Percentage of the element achieved1 Corporate 88.0 100.0 100.0 100.0
Division 88.0 76.4 100.0 77.5 91.0 100.0
1 Performance includes the results for each element, even if the NPAT or EBIT gateway was not achieved.
For
per
sona
l use
onl
y

38 Downer EDI Limited
Directors’ Report – continuedfor the year ended 30 June 2017
The following table sets out the performance achieved by each KMP across each element of the scorecard.
Corporate scorecard – G A Fenn and M J Ferguson
Element Measure Threshold Target Maximum
Zero Harm Safety •
Environmental •
People Employee engagement •
Financial Profit (NPAT) •
FFO •
Infrastructure Services scorecard – S Cinerari
Element Measure Threshold Target Maximum
Zero Harm Safety •
Environmental •
People Employee engagement •
Financial Profit (NPAT/EBIT) •
FFO •
New Zealand scorecard – S L Killeen
Element Measure Threshold Target Maximum
Zero Harm Safety •
Environmental •
People Employee engagement •
Financial Profit (NPAT/EBIT) •
FFO •
Rail scorecard – M J Miller
Element Measure Threshold Target Maximum
Zero Harm Safety •
Environmental •
People Employee engagement •
Financial Profit (NPAT/EBIT) •
FFO •
Mining scorecard – D J Overall
Element Measure Threshold Target Maximum
Zero Harm Safety •
Environmental •
People Employee engagement •
Financial Profit (NPAT/EBIT) •
FFO •
Engineering, Construction & Maintenance scorecard – B C Petersen
Element Measure Threshold Target Maximum
Zero Harm Safety •
Environmental •
People Employee engagement •
Financial Profit (NPAT/EBIT) •
FFO •
For 2017, the IPM applied to each member of the KMP remained at 1.
For
per
sona
l use
onl
y

Annual Report 2017 39
7.3.3 LTI performance outcomes
The table below summarises LTI performance measures tested and the outcomes for each executive.
Relevant executives
Relevant LTI measure
Performance outcome
% LTI tranche that vested
G A Fenn,
C W Bruyn,
S Cinerari,
D J Overall
2014 plan
TSR tranche – percentile ranking of Downer’s TSR relative to the constituents of the ASX100 over a three-year period.
Actual performance ranked at the 37th percentile.
0% became provisionally qualified.
The performance rights were forfeited.
EPS tranche – compound annual earnings per share growth against absolute targets over a three-year period.
Actual performance was -5.95%. 0% became provisionally qualified.
The performance rights were forfeited.
7.4 Major transactions
7.4.1 Major transactions in 2017
In 2017 Downer continued to optimise its portfolio in keeping with its strategy of creating new market positions to deliver long-term shareholder value through partnering, acquisition and divestment.
Downer undertook six major acquisitions during 2017 as well as an Entitlement Offer. These acquisitions were Spotless, Hawkins, ITS Pipetech, AAA asphalt plant, RPQ and AGIS Group.
7.4.2 Adjustments made to incentive calculations in relation to major transactions
In accordance with its policy, the Board considered the impact of each major transaction on incentive outcomes.
The acquisitions of RPQ and AGIS Group were included in the 2017 budget and as such no adjustments were made for those transactions.
The Board determined that the following adjustments be made to KPI calculations for the impact of the Entitlement Offer, takeover offer for Spotless and the acquisitions of Hawkins, ITS and AAA asphalt plant. The adjustments mean that executives are ‘no better or worse off’ as a result of the transactions so that performance is measured against delivery of the Company’s budget and business plan.
Measure Adjustment Impact on STI Impact on LTI
NPAT Net increase of $0.8 million comprised of:
– Exclusion of transaction costs of $18.4 million;
– Exclusion of the gain on revaluation of the initial investment in Spotless ($19.1 million) and other income ($0.7 million);
– Exclusion of net interest income of $0.5 million (being interest earned on the investment of funds raised for the Spotless transaction less interest paid on acquisition funding);
– Exclusion of operating earnings of $4.6 million generated by those businesses in FY17; and
– Income tax effect on adjustments of $7.3 million.
An additional 0.5% of the NPAT measure was earned.
An additional 0.5% of rights in the NPAT tranche met the performance condition.
For
per
sona
l use
onl
y

40 Downer EDI Limited
Directors’ Report – continuedfor the year ended 30 June 2017
Measure Adjustment Impact on STI Impact on LTI
FFO Net increase of $757.2 million comprised of:
– Exclusion of transaction costs of $13.7 million;
– Exclusion of net interest income of $1.1 million (being interest earned on the investment of funds raised for the Spotless transaction less interest paid on acquisition funding);
– Exclusion of payments made to acquire those businesses (net of cash acquired) of $746.7 million; and
– Exclusion of net cash flows generated by those businesses of $2.1 million.
An increase from nil to 100% of the FFO measure was earned.
An increase from nil to 100% of rights in the FFO tranche met the performance condition.
Zero Harm The Zero Harm performance of acquired businesses has been excluded.
Not applicable as acquired businesses historical performance has been measured on a different basis.
Not applicable.
EPS – The use of NPAT adjusted as set out above; and
– Exclusion of shares issued under the Entitlement Offer from the weighted average number of shares calculation.
Not applicable. No change.
TSR No adjustments were made to data sourced from the Australian Securities Exchange (ASX) for the calculation in relation to any major transaction. However, it is noted that ASX adjusts historical data for the bonus element of all new share issues (Adjustment Factor). In this case the Adjustment Factor is 0.943 and was applied to share prices and dividend rates prior to the capital raising.
This also applies to all companies in the peer group.
Not applicable. Not applicable.
Grant quantum Consistent with the ASX Listing Rules for the adjustment of the quantity of rights and options on issue at the time of new share issues, the quantity of unlapsed rights granted to executives were adjusted by the ASX Adjustment Factor.
Not applicable. Details of rights granted can be found at section 8.2.
7.4.3 Future periods
The takeover offer for Spotless continued in FY18. The impact on 2018 performance is included in the 2018 budget and accordingly no adjustments are expected in respect of FY18.
7.5 Variance from policy
There were no variances from policy during the year.
For
per
sona
l use
onl
y

Annual Report 2017 41
8. Executive equity ownership
8.1 Ordinary shares
KMP equity holdings in fully paid ordinary shares and performance rights issued by Downer EDI Limited are as follows:
Ordinary shares Performance rights
Balance at1 July 2016
Net change
Balance at30 June 2017
Balance at1 July 2016
Net change
Balance at30 June 2017
No. No. No. No. No. No.
G A Fenn 626,492 199,734 826,226 1,426,257 330,906 1,757,163
S Cinerari 75,708 (65,301) 10,407 489,557 136,864 626,421
M J Ferguson – – – – 94,411 94,411
S L Killeen – – – – – –
M J Miller – – – – 88,116 88,116
D J Overall 108,460 (108,460) – 510,373 27,613 537,986
B C Petersen – – – 59,450 110,566 170,016
8.2 Options and rights
No performance options were granted or exercised during the 2017 financial year.
As outlined in section 6.4.1, the LTI plan for the 2017 financial year is in the form of performance rights. Relief from certain regulatory requirements was applied for and has been received from the Australian Securities and Investments Commission. During the year, grants of performance rights were made to KMP in respect of the 2017 financial year.
The following table shows the number of performance rights granted and percentage of performance rights that vested or were forfeited during the year for each grant that affects compensation in this or future reporting periods.
2014 Plan 2015 Plan 2016 Plan 2017 Plan
Numberof per-
formance rights1
Vested%
Forfeited%
Numberof per-
formance rights2
Vested%
Forfeited%
Numberof per-
formance rights3
Vested%
Forfeited%
Number of per-
formance rights4
Vested%
Forfeited%
G A Fenn 243,576 – 100 541,920 – – 711,717 – – 503,526 – –
S Cinerari 76,726 – 100 170,705 – – 266,894 – – 188,822 – –
M J Ferguson – – – – – – – – – 94,411 – –
S L Killeen – – – – – – – – – – – –
M J Miller – – – – – – – – – 88,116 – –
D J Overall 113,993 – 100 253,619 – – 166,542 – – 117,825 – –
B C Petersen – – – – – – 63,017 – – 106,999 – –
1 Grant date 2 June 2015. The fair value of performance rights granted was $4.45 per right for the EPS tranche and $1.77 per right for the TSR tranche.2 Grant date 2 June 2015. The fair value of performance rights granted was $4.23 per right for the EPS and Scorecard tranches and $1.70 per right for the TSR tranche.
These quantities include the additional performance rights arising from application of the ASX Adjustment Factor to the quantity of unlapsed rights as a result of the Entitlement Offer.
3 Grant date 30 June 2016. The fair value of performance rights granted was $3.24 per right for the EPS and Scorecard tranches and $0.97 per right for the TSR tranche. These quantities include the additional performance rights arising from application of the ASX Adjustment Factor to the quantity of unlapsed rights as a result of the Entitlement Offer.
4 Grant date 21 June 2017. The fair value of performance rights granted was $5.29 per right for the EPS and Scorecard tranches and $4.61 per right for the TSR tranche.For
per
sona
l use
onl
y

42 Downer EDI Limited
Directors’ Report – continuedfor the year ended 30 June 2017
The maximum number of performance rights that may vest in future years that will be recognised as share-based payments in future years is set out in the table below:
Maximum number of shares for the vesting year
2019 2020 2021
G A Fenn 541,920 711,717 503,526
S Cinerari 170,705 266,894 188,822
M J Ferguson – – 94,411
S L Killeen – – –
M J Miller – – 88,116
D J Overall 253,619 166,542 117,825
B C Petersen – 63,017 106,999
The maximum value of performance rights that may vest in future years that will be recognised as share-based payments in future years is set out in the table below. The amount reported is the value of share-based payments calculated in accordance with AASB 2 Share-based Payment over the vesting period.
2018 2019 2020
G A Fenn 1,756,032 1,192,878 637,191
S Cinerari 593,734 509,306 238,946
M J Ferguson 119,473 119,473 119,473
S L Killeen – – –
M J Miller 111,507 111,507 111,507
D J Overall 542,691 279,134 149,103
B C Petersen 184,604 184,605 135,403
8.3 Remuneration consultants
Guerdon Associates Pty Ltd was engaged by the Board Remuneration Committee to provide remuneration advice in relation to KMP, but did not provide the Board Remuneration Committee with remuneration recommendations as defined under Division 1, Part 1.2, 9B (1) of the Corporations Act 2001 (Cth).
The Board was satisfied that advice received was free from any undue influence by KMP to whom the advice may relate, because strict protocols were observed and complied with regarding any interaction between Guerdon Associates Pty Ltd and management, and because all remuneration advice was provided to the Board Remuneration Committee chair.
9. Key terms of employment contracts
9.1 Notice and termination payments
Executives are on contracts with no fixed end date.
The following table captures the notice periods applicable to termination of the employment of executives.
Termination notice period by Downer
Termination notice period by employee
Termination payments payable under contract
Managing Director 12 months 6 months 12 months
Other Executives 12 months 6 months 12 months
Termination payments are calculated based upon total fixed remuneration at the date of termination. No payment is made for termination due to gross misconduct.
For
per
sona
l use
onl
y

Annual Report 2017 43
9.2 Managing Director and Chief Executive Officer of Downer’s employment agreement
Mr Fenn was appointed as the Managing Director of Downer commencing on 30 July 2010. The following table sets out the key terms of the Managing Director’s employment agreement.
Term Until terminated by either party.
Fixed remuneration $2.0 million per annum. This has remained unchanged since July 2012.
Fixed remuneration includes superannuation and non-cash benefits but excludes entitlements to reimbursement for Mr Fenn’s home telephone rental and call costs, home internet costs and medical, life and salary continuance insurance. Mr Fenn may also be accompanied by his wife when travelling on business, at the Chairman’s discretion. There was no such travel during the year.
STI opportunity Mr Fenn is eligible to receive an annual STI and the maximum STI opportunity is 100% of fixed remuneration.
Any entitlement to an STI is at the discretion of the Board, having regard to performance measures and targets developed in consultation with Mr Fenn including Downer’s financial performance, safety, people, environmental and sustainability targets and adherence to risk management policies and practices. The Board also retains the right to vary the STI by + or – 100% (up to the 100% maximum) based on its assessment of performance. The STI deferral arrangements in place for KMP apply to Mr Fenn.
There is no STI entitlement where the Managing Director’s employment terminates prior to the end of the financial year, other than in the event of a change in control or by mutual agreement.
LTI opportunity Mr Fenn is eligible to participate in the annual LTI plan and the value of the award is 100% of fixed remuneration calculated using the volume weighted average price after each year’s half yearly results announcement.
Mr Fenn’s performance requirements have been described in section 6.4.
In the event of a change of control, providing at least 12 months of a grant’s performance period have elapsed, unvested shares and performance rights pro rated with the elapsed service period are tested for vesting with performance against the relevant hurdles for that period and vest, as appropriate. Shares that have already been tested, have met performance requirements and are subject to the completion of the service condition, fully vest.
Termination Mr Fenn can resign:
a) By providing six months’ written notice; or
b) Immediately in circumstances where there is a fundamental change in his role or responsibilities. In these circumstances, Mr Fenn is entitled to a payment in lieu of 12 months’ notice.
Downer can terminate Mr Fenn’s employment:
a) Immediately for misconduct or other circumstances justifying summary dismissal; or
b) By providing 12 months’ written notice.
When notice is required, Downer can make a payment in lieu of notice of all or part of any notice period (calculated based on Mr Fenn’s fixed annual remuneration).
If Mr Fenn resigns because ill health prevents him from continuing his duties, he will receive a payment in recognition of his past services equivalent to 12 months’ fixed remuneration. At the discretion of the Board, his shares under the LTI plan may also vest.
If Downer terminates Mr Fenn’s employment on account of redundancy, in addition to the notice (or payment in lieu of notice) required to be given by Downer, Mr Fenn will receive a payment in recognition of his past services equivalent to 12 months’ fixed remuneration.
If Mr Fenn resigns he will be subject to a six-month post-employment restraint in certain areas where the Downer Group operates, where he is restricted from working for competitive businesses.
Other The agreement contains provisions regarding leave entitlements, duties, confidentiality, intellectual property, moral rights and other facilitative and ancillary clauses. It also contains provisions regarding corporate governance and a provision dealing with the Corporations Act 2001 (Cth) limits on termination benefits to be made to Mr Fenn.
For
per
sona
l use
onl
y

44 Downer EDI Limited
Directors’ Report – continuedfor the year ended 30 June 2017
10. Related party information
10.1 Transactions with other related parties
Transactions entered into during the year with Directors of Downer EDI Limited and the Group are within normal employee, customer or supplier relationships on terms and conditions no more favourable than dealings in the same circumstances on an arm’s length basis and include:
– the receipt of dividends from Downer EDI Limited;
– participation in the Long Term Incentive Plan;
– terms and conditions of employment; and
– reimbursement of expenses.
A number of Directors of the Company hold directorships in other entities. Several of these entities transacted with the Group on terms and conditions no more favourable than those available on an arm’s length basis.
11. Description of Non-executive Director remuneration
11.1 Non-executive Director remuneration policy
Downer’s Non-executive Director remuneration policy is to provide fair remuneration that is sufficient to attract and retain Directors with the experience, knowledge, skills and judgement to steward the Company.
There has been no change to the level of Non-executive Director fees since the prior reporting period and there will be no changes in the 2018 financial year.
Fees for Non-executive Directors are fixed and are not linked to the financial performance of the Company. The Board believes this is necessary for Non-executive Directors to maintain their independence.
Shareholders approved an annual aggregate cap of $2.0 million for Non-executive Director fees at the 2008 AGM. The allocation of fees to Non-executive Directors within this cap has been determined after consideration of a number of factors, including the time commitment of Directors, the size and scale of the Company’s operations, the skill sets of Board members, the quantum of fees paid to Non-executive Directors of comparable companies and participation in Board Committee work.
The basis of fees and the fee pool are reviewed when new Directors are appointed to the Board, when the structure of the Board changes, or at least every three years. Reference is made to individual Non-executive Director fee levels and workload (i.e. number of meetings and the number of Directors) at comparably sized companies from all industries other than the financial services sector, and the fee pools at these companies. In addition, an assessment is made on the extent of flexibility provided by the fee pool to recruit any additional Directors for planned succession after allocation of fees to existing Directors.
The Chairman receives a base fee of $375,000 per annum (inclusive of all Committee fees) plus superannuation. The other Non-executive Directors each receive a base fee of $150,000 per annum plus superannuation. Additional fees are paid for Committee duties: $35,000 for the chair of the Audit & Risk Committee; and $15,000 for the chair of each of the Zero Harm Committee, Remuneration Committee, Rail Projects Committee and Tender Risk Evaluation Committee.
Under his original terms of appointment in 2001, John Humphrey was eligible for certain retirement benefits. Consistent with the ASX Corporate Governance Council’s Corporate Governance Principles and Recommendations, the right to these retirement benefits was frozen and fully provided for in the financial statements. Other Non-executive Directors are not entitled to retirement benefits. All Non-executive Directors are entitled to payment of statutory superannuation entitlements in addition to Directors’ fees.
For
per
sona
l use
onl
y

Annual Report 2017 45
11.2 Non-executive Directors’ remuneration
The table below sets out the remuneration paid to Non-executive Directors for the 2017 and 2016 financial years.
Short-term benefits Post-employment benefits
YearBoard fee
$Chair fee
$Total fees
$Superannuation
$
Terminationbenefits
$Total
$
R M Harding 2017 375,000 – 375,000 35,625 – 410,625
2016 375,000 – 375,000 35,000 – 410,000
S A Chaplain 2017 150,000 35,000 185,000 17,575 – 202,575
2016 150,000 35,000 185,000 17,575 – 202,575
P S Garling 2017 150,000 15,000 165,000 15,675 – 180,675
2016 150,000 15,000 165,000 15,675 – 180,675
T G Handicott 2017 114,454 11,250 125,704 11,942 – 137,646
2016 – – – – – –
E A Howell 2017 150,000 11,250 161,250 15,319 – 176,569
2016 150,000 15,000 165,000 15,675 – 180,675
J S Humphrey 2017 51,359 – 51,359 8,466 185,000 244,825
2016 150,000 – 150,000 14,250 – 164,250
C G Thorne 2017 150,000 18,750 168,750 16,031 – 184,781
2016 150,000 15,000 165,000 15,675 – 180,675
11.3 Equity held by Non-executive Directors
The table below sets out the equity in Downer held by Non-executive Directors for the 2017 and 2016 financial years.
2017 2016
Balance at 1 July 2016
Net change
Balance at 30 June 2017
Balance at1 July 2015
Net change
Balance at30 June 2016
R M Harding 10,150 4,060 14,210 10,150 – 10,150
S A Chaplain 74,142 29,657 103,799 64,142 10,000 74,142
P S Garling 12,100 4,840 16,940 12,100 – 12,100
E A Howell 10,000 4,000 14,000 10,000 – 10,000
T G Handicott – 14,000 14,000 – – –
C G Thorne 59,230 23,692 82,922 59,230 – 59,230
Signed in accordance with a resolution of the Directors made pursuant to section 298(2) of the Corporations Act 2001 (Cth).
On behalf of the Directors
R M Harding Chairman
Sydney, 29 August 2017
For
per
sona
l use
onl
y

KPMG, an Australian partnership and a member firm of the KPMG network of independent member firms affiliated with KPMG International Cooperative (“KPMG
International”), a Swiss entity. Liability limited by a scheme approved under Professional Standards Legislation.
LEAD AUDITOR’S INDEPENDENCE DECLARATION UNDER SECTION 307C OF THE CORPORATIONS ACT 2001
To: the directors of Downer EDI Limited
I declare that, to the best of my knowledge and belief, in relation to the audit for the financial year ended 30 June 2017 there have been:
(i) no contraventions of the auditor independence requirements as set out in the Corporations Act 2001 in relation to the audit; and
(ii) no contraventions of any applicable code of professional conduct in relation to the audit.
KPMG
John Teer Partner
Sydney
29 August 2017
46 Downer EDI Limited
Auditor’s Independence DeclarationF
or p
erso
nal u
se o
nly

Annual Report 2017 47
Independent Auditor’s Reportfor the year ended 30 June 2017
KPMG, an Australian partnership and a member firm of the KPMG network of independent member firms affiliated with KPMG International Cooperative (“KPMG International”), a Swiss entity. Liability limited by a scheme approved under Professional Standards Legislation.
INDEPENDENT AUDITOR’S REPORT To the Members of Downer EDI Limited
REPORT ON THE FINANCIAL REPORT
Opinion
We have audited the Financial Report of Downer EDI Limited (the Company).
In our opinion, the accompanying Financial Report of the Company is in accordance with the Corporations Act 2001, including: • giving a true and fair view of the Group’s financial
position as at 30 June 2017 and of its financial performance for the year ended on that date; and
• complying with Australian Accounting Standards and the Corporations Regulations 2001.
The Financial Report comprises: • Consolidated Statement of financial position as at
30 June 2017 • Consolidated Statement of profit or loss and other
comprehensive income, Consolidated Statement of changes in equity, and Consolidated Statement of cash flows for the year then ended
• Notes including a summary of significant accounting policies
• Directors’ Declaration.
The Group consists of the Company and the entities it controlled at the year-end or from time to time during the financial year.
Basis for opinion
We conducted our audit in accordance with Australian Auditing Standards. We believe that the audit evidence we have obtained is sufficient and appropriate to provide a basis for our opinion.
Our responsibilities under those standards are further described in the Auditor’s responsibilities for the audit of the Financial Report section of our report.
We are independent of the Group in accordance with the Corporations Act 2001 and the ethical requirements of the Accounting Professional and Ethical Standards Board’s APES 110 Code of Ethics for Professional Accountants (the Code) that are relevant to our audit of the Financial Report in Australia. We have fulfilled our other ethical responsibilities in accordance with the Code.
Key audit matters
The Key audit matters we identified are: • Recognition of revenue • Value of goodwill • Acquisition of controlled entities
Key audit matters are those matters that, in our professional judgment, were of most significance in our audit of the Financial Report of the current period.
These matters were addressed in the context of our audit of the Financial Report as a whole, and in forming our opinion thereon, and we do not provide a separate opinion on these matters.
Key audit matter How our audit addressed the key audit matter
Recognition of revenue
Refer to Note B2 ‘Revenue and other income’. ($7,287.4m).
A substantial amount of the Group’s revenue relates to revenue from the rendering of services and construction contracts. Where these services and/or contracts have a long-term duration, revenue and margin are recognised based on the stage of completion of individual contracts. This is predominantly calculated on the proportion of total costs incurred at the reporting date compared to management’s estimation of total costs of the contract. We focussed on these types of contracts due to the high level of estimation involved, in particular relating to:
• Forecasting total cost to complete at initiation of the contract, including the estimation of cost contingencies for contracting risks;
• Revisions to total forecast costs for certain events or conditions that occur during the performance of the contract, or are expected to occur to complete the contract; and
• The recognition of variations and claims, based on an assessment by the Group as to whether it is
Our procedures included: • We evaluated the Group’s process regarding accounting for
contract revenues. We tested controls such as:
- the authorisation of monthly project valuations, which involves management assessing key contract KPIs, including cashflows;
- management’s assessment of significant changes in work in progress balances;
- management’s assessment of project unapproved variations and claims, and responses to project risk ratings;
- the review and approval of bid information including estimated project milestones, projected Earnings Before Interest and Tax (EBIT), Net Present Value (NPV), Return On Funds Employed (ROFE) and any potential legal identified by the Group risk and legal team, as prescribed in the Group’s risk management process;
• We undertook a sample of site visits (to both contract sites and commercial offices) across the Group’s major divisions and
For
per
sona
l use
onl
y

48 Downer EDI Limited
Independent Auditor’s Report – continuedfor the year ended 30 June 2017
KPMG, an Australian partnership and a member firm of the KPMG network of independent member firms affiliated with KPMG International Cooperative (“KPMG International”), a Swiss entity. Liability limited by a scheme approved under Professional Standards Legislation.
probable that the amount will be approved by the customer and therefore recovered.
We focused on this area as a key audit matter due to the number and type of estimation events that may occur over the course of the contract life, leading to complex and judgemental revenue recognition from contracts.
geographies to obtain a detailed understanding of the Group’s contract processes, their consistent application, and to understand the variety of risk elements of the contracts;
• We used data analytic routines to select a sample of contracts for testing based on a number of quantitative and qualitative factors. These factors included contracts with significant deterioration in margin, significant variations and claims, and factors which indicated to us that a greater level of judgement was required by the Group when assessing the revenue recognition based on the estimates developed for current and forecast contract performance. For the sample selected, where relevant:
- we read the contract terms and conditions to evaluate whether the individual characteristics of each contract were reflected in the estimate;
- we assessed the estimation of costs to complete by checking key forecast cost assumptions to underlying evidence such as Enterprise Bargaining Agreements for wage rates, previous purchase invoices for parts, historical costs for maintenance events and agreements with subcontractors;
- we assessed the Group’s ability to forecast margins on contracts by analysing the accuracy of previous margin forecasts to actual outcomes;
- we tested the variations and claims both within contract revenue and contract costs to underlying documentation, such as timesheets, correspondence with customers and independent time and cost claim experts (where applicable) for consistency and appropriateness with contract terms;
- we evaluated the Group’s legal and external experts’ reports received on contentious matters to identify conditions that may indicate the inappropriate recognition of variations and claims. We checked the consistency of this to the inclusion or not of an amount in the estimates used for revenue recognition;
- for contracts that had significant variation and claim elements, we used our major project specialists to evaluate the claim elements for risk of non-recovery. Our major projects specialists have significant experience and credentials to advise on project management matters; and
- we evaluated significant exposures to liquidated damages for late delivery of contract works by assessing the variation registers, which track the nature, quantum and status of current exposures.
Value of goodwill
Refer to C7 ‘Intangible assets’ ($2,607.3m).
The Group’s Cash Generating Units (CGUs) are subject to the cyclical nature of service and infrastructure spend in the sectors in which those CGUs operate. Some of these sectors have experienced the impacts of reductions in capital expenditure, constrained government spending, cost reduction mandates, project cancellations and deferrals, along with volatile commodity prices. Changes in those sectors impact the business activity for the Group’s CGUs and the resulting forecast cash flows used in the Group’s value in use models. Given these changes, the value of goodwill was a key audit matter.
Our procedures included:
• We evaluated the Group’s goodwill impairment assessment process and tested controls such as the review and approval of forecasts by management;
• We assessed the Group’s determination of the Group’s CGUs or groups of CGUs based on our understanding of the nature of the Group’s business units. We compared this to the internal reporting of the Group to assess how earnings are monitored and reported;
• We obtained the Group’s value in use models and checked amounts to a combination of the FY18 budget and the FY19-FY20 business plan.
For
per
sona
l use
onl
y

Annual Report 2017 49
KPMG, an Australian partnership and a member firm of the KPMG network of independent member firms affiliated with KPMG International Cooperative (“KPMG International”), a Swiss entity. Liability limited by a scheme approved under Professional Standards Legislation.
Other conditions giving rise to our focus on this area included the significant level of judgement in respect of factors such as:
• The determination of CGUs or groups of CGUs;
• Budgeted future revenue and costs;
• Discount rates;
• Terminal growth rate; and
• The outcome of tenders.
The Group has identified the Mining CGU as having sensitivity to impairment due the fact that a reasonably possible change in projected cash flows could result in the carrying value of the CGU exceeding their recoverable amount.
• Key inputs to the value in use models included forecast revenue, costs, capital expenditure, discount rates and terminal growth rates. We challenged these inputs by comparing the key market based assumptions to external analyst reports, published industry growth rates and industry reports. We compared forecasts to historical costs incurred or margins on similar projects. We also assessed the inclusion of key ongoing revenue contracts by comparing the margins in the impairment model to historical contract margins and for current tenders we assessed the probability weighting and margins based on our understanding of the business;
• We assessed the accuracy of previous Group forecasting to inform our evaluation of forecasts included in the value in use model. We applied increased scepticism to current period forecasts in areas where previous forecasts were not achieved and/or where future uncertainty is greater or volatility is expected;
• We involved our valuation specialists, for those CGUs with a higher risk of impairment, to recalculate the Group’s discount rates based on its business and its industry. Valuation specialists were also involved in assessing the value in use model for valuation methodology, including the treatment of assumptions for capital expenditure, working capital, terminal value and the net present value calculation;
• We performed sensitivity analysis on all CGUs in two main areas, being the discount rate and terminal growth rate assumptions. For the CGUs with a higher risk of impairment we performed a range of sensitivity analyses including the discount rate and terminal growth rate assumptions, revenue growth and cost savings targets set by management, as well as probability adjusting the outcomes of key tenders;
• We assessed the allocation of corporate overheads and assets to CGUs by comparing the allocation methodology to our understanding of the business and industry;
• We assessed the Group’s disclosures of the quantitative and qualitative considerations in relation to the valuation of goodwill, by comparing these disclosures to our understanding of the matter.
Acquisition of controlled entities
Refer to F2 ‘Acquisition of businesses’ ($779.3m).
During the year the Group purchased controlling interests in a number of businesses/entities. These acquisitions have been accounted for as business combinations and in a number of cases the acquisition accounting remains provisional at year end.
Accounting for the purchase of controlling interests is a Key Audit Matter due to the:
• Aggregated size of the acquisitions;
• Complexity of the acquisition process, specifically for Spotless Group Holdings Limited (Spotless), and the resultant large volume of documentation requiring our assessment;
• Early status of the acquisition accounting for certain of the transactions, which remain provisional at year end. This increases the possible range of outcomes for the auditor to consider and is impacted by the reduced precision of audit evidence; and
Our procedures included:
• We read the Bidders Statement and Sale and Purchase Agreements (as applicable) to understand key terms and conditions;
• We evaluated the methodology used for the acquisition accounting against accounting standard requirements and common industry practice for the determination of fair value;
• We challenged key assumptions in the Group’s intangible valuation models by comparing these inputs to market data, historic and current entity records, and strategic plans;
• Working with our valuation specialists, we challenged the discount rate assumptions used in the purchase price allocation by comparing the rates used by the Group against external market reports;
• We compared fair value adjustments for working capital to signed agreements;
For
per
sona
l use
onl
y

50 Downer EDI Limited
Independent Auditor’s Report – continuedfor the year ended 30 June 2017
KPMG, an Australian partnership and a member firm of the KPMG network of independent member firms affiliated with KPMG International Cooperative (“KPMG International”), a Swiss entity. Liability limited by a scheme approved under Professional Standards Legislation.
• Significance of the estimation required to determine the fair values of acquired assets and liabilities under the accounting standards, for those transactions where the acquisition accounting has been finalised.
We focused on assessing the basis for the estimations against the allowed criteria in the accounting standards to determine fair value and the documentation available from the Group to date. For those acquisitions where the purchase accounting has been completed the key inputs to the valuations were forecast assumptions relating to revenue, operating costs, the impact of contributory assets, the fair value of contingent consideration and discount rates.
• For contingent consideration (where applicable) we challenged the Group’s assumptions of forecast future performance by comparing inputs to strategic plans and historic growth rates, comparing the model used to the sale and purchase agreement and assessing the mathematical accuracy of the model used;
• We assessed the accounting treatment of post-acquisition payments to vendors against the Sale and Purchase Agreement and criteria contained in the relevant accounting standards;
• We compared the acquired company’s accounting policies against the Group’s policies; and
We assessed the adequacy of the Group’s disclosures in respect of the acquisitions against the requirements of accounting standards and our knowledge of the transactions.
Other Information
Other Information is financial and non-financial information in Downer EDI Limited’s annual reporting which is provided in addition to the Financial Report and the Auditor's Report. The Directors are responsible for the Other Information.
Our opinion on the Financial Report does not cover the Other Information and, accordingly, we do not express an audit opinion or any form of assurance conclusion thereon, with the exception of the Remuneration Report and our related assurance opinions.
In connection with our audit of the Financial Report, our responsibility is to read the Other Information. In doing so, we consider whether the Other Information is materially inconsistent with the Financial Report or our knowledge obtained in the audit, or otherwise appears to be materially misstated.
We are required to report if we conclude that there is a material misstatement of this Other Information, and based on the work we have performed on the Other Information that we obtained prior to the date of this Auditor’s Report we have nothing to report.
Responsibilities of the Directors for the Financial Report
The Directors are responsible for:
• preparing the Financial Report that gives a true and fair view in accordance with Australian Accounting Standards and the Corporations Act 2001
• implementing necessary internal control to enable the preparation of a Financial Report that gives a true and fair view and is free from material misstatement, whether due to fraud or error
• assessing the Group’s ability to continue as a going concern. This includes disclosing, as applicable, matters related to going concern and using the going concern basis of accounting unless they either intend to liquidate the Group or to cease operations, or have no realistic alternative but to do so.
Auditor’s responsibilities for the audit of the Financial Report
Our objective is:
• to obtain reasonable assurance about whether the Financial Report as a whole is free from material misstatement, whether due to fraud or error; and
• to issue an Auditor’s Report that includes our opinion.
Reasonable assurance is a high level of assurance, but is not a guarantee that an audit conducted in accordance with Australian Auditing Standards will always detect a material misstatement when it exists.
Misstatements can arise from fraud or error. They are considered material if, individually or in the aggregate, they could reasonably be expected to influence the economic decisions of users taken on the basis of this Financial Report.
A further description of our responsibilities for the audit of the Financial Report is located at the Auditing and Assurance Standards Board website at: http://www.auasb.gov.au/auditors_files/ar2.pdf. This description forms part of our Auditor’s Report.
For
per
sona
l use
onl
y

Annual Report 2017 51
KPMG, an Australian partnership and a member firm of the KPMG network of independent member firms affiliated with KPMG International Cooperative (“KPMG International”), a Swiss entity. Liability limited by a scheme approved under Professional Standards Legislation.
REPORT ON THE REMUNERATION REPORT
Opinion
In our opinion, the Remuneration Report of Downer EDI Limited for the year ended 30 June 2017, complies with Section 300A of the Corporations Act 2001.
Directors’ responsibilities
The Directors of the Company are responsible for the preparation and presentation of the Remuneration Report in accordance with Section 300A of the Corporations Act 2001.
Our responsibilities
We have audited the Remuneration Report included in pages 20 to 45 of the Directors’ report for the year ended 30 June 2017.
Our responsibility is to express an opinion on the Remuneration Report, based on our audit conducted in accordance with Australian Auditing Standards. KPMG
John Teer Cameron Slapp
Partner Partner
Sydney Sydney
29 August 2017 29 August 2017
For
per
sona
l use
onl
y

52 Downer EDI Limited
Financial Statements
Page 53 Consolidated Statement of Profit or Loss and Other Comprehensive Income Page 54 Consolidated Statement of Financial Position Page 55 Consolidated Statement of Changes in Equity Page 56 Consolidated Statement of Cash Flows
Notes to the consolidated financial statements
AAbout this report
Page 57-58
BBusiness performance
Page 59 -67
COperating assets and liabilities
Page 68-76
DEmployee benefits
Page 77
ECapital structure and financing
Page 78-86
FGroup structure
Page 87-96
GOther
Page 97-107
B1Segment information
C1Reconciliation of cash and cash equivalents
D1Employee benefits
E1Borrowings
F1Joint arrangements and associate entities
G1New accounting standards
B2Profit from ordinary activities
C2Trade and other receivables
D2Key management personnel compensation
E2Financing facilities
F2Acquisition of businesses
G2Capital and financial risk management
B3Earnings per share
C3Rendering of services and construction contracts
D3Employee discount share plan
E3Commitments
F3Disposal of subsidiary
G3Other financial assets and liabilities
B4Taxation
C4Inventories
E4Issued capital
F4Controlled entities
B5Remuneration of auditors
C5Trade and other payables
E5Reserves
F5Related party information
B6Subsequent events
C6Property, plant and equipment
E6Dividends
F6Parent entity disclosures
C7Intangible assets
C8Provisions
C9Contingent liabilities
Page 108 Directors’ Declaration For
per
sona
l use
onl
y

Annual Report 2017 53
Note2017$’m
2016$’m
Revenue from ordinary activities B2(a) 7,267.1 6,846.2
Other income B2(a) 20.3 3.8
Total revenue and other income 7,287.4 6,850.0
Employee benefits expense D1 (2,787.3) (2,758.6)
Subcontractor costs (1,740.8) (1,455.2)
Raw materials and consumables used (1,357.0) (1,174.8)
Plant and equipment costs (502.8) (580.2)
Depreciation and amortisation C6,C7 (220.2) (258.7)
Other expenses from ordinary activities (424.0) (363.3)
Total expenses (7,032.1) (6,590.8)
Share of net profit of joint ventures and associates F1(a) 22.5 17.7
Earnings before interest and tax 277.8 276.9
Finance income 14.4 7.2
Finance costs (41.2) (40.2)
Net finance costs (26.8) (33.0)
Profit before income tax 251.0 243.9
Income tax expense B4(a) (69.5) (63.3)
Profit after income tax 181.5 180.6
Profit for the year is attributable to: – Non-controlling interest – –
– Members of the parent entity 181.5 180.6
Profit for the year 181.5 180.6
Other comprehensive income
Items that may be reclassified subsequently to profit or loss – Exchange differences arising on translation of foreign operations 0.4 9.4
– Net loss on foreign currency forward contracts taken to equity (1.9) (2.5)
– Net loss on cross currency and interest rate swaps taken to equity (2.6) (0.8)
– Income tax relating to components of other comprehensive income 0.9 1.0
– Change in fair value of available-for-sale assets 18.3 –
– Available-for-sale reserve transferred to profit or loss (19.1) –
Other comprehensive (loss) / income for the year (net of tax) (4.0) 7.1
Other comprehensive income for the year is attributable to: – Non-controlling interest – –
– Members of the parent entity (4.0) 7.1
Other comprehensive (loss) / income for the year (4.0) 7.1
Total comprehensive income for the year 177.5 187.7
Earnings per share (cents)(i) Restated (i)
– Basic earnings per share B3 35.8 38.0
– Diluted earnings per share B3 35.0 35.9
(i) 2016 Earnings per share calculation has been restated to allow for the impact of the capital raising announced on 21 March 2017. Refer to Note B3.
The consolidated statement of profit or loss and other comprehensive income should be read in conjunction with the accompanying notes on pages 57 to 107.
Consolidated Statement of Profit or Loss and Other Comprehensive Incomefor the year ended 30 June 2017
For
per
sona
l use
onl
y

54 Downer EDI Limited
Note
30 June2017$’m
30 June2016
$’m
ASSETSCurrent assetsCash and cash equivalents C1(b) 844.6 569.4
Trade and other receivables C2 1,725.7 1,124.3
Other financial assets G3 12.5 10.1
Inventories C4 301.7 327.2
Current tax assets 45.5 46.3
Prepayments and other assets 49.5 38.2
Total current assets 2,979.5 2,115.5
Non-current assetsTrade and other receivables 105.6 17.3
Interest in joint ventures and associates F1(a) 88.0 81.6
Property, plant and equipment C6 1,295.2 988.3
Intangible assets C7 2,878.9 969.9
Other financial assets G3 17.1 22.1
Deferred tax assets B4(b) 59.4 –
Prepayments and other assets 31.7 5.6
Total non-current assets 4,475.9 2,084.8
Total assets 7,455.4 4,200.3
LIABILITIESCurrent liabilitiesTrade and other payables C5 1,761.0 1,010.9
Borrowings E1 863.2 45.5
Other financial liabilities G3 23.8 15.1
Employee benefits provision D1 365.4 254.2
Provisions C8 68.0 51.6
Current tax liabilities 7.2 0.5
Total current liabilities 3,088.6 1,377.8
Non-current liabilitiesTrade and other payables 30.6 12.7
Borrowings E1 581.8 604.5
Other financial liabilities G3 21.7 0.7
Employee benefits provision D1 38.2 27.6
Provisions C8 51.8 30.8
Deferred tax liabilities B4(b) 56.2 57.7
Total non-current liabilities 780.3 734.0
Total liabilities 3,868.9 2,111.8
Net assets 3,586.5 2,088.5
EQUITYIssued capital E4 2,421.8 1,427.8
Reserves E5 (10.9) (8.8)
Retained earnings 740.4 669.5
Parent interests 3,151.3 2,088.5
Non-controlling interest 435.2 –
Total equity 3,586.5 2,088.5
The consolidated statement of financial position should be read in conjunction with the accompanying notes on pages 57 to 107.
Consolidated Statement of Financial Positionas at 30 June 2017
For
per
sona
l use
onl
y

Annual Report 2017 55
2017$’m Issued capital Reserves
Retained earnings
Attributable to owners of
the parent
Non-controlling
interest Total
Balance at 1 July 2016 1,427.8 (8.8) 669.5 2,088.5 – 2,088.5 Profit after income tax – – 181.5 181.5 – 181.5 Other comprehensive income for the year (net of tax) – (4.0) – (4.0) – (4.0)Total comprehensive income for the year – (4.0) 181.5 177.5 – 177.5
Capital raising (net of transaction costs and tax) (i) 993.0 – – 993.0 – 993.0 Acquisition of business (ii) – – – – 435.2 435.2 Vested executive incentive share transactions 1.0 (1.0) – – – –Share-based employee benefits expense – 5.6 – 5.6 – 5.6 Income tax relating to share-based transactions during the year – (2.7) – (2.7) – (2.7)Payment of dividends(iii) – – (110.6) (110.6) – (110.6)Balance at 30 June 2017 2,421.8 (10.9) 740.4 3,151.3 435.2 3,586.5
(i) Relates to capital raising for the Spotless takeover bid. Refer to Note E4. (ii) Non-controlling interest as a result of Spotless acquisition. Refer to Note F2. (iii) Payment of dividends relates to 2016 final dividend, 2017 interim dividend and ROADS dividends paid during the financial year.
2016$’m
Issued capital Reserves
Retained earnings
Attributable to owners of
the parent
Non-controlling
interest Total
Balance at 1 July 2015 1,449.1 (15.8) 602.0 2,035.3 – 2,035.3 Profit after income tax – – 180.6 180.6 – 180.6 Other comprehensive income for the year (net of tax) – 7.1 – 7.1 – 7.1 Total comprehensive income for the year – 7.1 180.6 187.7 – 187.7
Group on-market share buy-back (26.5) – – (26.5) – (26.5)Vested executive incentive share transactions 5.2 (5.2) – – – –Share-based employee benefits expense – 4.9 – 4.9 – 4.9 Income tax relating to share-based transactions during the year – 0.2 – 0.2 – 0.2 Payment of dividends(i) – – (113.1) (113.1) – (113.1)Balance at 30 June 2016 1,427.8 (8.8) 669.5 2,088.5 – 2,088.5
(i) Payment of dividends relates to 2015 final dividend, 2016 interim dividend and ROADS dividends paid during the financial year.
The consolidated statement of changes in equity should be read in conjunction with the accompanying notes on pages 57 to 107.
Consolidated Statement of Changes in Equityfor the year ended 30 June 2017
For
per
sona
l use
onl
y
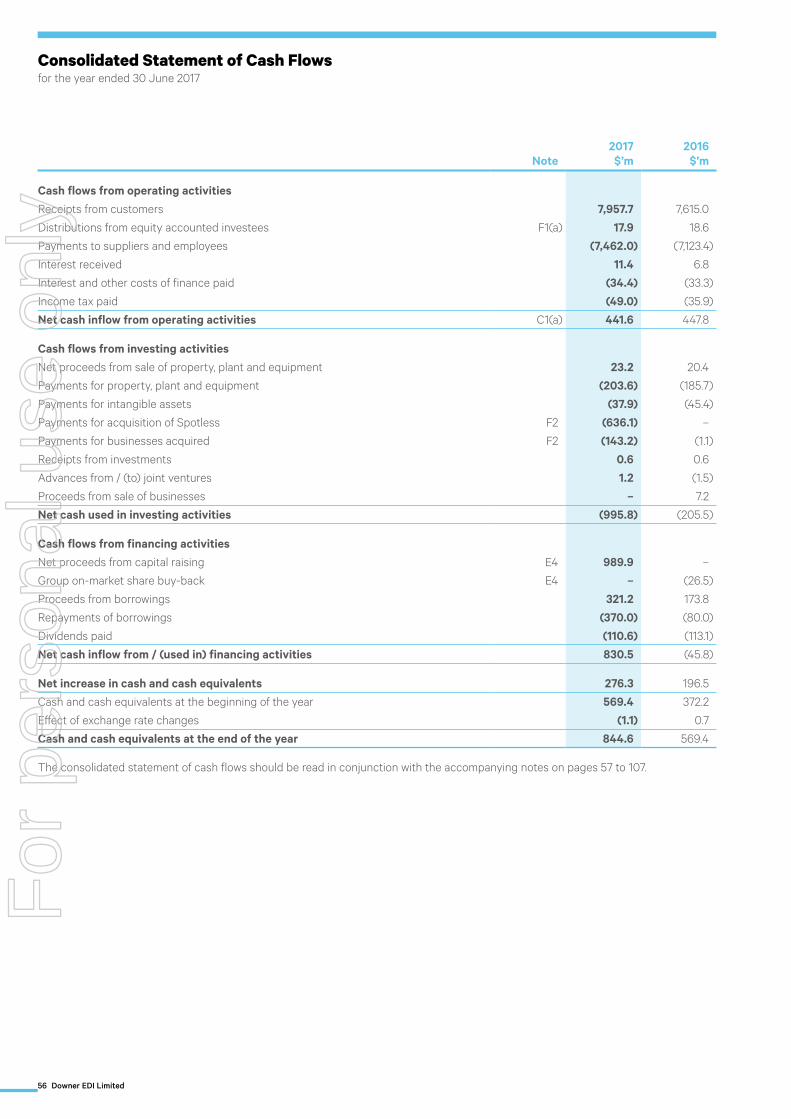
56 Downer EDI Limited
Note2017$’m
2016$’m
Cash flows from operating activitiesReceipts from customers 7,957.7 7,615.0
Distributions from equity accounted investees F1(a) 17.9 18.6
Payments to suppliers and employees (7,462.0) (7,123.4)
Interest received 11.4 6.8
Interest and other costs of finance paid (34.4) (33.3)
Income tax paid (49.0) (35.9)
Net cash inflow from operating activities C1(a) 441.6 447.8
Cash flows from investing activitiesNet proceeds from sale of property, plant and equipment 23.2 20.4
Payments for property, plant and equipment (203.6) (185.7)
Payments for intangible assets (37.9) (45.4)
Payments for acquisition of Spotless F2 (636.1) –
Payments for businesses acquired F2 (143.2) (1.1)
Receipts from investments 0.6 0.6
Advances from / (to) joint ventures 1.2 (1.5)
Proceeds from sale of businesses – 7.2
Net cash used in investing activities (995.8) (205.5)
Cash flows from financing activitiesNet proceeds from capital raising E4 989.9 –
Group on-market share buy-back E4 – (26.5)
Proceeds from borrowings 321.2 173.8
Repayments of borrowings (370.0) (80.0)
Dividends paid (110.6) (113.1)
Net cash inflow from / (used in) financing activities 830.5 (45.8)
Net increase in cash and cash equivalents 276.3 196.5
Cash and cash equivalents at the beginning of the year 569.4 372.2
Effect of exchange rate changes (1.1) 0.7
Cash and cash equivalents at the end of the year 844.6 569.4
The consolidated statement of cash flows should be read in conjunction with the accompanying notes on pages 57 to 107.
Consolidated Statement of Cash Flowsfor the year ended 30 June 2017
For
per
sona
l use
onl
y

Annual Report 2017 57
Notes to the consolidated financial statementsfor the year ended 30 June 2017
AAbout this report
Statement of compliance
These financial statements represent the consolidated results of Downer EDI Limited (ABN 97 003 872 848). The consolidated Financial Report (Financial Report) is a general purpose financial statement which has been prepared in accordance with Australian Accounting Standards (AASBs) adopted by the Australian Accounting Standards Board (AASB) and the Corporations Act 2001 (Cth). The Financial Report complies with International Financial Reporting Standards (IFRS) adopted by the International Accounting Standards Board (IASB).
The Financial Report was authorised for issue by the Board of Directors on 29 August 2017.
Rounding of amounts
Downer is a company of the kind referred to in ASIC Corporations (Rounding in Financial/Directors’ reports) Instrument 2016/191, relating to the “rounding off” of amounts in the Directors’ Report and consolidated financial statements. Unless otherwise expressly stated, amounts have been rounded off to the nearest whole number of millions of dollars and one place of decimals representing hundreds of thousands of dollars in accordance with that Instrument. Amounts shown as $- represent amounts less than $50,000 which have been rounded down.
Basis of preparation
The Financial Report has been prepared on a historical cost basis, except for the revaluation of certain financial instruments. Cost is based on the fair values of the consideration given in exchange for assets. All amounts are presented in Australian dollars, unless otherwise noted.
The accounting policies and methods of computation in the preparation of the Financial Report are consistent with those adopted and disclosed in Downer’s Annual Report for the financial year ended 30 June 2016, except in relation to the relevant amendments and their effects on the current period or prior periods as described in Note G1.
From 27 June 2017 the Group’s ownership interest in Spotless Group Holdings Limited (Spotless) exceeded 50%, resulting in the Group obtaining control. As a consequence of control being achieved in close proximity to the financial year end, the Directors have concluded that Spotless’ profit or loss and cash flow impact for the three days to 30 June 2017 is not material to the Downer Group, and therefore have commenced the consolidation of Spotless with effect from 30 June 2017. As a result, the consolidated profit or loss and consolidated cash flow of the Group for the year ended 30 June 2017 do not include any trading performance for Spotless.
For the purposes of the 30 June 2017 financial report, Downer holds a relevant interest of 65.7% (Refer to Note F2).
Accounting estimates and judgements
Preparation of the Financial Report requires management to make judgements, estimates and assumptions about future events. Information on material estimates and judgements considered when applying the accounting policies can be found in the following notes:
Accounting estimates and judgements Note Page
Revenue recognition B2 62
Recovery of deferred tax assets B4 66
Income taxes B4 66
Capitalisation of tender / bid costs C2 69
Useful lives and residual values C6 71
Impairment of assets C7 73
Provisions C8 75
Annual leave and long service leave D1 77
Accounting for acquisition of businesses F2 93
Significant accounting policiesAccounting policies are selected and applied in a manner that ensures that the resulting financial information satisfies the concepts of relevance and reliability, thereby ensuring that the substance of the underlying transactions or other events is reported. Other significant accounting policies are contained in the notes to the Financial Report to which they relate.
(i) Principles of consolidation
The Financial Report incorporates the financial statements of the Company and entities controlled by the Group and its subsidiaries. The Group controls an entity when it is exposed to, or has rights to, variable returns from its involvement with the entity and has the ability to affect those returns from its involvement with the entity and has the ability to affect those returns through its power over the entity.
The Financial Report includes the information and results of each subsidiary from the date on which the Company obtains control and until such time as the Company ceases to control such entity.
In preparing the Financial Report, all intercompany balances and transactions, and unrealised profits arising within the consolidated entity, are eliminated in full.
For
per
sona
l use
onl
y

58 Downer EDI Limited
Notes to the consolidated financial statements – continuedfor the year ended 30 June 2017
A. About this report – continued
(ii) Foreign currency
Transactions, assets and liabilities denominated in foreign currencies are translated into Australian dollars at reporting date using the following applicable exchange rates:
Foreign currency amount Applicable exchange rate
Transactions Date of transaction
Monetary assets and liabilities Reporting date
Non-monetary assets and liabilities carried at fair value
Date fair value is determined
Foreign exchange gains and losses resulting from translation are recognised in the statement of profit or loss, except for qualifying cash flow hedges which are deferred to equity.
On consolidation the assets, liabilities, income and expenses of foreign operations are translated into Australian dollars using the following applicable exchange rates:
Foreign currency amount Applicable exchange rate
Income and expenses Average exchange rate
Assets and liabilities Reporting date
Equity Historical date
Reserves Reporting date
Foreign exchange differences resulting from translation are initially recognised in the foreign currency translation reserve and subsequently transferred to the profit or loss on disposal of the foreign operation.
(iii) Finance and borrowing costs
Finance costs comprise interest expense on borrowings, cost to establish financing facilities (which are expensed over the term of the facility), losses on ineffective hedging instruments that are recognised in profit or loss and finance lease charges.
(iv) Available-for-sale financial assets
Available-for-sale financial assets are stated at fair value less impairment. Gains and losses arising from changes in fair value are recognised directly in the available-for-sale revaluation reserve, until the investment is disposed of or is determined to be impaired or control of an acquiree is obtained, at which time the cumulative gain or loss previously recognised in the available-for-sale revaluation reserve is included in the profit or loss for the year.F
or p
erso
nal u
se o
nly

Annual Report 2017 59
BBusiness performance
This section provides the information that is most relevant to understanding the financial performance of the Group during the financial year and, where relevant, the accounting policies applied and the critical judgements and estimates made.
B1. Segment information
B2. Profit from ordinary activities
B3. Earnings per share
B4. Taxation
B5. Remuneration of auditors
B6. Subsequent events
B1. Segment information
Identification of reportable segments
An operating segment is a component of an entity that engages in business activities from which it may earn revenue and incur expenses, whose operating results are regularly reviewed by the Group’s chief operating decision maker in order to effectively allocate Group resources and assess performance.
The Group has identified its operating segments based on the internal reports that are reviewed and used by the Group CEO in assessing performance and in determining the allocation of resources. The operating segments are identified by the Group based on the nature of the services provided. Discrete financial information about each of these operating businesses is reported to the Group CEO on a recurring basis.
The reportable segments are based on a combination of operating segments determined by the similarity of the services provided, and the sources of the Group’s major risks that could therefore have the greatest effect on the rates of return. Downer has determined that reportable segments are best represented as service lines.
During the period, and as a consequence of realigning business portfolios due to the Spotless transaction, the Group CEO is now assessing the performance of the Technology and Communications and Utilities Services operating segments together and therefore, the Group has combined these reportable segments into a single segment: Utilities.
The reportable segments identified within the Group are outlined below:
Service line Segment description
Transport Comprises the Group’s road, rail infrastructure, bridge, airport and port businesses and provides a broad range of transport infrastructure services including: earthworks; civil construction; asset management; maintenance; surfacing and stabilisation; supply of bituminous products and logistics; open space and facilities management; and rail track signalling and electrification works.
Utilities Comprises the Group’s power, gas, water, renewable energy and telecommunications businesses. This includes: planning, designing, constructing, operating, maintaining, managing and decommissioning power and gas network assets; providing complete water lifecycle solutions for municipal and industrial water users including pipeline bursting and civil maintenance; and design, build and maintenance services for wind farms, wind turbine sites and solar farms; as well as feasibility, design, civil construction, network construction, commissioning, testing, operations and maintenance across fibre, copper and radio networks as well as data centre services, automated ticketing and intelligent transport technology solutions.
Rail Provides total rail asset solutions including passenger and freight build, operations and maintenance, component overhauls and after-market services.
Engineering, Construction and Maintenance (EC&M)
Provides design, engineering, construction and maintenance services for greenfield and brownfield projects across a range of sectors and all stages of the project lifecycle including: feasibility studies; engineering design; civil works; structural, mechanical and piping; electrical and instrumentation; mineral process equipment design and manufacture; commissioning; operations maintenance; shutdowns, turnarounds and outages; strategic asset management; and decommissioning.
Mining Provides services across all stages of the mining lifecycle including: asset management; blasting services, explosive supply; civil projects; crushing; exploration drilling; mine closure and mine site rehabilitation; mobile plant maintenance; open cut mining; training and development for ATSI employees; tyre management; and underground mining.
Spotless Spotless operates in Australia and New Zealand and provides outsourced facility services, catering and laundry services, technical and engineering services, maintenance and asset management services and refrigeration solutions to various industries. The customers include corporations and government departments, agencies and authorities at the Federal, State and Municipal level.
For
per
sona
l use
onl
y

60 Downer EDI Limited
Notes to the consolidated financial statements – continuedfor the year ended 30 June 2017
B1. Segment information – continued2017$’m Transport Utilities Spotless Rail EC&M Mining
Un-allocated Total
Revenue 2,091.1 1,517.3 – 467.1 1,974.2 1,250.8 19.8 7,320.3 Inter-segment sales – – – – – – (32.9) (32.9)
Total segment revenue 2,091.1 1,517.3 – 467.1 1,974.2 1,250.8 (13.1) 7,287.4
Share of sales revenue from joint ventures and associates (i) 62.3 – – 383.1 30.1 49.4 – 524.9 Total revenue including joint ventures and other income (i) 2,153.4 1,517.3 – 850.2 2,004.3 1,300.2 (13.1) 7,812.3
Share of net profit of joint ventures and associates 8.5 – – 11.7 (0.6) 2.9 – 22.5
Depreciation and amortisation 40.6 21.6 – 10.9 15.3 116.4 15.4 220.2 Total reported segment results (EBIT) 124.6 84.1 – 30.3 52.3 83.4 (96.9) 277.8
Net finance costs (26.8)Total profit before tax 251.0
Acquisition of segment assets 114.9 56.5 1,998.4 51.9 95.5 102.2 37.0 2,456.4
Segment assets 1,080.3 748.0 2,621.4 572.1 719.1 836.3 878.2 7,455.4
Segment liabilities 391.5 405.8 1,406.5 141.3 413.4 264.5 845.9 3,868.9 Carrying value of equity accounted investees 10.0 – 1.8 64.5 5.3 6.4 – 88.0
2016$’m Transport Utilities Spotless Rail EC&M Mining
Un-allocated Total
Revenue 1,786.7 1,274.3 – 421.8 1,856.7 1,548.9 4.5 6,892.9
Inter-segment sales – – – – – – (42.9) (42.9)
Total segment revenue 1,786.7 1,274.3 – 421.8 1,856.7 1,548.9 (38.4) 6,850.0
Share of sales revenue from joint ventures and associates (i) 62.8 – – 404.4 30.4 46.3 – 543.9
Total revenue including joint ventures and other income (i) 1,849.5 1,274.3 – 826.2 1,887.1 1,595.2 (38.4) 7,393.9
Share of net profit of joint ventures and associates 6.8 – – 6.3 0.5 4.1 – 17.7
Depreciation and amortisation 39.7 19.3 – 10.8 18.2 153.6 17.1 258.7
Total reported segment results (EBIT) 103.7 71.4 – 14.4 48.2 130.0 (90.8) 276.9
Net finance costs (33.0)
Total profit before tax 243.9
Acquisition of segment assets 42.2 25.8 – 8.6 20.5 116.3 54.3 267.7
Segment assets 957.2 641.6 – 604.1 596.8 872.3 528.3 4,200.3
Segment liabilities 328.9 257.8 – 132.1 326.0 318.2 748.8 2,111.8
Carrying value of equity accounted investees 7.6 – – 58.7 5.9 9.4 – 81.6
(i) This is a non-statutory disclosure as it relates to Downer’s share of revenue from equity accounted joint ventures and associates.
For
per
sona
l use
onl
y

Annual Report 2017 61
B1. Segment information – continued
Reconciliation of segment net operating profit to net profit after tax:
Note
Segment results
2017$’m
2016$’m
Segment net operating profit 374.7 367.7
Unallocated:Spotless transaction costs (i) B2(b) (15.2) –
Fair value gain on available-for-sale asset (ii) B2(b) 19.1 –
Other income on available-for-sale asset (ii) B2(b) 0.7 –
Bid costs written off (iii) (iv) B2(b) (13.0) (13.0)
Settlement of contractual claims (5.0) –
Corporate costs (83.5) (77.8)
Total unallocated (96.9) (90.8)
Earnings before interest and tax 277.8 276.9
Net finance costs (26.8) (33.0)
Profit before income tax 251.0 243.9
Income tax expense B4(a) (69.5) (63.3)
Profit after income tax 181.5 180.6
(i) Relates to costs incurred as a result of the Spotless take over offer. Refer to Note F2.(ii) Relates to other income and revaluation of initial 19.99% investment in Spotless at $1.15 per share. (iii) Downer was a member of the Constellation Rail consortium. On 18 August 2016, the consortium was advised that it had not been successful in its bid to deliver and maintain
the New Intercity Fleet (NIF) for Transport for NSW. Accordingly, an amount of $10.0 million, referable to Downer’s share of pre-tax bid costs, has been expensed. Downer was also a member of the Creative Learning consortium. On 17 January 2017, the consortium was advised that it had not been successful in its bid to design,
construct and maintain the NZ Schools PPP project for the Ministry of Education. Accordingly, an amount of $3.0 million, referable to Downer’s share of pre-tax bid costs, has been expensed.
(iv) Downer was a member of the ACTivate consortium. On 1 February 2016, the consortium was advised that it had not been successful in its bid to build, operate and maintain Canberra’s new light rail project (“Capital Metro”). Accordingly, an amount of $13.0 million, referable to Downer’s share of pre-tax bid costs had been expensed in 2016.
Total revenue(i) Segment assetsAcquisition of
segment assets
2017$’m
2016$’m
2017$’m
2016$’m
2017$’m
2016$’m
By geographic location(ii)
Australia 5,704.8 5,502.7 6,709.0 3,607.3 2,351.9 238.2
New Zealand and Pacific 1,538.7 1,303.3 686.9 546.0 101.9 20.5
Asia – 1.3 7.5 6.7 – –
Africa 29.2 25.4 36.4 21.3 1.2 4.9
South America 12.6 14.3 13.4 16.5 1.4 4.1
Other 2.1 3.0 2.2 2.5 – –
Total 7,287.4 6,850.0 7,455.4 4,200.3 2,456.4 267.7
(i) Total revenue includes other income and inter-segment sales, recorded at amounts equal to competitive market prices charged to external customers for similar goods or services.
(ii) Revenue and assets are allocated based on geographical location of the legal entity.
For
per
sona
l use
onl
y

62 Downer EDI Limited
Notes to the consolidated financial statements – continuedfor the year ended 30 June 2017
B2. Profit from ordinary activities
a) Revenue and other income
2017$’m
2016$’m
Sales revenue Rendering of services 5,773.5 5,895.3
Construction contracts 1,250.9 713.8
Sale of goods 220.1 205.3
Other revenue 22.6 31.8
Total revenue from ordinary activities 7,267.1 6,846.2
Fair value gain on available-for-sale asset (i) 19.1 –
Other income on available-for-sale asset (i) 0.7 –
Other 0.5 3.8
Other income 20.3 3.8
Total revenue and other income 7,287.4 6,850.0
Share of sales revenue from joint ventures and associates (ii) 524.9 543.9
Total revenue including joint ventures and associates and other income (ii) 7,812.3 7,393.9
(i) Relates to other income and revaluation of initial 19.99% investment in Spotless at $1.15 per share. Refer to Note B2(b).
(ii) This is a non-statutory disclosure as it relates to Downer’s share of revenue from equity accounted joint ventures and associates.
Recognition and measurement
Revenue
Revenue is measured at the fair value of the consideration received or receivable. Revenue is recognised if it meets the criteria below.
(i) Rendering of services
The Group primarily generates service revenue from the following activities:
– Maintenance and management of transport infrastructure;
– Utilities infrastructure maintenance services (gas, power and water);
– Maintenance and installation of infrastructure in the telecommunications sector;
– Industrial plant maintenance;
– Contract mining services, mining assets maintenance services, tyre management and blasting;
– Rolling stock maintenance and rail asset management services;
– Engineering and consultancy services; and
– Facilities management.
These services are provided either under a fixed price service contract or a time and materials contract. Time and materials contract revenue is recognised at the contractual rates as labour hours are delivered and direct expenses are incurred.
Other short-term service contracts are recognised when the services are completed in accordance with the terms of the contract. Service contracts that have a long-term duration are recognised in proportion to the stage of completion at balance sheet date.
(ii) Construction contracts
Construction contracts are contracts specifically negotiated for the construction of an asset or combination of assets (including rail and infrastructure assets). Revenue is recognised in proportion to the stage of completion of the contract at balance sheet date.
(iii) Sale of goods
Revenue is recognised when the significant risks and rewards of ownership of the goods have passed to the buyer.
(iv) Other revenue
Other revenue primarily includes rental income and government grants relating to research and development incentives received by the Group. The Group elects to present the net amount in “Other revenue” as allowed under AASB120 Accounting for Government grants and disclosure of Government assistance.
Key estimate and judgement: Revenue recognitionDetermining the stage of completion requires an estimate of expenses incurred to date as a percentage of total estimated costs. Where variations and claims are made to the contract, assumptions are made regarding the probability that the customer will approve the variations and claims and the amount of revenue that will arise. Changes in these estimation methods could have a material impact on the financial statements of Downer.
For
per
sona
l use
onl
y

Annual Report 2017 63
B2. Profit from ordinary activities – continued
b) Individually significant items
The following material items forming part of the unallocated segment are relevant to an understanding of the Group’s financial performance:
Spotless transaction
2017 $’m
Earnings before interest and tax
Net finance income
Income tax expense
Profit after income tax
Spotless transaction costs (i) (15.2) – – (15.2)Fair value gain on available-for-sale asset (ii) 19.1 – (5.5) 13.6 Other income on available-for-sale asset (ii) 0.7 – (0.2) 0.5 Net finance income on Spotless takeover bid and capital raising (iii) – 1.7 (0.5) 1.2
4.6 1.7 (6.2) 0.1
(i) Transaction costs incurred in relation to the takeover of Spotless (refer to Note F2). The expenses are classified as “Other expenses from ordinary activities” on the statement of profit or loss for the year ended 30 June 2017.
(ii) Referable to the other income and revaluation of the initial 19.99% interest equivalent in Spotless (economic interest of 4.99% pursuant to a cash settled total return equity swap and 15.0% shareholding acquired immediately prior to the takeover bid) based on the offer share price of $1.15. The fair value gain is transferred from the available-for-sale reserve to profit or loss on obtaining control and is classified as “Other income” on the statement of profit or loss for the year ended 30 June 2017.
(iii) Net interest income from the capital raising proceeds received in relation to the Spotless acquisition. The net interest income is classified as part of “Net finance costs” on the statement of profit or loss for the year ended 30 June 2017.
Bid costs written off2017 $’m
2016 $’m
New Intercity Fleet rail project (iv) (10.0) –
NZ Schools PPP project (v) (3.0) –
Canberra light rail project (vi) – (13.0)
(13.0) (13.0)
(iv) Downer was a member of the Constellation Rail consortium. On 18 August 2016, the consortium was advised that it had not been successful in its bid to deliver and maintain the New Intercity Fleet (NIF) for Transport for NSW. Accordingly, an amount of $10.0 million, referable to Downer’s share of pre-tax bid costs, has been expensed and classified as “Other expenses from ordinary activities” on the statement of profit or loss for the year ended 30 June 2017.
(v) Downer was a member of the Creative Learning consortium. On 17 January 2017, the consortium was advised that it had not been successful in its bid to design, construct and maintain the NZ Schools PPP project for the Ministry of Education. Accordingly, an amount of $3.0 million, referable to Downer’s share of pre-tax bid costs, has been expensed and classified as “Other expenses from ordinary activities” on the statement of profit or loss for the year ended 30 June 2017.
(vi) Downer was a member of the ACTivate consortium. On 1 February 2016, the consortium was advised that it had not been successful in its bid to build, operate and maintain Canberra’s new light rail project (“Capital Metro”). Accordingly, an amount of $13.0 million, referable to Downer’s share of pre-tax bid costs, has been expensed and classified as “Other expenses from ordinary activities” on the statement of profit or loss for the year ended 30 June 2016.
For
per
sona
l use
onl
y

64 Downer EDI Limited
Notes to the consolidated financial statements – continuedfor the year ended 30 June 2017
B3. Earnings per shareBasic earnings per shareThe calculation of basic earnings per share (EPS) is based on the profit attributable to ordinary shareholders and the weighted-average number of ordinary shares outstanding.
2017Restated (i)
2016
Profit attributable to members of the parent entity ($’m) 181.5 180.6 Adjustment to reflect ROADS dividends paid ($’m) (8.6) (9.6)
Profit attributable to members of the parent entity used in calculating EPS ($’m) 172.9 171.0
Weighted average number of ordinary shares (WANOS) on issue (m’s) 483.6 450.4
Basic earnings per share (cents per share) 35.8 38.0
Diluted earnings per shareThe calculation of diluted EPS is based on the profit attributable to ordinary shareholders and the weighted-average number of ordinary shares outstanding after adjustments for the effects of all dilutive potential ordinary shares.
2017Restated (i)
2016
Profit attributable to members of the parent entity ($’m) 181.5 180.6
Weighted average number of ordinary shares
– Weighted average number of ordinary shares (WANOS) on issue (m’s)(ii) 483.6 450.4
– WANOS adjustment to reflect potential dilution for ROADS (m’s) (iii) 35.3 53.3
WANOS used in the calculation of diluted EPS (m’s) 518.9 503.7
Diluted earnings per share (cents per share) 35.0 35.9
(i) Basic and diluted EPS calculation for FY16 were restated as a result of 169.9 million shares issued from the capital raising made as part of the Spotless takeover offer announced on 21 March 2017. Under the entitlement offer, two new shares for each five outstanding shares were issued at a discounted price of $5.95 per share. As a result of the new shares issued, the weighted average number of ordinary shares (WANOS) to calculate EPS needs to be adjusted by a theoretical ex-rights price (TERP) factor. The adjustment factor of 0.943 was utilised to restate WANOS for the basic and diluted EPS calculations.
(ii) For diluted EPS, the WANOS has been further adjusted by the potential vesting of executive incentive shares.
(iii) The WANOS adjustment is the value of ROADS that could potentially be converted into ordinary shares at the reporting date. It is calculated based on the issued value of ROADS in New Zealand dollars converted to Australian dollars at the spot rate prevailing at the reporting date, which was $190.5 million (2016: $190.7 million), divided by the average market price of the Company’s ordinary shares for the period 1 July 2016 to 30 June 2017 discounted by 2.5% according to the ROADS contract terms, which was $5.40 (2016: $3.58).
B4. Taxation
a) Reconciliation of income tax expense
The prima facie income tax expense on profit before income tax reconciles to the income tax expense in the financial statements as follows:
2017$’m
2016$’m
Profit before income tax 251.0 243.9 Tax using the Company’s statutory tax rate 75.3 73.2 Effect of tax rates in foreign jurisdictions (1.3) (1.2)Non-deductible expenses 6.2 0.8 Profits and franked distributions from joint ventures and associates (5.1) (5.6)Non-taxable government grant (2.6) (3.0)Other items (0.8) (0.7)(Over) / under provision of income tax in previous year (2.2) (0.2)Total income tax expense 69.5 63.3 Current tax expense 68.7 24.9 Deferred tax expense 0.8 38.4
The tax rate used in the above reconciliation is the corporate tax rate of 30% payable by Australian corporate entities on taxable profits under Australian tax law. There has been no change in the corporate tax rate when compared with the previous year.
For
per
sona
l use
onl
y

Annual Report 2017 65
B4. Taxation – continued
b) Movement in deferred tax balances
2017$’m
Net balance
at 1 July
Charged to income
statement
Charged to compre-
hensive income and
equity
Net foreign
currency exchange
differences
Acquisition and
disposal
Net balance
at 30 June
Deferred tax
assets
Deferred tax
liabilities
Trade and other receivables (121.0) 3.6 – – 1.1 (116.3) – (116.3)Inventories (3.7) (6.2) – – 0.1 (9.8) – (9.8)Joint ventures and associates (1.3) 0.2 – – – (1.1) – (1.1)Property, plant and equipment (21.7) (7.2) – – 12.9 (16.0) – (16.0)Intangible assets (18.2) 1.8 – – (24.6) (41.0) – (41.0)Income tax losses – – – – 25.1 25.1 25.1 – Trade and other payables 8.4 11.5 – – 0.9 20.8 20.8 – Provisions 99.6 1.0 – – 56.6 157.2 157.2 – Other 0.2 (5.5) 6.0 – (16.4) (15.7) – (15.7)Tax assets / (liabilities) before set-off (57.7) (0.8) 6.0 – 55.7 3.2 203.1 (199.9)Set-off of DTA against DTL – (143.7) 143.7Net tax assets /(liabilities) 3.2 59.4 (56.2)
2016$’m
Net balance
at 1 July
Charged to income
statement
Charged to compre-
hensive income and
equity
Net foreign
currency exchange
differences
Acquisition and
disposal
Net balance
at 30 June
Deferred tax
assets
Deferred tax
liabilities
Trade and other receivables (85.3) (34.3) – (1.4) – (121.0) – (121.0)
Inventories (3.0) (0.7) – – – (3.7) – (3.7)
Joint ventures and associates (2.8) 1.5 – – – (1.3) – (1.3)
Property, plant and equipment (12.0) (9.6) – (0.1) – (21.7) – (21.7)
Intangible assets (20.4) 2.2 – – – (18.2) – (18.2)
Trade and other payables 25.5 (17.2) – (0.1) 0.2 8.4 8.4 –
Provisions 87.9 17.4 – 0.5 (6.2) 99.6 99.6 –
Other (3.1) 2.3 1.2 (0.2) – 0.2 0.2 –
Tax assets / (liabilities) before set-off (13.2) (38.4) 1.2 (1.3) (6.0) (57.7) 108.2 (165.9)
Set-off of DTA against DTL – (108.2) 108.2
Net tax assets /(liabilities) (57.7) – (57.7)
For
per
sona
l use
onl
y

66 Downer EDI Limited
Notes to the consolidated financial statements – continuedfor the year ended 30 June 2017
B4. Taxation – continued
Recognition and measurement
Current tax
Current tax assets and liabilities are measured at the amount of income taxes payable or recoverable in respect of the taxable profit or tax loss for the period. It is calculated using tax rates and tax laws that have been enacted or substantively enacted by the reporting date.
Deferred tax
Deferred tax is accounted for in respect of temporary differences arising from differences between the carrying amount of assets and liabilities and the corresponding tax base.
Deferred tax liabilities are recognised for all taxable temporary differences. Deferred tax assets are recognised for all deductible temporary differences, unused tax losses and tax offsets, to the extent that it is probable that sufficient future taxable profits will be available to utilise them.
However, deferred tax assets and liabilities are not recognised for:
– taxable temporary differences that arise from the initial recognition of assets or liabilities in a transaction that is not a business combination which affects neither taxable income nor accounting profit;
– taxable temporary differences relating to investments in subsidiaries, associates and joint ventures to the extent that the Group is able to control the timing of the reversal of the temporary differences and it is probable that they will not reverse in the foreseeable future; and
– taxable temporary differences arising from goodwill.
Deferred tax assets and liabilities are measured at the tax rates and tax laws that are expected to apply in the year when the asset is utilised or the liability is settled, based on tax rates and tax laws that have been enacted or substantively enacted at the reporting date.
Income taxes relating to items recognised directly in equity are recognised directly in equity and not in the income statement.
Offsetting deferred tax balances
Deferred tax assets and liabilities are offset when they relate to income taxes levied by the same taxation authority, for entities treated as a group for tax purposes, and the Company/Group intends to settle its current tax assets and liabilities on a net basis.
Tax consolidation
Downer EDI Limited and its wholly owned Australian controlled entities are part of a tax consolidated group under Australian taxation law. Downer EDI Limited is the head entity in the tax consolidated group. Entities within the tax consolidated group have entered into a tax funding agreement and a tax sharing agreement with the head entity. Under the terms of the tax funding agreement, Downer EDI Limited and each of the entities in the tax consolidated group have agreed to pay (or receive) a tax equivalent payment to (or from) the head entity, based on the current tax liability or current tax asset of the entity.
Key estimate and judgement: Recovery of deferred tax assetsDeferred tax assets are recognised for tax losses and deductible temporary differences to the extent it is probable that sufficient future taxable profits will be available to utilise them. Judgement is required to determine the amount of deferred tax assets that can be recognised, based upon the likely timing and the level of future taxable profits.
Key estimate and judgement: Income taxesThe Group is subject to income taxes in Australia and jurisdictions where it has foreign operations. Judgement is required in determining the worldwide provision for income taxes and in assessing whether deferred tax balances are recognised on the statement of financial position. Changes in circumstances will alter expectations, which may impact the amount of provision for income taxes and deferred tax balances recognised.
For
per
sona
l use
onl
y
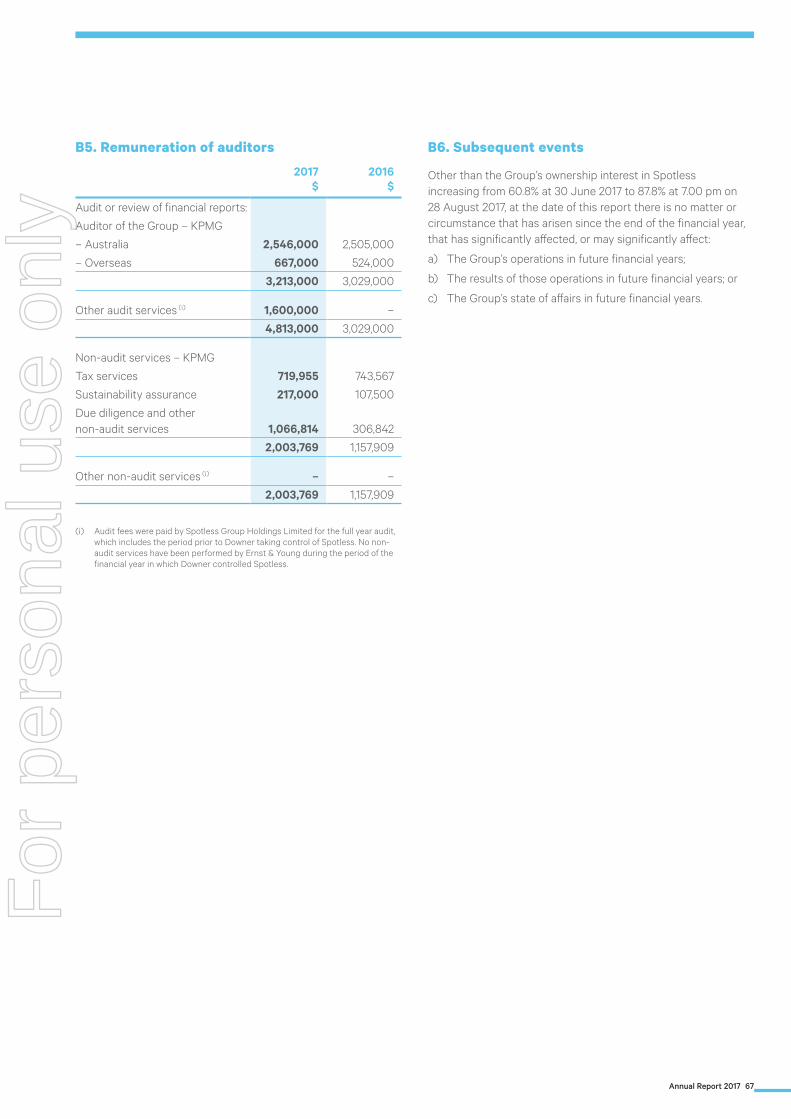
Annual Report 2017 67
B5. Remuneration of auditors
2017$
2016$
Audit or review of financial reports:
Auditor of the Group – KPMG
– Australia 2,546,000 2,505,000
– Overseas 667,000 524,000
3,213,000 3,029,000
Other audit services (i) 1,600,000 –
4,813,000 3,029,000
Non-audit services – KPMG
Tax services 719,955 743,567
Sustainability assurance 217,000 107,500
Due diligence and other non-audit services 1,066,814 306,842
2,003,769 1,157,909
Other non-audit services (i) – –
2,003,769 1,157,909
(i) Audit fees were paid by Spotless Group Holdings Limited for the full year audit, which includes the period prior to Downer taking control of Spotless. No non-audit services have been performed by Ernst & Young during the period of the financial year in which Downer controlled Spotless.
B6. Subsequent events
Other than the Group’s ownership interest in Spotless increasing from 60.8% at 30 June 2017 to 87.8% at 7.00 pm on 28 August 2017, at the date of this report there is no matter or circumstance that has arisen since the end of the financial year, that has significantly affected, or may significantly affect:
a) The Group’s operations in future financial years;
b) The results of those operations in future financial years; or
c) The Group’s state of affairs in future financial years.
For
per
sona
l use
onl
y

68 Downer EDI Limited
Notes to the consolidated financial statements – continuedfor the year ended 30 June 2017
COperating assets and liabilities
This section provides information relating to the operating assets and liabilities of the Group. Downer has a strong focus on maintaining a strong balance sheet through continued focus on cash conversion. The Group’s strategy also considers expenditure, growth and acquisition requirements.
C1. Reconciliation of cash and cash equivalents
C2. Trade and other receivables
C3. Rendering of services and construction contracts
C4. Inventories
C5. Trade and other payables
C6. Property, plant and equipment
C7. Intangible assets
C8. Provisions
C9. Contingent liabilities
C1. Reconciliation of cash and cash equivalents
a) Reconciliation of cash flow from operating activities
Note2017$’m
2016$’m
Profit after tax for the year 181.5 180.6 Adjustments for:
Share of joint ventures and associates’ profits net of distributions (4.6) 0.9 Depreciation and amortisation of non-current assets C6,C7 220.2 258.7 Amortisation of deferred costs 3.0 2.6 Net loss / (gain) on sale of property, plant and equipment 1.2 (3.0)Loss on disposal of businesses – 2.3 Research and development incentives (8.5) (10.0)Foreign exchange gain (0.5) (0.3)Movement in current tax balances 19.7 (11.0)Movement in deferred tax balances 0.8 38.4 Share-based employee benefits expense D1 5.6 4.9 Fair value gain on available-for-sale asset B1 (19.1) –Bid costs written off B1 13.0 13.0
Other 2.7 1.2
233.5 297.7Changes in net assets and liabilities, net of effects from acquisition and disposal of businesses:(Increase) / decrease in assets:
Current trade and other receivables (159.8) (23.4)Current inventories 38.7 18.5 Other current assets 0.2 4.2 Non-current trade and other receivables (5.1) (1.1)Other non-current assets (0.4) 1.2
Increase / (decrease) in liabilities:Current trade and other payables 160.7 (71.9)Current financial liabilities 3.3 –Current provisions (4.8) 25.2 Non-current trade and other payables (10.2) 2.0 Non-current financial liabilities 16.9 –Non-current provisions (12.9) 14.8
26.6 (30.5)Net cash generated by operating activities 441.6 447.8
For
per
sona
l use
onl
y

Annual Report 2017 69
b) Cash and cash equivalents
For the purpose of the statement of cash flows, cash and cash equivalents comprises:
2017$’m
2016$’m
Cash (i) 784.5 430.0
Short-term deposits 60.1 139.4
844.6 569.4
(i) In accordance with the Business Sale Agreement, the completion payment for the assets of Cabrini Health Limited ($20.0 million) was held on trust for Spotless (restricted cash) and released to Cabrini Health Limited on 1 July 2017.
C2. Trade and other receivables
Note2017$’m
2016$’m
CurrentTrade receivables 760.8 441.4
Allowance for doubtful debts (7.1) (3.7)
753.7 437.7 Amounts due from customers under contracts and rendering of services C3 908.3 635.9
Other receivables 63.7 50.7
1,725.7 1,124.3
Ageing profile of trade receivablesNeither past due nor impaired 678.8 360.3
Past due but not impaired 74.9 77.4
Impaired 7.1 3.7
760.8 441.4
Recognition and measurementTrade receivables
Trade receivables and other receivables are initially recognised at fair value and subsequently at amortised cost using the effective interest rate method, less an allowance for impairment.
Fair value
Due to the short-term nature of these financial rights, their carrying amounts are estimated to represent their fair values.
Impairment of trade receivables
The Group has considered the collectability and recoverability of trade receivables. An allowance for doubtful debts has been made for the estimated irrecoverable trade receivable amounts arising from services provided, determined by reference to past default experience.
Capitalisation of tender / bid costs
When it is probable that a contract will be awarded, the expenditure incurred in relation to tender/bid costs is capitalised to amounts due from customers under contracts. Capitalised costs are expensed in accordance with contract accounting principles once the contract is awarded. Where a tender/bid is subsequently unsuccessful, the previously capitalised costs are immediately expensed. Tender/bid costs that have been expensed cannot be recapitalised in the subsequent financial year.
Key estimate and judgement: Capitalisation of tender / bid costsJudgement is exercised in determining whether it is probable that the contract will be awarded. An error in judgement may result in capitalised tender/bid costs being recognised as an expense in the following financial year.
For
per
sona
l use
onl
y

70 Downer EDI Limited
Notes to the consolidated financial statements – continuedfor the year ended 30 June 2017
C3. Rendering of services and construction contracts
Note2017$’m
2016$’m
Cumulative contracts in progress as at reporting date:
Cumulative costs incurred plus recognised profits less recognised losses to date 7,361.4 7,121.0
Less: progress billings (6,741.3) (6,648.4)
Net amount 620.1 472.6
Recognised and included in the financial statements as amounts due:
From customers under contracts C2 908.3 635.9
To customers under contracts C5 (288.2) (163.3)
Net amount 620.1 472.6
Recognition and measurement
Services and construction contracts are reported in trade receivables and trade payables, as gross amounts due from / to customers.
If cumulative work done to date (contract costs plus contract net profit) of contracts in progress exceeds the progress payments received, the difference is recognised as an asset and included in amounts due from customers for contract work. If the net amount after deduction of progress payments received is negative, the difference is recognised as a liability and included in amounts due to customers for contract work.
C4. Inventories
2017$’m
2016$’m
CurrentRaw materials 187.8 208.0
Work in progress 0.1 0.5
Finished goods 66.5 88.7
Components and spare parts 47.3 30.0
301.7 327.2
Recognition and measurement
Inventories are valued at the lower of cost and net realisable value. Net realisable value represents the estimated selling price less all estimated costs of completion and costs to be incurred in marketing, selling and distribution.
C5. Trade and other payables
Note2017$’m
2016$’m
CurrentTrade payables 527.6 358.9
Amounts due to customers under contracts and rendering of services C3 288.2 163.3
Amounts owing in relation to Spotless shares acceptance F2 110.8 –
Accruals 732.8 414.8
Other 101.6 73.9
1,761.0 1,010.9
Recognition and measurement
Trade and other payables
Trade payables and other accounts payable are recognised when the Group becomes obliged to make future payments resulting from the purchase of goods and services.
Fair value
Due to the short-term nature of these financial obligations, their carrying amounts are estimated to represent their fair values.
For
per
sona
l use
onl
y

Annual Report 2017 71
C6. Property, plant and equipment
2017 $’m
Freehold land and
buildings
Plant, equipment
and leasehold improve-
ments
Equipment under
financelease
Laundries rental stock Total
Carrying amount as at 1 July 2016 68.5 859.9 59.9 – 988.3 Additions 7.4 212.7 2.2 – 222.3 Disposals at net book value (0.1) (17.6) (0.2) – (17.9)Acquisition of businesses (i) 57.4 212.5 – 37.5 307.4Depreciation expense (4.7) (182.3) (6.2) – (193.2)Reclassifications at net book value 1.0 18.7 (19.7) – – Reclassified as intangible assets (ii) – (7.2) – – (7.2)Net foreign currency exchange differences at net book value (0.1) (3.2) (1.2) – (4.5)Closing net book value as at 30 June 2017 129.4 1,093.5 34.8 37.5 1,295.2Cost 160.9 2,387.7 75.2 37.5 2,661.3Accumulated depreciation (31.5) (1,294.2) (40.4) – (1,366.1)
2016
Carrying amount as at 1 July 2015 59.1 895.1 82.9 – 1,037.1 Additions 13.6 168.8 14.0 – 196.4 Disposals at net book value – (16.8) (0.5) – (17.3)Acquisition of businesses – 1.7 – – 1.7 Disposals of business at net book value – (0.6) – – (0.6)Depreciation expense (4.7) (217.7) (12.1) – (234.5)Reclassifications at net book value – 24.4 (24.4) – –Reclassified as intangible assets (ii) – (1.2) – – (1.2)Net foreign currency exchange differences at net book value 0.5 6.2 – – 6.7 Closing net book value as at 30 June 2016 68.5 859.9 59.9 – 988.3 Cost 95.5 2,143.3 109.8 – 2,348.6 Accumulated depreciation (27.0) (1,283.4) (49.9) – (1,360.3)
(i) The values recognised are based on the fair value of assets acquired from the business acquisitions made during the year ended 30 June 2017, for which the accounting on certain transactions remains provisional. Refer to Note F2.
(ii) Refers to the reclassification of software from Capital Work in Progress to Intangible Assets.
Recognition and measurement
The value of property, plant and equipment is measured as the cost of the asset less accumulated depreciation and impairment.
The expected useful life and depreciation methods used are listed below:
Item Useful life Depreciation method
Freehold land n/a No depreciationBuildings 20-50 years Straight-line Leasehold improvements Life of lease Straight-line Plant and equipment – mining, power and gas Working hours Based on hours of usePlant and equipment – other 3-25 years Straight-line Equipment under finance lease 5-15 years Straight-line – lease termLaundries rental stock 18 months-5 years Straight-line
Key estimate and judgement: Useful lives and residual valuesThe estimation of the useful lives and residual values of assets has been based on historical experience as well as manufacturers’ warranties (for plant and equipment), lease terms (for leased equipment and leasehold improvements) and turnover policies. In addition, the condition of the assets is assessed at least once per year and considered against the remaining useful life. Adjustments to useful lives and residual values are made when considered necessary.
For
per
sona
l use
onl
y

72 Downer EDI Limited
Notes to the consolidated financial statements – continuedfor the year ended 30 June 2017
C7. Intangible assets
2017 $’m Goodwill
Customer contracts
and relationships
Brand names on
acquisition
Intellectual property on acquisition
Intellectual property, software
and system development Total
Carrying amount as at 1 July 2016 805.3 37.1 – – 127.5 969.9 Additions – – – – 38.5 38.5 Acquisition of businesses (i) 1,799.2 8.8 4.7 7.8 67.7 1,888.2 Disposal at net book value – – – – (0.7) (0.7)Reclassifications at net book value (ii) – – – – 7.2 7.2 Amortisation expense – (7.2) (0.2) – (19.6) (27.0)Net foreign currency exchange differences at net book value 2.8 – – – – 2.8 Closing net book value as at 30 June 2017 2,607.3 38.7 4.5 7.8 220.6 2,878.9 Cost 2,683.3 58.9 4.7 7.8 359.2 3,113.9 Accumulated amortisation and impairment (76.0) (20.2) (0.2) – (138.6) (235.0)
2016Carrying amount as at 1 July 2015 781.7 43.5 – – 93.8 919.0
Additions – – – – 49.1 49.1
Acquisition of businesses 20.5 – – – – 20.5
Reclassifications at net book value (ii) – – – – 1.2 1.2
Amortisation expense – (6.4) – – (17.8) (24.2)
Net foreign currency exchange differences at net book value 3.1 – – – 1.2 4.3
Closing net book value as at 30 June 2016 805.3 37.1 – – 127.5 969.9
Cost 881.3 50.1 – – 255.3 1,186.7
Accumulated amortisation and impairment (76.0) (13.0) – – (127.8) (216.8)
(i) The values recognised are based on the fair value of assets acquired from the business acquisitions made during the year ended 30 June 2017, for which the accounting on certain transactions remains provisional. Refer to Note F2.
(ii) Refers to the reclassification of software from Capital Work In Progress to Intangible Assets.
Recognition and measurement
Goodwill
Goodwill acquired in a business combination is measured at cost and subsequently measured at cost less any impairment losses. The cost represents the excess of the cost of a business combination over the fair value of the identifiable assets, liabilities and contingent liabilities acquired.
Customer contracts and relationships on acquisition
Customer contracts and relationships acquired as part of a business combination are recognised separately from goodwill and are carried at fair value at date of acquisition less accumulated amortisation and any accumulated impairment losses.
Brand names on acquisition
Brand names acquired as part of a business combination are recognised separately from goodwill and are carried at fair value at date of acquisition less accumulated amortisation and any accumulated impairment losses.
Intellectual property on acquisition
Intellectual property acquired as part of a business combination is recognised separately from goodwill and is carried at fair value at date of acquisition less accumulated amortisation and any accumulated impairment losses.
Intellectual property, software and system development
Intangible assets acquired by the Group, including intellectual property (purchased patents, trademarks and licences) and software are initially recognised at cost, and subsequently measured at cost less accumulated amortisation and any impairment losses. Internally developed systems are capitalised once the project is assessed to be feasible. The costs capitalised include consulting, licensing and direct labour costs. Costs incurred in determining project feasibility are expensed as incurred.
For
per
sona
l use
onl
y

Annual Report 2017 73
C7. Intangible assets – continued
Amortisation
Intangible assets with finite useful lives are amortised on a straight-line basis over their useful lives. The estimated useful lives are generally:
Item Useful Life
Software and system development 5-15 years
Brand names 20 years
Customer contracts and relationships 5-20 years
Intellectual property acquired 15-20 years
Other intangible assets (other than indefinite useful life intangible assets)
20 years
The estimated useful life and amortisation method are reviewed at the end of each annual reporting period.
Impairment of assets
Goodwill and intangible assets that have an indefinite useful life are tested annually for impairment, or more frequently if events or changes in circumstances indicate that they might be impaired. Other assets are reviewed for impairment whenever events or changes in circumstances indicate that the carrying amount may not be recoverable.
An impairment loss is recognised for the amount by which the asset’s carrying amount exceeds its recoverable amount. For the purpose of assessing impairment, assets are grouped at the lowest levels for which there are separately identifiable cash inflows that are largely independent of the cash inflows from other assets or groups of assets (cash-generating units or CGUs). Non-financial assets other than goodwill that suffered impairment are reviewed for possible reversal of the impairment at each reporting date.
Allocation of goodwill to cash-generating units
Goodwill has been allocated, for impairment testing purposes, to CGUs (group of units) that are significant individually or in aggregate, taking into consideration the nature of service, resource allocation, how operations are monitored and where independent cash inflows are identifiable. Six independent CGUs (by service line) have been identified across the Group against which impairment testing has been undertaken. Goodwill has been allocated to these CGUs as follows:
Carrying value of consolidated goodwill
2017$’m
2016$’m
Transport (i) 251.0 215.7
Utilities (i) 319.9 289.3
Rail 69.5 69.5
EC&M (i) 239.2 154.4
Mining 76.4 76.4
Spotless (ii) 1,651.3 –
2,607.3 805.3
(i) Included in this amount is the goodwill for certain acquisitions made during the year ended 30 June 2017, for which the accounting remains provisional.
(ii) The determination of the fair value of individual assets and liabilities acquired from Spotless including goodwill, remains provisional due to the proximity of the acquisition date to the end of the financial year. The measurement period may extend to 12 months from date of acquisition as allowed by AASB 3 Business Combinations. Refer to Note F2.
Key estimate and judgement: Impairment of assets Determination of potential impairment requires an estimation of the recoverable amount of the CGUs to which the goodwill and intangible assets with indefinite useful lives are allocated. The Group uses the “value in use” method to determine the recoverable amount. Key assumptions requiring judgement include projected cash flows, growth rate estimates, discount rates, working capital and capital expenditure.
Recoverable amount testing – key assumptions
The recoverable amount of the Spotless CGU is assessed as the fair value of the assets acquired less costs to sell. Fair value has been determined by reference to the takeover offer. There has been no events subsequent to the takeover offer that would result in an impairment. For the remaining CGUs, the table below shows the key assumptions utilised in the “value in use” calculations.
Budgeted EBITDA(i)
Long-termgrowth rate
Discountrate
Transport 5.3% 2.5% 10.3%
Utilities 1.4% 2.5% 10.3%
Rail 17.1% 2.5% 10.6%
EC&M 9.4% 2.5% 10.3%
Mining 4.5% 2.5% 11.0%
(i) Budgeted EBITDA used for impairment testing is expressed as the compound annual growth rates from FY17 to terminal year based on the CGUs business plan.
For
per
sona
l use
onl
y

74 Downer EDI Limited
Notes to the consolidated financial statements – continuedfor the year ended 30 June 2017
C7. Intangible assets – continuedRecoverable amount testing – key assumptions – continued(i) Projected cash flows
The Group determines the recoverable amount based on a “value in use” calculation, using three year cash flow projections based on the FY18 budget for the year ending 30 June 2018 and the business plan for the subsequent financial years ending 30 June 2019 and 2020 (as discussed with the Board). For FY21 onwards, the Group assumes a long-term growth rate to allow for organic growth on the existing asset base.
Cash flow projections are determined utilising the budgeted Earnings Before Interest, Tax, Depreciation and Amortisation (EBITDA) less tax, capital maintenance spending and working capital changes, adjusted to exclude any uncommitted restructuring costs and future benefits to provide a “free cash flow” estimate. This calculated “free cash flow” is then discounted to its present value using a post-tax discount rate that reflects current market assessments of the time value of money and the risks specific to the asset for which the estimates of future cash flows have not been adjusted.
Budgeted EBITDA has been based on past experience and the Group’s assessment of economic and regulatory factors affecting the industry within which the Downer businesses operate:
– Transport is expected to benefit from an increase in activity in the transport infrastructure sector;
– Utilities is expected to benefit from an increase in activity across the electricity, water and renewables sectors partially offset by the potential reduction in revenue from its existing significant telecommunication contracts;
– Rail is expected to benefit from the two new major projects (High Capacity Metro Trains and Sydney Growth Trains). In addition, closer integration with strategic partners is expected to continue to contribute to revenue and EBITDA growth; and
– Mining and EC&M’s revenue and EBITDA include assumptions that take into account the cyclical nature of the resources industry and various growth opportunities.
(ii) Long-term growth rate
The future annual growth rates for FY21 onwards to perpetuity are based on the historical nominal GDP rates for the country of operation.
(iii) Discount rates
Post-tax discount rates of between 10.3% and 11.0% reflect the Group’s estimate of the time value of money and risks specific to each CGU. In determining the appropriate discount rate for each CGU, consideration has been given to the estimated weighted average cost of capital (WACC) for the Group adjusted for country and business risks specific to that CGU, including benchmarking against relevant peer group companies. The post-tax discount rate is applied to post-tax cash flows that include an allowance for tax based on the respective jurisdiction’s tax rate. This method is used to approximate the requirement of the accounting standards to apply a pre-tax discount rate to pre-tax cash flows.
(iv) Budgeted capital expenditure
The cash flows for capital expenditure are based on past experience and the amounts included in the terminal year calculation are for maintenance capital used for existing plant and replacement of plant as it is retired from service. The resulting expenditure has been compared against the annual depreciation charge to ensure that it is reasonable.
(v) Budgeted working capital
Working capital has been maintained at a level required to support the business activities of each CGU, taking into account changes in the business cycle. It has been assumed to be in line with historic trends given the level of utilisation and operating activity.
SensitivitiesOther than as disclosed below, the Group believes that for all other CGUs, any reasonably possible change in the key assumptions would not cause the carrying value of the CGUs to exceed their recoverable amounts.
The valuation of the Rail CGU assumes the execution of the two new major projects secured during FY17 (High Capacity Metro Trains and Sydney Growth Trains), increased efficiencies in its operations and improvement in the financial performance of its business. A number of scenarios, including the impact of macro-economic risks, have been analysed. Based on the modelling and analysis performed, the recoverable amount is expected to be greater than the carrying value and no reasonably possible change in key assumptions would cause the carrying value of the Rail CGU to exceed its recoverable amount.
For the Mining CGU, the recoverable amount currently exceeds its carrying value by $57.1 million. The valuation of the Mining CGU assumes contract extensions from existing customers and growth opportunities in open cut and underground mining. The timing of the cash flows arising from these opportunities may be affected by macro-economic risks, including volatile commodity prices, increased competition which may impact the contract margins and insourcing by key customers for mining services contracts. In the event that these risks ultimately eventuate (including the loss of currently tendered opportunities) and cannot be mitigated, the Mining CGU carrying value may exceed its recoverable amount.
For the Mining CGU, a reasonably possible unfavourable change in four-year compound annual EBITDA growth rate, long-term growth rate and discount rate assumptions in isolation and, in the absence of any mitigating factors or unchanged circumstances, would result in the carrying value of the Mining CGU exceeding its recoverable amount. Under this downside sensitivity scenario, the approximate change in the estimated recoverable amount for the Mining CGU is as follows:
Individual changes in key assumptions that would
result in nil headroom
Decrease in four-year compound annual EBITDA growth rate (2.1%)
Decrease in long-term growth rate (1.1%)
Increase in the post-tax discount rate 0.9%
For
per
sona
l use
onl
y

Annual Report 2017 75
C8. Provisions
2017$’m
Decommissioning and restoration
Warrantiesand
contract claims
Onerous contracts and other Total
At 1 July 2016 14.4 22.2 45.8 82.4 Additional provisions recognised 1.7 11.0 7.7 20.4 Unused provision reversed (2.4) (4.9) (1.4) (8.7)Utilisation of provision (0.7) (12.5) (21.8) (35.0)Acquisition of businesses 25.2 1.6 33.9 60.7 Net foreign currency exchange differences – – – – At 30 June 2017 38.2 17.4 64.2 119.8 Current 16.2 16.9 34.9 68.0 Non-current 22.0 0.5 29.3 51.8
Recognition and measurement
Provisions
Provisions are recognised when:
– the Group has a present obligation as a result of a past event;
– it is probable that resources will be expended to settle the obligation; and
– the amount of the provision can be measured reliably.
(i) Decommissioning and restoration
Provisions for decommissioning and restoration are made for close down, restoration and environmental rehabilitation costs, including the cost of dismantling and demolition of infrastructure, removal of residual materials and remediation of disturbed areas.
Future rectification costs are reviewed annually and any changes are reflected in the present value of the rectification provision at the end of the reporting period.
The provision is discounted using a pre-tax rate that reflects current market assessments of the time value of money and the risks specific to the liability.
(ii) Warranties and contract claims
Provisions for warranties and contract claims are made for the estimated liability on all products still under warranty at balance sheet date and known claims arising under service and construction contracts.
(iii) Onerous contracts and other
Provisions primarily include amounts recognised in relation to onerous customer and supply contracts and return conditions provisions for leased assets. The Group has leases that require the leased asset to be returned to the lessor in a certain condition.
The onerous contract provision is discounted using a pre-tax rate that reflects current market assessments of the time value of money and the risks specific to the liability.
Key estimate and judgement: Provisions(i) Decommissioning and restoration
Judgement is required in determining the expected expenditure required to settle rectification obligations at the reporting date, based on current legal requirements and technology.
(ii) Warranties and contract claims
The provision is estimated having regard to previous claims experience.
(iii) Onerous contracts and other
These provisions have been calculated based on management’s best estimate of discounted net cash outflows required to fulfil the contracts. The status of these contracts and the adequacy of provisions are assessed at each reporting date.
The return condition provision is estimated based on the costs associated with returning leased assets to the lessor in a certain condition.
For
per
sona
l use
onl
y

76 Downer EDI Limited
Notes to the consolidated financial statements – continuedfor the year ended 30 June 2017
C9. Contingent liabilities
Bonding Note2017$’m
2016$’m
The Group has bid bonds and performance bonds issued in respect of contract performance in the normal course of business for wholly-owned controlled entities E2 1,185.5 722.0
The Group is called upon to give guarantees and indemnities to counterparties, relating to the performance of contractual and financial obligations (including for controlled entities and related parties). Other than as noted above, these guarantees and indemnities are indeterminable in amount.
Other contingent liabilities
i) The Group is subject to design liability in relation to completed design and construction projects. The Directors are of the opinion that there is adequate insurance to cover this area and accordingly, no amounts are recognised in the financial statements.
ii) The Group is subject to product liability claims. Provision is made for the potential costs of carrying out rectification works based on known claims and previous claims history. However, as the ultimate outcome of these claims cannot be reliably determined at the date of this report, contingent liability may exist for any amounts that ultimately become payable in excess of current provisioning levels.
iii) Controlled entities have entered into various joint arrangements under which the controlled entity is jointly and severally liable for the obligations of the relevant joint arrangements.
iv) The Group carries the normal contractor’s and consultant’s liability in relation to services, supply and construction contracts (for example, liability relating to professional advice, design, completion, workmanship, and damage), as well as liability for personal injury/property damage during the course of a project. Potential liability may arise from claims, disputes and/or litigation/arbitration by or against Group companies and/or joint venture arrangements in which the Group has an interest. The Group is currently managing a number of claims, arbitration and litigation processes in relation to services, supply and construction contracts as well as in relation to personal injury and property damage claims arising from project delivery.
v) Several New Zealand entities in the Group have been named as co-defendants in four “leaky building” claims. The leaky building claims where Group entities are co-defendants generally relate to water damage arising from historical design and construction methodologies (and certification) for residential and other buildings in New Zealand during the early-mid 2000s. The Directors are of the opinion that disclosure of any further information relating to the leaky building claims would be prejudicial to the interests of the Group.
vi) Ground subsidence at the Waratah Train Maintenance Centre, located on Manchester Road, Auburn (AMC) has been identified. The design and construction of the AMC formed part of the Waratah Train Project, with Reliance Rail contracting Downer to design and build the AMC. In turn, Downer subcontracted this work to John Holland Pty Ltd. The design and construction of the areas in which subsidence has been observed formed part of the subcontractor’s design and construct obligations. Investigations into the causes of the subsidence continue, with an estimated remediation cost in the order of $70 million. The Directors are of the opinion that there is no material exposure to either Downer EDI Rail Pty Limited or Downer EDI PPP Maintenance Pty Limited arising from the subsidence, based on the fact that there are a range of recovery options being pursued.
vii) On 16 September 2015, the Group announced that it had terminated a contract with Tecnicas Reunidas S.A. (“TR”) following TR’s failure to remedy a substantial breach of the contract and that the Group is pursuing a claim against TR in the order of $65 million. Downer has since demobilised from the site and has formally commenced an arbitration process, with a hearing date scheduled for June 2018. TR has initiated a counter-claim as part of the arbitration. The Directors are of the opinion that disclosure of any further information relating to this matter would be prejudicial to the interests of the Group.
viii) Under the terms of the agreement reached between the New South Wales Government and Reliance Rail, the Group has a contingent commitment to pay Reliance Rail $12.5 million in 2018 should it be required to refinance Reliance Rail’s senior debt.
ix) On 25 May 2017, Alison Court, as applicant, filed a representative proceeding (which has a litigation funder) in the Federal Court of Australia on behalf of shareholders who acquired Spotless shares from 25 August 2015 to 1 December 2015. The applicant under this proceeding alleges that Spotless engaged in misleading or deceptive conduct and/or breached its continuous disclosure obligations in relation to Spotless financial results for the financial year ended 30 June 2015 and in its conduct following the release of those financial results until Spotless issued its trading update of 2 December 2015. The applicant seeks damages, declarations, interest and costs. Spotless is vigorously defending the proceeding. No provision has been recognised at 30 June 2017 in respect of the representative proceedings.
For
per
sona
l use
onl
y

Annual Report 2017 77
DEmployee benefits
This section provides a breakdown of the various programs Downer uses to reward and recognise employees and key executives, including Key Management Personnel (KMP). Downer believes that these programs reinforce the value of ownership and incentives and drive performance both individually and collectively to deliver better returns to shareholders.
D1. Employee benefits
D2. Key management personnel compensation
D3. Employee discount share plan
D1. Employee benefits
2017$’m
2016$’m
Employee benefits provision:
– Current 365.4 254.2
– Non-current 38.2 27.6
Total 403.6 281.8
Recognition and measurement
The employee benefits liability represents accrued wages and salaries, leave entitlements and other incentives recognised in respect of employees’ services up to the end of the reporting period. These liabilities are measured at the amounts expected to be paid when they are settled and include related on-costs, such as workers compensation insurance, superannuation and payroll tax.
Key estimate and judgement: Annual leave and long service leave Long-term employee benefits are measured at the present value of estimated future payments for the services provided by employees up to the end of the reporting period. This calculation requires judgement in determining the following key assumptions:
– Future increase in wages and salary rates;
– Future on-cost rates; and
– Expected settlement dates based on staff turnover history.
The liability is discounted using the Australian corporate bond rates which most closely match the terms to maturity of the entitlement.
2017$’m
2016$’m
Employee benefits expense:
– Defined contribution plans 170.5 148.4
– Shared-based employee benefits expense 5.6 4.9
– Employee benefits 2,601.6 2,580.8
– Redundancy costs 9.6 24.5
Total 2,787.3 2,758.6
D2. Key management personnel compensation
2017$
2016$
Short-term employee benefits 13,742,489 13,279,618
Post-employment benefits 836,489 695,498
Share-based payments 2,929,596 2,460,150
Total 17,508,574 16,435,266
Recognition and measurement
Equity-settled transactions
Equity-settled share-based transactions are measured at fair value at the date of grant. The cost of these transactions is recognised in the profit or loss and credited to equity over the vesting period. At each balance sheet date, the Group revises its estimates of the number of rights that are expected to vest for service and non-market performance conditions. The expense recognised each year takes into account the most recent estimate.
The fair value at grant date is independently determined using an option pricing model and takes into account any market related performance conditions. Non-market vesting conditions are not considered when determining value; however they are included in assumptions about the number of rights that are expected to vest.
Cash-settled transactions
The amount payable to employees in respect of cash-settled share-based payments is recognised as an expense, with a corresponding increase in liabilities, over the period during which the employees become unconditionally entitled to the payment. The liability is remeasured at each reporting date and at settlement date based on the fair value, with any changes in the liability being recognised in profit or loss.
D3. Employee discount share plan
No shares were issued under the Employee Discount Share Plan during the years ended 30 June 2017 and 30 June 2016.
For
per
sona
l use
onl
y
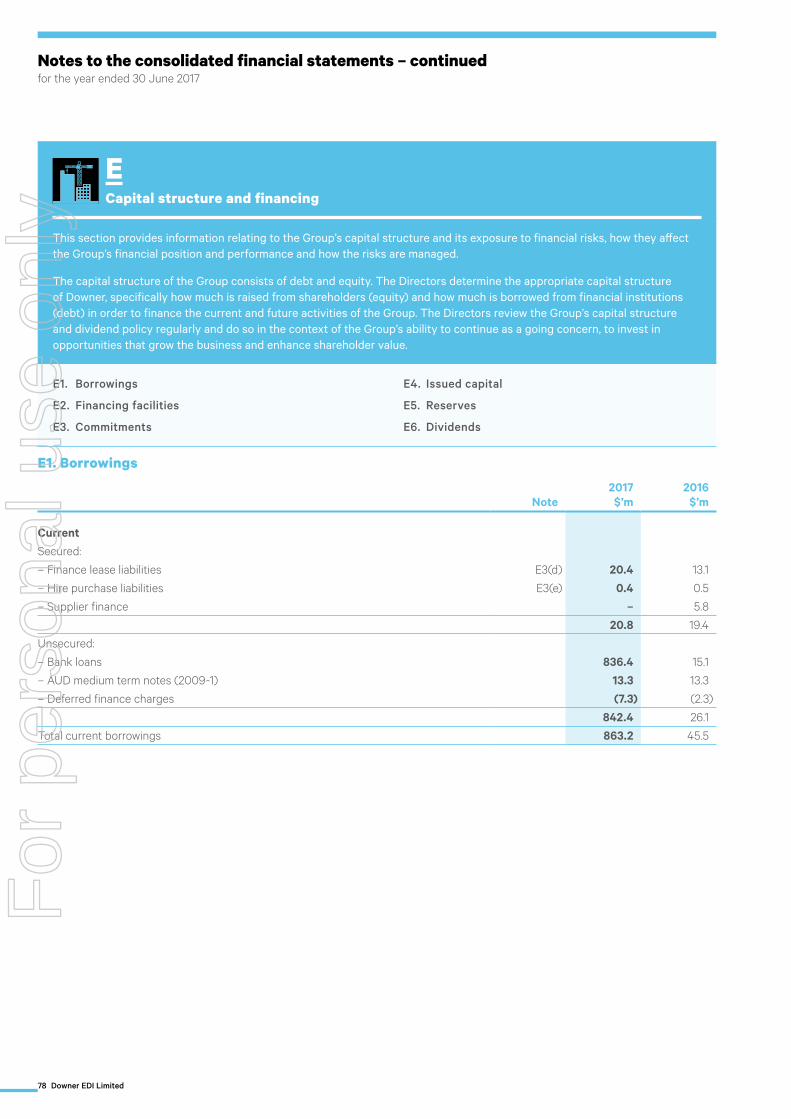
78 Downer EDI Limited
Notes to the consolidated financial statements – continuedfor the year ended 30 June 2017
ECapital structure and financing
This section provides information relating to the Group’s capital structure and its exposure to financial risks, how they affect the Group’s financial position and performance and how the risks are managed.
The capital structure of the Group consists of debt and equity. The Directors determine the appropriate capital structure of Downer, specifically how much is raised from shareholders (equity) and how much is borrowed from financial institutions (debt) in order to finance the current and future activities of the Group. The Directors review the Group’s capital structure and dividend policy regularly and do so in the context of the Group’s ability to continue as a going concern, to invest in opportunities that grow the business and enhance shareholder value.
E1. Borrowings
E2. Financing facilities
E3. Commitments
E4. Issued capital
E5. Reserves
E6. Dividends
E1. Borrowings
Note2017$’m
2016$’m
CurrentSecured:
– Finance lease liabilities E3(d) 20.4 13.1
– Hire purchase liabilities E3(e) 0.4 0.5
– Supplier finance – 5.8
20.8 19.4
Unsecured:
– Bank loans 836.4 15.1
– AUD medium term notes (2009-1) 13.3 13.3
– Deferred finance charges (7.3) (2.3)
842.4 26.1
Total current borrowings 863.2 45.5
For
per
sona
l use
onl
y

Annual Report 2017 79
E1. Borrowings – continued
Note2017$’m
2016$’m
Non-currentSecured:
– Finance lease liabilities E3(d) 14.8 13.9
– Hire purchase liabilities E3(e) 0.2 0.6
15.0 14.5
Unsecured:
– Bank loans 2.1 8.6
– USD notes 139.1 144.1
– AUD notes 30.0 30.0
– AUD medium term notes (2009-1) – 13.3
– AUD medium term notes (2013-1) 150.0 150.0
– AUD medium term notes (2015-1) 250.0 250.0
– Deferred finance charges (4.4) (6.0)
566.8 590.0
Total non-current borrowings 581.8 604.5
Total borrowings 1,445.0 650.0
Recognition and measurement
Borrowings
Borrowings are initially recognised at fair value, net of transaction costs. They are subsequently measured at amortised cost using the effective interest rate method.
2017$’m
2016$’m
Total borrowings (i) 1,409.2 616.1
Fair value of total borrowings (i) 1,466.0 687.4
(i) Exclude finance lease, hire purchase and supplier finance liabilities.
Fair value
The cash flows under the Group’s debt instruments are discounted using current market base interest rates and adjusted for current market credit default swap spreads for industrial companies with a BBB credit rating.
E2. Financing facilities
At 30 June 2017, the Group had the following facilities that were unutilised at balance date:
2017$’m
2016$’m
Syndicated bank bridge loan facility 500.0 –
Syndicated bank loan facilities 500.0 400.0
Bilateral bank loan facilities 190.0 125.0
Total unutilised bank loan facilities 1,190.0 525.0
Syndicated and bilateral bank and bilateral insurance bonding facilities 738.3 614.5
Total unutilised bonding facilities 738.3 614.5
Unutilised bank loans
Syndicated loan facilities
The syndicated bank bridge loan facility of $500.0 million is non-revolving, unsecured, matures in March 2019 (subject to Downer exercising its two six-month extension options at each of March 2018 and September 2018) and is to be specifically used to acquire shares in Spotless Group Holdings Limited and other related purposes.
The syndicated loan facilities, totalling $500.0 million, are unsecured and are split into the following tranches:
– $200.0 million maturing in April 2019;
– $100.0 million maturing in December 2020; and
– $200.0 million maturing in April 2021.
Bilateral bank loans facilities
These unutilised facilities are unsecured and due for renewal in multiple tranches in calendar years 2018 to 2019.
Utilised bank loans
Included in the aggregate amount of $836.4 million is $830.9 million which relates to bank loans of Spotless Group Holdings Limited which are classified as current pursuant to the “Change of Control Review Event” contained in Spotless’ loan facility documentation which gave lenders rights (under certain circumstances) to require prepayment of all amounts owing. Subsequent to 30 June 2017, all lenders provided a waiver under this Review Event until such date that Downer acquires 90% or more of the issued share capital of Spotless. At that point, Downer will undertake the process to compulsorily acquire 100% of Spotless which will enable it to commence the refinancing of all of the Spotless related debt under the Downer credit platform.
For
per
sona
l use
onl
y

80 Downer EDI Limited
Notes to the consolidated financial statements – continuedfor the year ended 30 June 2017
Downer has developed a detailed strategy in consultation with its main financiers to refinance this debt under its credit platform through a diverse combination of bank loans and debt capital markets issues.
At the point of securing a 100% interest in Spotless and thereafter acceding relevant Spotless subsidiaries to Downer’s debt facility guarantor pool, Downer would also be in a position to provide direct funding to Spotless if required, through a combination of its own operating cash flow and committed available debt facilities and / or by utilising the standby bridge loan facility put in place for purposes of the initial Spotless bid.
In the event Downer’s interest in Spotless remains below 90%, then Spotless will continue to fund itself on a stand-alone basis by accessing its existing facilities and will refinance these facilities in the normal course as and when they fall due.
In addition, a $50.0 million revolving cash advance facility limit relating to Spotless, which was in place at 30 June 2017, was reduced to $40.0 million with an effective date of 1 July 2017. This facility was drawn to $35.0 million at 30 June 2017. Subsequent to 30 June 2017, Spotless has also amended and extended the maturity date of two $75.0 million revolving cash advance facilities from 11 July 2018 to 1 September 2018 (aggregate $70.0 million drawn at 30 June 2017).
Utilised USD notes
USD unsecured private placement notes are on issue for a total amount of US$107.0 million. US$7.0 million notes mature in September 2019 and US$100.0 million in July 2025. The USD denominated principal and interest amounts have been fully hedged against the Australian dollar through cross-currency interest rate swaps.
Utilised AUD notes
AUD unsecured private placement notes are on issue for a total amount of $30.0 million with a maturity date of July 2025.
Utilised AUD Medium Term Notes (MTNs)
The Group has the following unsecured MTNs on issue:
– Series 2009-1 amortises through even semi-annual instalments, until the final maturity date of April 2018; current balance $13.3 million;
– Series 2013-1 for $150.0 million, which matures in November 2018; and
– Series 2015-1 for $250.0 million, which matures in March 2022.
The above facilities are subject to certain Group guarantees.
Utilised Finance lease/Hire purchase/Supplier finance facilities
The Group has certain secured facilities of these types which are for an aggregate amount of $35.8 million and which amortise over different periods of up to four years.
Covenants on financing facilities
Certain of the Group’s financing facilities contain undertakings to comply at all times with financial covenants. This requires the Group to operate within certain financial ratios as well as ensuring that subsidiaries that contribute certain minimum threshold amounts of Group EBIT and Group Total Tangible Assets are guarantors under various facilities.
The main financial covenants which the Group is subject to are Net Worth, Interest Service Coverage (calculated as rolling 12-month EBIT to Net Interest Expense) and Leverage (calculated as Net Debt to Total Capitalisation).
Financial covenants testing is undertaken and reported to the Board on a monthly basis. Reporting of financial covenants to financiers occurs semi-annually for the rolling 12-month periods to 30 June and 31 December. The Group was in compliance with all its financial covenants as at 30 June 2017.
Spotless Group Holdings Limited has financial covenants related to leverage and interest service coverage. These are reviewed by their Board of Directors on a six-monthly basis. No financial covenants were breached during the financial year.
Bonding
The Group has $1,923.8 million of bank guarantee and insurance bond facilities to support its contracting activities. $1,046.5 million of these facilities are provided to the Group on a committed basis and $877.3 million on an uncommitted basis. Included in these facilities is a syndicated $210.0 million committed revolving bank guarantee facility relating to a specific passenger rail contract and of which $27.3 million is utilised and $182.7 million is unutilised.
The Group’s facilities are provided by a number of banks and insurance companies on an unsecured basis and are subject to certain Group guarantees. $1,185.5 million (refer to Note C9) of these facilities were utilised as at 30 June 2017 with $738.3 million unutilised. These facilities have varying maturity dates between calendar years 2017 and 2020.
The underlying risk being assumed by the relevant financier under all bonds is Group corporate credit risk, rather than project specific risk.
The Group has the flexibility in respect of certain committed facility amounts (shown as part of the unutilised bilateral bank loan facilities) which can, at the election of the Group, be utilised for bonding purposes.
E2. Financing facilities – continued
For
per
sona
l use
onl
y

Annual Report 2017 81
Refinancing requirements
Where existing facilities approach maturity, the Group will negotiate with existing and new financiers to extend the maturity date of these facilities. The Group’s financial metrics and credit rating as well as conditions in financial markets and other factors may influence the outcome of these negotiations.
Credit ratings
The Group has an Investment Grade credit rating of BBB (Outlook Stable) from Fitch Ratings. Where the credit rating is reduced or placed on negative watch, customers and suppliers may be less willing to contract with the Group. Furthermore, banks and other lending institutions may demand more stringent terms (including increased pricing, reduced tenors and lower facility limits) on debt and bonding facilities, to reflect the deteriorating credit risk profile.
E3. Commitments
Note2017$’m
2016$’m
a) Capital expenditure commitmentsPlant and equipment and other
Within one year 74.2 18.2
Between one and five years 14.0 –
88.2 18.2
b) Operating lease commitments Non-cancellable operating leases relate to premises with lease terms of between one to 20 years.
Within one year 79.0 56.0
Between one and five years 201.9 155.3
Greater than five years 157.1 138.0
438.0 349.3
Non-cancellable operating leases relate to plant and equipment with lease terms of between one to seven years.
Within one year 71.8 58.9
Between one and five years 91.9 76.8
Greater than five years 6.9 6.9
170.6 142.6
c) Catering rightsCatering rights relates to exclusive secured catering rights arrangement with customers.
Within one year 28.7 –
Between one and five years 92.8 –
Greater than five years 9.1 –
130.6 –
d) Finance lease commitmentsFinance leases relate to plant and equipment with lease terms of between one to five years.
Within one year 21.5 14.1
Between one and five years 15.3 14.3
Minimum finance lease payments 36.8 28.4
Future finance charges (1.6) (1.4)
Finance lease liabilities 35.2 27.0
Included in the financial statements as:
Current borrowings E1 20.4 13.1
Non-current borrowings E1 14.8 13.9
35.2 27.0
E2. Financing facilities – continued
For
per
sona
l use
onl
y

82 Downer EDI Limited
Notes to the consolidated financial statements – continuedfor the year ended 30 June 2017
Note2017$’m
2016$’m
e) Hire purchase liabilitiesWithin one year 0.4 0.6
Between one and five years 0.2 0.6
Minimum hire purchase payments 0.6 1.2
Future finance charges – (0.1)
Hire purchase liabilities 0.6 1.1
Included in the financial statements as:
Current borrowings E1 0.4 0.5
Non-current borrowings E1 0.2 0.6
0.6 1.1
f) Operating lease expensesOperating lease expenses relating to land and building 70.2 66.8
Operating lease expenses relating to plant and equipment 92.9 105.6
Total operating lease expenses 163.1 172.4
Recognition and measurement
Leases
When the terms of a lease transfer substantially all the risks and rewards of ownership to the Group, the lease is classified as a finance lease. All other leases are classified as operating leases.
(i) Operating leases
Operating lease payments are recognised as an expense on a straight-line basis over the term of the lease, except where another systematic basis is more representative of the time pattern in which economic benefits from the leased assets are consumed.
(ii) Finance leases
Assets held under finance leases are initially recognised at an amount equal to the lower of their fair value or the present value of the minimum lease payments. Subsequently the assets are depreciated on a straight-line basis over the lesser of the estimated useful life or the lease term.
Finance lease payments are apportioned between the finance expense and the reduction of outstanding liability. The finance expense is allocated to each period during the lease term so as to achieve a constant rate of interest on the remaining balance of the liability.
E3. Commitments – continued
For
per
sona
l use
onl
y

Annual Report 2017 83
E4. Issued capital
2017$’m
2016$’m
Ordinary shares
594,702,512 ordinary shares (2016: 424,785,204) 2,263.2 1,270.2
Unvested executive incentive shares
4,257,373 ordinary shares (2016: 4,453,456) (20.0) (21.0)
200,000,000 Redeemable Optionally Adjustable
Distributing Securities (ROADS) (2016: 200,000,000) 178.6 178.6
2,421.8 1,427.8
a) Fully paid ordinary share capitalFully paid ordinary shares carry one vote per share and carry the right to dividends.
2017 2016
m’s $’m m’s $’m
Fully paid ordinary share capitalBalance at the beginning of the financial year 424.8 1,270.2 432.7 1,296.7
Group on-market share buy-back – – (7.9) (26.5)
Capital raising (i) 169.9 1,011.0 – –
Capital raising costs net of tax – (18.0) – –
Balance at the end of the financial year 594.7 2,263.2 424.8 1,270.2
b) Unvested executive incentive sharesBalance at the beginning of the financial year 4.5 (21.0) 5.3 (26.2)
Vested executive incentive share transactions (ii) (0.2) 1.0 (0.8) 5.2
Balance at the end of the financial year 4.3 (20.0) 4.5 (21.0)
(i) Relates to 169.9 million shares issued from capital raising as part of the Spotless takeover offer where two new shares for every five outstanding shares were issued at a discounted price of $5.95 per share.
(ii) Represents 196,083 vested shares for a value of $955,174, referable to the 2nd deferred component of the 2014 STI award and 1st deferred component of the 2015 STI. June 2016 figures referable to the first deferred component of the 2014 STI award totalling 842,537 vested shares for a value of $5,155,989.
Unvested executive incentive shares are stock market purchases and are held by the Executive Employee Share Plan Trust under the Long Term Incentive (LTI) plan. From the 2011 LTI plan onwards, no dividends will be distributed on shares held in trust during the performance measurement and service periods. Accumulated dividends will be paid out to executives after all vesting conditions have been met. Otherwise, excess net dividends are retained in the trust to be used by the Company to acquire additional shares on the market for employee equity plans.
For
per
sona
l use
onl
y
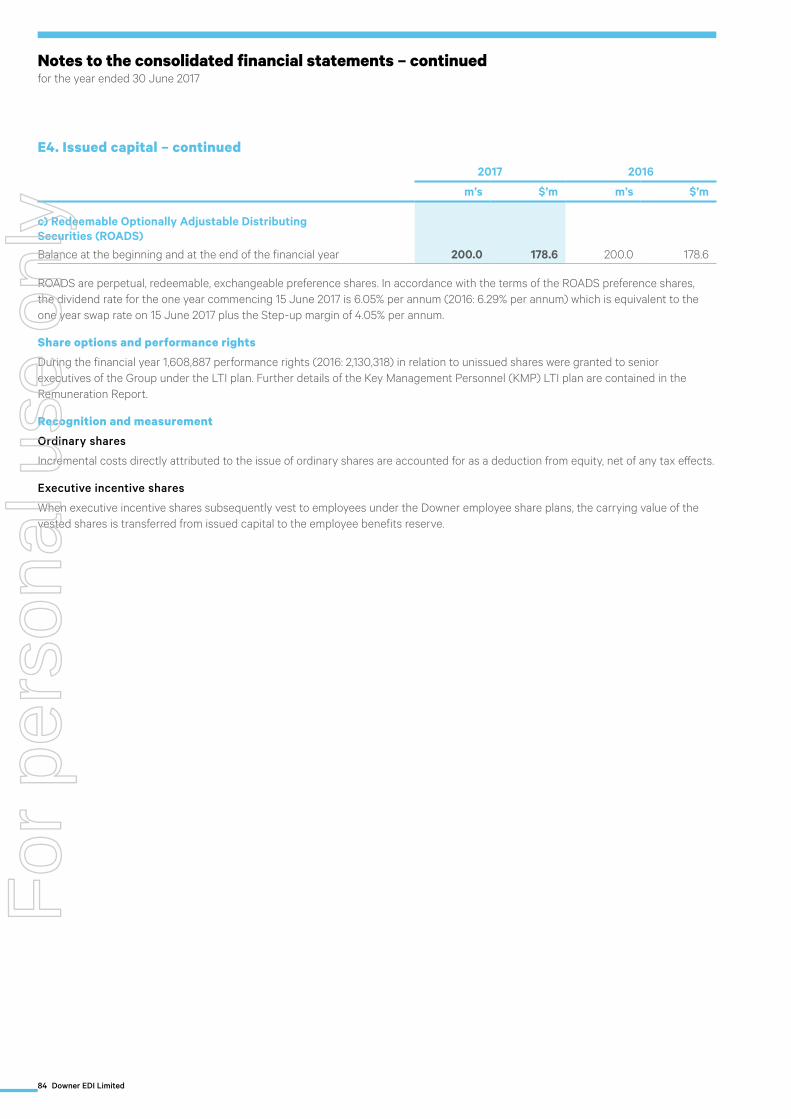
84 Downer EDI Limited
Notes to the consolidated financial statements – continuedfor the year ended 30 June 2017
E4. Issued capital – continued
2017 2016
m’s $’m m’s $’m
c) Redeemable Optionally Adjustable Distributing Securities (ROADS)Balance at the beginning and at the end of the financial year 200.0 178.6 200.0 178.6
ROADS are perpetual, redeemable, exchangeable preference shares. In accordance with the terms of the ROADS preference shares, the dividend rate for the one year commencing 15 June 2017 is 6.05% per annum (2016: 6.29% per annum) which is equivalent to the one year swap rate on 15 June 2017 plus the Step-up margin of 4.05% per annum.
Share options and performance rights
During the financial year 1,608,887 performance rights (2016: 2,130,318) in relation to unissued shares were granted to senior executives of the Group under the LTI plan. Further details of the Key Management Personnel (KMP) LTI plan are contained in the Remuneration Report.
Recognition and measurement
Ordinary shares
Incremental costs directly attributed to the issue of ordinary shares are accounted for as a deduction from equity, net of any tax effects.
Executive incentive shares
When executive incentive shares subsequently vest to employees under the Downer employee share plans, the carrying value of the vested shares is transferred from issued capital to the employee benefits reserve.
For
per
sona
l use
onl
y

Annual Report 2017 85
E5. Reserves
2017 $’m
Hedge reserve
Foreign currency
translation reserve
Employee benefits reserve
Available-for-sale
revaluation reserve Total
Balance at 1 July 2016 (2.6) (18.4) 12.2 – (8.8)Foreign currency translation difference – 0.4 – – 0.4 Change in fair value of cash flow hedges (net of tax) (3.6) – – – (3.6)Change in fair value of available-for-sale assets – – – 18.3 18.3 Available-for-sale reserve transferred to profit or loss – – – (19.1) (19.1)Total comprehensive income for the year (3.6) 0.4 – (0.8) (4.0)Vested executive incentive share transactions – – (1.0) – (1.0)Share-based employee benefits expense – – 5.6 – 5.6 Income tax relating to share-based transactions during the year – – (2.7) – (2.7)Balance at 30 June 2017 (6.2) (18.0) 14.1 (0.8) (10.9)
2016Balance at 1 July 2015 (0.3) (27.8) 12.3 – (15.8)
Foreign currency translation difference – 9.4 – – 9.4
Change in fair value of cash flow hedges (net of tax) (2.3) – – – (2.3)
Total comprehensive income for the year (2.3) 9.4 – – 7.1
Vested executive incentive share transactions – – (5.2) – (5.2)
Share-based employee benefits expense – – 4.9 – 4.9
Income tax relating to share-based transactions during the year – – 0.2 – 0.2
Balance at 30 June 2016 (2.6) (18.4) 12.2 – (8.8)
Hedge reserve
The hedge reserve comprises the effective portion of the cumulative net change in the fair value cash flow hedging instruments relating to future transactions.
Foreign currency translation reserve
The foreign currency translation reserve comprises foreign exchange differences arising from the translation of the financial statements of operations where their functional currency is different to the presentation currency of the Group.
Employee benefit reserve
The employee benefit reserve is used to recognise the fair value of share-based payments issued to employees over the vesting period, and to recognise the value attributable to the share-based payments during the reporting period.
Available-for-sale revaluation reserve
The fair value reserve includes the cumulative net movement above cost of the fair value of available-for-sale investment until the asset is realised or impaired or control of an acquiree is obtained at which time the cumulative gain or loss previously recognised in the available-for-sale revaluation reserve is included in the profit or loss.F
or p
erso
nal u
se o
nly

86 Downer EDI Limited
Notes to the consolidated financial statements – continuedfor the year ended 30 June 2017
E6. Dividends
a) Ordinary shares2017 Final
2017 Interim
2016Final
2016Interim
Dividend per share (in Australian cents) 12.0 12.0 12.0 12.0
Franking percentage 100% 100% 100% 100%
Cost (in $’m) 71.4 51.0 51.0 51.7
Dividend record date 12/09/2017 16/02/2017 18/08/2016 18/02/2016
Payment date 10/10/2017 16/03/2017 15/09/2016 17/03/2016
Recognition and measurement
Provision is made for the amount of any dividend declared, being appropriately authorised and no longer at the discretion of the entity, before or at the end of the financial year but not distributed at balance date.
The final 2017 dividend has not been declared at the reporting date and therefore is not reflected in the consolidated financial statements.
b) Redeemable Optionally Adjustable Distributing Securities (ROADS)
2017 Quarter 1 Quarter 2 Quarter 3 Quarter 4 Total
Dividend per ROADS (in Australian cents) 1.08 1.09 1.03 1.08 4.28 New Zealand imputation credit percentage 100% 100% 100% 100% 100%Cost (in A$’m) 2.1 2.2 2.1 2.2 8.6 Payment date 15/09/2016 15/12/2016 15/03/2017 15/06/2017
2016 Quarter 1 Quarter 2 Quarter 3 Quarter 4 Total
Dividend per ROADS (in Australian cents) 1.18 1.22 1.17 1.24 4.81
New Zealand imputation credit percentage 100% 100% 100% 100% 100%
Cost (in A$’m) 2.4 2.4 2.3 2.5 9.6
Payment date 15/09/2015 15/12/2015 15/03/2016 15/06/2016
c) Franking credits
The franking account balance as at 30 June 2017 is nil (2016: nil).
For
per
sona
l use
onl
y
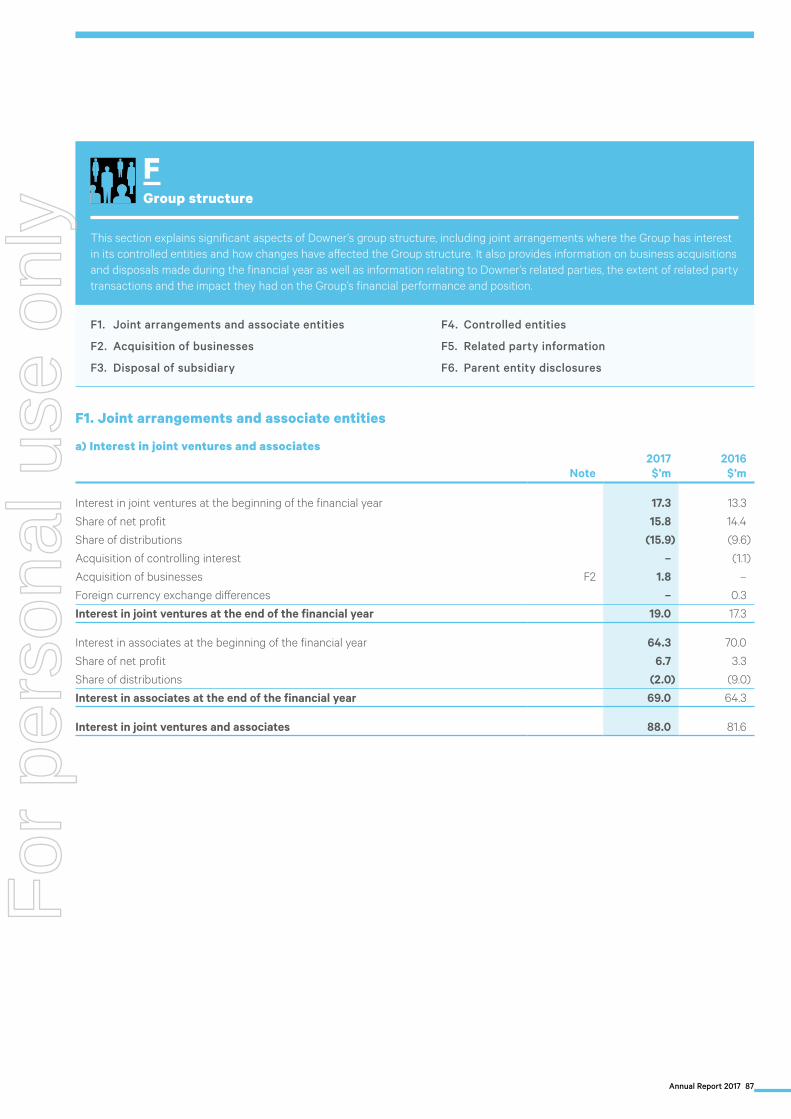
Annual Report 2017 87
FGroup structure
This section explains significant aspects of Downer’s group structure, including joint arrangements where the Group has interest in its controlled entities and how changes have affected the Group structure. It also provides information on business acquisitions and disposals made during the financial year as well as information relating to Downer’s related parties, the extent of related party transactions and the impact they had on the Group’s financial performance and position.
F1. Joint arrangements and associate entities
F2. Acquisition of businesses
F3. Disposal of subsidiary
F4. Controlled entities
F5. Related party information
F6. Parent entity disclosures
F1. Joint arrangements and associate entities
a) Interest in joint ventures and associates
Note2017$’m
2016$’m
Interest in joint ventures at the beginning of the financial year 17.3 13.3
Share of net profit 15.8 14.4
Share of distributions (15.9) (9.6)
Acquisition of controlling interest – (1.1)
Acquisition of businesses F2 1.8 –
Foreign currency exchange differences – 0.3
Interest in joint ventures at the end of the financial year 19.0 17.3
Interest in associates at the beginning of the financial year 64.3 70.0
Share of net profit 6.7 3.3
Share of distributions (2.0) (9.0)
Interest in associates at the end of the financial year 69.0 64.3
Interest in joint ventures and associates 88.0 81.6
For
per
sona
l use
onl
y

88 Downer EDI Limited
Notes to the consolidated financial statements – continuedfor the year ended 30 June 2017
F1. Joint arrangements and associate entities – continued
a) Interest in joint ventures and associates – continuedThe Group has interests in the following joint ventures and associates which are equity accounted:
Ownership interest
Name of arrangement Principal activityCountry ofoperation
2017%
2016%
Joint venturesAllied Asphalt Limited Asphalt plant New Zealand 50 50
Bitumen Importers Australia Joint Venture Construction of bitumen storage facility Australia 50 50
Bitumen Importers Australia Pty Ltd Bitumen importer Australia 50 50
Eden Park Catering Limited (i) Catering for functions at Eden Park New Zealand 50 –
EDI Rail-Bombardier Transportation Pty Ltd Sale and maintenance of railway rolling stock Australia 50 50
Emulco Limited Emulsion plant New Zealand 50 50
Isaac Asphalt Limited Manufacture and supply of asphalt New Zealand 50 50
RTL Mining and Earthworks Pty Ltd Contract mining, civil works and plant hire Australia 44 44
VEC Shaw Joint Venture Road construction Australia 50 50
ZFS Functions (Pty) Ltd (i) Catering for functions at Federation Square Australia 50 –
Associates
MHPS Plant Services Pty LtdRefurbishment, construction and maintenance of boilers Australia 27 27
Keolis Downer Pty LtdOperation and maintenance of Gold Coast light rail, Melbourne tram network and bus operation Australia 49 49
Reliance Rail Pty Ltd (ii) Rail manufacturing and maintenance Australia 49 49
(i) Spotless joint ventures acquired as part of the Spotless Group Holdings Limited acquisition. Refer to Note F2. (ii) Downer previously wrote down its investment in Reliance Rail Pty Ltd to nil. The New South Wales Government has the right in February 2018 to acquire Downer’s ownership
of Reliance Rail Pty Ltd for nil consideration. As a consequence, Downer does not include Reliance Rail Pty Ltd in its equity accounted disclosure.
There are no material commitments held by joint ventures or associates.
All joint ventures and associates have a statutory reporting date of 30 June, with the exception of MHPS Plant Services Pty Ltd which has a statutory reporting date of 31 March.
Recognition and measurement
Equity accounting
(i) Investments in joint ventures
Investments in joint ventures are accounted for using the equity method of accounting.
(ii) Investments in associates
Investments in entities over which the Group has the ability to exercise significant influence, but not control, are accounted for using the equity method of accounting. The investment in associates is carried at cost plus post-acquisition changes in the Group’s share of the associates’ net assets, less any impairment in value.
Proportionate consolidation
Joint operations
Joint operations give the Group the right to the underlying assets and obligations for liabilities and are accounted for by recognising the share of those assets and liabilities.
For
per
sona
l use
onl
y

Annual Report 2017 89
F1. Joint arrangements and associate entities – continued
b) Interest in joint operationsThe Group has interests in the following joint operations which are proportionately consolidated:
Ownership interest
Name of joint operation Principal activityCountry ofoperation
2017%
2016%
BPL Downer Joint Venture Building construction Singapore 50 50
CDJV Construction Pty Ltd Employment of labour force deployed in Clough Downer
Australia 50 50
China Hawkins Construction JV Building Construction New Zealand 50 –
Clough Downer Joint Venture Gas compression facilities and pipelines Australia 50 50
CMC and Downer Joint Venture Road construction Australia 50 50
Concrete Paving Recycling Pty Ltd Road maintenance Australia 49 –
Dampier Highway Joint Venture Highway construction and design Australia 50 50
Downer-Carey Mining JV Management of run of mine and ore rehandling services
Australia 46 46
Downer Clough Joint Venture Ammonium nitrate production Australia 50 50
Downer Daracon Joint Venture Construction Australia 50 50
Downer EDI Works Pty Ltd & Leighton Contractors Pty Ltd
Design and construction of rail works Australia 50 50
Downer Electrical GHD JV (i) Traffic control infrastructure Australia 90 90
Downer HEB Joint Venture Design and build of the New Zealand National War Memorial Park
New Zealand 50 50
DownerMouchel (ii) Road maintenance Australia 60 60
DownerMouchel Services Pty Ltd Employment of labour force deployed in DownerMouchel in New South Wales
Australia 50 50
Downer New Zealand Projects 1 Limited & Soletanche Bachy International (NZ) Limited
Enabling works for Auckland City Rail Link New Zealand 50 50
Downer York Joint Venture Tramline extension Australia 50 –
Hatch Downer JV Design and construction of solvent extraction plant Australia 50 50
HCMT Supplier JV Rail build supplier Australia 50 –
John Holland EDI Joint Venture Research reactor Australia 40 40
John Holland Pty Ltd & Downer Utilities Australia Pty Ltd Partnership
Operation of water recycling plant at Mackay Australia 50 50
Karlayura ReGen Joint Venture Road construction Australia 50 50
Landloch ReGen Joint Venture Rehabilitation works, earthworks and plant monitoring and maintenance
Australia (iii) (iii)
LD&C Joint Venture Design and construction of pipes and structures Australia 37.5 37.5
Leighton Works Joint Venture Road construction New Zealand 50 50
Macdow Downer Joint Venture (Russley Road)
Road construction New Zealand 50 50
Macdow Downer Joint Venture (CSM2) Road construction New Zealand 50 –
Macdow Downer Joint Venture (Connectus) Rail construction New Zealand 50 –
Organic Water Joint Venture Design, construction and operation of water recycling plant
Australia 50 50
Synergy Joint Venture Road and pavement construction Australia 33 33
Thiess Downer EDI Works Construction of coast to coast railway Australia 25 25
For
per
sona
l use
onl
y

90 Downer EDI Limited
Notes to the consolidated financial statements – continuedfor the year ended 30 June 2017
Ownership interest
Name of joint operation Principal activityCountry ofoperation
2017%
2016%
Thiess VEC Joint Venture Highway construction Australia 50 50
Utilita Water Solutions Plant maintenance Australia 50 50
Waanyi ReGen JV Rehab contract services Australia 50 –
Wiri Train Depot Joint Venture Construction of the Wiri train depot New Zealand 50 50
York Civil Pty Ltd and Downer EDI Engineering Pty Ltd Joint Venture (iv)
Construction of water pump station Australia – 50
(i) Contractual arrangement prevents control despite ownership of more than 50% of these joint ventures.(ii) The joint arrangement specifies 50% interest, except where an Integrated Service Arrangement (ISA) obligation is in place, whereby Downer EDI Limited has a 60% interest.(iii) Joint control is effected through unanimous vote by joint venture partners to direct the joint arrangement’s relevant activities however the Group’s interest may vary based
on discrete phases of works performed.(iv) Downer’s interest in the joint operation was disposed of during the financial year ended 30 June 2017 following completion of the contract.
F2. Acquisition of businesses
2017
The goodwill arising from acquisitions made during the financial year ended 30 June 2017 is as follows:
NoteSpotless
$’m Other (i)
$’m Total $’m
Cash 702.1 148.0 850.1 Consideration payable C5 110.8 – 110.8 Contingent consideration – 20.2 20.2 Available-for-sale investment fair value gain 19.1 – 19.1 Non-controlling interest at fair value 435.2 – 435.2
1,267.2 168.2 1,435.4Less: Net identifiable (liabilities) / assets acquired (384.1) 20.3 (363.8)Goodwill arising from acquisitions 1,651.3 147.9 1,799.2
(i) Other includes the acquisition of Hawkins, ITS PipeTech, RPQ and AGIS.
F1. Joint arrangements and associate entities – continued
b) Interest in joint operations – continued
For
per
sona
l use
onl
y

Annual Report 2017 91
F2. Acquisition of businesses – continued
2017 – continued
The provisional value of assets and liabilities recognised as a result of the acquisitions made in the financial year ended 30 June 2017 is as follows:
NoteSpotless
$’m Other (i)
$’m Total
$’m
Cash and other cash equivalents 66.0 5.4 71.4 Trade and other receivables 412.7 63.7 476.4Inventories 32.0 3.0 35.0 Other current assets 11.3 0.2 11.5 Equity accounted investments F1 1.8 – 1.8 Property, plant and equipment C6 281.2 26.2 307.4Intangibles C7 65.9 23.1 89.0 Non-current trade and other receivables 73.4 – 73.4 Net deferred tax asset / (liability) B4 59.4 (3.7) 55.7Other non-current assets 25.8 – 25.8 Current tax receivable – 0.1 0.1 Intercompany amounts receivable by the Group on acquisition – 1.5 1.5 Trade and other payables (381.6) (86.2) (467.8)Provisions (162.7) (13.6) (176.3)Borrowings (848.3) – (848.3)Financial liabilities (2.3) – (2.3)Current tax payable (7.2) – (7.2)Non–current trade and other payables (11.5) – (11.5)Effects of foreign exchange translation – 0.6 0.6 Net identifiable (liabilities) / assets acquired (384.1) 20.3 (363.8)
The total net cash outflow as a result of the acquisitions made during the financial year ended 30 June 2017 is as follows:
Spotless (iii)
$’m Other (i)
$’m Total
$’m
Gross purchase consideration (ii) 702.1 168.8 870.9 Less: Net cash acquired (66.0) (5.4) (71.4)Less: Contingent consideration – (20.2) (20.2)Total cash consideration 636.1 143.2 779.3
(i) Other includes the acquisition of Hawkins, ITS PipeTech, RPQ and AGIS. (ii) Included in Other is the $0.6 million final deferred consideration payment made for Scarrif Pipelines which was acquired on 1 July 2013.(iii) If the acquisition had taken place effective 1 July 2016, with 100% control being achieved, Spotless would have contributed additional revenue of $3,006.3 million and loss
after tax of $347.4 million.
The valuation techniques used for measuring the fair value of material assets acquired were as follows:
Asset acquired Valuation technique
Trade and other receivables Cost technique – considers the expected economic benefits receivable when due.
Property, plant and equipment Market comparison technique and cost technique: the valuation model considers quoted market prices for similar items when available and depreciated replacement cost when appropriate.
Intangible assets Multi-period excess earnings method: considers the present value of net cash flows expected to be generated by the customer contracts and relationships, intellectual property and brand names, excluding any cash flows related to contributory assets. For the valuation of certain brand names, discounted cash flow under the relief from royalty valuation methodology has been utilised.
Trade and other payables Cost technique – considers the expected economic outflow of resources when due.
Borrowings Cost technique – considers the expected economic outflow of resources when due.
Provisions Cost technique – considers the probable economic outflow of resources when the obligation arises.
For
per
sona
l use
onl
y

92 Downer EDI Limited
Notes to the consolidated financial statements – continuedfor the year ended 30 June 2017
F2. Acquisition of businesses – continued
2017 – continued
Spotless
Spotless operates in Australia and New Zealand and provides outsourced facility services, catering and laundry services, technical and engineering services, maintenance and asset management services and refrigeration solutions to various industries. The acquisition of Spotless enhances the Group’s contract portfolio, with long-term contracts that provide high certainty over revenues; contributes a complementary, high quality customer base and makes Downer an integrated services provider with a comprehensive range of capabilities.
On 20 March 2017, the Group acquired an interest equivalent to 19.99% in the issued capital of Spotless Group Holdings Limited (Spotless) which comprised the following:
– 15% shareholding at a weighted average of $1.146 per share; and
– An economic interest equivalent to 4.99% accumulated via total return cash-settled equity swap, at a weighted average reference price of $0.815 per share.
On obtaining the initial shareholding the Group announced an offer for the remaining shares pursuant to a takeover at a price of $1.15 per share.
On 27 June 2017, the Group obtained an interest stake in Spotless of 50.3%, which gave the Group control over Spotless. The acquisition of an interest exceeding 50% triggered an automatic two weeks extension to the Offer period to 11 July 2017. During the automatic extension period, the Group obtained an additional 15.4% interest in Spotless, taking total ownership to 65.7%. Consequently, a Non-Controlling Interest (NCI) of 34.3% has been recognised as at 30 June 2017.
The Group has elected to recognise the NCI at fair value, which has been assessed to be the offer share price on the date of control ($1.15 per share). This resulted in a minority interest of $435.2 million being recognised at 30 June 2017.
On consolidation, the investment in Spotless and pre-acquisition equity balances have been eliminated with a preliminary recognition of goodwill of $1,651.3 million. Due to the proximity of the acquisition to the financial year end, the accounting of the Spotless acquisition will remain provisionally determined at 30 June 2017 with the determination of the fair value of the acquired identifiable assets and liabilities to be finalised in FY18, as the measurement period allowed by AASB 3 Business Combinations is up to 12 months from the date of acquisition.
The following table summarises the NCI in relation to the Spotless acquisition:
$’m
Current assets 522.0Non-current assets 2,158.8Current liabilities (1,359.0)Non-current liabilities (54.6)Net assets 1,267.2NCI percentage 34.343%Net assets attributable to NCI 435.2
Hawkins
On 31 March 2017, the Group acquired the businesses of Hawkins, for a gross consideration of $55.4 million. The principal activities of Hawkins include construction, infrastructure development and project management throughout New Zealand. The Hawkins acquisition will complement existing engineering, construction and maintenance capabilities in New Zealand.
The total cash outflow for this acquisition was $52.6 million which comprised gross consideration of $55.4 million net of $2.8 million cash balances acquired. The purchase consideration was paid in two separate payments in March and June 2017.
At the date of acquisition, the net asset value of Hawkins was ($16.3) million due to negative working capital of the business, resulting in $71.7 million of goodwill being recognised. The Group has reported a provisional purchase price allocation with the identification of intangible assets on acquisition not yet completed due to the proximity of the transaction to year end.
ITS PipeTech
On 31 March 2017, the Group acquired 100% of ITS PipeTech Pty Ltd (ITS), for a gross consideration of $45.0 million. The principal activities of ITS include pipe bursting, civil maintenance and robotics. ITS complements, grows and broadens existing pipeline capabilities in the Utilities business.
The total cash outflow for this acquisition was $41.1 million which comprised gross consideration of $45.0 million, net of $0.6 million cash balances acquired and $3.3 million contingent consideration. The contingent consideration is payable based on achievement of financial targets over the periods through to 30 June 2020.
At the date of acquisition, the net asset value of ITS was $14.3 million inclusive of $9.4 million of acquired intangibles, $1.6 million of customer contracts and $7.8 million of intellectual property, resulting in $30.7 million of goodwill being recognised. The Group has reported a provisional purchase price allocation as the final determination of the fair value of acquired identifiable assets and liabilities has not yet been finalised.
For
per
sona
l use
onl
y

Annual Report 2017 93
F2. Acquisition of businesses – continued
2017 – continued
RPQ Group
On 30 September 2016, the Group acquired 100% of RPQ Group (RPQ) for a gross consideration of $51.1 million. The principal activities of RPQ include the supply of asphalt, bitumen spray sealing, road milling and profiling, road maintenance, foam bitumen stabilisation, mobile asphalt production, mobile crushing and equipment hire. The RPQ acquisition increases the Group’s capabilities in the Transport business.
The total cash outflow for this acquisition was $42.8 million which comprised gross consideration of $51.1 million, net of $0.8m cash balances acquired and $7.5 million contingent consideration. The contingent consideration comprises two seperate conditions being to cover claims relating to warranties and indemnities from pre-acquisition activities and a restraint for the manufacture of certain products.
At the date of acquisition, the net asset value of RPQ was $15.8 million inclusive of $5.0 million of acquired intangibles, $2.0 million of customer contracts and $3.0 million of brand names, resulting in $35.3 million of goodwill being recognised.
AGIS
On 1 July 2016, the Group acquired 100% of AGIS Group Pty Limited (AGIS) for a gross consideration of $16.7 million. AGIS provides project management, systems engineering and integration, and capability development advice to a range of government agencies including the Department of Defence, Australian Defence Forces and the Department of Foreign Affairs and Trade. The AGIS acquisition expands the Group’s footprint in the Defence sector.
Total cash outflow for this acquisition was $6.1 million, which comprised gross consideration of $16.7 million, net of $1.2 million cash balances acquired and $9.4 million contingent consideration. The contingent consideration is payable based on earnout metrics being met over the next three years. At the date of acquisition, the net asset value of AGIS was $6.5 million inclusive of $6.9 million of acquired intangibles, $5.2 million of customer contracts and $1.7 million of brand names, resulting in $10.2 million of goodwill being recognised.
Goodwill from Acquisitions
The goodwill resulting from the above acquisitions represents the future market development, expected revenue growth opportunities, technical talent and expertise, and the benefits of expected synergies. These benefits are not recognised separately from goodwill because they do not meet the recognition criteria for identifiable intangible assets. None of the goodwill arising from these acquisitions is expected to be deductible for tax purposes.
2016
Green Vision Recycling Limited
On 18 December 2015, the Group acquired the remaining 67% of Green Vision Recycling Limited for $0.9 million. Green Vision is a New Zealand company specialised in recycling horizontal infrastructure (roads, footpath, kerbs and soil).
Recognition and measurement
Business Combinations
The Group accounts for business combinations using the acquisition method when control is transferred to the Group. The consideration transferred in the acquisition is measured at fair value. Acquisition-related costs are expensed as incurred in profit or loss.
(i) Acquisition achieved in stages
Where a business combination is achieved in stages, the Group’s previously held equity interest in the acquiree is remeasured to fair value at the acquisition date (i.e. the date when the Group attains control) and the resulting gain or loss, if any, is recognised in profit or loss. Amounts arising from interests in the acquiree prior to the acquisition date that have previously been recognised in other comprehensive income are reclassified to profit or loss where such treatment would be appropriate if that interest were disposed of or control of the acquiree obtained.
(ii) Contingent consideration
The subsequent accounting for changes in the fair value of contingent consideration that do not qualify as measurement period adjustments depends on how the contingent consideration is classified. Contingent consideration that is classified as equity is not remeasured at subsequent reporting dates and its subsequent settlement is accounted for within equity.
Contingent consideration that is classified as an asset or liability is remeasured at subsequent reporting dates with the corresponding gain or loss being recognised in profit or loss.
(iii) Non-controlling interest
The Group can elect, on an acquisition by acquisition basis, to recognise non-controlling interests in an acquired entity either at fair value or at the non-controlling interest’s share of the acquired entity’s net identifiable assets / (liabilities).
Key estimate and judgement: Accounting for acquisition of businessesAccounting for acquisition of businesses requires judgement and estimates in determining the fair value of acquired assets and liabilities. The relevant accounting standard allows the fair value of assets acquired to be refined for a window of a year after the acquisition date and judgement is required to ensure that the adjustments made reflect new information obtained about facts and circumstances that existed as of the acquisition date. The adjustments made on fair value of assets are retrospective in nature and have an impact on goodwill recognised on acquisition.
For
per
sona
l use
onl
y

94 Downer EDI Limited
Notes to the consolidated financial statements – continuedfor the year ended 30 June 2017
F3. Disposal of subsidiary
2017
The Group did not dispose any business during the period ended 30 June 2017.
2016
On 31 August 2015, the Group sold the Rimtec business to Rimex Wheel Pty Ltd for a total consideration of $7.2 million. The Group incurred a $2.3 million loss as a result of this transaction.
F4. Controlled entitiesThe controlled entities of the Group listed below were wholly owned during the current and prior year, unless otherwise stated:
AustraliaAGIS Group Pty Ltd (iii)
ASPIC Infrastructure Pty Ltd (iii)
Dean Adams Consulting Pty LtdDowner Australia Pty LtdDowner EDI Associated Investments Pty LtdDowner EDI Engineering Company Pty LimitedDowner EDI Engineering CWH Pty LimitedDowner EDI Engineering Electrical Pty LtdDowner EDI Engineering Group Pty LimitedDowner EDI Engineering Holdings Pty LtdDowner EDI Engineering Power Pty LtdDowner EDI Engineering Pty LimitedDowner EDI Engineering Transmission Pty Ltd (ii)
Downer EDI Limited Tax Deferred Employee Share PlanDowner EDI Mining Pty LtdDowner EDI Mining-Blasting Services Pty LtdDowner EDI Mining-Minerals Exploration Pty LtdDowner EDI Rail Pty LtdDowner EDI Services Pty LtdDowner EDI Works Pty LtdDowner Energy Systems Pty LimitedDowner Group Finance Pty LimitedDowner Holdings Pty LimitedDowner Investments Holdings Pty Ltd (v)
Downer Mining Regional NSW Pty LtdDowner PPP Investments Pty LtdDowner Utilities Australia Pty LtdDowner Utilities Holdings Australia Pty LtdDowner Utilities Networks Pty LtdDowner Utilities New Zealand Pty LtdDowner Utilities Projects Pty LtdDowner Utilities SDR Australia Pty LtdDowner Utilities SDR Pty LtdDowner Victoria PPP Maintenance Pty Ltd (v)
EDI Rail PPP Maintenance Pty LtdEDICO Pty LtdEmoleum PartnershipEmoleum Road Services Pty LtdEmoleum Roads Group Pty LtdEmoleum Services Pty LimitedEvans Deakin Industries Pty LtdFaxgroove Pty. Limited (ii)
ITS PipeTech Pty Ltd (iii)
LNK Group Pty Ltd (v)
Locomotive Demand Power Pty LtdLowan (Management) Pty. Ltd.Maclab Services Pty Ltd (iii)
Mineral Technologies (Holdings) Pty LtdMineral Technologies Pty LtdNew South Wales Spray Seal Pty Ltd (iii)
Australia – continuedOtraco International Pty LtdOtracom Pty LtdPrimary Producers Improvers Pty LtdQCC Resources Pty Ltd (iv)
Rail Services Victoria Pty LtdREJV Services Pty LtdReussi Pty Ltd (ii)
Roche Bros. Superannuation Pty. Ltd.Roche Services Pty LtdRPC Roads Pty LtdRPQ Pty Ltd (iii)
RPQ Asphalt Pty Ltd (iii)
RPQ North Coast Pty Ltd (iii)
RPQ Services Pty Ltd (iii)
RPQ Spray Seal Pty Ltd (iii)
SACH Infrastructure Pty LtdSnowden Holdings Pty LtdSnowden Mining Industry Consultants Pty LtdSnowden Technologies Pty LtdSouthern Asphalters Pty LtdTrico Asphalt Pty Ltd (iii)
VEC Civil Engineering Pty LtdVEC Plant and Equipment Pty Ltd
New Zealand and PacificA F Downer Memorial Scholarship TrustDGL Investments LimitedDowner Construction (Fiji) LimitedDowner Construction (New Zealand) LimitedDowner Construction PNG LimitedDowner EDI Engineering PNG Limited (v)
Downer EDI Engineering Power LimitedDowner EDI Mining NZ LimitedDowner EDI Works Vanuatu LimitedDowner New Zealand LimitedDowner New Zealand Projects 1 LimitedDowner New Zealand Projects 2 LimitedDowner New Zealand Projects 3 Limited (v)
Downer Utilities Alliance New Zealand LimitedDowner Utilities New Zealand LimitedDowner Utilities PNG LimitedGreen Vision Recycling LimitedHawkins 2017 Limited (iii)
Hawkins Project 1 Limited (iii)
ITS Pipetech (Fiji) Limited (iii)
Richter Drilling (PNG) LimitedRoche Mining (PNG) Limited (iv)
Techtel Training & Development LimitedUnderground Locators LimitedWaste Solutions LimitedWorks Finance (NZ) Limited
For
per
sona
l use
onl
y

Annual Report 2017 95
AfricaDowner EDI Mining – Ghana LtdMD Mineral Technologies SA (Pty) Ltd.MD Mining and Mineral Services (Pty) Ltd (i)
Otraco Botswana (Proprietary) LimitedOtraco Southern Africa (Pty) LtdOtraco Tyre Management Namibia (Proprietary) LimitedSnowden Mining Industry Consultants (Proprietary) LtdSnowden Training (Pty) Ltd
AsiaChan Lian Construction Pte LtdChangChun Ao Hua Technical Consulting Co Ltd (v)
Chang Chun Ao Da Technical Consulting Co LtdDowner EDI Engineering Holdings (Thailand) LimitedDowner EDI Engineering Thailand LtdDowner EDI Engineering (S) Pte LtdDowner EDI Group Insurance Pte LtdDowner EDI Rail (Hong Kong) LimitedDowner EDI Works (Hong Kong) LimitedDowner Pte LtdDowner Singapore Pte LtdDuffill Watts Pte LtdDuffill Watts Vietnam Ltd (iv)
MD Mineral Technologies Private LimitedPT Duffill Watts IndonesiaPT Otraco Indonesia
AmericasDBS Chile SpAMineral Technologies Comercio de Equipamentos paraProcessamento de Minerais LTDMineral Technologies, Inc.Otraco Brasil Gerenciamento de Pneus LtdaOtraco Chile SASnowden Consultoria do Brasil LimitadaSnowden Mining Industry Consultants Inc.
United KingdomSillars (B. & C.E.) LimitedSillars (TMWD) LimitedSillars Holdings LimitedSillars Road Construction LimitedSnowden Mining Industry Consultants LimitedWorks Infrastructure (Holdings) LimitedWorks Infrastructure LimitedSpotless (vi)
AE Smith & Son Proprietary Ltd (vii)
AE Smith & Son (SEQ) Pty LtdAE Smith & Son (NQ) Pty LtdAE Smith Building Technologies Pty LtdAE Smith Service Holdings Pty LtdAE Smith Service Pty LtdAE Smith Service (SEQ) Pty LtdAladdin Group Services Pty Limited (vii)
Aladdin Holdings Pty Limited (vii)
Spotless (vi) – continuedAladdin Laundry Pty Limited (vii)
Aladdin Linen Supply Pty Limited (vii)
Asset Services (Aust) Pty Ltd (vii)
Berkeley Challenge Pty Limited (vii)
Berkeley Challenge (Management) Pty Limited (vii)
Berkeleys Franchise Services Pty Ltd (vii)
Berkeley Railcar Services Pty Ltd (vii)
Bonnyrigg Management Pty Ltd (vii)
Cleandomain Proprietary Limited (vii)
Cleanevent Australia Pty Ltd (vii)
Cleanevent Holdings Pty Ltd (vii)
Cleanevent International Pty Ltd (vii)
Cleanevent Technology Pty Ltd (vii)
Emerald ESP Pty LtdEnsign Services (Aust) Pty Ltd (vii)
Errolon Pty Ltd (vii)
Fieldforce Services Pty Ltd (vii)
Infrastructure Constructions Pty Ltd (vii)
International Linen Service Pty Ltd (vii)
Monteon Pty Ltd (vii)
Nationwide Venue Management Pty Ltd (vii)
Nuvogroup (Australia) Pty Ltd (vii)
NG-Serv Pty Ltd (vii)
Pacific Industrial Services BidCo Pty Limited (vii)
Pacific Industrial Services FinCo Pty Limited (vii)
Riley Shelley Services Pty Ltd (vii)
Skilltech Consulting Services Pty Ltd (vii)
Skilltech Metering Solutions Pty Ltd (vii)
Sports Venue Services Pty Ltd (vii)
Spotless Defence Services Pty Ltd (vii)
Spotless Facility Services Pty Ltd (vii)
Spotless Financing Pty Limited (vii)
Spotless Group Holdings LimitedSpotless Group Limited (vii)
Spotless Investment Holdings Pty Ltd (vii)
Spotless Management Services Pty Ltd (vii)
Spotless Property Cleaning Services Pty Ltd (vii)
Spotless Securities Plan (Pty) Ltd (vii)
Spotless Services Australia Limited (vii)
Spotless Services International Pty Ltd (vii)
Spotless Services Limited (vii)
Spotless Facility Services (NZ) LimitedSpotless Holdings (NZ) LimitedSpotless Treasury Pty Ltd (vii)
SSL Asset Services (Management) Pty Ltd (vii)
SSL Facilities Management Real Estate Services Pty Ltd (vii)
SSL Security Services Pty Ltd (vii)
Taylors Two Two Seven Pty Ltd (vii)
Trenchless Group Pty Ltd (vii)
UAM Pty Ltd (vii)
Utility Services Group Holdings Pty Ltd (vii)
Utility Services Group Limited (vii)
(i) 70% ownership interest.(ii) Entity currently undergoing liquidation.(iii) Entity acquired during the financial year ended 30 June 2017.(iv) Entity liquidated during the financial year ended 30 June 2017.(v) Entity incorporated during the financial year ended 30 June 2017.(vi) Entity acquired as part of the Spotless Group Holdings Limited acquisition. The ownership interest equals to the ownership interest in Spotless described in Note F2.(vii) These Spotless wholly-owned entities all form part of the tax consolidated group of which Spotless Group Holdings Limited is the head entity.
For
per
sona
l use
onl
y

96 Downer EDI Limited
Notes to the consolidated financial statements – continuedfor the year ended 30 June 2017
F5. Related party information
a) Transactions within the wholly-owned Group
Aggregate amounts receivable from and payable to wholly-owned subsidiaries are included within total assets and liabilities balances as disclosed in Note F6. Amounts contributed to the defined contribution plan are disclosed in Note D1.
Other transactions occurred during the financial year between the parent entity and wholly-owned subsidiaries, as well as between entities in the wholly-owned Group, are on normal arm’s length commercial terms.
b) Equity interests in related parties
Equity interests in subsidiaries
Details of the percentage of ordinary shares held in controlled entities are disclosed in Note F4.
Equity interests in joint arrangements and associate entities
Details of interests in joint arrangements and associate entities are disclosed in Note F1.
c) Controlling entity
The parent entity of the Group is Downer EDI Limited.
F6. Parent entity disclosures
a) Financial Position
Company
2017$’m
2016$’m
AssetsCurrent assets 1,108.8 505.9
Non-current assets 1,305.2 894.7
Total assets 2,414.0 1,400.6
LiabilitiesCurrent liabilities 29.9 30.6
Non-current liabilities 6.4 3.8
Total liabilities 36.3 34.4
Net assets 2,377.7 1,366.2
EquityIssued capital 2,243.2 1,249.2
Retained earnings 120.4 104.8
ReservesEmployee benefits reserve 14.1 12.2
Total equity 2,377.7 1,366.2
b) Financial performanceProfit for the year 117.6 172.2
Total comprehensive income 117.6 172.2
c) Guarantees entered into by the parent entity in relation to debts of its subsidiaries
The parent entity has, in the normal course of business, entered into guarantees in relation to the debts of its subsidiaries during the financial year.
d) Contingent liabilities of the parent entity
The parent entity has no contingent liabilities as at 30 June 2017 (2016: nil) other than those disclosed in Note C9.
The parent entity does not have any commitments for acquisition of property, plant and equipment as at 30 June 2017 (2016: nil).
For
per
sona
l use
onl
y

Annual Report 2017 97
GOther
This section provides details on other required disclosures relating to the Group to comply with the accounting standards and other pronouncements including the Group’s capital and financial risk management disclosure. This disclosure provides information around the Group’s risk management policies and how Downer uses derivatives to hedge the underlying exposure to changes in interest rates and to foreign exchange rate fluctuations.
G1. New accounting standards
G2. Capital and financial risk management
G3. Other financial assets and liabilities
G1. New accounting standards
a) New and amended accounting standards adopted by the Group
In the current year, the Group has applied a number of new and revised accounting standards issued by the Australian Accounting Standards Board (AASB) that are mandatorily effective for an accounting period that begins on or after 1 July 2016, as follows:
– AASB 2014-3 Amendments to Australian Accounting Standards – Accounting for Acquisitions of Interests in Joint Operations;
– AASB 2015-1 Amendments to Australian Accounting Standards – Annual Improvements to Australian Accounting Standards 2012-2014 Cycle;
– AASB 2015-2 Amendments to Australian Accounting Standards – Disclosure Initiative: Amendments to AASB 101; and
– AASB 2015-9 Amendments to Australian Accounting Standards – Scope and Application Paragraphs.
Adoption of these standards has not resulted in any material changes to the Group’s financial statements.
b) New accounting standards and interpretations not yet adopted
The following standards, amendments to standards and interpretations are relevant to current operations. They are available for early adoption but have not been applied by the Group in this Financial Report.
AASB 9 – Financial Instruments
AASB 9 addresses the classification, measurement and derecognition of financial assets and financial liabilities and introduces new rules for hedge accounting and a new impairment model for financial assets. The standard is not applicable until 1 July 2018.
The Group expects existing hedge relationships would appear to qualify as continuing hedge relationships upon adoption of the new standard and does not expect the standard to have a significant impact on the recognition or measurement of the Group’s financial instruments.
The new impairment model requires the recognition of impairment provisions based on expected credit losses rather than only incurred credit losses. Whilst the Group has yet to finalise its detailed assessment of the impact of AASB 9 and its interaction with AASB 15 it may result in earlier recognition of credit loss provisions.
The new standard also introduces expanded disclosure requirements and changes in presentation. These are expected to change the nature and extent of the Group’s disclosure about its financial instruments particularly in the year of adoption of the new standard.
AASB 15 – Revenue from Contracts with Customers
AASB 15 changes the way revenue is recognised and provides for a significant increase in the disclosure requirements for the business. The core principle is that an entity recognises revenue to depict the transfer of promised goods or services to customers in an amount that reflects the consideration to which the entity expects to be entitled in exchange for those goods or services. This means that revenue will be recognised when control of goods or services is transferred rather than on transfer of risks and rewards.
The standard is only expected to impact those contracts that are ongoing at the date of adoption. The Group is in the process of assessing the full impact of the application of AASB 15, which involves carrying out a review of all existing major contracts to ensure the impact and effect of the new standard is fully understood in advance of the effective date. As at 30 June 2017, a high level impact assessment has been performed across the Group along with detailed contract reviews on a sample of key contracts across the divisions. The Group has also performed project assessments across new long-term service contracts.
AASB 15 will become mandatory for reporting periods beginning on or after 1 July 2018. The Group does not intend to early adopt this standard before its mandatory effective date and therefore AASB 15 will be applied for the first time in the 2019 Financial Report.
For
per
sona
l use
onl
y

98 Downer EDI Limited
Notes to the consolidated financial statements – continuedfor the year ended 30 June 2017
While a detailed assessment is yet to be concluded, the Group expects the following impacts:
– AASB 15 has a higher threshold of probability and therefore revenue is to be recognised only when it is highly probable that a significant reversal will not occur. It is expected this will impact the timing/quantum of project variances, variable and incentive based payments, and claims recognised as part of “amounts due from customers under contract and rendering of services”.
– AASB 15 requires only incremental costs of obtaining a contract to be capitalised and then expensed over the contract period.
– Implementation may require some development of current reporting systems and processes.
The new standard also introduces expanded disclosure requirements and changes in presentation, particularly in relation to key judgements and future revenue expected to be generated. These are expected to change the nature and extent of the Group’s disclosure about its revenue from contracts with customers and associated assets, particularly in the year of adoption of the new standard.
AASB 15 needs to be implemented either fully retrospectively, which would require restatement of comparatives, or using the cumulative effect method, which would not require a restatement of comparatives, upon the effective date of 1 July 2018. AASB 15 contains a number of practical expedients for the full retrospective approach including the option to omit the restatement impact of completed contracts that begin and end within the same annual reporting period and / or completed at the beginning of the earliest period presented. The transaction price at the date of contract completion may also be used, rather than estimating variable consideration amounts in each comparative period. Contract modifications presented in the earliest reporting period may not be required to be separately evaluated. The Group is in the process of assessing the available options for transition.
AASB 16 – Leases
AASB 16 will replace the current leasing standard AASB 117, and contains significant changes to the accounting treatment of leases around how to recognise, measure and disclose leases. The new standard provides a single lessee accounting model, requiring lessees to recognise assets and liabilities for all leases, with the exception of short-term (less than 12 months) and low value leases. AASB 16 applies to annual reporting periods beginning on or after 1 July 2019.
As at reporting date, the Group has non-cancellable operating lease commitments of $608.6 million (refer to Note E3 Commitments). The Group manages its owned and leased assets to ensure there is an appropriate level of equipment to meet its current obligations and to tender for new work. The decision as to whether to lease or purchase an asset is dependent on the finance available at the time and the residual risk of ownership following the anticipated completion of the project.
To date, management has focused on the identification of the provisions of the standard which will most impact the Group and is in the process of determining whether any additional arrangements in excess of the current portfolio will be considered as a lease, together with a review of the lease contracts and financial reporting systems in place. As such, the Group has not quantified yet the effect of the new standard; however the following impacts are expected on implementation date:
– Total assets and total liabilities will increase, due to the recognition of a “Right of Use Asset” and a “Lease Liability” grossing up the assets and liabilities in the Consolidated Statement of Financial Position;
– Interest expense will increase due to the effective interest rate implicit in the lease, where the interest expense component is higher on early years on the lease;
– Depreciation charge will increase as the right of use assets is recognised;
– Lease rental expenses will decrease due to the recognition of interest and depreciation noted above; and
– Operating cash flows will be higher as repayment of the principle portion of all lease liabilities will be classified as financing activities.
AASB 16 needs to be implemented retrospectively, either with the restatement of comparatives or with the cumulative impact of application recognised as at 1 July 2019 under the modified retrospective approach. AASB 16 contains a number of practical expedients, one of which permits the classification of existing contracts as leases under current accounting standards to be carried over to AASB 16. Under the modified retrospective approach, on a lease-by-lease basis, the right of use of an asset may be deemed to be equivalent to the liability at transition or calculated retrospectively as at inception of the lease. The Group is in the process of assessing the available options for transition.
Other
The following new or amended standards are not expected to have a significant impact on the Group’s consolidated financial statements:
– AASB 2016-1 Amendments to Australian Accounting Standards – Recognition of Deferred Tax Assets for Unrealised Losses;
– AASB 2016-2 Amendments to Australian Accounting Standards – Disclosure Initiative: Amendments to AASB 107;
– AASB 2016-5 Amendments to Australian Accounting Standards – Classification and Measurement of Share-based Payment Transactions;
– AASB 2014-10 Amendments to Australian Accounting Standards: Sale or Contribution of Assets Between an Investor and its Associate or Joint Venture; and
– IFRIC23 Uncertainties over Income Tax Treatments.
G1. New accounting standards – continued
For
per
sona
l use
onl
y

Annual Report 2017 99
G2. Capital and financial risk management
a) Capital risk management
The capital structure of the Group consists of debt and equity. The Group may vary its capital structure by adjusting the amount of dividends, returning capital to shareholders, issuing new shares or increasing or reducing debt.
The Group’s objectives when managing capital are to safeguard its ability to operate as a going concern so that it can meet all its financial obligations when they fall due, provide adequate returns to shareholders and maintain an appropriate capital structure to optimise its cost of capital, to maintain an Investment Grade credit rating and to ensure ongoing access to funding.
b) Financial risk management objectives
The Group’s Treasury function manages the funding, liquidity and financial risks of the Group. These risks include foreign exchange, interest rate, commodity and counterparty credit risk.
The Group may enter into a variety of derivative financial instruments to manage its exposures including:
i) Forward foreign exchange contracts to hedge the exchange rate risk arising from cross-border trade flows, foreign income and debt service obligations;
ii) Cross-currency interest rate swaps to manage the interest rate and currency risk associated with foreign currency denominated borrowings; and
iii) Interest rate swaps to manage interest rate risk.
The Group does not enter into or trade derivative financial instruments for speculative purposes.
Financial assets and liabilities are offset and the net amount reported in the Consolidated Statement of Financial Position, when there is a legally enforceable right to offset the recognised amounts and there is an intention to settle on a net basis or realise the asset and settle the liability simultaneously. No material amounts with a right to offset were identified in the Consolidated Statement of Financial Position.
c) Foreign currency risk management
The Group undertakes certain transactions denominated in foreign currencies. As a result, exposures to exchange rate fluctuations arise. Exchange rate exposures are managed within approved policy parameters, utilising forward foreign exchange contracts and cross-currency swaps.
The carrying amounts of the Group’s material unhedged foreign currency denominated financial assets and financial liabilities at the reporting date are as follows:
Financial assets(i)
Financial liabilities(i)
2017$’m
2016$’m
2017$’m
2016$’m
US dollar (USD) 1.9 4.8 11.8 11.7
New Zealand dollar (NZD) 0.6 1.2 0.3 –
Euro (EUR) 0.1 0.7 1.0 –
2.6 6.7 13.1 11.7
(i) The above table shows foreign currency financial assets and liabilities in Australian dollar equivalent.
For
per
sona
l use
onl
y

100 Downer EDI Limited
Notes to the consolidated financial statements – continuedfor the year ended 30 June 2017
G2. Capital and financial risk management – continued
c) Foreign currency risk management – continued
Foreign currency forward contracts
The following table summarises by currency, the Australian dollar (AUD) value (unless otherwise stated) of forward exchange contracts outstanding as at the reporting date:
Weighted average exchange rate Foreign currency Contract value Fair value
Outstanding contracts
2017 2016 2017FC’m
2016FC’m
2017$’m
2016$’m
2017$’m
2016$’m
Buy USD / Sell AUDLess than 3 months 0.7165 0.7165 30.3 7.2 42.3 10.0 (1.4) (0.4)
3 to 6 months 0.7529 0.7328 4.1 10.5 5.5 14.3 (0.1) (0.2)
Later than 6 months 0.7492 0.7304 81.8 0.3 109.2 0.5 (2.3) –
116.2 18.0 157.0 24.8 (3.8) (0.6)
Buy AUD / Sell USDLess than 3 months 0.7294 0.7109 1.5 0.8 2.1 1.2 0.1 0.1
3 to 6 months 0.7351 – 4.9 – 6.7 – 0.3 –
Later than 6 months 0.7628 – 1.0 – 1.3 – – –
7.4 0.8 10.1 1.2 0.4 0.1
Buy EUR / Sell AUDLess than 3 months 0.6818 0.6325 30.9 6.4 45.3 10.1 0.7 (0.7)
3 to 6 months 0.6790 0.6191 0.4 2.1 0.6 3.3 0.1 (0.2)
Later than 6 months 0.6735 – 0.4 – 0.6 – – –
31.7 8.5 46.5 13.4 0.8 (0.9)
Buy AUD / Sell NZDLess than 3 months 1.0542 – 4.1 – 3.9 – – –
3 to 6 months 1.0547 – 11.4 – 10.8 – (0.1) –
Later than 6 months 1.0558 – 28.8 – 27.2 – (0.1) –
44.3 – 41.9 – (0.2) –
For
per
sona
l use
onl
y

Annual Report 2017 101
G2. Capital and financial risk management – continued
c) Foreign currency risk management – continued
Cross-currency interest rate swaps
Under cross-currency interest rate swaps, the Group is committed to exchange certain foreign currency loan principal and interest amounts at agreed future dates at fixed foreign exchange and interest rates. Such contracts enable the Group to eliminate the risk of adverse movements in foreign exchange and interest rates related to foreign currency denominated borrowings.
The following table details the Australian dollar equivalent of cross-currency interest rate swaps outstanding as at the reporting date:
Outstanding contracts
Weighted average interest rate (including
credit margin)Weighted average
exchange rate Contract value Fair value
2017%
2016%
2017 2016 2017$’m
2016$’m
2017$’m
2016$’m
Buy USD / Sell AUD1 to 5 years 7.8 7.8 0.7168 0.7168 9.8 9.8 (0.9) (0.5)
5 years or more 5.9 5.9 0.7739 0.7739 129.2 129.2 (4.7) 2.8
139.0 139.0 (5.6) 2.3
The above cross-currency interest rate swap contracts are designated as effective cash flow hedges.
Foreign currency sensitivity analysis
The Group is mainly exposed to the United States dollar (USD), Euro (EUR) and New Zealand dollar (NZD).
The following table details the Group’s sensitivity to movements in the Australian dollar against relevant foreign currencies. The percentages disclosed below represent the Group’s assessment of the possible changes in spot foreign exchange rates (i.e. forward exchange points and discount factors have been kept constant). The sensitivity analysis includes only outstanding foreign currency denominated monetary items and adjusts their translation at the period end for a given percentage change in foreign exchange rates.
A positive number indicates a before-tax increase in profit and equity and a negative number indicates a before-tax decrease in profit and equity.
Profit/(loss)(i) Equity(ii)
2017$’m
2016$’m
2017$’m
2016$’m
USD impact– 15% rate change (1.7) (1.2) 24.9 4.1
+ 15% rate change 1.3 0.9 (18.4) (3.0)
EUR impact– 15% rate change (0.2) 0.1 7.1 1.4
+ 15% rate change 0.1 (0.1) (7.1) (1.4)
NZD impact– 15% rate change – – (6.9) –
+ 15% rate change – – 5.1 –
(i) This is mainly as a result of the changes in the value of forward foreign exchange contracts not designated in a hedge relationship, foreign currency investments, receivables and payables.
(ii) This is as a result of the changes in the value of forward foreign exchange contracts designated as cash flow hedges.
For
per
sona
l use
onl
y

102 Downer EDI Limited
Notes to the consolidated financial statements – continuedfor the year ended 30 June 2017
G2. Capital and financial risk management – continued
d) Interest rate risk management
The Group is exposed to interest rate risk as entities borrow funds at floating interest rates. The risk is managed by maintaining an appropriate mix between fixed and floating rate borrowings and hedging is undertaken through interest rate swap contracts and the issue of long-term fixed rate debt securities.
The Group’s exposure to interest rates on financial assets and financial liabilities is detailed in the table below:
Weighted average interest rate
(including credit margin) Liability/(asset)
2017%
2016%
2017$’m
2016$’m
Floating interest rates – cash flow exposureBank loans 3.3 3.8 733.7 23.7
Cash and cash equivalents 1.7 2.1 (844.6) (569.4)
Total cash flow exposure (110.9) (545.7)
Fixed interest rates – fair value exposureBank loans (i) 4.0 – 107.0 –
USD notes (i) 6.0 6.0 144.7 141.7
AUD notes 5.8 5.8 30.0 30.0
AUD medium term notes (2009-1) (i) (ii) 7.2 7.2 13.6 27.5
AUD medium term notes (2013-1) (iii) 6.0 6.0 150.0 150.0
AUD medium term notes (2015-1) (iii) 4.7 4.7 250.0 250.0
Supplier finance – 4.9 – 5.8
Finance lease and hire purchase 4.2 5.2 35.8 28.1
Total fair value exposure 731.1 633.1
(i) The values of the interest rate and cross-currency swaps have been included in the debt amounts.(ii) The underlying medium term notes were issued on a floating rate basis and fixed through interest rate swaps.(iii) Weighted average interest rate is shown on a yield-to-maturity basis.
All interest rates in the above table reflect rates in the currency of the relevant loan other than USD notes, where the AUD rates under the cross-currency swaps are used.
The table above relates to amounts that are drawn. The Group has a number of undrawn facilities, which if utilised would be on a floating rate basis.
Interest rate swap contracts
The Group uses interest rate swap contracts to manage interest rate exposures. Under these contracts, the Group commits to exchange the difference between fixed and floating rate interest amounts calculated on notional principal amounts. The fair value of interest rate swaps are based on market values of equivalent instruments at the reporting date.
The following table details the interest rate swap contracts and related notional principal amounts as at the reporting date:
Outstanding floating to fixed swap contracts
Weighted average interest rate
Notional principal amount Fair value
2017 %
2016 %
2017 $’m
2016 $’m
2017 $’m
2016 $’m
AUD interest rate swapsLess than 1 year 3.8 – 81.8 – (1.6) –
1 to 2 years 5.2 5.2 13.3 26.6 (0.2) (0.8)
NZD interest rate swapsLess than 1 year 4.7 – 25.2 – (0.7) –
120.3 26.6 (2.5) (0.8)
For
per
sona
l use
onl
y
Annual Report 2017 103
G2. Capital and financial risk management – continued
d) Interest rate risk management – continued
Interest rate sensitivity analysis
The sensitivity analysis has been determined based on the exposure to interest rates at the reporting date and assuming that the rate change occurs at the beginning of the financial year and is then held constant throughout the reporting period.
Sensitivities have been based on a movement in interest rate by 100 basis points on profit and equity across the yield curve of the relevant currencies (2016: 50 and 75 basis points on profit and equity respectively). The selected basis points increase or decrease represents the Group’s assessment of the possible change in interest rates on variable rate instruments, cross-currency interest rate swaps and interest rate swaps. Based on the sensitivity analysis performed, the change in interest rates at reporting date does not have a material impact on either profit or equity.
e) Credit risk management
Credit risk refers to the risk that a financial counterparty will default on its contractual obligations, resulting in a loss to the Group. The Group’s exposure and the credit ratings of its counterparties are regularly monitored and transactions are diversified among approved counterparties.
Trade receivables consist of a large number of customers, spread across diverse industries and geographical areas. Ongoing credit evaluation is performed on the financial condition of trade receivable counterparties. Refer to Note C2 for details on credit risk arising from trade and other receivables.
The preferred credit risk on derivative financial instruments is to counterparties that have minimum long-term credit ratings from Standard & Poor’s of no less than AA- (or equivalent from other rating agencies). Due to the general downward migration of the credit ratings of bank counterparties over recent years, the Group has exposure to banks at the A+ and A rating levels, in addition to those at the AA- level.
Credit risk arising from cash balances held with banks is managed by Group Treasury. Investments of surplus funds are generally only made with counterparties that have a minimum AA- credit rating. Investments for relatively short tenors are made from time to time with A+ and A rated counterparties. In a few circumstances, restricted amounts of surplus funds are held in foreign jurisdictions where there are no financial institutions that meet the above minimum rating thresholds.
Counterparty credit limits, and the related credit acceptability of counterparties, are reviewed by the Board from time to time. The limits are set to minimise the concentration of risks and therefore mitigate financial loss through potential counterparty default. No material exposure is considered to exist by virtue of the non-performance of any financial counterparty.
The carrying amount of financial assets recorded in the financial statements, net of any allowances for losses, represents the Group’s maximum exposure to credit risk.
f) Liquidity risk management
Liquidity risk arises from the possibility that the Group is unable to settle a financial transaction on the due date. Liquidity risk management is ultimately a Board responsibility, which has been built on an appropriate risk management framework under the Group’s Treasury policy.
The Group manages liquidity risk by maintaining adequate cash reserves and committed undrawn debt facilities, by monitoring forecast and actual cash flows and by matching the maturity profiles of financial assets and liabilities. Included in Note E2 is a summary of committed undrawn bank loan facilities.
For
per
sona
l use
onl
y

104 Downer EDI Limited
Notes to the consolidated financial statements – continuedfor the year ended 30 June 2017
G2. Capital and financial risk management – continued
f) Liquidity risk management – continued
Liquidity risk tables
The following tables detail the Group’s contractual maturity of its financial liabilities. The tables are based on the undiscounted cash flows of financial liabilities. The tables include both interest and principal cash flows.
$’mLess than
1 year1 to 2 years
2 to 3years
3 to 4years
4 to 5 years
More than 5 years
2017Trade payables 527.6 – – – – –
Finance lease and hire purchase liabilities 21.2 9.0 4.9 1.0 – –
Bank loans 836.6 2.1 – – – – USD notes 6.5 6.5 15.4 6.0 6.0 151.0 AUD notes 1.7 1.7 1.7 1.7 1.7 36.1 AUD medium term notes (2009-1) 13.7 – – – – – AUD medium term notes (2013-1) 8.6 154.3 – – – – AUD medium term notes (2015-1) 11.3 11.3 11.3 11.3 261.3 – Total borrowings including interest 878.4 175.9 28.4 19.0 269.0 187.1 Cross-currency interest rate swaps (i)
– Receive leg (6.5) (6.5) (15.3) (5.9) (5.9) (150.8) – Pay leg 8.4 8.4 17.8 7.6 7.7 155.8
Interest rate swaps 2.2 – – – – – Foreign currency forward contracts 2.7 0.2 – – – – Total derivative instruments (ii) 6.8 2.1 2.5 1.7 1.8 5.0
Total 1,434.0 187.0 35.8 21.7 270.8 192.1
2016Trade payables 358.9 – – – – –
Finance lease, hire purchase and supplier finance liabilities 20.6 13.2 1.6 0.1 – –
Bank loans 15.8 6.7 2.1 – – –
USD notes 6.7 6.7 6.7 15.8 6.1 161.8
AUD notes 1.7 1.7 1.7 1.7 1.7 37.9
AUD medium term notes (2009-1) 14.3 13.7 – – – –
AUD medium term notes (2013-1) 8.6 8.6 154.3 – – –
AUD medium term notes (2015-1) 11.3 11.3 11.3 11.3 11.3 261.3
Total borrowings including interest 58.4 48.7 176.1 28.8 19.1 461.0
Cross currency interest rate swaps (i)
– Receive leg (6.8) (6.8) (6.8) (15.9) (6.2) (162.4)
– Pay leg 8.4 8.4 8.4 17.8 7.6 163.5
Interest rate swaps 0.7 0.3 – – – –
Foreign currency forward contracts 1.3 – – – – –
Total derivative instruments (ii) 3.6 1.9 1.6 1.9 1.4 1.1
Total 441.5 63.8 179.3 30.8 20.5 462.1
(i) Bond basis.(ii) Includes assets and liabilities.
For
per
sona
l use
onl
y

Annual Report 2017 105
G2. Capital and financial risk management – continued
Recognition and measurement
Derivative financial instruments
Derivative financial instruments are initially recognised at fair value on the date a derivative contract is entered into and are subsequently re-measured to their fair value at each reporting date. Any gains or losses arising from changes in fair value of derivatives, except those that qualify as effective hedges, are immediately recognised in profit or loss.
Hedge accounting
When the Group designates certain derivatives to be part of a hedging relationship, and they meet the criteria for hedge accounting, the hedges are classified as either fair value or cash flow hedges.
Fair value hedges
Fair value hedges are used to hedge the exposure to changes in the fair value of a recognised asset, liability or firm commitment. For fair value hedges, changes in the fair value of the derivative, together with any changes in the fair value of the hedged asset or liability that is attributable to the hedged risk, are immediately recorded in profit or loss. Hedge accounting is discontinued when the hedge instrument expires or is sold, terminated, exercised, or no longer qualifies for hedge accounting.
Cash flow hedges
Cash flow hedges are used to hedge risks associated with contracted and highly probable forecast transactions. For cash flow hedges, the effective portion of changes in the fair value of the derivative is deferred in equity and the gain or loss relating to the ineffective portion is recognised immediately in profit or loss.
Amounts deferred in equity are transferred to profit or loss in the same period the hedged item is recognised in profit or loss. When the forecast transaction that is hedged results in the recognition of a non-financial asset or liability, the gains and losses previously deferred in equity are transferred to form part of the initial measurement of the cost of the non-financial asset or liability.
If the forecast transaction is no longer expected to occur, the cumulative gain or loss that was deferred in equity is recognised immediately in profit or loss. If the hedge instrument expires or is sold, terminated, exercised, or no longer qualifies for hedge accounting, any gain or loss deferred in equity remains in equity until the forecast transaction occurs.
For
per
sona
l use
onl
y

106 Downer EDI Limited
Notes to the consolidated financial statements – continuedfor the year ended 30 June 2017
G3. Other financial assets and liabilities
2017$’m
Financial assets Financial liabilities
Current Non-current Current Non-current
At amortised cost:Other financial assets 9.8 13.4 – – Advances to / from joint ventures and associates 1.5 – 13.2 –
11.3 13.4 13.2 – At fair value:
Level 2Foreign currency forward contracts – Cash flow hedge 1.2 – 3.8 0.2 Cross-currency and interest rate swaps – Cash flow hedge – – 3.5 4.6
1.2 – 7.3 4.8 Level 3Unquoted equity investments – Available-for-sale – 3.7 – – Contingent consideration – – 3.3 16.9
– 3.7 3.3 16.9 Total 12.5 17.1 23.8 21.7
2016 $’m
Financial assets Financial liabilities
Current Non-current Current Non-current
At amortised cost:Other financial assets 9.8 13.4 – –
Advances from joint ventures and associates – – 12.0 –
9.8 13.4 12.0 –
At fair value:Level 2Foreign currency forward contracts – Cash flow hedge 0.3 – 1.7 –
Cross-currency and interest rate swaps – Cash flow hedge – 3.6 1.4 0.7
0.3 3.6 3.1 0.7
Level 3Unquoted equity investments – Available-for-sale – 5.1 – –
Total 10.1 22.1 15.1 0.7
Reconciliation of Level 3 fair value measurements of financial assets
Level 3 investments decreased by $1.4 million from prior year (2016: $1.1 million decrease) mostly due to revaluation and return on investment.
For
per
sona
l use
onl
y

Annual Report 2017 107
G3. Other financial assets and liabilities – continued
Recognition and measurement
Fair value measurement
When a derivative is designated as the cash flow hedging instrument, the effective portion of changes in the fair value of the derivative is recognised in Other Comprehensive Income and accumulated in the hedging reserve. Any ineffective portion of changes in the fair value of the derivative is recognised immediately in profit or loss.
Valuation of financial instruments
For financial instruments measured and carried at fair value, the Group uses the following to categorise the methods used:
– Level 1: fair value is calculated using quoted prices in active markets for identical assets or liabilities;
– Level 2: fair value is estimated using inputs other than quoted prices included within Level 1 that are observable for the asset or liability, either directly (as prices) or indirectly (derived from prices); and
– Level 3: fair value is estimated using inputs for the asset or liability that are not based on observable market data.
During the year there were no transfers between Level 1, Level 2 and Level 3 fair value hierarchies.
The following table shows the valuation technique used in measuring Level 2 and 3 fair values, as well as significant unobservable inputs used:
Type Valuation technique Significant unobservable input
Cross-currency and interest rate swaps Calculated using the present value of the estimated future cash flows based on observable yield curves.
Not applicable.
Foreign currency forward contracts Calculated using forward exchange rates prevailing at the balance sheet date.
Not applicable.
Unquoted equity investments Calculated based on the Group’s interest in the net assets of the unquoted entities.
Assumptions are made with regard to future expected revenues and discount rates.
Changing the inputs to the valuations to reasonably possible alternative assumptions would not significantly change the amounts recognised in profit or loss, total assets or total liabilities, or total equity.
Contingent Consideration Calculated on the amounts expected to be paid based on the probability of contingent events and targets being achieved, determined by reference to forecasts of future performance of the acquired businesses discounted using the market rates prevailing at financial year end.
Assumptions are made with regard to future expected earnings and discount rates on certain of the contingent arrangements.
For
per
sona
l use
onl
y

108 Downer EDI Limited
Directors’ Declarationfor the year ended 30 June 2017
In the opinion of the Directors’ of Downer EDI Limited:
(a) The financial statements and notes set out on pages 53 to 107 are in accordance with the Australian Corporations Act 2001 (Cth), including:
(i) Complying with Accounting Standards, the Corporations Regulations 2001 and other mandatory professional reporting requirements; and
(ii) The financial statements and notes thereto give a true and fair view of the financial position and performance of the Company and the consolidated entity;
(b) There are reasonable grounds to believe that Downer EDI Limited will be able to pay its debts as and when they become due and payable;
(c) The Directors have been given the declarations required by Section 295A of the Corporations Act 2001 (Cth); and
(d) The attached financial statements are in compliance with International Financial Reporting Standards, as noted in Note A to the financial statements.
Signed in accordance with a resolution of the Directors made pursuant to Section 295(5) of the Corporations Act 2001 (Cth).
On behalf of the Directors
R M Harding Chairman
Sydney, 29 August 2017
For
per
sona
l use
onl
y

Annual Report 2017 109
Downer’s philosophy:
Downer exists to create and sustain the modern environment by building trusted relationships with its public and private sector customers. Downer recognises that sustainability is vital for securing long-term environmental, economic and social viability and understands its role in contributing to a sustainable future for communities to prosper.
Sustainability at Downer means being a valued contributor to the communities in which it operates, being a responsible employer and minimising the impact the business has on the environment. Downer’s approach to sustainability is intrinsically linked to its business strategy because the sustainability of Downer’s activities is fundamental to the Company’s future success.
Importantly, Zero Harm is embedded in Downer’s culture. Zero Harm means sustaining a work environment that not only supports the health and safety of people, but also minimises the impact that Downer’s operations have on the environment, including through the maximisation of resource efficiency.
As a service provider, Downer’s contribution to sustainability is also achieved by providing its customers with industry leading solutions that drive efficiency thereby reducing the impact that customer operations have on the environment.
Downer works closely with the local communities in which it operates, implementing a range of strategies focusing on social responsibility, local and indigenous employment, cultural heritage management and stakeholder engagement.
In relation to its own workforce, Downer believes its people are its greatest asset. Downer supports and fosters diversity and inclusiveness in the workplace and provides programs that focus on skills development and career pathways.
Governance and Risk Management:
Downer uses a company-wide Risk Management Framework and divisional integrated management systems to identify and manage sustainability issues and opportunities. Downer has been certified (as a minimum) to the following standards: AS/NZS 401 or OHSAS 18001 (for occupational health and safety management systems); ISO 14001 environmental management systems; and IS0 9001 quality management systems.
The Board’s Zero Harm Committee oversees the development and implementation of Downer’s workplace health and safety and environmental management systems. The effectiveness of these systems is monitored through extensive internal and third-party audit programs, with oversight by both the Board Zero Harm and Board Audit and Risk Committees. Other aspects of Downer’s approach to Sustainability are overseen by the Group Diversity Committee and other relevant corporate governance forums.
Downer’s Zero Harm performance during FY17 is summarised below. More comprehensive information is provided in Downer’s 2017 Sustainability Report which will be available on the Downer website.
Health and safety
Health and safety is Downer’s top priority. Downer believes that any injury is unacceptable and preventable and Downer is committed to the pursuit of Zero Harm to its employees, contractors, and those who are directly affected by the Company’s operations. This goal is supported by the strong leadership of Downer’s senior managers who are actively engaged in enabling and empowering Downer’s people to maintain safe working environments for themselves and the community. Downer has a mature safety culture which fosters sustained efforts by everyone in its workplaces to work together to keep each other safe.
Downer’s strategic plan for critical risk management continues to be the key focus of its Zero Harm program. Downer continues to understand and manage the low-likelihood, high-consequence risks – the ‘critical risks’ – that have the potential to cause serious injury to people. Implementation of the plan in FY17 focused on the ongoing evaluation and assurance of the critical controls by multiple layers of management and frontline leaders.
Downer has focused on the development of its frontline leaders, and during FY17 continued to implement its Group-wide Zero Harm Management System Framework’s performance criteria.
Downer continues to show strong performance against the health and safety lag indicators with Lost Time Injury Frequency Rate (LTIFR)1 below 1 and the Total Recordable Injury Frequency Rate (TRIFR)2 below 4. During FY17, LTIFR decreased from 0.66 in FY16 to 0.55 representing a 16.7% decrease in injuries that resulted in time lost. TRIFR increased slightly from 3.32 in FY16 to 3.50. There were no fatalities.
Sustainability Performance Summary 2017
1 Lost time injuries (LTIs) are defined as injuries that cause the injured person (employee or contractor) to be unfit to perform any work duties for one whole day or shift, or more, after the shift on which the injury occurred, and any injury that results, directly or indirectly, in the death of the person. The Lost Time Injury Frequency Rate (LTIFR) is the number of LTIs per million hours worked.
2 TRIFR is the number of LTIs + medically treated injuries (MTIs) for employees and contractors per million hours worked.
For
per
sona
l use
onl
y

110 Downer EDI Limited
Downer received no fines or recorded convictions in FY17 as a result of breaches of occupational health and safety legislation.
0.0
0.2
0.4
0.6
0.8
1.0
1.2
Lost
Tim
e In
juri
es p
er 1,
000,
000
hour
s
Tota
l Rec
orda
ble
Inju
ries
per
1,00
0,00
0 ho
urs
0
2
4
6
8
10
12
TRIFRLTIFR
2010 2011 201520142012 20162013 2017
Environmental Sustainability
Downer’s environmental sustainability performance is measured against the key areas of risk management, compliance, minimising environmental impact and maximising resource efficiency opportunities in its own and its customers’ businesses. Downer’s key focus areas during the year were:
– Managing its top environmental critical risks by verifying that critical controls were in place and effective;
– Incorporating sustainability design principles and initiatives into major projects;
– Increasing employee knowledge and awareness of environmental sustainability practices; and
– Increasing internal and external engagement of Downer’s environmental capability.
There were no significant environmental incidents3 (≥ Level 4) during FY17 which means Downer achieved its Group-wide target of zero Level 54 or Level 65 environmental incidents. However, Downer received four fines in its Australian operations, totalling $34,780, and two fines in New Zealand, totalling NZD$1,500 (see the 2017 Sustainability Report for further details).
Downer operates within a number of highly carbon-intensive industry sectors and recognises that climate change presents a challenge to business, society and the natural environment. Downer is committed to participating in climate change solutions by developing processes and technology to reduce its direct emissions and overall energy consumption.
Downer’s response to climate change requires an integrated approach focusing on compliance, business improvement and business development opportunities. This year, Downer has commenced a review of its climate disclosure practices with the view to aligning with the framework and recommendations of the Taskforce on Climate-related Financial Disclosures (TCFD) for disclosure reporting. Downer has been reporting its annual carbon performance through voluntary disclosure in annual sustainability reports and to CDP for many years.
Downer’s sustainability management has a focus on reducing greenhouse gas (GHG) emissions associated with its operations and provides the framework for identifying energy efficient and carbon abatement opportunities across the Company’s value chain. Climate related risks on major projects are typically assessed by the project owner through various government environmental planning and approvals processes. Downer works in partnership with its customers to address climate related risks by providing leading design, engineering and low carbon solutions.
Reducing GHG emissions and improving energy efficiency are supported by Downer’s business-specific energy management plans that identify opportunities to maximise operational efficiency, as well as manage the Company’s carbon footprint relative to its business activities. These plans include annual targets for GHG emissions reductions (Scopes 1, 2 and defined Scope 36).
In FY17, more than 50 new projects were implemented that have the capacity to deliver 186 terajoules of annualised energy savings, equivalent to the abatement of over 12 kilotonnes of CO
2-e emissions across Scopes 1, 2 and defined Scope 3.
Downer is also one of Australia’s largest and most experienced providers in the renewable energy sector offering design, build and maintenance services for wind farms, wind turbine sites and solar farms. Downer has been involved in the construction of about half the wind turbines built in Australia and has recently worked on the Sunshine Coast, Clare and Ross River solar farms. When the Ross River Solar Farm is completed, Downer will have facilitated the delivery of more than 2.3GW of renewable energy to the Australian market.
3 A significant environmental incident or significant environmental spill (≥Level 4) is any environmental incident or spill where there is significant impact on or material harm to the environment; or a notifiable incident where there is a spill that results in significant impact or material harm; or there is long-term community irritation leading to disruptive actions and requiring continual management attention.
4 A Level 5 environmental incident is defined as any incident that causes significant impact or serious harm on the environment, where “material harm” has occurred and if costs in aggregate exceed $50,000.
5 A Level 6 environmental incident is defined as an incident that results in catastrophic widespread impact on the environment, resulting in irreversible damage.6 Scope 1 emissions are those produced directly by Downer Group activities
Scope 2 emissions are indirect emissions, such as electricity consumption Scope 3 emissions are those that occur from sources not owned or controlled by Downer.
Sustainability Performance Summary 2017 – continuedF
or p
erso
nal u
se o
nly

Annual Report 2017 111
Overview
Downer’s corporate governance framework provides the platform from which:
– The Board is accountable to shareholders for the operations, performance and growth of the Company;
– Downer management is accountable to the Board;
– The risks to Downer’s business are identified and managed; and
– Downer effectively communicates with its shareholders and the investment community.
Downer continues to enhance its policies and processes to promote leading corporate governance practices.
The Board endorses the ASX Corporate Governance Council’s Corporate Governance Principles and Recommendations (ASX Principles).
Principle 1: Lay solid foundations for management and oversight
The Downer Board Charter sets out the functions and responsibilities of the Board and is available on the Downer website at www.downergroup.com.
The Board Charter states that the role of the Board is to provide strategic guidance and to effectively oversee management of the Company. Among other things, the Board is responsible for:
– Overseeing the Company, including its control and accountability systems;
– Appointing and removing the Group CEO and senior executives;
– Monitoring performance of the Group CEO and senior executives; and
– Reviewing, ratifying and monitoring systems of risk management and internal control, codes of conduct and legal compliance.
Before appointing a Director, the Board undertakes appropriate checks and provides shareholders with all material information which is relevant to the decision to elect or re-elect a Director.
Directors receive formal letters of engagement setting out the key terms, conditions and expectations of their engagement.
The Board Charter also describes the functions delegated to management, led by the Group CEO.
The primary goal set for management by the Board is to focus on enhancing shareholder value, which includes responsibility for Downer’s economic, environmental and social performance.
The Group CEO is responsible for the day-to-day management of Downer and his authority is delegated and authorised by the Board.
Downer has written employment agreements with each of its senior executives and the performance of those senior executives is regularly reviewed against appropriate measures, including performance targets linked to the business plan and overall corporate objectives. In 2017, Downer’s senior executives participated in periodic performance evaluations where they received feedback on progress against these targets.
The Company Secretary is responsible for supporting the effectiveness of the Board and is directly accountable to the Board, through the Chairman, on all matters to do with the proper functioning of the Board.
Details of Downer’s Directors and the Executive Leadership Team are available on the Downer website at www.downergroup.com.
Diversity at Downer
Downer is committed to ensuring that it has a diverse and inclusive workforce, which fulfils the expectations of its employees, customers and shareholders while building a sustainable future for its business. This is fomalised through the Downer Diversity & Inclusiveness (D&I) Policy which outlines the Company’s commitment to developing a diverse and inclusive workforce.
In 2016, Downer launched a revised Diversity Framework. The purpose of this framework is to support the D&I Policy and implementation of Divisional D&I strategies.
The Diversity & Inclusiveness Policy is available on the Downer website at www.downergroup.com.
ASX diversity recommendations – diversity statement
This diversity statement outlines Downer’s performance throughout 2017 with respect to its broader diversity program, but with a particular focus on gender, and specifically includes:
– Details of Downer’s key gender representation metrics;
– An overview of the gender diversity initiatives undertaken by Downer throughout 2017; and
– An outline of Downer’s measurable gender diversity objectives for 2018.
Gender representation metrics
As at 30 June 2017, the gender representation metrics were as follows:
– Three of the six Non-executive Directors on the Downer Board are women;
– Women currently make up 13.9% of Senior Executive1 roles;
– 11.1% of Manager2 roles are held by women; and
– Women constitute approximately 13.5% of Downer’s workforce.
1 For present purposes, “Senior Executive” refers to CEO, KMP and Other Executives/General Managers as defined in the Workplace Gender Equality Agency Reference guide to the workplace profile and reporting questionnaire (WGEA Reference Guide).
2 For present purposes, “Manager” refers to CEO, KMP, Other Executives/General Managers, Senior Managers and Other Managers as defined in the WGEA Reference Guide.
Corporate governance for the year ended 30 June 2017
For
per
sona
l use
onl
y

112 Downer EDI Limited
Corporate governance – continuedfor the year ended 30 June 2017
Looking back: 2017 measurable objectives
Objective Outcome
To ensure a coordinated and integrated approach to D&I through the restructuring of the Group Diversity Steering Committee (GDSC) and Divisional Diversity Steering Committees (DDSCs) to ensure the effective implementation of the D&I Plans.
In July 2016, Downer launched a revised Diversity Framework. This framework now includes six DDSCs who report quarterly to the GDSC. The objective of the DDSCs is to support and promote a diverse and inclusive workplace through the implementation of their D&I Plans.
To launch Downer’s Performance Development framework and use output to identify, grow and retain high potential female employees in order to support the following Group targets:
– 20% female workforce by 30 June 2020; and
– 12% female Senior Executives by 30 June 2020.
Regular talent reviews across the business continue to improve visibility of the female talent that we have within Downer. As a result of the Performance Development Review (PDR) process, 8 female employees have participated in Downer’s Executive Development program in the last 18 months. Actions which support female participation and development within the business have also been included in the Divisional D&I Plans.
To launch the Divisional D&I Plans and embed them in the operations of the business units.
Divisional D&I Plans have been drafted and signed-off by the respective leadership teams. These plans have a focus on (but are not limited to) gender. Progress of these plans is reported to the GDSC on a quarterly basis.
To promote and communicate flexible work options (a key enabler of Diversity) through the creation of a business case for sign-off by the Executive Committee.
Downer is committed to adopting a flexible approach to work in order to attract and retain a talented and diverse workforce. With the establishment of the DDSCs, responsibility for workplace flexibility is owned by the Divisions to ensure policies, tools and training in relation to flexible work meet the requirements of their workforce which includes salaried and waged employees.
To implement recommendations identified from the gender pay review
A ‘like for like’ Gender Remuneration Review for salaried employees commenced in December 2015 and has been ongoing. Recommendations implemented as a result of this review include:
– The creation of a gender remuneration action plan;
– Identification of causes for the gaps;
– Reporting of pay equity metrics to the Downer Board and Executive Committee; and
– Correction of like-for-like gaps.
The review remains ongoing.
To continue laying the foundation for Downer’s reconciliation journey by receiving endorsement of Downer’s ‘Reflect’ Reconciliation Action Plan (RAP) from Reconciliation Australia.
Downer is committed to building on its existing relationships with Aboriginal and Torres Strait Islander peoples, their communities and organisations. In September 2016, Downer launched its ‘Reflect’ RAP. Led by a Working Group, this RAP affirms Downer’s commitment to the reconciliation process and provides the Company with a practical framework to focus its efforts over a 12 month period.
To continue the association with Jawun in Australia and Māori based leadership programs in New Zealand
In the 2017 financial year, 12 employees completed secondments at Cape York, the West Kimberley and Inner Sydney as part of the Jawun program. By assisting Aboriginal leaders, organisations and communities to achieve their own development goals, Downer’s people have a unique and rewarding experience while delivering lasting benefits to their host communities. Following the ongoing success of their Māori leadership programs, Downer New Zealand received (in August 2016) the ‘Emerging Diversity & Inclusion Program Award’ at the New Zealand Diversity Awards.
For
per
sona
l use
onl
y

Annual Report 2017 113
Looking ahead: 2018 measurable objectives
– Through the Talent Management & Succession Planning process ensure that identified top female talent (across the Divisions) have active performance and development plans that are tracking to plan.
– Develop tools, policies and training in relation to Flexible Work and pilot within the Rail Division to ensure that individual and business needs are met. Set and monitor targets to measure employee engagement in flexible work and report to the GDSC.
– Review and update Downer’s Parental Leave Policy to include employer funded paid parental leave for secondary carers.
– Following the successful delivery of Downer’s ‘Reflect’ RAP, draft an ‘Innovate’ RAP which includes a focus on cultural learning, Aboriginal and Torres Strait Islander employment and supplier diversity.
– To continue the association with Jawun in Australia and Māori based leadership programs in New Zealand.
– Establish baseline data on Aboriginal & Torres Strait Islander people working at Downer.
Principle 2: Structure the Board to add value
Throughout the 2017 financial year, the Board was comprised of a majority of independent Directors.
The Board is currently comprised of the Chairman (Mike Harding, an independent, Non-executive Director), five other independent, Non-executive Directors and an Executive Director (the Group CEO, Grant Fenn). Details of the members of the Board, including their skills, experience, status and their term of office are set out in the Directors’ Report on pages 2 to 3 and are also available on the Downer website at www.downergroup.com.
The composition of the Board is assessed by the Nominations and Corporate Governance Committee to ensure the Board is of a composition, size and commitment to effectively discharge its responsibilities and duties.
Directors are required to bring an independent judgement to bear on all Board decisions. To facilitate this, it is Downer’s policy to provide Directors with access to independent professional advice at the Company’s expense in appropriate circumstances.
Downer’s Non-executive Directors recognise the benefit of conferring regularly without management present, and they do so at various times throughout the year.
The Board considers that an independent Director is a Non-executive Director who is not a member of management and who is free of any business or other relationship that could (or could reasonably be perceived to) materially interfere with the independent exercise of their judgement. The Board regularly assesses the independence of each Director to ensure that each Director has the capacity to bring an independent judgement to bear on issues before the Board and to act in the best interests of Downer as a whole.
Downer’s governance framework requires each Director to promptly disclose actual and possible conflicts of interest, any interests in contracts, other directorships or offices held, related party transactions and any dealing in the Company’s securities.
At least one Director must retire from office at each Annual General Meeting (AGM). No Non-executive Director can serve more than three years without offering themselves for re-election.
The Chairman of the Board is an independent, Non-executive Director. He is responsible for leadership of the Board and for the efficient organisation and functioning of the Board. The Chairman is appointed by the Board to ensure that a high standard of values, governance and constructive interaction is maintained.
The Chairman facilitates the effective contribution of all Directors and promotes constructive and respectful relations between Directors and the Board and management. He also represents the views of the Board to Downer’s shareholders and conducts the AGM.
The roles of Chairman and Group CEO are not exercised by the same person and the division of responsibilities between the Chairman and the Group CEO have been agreed by the Board and are set out in the Board Charter and Downer’s Delegations Policy.
For
per
sona
l use
onl
y

114 Downer EDI Limited
Corporate governance – continuedfor the year ended 30 June 2017
The Board has established a number of committees to assist the Board to effectively and efficiently execute its responsibilities. A list of the main Board Committees and their current membership is set out in the table below.
Board Committee Chairman Members
Audit and Risk Committee S A Chaplain P S GarlingT G HandicottC G Thorne
Zero Harm Committee C G Thorne S A Chaplain G A FennE A Howell
Nominations and Corporate Governance Committee
R M Harding S A Chaplain T G Handicott
Remuneration Committee T G Handicott P S Garling R M Harding
Disclosure Committee T G Handicott G A FennR M Harding
Rail Projects Committee P S Garling G A Fenn T G Handicott R M Harding
Tender Risk Evaluation Committee C G Thorne G A Fenn T G Handicott R M HardingE A Howell
The names of members of each committee, the number of meetings and the attendances by each of the members of the various committees to which they are appointed is set out in the Directors’ Report on page 18.
The Tender Risk Evaluation Committee’s primary purpose is to oversee tenders and contracts that exceed the delegation of the Group CEO. The Tender Risk Evaluation Committee is chaired by an independent Director and comprises five members, including the Group CEO. Meetings of the Tender Risk Evaluation Committee are convened as required to review tender opportunities.
The Board has established the Nominations and Corporate Governance Committee to oversee the practices for selection and appointment of Directors of the Company.
The Nominations and Corporate Governance Committee’s primary purpose is to support and advise the Board on fulfilling its responsibilities to shareholders by ensuring that the Board is comprised of individuals who are best able to discharge the responsibilities of Directors having regard to the law and leading governance practice.
The Nominations and Corporate Governance Committee has a charter which sets out its roles and responsibilities, composition, structure, membership requirements and the procedures for inviting non-committee members to attend meetings. The Nominations and Corporate Governance Committee Charter gives the Nominations and Corporate Governance Committee access to internal and external resources, including advice from external consultants and specialists. The Nominations and Corporate Governance Committee Charter is available on the Downer website at www.downergroup.com.
The Nominations and Corporate Governance Committee, all members of which are independent Directors, is chaired by an independent Director and has a minimum of three members.
The Committee’s responsibilities include:
– Assessing the skills and competencies required on the Board;
– Assessing the extent to which the required skills are represented on the Board;
– Establishing processes for the review of the performance of individual Directors and the Board as a whole;
– Establishing processes for identifying suitable candidates for appointment to the Board (including undertaking a formal due diligence screening process); and
– Recommending the engagement of nominated persons as Directors.
For
per
sona
l use
onl
y

Annual Report 2017 115
When appointing Directors, the Nominations and Corporate Governance Committee aims to ensure that an appropriate balance of skills, experience, expertise and diversity is represented on the Board. This may result in a non-executive Director with a longer tenure remaining in office so as to bring that experience and depth of understanding to matters brought before the Board.
Given the breadth of Downer’s service offerings across a range of markets, the Board seeks to ensure that it maintains an appropriate range of technical skills across engineering, geology, construction and scientific disciplines when considering the appointment of a new Director. The Board also identified that the review of major tender bids and the successful delivery of major projects also requires Directors with strong commercial and legal acumen. It is for this reason that in undertaking the selection process for its most recently appointed director, the Board selected a candidate with over 30 years’ experience in the legal profession.
The chart below illustrates the balance achieved with the current Board composition. The Company recognises the value of diversity which has been a component of the appointment process over the past few years.
Professional qualifications
Business and economics
Humanities
1.0 2.0 3.0 4.0
Professional qualifications
0.0 5.0
Technical*
Legal
*Comprises construction, engineering, metallurgy and science.
Industry experience
1.0 2.0 3.0 4.00.0 5.0
Professional Services*
Transport and infrastructure
Resources
*Includes banking, finance and legal.
Tenure in years
9+
3–6
1.0 2.0 3.00.0
6–9
0–3
Gender diversityGender diversity
Male Female
3
4
From time to time, Downer engages external specialists to assist with the selection process as necessary, and the Chairman, Board and Group CEO meet with nominees as part of the appointment process.
Nominations for re-election of Directors are reviewed by the Nominations and Corporate Governance Committee and Directors are re-elected in accordance with the Downer Constitution and the ASX Listing Rules.
As part of its commitment to leading corporate governance practice, the Board undertakes improvement programs, including externally facilitated periodic reviews of its performance and that of its Committees and Directors. The last review was completed during FY16.
The Company has formal induction procedures for both Directors and senior executives. These induction procedures have been developed to enable new Directors and senior executives to gain an understanding of:
– Downer’s financial position, strategies, operations and risk management policies;
– The respective rights, duties and responsibilities and roles of the Board and senior executives; and
– Downer’s culture and values.
Directors are given an induction briefing by the Company Secretary and an induction pack containing information about Downer and its business, Board and Committee charters and Downer Group policies. New Directors also meet with key senior executives to gain an insight into the Company’s business operations and the Downer Group structure.
Directors are encouraged to continually build on their exposure to the Company’s business and a formal program of Director site visits has been in place since 2009. Directors are also encouraged to attend appropriate training and professional development courses to update and enhance their skills and knowledge and the Company Secretary regularly organises governance and other continuing education sessions for the Board.
The Board is provided with the information it needs to discharge its responsibilities effectively. The Directors also have access to the Company Secretary for all Board and governance-related issues and the appointment and removal of the Company Secretary is determined by the Board. The Company Secretary is accountable to the Board, through the Chair, on all governance matters.
For
per
sona
l use
onl
y

116 Downer EDI Limited
Corporate governance – continuedfor the year ended 30 June 2017
Principle 3: Promote ethical and responsible decision-making
Downer strives to attain the highest standards of behaviour and business ethics when engaging in corporate activity. The Downer Standards of Business Conduct sets the ethical tone and standards of the Company and deals with matters such as:
– Compliance with the letter and the spirit of the law; – Workplace behaviour; – Prohibition against bribery and corruption; – Protection of confidential information; – Engaging with stakeholders; – Workplace safety; – Diversity and inclusiveness; – Sustainability; and – Conflicts of interest.
Downer has a formal whistleblower policy and procedures for reporting and investigating breaches of the Standards of Business Conduct. This includes the Our Voice service, an external and independent reporting service which enables employees to anonymously report potential breaches of the Standards of Business Conduct, including misconduct or other unethical behaviour. Reports received through Our Voice are investigated where appropriate, with the Company Secretary overseeing the completion of any remedial action.
The Standards of Business Conduct applies to all officers and employees and is available on the Downer website at www.downergroup.com.
Downer endorses leading governance practices and has in place policies setting out the Company’s approach to various matters, including:
– Securities trading (stipulating ‘closed periods’ for designated employees and a formal process which employees must adhere to when dealing in securities);
– The Company’s disclosure obligations (including continuous disclosure);
– Communicating with shareholders and the general investment community; and
– Privacy.
Downer has an Anti-Bribery and Corruption Policy which expands upon the prohibition against bribery and corruption currently contained in the Standards of Business Conduct, and which addresses key issues such as working with government, political donations, human rights, conducting business internationally and gifts and benefits. As Downer has operations in foreign jurisdictions, Downer employees are confronted by the challenges of doing business in environments where bribery and corruption are real risks. However, regardless of the country or culture within which its people work, Downer is committed to compliance with the law, as well as maintaining its reputation for ethical practice.
These policies are available on the Downer website at www.downergroup.com.
Principle 4: Safeguard integrity in financial reporting
The Company has in place a structure of review and authorisation which independently verifies and safeguards the integrity of its financial reporting.
The Audit and Risk Committee assists the Board to fulfil its responsibilities relating to:
– The quality and integrity of the accounting, auditing and reporting practices of the Company with a particular focus on the qualitative aspects of financial reporting to shareholders;
– The Company’s risk profile and risk policies; and
– The effectiveness of the Company’s system of internal control and framework for risk management.
The Audit and Risk Committee is structured so that it:
– Consists of only Non-executive Directors;
– Consists of a majority of independent Directors;
– Is chaired by an independent Chairman (who is not the Chairman of the Board); and
– Has at least three members.
The Audit and Risk Committee currently comprises only independent Directors, includes members who are financially literate and has at least one member who has relevant qualifications and experience.
The Audit and Risk Committee Charter sets out the Audit and Risk Committee’s role and responsibilities, composition, structure and membership requirements and the procedures for inviting non-committee members to attend meetings.
The Board receives assurances from the Group CEO and the Group CFO that the declarations provided to it in relation to the annual and half-year financial statements, in accordance with sections 295A and 303(4) of the Corporations Act 2001 (Cth) are founded on a sound system of risk management and internal control and that the system is operating effectively in all material respects in relation to financial reporting risks.
Downer’s external auditor attends the Company’s AGMs and is available to answer any questions which shareholders may have about the conduct of the external audit for the relevant financial year and the preparation and content of the Audit Report.
Information regarding the number of times the Audit and Risk Committee convened in FY17, together with the individual attendances of members at the meetings, is set out in the Directors’ Report on page 18.
The Audit and Risk Committee Charter is available on the Downer website at www.downergroup.com.
For
per
sona
l use
onl
y

Annual Report 2017 117
Principle 5: Make timely and balanced disclosure
The Company’s Disclosure Policy sets out processes which assist the Company to ensure that all investors have equal and timely access to material information about the Company and that Company announcements are factual and presented in a clear and balanced way. A copy of the Disclosure Policy is available on the Downer website at www.downergroup.com.
The Disclosure Policy also sets out the procedures for identifying and disclosing material and market-sensitive information in accordance with the Corporations Act 2001 (Cth) and the ASX Listing Rules.
Downer’s Disclosure Committee consists of two independent, Non-executive Directors (one of which is the Chairman of the Board) and the Group CEO. The Disclosure Committee oversees disclosure of information by the Company to the market and the general investment community.
Principle 6: Respect the rights of shareholders
Downer empowers its shareholders by:
– Communicating effectively, openly and honestly with shareholders;
– Giving shareholders ready access to balanced and understandable information about the Company and its governance; and
– Making it easy for shareholders to participate in general meetings.
The Downer Communication Policy sets out the Company’s approach to communicating with shareholders and is available on the Downer website at www.downergroup.com.
The Company publishes corporate information on its website (www.downergroup.com), including Annual and Half Year Reports, ASX announcements, investor updates and media releases.
Downer encourages shareholder participation at AGMs through its use of electronic communication, including by making notices of meetings available on its website and audio casting of general meetings and significant Group presentations.
The Directors and key members of management attend the Company’s AGMs and are available to answer questions.
Principle 7: Recognise and manage risk
To mitigate the risks that arise through its activities, Downer has various risk management policies and procedures in place that cover (among other matters) interest rate management, foreign exchange risk management, credit risk management, tendering and contracting risk and project management.
Downer has controls at the Board, executive and business unit levels that are designed to safeguard Downer’s interests and ensure the integrity of reporting (including accounting, financial reporting, environment and workplace health and safety policies and procedures). These controls are designed to ensure that Downer complies with legal and regulatory requirements, as well as community standards.
Downer has a Risk Management Framework in place to enable business risks to be identified, evaluated and managed. The Board ratifies Downer’s approach to managing risk and oversees Downer’s Risk Management Framework, including the Group risk profile and the effectiveness of the systems being implemented to manage risk. The last comprehensive review of the Risk Management Framework was completed in 2016. However, the Board reviews the Group risk profile twice each year, undertakes a facilitated risk workshop annually, and considers other risk matters, such as business resilience, tender review processes, risk appetite, and specific risk areas, on a regular basis, as well as regular reports from senior management, the internal audit team, and the external auditor.
Downer’s annual Sustainability Report provides a detailed overview of Downer’s approach to managing its environmental sustainability and social sustainability risks. The 2016 Sustainability Report is available on the Downer website at www.downergroup.com.
The Company’s internal audit function objectively evaluates and reports on the existence, design and operating effectiveness of internal controls. Downer’s internal audit team is independent of the external auditor and reports to the Audit and Risk Committee.
Downer’s Audit and Risk Committee assists the Board in its oversight of Downer’s risk profile and risk policies, the effectiveness of the systems of internal control and Risk Management Framework and Downer’s compliance with applicable legal and regulatory obligations. The Audit and Risk Committee Charter is available on the Downer website at www.downergroup.com.
Management reports regularly to the Audit and Risk Committee on the effectiveness of Downer’s management of its material business risks and on the progress of mitigation treatments.
For
per
sona
l use
onl
y

118 Downer EDI Limited
Corporate governance – continuedfor the year ended 30 June 2017
Principle 8: Remunerate fairly and responsibly
The Board has established a Remuneration Committee and has adopted the Remuneration Committee Charter which sets out its role and responsibilities, composition, structure and membership requirements and the procedures for inviting non-committee members to attend meetings.
The Remuneration Committee is responsible for reviewing and making recommendations to the Board about:
– Executive remuneration and incentive policies;
– The remuneration, recruitment, retention, performance measurement and termination policies and procedures for all senior executives reporting directly to the Group CEO;
– Executive and equity-based incentive plans; and
– Superannuation arrangements and retirement payments.
Remuneration of the Group CEO, executive directors and non-executive directors forms part of the responsibilities of the Nominations and Corporate Governance Committee.
Downer’s remuneration policy is designed to motivate senior executives to pursue the long-term growth and success of the Company and prescribes a relationship between the performance and remuneration of senior executives.
The Remuneration Committee is structured so that it:
– Consists of a majority of independent Directors;
– Is chaired by an independent Director; and
– Has at least three members.
Currently no Executive Director is a member of the Remuneration Committee.
The maximum aggregate fee approved by shareholders that can be paid to Non-executive Directors is $2.0 million per annum. This cap was approved by shareholders on 30 October 2008. Further details about remuneration paid to Non-executive Directors are set out in the Remuneration Report at page 20.
The Company’s previous Constitution allowed for retiring Non-executive Directors to receive a retiring allowance, subject to the limitations set out in the Corporations Act 2001 (Cth). Consistent with the ASX Principles, the right to retirement benefits was frozen in 2005. However, because remuneration arrangements for some Non-executive Directors were in place prior to 2005, where such retirement benefits have been paid they have been fully provided for in the financial statements. Directors entitled to a retirement benefit were paid a reduced fee and once a Director’s accumulated reduction in base fees reached the value of the retirement benefit, the applicable base fee reverted to the general fee level. This was applied to Mr Humphrey from 1 July 2009 who retired in November 2016. No retirement benefit has been offered to any current Non-executive Director.
Non-executive Directors do not participate in any equity incentive schemes.
The remuneration structure for Executive Directors and senior executives is designed to achieve a balance between fixed and variable remuneration taking into account the performance of the individual and the performance of the Company. Executive Directors receive payment of equity-based remuneration as short and long-term incentives.
Executive Directors and senior executives are prohibited from entering into transactions in associated products which limit the economic risk of participating in unvested entitlements under any of the Company’s equity-based remuneration schemes.
Further details about the remuneration of Executive Directors and senior executives are set out in the Remuneration Report at page 20 and details of Downer shares beneficially owned by Directors are provided in the Directors’ Report at page 4.
For
per
sona
l use
onl
y

Annual Report 2017 119
Downer shareholders
Downer had 17,756 ordinary shareholders as at 30 June 2017.
The largest shareholder, HSBC Custody Nominees (Australia) Limited, holds 34.18% of the 594,702,512 fully paid ordinary shares issued at that date. Downer has 15,942 shareholders with registered addresses in Australia.
Securities exchange listing
Downer is listed on the Australian Securities Exchange (ASX) under the “Downer EDI” market call code 3965, with ASX code DOW, and is an overseas listed issuer on the New Zealand Exchange with the ticker code DOW NZ.
Company information
The Company’s website www.downergroup.com offers comprehensive information about Downer and its services. The site also contains news releases and announcements to the ASX and NZX, financial presentations, Annual Reports, Half Year Reports and company newsletters. Downer printed communications for shareholders include the Annual Report which is available on request.
Dividends
Dividends are determined by the Board having regard to a range of circumstances within the business operations of Downer including operating profit and capital requirements. The level of franking on dividends is dependent on the level of taxes paid to the Australian Taxation Office by Downer and its incorporated joint ventures.
International shareholders can use Computershare’s Global Payments System to receive dividend payments in the currency of their choice at a nominal cost to the shareholder.
Dividend reinvestment plan
Downer’s Dividend Reinvestment Plan (DRP) is a mechanism to allow shareholders to increase their shareholding in the Company without the usual costs associated with share acquisitions, such as brokerage. Details of the DRP are available from the Company’s website or the Easy Update website at www.computershare.com.au/easyupdate/dow.
Share registry
Shareholders and investors seeking information about Downer shareholdings or dividends should contact the Company’s share registry, Computershare Investor Services Pty Ltd (Computershare):
Level 5 115 Grenfell Street Adelaide SA 5000
GPO Box 1903 Adelaide SA 5001
Tel: 1300 556 161 (within Australia) +61 3 9415 4000 (outside Australia)
Fax: 1300 534 987 (within Australia) +61 3 9473 2408 (outside Australia)
www.computershare.com
Shareholders must give their holder number (SRN/HIN) when making inquiries. This number is recorded on issuer sponsored and CHESS statements.
Updating your shareholder details
Shareholders can update their details (including bank accounts, DRP elections, tax file numbers and email addresses) online at www.computershare.com.au/easyupdate/dow.
Shareholders will require their holder number (SRN/HIN) and postcode to access this site.
Tax file number information
Providing your tax file number to Downer is not compulsory. However, for shareholders who have not supplied their tax file number, Downer is required to deduct tax at the top marginal rate plus Medicare levy from unfranked dividends paid to investors residing in Australia. For more information please contact Computershare.
Lost issuer sponsored statement
You are advised to contact Computershare immediately, in writing, if your issuer sponsored statement has been lost or stolen.
Information for Investors for the year ended 30 June 2017
For
per
sona
l use
onl
y

120 Downer EDI Limited
Information for Investors – continuedfor the year ended 30 June 2017
Annual Report mailing list
Shareholders must elect to receive a Downer Annual Report by writing to Computershare Investor Services Pty Ltd at the address provided. Alternatively shareholders may choose to receive this publication electronically.
Change of address
So that we can keep you informed, and protect your interests in Downer, it is important that you inform Computershare of any change of your registered address.
Registered office and principal administration office
Downer EDI Limited Level 2, Triniti III Triniti Business Campus 39 Delhi Road North Ryde NSW 2113
Tel: +61 2 9468 9700 Fax: +61 2 9813 8915
Auditor
KPMG International Towers Sydney 3 300 Barangaroo Avenue Sydney NSW 2000
Australian securities exchange information as at 30 June 2017
Number of holders of equity securities:
Ordinary share capital
594,702,512 fully paid listed ordinary shares were held by 17,756 shareholders. All issued ordinary shares carry one vote per share.
Substantial shareholders
The following shareholders have notified that they are substantial shareholders of Downer as at 30 June 2017.
ShareholdersOrdinary
shares held% of issued
shares
Dimensional Fund Advisors 30,507,546 5.13
AustralianSuper Pty Ltd 30,148,052 5.07
Distribution of holders of quoted equity securities
Shareholder distribution of quoted equity securities as at 30 June 2017 is as follows.
Range of holdingsNumber of
Shareholders Shareholders
%Ordinary
shares heldShares
%
1 – 1,000 10,135 57.08 4,355,027 0.73
1,001 – 5,000 5,815 32.75 13,496,350 2.27
5,001 – 10,000 1,053 5.93 7,644,968 1.29
10,001 – 100,000 693 3.90 14,831,146 2.49
100,001 and over 60 0.34 554,375,021 93.22
Total 17,756 594,702,512 100.00
Holding less than a marketable parcel of shares
890
For
per
sona
l use
onl
y

Annual Report 2017 121
Twenty largest shareholders
Downer’s 20 largest shareholders of ordinary fully paid shares as at 30 June 2017 are as follows.
Shareholders Shares held% of issued
shares
HSBC Custody Nominees (Australia) Limited 203,278,049 34.18
Chase Manhattan Nominees Limited 132,725,455 22.32
Citicorp Nominees Pty Ltd 94,988,046 15.97
National Nominees Limited 49,018,513 8.24
BNP Paribas Nominees Pty Ltd – Agency Lending DRP A/C 15,373,022 2.58
Citicorp Nominees Pty Limited – Colonial First State Inv A/C 11,790,456 1.98
BNP Paribas Noms Pty Ltd <DRP> 11,573,160 1.95
CPU Share Plans Pty Limited 5,315,344 0.89
HSBC Custody Nominees (Australia) Limited <NT- Commonwealth Super Corp A/C> 5,298,545 0.89
RBC Investor Services Australia Nominees Pty Ltd <VFA A/C> 2,928,660 0.49
AMP Life Ltd 2,165,170 0.36
SBN Nominees Pty Limited <10004 Account> 2,162,800 0.36
Argo Investments Ltd 1,809,538 0.30
UBS Nominees Pty Ltd 1,478,890 0.25
Equity Trustees Limited – <ESF Aust Equity Portfolio> 1,307,104 0.22
Buttonwood Nominees Pty Ltd 1,156,265 0.19
National Nominees Limited <DB A/C> 1,030,897 0.17
Mr Barry Sydney Patterson + Mrs Glenice Margaret Patterson 891,642 0.15
EQT Wealth Services Limited <Common Fund 103 A/C> 805,569 0.14
BNP Paribus Noms (NZ) Ltd <DRP> 770,090 0.13
Total for top 20 shareholders 545,867,215 91.76
On-market share buy-back
On 5 August 2014, the Board resolved to undertake an ongoing share buy-back program that commenced on 20 August 2014. The total number of shares acquired was 2,716,761. The Board determined to continue the share buy-back program with a further share buy-back program that commenced on 4 September 2015 and ended on 1 September 2016. The total number of shares acquired was 7,898,010.
For
per
sona
l use
onl
y

122 Downer EDI Limited
This page has been intentionally left blank.
For
per
sona
l use
onl
y

Annual Report 2017 123
This page has been intentionally left blank.
For
per
sona
l use
onl
y

124 Downer EDI Limited
This page has been intentionally left blank.
For
per
sona
l use
onl
y

DOWNER EDI LIMITED
Level 2, Triniti III Triniti Business Campus 39 Delhi Road North Ryde NSW 2113 Australia
T +61 2 9468 9700 F +61 2 9813 8915
ABN 97 003 872 848
For
per
sona
l use
onl
y

www.downergroup.com
Dow
ner Annual Report 2017
For
per
sona
l use
onl
y

Media/ASX and NZX Release 29 August 2017
DOWNER REPORTS NET PROFIT AFTER TAX OF $181.5 MILLION Downer EDI Limited (Downer) today announced its financial results for the 12 months to 30 June 2017.
The following highlights from these results do not include any contribution from Spotless1:
Net profit after tax (NPAT) of $181.5 million, up from $180.6 million;
Total revenue of $7.8 billion, up 5.7%;
Earnings before interest and tax (EBIT) of $277.8 million, up 0.3%;
Operating cash flow of $441.6 million, representing cash conversion of 103.1% of earnings before interest, tax, depreciation and amortisation (EBITDA);
Work-in-hand of $22.5 billion, up from $21.1 billion at 31 December 2016; and
Lost Time Injury Frequency Rate of 0.55 per million hours worked; Total Recordable Injury Frequency Rate of 3.50 per million hours worked.
Gearing, including Spotless, was 14.7% (17.7% including off-balance sheet debt) with available liquidity of $2.0 billion comprising cash of $844.6 million and undrawn committed facilities of $1.2 billion.
The Chief Executive Officer of Downer, Grant Fenn, said it was very pleasing that Downer again exceeded its full year guidance with increases in total revenue, EBIT and NPAT.
“Our Transport service line performed strongly with highlights including the success of our New Zealand operations in securing a high proportion of long term network management contracts and the acquisition of RPQ in Australia, which provides improved geographic and product coverage for our surfacing and asphalt businesses.
“We won several new infrastructure projects during the year including Newcastle Light Rail, the NSW Transport Access Program and the High Capacity Metro Trains depots in Melbourne.
“The outlook for Transport is very positive with increasing demand for product innovation, smart asset management and intelligent infrastructure. The growth in transport infrastructure investment will provide a buoyant market for a number of years in construction and product supply.”
1 On 21 March 2017, Downer announced an offer, through its wholly owned subsidiary Downer EDI Services Pty Ltd, to acquire all of the issued share capital of Spotless Group Holdings Limited (Spotless) which it did not already own. On 27 June 2017, Downer’s ownership interest in Spotless exceeded 50%, requiring the consolidation of Spotless’ financial statements from that time. The profit or loss and cash flow impact attributable to Spotless for the three days to 30 June 2017 is not material to the Downer Group and therefore no revenue, EBIT or operating cash flow contribution from Spotless is included in these results.
Downer EDI Limited ABN 97 003 872 848
Triniti Business Campus 39 Delhi Road
North Ryde NSW 2113
1800 DOWNER www.downergroup.com
F
or p
erso
nal u
se o
nly

Mr Fenn said a strong performance on nbnTM contracts was the prime driver of EBIT growth in Utilities, which includes Downer’s power, gas, water, communications and renewable energy businesses.
“Privatisation, contestability and business improvement will be a consistent theme across all distribution networks in Australia and New Zealand, and Downer has an unmatched position,” he said.
The freight rail market has been tough in recent years, however State Governments have been investing in new rolling stock and during the year Downer was successful in securing the High Capacity Metro Trains project in Victoria and the Sydney Growth Trains project in New South Wales.
“These major Rail projects are progressing well,” Mr Fenn said, “and we also continue to perform well on the Waratah and Millennium maintenance contracts.”
Keolis Downer’s Melbourne and Gold Coast light rail operations also performed well and during the year the joint venture was awarded the contract to operate an integrated public transport system for the city of Newcastle.
Mr Fenn said the Gorgon and Wheatstone projects made strong contributions to the Engineering, Construction & Maintenance result and Downer had secured new contracts at Ichthys and Prelude.
“We are now a major provider of services on Ichthys with around 600 people on the project and we are continuing to ramp up,” he said.
Mr Fenn said the Hawkins acquisition in New Zealand brought significant technical capability and was a very exciting addition to the Group.
The reduction in Mining revenue and EBIT was predominantly due to the expiry of the Christmas Creek contract in September 2016 and there will be a full year impact attributable to Christmas Creek in 2018.
“Our cash flow performance, with cash conversion of 103.1%, was again outstanding, Mr Fenn said.
“Importantly, we continue to perform well against key health and safety indicators due to our ongoing focus on critical risk management which is a central element of our Zero Harm program.
“Overall, this is a strong result that reflects the success of our strategy to focus on growth in public infrastructure and service delivery.” Downer reports its financial results under five service lines and the performance of each service line, compared with the previous corresponding period, is summarised below: Transport Utilities Total revenue of $2.2 billion, up 16.4% Total revenue of $1.5 billion, up 19.1% EBIT of $124.6 million, up 20.2% EBIT of $84.1 million, up 17.8% Work-in-hand of $6.3 billion Work-in-hand of $3.6 billion Rail Engineering, Construction & Maintenance Total revenue of $850.2 million, up 2.9% Total revenue of $2.0 billion, up 6.2% EBIT of $30.3 million, up 110.4% EBIT of $52.3 million, up 8.5% Work-in-hand of $8.0 billion Work-in-hand of $2.6 billion Mining Total revenue of $1.3 billion, down 18.5% EBIT of $83.4 million, down 35.8% Work-in-hand of $2.0 billion
Page 2 of 3
For
per
sona
l use
onl
y

Spotless
Downer announced a takeover offer for Spotless on 21 March 2017 and Downer currently owns 87.8% of Spotless.
Spotless announced its financial results for the 12 months to 30 June 2017 on 24 August 2017 and these results were in line with Downer’s expectations.
Downer will report the financial results of Spotless as a separate service line from the 2018 financial year onwards.
Dividend
The Downer Board resolved to pay a fully franked final dividend of 12.0 cents per share (12.0 cents per share in the prior corresponding period), payable on 10 October 2017 to shareholders on the register at 12 September 2017. The company’s Dividend Reinvestment Plan (DRP) remains suspended and will not operate for this dividend.
Outlook
With the acquisition of Spotless, the Downer Group is now well positioned for expected growth in the transport infrastructure, health, education, corrections, defence, utilities and other government service markets across Australia and New Zealand. The Group’s strong competitive position in all of its major markets, coupled with market growth, is driving significant opportunities across all businesses. Excluding Spotless earnings and any costs or synergies related to the acquisition, Downer is targeting NPAT of around $190 million for the 2018 financial year, an increase of 5%. In its Target’s Statement dated 27 April 2017, the Spotless Board provided earnings guidance of between $85 million and $100 million NPAT for the 2018 financial year2. Once Downer completes its review of the Spotless business planning, budgeting and target setting process, updated guidance will be provided for the entire Downer Group, including Spotless.
For further information please contact:
Michael Sharp, Group Head of Corporate Affairs and Investor Relations +61 439 470145
Downer EDI Limited (Downer) is a leading provider of services to customers in markets including: Transport; Utilities; Rail; Engineering, Construction & Maintenance and Mining. We build strong relationships of trust with our customers, truly understanding and predicting their needs and bringing them world leading insights and solutions. Downer employs about 20,000 people across more than 200 sites and projects, mostly in Australia and New Zealand, but also in the Asia-Pacific region, South America and Southern Africa. For more on Downer, visit: www.downergroup.com
2 For further information regarding the basis of preparation of this guidance, including key assumptions and other discussion, see section 5.4 and section 7 of Spotless’ Target’s Statement dated 27 April 2017
Page 3 of 3
For
per
sona
l use
onl
y
Downer Full Year Results | 29 August 2017 INVESTOR PRESENTATION
For
per
sona
l use
onl
y

INTRODUCTION
Downer’s financial results for the 12 months to 30 June 2017 incorporate the financial statements of Spotless Group Holdings Limited (Spotless) as Downer’s interest in Spotless exceeded 50% on 27 June 2017. The table below shows where Spotless is either included or excluded from Downer’s key metrics.
2
Spotless
Profit or loss Excluded
Operating cash flow Excluded
Work-in-hand Excluded
LTIFR/TRIFR Excluded
Balance sheet Included
Gearing Included
ROFE Included
Investing/financing cash flow Costs associated with Spotless transaction included
For
per
sona
l use
onl
y

OVERVIEW
Total revenue1 $7,812 million, up 5.7%
1 Total revenue is a non-statutory disclosure and includes revenue from joint ventures and other alliances and other income.
2 Work-in-hand numbers are unaudited.
3 Adjusted for the mark-to-market of derivatives and deferred finance charges.
4 Gearing = Net debt / net debt + equity. Gearing including off-balance sheet debt based on present value of plant and equipment operating leases discounted at 10% pa: $151.5m (June 2016: $128.5m).
5 Lost Time Injury Frequency Rate - the number of lost time injuries (LTIs) per million hours worked.
6 Total Recordable Injury Frequency Rate – the number of LTIs and medically treated injuries per million hours worked.
Net Profit After Tax (NPAT) $181.5 million, up 0.5%
Earnings Before Interest and Tax (EBIT) $277.8 million, up 0.3%
Operating cash flow $441.6 million, EBITDA conversion 103.1%
Net debt3 $620.2 million (including $787.5 million from Spotless)
Final dividend declared: 12.0 cps, 100% franked no Dividend Reinvestment Plan
LTIFR5 of 0.55, TRIFR6 of 3.50
Gearing4 (including Spotless) 14.7%, 17.7% including off balance sheet debt
3
Work in hand2 $22.5 billion, up from $21.1 billion at 31 December 2016
Liquidity of $2.0 billion
For
per
sona
l use
onl
y

TRANSPORT
OPPORTUNITIES
1 Total revenue includes joint ventures and other income.
2 ROFE = EBIT divided by average funds employed (AFE). AFE = Average Opening and Closing Net Debt + Equity.
Total revenue1 $m EBIT margin EBIT $m ROFE2
124.6 103.7
020406080
100120140
FY17 FY16
5.8% 5.6%
0.0%
1.0%
2.0%
3.0%
4.0%
5.0%
6.0%
FY17 FY16
22.2% 19.3%
0%
5%
10%
15%
20%
25%
FY17 FY16
2,153.4 1,849.5
0
500
1,000
1,500
2,000
2,500
FY17 FY16
4
New projects include Newcastle Light Rail, NSW Transport Access Program and HCMT depot (Victoria) Good performance from New Zealand, including Kaikoura earthquake recovery works Strong contribution from bituminous products Bolt on acquisitions, e.g. RPQ, have broadened geographical presence and capability mix
For
per
sona
l use
onl
y

UTILITIES
1 Total revenue includes joint ventures and other income.
2 ROFE = EBIT divided by average funds employed (AFE). AFE = Average Opening and Closing Net Debt + Equity.
Total revenue1 $m EBIT margin EBIT $m ROFE2
1,517.3 1,274.3
0200400600800
1,0001,2001,4001,600
FY17 FY16
84.1 71.4
0
20
40
60
80
100
FY17 FY16
5.5% 5.6%
0%
1%
2%
3%
4%
5%
6%
FY17 FY16
22.7%
18.6%
0%
5%
10%
15%
20%
25%
FY17 FY16
5
Strong contribution from nbnTM contracts with increased volumes Increased activity in renewable energy – market very competitive Good performance from New Zealand Acquisition of ITS Pipetech provides entry into growing market for pipeline rehabilitation
For
per
sona
l use
onl
y
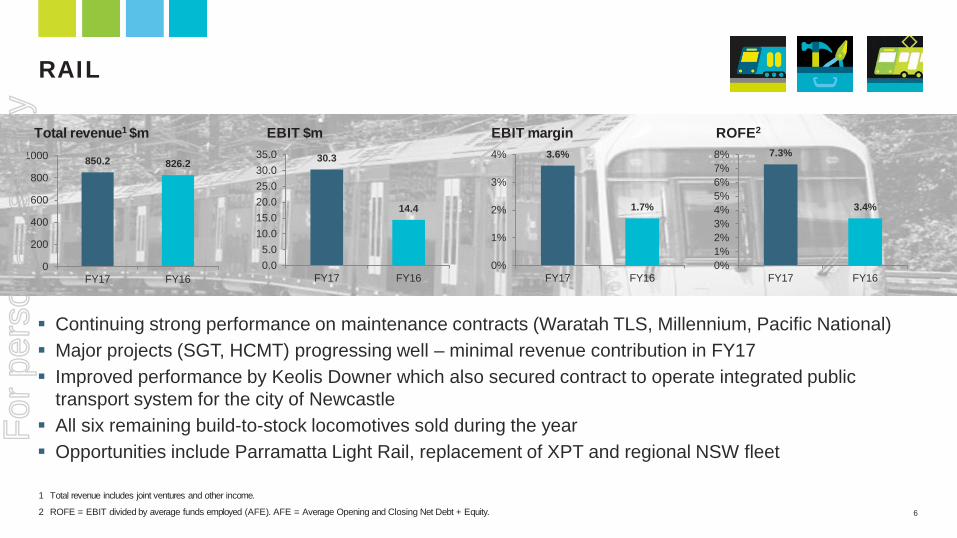
RAIL
1 Total revenue includes joint ventures and other income.
2 ROFE = EBIT divided by average funds employed (AFE). AFE = Average Opening and Closing Net Debt + Equity.
Total revenue1 $m EBIT margin EBIT $m ROFE2
850.2 826.2
0
200
400
600
800
1000
FY17 FY16
30.3
14.4
0.05.0
10.015.020.025.030.035.0
FY17 FY16
3.6%
1.7%
0%
1%
2%
3%
4%
FY17 FY16
7.3%
3.4%
0%1%2%3%4%5%6%7%8%
FY17 FY16
6
Continuing strong performance on maintenance contracts (Waratah TLS, Millennium, Pacific National) Major projects (SGT, HCMT) progressing well – minimal revenue contribution in FY17 Improved performance by Keolis Downer which also secured contract to operate integrated public
transport system for the city of Newcastle All six remaining build-to-stock locomotives sold during the year Opportunities include Parramatta Light Rail, replacement of XPT and regional NSW fleet
For
per
sona
l use
onl
y

1 Total revenue includes joint ventures and other income.
2 ROFE = EBIT divided by average funds employed (AFE). AFE = Average Opening and Closing Net Debt + Equity.
Total revenue1 $m EBIT margin EBIT $m ROFE2
52.3 48.2
0.0
10.0
20.0
30.0
40.0
50.0
60.0
FY17 FY16
2.6% 2.6%
0%
1%
2%
3%
FY17 FY16
22.9% 22.9%
0%
5%
10%
15%
20%
25%
FY17 FY16
2,004.3
1,887.1
0
500
1000
1500
2000
2500
FY17 FY16
ENGINEERING, CONSTRUCTION & MAINTENANCE
7
Strong performance at Gorgon and Wheatstone – new contracts secured at Ichthys and Prelude Long term maintenance contracts with Chevron, ConocoPhillips, Santos and Origin Process engineering led EPC projects Acquisition of Hawkins provides entry into growing New Zealand non-residential building market F
or p
erso
nal u
se o
nly

MINING
1 Total revenue includes joint ventures and other income.
2 ROFE = EBIT divided by average funds employed (AFE). AFE = Average Opening and Closing Net Debt + Equity.
Total revenue1 $m EBIT margin EBIT $m ROFE2
1,300.2
1,595.2
0
500
1,000
1,500
2,000
FY17 FY16
83.4
130.0
020406080
100120140
FY17 FY16
6.4%
8.1%
0%
2%
4%
6%
8%
10%
FY17 FY16
13.2%
19.0%
0%
5%
10%
15%
20%
FY17 FY16
8
Conclusion of Christmas Creek contract Two year extension to Meandu Mine contract (to June 2020) Four year extension to Karara Mining contract (to March 2022) Boggabri contract to conclude at end of November 2017
For
per
sona
l use
onl
y

SPOTLESS
9
Total revenue $m Underlying EBIT margin Underlying EBIT $m
3,006.3
3,176.1
0500
1,0001,5002,0002,5003,0003,500
FY17 FY16
161.5
221.8
0
50
100
150
200
250
FY17 FY16
5.4%
7.0%
0%
2%
4%
6%
8%
FY17 FY16
Underlying NPAT of $84.1 million, within guidance range of $80 million to $90 million Contract renewal rates continued to improve, to 93% by number and 76% by value Improved operating cash flow driven by better working capital management and cash collections
For
per
sona
l use
onl
y

COMBINED GROUP
10
For
per
sona
l use
onl
y

For
per
sona
l use
onl
y
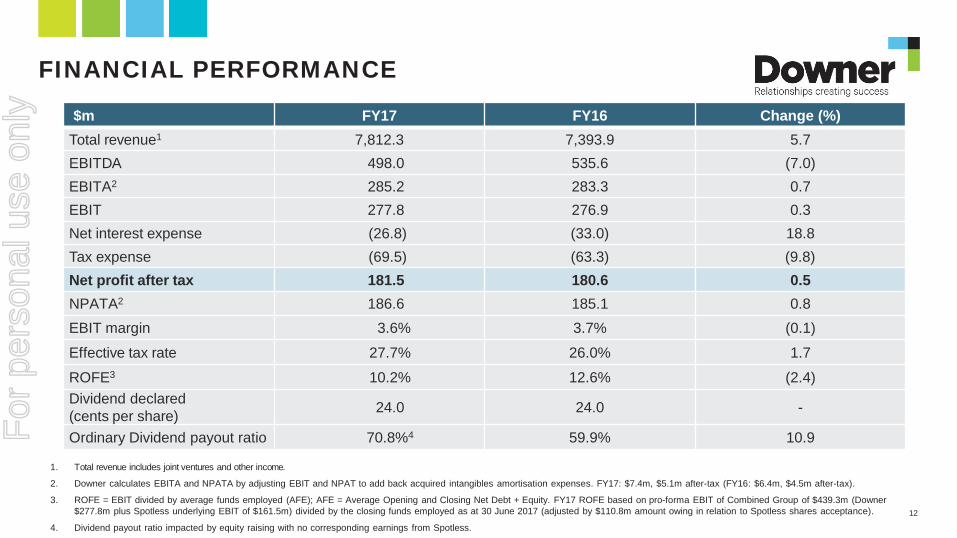
FINANCIAL PERFORMANCE
1. Total revenue includes joint ventures and other income.
2. Downer calculates EBITA and NPATA by adjusting EBIT and NPAT to add back acquired intangibles amortisation expenses. FY17: $7.4m, $5.1m after-tax (FY16: $6.4m, $4.5m after-tax).
3. ROFE = EBIT divided by average funds employed (AFE); AFE = Average Opening and Closing Net Debt + Equity. FY17 ROFE based on pro-forma EBIT of Combined Group of $439.3m (Downer $277.8m plus Spotless underlying EBIT of $161.5m) divided by the closing funds employed as at 30 June 2017 (adjusted by $110.8m amount owing in relation to Spotless shares acceptance).
4. Dividend payout ratio impacted by equity raising with no corresponding earnings from Spotless.
$m FY17 FY16 Change (%) Total revenue1 7,812.3 7,393.9 5.7 EBITDA 498.0 535.6 (7.0) EBITA2 285.2 283.3 0.7 EBIT 277.8 276.9 0.3 Net interest expense (26.8) (33.0) 18.8 Tax expense (69.5) (63.3) (9.8) Net profit after tax 181.5 180.6 0.5 NPATA2 186.6 185.1 0.8 EBIT margin 3.6% 3.7% (0.1)
Effective tax rate 27.7% 26.0% 1.7
ROFE3 10.2% 12.6% (2.4) Dividend declared (cents per share) 24.0 24.0 -
Ordinary Dividend payout ratio 70.8%4 59.9% 10.9
12
For
per
sona
l use
onl
y

$m Total Transport Utilities Rail EC&M Mining Corp
Statutory EBIT 277.8 124.6 84.1 30.3 52.3 83.4 (96.9)
Benefit of Spotless1 (4.6) (4.6)
New Intercity Fleet bid costs 10.0 10.0
NZ Schools PPP bid costs 3.0 3.0
Settlement of contractual claims 5.0 5.0
Contract closure (6.5) (6.5)
Adjusted EBIT (approx.) 284.7 124.6 84.1 30.3 52.3 76.9 (83.5)
SUMMARY OF EARNINGS
13
1 Refer to breakdown on slide 26
For
per
sona
l use
onl
y

OPERATING CASH FLOW
1 Interest and other costs of finance paid minus interest received.
2 Unaudited.
$m FY17 FY16 EBIT 277.8 276.9
Add: depreciation & amortisation 220.2 258.7
EBITDA 498.0 535.6
Operating cash flow 441.6 447.8
Add: Net interest paid1 23.0 26.5
Tax paid 49.0 35.9
Waratah Train Project net cash (inflow) 2 - (13.4)
Adjusted operating cash flow 513.6 496.8
EBITDA conversion 103.1% 92.8%
14
For
per
sona
l use
onl
y

CASH FLOW
1 The amount represents gross consideration paid up to 30 June 2017 of $702.1m less net cash acquired of $66.0m.
2 Relates to the issue of 169.9 million shares from capital raising in relation to Spotless acquisition.
3 As at 30 June 2016, Downer had bought back 7.9 million shares, reducing the total number of shares outstanding to 424.8 million.
4 Refer to slide 24 for details.
$m FY17 FY16 Total operating 441.6 447.8 Net capital expenditure (180.4) (165.3) Spotless acquisition 1 (636.1) - Other acquisitions (143.2) - IT Transformation and Other (36.1) (40.2) Total investing (995.8) (205.5) Issue of shares (net of costs) 2 989.9 - Net (repayment) / proceeds of borrowings (48.8) 93.8 Dividends paid (110.6) (113.1) On-market share buy-back3 - (26.5) Total financing 830.5 (45.8) Net increase in cash held 276.3 196.5 Cash at 30 June 844.6 569.4 Total liquidity4 2,034.6 1,094.4
15
For
per
sona
l use
onl
y

DEBT MATURITY PROFILE – DOWNER ONLY (by limit as at 30 June 2017)
1 1. The maturity profile is based on contractual facility maturity dates.
2 2. The maturity profile excludes debt that has been consolidated pursuant to the acquisition of Spotless.
3 3. Weighted average debt duration = 3.60 years (June 2016 = 4.25 years); including $500.0m facility for acquisition of shares in Spotless = 3.02 years.
4 4. Undrawn $965m (includes $500.0m facility for acquisition of shares in Spotless).
5 5. Syndicated bank facility – acquisition of shares in Spotless: maturity date of March 2019 is subject to Downer exercising its two six month extension options at March 2018 and September 2018.
6
16
0
100
200
300
400
500
600
700
800
900
Dec-
17
Jun-
18
Dec-
18
Jun-
19
Dec-
19
Jun-
20
Dec-
20
Jun-
21
Dec-
21
Jun-
22
Dec-
22
Jun-
23
Dec-
23
Jun-
24
Dec-
24
Jun-
25
Dec-
25
A$m
Equ
ival
ent
Syndicated bank facility -acquisition of shares in SPOSyndicated bank facility -general corporate purposesA$MTN
USPP
Bilateral bank facilities -general corporate purposesECA finance
Finance leases
For
per
sona
l use
onl
y

0
100
200
300
400
500
600
700
Dec
-17
Jun-
18
Dec
-18
Jun-
19
Dec
-19
Jun-
20
Dec
-20
Jun-
21
A$m
Equ
ival
ent
Spotless Debt Maturity Profile - By Limit (at 30 June 2017)
Finance leases
Syndicated bank facility - general corporate purposes
Bilateral bank facilities - general corporate purposes
Interest Cover
2.4x 2.7x 2.9x
FY16 1H17 FY17
8.8x 8.4x 7.3x
FY16 1H17 FY17
DEBT MATURITY PROFILE – SPOTLESS ONLY (by limit as at 30 June 2017)
1 1. The maturity profile is based on contractual facility maturity dates.
2 2. Weighted average debt duration = 1.85 years.
3 3. Leverage ratio includes allowance adjustments to EBITDA for the purpose of debt covenant metrics.
17
DEBT COVENANTS Net Leverage
3.0x
3.5x
Covenant Unutilised facilities
95
30
100
For
per
sona
l use
onl
y

BALANCE SHEET AND CAPITAL MANAGEMENT
1 Adjusted for the mark-to-market of derivatives and deferred finance charges. 2 Downer includes the present value of plant and equipment operating leases discounted at 10% pa: $128.3m (2016: $128.5m); Combined Group includes $151.5m. 3 Spotless June 2017 position. 4 The amount primarily represents net capital raising proceeds of $989.9 million less $702.1 million gross purchase consideration and transaction costs incurred on the Spotless takeover. 5 Adjusted Net Debt includes Net Debt plus 6x operating lease expenses in the year. Adjusted EBITDAR equals underlying earnings before interest, tax, depreciation, amortisation and
operating lease expense (on a rolling 12 month basis).
$m Downer Spotless3
Adjustments on Spotless
transaction / consolidation
Combined Group Jun 17
Jun 16
Total assets 4,487.8 1,912.0 1,055.6 7,455.4 4,200.3
Total shareholders’ equity 2,158.3 420.8 1,007.4 3,586.5 2,088.5
Net (debt1) / cash (111.9) (787.5) 279.24 (620.2) (87.4)
Gearing: net debt to net debt plus equity 4.9% 14.7% 4.0%
Gearing (including off balance sheet debt)2 10.0% 17.7% 9.4%
Debtor days 27.3 23.6 WIP days 36.1 34.1 Creditor days 28.2 37.2
Interest cover 10.0x 10.0x 8.8 x Net debt / EBITDA 0.2 1.2 0.2 Adjusted Net Debt / adjusted EBITDAR5 1.6 x 2.4 x 1.6 x
18
For
per
sona
l use
onl
y
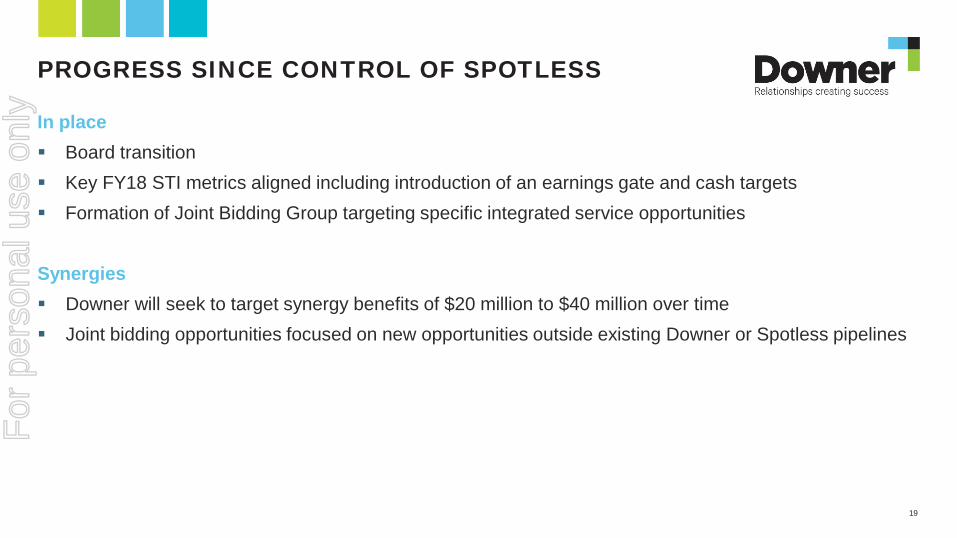
PROGRESS SINCE CONTROL OF SPOTLESS
In place Board transition Key FY18 STI metrics aligned including introduction of an earnings gate and cash targets Formation of Joint Bidding Group targeting specific integrated service opportunities
Synergies Downer will seek to target synergy benefits of $20 million to $40 million over time Joint bidding opportunities focused on new opportunities outside existing Downer or Spotless pipelines
19
For
per
sona
l use
onl
y

For
per
sona
l use
onl
y

WORK-IN-HAND $22.5 BILLION - NOT INCLUDING $10.8 BILLION SPOTLESS PPPs
21
0
2,000
4,000
6,000
8,000
10,000
12,000
Transport Utilities EC&M Mining Rail SpotlessPPPs
Jun-16 Jun-17
For
per
sona
l use
onl
y

OUTLOOK
22
With the acquisition of Spotless, the Downer Group is now well positioned for expected growth in the transport infrastructure, health, education, corrections, defence, utilities and other government service markets across Australia and New Zealand. The Group’s strong competitive position in all of its major markets, coupled with market growth, is driving significant opportunities across all businesses. Excluding Spotless earnings and any costs or synergies related to the acquisition, Downer is targeting NPAT of around $190 million for the 2018 financial year, an increase of 5%. In its Target’s Statement dated 27 April 2017, the Spotless Board provided earnings guidance of between $85 million and $100 million NPAT for the 2018 financial year1. Once Downer completes its review of the Spotless business planning, budgeting and target setting process, updated guidance will be provided for the entire Downer Group, including Spotless.
1. For further information regarding the basis of preparation of this guidance, including key assumptions and other discussion, see section 5.4 and section 7 of Spotless’ Target’s Statement dated 27 April 2017.
For
per
sona
l use
onl
y

For
per
sona
l use
onl
y

DEBT AND BONDING FACILITIES
1 Includes $500.0m syndicated facility for acquisition of shares in Spotless; undrawn as at 30 June 2017.
2 Includes $279.2m - Balance of rights issuance proceeds related to acquisition of shares in Spotless.
3 Includes Downer 15% and Spotless 28%.
4 Includes Downer 2% and Spotless 12%.
5 Includes A$ Medium Term Notes sold to Asian and European domiciled investors measured at financial close of the transaction.
Debt facilities $m DOW SPO Group
Total limit 1,576.31 1,078.5 2,654.8
Drawn (611.3) (853.5) (1,464.8)
Available 965.0 1 225.0 1,190.0
Cash 778.6 2 66.0 844.6
Total liquidity 1,743.6 291.0 2,034.6
Bonding facilities $m DOW SPO Group
Total limit 1,739.8 184.0 1,923.8
Drawn (1,041.2) (144.3) (1,185.5)
Available facilities 698.6 39.7 738.3
Debt facilities by type % Syndicated bank facility :
- general corporate purposes 3 43
- SPO acquisition 19
A$MTN 15
Bilateral bank facilities 4 14
USPP 7
Other 2
100
Debt facilities by geography % Australia / NZ 88
North America 7
Asia 5 4
Europe 5 1
100
24
For
per
sona
l use
onl
y

SEGMENT REPORTING
FY17
$m Transport Utilities Rail EC&M Mining Unallocated Total
Segment revenue 2,091.1 1,517.3 467.1 1,974.2 1,250.8 (13.1)1 7,287.4
Share of sales from JVs and Associates2 62.3 - 383.1 30.1 49.4 - 524.9
Total revenue2 2,153.4 1,517.3 850.2 2,004.3 1,300.2 (13.1)1 7,812.3
EBIT 124.6 84.1 30.3 52.3 83.4 (96.9) 277.8
EBIT margin 5.8% 5.5% 3.6% 2.6% 6.4% - 3.6%
FY16
$m
Transport Utilities Rail EC&M Mining Unallocated Total
Segment revenue 1,786.7 1,274.3 421.8 1,856.7 1,548.9 (38.4) 6,850.0
Share of sales from JVs and Associates2 62.8 - 404.4 30.4 46.3 - 543.9
Total revenue2 1,849.5 1,274.3 826.2 1,887.1 1,595.2 (38.4) 7,393.9
EBIT 103.7 71.4 14.4 48.2 130.0 (90.8) 276.9
EBIT margin 5.6% 5.6% 1.7% 2.6% 8.1% - 3.7%
1. Includes intra eliminations, other income and fair value gain on Spotless investment. 2. This is a non-statutory disclosure as it relates to/includes Downer’s share of revenue from equity accounted joint ventures and associates.
25
For
per
sona
l use
onl
y

RECONCILIATION OF UNDERLYING TO STATUTORY RESULT
FY17 $m EBIT
Net interest
(expense) / income
Tax expense NPAT
Underlying result 273.2 (28.5) (63.3) 181.4
Spotless transaction costs1 (15.2) - - (15.2)
Gains and other income related to Spotless investment2 19.8 1.7 (6.2) 15.3
4.6 1.7 (6.2) 0.1
Statutory result 277.8 (26.8) (69.5) 181.5
1. Includes advisory fees and transition costs in relation to Spotless acquisition.
2. Relates to other income and revaluation of initial 19.99% investment in Spotless at $1.15 per share and to the net interest income on proceeds from ~$1bn capital raising less cash paid. 26
For
per
sona
l use
onl
y

WORK-IN-HAND: $22.5 BILLION
27
28%
16%
12% 9%
35%
WIH By Service Line
Transport
Utilities
EC&M
Mining
Rail
54%
19%
23%
2%
1% By Contract Type - June 2017
Schedule of Rates
Recurring
Lump Sum / Fixed Price
Alliance / Target Cost
Cost Plus
For
per
sona
l use
onl
y

Downer Full Year Results | 29 August 2017 INVESTOR PRESENTATION
For
per
sona
l use
onl
y

Appendix 4G Key to Disclosures Corporate Governance Council Principles and Recommendations
Rules 4.7.3 and 4.10.31
Appendix 4G
Key to Disclosures Corporate Governance Council Principles and Recommendations
Introduced 01/07/14 Amended 02/11/15
Name of entity
Downer EDI Limited
ABN / ARBN Financial year ended:
97 003 872 848 30 June 2017
Our corporate governance statement2 for the above period above can be found at:3
☒ These pages of our annual report: Pages 111 to 118
☐ This URL on our website:
The Corporate Governance Statement is accurate and up to date as at [insert effective date of statement] and has been approved by the board.
The annexure includes a key to where our corporate governance disclosures can be located.
Date: 29 August 2017
Name of Director or Secretary authorising lodgement:
Peter John Tompkins
1 Under Listing Rule 4.7.3, an entity must lodge with ASX a completed Appendix 4G at the same time as it lodges its annual report with ASX.
Listing Rule 4.10.3 requires an entity that is included in the official list as an ASX Listing to include in its annual report either a corporate governance statement that meets the requirements of that rule or the URL of the page on its website where such a statement is located. The corporate governance statement must disclose the extent to which the entity has followed the recommendations set by the ASX Corporate Governance Council during the reporting period. If the entity has not followed a recommendation for any part of the reporting period, its corporate governance statement must separately identify that recommendation and the period during which it was not followed and state its reasons for not following the recommendation and what (if any) alternative governance practices it adopted in lieu of the recommendation during that period.
Under Listing Rule 4.7.4, if an entity chooses to include its corporate governance statement on its website rather than in its annual report, it must lodge a copy of the corporate governance statement with ASX at the same time as it lodges its annual report with ASX. The corporate governance statement must be current as at the effective date specified in that statement for the purposes of rule 4.10.3. 2 “Corporate governance statement” is defined in Listing Rule 19.12 to mean the statement referred to in Listing Rule 4.10.3 which discloses the extent to which an entity has followed the recommendations set by the ASX Corporate Governance Council during a particular reporting period. 3 Mark whichever option is correct and then complete the page number(s) of the annual report, or the URL of the web page, where the entity’s corporate governance statement can be found. You can, if you wish, delete the option which is not applicable.
Throughout this form, where you are given two or more options to select, you can, if you wish, delete any option which is not applicable and just retain the option that is applicable. If you select an option that includes “OR” at the end of the selection and you delete the other options, you can also, if you wish, delete the “OR” at the end of the selection.
+ See chapter 19 for defined terms 2 November 2015 Page 1
For
per
sona
l use
onl
y

Appendix 4G Key to Disclosures Corporate Governance Council Principles and Recommendations
ANNEXURE – KEY TO CORPORATE GOVERNANCE DISCLOSURES Corporate Governance Council recommendation We have followed the recommendation in full for the whole of the
period above. We have disclosed … We have NOT followed the recommendation in full for the whole of the period above. We have disclosed …4
PRINCIPLE 1 – LAY SOLID FOUNDATIONS FOR MANAGEMENT AND OVERSIGHT
1.1 A listed entity should disclose: (a) the respective roles and responsibilities of its board and
management; and (b) those matters expressly reserved to the board and those
delegated to management.
… the fact that we follow this recommendation: ☒ in our Corporate Governance Statement OR
☐ at [insert location] … and information about the respective roles and responsibilities of our board and management (including those matters expressly reserved to the board and those delegated to management):
☐ at http://www.downergroup.com/Resources/Documents/Investors/Corporate-Governance/Board-and-Committees/Board-Charter.pdf
☐ an explanation why that is so in our Corporate Governance Statement OR
☐ we are an externally managed entity and this recommendation is therefore not applicable
1.2 A listed entity should: (a) undertake appropriate checks before appointing a person, or
putting forward to security holders a candidate for election, as a director; and
(b) provide security holders with all material information in its possession relevant to a decision on whether or not to elect or re-elect a director.
… the fact that we follow this recommendation: ☒ in our Corporate Governance Statement OR
☐ at [insert location]
☐ an explanation why that is so in our Corporate Governance Statement OR
☐ we are an externally managed entity and this recommendation is therefore not applicable
1.3 A listed entity should have a written agreement with each director and senior executive setting out the terms of their appointment.
… the fact that we follow this recommendation: ☒ in our Corporate Governance Statement OR
☐ at [insert location]
☐ an explanation why that is so in our Corporate Governance Statement OR
☐ we are an externally managed entity and this recommendation is therefore not applicable
1.4 The company secretary of a listed entity should be accountable directly to the board, through the chair, on all matters to do with the proper functioning of the board.
… the fact that we follow this recommendation: ☒ in our Corporate Governance Statement OR
☐ at [insert location]
☐ an explanation why that is so in our Corporate Governance Statement OR
☐ we are an externally managed entity and this recommendation is therefore not applicable
4 If you have followed all of the Council’s recommendations in full for the whole of the period above, you can, if you wish, delete this column from the form and re-format it. + See chapter 19 for defined terms 2 November 2015 Page 2
For
per
sona
l use
onl
y

Appendix 4G Key to Disclosures Corporate Governance Council Principles and Recommendations
Corporate Governance Council recommendation We have followed the recommendation in full for the whole of the period above. We have disclosed …
We have NOT followed the recommendation in full for the whole of the period above. We have disclosed …4
1.5 A listed entity should: (a) have a diversity policy which includes requirements for the
board or a relevant committee of the board to set measurable objectives for achieving gender diversity and to assess annually both the objectives and the entity’s progress in achieving them;
(b) disclose that policy or a summary of it; and (c) disclose as at the end of each reporting period the
measurable objectives for achieving gender diversity set by the board or a relevant committee of the board in accordance with the entity’s diversity policy and its progress towards achieving them and either: (1) the respective proportions of men and women on the
board, in senior executive positions and across the whole organisation (including how the entity has defined “senior executive” for these purposes); or
(2) if the entity is a “relevant employer” under the Workplace Gender Equality Act, the entity’s most recent “Gender Equality Indicators”, as defined in and published under that Act.
… the fact that we have a diversity policy that complies with paragraph (a): ☒ in our Corporate Governance Statement OR
☐ at [insert location] … and a copy of our diversity policy or a summary of it:
☐ at http://www.downergroup.com/Resources/Documents/Investors/Corporate-Governance/Board-Policies/Diversity-and-Inclusiveness-Policy.pdf
… and the measurable objectives for achieving gender diversity set by the board or a relevant committee of the board in accordance with our diversity policy and our progress towards achieving them: ☒ in our Corporate Governance Statement OR
☐ at [insert location] … and the information referred to in paragraphs (c)(1) or (2): ☒ in our Corporate Governance Statement OR
☐ at [insert location]
☐ an explanation why that is so in our Corporate Governance Statement OR
☐ we are an externally managed entity and this recommendation is therefore not applicable
1.6 A listed entity should: (a) have and disclose a process for periodically evaluating the
performance of the board, its committees and individual directors; and
(b) disclose, in relation to each reporting period, whether a performance evaluation was undertaken in the reporting period in accordance with that process.
… the evaluation process referred to in paragraph (a): ☒ in our Corporate Governance Statement OR
☐ at [insert location] … and the information referred to in paragraph (b): ☒ in our Corporate Governance Statement OR
☐ at [insert location]
☐ an explanation why that is so in our Corporate Governance Statement OR
☐ we are an externally managed entity and this recommendation is therefore not applicable
1.7 A listed entity should: (a) have and disclose a process for periodically evaluating the
performance of its senior executives; and (b) disclose, in relation to each reporting period, whether a
performance evaluation was undertaken in the reporting period in accordance with that process.
… the evaluation process referred to in paragraph (a): ☒ in our Corporate Governance Statement OR
☐ at [insert location] … and the information referred to in paragraph (b): ☒ in our Corporate Governance Statement OR
☐ at [insert location]
☐ an explanation why that is so in our Corporate Governance Statement OR
☐ we are an externally managed entity and this recommendation is therefore not applicable
+ See chapter 19 for defined terms 2 November 2015 Page 3
For
per
sona
l use
onl
y

Appendix 4G Key to Disclosures Corporate Governance Council Principles and Recommendations
Corporate Governance Council recommendation We have followed the recommendation in full for the whole of the period above. We have disclosed …
We have NOT followed the recommendation in full for the whole of the period above. We have disclosed …4
PRINCIPLE 2 - STRUCTURE THE BOARD TO ADD VALUE
2.1 The board of a listed entity should: (a) have a nomination committee which:
(1) has at least three members, a majority of whom are independent directors; and
(2) is chaired by an independent director, and disclose: (3) the charter of the committee; (4) the members of the committee; and (5) as at the end of each reporting period, the number of
times the committee met throughout the period and the individual attendances of the members at those meetings; or
(b) if it does not have a nomination committee, disclose that fact and the processes it employs to address board succession issues and to ensure that the board has the appropriate balance of skills, knowledge, experience, independence and diversity to enable it to discharge its duties and responsibilities effectively.
[If the entity complies with paragraph (a):] … the fact that we have a nomination committee that complies with paragraphs (1) and (2): ☒ in our Corporate Governance Statement OR
☐ at [insert location] … and a copy of the charter of the committee:
☐ at http://www.downergroup.com/Resources/Documents/Investors/Corporate-Governance/Board-and-Committees/Nomination-and-Corporate-Governance-Committee-Charter.pdf
… and the information referred to in paragraphs (4) and (5): ☒ in our Corporate Governance Statement OR
☐ at [insert location] [If the entity complies with paragraph (b):] … the fact that we do not have a nomination committee and the processes we employ to address board succession issues and to ensure that the board has the appropriate balance of skills, knowledge, experience, independence and diversity to enable it to discharge its duties and responsibilities effectively:
☐ in our Corporate Governance Statement OR
☐ at [insert location]
☐ an explanation why that is so in our Corporate Governance Statement OR
☐ we are an externally managed entity and this recommendation is therefore not applicable
2.2 A listed entity should have and disclose a board skills matrix setting out the mix of skills and diversity that the board currently has or is looking to achieve in its membership.
… our board skills matrix: ☒ in our Corporate Governance Statement OR
☐ at [insert location]
☐ an explanation why that is so in our Corporate Governance Statement OR
☐ we are an externally managed entity and this recommendation is therefore not applicable
+ See chapter 19 for defined terms 2 November 2015 Page 4
For
per
sona
l use
onl
y

Appendix 4G Key to Disclosures Corporate Governance Council Principles and Recommendations
Corporate Governance Council recommendation We have followed the recommendation in full for the whole of the period above. We have disclosed …
We have NOT followed the recommendation in full for the whole of the period above. We have disclosed …4
2.3 A listed entity should disclose: (a) the names of the directors considered by the board to be
independent directors; (b) if a director has an interest, position, association or
relationship of the type described in Box 2.3 but the board is of the opinion that it does not compromise the independence of the director, the nature of the interest, position, association or relationship in question and an explanation of why the board is of that opinion; and
(c) the length of service of each director.
… the names of the directors considered by the board to be independent directors:
☐ in our Corporate Governance Statement OR
☒ at 2017 Annual Report – Directors’ Report … and, where applicable, the information referred to in paragraph (b):
☐ in our Corporate Governance Statement OR
☒ at 2017 Annual Report – Directors’ Report … and the length of service of each director:
☐ in our Corporate Governance Statement OR
☒ at 2017 Annual Report – Directors’ Report
☐ an explanation why that is so in our Corporate Governance Statement
2.4 A majority of the board of a listed entity should be independent directors.
… the fact that we follow this recommendation: ☒ in our Corporate Governance Statement OR
☐ at [insert location]
☐ an explanation why that is so in our Corporate Governance Statement OR
☐ we are an externally managed entity and this recommendation is therefore not applicable
2.5 The chair of the board of a listed entity should be an independent director and, in particular, should not be the same person as the CEO of the entity.
… the fact that we follow this recommendation: ☒ in our Corporate Governance Statement OR
☐ at [insert location]
☐ an explanation why that is so in our Corporate Governance Statement OR
☐ we are an externally managed entity and this recommendation is therefore not applicable
2.6 A listed entity should have a program for inducting new directors and provide appropriate professional development opportunities for directors to develop and maintain the skills and knowledge needed to perform their role as directors effectively.
… the fact that we follow this recommendation: ☒ in our Corporate Governance Statement OR
☐ at [insert location]
☐ an explanation why that is so in our Corporate Governance Statement OR
☐ we are an externally managed entity and this recommendation is therefore not applicable
PRINCIPLE 3 – ACT ETHICALLY AND RESPONSIBLY
3.1 A listed entity should: (a) have a code of conduct for its directors, senior executives
and employees; and (b) disclose that code or a summary of it.
… our code of conduct or a summary of it:
☐ in our Corporate Governance Statement OR
☒ at http://www.downergroup.com/Resources/Documents/Investors/CoGovernance/Board-Policies/Standards-of-Business-Conduct.pdf
☐ an explanation why that is so in our Corporate Governance Statement
+ See chapter 19 for defined terms 2 November 2015 Page 5
For
per
sona
l use
onl
y

Appendix 4G Key to Disclosures Corporate Governance Council Principles and Recommendations
Corporate Governance Council recommendation We have followed the recommendation in full for the whole of the period above. We have disclosed …
We have NOT followed the recommendation in full for the whole of the period above. We have disclosed …4
PRINCIPLE 4 – SAFEGUARD INTEGRITY IN CORPORATE REPORTING
4.1 The board of a listed entity should: (a) have an audit committee which:
(1) has at least three members, all of whom are non-executive directors and a majority of whom are independent directors; and
(2) is chaired by an independent director, who is not the chair of the board,
and disclose: (3) the charter of the committee; (4) the relevant qualifications and experience of the
members of the committee; and (5) in relation to each reporting period, the number of
times the committee met throughout the period and the individual attendances of the members at those meetings; or
(b) if it does not have an audit committee, disclose that fact and the processes it employs that independently verify and safeguard the integrity of its corporate reporting, including the processes for the appointment and removal of the external auditor and the rotation of the audit engagement partner.
[If the entity complies with paragraph (a):] … the fact that we have an audit committee that complies with paragraphs (1) and (2): ☒ in our Corporate Governance Statement OR
☐ at [insert location] … and a copy of the charter of the committee:
☐ at http://www.downergroup.com/Resources/Documents/Investors/Corporate-Governance/Board-and-Committees/Audit-and-Risk-Committee-Charter.pdf
… and the information referred to in paragraphs (4) and (5):
☐ in our Corporate Governance Statement OR
☒ at 2017 Annual Report – Directors’ Report [If the entity complies with paragraph (b):] … the fact that we do not have an audit committee and the processes we employ that independently verify and safeguard the integrity of our corporate reporting, including the processes for the appointment and removal of the external auditor and the rotation of the audit engagement partner:
☐ in our Corporate Governance Statement OR
☐ at [insert location]
☐ an explanation why that is so in our Corporate Governance Statement
4.2 The board of a listed entity should, before it approves the entity’s financial statements for a financial period, receive from its CEO and CFO a declaration that, in their opinion, the financial records of the entity have been properly maintained and that the financial statements comply with the appropriate accounting standards and give a true and fair view of the financial position and performance of the entity and that the opinion has been formed on the basis of a sound system of risk management and internal control which is operating effectively.
… the fact that we follow this recommendation: ☒ in our Corporate Governance Statement OR
☐ at [insert location]
☐ an explanation why that is so in our Corporate Governance Statement
+ See chapter 19 for defined terms 2 November 2015 Page 6
For
per
sona
l use
onl
y
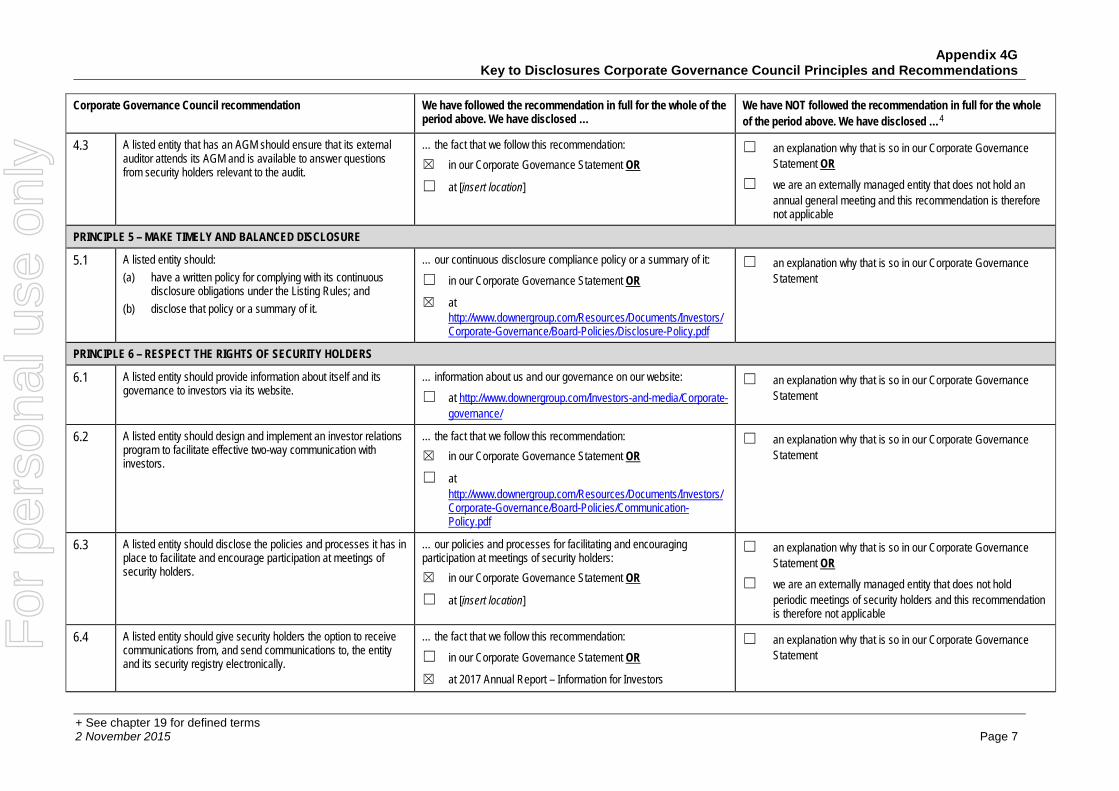
Appendix 4G Key to Disclosures Corporate Governance Council Principles and Recommendations
Corporate Governance Council recommendation We have followed the recommendation in full for the whole of the period above. We have disclosed …
We have NOT followed the recommendation in full for the whole of the period above. We have disclosed …4
4.3 A listed entity that has an AGM should ensure that its external auditor attends its AGM and is available to answer questions from security holders relevant to the audit.
… the fact that we follow this recommendation: ☒ in our Corporate Governance Statement OR
☐ at [insert location]
☐ an explanation why that is so in our Corporate Governance Statement OR
☐ we are an externally managed entity that does not hold an annual general meeting and this recommendation is therefore not applicable
PRINCIPLE 5 – MAKE TIMELY AND BALANCED DISCLOSURE
5.1 A listed entity should: (a) have a written policy for complying with its continuous
disclosure obligations under the Listing Rules; and (b) disclose that policy or a summary of it.
… our continuous disclosure compliance policy or a summary of it:
☐ in our Corporate Governance Statement OR
☒ at http://www.downergroup.com/Resources/Documents/Investors/Corporate-Governance/Board-Policies/Disclosure-Policy.pdf
☐ an explanation why that is so in our Corporate Governance Statement
PRINCIPLE 6 – RESPECT THE RIGHTS OF SECURITY HOLDERS
6.1 A listed entity should provide information about itself and its governance to investors via its website.
… information about us and our governance on our website:
☐ at http://www.downergroup.com/Investors-and-media/Corporate-governance/
☐ an explanation why that is so in our Corporate Governance Statement
6.2 A listed entity should design and implement an investor relations program to facilitate effective two-way communication with investors.
… the fact that we follow this recommendation: ☒ in our Corporate Governance Statement OR
☐ at http://www.downergroup.com/Resources/Documents/Investors/Corporate-Governance/Board-Policies/Communication-Policy.pdf
☐ an explanation why that is so in our Corporate Governance Statement
6.3 A listed entity should disclose the policies and processes it has in place to facilitate and encourage participation at meetings of security holders.
… our policies and processes for facilitating and encouraging participation at meetings of security holders: ☒ in our Corporate Governance Statement OR
☐ at [insert location]
☐ an explanation why that is so in our Corporate Governance Statement OR
☐ we are an externally managed entity that does not hold periodic meetings of security holders and this recommendation is therefore not applicable
6.4 A listed entity should give security holders the option to receive communications from, and send communications to, the entity and its security registry electronically.
… the fact that we follow this recommendation:
☐ in our Corporate Governance Statement OR
☒ at 2017 Annual Report – Information for Investors
☐ an explanation why that is so in our Corporate Governance Statement
+ See chapter 19 for defined terms 2 November 2015 Page 7
For
per
sona
l use
onl
y

Appendix 4G Key to Disclosures Corporate Governance Council Principles and Recommendations
Corporate Governance Council recommendation We have followed the recommendation in full for the whole of the period above. We have disclosed …
We have NOT followed the recommendation in full for the whole of the period above. We have disclosed …4
PRINCIPLE 7 – RECOGNISE AND MANAGE RISK
7.1 The board of a listed entity should: (a) have a committee or committees to oversee risk, each of
which: (1) has at least three members, a majority of whom are
independent directors; and (2) is chaired by an independent director, and disclose: (3) the charter of the committee; (4) the members of the committee; and (5) as at the end of each reporting period, the number of
times the committee met throughout the period and the individual attendances of the members at those meetings; or
(b) if it does not have a risk committee or committees that satisfy (a) above, disclose that fact and the processes it employs for overseeing the entity’s risk management framework.
[If the entity complies with paragraph (a):] … the fact that we have a committee or committees to oversee risk that comply with paragraphs (1) and (2): ☒ in our Corporate Governance Statement OR
☐ at [insert location] … and a copy of the charter of the committee:
☐ at http://www.downergroup.com/Resources/Documents/Investors/Corporate-Governance/Board-and-Committees/Audit-and-Risk-Committee-Charter.pdf
… and the information referred to in paragraphs (4) and (5):
☐ in our Corporate Governance Statement OR
☒ at [insert location] Corporate Governance Statement 2017 Annual Report –Director’s Report
[If the entity complies with paragraph (b):] … the fact that we do not have a risk committee or committees that satisfy (a) and the processes we employ for overseeing our risk management framework:
☐ in our Corporate Governance Statement OR
☐ at [insert location]
☐ an explanation why that is so in our Corporate Governance Statement
7.2 The board or a committee of the board should: (a) review the entity’s risk management framework at least
annually to satisfy itself that it continues to be sound; and (b) disclose, in relation to each reporting period, whether such
a review has taken place.
… the fact that board or a committee of the board reviews the entity’s risk management framework at least annually to satisfy itself that it continues to be sound: ☒ in our Corporate Governance Statement OR
☐ at [insert location] … and that such a review has taken place in the reporting period covered by this Appendix 4G: ☒ in our Corporate Governance Statement OR
☐ at [insert location]
☐ an explanation why that is so in our Corporate Governance Statement
+ See chapter 19 for defined terms 2 November 2015 Page 8
For
per
sona
l use
onl
y

Appendix 4G Key to Disclosures Corporate Governance Council Principles and Recommendations
Corporate Governance Council recommendation We have followed the recommendation in full for the whole of the period above. We have disclosed …
We have NOT followed the recommendation in full for the whole of the period above. We have disclosed …4
7.3 A listed entity should disclose: (a) if it has an internal audit function, how the function is
structured and what role it performs; or (b) if it does not have an internal audit function, that fact and
the processes it employs for evaluating and continually improving the effectiveness of its risk management and internal control processes.
[If the entity complies with paragraph (a):] … how our internal audit function is structured and what role it performs: ☒ in our Corporate Governance Statement OR
☐ at [insert location] [If the entity complies with paragraph (b):] … the fact that we do not have an internal audit function and the processes we employ for evaluating and continually improving the effectiveness of our risk management and internal control processes:
☐ in our Corporate Governance Statement OR
☐ at [insert location]
☐ an explanation why that is so in our Corporate Governance Statement
7.4 A listed entity should disclose whether it has any material exposure to economic, environmental and social sustainability risks and, if it does, how it manages or intends to manage those risks.
… whether we have any material exposure to economic, environmental and social sustainability risks and, if we do, how we manage or intend to manage those risks:
☐ in our Corporate Governance Statement OR
☒ at 2017 Annual Report – Review of Operations; and 2016 Sustainability report at this location:
http://www.downergroup.com/About-us/Zero-Harm/Sustainability/
☐ an explanation why that is so in our Corporate Governance Statement
+ See chapter 19 for defined terms 2 November 2015 Page 9
For
per
sona
l use
onl
y

Appendix 4G Key to Disclosures Corporate Governance Council Principles and Recommendations
Corporate Governance Council recommendation We have followed the recommendation in full for the whole of the period above. We have disclosed …
We have NOT followed the recommendation in full for the whole of the period above. We have disclosed …4
PRINCIPLE 8 – REMUNERATE FAIRLY AND RESPONSIBLY
8.1 The board of a listed entity should: (a) have a remuneration committee which:
(1) has at least three members, a majority of whom are independent directors; and
(2) is chaired by an independent director, and disclose: (3) the charter of the committee; (4) the members of the committee; and (5) as at the end of each reporting period, the number of
times the committee met throughout the period and the individual attendances of the members at those meetings; or
(b) if it does not have a remuneration committee, disclose that fact and the processes it employs for setting the level and composition of remuneration for directors and senior executives and ensuring that such remuneration is appropriate and not excessive.
[If the entity complies with paragraph (a):] … the fact that we have a remuneration committee that complies with paragraphs (1) and (2): ☒ in our Corporate Governance Statement OR
☐ at [insert location] … and a copy of the charter of the committee:
☐ at http://www.downergroup.com/Resources/Documents/Investors/Corporate-Governance/Board-and-Committees/Remuneration-Committee-Charter.pdf
… and the information referred to in paragraphs (4) and (5):
☐ in our Corporate Governance Statement OR
☒ at Corporate Governance Statement 2017 Annual Report –Director’s Report
[If the entity complies with paragraph (b):] … the fact that we do not have a remuneration committee and the processes we employ for setting the level and composition of remuneration for directors and senior executives and ensuring that such remuneration is appropriate and not excessive:
☐ in our Corporate Governance Statement OR
☐ at [insert location]
☐ an explanation why that is so in our Corporate Governance Statement OR
☐ we are an externally managed entity and this recommendation is therefore not applicable
8.2 A listed entity should separately disclose its policies and practices regarding the remuneration of non-executive directors and the remuneration of executive directors and other senior executives.
… separately our remuneration policies and practices regarding the remuneration of non-executive directors and the remuneration of executive directors and other senior executives:
☐ in our Corporate Governance Statement OR
☒ at 2017 Annual Report – Remuneration Report
☐ an explanation why that is so in our Corporate Governance Statement OR
☐ we are an externally managed entity and this recommendation is therefore not applicable
+ See chapter 19 for defined terms 2 November 2015 Page 10
For
per
sona
l use
onl
y

Appendix 4G Key to Disclosures Corporate Governance Council Principles and Recommendations
Corporate Governance Council recommendation We have followed the recommendation in full for the whole of the period above. We have disclosed …
We have NOT followed the recommendation in full for the whole of the period above. We have disclosed …4
8.3 A listed entity which has an equity-based remuneration scheme should: (a) have a policy on whether participants are permitted to
enter into transactions (whether through the use of derivatives or otherwise) which limit the economic risk of participating in the scheme; and
(b) disclose that policy or a summary of it.
… our policy on this issue or a summary of it:
☐ in our Corporate Governance Statement OR
☒ at 2017 Annual Report – Remuneration Report
☐ an explanation why that is so in our Corporate Governance Statement OR
☐ w e do not have an equity-based remuneration scheme and this recommendation is therefore not applicable OR
☐ we are an externally managed entity and this recommendation is therefore not applicable
ADDITIONAL DISCLOSURES APPLICABLE TO EXTERNALLY MANAGED LISTED ENTITIES
- Alternative to Recommendation 1.1 for externally managed listed entities: The responsible entity of an externally managed listed entity should disclose: (a) the arrangements between the responsible entity and the
listed entity for managing the affairs of the listed entity; (b) the role and responsibility of the board of the responsible
entity for overseeing those arrangements.
… the information referred to in paragraphs (a) and (b):
☐ in our Corporate Governance Statement OR
☐ at [insert location]
☐ an explanation why that is so in our Corporate Governance Statement
- Alternative to Recommendations 8.1, 8.2 and 8.3 for externally managed listed entities: An externally managed listed entity should clearly disclose the terms governing the remuneration of the manager.
… the terms governing our remuneration as manager of the entity:
☐ in our Corporate Governance Statement OR
☐ at [insert location]
☐ an explanation why that is so in our Corporate Governance Statement
+ See chapter 19 for defined terms 2 November 2015 Page 11
For
per
sona
l use
onl
y