dottorato di ricerca - benvenuti su unica...
TRANSCRIPT

Università degli Studi di Cagliari
DOTTORATO DI RICERCA
TOSSICOLOGIA
Ciclo XXVII
ROLE OF HYDROXY ACID OXIDASE 2 (HAO2)
IN HEPATOCELLULAR CARCINOMA
Settore scientifico disciplinare di afferenza
MED/04
Presentata da: Dott.ssa Sandra Mattu
Coordinatore Dottorato Prof. Gaetano Di Chiara Relatore/Tutor Prof. Amedeo Columbano
Esame finale anno accademico 2013 – 2014

Sandra Mattu gratefully acknowledges Sardinia Regional Government for the
financial support of her PhD scholarship(P.O.R. Sardegna F.S.E. Operational
Programme of the Autonomous Region of Sardinia, European Social Fund 2007-
2013 - Axis IV Human Resources, Objective l.3, Line of Activity l.3.1.).
Table of contents
List of abbreviations ............................................................................................................ 1
Introduction ........................................................................................................................... 4
1. Hepatocellular carcinoma ...................................................................................................... 4
1.1. Epidemiology .................................................................................................................... 4
1.2. Risk factors ....................................................................................................................... 5
1.3. Molecular mechanisms .................................................................................................... 7
1.4. Clinical aspects. .............................................................................................................. 11
1.5. Animal models of hepatocarcinogensis ......................................................................... 15
2. Hydroxy acid oxidases ......................................................................................................... 16
Aim of the Study ................................................................................................................. 22
Materials and Methods .................................................................................................... 23
1. Animals and treatments ...................................................................................................... 23
2. Immunohistochemestry ...................................................................................................... 25
2.1. Hematoxilin and Eosin staining ...................................................................................... 25
2.2. Glutathione S-transferase staining ................................................................................ 25
2.3. Cytokeratin-19 staining .................................................................................................. 25
3. Laser Capture microdissection ............................................................................................ 26
4. RNA extraction ..................................................................................................................... 26
4.1. RNA isolation using PicoPure RNA isolation kit ............................................................. 26
4.2. RNA isolation using TRIzol® Reagent .............................................................................. 27
5. Quantitative and qualitative analysis of nucleic acids ........................................................ 27
6. RT-PCR (Reverse Transcription Polymerase Chain Reaction) .............................................. 27
7. Quantitative Real-Time PCR ................................................................................................ 28
8. Protein isolation .................................................................................................................. 28
9. Western blotting .................................................................................................................. 29
10. Cell lines ............................................................................................................................. 29
10.1. Stable transduction with HAO2 .................................................................................... 30
10.2. Crystal violet cell growth assay .................................................................................... 30
10.3. Soft agar colony formation assay ................................................................................. 31
10.4. Rat tumorigenicity assay .............................................................................................. 31
11. Human samples ................................................................................................................. 31
11.1. Microarray analysis ...................................................................................................... 33
11.2. Tissue microarray (TMA) and immunohistochemistry ................................................ 34
12. Statistics ............................................................................................................................. 35
Results ................................................................................................................................... 36
1. Analysis of Hao2 in rat preneoplastic lesions and HCCs ...................................................... 36
2. Hao2 is mostly down-regulated in the subset of nodules expressing the putative
progenitor cell marker Krt-19 ............................................................................................. 37
3. Is Hao2 down-regulation a species-dependent event or a common feature of HCC? ....... 39
4. Down-regulation of Hao2 takes place also in HCCs generated in the absence of
administration of genotoxic agents .................................................................................... 39
5. The role of Hao2 in proliferation of normal hepatocytes ................................................... 40
6. HAO2 expression is strongly down-regulated in human HCC ............................................. 41
7. HAO2 protein content is decresed in human HCC .............................................................. 44
8. Hao2 in vitro and in vivo ...................................................................................................... 46
Discussion ............................................................................................................................. 49
References ............................................................................................................................ 51

ACKNOWLEDGEMENTS
I would like to express my sincere gratitude to Professor Amedeo Columbano and Professor
Giovanna Maria Ledda who believed in me by giving me the opportunity to continue my
research in their laboratory.
I am also deeply grateful to Professor Silvia Giordano for accepting me in her laboratory of
the IRCC of Candiolo, in order to improve my cell culture knowledge for the accomplishment
of this thesis.
I also want to express my appreciation to Professor Luigi Terracciano, from the University of
Basel and Doctor Laura Gramantieri from the Policlinico S. Orsola-Malpighi of Bologna.
Results described in this work on human samples would not have been obtained without
their close collaboration.
My gratitude also go to Prof. Patrizia Zavattari that stimulated my interest in the field of
research and transmitted me her passion for this work.
Sincere thanks to Carla Teodora Puggioni and all my colleagues who shared with me the
good and bad moments of our work and in particular to Dr. Roberto Loi for his advise and
help in reviewing my writing.
A special gratitude and love goes to my family and Francesco who encouraged and
supported me every day in all my decisions during the most difficult time of thesis writing.
Without them nothing would have been possible.

1
LIST OF ABBREVIATIONS
2-AAF 2-acetylaminofluorene
3’-UTR 3’-untraslated region
AFB1 Aflatoxin B1
AFP α-phetoprotein
aHCC Advanced hepatocellular carcinoma
AKT/PKB Thymoma viral protooncogene/Protein kinase B
APC Adenomatous polyposis coli
BCLC Barcelona Clinic Liver Cancer
βTrCp β-transducin repeat-containing protein
CAR Constitutive androstane receptor
CDK Cyclin-dependent kinase
cDNA Complementary DNA
CK1 Casein kinase 1
Ct Threshold cycle
DAB 3’,3’-diaminobenzidine
DENA Diethylnitrosamine
DMEM Dulbecco’s Modified Eagle’s Medium
DMSO Dimethyl sulfoxide
EGFR Epidermal growth factor receptor
eHCC Early hepatocellular carcinoma
EKKB Ethics Committee of the University Hospital of Basel
ES Edmondson and Steiner
F-344 Fisher 344
FBS Fetal bovin serum
FCB2 Flavocytochrome b2 or L-lactate dehydrogenase
FFPE Formalin-fixed paraffin embedded
Fz Frizlzled
GAPDH Glyceraldehyde-3-phosphate dehydrogenase
GSH Glutathione peroxidase

2
GSK-3β Glycogen kinase-3β
GSTP Placental glutathione-S-transferase
H2O2 Hydrogen peroxide
HAO1 Hydroxy acid oxidase 1
HAO2 Hydroxy acid oxidase 2
HAO3 Hydroxy acid oxidase 3
HbF Fetal hemoglobin
HbS Sickle hemoglobin
HBx Hepatitis B x protein
HBV Hepatitis B virus
HCV Hepatitis C virus
HCC Hepatocellular carcinoma
HGF Hepatocyte growth factor
HEK293T Human embryonic kidney 293 cells
HO. Hydroxyl
HRP Horseradish peroxidase
JAKs Janus kinases
KRT-19 Cytokeratin-19
IACT Intra-artery chemotherapy
IARC International Agency for Research on Cancer
IGFR Insulin growth factor receptor
IHC Immunohistochemistry
LEF/TCF Lymphoid enhancer factor/T-cell factor
LMO Lactate monooxygenase
LOX Lactate oxidase
MAPK mitogen-activated protein kinase
MDH Mandelate dehydrogenase
MEM Minimum Essential Medium
mTOR Mammalian target of rapamycin
NO Nitric oxide
O2.- Superoxide
OD Optical density
PAHX Phytanoil-CoA 2-hydroxylase

3
PBS Phosphate buffered saline
PDGFR Platelet derived growth factor receptor
PH Partial hepatectomy
PI3K Phosphatidylinositol-3-kinase
PIP3 Phosphatidyl inositol 3,4,5-triphosphate
PTEN Phosphatase and tensin homolog
PTS Peroxisomal targeting signal
qRT-PCR Quantitative real time- polymerase chain reaction
QTL Quantitative trait loci
Rb Retinoblastoma protein
R-H Resistant-Hepatocyte
RIN RNA integrity number
RNS Reactive nitrogen species
ROC Receiver-operating charactheristic
ROS Reactive oxygen species
RPMI Roswell Park Memorial Institute
SEM Standard error of the mean
SNP Nucleotide polymorphism
SOCS Suppressors of cytokine signaling
SOD Superoxide dismutase
SPSS Statistical package for social science
STAT Signal transducer and activator of transcription
TAE Transarterial embolization
TACE Transarterial chemoembolization
TMA Tissue microarray
TBS-T Tris-buffered saline with tween 20
TCPOBOP 1,4-bis[2-(3,5-dichloropyridyloxy)]benzene
TMA Tissue macroarray
VEGFR Vascular endothelial growth factor receptor
VSV Vesicular stomatitis virus
4
INTRODUCTION
1. Hepatocellular carcinoma
Hepatocellular carcinoma (HCC) is the most common primary liver cancer. It represents
the sixth most frequent solid tumor worldwide, with more than half a million new cases per
year, and the third cause of cancer-related death (Ferlay J. et al. 2010). Chronic liver disease
and cirrhosis are the main causes of HCC in association with major risk factors including
hepatitis B (HBV) and hepatitis C (HCV) viruses, alcohol consumption and toxic exposures to
aflatoxin B1. Although less frequent, other risk factors include nonalcoholic fatty liver
disease (Hashimoto E et al, 2004), diabetes (El-Serag HB et al, 2004; Regimbeau J et al,
2004), hereditary hemochromatosis (Hellerbrand C et al, 2003), obesity (Regimbeau J et al,
2004) and oral contraceptives (Maheshwari S et al, 2007).
1.1. Epidemiology
The heterogenous worldwide incidence of HCC reflects variations in distribution and in
the natural history of HBV and HCV infections. More than 80% of cases arise in sub-Saharan
Africa and in Eastern Asia; China alone accounts for more than 50% of the world’s cases (El-
Serag HB. et al. 2007). In these areas HBV is highly prevalent except Japan where HCV is the
leading cause (Gao J. et al. 2012). North-America and Europe are considered areas with low
incidence rates even if some data indicate a steadily increasing in the West (Parkin DM et al,
2001) where HCV plays a more dominant role.
Moreover, the incidence rate of HCC may vary by ethnicity. In the Unites States, for
example, HCC incidence is two times higher in Asians than in African Americans, whose rates
are two times higher than in whites (El-Serag HB. et al. 2007).
A higher HCC incidence is also observed in males, with male to female ratio being
estimated approximately between 2:1 and 4:1. This divergence can be explained by sex-
specific differences in exposure to different risk factors such as HBV and HCV infection and
alcohol consumption. In addition, an experimental study has shown in male mice a two to
eight fold increase in the development of HCC, supporting the hypothesis that androgens
may influence HCC progression. (Rudolph KL et al, 2000). Worldwide, in almost all areas, the
peak of higher incidence is observed in males earlier in life than females, with female rates

5
peaking in the age group 5 years older than the peak age group for males (El-Serag HB. et al.
2007).
1.2. Risk factors
HBV is the most frequent risk factor for HCC, with more than 240 million people with chronic
infection worldwide (WHO Media centre, 2014). The relationship between HCC and HBV is well-
established from the early eighties even if the role of HBV in the malignant transformation
remains unclear.
In this regard, different mechanisms have been proposed. The chronic HBV infection
causes a continuous immune-mediated destruction of infected hepatocytes, resulting in
hepatocytes proliferation and liver regeneration (Guidotti LG et al, 2006; Seeger C et al,
2007).
The persistent inflammation, the recruitment of immune cells, and the consequent
local increase in inflammatory cytokines can produce a locally mutagenic microenvironment;
in addition, an excessive amount of reactive oxygen species (ROS) can directly mediate
mutagenic processes by damaging DNA. Furthermore, the increase of inflammatory
cytokines may induce several signalling pathways involved in gene transcription, cell
proliferation, or cell survival (Berasain C et al, 2009).
Moreover, several studies have shown that HBV viral DNA can integrate into the host
genome and that it actually occurs in the infected livers since the early stages of natural
acute infections. Multiple integrations events have been detected in chronic hepatitis
tissues, and integrated HBV sequences have been seen in 80%-90% of HBV-related HCCs
(Balsano C et al, 1994). Genome integration of HBV at specific sites has been associated with
major genetic alterations, including generalized genomic instability, gene and chromosomal
deletions and translocations, amplification of cellular DNA, and generation of fusion
transcripts (Reifenberg K et al, 1999; Klein N et al, 1999).
The third mechanism by which HBV contributes to carcinogenesis is by expression of
viral proteins, in particular, X protein (HBx). Although HBx does not bind directly to DNA, in
the cytoplasm it modulates mitogenic signaling pathways involved in oncogenesis,
proliferation, apoptosis, inflammation and immune response. In the nucleus it promotes the
interaction with numerous transcription factors modulating gene expression (Bouchard MJ
and Navas-Martin S., 2011).
6
Twenty years after the discovery of HBV, Choo and colleagues in 1989 identified
hepatitis C virus (Choo QL et al, 1989), an enveloped, single stranded, positive sense RNA
virus (Hoofnagle et al, 1999). HCV is the major risk factor in areas with low prevalence of
HBV; the infection is present in about 3% of world’s population and 170 million people are
chronic carriers (Gao J et al, 2012).
The mechanism by which HCV causes HCC is not well defined. Unlike HBV, it does not
integrate into the human genome. The main hypothesis is that in the context of chronic liver
damage caused by HCV infection, with a persistent inflammation and hepatocyte
regeneration, the resultant cirrhosis can lead to chromosomal damage that can trigger the
development of HCC in the modified tissue microenvironment (Gomaa AI et al, 2008).
Oxidative stress, steatosis and insulin resistance have been identified as procarcinogenic
cofactors in chronic HCV infections (McGivern DR et al, 2009).
A second hypothesis is that interactions between host and viral proteins may have a
direct role in HCV-related HCC through the modulation of cellular proliferation, apoptosis
and immunological responses (Pang R et al, 2005). In fact HCV core and non-structural
proteins can modulate several tumor suppressor genes and their targets and activate
different intracellular pathways. HCV core protein has been found to bind to p53 (Ray RB et
al, 1997), p73 (Alisi A et al, 2003) and pRb (Cho J et al, 2001). In particular, core and non-
structural proteins can modulate cell-cycle control by regulating the cyclin-dependent
inhibitor p21/Waf, a target of p53 (Uchida M et al, 2002).
Various studies have shown the role of core proteins in the regulation of three
different pathways involved in cell proliferation. Viral proteins can activate the Raf1/MAPK
thus promoting cell proliferation (Hayashi J et al, 2000) and the Wnt/β-catenin pathway,
which can control DNA synthesis and cell-cycle progression (Fukutomi T et al, 2005). Core
proteins modulate also TGFβ signaling, which is involved in cell proliferation, apoptosis, and
differentiation (Shin JY et al, 2005).
The association between heavy and prolonged alcohol consumption (more than 50-70
g/day) with both HCC incidence and mortality was found in the mid eighties (Nanji AA et al,
1985). Alcohol ingestion can lead to the development of HCC through several mechanisms:
as a carcinogen, leading to the development of cirrhosis, and with a synergistic effect with
other risk factors, such as HBV and HCV (Gao J et al, 2012). Some data demonstrated that
among consumers of alcohol, the risk of developing HCC increases linearly with a daily intake
of more than 60 grams; the simultaneous presence of HCV infection increases about 2-fold
7
the risk of hepatocellular carcinoma development (Donato F et al, 2002). Other studies
confirmed the interaction between alcohol assumption and risk factors like diabetes, obesity
and smoking (Wang LY et al, 2003; Yuan JM et al, 2004; Singal AK et al, 2007; Chuang SC et
al, 2009).
Aflatoxins are mycotoxins produced by Aspergillus parasiticus and Aspergillus Flavus.
Under favourable conditions, like warm and damp environment, these fungi grow and
colonize many types of foods such as grain, corn and peanuts. In particular, Aflatoxin B1
(AFB1) was classified as group I carcinogen by the International Agency for Research on
Cancer (IARC, 1987). After ingestion, AFB1 requires metabolic conversion to its active
intermediate, AFB1-exo-8,9-epoxide, in order to bind DNA and cause damage (Garner RC et
al, 1972). In particular, a G>T mutation of the p53 gene at codon 249 has been associated
with AFB1 exposure; this mutational inactivation has been observed in 30%-60% of HCC
developed in geographical areas that are endemic for AFB1 (Bressac B et al, 1991; Turner PC
et al, 2002). Several authors have demonstrated an association between AFB1 exposure and
HBV infection (Yeh FS et al, 1989; Qian GS et al, 1994) and that the interaction of both risk
factors increased the risk of hepatocarcinogenesis by interfering with the ability of
hepatocytes to metabolize aflatoxins (Smela ME et al, 2001; Williams JH. et al. 2004).
The investigation of different mechanisms leading to hepatocarcinogenesis points to
common pathogenetic pathways and processes involving, in particular, p53 inactivation or
mutation, inflammation, continuous cycles of necrosis and regeneration, and oxidative
stress, underlying their essential contribute in HCC development (Farazi PA et al, 2006).
1.3. Molecular mechanisms
As described above, many studies over the years have identified major risk factors for
HCC, even if little is known about the molecular mechanisms that contribute to HCC
development.
Growing evidence suggests that gradual accumulation of mutations and genetic
changes in preneoplastic hepatocytes cause malignant transformation leading to HCC
development (El-Serag et al, 2007).
The neoplastic evolution of HCC is a multi-step process (Farazi PA et al, 2006). Different
etiologic agents (hepatitis virus infection, toxins, alcohol, etc.) are able to induce hepatic
injury followed by necrosis and hepatocyte regeneration; this setting of chronic liver disease
can then progress to cirrhosis, a predisposing condition to hepatocarcinogenesis, which

8
becomes manifest after 20-40 years of latency (El-Serag HB et al, 2007). The cirrhosis process
is characterized by the formation of abnormal liver nodules surrounded by collagen
deposition and scar tissue. Afterwards, the first step towards HCC is the formation of
hyperplastic nodules of regenerating hepatocytes followed by the appearance of dysplastic
nodules. The latter pre-malignant lesions consist of abnormal liver architecture with an
increase in trabecular thickening and including clear cells, enriched in glycogen or lipids
deposits, and nuclear crowding. These dysplastic nodules can develop into HCC and acquire
invasive and metastatic ability (Okuda K., 2000). HCC can be graded in well, moderately and
poorly differentiate HCC. A tumor can be defined as well differentiated when cell
morphology is similar to normal hepatocytes. Conversely, in poorly differentiated tumors,
the cells are large and often share common morphological aspects with those of other
metastatic tumors; they represent in fact the most malignant type of primary HCC.
Shortening of telomeres is a mechanism involved in chronic liver disease and cirrhosis
(Urabe Y et al, 1996; Miura N et al, 1997; Rudolph KL et al, 2001; Kitada T et al, 1995); it has
a role in cancer initiation and contributes to the induction of chromosomal instability (Plentz
RR et al, 2004 and 2005; Farazi PA et al, 2003). Telomerase reactivation has been associated
with malignant progression; it is necessary to restore chromosomal stability to a level
compatible with cancer cell viability (Farazi PA et al, 2003 and 2006).
The molecular analysis of human HCC has revealed the accumulation of genetic and
epigenetic modifications that cause significant changes in gene expression and in cellular
signaling pathways (Aravalli RN et al, 2013). The loss of cell-cycle checkpoints is one of the
most frequent alterations in HCC; in particular, p53 and Rb proteins are the most affected
(El-Serag HB. et al. 2007).
p53 is a critical tumor suppressor; its pathway prevents cell survival and proliferation
during shortening of telomeres (Wright WE et al, 1992), triggers apoptosis in genotoxic
stress conditions (Speidel D. et al, 2015), induces cell-cycle arrest in response to oncogene
activaction (Di Micco R et al, 2006) and promotes genome integrity (El-Serag HB et al, 2007).
Under normal conditions, p53 cellular levels are low; they are immediately up
regulated after intracellular and extracellular stress signals. In half of all human tumors
inactivation of the p53 gene is due to a single point mutation, in others, the expression of
the p53 protein is not affected but cell signaling pathways involved in cell cycle arrest and
apoptosis are defective (Stegh AH, 2012). Several studies have shown a critical role of p53
mutation or inactivation in HCC (Bressac B et al, 1991; Tannapfel A et al, 2001; Jablkowski M

9
et al, 2005; Hsu IC et al, 1993; Lunn RM et al, 1997). Therefore, disruption of p53 checkpoint
function at the cirrhosis stage could provide a selective advantage allowing proliferation of
hepatocytes with a critical telomere lenght (El-Serag HB et al, 2007).
The tumor suppressor retinoblastoma protein (Rb) is a major regulator of cell cycle in
response to telomere shortening, DNA damage, and oncogene activaction (Wright WE et al,
1992; Di Micco R et al, 2006). The G1 to S phase transition is regulated by the
hypophosphorylated Rb gene which sequesters the E2F family of transcription factors
inhibiting the expression of genes required for entry into S phase. The phosphorylation state
of Rb is tightly regulated by cyclin-dependent kinases (CDKs) (Goodrich DW. 2006). In human
HCC, a deregulation of Rb pathway is observed in more than 80% of cases, with a frequent
repression of the CDK inhibitor p16 due to promoter methylation (Azechi H et al, 2001).
Besides p53, an impairment of the Rb checkpoint would allow an expansion of hepatocytes
with altered telomeres during the cirrhosis stage (El-Serag HB et al, 2007).
Increasing evidence suggests enhanced levels of ROS and RNS (reactive nitrogen
species) in many types of cancer cells (Kawanishi S et al, 2006; Marra et M al, 2011; Chuma
et al, 2008). ROS are defined as oxygen-containing chemical species with reactive properties.
They are produced continuously in cells and derive from metabolic reactions occurring in the
mitochondria (Handy DE et al, 2012), peroxisomes (Schrader M et al, 2006) and endoplasmic
reticulum (Malhotra JD et al, 2007). Important free radicals in humans, include superoxide
(O2.-), hydroxyl (HO.) and nitric oxide (NO), as well as non-radical molecules such as hydrogen
peroxide (H2O2) Cells have developed a complete set of antioxidant mechanisms to
counteract and limit damaging effects of free radical formation. These include the enzymes,
superoxide dismutase (SOD), glutathione peroxidase (GSH) and catalase. There are further
antioxidant defences including Vitamin C and E. At moderate levels, ROS can promote cell
proliferation and differentiation (Boonstra J et al, 2004; Schafer FQ et al, 2001). However,
the disruption of the redox balance induces high ROS levels that promote cell death and
cellular damage (Toyokuni S et al, 1995).
Especially at early stages, cancer cells try to contrast damaging ROS effects, increasing
ROS scavengers activity that reduce ROS to levels that are compatible with cellular biological
functions, but still higher than in normal cells (Gorrini C et al, 2013).
Some of the more frequently activated oncogenic pathways found in human HCC
include the Wnt/β-catenin, MAPK AKT/mTOR and JAK/STAT (Aravalli et al, 2013).
10
β-catenin is the critical downstream effector in Wnt signaling pathway where it
mediates a nuclear response after the binding of Wnt proteins to Frizzled receptors at the
plasma membrane. In unstimulated adult cells, when the Wnt pathway is inactive, β-catenin
is recruited into a destruction complex with Axin, adenomatous polyposis coli (APC), casein
kinase 1 (CK1) and glycogen synthase kinase-3β (GSK-3β). CK1 and GSK-3β phosphorylate β-
catenin at specific residues (Amit S et al, 2002) which results in β-catenin recognition by the
β-transducin repeat-containing protein (βTrCP) for ubiquitination and subsequent
proteasomal degradation (Monga SP. 2014).
Binding of Wnt proteins to the Frizzled (Fz) receptor induces the disruption of the
complex resulting in cytoplasmic accumulation of β-catenin and nuclear translocation. In the
nucleus, β-catenin binds to the LEF/TCF (lymphoid enhancer factor or T-cell factor), exerting
its function through the transcriptional regulation of its target genes (Logan CY et al, 2004).
β-catenin target genes are involved in embryonic and tissue development, cellular
differentiation, survival, regeneration, self-renewal and in oncogenic transformation of
several cell types, including hepatocytes (Cadigan KM et al, 1997; Nusse R et al, 2005; Peifer
M et al, 2000; Willert K et al, 2004.). The aberrant activation of this pathway has been found,
in about 20-40% of HCC cases, linked to activating β-catenin mutations (De la Coste A et al,
1998; Zucman-Rossi J et al, 2007).
MAPK (mitogen-activated protein kinase) cascade transduces signals from tyrosine
kinase receptors, such as EGFR (Epidermal growth factor receptor), IGFR (Insulin growth
factor receptor), PDGFR (Platelet derived growth factor receptor), MET, VEGFR (Vascular
endothelial growth factor receptor), upon the binding to their ligands. In this cascade, active
Ras (GTP-Ras) causes the sequential activation of Raf, Mek and Erk. The latter transactivates
numerous growth-related genes such c-Jun, c-Fos, c-Myc. MAPK signaling is involved in cell
survival, differentiation, adhesion and proliferation (Roberts PJ et al, 2007; Schmidt CM et al,
1997). Moreover, it is often found to be deregulated in various types of human tumors,
including HCC (Huang P et al, 2010; Wagner EF et al, 2009).
The PI3K/Akt/mTOR pathway also plays an important role in cell growth, survival
regulation, metabolism, and inhibition of apoptosis (Kudo M. 2012). It acts through
phosphatidylinositol-3-kinase (PI3K) and generation of phosphatidyl inositol 3,4,5-
triphosphate (PIP3), which binds to and activates the serine/threonine kinase Thymoma viral
protooncogene (Akt/PkB) (Woodgett JR. 2005). Activation of Akt signaling and impaired
expression of phosphatase and tensin homolog (PTEN) (a negative regulator of Akt) have

11
been reported in 40%–60% of human HCC (Hu TH et al, 2003). The serine/threonine kinase
mTOR (mammalian target of rapamycin) is an important mediator in the PI3K/Akt pathway,
that regulates protein synthesis mediating cell growth (Engelman JA et al, 2009).
Signal transducers and activators of transcription (STATs), which consist of a family of
transcription factors, are activated by a large number of cytokines, hormones, and growth
factors (Harrison DA. 2012) through tyrosine phosphorylation by Janus kinases (JAKs).
Activated STATs stimulate the transcription of suppressors of cytokine signaling (SOCS) genes
and their proteins that act to negatively regulate receptor complexes by inactivating JAKs or
blocking recruitment sites for STATs. The JAK/STAT pathway activates cell proliferation,
migration, differentiation, and apoptosis (Yoshikawa H et al, 2001). The activation of
JAK/STAT pathway as consequence of a deregulation of SOCS has been reported in HCC
(Calvisi DF. et al. 2006)
1.4. Clinical aspects
The knowledge of the main risk factors, and the mechanisms through which these act,
could help to reduce the incidence of HCC, through appropriate prevention that aims to limit
viral transmission and alcoholism. The spread of HBV infection can be effectively reduced by
vaccination. In Italy a mandatory vaccination policy was introduce in 1991 for all new borns
and 12 year old adolescents, and a screening for women in the third quarter of pregnancy
(Zanetti AR et al, 2008). To date, unfortunately, there is no vaccine against HCV and
prevention of infection should focus on proper health care conditions. Moreover, public
awareness regarding the risks of excessive alcohol consumption might contribute to the
reduction of HCC risk (Bruix J et al, 2004).
If effective primary prevention is not possible, other approaches aimed at preventing
the spread of these viruses are necessary in order to remove risk factors and their ability to
induce chronic liver damage and cirrhosis. The effect of antiviral therapy in patients with
chronic hepatitis B or C on the prevention of the development of HCC is controversial.
Therefore, the only strategy is the early detection that can be achieved with a
surveillance program (Bruix J et al, 2004). A liver ultrasonography every 6 months is
recommended only for patients with cirrhosis of any etiology or for those without cirrhosis
but with chronic HBV infection (Bruix J et al, 2011). It is well tolerated and widely available,
and capable of achieving sensitivity of 60–80% and specificity beyond 90%. (Singal A et al,
2009). The serological test of α-fetoprotein (AFP) is no longer recommended for effective
12
surveillance because of its low diagnostic sensitivity and specificity (Singal A et al, 2009; Lok
AS et al, 2010).
Moreover, the histological grade and the staging of the tumor are important
prognostic factors in the management of patients, in assessment of prognosis and in
treatment assignment.
The histologic grading of HCC is usually evaluated by the Edmondson and Steiner (ES)
grading system, which was first described in 1954 (Edmondson HA et al, 1954). The
diagnostic criteria used by the authors to determine the degree of cell differentiation are the
quality of the cytoplasm (quantity, granularity and acidophilia), the nuclear aspect (size and
degree of hyperchromatism) and the nuclear/cytoplasmic ratio. They also included the
cohesive quality, the function and the architecture of tumor cells. Using these criteria the
authors classified tumors into four grades.
Grade I belong to the best differentiated tumors. Its diagnosis is possible only after the
demonstration of more aggressive growths in other parts of the carcinoma with grade II.
Cells in grade II are similar to normal hepatic cells with hyperchromatic and larger
nuclei than normal with an acidophilic, abundant cytoplasm. Acini are frequent and their
lumina of various sizes are often filled with bile or protein precipitate.
In grade III nuclei of tumor cells are progressively larger and more hyperchromatic but
with less cytoplasm; this is acidophilic and with segregation of granular material toward the
cell border. Some breakup or distortion of the usual trabecular pattern is present. Tumor
giant cells are numerous.
Grade IV is characterised by the presence of intensely hyperchromatic nuclei that
occupy a greater portion of the cell with a scanty and less granular cytoplasm. Another
characteristic of these tumors is the loss of trabecular pattern and the lack of cohesiveness
of the cells that would predispose to early and widespread metastases.
Importantly, grading heterogeneity inside a tumor is frequently observed, making
difficult the classification of the tumor (Pawlik TM et al, 2007). Accordingly, and compared to
other carcinomas, HCCs are usually classified in well-, moderately and poorly differentiated
(Paradis V. 2013).
The Barcelona Clinic Liver Cancer (BCLC) staging classification was first published in
1999 (Llovet JM et al, 1999) and has been refined and further developed in 2003 (Llovet JM
et al, 2003). This system is widely accepted to stratify individual tumors according to the
13
different available treatments. In agreement to this staging system, patients can be classified
into five groups: very early, early, intermediate, advanced and end-stage.
The very early stage includes patients with a well compensated cirrhosis, single and
well differentiated HCC, less than 2 cm in size. The diagnosis of tumor is possible only after
surgery and these patients can benefit of curative treatments.
Asymptomatic patients with single HCC smaller than 5 cm in diameter or three nodules
equal or less than 3 cm compose the early stage (Mazzaferro V et al, 1996). These patients
with preserved liver function are candidate to curative treatments.
The intermediate stage is formed by patients with large, multifocal HCCs, who are
asymptomatic and without an invasive pattern, defined as macrovascular invasion or
extrahepatic spread. In these patients the transarterial chemoembolization (TACE) is
considered the elective treatment.
The advanced stage is characterized by patients with mild cancer-related symptoms
and an invasive pattern. Until very recently, there was no effective treatment and patients
were therefore candidates for therapeutic trials.
The end-stage is characterized by an extensive tumor involvement and an impaired
physical status. It also includes patients with severe impairment of liver function and
unsuitable for transplantation. The expected survival is shorter than 3–6 months and these
patients should be treated only with palliative therapies.
In according with BCLC system, patients can therefore be assigned to different
therapeutic strategies. Patients diagnosed at an early stage can undergo curative treatments
such as surgical resection, transplantation or percutaneous ablation; they offer a high rate of
complete responses and, thus, potential for cure. Treatment options for HCC include also
palliative care, which is not aimed to cure, but in some cases can obtain good response rate
and even improve survival (Llovet JM et al, 2003). Unfortunately, only 30%-40% of patients
benefit of these treatments in western countries and hence the vast majority receive
palliative therapy (Bruix J et al, 2002).
Surgical resection is reserved to patients with very early and early stage HCC and
without portal hypertension (Bruix J et al, 1996). This patients are the best candidates for
the resection of a hepatic segment, with survival rates exceeding 60%-70% at 5 years; the
major pitfall is the high rate of tumor recurrence being more than 50% at 3 years during
follow-up (Llovet JM et al, 2003).
14
Liver transplantation is the treatment option for patients with early HCC in
decompensated cirrhosis; the 5-year survival rate is over 70% and the risk of tumor
recurrence is less than with surgery (Llovet JM et al, 2003). The main obstacle of this
treatment is the paucity of donor livers; it increases the waiting time for transplantation and
leads to patients drop out from the waiting list as a consequence of HCC progression. The
monthly drop-out rate is around 4% (Sarasin FP et al, 2001; Llovet JM et al, 2005)
Percutaneous ablation is the treatment of choice for early, unresectable HCC (Livraghi
T et al, 1995; Lencioni R et al, 1997; Rossi S et al, 1996; Buscarini L et al, 2001; Okada S et al,
1999). Destruction of tumor tissue can be obtained by direct injection of chemical
substances (ethanol, acetic acid, boiling saline) or by physical modification of the cancerous
tissue temperature (radiofrequency, microwave, laser, cryotherapy) (Okada S et al, 1999).
This treatment modality has the advantage of a very short hospitalization, low cost and rare
complications (Livraghi T et al, 1995). Efficacy of percutaneous ablation, defined as absence
of contrast uptake on computerized tomography one month after the procedure (Bruix J et
al, 2001), greatly depends on tumor size. It decreases from 90-100% in HCCs less than 2 cm,
with a survival rate a 5-years of 71%, to 70% in HCCs sized 2–3 cm and 50% in HCCs sized 3–5
cm (Okada S et al, 1999; Mazzanti R et al, 2004a,b).
Palliative treatments can be proposed to patients in intermediate and advanced tumor
stage that do not benefit from curative interventions. They include transarterial
chemoembolization (TACE), transarterial embolization alone (TAE), intra-artery
chemotherapy (IACT) and radiation therapy (Mazzanti R et al, 2007). Systemic chemotherapy
with several kinds of drugs as well as hormonal therapy have been shown to be ineffective in
the treatment of HCC, toxic, and without survival benefits (Bruix J and Sherman M. 2005).
Among palliative treatments only TACE with cisplatin or doxorubicin has been proven to
improve survival (Llovet JM and Bruix J, 2003); it is indicated in patients with intermediate
stage HCC or early tumors in which curative treatments are unfeasible (Mazzanti R et al,
2008). Chemoembolization combines selective injection of chemotherapeutic drugs into the
hepatic artery with obstruction of the vessels feeding the tumor. Despite the large use of
TACE in treatment of unresectable HCCs, an universally standard protocol is currently not
available. Patients with portal thrombosis or advanced disease in which TACE treatment is
not recommended could ameliorate their survival by IACT (Mazzanti R et al, 2008); a pilot
study has shown a benefical effect of 5-fluorouracil (5-FU) infusion on response rate and
survival (Mazzanti R et al, 2004a).
15
The advent of targeted therapies and the approval of the systemic treatment of
advanced HCC with the kinase inhibitor sorafenib have provided some hope for the future.
Currently, only sorafenib is approved for HCC treatment; however, it improves survival by
only a couple of months. Consequently, HCC remains one of the few cancer types with an
increasing cancer-related mortality. Although no definite breakthrough in treatment is
currently in sight, new therapeutic targets have recently come to the spotlight. One of these
targets is the tyrosine kinase receptor for the Hepatocyte Growth Factor (HGF), encoded by
the MET gene, known to promote tumor growth and metastasis in many human organs.
1.5. Animal model of hepatocarcinogenesis
Due to the multistage nature of HCC, the molecular pathogenesis of this cancer cannot
be properly understood without more information on the molecular alterations
characterizing its early development. Unfortunately, the study of the early steps of HCC
development in humans is complicated due to the late stage in which the tumor is diagnosed
and to the heterogeneity inside a tumor that makes difficult a clinical classification.
Therefore, animals model that enable dissection of the several steps of
hepatocarcinogenesis are required.
In my thesis we used two different rodent models of hepatocarcinogenesis to
investigate which alterations found in HCC could take place at early stages of the process,
suggesting therefore their possible critical role.
The first model employed was the rat Resistant-Hepatocyte (R-H). The R-H or Solt-
Farber rat model (Solt DB et al, 1977) allows the identification of phenotypically distinct
lesions along the various steps of liver carcinogenesis in the rat (early nodules, adenomas,
early HCCs, and advanced HCCs).
This experimental model constists of a classical initiation-promotion procedure:
initiation of hepatocytes is determined by a single necrogenic dose of diethylnitrosamine
(DENA); promotion is achieved by 2 weeks of dietary exposure to 2-acetylaminofluorene (2-
AAF), that selectively inhibits the proliferation of normal hepatocytes and 2/3 partial
hepatectomy (PH) as a growth stimulus for DENA-initiated hepatocytes.
Initiated cells, unlike normal hepatocytes, are indeed capable to clonally expand and
rapidly give rise to early preneoplastic lesions identifiable by their positivity to the placental
form of the enzyme glutathione-S-transferase (GSTP). During the carcinogenic process, the
vast majority of the preneoplastic lesions re-differentiate througha process named

16
remodeling (Enomoto K et al, 1982) with a gradual loss of the GSTP and other preneoplastic
markers (Perra A et al, 2009). Only persistent nodules progress, to adenomas and early HCCs
(eHCCs) clearly visible at about 10 months after DENA initiation. Fourteen months after
initiation, all rats present advanced HCCs (aHCCs).
Previous studies allowed to distinguish within GSTP+ preneoplastic lesions, , a
subpopulation of persistent nodules that express the intermediate filament protein
cytokeratin 19 (KRT-19) (Andersen JB et al, 2010).
KRT-19 is expressed in normal adult liver only in epithelial cells of the bile ducts, but
not in hepatocytes. Its abnormal expression is found in several pathological conditions
including remodeling of the parenchyma in livers with chronic hepatitis or cirrhosis,
capillarization of hepatic sinusoids and ductular oval cell proliferation (Su Q et al, 2003).
A comparative analysis of the gene expression profiles of early preneoplastic lesions
and of early and advanced HCCs, has revealed a common signature, thus demonstrating
their ability to progress to HCC, giving rise to almost all HCCs generated in the Resistant
hepatocyte model (Andersen JB et al, 2010). Furthermore, the gene expression signature
associated with the rat lesions positive for the stem/progenitor cell marker KRT-19 predicts
the clinical outcome of human HCC, giving a translational value to this model (Petrelli A et al,
2014).
In the second animal model, female C3H/HeNCrl mice were treated chronically with
repeated doses of the CAR (Constitutive androstane receptor) ligand TCPOBOP (1,4-bis[2-
(3,5-dichloropyridyloxy)]benzene), with or withouth a single administration of DENA.
TCPOBOP is the most potent nuclear receptor CAR agonist, that similar to
phenobarbital, induces liver hyperplasia and hypertrophy in mice (Dragani TA et al, 1985;
Manenti G et al, 1987) by accelerating the entry of hepatocytes into the S phase of cell cycle
(Ledda-Columbano et al, 2000). Moreover, TCPOBOP is both a nongenotoxic carcinogen on
its own and a potent tumor promoter when combined with genotoxic agents (Diwan BA et
al, 1992; Columbano A et al, 2003; Ledda-Columbano GM et al, 2000; Locker J et al, 2003). In
our study TCPOBOP induces the development of HCCs in mice treated with or without DENA
after 28 and 42 weeks, respectively.
2. Hydroxy acid oxidases
L-2 Hydroxy acid oxidases are flavin mononucleotide (FMN)-dependent peroxisomal
enzymes. Although their role is still unknown, these enzymes are members of the
17
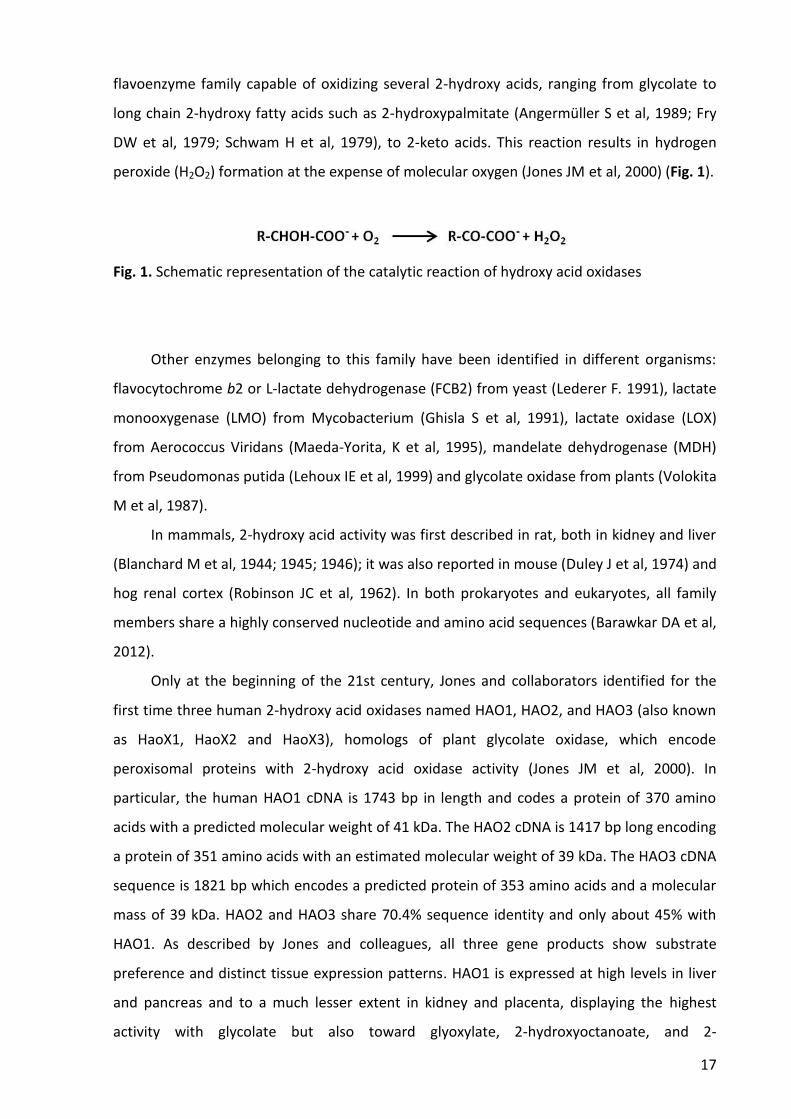
flavoenzyme family capable of oxidizing several 2-hydroxy acids, ranging from glycolate to
long chain 2-hydroxy fatty acids such as 2-hydroxypalmitate (Angermüller S et al, 1989; Fry
DW et al, 1979; Schwam H et al, 1979), to 2-keto acids. This reaction results in hydrogen
peroxide (H2O2) formation at the expense of molecular oxygen (Jones JM et al, 2000) (Fig. 1).
Fig. 1. Schematic representation of the catalytic reaction of hydroxy acid oxidases
Other enzymes belonging to this family have been identified in different organisms:
flavocytochrome b2 or L-lactate dehydrogenase (FCB2) from yeast (Lederer F. 1991), lactate
monooxygenase (LMO) from Mycobacterium (Ghisla S et al, 1991), lactate oxidase (LOX)
from Aerococcus Viridans (Maeda-Yorita, K et al, 1995), mandelate dehydrogenase (MDH)
from Pseudomonas putida (Lehoux IE et al, 1999) and glycolate oxidase from plants (Volokita
M et al, 1987).
In mammals, 2-hydroxy acid activity was first described in rat, both in kidney and liver
(Blanchard M et al, 1944; 1945; 1946); it was also reported in mouse (Duley J et al, 1974) and
hog renal cortex (Robinson JC et al, 1962). In both prokaryotes and eukaryotes, all family
members share a highly conserved nucleotide and amino acid sequences (Barawkar DA et al,
2012).
Only at the beginning of the 21st century, Jones and collaborators identified for the
first time three human 2-hydroxy acid oxidases named HAO1, HAO2, and HAO3 (also known
as HaoX1, HaoX2 and HaoX3), homologs of plant glycolate oxidase, which encode
peroxisomal proteins with 2-hydroxy acid oxidase activity (Jones JM et al, 2000). In
particular, the human HAO1 cDNA is 1743 bp in length and codes a protein of 370 amino
acids with a predicted molecular weight of 41 kDa. The HAO2 cDNA is 1417 bp long encoding
a protein of 351 amino acids with an estimated molecular weight of 39 kDa. The HAO3 cDNA
sequence is 1821 bp which encodes a predicted protein of 353 amino acids and a molecular
mass of 39 kDa. HAO2 and HAO3 share 70.4% sequence identity and only about 45% with
HAO1. As described by Jones and colleagues, all three gene products show substrate
preference and distinct tissue expression patterns. HAO1 is expressed at high levels in liver
and pancreas and to a much lesser extent in kidney and placenta, displaying the highest
activity with glycolate but also toward glyoxylate, 2-hydroxyoctanoate, and 2-
18
hydroxypalmitate. High expression levels of HAO2 were detected both in liver and kidney
with small amounts also in thymus. It is preferentially active against long chain 2-hydroxy
acids, in particular 2-hydroxyoctanoate or 2-hydroxypalmitate. HAO3 is found to be
expressed primarily in pancreas with 2-hydroxyoctanoate as substrate.
Very few data are available in the literature about human 2-hydroxy acid oxidases; to
date, their functional role remains to be identified.
Some studies focused on Hao2 have been conducted in rat models of genetic
hypertension, in order to investigate genetic determinants of blood pressure regulation. In
fact, Hao2 has been identified as a candidate gene for the systolic blood pressure
quantitative trait loci (QLT) in rats (Lee SJ et al, 2003); another genome-wide linkage study
seemed to confirm the potential relation between Hao2 and hypertension in humans (Rico-
Sanz J et al, 2004). To establish the involvement of Hao2 in blood pressure regulation,
several authors, availing themselves of the rat Hao2 crystal structure (Cunane LM et al,
2005) developed potent and selective rat Hao2 inhibitors (Barawkar DA et al, 2011; 2012)
that seem to inhibit Hao2 leading to a reduction of blood pressure in the rat hypertension
models analysed.
Another study (Ma Q et al, 2007) showed the possible role of Hao2 in the treatment of
patients with sickle cell anemia in response to hydroxyurea, a drug that increases
concentration of fetal hemoglobin (HbF) inhibiting the polymeration of sickle hemoglobin
(HbS). This study suggests that single nucleotide polymorphisms (SNPs) of several genes,
including Hao2, are associated with the HbF response to treatment with hydroxyurea.
In their work on the identification of the three human hydroxy acid oxidases (Jones JM
et al, 2000), Jones and coworkers hypothesized their possible contribution in α-oxidation of
fatty acids. Their oxidative metabolism can proceed by distinct pathways, including α-, β-
and ω-oxidation (Wanders RJ et al, 2011).
The discovery of fatty acid α-oxidation is closely related to the finding of high amounts
of phytanic acid in kidney, liver and brain of patients affected with Refsum disease, a rare
genetic disease characterized by retinitis pigmentosa polyneuropathy, deafness, ataxia,
ichthyosis and cardiac manifestations.
α-oxidation in humans is a process in which 3-methyl branched fatty acids, such as
phytanic acid, are shortened to 2-methyl branched fatty acids, which can then be further
degraded by peroxisomal and mitochondrial β-oxidation (Fig. 2). Despite several studies
some of the individual enzymatic steps remain to be identified. Research focused on the
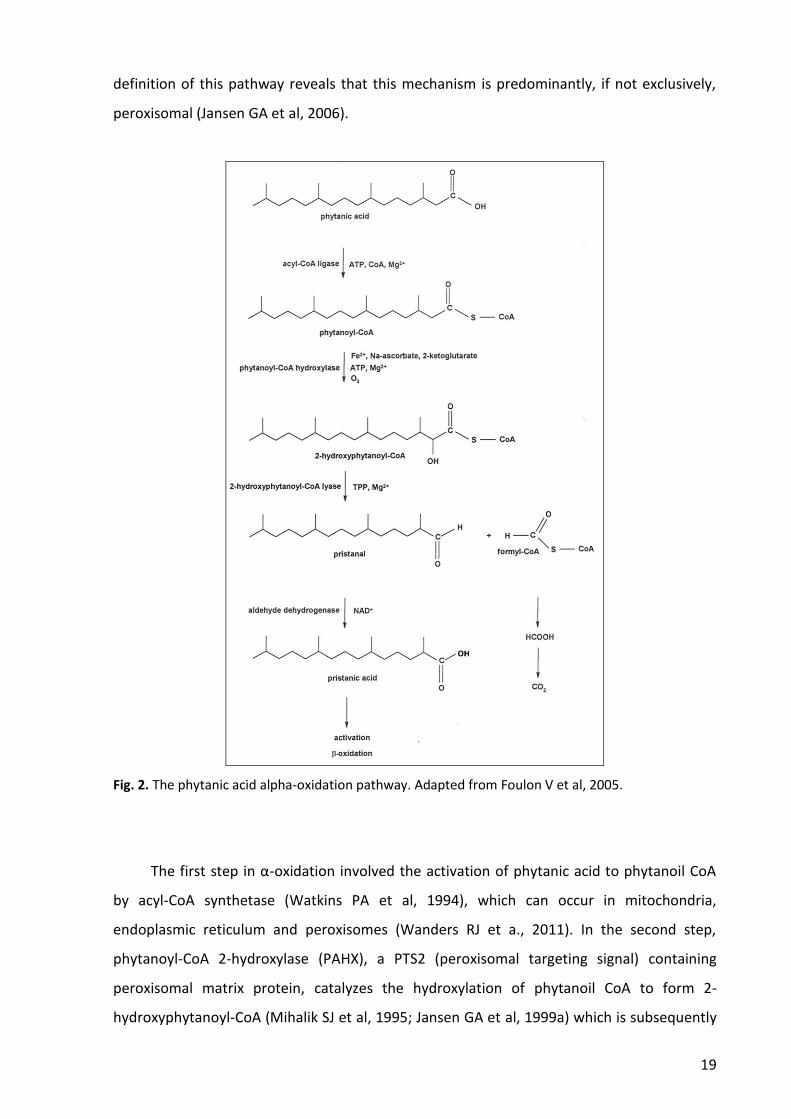
19
definition of this pathway reveals that this mechanism is predominantly, if not exclusively,
peroxisomal (Jansen GA et al, 2006).
Fig. 2. The phytanic acid alpha-oxidation pathway. Adapted from Foulon V et al, 2005.
The first step in α-oxidation involved the activation of phytanic acid to phytanoil CoA
by acyl-CoA synthetase (Watkins PA et al, 1994), which can occur in mitochondria,
endoplasmic reticulum and peroxisomes (Wanders RJ et a., 2011). In the second step,
phytanoyl-CoA 2-hydroxylase (PAHX), a PTS2 (peroxisomal targeting signal) containing
peroxisomal matrix protein, catalyzes the hydroxylation of phytanoil CoA to form 2-
hydroxyphytanoyl-CoA (Mihalik SJ et al, 1995; Jansen GA et al, 1999a) which is subsequently

20
decarboxylated to pristanal and formyl-CoA by 2-hydroxyphytanoyl-CoA (Foulon V et al,
1999; Jansen GA et al, 1999b). In the last step, pristanal is converted into pristanic acid in a
reaction catalized by aldehyde dehydrogenase (Jansen GA et al, 2001) which is then further
degraded by peroxisomal β-oxidation.
Alternatively to this model, some reports indicate a second pathway in which fatty acid
α-oxidation may involve the formation of 2-ketophytanic acids intermediate from 2-
hydroxyphytanic acids, both in rat and human liver (Fig. 3) (Wanders RJ et al, 1995; Vamecq,
J. et al, 1988; Verhoeven, NM et al, 1997; Wanders RJ et al, 1994).
Fig. 3. Formation of pristanic acid from 2-hydroxyphytanic acid. Adapted from Verhoeven NM et al, 1997.
These studies suggest that, at least in rat liver, this conversion is catalyzed by an
enzyme localized in peroxisomes which uses molecular oxygen as second substrate. The
subsequent finding that the formation of 2-ketophytanic acid is strongly reduced if
molecular oxygen is substituted by nitrogen, and it is also associated with H2O2 formation,
further supports the involvement of an oxidase in the reaction.
Unfortunately, this mechanism is still under debate and to date the role of hydroxy
acid oxidases still needs to be clarified.
As previously described, hydroxy acids oxidase are peroxisomal enzymes and produce
H2O2 as part of their normal catalytic cycle. In 2003, Recalcati and colleagues showed in rat a

21
down-regulation of Hao1 in response to oxidative stress, thus providing that a decrease of
this ROS producing enzyme may prevent excessive H2O2 formation in liver peroxisomes
(Recalcalti S et al, 2003).
Peroxisomes are subcellular organelles bounded by a single membrane, which are
present in the majority of eukaryotic cells. They were isolated and characterized by de Duve
that defined them as a cell organelle which contains at least one H2O2-producing oxidase
together with catalase, a H2O2-degrading enzyme (de Duve C. 1965). Mammalian
peroxisomes play a pivotal role in metabolic pathways, including fatty acids α- and β-
oxidation, ether-phospholipid biosynthesis, glyoxylate metabolism, amino acid catabolism,
polyamine oxidation, and the oxidative part of the pentose phosphate pathway (Wanders RJ
et al, 2006). Many of the enzymes participating in these pathways produce ROS and RNS as
byproducts of their catalytic reactions (Antonenkov VD et al, 2010). It has been estimated
that peroxisomes contribute to 35% of the H2O2 production in rat liver (de Duve C et al,
1966), inducing oxidative stress; this is also confirmed by the long-term administration of
peroxisome proliferators in rodent liver cells (Kasai H et al, 1989).
Numerous observations indicate also that peroxisomes contain various ROS-
metabolizing enzymes protecting cells from oxidative stress and accounting for 20% of the
oxigen consumption in rat liver (Boveris A et al, 1972). Indeed, an abnormal functioning of
peroxisomes causes increase apoptosis in the development of mouse cerebellum (Krysko O
et al, 2007); in humans, an inherited deficiency of catalase, the most abundant peroxisomal
ROS-metabolizing enzyme, induces an increased risk of developing age-related diseases such
as diabetes, atherosclerosis, and cancer (Góth L et al, 2000).
These findings collectively suggest the idea that peroxisomal metabolism and cellular
oxidative stress are closely interconnected (Fransen M et al, 2012; Bonekamp NA et al, 2009;
Schrader M et al, 2006).
Overall, very few data are present in literature about hydroxy acid oxidases and their
role is still unclear.
The role of Hao2 in cancer is still unknown. A study of gene expression profiles for
human intrahepatic cholangiocarcinoma showed among down-regulated genes also Hao2
(Wang AG et al, 2006), although no hypothesis about its role have been proposed by the
authors.

22
AIM OF THE WORK
Previous microarray analysis done in our laboratory has shown that Hao2 was one of
the most down-regulated genes in advanced HCCs developed with the R-H model of
hepatocarcinogenesis. Since its role is still unclear and no studies are reported in the
literature about Hao2 and cancer, the aim of my PhD thesis was to shed light on the possible
role of Hao2 in HCC development, in two different rodent models and in two distinct cohorts
of human patients. Furthermore, using a multistage model of rat hepatocarcinogenesis, I
also wished to determine whether alterations of the expression of Hao2 could take place at
early stages of the tumorigenic process.
23
MATERIALS AND METHODS
1. Animals and Treatments
Male Fischer 344 (F-344) rats and female C3H/HeNCrl mice were purchased from
Charles River Laboratories (Milano, Italy). Before starting experimental procedures, animals
were housed at constant room temperature (25°C) and 12 hours light/dark cycles and fed
with rodent standard diet (Mucedola, Milano, Italy) and ad libitum access to water. Guide for
Care and Use of Laboratory Animals were followed during the investigation. All animal
procedures were approved by the Ethical Commission of the University of Cagliari and the
Italian Ministry of Health.
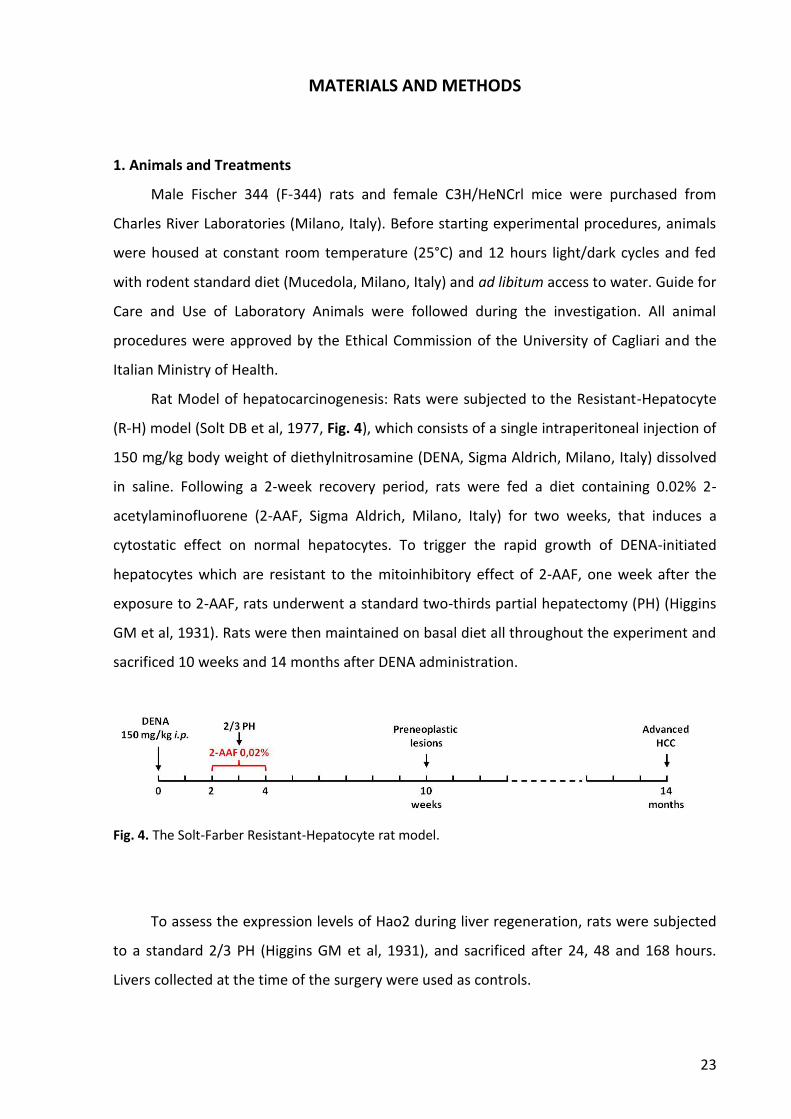
Rat Model of hepatocarcinogenesis: Rats were subjected to the Resistant-Hepatocyte
(R-H) model (Solt DB et al, 1977, Fig. 4), which consists of a single intraperitoneal injection of
150 mg/kg body weight of diethylnitrosamine (DENA, Sigma Aldrich, Milano, Italy) dissolved
in saline. Following a 2-week recovery period, rats were fed a diet containing 0.02% 2-
acetylaminofluorene (2-AAF, Sigma Aldrich, Milano, Italy) for two weeks, that induces a
cytostatic effect on normal hepatocytes. To trigger the rapid growth of DENA-initiated
hepatocytes which are resistant to the mitoinhibitory effect of 2-AAF, one week after the
exposure to 2-AAF, rats underwent a standard two-thirds partial hepatectomy (PH) (Higgins
GM et al, 1931). Rats were then maintained on basal diet all throughout the experiment and
sacrificed 10 weeks and 14 months after DENA administration.
Fig. 4. The Solt-Farber Resistant-Hepatocyte rat model.
To assess the expression levels of Hao2 during liver regeneration, rats were subjected
to a standard 2/3 PH (Higgins GM et al, 1931), and sacrificed after 24, 48 and 168 hours.
Livers collected at the time of the surgery were used as controls.

24
Mouse model of hepatocarcinogenesis: Mice were randomized into two experimental
protocols. The first group (Fig. 5A) was injected intraperitoneally with DENA, dissolved in
saline, at a dose of 90 mg/kg body weight. After one week of recovery period, mice were
treated once a week with the Constitutive Androstane Receptor (CAR) ligand TCPOBOP
(3mg/kg body weight) dissolved in dimethyl sulfoxide (DMSO) and given intragastrically in a
corn-oil solutionl. Matched-aged mice treated only with TCPOBOP were used as controls.
The second group (Fig. 5B) was given weekly intragastric doses of TCPOBOP (3 mg/kg
body weight), in the absence of DENA administration. Matched-aged mice treated with corn
oil were used as control. Mice were sacrificed after 42 weeks of treatment, a time point
when HCCs were observed. Mice treated weekly with corn oil were used as controls.
Fig. 5. Schematic representation of experimental mouse models. HCC was generated by A) a single injection of DENA followed by treatment with the CAR ligand TCPOBOP (once/week/28 weeks), B) repeated doses of the non-genotoxic agent TCPOBOP (once/week/42 weeks), in the absence of DENA pre-treatment.
In both rat and mouse protocols, immediately after the sacrifice, livers were divided
into several sections which were stored according to three different methods. Sections were
fixed in 10% buffer formalin, embedded in paraffin and stored at room temperature for
25
immunohistochemistry staining. Other sections of the liver were snap-frozen in isopentane
(2-Methylbutane) and liquid nitrogen, and immediately kept at -80°C for criosectioning. The
remaining liver was snap-frozen in liquid nitrogen and stored at -80°C for DNA, RNA and
protein extraction.
2. Immunohistochemistry
Isopentane-frozen rat liver sections were serially sliced at 6 µm thickness using a Leica
CM 1950 cryostat, mounted directly on super frost slides (Fisher Scientific, Pittsburgh PA),
and air dried for 5 minutes before immunohistochemical staining.
2.1. Hematoxilin and eosin staining
Liver sections were fixed in acetone at -20°C for 5 minutes and stained for 3 minutes
with Mayer’s haematoxylin and 1% aqueous eosin for 20 seconds. Sections were then
dehydrated through ascending alcohol series, cleared with xylene, air-dried and then
mounted using synthetic mounting and coverslipped.
2.2. Glutathione S-transferase staining
Frozen liver section were fixed in 10% buffer formalin for 6 hours. After several washes
in water and in phosphate buffered saline (PBS), endogenous peroxidase activity was
blocked by 0,3% hydrogen peroxide (Sigma-Aldrich, Milano, Italy) in distilled water for 10
minutes. Unspecific binding sites were then removed by incubating section for 30 minutes in
1:10 normal goat serum in PBS. Slides were then incubated overnight at 4°C with 1:1000
anti-GSTP antibody (MBL, 311, Nagoya, Japan) and with anti-rabbit Horseradish Peroxidase
(HRP) conjugated antibody (Sigma Aldrich, Milano, Italy) at a dilution of 1:300 for 30 minutes
at room temperature. Positive reaction was visualized by 3, 3′-diaminobenzidine (DAB, Sigma
Aldrich, Milano, Italy) for 6 minutes at room temperature. Sections were counterstained
with Harris hematoxylin, dehydrated through graded alcohols, cleared and mounted in
synthetic mounting media.
2.3. Cytokeratin-19 staining
Frozen liver sections were fixed in cold acetone for 20 minutes. Block of endogenous
peroxidases and aspecific sites were performed as described previously for GSTP staining.
Slides were then incubated with primary mouse polyclonal anti-Krt-19 antibody (Novocastra,
26
NCL-CK19, Leica Biosystems, Milano, Italy) at a dilution of 1:100 overnight a 4°C and then
with 1:200 anti-mouse Horseradish Peroxidase (HRP, Sigma-Aldrich, Milano, Italy)
conjugated antibody at room temperature for 30 minutes. Staining was developed with 3,3′-
diaminobenzidine (DAB) for 6 min at room temperature, and then tissue sections were
counterstained with Harris hematoxylin dehydrated in graded alcohols, and mounted in
synthetic mounting media.
3. Laser capture microdissection
Sixteen-μm-thick serial frozen sections were cut and attached to 2-μm RNase free PEN-
membrane slides (Leica, Wetzlar, Germany). Immediately before micro-dissection, frozen
sections were stained by a 2.45 minutes H&E procedure. Briefly, sections were rapidly
hydrated (30 seconds in Ethanol 100 and 95%), stained in Mayer’s hematoxilin for 90
seconds, washed in water for 20 seconds, stained in 0.5% alcoholic Eosin for 10 seconds and
dehydrated by Ethanol 100% for 30 seconds. Then, sections were microdissected by Leica
LMD6000 (Leica Microsystems Inc., Buffalo Grove, IL); the whole procedure was performed
within 20 minutes to prevent RNA degradation. Microdissected lesions were collected into
caps of 0.5 ml microcentrifuge tubes filled with 100 μl of Extraction Buffer (XB) and
incubated for 30 minutes at 42°C. To collect tissue extracts into the microcentrifuge tubes,
samples were centrifugated at 800 x g for two minutes and then frozen at -80°C until
extraction with PicoPure RNA isolation kit (Arcturus, Life Technologies, Monza, Italy).
4. RNA extraction
4.1. RNA isolation using PicoPure RNA isolation kit
Total RNA was isolated from rat micro-dissected lesions (controls, preneoplastic
lesions and HCCs) with PicoPure RNA isolation kit according to manifacturer’s instructions.
Briefly, after pre-condition of the RNA Purification Column with Conditioning Buffer (CB),
100 μl of 70% ethanol was added to the tissue extract, transferred to RNA purification
column and centrifuged at 100 x g for 2 minutes for RNA binding, followed by a quick spin at
16000 x g for 30 seconds to remove flowthrough. RNA Purification Column was then washed
three times by Washing Buffer 1 and 2 and then transferred to a new 0.5 ml microcentrifuge
tube provided by the kit. Sixteen μl of DNase/RNase free distilled water (Gibco, Life
technologies, Monza, Italy) was added; the tube assembly was left to incubate at room
27
temperature for 1 minute and centrifuged at 1000 x g for 1 minute to distribute elution
buffer in the column, followed by spinning at 16000 x g for 1 minute to elute RNA. The
eluted RNA was then stored at -80°C.
4.2. RNA isolation using TRIzol® Reagent
Total RNA from frozen mouse, human tissue and human HCC cell lines was extracted
using TRIzol® Reagent (Invitrogen, Life Technologies, Monza, Italy), according to
manifacturer’s instructions.
Briefly, 1 ml of TRIzol was added to 50-100 mg of hepatic tissue. Samples were
homogenized with a Polytron homogenizer and incubated 5 minutes at room temperature to
permit the complete dissociation of nucleoprotein complex. Then, 0.2 ml chloroform/ml of
TRIzol, were added, shaked by hand for 15 seconds and incubated for 3 minutes at room
temperature. After centrifugation (15 minutes at 12000 x g at 4°C) the mixture was
separated into three phases: a lower red phenol-chloroform phase containing proteins, a
white interphase containing DNA, and a colorless upper aqueous phase containing RNA.
Aqueous phase was transferred into a new tube and RNA was precipitated by addition of
500 ml 100% isopropanol followed by 10 minutes incubation at room temperature and
centrifugation at +4°C at 12000 x g for 10 minutes. The resulting RNA pellet was washed in
75% ethanol and dissolved DNase/RNase free distilled water in at heat block set at 60°C for
10 minutes.
5. Quantitative and qualitative analysis of nucleic acids
Total RNA concentrations and purity ratios (260/280 and 260/230) were measured
using NanoDrop 1000 Spectrophotometer (Thermo Scientific, France). RNA integrity was
assessed by Agilent Bioanalyzer 2100 (Agilent Technologies, Santa Clara, CA, USA) by
evaluating the RNA Integrity Number (RIN). All procedures were performed according to
manufacturer’s protocol. Only RNA samples with a RIN equal to or higher than 7 were
further used in the study.
6. RT-PCR (Reverse Transcription Polymerase Chain Reaction)
To investigate by quantitative real time-PCR (qRT-PCR) mRNA expression levels of
Hao2, total RNA was retro-transcribed to cDNA using the High Capacity cDNA Reverse
Transcription Kit (Applied Biosystem, Life Technologies, Italy).
28
Different amounts of total RNA were diluted in 10 μl of DNase/RNase free distilled
water. The 20 μl reaction mixture contained: 2 μl of RT buffer (10X), 2 μl of Random Primers
(10X), 0.8 μl of dNTP mix (100 mM), 1 μl of MultiScribe Reverse Transcriptase, 1 μl of RNase
Inhibitor and 3.2 μl of DNase/RNase free distilled water and 10 μl of the appropriate total
RNA at the desired concentration. Thermo cycle condition was: 25° C for 10 minutes, 37° C
for 120 minutes and 85° C for 5 minutes, followed by a 4° C hold. Samples were then stored
at -20° C until next use.
7. Quantitative Real Time PCR
Retro-transcribed cDNAs were used for gene expression analysis performed by qRT-
PCR. Reaction mixtures were prepared to a final volume of 10 μl containing: 4 μl of cDNA
template (2.5 ng/μl), 5 μl of 2X TaqMan Gene Expression Master Mix (Applied Biosystem,
Life Technologies, Italy), 0.5 μl of 20X TaqMan assay (Applied Biosystem, Life Technologies,
Italy) and 0.5 μl of RNase free water.
The following TaqMan probes were used for Hao2 gene expression: Rn00583454_m1
for rat, Mm00469507_m1 for mouse and Hs00213002_m1 for human.
Reactions were performed in a ABI PRISM 7300HT thermocycler (Applied Biosystem,
Life Technologies, Italy); the cycle conditions were set as follows: 50° C for 2 minutes and 95°
C for 10 minutes, followed by 40 cycles at 95° C for 15 seconds and at 60° C for 1 minute.
Each sample was analysed in triplicate; the housekeeping genes rat and mouse GAPDH
(glyceraldehyde-3-phosphate dehydrogenase) and human β-actin were used for
normalization. To determine the relative expression levels of Hao2, the 2−ΔΔCT method was
used. The threshold cycle (Ct) value of the target gene was normalized to that of the
endogenous reference and compared with a calibrator.
8. Protein isolation
Rat liver samples were homogenized in RIPA Buffer (1X PBS, 1% Igepal CA-630, 0.5%
sodium deoxycholate, 0.1% SDS) containing protease and phosphatase inhibitor cocktail
(Sigma-Aldrich, Milano, Italy) with a Polytron homogenizer and centrifuged two times at
12000 rpm for 15 minutes at 4 °C. The supernatant was collected in a new tube and stored at
-80 °C.
Proteins from human HCC cell lines were directly extracted using Laemmli buffer (Tris-
HCl 0.5M, pH 6.8, SDS 10%), pre-warmed at 95°C, which was dispensed on cells on a culture
29
dish (after removal of media and washing with PBS). Cells were then gently scraped from the
culture dish and transferred into a 1.5 ml tube. Samples were incubated in an heating block
at 95°C for 3 minutes and then stored at -80°C.
Protein concentrations of both tissue and cell lysates was evaluated with the BCA
Protein Assay kit (Pierce Biotechnology, Rockford, USA) using bovine serum albumin (BSA,
Sigma-Aldrich, Milano, Italy) as standard.
9. Western blotting
Aliquotes of 100 μg of protein were denatured by heating for 10 minutes at 70°C in
NuPAGE® LDS Sample Buffer (4X) (Invitrogen), separated by NuPage Novex Bis-Tris 10% gels
(Invitrogen, Life Technologies, Monza, Italy), and transferred onto nitrocellulose membranes
(Invitrogen, Life Technologies, Monza, Italy) by electroblotting. Membranes were blocked in
5% BSA in Tris-buffered saline (NaCl 5M, Tris-HCl 1M pH 7.4) containing 0.1% Tween 20 (TBS-
T) for 40 minutes and probed with 1:200 goat polyclonal anti-Hao2 antibody (sc-242990,
Santa Cruz Biotechnology, Santa Cruz, CA) in 5% BSA, overnight at 4°C. Membranes were
then incubated with 1:5000 anti-goat horseradish peroxidase (HRP) -secondary antibody
(Santa Cruz Biotechnology, Santa Cruz, CA) in 5% BSA for 90 minutes at room temperature.
After three washes in TBST, proteins were revealed with the Super Signal West Pico (Pierce
Chemical Co., New York, NY). Levels of Hao2 were normalized to the housekeeping gene
anti-actin (A4700, Sigma-Aldrich, Milano, Italy) that was used also as loading control.
10. Cell lines
For all in vitro experiments 9 HCC human cell lines and cells isolated by a HCC bearing
rat (R-H cells, Petrelli A et al, 2014) were used.
HA22T/VGH, Hep3B, HepG2, HuH7, Mahlavu and Sk-Hep-1 were kindly provided by Dr.
Silvia Giordano, IRCC Institute of Candiolo (Turin, Italy). In addition, SNU 182, SNU 398 and
SNU 475 cells were kindly provided by Dr. Laura Gramantieri, St. Orsola-Malpighi University
Hospital (Bologna, Italy). Cells were maintained at 37°C in a 5% CO2 humidified atmosphere.
All culture medium and their constituents were purchased from Gibco (Life Technologies,
Monza, Italy).
HA22T/VGH cells were cultured in RPMI (Roswell Park Memorial Institute)-1640
medium with 10% inactivated fetal bovine serum (FBS, Lonza, Basel, Switzerland), 1%

30
sodium pyruvate, and 1% penicillin-streptomycin. Serum was inactivated in water bath at
56°C for 1 hour.
Hep3B and Sk-Hep-1 were cultured in Minimum Essential Medium (MEM) with 10%
FBS, 1% sodium pyruvate, 1% non-essential amino acids and 1% penicillin-streptomycin.
HepG2 cells were cultured in Dulbecco’s Modified Eagle’s Medium (DMEM)
supplemented with 10% FBS, 1% glutamine and 1% Penicillin-Streptomycin.
HuH7 and Mahlavu cells were cultured in DMEM supplemented with 10% inactivated
FBS, 1% glutamine and 1% penicillin-streptomycin.
SNU 182, SNU 398 and SNU 475 cells were cultured in RPMI-1640 medium with 10%
FBS, 1% glutamine, and 1% penicillin-streptomycin.
The R-H cells were obtained by classical collagenase perfusion techniques from HCC-
bearing rats subjected to the R-H protocol and sacrificed at 14 months. Cells were cultured in
collagen-coated plates, in RPMI-1640 medium with 10% FBS (Petrelli A et al, 2014).
10.1. Stable transduction with Hao2
Human Embryonic Kidney 293 cells (HEK293T, ATCC, Manassas, VA, USA) were
cultured in Iscove’s Modified Dulbecco’s Medium (IMDM, Gibco, Life Technologies, Monza,
Italy) with 10% FBS in a 5% CO2 atmosphere. The HAO2 construct (HsCD00439253) was
purchased from DNASU plasmid repository of the Biodesign Institute, Arizona State
University and cloned into pLX304 (Gateway V5-tagged lentiviral expression vector).
Lentiviral vector for the constitutive expression of HAO2 was produced by transient
transfection of the bidirectional transfer plasmid, the packaging plasmids pMDLg/pRRE and
pRSV.REV, and the vesicular stomatitis virus (VSV) envelope plasmid pMD2.VSV-G (15, 6.5,
2.5, and 3.5 μg, respectively, for 10-cm dishes) in HEK293T cells using the calcium phospate
method (Chen CA et al, 1988). The virus containing medium was collected at 48h from
transfection and used to transduce Mahlavu and R-H cells. Cells were transduced in six-well
plates (105 per well) in 2 ml total medium in the presence of polybrene, an attachment
factor to enhance virus-cell fusion.
10.2. Crystal violet cell growth assay
Both Mahlavu (500 cells/well) and R-H cells (1000 cells/well) and their Hao2
transduced counterpart were seeded in 96-well plates. Cell growth was evaluated by crystal
violet staining 96 hours, 6 days and 8 days after seeding. Cells were fixed with a solution of

31
22% glutaraldehyde in PBS at room temperature on a rotary shaker for 20 minutes and then
washed with PBS. Cells were stained with a crystal violet solution at room temperature on a
rotary shaker for 20 minutes, washed two times in PBS and in distilled water. After air-drying
at room temperature, cells were dissolved in 10% acetic acid in distilled water for 20 minutes
at room temperature on a rotary shaker. One-hundred µl of each sample were than
transferred in a 96-well plate and optical density (OD) was measured at 590 nm (PerkinElmer
2030 Software).
10.3. Soft agar colony formation assay
Anchorage-independent growth was determined by the colony formation assay in soft
agar in wild type and Hao2 transduced, Mahlavu and R-H cells. It was performed in a 24 well
plate embedding 3x10³ cells/well in 0.5% SeaPlaque low melting agarose (BioWhittaker
Molecular Applications-BMA, 50100) on top of a layer of growth medium containing 1%
agar. The cell suspension was incubated in a humidified atmosphere in the presence of 5%
CO2 at 37° C and, after 2 weeks, colonies were stained with crystal violet and quantified by
counting all visible colonies.
10.4. Rat Tumorigenicity Assay
Wild type and stably transduced Hao2 R-H cells (106/rat) in 20% Matrigel Matrix (BD
Biosciences, Milano, Italy) were injected subcutaneously in the right flank of F-344 syngeneic
male rats (n=7 rats for wild-type and n=6 rats for transduced Hao2 R-H cells). Rats were
monitored twice/week for monitoring tumor formation.
11. Human samples
Two cohorts of patients carrying HCC were examined. The first consisted of HCCs and
matched non-neoplastic liver parenchyma obtained from 59 consecutive patients
undergoing liver resection for HCC and 5 liver healthy donors. Specimens and clinico-
pathological data were obtained from the Institute of Pathology, University Hospital of Basel,
Switzerland. All patients gave written informed content to the study, which was approved by
the Ethics Committee of the University Hospital of Basel (EKKB). HCC diagnosis was verified
by pathological examination, no anti-cancer treatments were given before biopsy collection.
Tumor differentiation was defined according to Edmondson’s grading system. Only biopsies
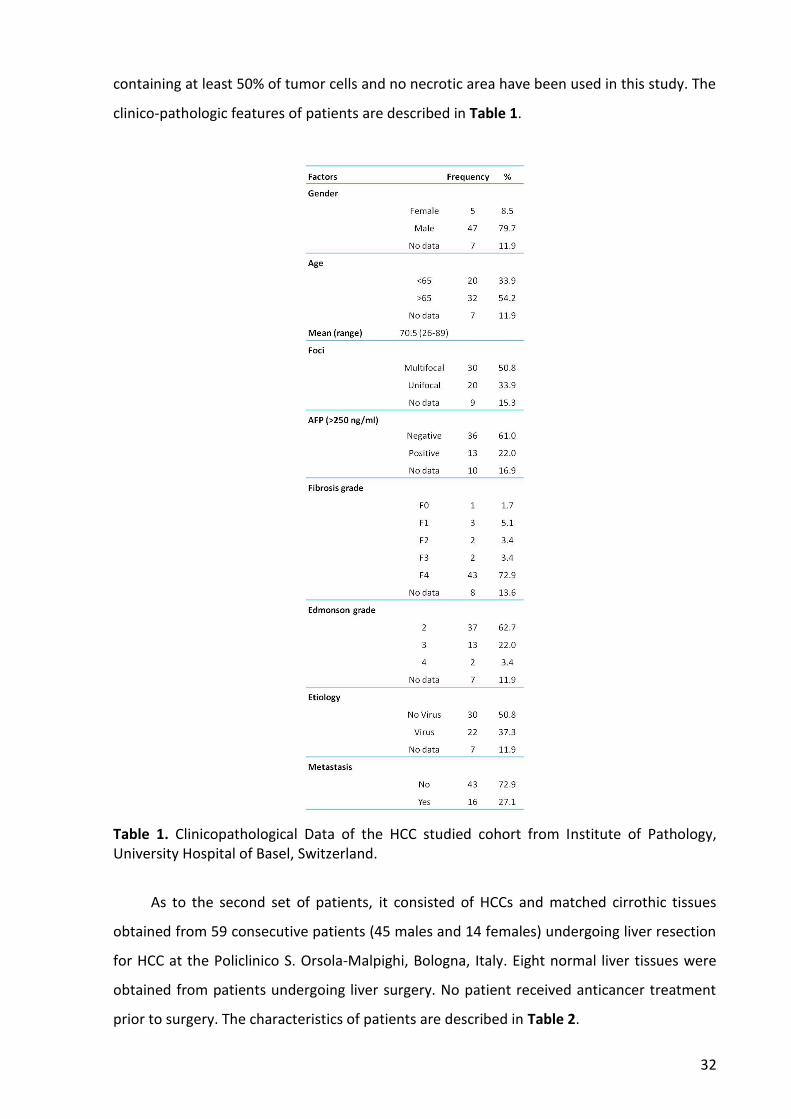
32
containing at least 50% of tumor cells and no necrotic area have been used in this study. The
clinico-pathologic features of patients are described in Table 1.
Table 1. Clinicopathological Data of the HCC studied cohort from Institute of Pathology, University Hospital of Basel, Switzerland.
As to the second set of patients, it consisted of HCCs and matched cirrothic tissues
obtained from 59 consecutive patients (45 males and 14 females) undergoing liver resection
for HCC at the Policlinico S. Orsola-Malpighi, Bologna, Italy. Eight normal liver tissues were
obtained from patients undergoing liver surgery. No patient received anticancer treatment
prior to surgery. The characteristics of patients are described in Table 2.
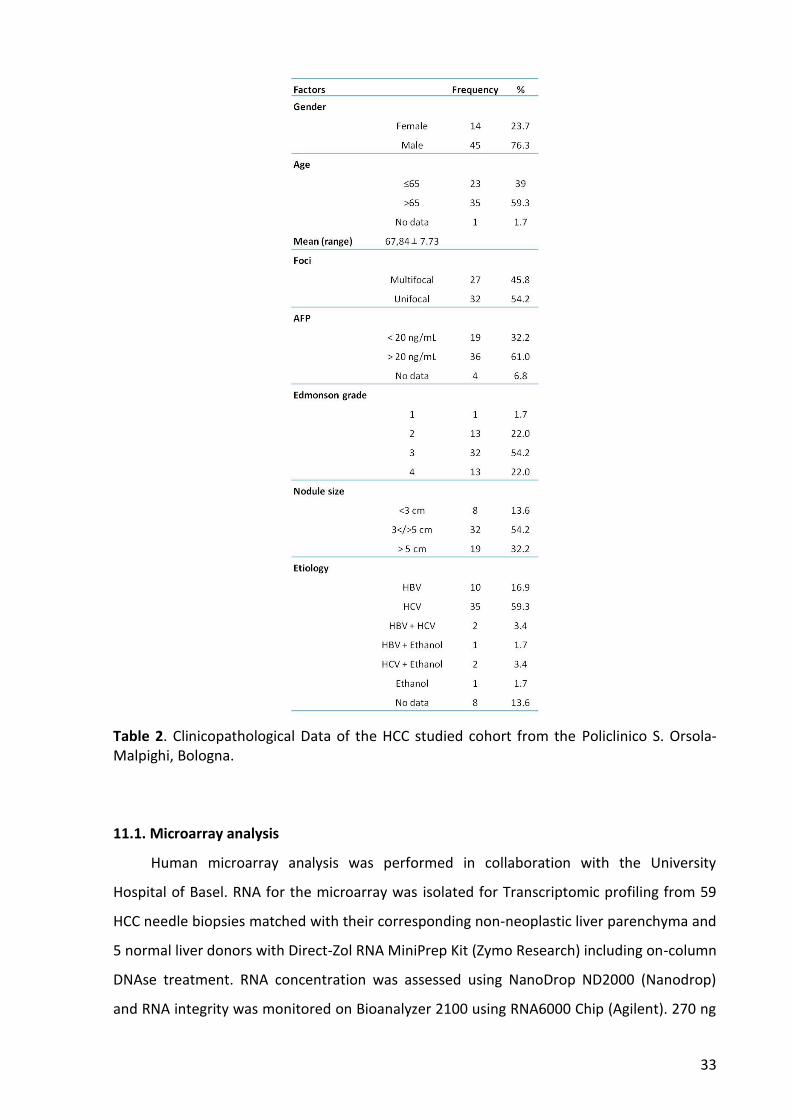
33
Table 2. Clinicopathological Data of the HCC studied cohort from the Policlinico S. Orsola-Malpighi, Bologna.
11.1. Microarray analysis
Human microarray analysis was performed in collaboration with the University
Hospital of Basel. RNA for the microarray was isolated for Transcriptomic profiling from 59
HCC needle biopsies matched with their corresponding non-neoplastic liver parenchyma and
5 normal liver donors with Direct-Zol RNA MiniPrep Kit (Zymo Research) including on-column
DNAse treatment. RNA concentration was assessed using NanoDrop ND2000 (Nanodrop)
and RNA integrity was monitored on Bioanalyzer 2100 using RNA6000 Chip (Agilent). 270 ng

34
of DNAse-treated total RNA was subjected to target synthesis using the WT Expression kit
(Ambion) following standard recommendations. Fragmentation and labeling of amplified
cDNA were performed using the WT Terminal Labeling Kit (Affymetrix). Synthesis reactions
were carried out using a PCR machine (TProfessionnalTrio, Biometra) in 0.2ml tubes
(Starlab). Eighty-five µl cocktail (23.4ng/µl labeled DNA) were loaded on GeneChip®Human
Gene 1.0ST arrays (Affymetrix) and hybridized for 17 hours (45°C, 60rpm) in Hybridization
oven 645 (Affymetrix). The arrays were washed and stained on Fluidics Stations 450
(Affymetrix) by using the Hybridization Wash and Stain Kit (Affymetrix) under FS450_0002
protocol. The GeneChips were scanned with an Affymetrix GeneChip Scanner 3000 7G. DAT
images and CEL files of the microarrays were generated using Affymetrix GeneChip
Command Control (version 4.0). Afterwards, CEL files were imported into Qlucore software
and Robust Multichip Average (RMA) normalized. Subsequently, principal component
analysis to discriminate between engineered and control cells will be performed. Quantile
normalization and data processing were performed using the GeneSpringGXv11.5.1 software
package (Agilent, USA). The gene signature value was assessed using the BRB-ArrayTool
(v4.3.2, NIH).
11.2. Tissue microarray (TMA) and immunohistochemistry
For immunohistochemical analysis of HAO2, in collaboration with the University
Hospital of Basel, we analysed formalin-fixed paraffin embedded (FFPE) tissue samples
organized into a tissue microarray (TMA), as previously described (Baumhoer D et al, 2008).
Briefly, this array contains 434 tissue specimens from both HCC and non-neoplastic liver
tissue samples. Roughly 60% of used specimens used for the TMA construction were
obtained from patients that underwent surgical resection without prior treatment for HCC,
while the remaining were collected from autopsy cases. Histologic grading and classification
of used liver samples was performed by 2 experienced pathologists according to the World
Health Organization classification and Edmondson & Steiner grading system.
Sections of 4 µm of paraffin embedded tissue were immunostained using a primary
antibody against HAO2 (NBP2-32037 Novus Biologicals, Littleton, CO, USA). Automated IHC
were carried out in the Ventana BenchMark (Ventana Medical Systems, Tucson, AZ, USA)
platform by using the primary antibody against HAO2 diluted at 1:10.

35
12. Statistical analysis
For qRT-PCR analysis, data are expressed as mean ± standard error (SEM). Analysis of
significance was done by One-Way ANOVA, followed by Tukey-Kramer multiple-comparison
post-hoc test and t Student’s test using the GraphPad software (La Jolla, California).
Differences in patient survival were assessed using the Kaplan–Meier method and
analysed using the log-rank test in univariate analysis. Cut-off scores were selected by
evaluating the receiver-operating characteristic (ROC) curves. The point on the curve with
the shortest distance to the coordinate (0, 1) was selected as the threshold value to classify
cases as “positive/overexpressing” or “negative/down-regulated”. Analyses were performed
using the SPSS (Statistical Package for Social Science) software (IBM, Armonk, NY).
P-value were considered significant at p< 0.05.

36
RESULTS
1. Analysis of Hao2 in rat preneoplastic lesions and HCCs
Previous gene expression profiling performed in advanced HCCs generated by the
Resistant Hepatocyte rat model, has shown that Hao2 was among the five mostly down-
regulated genes (Table 3, Petrelli A et al, 2014)
Gene Full name Fold change
aHCC/Control
Cyp2c cytochrome P450, subfamily 2 - 69.57
Obp3 alpha-2u globulin PGCL4 - 49.07
Ca3 carbonic anhydrase 3 - 29.79
Dhrs7 dehydrogenase/reductase (SDR family) member 7 - 22.80
Hao2 hydroxyacid oxidase 2 - 10.86
Cdh17 cadherin 17 - 10.80
Olr59 olfactory receptor 59 - 9.86
Avpr1a arginine vasopressin receptor 1A - 8.75
Table 3. Most down-regulated genes in microdissected advanced HCCs (fold change versus controls <-5). Adapted from Petrelli A et al, 2014.
Based on these preliminary data, we performed real time PCR to validate these results
and, in particular, to investigate whether Hao2 down-regulation occurs also during early
stages of liver carcinogenesis. To this aim, we laser-microdissected preneoplastic lesions
identified, by their positivity to GSTP, and HCCs, generated at 10 weeks and 14 months after
DENA treatment, respectively.
As shown in Fig. 6, a significant reduction of the expression of Hao2 was observed in all
GSTP+ preneoplastic nodules and HCCs, compared to normal liver samples. Hao2 mean
expression in HCCs vs. preneoplastic lesions vs. control livers was: 0.06 ± 0.01 vs. 0.25 ± 0.06
(p<0.05) vs. 1 ± 0.05 (p<0.001).

37
Fig. 6. Hao2 average mRNA expression in rat control livers (n=4), preneoplastic lesions (n=19) and HCCs (n=9), as assessed by quantitative real-time PCR using the 2-ddCt method and rat GAPDH as endogenous control. Each bar represents mean ± standard error (SEM), calculated as fold-change difference. Tukey-Kramer test: *** p<0.001; * p<0.05.
In agreement with mRNA levels, western blot analysis showed a very low level of Hao2
protein content in HCCs compared to normal livers (Fig.7).
Fig. 7. Total liver tissue lysate of controls (n=2) and HCCs (n=7) were analysed by Western Blot. Protein loading for each sample was verified using anti-actin antibody.
These results demonstrated that down-regulation of Hao2 occurs in early stages of
carcinogenesis and is maintained all along the tumorigenic process.
2. Hao2 is mostly down-regulated in the subset of nodules expressing the putative
progenitor cell marker Krt-19
The well-characterized Resistant Hepatocyte (RH) rat model allows to identify
phenotypically distinct lesions along the various steps of carcinogenesis (early nodules,
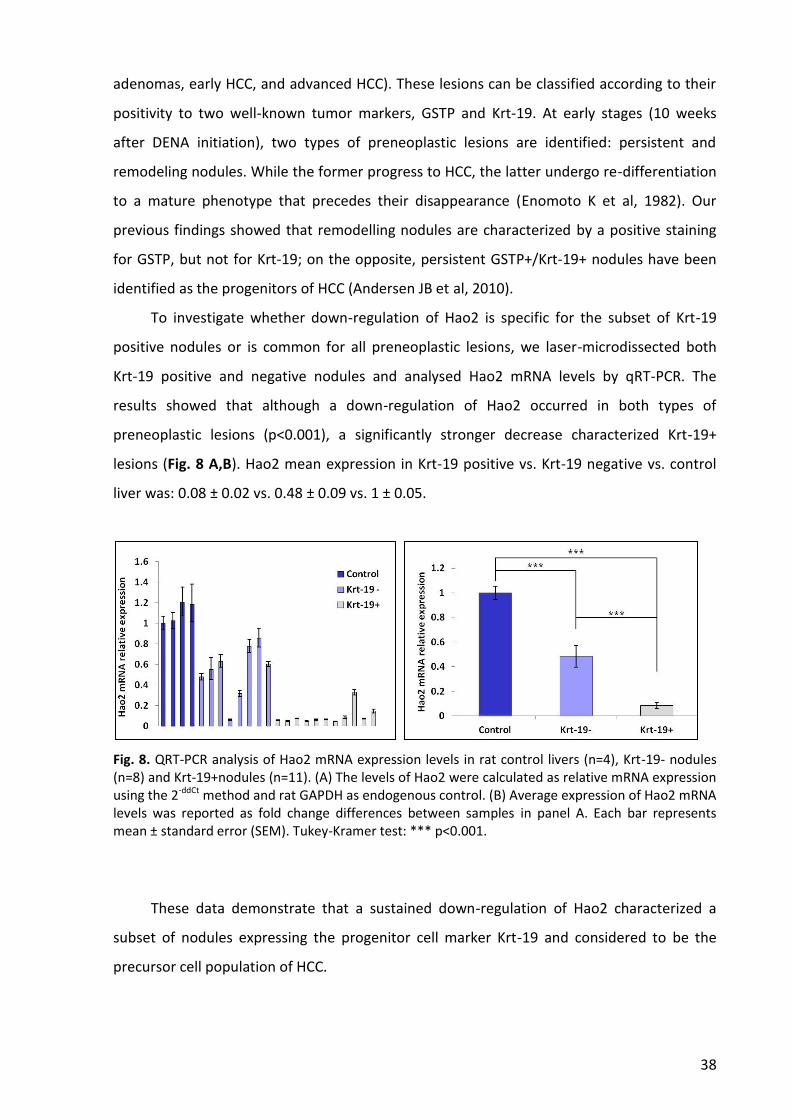
38
adenomas, early HCC, and advanced HCC). These lesions can be classified according to their
positivity to two well-known tumor markers, GSTP and Krt-19. At early stages (10 weeks
after DENA initiation), two types of preneoplastic lesions are identified: persistent and
remodeling nodules. While the former progress to HCC, the latter undergo re-differentiation
to a mature phenotype that precedes their disappearance (Enomoto K et al, 1982). Our
previous findings showed that remodelling nodules are characterized by a positive staining
for GSTP, but not for Krt-19; on the opposite, persistent GSTP+/Krt-19+ nodules have been
identified as the progenitors of HCC (Andersen JB et al, 2010).
To investigate whether down-regulation of Hao2 is specific for the subset of Krt-19
positive nodules or is common for all preneoplastic lesions, we laser-microdissected both
Krt-19 positive and negative nodules and analysed Hao2 mRNA levels by qRT-PCR. The
results showed that although a down-regulation of Hao2 occurred in both types of
preneoplastic lesions (p<0.001), a significantly stronger decrease characterized Krt-19+
lesions (Fig. 8 A,B). Hao2 mean expression in Krt-19 positive vs. Krt-19 negative vs. control
liver was: 0.08 ± 0.02 vs. 0.48 ± 0.09 vs. 1 ± 0.05.
Fig. 8. QRT-PCR analysis of Hao2 mRNA expression levels in rat control livers (n=4), Krt-19- nodules (n=8) and Krt-19+nodules (n=11). (A) The levels of Hao2 were calculated as relative mRNA expression using the 2-ddCt method and rat GAPDH as endogenous control. (B) Average expression of Hao2 mRNA levels was reported as fold change differences between samples in panel A. Each bar represents mean ± standard error (SEM). Tukey-Kramer test: *** p<0.001.
These data demonstrate that a sustained down-regulation of Hao2 characterized a
subset of nodules expressing the progenitor cell marker Krt-19 and considered to be the
precursor cell population of HCC.
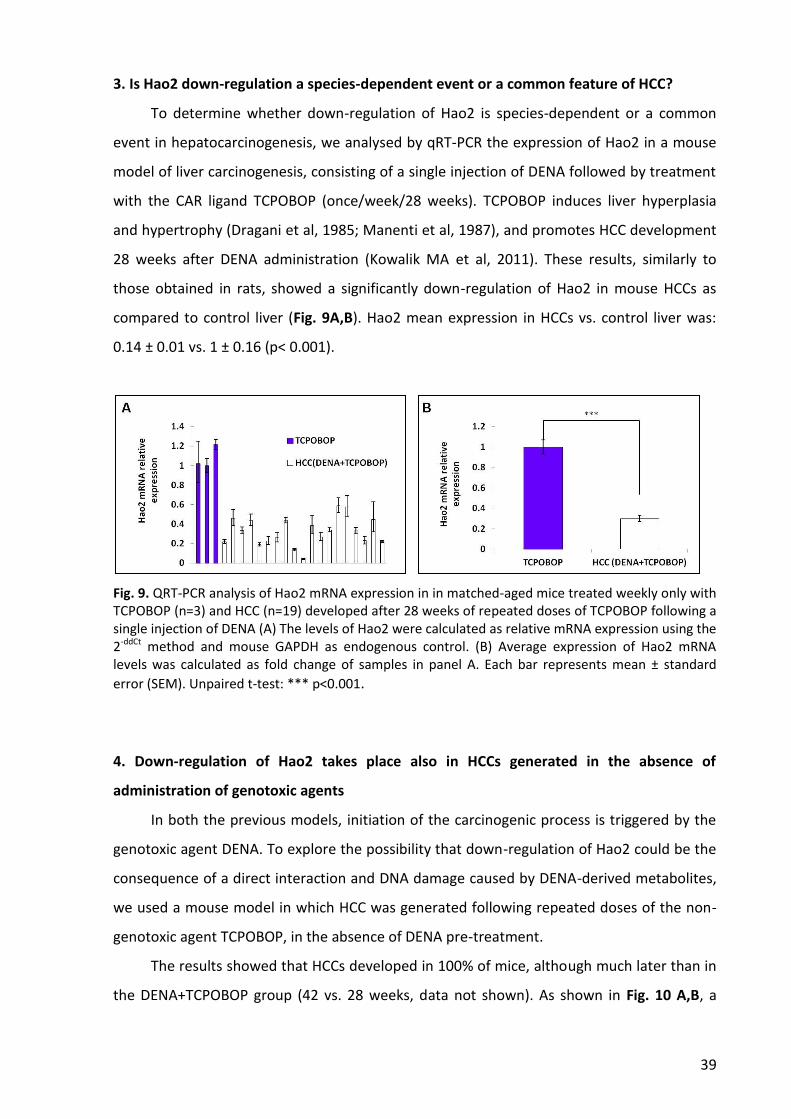
39
3. Is Hao2 down-regulation a species-dependent event or a common feature of HCC?
To determine whether down-regulation of Hao2 is species-dependent or a common
event in hepatocarcinogenesis, we analysed by qRT-PCR the expression of Hao2 in a mouse
model of liver carcinogenesis, consisting of a single injection of DENA followed by treatment
with the CAR ligand TCPOBOP (once/week/28 weeks). TCPOBOP induces liver hyperplasia
and hypertrophy (Dragani et al, 1985; Manenti et al, 1987), and promotes HCC development
28 weeks after DENA administration (Kowalik MA et al, 2011). These results, similarly to
those obtained in rats, showed a significantly down-regulation of Hao2 in mouse HCCs as
compared to control liver (Fig. 9A,B). Hao2 mean expression in HCCs vs. control liver was:
0.14 ± 0.01 vs. 1 ± 0.16 (p< 0.001).
Fig. 9. QRT-PCR analysis of Hao2 mRNA expression in in matched-aged mice treated weekly only with TCPOBOP (n=3) and HCC (n=19) developed after 28 weeks of repeated doses of TCPOBOP following a single injection of DENA (A) The levels of Hao2 were calculated as relative mRNA expression using the 2-ddCt method and mouse GAPDH as endogenous control. (B) Average expression of Hao2 mRNA levels was calculated as fold change of samples in panel A. Each bar represents mean ± standard
error (SEM). Unpaired t-test: *** p<0.001.
4. Down-regulation of Hao2 takes place also in HCCs generated in the absence of
administration of genotoxic agents
In both the previous models, initiation of the carcinogenic process is triggered by the
genotoxic agent DENA. To explore the possibility that down-regulation of Hao2 could be the
consequence of a direct interaction and DNA damage caused by DENA-derived metabolites,
we used a mouse model in which HCC was generated following repeated doses of the non-
genotoxic agent TCPOBOP, in the absence of DENA pre-treatment.
The results showed that HCCs developed in 100% of mice, although much later than in
the DENA+TCPOBOP group (42 vs. 28 weeks, data not shown). As shown in Fig. 10 A,B, a
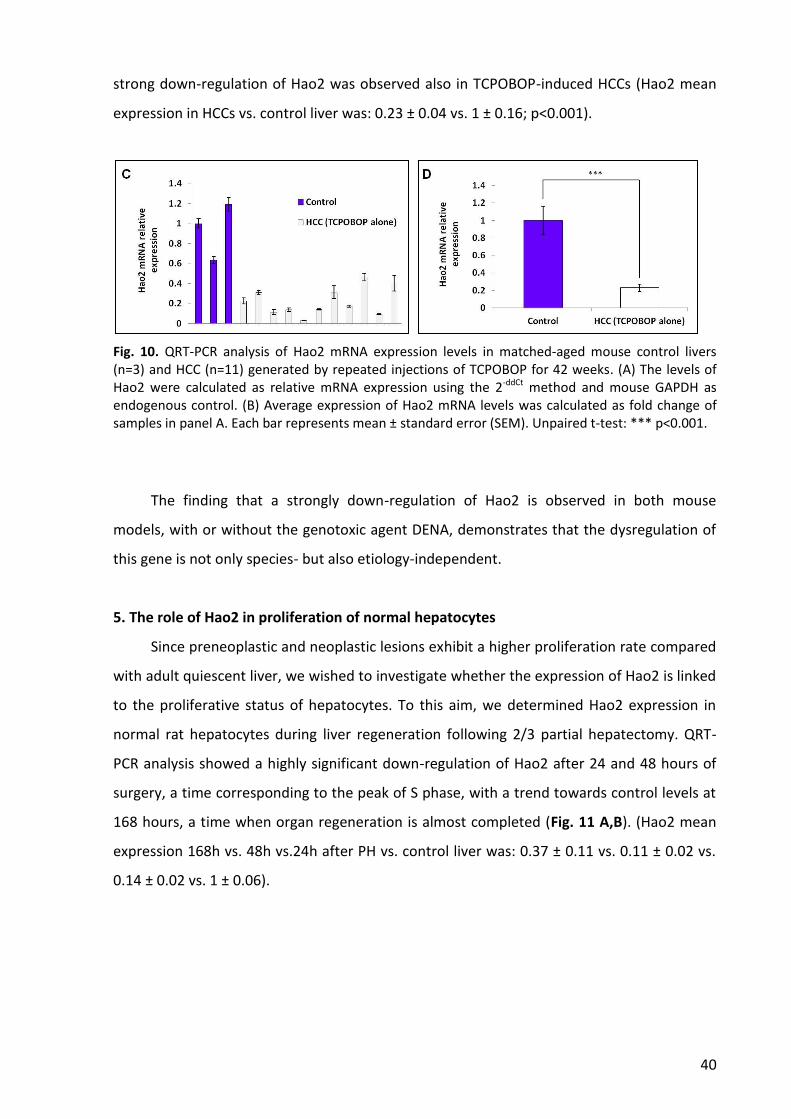
40
strong down-regulation of Hao2 was observed also in TCPOBOP-induced HCCs (Hao2 mean
expression in HCCs vs. control liver was: 0.23 ± 0.04 vs. 1 ± 0.16; p<0.001).
Fig. 10. QRT-PCR analysis of Hao2 mRNA expression levels in matched-aged mouse control livers (n=3) and HCC (n=11) generated by repeated injections of TCPOBOP for 42 weeks. (A) The levels of Hao2 were calculated as relative mRNA expression using the 2-ddCt method and mouse GAPDH as endogenous control. (B) Average expression of Hao2 mRNA levels was calculated as fold change of samples in panel A. Each bar represents mean ± standard error (SEM). Unpaired t-test: *** p<0.001.
The finding that a strongly down-regulation of Hao2 is observed in both mouse
models, with or without the genotoxic agent DENA, demonstrates that the dysregulation of
this gene is not only species- but also etiology-independent.
5. The role of Hao2 in proliferation of normal hepatocytes
Since preneoplastic and neoplastic lesions exhibit a higher proliferation rate compared
with adult quiescent liver, we wished to investigate whether the expression of Hao2 is linked
to the proliferative status of hepatocytes. To this aim, we determined Hao2 expression in
normal rat hepatocytes during liver regeneration following 2/3 partial hepatectomy. QRT-
PCR analysis showed a highly significant down-regulation of Hao2 after 24 and 48 hours of
surgery, a time corresponding to the peak of S phase, with a trend towards control levels at
168 hours, a time when organ regeneration is almost completed (Fig. 11 A,B). (Hao2 mean
expression 168h vs. 48h vs.24h after PH vs. control liver was: 0.37 ± 0.11 vs. 0.11 ± 0.02 vs.
0.14 ± 0.02 vs. 1 ± 0.06).
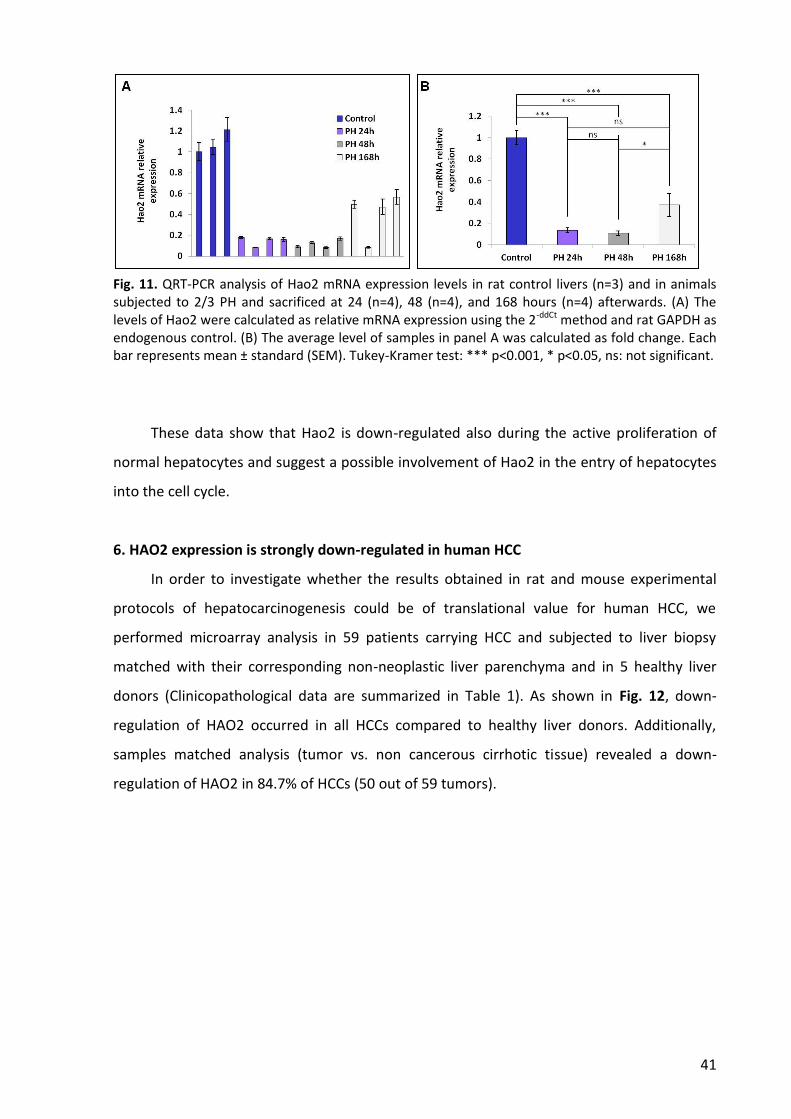
41
Fig. 11. QRT-PCR analysis of Hao2 mRNA expression levels in rat control livers (n=3) and in animals subjected to 2/3 PH and sacrificed at 24 (n=4), 48 (n=4), and 168 hours (n=4) afterwards. (A) The levels of Hao2 were calculated as relative mRNA expression using the 2-ddCt method and rat GAPDH as endogenous control. (B) The average level of samples in panel A was calculated as fold change. Each bar represents mean ± standard (SEM). Tukey-Kramer test: *** p<0.001, * p<0.05, ns: not significant.
These data show that Hao2 is down-regulated also during the active proliferation of
normal hepatocytes and suggest a possible involvement of Hao2 in the entry of hepatocytes
into the cell cycle.
6. HAO2 expression is strongly down-regulated in human HCC
In order to investigate whether the results obtained in rat and mouse experimental
protocols of hepatocarcinogenesis could be of translational value for human HCC, we
performed microarray analysis in 59 patients carrying HCC and subjected to liver biopsy
matched with their corresponding non-neoplastic liver parenchyma and in 5 healthy liver
donors (Clinicopathological data are summarized in Table 1). As shown in Fig. 12, down-
regulation of HAO2 occurred in all HCCs compared to healthy liver donors. Additionally,
samples matched analysis (tumor vs. non cancerous cirrhotic tissue) revealed a down-
regulation of HAO2 in 84.7% of HCCs (50 out of 59 tumors).
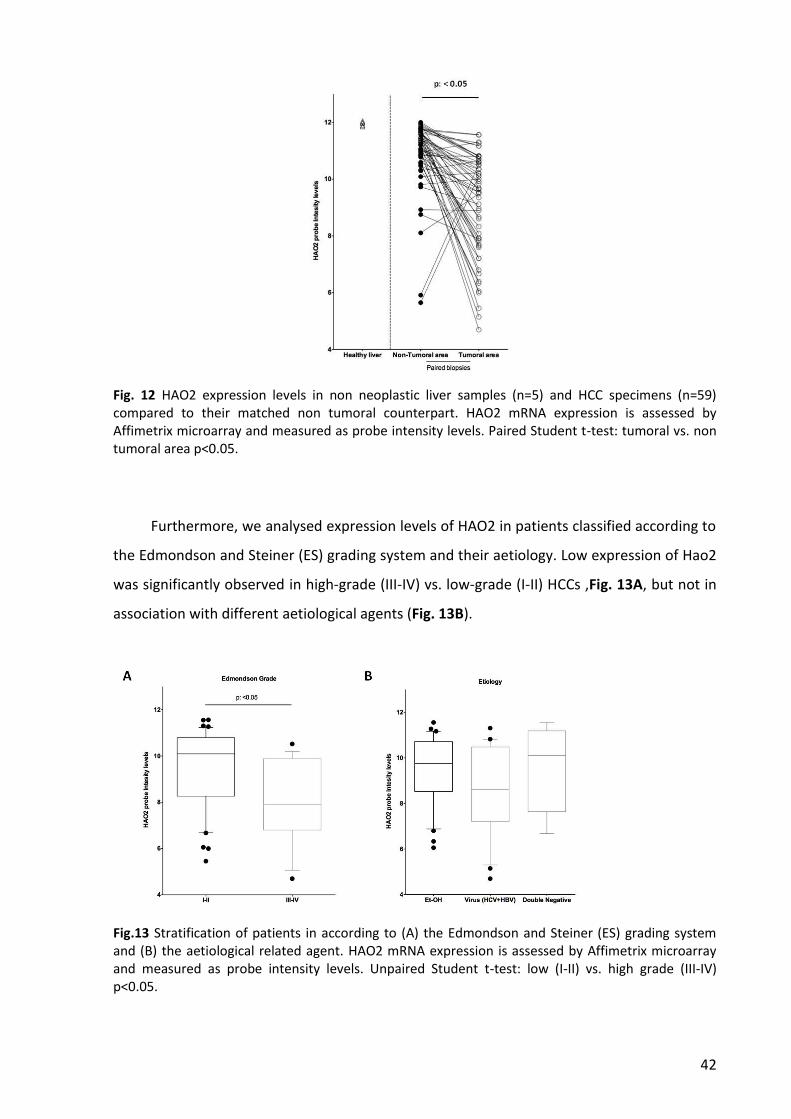
42
Fig. 12 HAO2 expression levels in non neoplastic liver samples (n=5) and HCC specimens (n=59) compared to their matched non tumoral counterpart. HAO2 mRNA expression is assessed by Affimetrix microarray and measured as probe intensity levels. Paired Student t-test: tumoral vs. non tumoral area p<0.05.
Furthermore, we analysed expression levels of HAO2 in patients classified according to
the Edmondson and Steiner (ES) grading system and their aetiology. Low expression of Hao2
was significantly observed in high-grade (III-IV) vs. low-grade (I-II) HCCs ,Fig. 13A, but not in
association with different aetiological agents (Fig. 13B).
Fig.13 Stratification of patients in according to (A) the Edmondson and Steiner (ES) grading system and (B) the aetiological related agent. HAO2 mRNA expression is assessed by Affimetrix microarray and measured as probe intensity levels. Unpaired Student t-test: low (I-II) vs. high grade (III-IV) p<0.05.

43
Finally, to explore whether HAO2 expression is associated with clinical progression and
outcome of HCC patients, we examined the incidence of metastases and patient overall
survival (OS) rates using Kaplan-Meier analysis. The metastatic status was defined as either
regional lymph node invasion and/or distant organ involvement. Patients with low HAO2
expression showed an increased metastatic activity (Fig. 14A) and a decreased OS (median
of 10 versus 31 months in low vs. high HAO2, respectively; Fig. 14B).
Fig. 14 HAO2 expression levels, analysed by Affimetrix microarray and measured as probe intensity levels, in association with (A) metastasis formation and (B) predicts poor pantients survival. Survival plot was analysed using the Kaplan-Meier method. ROC analysis was used to discriminate between high and low expressing levels of HAO2. Unpaired Student t-test: all P values <0.05.
Next, we investigated the expression levels of Hao2 in another distinct series of 59
human HCCs and their corresponding peritumoural tissues provided by the Policlinico S.
Orsola-Malpighi of Bologna. The characteristics of the study population are described in
Table 2. Similarly to what observed in the previous cohort, HCC down-regulation was
confirmed in all samples compared to normal liver donors (Fig. 15A,B) and in 88.1 % of
samples compared to matched cirrhotic tissues (52 out of 59 tumors ,Fig. 15A,B).

44
Fig. 15 QRT-PCR analysis of Hao2 mRNA expression levels in human HCCs and matched cirrhotic tissues (n=59) and in normal liver (n=8). (A) The levels of Hao2 were calculated as relative mRNA expression using the 2-ddCt method and represented as log 2. Human β-actin was used as endogenous control. (B) The average levels of samples in panel A were calculated as fold change. Each bar represents mean ± standard error (SEM). Tukey-Kramer test: ** p<0.01,*** p<0.001.
Altogether these data show that in humans, as well as in rodents, HAO2 mRNA levels
are significantly down-regulated in HCC development.
7. HAO2 protein content is decresed in human HCC
We next evaluated the content of HAO2 protein in human HCC. Initially, we performed
immunohistochemical staining (IHC) for HAO2 in tissue specimens from both HCC and non-
neoplastic liver tissue samples from patients of the Basel cohort. Initial studies were
performed to find the most appropriate antibody for IHC staining. From our search, while
antibodies for western blot were provided by different companies, only the Novus
Biologicals antibody was recommended for HAO2 staining in human tissues. Using this
antibody, we found positivity for HAO2 in human cirrhotic areas (Fig. 16A) which was
reduced in most of human HCCs (Fig. 16B,C). In addition tissue microarray (TMA) staining
showed (Fig. 16D) that approximately 60% of HCC analysed exhibited a reduced HAO2
staining when compared to surrounding liver (Fig. 16D,E).

45
Fig. 16. Representative pictures of HAO2 immunohistochemical in HCC and non-neoplastic liver tissue samples. HAO2 protein levels analised by IHC staining in (A) cirrhotic liver at 100x magnification and in HCC samples (B) at 100x (C) and 200x magnification. TMA staining in non-neoplastic liver tissue (D) and HCC punches (E) at 100x magnification.
Although the results of IHC were encouraging, we were not completely satisfied by the
immunostaining of liver samples. Therefore, we performed western blot analysis in 7 human
HCCs and their cirrhotic counterparts. As shown in Fig. 17, HAO2 protein content was
strongly decreased in 5/7 HCCs, when compared to their corresponding cirrhotic
peritumorural livers.
Fig. 17. HAO2 expression levels analysed by western blot in 7 HCCs and their cirrhotic peritumoral livers (PT). Actin antibody was used as an internal control.
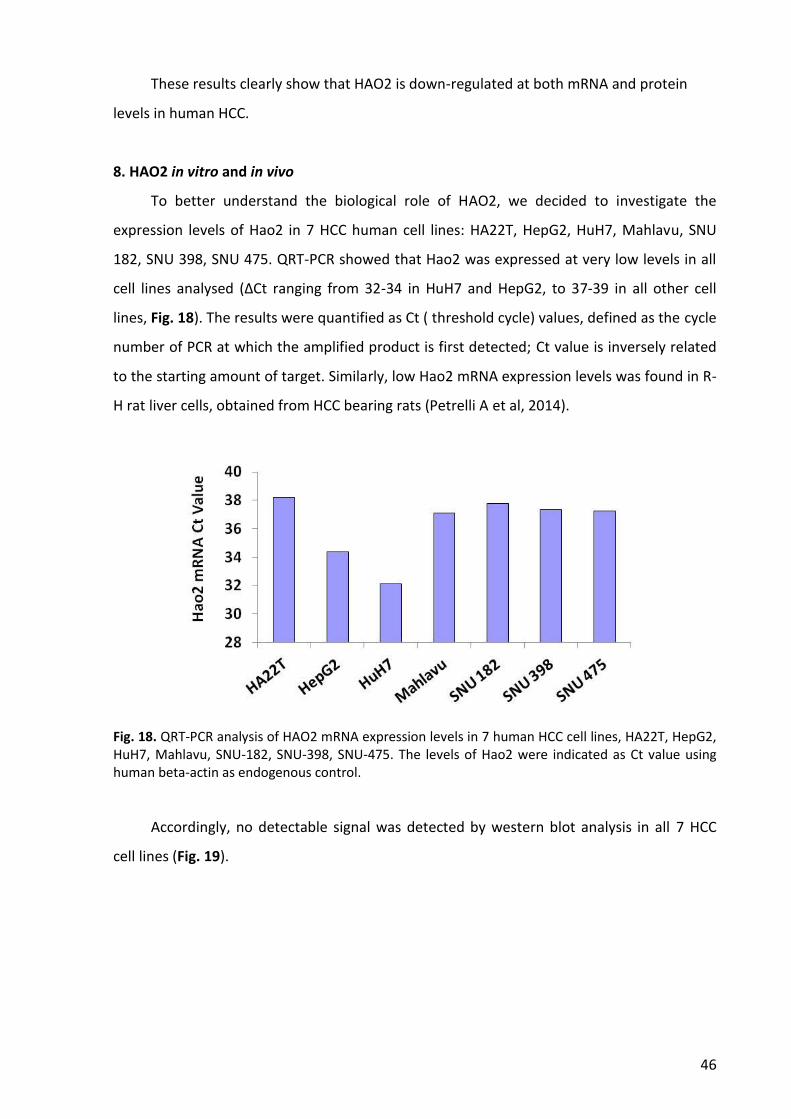
46
These results clearly show that HAO2 is down-regulated at both mRNA and protein
levels in human HCC.
8. HAO2 in vitro and in vivo
To better understand the biological role of HAO2, we decided to investigate the
expression levels of Hao2 in 7 HCC human cell lines: HA22T, HepG2, HuH7, Mahlavu, SNU
182, SNU 398, SNU 475. QRT-PCR showed that Hao2 was expressed at very low levels in all
cell lines analysed (ΔCt ranging from 32-34 in HuH7 and HepG2, to 37-39 in all other cell
lines, Fig. 18). The results were quantified as Ct ( threshold cycle) values, defined as the cycle
number of PCR at which the amplified product is first detected; Ct value is inversely related
to the starting amount of target. Similarly, low Hao2 mRNA expression levels was found in R-
H rat liver cells, obtained from HCC bearing rats (Petrelli A et al, 2014).
Fig. 18. QRT-PCR analysis of HAO2 mRNA expression levels in 7 human HCC cell lines, HA22T, HepG2, HuH7, Mahlavu, SNU-182, SNU-398, SNU-475. The levels of Hao2 were indicated as Ct value using human beta-actin as endogenous control.
Accordingly, no detectable signal was detected by western blot analysis in all 7 HCC
cell lines (Fig. 19).

47
Fig. 19. Western blot analysis of HAO2 in human and R-H cell lines. HAO2-transduced Mahlavu (HAO2-Mahlavu) and R-H cell lines (HAO2-R-H) were used as positive controls.
Therefore, the down-regulation of Hao2 was confirmed also in human HCC cell lines at
both mRNA and protein levels.
In order to investigate whether an increase in HAO2 expression could hamper cell
growth, we performed soft agar and cell growth assays in human Mahlavu and rat R-H cell
lines transduced with a lentiviral construct containing HAO2; we did not observe significant
alteration in anchorage-dependent or independent growth ability between human and rat
cell lines compared to their transduced counterparts (data not shown).
Moreover, we tested in vivo if the increase of Hao2 expression could impact the
tumorigenic ability of Hao2-transduced cells. Therefore, parental and Hao2-transduced R-H
cell lines were subcutaneously grafted into syngeneic F-344 rats. We found that while
parental R-H cells were able to form tumors in 3/7 animals, no tumors was observed in all 6
rats grafted with Hao2-transduced cell lines within 40 days post injection (Fig. 20).
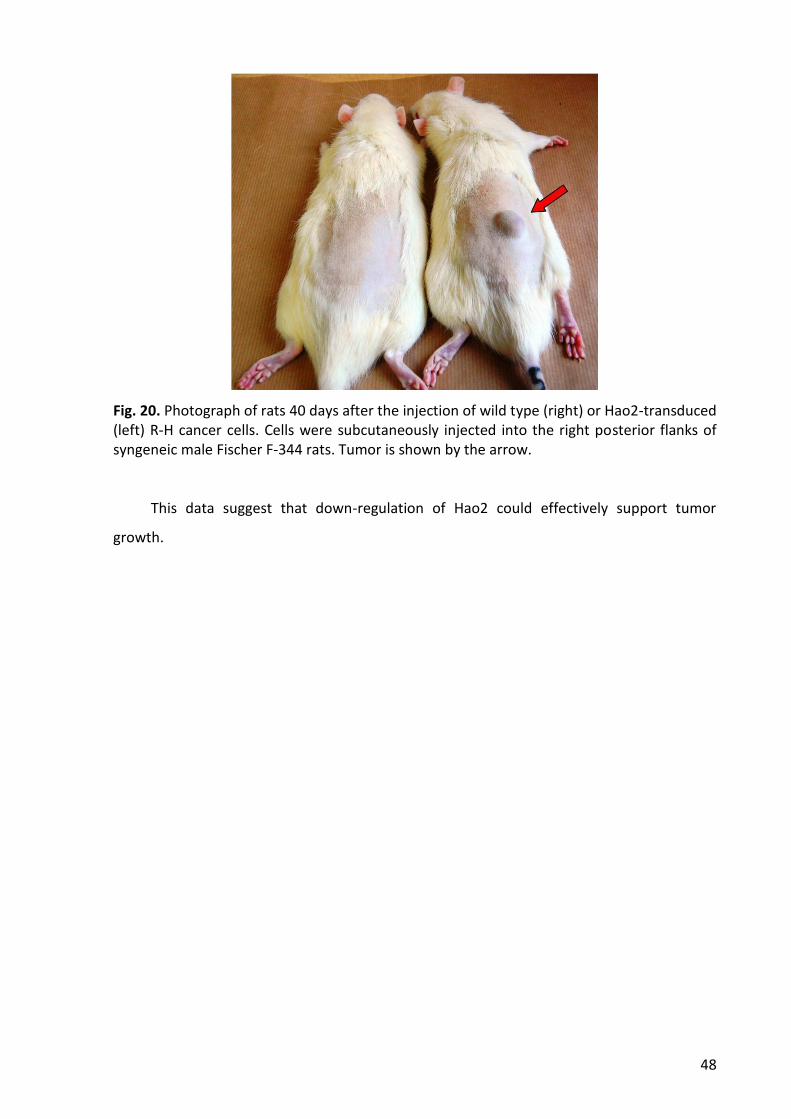
48
Fig. 20. Photograph of rats 40 days after the injection of wild type (right) or Hao2-transduced (left) R-H cancer cells. Cells were subcutaneously injected into the right posterior flanks of syngeneic male Fischer F-344 rats. Tumor is shown by the arrow.
This data suggest that down-regulation of Hao2 could effectively support tumor
growth.
49
DISCUSSION
L-2 Hydroxy acid oxidases are flavin mononucleotide (FMN)-dependent peroxisomal
enzymes which are able to oxidize a number of 2-hydroxy acids to 2-keto acids resulting in
hydrogen peroxide formation at the expense of molecular oxygen (Angermüller S. 1989; Fry
DW et al, 1979; Schwam H et al, 1979).
Currently, very few data are available in literature about hydroxy acid oxidases and
their functional role remains to be defined. Some authors reported an involvement of these
enzymes in fatty acid α-oxidation (Jones JM et al, 2000) or in regulation in blood pressure
(Lee SJ et al, 2003; Rico-Sanz J et al, 2004), albeit the mechanisms are not fully explained. By
producing hydrogen peroxide, during their enzymatic activity, hydroxy acid oxidases might
contribute to generate oxidative stress, by increasing ROS levels. High ROS levels are
associated with cell death and cellular damage and with an abnormal cancer cell growth
(Toyokuni S et al, 1995).
Unfortunately, the role of Hao2, if any, in cancer is still unknown. Indeed, the only
study associating Hao2 and cancer was a study of gene expression profile in human
intrahepatic cholangiocarcinomas. This study identified Hao2 among down-regulated genes
in these tumors (Wand AG et al, 2006), but no comments or hypotheses about its role were
proposed by the authors.
To our knowledge, the results obtained in my thesis are the first to show that Hao2 is
profoundly down-regulated in HCCs. The main findings stemming from our study can be
summarised as follows: i) Hao2 is down-regulated in 100% of rat and mouse HCCs and in
about 80% of human HCCs; ii) Hao2 down-regulation is species and etiology independent; iii)
Hao2 down-regulation is a very early event in multistage hepatocarcinogenesis; iv) it is more
pronounced in the most aggressive preneoplastic lesions; v) its levels are inversely
correlated with overall survival and metastasis; vi) transduction of Hao2 inhibits the
tumorigenic potency of HCC cells in vivo.
At the present, no data are available to explain the reduced expression of Hao2
observed in HCC. Several epigenetic or genetic alterations or post-transcriptional regulation,
such as that caused by miRNA could be involved. Searching for Hao2-targeting miRs, we
found that miR-183 is predicted to bind to complementary sequences located in the 3′-
untranslated (3‘-UTR) region of Hao2 mRNA. Previous work done in our laboratory has
50
shown that this miR is up-regulated in Krt-19 positive preneoplastic lesions (75-fold) and in
HCCs (15-fold) developed with the R-H model of hepatocarcinogenesis (Petrelli A et al,
2014). Notably, the same lesions exhibited Hao2 down-regulation, when compared to
control liver, suggesting that increased levels of miR-183 could be responsible for Hao2
down-regulation. Further studies will be performed to establish if this or other miRs are
indeed responsible for Hao2 down-regulation in the carcinogenic process.
Although the mechanisms underlying Hao2 decrease in pre- and neoplastic lesions are
unclear, it is possible to speculate that this enzyme plays a role in hepatocyte proliferation
and survival. Indeed, the findings that i) the expression levels of Hao2 decreased during liver
regeneration after PH, and that, ii) the maximal Hao2 down-regulation occurs in the most
aggressive rat preneoplastic lesions (Krt-19+), which proliferate at a higher rate than those
negative for this marker (Petrelli A et al, 2014), suggest that Hao2 is inversely correlated to
cell cycle, in a way resembling tumor suppressor genes.
Another possible explanation for the biological effect driven by decreased levels of
Hao2 could be linked to the ability of this enzyme to produce hydrogen peroxide. Loss of this
enzyme may represent a cytoprotective mechanism by which genetically-altered cells can
escape excessive ROS generation and cell damage/death.
Independently upon the mechanism through which Hao2 regulates hepatocyte behaviour,
our findings can have a relevant translational value in terms of both prognosis and diagnosis.
Indeed, the novel finding that Hao2 expression is virtually absent in preneoplastic lesions,
suggests its possible use as a diagnostic marker. This possibility is supported by our
preliminary findings showing immunohistochemical positivity for HAO2 in human cirrhotic
areas, but not in most of human HCC. It is possible to hypothesize that HAO2 staining might
allow early identification of dysplastic nodules and their discrimination from cirrhotic
regenerative nodules, a diagnosis that is presently problematic in most circumstances.
HAO2 can also be useful for prognostic purposes. Indeed, as shown in my thesis, the
levels of HAO2 in HCC inversely correlate with increased metastatic ability of the tumor and
overall survival of the patients.

51
REFERENCES
Alisi A, Giambartolomei S, Cupelli F, Merlo P, Fontemaggi G, Spaziani A, Balsano C.
Physicaland functional interaction between HCV core protein and the different p73
isoforms. Oncogene. 2003; 22:2573–2580.
Amit S, Hatzubai A, Birman Y, Andersen JS, Ben-Shushan E, Mann M, Ben-Neriah Y,
Alkalay I. Axin-mediated CKI phosphorylation of beta-catenin at Ser 45: a molecular
switch for the Wnt pathway. Genes Dev. 2002; 16(9):1066-76
Andersen JB, Loi R, Perra A, Factor VM, Ledda-Columbano GM, Columbano A,
Thorgeirsson SS. Progenitor-derived hepatocellular carcinoma model in the rat.
Hepatology. 2010; 51(4):1401-9.
Angermüller S. Peroxisomal oxidases: cytochemical localization and biological relevance.
Prog Histochem Cytochem. 1989; 20(1):1-65.
Antonenkov VD, Grunau S, Ohlmeier S, Hiltunen JK. Peroxisomes are oxidative
organelles, Antioxid. Redox Signal. 2010; 13:525–537.
Aravalli RN, Cressman EN, Steer CJ. Cellular and molecular mechanisms of hepatocellular
carcinoma: an update. Arch Toxicol. 2013; 87(2):227-47.
Azechi H, Nishida N, Fukuda Y, Nishimura T, Minata M, Katsuma H, Kuno M, Ito T,
Komeda T, Kita R, Takahashi R, Nakao K. Disruption of the p16/cyclin D1/retinoblastoma
protein pathway in the majority of human hepatocellular carcinomas. Oncology.
2001;60(4):346-54.
Balsano C, Billet O, Bennoun M, Cavard C, Zider A, Grimber G, Natoli G, Briand P, Levrero
M. Hepatitis B virus X gene product acts as a transactivator in vivo. J. of Hepat. 1994;
21:103–109.
Barawkar DA, Bandyopadhyay A, Deshpande A, Koul S, Kandalkar S, Patil P, Khose G,
Vyas S, Mone M, Bhosale S, Singh U, De S, Meru A, Gundu J, Chugh A, Palle VP,
Mookhtiar KA, Vacca JP, Chakravarty PK, Nargund RP, Wright SD, Roy S, Graziano MP,
Cully D, Cai TQ, Singh SB. Discovery of pyrazole carboxylic acids as potent inhibitors of
rat long chain L-2-hydroxy acid oxidase. Bioorg Med Chem Lett. 2012; 22(13):4341-7.
52
Barawkar DA, Meru A, Bandyopadhyay A, Banerjee A, Deshpande AM, Athare C, Koduru
C, Khose G, Gundu J, Mahajan K, Patil P, Kandalkar SR, Niranjan S, Bhosale S, De S,
Mukhopadhyay S, Chaudhary S, Koul S, Singh U, Chugh A, Palle VP, Mookhtiar KA, Vacca
J, Chakravarty PK, Nargund RP, Wright SD, Roy S, Graziano MP, Singh SB, Cully D, Cai TQ.
Potent and Selective Inhibitors of Long Chain l-2-Hydroxy Acid Oxidase Reduced Blood
Pressure in DOCA Salt-Treated Rats. ACS Med Chem Lett. 2011; 2(12):919-23.
Baumhoer D, Tornillo L, Stadlmann S, Roncalli M,Diamantis EK, Terracciano LM.
Glypican 3 expression in human nonneoplastic, preneoplastic, and neoplastic tissues: a
tissue microarray analysis of 4,387 tissue samples. Am J Clin Pathol 2008;129:899–906.
Berasain C, Castillo J, Perugorria MJ, Latasa MU, Prieto J, Avila MA. Inflammation and
liver cancer: new molecular links, Ann. NY Acad. Sci. 2009; 1155 206–221.
Blanchard M, Green DE, Nocito V, Ratner S. L-Amino acid oxidase of animal tissue. J.
Biol. Chem. 1994; 155, 421-440.
Blanchard M, Green DE, Nocito-Carroll V, Ratner S. L-Hydroxy acid oxidase, J. Biol. Chem.
1946; 163, 137-144.
Blanchard M, Green DE. Isolation of L-amino acid oxidase. J. Biol. Chem. 1945, 161,
583−597.
Bonekamp NA, Völkl A, Fahimi HD, Schrader M. Reactive oxygen species and
peroxisomes: struggling for balance. Biofactors. 2009; 35:346–355.
Boonstra J, Post JA. Molecular events associated with reactive oxygen species and cell
cycle progression in mammalian cells. Gene. 2004; 337, 1–13.
Bouchard MJ, Navas-Martin S. Hepatitis B and C virus hepatocarcinogenesis: lessons
learned and future challenges. Cancer Lett. 2011; 305(2):123-43.
Boveris A, Oshino N, Chance B. The cellular production of hydrogen peroxide. Biochem.
J. 1972; 128(3):617-30.
Bressac B, Kew M, Wands J, Ozturk M. Selective G to T mutations of p53 gene in
hepatocellular carcinoma from southern Africa. Nature. 1991; 350:429–431.42.
Bruix J, Boix L, Sala M, Llovet JM. Focus on hepatocellular carcinoma. Cancer Cell. 2004;
5(3):215-9.
53
Bruix J, Castells A, Bosch J, Feu F, Fuster J, Garcia-Pagan JC, Visa J, Bru C, Rodés J.
Surgical resection of hepatocellular carcinoma in cirrhotic patients: prognostic value of
preoperative portal pressure. Gastroenterology. 1996; 111(4):1018-22.
Bruix J, Llovet JM. Prognostic prediction and treatment strategy in hepatocellular
carcinoma. Hepatology. 2002; 35: 519–24.
Bruix J, Sherman M, Llovet JM, Beaugrand M, Lencioni R, Burroughs AK, Christensen E,
Pagliaro L, Colombo M, Rodes J. EASL Panel of Experts on HCC. Clinical management of
hepatocellular carcinoma. Conclusions of the Barcelona-2000 EASL conference.
European Association for the Study of the Liver. J. Hepatol. 2001; 35, 421–430.
Bruix J, Sherman M. Management of hepatocellular carcinoma: an update. Hepatology
2011; 53: 1020–22.
Bruix J, Sherman M; Practice Guidelines Committee, American Association for the Study
of Liver Diseases. Management of hepatocellular carcinoma. Hepatology. 2005;
42(5):1208-36.
Bruix J, Sherman M; Practice Guidelines Committee, American Association for the Study
of Liver Diseases. Management of hepatocellular carcinoma. Hepatology. 2005;
42(5):1208-36.
Buscarini L, Buscarini E, Di Stasi M. Percutaneous radiofrequency ablation of small
hepatocellular carcinoma: long-term results. Eur Radiol 2001; 11: 914–21.
Cadigan KM, Nusse R. Wnt signaling: a common theme in animal development. Genes
Dev 1997; 11:3286–305.
Calvisi DF, Ladu S, Gorden A, Farina M, Conner EA, Lee JS, Factor VM, Thorgeirsson SS.
Ubiquitous activation of Ras and Jak/Stat pathways in human HCC. Gastroenterology.
2006; 130(4):1117-28.
Casteels M, Foulon V, Mannaerts GP, Van Veldhoven PP. Alpha-oxidation of 3-methyl-
substituted fatty acids and its thiamine dependence. Eur J Biochem. 2003; 270(8):1619-
27.
Chen CA, Okayama H. Calcium phosphate-mediated gene transfer: a highly efficient
transfection system for stably transforming cells with plasmid DNA. Biotechniques.
1988; 6(7):632-8. PubMed PMID: 3273409.

54
Cho J, Baek W, Yang S, Chang J, Sung YC, Suh M. HCV core protein modulates Rb
pathwaythrough pRb down-regulation and E2F-1 up-regulation. Biochim Biophys Acta.
2001; 1538:59–66.
Choo QL, Kuo G, Weiner AJ, Overby LR, Bradley DW, Houghton M. Isolation of a cDNA
clone derived from a blood-borne non-A, non-B viral hepatitis genome. Science. 1989;
244(4902):359-62.
Chuang SC, La Vecchia C, Boffetta P. Liver cancer: Descriptive epidemiology and risk
factors other than HBV and HCV infection. Cancer Letters. 2009; 286:9-14.
Chuma M, Hige S, Nakanishi M, Ogawa K, Natsuizaka M, Yamamoto Y, Asaka M. 8-
Hydroxy-2’-deoxy-guanosine is a risk factor for development of hepatocellular
carcinoma in patients with chronic hepatitis C virus infection. J Gastroenterol Hepatol.
2008; 23(9):1431–1436.
Columbano A, Ledda-Columbano GM. Mitogenesis by ligands of nuclear receptors: an
attractive model for the study of the molecular mechanisms implicated in liver growth.
Cell Death Differ. 2003; 10 Suppl 1:S19–S21.
Cunane LM, Barton JD, Chen ZW, Lê KH, Amar D, Lederer F, Mathews FS. Crystal
structure analysis of recombinant rat kidney long chain hydroxy acid oxidase.
Biochemistry. 2005; 44(5):1521-31.
de Duve C, Baudhuin P. Peroxisomes (microbodies and related particles). Physiol. Rev.
1966; 46:323–357.
de Duve C. Functions of microbodies (peroxisomes). J. Cell Biol. 1965; 27:25A.
de La Coste A, Romagnolo B, Billuart P, Renard CA, Buendia MA, Soubrane O, Fabre M,
Chelly J, Beldjord C, Kahn A, Perret C. Somatic mutations of the beta-catenin gene are
frequent in mouse and human hepatocellular carcinomas. Proc Natl Acad Sci U S A.
1998; 95(15):8847-51.
Di Micco R, Fumagalli M, Cicalese A, Piccinin S, Gasparini P, Luise C, Schurra C, Garre' M,
Nuciforo PG, Bensimon A, Maestro R, Pelicci PG, d'Adda di Fagagna F. Oncogene-
induced senescence is a DNA damage response triggered by DNA hyper-replication.
Nature. 2006; 444(7119):638-42.
55
Diwan BA, Lubet RA, Ward JM, Hrabie JA, Rice JM. Tumor-promoting and
hepatocarcinogenic effects of 1,4-bis[2-(3,5-dichloropyridyloxy)]benzene (TCPOBOP) in
DBA/2NCr and C57BL/6NCr mice and an apparent promoting effect on nasal cavity
tumors but not on hepatocellular tumors in F344/NCr rats initiated with N-
nitrosodiethylamine. Carcinogenesis. 1992; 13:1893–1901.
Donato F, Tagger A, Gelatti U, Parrinello G, Boffetta P, Albertini A, Decarli A, Trevisi P,
Ribero ML, Martelli C, Porru S, Nardi G. Alcohol and hepatocellular carcinoma: the effect
of lifetime intake and hepatitis virus infections in men and women. Am J Epidemiol.
2002; 155:323–331.
Dragani TA, Manenti G, Galliani G, Della Porta G. Promoting effects of 1,4-bis[2-(3,5-
dichloropyridyloxy)]benzene in mouse hepatocarcinogenesis. Carcinogenesis. 1985;
6(2), 225-228.
Duley J, Holmes RS. Alpha-hydroxyacid oxidase genetics in the mouse: evidence for two
genetic loci and a tetrameric subunit structure for the liver isozyme. Genetics. 1974;
76(1):93-7.
Edmondson HA, Steiner PE. Primary carcinoma of the liver: a study of 100 cases among
48 900 necropsies. Cancer 1954; 7: 462–503.
El-Serag HB, Rudolph KL. Hepatocellular carcinoma: epidemiology and molecular
carcinogenesis. Gastroenterology. 2007; 132(7):2557-76.
El-Serag HB, Tran T, Everhart JE. Diabetes increases the risk of chronic liver disease and
hepatocellular carcinoma. Gastroenterology. 2004; 126:460–468.
Engelman JA. Targeting PI3K signalling in cancer: opportunities, challenges and
limitations. Nat Rev Cancer. 2009; 9: 550-562.
Enomoto K, Farber E. Kinetics of phenotypic maturation of remodeling of hyperplastic
nodules during liver carcinogenesis. Cancer Res. 1982; 42: 2330-5.
Farazi PA, DePinho RA. Hepatocellular carcinoma pathogenesis: from genes to
environment. Nat Rev Cancer. 2006; 6(9):674-87.
Farazi PA, Glickman J, Jiang S, Yu A, Rudolph KL, DePinho RA. Differential impact of
telomere dysfunction on initiation and progression of hepatocellular carcinoma. Cancer
Res. 2003;63(16):5021-7.

56
Ferlay J, Shin HR, Bray F, Forman D, Mathers C, Parkin DM. Estimates of worldwide
burden of cancer in 2008: GLOBOCAN 2008. Int J Cancer. 2010; 127:2893–917.
Foulon V, Antonenkov VD, Croes K, Waelkens E, Mannaerts GP, Van Veldhoven PP,
Casteels M. Purification, molecular cloning, and expression of 2-hydroxyphytanoyl-CoA
lyase, a peroxisomal thiamine pyrophosphate-dependent enzyme that catalyzes the
carbon–carbon bond cleavage during alpha-oxidation of 3-methyl-branched fatty acids.
Proc. Natl. Acad. Sci. U.S.A. 1999; 96:10039–10044.
Foulon V, Sniekers M, Huysmans E, Asselberghs S, Mahieu V, Mannaerts GP, Van
Veldhoven PP, Casteels M. Breakdown of 2-hydroxylated straight chain fatty acids via
peroxisomal 2-hydroxyphytanoyl-CoA lyase: a revised pathway for the alpha-oxidation
of straight chain fatty acids. J Biol Chem. 2005; 280(11):9802-12.
Fransen M, Nordgren M, Wang B, Apanasets O. Role of peroxisomes in ROS/RNS-
metabolism: implications for human disease. Biochim Biophys Acta. 2012; 1822(9):1363-
73.
Fry DW, Richardson KE. Isolation and characterization of glycolic acid oxidase from
human liver. Biochim Biophys Acta. 1979; 568(1):135-44.
Fukutomi T, Zhou Y, Kawai S, Eguchi H, Wands JR, Li J. Hepatitis C virus core protein
stimulates hepatocyte growth: correlation with upregulation of wnt-1 expression.
Hepatology. 2005; 41:1096–1105.
Gao J, Xie L, Yang WS, Zhang W, Gao S, Wang J, Xiang YB. Asian Pacific J. Cancer Prev.
2012; 13:743-752
Garner RC, Miller EC, Miller JA. Liver microsomal metabolism of aflatoxin B 1 to a
reactive derivative toxic to Salmonella typhimurium TA 1530. Cancer Res. 1972;
32:2058–2066.
Ghisla S, Massey V. In: Chemistry and Biochemistry of Flavoenzymes. Müller F, editor.
Vol. 2. Boca Raton, FL: CRC; 1991. pp. 243–28.
Gomaa AI, Khan SA, Toledano MB, Waked I, Taylor-Robinson SD. Hepatocellular
carcinoma: epidemiology, risk factors and pathogenesis. World J Gastroenterol.
2008;14(27):4300-8.
57
Goodrich DW. The retinoblastoma tumor-suppressor gene, the exception that proves
the rule. Oncogene. 2006; 25(38):5233-43.
Gorrini C, Harris IS, Mak TW. Modulation of oxidative stress as an anticancer strategy.
Nat Rev Drug Discov. 2013; 12(12):931-47.
Góth L, Eaton JW. Hereditary catalase deficiencies and increased risk of diabetes. Lancet.
2000; 356:1820–1821.
Guidotti LG, Chisari FV. Immunobiology and pathogenesis of viral hepatitis, Annu. Rev.
Pathol. 2006; 1:23–61.
Handy DE, Loscalzo J. Redox regulation of mitochondrial function. Antioxid Redox Signal.
2012; 16(11):1323-67.
Harrison DA. The Jak/STAT pathway. Cold Spring Harb Perspect Biol. 2012; 4(3):pii:
a011205
Hashimoto E, Taniai M, Kaneda H, Tokushige K, Hasegawa K, Okuda H, Shiratori K,
Takasaki K. Comparison of hepatocellular carcinoma patients with alcoholic liver disease
and nonalcoholic steatohepatitis. Alcohol Clin Exp Res. 2004; 28(8 Suppl
Proceedings):164S-168S.
Hayashi J, Aoki H, Kajino K, Moriyama M, Arakawa Y, Hino O. Hepatitis C virus core
protein activates the MAPK/ERK cascade synergistically with tumor promoter TPA, but
not with epidermal growth factor or transforming growth factor α. Hepatology. 2000;
32:958–961.
Hellerbrand C, Pöppl A, Hartmann A, Schölmerich J, Lock G. HFE C282Y heterozygosity in
hepatocellular carcinoma: evidence for an increased prevalence. Clin Gastroenterol
Hepatol 2003;1:279-284.
Higgins GM, Anderson RM. Experimental pathology of the liver – Restoration of the liver
of the white rat following partial surgical removal. Arch Pathol. 1931;12:186-202.
Hoofnagle JH. Management of hepatitis C: current and future perspectives. J Hepatol.
1999; 31 Suppl 1:264-8.
Hsu IC, Tokiwa T, Bennett W, Metcalf RA, Welsh JA, Sun T, Harris CC. p53 gene mutation
and integrated hepatitis B viral DNA sequences in human liver cancer cell lines.
Carcinogenesis. 1993 May;14(5):987-92.
58
Hu TH, Huang CC, Lin PR, et al. Expression and prognostic role of tumor suppressor gene
PTEN/MMAC1/TEP1 in hepatocellular carcinoma. Cancer. 2003; 97:1929–1940.
Huang P, Han J, Hui L. MAPK signaling in inflammation-associated cancer development.
Protein Cell. 2010; 1:218–26.
Jablkowski M, Bocian A, Bialkowska J, Bartkowiak J. A comparative study of P53/MDM2
genes alterations and P53/MDM2 proteins immunoreactivity in liver cirrhosis and
hepatocellular carcinoma. J Exp Clin Cancer Res. 2005; 24:117–125.
Jansen GA, Ofman R, Denis S, Ferdinandusse S, Hogenhout EM, Jakobs C, Wanders RJA.
Phytanoyl-CoA hydroxylase from rat liver. Protein purification and cDNA cloning with
implications for the subcellular localization of phytanic acid alpha-oxidation. J. Lipid. Res.
1999a; 40:2244–2254.
Jansen GA, Van den Brink DM, Ofman R, Draghici O, Dacremont G, Wanders RJA,
Identification of pristanal dehydrogenase activity in peroxisomes: conclusive evidence
that the complete phytanic acid alpha-oxidation pathway is localized in peroxisomes.
Biochem. Biophys. Res. Commun. 2001; 283:674–679.
Jansen GA, Verhoeven NM, Denis S, Romeijn GJ, Jakobs C, ten Brink HJ, Wanders RJA.
Phytanic acid alpha-oxidation: identification of 2-hydroxyphytanoyl-CoA lyase in rat liver
and its localisation in peroxisomes, Biochim. Biophys. Acta. 1999b; 1440: 176–182.
Jansen GA, Wanders RJ. Alpha-oxidation. Biochim Biophys Acta. 2006; 1763(12):1403-
12.
Jones JM, Morrell JC, Gould SJ. Identification and characterization of HAOX1, HAOX2,
and HAOX3, three human peroxisomal 2-hydroxy acid oxidases. J Biol Chem. 2000;
275(17):12590-7.
Kasai H, Okada Y, Nishimura S, Rao MS, Reddy JK. Formation of 8-
hydroxydeoxyguanosine in liver DNA of rats following long-term exposure to a
peroxisome proliferator. Cancer Res. 1989; 49:2603–2605.
Kawanishi S, Hiraku Y, Pinlaor S, Ma N. Oxidative and nitrative DNA damage in animals
and patients with inflammatory diseases in relation to inflammation-related
carcinogenesis. Biol Chem. 2006; 387(4):365-72.
59
Kitada T, Seki S, Kawakita N, Kuroki T, Monna T. Telomere shortening in chronic liver
diseases. Biochem. Biophys. Res. Commun. 1995; 211: 33–39.
Klein N, Bouchard M, Wang L-H, Kobarg C, Schneider R. Src kinases involved in hepatitis
B virus replication. EMBO J. 1999; 18:5019–5027.
Kowalik MA, Saliba C, Pibiri M, Perra A, Ledda-Columbano GM, Sarotto I, Ghiso E,
Giordano S, Columbano A. Yes-Associated Protein Regulation of Adaptive Liver
Enlargement and Hepatocellular Carcinoma Development in Mice. Hepatology. 2011;
53:2086-2096.
Krysko O, Hulshagen L, Janssen A, Schütz G, Klein R, De Bruycker M, Espeel M, Gressens
P, Baes M. Neocortical and cerebellar developmental abnormalities in conditions of
selective elimination of peroxisomes from brain or from liver. J. Neurosci. Res. 2007;
85:58–72.
Kudo M. Signaling pathway/molecular targets and new targeted agents under
development in hepatocellular carcinoma. World J Gastroenterol. 2012; 18(42):6005-17.
Ledda-Columbano, G.M., Pibiri, M., Loi, R., Perra, A., Shinozuka, H., Columbano, A. Early
increase in cyclin-D1 expression and accelerated entry of mouse hepatocytes into S
phase after administration of the mitogen 1,4-Bis[2-(3,5-Dichloropyridyloxy)] benzene.
Am J Pathol. 2000; 156(1):91-97.
Lederer F. in Chemistry and biochemistry of flavoenzymes, (Müller, F., ed.). 1991; vol. 2,
pp. 153–242, CRC Press, Boca Rato
Lee SJ, Liu J, Qi N, Guarnera RA, Lee SY, Cicila GT. Use of a panel of congenic strains to
evaluate differentially expressed genes as candidate genes for blood pressure
quantitative trait loci. Hypertens Res. 2003; 26(1):75-87.
Lehoux IE, Mitra B. (S)-Mandelate dehydrogenase from Pseudomonas putida:
Mechanistic studies with alternate substrates and pH and kinetic isotope effects.
Biochemistry. 1999; 38: 5836-5848.
Lencioni R, Pinto F, Armillotta N, Bassi AM, Moretti M, Di Giulio M, Marchi S,Uliana M,
Della Capanna S, Lencioni M, Bartolozzi C. Long-term results of percutaneous ethanol
injection therapy for hepatocellular carcinoma in cirrhosis:a European experience. Eur
Radiol. 1997; 7(4):514-9.

60
Livraghi T, Giorgio A, Marin G, et al. Hepatocellular carcinoma and cirrhosis in 746
patients: long-term results of percutaneous ethanol injection. Radiology 1995; 197:
101–08.
Llovet JM, Bruix J. Systematic review of randomized trials for unresectable
hepatocellular carcinoma: chemoembolization improves survival. Hepatology. 2003;
37:429–442.
Llovet JM, Burroughs A, Bruix J. Hepatocellular carcinoma. Lancet. 2003; 362:1907-17.
Llovet JM, Schwartz M, Mazzaferro V: Resection and liver transplantation for
hepatocellular carcinoma. Semin Liver Dis. 2005; 25:181–200.
Llovet, J.M, Bru, C, Bruix J. Prognosis of hepatocellular carcinoma: the BCLC staging
classification. Semin. Liver Dis. 1999; 19:329–338.
Locker J, Tian J, Carver R, Concas D, Cossu C, Ledda-Columbano GM, Columbano A. A
common set of immediate-early response genes in liver regeneration and hyperplasia.
Hepatology. 2003; 38:314–325.
Logan CY, Nusse R. The Wnt signaling pathway in development and disease. Ann Rev Cell
Dev Biol. 2004; 20:781–810.
Lok AS, Sterling RK, Everhart JE, Wright EC, Hoefs JC, Di Bisceglie AM, Morgan TR, Kim
HY, Lee WM, Bonkovsky HL, Dienstag JL; HALT-C Trial Group. Des-gamma-carboxy
prothrombin and alpha-fetoprotein as biomarkers for the early detection of
hepatocellular carcinoma. Gastroenterology. 2010; 138(2):493-502.
Lunn RM, Zhang YJ, Wang LY, Chen CJ, Lee PH, Lee CS, Tsai WY, Santella RM. p53
mutations, chronic hepatitis B virus infection, and aflatoxin exposure in hepatocellular
carcinoma in Taiwan. Cancer Res. 1997;57(16):3471-7.
Ma Q, Wyszynski DF, Farrell JJ, Kutlar A, Farrer LA, Baldwin CT, Steinberg MH. Fetal
hemoglobin in sickle cell anemia: genetic determinants of response to hydroxyurea.
Pharmacogenomics J. 2007; 7(6):386-94.
Maeda-Yorita K, Aki K, Sagai H, Misaki H, Massey V. L-Lactate oxidase and L-lactate
monooxygenase: Mechanistic variations on a common structural theme, Biochimie.
1995; 77:631-642.

61
Maheshwari S, Sarraj A, Kramer J, El-Serag HB. Oral contraception and the risk of
hepatocellular carcinoma. J Hepatol. 2007; 47:506-513.
Malhotra JD, Kaufman RJ. Endoplasmic reticulum stress and oxidative stress: a vicious
cycle or a double-edged sword? Antioxid Redox Signal. 2007; 9(12):2277-93.
Manenti G, Dragani TA, Della Porta G. Effects of phenobarbital and 1,4-bis[2-(3,5-
dichloropyridyloxy)]benzene on differentiated functions in mouse liver. Chem Biol
Interact 1987; 64(1-2):83-92.
Marra M, Sordelli IM, Lombardi A, Lamberti M, Tarantino L, Giudice A, Stiuso P,
Abbruzzese A, Sperlongano R, Accardo M, Agresti M, Caraglia M, Sperlongano P.
Molecular targets and oxidative stress biomarkers in hepatocellular carcinoma: an
overview. J Transl Med. 2011; 9:171.
Mazzaferro V, Regalia E, Doci R, Andreola S, Pulvirenti A, Bozzetti F, Montalto F,
Ammatuna M, Morabito A, Gennari L. Liver transplantation for the treatment of small
hepatocellular carcinomas in patients with cirrhosis. N Engl J Med. 1996; 334(11):693-9.
Mazzanti R, Arena U, Pantaleo P. Antonuzzo L, Cipriani G, Neri B, Giordano C, Lanini F,
Marchetti S, Gentilini P. Survival and prognostic factors in patients with hepatocellular
carcinoma treated by percutaneous ethanol injection: a 10-year experience. Can. J.
Gastroenterol. 2004b; 18 (10): 611–618.
Mazzanti R, Giallombardo AL, Mini E, Nobili S, Neri B, Arena U, Pantaleo P, Fabbroni V,
Ghilardi M, Gattai R, Bandettini L. Treatment of locally advanced hepatocellular
carcinoma by hepatic intra artery chemotherapy: a pilot study. Dig. Liver Dis. 2004a; 36
(4):278–285.
Mazzanti R, Gramantieri L, Bolondi L. Hepatocellular carcinoma: epidemiology and
clinical aspects. Mol Aspects Med. 2008; 29(1-2):130-43.
McGivern DR, Lemon SM. Tumor suppressors, chromosomal instability, and hepatitis C
virusassociated liver cancer. Annu Rev Pathol. 2009; 4:399–415.
Mihalik SJ, Rainville AM, Watkins PA. Phytanic acid a-oxidation in rat liver peroxisomes.
Production of a-hydroxyphytanoyl-CoA and formate is enhanced by dioxygenase
cofactors. Eur. J. Biochem. 1995; 232:545–551.
62
Miura N, Horikawa I, Nishimoto A, Ohmura H, Ito H, Hirohashi S, Shay JW, Oshimura M.
Progressive telomere shortening and telomerase reactivation during hepatocellular
carcinogenesis. Cancer Genet Cytogenet. 1997;93(1):56-62.
Monga SP. Role and regulation of β-catenin signaling during physiological liver growth.
Gene Expr. 2014; 16(2):51-62.
Nanji AA, French SW. Hepatocellular carcinoma- Relationship to wine and pork
consumption. Cancer. 1985; 56:2711-2.
Nusse R. Wnt signaling in disease and in development. Cell Res 2005; 15:28–32.
Okada S. Local ablation therapy for hepatocellular carcinoma. Semin Liver Dis. 1999; 19:
323–28.
Okuda K. Hepatocellular carcinoma. J. Hepatol. 2000; 32:225–237.
Overall evaluations of carcinogenicity: an updating of IARC Monographs volumes 1 to
42. IARC Monogr Eval Carcinog Risks Hum Suppl. 1987; 7:1-440.
Pang R, Tse E, Poon RT. Molecular pathways in hepatocellular carcinoma. Cancer Lett.
2006; 240(2):157-69.
Paradis V. Histopathology of hepatocellular carcinoma. Recent Results Cancer Res. 2013;
190:21-32.
Parkin DM, Bray FI, Devesa SS. Cancer burden in the year 2000. The global picture. Eur J
Cancer. 2001; 37:S4-S66.
Pawlik TM, Gleisner AL, Anders RA, Assumpcao L, Maley W, Choti MA. Preoperative
assessment of hepatocellular carcinoma tumor grade using needle biopsy: implications
for transplant eligibility. Ann Surg. 2007; 245(3):435-42.
Peifer M, Polakis P. Wnt signaling in oncogenesis and embryogenesis --a look outside the
nucleus. Science. 2000; 287:1606–9.
Perra A, Kowalik MA, Pibiri M, Ledda-Columbano GM, Columbano A. Thyroid hormone
receptor ligands induce regression of rat preneoplastic liver lesions causing their
reversion to a differentiated phenotype. Hepatology. 2009; 49(4):1287-96.
Petrelli A, Perra A, Cora D, Sulas P, Menegon S, Manca C, Migliore C, Kowalik MA, Ledda-
Columbano GM, Giordano S, Columbano A. MicroRNA/gene profiling unveils early
63
molecular changes and nuclear factor erythroid related factor 2 (NRF2) activation in a
rat model recapitulating human hepatocellular carcinoma (HCC). Hepatology. 2014;
59(1):228-41.
Plentz RR, Caselitz M, Bleck JS, Gebel M, Flemming P, Kubicka S, Manns MP, Rudolph KL.
Hepatocellular telomere shortening correlates with chromosomal instability and the
development of human hepatoma. Hepatology. 2004; 40(1):80-6.
Plentz RR, Schlegelberger B, Flemming P, Gebel M, Kreipe H, Manns MP, Rudolph KL,
Wilkens L. Telomere shortening correlates with increasing aneuploidy of chromosome 8
in human hepatocellular carcinoma. Hepatology. 2005; 42(3):522-6.
Qian GS, Ross RK, Yu MC, Yuan JM, Gao YT, Henderson BE, Wogan GN, Groopman JD. A
follow-up study of urinary markers of aflatoxin exposure and liver cancer risk in
Shanghai, People's Republic of China. Cancer Epidemiol Biomarkers Prev. 1994; 3(1):3-
10.
Ray RB, Steele R. Separate domains of MBP-1 involved in c-myc promoter binding and
growthsuppressive activity. Gene. 1997; 186:175–180.
Recalcati S, Tacchini L, Alberghini A, Conte D, Cairo G. Oxidative stress-mediated down-
regulation of rat hydroxyacid oxidase 1, a liver-specific peroxisomal enzyme.
Hepatology. 2003; 38(5):1159-66.
Regimbeau JM, Colombat M, Mognol P, Durand F, Abdalla E, Degott C, Degos F, Farges
O, Belghiti J. Obesity and diabetes as a risk factor for hepatocellular carcinoma. Liver
Transpl. 2004;10(2 Suppl 1):S69-73.
Reifenberg K, Wilts H, Lohler J, Nusser P, Hanano R, Guidotti LG, Chisari FV, Schlicht HJ.
The hepatitis B virus X protein transactivates viral core gene expression in vivo. J Virol.
1999; 73:10399–10405.
Rico-Sanz J, Rankinen T, Rice T, Leon AS, Skinner JS, Wilmore JH, Rao DC, Bouchard C.
Quantitative trait loci for maximal exercise capacity phenotypes and their responses to
training in the HERITAGE Family Study. Physiol Genomics. 2004; 16(2):256-60.
Roberts PJ, Der CJ. Targeting the Raf-MEK-ERK mitogen activated protein kinase cascade
for the treatment of cancer. Oncogene. 2007; 26:3291-3310
64
Robinson JC, Keay L, Molinari R, Sizer IW. L-α-Hydroxy acid oxidases of hog renal cortex.
J. Biol. Chem. 1962; 237:2001−2010.
Rossi S, Di Stasi M, Buscarini E, Quaretti P, Garbagnati F, Squassante L, Paties CT,
Silverman DE, Buscarini L. Percutaneous RF interstitial thermal ablation in the treatment
of hepatic cancer. AJR Am J Roentgenol. 1996; 167(3):759-68.
Rudolph KL, Chang S, Millard M, Schreiber-Agus N, DePinho RA. Inhibition of
experimental liver cirrhosis in mice by telomerase gene delivery. Science. 2000;
287:1253–1258.
Rudolph KL, DrPinho RA. in The Liver Biology and Pathobiology (eds Arias, I., Fausto, N.,
Boyer, J., Chisari, F. & Shafritz, D.) 1001–1011 (Lippincott Williams and Wilkins,
Philadelphia, 2001).
Sarasin FP, Majno PE, Llovet JM, Bruix J, Mentha G, Hadengue A. Living donor liver
transplantation for early hepatocellular carcinoma: A life-expectancy and cost-
effectiveness perspective. Hepatology. 2001; 33(5):1073-9.
Schafer FQ, Buettner GR. Redox environment of the cell as viewed through the redox
state of the glutathione disulfide/glutathione couple. Free Radic Biol. Med. 2001;
30:1191–1212.
Schmidt CM, McKillop IH, Cahill PA, Sitzmann JV. Increased MAPK expression and activity
in primary human hepatocellular carcinoma. Biochem Biophys Res Commun. 1997; 236:
54-58.
Schrader M, Fahimi HD. Peroxisomes and oxidative stress. Biochim. Biophys. Acta. 2006;
1763:1755–1766.
Schwam H, Michelson S, Randall WC, Sondey JM, Hirschmann R. Purification and
characterization of human liver glycolate oxidase. Molecular weight, subunit, and kinetic
properties. Biochemistry. 1979; 18(13):2828-33.
Seeger C, Zoulim F, Mason W. Hepadnaviridae. In Fields Virology, Knipe D, Howley P
(eds). 2007: Vol. 2, Fifth edn, pp 2977-3030. Philadelphia: Wolters Kluwer Health,
Lippincott Williams & Wilkins.
Shin JY, Hur W, Wang JS, Jang JW, Kim CW, Bae SH, Jang SK, Yang SH, Sung YC, Kwon OJ,
Yoon SK. HCV core protein promotes liver fibrogenesis via up-regulation of CTGF with
TGF-beta1. Exp Mol Med. 2005; 37:138–145.

65
Singal A, Volk ML, Waljee A, Salgia R, Higgins P, Rogers MA, Marrero JA. Meta-analysis:
surveillance with ultrasound for early-stage hepatocellular carcinoma in patients with
cirrhosis. Aliment Pharmacol Ther. 2009; 30(1):37-47.
Singal AK, Anand BS. Mechanisms of synergy between alcohol and hepatitis C virus. J
Clin Gastroenterol. 2007; 41, 761-72.
Smela ME, Currier SS, Bailey EA, Essigmann JM. The chemistry and biology of aflatoxin
B(1): from mutational spectrometry to carcinogenesis. Carcinogenesis. 2001; 22:535–
545.
Solt DB, Medline A, Farber E. Rapid emergence of carcinogen-induced hyperplastic
lesions in a new model for the sequential analysis of liver carcinogenesis. Am J Pathol.
1977; 88(3):595-618.
Speidel D. The role of DNA damage responses in p53 biology. Arch Toxicol. 2015;
89(4):501-17.
Stegh AH. Targeting the p53 signaling pathway in cancer therapy - the promises,
challenges and perils. Expert Opin Ther Targets. 2012; 16(1):67-83.
Su Q, Fu Y, Liu YF, Zhang W, Liu J, Wang CM. Laminin induces the expression of
cytokeratin 19 in hepatocellular carcinoma cells growing in culture. World J
Gastroenterol. 2003; 9(5):921-9.
Tanaka A, Takemoto D, Hyon GS, Park P, Scott B. NoxA activation by the small GTPase
RacA is required to maintain a mutualistic symbiotic association between Epichloë
festucae and perennial ryegrass. Mol Microbiol. 2008 Jun;68(5):1165-78.
Tannapfel A, Busse C, Weinans L, Benicke M, Katalinic A, Geissler F, Hauss J, Wittekind C.
INK4a-ARF alterations and p53 mutations in hepatocellular carcinomas. Oncogene.
2001; 20(48):7104-9.
Toyokuni S, Okamoto K, Yodoi J, Hiai H. Persistent oxidative stress in cancer. FEBS Lett.
1995; 358(1):1-3.
Turner PC, Sylla A, Diallo MS, Castegnaro JJ, Hall AJ, Wild CP. The role of aflatoxins and
hepatitis viruses in the etiopathogenesis of hepatocellular carcinoma: A basis for
primary prevention in Guinea-Conakry, West Africa. J Gastroenterol Hepatol. 2002;
17(Suppl):S441–S448.

66
Uchida M, Hino N, Yamanaka T, Fukushima H, Imanishi T, Uchiyama Y, Kodama T, Doi T.
Hepatitis C virus core protein binds to a C-terminal region of NS5B RNA polymerase.
Hepatol Res. 2002; 22:297–306.
Urabe Y, Nouso K, Higashi T, Nakatsukasa H, Hino N, Ashida K, Kinugasa N, Yoshida K,
Uematsu S, Tsuji T. Telomere length in human liver diseases. Liver.1996; 16(5):293-7.
Vamecq J, Draye JP. The enzymatic and mass spectrometric identification of 2-
oxophytanic acid, a product of the peroxisomal oxidation of l-2-hydroxyphytanic acid.
Biomed Environ Mass Spectrom. 1988; 15(6):345-51.
Verhoeven NM, Wanders RJA, Schor DSM, Jansen GA, Jakobs C. Phytanic acid α-
oxidation: decarboxylation of 2-hydroxyphytanoyl-CoA to pristanic acid in human liver. J.
Lipid Res. 1997; 38:2062–2070.
Volokita M, Somerville CR. The primary structure of spinach glycolate oxidase deduced
from the DNA sequence of a cDNA clone. J Biol Chem. 1987; 262(33):15825-8.
Wagner EF, Nebreda AR. Signal integration by JNK and p38 MAPK pathways in cancer
development. Nat Rev Cancer. 2009; 9:537–49.
Wanders RJ, Komen J, Ferdinandusse S. Phytanic acid metabolism in health and disease.
Biochim Biophys Acta. 2011; 1811(9):498-507.
Wanders RJ, van Roermund CW, Schor DS, ten Brink HJ, Jakobs C. 2-Hydroxyphytanic
acid oxidase activity in rat and human liver and its deficiency in the Zellweger syndrome.
Biochim Biophys Acta. 1994; 1227(3):177-82.
Wanders RJ, van Roermund CW, Schor DS, ten Brink HJ, Jakobs C. Phytanic acid
oxidation in man: identification of a new enzyme catalysing the formation of 2-
ketophytanic acid from 2-hydroxyphytanic acid and its deficiency in the Zellweger
syndrome. J Inherit Metab Dis. 1995; 18(2):201-3.
Wanders RJ, Waterham HR. Peroxisomal disorders: the single peroxisomal enzyme
deficiencies, Biochim. Biophys. Acta. 2006; 1763:1707–1720.
Wang AG, Yoon SY, Oh JH, Jeon YJ, Kim M, Kim JM, Byun SS, Yang JO, Kim JH, Kim DG,
Yeom YI, Yoo HS, Kim YS, Kim NS. Identification of intrahepatic cholangiocarcinoma
related genes by comparison with normal liver tissues using expressed sequence tags.
Biochem Biophys Res Commun. 2006; 345(3):1022-32.
67
Wang LY, You SL, Lu SN, Ho HC, Wu MH, Sun CA, Yang HI, Chien-Jen C. Risk of
hepatocellular carcinoma and habits of alcohol drinking, betel quid chewing and
cigarette smoking: a cohort of 2416 HBsAg-seropositive and 9421 HBsAg-seronegative
male residents in Taiwan. Cancer Causes Control. 2003; 14(3):241-50.
Watkins PA, Howard AE, Mihalik SJ. Phytanic acid must be activated to phytanoyl-CoA
prior to its alpha-oxidation in rat liver peroxisomes. Biochim. Biophys. Acta. 1994;
1214:288–294.
WHO Media centre (2014). Hepatitis B, Fact sheet N°204. Available at
http://www.who.int/mediacentre/factsheets/ fs204/en/
Willert K, Brown JD, Danenberg E, Duncan AW, Weissman IL, Reya T, Yates JR 3rd, Nusse
R. Wnt proteins are lipid-modified and can act as stem cell growth factors. Nature. 2003:
22;423(6938):448-52.
Williams JH, Phillips TD, Jolly PE, Stiles JK, Jolly CM, Aggarwal D. Human aflatoxicosis in
developing countries: a review of toxicology, exposure, potential health consequences,
and interventions. Am. J. Clin. Nutr. 2004; 80:1106–1122.
Woodgett JR. Recent advances in the protein kinase B signaling pathway. Curr Opin Cell
Biol. 2005; 17: 150-7.
Wright WE, Shay JW. The two-stage mechanism controlling cellular senescence and
immortalization. Exp Gerontol. 1992; 27: 383–389.
Yeh FS, Yu MC, Mo CC, Luo S, Tong MJ, Henderson BE. Hepatitis B virus, aflatoxins, and
hepatocellular carcinoma in southern Guangxi, China. Cancer Res. 1989; 49(9):2506-9.
Yoshikawa H, Matsubara K, Qian GS, Jackson P, Groopman JD, Manning JE, Harris CC,
Herman JG. SOCS-1, a negative regulator of the JAK/STAT pathway, is silenced by
methylation in human hepatocellular carcinoma and shows growth-suppression activity.
Nat Genet. 2001 May;28(1):29-35.
Yuan JM, Govindarajan S, Arakawa K, Yu MC. Synergism of alcohol, diabetes, and viral
hepatitis on the risk of hepatocellular carcinoma in blacks and whites in the U.S. Cancer.
2004 Sep 1;101(5):1009-17.
Zanetti AR, Van Damme P, Shouval D. The global impact of vaccination against hepatitis
B:a historical overview. Vaccine. 2008; 26(49):6266-73.

68
Zucman-Rossi J, Benhamouche S, Godard C, Boyault S, Grimber G, Balabaud C, Cunha AS,
Bioulac-Sage P, Perret C. Differential effects of inactivated Axin1 and activated beta-
catenin mutations in human hepatocellular carcinomas. Oncogene. 2007; 26(5):774-80.