dot & nypd accomplishments 2017 - nyc.gov · the pre-vision zero average (58 vs. 47) 5 year...
TRANSCRIPT

DOT & NYPD
Accomplishments
2017

Vision Zero DOT & NYPD Accomplishments
Enforcement
– Failure to Yield
• Nearly 170,000 summonses since the start of Vision Zero
• Over 50,000 summonses in 2017. More than 4 times the pre-VZ annual average
– Speeding (Manual)
• Nearly 540,000 summonses since the start of Vision Zero
• Nearly 150,000 in 2017. Up more than 90% from the pre-VZ annual average
– Speeding (Automated)
• More than 4 million Notices of Liability issued since start of Vision Zero
• Nearly 1.3 million Notices of Liability issued in 2017
• More than 50% of Notices of Liability issued at Priority Locations in 2017
Design
– Leading Pedestrian Intervals (LPIs)
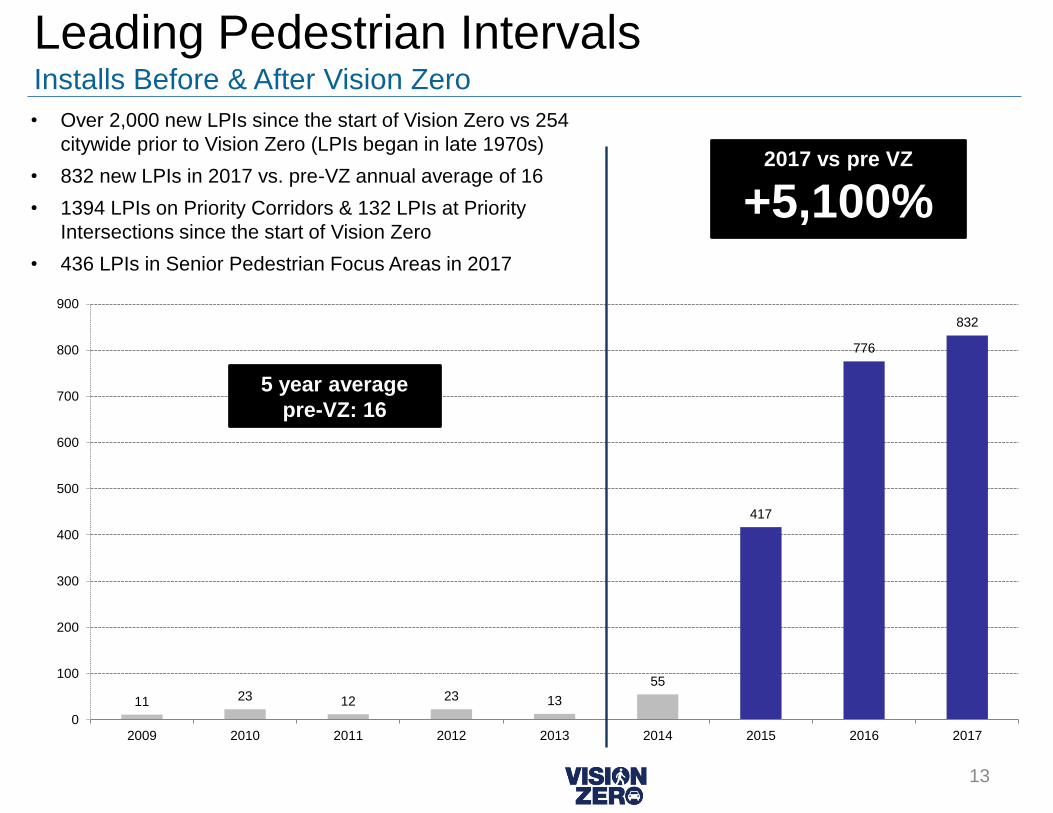
• Over 2,000 new LPIs since the start of Vision Zero vs 254 citywide prior to Vision Zero (LPIs began in late 1970s)
• 832 new LPIs in 2017 vs. pre-VZ annual average of 16
• 1394 LPIs on Priority Corridors & 132 LPIs at Priority Intersections since the start of Vision Zero
• 436 LPIs in Senior Pedestrian Focus Areas in 2017
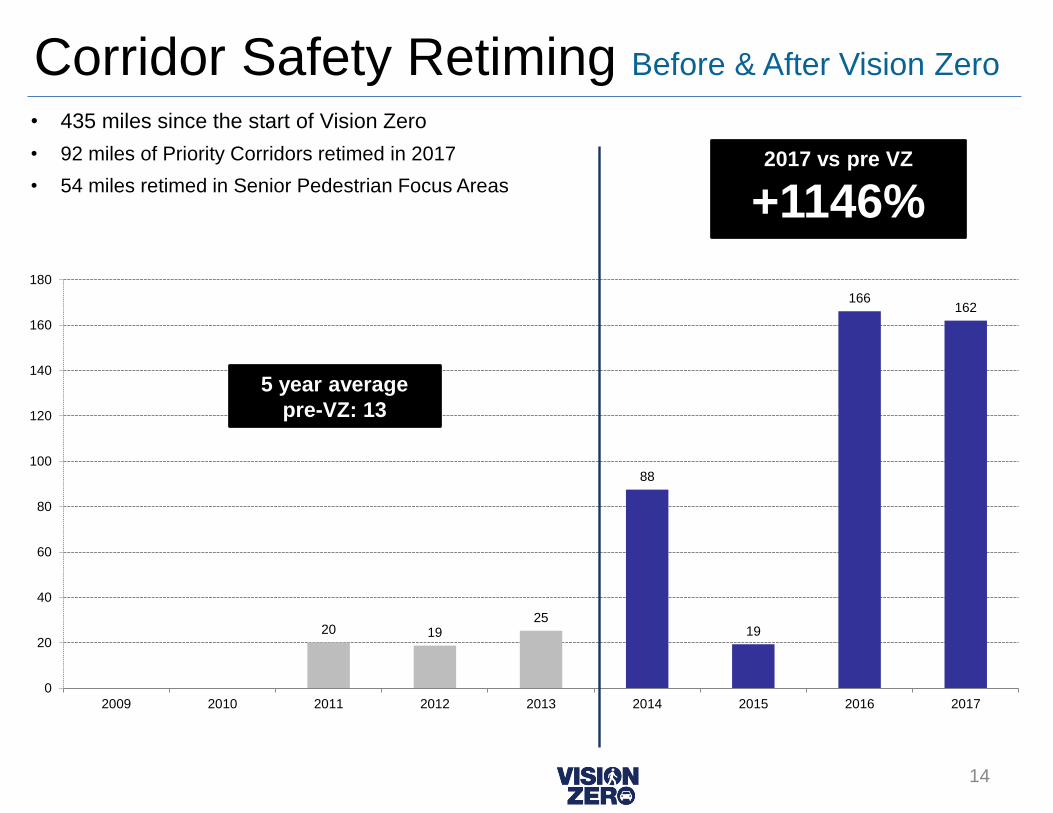
– Corridor Safety Retiming
• 435 miles since the start of Vision Zero
• 92 miles of Priority Corridors retimed in 2017
• 54 miles retimed in Senior Pedestrian Focus Areas
– Left Turn Traffic Calming
• Nearly 220 intersections received a treatment since the start of Vision Zero
• Treatments installed at 110 intersections in 2017 (107 in 2016)
• More than 170 intersections treated in Priority Locations since start of Vision Zero
– Turning Safety Signal Treatments
• Includes Split Phases, Delayed Turns (Split LPIs) for Ped/Bike, Left Turn Signals & Phases
• Over 150 Turning Safety Signal Treatments since the start of Vision Zero
• 53 Turning Safety Signal Treatments in 2017
• Over 100 Turning Safety Signal Treatments at Priority Locations since the start of Vision Zero
– Vision Zero Lighting
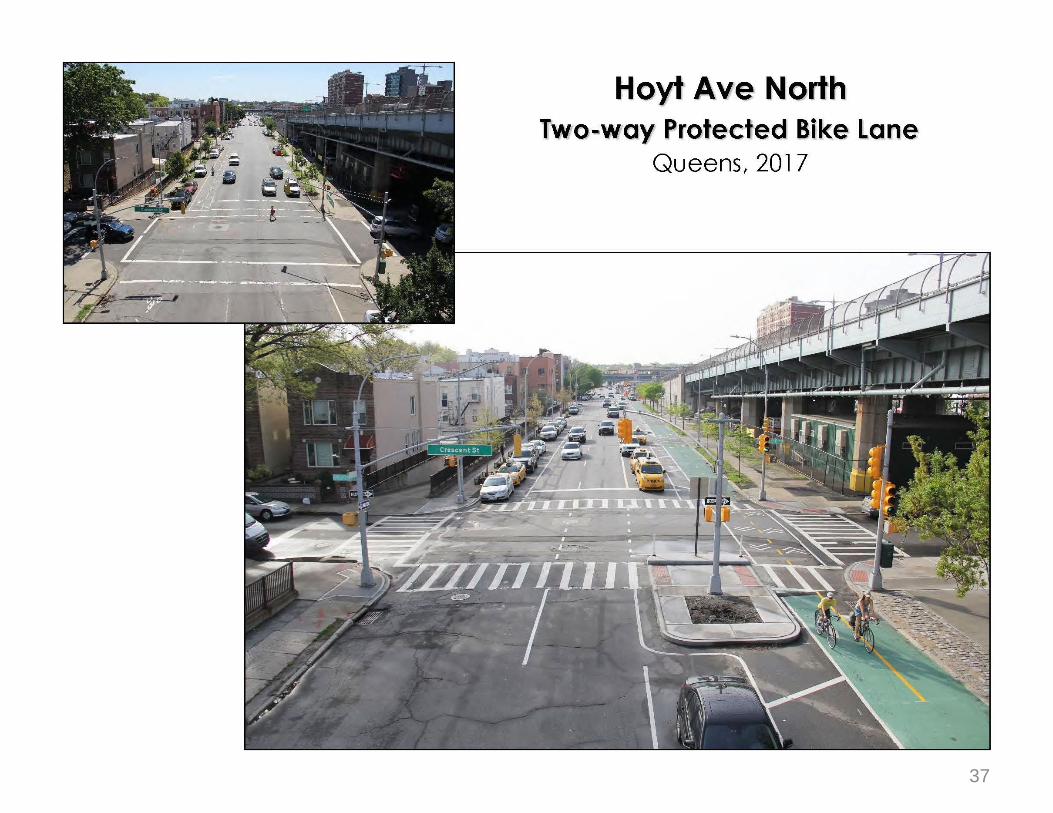
• Extra lighting fixtures added at locations where injuries were higher in darkness
• 1000 locations completed since the start of Vision Zero
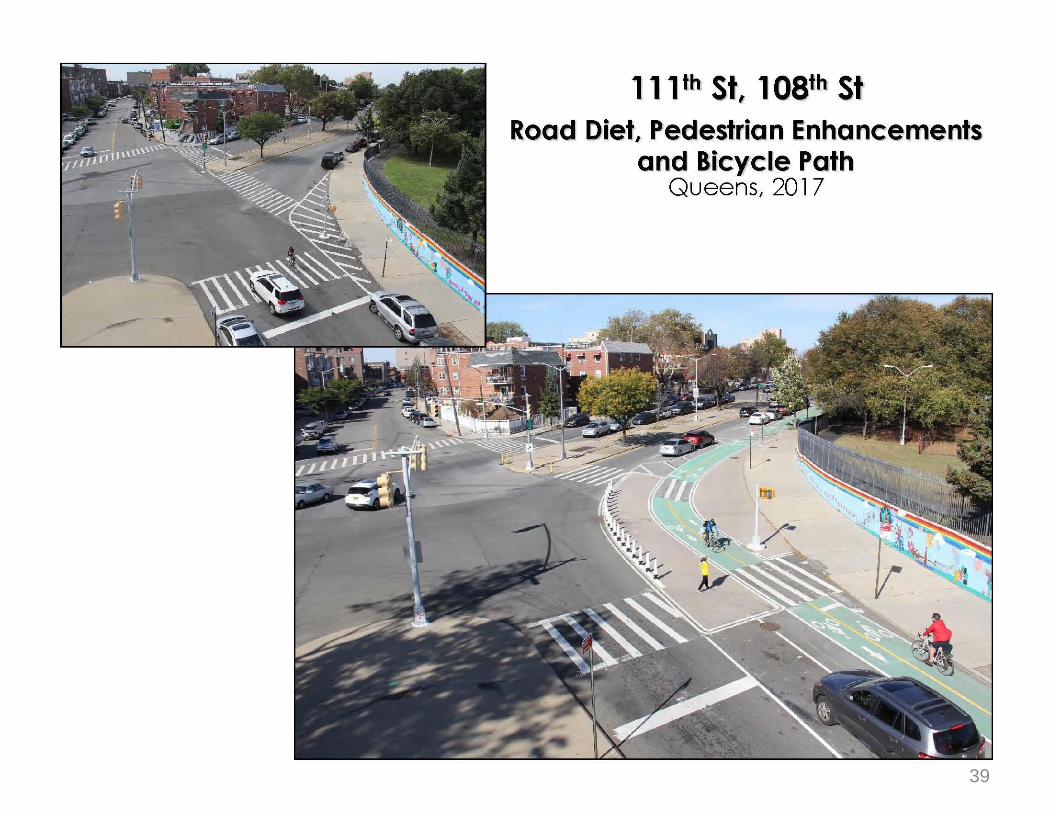
• More than 750 in Priority Locations since start of Vision Zero
1

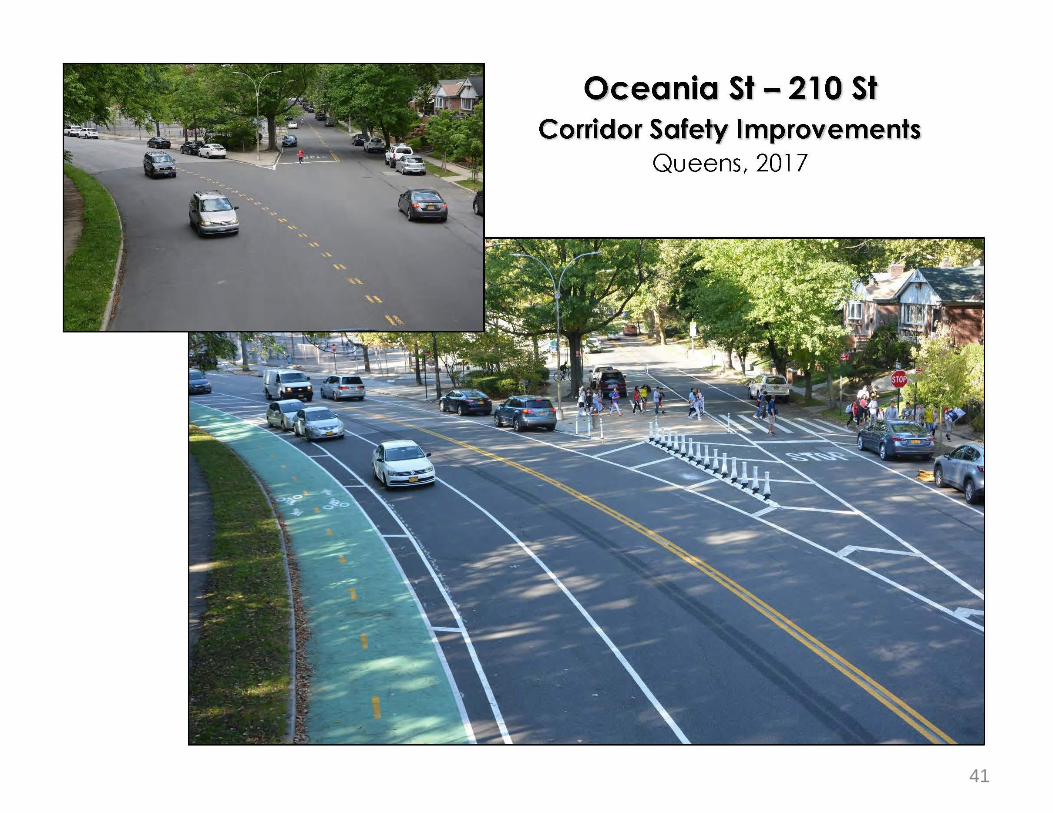
Vision Zero DOT & NYPD Accomplishments
Design (continued)
– Total Safety Projects
• 356 total safety engineering projects completed since the start of Vision Zero
• In 2017, 114 projects completed, more than double the pre-VZ annual average
• 254 safety engineering projects completed at Priority Locations since start of Vision Zero (76 in 2017)
– Protected Bicycle Lane Miles
• Over 60 miles of Protected Bike Lanes installed since start of Vision Zero
• Nearly 25 miles installed in 2017, the most of any year and nearly quadruple the pre-VZ annual average
– Dedicated Bicycle Lane Miles
• More than 180 miles of dedicated cycling space (conventional and protected bicycle lanes) installed since start of Vision
Zero
• In 2017, more than 66 miles of dedicated cycling space (conventional and protected bicycle lanes) installed, more than
double the pre-VZ annual average
– Speed Bumps
• Over 1,500 new speed bumps since the start of Vision Zero
• Nearly 400 new in 2017, more than double the pre-VZ annual average
• Over 460 new speed bumps installed in Priority Areas since start of Vision Zero
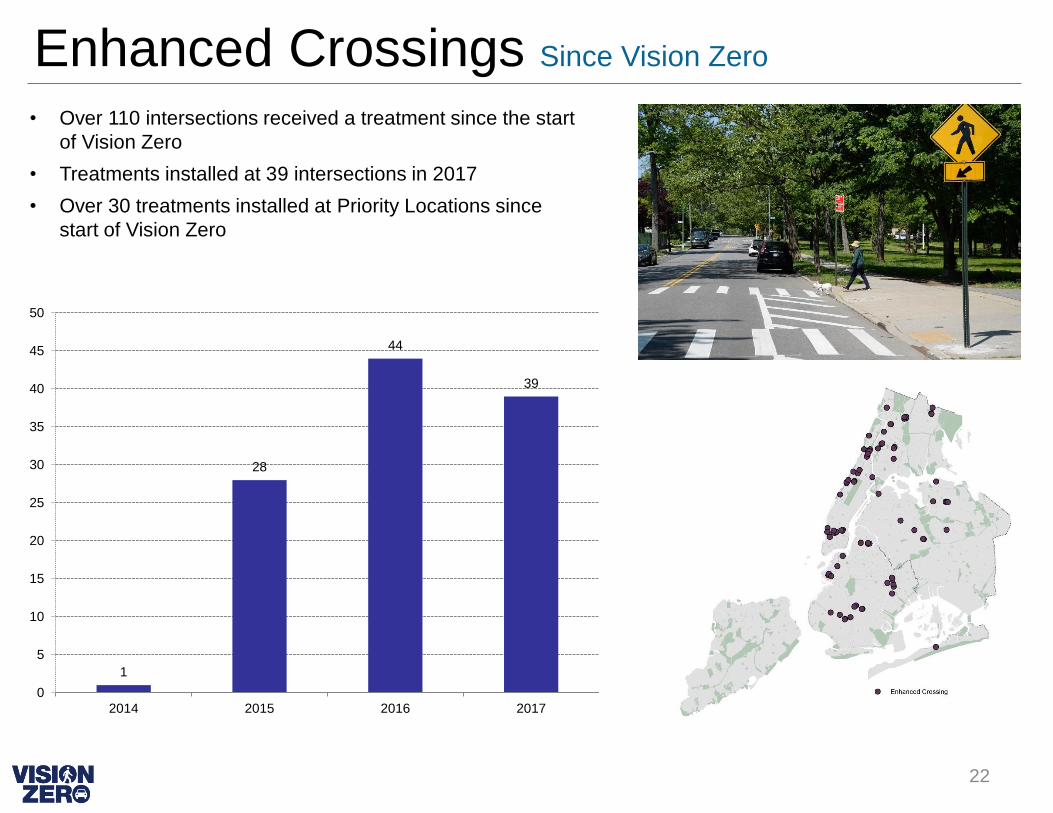
– Enhanced Crossings
• Over 110 intersections received a treatment since the start of Vision Zero
• Treatments installed at 39 intersections in 2017
• Over 30 treatments installed at Priority Locations since start of Vision Zero
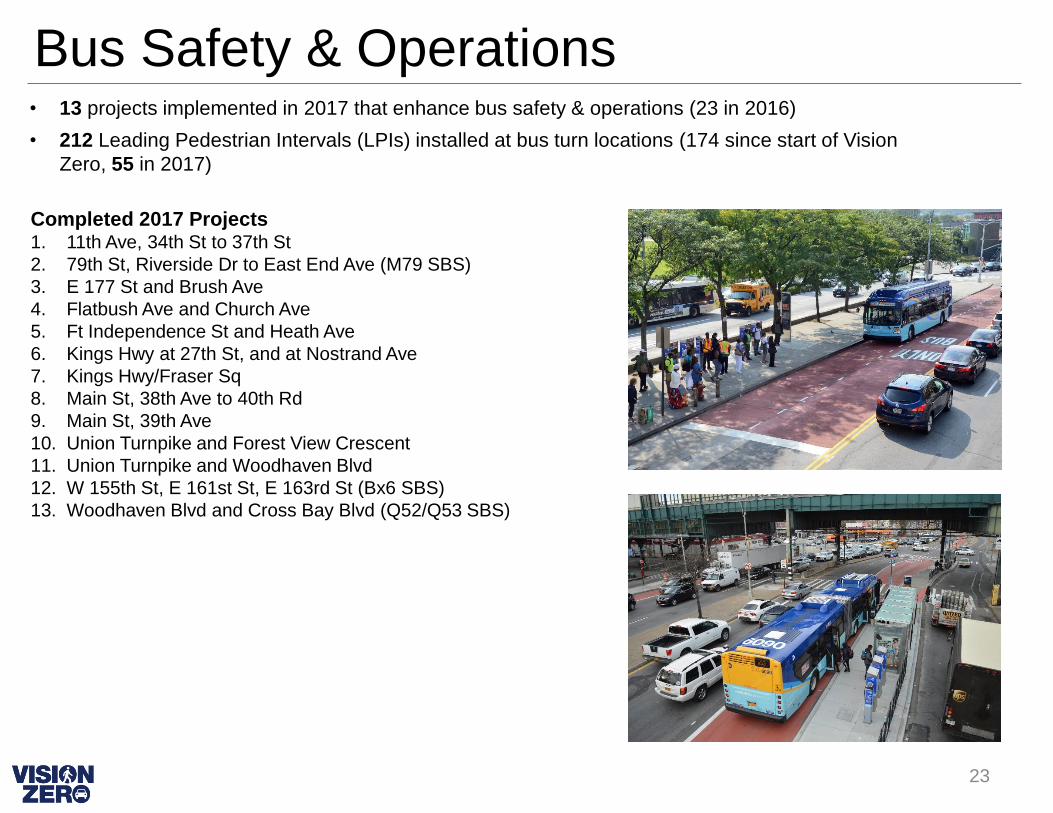
– Bus Safety & Operations
• 13 projects implemented in 2017 that enhance bus safety & operations (23 in 2016)
• 212 Leading Pedestrian Intervals (LPIs) installed at bus turn locations (174 since start of Vision Zero, 55 in 2017)
Safety Education
– NYPD & DOT Street Teams visited over 480 Priority Locations since start of Vision Zero (nearly 2 million flyers distributed)
– More than 120 Priority Locations visited in 2017 (over 250,000 flyers distributed)
– DOT Safety Education visited over 1,300 schools at Priority Locations since start of Vision Zero
– More than 300 schools in Priority Locations visited in 2017
– DOT Safety Education visited nearly 300 senior centers at Priority Locations since start of Vision Zero
– More than 90 senior centers in Priority Locations visited in 2017
Public Awareness Campaigns
– Driver behavior and comprehension continues to trend upward directionally
– Awareness and support of Vision Zero remains at a high level
– Performance on key metrics is statistically consistent year over year
– In October 2017, the City introduced the new Vision Zero campaign “Signs” 2

DOT & NYPD
Accomplishments
Traffic Fatalities
260273
250
278
299
259
234 231
217
0
50
100
150
200
250
300
350
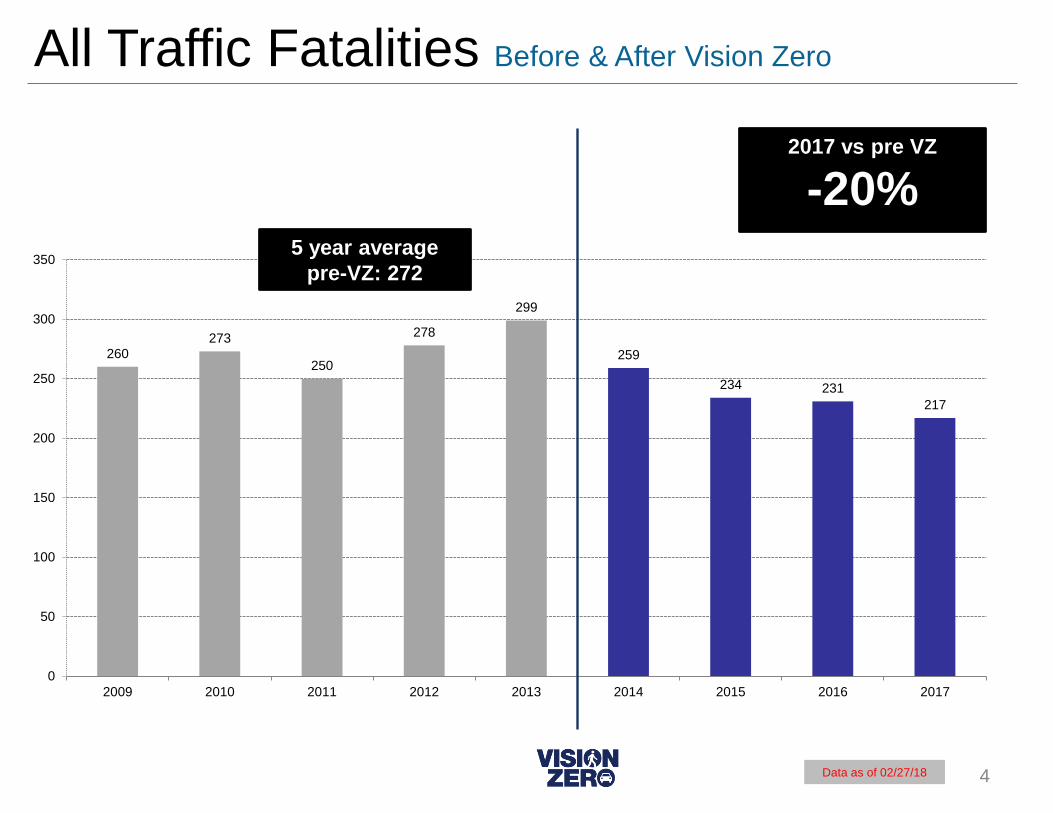
2009 2010 2011 2012 2013 2014 2015 2016 2017
All Traffic Fatalities Before & After Vision Zero
2017 vs pre VZ
-20%5 year average
pre-VZ: 272
4Data as of 02/27/18

136 140 131148 153
125 118101 103
124133
119
130
146
134
116130
114
260
273
250
278
299
259
234 231
217
0
50
100
150
200
250
300
350
2009 2010 2011 2012 2013 2014 2015 2016 2017
All Traffic Fatalities Before & After Vision Zero
2017 vs pre VZ
At Priority Locations:
-27%
• Fatalities at Priority Locations have fallen 27%, from
142 to 103. Not at Priority Locations, fatalities were
down 12% in 2017 versus the pre-Vision Zero average
(130 vs. 114)
5 year average
pre-VZ at Priority
Locations: 142
Fatalities at Priority Locations
Fatalities at non-Priority Locations
5Data as of 02/27/18

158153
143
151
184
140 139
148
104
0
20
40
60
80
100
120
140
160
180
200
2009 2010 2011 2012 2013 2014 2015 2016 2017
Pedestrian Fatalities Before & After Vision Zero
5 year average
pre-VZ: 158
2017 vs pre VZ
-34%
6Data as of 02/27/18

101 94 87101
114
85 9173
57
5759
56
50
70
55 4875
47
158153
143
151
184
140 139
148
104
0
20
40
60
80
100
120
140
160
180
200
2009 2010 2011 2012 2013 2014 2015 2016 2017
Pedestrian Fatalities Before & After Vision Zero
2017 vs pre VZ
at Priority Locations:
-42%
• Pedestrian fatalities at Priority Locations have fallen
42%, from 99 to 57. Not at Priority Locations,
pedestrian fatalities were down 19% in 2017 versus
the pre-Vision Zero average (58 vs. 47)
5 year average
pre-VZ at Priority
Locations: 99
Fatalities at Priority Locations
Fatalities at non-Priority Locations
7Data as of 02/27/18

DOT & NYPD
Accomplishments
Enforcement
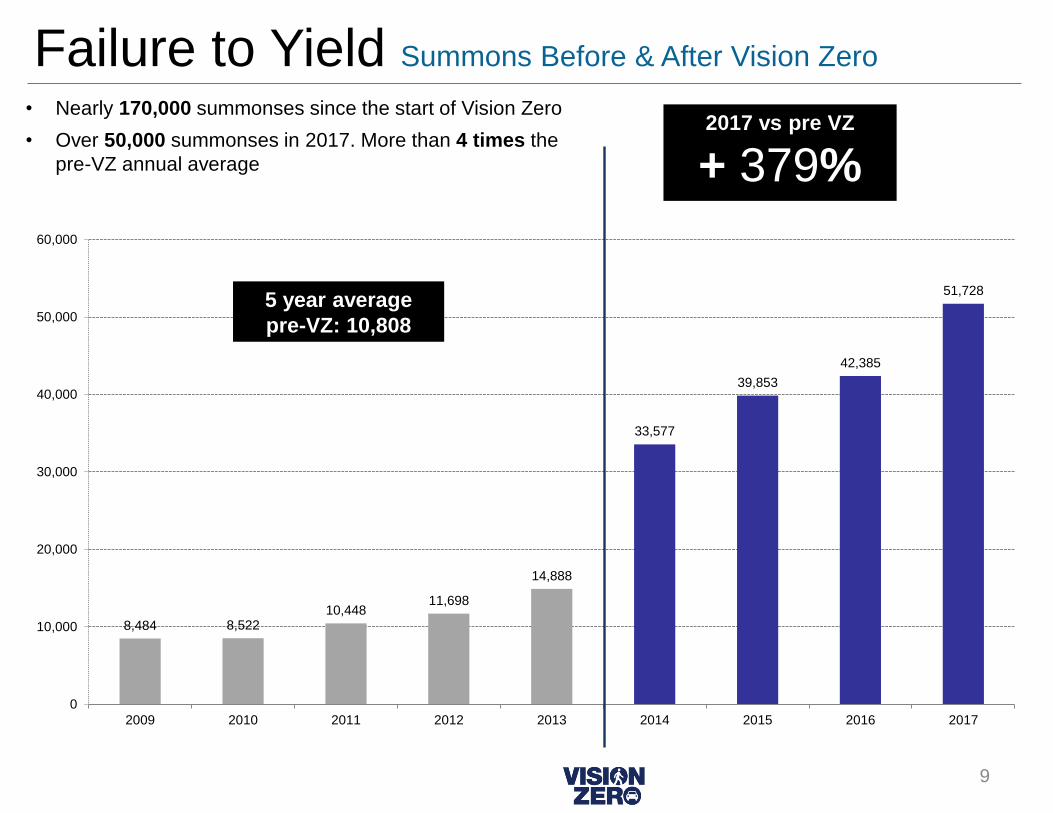
8,484 8,52210,448
11,698
14,888
33,577
39,853
42,385
51,728
0
10,000
20,000
30,000
40,000
50,000
60,000
2009 2010 2011 2012 2013 2014 2015 2016 2017
Failure to Yield Summons Before & After Vision Zero
5 year average
pre-VZ: 10,808
2017 vs pre VZ
+ 379%
• Nearly 170,000 summonses since the start of Vision Zero
• Over 50,000 summonses in 2017. More than 4 times the
pre-VZ annual average
9

80,015 78,127 76,49371,305
83,202
117,768
134,438137,256
149,910
0
20,000
40,000
60,000
80,000
100,000
120,000
140,000
160,000
2009 2010 2011 2012 2013 2014 2015 2016 2017
Speeding Manual Summons Before & After Vision Zero
5 year average
pre-VZ: 77,828
2017 vs pre VZ
+93%
• Nearly 540,000 summonses since the start of Vision
Zero
• Nearly 150,000 in 2017. Up more than 90% from the
pre-VZ annual average
10
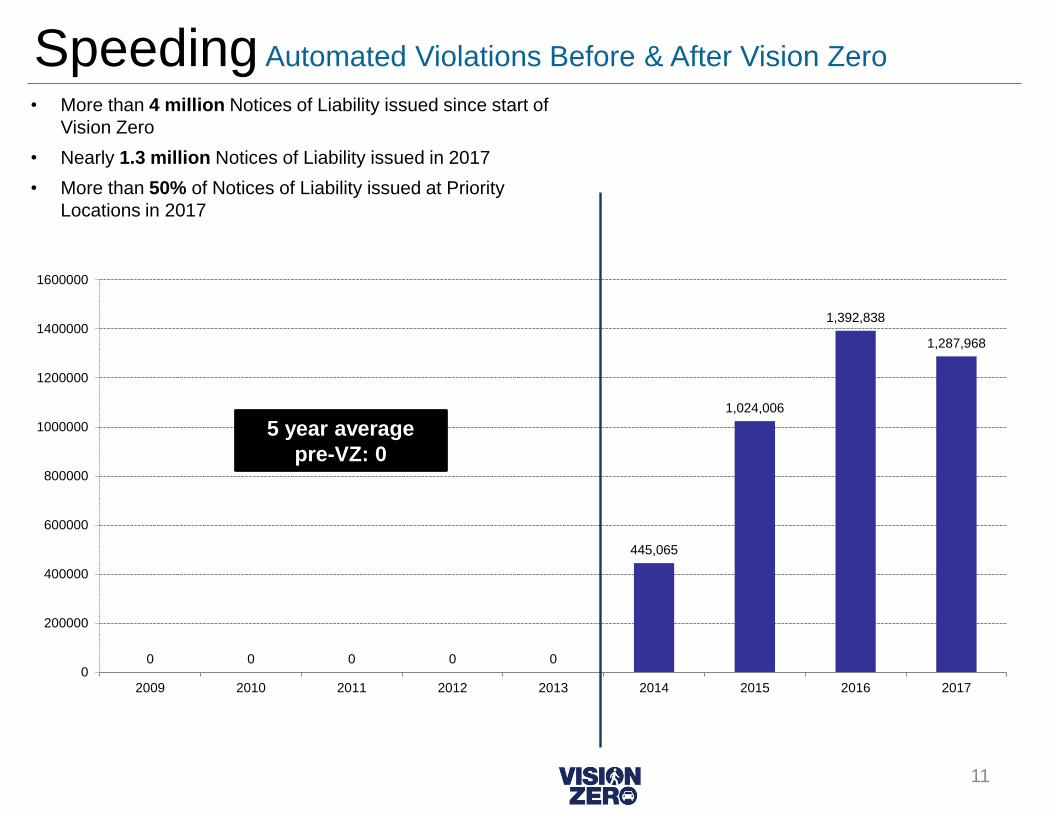
0 0 0 0 0
445,065
1,024,006
1,392,838
1,287,968
0
200000
400000
600000
800000
1000000
1200000
1400000
1600000
2009 2010 2011 2012 2013 2014 2015 2016 2017
Speeding Automated Violations Before & After Vision Zero
5 year average
pre-VZ: 0
• More than 4 million Notices of Liability issued since start of
Vision Zero
• Nearly 1.3 million Notices of Liability issued in 2017
• More than 50% of Notices of Liability issued at Priority
Locations in 2017
11
DOT & NYPD
Accomplishments
Design
11 23 12 23 13
55
417
776
832
0
100
200
300
400
500
600
700
800
900
2009 2010 2011 2012 2013 2014 2015 2016 2017
Leading Pedestrian Intervals Installs Before & After Vision Zero
5 year average
pre-VZ: 16
2017 vs pre VZ
+5,100%
• Over 2,000 new LPIs since the start of Vision Zero vs 254
citywide prior to Vision Zero (LPIs began in late 1970s)
• 832 new LPIs in 2017 vs. pre-VZ annual average of 16
• 1394 LPIs on Priority Corridors & 132 LPIs at Priority
Intersections since the start of Vision Zero
• 436 LPIs in Senior Pedestrian Focus Areas in 2017
13
20 1925
88
19
166162
0
20
40
60
80
100
120
140
160
180
2009 2010 2011 2012 2013 2014 2015 2016 2017
Corridor Safety Retiming Before & After Vision Zero
5 year average
pre-VZ: 13
2017 vs pre VZ
+1146%
• 435 miles since the start of Vision Zero
• 92 miles of Priority Corridors retimed in 2017
• 54 miles retimed in Senior Pedestrian Focus Areas
14
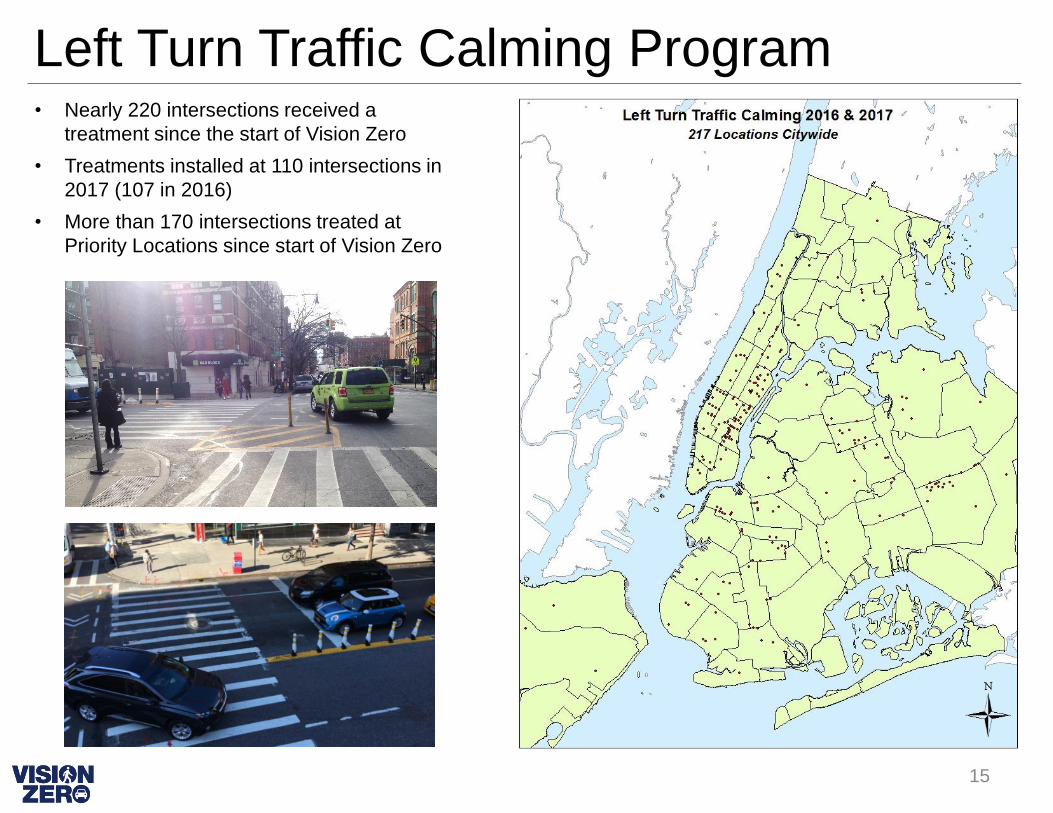
Left Turn Traffic Calming Program • Nearly 220 intersections received a
treatment since the start of Vision Zero
• Treatments installed at 110 intersections in
2017 (107 in 2016)
• More than 170 intersections treated at
Priority Locations since start of Vision Zero
15
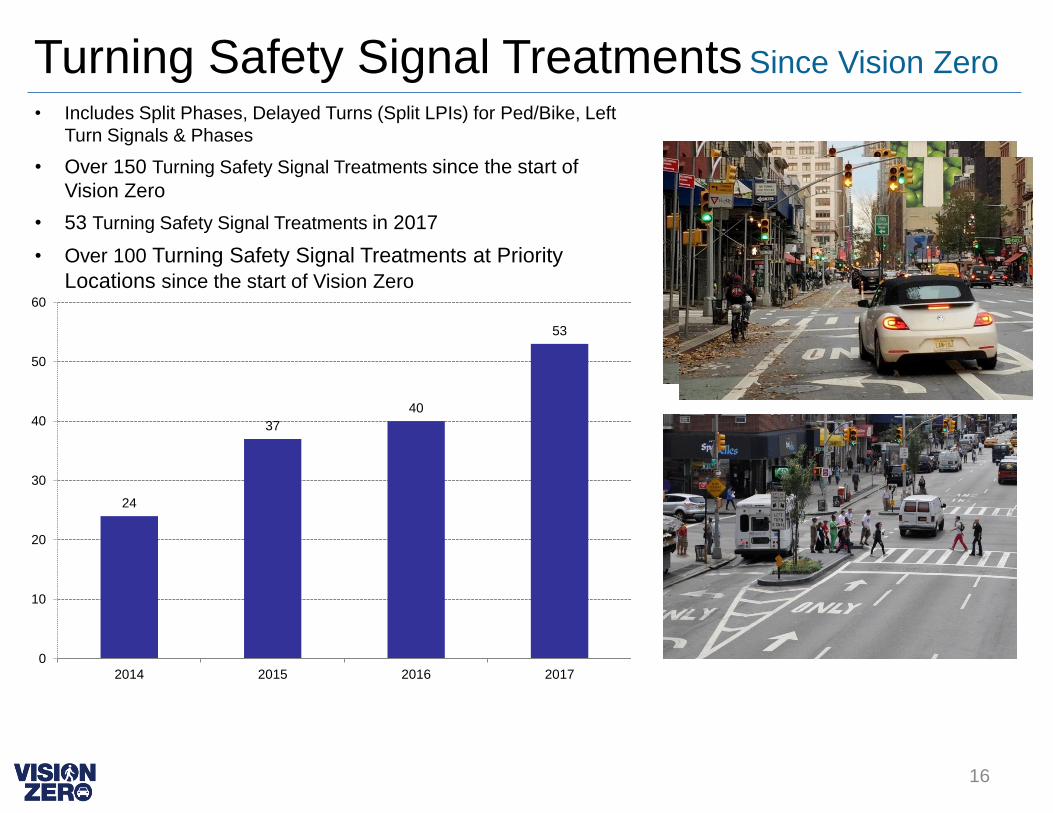
Turning Safety Signal Treatments Since Vision Zero
• Includes Split Phases, Delayed Turns (Split LPIs) for Ped/Bike, Left
Turn Signals & Phases
• Over 150 Turning Safety Signal Treatments since the start of
Vision Zero
• 53 Turning Safety Signal Treatments in 2017
• Over 100 Turning Safety Signal Treatments at Priority
Locations since the start of Vision Zero
16
24
37
40
53
0
10
20
30
40
50
60
2014 2015 2016 2017

Vision Zero Lighting
• Extra lighting fixtures added at
locations where injuries were higher in
darkness
• 1000 locations completed since the
start of Vision Zero
• More than 750 in Priority Locations
since start of Vision Zero
17

42
60
76 76
15
20
2938
45 42 42
51
6257
80
105
114
0
20
40
60
80
100
120
2009 2010 2011 2012 2013 2014 2015 2016 2017
• 356 total safety engineering projects completed since the
start of Vision Zero
• In 2017, 114 projects completed, more than double the
pre-VZ annual average
• 254 safety engineering projects completed at Priority
Locations since start of Vision Zero (76 in 2017)
18
Safety Projects at Priority Locations
Safety Projects at non-Priority Locations
Total Safety Projects Before & After Vision Zero
2017 vs pre VZ
+138%
5 year average
pre-VZ: 48

9.1
8.0
4.2 4.5
6.7
5.4
13.3
18.5
24.9
0.0
5.0
10.0
15.0
20.0
25.0
30.0
2009 2010 2011 2012 2013 2014 2015 2016 2017
Protected Bike Lane Miles Before & After Vision Zero
5 year average
pre-VZ: 6.5
2017 vs pre VZ
+285%
• Over 60 miles of Protected Bike Lanes installed since
start of Vision Zero
• Nearly 25 miles installed in 2017, the most of any year
and nearly quadruple the pre-VZ annual average
19

32.7
19.2
3.5
17.9
25.0
8.8
24.1
45.141.4
9.1
8.0
4.2
4.5
6.7
5.4
13.3
18.5 24.9
41.7
27.2
7.7
22.3
31.7
14.2
37.5
63.666.3
0.0
10.0
20.0
30.0
40.0
50.0
60.0
70.0
2009 2010 2011 2012 2013 2014 2015 2016 2017
5 year average
pre-VZ: 26.1 miles
2017 vs pre VZ
+153%
• More than 180 miles of dedicated cycling space
(conventional and protected bicycle lanes) installed since
start of Vision Zero
• In 2017, more than 66 miles of dedicated cycling space
(conventional and protected bicycle lanes) installed, more
than double the pre-VZ annual average
20Conventional Bicycle Lanes (miles)
Protected Bicycle Lanes (miles)
Dedicated Cycling Space Before & After Vision Zero

100
183
122
240
291
400
340
405390
0
50
100
150
200
250
300
350
400
450
2009 2010 2011 2012 2013 2014 2015 2016 2017
Speed Bumps Installs Before & After Vision Zero
5 year average
pre-VZ: 187
2017 vs pre VZ
+109%
• Over 1,500 new speed bumps since the start of Vision
Zero
• Nearly 400 new in 2017, more than double the pre-VZ
annual average
• Over 460 new speed bumps installed in Priority Areas
since start of Vision Zero
21
Enhanced Crossings Since Vision Zero
• Over 110 intersections received a treatment since the start
of Vision Zero
• Treatments installed at 39 intersections in 2017
• Over 30 treatments installed at Priority Locations since
start of Vision Zero
22
1
28
44
39
0
5
10
15
20
25
30
35
40
45
50
2014 2015 2016 2017
Bus Safety & Operations • 13 projects implemented in 2017 that enhance bus safety & operations (23 in 2016)
• 212 Leading Pedestrian Intervals (LPIs) installed at bus turn locations (174 since start of Vision
Zero, 55 in 2017)
Completed 2017 Projects1. 11th Ave, 34th St to 37th St
2. 79th St, Riverside Dr to East End Ave (M79 SBS)
3. E 177 St and Brush Ave
4. Flatbush Ave and Church Ave
5. Ft Independence St and Heath Ave
6. Kings Hwy at 27th St, and at Nostrand Ave
7. Kings Hwy/Fraser Sq
8. Main St, 38th Ave to 40th Rd
9. Main St, 39th Ave
10. Union Turnpike and Forest View Crescent
11. Union Turnpike and Woodhaven Blvd
12. W 155th St, E 161st St, E 163rd St (Bx6 SBS)
13. Woodhaven Blvd and Cross Bay Blvd (Q52/Q53 SBS)
23
DOT & NYPD
Accomplishments
Safety Education
Safety Education Since Vision Zero
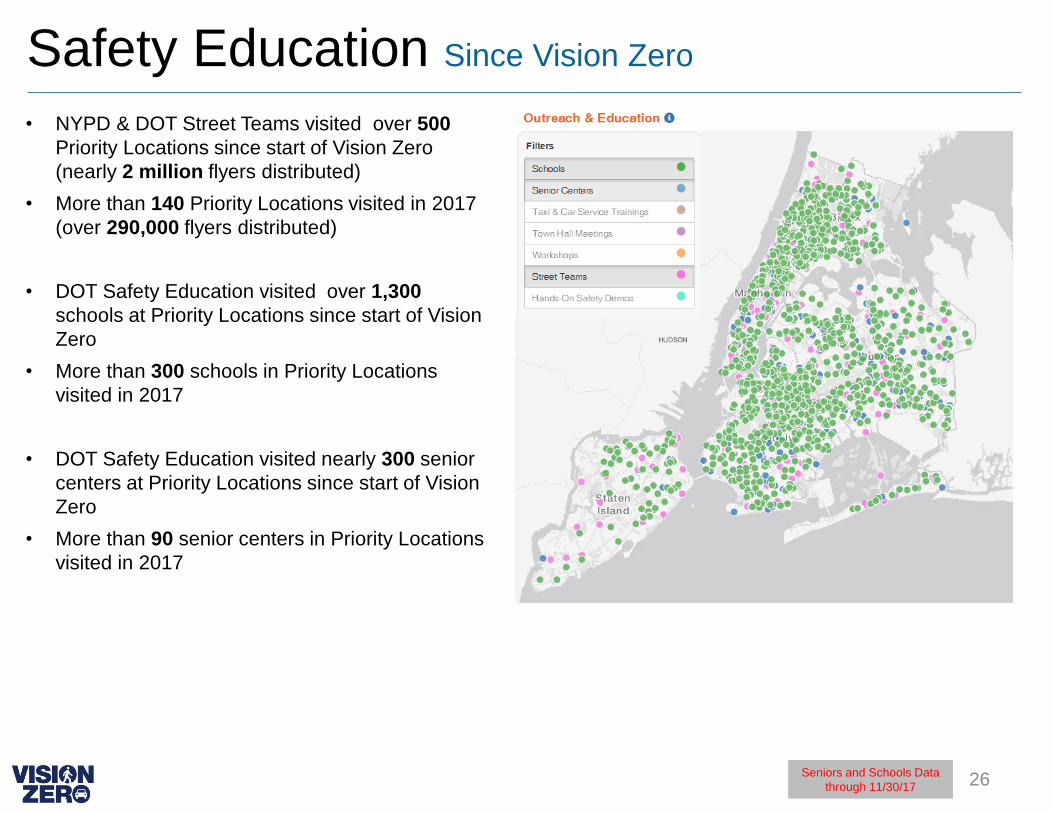
• NYPD & DOT Street Teams visited over 500
Priority Locations since start of Vision Zero
(nearly 2 million flyers distributed)
• More than 140 Priority Locations visited in 2017
(over 290,000 flyers distributed)
• DOT Safety Education visited over 1,300
schools at Priority Locations since start of Vision
Zero
• More than 300 schools in Priority Locations
visited in 2017
• DOT Safety Education visited nearly 300 senior
centers at Priority Locations since start of Vision
Zero
• More than 90 senior centers in Priority Locations
visited in 2017
26Seniors and Schools Data
through 11/30/17
DOT & NYPD
Accomplishments
Public Awareness
Campaigns

“Your Choices Matter”• Driver behavior and comprehension continues to
trend upward directionally
• Awareness and support of Vision Zero remains at
a high level
• Performance on key metrics is statistically
consistent year over year
An annual performance study tracked the impact of the “Your Choices Matter” advertising campaign across key metrics.
Select Metrics, 2015-2017, Among Drivers:
• Awareness of Vision Zero: 2015 – 62%, 2016 – 76%, 2017 – 71%
• Support of Vision Zero as a valuable government program: 2015 – 78%, 2016 – 82%, 2017 – 82%
• Correctly identifies the speed limit: 2015 – 49%, 2016 – 54%, 2017 – 55%
• Comprehends drivers must yield to pedestrians in the cross walk: 2015 – 91%, 2016 – 87%, 2017 – 86%
• Comprehends drivers’ behaviors are primary factors in fatalities: 2015 – 79%, 2016 – 82%, 2017 – 83%
• Will pay more attention to pedestrians and cyclists: 2015 – 83%, 2016 – 82%, 2017 – 84%
• Will give more thought to speed approaching crosswalks: 2015 – 81%, 2016 – 76%, 2017 – 80%
• Campaign encouraged me to be a more responsible driver: 2015 – 79%, 2016 – 79%, 2017 – 81%

“Signs”
• In October 2017, the City introduced the new
Vision Zero campaign “Signs”
• “Signs” outperformed other concepts across
nearly every metric, including affinity and
encouraging speed limit and turning
compliance
• “Signs” depicts situations drivers encounter
every day, both from the perspective of a
driver and a pedestrian
• “Signs” imagery simply and clearly explains
what is needed to save lives – slowing down,
paying attention and giving right of way
• The phrasing “saving a life is easy” was the
most resonant language tested due to clarity
and conciseness. The message is also seen
as highly believable and fits what drivers
know about Vision Zero

Woodhaven Boulevard
Queens, 2017
Q52/Q53 SBS
31
32
33

34

35

36
37

38
39

40
41