dosing free nitrous acid for sulfide control in sewers: results of field trials in australia
TRANSCRIPT
ww.sciencedirect.com
wat e r r e s e a r c h 4 7 ( 2 0 1 3 ) 4 3 3 1e4 3 3 9
Available online at w
journal homepage: www.elsevier .com/locate/watres
Dosing free nitrous acid for sulfide control insewers: Results of field trials in Australia
Guangming Jiang a, Anthony Keating b, Shaun Corrie c, Kelly O’halloran d,Lam Nguyen e, Zhiguo Yuan a,*aAdvanced Water Management Centre, The University of Queensland, QLD, AustraliabCloevis, UniQuest Pty Limited, The University of Queensland, QLD, AustraliacCWE Corrie Water and Environment, QLD, AustraliadGold Coast City Council, QLD, AustraliaeUS Peroxide LLC, Atlanta, GA 30339, USA
a r t i c l e i n f o
Article history:
Received 14 February 2013
Received in revised form
10 April 2013
Accepted 10 May 2013
Available online 24 May 2013
Keywords:
Sewer
Free nitrous acid
Hydrogen peroxide
Biofilm
Sulfide
Odour
Abbreviations: ADWF, Average dry-weathHRT, Hydraulic retention time; SRB, Sulphat* Corresponding author. Tel.: þ61 7 3365 437E-mail addresses: [email protected]
riewater.com.au (S. Corrie), [email protected] (Z. Yuan).0043-1354/$ e see front matter ª 2013 Elsevhttp://dx.doi.org/10.1016/j.watres.2013.05.024
a b s t r a c t
Intermittent dosing of free nitrous acid (FNA), with or without the simultaneous dosing of
hydrogen peroxide, is a new strategy developed recently for the control of sulfide pro-
duction in sewers. Six-month field trials have been carried out in a rising main sewer in
Australia (150 mm in diameter and 1080 m in length) to evaluate the performance of the
strategy that was previously demonstrated in laboratory studies. In each trial, FNA was
dosed at a pumping station for a period of 8 or 24 h, some with simultaneous hydrogen
peroxide dosing. The sulfide control effectiveness was monitored by measuring, on-line,
the dissolved sulfide concentration at a downstream location of the pipeline (828 m from
the pumping station) and the gaseous H2S concentration at the discharge manhole.
Effective sulfide control was achieved in all nine consecutive trials, with sulfide production
reduced by more than 80% in 10 days following each dose. Later trials achieved better
control efficiency than the first few trials possibly due to the disrupting effects of FNA on
sewer biofilms. This suggests that an initial strong dose (more chemical consumption)
followed by maintenance dosing (less chemical consumption) could be a very cost-effective
way to achieve consistent control efficiency. It was also found that heavy rainfall slowed
the recovery of sulfide production after dosing, likely due to the dilution effects and
reduced retention time. Overall, intermittent dose of FNA or FNA in combination with H2O2
was successfully demonstrated to be a cost-effective method for sulfide control in rising
main sewers.
ª 2013 Elsevier Ltd. All rights reserved.
er flow; COD, Chemical oxygen demand; FNA, Free nitrous acid; H2O2, Hydrogen peroxide;e-reducing bacteria; WWTP, Wastewater treatment plant.4; fax: þ61 7 3365 4726.u, [email protected] (G. Jiang), [email protected] (A. Keating), [email protected] (K. O’halloran), [email protected] (L. Nguyen), Zhiguo@awmc.
ier Ltd. All rights reserved.
wat e r r e s e a r c h 4 7 ( 2 0 1 3 ) 4 3 3 1e4 3 3 94332
1. Introduction sewer biofilms to a high-level of nitrite over an extended
Hydrogen sulfide, produced by sulphate-reducing bacteria
(SRB) in sewers under anaerobic conditions, is an important
source of sewer odours, corrosion and health hazards
(Pomeroy and Bowlus, 1946; US EPA, 1974;WERF, 2007). Sulfide
released into the atmosphere through manholes or pumping
stations may cause odour complaints from nearby residents.
Also, hydrogen sulfide is toxic to human and animals (WHO,
2003). The generation of hydrogen sulfide from sewage and
the transfer to the sewer atmosphere can cause serious con-
crete corrosion, creating major challenges to infrastructure
management through reduced service life and high costs for
sewer (US EPA, 1992).
Many chemical dosing technologies have been developed
to prevent hydrogen sulfide production/emission in sewer
systems (Ganigue et al., 2011; Zhang et al., 2008). There are
four commonly used strategies:
1) Sulfide removal by oxidation through injection of air, oxy-
gen, and nitrate (Gutierrez et al., 2008; Mohanakrishnan
et al., 2009). Addition of stronger oxidants like hydrogen
peroxide, ozone was also reported (US EPA, 1992);
2) Sulfide removal by precipitation through the addition of
iron salts (Firer et al., 2008; Zhang et al., 2009a);
3) Reduction of H2S transfer from liquid to air by pH elevation,
typically through the use of magnesium hydroxide or lime
(Gutierrez et al., 2009; Rees et al., 2003).
4) Prevention of sulfide generation by inhibiting the activities
of sulphate-reducing bacteria or inactivating them through
the use of inhibitors or biocides like caustic and molybdate
(Predicala et al., 2008; Zhang et al., 2009b).
The first three types of strategies require continuous
chemical addition in order to achieve effective sulfide control
at all times, incurring high chemical consumption and oper-
ational costs (Jiang et al., 2011a). In contrast, biocides have the
potential to disrupt the sulfide generating capacity of the
sewer biofilm for extended periods following application. As a
result, treatment with biocides may only need to be inter-
mittent with the intervals between treatments determined by
how rapidly the sulfide generating capacity recovers, i.e. the
regrowth rate of SRB in biofilms.
Currently, caustic compounds are the most common
biocidal agent used for sulfide control in sewers (Ganigue et al.,
2011). Sodium hydroxide is added to wastewater to cause a pH
shock (10e11) to suppress sulphate reduction activity in sewer
biofilms. However, the effectiveness of caustic shock was
limited in real applications with H2S being reduced by 40e50%
(O’Gorman et al., 2011; Tomar andAbdullah, 1994). In addition,
costs of caustic shock are comparable to continuous dosing of
oxidants or precipitants. Another SRB inhibitor, molybdate,
was only demonstratedwith pure cultures of SRB or for sulfide
control in oil fields or anaerobic digesters (Kjellerup et al., 2005;
Nemati et al., 2001; Tanaka and Lee, 1997). The persistence of
molybdate in dosed water and the potential negative impacts
on environment is still a significant concern.
Nitrite causes specific inhibition to dissimilatory sulphate
reduction (Greene et al., 2006) and therefore an exposure of
period of time (weeks) caused a gradual decrease of the SRB
population and hence the loss of biofilm activity (Jiang et al.,
2010; Mohanakrishnan et al., 2008). Jiang et al. (2011b)
further found that simultaneous addition of nitrite and acid
deactivated sewer biofilm activity with an exposure time of
6e24 h. It was revealed that free nitrous acid (FNA or HNO2)
formed from nitrite at acidic conditions has a strong biocidal
effect on anaerobic sewer biofilms, with the viable microbial
cells in biofilms decreased from approximately 80% prior to
FNA dosage to 5e15% after the biofilm was exposed to FNA at
0.2e0.3 mg HNO2eN/L for 6e24 h.
Hydrogen peroxide, in combinationwith FNA,was found to
enhance the microbial inactivation by 1-log (Jiang and Yuan,
2013), in comparison with FNA dosing alone. About 2-log of
microbial inactivation was achieved when biofilms were
exposed to FNA at 0.2 mgN/L or above and H2O2 at 30 mg/L or
above for 6 h or longer. FNA was identified as the primary
inactivation agent and H2O2 enhanced its efficiency. The in-
termediates of reactions between FNA and H2O2, such as
peroxynitrite and nitrogen dioxide, were suggested to be
responsible for the synergism between FNA and H2O2.
The strong biocidal effect of FNA on sewer biofilms implies
that the simultaneous dosage of nitrite and acid could achieve
rapid inactivation of SRB in sewer biofilms, making it possible
to achieve sulfide control through intermittent FNA dosing.
Through laboratory sewer reactor studies, Jiang et al. (2011a)
showed that 12-h dosing of FNA at a concentration of
0.26 mg-N/L every 5 days could reduce the average sulfide
production by >80%. The recovery time was doubled to
approximately 10 days in another laboratory sewer reactor
study by simultaneous addition of FNA and H2O2 due to the
increased inactivation efficiency (Jiang and Yuan, 2013).
Although laboratory studies showed great promise of using
FNA in sewers, the completely mixed nature in the lab-scale
sewer reactors are different from real sewers, which are
plug-flow systems. Therefore, biofilms at different locations in
a sewer main may be exposed to FNA at different concentra-
tions due to possible variations in nitrite and H2O2 concen-
trations and pH level during the transport of wastewater.
Consequently, the effectiveness of FNA dosing on sulfide
control in real sewers may be different from that previous
observed in laboratory sewer reactors. In addition, previous
laboratory studies were carried out with limited numbers of
consecutive dosing, and hence the long-term effect of FNA
dosing on sewer biofilm activities has not been assessed. It is
possible that sewer biofilms develop resistance to FNA during
repetitive dosing.
The primary aim of this study is to investigate the long-
term effectiveness of FNA dosing, with and without simul-
taneous H2O2 dosing, in controlling sulfide production in full
scale rising main sewers. Field trials were carried out at a
rising main sewer with a diameter of 150 mm and a length of
1080 m. Different chemical combinations of FNA and
hydrogen peroxide were added into the wet well at the
pumping station for different dosing durations. Both dis-
solved sulfide in the downstream pipeline and H2S gas in the
discharge manhole were continuously monitored with online
sensors, and were used as indicators of sulfide-producing
wat e r r e s e a r c h 4 7 ( 2 0 1 3 ) 4 3 3 1e4 3 3 9 4333
activity in the pipe. The trials were carried out over a 6-month
period. Impacts of rain events were also evaluated based
upon SCADA data of sewage flow and hydraulic retention
time.
2. Materials and methods
2.1. Field trial site description
UC9 is a sewage pumping station located in the Gold
Coast, Australia (Google map latitude and longitude co-
ordinates: �27.9, 153.3). The annual mean atmospheric tem-
perature is between 17.2 and 25.1 �C, respectively. Mean
annual rainfall is 1376.5 mm (http://www.weatherzone.com.
au/). The UC9 pumping station receives domestic waste-
water from residential propertieswith an average daily flow of
206 m3/d. The rising main pipe leading from UC9 to a
discharge wet well is 1080 m long, and has a diameter of
150 mm.
The UC9 pumping station is operated with pumps turned
on and off when the water level in the wet well reaches above
18% and below 7%, respectively, of the total depth. Each
pumping event delivers about 2.2 m3 of wastewater into the
rising main pipe. The hydraulic retention time (HRT) of
wastewater in the UC9 pipe is representative of typical rising
main sewers, which varies between 3 and 7 h during a dry
weather day.
2.2. Dosing schemes
The dosing schemes of the field trials were designed based on
results of previously reported laboratory-scale experiments
(Jiang et al., 2011a, 2011b; Jiang and Yuan, 2013). Nine trials
were carried out from March to September in 2012 with
testing conditions summarized in Table 1. Chemicals were
added directly to the wet well at the UC9 pumping station
(starting point of the sewer pipe) during the specified dosing
period, followed by a recovery period which lasted between 1
and 4 weeks. During the recovery period, the sewer system
was allowed to run without chemical dosing. Subsequent
dosing (the next trial) was conducted when sulfide and H2S
Table 1 e Dosing schemes (chemicals and dosing durations) fo
Trial no. Chemical mix
Nitrite (mg-N/L) H2O2 (mg/L) pH (with
1 100 60 6
2 100 60 6
3 100 60 6
4 100 0 6
5 100 0 6
6 100 0 6
7 100 0 6
8 100 0 6
9 100 60 6
a FNA concentration is jointly determined by pH and the nitrite conce
(Ka � 10pH), where Ka is the ionization constant of the nitrous acid equilib
concentrations recovered to 20e50% of the baseline sulfide
level.
Two chemical mixes, i.e. FNA alone and FNA þ H2O2, were
tested in the trials. The FNA and H2O2 concentrations in all
trials were 0.26 mg HNO2eN/L and 60 mg/L, respectively,
selected according to results obtained in previous laboratory
studies. In addition, the duration of chemical addition is a
critical dosing parameter, as it determines the exposure time
of sewer biofilms to the biocidal chemicals, and also the
amount of chemicals required (for the given concentrations).
Previous lab studies indicated that an exposure timebetween6
and 24 h would be adequate to inactivate microbes in sewer
biofilms. Two dosing durations, which are 8 and 24 h, respec-
tively, were chosen to reflect the effective exposure time
required, and also to coincide with the 8-hour working shift in
Australia.
Chemicals were added to the UC9wet well via dosing pipes
dipping below the water surface For each trial, sodium nitrite
(40% solution) was added to the wet well immediately after a
pumping event to the residual wastewater in the well
(approximately 4 m3). The dosing amount was designed such
that a nitrite concentration of 100 mg-N/L in the wet well
would be achieved in the wastewater when the well was filled
up to the 18% level (i.e. before each pumping event). Hydro-
chloric acid (36%) was added continuously to maintain a
sewage pH of 6.0 at all times while the well was filled up with
wastewater. Continuous inflow of wastewater into the wet
well between pumping events (with intervals between 20 min
and 1 h) allowed adequate mixing of chemicals with waste-
water in the well. For some trials (trial No. 1, 2, 3, and 9),
hydrogen peroxide (stock concentration at 35%) was also
added immediately before a pumping event to reach a con-
centration of 60 mg/L in the wet well. During each trial (Table
1), three wastewater samples were taken from the wet well
over the trial period to verify the nitrite dosage. The con-
sumption of each of the chemicals during each trial was
recorded by measuring the stock levels before and after each
trial, to independently verify the dosing rates. Three waste-
water samples were also taken at the downstream sampling
location (see Fig. 1A) to reveal any variation of nitrite con-
centration in the pipe. The volume of chemicals being added
was also recorded to ensure the correct dosing levels.
r the trials.
FNAa (mg HNO2eN/L) Dosing duration (h)
HCl)
0.26 24
0.26 24
0.26 24
0.26 24
0.26 24
0.26 8
0.26 8
0.26 8
0.26 8
ntration (Weon et al., 2002). FNA was calculated as FNA ¼ NO2�eN/
rium equation. The value of Ka is determined by Ka ¼ e�2300/(273þ�C).

Fig. 1 e Map of the UC9 pumping station and the sewer
section used for the field trials (top); pumping events and
the diurnal pattern of hydraulic retention time in a typical
dry weather day (bottom).
wat e r r e s e a r c h 4 7 ( 2 0 1 3 ) 4 3 3 1e4 3 3 94334
2.3. Monitoring and sampling
A UVeVIS spectrometer (S:CAN, Messtechnik GmbH, Austria)
capable of monitoring dissolved sulfide concentration in
Fig. 2 e Dosing and online monitoring arrangemen
sewage was installed at 828 m downstream of the pumping
station (Figs. 1 and 2). Manual cleaning of the sensor lens was
carried out every second day during the online monitoring
periods. The sensor was calibrated before the start of trials as
previously described (Sutherland-Stacey et al., 2008). pH was
also monitored at this location with a pH probe built in the
spectrometer unit. The recorded online data of HS� and pH
were used to calculate the dissolved H2S concentration, with
the total dissolved sulfide concentration (ST) obtained as the
sum of S2�, HS� and H2S concentrations.
ST ¼ ½H2S� þ�HS��þ �
S2�� ¼ �HS���1þ 10�pH
K1þ K2
10�pH
�
where, K1 ¼ ½HS��=½H2S�10�pH and.K2 ¼ ½S2��=½HS��10�pH At
25 �C, pK1 and pK2 were reported to be 7.05 and 13.8 (Ellis and
Milestone, 1967), respectively.
An online gas logger (Odalog� 10-1000 Logger L2) was
installed in the discharge wet well to monitor the gaseous H2S
concentration. The H2S sensor records the gaseous H2S con-
centration and temperature at 2 min intervals. The H2S data
were used in combinationwith the dissolved sulfide data from
the UVeVIS spectrometer as the gauge of sulphate-reducing
activity in the sewer pipe.
Both sensors were installed 6 weeks before the first dosing
trial to establish the baseline levels of dissolved sulfide and
gaseous H2S. This baseline serves as a measure of the unaf-
fected level of the sulfide producing activity of the sewer pipe,
which is used to calculate the level of suppression achieved
after each dose and the speed of recovery. Both dissolved
sulfide and H2S concentrations varied daily due to the dy-
namic pumping pattern and varying HRTs (see Results and
Discussion section), and therefore daily average concentra-
tions were employed as indicator of sulfide production on
each day.
2.4. Chemical analysis
For the analyses of dissolved sulfide, 1.5 mL wastewater was
filtered (0.22 mmmembrane) into 0.5mL preserving solution of
sulfide anti-oxidant buffer (SAOB) (Keller-Lehmann et al.,
2006). Samples were then analysed within 24 h on an ion
chromatograph (IC) with a UV and conductivity detector
(Dionex ICS-2000). For the analysis of nitrite, 1 mL of sewage
t during the trials at the UC9 pumping station.

wat e r r e s e a r c h 4 7 ( 2 0 1 3 ) 4 3 3 1e4 3 3 9 4335
was filtered similarly, diluted 10 times and analysed using a
Lachat QuikChem 8000 (Milwaukee) flow-injection analyser
(FIA).
3. Results and discussion
3.1. Diurnal profiles of dissolved sulfide and gaseousH2S concentrations
Fig. 3A showsprofile of dissolved sulfide concentrationat 828m
downstream of UC9 wet well two days prior to the first dosing
event. The average sulfide concentration on the day was
7.4� 2.4mg-S/L, varying from0.6 to13.5mg-S/L. Sulfideprofiles
during other days in the baseline period were similar. The
average dissolved sulfide level over the entire baseline period
was 7.4 � 0.6 mg-S/L. The peaks of dissolved sulfide on the
diurnal profile corresponded to the HRT peaks shown in Fig. 2.
Especially, the longest HRT occurring around 6:00 AM each day
coincided with the highest daily dissolved sulfide concentra-
tion. As an example, Fig. 3A also shows a 24-h profile of dis-
solved sulfide measured 2 days after a dosing, which indicates
clearly lower concentrations in the range of 0e2.0 mg-S/L.
Sulfide was present at negligible concentrations for about half
of the time during the day (mainly during periods with shorter
HRT, i.e. in the afternoon). There was some sulfide production
during periods with longer HRT (>4 h), which indicates that a
small proportion of SRB survived the dosing event.
Sewage pH varied between 7.0 and 8.0, with its peak value
(approximately 8) between 6:00 AM to 12:00 PM. No discernible
change of pH was observed during the recovery period after
the dosing event.
Fig. 3 e Typical profiles of dissolved sulfide and wastewater pH
dosing (A); and H2S gas and atmospheric temperature in discha
Fig. 3B shows diurnal profiles of gaseous H2S concentra-
tions and temperature in the UC9 discharge wet well corre-
sponding to the same pre- and post-dosing time shown in
Fig. 3A. During the baseline period, the average H2S gas con-
centration and temperature were 36.5 � 6.4 ppmv and
26.3 � 1.5 �C, respectively. Temperature in the discharge wet
well 2 days after the 1st dosing was similar to the baseline
levels. H2S concentration increased sharply with each
pumping event, which discharged sulfide-containing waste-
water to the discharge well. The H2S then decreased to below
10 ppmv during the quiescent period (no discharge of waste-
water) presumably due to air dilution or leakage to the at-
mosphere. The gaseous H2S profile correlates well with
dissolved sulfide profile shown in Fig. 3A. The H2S profile
during 2 days after the first dosing, averaged at 1.5 ppmv,
shows much lower H2S concentrations supporting the dis-
solved sulfide measurement.
3.2. Comparison of the nine dosing trials
Fig. 4AeD show the daily averages of dissolved sulfide and
gaseous H2S concentrations measured at the downstream
location (828 m) and in the discharge wet well, respectively,
after each of the nine dosing trials. The baseline period before
the first dosing event is shown as negative days in Fig. 4. The
dosing day is indicated as day 0 and the following recovery
period after each trial is indicated as positive days up to 16
days (See Figure S1 for complete recovery up to 27 days). Both
dissolved sulfide and H2S concentrations are shown in com-
parison to their average values during the baseline period.
For all trials, the dosing event immediately reduced the
dissolved sulfide and gaseous H2S concentrations by over 95%.
at 828 m downstream of UC9 pump station before and after
rge wet well before and after dosing (B).
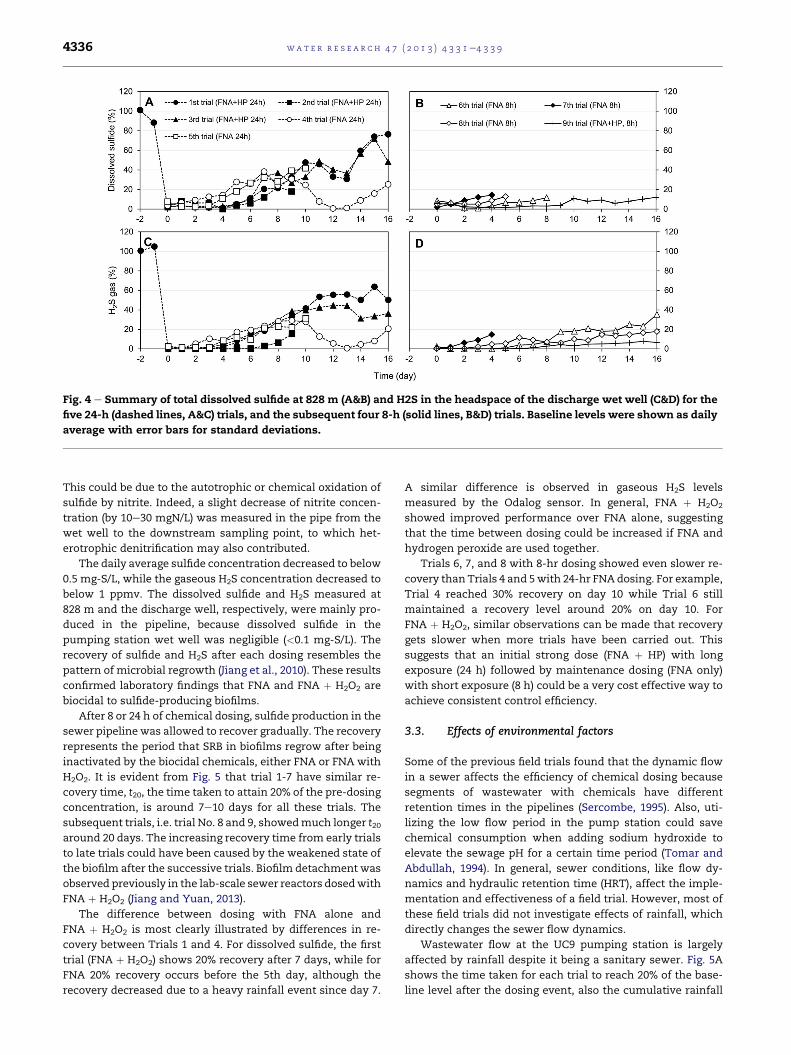
Fig. 4 e Summary of total dissolved sulfide at 828 m (A&B) and H2S in the headspace of the discharge wet well (C&D) for the
five 24-h (dashed lines, A&C) trials, and the subsequent four 8-h (solid lines, B&D) trials. Baseline levels were shown as daily
average with error bars for standard deviations.
wat e r r e s e a r c h 4 7 ( 2 0 1 3 ) 4 3 3 1e4 3 3 94336
This could be due to the autotrophic or chemical oxidation of
sulfide by nitrite. Indeed, a slight decrease of nitrite concen-
tration (by 10e30 mgN/L) was measured in the pipe from the
wet well to the downstream sampling point, to which het-
erotrophic denitrification may also contributed.
The daily average sulfide concentration decreased to below
0.5 mg-S/L, while the gaseous H2S concentration decreased to
below 1 ppmv. The dissolved sulfide and H2S measured at
828 m and the discharge well, respectively, were mainly pro-
duced in the pipeline, because dissolved sulfide in the
pumping station wet well was negligible (<0.1 mg-S/L). The
recovery of sulfide and H2S after each dosing resembles the
pattern of microbial regrowth (Jiang et al., 2010). These results
confirmed laboratory findings that FNA and FNA þ H2O2 are
biocidal to sulfide-producing biofilms.
After 8 or 24 h of chemical dosing, sulfide production in the
sewer pipeline was allowed to recover gradually. The recovery
represents the period that SRB in biofilms regrow after being
inactivated by the biocidal chemicals, either FNA or FNA with
H2O2. It is evident from Fig. 5 that trial 1-7 have similar re-
covery time, t20, the time taken to attain 20% of the pre-dosing
concentration, is around 7e10 days for all these trials. The
subsequent trials, i.e. trial No. 8 and 9, showedmuch longer t20around 20 days. The increasing recovery time from early trials
to late trials could have been caused by the weakened state of
the biofilm after the successive trials. Biofilm detachment was
observed previously in the lab-scale sewer reactors dosedwith
FNA þ H2O2 (Jiang and Yuan, 2013).
The difference between dosing with FNA alone and
FNA þ H2O2 is most clearly illustrated by differences in re-
covery between Trials 1 and 4. For dissolved sulfide, the first
trial (FNA þ H2O2) shows 20% recovery after 7 days, while for
FNA 20% recovery occurs before the 5th day, although the
recovery decreased due to a heavy rainfall event since day 7.
A similar difference is observed in gaseous H2S levels
measured by the Odalog sensor. In general, FNA þ H2O2
showed improved performance over FNA alone, suggesting
that the time between dosing could be increased if FNA and
hydrogen peroxide are used together.
Trials 6, 7, and 8 with 8-hr dosing showed even slower re-
covery than Trials 4 and 5with 24-hr FNA dosing. For example,
Trial 4 reached 30% recovery on day 10 while Trial 6 still
maintained a recovery level around 20% on day 10. For
FNA þ H2O2, similar observations can be made that recovery
gets slower when more trials have been carried out. This
suggests that an initial strong dose (FNA þ HP) with long
exposure (24 h) followed by maintenance dosing (FNA only)
with short exposure (8 h) could be a very cost effective way to
achieve consistent control efficiency.
3.3. Effects of environmental factors
Some of the previous field trials found that the dynamic flow
in a sewer affects the efficiency of chemical dosing because
segments of wastewater with chemicals have different
retention times in the pipelines (Sercombe, 1995). Also, uti-
lizing the low flow period in the pump station could save
chemical consumption when adding sodium hydroxide to
elevate the sewage pH for a certain time period (Tomar and
Abdullah, 1994). In general, sewer conditions, like flow dy-
namics and hydraulic retention time (HRT), affect the imple-
mentation and effectiveness of a field trial. However, most of
these field trials did not investigate effects of rainfall, which
directly changes the sewer flow dynamics.
Wastewater flow at the UC9 pumping station is largely
affected by rainfall despite it being a sanitary sewer. Fig. 5A
shows the time taken for each trial to reach 20% of the base-
line level after the dosing event, also the cumulative rainfall
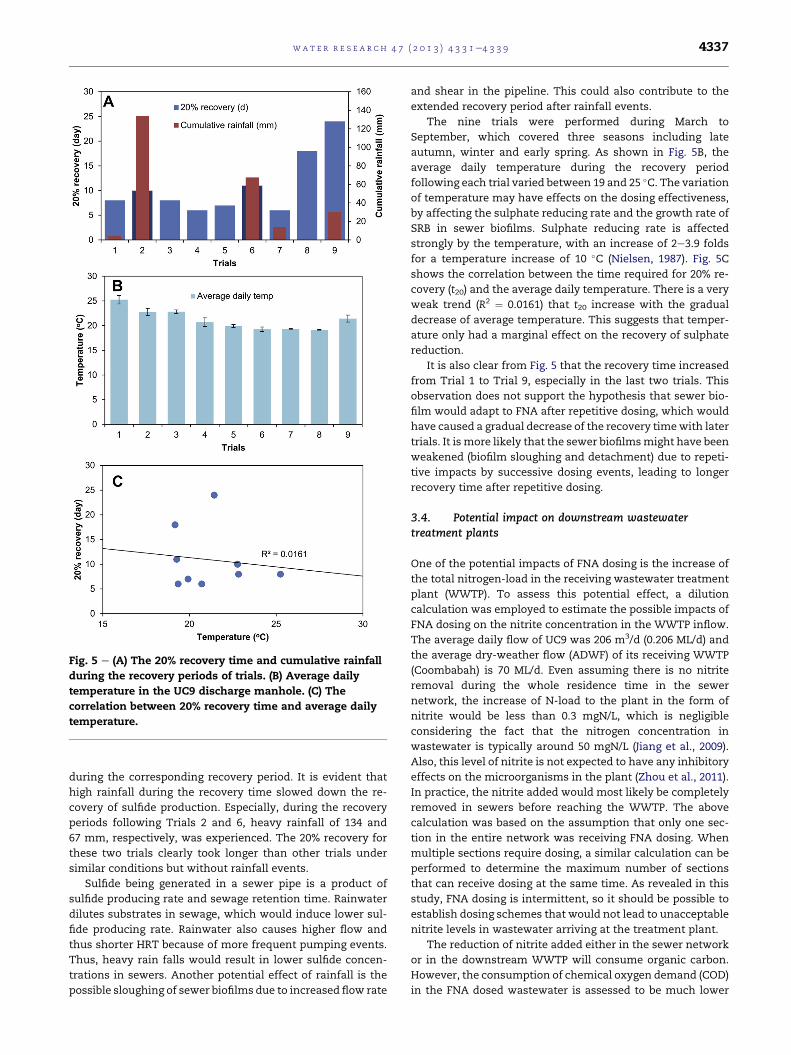
Fig. 5 e (A) The 20% recovery time and cumulative rainfall
during the recovery periods of trials. (B) Average daily
temperature in the UC9 discharge manhole. (C) The
correlation between 20% recovery time and average daily
temperature.
wat e r r e s e a r c h 4 7 ( 2 0 1 3 ) 4 3 3 1e4 3 3 9 4337
during the corresponding recovery period. It is evident that
high rainfall during the recovery time slowed down the re-
covery of sulfide production. Especially, during the recovery
periods following Trials 2 and 6, heavy rainfall of 134 and
67 mm, respectively, was experienced. The 20% recovery for
these two trials clearly took longer than other trials under
similar conditions but without rainfall events.
Sulfide being generated in a sewer pipe is a product of
sulfide producing rate and sewage retention time. Rainwater
dilutes substrates in sewage, which would induce lower sul-
fide producing rate. Rainwater also causes higher flow and
thus shorter HRT because of more frequent pumping events.
Thus, heavy rain falls would result in lower sulfide concen-
trations in sewers. Another potential effect of rainfall is the
possible sloughing of sewer biofilms due to increased flow rate
and shear in the pipeline. This could also contribute to the
extended recovery period after rainfall events.
The nine trials were performed during March to
September, which covered three seasons including late
autumn, winter and early spring. As shown in Fig. 5B, the
average daily temperature during the recovery period
following each trial varied between 19 and 25 �C. The variation
of temperature may have effects on the dosing effectiveness,
by affecting the sulphate reducing rate and the growth rate of
SRB in sewer biofilms. Sulphate reducing rate is affected
strongly by the temperature, with an increase of 2e3.9 folds
for a temperature increase of 10 �C (Nielsen, 1987). Fig. 5C
shows the correlation between the time required for 20% re-
covery (t20) and the average daily temperature. There is a very
weak trend (R2 ¼ 0.0161) that t20 increase with the gradual
decrease of average temperature. This suggests that temper-
ature only had a marginal effect on the recovery of sulphate
reduction.
It is also clear from Fig. 5 that the recovery time increased
from Trial 1 to Trial 9, especially in the last two trials. This
observation does not support the hypothesis that sewer bio-
film would adapt to FNA after repetitive dosing, which would
have caused a gradual decrease of the recovery timewith later
trials. It is more likely that the sewer biofilmsmight have been
weakened (biofilm sloughing and detachment) due to repeti-
tive impacts by successive dosing events, leading to longer
recovery time after repetitive dosing.
3.4. Potential impact on downstream wastewatertreatment plants
One of the potential impacts of FNA dosing is the increase of
the total nitrogen-load in the receiving wastewater treatment
plant (WWTP). To assess this potential effect, a dilution
calculation was employed to estimate the possible impacts of
FNA dosing on the nitrite concentration in the WWTP inflow.
The average daily flow of UC9 was 206 m3/d (0.206 ML/d) and
the average dry-weather flow (ADWF) of its receiving WWTP
(Coombabah) is 70 ML/d. Even assuming there is no nitrite
removal during the whole residence time in the sewer
network, the increase of N-load to the plant in the form of
nitrite would be less than 0.3 mgN/L, which is negligible
considering the fact that the nitrogen concentration in
wastewater is typically around 50 mgN/L (Jiang et al., 2009).
Also, this level of nitrite is not expected to have any inhibitory
effects on the microorganisms in the plant (Zhou et al., 2011).
In practice, the nitrite added would most likely be completely
removed in sewers before reaching the WWTP. The above
calculation was based on the assumption that only one sec-
tion in the entire network was receiving FNA dosing. When
multiple sections require dosing, a similar calculation can be
performed to determine the maximum number of sections
that can receive dosing at the same time. As revealed in this
study, FNA dosing is intermittent, so it should be possible to
establish dosing schemes that would not lead to unacceptable
nitrite levels in wastewater arriving at the treatment plant.
The reduction of nitrite added either in the sewer network
or in the downstream WWTP will consume organic carbon.
However, the consumption of chemical oxygen demand (COD)
in the FNA dosed wastewater is assessed to be much lower
wat e r r e s e a r c h 4 7 ( 2 0 1 3 ) 4 3 3 1e4 3 3 94338
(negligible) when compared to other commonly used chem-
icals like oxygen and nitrate for sulfide control in sewers. This
is mainly due to the low chemical consuming nature of
intermittent dosing and the complete suppression ofmethane
production (Jiang et al., 2011b; Jiang and Yuan, 2013), which
usually consumes a big portion of COD. In contrast, dosing of
nitrate or oxygen was shown not to be able to completely
suppress methane production (Jiang et al., 2013).
3.5. Economic evaluation
Economic analysis as shown in Table S1 (supplementary
information) indicated that chemical costs, based on field
trial dosages of FNA alone at 0.26mgN/L or with 60 mg/L H2O2,
with a dosing duration of 8 h, and a recovery period of 10 days,
is only 0.01 $/m3 sewage (0.63 $/kg-sulphur), and 0.01 $/m3
sewage (0.8 $/kg-sulphur) respectively. This is far below the
costs associated with the currently used chemicals, including
ferrous or ferric chloride, nitrate, oxygen, magnesium hy-
droxide, and intermittent dosing of sodium hydroxide, used
widely by water utilities. A recent industry survey in Australia
revealed that the costs for the use of these chemicals range
between 0.04 and 0.48$/m3 sewage (Ganigue et al., 2011).
However, it should be highlighted that a full economic
assessment must be done on a case by case basis considering
the specific conditions of the systems and also the chemical
supplier and delivery options.
4. Conclusions
In this study, we investigated the long-term effectiveness of
free nitrous acid dosing, with or without simultaneous addi-
tion of hydrogen peroxide, to control sulfide production in
sewers, through field trials in real rising main sewers. The
main conclusions are:
� Intermittent dosing of FNA or FNA þ H2O2 can achieve
effective control of sulfide production in risingmain sewers.
One single dose for 8e24 h can provide lasting effectiveness
up to 10 days for an average reduction of sulfide by 80%.
� No biofilm adaptation to FNA or FNA þ H2O2 has been
observed through the 6-month trials. Instead, successive
dosing may achieve better control efficiency due to repeti-
tive weakening of the biofilms.
� Rainfall can cause extended recovery time following
chemical dosing of FNA in the sewer system.
Acknowledgements
The authors acknowledge the financial support provided by
the Australian Research Council and many members of the
Australian water industry through LP0882016 the Sewer
Corrosion and Odour Research Project (www.score.org.au).
Guangming Jiang is especially grateful to the research fund by
the New Staff Start-up Grant from the University of Queens-
land. We also thank Gold Coast City Council for support and
cooperation with the field trials. UniQuest and US Peroxide
LLC are highly acknowledged for funding and in-kind support.
DCM Process Control is gratefully acknowledged for their
technical support provided to the use of the S:CAN sensor.
Appendix A. Supplementary data
Supplementary data related to this article can be found at
http://dx.doi.org/10.1016/j.watres.2013.05.024.
r e f e r e n c e s
Ellis, A.J., Milestone, N.B., 1967. The ionization constants ofhydrogen sulphide from 20 to 90�C. Geochimica etCosmochimica Acta 31 (4), 615e620.
Firer, D., Friedler, E., Lahav, O., 2008. Control of sulfide in sewersystems by dosage of iron salts: comparison betweentheoretical and experimental results, and practicalimplications. Science of the Total Environment 392 (1),145e156.
Ganigue, R., Gutierrez, O., Rootsey, R., Yuan, Z., 2011. Chemicaldosing for sulfide control in Australia: an industry survey.Water Research 45 (19), 6564e6574.
Greene, E.A., Brunelle, V., Jenneman, G.E., Voordouw, G., 2006.Synergistic inhibition of microbial sulfide production bycombinations of the metabolic inhibitor nitrite and biocides.Applied and Environmental Microbiology 72 (12), 7897e7901.
Gutierrez, O., Mohanakrishnan, J., Sharma, K.R., Meyer, R.L.,Keller, J., Yuan, Z., 2008. Evaluation of oxygen injection as ameans of controlling sulfide production in a sewer system.Water Research 42 (17), 4549e4561.
Gutierrez, O., Park, D., Sharma, K.R., Yuan, Z., 2009. Effects oflong-term pH elevation on the sulfate-reducing andmethanogenic activities of anaerobic sewer biofilms. WaterResearch 43 (9), 2549e2557.
Jiang, G., Gutierrez, O., Sharma, K.R., Keller, J., Yuan, Z., 2011a.Optimization of intermittent, simultaneous dosage of nitriteand hydrochloric acid to control sulfide and methaneproduction in sewers. Water Research 45 (18), 6163e6172.
Jiang, G., Gutierrez, O., Sharma, K.R., Yuan, Z., 2010. Effects ofnitrite concentration and exposure time on sulfide andmethane production in sewer systems. Water Research 44(14), 4241e4251.
Jiang, G., Gutierrez, O., Yuan, Z., 2011b. The strong biocidal effectof free nitrous acid on anaerobic sewer biofilms. WaterResearch 45 (12), 3735e3743.
Jiang, G., Sharma, K.R., Guisasola, A., Keller, J., Yuan, Z., 2009.Sulfur transformation in rising main sewers receiving nitratedosage. Water Research 43 (17), 4430e4440.
Jiang, G., Sharma, K.R., Yuan, Z., 2013. Effects of nitrate dosing onmethanogenic activity in a sulfide-producing sewer biofilmreactor. Water Research 0.
Jiang, G., Yuan, Z., 2013. Synergistic inactivation of anaerobicwastewater biofilm by free nitrous acid and hydrogenperoxide. Journal of Hazardous Materials 0.
Keller-Lehmann, B., Corrie, S., Ravn, R., Yuan, Z., Keller, J., 2006.Preservation and simultaneous analysis of relevant solublesulfur species in sewage samples. In: Proceedings of theSecond International IWA Conference on Sewer Operationand Maintenance, Vienna, Austria.
Kjellerup, B.V., Veeh, R.H., Sumithraratne, P., Thomsen, T.R.,Buckingham-Meyer, K., Frolund, B., Sturman, P., 2005.Monitoring of microbial souring in chemically treated,produced-water biofilm systems using molecular techniques.Journal of Industrial Microbiology & Biotechnology 32 (4),163e170.

wat e r r e s e a r c h 4 7 ( 2 0 1 3 ) 4 3 3 1e4 3 3 9 4339
Mohanakrishnan, J., Gutierrez, O., Meyer, R.L., Yuan, Z., 2008.Nitrite effectively inhibits sulfide andmethane production in alaboratory scale sewer reactor. Water Research 42 (14),3961e3971.
Mohanakrishnan, J., Gutierrez, O., Sharma, K.R., Guisasola, A.,Werner, U., Meyer, R.L., Keller, J., Yuan, Z., 2009. Impact ofnitrate addition on biofilm properties and activities in risingmain sewers. Water Research 43 (17), 4225e4237.
Nemati, M., Mazutinec, T.J., Jenneman, G.E., Voordouw, G., 2001.Control of biogenic H2S production with nitrite andmolybdate. Journal of Industrial Microbiology & Biotechnology26 (6), 350e355.
Nielsen, P.H., 1987. Biofilm dynamics and kinetics during high-rate sulfate reduction under anaerobic conditions. Appliedand Environmental Microbiology 53 (1), 27e32.
O’Gorman, J., Purssell, I., Iori, G., 2011. Caustic soda washing of asewer pressure main e cost-effective removal of biofilm thatreduced both odour and methane. Water 38 (1), 83e87.
Pomeroy, R., Bowlus, F.D., 1946. Progress report on sulfide controlresearch. Sewage Works Journal 18 (4), 597e640.
Predicala, B., Nemati, M., Stade, S., Lague, C., 2008. Control ofH2S emission from swine manure using Na-nitrite and Na-molybdate. Journal of Hazardous Materials 154 (1e3),300e309.
Rees, M.J., Sickerdick, L.M., van Merkestein, R., Dowd, A., 2003. Anevaluation of liquid magnesium hydroxide for the control ofhydrogen sulfide gas odour. In: Proceedings of OzWater 2003.In: AWA 20th Convention, Perth, Western Australia.
Sercombe, D.C.W., 1995. The control of septicity and odors insewerage systems and at sewage-treatment works operatedby Anglian-water-services-limited. Water Science andTechnology 31 (7), 283e292.
Sutherland-Stacey, L., Corrie, S., Neethling, A., Johnson, I.,Gutierrez, O., Dexter, R., Yuan, Z., Keller, J., Hamilton, G.,2008. Continuous measurement of dissolved sulfide insewer systems. Water Science and Technology 57 (3),375e381.
Tanaka, S., Lee, Y.H., 1997. Control of sulfate reduction bymolybdate in anaerobic digestion. Water Science andTechnology 36, 143e150.
Tomar, M., Abdullah, T.H.A., 1994. Evaluation of chemicals tocontrol the generation of malodorous hydrogen sulfide inwaste water. Water Research 28 (12), 2545e2552.
US EPA, 1974. Process Design Manual for Sulfide Control inSanitary Sewer Systems.
USEPA,1992.Detection,Control, andCorrectionofHydrogenSulfideCorrosion in Existing Wastewater System. Office of WastewaterEnforcement and Compliance, Washington, DC, p. 20460.
Weon, S.-Y., Lee, C.-W., Lee, S.-I., Koopman, B., 2002. Nitriteinhibition of aerobic growth of Acinetobacter sp. WaterResearch 36 (18), 4471e4476.
WERF, 2007. In: Apgar, D., Witherspoon, J., Easter, C., Bassrai, S.,Dillon, C., Torres, E., Bowker, R.P.G., Corsi, R., Davidson, S.,Wolstenholme, P., Forbes, B., Quigley, C., Ward, M., Joyce, J.,Morton, R., Weiss, J., Stuetz, R. (Eds.), Water EnvironmentResearch Fundation: Minimization of Odor and Corrosion inCollection Systems Phase 1. (London, UK).
WHO, 2003. World Health Organization: Hydrogen Sulfide:Human Health Aspects. In: Concise International ChemicalAssessment Document, 53. (Geneva).
Zhang, L., De Schryver, P., De Gusseme, B., De Muynck, W.,Boon, N., Verstraete, W., 2008. Chemical and biologicaltechnologies for hydrogen sulfide emission control in sewersystems: a review. Water Research 42 (1e2), 1e12.
Zhang, L., Keller, J., Yuan, Z., 2009a. Inhibition of sulfate-reducingand methanogenic activities of anaerobic sewer biofilms byferric iron dosing. Water Research 43 (17), 4123e4132.
Zhang, L., Mendoza, L., Marzorati, M., Verstraete, W., 2009b.Decreasing sulfide generation in sewage by dosingformaldehyde and its derivatives under anaerobic conditions.Water Science and Technology 59 (6), 1248e1254.
Zhou, Y., Oehmen, A., Lim, M., Vadivelu, V., Ng, W.J., 2011. Therole of nitrite and free nitrous acid (FNA) in wastewatertreatment plants. Water Research 45 (15), 4672e4682.