dominant factors for an e an australian education sector
TRANSCRIPT

systems
Article
Dominant Factors for an Effective Selection System:An Australian Education Sector Perspective
Sophia Diana Rozario 1, Sitalakshmi Venkatraman 2,* , Mei-Tai Chu 1 and Adil Abbas 3
1 La Trobe Business School, La Trobe University, Melbourne VIC 3086, Australia;[email protected] (S.D.R.); [email protected] (M.-T.C.)
2 Department of Information Technology, Melbourne Polytechnic, Melbourne 3072, Australia3 Holmesglen Institute, Southbank VIC 3006, Australia; [email protected]* Correspondence: [email protected]
Received: 22 September 2019; Accepted: 30 October 2019; Published: 1 November 2019�����������������
Abstract: With the latest advancements in information technologies, many organisations expectsystems to provide effective support in the recruitment process and decision making. However, thereis a lack of clarity on the dominant factors required for an effective recruitment system which caninfluence business outcomes. This paper aimed to identify the predominant factors in the employeeselection process and the use of a management system for decision support. The empirical studyconsisted of a qualitative survey of 74 samples and a quantitative survey of 204 individual participantsfrom 17 organisations coming from technical and further education (TAFE)/dual education (highereducation and vocational education) sector members of the Victorian TAFE Association in Australia.Using commonly adopted exploratory factor analysis (EFA) of 38 variables, the data triangulation ofthe qualitative and quantitative analysis resulted in conformance of five dominant factors under threethemes. We believe the results of the study offer actionable suggestions in developing an effectiverecruitment system and furthers the research in this field of study.
Keywords: recruitment system; selection process; talent acquisition; exploratory factor analysis;thematic analysis; data triangulation
1. Introduction
Recruitment systems increasingly require a focus on talent acquisition (TA) which is the process ofadvertising and attracting potential job applicants from internal or external sources to the organisationand then to assess their suitability for the job advertised with the final goal to select the applicantthat best fits the job description [1]. Huffcutt and Culbertson [2] note, “it is rare, even unthinkable,for someone to be hired without some type of interview”. In light of TA being of prime importanceto an organisation, Wyatt and Jamieson [3] note that employee selection processes are known to benotorious for decision making which is unreliable and often invalid and, hence, propagating the needfor an expert system based on an objective approach to reduce the possible biases and prejudices whichare mainly based on probable predispositions as clearly documented in their literature. This processhas two key stakeholders: First are the interviewers who are the representatives of the organisationand play a vital role in conducting interviews to identify the best candidate suited for the position [4].The second key stakeholders are the applicants or candidates who express interest in becoming futureemployees of an organisation by applying for the job advertised [5].
The selection methods currently used by interviewers to assist with predicting the most suitableapplicant that matches the job requirement are diverse and imperfect [6]. To increase the accuracyof the prediction of the right applicant, there are different types of applicant testing methods thatare constructed and implemented by different organisations [7]. Personality tests, integrity tests,
Systems 2019, 7, 50; doi:10.3390/systems7040050 www.mdpi.com/journal/systems

Systems 2019, 7, 50 2 of 22
and psychological and psychometric tests are most commonly used to achieve good recruitmentoutcomes [8]. Information technology (IT) has been used in facilitating the execution of these testsand to further calculate the applicant scores as well as report the test performance with explanationsand recommendations. These tests have also advanced into various recruitment management andapplicant management expert systems that have been introduced [6]. Wyatt and Jamieson [3] havegone to great lengths to analyse and build an expert system called “CHAOS” (Computerised HelpfulAdvice on Selection) to assist with building an objective hiring process. Through their research, theyhave demonstrated that an expert system-based approach to decision making will provide morereliable decisions known for their consistency. They also mention that there is always contention in theprocess of recruitment and selection, thereby making it an ideal domain to build an expert system toassist managers’ decision processes enabling objectivity and fairness. In this context, another vitaldimension to cover is the validity of the selection procedure. Robertson and Smith [9] outline theessential elements in the design and validation of the employee selection process.
In more recent times, with the advancements in IT, several applications of technologies in theselection processes are also being upgraded using artificial intelligence. This is necessary due to theuncertainty and increased risk coupled with the limited time to make the right decision to select thebest applicant for the organisation [10]. Communication robots focusing on social innovation are beingtested for non-verbal behaviour recognition to predict social interaction outcomes [11]. The architectureof these robots shows that they are emotionally aware and tuned to identify face detection, speechrecognition, emotions reading, and gesturing, along with interview data processing [12]. Based onthe desired level of sophistication of such expert systems, job interviews could be automated witheither structured or unstructured interviews. However, many organisations are not able to adopt suchsophisticated recruitment systems. This is because several influencing factors guide the recruitmentprocess for making the system effective, and there is a lack of research in this direction. Apart fromfactors such as job interviews being structured or unstructured playing a significant role, the personalityaspects are critical as they lead to work performance and finally to employee retention. Such factorshaving a long-term impact are essential for a successful recruitment system. In order to unearth allthese key dimensions, this research study focused on identifying the dominant factors in the interviewand selection process for developing an effective recruitment system.
In this paper, all types of job interviews were broadly categorised under two headings, eitherstructured/high-structured interviews (HSI) or unstructured/low-structured interviews (LSI) [13].There have been many definitions for the term “structured interview” in the literature [14]. One, inparticular, provides a crisp and clear understanding: “the degree of discretion that an interviewer isallowed in conducting the interview” [15]. Unstructured, on the other hand, is when the interviewercan ask different questions to each applicant in any order and pattern that the interviewer deemsfit [16]. Based on the job interview type being structured or unstructured, increased or decreasedobjective/subjective elements play a role in the hiring decision. Research has established that structuredinterviews have higher criterion-related validity and improved dependability than unstructuredinterviews [13]. However, there is evidence in support of the counter-argument as well, where anempirical examination of hiring decisions of auditors highlighted that increased subjective elements inthe hiring decision had the highest explanatory power in influencing the hiring decision [17]. This paperintends to uncover more benefits and drawbacks of these two types of interviews by understanding thedominant factors in the employee selection decision process. The research was based on an empiricalstudy with a focus specifically on the current recruitment systems in practice within an Australiantechnical and further education (TAFE)/dual-sector setting. In addition, the findings are presentedfrom the perspectives of these stakeholders when they experienced the same process from differentcontexts based on their roles, such as hiring member and applicant, and outcomes which were furtherclassified into successful and unsuccessful applicants.
The purpose of this paper was to discuss the dominant factors of the selection process, specificallystudying the current status of 17 organisations from an Australian TAFE/dual-sector in the use of

Systems 2019, 7, 50 3 of 22
technology and management systems within their TA process. This study is a continuation of ongoingresearch, and the objective of this empirical study was to identify and understand the dominant factorsof the employee selection process. This research carries forward from discussions on the quantitativeanalysis of the critical aspects of the selection process outlined in our previous study [18]. The focus ofthis paper was to consider the factors that can influence the decision based on different perspectives ofthe participants, such as hiring members, successful applicants, as well as unsuccessful applicants.Here, we adopted a mixed-methods approach using statistical techniques for quantitative analysis andthematic analysis for the qualitative analysis to meet the research objective.
This paper is organised around the predominant factors in the employee selection process and theuse of a management system for decision support. Section 2 provides the research context and methodalong with introducing the sample participants of this investigation, namely the TAFE/dual education(higher education and vocational education) sector members of the Victorian TAFE Association (VTA).This section also presents a breakdown of the characteristics of the sample collected. Section 3 describesthe pragmatic study design to map this paper’s research question with the qualitative and quantitativequestions and sets the stage for the analysis to be conducted in the next section. Section 4 breaksthe examination into two parts with the quantitative analysis findings presented first followed bythe qualitative data presented next. Section 5 summarises the results from these investigations andcompares the findings from both the quantitative and qualitative methods as part of data triangulation.Lastly, Section 6 concludes with recommendations for future research.
2. Literature Review of Theoretical Framework and Empirical Study Background
2.1. A Review of the Theoretical Framework
Research on improving human resource management (HRM) processes with the help of expertsystems is an ongoing endeavour. In these studies, the key areas of improvement in HRM systemsand applications calls for further investigation by taking a multi-level approach to the analysis [19],accounting for selection bias [20], and reviewing the associations among all HRM systems in anorganization to better understand the HRM expert systems with its performance outcomes [21].The focus of using expert systems in HRM has been steadily increasing with time. This is furtherevidenced in the recent shift of discussions related to individual HR practices in employing HRsystems to the whole process [22]. This is also evidenced in the review by Sackett and Lievens [23]on the possible platforms to consider for improving the selection process. Some of the seminal andfundamental theoretical frameworks that researchers have used over the last few decades are reviewed,and a summary is presented in Table 1 below. Overall, there is no single framework that is approvedas an all-encompassing theoretical framework by these researchers for this topic.
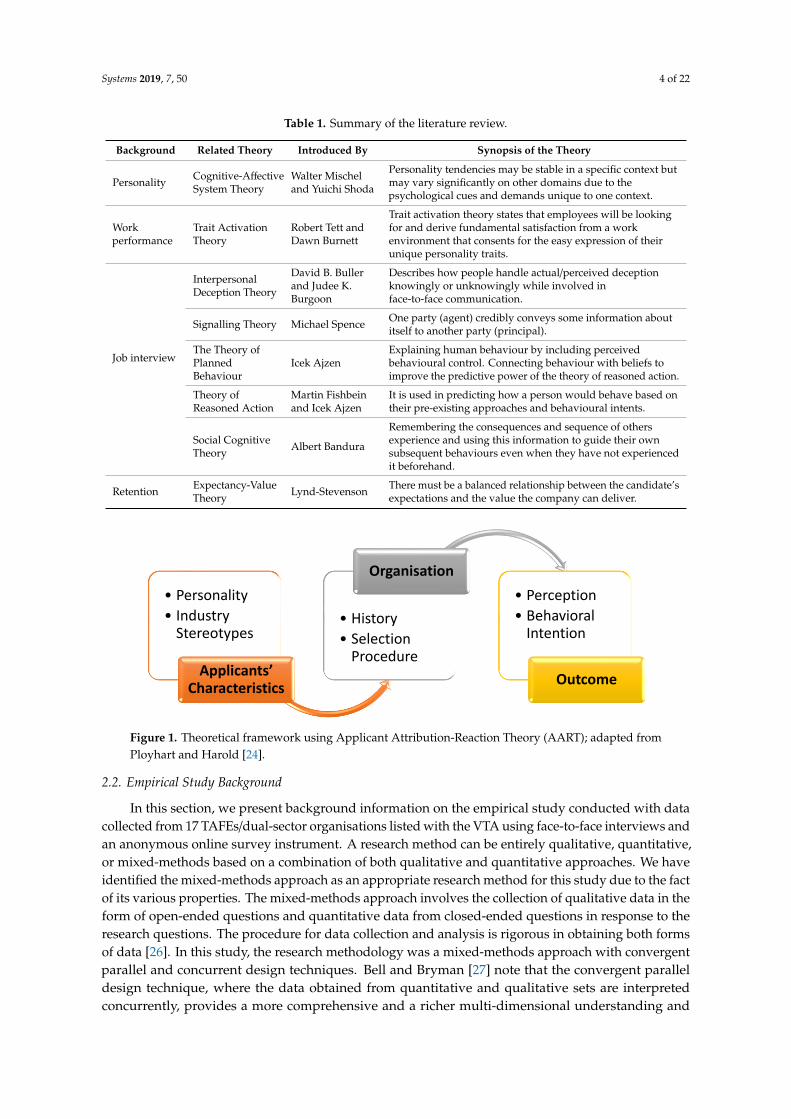
This research assumed the Applicant Attribution-Reaction Theory (AART) framework by Ployhartand Harold [24], which is a model integrating attribution theory into applicant reactions. Validating thisinformation with the explanation given by Lederman and Lederman [25] on the purpose of theoreticalframeworks in research, it can be stated that using AART for this empirical study would serve to be aguiding framework for our research investigation as illustrated in Figure 1 below. They confer thatqualitative researchers tend to analyse the data they have collected by invoking a theory to assist themin establishing their findings from the investigation in the context of existing literature.
As this study is the second part of an ongoing research project outlined earlier by Rozario andVenkatraman [18], this paper focused on identifying the dominant factors of the selection decision basedon the existing processes with the current use of systems and technology by the various organisationsoperating in the Australian TAFE/dual education sectors within urban and regional Victoria.
Systems 2019, 7, 50 4 of 22
Table 1. Summary of the literature review.
Background Related Theory Introduced By Synopsis of the Theory
Personality Cognitive-AffectiveSystem Theory
Walter Mischeland Yuichi Shoda
Personality tendencies may be stable in a specific context butmay vary significantly on other domains due to thepsychological cues and demands unique to one context.
Workperformance
Trait ActivationTheory
Robert Tett andDawn Burnett
Trait activation theory states that employees will be lookingfor and derive fundamental satisfaction from a workenvironment that consents for the easy expression of theirunique personality traits.
Job interview
InterpersonalDeception Theory
David B. Bullerand Judee K.Burgoon
Describes how people handle actual/perceived deceptionknowingly or unknowingly while involved inface-to-face communication.
Signalling Theory Michael Spence One party (agent) credibly conveys some information aboutitself to another party (principal).
The Theory ofPlannedBehaviour
Icek AjzenExplaining human behaviour by including perceivedbehavioural control. Connecting behaviour with beliefs toimprove the predictive power of the theory of reasoned action.
Theory ofReasoned Action
Martin Fishbeinand Icek Ajzen
It is used in predicting how a person would behave based ontheir pre-existing approaches and behavioural intents.
Social CognitiveTheory Albert Bandura
Remembering the consequences and sequence of othersexperience and using this information to guide their ownsubsequent behaviours even when they have not experiencedit beforehand.
Retention Expectancy-ValueTheory Lynd-Stevenson There must be a balanced relationship between the candidate’s
expectations and the value the company can deliver.
Systems 2019, 7, 50 4 of 24
Signalling Theory
Michael Spence
One party (agent) credibly conveys some information about itself to another party (principal).
The Theory of Planned Behaviour
Icek Ajzen
Explaining human behaviour by including perceived behavioural control. Connecting behaviour with beliefs to improve the predictive power of the theory of reasoned action.
Theory of Reasoned Action
Martin Fishbein and Icek Ajzen
It is used in predicting how a person would behave based on their pre-existing approaches and behavioural intents.
Social Cognitive Theory
Albert Bandura
Remembering the consequences and sequence of others experience and using this information to guide their own subsequent behaviours even when they have not experienced it beforehand.
Retention Expectancy-Value Theory
Lynd-Stevenson
There must be a balanced relationship between the candidate’s expectations and the value the company can deliver.
This research assumed the Applicant Attribution-Reaction Theory (AART) framework by Ployhart and Harold [24], which is a model integrating attribution theory into applicant reactions. Validating this information with the explanation given by Lederman and Lederman [25] on the purpose of theoretical frameworks in research, it can be stated that using AART for this empirical study would serve to be a guiding framework for our research investigation as illustrated in Figure 1 below. They confer that qualitative researchers tend to analyse the data they have collected by invoking a theory to assist them in establishing their findings from the investigation in the context of existing literature.
Figure 1. Theoretical framework using Applicant Attribution-Reaction Theory (AART); adapted from Ployhart and Harold [24].
As this study is the second part of an ongoing research project outlined earlier by Rozario and Venkatraman [18], this paper focused on identifying the dominant factors of the selection decision based on the existing processes with the current use of systems and technology by the various organisations operating in the Australian TAFE/dual education sectors within urban and regional Victoria.
2.2. Empirical Study Background
In this section, we present background information on the empirical study conducted with data collected from 17 TAFEs/dual-sector organisations listed with the VTA using face-to-face interviews
• Personality• Industry
Stereotypes
Applicants’ Characteristics
• History• Selection
Procedure
Organisation• Perception• Behavioral
Intention
Outcome
Figure 1. Theoretical framework using Applicant Attribution-Reaction Theory (AART); adapted fromPloyhart and Harold [24].
2.2. Empirical Study Background
In this section, we present background information on the empirical study conducted with datacollected from 17 TAFEs/dual-sector organisations listed with the VTA using face-to-face interviews andan anonymous online survey instrument. A research method can be entirely qualitative, quantitative,or mixed-methods based on a combination of both qualitative and quantitative approaches. We haveidentified the mixed-methods approach as an appropriate research method for this study due to the factof its various properties. The mixed-methods approach involves the collection of qualitative data in theform of open-ended questions and quantitative data from closed-ended questions in response to theresearch questions. The procedure for data collection and analysis is rigorous in obtaining both formsof data [26]. In this study, the research methodology was a mixed-methods approach with convergentparallel and concurrent design techniques. Bell and Bryman [27] note that the convergent paralleldesign technique, where the data obtained from quantitative and qualitative sets are interpretedconcurrently, provides a more comprehensive and a richer multi-dimensional understanding and

Systems 2019, 7, 50 5 of 22
response to the research questions. By doing so, the concurrent data triangulation is enabled, whereinthe data obtained from the qualitative and quantitative sets during each research phase undergo acompare and contrast process. This way, the datasets support one another, bringing about a completepicture of the research question posed [28]. Figure 2 below illustrates an overview of this researchdesign. Following this, the background information on the data collected from the 17 organisations inthis research is tabulated.
Systems 2019, 7, 50 5 of 24
and an anonymous online survey instrument. A research method can be entirely qualitative, quantitative, or mixed-methods based on a combination of both qualitative and quantitative approaches. We have identified the mixed-methods approach as an appropriate research method for this study due to the fact of its various properties. The mixed-methods approach involves the collection of qualitative data in the form of open-ended questions and quantitative data from closed-ended questions in response to the research questions. The procedure for data collection and analysis is rigorous in obtaining both forms of data [26]. In this study, the research methodology was a mixed-methods approach with convergent parallel and concurrent design techniques. Bell and Bryman [27] note that the convergent parallel design technique, where the data obtained from quantitative and qualitative sets are interpreted concurrently, provides a more comprehensive and a richer multi-dimensional understanding and response to the research questions. By doing so, the concurrent data triangulation is enabled, wherein the data obtained from the qualitative and quantitative sets during each research phase undergo a compare and contrast process. This way, the datasets support one another, bringing about a complete picture of the research question posed [28]. Figure 2 below illustrates an overview of this research design. Following this, the background information on the data collected from the 17 organisations in this research is tabulated
Figure 2. Research design overview.
3. Empirical Study Design
Previous research has established the critical aspects of a selection process from the perspectives of both hiring members and applicants [18]. Based on the results obtained, the platform was set in this study to explore further the identification of the dominant factors to be considered for improving the selection process of recruitment systems. Specifically, this paper investigated the empirical evidence in supporting the dominant factors for the employee interview and selection process with the potential to enhance the recruitment systems.
Figure 2. Research design overview.
3. Empirical Study Design
Previous research has established the critical aspects of a selection process from the perspectivesof both hiring members and applicants [18]. Based on the results obtained, the platform was set in thisstudy to explore further the identification of the dominant factors to be considered for improving theselection process of recruitment systems. Specifically, this paper investigated the empirical evidence insupporting the dominant factors for the employee interview and selection process with the potential toenhance the recruitment systems.
Based on the research design for this study, as outlined in Section 2.2. above, both the probabilityand non-probability techniques of sampling were used for this research. The stratified samplingmethod, which uses some known characteristics of the participant, was utilised for this study. This wasin the form of identifying human resources professionals and executives who represent their institutesin the VTA forums since their subject knowledge and practical exposure are associated with a directimpact in this study. Additionally, under the non-probability technique, snowball sampling andhomogeneous purposive sampling were used. One of the main criteria for shortlisting participantsfor this study involved the capacity of the participant to contribute to the research finding, which is

Systems 2019, 7, 50 6 of 22
possible only if they have undergone the employee selection process of a TAFE. By implementingthis judgemental step, we ensured that only the current and past employees in any position of aTAFE were included in the study, and the homogeneous purposive sampling technique was used.The overall sample size, even after using these sampling techniques, would be quite challenging tomanage due to the size and, therefore, quota sampling was implemented. The maximum participantsfrom the urban area were set to five from each organisation, and for the regional area, it was set totwo from each institution. This resulted in 50 participants from the urban area and 14 participantsfrom the regional area with 64 targeted participants. However, during the fieldwork, a few moreinterested participants volunteered to undergo face-to-face qualitative interviews. Likewise, for thesurvey, the target responses were fixed at a minimum of 10 members per institution for the urbanarea and 5 responses for the regional area which totalled to at least 105 participants from all TAFEs toenable representability and generalisability of the population. Table 2 below lists the 17 VTA membersthat were identified to be part of the Victoria TAFE sector and operating in either urban or regionalVictoria. Both current and previous employees of these institutes were invited to participate in thisempirical study.
Table 2. List of Victorian TAFE association members.
# Urban Institutes(Melbourne) # Regional Institutes Regional Location
1 Box Hill Institute 1 Federation Training Chadstone2 Chisholm 2 Federation University Ballarat3 Holmesglen 3 Gordon Institute of TAFE Geelong4 Kangan Institute 4 South West TAFE Warrnambool5 Melbourne Polytechnic 5 Wodonga TAFE Wodonga6 William Angliss Institute 6 Sunraysia Institute Mildura7 AMES Australia 7 GOTAFE Wangaratta8 RMIT University9 Swinburne
10 Victoria Polytechnic
There were 74 interviews for qualitative data and 204 individual survey participants for quantitativedata from these 17 organisations. The total number of participants from the qualitative and quantitativemethods with their individual personal experiences are tabulated in Table 3. It outlines the number ofparticipants per organization (with the names coded) for the face-to-face semi-structured interviews aspart of the qualitative data collection. Likewise, for the online survey, the participants were requestedto recollect their experiences during instances when they were taking the role as a successful applicant,unsuccessful applicant, or a hiring member which resulted in 605 unique such instances. As thefocus of this study was on the experiences in the TAFE/dual-sector alone, the 52 instances forminga non-TAFE-based experience were categorised as “other” and were removed from the analysis.However, in this category, the 27 responses collected from unsuccessful participants were retained aftera confirmation upon a preliminary examination of their organisations, whether related to the service orthe education sector in Australia. The final set of valid data prepared for this analysis from the surveyconsisted of 553 total experiences combining successful, unsuccessful and hiring member perspectives.This information (N) on the quantitative and qualitative data collected is tabulated in Table 3 below.

Systems 2019, 7, 50 7 of 22
Table 3. Response rate for qualitative and quantitative data collection.
TAFE/Dual-Sector InterviewsSuccessfulInterview
Experience
UnsuccessfulInterview
Experience
HiringMember
(Name Coded) Qualitative Data (N) Quantitative Data (N)
1 5 9 2 32 6 22 2 73 8 22 5 134 2 6 1 35 4 45 4 286 2 11 0 77 2 9 3 48 5 14 4 59 5 21 5 6
10 7 59 14 2811 6 16 8 812 2 10 2 513 2 3 0 114 6 19 2 615 5 24 5 516 5 18 4 1217 2 8 3 5
Other 0 52 27 0Total 74 368 91 146
A conscious effort was undertaken to encourage participation and to ensure equal representationfrom both genders in this study. Table 4 below gives the gender distribution of the survey participants.
Table 4. Gender distribution of survey participants.
Gender Frequency Percentage
Male 104 51%Female 98 48%
Do not wish to answer 2 1%
The age distribution of the participants in this study was spread across a wide range from the agesof 25 to 74. Most of the participants (39%) belonged to the age group 55–64 and closely following thatage range was the age group 45–54 (31%). Table 5 below presents the frequency distribution across theage groups of all the participants in this study.
Table 5. Age distribution of survey participants.
Age Frequency Percentage
25–34 15 7%35–44 32 16%45–54 64 31%55–64 79 39%65–74 14 7%
Table 6 below provides the distribution of the citizenship status of the participants. It demonstratesthat most of the participants (90%) are Australian citizens, a smaller number are permanent residents ofAustralia (8%), and a minimal number of participants (2%) were categorised as “other”. This informationassisted in establishing the homogeneous nature of the participants in the context of their working rightsin Australia. Therefore, their responses may not be affected by any changes in the immigration rules

Systems 2019, 7, 50 8 of 22
related to the work permits. This ensures that an unbiased response was obtained from the participantsfocusing only on the nature of the employment and the selection process for their employment withoutmuch effect from work permits and other external immigration-related information.
Table 6. Citizenship distribution of survey participants.
Citizenship Frequency Percentage
Australian Citizen 184 90%Permanent Resident 16 8%
Other 4 2%
Previous work [18] analysed a few critical aspects using the hypothesis testing technique fromthe perspective of a hiring member and successful or unsuccessful interview applicant. In continuingthat, this section attempted to explore all the variables used in this study in association with the hiringprocess. It assists in finding the results to the research question, which is related to identifying thedominant factors in the hiring process, as outlined in Table 7 below. These questions were carefullyselected to align with the current literature also related to using expert systems in HRM. This sectionpresents the findings in two parts: the first part involved the use of exploratory factor analysis asa quantitative technique, and the second part involved the use of thematic analysis as a qualitativetechnique to establish the dominant factors. In conclusion, a comparative analysis of both findingswas completed as part of the data triangulation to establish the reliability and validity of the resultsreported. Finally, we present how both techniques taken together provided evidence to address theresearch question.
Table 7. Research question mapped with the online survey and interview questions.
Research Question Quantitative Analysis—OnlineSurvey Questions Qualitative Analysis—Interview Questions
What are the dominantfactors to be consideredfor improving theeffectiveness of thecurrent hiring process?
• The duration of the total hiringprocess was reasonable• There was bias in the hiring decision• All interview questions wererelevant to the job• The interview process was wellorganised• Constructive interview feedbackwas provided
•What more information would you have likedwhen the hiring decision was conveyed to you?• Can you describe the best interview you havehad as an interviewee? Why is it the best?• Can you describe the best interview you havehad as an interviewer?• How do you think we can underpin fairness,equity, and transparency in the hiring process?
4. Analysis of Dominant Factors to Consider for Improvements to the Interview Selection Process
4.1. Quantitative Analysis: Exploratory Factor Analysis
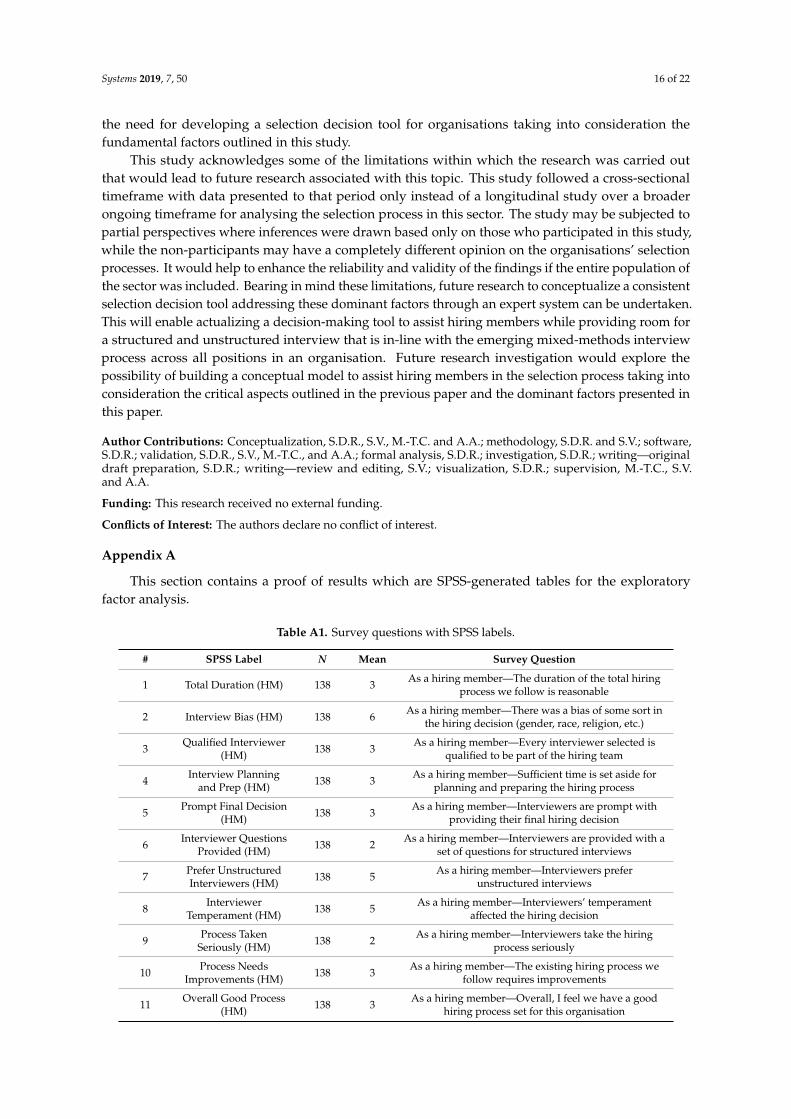
From the previous study [18], the findings show that the results were significantly similar inall the critical aspects as shortlisted for this study, irrespective of the applicant being successful orunsuccessful. In this study, we further perform the exploratory factor analysis (EFA) that takes intoaccount the successful applicant’s experience and the hiring member’s experience along with theirresponses to proposed improvements as provided in the survey. Table A1 in Appendix A presentsquestions related to the hiring process from the perspective of the hiring member (HM) and the hiredsuccessful applicant (HS) along with improvements to the hiring process (HP) with the frequencyvalue. The responses are provided using the Likert scale from 1 to 7, where 1—strongly agree, 2—agree,3—somewhat agree, 4—neither agree nor disagree, 5—somewhat disagree, 6—disagree and 7—stronglydisagree. This tabulated information on the mean needs to be understood in reference to the 7 pointsLikert scale provided in this section.
The 38 variables listed in Table A1 in Appendix A are processed using the exploratory factoranalysis technique for finding dominant factors. This technique was used to arrive at the meaningful

Systems 2019, 7, 50 9 of 22
factors that can be listed as dominant factors, which could then be considered in improving theeffectiveness of the employee selection interview process. An EFA assesses the number of factors thatare common in a survey instrument that impacts its measures and examines the association amongeach common factor to the equivalent measure and the strength of that factor [29]. Researchers useexploratory factor analysis for various purposes: (i) to detect the constructs’ natures that promptresponses in a survey; (ii) to decide on interconnected sets of items; (iii) to establish the breadth anddepth of measurement scales; (iv) to organize the most significant features in that group of items;and (v) to produce factor scores that signify fundamental ideas [29]. Further, EFA is considered asan appropriate multivariate statistical approach to assist with data reduction, to explore associationsamong categories, and in estimating the measurement scales’ construct validities [30]. Exploratoryfactor analysis consists of a sequence of statistical steps for analysis. The first step is the planning step,where the suitability of the data for an EFA is determined by checking the sample size to establish areasonable factorability followed by generating a correlation matrix and conducting a test to measurethe sampling adequacy. The second step involves extracting the factors using principal axis factoring(PAF), which is the conventional method of extraction for EFA, or principal component analysis (PCA),which is another method of extraction in EFA, both of which were used in this paper. The third steprequires determining a fixed number of factors to retain. The fourth step contains factor rotation withvarimax as the commonly used rotation method. The fifth step consists of interpreting the factorstructure and assigning new labels [31].
As outlined above, primarily, an examination for determining the factorability of the 38 variableslisted in Table A1 in Appendix A was carried out. Initially, 36 of the 38 items were detected to becorrelated with at least a value greater than 0.25 with one other item, thereby establishing a reasonablefactorability. Furthermore, the Kaiser–Meyer–Olkin measure of sampling adequacy resulted in 0.807,as demonstrated in Table 8 below, which is higher than the generally suggested value of 0.5, and theBartlett’s test of sphericity established the significances with 0.000 for the 38 variables processed andconfirmed the adequacy of the required sampling. Additionally, the communalities tables from SPSS,as outlined in Table A2 in Appendix A using the PAF method for extraction in the initial communalities,were all above 0.3, further confirming that each variable had some common variance with othervariables in that table. With these results showing overall positive indicators, EFA was considered as asuitable technique for this table of 38 variables.
Table 8. Kaiser–Meyer–Olkin test and Bartlett’s test.
Kaiser–Meyer–Olkin Measure of Sampling Adequacy 0.807
Bartlett’s Test of SphericityApproximate chi-square 2486.455
df 703Significance 0.000
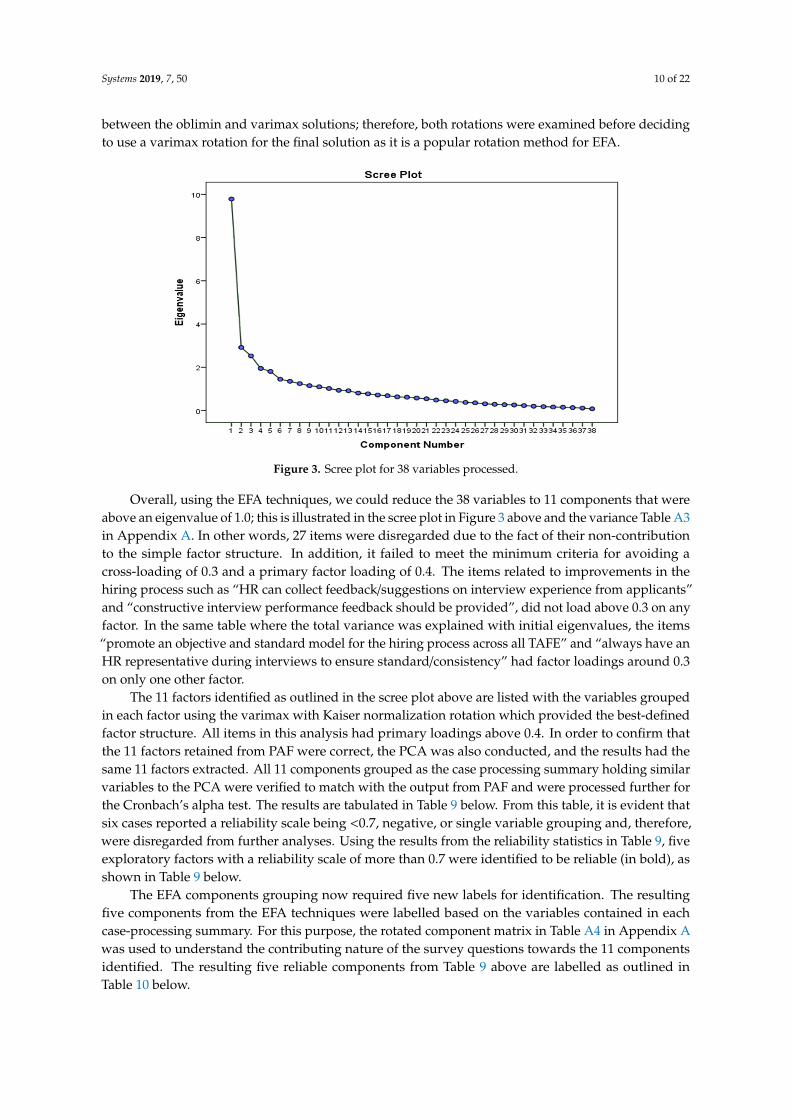
After establishing the EFA technique to be an appropriate statistical testing tool for this dataset, theresults obtained by conducting EFA for the 38 variables were summarised (Table A3 in Appendix A).Table A3 provides the tabulation of the variables against the total initial eigenvalues (highlighted inblue) which indicate that the first five factors described up to 26%, 8%, 7%, 5%, and 5% of the varianceindividually (% value highlighted in green). The sixth to the eleventh factors had initial eigenvaluesjust over one and individually described close to 3% of the variance. Apart from these first 11 factors,the remaining factors from 12–38 had a total initial eigenvalue less than 1.0 and, therefore, needed tobe removed from further analysis. This resulted in the 11 shortlisted factors that were retained forfurther processing. The results for all the eleven factors were individually studied using oblimin andvarimax rotations of the factor loading matrix. The identified eleven factors explain close to 70% of thevariances in the dataset and is illustrated by a scree plot in Figure 3 below. It shows the “levelling off”of eigenvalues after eleven factors and the inadequate frequency of primary loadings and difficulty ofinterpreting the twelfth factor and subsequent factors as mentioned earlier. There was little difference
Systems 2019, 7, 50 10 of 22
between the oblimin and varimax solutions; therefore, both rotations were examined before decidingto use a varimax rotation for the final solution as it is a popular rotation method for EFA.
Systems 2019, 7, 50 10 of 24
therefore, needed to be removed from further analysis. This resulted in the 11 shortlisted factors that were retained for further processing. The results for all the eleven factors were individually studied using oblimin and varimax rotations of the factor loading matrix. The identified eleven factors explain close to 70% of the variances in the dataset and is illustrated by a scree plot in Figure 3 below. It shows the “levelling off” of eigenvalues after eleven factors and the inadequate frequency of primary loadings and difficulty of interpreting the twelfth factor and subsequent factors as mentioned earlier. There was little difference between the oblimin and varimax solutions; therefore, both rotations were examined before deciding to use a varimax rotation for the final solution as it is a popular rotation method for EFA.
Figure 3. Scree plot for 38 variables processed.
Overall, using the EFA techniques, we could reduce the 38 variables to 11 components that were above an eigenvalue of 1.0; this is illustrated in the scree plot in Figure 3 above and the variance Table A3 in Appendix A. In other words, 27 items were disregarded due to the fact of their non-contribution to the simple factor structure. In addition, it failed to meet the minimum criteria for avoiding a cross-loading of 0.3 and a primary factor loading of 0.4. The items related to improvements in the hiring process such as “HR can collect feedback/suggestions on interview experience from applicants” and “constructive interview performance feedback should be provided”, did not load above 0.3 on any factor. In the same table where the total variance was explained with initial eigenvalues, the items “promote an objective and standard model for the hiring process across all TAFE” and “always have an HR representative during interviews to ensure standard/consistency” had factor loadings around 0.3 on only one other factor.
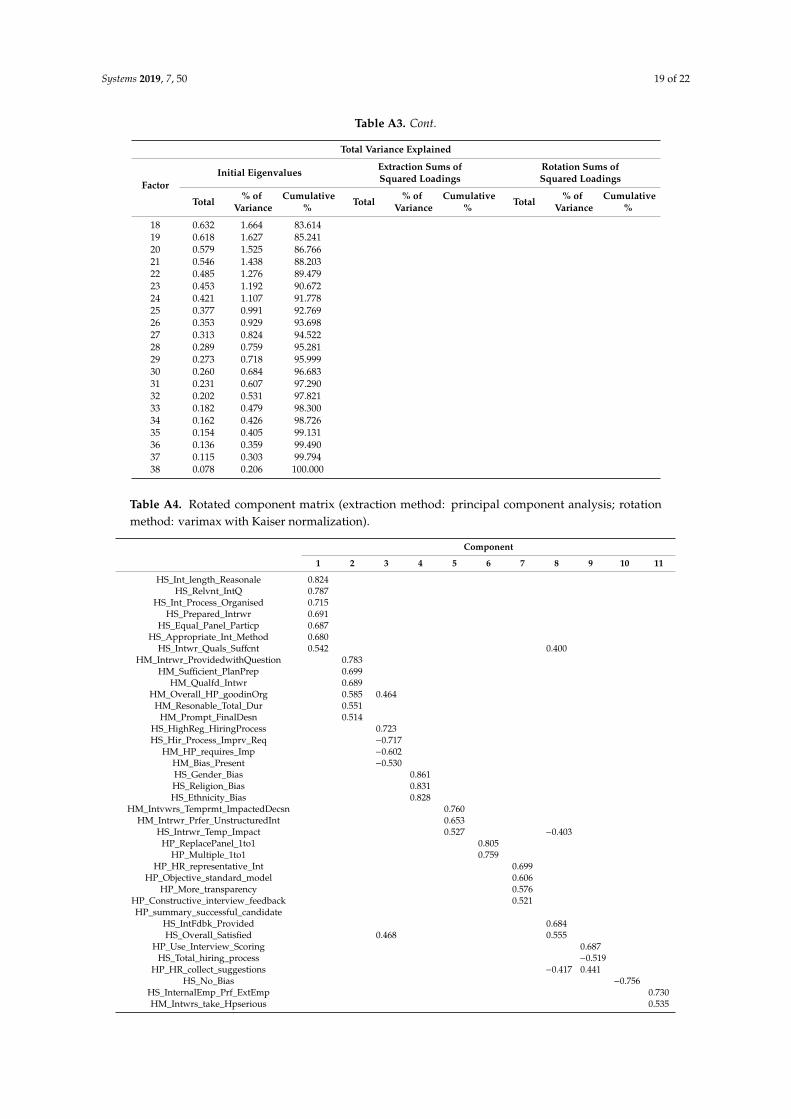
The 11 factors identified as outlined in the scree plot above are listed with the variables grouped in each factor using the varimax with Kaiser normalization rotation which provided the best-defined factor structure. All items in this analysis had primary loadings above 0.4. In order to confirm that the 11 factors retained from PAF were correct, the PCA was also conducted, and the results had the same 11 factors extracted. All 11 components grouped as the case processing summary holding similar variables to the PCA were verified to match with the output from PAF and were processed further for the Cronbach’s alpha test. The results are tabulated in Table 9 below. From this table, it is evident that six cases reported a reliability scale being <0.7, negative, or single variable grouping and, therefore, were disregarded from further analyses. Using the results from the reliability statistics in Table 9, five exploratory factors with a reliability scale of more than 0.7 were identified to be reliable (in bold), as shown in Table 9 below.
Table 9. Cronbach’s alpha reliability statistics.
Figure 3. Scree plot for 38 variables processed.
Overall, using the EFA techniques, we could reduce the 38 variables to 11 components that wereabove an eigenvalue of 1.0; this is illustrated in the scree plot in Figure 3 above and the variance Table A3in Appendix A. In other words, 27 items were disregarded due to the fact of their non-contributionto the simple factor structure. In addition, it failed to meet the minimum criteria for avoiding across-loading of 0.3 and a primary factor loading of 0.4. The items related to improvements in thehiring process such as “HR can collect feedback/suggestions on interview experience from applicants”and “constructive interview performance feedback should be provided”, did not load above 0.3 on anyfactor. In the same table where the total variance was explained with initial eigenvalues, the items“promote an objective and standard model for the hiring process across all TAFE” and “always have anHR representative during interviews to ensure standard/consistency” had factor loadings around 0.3on only one other factor.
The 11 factors identified as outlined in the scree plot above are listed with the variables groupedin each factor using the varimax with Kaiser normalization rotation which provided the best-definedfactor structure. All items in this analysis had primary loadings above 0.4. In order to confirm thatthe 11 factors retained from PAF were correct, the PCA was also conducted, and the results had thesame 11 factors extracted. All 11 components grouped as the case processing summary holding similarvariables to the PCA were verified to match with the output from PAF and were processed further forthe Cronbach’s alpha test. The results are tabulated in Table 9 below. From this table, it is evident thatsix cases reported a reliability scale being <0.7, negative, or single variable grouping and, therefore,were disregarded from further analyses. Using the results from the reliability statistics in Table 9, fiveexploratory factors with a reliability scale of more than 0.7 were identified to be reliable (in bold), asshown in Table 9 below.
The EFA components grouping now required five new labels for identification. The resultingfive components from the EFA techniques were labelled based on the variables contained in eachcase-processing summary. For this purpose, the rotated component matrix in Table A4 in Appendix Awas used to understand the contributing nature of the survey questions towards the 11 componentsidentified. The resulting five reliable components from Table 9 above are labelled as outlined inTable 10 below.

Systems 2019, 7, 50 11 of 22
Table 9. Cronbach’s alpha reliability statistics.
Valid Cases Reliability Statistics
N % Cronbach’s Alpha N Items
Case Processing Summary 1 350 95.1 0.903 * 7Case Processing Summary 2 138 37.5 0.815 * 6Case Processing Summary 3 135 36.7 −0.696 5Case Processing Summary 4 350 95.1 0.905 * 3Case Processing Summary 5 135 36.7 0.714 * 3Case Processing Summary 6 203 55.2 0.784 * 2Case Processing Summary 7 203 55.2 0.584 4Case Processing Summary 8 203 55.2 0.117 5Case Processing Summary 9 203 55.2 0.089 3
Case Processing Summary 10 135 36.7 0.021 2Case Processing Summary 11 135 36.7 0.021 2
* Reliability scale of >0.7.
Table 10. The Exploratory Factor Analysis components with labels (using SPSS).
# EFA Components Label
1 Training2 Planning and structured interviews3 Bias in the selection process4 Interviewer’s personality5 Panel Interview and Transparency
4.2. Qualitative Analysis—Thematic Analysis
Following the quantitative analysis in the previous section, this section now examines the datacollected from a qualitative perspective using a thematic analysis. In particular, it provides evidence forthe data triangulation, considering the similarity in the data provided in Table 10 above and Table 11below. The semi-structured interviews with 74 participants for an average duration of 45 min involvedparticipants answering approximately 25 questions. Using NVivo software, the transcribed data wereassigned preliminary codes which were developed using keywords from the interview question andwere descriptive of the content. Additionally, there was a systematic analysis for patterns and themesacross all interviews, which finally resulted in 35 such relevant codes that were identified for thisstudy. This was later grouped into different categories based on the similarity and association of thecontent resulting in six different categories as evidenced in Table A5 in Appendix B. Using thematicanalysis of NVivo, this was further analysed and reviewed for broad themes based on the featuresbeing discussed thereby establishing dimension reduction which resulted in three themes. Informationrelated to the list of codes, categories, and themes with their relevant association to each other ispresented in Table A5 in Appendix B for reference. Overall, these manual and in-depth analyses haveresulted in 31 codes, 5 categories, and 3 themes. Furthermore, the five categories extracted using thethematic analysis are summarised in Table 11 below and suited the extracted factors in the EFA, therebyestablishing data triangulation, as discussed earlier.
Table 11. Thematic analysis: categories (using NVivo).
# Thematic Analysis (Categories)
1 Hiring members involvement2 Interview process enhancements3 Variation of bias in interviews4 Interview process problems5 Applicant feedback

Systems 2019, 7, 50 12 of 22
The above two quantitative and qualitative analyses confirmed, indicating that the five distinctfactors listed from each method based on the responses of participants in the selection processestablished moderate and internally consistent findings with evident data triangulation. Using thequantitative and qualitative analysis, it yielded similar results, thereby establishing that the resultswere satisfactory and acceptable. The five dominant factors to be considered in improving and ensuringproper standards in the employee selection interview process were:
• Training the hiring members for the interview process;• Planning and preparing for the interview process;• Removing the bias of the hiring members during the interview process;• Providing feedback to applicants to ensure a transparent process; and• Ensuring the hiring decisions are process-driven instead of driven by the interviewer’s personality.
Despite operating in a developed country, the use of technology in this sector to help with thedecision making in the selection interview process was limited or nil. Due to the lack of training andtechnology, hiring members suggested some useful methods. On the one hand, these suggestions couldbring enhancements to the recruitment process. On the other hand, due to the variations obtainedfrom different participants, a further in-depth study is required to determine the consistency for biasthat may exist.
In response to the interview question “Do you have any recruitment management systems thatyou used or was it just emails and paper-based?”, most of the 74 participants responded negatively;participants 12, 22, 28, 30, 31, 38, and 39 were some of the many who had commented that the processrelied only on “email- and paper-based” methods. However, there were a few of the 17 organisationsthat seemed to have this worked out, which was appreciated by some hiring members, such as P11who stated:
“At [withheld], we use [withheld] on our website, and people can see our positions. So, they applyfor our position online, and then our interview process is managed through that recruitment modulethrough the back end. We know which people are shortlisted. We can see where people are at throughthe stages. That way we can see if they are unsuccessful quite early or we can see if they progressthrough to the interview stage, etc.”
Using NVivo, a word frequency of the responses to the use of recruitment systems in eachparticipant’s HR department was calculated. The results obtained from NVivo are given in Figure 4below. There appears to be a good acceptance and eagerness among participants for the implementationof HR expert systems, as highlighted in red in Figure 4 below. This refers to the current practice ofusing paper and emails only with a positive response and reasons for adopting recruitment systemsnoted as follows:
• Transparent outcome;• Updating services;• Improved process;• Understating the requirements better;• Data stored as a database and managed online with objective rating systems;• Better position to provide relevant feedback and to defend the decision taken; and• Finally making the organization appear professional.

Systems 2019, 7, 50 13 of 22Systems 2019, 7, 50 13 of 24
Figure 4. Word frequency for the use of recruitment systems in HR departments.
5. Summary of Findings and Discussion
This section aims to summarise how the research question of this ongoing study was addressed by providing an analysis of the dominant factors involved in the consideration for improving the selection process. We analysed the results and the key empirical findings of this research by including the statistical data analysis (quantitative) as well as the narrative data analysis (qualitative). The five dominant factors that were identified for improving the employee selection process are discussed. Prior to discussing the specific dominant factors for improvement of the selection process, this section begins with a review of the findings based on all the factors associated with the selection process and provides more in-depth insights and the reasoning behind the grouping and clustering of some factors in order to form the dominant factors.
An overall review of this study’s findings demonstrates 38 individual elements used for analysis associated with the employee selection process. It shows clear indications in the results that there was a strong correlation among multiple elements that assess the different stages of the selection process. The EFA technique was used to effectively process the data further to perform data reduction by associating the correlated elements that cluster together to form a group. The data was reduced to 10 possible groups with the other elements listed within each associated group. Each group was renamed based on the elements it held for a most suitable indication of the group name. Interviewer Training was the name given to a group that consisted of seven elements such as the length of the interview; having relevant interview questions; being prepared for the interview; ensuring equal panel participation; using an appropriate interview method; having qualified interviewers; interviewers organised with the conduct of the proceeding. The results of this group, with the seven elements, collectively report 90% reliability. This finding aligned with existing literature and was also evident from its popularity of usage relating to the necessity for training of the interviewer and the applicant [32–35]. The next group was renamed as Planned and Structured Interview Process which consisted of six elements such as providing interview questions for structured interview; allocating sufficient preparation and planning for the process; appointing qualified and relevant interviewers; hiring member’s confidence in the overall process; total duration for the selection process; and the promptness of arriving at the final selection decision. The results of these elements collectively formed a new group which was found to be 82% reliable. The third group was called Bias in the Interview, and it consisted of three elements such as the interviewers’ bias on gender, religion, and ethnicity which collectively reported a 91% reliability of belonging to this group. The fourth group was named as Interviewer’s Personality and Fit, consisting of three elements such as the interviewer’s
Figure 4. Word frequency for the use of recruitment systems in HR departments.
5. Summary of Findings and Discussion
This section aims to summarise how the research question of this ongoing study was addressedby providing an analysis of the dominant factors involved in the consideration for improving theselection process. We analysed the results and the key empirical findings of this research by includingthe statistical data analysis (quantitative) as well as the narrative data analysis (qualitative). The fivedominant factors that were identified for improving the employee selection process are discussed.Prior to discussing the specific dominant factors for improvement of the selection process, this sectionbegins with a review of the findings based on all the factors associated with the selection process andprovides more in-depth insights and the reasoning behind the grouping and clustering of some factorsin order to form the dominant factors.
An overall review of this study’s findings demonstrates 38 individual elements used for analysisassociated with the employee selection process. It shows clear indications in the results that therewas a strong correlation among multiple elements that assess the different stages of the selectionprocess. The EFA technique was used to effectively process the data further to perform data reductionby associating the correlated elements that cluster together to form a group. The data was reducedto 10 possible groups with the other elements listed within each associated group. Each group wasrenamed based on the elements it held for a most suitable indication of the group name. InterviewerTraining was the name given to a group that consisted of seven elements such as the length ofthe interview; having relevant interview questions; being prepared for the interview; ensuringequal panel participation; using an appropriate interview method; having qualified interviewers;interviewers organised with the conduct of the proceeding. The results of this group, with the sevenelements, collectively report 90% reliability. This finding aligned with existing literature and was alsoevident from its popularity of usage relating to the necessity for training of the interviewer and theapplicant [32–35]. The next group was renamed as Planned and Structured Interview Process whichconsisted of six elements such as providing interview questions for structured interview; allocatingsufficient preparation and planning for the process; appointing qualified and relevant interviewers;hiring member’s confidence in the overall process; total duration for the selection process; and thepromptness of arriving at the final selection decision. The results of these elements collectively formeda new group which was found to be 82% reliable. The third group was called Bias in the Interview, andit consisted of three elements such as the interviewers’ bias on gender, religion, and ethnicity whichcollectively reported a 91% reliability of belonging to this group. The fourth group was named as

Systems 2019, 7, 50 14 of 22
Interviewer’s Personality and Fit, consisting of three elements such as the interviewer’s temperamentimpacting on the panel’s decision; the interviewer’s personality and attitude impacting on the selectiondecision; the interviewer’s preference for unstructured interviews. This group reports a reliabilityscore of 71% with these three elements. The final group was called the Interview and Transparency,as it consists of two elements which were associated with the formation of the panel interview andseeking transparency. These elements reported a 78% reliability of being combined in the same group.In summary, these were the top five groups that had a reliability score > 70% and, therefore, are listedas the dominant factors that need to be considered in improving the selection process.
The findings in this empirical study also support previous research which has found theseelements as important factors in establishing a robust talent acquisition process in an employeeselection system [36]. What further emerges from the findings is that, as part of the data triangulation,a qualitative analysis was carried out simultaneously, and the results from the qualitative analysiswere consistent with the results reported using the quantitative analysis approach. It thereby confirmsthe validity and reliability of the key findings for the research question in this study. In the qualitativeanalysis, 31 individual codes were identified, which were further grouped into six different categoriesbased on the similarity of their nature. The six categories were the hiring members involvement;interview process enhancements; variation of bias in interviews; interview process problems; applicantfeedback; and external association to the interview process. These six categories were further classifiedinto the emerging three themes:
• Ensuring the integrity of the interview selection process;• Enhancing the applicant feedback process with enriched information; and• Contributory elements towards the overall satisfaction of the interview selection process.
The first five categories from the qualitative analysis aligned very closely with the five factorsresulting from the quantitative analysis that demonstrated the close similarity among both findings.This information is summarised and illustrated in Figure 5 below.
Systems 2019, 7, 50 14 of 24
temperament impacting on the panel’s decision; the interviewer’s personality and attitude impacting on the selection decision; the interviewer’s preference for unstructured interviews. This group reports a reliability score of 71% with these three elements. The final group was called the Interview and Transparency, as it consists of two elements which were associated with the formation of the panel interview and seeking transparency. These elements reported a 78% reliability of being combined in the same group. In summary, these were the top five groups that had a reliability score > 70% and, therefore, are listed as the dominant factors that need to be considered in improving the selection process.
The findings in this empirical study also support previous research which has found these elements as important factors in establishing a robust talent acquisition process in an employee selection system [36]. What further emerges from the findings is that, as part of the data triangulation, a qualitative analysis was carried out simultaneously, and the results from the qualitative analysis were consistent with the results reported using the quantitative analysis approach. It thereby confirms the validity and reliability of the key findings for the research question in this study. In the qualitative analysis, 31 individual codes were identified, which were further grouped into six different categories based on the similarity of their nature. The six categories were the hiring members involvement; interview process enhancements; variation of bias in interviews; interview process problems; applicant feedback; and external association to the interview process. These six categories were further classified into the emerging three themes:
• Ensuring the integrity of the interview selection process; • Enhancing the applicant feedback process with enriched information; and • Contributory elements towards the overall satisfaction of the interview selection process.
The first five categories from the qualitative analysis aligned very closely with the five factors resulting from the quantitative analysis that demonstrated the close similarity among both findings. This information is summarised and illustrated in Figure 5 below.
Figure 5. Mapping the qualitative and quantitative findings.
Responses to all questions from all 74 participants were processed by NVivo software to find the Pearson’s correlation for word similarity. This resulted in exposing the current lack of expert systems in this sector and the positive reception by participants to adopt a more system-based decision for the employee selection process. From this study, we can arrive at the following concrete
Figure 5. Mapping the qualitative and quantitative findings.
Responses to all questions from all 74 participants were processed by NVivo software to findthe Pearson’s correlation for word similarity. This resulted in exposing the current lack of expert

Systems 2019, 7, 50 15 of 22
systems in this sector and the positive reception by participants to adopt a more system-baseddecision for the employee selection process. From this study, we can arrive at the following concreteimprovements to the recruitment system that create evidence-based recommendations for change inthe selection processes:
• Ongoing training should reinforce that discriminatory questions cannot be asked;• Include an HR/neutral representative on the committee; and• Rather than necessarily providing feedback, perhaps the HR role should be to obtain feedback on
the process from unsuccessful applicants for each position.
In summary, this paper carried out further research based on our previous study, which attemptedto uncover the critical aspects of the employee selection process [18]. Technological assistance was oneof the key critical aspects brought into the limelight by the hiring members. By correlating the findingsreported in the previous work that were found in tandem with the discussions in this paper, the resultswere well justified. The identification of the five dominant factors in this study—namely, training,planning factors of the interview approach, avoiding bias, influence by the interviewer’s personality,and establishing panel interviews for transparency—have perfectly synchronised with our previousrelated research investigations.
We observed some of the shortcomings in the process found in this study that is summarizedhere. The relatively low standard of the hiring process was shown when the quality of the shortlistedcandidates could not be quantified. With the help of customized expert systems, some organizationscould manage to substantiate the quality of the candidates in the hiring process. However, since sucha system is required to be well customized, the limitation could be in the language that is probablyunderstood only within that organization. Introducing a standard model that could be used acrossall 17 organizations in this sector would establish a common language. This measure will also servethe candidates to understand their level of individual and non-subjective performance when they askfor feedback from the hiring team. These findings are in line with the arguments presented by otherresearchers from various associated fields, such as an open communication method in organisationsbetween the organization and its stakeholders [37]. A systematic approach which indicates “howmuch better” or worse the candidate was to the hired person, would denounce any subjective personalinterpretation of the hiring managers. It is imperative to undertake a systematic analysis of the processto determine the type of person to be hired. The outcome of such an in-depth analysis could beused to prove the reliability and validity of the hiring process. The cost to organisations of usingpoor recruitment techniques or selecting someone who does not last long with the organisation oreven selecting an unsuitable person who stays with the organisation could have an extraordinarilysignificant negative impact on the organisation in terms of morale, cost, and potential loss of revenue [3].In this context, Cook and Cripps [38] present the various psychological assessment techniques used forselection and identify only those that are worth using.
6. Conclusions and Future Research
This paper presented the findings of an exploratory study conducted to determine the dominantfactors of the employee selection process for achieving a robust recruitment system. The empiricalstudy consisted of 17 organisations from an Australian TAFE/dual-sector, and a mixed-method ofboth quantitative and qualitative survey analysis was adopted to study the use of technology andmanagement systems for the employee selection process from various perspectives of participantsincluding hiring members and successful and unsuccessful candidates. The findings from the EFAand NVivo analytic tools revealed five dominant factors of the selection process, such as training,planning factors of the interview approach, avoiding bias, influence by the interviewer’s personality,and establishing panel interviews for transparency, have not only confirmed with the critical factorsrevealed from our previous investigation but also successfully cleared the data triangulation forreliability and validity of results. These findings align well with existing literature in promoting
Systems 2019, 7, 50 16 of 22
the need for developing a selection decision tool for organisations taking into consideration thefundamental factors outlined in this study.
This study acknowledges some of the limitations within which the research was carried outthat would lead to future research associated with this topic. This study followed a cross-sectionaltimeframe with data presented to that period only instead of a longitudinal study over a broaderongoing timeframe for analysing the selection process in this sector. The study may be subjected topartial perspectives where inferences were drawn based only on those who participated in this study,while the non-participants may have a completely different opinion on the organisations’ selectionprocesses. It would help to enhance the reliability and validity of the findings if the entire population ofthe sector was included. Bearing in mind these limitations, future research to conceptualize a consistentselection decision tool addressing these dominant factors through an expert system can be undertaken.This will enable actualizing a decision-making tool to assist hiring members while providing room fora structured and unstructured interview that is in-line with the emerging mixed-methods interviewprocess across all positions in an organisation. Future research investigation would explore thepossibility of building a conceptual model to assist hiring members in the selection process taking intoconsideration the critical aspects outlined in the previous paper and the dominant factors presented inthis paper.
Author Contributions: Conceptualization, S.D.R., S.V., M.-T.C. and A.A.; methodology, S.D.R. and S.V.; software,S.D.R.; validation, S.D.R., S.V., M.-T.C., and A.A.; formal analysis, S.D.R.; investigation, S.D.R.; writing—originaldraft preparation, S.D.R.; writing—review and editing, S.V.; visualization, S.D.R.; supervision, M.-T.C., S.V.and A.A.
Funding: This research received no external funding.
Conflicts of Interest: The authors declare no conflict of interest.
Appendix A
This section contains a proof of results which are SPSS-generated tables for the exploratoryfactor analysis.
Table A1. Survey questions with SPSS labels.
# SPSS Label N Mean Survey Question
1 Total Duration (HM) 138 3 As a hiring member—The duration of the total hiringprocess we follow is reasonable
2 Interview Bias (HM) 138 6 As a hiring member—There was a bias of some sort inthe hiring decision (gender, race, religion, etc.)
3 Qualified Interviewer(HM) 138 3 As a hiring member—Every interviewer selected is
qualified to be part of the hiring team
4 Interview Planningand Prep (HM) 138 3 As a hiring member—Sufficient time is set aside for
planning and preparing the hiring process
5 Prompt Final Decision(HM) 138 3 As a hiring member—Interviewers are prompt with
providing their final hiring decision
6 Interviewer QuestionsProvided (HM) 138 2 As a hiring member—Interviewers are provided with a
set of questions for structured interviews
7 Prefer UnstructuredInterviewers (HM) 138 5 As a hiring member—Interviewers prefer
unstructured interviews
8 InterviewerTemperament (HM) 138 5 As a hiring member—Interviewers’ temperament
affected the hiring decision
9 Process TakenSeriously (HM) 138 2 As a hiring member—Interviewers take the hiring
process seriously
10 Process NeedsImprovements (HM) 138 3 As a hiring member—The existing hiring process we
follow requires improvements
11 Overall Good Process(HM) 138 3 As a hiring member—Overall, I feel we have a good
hiring process set for this organisation

Systems 2019, 7, 50 17 of 22
Table A1. Cont.
# SPSS Label N Mean Survey Question
12 Reasonable TotalDuration (HS) 350 2 As a successful applicant—The duration of the total
hiring process was reasonable
13 Appropriate Methods(HS) 350 2 As a successful applicant—The interview method used
was appropriate (phone/face-to-face/panel, etc.)
14 Bias on Religion (HS) 350 6 As a successful applicant—There was bias in the hiringdecision based on religion
15 Bias on Gender (HS) 350 6 As a successful applicant—There was bias in the hiringdecision based on gender
16 Bias on Ethnicity (HS) 350 6 As a successful applicant—There was bias in the hiringdecision based on ethnicity
17 No Bias (HS) 350 3 As a successful applicant—There was no bias of any sortin the hiring decision
18 TemperamentImpacted (HS) 350 5 As a successful applicant—The interviewer’s
temperament impacted on the hiring decisions
19 Relevant Questions(HS) 350 2 As a successful applicant—All interview questions were
relevant to the job
20 Organised Process(HS) 350 2 As a successful applicant—The interview process was
well organised
21 Prepared Interviewers(HS) 350 2 As a successful applicant—The interviewers were well
prepared for the interview
22 Interview Length (HS) 350 2 As a successful applicant—The length of the interviewswas reasonable
23 Equal PanelParticipation (HS) 350 2 As a successful applicant—All interviewers in the panel
participated equally in the interview
24 Qualified Interviewer(HS) 350 2 As a successful applicant—I felt the interviewers had the
necessary qualifications to interview
25 Internal EmployeePreference (HS) 350 4 As a successful applicant—I feel that internal employees
are preferred to external applicants for interviews
26 Provided Feedback(HS) 350 4 As a successful applicant—Constructive interview
feedback was provided after the interview
27 Process ImprovementsRequired (HS) 350 4 As a successful applicant—The hiring process requires
many improvements
28 Regard Based onProcess (HS) 350 3 As a successful applicant—I have high regard for this
organisation based on its hiring process
29 Overall satisfaction(HS) 350 3 As a successful applicant—Overall, I was satisfied with
the entire hiring process
30 Scoring System (HP) 203 2 In general, an interview scoring sheet can be used toassist in hiring decisions
31 Panel Structure (HP) 203 4 In general, one-to-one interviews are better than panelinterviews
32 Multiple Interviews(HP) 203 5 In general, multiple one-to-one interviews can replace a
panel interview
33 Applicant Suggestions(HP) 203 3 In general, HR can collect feedback/suggestions on
interview experience from applicants
34 Interview Feedback(HP) 203 2 In general, constructive interview performance feedback
should be provided
35 Objective ConsistentSystem (HP) 203 3 In general, we promote an objective and standard model
for hiring process across all TAFE
36 Transparency (HP) 203 3 In general, the hiring process needs to have moretransparency in the hiring decision
37 HR Representative(HP) 203 3 In general, we always have an HR representative during
interviews to ensure standard/consistency
38 Successful ApplicantSummary (HP) 200 4 In general, we share a summary of a successful
candidate with other interview applicants

Systems 2019, 7, 50 18 of 22
Table A2. Communalities using the principal axis factoring extraction method for EFA.
Communalities
Initial Extraction
HS_Total_hiring_process 0.535 0.438HS_Appropriate_Int_Method 0.690 0.740
HS_Religion_Bias 0.598 0.517HS_Gender_Bias 0.848 0.926
HS_Ethnicity_Bias 0.818 0.799HS_No_Bias 0.430 0.305
HS_Intrwr_Temp_Impact 0.616 0.633HS_Relvnt_IntQ 0.610 0.601
HS_Int_Process_Organised 0.788 0.761HS_Prepared_Intrwr 0.809 0.766
HS_Int_length_Reasonale 0.710 0.765HS_Equal_Panel_Particp 0.663 0.591HS_Intwr_Quals_Suffcnt 0.756 0.801
HS_InternalEmp_Prf_ExtEmp 0.455 0.430HS_IntFdbk_Provided 0.504 0.424
HS_Hir_Process_Imprv_Req 0.683 0.705HS_HighReg_HiringProcess 0.729 0.817
HS_Overall_Satisfied 0.713 0.778HP_Use_Interview_Scoring 0.428 0.354
HP_ReplacePanel_1to1 0.511 0.644HP_Multiple_1to1 0.545 0.570
HP_HR_collect_suggestions 0.342 0.286HP_Constructive_interview_feedback 0.421 0.423
HP_Objective_standard_model 0.316 0.310HP_More_transparency 0.466 0.468
HP_HR_representative_Int 0.311 0.269HP_summary_successful_candidate 0.391 0.312
HM_Resonable_Total_Dur 0.592 0.697HM_Bias_Present 0.522 0.468
HM_Qualfd_Intwr 0.566 0.550HM_Sufficient_PlanPrep 0.547 0.479HM_Prompt_FinalDesn 0.540 0.445
HM_Intrwr_ProvidedwithQuestion 0.556 0.590HM_Intrwr_Prfer_UnstructuredInt 0.531 0.457
HM_Intvwrs_Temprmt_ImpactedDecsn 0.601 0.704HM_Intwrs_take_Hpserious 0.452 0.451
HM_HP_requires_Imp 0.616 0.564HM_Overall_HP_goodinOrg 0.751 0.714
Table A3. Total variance explained with initial eigenvalues (extraction method: principal axis factoring).
Total Variance Explained
FactorInitial Eigenvalues Extraction Sums of
Squared LoadingsRotation Sums ofSquared Loadings
Total % ofVariance
Cumulative% Total % of
VarianceCumulative
% Total % ofVariance
Cumulative%
1 9.781 25.740 25.740 9.435 24.829 24.829 3.910 10.288 10.2882 2.919 7.680 33.420 2.580 6.788 31.617 2.990 7.869 18.1573 2.527 6.650 40.070 2.027 5.334 36.951 2.800 7.369 25.5264 1.949 5.128 45.198 1.450 3.816 40.767 2.075 5.459 30.9865 1.810 4.763 49.961 1.433 3.772 44.539 1.740 4.580 35.5656 1.448 3.810 53.772 1.055 2.776 47.315 1.729 4.550 40.1157 1.353 3.559 57.331 0.914 2.405 49.720 1.615 4.249 44.3658 1.245 3.276 60.607 0.783 2.061 51.781 1.612 4.243 48.6089 1.150 3.025 63.632 0.691 1.818 53.599 1.238 3.258 51.866
10 1.097 2.887 66.519 0.648 1.705 55.304 0.933 2.455 54.32111 1.021 2.686 69.205 0.535 1.409 56.713 0.909 2.392 56.71312 0.937 2.467 71.67213 0.916 2.410 74.08214 0.808 2.126 76.20815 0.775 2.039 78.24716 0.721 1.896 80.14317 0.686 1.806 81.949
Systems 2019, 7, 50 19 of 22
Table A3. Cont.
Total Variance Explained
FactorInitial Eigenvalues Extraction Sums of
Squared LoadingsRotation Sums ofSquared Loadings
Total % ofVariance
Cumulative% Total % of
VarianceCumulative
% Total % ofVariance
Cumulative%
18 0.632 1.664 83.61419 0.618 1.627 85.24120 0.579 1.525 86.76621 0.546 1.438 88.20322 0.485 1.276 89.47923 0.453 1.192 90.67224 0.421 1.107 91.77825 0.377 0.991 92.76926 0.353 0.929 93.69827 0.313 0.824 94.52228 0.289 0.759 95.28129 0.273 0.718 95.99930 0.260 0.684 96.68331 0.231 0.607 97.29032 0.202 0.531 97.82133 0.182 0.479 98.30034 0.162 0.426 98.72635 0.154 0.405 99.13136 0.136 0.359 99.49037 0.115 0.303 99.79438 0.078 0.206 100.000
Table A4. Rotated component matrix (extraction method: principal component analysis; rotationmethod: varimax with Kaiser normalization).
Component
1 2 3 4 5 6 7 8 9 10 11
HS_Int_length_Reasonale 0.824HS_Relvnt_IntQ 0.787
HS_Int_Process_Organised 0.715HS_Prepared_Intrwr 0.691
HS_Equal_Panel_Particp 0.687HS_Appropriate_Int_Method 0.680
HS_Intwr_Quals_Suffcnt 0.542 0.400HM_Intrwr_ProvidedwithQuestion 0.783
HM_Sufficient_PlanPrep 0.699HM_Qualfd_Intwr 0.689
HM_Overall_HP_goodinOrg 0.585 0.464HM_Resonable_Total_Dur 0.551
HM_Prompt_FinalDesn 0.514HS_HighReg_HiringProcess 0.723HS_Hir_Process_Imprv_Req −0.717
HM_HP_requires_Imp −0.602HM_Bias_Present −0.530HS_Gender_Bias 0.861HS_Religion_Bias 0.831HS_Ethnicity_Bias 0.828
HM_Intvwrs_Temprmt_ImpactedDecsn 0.760HM_Intrwr_Prfer_UnstructuredInt 0.653
HS_Intrwr_Temp_Impact 0.527 −0.403HP_ReplacePanel_1to1 0.805
HP_Multiple_1to1 0.759HP_HR_representative_Int 0.699
HP_Objective_standard_model 0.606HP_More_transparency 0.576
HP_Constructive_interview_feedback 0.521HP_summary_successful_candidate
HS_IntFdbk_Provided 0.684HS_Overall_Satisfied 0.468 0.555
HP_Use_Interview_Scoring 0.687HS_Total_hiring_process −0.519
HP_HR_collect_suggestions −0.417 0.441HS_No_Bias −0.756
HS_InternalEmp_Prf_ExtEmp 0.730HM_Intwrs_take_Hpserious 0.535

Systems 2019, 7, 50 20 of 22
Appendix B
Table A5. Qualitative analysis: coding process and list.
# Codes Categories Themes
1 Constructive Feedback Applicant Feedback Enhancing applicant feedback process withenriched information
2 Feedback Utility Applicant Feedback Enhancing applicant feedback process withenriched information
3 Organisational ChangeImpacts
External Association tothe Interview Process Ensuring integrity of the interview selection process
4 Feeling of BeingUnsuccessful
External Association tothe Interview Process
Enhancing applicant feedback process withenriched information
5 Feeling of BeingSuccessful
External Association tothe Interview Process
Enhancing applicant feedback process withenriched information
6 Interviewers Seriousnessof the Process
Hiring MembersInvolvement
Contributory elements towards the overall satisfactionof the interview selection process
7 Participation of PanelMembers
Hiring MembersInvolvement
Contributory elements towards the overall satisfactionof the interview selection process
8 Applicant DatabaseLike Seek
Interview ProcessEnhancements
Contributory elements towards the overall satisfactionof the interview selection process
9 Best Interview: Elements Interview ProcessEnhancements
Contributory elements towards the overall satisfactionof the interview selection process
10
Northern Territorystate’s Feedback ProcessReplication inVictoria state
Interview ProcessEnhancements
Contributory elements towards the overall satisfactionof the interview selection process
11 Practical Improvementsto HP
Interview ProcessEnhancements
Contributory elements towards the overall satisfactionof the interview selection process
12 Request for Feedback Interview ProcessEnhancements
Contributory elements towards the overall satisfactionof the interview selection process
13Share InterviewQuestions PriorInterview
Interview ProcessEnhancements
Contributory elements towards overall satisfaction ofthe interview selection process
14Use of Technology:RecruitmentManagement System
Interview ProcessEnhancements
Contributory elements towards the overall satisfactionof the interview selection process
15 Common SelectionProcess for all TAFEs
Interview ProcessEnhancements
Contributory elements towards the overall satisfactionof the interview selection process
16 Use of Scores and Ranks Interview ProcessEnhancements
Contributory elements towards the overall satisfactionof the interview selection process
17 Shortlisting Strategies forInterview
Interview ProcessEnhancements overall satisfaction of the interview selection process
18 Shortlisting StrategiesAfter Interview
Interview ProcessEnhancements
Contributory elements towards the overall satisfactionof the interview selection process
19 Appropriate InterviewMethod
Interview ProcessProblems Ensuring integrity of the interview selection process
20 Duration of Interview Interview ProcessProblems Ensuring integrity of the interview selection process
21 Interview Planning andPrep Process
Interview ProcessProblems Ensuring integrity of the interview selection process
22 Interview OutcomeConveyed Duration
Interview ProcessProblems Ensuring integrity of the interview selection process
23 Interview Training Interview ProcessProblems Ensuring integrity of the interview selection process
24 Interviewer Qualified Interview ProcessProblems Ensuring integrity of the interview selection process

Systems 2019, 7, 50 21 of 22
Table A5. Cont.
# Codes Categories Themes
25 Organised InterviewProcess
Interview ProcessProblems Ensuring integrity of the interview selection process
26 Relevant InterviewQuestions
Interview ProcessProblems Ensuring integrity of the interview selection process
27 Cert IV implemented Interview ProcessProblems Ensuring integrity of the interview selection process
28 Key Selection Criteria -Enhancement
Interview ProcessProblems Ensuring integrity of the interview selection process
29 Worst Interview:Elements
Interview ProcessProblems Ensuring integrity of the interview selection process
30Interviewer PreferenceBetween Structured andUnstructured Interviews
Interview ProcessProblems Ensuring integrity of the interview selection process
31 Training on How to Usethe Scoring and Ranking
Interview ProcessProblems Ensuring integrity of the interview selection process
32 Hiring DecisionOverridden
Variation of Bias inInterviews Ensuring integrity of the interview selection process
33 Internal EmployeesPreferred
Variation of Bias inInterviews Ensuring integrity of the interview selection process
34 Interviewer Bias Variation of Bias inInterviews Ensuring integrity of the interview selection process
35Underpin Fairness,Equality, andTransparency
Variation of Bias inInterviews Ensuring integrity of the interview selection process
References
1. Ekwoaba, J.O.; Ikeije, U.U.; Ufoma, N. The impact of recruitment and selection criteria on organizationalperformance. Glob. J. Hum. Resour. Manag. 2015, 3, 22–23.
2. Huffcutt, A.I.; Culbertson, S.S. APA Handbook of Industrial and Organizational Psychology, Vol. 2: Selecting andDeveloping Members for the Organization; Zedeck, S., Ed.; American Psychological Association: Washington,DC, USA, 2010; pp. 185–203.
3. Wyatt, D.; Jamieson, R. Improving Recruitment and Selection Decision Processes with an ExpertSystem. In Proceedings of the Second Americas Conference on Information Systems, Phoenix, AZ, USA,16–18 August 1996.
4. Sudheshna, B.; Sudhir, B. Employee Perception and Interview Process in IT Companies. Splint Int. J. Prof.2016, 3, 89–91.
5. Ababneh, K.I.; Al-Waqfi, M.A. The role of privacy invasion and fairness in understanding job applicant reactionsto potentially inappropriate/discriminatory interview questions. Pers. Rev. 2016, 45, 392–418. [CrossRef]
6. Saidi Mehrabad, M.; Brojeny, M.F. The development of an expert system for effective selection and appointmentof the jobs applicants in human resource management. Comput. Ind. Eng. 2007, 53, 306–312. [CrossRef]
7. Ones, D.S.; Viswesvaran, C. Integrity tests and other criterion-focused occupational personality scales (COPS)used in personnel selection. Int. J. Sel. Assess. 2001, 9, 31–39. [CrossRef]
8. Gierlasinski, N.J.; Nixon, D.R. A Comparison of Interviewing Techniques: HR versus Fraud Examination.Oxf. J. Int. J. Bus. Econ. 2014, 5, 1.
9. Robertson, I.T.; Smith, M. Personnel selection. J. Occup. Organ. Psychol. 2001, 74, 441–472. [CrossRef]10. Petrovic, D.; Puharic, M.; Kastratovic, E. Defining of necessary number of employees in airline by using
artificial intelligence tools. Int. Rev. 2018, 3–4, 77–89. [CrossRef]11. Naim, I.; Tanveer, M.I.; Gildea, D.; Hoque, M.E. Automated analysis and prediction of job interview
performance. IEEE Trans. Affect. Comput. 2016, 9, 191–204. [CrossRef]12. Khosla, R.; Chu, M.-T.; Yamada, K.G.; Kuneida, K.; Oga, S. Innovative embodiment of job interview in
emotionally aware communication robot. In Proceedings of the 2011 International Joint Conference onNeural Networks, San Jose, CA, USA, 31 July–5 August 2011; pp. 1546–1552.

Systems 2019, 7, 50 22 of 22
13. Tsai, W.C.; Chen, F.H.; Chen, H.-Y.; Tseng, K.-Y. When Will Interviewers Be Willing to Use High-structuredJob Interviews? The role of personality. Int. J. Sel. Assess. 2016, 24, 92–105. [CrossRef]
14. Levashina, J.; Hartwell, C.; Morgeson, F.; Campion, M.A. The structured employment interview: Narrativeand quantitative review of the research literature. Pers. Psychol. 2014, 67, 241–293. [CrossRef]
15. Huffcutt, A.I.; Arthur, W., Jr. Hunter and Hunter (1984) revisited: Interview validity for entry-level jobs.J. Appl. Psychol. 1994, 79, 184–190. [CrossRef]
16. Dana, J.; Dawes, R.; Peterson, N. Belief in the unstructured interview: The persistence of an illusion.Judgm. Decis. Mak. 2013, 8, 512.
17. Law, P.K.; Yuen, D.C. An empirical examination of hiring decisions of experienced auditors in publicaccounting: Evidence from Hong Kong. Manag. Audit. J. 2011, 26, 760–777. [CrossRef]
18. Rozario, S.D.; Venkatraman, S.; Abbas, A. Challenges in Recruitment and Selection Process: An EmpiricalStudy. Challenges 2019, 10, 35. [CrossRef]
19. Peccei, R.; Van de Voorde, K. The application of the multilevel paradigm in human resource management–outcomesresearch: Taking stock and going forward. J. Manag. 2019, 45, 786–818. [CrossRef]
20. Schmidt, J.A.; Pohler, D.M. Making stronger causal inferences: Accounting for selection bias in associationsbetween high performance work systems, leadership, and employee and customer satisfaction. J. Appl. Psychol.2018, 103, 1001. [CrossRef]
21. Jiang, K.; Messersmith, J. On the shoulders of giants: A meta-review of strategic human resource management.Int. J. Hum. Resour. Manag. 2018, 29, 6–33. [CrossRef]
22. Boon, C.; den Hartog, D.N.; Lepak, D.P. A systematic review of human resource management systems andtheir measurement. J. Manag. 2019. [CrossRef]
23. Sackett, P.R.; Lievens, F. Personnel selection. Annu. Rev. Psychol. 2008, 59, 419–450. [CrossRef]24. Ployhart, R.; Harold, C. The Applicant Attribution-Reaction Theory (AART): An Integrative Theory of
Applicant Attributional Processing. Int. J. Sel. Assess. 2004, 12, 84–98. [CrossRef]25. Lederman, N.G.; Lederman, J.S. What Is a Theoretical Framework? A Practical Answer. J. Sci. Teach. Educ.
2015, 26, 593–597. [CrossRef]26. Saunders, M. Research Methods for Business Students, 6th ed.; Lewis, P., Thornhill, A., Eds.; Pearson Education:
Harlow, UK, 2012.27. Bell, E.; Bryman, A.; Harley, B. Business Research Methods; Oxford University Press: Oxford, UK, 2018.28. Saunders, M. Research Methods for Business Students, 7th ed.; Lewis, P., Thornhill, A., Eds.; Pearson Education:
Harlow, UK, 2016.29. DeCoster, J. Overview of Factor Analysis. 1998. Available online: www.stat-help.com/notes.html (accessed
on 23 May 2019).30. Williams, B.; Onsman, A.; Brown, T. Exploratory factor analysis: A five-step guide for novices. Australas. J.
Paramed. 2010, 8, 3. [CrossRef]31. Conway, J.M.; Huffcutt, A.I. A review and evaluation of exploratory factor analysis practices in organizational
research. Organ. Res. Methods 2003, 6, 147–168. [CrossRef]32. Chamorro-Premuzic, T. Psychology of Personnel Selection; Furnham, A., Ed.; Cambridge University Press:
Cambridge, UK, 2010.33. Bradley-Adams, K. Face to face with success: Keith Bradley-Adams offers advice on how to behave in interviews
and how to answer tricky questions. (Career Development) (Brief article). Nurs. Stand. 2011, 25, 63.34. Entwistle, F. How to prepare for your first job interview. Nurs. Times 2013, 109, 14–15.35. Emett, S.; Wood, D.A. Tactics: Common questions-evasion: Identify ploys and learn methods to get the
specific answers you need. J. Account. 2010, 210, 36.36. Macan, T. The employment interview: A review of current studies and directions for future research.
Hum. Resour. Manag. Rev. 2009, 19, 203–218. [CrossRef]37. Miller, V.D.; Gordon, M.E. Meeting the Challenge of Human Resource Management: A Communication Perspective;
Routledge: New York, NY, USA, 2014.38. Cook, M.; Cripps, B. Psychological Assessment in the Workplace; John Wiley & Sons Ltd.: West Sussex, UK, 2005.
© 2019 by the authors. Licensee MDPI, Basel, Switzerland. This article is an open accessarticle distributed under the terms and conditions of the Creative Commons Attribution(CC BY) license (http://creativecommons.org/licenses/by/4.0/).