dollar industries ltd
TRANSCRIPT

Dollar Industries Ltd
Wear the Stock

2 | P a g e ( 1 3 t h O c t 2 0 2 1 )
TABLE OF CONTENTS
Summary 3
Valuation & Peer Comparison 4
Financial Analysis and Projections 8
Key Growth Drivers 9
Industry set to grow 9
Revamp of Brand Identity 11
Constructing Integrated Warehouse Unit 11
Implementation of Project Lakshya 11
Investment in Digitization 12
Transitioning from promoter to professional led company 12
Strong Network of Manufacturing facilities and branches 12
Doubling Capacity of Spinning Unit 12
Balance Sheet Strength 14
Key Management Persons 15
Business Quality Score 16
Annual Report Takeaways 17
Key Concall Takeaways – Abridged Summary 21
Quarterly Financials 22
Financial Statement Analysis & Projections 23
Disclaimer 24
3 | P a g e ( 1 3 t h O c t 2 0 2 1 )
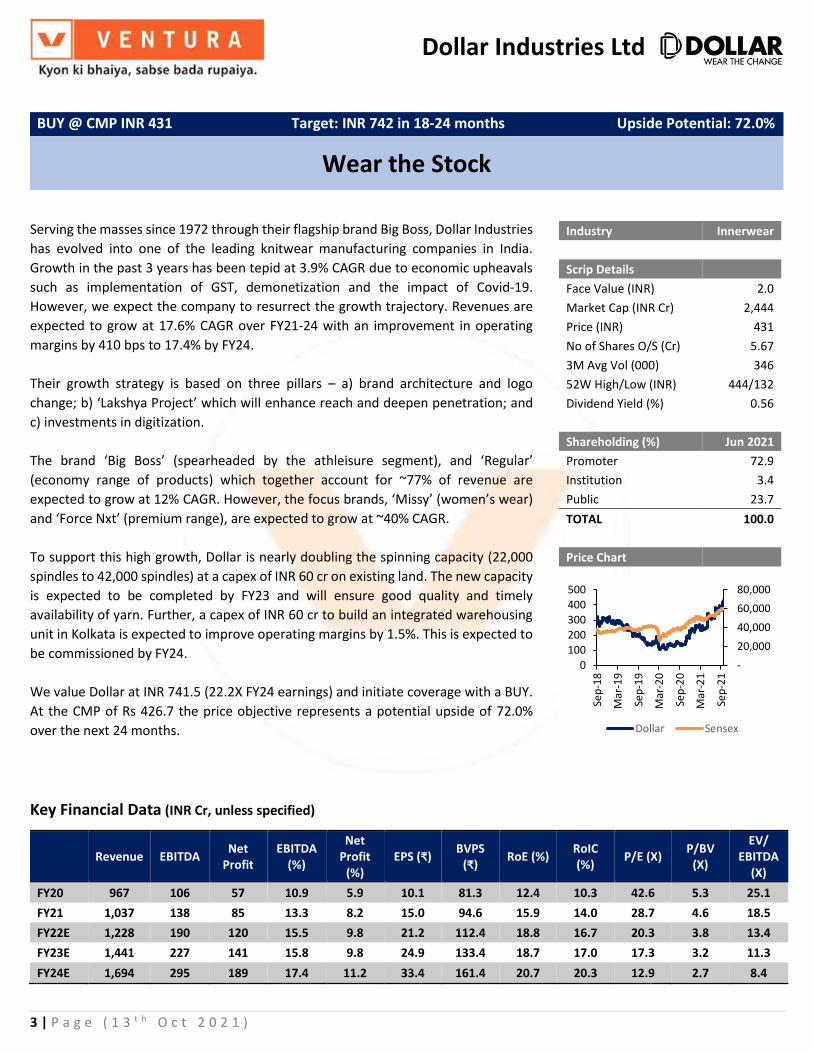
Serving the masses since 1972 through their flagship brand Big Boss, Dollar Industries
has evolved into one of the leading knitwear manufacturing companies in India.
Growth in the past 3 years has been tepid at 3.9% CAGR due to economic upheavals
such as implementation of GST, demonetization and the impact of Covid-19.
However, we expect the company to resurrect the growth trajectory. Revenues are
expected to grow at 17.6% CAGR over FY21-24 with an improvement in operating
margins by 410 bps to 17.4% by FY24.
Their growth strategy is based on three pillars – a) brand architecture and logo
change; b) ‘Lakshya Project’ which will enhance reach and deepen penetration; and
c) investments in digitization.
The brand ‘Big Boss’ (spearheaded by the athleisure segment), and ‘Regular’
(economy range of products) which together account for ~77% of revenue are
expected to grow at 12% CAGR. However, the focus brands, ‘Missy’ (women’s wear)
and ‘Force Nxt’ (premium range), are expected to grow at ~40% CAGR.
To support this high growth, Dollar is nearly doubling the spinning capacity (22,000
spindles to 42,000 spindles) at a capex of INR 60 cr on existing land. The new capacity
is expected to be completed by FY23 and will ensure good quality and timely
availability of yarn. Further, a capex of INR 60 cr to build an integrated warehousing
unit in Kolkata is expected to improve operating margins by 1.5%. This is expected to
be commissioned by FY24.
We value Dollar at INR 741.5 (22.2X FY24 earnings) and initiate coverage with a BUY.
At the CMP of Rs 426.7 the price objective represents a potential upside of 72.0%
over the next 24 months.
Key Financial Data (INR Cr, unless specified)
Revenue EBITDA Net
Profit EBITDA
(%)
Net Profit
(%) EPS (₹)
BVPS (₹)
RoE (%) RoIC (%)
P/E (X) P/BV
(X)
EV/ EBITDA
(X) FY20 967 106 57 10.9 5.9 10.1 81.3 12.4 10.3 42.6 5.3 25.1
FY21 1,037 138 85 13.3 8.2 15.0 94.6 15.9 14.0 28.7 4.6 18.5
FY22E 1,228 190 120 15.5 9.8 21.2 112.4 18.8 16.7 20.3 3.8 13.4
FY23E 1,441 227 141 15.8 9.8 24.9 133.4 18.7 17.0 17.3 3.2 11.3
FY24E 1,694 295 189 17.4 11.2 33.4 161.4 20.7 20.3 12.9 2.7 8.4
BUY @ CMP INR 431 Target: INR 742 in 18-24 months Upside Potential: 72.0%
Wear the Stock
Industry Innerwear
Scrip Details
Face Value (INR) 2.0
Market Cap (INR Cr) 2,444
Price (INR) 431
No of Shares O/S (Cr) 5.67
3M Avg Vol (000) 346
52W High/Low (INR) 444/132
Dividend Yield (%) 0.56
Shareholding (%) Jun 2021
Promoter 72.9
Institution 3.4
Public 23.7
TOTAL 100.0
Price Chart
-
20,000
40,000
60,000
80,000
0
100
200
300
400
500Se
p-1
8
Mar
-19
Sep
-19
Mar
-20
Sep
-20
Mar
-21
Sep
-21
Dollar Sensex
Dollar Industries Ltd
Packaging Ltd
4 | P a g e ( 1 3 t h O c t 2 0 2 1 )
Source: Ventura Research
0
50
100
150
200
250
300
350
400
450
Ap
r-1
9
Jun
-19
Au
g-1
9
Oct
-19
Dec
-19
Feb
-20
Ap
r-2
0
Jun
-20
Au
g-2
0
Oct
-20
Dec
-20
Feb
-21
Ap
r-2
1
Jun
-21
Au
g-2
1
Oct
-21
1 year forward P/E band chart
Adj Price 8.8x 12.3x
15.8x 19.3x 22.8x
0
5
10
15
20
25
30
35
Jun
-18
Dec
-18
Jun
-19
Dec
-19
Jun
-20
Dec
-20
Jun
-21
Dollar P/E Trend
-2 Std Dev Average -1 Std Dev
+2 Std Dev -1 Std Dev P/E
-100%
-50%
0%
50%
100%
150%
Sep
-18
Dec
-18
Mar
-19
Jun
-19
Sep
-19
Dec
-19
Mar
-20
Jun
-20
Sep
-20
Dec
-20
Mar
-21
Jun
-21
Sep
-21
Price Performance of Dollar, Lux and Sensex
Dollar Lux Sensex
0
0.2
0.4
0.6
0.8
1
1.2
Sep-18 Mar-19 Sep-19 Mar-20 Sep-20 Mar-21 Sep-21
P/E Valuation of Dollar to Lux
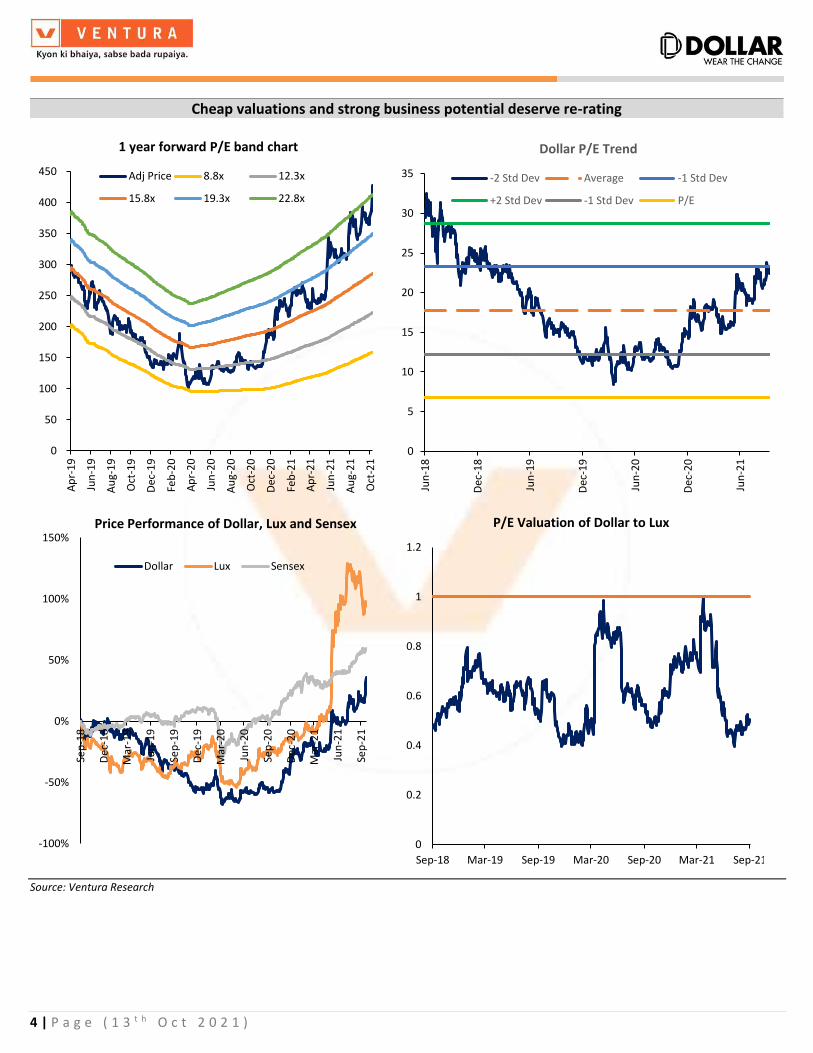
Cheap valuations and strong business potential deserve re-rating

5 | P a g e ( 1 3 t h O c t 2 0 2 1 )
Our Bull and Bear Case Scenarios
We have prepared a Bull and Bear case scenario based on FY24 P/E ratios
• Bull Case: We have assumed a 20% CAGR in revenue with margins rising to 18%.
Assigning a P/E of 22.7X in FY24 will result in a Bull Case price target of INR 786.3 per
share (upside of 82.4% from CMP)
• Bear Case: We have assumed a 12% CAGR in revenue and margins falling to 12%.
Assigning a P/E of 12.2X in FY24 will result in a Bear Case price target of INR 260 per
share (downside of 39.6% from CMP)
Bull & Bear Case Scenario
Source: Ventura Research
Bull Case Price
INR 786 per share
Target Price
INR 741 per share
Bear Case Price
INR 260 per share
Current Price
INR 431 per share
PE of 22.7X
PE of 12.2X

Valuation and Comparable Metric of Domestic and Global Innerwear Companies
Source: Company Reports, Bloomberg & Ventura Research
Figures as mentioned
Company Name Mkt Cap PricePEG
2021-242021 2022 2023 2024 2021 2022 2023 2024 2021 2022 2023 2024 2021 2022 2023 2024 2021 2022 2023 2024 2021 2022 2023 2024 2021 2022 2023 2024 2021 2022 2023 2024
Domestic Peers (Fig in INR Cr)
Dollar 2,445 431.1 0.4 28.7 20.3 17.3 12.9 18.5 13.4 11.3 8.4 4.6 3.8 3.2 2.7 15.9 18.8 18.7 20.7 14.0 16.7 17.0 20.3 1,037 1,228 1,441 1,694 13.3 15.5 15.8 17.4 8.2 9.8 9.8 11.2
Lux 12,013 3,995 2.0 51.1 38.3 32.8 32.4 36.0 26.3 22.6 21.6 11.9 10.7 9.0 9.0 23.4 27.8 27.5 27.8 31.5 33.6 32.5 32.1 1,690 2,277 2,629 3,039 19.5 19.8 20.0 18.3 13.9 13.8 14.0 12.2
Rupa 3,915 492 1.2 15.4 20.5 17.5 15.5 15.4 14.2 12.3 11.1 5.4 4.5 3.9 3.1 24.0 22.2 22.1 20.0 23.6 21.8 21.3 19.8 1,313 1,520 1,738 1,946 19.6 18.3 18.6 18.5 13.4 12.6 12.9 13.0
Page 36,873 33,058 2.0 108.3 78.8 65.2 53.0 69.4 53.8 41.3 36.0 41.7 35.9 30.2 26.4 38.5 45.5 46.3 49.8 60.3 63.5 67.9 76.1 2,833 3,393 4,129 4,701 18.6 20.1 21.4 21.5 12.0 13.8 13.7 14.8
VIP 7,049 499 - (72.3) 115.9 40.5 30.8 (108.1) 47.5 22.1 17.9 13.6 12.1 10.1 8.2 (18.9) 10.5 25.0 26.5 (22.4) 14.0 36.1 42.9 619 1,107 1,690 1,961 (10.7) 13.2 18.4 19.8 (15.8) 5.5 10.3 11.7
Global Peers (Fig in USD mn)
HanesBrands Inc 6,739 19.3 1.1 11.0 10.2 9.4 8.7 9.4 8.5 7.7 7.0 7.1 5.1 3.9 2.8 64.6 49.8 41.3 31.8 23.1 23.9 25.1 20.1 6,805 7,160 7,609 7,748 15.2 15.6 15.7 16.5 9.0 9.2 9.4 10.0
Naked Brand Group 55,358 426.4 1.2 94.0 56.9 47.6 40.2 45.9 34.4 28.7 23.5 21.7 18.1 14.1 11.4 23.1 31.8 29.7 28.3 37.3 81.7 81.6 81.6 4,402 6,271 7,306 8,343 27.2 25.0 25.5 27.0 13.4 15.5 15.9 16.5
PVH 7,829 110.2 - (6.9) 12.9 11.8 10.5 (43.8) 7.3 6.6 5.8 1.7 1.5 1.6 1.2 (24.1) 11.8 13.2 11.8 (12.6) 13.8 16.7 15.8 7,133 9,108 9,549 9,976 (3.7) 13.1 13.0 13.4 (15.9) 6.7 7.0 7.5
Gap Inc 9,102 24.2 - (13.7) 10.9 9.5 7.9 21.0 4.6 3.9 3.4 3.5 3.1 2.5 2.1 (25.3) 28.3 26.1 27.1 (10.9) 53.5 52.1 48.7 13,800 17,829 18,255 18,904 5.0 10.6 11.5 12.6 (4.8) 4.7 5.3 6.1
Marks & Spencer 4,971 2.5 - (19.2) 12.5 11.0 10.0 12.9 5.9 5.3 5.4 1.6 1.5 1.5 1.4 (8.2) 12.1 13.3 14.0 (0.5) 10.0 11.9 11.5 11,991 14,184 14,504 14,844 6.3 10.8 10.9 10.8 (2.2) 2.8 3.1 3.3
Under Armour 9,332 21.4 1.1 36.0 30.7 23.7 21.5 17.1 13.9 11.1 9.8 5.2 4.5 3.9 3.3 14.5 14.6 16.4 15.3 27.7 34.9 41.6 37.6 5,519 5,826 6,167 6,578 9.4 10.7 12.2 12.9 4.7 5.2 6.4 6.6
Hugo Boss 4,101 58.3 0.1 3.5 2.3 2.0 2.0 8.1 6.0 5.5 5.9 3.9 3.4 3.0 2.4 10.3 15.5 17.0 17.6 13.1 19.7 22.6 18.9 3,027 3,409 3,717 4,147 18.6 21.7 21.4 19.8 3.5 5.5 6.3 7.2
H&M 33,647 20.3 0.8 28.5 19.0 16.8 16.7 7.8 6.6 6.1 6.1 4.8 4.4 4.1 3.8 17.6 24.7 26.2 24.1 21.4 33.4 36.7 35.1 23,565 25,964 26,875 27,981 18.5 19.2 20.0 19.5 5.0 6.9 7.5 7.2
EBITDA Margin (%) Net Margin (%)P/E (X) EV/EBITDA (X) P/BV (X) RoE (%) RoIC (%) Sales

Source: Ventura Research & Bloomberg
Dollar
Lux
Rupa
Page
VIP
Hanesbrands
Naked Brand Group
PVH GapMarks & Spencer
Under Armour
Hugo Boss
H&M
0.0
5.0
10.0
15.0
20.0
25.0
30.0
35.0
40.0
0.0 10.0 20.0 30.0 40.0 50.0 60.0
FY2
4 E
V/E
BIT
DA
FY24 ROE
Dollar
Lux
Rupa
Page
VIP
Hanesbrands
Naked Brand Group
PVHGap
Marks & Spencer
Under Armour
Hugo Boss
H&M
-10
0
10
20
30
40
50
60
8.0 13.0 18.0 23.0 28.0
FY2
4 R
eve
nu
e C
AG
R
FY24 EBITDA Margin
Dollar at attractive valuations

8 | P a g e ( 1 3 t h O c t 2 0 2 1 )
Financial Analysis and Projections
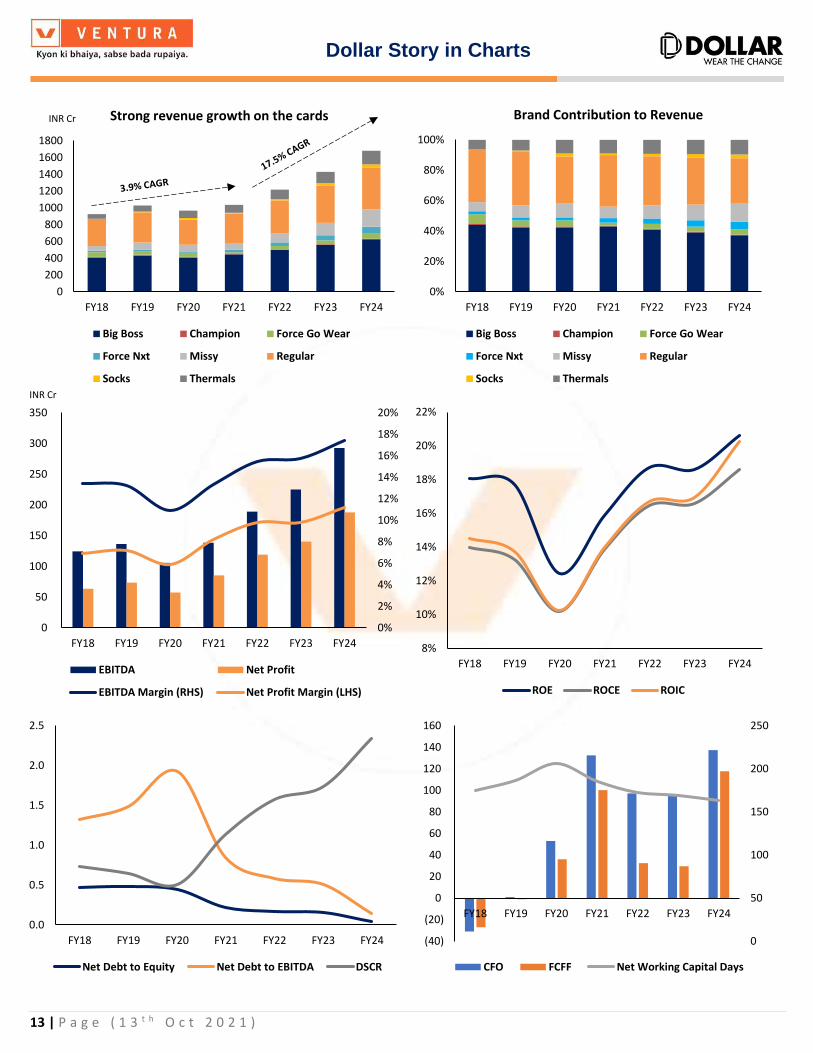
With greater reach and range in the market through the implementation of Project Lakshya,
we expect Dollar’s revenue/EBITDA/PAT to grow at a CAGR of 17.8%/28.7%/30.5% to INR 1,694
cr/ INR 295 cr / INR 189 cr respectively over FY21-24E.
• We expect Big Boss (43% of revenue) and Regular (34% of revenue) to grow at 12%
CAGR to INR 626 cr and INR 213 cr by FY24 respectively.
• Force Nxt (3% of revenue) and Missy (8% of revenue) are expected to grow at a faster
pace of 40% each year to INR 85 cr and INR 213 cr respectively.
• Champion (1% of revenue) is forecasted to grow at 34.3% to INR 13 cr and
• Force Go Wear (2% of revenue) at 40.6% CAGR to INR 58 cr.
• Socks (1% of revenue) is forecasted to grow at 59.1% CAGR to INR 42 cr and
• Thermals (9% of revenue) to have 20.0% CAGR over the same period to INR 161 cr.
Rationalization of costs and commissioning of the integrated warehousing unit in Kolkata is
expected to improve EBITDA margin by 410bps to 17.4%. Adoption of the new tax regime is
expected to improve net profit margin by 300bps to 11.2%, over the same period.
Subsequently, RoE and RoIC are expected to improve to 20.7% (+480bps) and 20.3% (+630bps),
respectively, by FY24. Enhanced visibility of profitability and cash generation should enable
Dollar to maintain dividend payouts at +16% which is in line with historical trends.
Financial Summary
Source: Company Reports & Ventura Research
Fig in INR Cr (unless specified) FY18 FY19 FY20 FY21 FY22E FY23E FY24E FY25E FY26E FY27E FY28E FY29E FY30E FY31E
Revenue 925.6 1,028.8 967.1 1,037.0 1,227.7 1,440.9 1,693.7 1,994.7 2,343.6 2,759.3 3,238.6 3,765.3 4,342.3 4,985.0
YoY Growth (%) - 11.2 -6.0 7.2 18.4 17.4 17.5 17.8 17.5 17.7 17.4 16.3 15.3 14.8
Raw Material Cost 405.9 433.5 448.5 445.3 509.5 598.0 685.9 807.8 949.2 1,117.5 1,311.6 1,524.9 1,758.6 2,018.9
Employee Cost 26.4 30.3 42.1 44.6 49.1 54.0 60.5 67.8 75.9 85.0 95.2 106.6 119.4 133.8
Other Expenses 368.8 428.6 370.9 408.7 478.8 561.9 652.1 768.0 902.3 1,062.3 1,246.9 1,449.6 1,671.8 1,919.2
EBITDA 124.4 136.4 105.7 138.4 190.3 227.0 295.2 351.1 416.3 494.4 584.9 684.1 792.5 913.1
YoY Growth (%) - 14.5 -12.9 14.1 356.5 390.6 471.2 100.6 997.2 128.6 128.6 122.3 117.7 112.7
Margin (%) 13.4 13.3 10.9 13.3 15.5 15.8 17.4 17.6 17.8 17.9 18.1 18.2 18.2 18.3
Net Profit 63.6 73.6 57.3 85.3 120.2 141.5 189.5 232.3 275.8 327.8 386.6 449.0 515.6 581.5
YoY Growth (%) - 15.7 -22.1 48.8 40.8 17.7 33.9 22.6 18.7 18.9 17.9 16.2 14.8 12.8
Margin (%) 6.9 7.2 5.9 8.2 9.8 9.8 11.2 11.6 11.8 11.9 11.9 11.9 11.9 11.7
Shareholder's Fund 352.4 415.7 460.8 536.8 637.7 756.5 915.7 1,110.8 1,342.4 1,617.7 1,942.4 2,319.6 2,752.8 3,241.2
Return on Equity (%) 18.1 17.7 12.4 15.9 18.8 18.7 20.7 20.9 20.5 20.3 19.9 19.4 18.7 17.9
Capital Employed 536.5 639.0 670.8 660.8 759.7 888.2 1,042.1 1,200.8 1,412.4 1,677.7 1,992.4 2,359.6 2,772.8 3,251.2
Return on Capital Employed (%) 14.0 13.3 10.2 13.8 16.6 16.7 18.7 19.3 19.4 19.3 19.0 18.5 17.9 17.1
Invested Capital 516.9 617.5 664.6 653.5 752.0 873.3 961.4 1103.0 1269.9 1470.7 1698.8 1932.7 2188.8 2483.7
Return on Invested Capital 14.5 13.8 10.3 14.0 16.7 17.0 20.3 21.1 21.6 22.0 22.3 22.6 22.7 22.4
Cash Flow from Operations -31.1 0.8 52.9 132.4 93.8 94.8 137.8 137.0 166.9 197.7 240.2 304.0 370.4 451.0
Cash Flow from Investing -10.8 -15.8 -25.1 -21.9 -65.0 -67.0 -32.0 -39.0 -53.0 -65.0 -80.0 -85.0 -110.0 -162.0
Cash Flow from Financing 51.2 16.4 -42.6 -109.4 -28.5 -20.5 -40.0 -81.9 -69.2 -69.1 -76.6 -85.7 -107.4 -105.4
Net Cash Flow 9.4 1.4 -14.8 1.1 0.3 7.3 65.8 16.1 44.7 63.6 83.6 133.3 153.0 183.6
NOPLAT 74.6 83.3 66.0 89.5 124.0 146.1 193.2 230.3 272.0 321.6 376.9 435.2 494.8 553.3
Free Cash Flow -27.1 -1.2 36.0 100.1 29.4 29.9 118.4 111.6 136.3 163.0 206.5 279.8 345.8 407.3
9 | P a g e ( 1 3 t h O c t 2 0 2 1 )
Key Growth Drivers
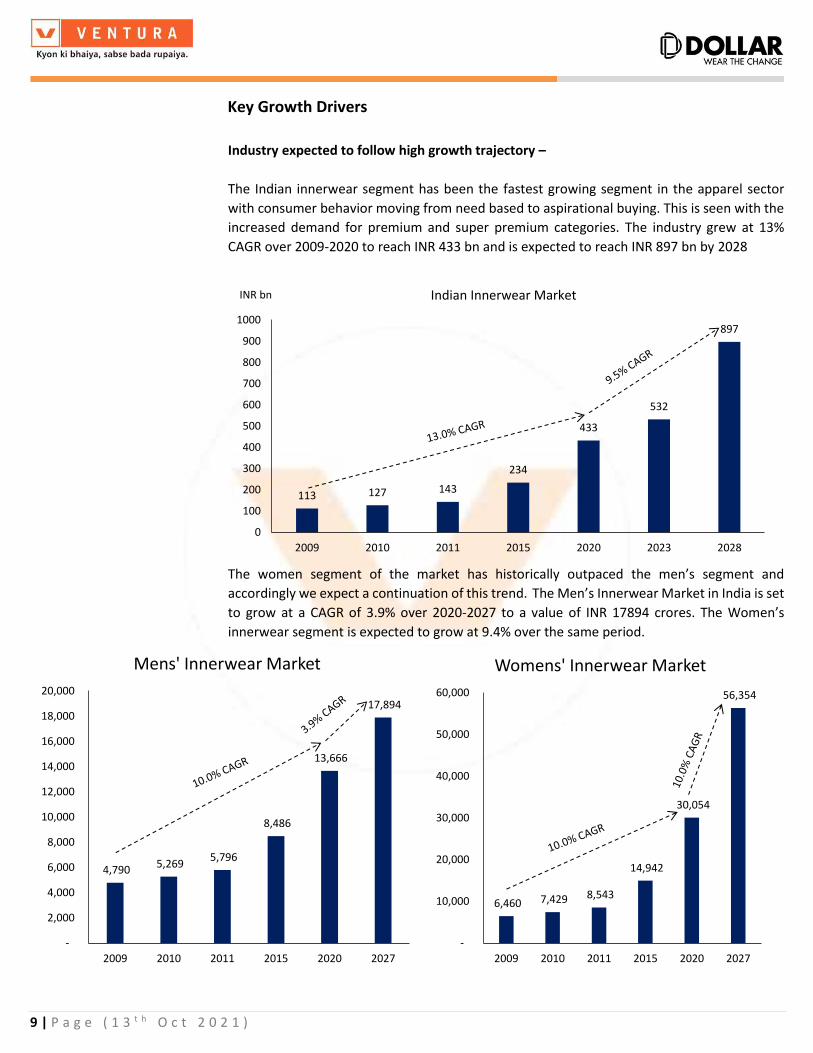
Industry expected to follow high growth trajectory –
The Indian innerwear segment has been the fastest growing segment in the apparel sector
with consumer behavior moving from need based to aspirational buying. This is seen with the
increased demand for premium and super premium categories. The industry grew at 13%
CAGR over 2009-2020 to reach INR 433 bn and is expected to reach INR 897 bn by 2028
The women segment of the market has historically outpaced the men’s segment and
accordingly we expect a continuation of this trend. The Men’s Innerwear Market in India is set
to grow at a CAGR of 3.9% over 2020-2027 to a value of INR 17894 crores. The Women’s
innerwear segment is expected to grow at 9.4% over the same period.
113 127 143
234
433
532
897
0
100
200
300
400
500
600
700
800
900
1000
2009 2010 2011 2015 2020 2023 2028
Indian Innerwear MarketINR bn
4,790 5,269
5,796
8,486
13,666
17,894
-
2,000
4,000
6,000
8,000
10,000
12,000
14,000
16,000
18,000
20,000
2009 2010 2011 2015 2020 2027
Mens' Innerwear Market
6,460 7,429 8,543
14,942
30,054
56,354
-
10,000
20,000
30,000
40,000
50,000
60,000
2009 2010 2011 2015 2020 2027
Womens' Innerwear Market

10 | P a g e ( 1 3 t h O c t 2 0 2 1 )
Peer Analysis of End User Segment for Innerwear
Dollar Page Lux Rupa & Co VIP Clothing All Users
Super Premium
Jockey FCUK
Premium Force Go Wear,
Ultra Jockey, Speedo Fruit of the Loom
Mid Premium
Cozi, Inferno
Torrido, Bumchums,
Footline, Thermocot
Economy Cott's Wool Jon
Men Super
Premium Jockey
FCUK
Premium Force Go Wear,
Forece Nxt, Ultra Jockey, Speedo
Lux Premium, Onn, One8
Macroman M Series, Fruit of the
Loom Frenchie
Mid Premium
BigBoss GenX, CoziGlo
Frontline, Euro, Macroman, Torrido,
Bumchums, Footline,
Thermocot
VIP
Economy Lehar Venus Jon Leader
Women Super
Premium Jockey FCUK
Premium Force Go Wear,
Ultra, Missy Jockey, Speedo
Macrowoman W Series, Fruit of the
Loom
Mid Premium
Lyra, Touch Softline, Femmora
Economy Lehar Jon
Kids Super
Premium
Jockey
FCUK
Premium Force Go Wear,
Ultra Jockey, Speedo
Fruit of the Loom
Mid Premium
BigBoss,
Champion
Torrido, Bumchums,
Footline, Thermocot
Economy Leader Jon Source: Ventura Research

11 | P a g e ( 1 3 t h O c t 2 0 2 1 )
Revamp of brand identity with new logo
In 2020, Dollar redesigned their logo to highlight the mnemonic “D” for Dollar, Dynamism and
Determinations with a fresh vision to ‘Wear the Change’. This was their way of creating a more
youth friendly image along with improved brand architecture.
Constructing an integrated warehousing unit
The company currently has 4-5 individual units in Kolkata which they are planning to integrate
into a single unit in the next 2 years at a cost of INR 60 cr. This is expected to improve supply
chain efficiencies and will result in an increase in EBITDA margins by ~ 1.5% thereon.
Implementation of ‘Project Lakshya‘
This is a project to increase the reach and range of Dollar Industries in the market. The
company is replacing the push model by the auto replenishment model which will over time
increase the return on investment for the distributors which in turn will reduce the company’s
receivable days. The Working Capital Cycle is expected to come down by 22 days to 163 days
in FY24. This project is expected to be completed by FY24.
Project Lakshya - Coverage % (Mapped vs Estimated)
2,35,073
1,28,559
32,578
-
50,000
1,00,000
1,50,000
2,00,000
2,50,000
Estimated Outlets Mapped Outlets Enrolled Outlets
Substantial head room for growth from low hanging fruit of enhancing reach
18%
47% 48%
77%70%
43%
19%
0%
10%
20%
30%
40%
50%
60%
70%
80%
90%

12 | P a g e ( 1 3 t h O c t 2 0 2 1 )
Investment in Digitization –
Dollar has continued to invest in digitalization to ensure seamless engagements with all
customers and enhanced operational efficiency. Auto replenishment system (ARS) and
Distributor management system (DMS) are being implemented for the Lakshya distributors
whereas ARS at a supply chain level is still a work in progress. Automated tele-calling solutions,
digital communications and online task allocation have also been implemented and are helping
enhance productivity, brand recall and operational efficiency.
Transitioning from a promoter led company to a professional led company –
Dollar recognizes the value of hiring skilled professionals to sustain growth over the long term.
While this will no doubt be a gradual shift, the transition is in play since the past 2 years.
Strong network of manufacturing facilities and Branches –
The company has 4 manufacturing facilities located in Ludhiana, Delhi, Kolkata and Tirupur
with 14 branches across the country. They also have a strong network outside India as shown
below for exports which accounted for ~6% of revenue in FY21.
Doubling Capacity of Spinning unit –
The company produces yarn which is sufficient for 25% of its total needs. The balance 75% is
outsourced which may sometimes lead to a delay in procurement. To combat this, they plan
to spend INR 60 cr to increase capacity of their spinning unit from 22,000 spindles to 42,000
spindles by FY23. This is going to be done in the same unit hence no cost is going to be incurred
for acquiring land. The entire cost would be towards construction of the shed and purchase of
machinery.
13 | P a g e ( 1 3 t h O c t 2 0 2 1 )
0
200
400
600
800
1000
1200
1400
1600
1800
FY18 FY19 FY20 FY21 FY22 FY23 FY24
Strong revenue growth on the cards
Big Boss Champion Force Go Wear
Force Nxt Missy Regular
Socks Thermals
0%
20%
40%
60%
80%
100%
FY18 FY19 FY20 FY21 FY22 FY23 FY24
Brand Contribution to Revenue
Big Boss Champion Force Go Wear
Force Nxt Missy Regular
Socks Thermals
0%
2%
4%
6%
8%
10%
12%
14%
16%
18%
20%
0
50
100
150
200
250
300
350
FY18 FY19 FY20 FY21 FY22 FY23 FY24
EBITDA Net Profit
EBITDA Margin (RHS) Net Profit Margin (LHS)
8%
10%
12%
14%
16%
18%
20%
22%
FY18 FY19 FY20 FY21 FY22 FY23 FY24
ROE ROCE ROIC
0.0
0.5
1.0
1.5
2.0
2.5
FY18 FY19 FY20 FY21 FY22 FY23 FY24
Net Debt to Equity Net Debt to EBITDA DSCR
0
50
100
150
200
250
(40)
(20)
0
20
40
60
80
100
120
140
160
FY18 FY19 FY20 FY21 FY22 FY23 FY24
CFO FCFF Net Working Capital Days
Dollar Story in Charts
INR Cr
INR Cr

14 | P a g e ( 1 3 t h O c t 2 0 2 1 )
Balance sheet strength
Dollar, compared to peers, has very low leverage. The company has negligible long-term debt
of ~INR 2 cr and INR 120 cr in short term borrowings. With the implementation of channel
financing, the company aims to be debt free by FY24. However, since this is work in progress,
we have not modeled the same and it remains an upside risk to our forecast of net debt to
equity of 0.05X and net debt to EBITDA of 0.15X by FY24.
Healthy balance sheet compared to any other player across the globe
Source: Company Reports & Bloomberg
Dollar
LuxRupa
Page
VIP
HanesBrands Inc
Naked Brand Group
PVH
Gap Inc
Marks & Spencer
Under Armour
Hugo BossH&M
-15.0
-10.0
-5.0
0.0
5.0
10.0
-0.5 0.0 0.5 1.0 1.5 2.0 2.5 3.0 3.5
Ne
t D
eb
t to
EB
ITD
A
Net Debt to Equity
15 | P a g e ( 1 3 t h O c t 2 0 2 1 )
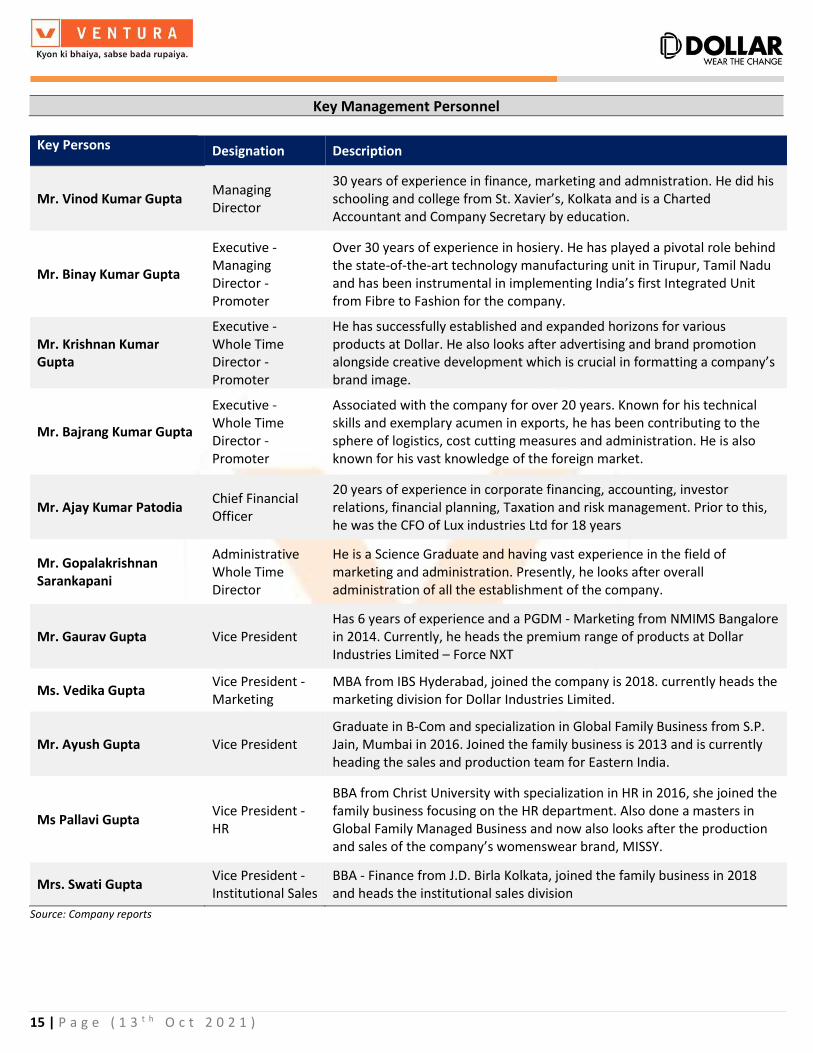
Key Management Personnel
Key Persons Designation Description
Mr. Vinod Kumar Gupta Managing Director
30 years of experience in finance, marketing and admnistration. He did his schooling and college from St. Xavier’s, Kolkata and is a Charted Accountant and Company Secretary by education.
Mr. Binay Kumar Gupta
Executive - Managing Director - Promoter
Over 30 years of experience in hosiery. He has played a pivotal role behind the state-of-the-art technology manufacturing unit in Tirupur, Tamil Nadu and has been instrumental in implementing India’s first Integrated Unit from Fibre to Fashion for the company.
Mr. Krishnan Kumar Gupta
Executive - Whole Time Director - Promoter
He has successfully established and expanded horizons for various products at Dollar. He also looks after advertising and brand promotion alongside creative development which is crucial in formatting a company’s brand image.
Mr. Bajrang Kumar Gupta
Executive - Whole Time Director - Promoter
Associated with the company for over 20 years. Known for his technical skills and exemplary acumen in exports, he has been contributing to the sphere of logistics, cost cutting measures and administration. He is also known for his vast knowledge of the foreign market.
Mr. Ajay Kumar Patodia Chief Financial Officer
20 years of experience in corporate financing, accounting, investor relations, financial planning, Taxation and risk management. Prior to this, he was the CFO of Lux industries Ltd for 18 years
Mr. Gopalakrishnan Sarankapani
Administrative Whole Time Director
He is a Science Graduate and having vast experience in the field of marketing and administration. Presently, he looks after overall administration of all the establishment of the company.
Mr. Gaurav Gupta Vice President Has 6 years of experience and a PGDM - Marketing from NMIMS Bangalore in 2014. Currently, he heads the premium range of products at Dollar Industries Limited – Force NXT
Ms. Vedika Gupta Vice President - Marketing
MBA from IBS Hyderabad, joined the company is 2018. currently heads the marketing division for Dollar Industries Limited.
Mr. Ayush Gupta Vice President Graduate in B-Com and specialization in Global Family Business from S.P. Jain, Mumbai in 2016. Joined the family business is 2013 and is currently heading the sales and production team for Eastern India.
Ms Pallavi Gupta Vice President - HR
BBA from Christ University with specialization in HR in 2016, she joined the family business focusing on the HR department. Also done a masters in Global Family Managed Business and now also looks after the production and sales of the company’s womenswear brand, MISSY.
Mrs. Swati Gupta Vice President - Institutional Sales
BBA - Finance from J.D. Birla Kolkata, joined the family business in 2018 and heads the institutional sales division
Source: Company reports
16 | P a g e ( 1 3 t h O c t 2 0 2 1 )
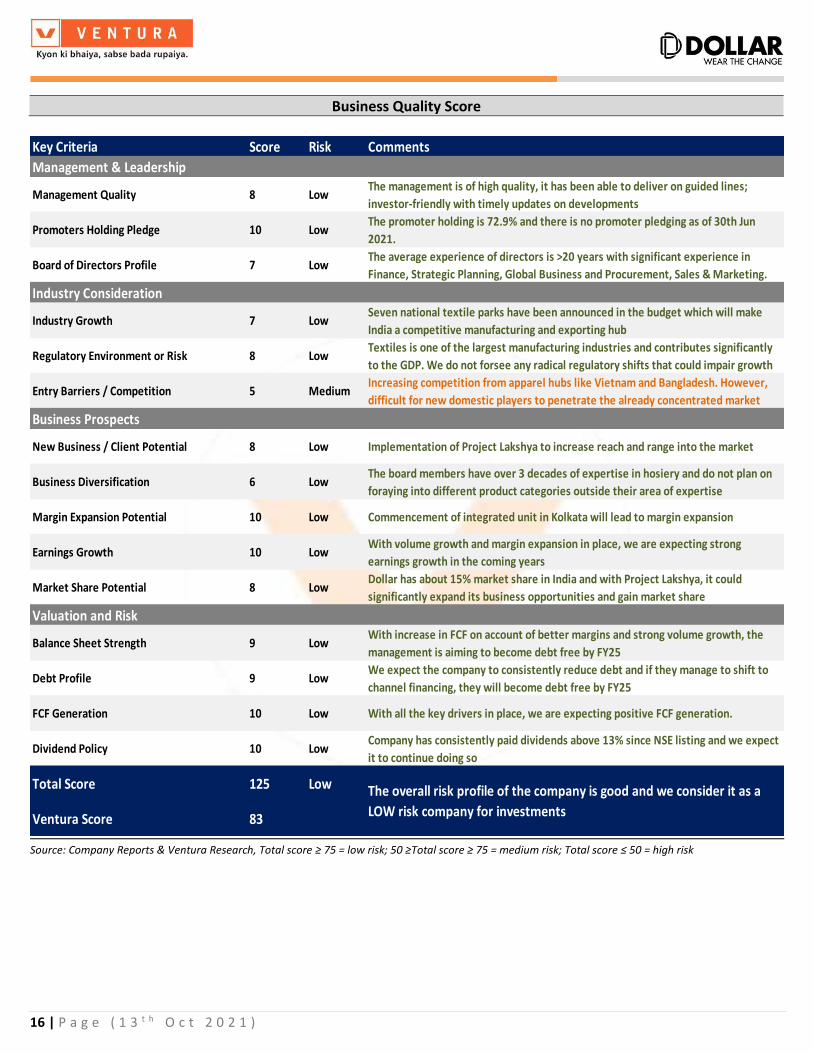
Business Quality Score
Source: Company Reports & Ventura Research, Total score ≥ 75 = low risk; 50 ≥Total score ≥ 75 = medium risk; Total score ≤ 50 = high risk
Key Criteria Score Risk Comments
Management & Leadership
Management Quality 8 LowThe management is of high quality, it has been able to deliver on guided lines;
investor-friendly with timely updates on developments
Promoters Holding Pledge 10 LowThe promoter holding is 72.9% and there is no promoter pledging as of 30th Jun
2021.
Board of Directors Profile 7 LowThe average experience of directors is >20 years with significant experience in
Finance, Strategic Planning, Global Business and Procurement, Sales & Marketing.
Industry Consideration
Industry Growth 7 LowSeven national textile parks have been announced in the budget which will make
India a competitive manufacturing and exporting hub
Regulatory Environment or Risk 8 LowTextiles is one of the largest manufacturing industries and contributes significantly
to the GDP. We do not forsee any radical regulatory shifts that could impair growth
Entry Barriers / Competition 5 MediumIncreasing competition from apparel hubs like Vietnam and Bangladesh. However,
difficult for new domestic players to penetrate the already concentrated market
Business Prospects
New Business / Client Potential 8 Low Implementation of Project Lakshya to increase reach and range into the market
Business Diversification 6 LowThe board members have over 3 decades of expertise in hosiery and do not plan on
foraying into different product categories outside their area of expertise
Margin Expansion Potential 10 Low Commencement of integrated unit in Kolkata will lead to margin expansion
Earnings Growth 10 LowWith volume growth and margin expansion in place, we are expecting strong
earnings growth in the coming years
Market Share Potential 8 LowDollar has about 15% market share in India and with Project Lakshya, it could
significantly expand its business opportunities and gain market share
Valuation and Risk
Balance Sheet Strength 9 LowWith increase in FCF on account of better margins and strong volume growth, the
management is aiming to become debt free by FY25
Debt Profile 9 LowWe expect the company to consistently reduce debt and if they manage to shift to
channel financing, they will become debt free by FY25
FCF Generation 10 Low With all the key drivers in place, we are expecting positive FCF generation.
Dividend Policy 10 LowCompany has consistently paid dividends above 13% since NSE listing and we expect
it to continue doing so
Total Score 125 Low
Ventura Score 83
The overall risk profile of the company is good and we consider it as a
LOW risk company for investments

17 | P a g e ( 1 3 t h O c t 2 0 2 1 )
Annual Report Takeaways
Dollar Industries overhauled their brand architecture. In FY21 they changed their logo and
decided to prefix every existing product brand of the company with the word ‘Dollar’.
To enhance efficiency, they have revamped their distribution network through the
implementation of Project ‘Lakshya’. Instead of routing all products through distributors
before delivering to the retail outlets, the company is now focusing on bridging this gap and
marketing products directly to the retailers thereby replacing the traditional push model with
the pull model. This will strengthen capital efficiency at the retail level because the retailers
will now have the flexibility to buy products on a per-piece basis. This has resulted in increased
stock at the retail level and enabled Dollar to widen and deepen their footprint.

18 | P a g e ( 1 3 t h O c t 2 0 2 1 )
The company plans on launching EBO’s and foraying into the brassiere segment. They are also
in the process of finishing the construction of an integrated warehouse in West Bengal which
will improve inventory management. The revamped brand architecture has helped gain
significant traction providing them the impetus to widen their distribution network.
They have continued to invest in digitization to ensure seamless engagements with all
customers and enhanced operational efficiency. Their digital interventions include Automated
Tele-calling, Auto Replenishment System, Distribution Management System, Digital
Communication and Online Task Allocation.
Keeping in mind the significant advantages of utilizing solar power, Dollar has embarked on
increasing the capacity of their solar plant from 4MW to 5MW. This is expected to be
completed by FY22.
Details on Board of Director and KMPs
Company Reports & Ventura Research
Board of Directors & KMP FY17 FY18 FY19 FY20 FY21
Vinod Kumar Gupta
Binay Kumar Gupta
Din Dayal Gupta
Krishan Kumar Gupta
Bajrang Kumar Gupta
Gopalakrishnan Sarankapani
Sanjay Jhunjhunwalla
Pawan Kumar Agarwal
Ashok Kumar Goel ID
Vinay Kumar Agarwal ID
Rakesh Gopikishan Biyani
Binay Kumar Agarwal
Sunil Mitra
Rajesh Kumar Bubna
Divyaa Newatia
Deepshikha Rakesh Agarwal
Anil Kumar Saboo
Srikumar Bandyopadhyay
Shahi Agarwal
Ankit Gupta
MD - Managing Director ID - Independent Director
NED - Non Executive Director CFO - Chief Financial Officer
VP - Vice President SVP - Senior Vice President
WTD - Whole Time Director GM - General Manager
GM SVP
VP CFO
ID
ID
ID
ID
ID
NED
ID
ID
ID
ID
MD
Chairman
WTD
WTD
WTD
MD
19 | P a g e ( 1 3 t h O c t 2 0 2 1 )
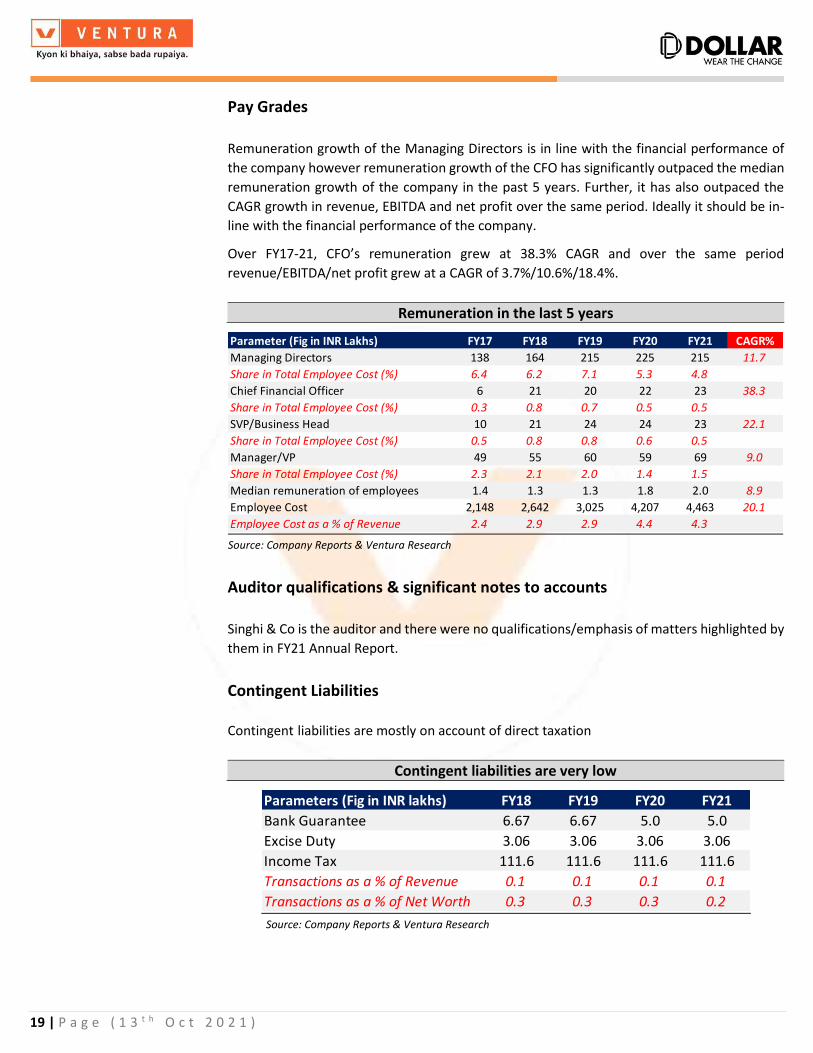
Pay Grades Remuneration growth of the Managing Directors is in line with the financial performance of
the company however remuneration growth of the CFO has significantly outpaced the median
remuneration growth of the company in the past 5 years. Further, it has also outpaced the
CAGR growth in revenue, EBITDA and net profit over the same period. Ideally it should be in-
line with the financial performance of the company.
Over FY17-21, CFO’s remuneration grew at 38.3% CAGR and over the same period
revenue/EBITDA/net profit grew at a CAGR of 3.7%/10.6%/18.4%.
Remuneration in the last 5 years
Source: Company Reports & Ventura Research
Auditor qualifications & significant notes to accounts Singhi & Co is the auditor and there were no qualifications/emphasis of matters highlighted by
them in FY21 Annual Report.
Contingent Liabilities
Contingent liabilities are mostly on account of direct taxation
Contingent liabilities are very low
Source: Company Reports & Ventura Research
Parameter (Fig in INR Lakhs) FY17 FY18 FY19 FY20 FY21 CAGR%
Managing Directors 138 164 215 225 215 11.7
Share in Total Employee Cost (%) 6.4 6.2 7.1 5.3 4.8
Chief Financial Officer 6 21 20 22 23 38.3
Share in Total Employee Cost (%) 0.3 0.8 0.7 0.5 0.5
SVP/Business Head 10 21 24 24 23 22.1
Share in Total Employee Cost (%) 0.5 0.8 0.8 0.6 0.5
Manager/VP 49 55 60 59 69 9.0
Share in Total Employee Cost (%) 2.3 2.1 2.0 1.4 1.5
Median remuneration of employees 1.4 1.3 1.3 1.8 2.0 8.9
Employee Cost 2,148 2,642 3,025 4,207 4,463 20.1
Employee Cost as a % of Revenue 2.4 2.9 2.9 4.4 4.3
Parameters (Fig in INR lakhs) FY18 FY19 FY20 FY21
Bank Guarantee 6.67 6.67 5.0 5.0
Excise Duty 3.06 3.06 3.06 3.06
Income Tax 111.6 111.6 111.6 111.6
Transactions as a % of Revenue 0.1 0.1 0.1 0.1
Transactions as a % of Net Worth 0.3 0.3 0.3 0.2
20 | P a g e ( 1 3 t h O c t 2 0 2 1 )
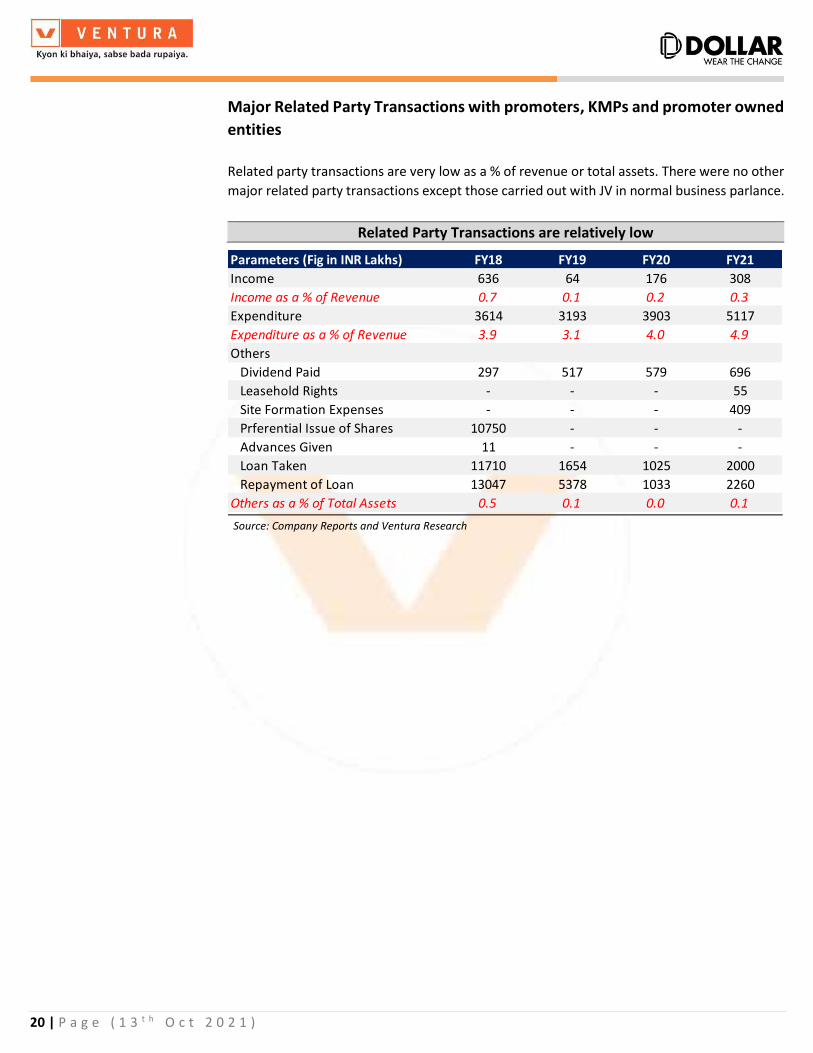
Major Related Party Transactions with promoters, KMPs and promoter owned
entities Related party transactions are very low as a % of revenue or total assets. There were no other
major related party transactions except those carried out with JV in normal business parlance.
Related Party Transactions are relatively low
Source: Company Reports and Ventura Research
Parameters (Fig in INR Lakhs) FY18 FY19 FY20 FY21
Income 636 64 176 308
Income as a % of Revenue 0.7 0.1 0.2 0.3
Expenditure 3614 3193 3903 5117
Expenditure as a % of Revenue 3.9 3.1 4.0 4.9
Others
Dividend Paid 297 517 579 696
Leasehold Rights - - - 55
Site Formation Expenses - - - 409
Prferential Issue of Shares 10750 - - -
Advances Given 11 - - -
Loan Taken 11710 1654 1025 2000
Repayment of Loan 13047 5378 1033 2260
Others as a % of Total Assets 0.5 0.1 0.0 0.1

21 | P a g e ( 1 3 t h O c t 2 0 2 1 )
Key Concall Takeaways – Abridged Summary
Q2FY21 – Dollar in Q1 had launched the anti viral range of products which during Q2 was well
accepted. The newly introduced athliesure range grew to 11% of the product category mix.
The company had already invested in windmill energy but in continuation of the effort to get
greener and cleaner power, the company also commissioned a 4MW solar plant in Tamil Nadu
with a capacity to generate 75 lakh power unit annually. The total investment in this solar plant
was approximately INR 18 cr and was funded through internal accruals.
Q3FY21 – In spite of increase in cotton prices, the company had been able to maintain
profitability margins by increasing the prices of the finished products. The JV company was
working on launching e-commerce, B2B, and channel expansion. The revenue for the JV stood
at INR 4.63 cr as compared to INR 4.15 cr in Q3FY20. The loss from it was INR 1.23 cr with
Dollar’s share in the loss being INR 61 lakhs.
Q4FY21 - Dollar experienced degrowth in certain categories like socks and leggings where
demand was muted due to the pandemic situation. The company spent INR 79 cr for
advertising in FY21 out of which INR 50 cr was spent towards branding and overhauling its
brand architecture. From this, INR 19 cr was spent in the quarter in the form of dealer boards
and in shop branding. The JV company is working on expanding the distribution network pan
India. In the entire year FY21, revenue of the JV company stood at INR 17 cr, a growth of 5%.
The loss from it stood at INR 3.8 cr as compared to INR 4.5 cr in FY20 with Dollar’s share of loss
being INR 2 cr in FY21
Q1FY22 - The company announced a capex of INR 90 cr in Q1FY22 to be invested for expansion
of the spinning division, socks manufacturing unit and increasing production capacity at
Kolkata and Tirupur. The company is also in the process of setting up a fully autommated,
digitized integrated plant of 3.2 lakh sqft in West Bengal. Sales through e-commerce grew 98%
YoY in Q1FY22. The JV with Pepe Jeans, reported revenue of INR 1.29 cr in Q1FY22 as compared
to INR 1.39 cr in Q1FY21. The loss from the JV stood at INR 1.14 cr with Dollar’s share of loss
being INR 57 lakhs as compared to INR 25 lakhs in Q1FY21.

22 | P a g e ( 1 3 t h O c t 2 0 2 1 )
Quarterly and Annual Performance
Source: Company Reports & Ventura Research
Figures are in INR Cr FY19 Q1FY20 Q2FY20 Q3FY20 Q4FY20 FY20 Q1FY21 Q2FY21 Q3FY21 Q4FY21 FY21 Q1FY22 FY22E FY23E FY24E
Net Sales 1,029 234 243 255 238 967 160 258 312 308 1,037 205 1,228 1,441 1,694
YoY Growth (%) 11.2 0.0 0.0 0.0 0.0 -6.0 -31.5 6.2 22.4 29.7 7.2 27.9 18.4 17.4 17.5
Raw Material Cost 434 96 121 114 118 448 72 101 140 132 445 77 510 598 686
YoY Growth (%) 6.8 0.0 0.0 0.0 0.0 3.4 -24.8 -16.2 22.9 12.0 -0.7 7.2 14.4 17.4 14.7
Employee Cost 30 10 10 10 12 42 8 11 12 14 45 13 49 54 61
YoY Growth (%) 14.5 0.0 0.0 0.0 0.0 39.1 -16.7 35.8 10.2 14.3 6.1 59.9 10.0 10.0 12.0
Other Expenses 429 101 89 97 87 371 51 111 117 132 409 79 479 562 652
YoY Growth (%) 16.2 0.0 0.0 0.0 0.0 -13.5 -49.4 24.9 19.9 51.3 10.2 54.7 17.2 17.4 16.0
EBITDA 136 27 23 33 21 106 29 35 43 31 138 35 190 227 295
EBITDA Margin (%) 13.3 11.5 9.6 13.1 8.8 10.9 17.9 13.6 13.8 10.1 13.3 17.3 15.5 15.8 17.4
YoY Growth (%) 9.7 0.0 0.0 0.0 0.0 -22.5 6.3 50.8 29.6 48.3 31.0 23.3 37.5 19.3 30.1
Depreciation 11 3 4 4 4 14 3 3 4 5 15 4 22 29 34
EBIT 125 24 20 30 17 91 25 32 39 26 123 32 168 198 261
EBIT Margin (%) 12.2 10.2 8.1 11.7 7.3 9.5 15.8 12.3 12.6 8.5 11.9 15.4 13.7 13.7 15.4
YoY Growth (%) 11.7 0.0 0.0 0.0 0.0 -27.0 6.5 61.4 32.7 51.8 34.4 24.4 36.9 17.6 31.8
Interest 16 4 4 4 4 16 3 2 2 1 9 1 9 10 9
Other Income 2 0 1 1 3 5 0 1 1 2 3 1 4 3 4
Exceptional Income / Expenses 0 0 0 0 0 0 0 0 0 0 0 0 0 0 0
Profit Before Tax 111 20 16 27 17 80 22 30 38 27 117 31 163 192 256
PBT Margin (%) 10.8 8.5 6.7 10.4 7.1 8.3 13.8 11.6 12.3 8.8 11.3 15.2 13.3 13.3 15.1
YoY Growth (%) 15.9 0.0 0.0 0.0 0.0 -28.1 10.5 82.7 43.8 60.8 47.0 40.8 39.1 17.5 33.4
Tax Rate (%) 32.2 35.4 16.5 26.4 20.9 25.5 25.4 25.3 25.8 25.8 25.6 25.6 25.2 25.2 25.2
Profit After Tax 75 13 14 20 13 59 16 22 28 20 87 23 122 143 191
PAT Margin (%) 7.3 5.5 5.6 7.7 5.6 6.1 10.3 8.7 9.1 6.5 8.4 11.3 9.9 10.0 11.3
YoY Growth (%) 17.5 0.0 0.0 0.0 0.0 -21.0 27.7 63.6 44.9 50.9 46.8 40.4 445.9 405.5 852.8
Minority Int -1.6 0.1 -0.4 -0.8 -1.1 -2.1 -0.4 -0.6 -0.8 -0.6 -2.0 -0.6 -2.0 -2.0 -2.0
Net Profit 73.6 13.0 13.3 18.8 12.2 57.3 16.1 21.8 27.6 19.5 85.3 22.5 120.2 141.5 189.5
Net Profit Margin 7.2 5.6 5.5 7.4 5.1 5.9 10.1 8.4 8.9 6.3 8.2 11.0 9.8 9.8 11.2
YoY Growth (%) 15.7 0.0 0.0 0.0 0.0 -22.1 23.8 63.5 46.8 60.3 48.8 39.9 40.8 17.7 33.9
Adjusted EPS 13.0 2.3 2.3 3.3 2.1 10.1 2.8 3.8 4.9 3.4 15.0 4.0 21.2 24.9 33.4
Shareholder's Funds 416 431 461 490 537 638 757 916
BV per share 73.3 76.0 81.3 86.4 94.6 112.4 133.4 161.4
Net Debt 202 199 204 121 117 114 117 46
Net Debt to Equity 0.5 0.5 0.4 0.2 0.2 0.2 0.2 0.0
Net Debt to EBITDA 1.5 1.6 1.9 1.0 0.8 0.6 0.5 0.2
Capex -12.8 -5.8 -22.4 -4.3 -22.7 -60.0 -60.0 -20.0
RoE(%) 17.7 15.8 12.4 14.0 15.9 18.8 18.7 20.7
ROIC 13.8 13.0 10.3 3.9 14.0 16.7 17.0 20.3
P/E 33.2 35.8 42.6 35.5 28.7 20.3 17.3 12.9
P/B 5.9 5.7 5.3 5.0 4.6 3.8 3.2 2.7
EV/EBITDA 19.4 21.8 25.1 21.7 18.5 13.4 11.3 8.4

23 | P a g e ( 1 3 t h O c t 2 0 2 1 )
Financial Analysis & Projections
Source: Company Reports & Ventura Research
Figures in Rs Cr FY20 FY21 FY22E FY23E FY24E Figures in Rs Cr FY20 FY21 FY22E FY23E FY24E
Income Statement Per Share Data & Yields
Net Revenue 967.1 1,037.0 1,227.7 1,440.9 1,693.7 Adjusted EPS 10.1 15.0 21.2 24.9 33.4
YoY Growth (%) -6.0 7.2 18.4 17.4 17.5 Adjusted CEPS 12.6 17.8 25.1 30.1 39.5
Raw Material Cost 448.5 445.3 509.5 598.0 685.9 Adjusted BVPS 81.3 94.6 112.4 133.4 161.4
YoY Growth (%) 3.4 -0.7 14.4 17.4 14.7 CFO per share 9.2 23.3 16.5 16.7 24.3
Gross Profit 518.6 591.7 718.2 842.9 1,007.7 CFO Yield 0.4 1.0 0.7 0.7 1.0
YoY Growth (%) -12.9 14.1 21.4 17.4 19.6 FCF per share 6.8 18.1 5.5 5.6 21.2
Margin (%) 53.6 57.1 58.5 58.5 59.5 FCF Yield 0.3 0.7 0.2 0.2 0.9
Operating Cost 413.0 453.3 527.9 616.0 712.6
YoY Growth (%) -10.0 9.8 16.5 16.7 15.7 Solvency Ratio (X)
EBITDA 105.7 138.4 190.3 227.0 295.2 Total Debt to Equity 0.5 0.2 0.2 0.2 0.1
YoY Growth (%) -22.5 31.0 37.5 19.3 30.1 Net Debt to Equity 0.4 0.2 0.2 0.2 0.0
Margin (%) 10.9 13.3 15.5 15.8 17.4 Net Debt to EBITDA 1.9 0.8 0.6 0.5 0.2
Depreciation & Amortization 14.2 15.5 22.0 29.1 34.4 Interest Coverage Ratio 5.6 13.5 19.0 20.6 27.8
EBIT 91.5 122.9 168.3 197.9 260.8 Debt Service Coverage Ratio 0.5 1.1 1.6 1.7 2.4
YoY Growth (%) -27.0 34.4 36.9 17.6 31.8
Margin (%) 9.5 11.9 13.7 13.7 15.4 Working Capital Ratios
Other Income 4.7 3.5 3.7 3.4 4.4 Payable Days 45 49 49 49 49
Finance Cost 16.4 9.1 8.8 9.6 9.4 Receivable Days 136 116 112 110 105
PBT 79.8 117.3 163.2 191.7 255.8 Inventory Days 115 118 110 108 107
YoY Growth (%) -28.1 47.0 39.1 17.5 33.4 Net Working Capital Days 206 185 173 169 163
Margin (%) 8.3 11.3 13.3 13.3 15.1
Tax 20.3 30.0 41.1 48.3 64.4 Return Ratios (%)
Tax Rate (%) 25.5 25.6 25.2 25.2 25.2 Return on Equity 12.4 15.9 18.8 18.7 20.7
PAT 59.5 87.3 122.1 143.5 191.4 Return on Capital Employed 10.2 13.8 16.6 16.7 18.7
YoY Growth (%) -21.0 46.8 39.9 17.5 33.4 Return on Invested Capital 10.3 14.0 16.7 17.0 20.3
Margin (%) 6.1 8.4 9.9 10.0 11.3
Minority Interest -2.1 -2.0 -2.0 -2.0 -2.0 Valuation (X)
Net Profit 57.3 85.3 120.2 141.5 189.5 P/E 42.6 28.7 20.3 17.3 12.9
YoY Growth (%) -22.1 48.8 40.8 17.7 33.9 P/BV 5.3 4.6 3.8 3.2 2.7
Margin (%) 5.9 8.2 9.8 9.8 11.2 EV/EBITDA 25.1 18.5 13.4 11.3 8.4
EV/Sales 2.7 2.5 2.1 1.8 1.5
Balance Sheet
Share Capital 11.3 11.3 11.3 11.3 11.3 Cash Flow Statement
Total Reserves 449.5 525.4 626.3 745.2 904.3 Profit Before Tax 77.7 115.3 163.2 191.7 255.8
Shareholders' Fund 460.8 536.8 637.7 756.5 915.7 Add: Depreciation 14.2 15.5 22.0 29.1 34.4
Long Term Borrowings 3.3 2.3 2.0 1.7 1.4 Add: Finance Cost 16.4 9.1 8.8 9.6 9.4
Long Term Lease Liabilities 2.6 2.1 2.0 4.0 6.0 Change in other assets & liabilities -9.9 4.2 -2.5 -2.1 -8.1
Net Deferred Tax Liabilities -1.3 -1.1 -1.0 -1.0 -1.0 Change in working capital -21.8 17.9 -56.6 -85.2 -89.2
Long Term Provisions 4.0 5.2 5.7 6.8 7.9 Less: Tax Paid -24.6 -30.0 -41.1 -48.3 -64.4
Total Liabilities 469.4 545.2 646.4 768.0 930.0 Cash Flow from Operations 52.0 131.9 93.8 94.8 137.8
Gross Block 118.0 139.5 199.5 259.5 279.5 Net Capital Expenditure -22.4 -22.7 -60.0 -60.0 -20.0
Less: Accumulated Depreciation 49.1 60.6 77.2 98.8 122.1 Change in other investments -2.7 0.8 -5.0 -7.0 -12.0
Net Block 68.9 78.8 122.2 160.6 157.4 Cash Flow from Investing -25.1 -21.9 -65.0 -67.0 -32.0
Capital WIP 14.1 14.7 10.0 5.0 5.0 Change in Short Term Borrowings -2.7 -85.4 0.4 10.0 -5.0
Right Of Use Assets 5.4 6.4 6.0 5.6 6.5 Proceeds from Long Term Borrowings 0.0 0.4 0.0 0.0 0.0
Intangible Assets 0.0 0.0 0.0 0.0 0.0 Repayment in Long Term Borrowings -10.7 -1.4 -0.3 -0.3 -0.3
Investment in JV 5.9 3.9 3.9 3.9 3.9 Change in Lease Liability -2.5 -4.2 -0.5 2.0 5.0
Other Financial Assets 2.6 2.2 2.6 3.7 4.9 Proceeds from Issue of Share Capital 0.0 0.0 0.0 0.0 0.0
Non Current Tax Assets 4.6 4.6 5.5 6.4 7.5 Dividend Paid -11.6 -9.6 -19.2 -22.6 -30.3
Non Current Investments 0.6 0.6 0.7 0.9 1.0 Less: Finance Cost -15.1 -9.1 -8.8 -9.6 -9.4
Long Term Loans & Advances 0.7 0.8 0.9 1.1 1.3 Cash Flow from Financing -42.6 -109.4 -28.5 -20.5 -40.0
Other Non Current Assets 0.6 1.5 1.7 2.0 2.4 Net Cash Flow -14.8 1.1 0.3 7.3 65.8
Net Current Assets 366.0 431.7 492.7 578.7 740.0 Opening Balance of Cash 20.7 5.9 7.0 7.3 14.6
Total Assets 469.4 545.2 646.4 768.0 930.0 Closing Balance of Cash 5.9 7.0 7.3 14.6 80.4

24 | P a g e ( 1 3 t h O c t 2 0 2 1 )
Disclosures and Disclaimer
Ventura Securities Limited (VSL) is a SEBI registered intermediary offering broking, depository and portfolio management services to clients. VSL is member of BSE, NSE
and MCX-SX. VSL is a depository participant of NSDL. VSL states that no disciplinary action whatsoever has been taken by SEBI against it in last five years except
administrative warning issued in connection with technical and venial lapses observed while inspection of books of accounts and records. Ventura Commodities Limited,
Ventura Guaranty Limited, Ventura Insurance Brokers Limited and Ventura Allied Services Private Limited are associates of VSL. Research Analyst (RA) involved in the
preparation of this research report and VSL disclose that neither RA nor VSL nor its associates (i) have any financial interest in the company which is the subject matter
of this research report (ii) holds ownership of one percent or more in the securities of subject company (iii) have any material conflict of interest at the time of
publication of this research report (iv) have received any compensation from the subject company in the past twelve months (v) have managed or co-managed public
offering of securities for the subject company in past twelve months (vi) have received any compensation for investment banking merchant banking or brokerage
services from the subject company in the past twelve months (vii) have received any compensation for product or services from the subject company in the past twelve
months (viii) have received any compensation or other benefits from the subject company or third party in connection with the research report. RA involved in the
preparation of this research report discloses that he / she has not served as an officer, director or employee of the subject company. RA involved in the preparation of
this research report and VSL discloses that they have not been engaged in the market making activity for the subject company. Our sales people, dealers, traders and
other professionals may provide oral or written market commentary or trading strategies to our clients that reflect opinions that are contrary to the opinions expressed
herein. We may have earlier issued or may issue in future reports on the companies covered herein with recommendations/ information inconsistent or different those
made in this report. In reviewing this document, you should be aware that any or all of the foregoing, among other things, may give rise to or potential conflicts of
interest. We may rely on information barriers, such as "Chinese Walls" to control the flow of information contained in one or more areas within us, or other areas, units,
groups or affiliates of VSL. This report is for information purposes only and this document/material should not be construed as an offer to sell or the solicitation of an
offer to buy, purchase or subscribe to any securities, and neither this document nor anything contained herein shall form the basis of or be relied upon in connection
with any contract or commitment whatsoever. This document does not solicit any action based on the material contained herein. It is for the general information of the
clients / prospective clients of VSL. VSL will not treat recipients as clients by virtue of their receiving this report. It does not constitute a personal recommendation or
take into account the particular investment objectives, financial situations, or needs of clients / prospective clients. Similarly, this document does not have regard to
the specific investment objectives, financial situation/circumstances and the particular needs of any specific person who may receive this document. The securities
discussed in this report may not be suitable for all investors. The appropriateness of a particular investment or strategy will depend on an investor's individual
circumstances and objectives. Persons who may receive this document should consider and independently evaluate whether it is suitable for his/ her/their particular
circumstances and, if necessary, seek professional/financial advice. And such person shall be responsible for conducting his/her/their own investigation and analysis of
the information contained or referred to in this document and of evaluating the merits and risks involved in the securities forming the subject matter of this document.
The projections and forecasts described in this report were based upon a number of estimates and assumptions and are inherently subject to significant uncertainties
and contingencies. Projections and forecasts are necessarily speculative in nature, and it can be expected that one or more of the estimates on which the projections
and forecasts were based will not materialize or will vary significantly from actual results, and such variances will likely increase over time. All projections and forecasts
described in this report have been prepared solely by the authors of this report independently of the Company. These projections and forecasts were not prepared with
a view toward compliance with published guidelines or generally accepted accounting principles. No independent accountants have expressed an opinion or any other
form of assurance on these projections or forecasts. You should not regard the inclusion of the projections and forecasts described herein as a representation or
warranty by VSL, its associates, the authors of this report or any other person that these projections or forecasts or their underlying assumptions will be achieved. For
these reasons, you should only consider the projections and forecasts described in this report after carefully evaluating all of the information in this report, including
the assumptions underlying such projections and forecasts. The price and value of the investments referred to in this document/material and the income from them
may go down as well as up, and investors may realize losses on any investments. Past performance is not a guide for future performance. Future returns are not
guaranteed and a loss of original capital may occur. Actual results may differ materially from those set forth in projections. Forward-looking statements are not
predictions and may be subject to change without notice. We do not provide tax advice to our clients, and all investors are strongly advised to consult regarding any
potential investment. VSL, the RA involved in the preparation of this research report and its associates accept no liabilities for any loss or damage of any kind arising out
of the use of this report. This report/document has been prepared by VSL, based upon information available to the public and sources, believed to be reliable. No
representation or warranty, express or implied is made that it is accurate or complete. VSL has reviewed the report and, in so far as it includes current or historical
information, it is believed to be reliable, although its accuracy and completeness cannot be guaranteed. The opinions expressed in this document/material are subject
to change without notice and have no obligation to tell you when opinions or information in this report change. This report or recommendations or information
contained herein do/does not constitute or purport to constitute investment advice in publicly accessible media and should not be reproduced, transmitted or published
by the recipient. The report is for the use and consumption of the recipient only. This publication may not be distributed to the public used by the public media without
the express written consent of VSL. This report or any portion hereof may not be printed, sold or distributed without the written consent of VSL. This document does
not constitute an offer or invitation to subscribe for or purchase or deal in any securities and neither this document nor anything contained herein shall form the basis
of any contract or commitment whatsoever. This document is strictly confidential and is being furnished to you solely for your information, may not be distributed to
the press or other media and may not be reproduced or redistributed to any other person. The opinions and projections expressed herein are entirely those of the
author and are given as part of the normal research activity of VSL and are given as of this date and are subject to change without notice. Any opinion estimate or
projection herein constitutes a view as of the date of this report and there can be no assurance that future results or events will be consistent with any such opinions,
estimate or projection. This document has not been prepared by or in conjunction with or on behalf of or at the instigation of, or by arrangement with the company or
any of its directors or any other person. Information in this document must not be relied upon as having been authorized or approved by the company or its directors
or any other person. Any opinions and projections contained herein are entirely those of the authors. None of the company or its directors or any other person accepts
any liability whatsoever for any loss arising from any use of this document or its contents or otherwise arising in connection therewith. The information contained herein
is not intended for publication or distribution or circulation in any manner whatsoever and any unauthorized reading, dissemination, distribution or copying of this
communication is prohibited unless otherwise expressly authorized. Please ensure that you have read “Risk Disclosure Document for Capital Market and Derivatives
Segments” as prescribed by Securities and Exchange Board of India before investing in Securities Market.
Ventura Securities Limited - SEBI Registration No.: INH000001634
Corporate Office: I-Think Techno Campus, 8th Floor, ‘B’ Wing, Off Pokhran Road No 2, Eastern Express Highway, Thane (W) – 400608