does the private sector care about aids? evidence from ...documents.worldbank.org/curated/en/... ·...
TRANSCRIPT

Does the Private Sector Care About AIDS? Evidence from Investment Climate Surveys in East Africa
Vijaya Ramachandran* Georgetown University
Manju Kedia Shah The World Bank
Ginger Turner
The World Bank
37171
Pub
lic D
iscl
osur
e A
utho
rized
Pub
lic D
iscl
osur
e A
utho
rized
Pub
lic D
iscl
osur
e A
utho
rized
Pub
lic D
iscl
osur
e A
utho
rized
Pub
lic D
iscl
osur
e A
utho
rized
Pub
lic D
iscl
osur
e A
utho
rized
Pub
lic D
iscl
osur
e A
utho
rized
Pub
lic D
iscl
osur
e A
utho
rized

2
JEL: O1, I1
Keywords: AIDS, private sector, Africa, investment climate surveys
Abstract: This paper analyzes the determinants of firms’ decision to provide HIV/AIDS prevention activities. Using data from 860 firms and 4,955 workers in Uganda, Tanzania, and Kenya, it shows that larger firms, and firms with higher skilled workers tend to invest more in AIDS prevention. Firms where more than 50 percent of workers are unionized are also more likely to do more prevention activity. Finally, these characteristics are also significant in determining whether or not a firm carries out pre-employment health checks of its workers. The results shed light on the likelihood of private sector intervention and the gaps that will require public sector assistance. *Corresponding Author: Vijaya Ramachandran, Assistant Professor, Georgetown Public Policy Institute, 3520 Prospect St NW, 4th Floor, Washington, DC 20007. Tel: 202-687-2146, Fax: 202-687-5544, E-mail: [email protected]

3
Introduction
It is estimated that up to 26 million Africans are infected with HIV/AIDS, many of them
employed in the private sector.∗ The impact of this epidemic on enterprise costs and
performance depends on worker attrition due to sickness and death, the corresponding
costs to the firm for providing health and sickness benefits, replacement costs to obtain
new workers and the impact of HIV/AIDS on worker productivity. Efforts to measure
the impact of HIV/AIDS on a firm’s costs and productivity thus far have been hampered
by measurement problems and by the absence of good quality panel data. Some earlier
studies of the manufacturing sector have found that AIDS has no measurable impact on
the private sector due to the ease of replacing workers (Biggs and Shah, 1997).
This study uses a different approach to understanding the impact of HIV on the private
sector. It focuses on examining manager and worker perceptions on HIV/AIDS, and how
firms in the private sector respond to HIV/AIDS through various measures. In doing so,
it tries to understand whether there is a cost to firms from HIV. Using a survey sample of
860 firms and 4,955 workers from Uganda, Kenya and Tanzania, we show that about 32
percent of firms engage in HIV/AIDS prevention activity. The percentage of firms
conducting pre-employment health checks in our sample ranges from about 20 percent in
Uganda to over 50 percent in Tanzania.
The analysis shows that larger firms and firms with higher skilled and/or better trained
workforces tend to do more about HIV through various prevention activities; these firms
are also more likely to conduct pre-employment health checks to screen out sicker
∗ We would like to thank Elizabeth Ashbourne, Nancy Birdsall, George Clarke, Bill Cline, Sabine Durier, Judy Feder, Alan Gelb, Alvaro Gonzalez, James Habyarimana, John Kline, Maureen Lewis, Taye Mengistae, Agata Pawlowska, Axel Peuker, and seminar participants at the World Bank, the Center for Global Development, and Georgetown University for helpful comments and suggestions. The data for Sub-Saharan Africa used in this paper were collected by the Regional Program on Enterprise Development in the Africa Private Sector Group at the World Bank. The views expressed in this paper are the authors’own.

4
applicants. Firms where a majority of workers are unionized are also more likely to carry
out AIDS prevention activities and pre-employment health checks. Finally, managers
who are concerned about absenteeism are also significantly more likely to carry out
AIDS prevention activities. Our results imply that where it is costly to replace workers,
firms attempt to mitigate this cost by engaging in prevention activity or by screening new
applicants. Our data also indicate that a very large proportion of workers—75 percent--
are willing to pay to be tested for HIV.
Our results imply that increasing the incentives for those large firms not yet doing
prevention would significantly increase the coverage of workers with respect to AIDS
prevention activities. For countries with a very large share of small and medium sized
firms, it appears that the public sector needs to shoulder more of the cost of preventing
AIDS.
I: HIV/AIDS in East Africa
Kenya, Tanzania and Uganda have all been struggling with the problem of HIV/AIDS for
at least two decades. Table 1 below presents the HIV prevalence rates for these
countries. We see that Tanzania has the highest prevalence rate and absolute number of
HIV-positive persons, followed by Kenya, and Uganda. All three countries have
mounted public campaigns to fight AIDS; these campaigns have increasingly been
supplemented by private sector efforts.1 The purpose of this paper is to examine the
latter, in order to determine which types of firms are engaged in AIDS prevention and
why.
Table 1: HIV Prevalence in East Africa
Kenya Tanzania Uganda Adult (15-49) HIV prevalence rate
6.7 8.8 4.1
Adults and children (0-49) living with HIV/AIDS (millions)
1.2 1.6 0.53
1 Appendix 1 has additional information on HIV/AIDS in these three countries.

5
Adults (Ages 15-49) living with HIV/AIDS (millions)
1.1 1.5 0.45
Source: UNAIDS 2004; Center for HIV Information, University of California-San Diego
Thus far, it has been extraordinarily difficult to directly observe the impact of AIDS on
productivity. This study uses a different approach to understanding the impact of HIV on
the private sector. It focuses on examining manager and worker perceptions on
HIV/AIDS, and how firms in the private sector respond to HIV/AIDS through various
measures. In doing so, it tries to understand whether there is a cost to firms from HIV.
Before we turn to an exploration of firm-level data for East Africa, we need to
acknowledge recent analyses focused on the private sector, that have helped shape our
work. While there is a large literature on the problem of HIV/AIDS in Africa, there is
relatively little rigorous analysis of private sector activity. Some major studies are worth
citing in this regard. A global survey in 2003 revealed that the private sector is not doing
enough about AIDS (Bloom, 2004; Taylor et al, 2004). The World Economic Forum’s
Global Health Initiative website summarizes the results of the study as follows:2
Of the nearly 8,000 businesses surveyed in 103 countries: -47% felt that HIV will have some impact on their business; this number is much lower in countries that to date have not been hard-hit by HIV. There are important regional variances – in Africa, 89% thought HIV would have some impact, but in the Middle East and North Africa that figure dropped to 33%. Worldwide, 21% of surveyed firms feel that HIV will have a severe impact on their business. -Business leaders estimate lower HIV infection rates among their workforce than UNAIDS (official national adult prevalence figures), although 36% of business leaders did not or could not estimate how many of their employees had HIV. The small proportion of firms that have conducted quantitative studies estimates lower rates than other firms.
In summarizing the findings of their paper, David Bloom and coauthors argue that firms
have taken little action regarding HIV in Africa (Bloom et al, 2004). They write that the
largest discrepancy between firm perceptions and actual data is to be found in Africa,
where 45 percent of firms report less than 1 percent prevalence, despite data from
UNAIDS that shows only 10 percent of respondent firms in Africa are located in low-
2 http://www.weforum.org/site/homepublic.nsf/Content/Global+Health+Initiative

6
prevalence countries. They argue that as of 2003-04, the response to AIDS by the private
sector has been “piecemeal” with only a few firms having HIV/AIDS policies; the
response is limited even where firms are quite concerned about HIV. This response is
even more sanguine, they argue, in countries which are relatively well-governed. In these
cases, businesses seem to rely more on the public sector to deal with the problem.
In Rosen’s analysis of Nigeria, she also argues that managers are doing little about AIDS
(Rosen, 2001). Survey data used in this paper in 2001 showed that AIDS was not yet a
big problem in the Nigerian workplace and most managers have had little experience
dealing with it. Rosen also makes the interesting argument that given the high cost of the
business environment in Nigeria (power, water), it is unlikely that AIDS would enter the
“top ten” list of concerns for a while. In addition to the “high cost” of doing business that
keeps companies from addressing HIV/AIDS, the general health infrastructure is weak,
and lack of clean water is a real concern in many parts of sub-Saharan Africa.
Consequently, there may be higher priorities to the community and companies in the
short term. Also, Nigeria had only a 5 percent prevalence at the time of Rosen’s study,
with some states having almost no HIV, making Nigeria a difficult example to use in the
general sense.
A recent study of agricultural workers in Kenya provided empirical estimates of the
impact of HIV/AIDS on labor productivity, by comparing healthy workers to workers
who later left the company due to HIV, through retrospective measures of output for
several years before their exit (Fox et al, 2004). Workers terminated because of AIDS-
related causes earned 16-18 percent less in the two years before termination, as well as
choosing less strenuous tasks and using more sick leave days (Fox et al, 2004). Rosen et
al. 2004 examined the cost of AIDS to six large employers in South Africa, estimating
the cost at 0.4 to 5.9 percent of the total wage and salary bill, with each infected
employee costing the employer an average of 0.5 to 3.6 times his or her annual salary.
Rosen observed in another collection of case studies that many large employers are
actively taking steps to shift the economic burden of AIDS onto employees and
7
governments, through such practices as outsourcing unskilled jobs and capping benefits
premiums (Rosen and Simon, 2003).
In a survey of 80 small and medium enterprises in South Africa, Connelly and Rosen
(2005) found that managers on average ranked HIV/AIDS as 9 out of 10 on the list of
priorities, although worker productivity ranked number 1. Managers attributed a low
percentage of productivity losses to HIV and found worker replacement inexpensive. In
addition, the study found lack of information to be a major constraint, as even managers
interested in HIV programs were unaware of free services available nearby.
Aurum Health, a health research organization in South Africa, recently demonstrated the
profitability of AIDS workplace programs in 9 large firms with over 120,000 employees,
including Anglo-American mining company. They observed a 60 percent decrease in
absenteeism, which compensated for 70 percent of the costs of the AIDS workplace
programs, the rest of which were covered by other cost savings (Aurum Health, 2005).
Advocacy organizations, such as the Global Business Coalition (GBC) and the South
African Business Coalition Against HIV/AIDS (SABCOHA), have gathered numerous
case studies on HIV/AIDS workplace programs including prevention, care, and
treatment, mostly in large companies, though mostly without rigorous monitoring and
evaluation that could determine effectiveness. SABCOHA has recently targeted SMEs
with its SME toolkit, for sale for approximately $215, which has attracted very low
uptake (Mears, 2005).
Biggs and Shah look at the impact of AIDS through worker attrition due to sickness and
death on firm performance and conclude that there is no significant measurable impact
(Biggs and Shah, 1997). However, this study was based on data from the early 1990s,
when the AIDS epidemic was not yet full-blown in the surveyed countries, and its impact
on worker attrition was low.

8
Recent studies show that the private sector in Africa is very concerned about the issue—
in 2004, the Johannesburg Stock Exchange has indicated that HIV is a liability for
companies listed on the exchange, making it the first instance that companies have to
disclose their prevalence levels as part of their official evaluation.3 And across the
world, the private sector is increasingly engaged in the fight against AIDS. Of particular
note is the Global Business Coalition which is an association of private sector firms
banding together to address the problem of HIV/AIDS (www.businessfightsaids.org).
The GBC provides teams of experts to help member businesses design AIDS programs in
Africa and elsewhere. Similar initiatives are underway by SABCOHA (the South
African Business Coalition Against AIDS) and other private sector organizations.
A thorough investigation of donor and public funding for HIV/AIDS highlights real
problems in terms of governments’ abilities to absorb and spend large amounts of money
(Lewis, 2005), indicating that the private sector should perhaps be emphasized as a key
alternative source of interventions.
Finally, Rosen et al calculated the impact of AIDS on six corporations in South Africa
and Botswana and found that AIDS impacted labor costs by as much as 6 percent; they
argue that providing anti-retroviral therapy to employees in these six firms at no cost
would have made economic sense, from a cost-benefit point of view (Rosen et al, 2003).
This analysis is based on case study evidence, rather than on econometric analysis of a
large sample of firms.
In this analysis, we try to estimate the determinants of firms’ activities to prevent
HIV/AIDS. The data for this study came from the World Bank’s Africa Investment
Climate Surveys, collected by the World Bnk’s Regional Program on Enterprise
Development in 2002-03, in collaboration with local organizations in Africa.4 Each firm
survey includes interviews with several hundred firms--a labor and training module
3 The King Report on Corporate Governance for South Africa (known as “King 2”) defines the code for good corporate governance in South Africa via the Code of Corporate Practices and Conduct (www.globalreporting.org). 4 The collaborating institutions for data collection were the Kenya Institute for Public Policy Research (KIPPRA), the Economic and Social Research Foundation-Tanzania (ESRF) and the Uganda Manufacturers Association Consulting Services (UMACIS).

9
covers worker health issues and information is obtained through on worker health and
firm interventions by interviewing each firm’s managers. A separate worker section was
also included in each survey, where the firm’s workers (up to 10 per firm) were
interviewed and asked several questions relating to education, experience, earnings, and
health status, among other things.5 II: Enterprise Behavior in East Africa
The analysis contained in this paper is based on a sample of 860 firms across Uganda,
Kenya and Tanzania and 4,955 workers. These firms are located in “traditional” sectors
such as agro-processing, wood/furniture, textiles/garments/leather, paper and publishing,
construction, chemicals and plastics, and metalworking. Each firm was interviewed in
person by a team of enumerators; in most cases, the manager, accountant, and up to 10
workers were interviewed separately to collect the information used in this analysis. In
this section, we will discuss the characteristics of the firms and the types of health-related
activities they engage in.
In the survey data, we identify three main actions that firms may take in response to the
HIV/AIDS impact on the workplace:
1) Conducting prevention activities
2) Conducting pre-employment health checks of workers
3) Offering general medical benefits, particularly medical aid, which may or may not
cover HIV-related illness
HIV/AIDS Prevention Activity
HIV/AIDS prevention activities are defined as the following activities in the survey:
• Prevention messages, which mostly consists of putting up posters around the
factory
• Distributing condoms on the premises of the firm
5 We would like to acknowledge the valuable comments and suggestions provided by David Bloom and Sydney Rosen regarding the design of the questions on AIDS used in our firm-level surveys.
10
• Providing HIV/AIDS counseling
• Offering anonymous HIV/AIDS testing
• Financial aid to employees with HIV/AIDS
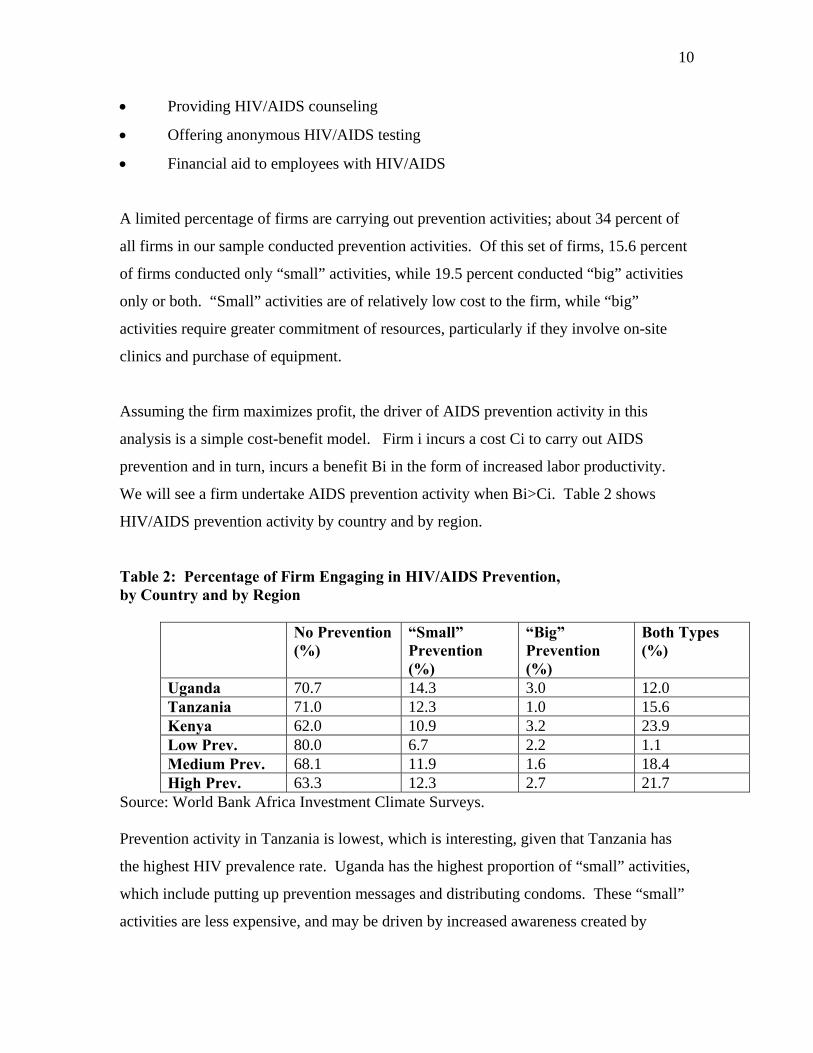
A limited percentage of firms are carrying out prevention activities; about 34 percent of
all firms in our sample conducted prevention activities. Of this set of firms, 15.6 percent
of firms conducted only “small” activities, while 19.5 percent conducted “big” activities
only or both. “Small” activities are of relatively low cost to the firm, while “big”
activities require greater commitment of resources, particularly if they involve on-site
clinics and purchase of equipment.
Assuming the firm maximizes profit, the driver of AIDS prevention activity in this
analysis is a simple cost-benefit model. Firm i incurs a cost Ci to carry out AIDS
prevention and in turn, incurs a benefit Bi in the form of increased labor productivity.
We will see a firm undertake AIDS prevention activity when Bi>Ci. Table 2 shows
HIV/AIDS prevention activity by country and by region.
Table 2: Percentage of Firm Engaging in HIV/AIDS Prevention, by Country and by Region
No Prevention (%)
“Small” Prevention (%)
“Big” Prevention (%)
Both Types (%)
Uganda 70.7 14.3 3.0 12.0 Tanzania 71.0 12.3 1.0 15.6 Kenya 62.0 10.9 3.2 23.9 Low Prev. 80.0 6.7 2.2 1.1 Medium Prev. 68.1 11.9 1.6 18.4 High Prev. 63.3 12.3 2.7 21.7
Source: World Bank Africa Investment Climate Surveys.
Prevention activity in Tanzania is lowest, which is interesting, given that Tanzania has
the highest HIV prevalence rate. Uganda has the highest proportion of “small” activities,
which include putting up prevention messages and distributing condoms. These “small”
activities are less expensive, and may be driven by increased awareness created by

11
publicly-funded programs. Kenya has the highest percentage of firms engaging in “big”
prevention which includes counseling, HIV testing and/or financial aid. Both Kenya and
Uganda have visible public-awareness campaigns to fight HIV/AIDS; our data suggest
that private sector efforts in these countries may complement public sector interventions.
Table 2 also shows that prevention activity has a positive association to regional HIV
prevalence.6 Firms in high-prevalence regions are almost twice as likely to engage in
prevention activity than firms in low-prevalence zones, for each category of prevention.
High-prevalence regions such as Nyanza in Kenya; Iringa, Mbeya, and Dar es Salaam in
Tanzania; and Kampala and Entebbe in Uganda, are more likely to have firms that
conduct prevention activities. It is however worth pointing out that the vast majority of
our firms (60 percent) are in medium or high prevalence zones.
Our data also indicate that prevention activity is most likely in the agroprocessing/food
sector, followed by the furniture/wood sector and the construction/machinery sector, and
is least likely in the textile/garments/leather sector. The variance is not very high across
sectors; prevention activity varies in about a 10 percent range and there is no obvious
difference between these sectors with respect to labor intensity.
Table 3 shows the size distribution of the sample. There are 285 Kenyan firms, 276
Tanzanian firms and 299 Ugandan firms in the sample.7 Kenya has the highest share of
large and very large firms (137 firms, almost 49 percent of the sample), followed by
Tanzania (71 firms or 26 percent) and Uganda ( 58 firms or 19 percent). Uganda has the
largest share of micro and small firms in our sample.
6 Low, medium and high prevalence are defined as the following: Low is <5% population infected with HIV, Medium is 5-10%, High is >10% 7 Micro firms are less than 10 employees, small firms have 10-49 employees, medium firms have 50-99 employees, large firms have 100-499 employees and very large firms have 500+ employees.

12
Table 3: Firm Size Distribution in East Africa Sample (percentage)
Workers Kenya Tanzania Uganda 1-9 3.9 17.4 18.1 10-49 31.9 39.5 51.2 50-99 16.1 17.4 11.4 100-499 29.1 18.1 16.1 500+ 18.9 7.6 3.3
Source: World Bank Africa Investment Climate Surveys
Table 4 reveals interesting differences in prevention activity by firm size. Not only are
large firms more likely to do prevention activity, but they are more likely to do more
intensive prevention activity (“big activity”), such as voluntary counseling and testing
(VCT), and financial aid for employees. The figure is highest for large and very large
firms in our sample; close to 50 percent of large firms and over 70 percent of very large
firms are engaged in some type of prevention. Overall, about 32 percent of firms carry
out some sort of prevention activity.
Table 4 : Prevention Activity by Firm Size in Kenya, Uganda and Tanzania (% of firms)
Workers No Prevention Condoms and Posters (small)
Only Counseling and Testing (big)
Both Types
1-9 83.4 10.1 2.1 4.4 10-49 76.7 12.8 2.8 7.7 50-99 68.4 14.2 1.6 15.8 100-499 53 13.3 2.2 31.5 500+ 25.9 16.1 3.2 54.8
Source: World Bank Africa Investment Climate Surveys
Table 5 shows prevention activity by types of ownership—foreign vs. domestic—in our
sample. About 45 percent of foreign firms conduct some type of prevention activity vs.
about 28 percent for domestic firms. We see that foreign-owned firms are more likely to
conduct HIV/AIDS prevention activities and also to conduct a range of both “big” and
“small” activities, relative to domestic-owned firms.8
8 Foreign ownership is defined as firms with any foreign equity; most firms with foreign equity in our sample have at least a 20 percent share of foreign ownership.

13
Table 5: AIDS Prevention Activity by Ownership (% of firms)
Type of Ownership
No Prevention
Condoms and Posters
Only Counseling and Testing
Both Types
Foreign 54.5 12.4 3.4 29.8 Domestic 71.4 12.6 2.2 13.8
Source: World Bank Africa Investment Climate Surveys Why do certain types of firms do more in terms of prevention? There could be several
reasons for this—the large fixed cost incurred in setting up a treatment program is more
affordable for larger firms, which are also able to cover more workers. In addition, and
perhaps more importantly, firms with more skilled workers may view these workers as
less substitutable and have a greater incentive to engage in prevention activity from a
cost-benefit point of view.9
Table 6 shows the data disaggregated by firms that do any type of prevention and “big”
prevention vs. those that do not, disaggregated by provision of training and skill ratio of
the workforce. Firms that train their workers are twice as likely to engage in prevention
activity; 60 percent of firms that do AIDS prevention also provide training to their
workers. Similarly, 61 percent of firms that provide VCT also provide worker training;
only half that percentage provide training in the category of firms that do not provide
VCT and other “big” services. The ratio of skilled production workers to total workers
in the firm is slightly higher in firms doing “big” prevention versus those which do not.10
Table 6: Provision of Training and Skill Ratio (% of firms) vs. Prevention Activity
Firms Doing Prevention
Firms Doing No Prevention
Firms Doing “Big” Activities
Firms Doing No “Big” Activity
%Firms Providing Formal Training
60 33 61 37
9 There is also evidence to suggest that there is greater responsiveness to AIDS education and information by more skilled or educated people (de Walque, 2004). 10 Micro firms are dropped in this table as their skill ratios are artificially high due to the very small number of workers relative to the manager.

14
%Workers in the Firm who are Skilled
35 35 37 35
Source: World Bank Africa Investment Climate Surveys
Finally, do firms do more prevention activity when the perception of worker-absenteeism
is higher? Our data show that firms reporting a higher rate of absenteeism are more
likely to conduct HIV/AIDS prevention activities. About 43 percent of firms that say
that absenteeism is a problem carry out AIDS prevention activities; this number falls to
29 percent for firms that do not report absenteeism as a problem. This may reflect
underlying managerial quality—managers who are likely to observe absenteeism may
also be more likely to do AIDS prevention.11
Pre-Employment Health Checks
Our data shows that a significant number of firms in East Africa engage in pre-
employment health checks. Pre-employment health checks that do not specifically test
for HIV/AIDS may not detect workers’ HIV infection status. Our survey data does not
ask whether pre-employment health checks include HIV testing, or whether managers
understand that HIV/AIDS status would be visible from general health examinations.
Some managers may not make the connection between HIV prevention and general
health testing; others may make guesses as to the reasons for symptoms observed during
the pre-employment check. Table 7 shows the incidence of pre-employment health
checks, by country and by region. About 33 percent of firms in our sample engage in
pre-employment health checks of potential employees.12
11 The Tanzania survey asks about “high” HIV-related and general absenteeism ; the Uganda and Kenya surveys ask about “high” HIV-related absenteeism and “increased” general absenteeism. The question does not specify the time period of increase but the last 12 months is clearly implied from the flow of questions. 12 Since the focus of this paper is the determinants of firm behavior, we have summarized and reported the results from the worker interviews in Appendix 2.
15
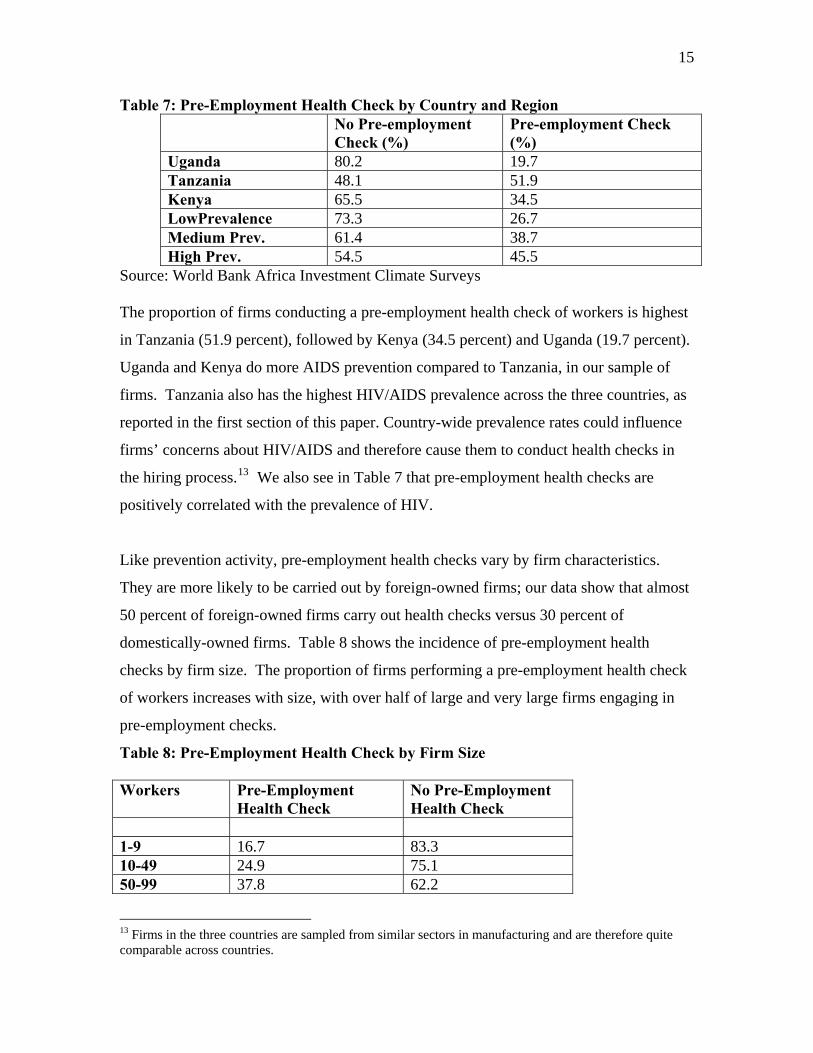
Table 7: Pre-Employment Health Check by Country and Region No Pre-employment
Check (%) Pre-employment Check (%)
Uganda 80.2 19.7 Tanzania 48.1 51.9 Kenya 65.5 34.5 LowPrevalence 73.3 26.7 Medium Prev. 61.4 38.7 High Prev. 54.5 45.5
Source: World Bank Africa Investment Climate Surveys
The proportion of firms conducting a pre-employment health check of workers is highest
in Tanzania (51.9 percent), followed by Kenya (34.5 percent) and Uganda (19.7 percent).
Uganda and Kenya do more AIDS prevention compared to Tanzania, in our sample of
firms. Tanzania also has the highest HIV/AIDS prevalence across the three countries, as
reported in the first section of this paper. Country-wide prevalence rates could influence
firms’ concerns about HIV/AIDS and therefore cause them to conduct health checks in
the hiring process.13 We also see in Table 7 that pre-employment health checks are
positively correlated with the prevalence of HIV.
Like prevention activity, pre-employment health checks vary by firm characteristics.
They are more likely to be carried out by foreign-owned firms; our data show that almost
50 percent of foreign-owned firms carry out health checks versus 30 percent of
domestically-owned firms. Table 8 shows the incidence of pre-employment health
checks by firm size. The proportion of firms performing a pre-employment health check
of workers increases with size, with over half of large and very large firms engaging in
pre-employment checks.
Table 8: Pre-Employment Health Check by Firm Size Workers Pre-Employment
Health Check No Pre-Employment Health Check
1-9 16.7 83.3 10-49 24.9 75.1 50-99 37.8 62.2
13 Firms in the three countries are sampled from similar sectors in manufacturing and are therefore quite comparable across countries.
16
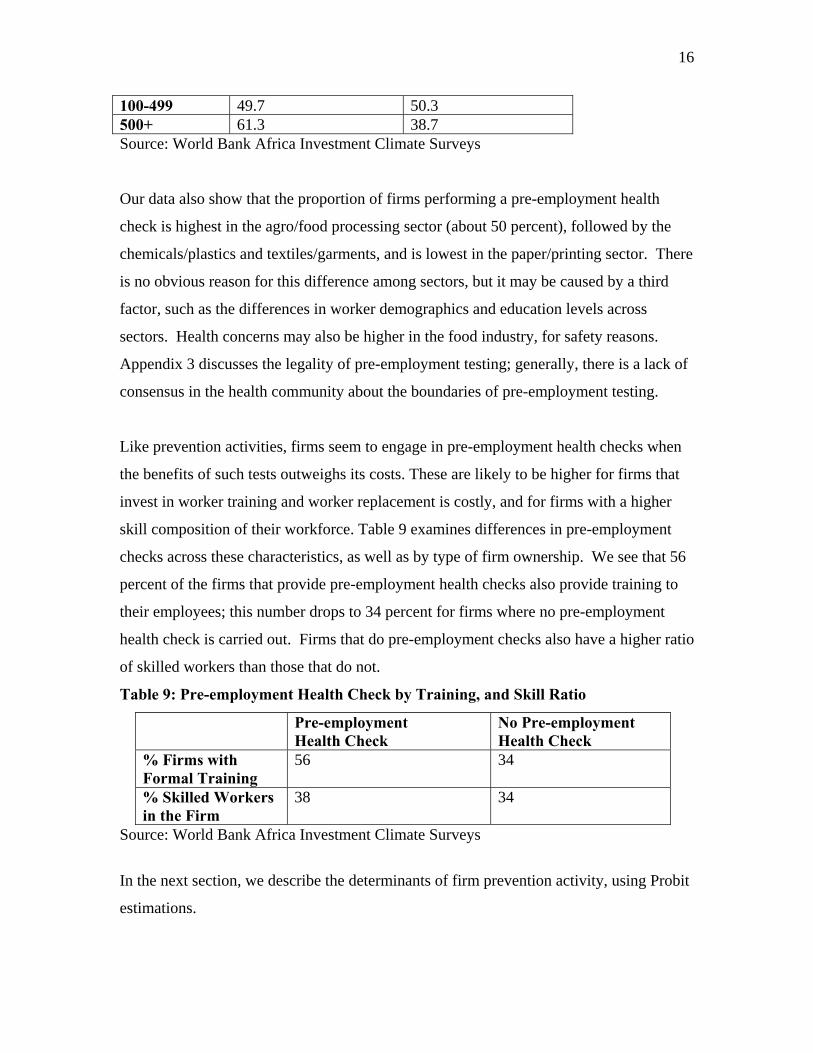
100-499 49.7 50.3 500+ 61.3 38.7 Source: World Bank Africa Investment Climate Surveys
Our data also show that the proportion of firms performing a pre-employment health
check is highest in the agro/food processing sector (about 50 percent), followed by the
chemicals/plastics and textiles/garments, and is lowest in the paper/printing sector. There
is no obvious reason for this difference among sectors, but it may be caused by a third
factor, such as the differences in worker demographics and education levels across
sectors. Health concerns may also be higher in the food industry, for safety reasons.
Appendix 3 discusses the legality of pre-employment testing; generally, there is a lack of
consensus in the health community about the boundaries of pre-employment testing.
Like prevention activities, firms seem to engage in pre-employment health checks when
the benefits of such tests outweighs its costs. These are likely to be higher for firms that
invest in worker training and worker replacement is costly, and for firms with a higher
skill composition of their workforce. Table 9 examines differences in pre-employment
checks across these characteristics, as well as by type of firm ownership. We see that 56
percent of the firms that provide pre-employment health checks also provide training to
their employees; this number drops to 34 percent for firms where no pre-employment
health check is carried out. Firms that do pre-employment checks also have a higher ratio
of skilled workers than those that do not.
Table 9: Pre-employment Health Check by Training, and Skill Ratio
Pre-employment Health Check
No Pre-employment Health Check
% Firms with Formal Training
56 34
% Skilled Workers in the Firm
38 34
Source: World Bank Africa Investment Climate Surveys
In the next section, we describe the determinants of firm prevention activity, using Probit
estimations.

17
III. Econometric Estimations of Firm Behavior
In this section, we examine the determinants of pre-employment health checks and AIDS
prevention activities, in a multivariate framework, using a Probit model. Our basic
hypothesis is private enterprises that maximize profits invest in AIDS prevention
activities or pre-employment health checks if the benefits from these activities outweigh
the costs. A firm benefits from AIDS prevention activities and/or screening mechanisms
because it leads to healthier workers and higher worker productivity from its existing
worker pool. For firms in low-skill industries, or at the lower end of the size spectrum
where it is easy to hire and fire workers, these benefits are likely to be low due to the low
level of skills required and the ease of worker replacement. These benefits are likely to
offset costs within firms in which workers cannot be replaced easily without substantial
productivity loss. This leads to two sub-hypotheses: Hypothesis 1: Firms which have a higher ratio of skilled labor are more likely to invest
more in AIDS prevention and/or pre-employment health checks because of higher
replacement costs, ceteris paribus.
Hypothesis 2: Firms which carry out training programs are more likely invest more in
AIDS prevention and/or pre-employment health checks because of a higher level of
investment in employees, ceteris paribus.
The Probit model used is as follows:
Y*=F(X’β)+u
Where Y* represents the unobservable variable measuring the net benefit to a firm from
investing in any of these activities. The actual variable observed is y (whether or not a
firm carries out AIDS prevention or pre-employment health checks), measured as a
dummy variable, equal to 1 if Y* >0, and 0 otherwise. The function F is the distribution
function--X is a vector of explanatory variables, and u is the unobserved error term.
It is important to note that skill ratios are independent of whether the firm invests in
training of workers; skill ratio is defined by job status i.e. the ratio of managers and
professionals to total workers. In each skill category, the firm may or may not provide
18
formal training. Therefore, the first hypothesis captures formal schooling (pre-
employment human capital formation) while the second captures post-employment
learning.
We also control for size of the firm, type of ownership, and for sector and country
differences in AIDS prevention across our sample. We also control for bargaining power
of labor as measured by degree of unionization of the workforce. The hypothesis is that a
more unionized labor force will lead to greater AIDS prevention activity. Related to this,
it may also lead to more pre-employment health checks as firms anticipate that they need
to offer a higher level of services to their unionized employees.
The following equation is estimated for firm i, based on the simple model described
above:
uXXXFY niniiii ++++= )...( 2211 βββα
where Y = whether any AIDS prevention is carried out
whether “big” AIDS prevention activities are carried out
whether the firm does pre-employment health checks
X1= size of the firm, as measured by log of total number of workers
X2= whether the firm is foreign owned (0/1 dummy)
X3= ratio of skilled to total labor
X4= whether or not a firm does training
X5= whether or not a firm is majority unionized
X6-X12= sector and country dummies
It is important to note that skill ratios are independent of whether the firm invests in
training of workers; skill ratio is defined by job status i.e. the ratio of managers and
professionals to total workers. In each skill category, the firm may or may not provide
formal training. Therefore, the first hypothesis captures formal schooling (pre-
employment human capital formation) while the second captures post-employment
learning.
19
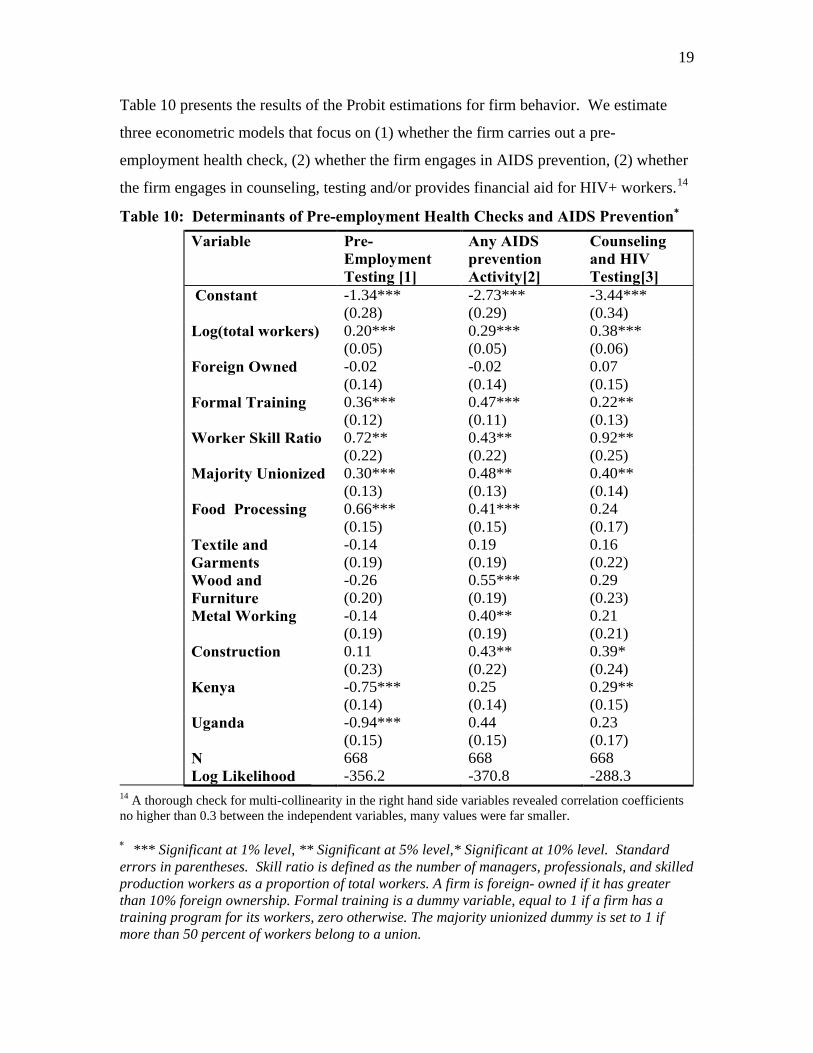
Table 10 presents the results of the Probit estimations for firm behavior. We estimate
three econometric models that focus on (1) whether the firm carries out a pre-
employment health check, (2) whether the firm engages in AIDS prevention, (2) whether
the firm engages in counseling, testing and/or provides financial aid for HIV+ workers.14
Table 10: Determinants of Pre-employment Health Checks and AIDS Prevention∗
Variable Pre-Employment Testing [1]
Any AIDS prevention Activity[2]
Counseling and HIV Testing[3]
Constant -1.34*** (0.28)
-2.73*** (0.29)
-3.44*** (0.34)
Log(total workers) 0.20*** (0.05)
0.29*** (0.05)
0.38*** (0.06)
Foreign Owned -0.02 (0.14)
-0.02 (0.14)
0.07 (0.15)
Formal Training 0.36*** (0.12)
0.47*** (0.11)
0.22** (0.13)
Worker Skill Ratio 0.72** (0.22)
0.43** (0.22)
0.92** (0.25)
Majority Unionized
0.30*** (0.13)
0.48** (0.13)
0.40** (0.14)
Food Processing 0.66*** (0.15)
0.41*** (0.15)
0.24 (0.17)
Textile and Garments
-0.14 (0.19)
0.19 (0.19)
0.16 (0.22)
Wood and Furniture
-0.26 (0.20)
0.55*** (0.19)
0.29 (0.23)
Metal Working -0.14 (0.19)
0.40** (0.19)
0.21 (0.21)
Construction 0.11 (0.23)
0.43** (0.22)
0.39* (0.24)
Kenya -0.75*** (0.14)
0.25 (0.14)
0.29** (0.15)
Uganda -0.94*** (0.15)
0.44 (0.15)
0.23 (0.17)
N 668 668 668
Log Likelihood -356.2 -370.8 -288.3 14 A thorough check for multi-collinearity in the right hand side variables revealed correlation coefficients no higher than 0.3 between the independent variables, many values were far smaller.
∗ *** Significant at 1% level, ** Significant at 5% level,* Significant at 10% level. Standard errors in parentheses. Skill ratio is defined as the number of managers, professionals, and skilled production workers as a proportion of total workers. A firm is foreign- owned if it has greater than 10% foreign ownership. Formal training is a dummy variable, equal to 1 if a firm has a training program for its workers, zero otherwise. The majority unionized dummy is set to 1 if more than 50 percent of workers belong to a union.

20
Equation [1] presents the results examining the determinants of pre-employment tests.15
The dependent variable is defined as a dummy variable, equal to 1 if the firm conducts a
pre-employment check, zero otherwise. We see that firm size is extremely significant-
larger firms are much more likely to conduct pre-employment tests compared to smaller
enterprises. After controlling for firm size, we see that firms that provide have a formal
worker training program (beyond on-the-job) are much more likely to test new workers.
In addition, firms with a higher proportion of skilled workers are more likely to engage in
pre-employment checks.
Firms in the food sectors test their new workers more than firms in other sectors, perhaps
due to safety reasons. It is interesting to note that after controlling for size, foreign
ownership is not significant in the multivariate estimation; foreign firms are not more
likely to screen out potentially sick applicants or carry out AIDS prevention.16 Finally,
Kenya and Uganda do significant less pre-employment health checks than Tanzania.
Equation [2] describes the results of the Probit estimation for whether or not the firm
engages in AIDS prevention activity. We see that size matters here as well; larger firms
tend to do more prevention. After controlling for size, it is important to note that firms
with better trained workers and higher-skilled workers tend to do more prevention.17
Four sectors—food-processing, wood, metal, and construction—tend to do more than
other sectors.18 And the country dummies are not significant; there is no real variance in
prevention activity across countries, after controlling for firm size and other firm
characteristics.19
15 Specifications that controlled for age of the firm and included a dummy for whether or not the firm is credit constrained did not yield any additional significance. 16 The coefficient on foreign ownership is small and the variance is large, indicating that there is not enough variance in foreign firms in our sample. Since most foreign firms are large, the size coefficient captures the significance and foreign-ness alone does not give us additional information. 17 It could be argued that firms that do more AIDS prevention carry out more training i.e. that the causality goes in the opposite directly. We do not believe that this is the case; anecdotal and other evidence suggests that firms’s decision to do training greatly precedes their decision to do AIDS prevention. 18 It is likely the case that sectors where employees are not easily replaceable will do more AIDS prevention; this may be due to issues such as lack of ease in hiring or the difficulty of losing workers during peak seasons. 19 This result is also reassuring in terms of the decision to pool the data across countries.
21
Equation [3] estimates the determinants of more significant AIDS intervention (voluntary
counseling and testing). Again, larger firms and firms that have higher-skilled workers
who are trained in-house tend to do more VCT activity.
Why is size significant in the three regressions? Large firms may have better quality
managers, greater resources, and/or other unobserved characteristics that enable them to
do AIDS prevention.20 Larger firms may also have already-established facilities for
conferences or training that can be easily adapted for AIDS education sessions. Apart
from the fact that large firms may find AIDS interventions more affordable, they may
also be more aware of the risks of HIV. Available evidence suggests that small and
medium enterprises may be less aware of the risks of HIV, lack the staff and resources to
carry out prevention activity and are sometimes unaware of options available to them to
address the problem of HIV (Rosen et al, 2003, Durier, 2005 ).
It is also worth noting that foreign ownership is not significant after controlling for size.
Finally, Kenyan firms do more VCT activity than other firms, as do firms in the
construction sector; the latter perhaps because of the migratory nature of the workforce
and/or the difficulty in replacing workers in this sector.
Unionization is significant in determining AIDS prevention, only when a majority of
workers are unionized.21 A simple union dummy set to 1 if the firm has a union is not
significant, but a dummy recording whether more than 50 percent of workers are
unionized is significant in determining whether or not the firm carries out AIDS
prevention activity. Interestingly, it is also significant in determining whether or not the
firm carries out a pre-employment health check; this may be because firms with a
unionized workforce are aware that they have to provide a higher level of AIDS-related
services and may consequently do more to screen out sick workers. Other econometric
specifications that included measures of location of the firm and education level of the 20 Anecdotal evidence suggests that large firms in the textile and garment sector in Lesotho carry out very little AIDS prevention; this may be due to the highly mobile nature of firms in this sector. In countries which serve as temporary homes to firms because of legislation such as the Africa Growth and Opportunity Act, one would expect less correlation with size or workforce quality. 21 We would like to thank James Habyarimana for discussions on the issue of unionization.
22
manager did not yield different results than those reported here. It is worth mentioning
that the coefficients reported in Table 10 are very robust to these variations in
specification.
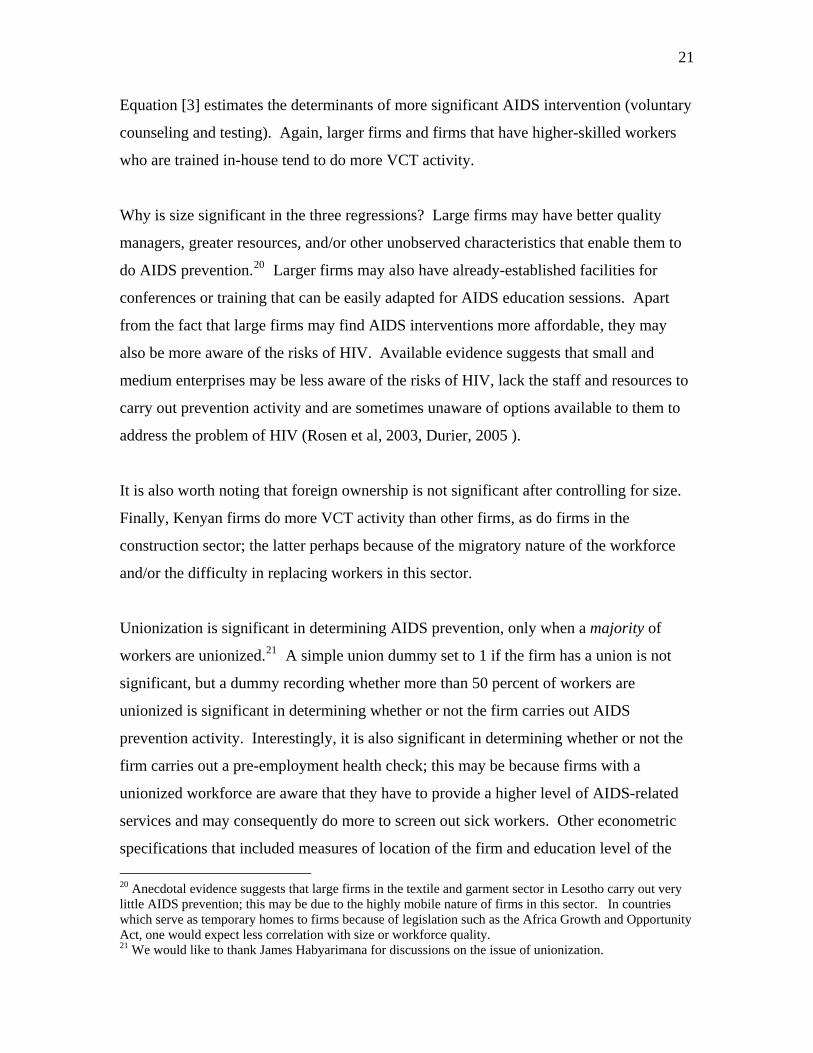
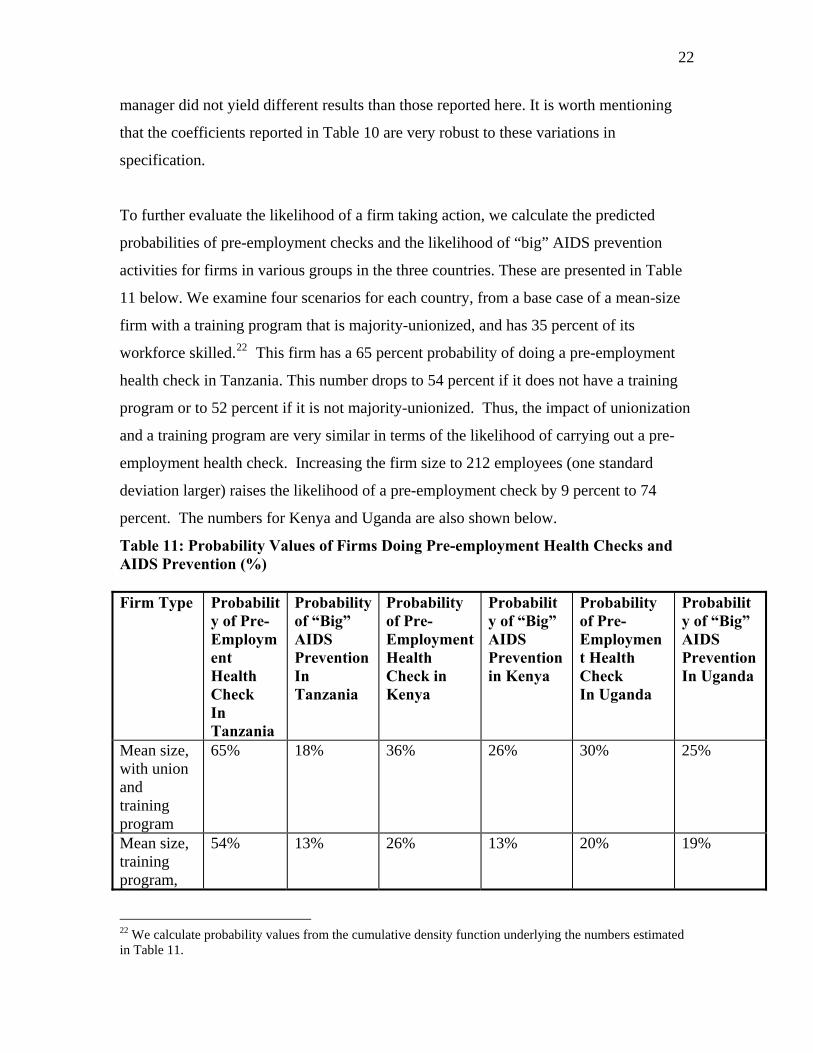
To further evaluate the likelihood of a firm taking action, we calculate the predicted
probabilities of pre-employment checks and the likelihood of “big” AIDS prevention
activities for firms in various groups in the three countries. These are presented in Table
11 below. We examine four scenarios for each country, from a base case of a mean-size
firm with a training program that is majority-unionized, and has 35 percent of its
workforce skilled.22 This firm has a 65 percent probability of doing a pre-employment
health check in Tanzania. This number drops to 54 percent if it does not have a training
program or to 52 percent if it is not majority-unionized. Thus, the impact of unionization
and a training program are very similar in terms of the likelihood of carrying out a pre-
employment health check. Increasing the firm size to 212 employees (one standard
deviation larger) raises the likelihood of a pre-employment check by 9 percent to 74
percent. The numbers for Kenya and Uganda are also shown below.
Table 11: Probability Values of Firms Doing Pre-employment Health Checks and AIDS Prevention (%) Firm Type Probabilit
y of Pre-Employment Health Check In Tanzania
Probability of “Big” AIDS Prevention In Tanzania
Probability of Pre-Employment Health Check in Kenya
Probability of “Big” AIDS Prevention in Kenya
Probability of Pre-Employment Health Check In Uganda
Probability of “Big” AIDS Prevention In Uganda
Mean size, with union and training program
65% 18% 36% 26% 30% 25%
Mean size, training program,
54% 13% 26% 13% 20% 19%
22 We calculate probability values from the cumulative density function underlying the numbers estimated in Table 11.

23
no union Mean size, with union, no training
52% 10% 24% 10% 18% 14%
Firm , one std. dev. Bigger, with union and training
74% 35% 46% 46% 39% 44%
The results from this exercise confirm the data reported in the descriptive tables in
previous sections—larger firms, especially those with higher investments in workers tend
to do more AIDS prevention and to screen employees more carefully; for these firms, it
does appear that the benefits of HIV-related activities outweigh the costs.
Conclusions and Policy Implications
It has thus far been difficult to measure the impact of HIV/AIDS on worker productivity.
The analysis in this paper indicates that there may well be a cost to losing workers--firms
which are larger, have trained workers, and/or workers with greater skill levels, tend to
do more to prevent HIV/AIDS. Firms with a high degree of unionization also carry out
more AIDS prevention. These factors are also significant in determining whether or not
firms do pre-employment health checks.
The results reported in this paper help us understand the incentives faced by the private
sector when dealing with the problem of HIV/AIDS. They may also help us understand
what we can realistically expect the private sector to do to address the problem of
HIV/AIDS. Several questions emerge--how we can create stronger incentives for private
sector intervention such as tax credits or other financial incentives? Increasing AIDS
prevention activity in the medium-to-large segment of firms would increase the share of
workers covered by some prevention activity. If the result that larger firms do more is in
part due to the lower perceived benefit of AIDS interventions by smaller firms, can we
raise awareness in the SME sector about the true cost of HIV? Also, if size of the firms
drives the degree of intervention, the public sector will need to do more about HIV/AIDS

24
in countries where there is a high percentage of small firms. Finally, if latent demand
does indeed exist for HIV testing, both the public and private sectors need to find ways to
meet that demand; removing the social stigma attached to HIV testing and/or providing a
continuum of services beyond VCT may be necessary to ensure that workers are able to
get tested. Further research is necessary to get answers to these questions and to help
address the enormous problem of HIV/AIDS in Africa.
Appendix 1: HIV-Related Data for Kenya, Uganda and Tanzania
Table A1 below presents general knowledge and behavior characteristics of the
population. We see that Uganda has better knowledge and healthier behavior on all
indicators and in Table A2, which shows general health service access, Uganda is again
the highest. Tanzania is roughly equivalent in Voluntary Counseling and Testing (VCT)
but falls behind in other HIV-related medication coverage, like anti-retroviral drugs and
prevention of mother-to-child transmission (PMTCT) services.
Table A2.1: Access to Health Services Kenya Tanzania Uganda % of adults receiving VCT in the last year
0.7 0.6 0.7
Number of VCT clients per year
110,000 110,561 156,000
Number of VCT sites
220 277 153
% of pregnant women offered PMTCT services
12 1 5
% of HIV+ pregnant women receiving ARV prophylaxis
3 0 3
Estimated coverage of ARV therapy
3.1 0.5 3
Source: UNAIDS 2004; Center for HIV Information, University of California-San Diego

25
Appendix 2: Worker Characteristics and Perceptions about HIV/AIDS
A sample of 4950 workers was interviewed in East Africa, of which 80% of workers
interviewed were male and 20% were female. Broken down by country, we have 1,922
workers interviewed in Kenya, 1,597 in Tanzania, and 1,436 in Uganda. Most workers
interviewed (84 percent) had permanent status, rest were temporary employees. The
majority of workers interviewed were between 20 and 40 years of age. The age,
occupational, and educational distribution of the workforce is shown in Tables A2.1-2.3.
Unskilled production workers make up the largest share of the sample, followed by
skilled workers. We also see that about a third of workers have completed primary
school, another third have completed secondary school or vocational training, and 12
percent have a university degree.
Table A2.1: Age distribution of workers surveyed 0-20 21-30 31-40 41-50 51-60 61-70 >70 Number of workers
108 1742 1734 905 371 78 12
Table A2.2: Occupation of Workers Managers Professionals Skilled
production Unskilled production
Non-production
Percent of workforce
9 5 32 39 15
Table A2.3.: Worker Education Tertiary Secondary/
Vocational/ Technical
Primary Did not complete primary
Percent of workforce
12 33 33 22
26
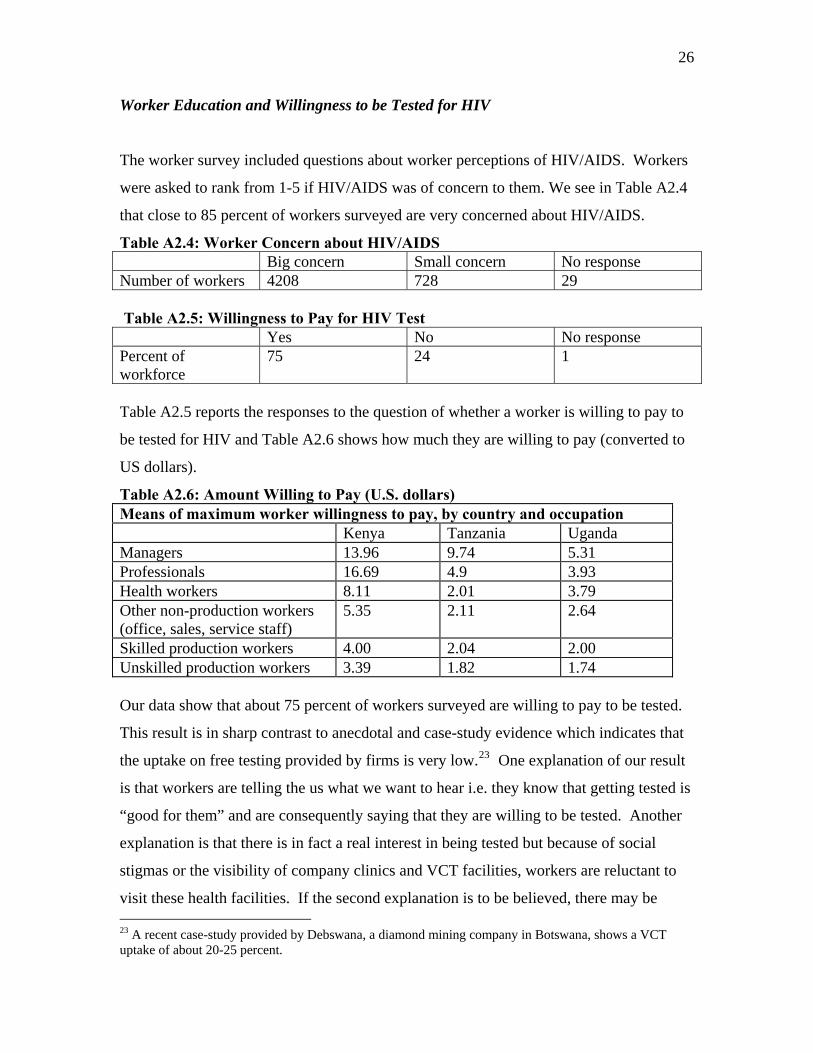
Worker Education and Willingness to be Tested for HIV
The worker survey included questions about worker perceptions of HIV/AIDS. Workers
were asked to rank from 1-5 if HIV/AIDS was of concern to them. We see in Table A2.4
that close to 85 percent of workers surveyed are very concerned about HIV/AIDS.
Table A2.4: Worker Concern about HIV/AIDS Big concern Small concern No response Number of workers 4208 728 29 Table A2.5: Willingness to Pay for HIV Test Yes No No response Percent of workforce
75 24 1
Table A2.5 reports the responses to the question of whether a worker is willing to pay to
be tested for HIV and Table A2.6 shows how much they are willing to pay (converted to
US dollars).
Table A2.6: Amount Willing to Pay (U.S. dollars) Means of maximum worker willingness to pay, by country and occupation Kenya Tanzania Uganda Managers 13.96 9.74 5.31 Professionals 16.69 4.9 3.93 Health workers 8.11 2.01 3.79 Other non-production workers (office, sales, service staff)
5.35 2.11 2.64
Skilled production workers 4.00 2.04 2.00 Unskilled production workers 3.39 1.82 1.74 Our data show that about 75 percent of workers surveyed are willing to pay to be tested.
This result is in sharp contrast to anecdotal and case-study evidence which indicates that
the uptake on free testing provided by firms is very low.23 One explanation of our result
is that workers are telling the us what we want to hear i.e. they know that getting tested is
“good for them” and are consequently saying that they are willing to be tested. Another
explanation is that there is in fact a real interest in being tested but because of social
stigmas or the visibility of company clinics and VCT facilities, workers are reluctant to
visit these health facilities. If the second explanation is to be believed, there may be 23 A recent case-study provided by Debswana, a diamond mining company in Botswana, shows a VCT uptake of about 20-25 percent.
27
significant latent demand for HIV testing.24 This high number may reflect, to some
extent, the workers’ perception of the risk of being exposed to HIV. Finally, if there is
indeed latent demand, it might be realized if VCT were part of a continuum of services,
whereby workers have treatment options available after learning their HIV status.
Table A2.6 shows the amount that workers are willing to pay to get tested; we see that
there is a correlation between work status and amount that workers are willing to pay.
Interestingly, it appears that some workers are willing to pay an amount above the cost of
the test. One implication is that if a fee-based testing option were made available and all
employees took the test, it would become routine and might help end the stigma attached
to testing since it would be a market, consumer-oriented transaction (Birdsall, 2005).
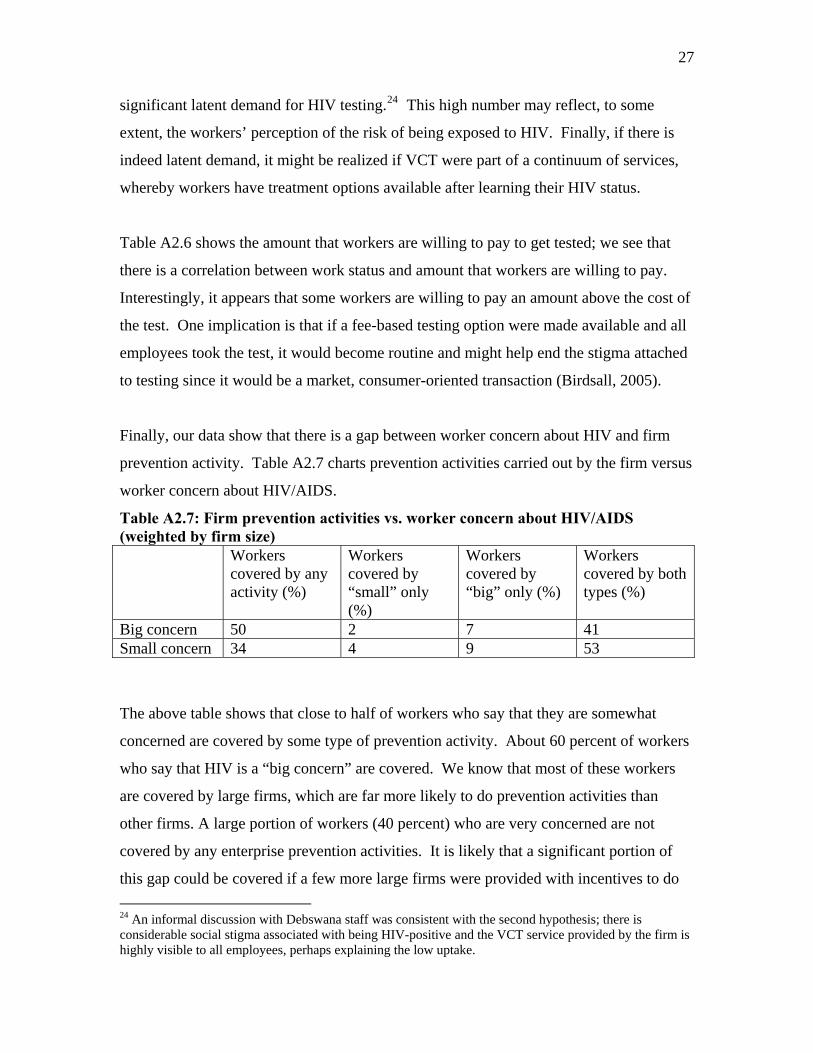
Finally, our data show that there is a gap between worker concern about HIV and firm
prevention activity. Table A2.7 charts prevention activities carried out by the firm versus
worker concern about HIV/AIDS.
Table A2.7: Firm prevention activities vs. worker concern about HIV/AIDS (weighted by firm size) Workers
covered by any activity (%)
Workers covered by “small” only (%)
Workers covered by “big” only (%)
Workers covered by both types (%)
Big concern 50 2 7 41 Small concern 34 4 9 53
The above table shows that close to half of workers who say that they are somewhat
concerned are covered by some type of prevention activity. About 60 percent of workers
who say that HIV is a “big concern” are covered. We know that most of these workers
are covered by large firms, which are far more likely to do prevention activities than
other firms. A large portion of workers (40 percent) who are very concerned are not
covered by any enterprise prevention activities. It is likely that a significant portion of
this gap could be covered if a few more large firms were provided with incentives to do 24 An informal discussion with Debswana staff was consistent with the second hypothesis; there is considerable social stigma associated with being HIV-positive and the VCT service provided by the firm is highly visible to all employees, perhaps explaining the low uptake.

28
prevention activity. Future work will try to determine the “tipping point” at which firms
find it profitable to bear the cost of HIV and engage in prevention activity.

29
Appendix 3: Legality of Pre-Employment Health Testing
There is a fair bit of variance in opinion in whether pre-employment health checks are
illegal in the countries in our sample. There seem to be national policies that ban HIV
testing in Tanzania and Kenya. In Kenya, a court case is currently ongoing with a
woman suing her employer and hospital for testing her without her knowledge and
dismissing her because she was HIV positive, but the legal judgment has not been passed
down into law yet. While it appears that HIV testing as a condition of employment is
illegal, the law appears to be silent on the issue of pre-employment health checks. These
checks are conducted outside the employer-employee relationship i.e. prior to the
potential employee being hired.
It is unclear to what extent pre-employment health checks can identify the HIV status of
the employee; it may well be the case that potential employers can make a guess about
HIV status, particularly in cases where the CD4 count is low. The following chart
summarizes responses received on the question of legality of HIV testing, based on e-
mail responses received to our queries.
Responses to HIV Testing as a condition of employment Type of Respondent Is HIV testing as a condition of
employment legal or illegal in your country?
Local NGO Pre-employment testing is illegal in Kenya. Testing HIV in Kenya must have an expressed consent given by the person being tested without coercion unless it is anonymous and unlinked.
International NGO The current law is silent on the issue on compulsory HIV testing before employment. However, some organization do require medical tests which include HIV testing. What they do is that they send would be employees to their doctors who would by pass you and give the result to the would be employer and if you are HIV positive, they will deny you employment and not give the reason. The draft bill on HIV, which is awaiting

30
debate in parliament, prohibit pre-employment testing and we are hoping that it will be debated soon and be passed without amendments. Otherwise, to get a medical cover when you are HIV positive in this country is a nightmare.
Academic researcher I am quite sure it is illegal in Kenya and Uganda, though I cannot confirm it. I don’t know about Tanzania.
International organization staff HIV status is not pre-employment requirement in Tanzania.
National government officer in Tanzania What is currently happening is only encouraging new employees to go and know their sero status, so it is upon an employee to decide.
31
REFERENCES
Aurum Health (2005), http://www.aurumhealth.org
Biggs, Tyler and Manju Shah (1997), “The Impact of the AIDS Epidemic on African
Firms,” RPED Working Paper no. 72.
Birdsall, Nancy, e-mail correspondence, June 28, 2005.
Bloom, David et al (2004), “Business and HIV/AIDS: Who Me? A Global Review of the
Business Response to HIV/AIDS,” Prepared for the World Economic Forum’s Global
Health Initiative.
Connelly, P. and Rosen S. (2005), “Will small and medium enterprises provide
HIV/AIDS services to employees? An analysis of market demand,” South African
Journal of Economics.
Debswana AIDS Office (2005), Presentation on Debswana HIV/AIDS Program,
Washington D.C., September.
De Walque, Damien (2004), “How Does the Impact of an HIV/AIDS Information
Campaign Vary with Educational Attainment? Evidence from Rural Uganda,” World
Bank Policy Research Working Paper, No WPS3289.
Durier, Sabine (2005), Meeting to discuss IFC Against AIDS Program, November 9.
Fox M., Rosen S., MacLeod W., Wasunna M., Bii M., Foglia G., Simon J.(2004), “The
Impact of HIV/AIDS on Labour productivity in Kenya,” Tropical Medicine and
International Health, Vol. 9
Global Reporting Initiative (2005), www.globalreporting.org

32
Lewis, Maureen (2005), “Addressing the Challenge of HIV/AIDS: Macroeconomic,
Fiscal and Institutional Issues,” Working Paper 58, Center for Global Development.
Mears, Brad (2005), SABCOHA presentation at South Africa AIDS Conference.
Rosen, Sydney (2001), “The Implications of HIV/AIDS for Nigerian Manufacturing
Firms,” RPED Working Paper No. 113, July.
Rosen, S. and Simon J. (2003), “Shifting the burden: the private sector’s response to the
AIDS epidemic in Africa,” Bulletin of the World Health Organization 81(2): 131-37.
Rosen, Sydney et al (2003), “AIDS Is Your Business,” Harvard Business Review, Vol.
81, no.1, February.
Taylor, Kate et al (2004), “Business and HIV/AIDS: A Global Snapshot,” Draft
Manuscript, July.