does microfinance really help the poor? new evidence from ... · (brac), and the bangladesh rural...
TRANSCRIPT

The Financial Access Initiative is a consortium of researchers at New York University, Harvard, Yale and Innovations for Poverty Action.
NYU Wagner Graduate School295 Lafayette Street, 2nd FloorNew York, NY 10012-9604
T: 212.998.7523F: 212.995.4162E: [email protected]
www.financialaccess.org
Does Microfinance Really Help the Poor?
New Evidence from Flagship Programs in Bangladesh
Jonathan Morduch
June 1998
Contributions to this research made by a member of The Financial Access Initiative.

Does Microfinance Really Help the Poor?
New Evidence from Flagship Programs in Bangladesh
Jonathan Morduch
Department of Economics and HIIDHarvard University
and Hoover InstitutionStanford University
First complete draft: 2/26/98
Comments welcome
June 27, 1998
This paper builds on conversations with Anne Case, Angus Deaton, Esther Duflo, Paul Gertler, Guido Imbens,Anjini Kochar, Margaret Madajewicz, Dick Meyer, and, especially, Mark Pitt. I have also benefitted fromconversations with Grameen Bank and BRAC staff in June 1997 and from comments at seminars at StanfordUniversity, UC-Berkeley, the University of Washington, and RAND. Aimee Chin provided critical insights andexcellent research assistance. I am particularly grateful to Shahid Khandker, the World Bank, and the BangladeshInstitute of Development Studies for making their household-level data set accessible. The paper was completedwhile I was a National Fellow at the Hoover Institution, Stanford University. The views expressed here do notnecessarily reflect those of the individuals or institutions above. All views and errors are mine only.

Abstract
The microfinance movement has built on innovations in financial intermediationthat reduce the costs and risks of lending to poor households. Replications of the movement’s flagship, the Grameen Bank of Bangladesh, have now spread aroundthe world. While programs aim to bring social and economic benefits to clients,few attempts have been made to quantify benefits rigorously. This paper draws ona new cross-sectional survey of nearly 1800 households, some of which are servedby the Grameen Bank and two similar programs, and some of which have noaccess to programs. Households that are eligible to borrow and have access to theprograms do not have notably higher consumption levels than control households,and, for the most part, their children are no more likely to be in school. Men alsotend to work harder, and women less. More favorably, relative to controls,households eligible for programs have substantially (and significantly) lowervariation in consumption and labor supply across seasons. The most importantpotential impacts are thus associated with the reduction of vulnerability, not ofpoverty per se. The consumption-smoothing appears to be driven largely byincome-smoothing, not by borrowing and lending.
The evaluation holds lessons for studies of other programs in low-incomecountries. While it is common to use fixed effects estimators to control forunobservable variables correlated with the placement of programs, using fixedeffects estimators can exacerbate biases when, as here, programs target theirprograms to specific populations within larger communities.
Key words: microfinance, project evaluation, Grameen Bank, Bangladesh
Address for correspondence:
Jonathan MorduchHoover Institution L217Stanford UniversityStanford, CA 94305-6010(650) 725-8557

1
1. Introduction
Microfinance has captured the imaginations of many people working to reduce poverty.
The premise is simple. Rather than giving handouts to poor households, microfinance programs
offer small loans to foster small-scale entrepreneurial activities. Such credit would otherwise not
be available -- or would be only available at the very high interest rates charged by moneylenders
(who often charge as much as 10% per month). Moneylenders operate with little competition
since potential entrants quickly find that costs and risks are high -- and borrowers are usually
unable to offer standard forms of collateral, if any at all (Rashid and Townsend, 1993).
However, the emerging microfinance movement demonstrates institutional innovations
that appear to greatly reduce the risk and cost of providing financial services to poor households.
Innovations include contracts that give borrowers incentives to exclude bad credit risks and
monitor other borrowers’ activities, schedules of loans that increase over time conditional on
successful performance, and weekly or semi-weekly loan repayment requirements (Morduch,
1997). The movement is now global, and leaders at the World Bank, United Nations, and other
international organizations have joined in pushing to reach 100 million households around the
world by the year 2005 (Microfinance Summit, 1997). The movement has also generated
considerable support in the U.S. (including the high-profile support of Hillary Rodham Clinton;
Buntin, 1997), and small-scale programs now operate in 300 U.S. sites (Economist, 1997). The
New York Times (1997) has celebrated this “much-needed revolution in anti-poverty programs”
and called for enhanced support.
But how great is the ultimate impact on poor households? While strong claims are made

2
for the ability of microfinance to reduce poverty, only a handful of studies use sizeable samples
and appropriate treatment/control frameworks to answer the question. The present study
investigates a 1991-92 cross-sectional survey of nearly 1800 households in Bangladesh served by
microfinance programs of the Grameen Bank, the Bangladesh Rural Advancement Committee
(BRAC), and the Bangladesh Rural Development Board (BRDB). The sample also includes a
control group of households in areas not served by any microfinance programs. The three
lending programs considered here together serve over four million poor clients in Bangladesh, but
their role is much broader. The Grameen Bank is the flagship of the international microfinance
movement, and its model has now been replicated on four continents, including sites in the United
States as varied as rural Arkansas and inner-city Chicago.
Simple estimates of impacts show clear achievements. For example, if households served
by the Grameen Bank are ordered by the amounts they have borrowed from the program, the top
quarter enjoys 15% higher consumption per capita than households in the bottom quarter. In
addition, 62% of the school-age sons of Grameen Bank borrowers are enrolled in school versus
34% of the sons of eligible households that do not borrow. For daughters, the Grameen
advantage is 55% versus 40%.
These simple comparisons appear to be driven entirely by selection biases, however. Once
appropriate comparisons with control groups are made, access to the three microfinance programs
does not yield meaningful increases in per capita consumption, the education of sons, nor the
education of daughters. If anything, the levels are slightly lower than for control groups. The
results are surprising and contradict frequent claims made about the programs in international
discussions of microfinance.

1Simple evaluations are subject to multiple selection biases: self-selection into the programs by the mostable, non-random program placement, and endogenous determination of the intensity of participation (e.g., the sizeof loans in microfinance). The typical problem stems from the near impossibility of finding good instrumentalvariables.
3
Access to the programs does, however, appear to aid the diversification of labor supply
across seasons. In turn, access is associated with a reduction in the variability of consumption
across seasons. Thus, while the programs may not increase consumption on average, they may
offer households ways to smooth consumption through smoothing income. In pointing to impacts
on vulnerability, the results highlight an advantage that is seldom considered in the emerging
microfinance literature (an exception is Pitt and Khandker, 1998b). These benefits should be
judged against the tens of millions of dollars that have supported the programs.
The results also demonstrate how misleading simple performance indicators can be, and
they hold lessons for evaluations of similar public health and other social programs in low-income
countries.1 As here, such programs are often limited to particular regions and particular target
groups, typically poor households. Unlike in wealthier countries, income-based means tests are
almost never used. Instead, for example, the microfinance programs in rural Bangladesh focus on
the “functionally landless” -- implemented as a rule barring lending to households owning over a
half acre of cultivable land.
The program rule can be the basis of a plausible econometric strategy if the eligibility
requirement is strictly enforced and built around a feature that is exogenous to the household.
Then, clean impacts can be gauged by comparing the status of households clustered just below the
arbitrary dividing line to households clustered just above. This approach is a form of regression
discontinuity design (Campbell, 1969), and the insights provide the basis of Pitt and Khandker’s

2Data on landholdings before participation are thus required in order to gauge the robustness ofcomparisons. The bottom four rows of Table 1, however, suggest that the results will not change dramatically onthis score.
4
work (1998a and 1998b; they use the same data as used here).
But the idea can not be implemented reliably in this sample. The data demonstrate
frequent violations of the rules. For example, 30% of Grameen borrowers own more land than
the half-acre cut-off, with landholdings as large as fourteen acres. Among households labeled in
the survey as “eligible” to borrow and with access to programs, the fraction of borrowers is nearly
twice as high for those holding over half an acre versus those below (63% versus 34% for the
three programs combined; The first two rows of Table 1 give figures disaggregated by program).
Counter to historical observations suggesting an absence of land markets in South Asia, there is
also substantial evidence of land sales. The data show that nearly one eighth of borrowers
purchased substantial amounts of land in the six years prior to the survey.2
The approach below instead exploits the treatment/control aspect of the data through
comparisons across villages. The groups in villages not served by programs were sampled with
strict adherence to the half acre rule, however, and the asymmetry with groups in program villages
creates problems here as well. A solution is to turn the sampling strategy on its head. While the
sample was designed so that the control groups are comparable to the “treated” groups, the rule
violations require that the treatment groups be redefined in order to bring them into conformity
with the controls.
An additional concern is given by non-random program placement. Upward biases arise
when programs choose regions that are already doing well, and downward biases arise when
programs favor disadvantaged areas. The typical response to the problem is to estimate impacts

5
while including region-level fixed effects or their equivalent (e.g., Pitt and Khandker, 1998a).
Counter to frequent assertion, however, this is not a panacea for addressing non-random program
placement. Indeed, including region-level fixed effects can exacerbate bias when program
placement is predicated on unobserved qualities particular to target populations. The data
suggest that this is often the case. But, with the exception of the results on reduced variability
and labor supply, the main qualitative results are robust both with and without controls for
village-level unobservables.
The next sections below describe the data set, methodology, and results. Findings are
then related to those using Pitt and Khandker’s (1998a) “weighted exogenous sampling maximum
likelihood - limited information maximum likelihood - fixed effects” (WESML-LIML-FE)
approach. Pitt and Khandker, who were both involved in the data collection, use regression
discontinuity design to estimate marginal impacts rather than the average impacts described here.
They find positive impacts on household consumption and negative impacts on male labor supply,
in contrast to the findings below. Moreover, their results suggest that lending to women may
bring larger social benefits than lending to men, a result that they interpret within the context of a
model of intrahousehold allocation. But since women on average receive smaller loans than men,
in principle the finding may reflect diminishing marginal returns to capital rather than the position
of women within households. Their general approach is recast as an instrumental variables
problem that helps clarify necessary identifying restrictions and illustrates broader methodological
differences.

6
2. Empirical Strategy and data
The survey was collected by the Bangladesh Institute for Development Studies in
collaboration with the World Bank. The survey covers 87 villages and was completed in 1991-
92. Villages in 5 subdistricts in the sample are not served by any of the three programs, while
villages in the remaining 24 subdistricts are. Villages in both types of subdistrict were chosen
randomly from a village census and microfinance program lists, respectively. Just over 20
households were surveyed per village, yielding useable data on 1798 households, 1538 of which
are eligible to participate and have access to programs. Within the latter group, 905 participate.
With few exceptions, only one program operates in any given village, and households must be
resident to be eligible to borrow.
Data on outcomes were collected at three points during 1991-92 to capture seasonal
variations in household circumstances. The data were collected following the harvests of the
three main rice seasons, Aman (December/January), Boro (April/May) and Aus (July/August).
Aman is the main rice harvest and Aus is considered the “hungry season” (Pitt and Khandker,
1998b).
The data set can be divided into five different types of households, represented in Figure 1
for a typical village with a program and one without. The eligibility rule is meant to exclude
households with more than half an acre of land from participating. This includes group A in
village 1 and group B in village 2; the latter group would be eligible to borrow if a program was
available.
Groups C and D are eligible to borrow, but only those in group D in fact participate. Since
they are self-selected (or selected by loan officers), households in group D cannot be simply

3Non-participants are affected through demonstration effects, enhanced competition in credit supply, andincreased demand for labor and goods. Positive spillovers to eligible villagers that choose not to participate canexaggerate impacts on borrowers, but spillovers are not an issue if concern is just with the impact of eligibility. When eligible non-borrowers get positive spillovers, the calculation here attributes those impacts fully to impactson borrowers, biasing upward measured impacts. Similarly, negative spillovers will diminish measured averageimpacts.
7
compared to households in group C or in group E without introducing the possibility of bias.
According to Hashemi (1997) nearly half of all non-participants in a region served by Grameen
and BRAC indicated that they did not borrow for fear that they would not generate high enough
returns to be able to repay loans. They thus self-select out of the pool of participants, and
comparisons of borrowers versus non-borrowers will be biased upward.
A more promising comparison is between all households in groups C and D versus those
in group E. Under the assumption that landholding is exogenous, membership in either C or D or
in E is not affected by self-selection, and differences in outcomes should reflect the presence of
the program in village 1. The focus is thus on measuring the impact of eligibility rather than
participation, just as researchers, for example, estimate the impact of a population’s “exposure” to
health clinics, rather than the impact of their actual usage.
Estimates of the impact on participants (and impact per taka borrowed) can be recovered
under the assumption that there are no spillovers from program clients to non-participants. With
no spillovers, the average impact per participant is calculated by dividing the impact per eligible
household by the proportion of eligible households that participate.3 Similarly, the average impact
per unit borrowed is calculated by dividing through again by the average loan size, yielding a
Wald estimate of the impact.
In Aman season, for example, the average logarithm of consumption per capita in the

8
previous week for eligible Grameen households was 4.30, while log consumption was 4.20 for
“eligible” households in villages without programs (an 11% difference). As described above,
however, the programs are lax in following their eligibility rules. When strict, de jure definitions
of eligibility are used instead of de facto practice, the advantage falls to 4.24 versus 4.20, a 4%
difference. Assuming away spillovers, this is approximately an 11% increase per borrower, and
an elasticity with respect to the value of cumulative borrowing of about 0.004.
Controlling for non-random program placement
The comparison above, however, may reflect general differences across villages.
Assuming that spillovers are minor (from D to groups A or C), outcomes for the combined
groups C and D can be compared to outcomes in group A, while a similar comparison can be
made for group E relative to B in village 2. These within-village differences can then be
compared across the two villages, yielding a refined estimate of the average impact of eligibility.
The difference in log consumption using de facto classifications is -0.41 in Grameen villages and -
0.28 in control villages. Relative to wealthier households, eligible household in Grameen villages
fare about 14% worse than those in control villages. The comparisons reverses the advantage to
being eligible for Grameen programs.
When the sample is instead divided by the strict, de jure eligibility criterion, the
disadvantage deepens. The difference within Grameen villages in now -0.48 versus -0.28 in the
control villages, a disadvantage of about 22%. Generalizing the approach to control for relevant
household characteristics and village-level fixed effects in a regression framework leads to similar

4The fact that wealthier households in each village are barred from participating makes it possible toemploy village-level fixed effects to control for village-level unobservables in the cross-section – while stillidentifying average impacts of program access. The feature provides an econometric advantage over evaluations ofprograms open to everyone in a given region (in which case, longitudinal data are required in order to control forvillage-level unobservables.)
9
qualitative results.4
But a simple illustration below shows that if programs locate on the basis of qualities
specific only to target groups, employing of the fixed effects may not be an improvement. It will
not remove all biases due to non-random program placement -- and could exacerbate bias by
setting up the wrong benchmark by which to measure program performance. The problem arises
since the programs explicitly limit their attention to just functionally landless households. Thus,
the critical unobservables will be those specific to target groups within villages, not just
unobservables that affect all villagers equally. As a consequence, straight differences restricted to
target samples may be more revealing than differences-in-differences using the full sample.
Consider the regression equivalent of the difference-in-difference method. Outcome Y for
household i in village v can be described by the linear relationship:
(1)Y e b e d Xiv iv v iv v v k ivk ivk
K
v
V
= + + + +=
+
=∑∑α α γ α ε1 2
3
3
1( ) ,
where e gives “eligibility status” (irrespective of whether a program is in fact available), b gives
program availability in the village, the K X’s control for household characteristics, the dv are a set
of village-level dummy variables, and eiv is an idiosyncratic error term with mean zero. The
coefficient a1 gives the difference-in-difference, the impact over and above both the village mean
and the fact of being “eligible”. (In the application below, this coefficient is disaggregated by
program to account for heterogeneous impacts.)

10
For expositional clarity, the X’s can be ignored. If equation (1) characterizes the process
that actually generates the data, all is well and good. But instead imagine that the unobservables
vary by target group and location such that:
Y e b e m e biv iv v iv iv iv v= + + + = =α α ε1 2 1 1( ) ,if and
Y e b e n e biv iv v iv iv iv v= + + + = =α α ε1 2 0 1( ) ,if and
Y e b e p e biv iv v iv iv iv v= + + + = =α α ε1 2 1 0( ) ,if and
Y e b e q e biv iv v iv iv iv v= + + + = =α α ε1 2 0 0( ) .if and
The unobservables will simply difference out when estimating using village-level fixed effects if m
= n and p = q. The estimate of a1 will then be unbiased.
There is nothing beyond convenience to support the assumption that the unobservables
take that pattern. It is more likely that the roles of unobservables vary systematically within
villages. It would not be surprising to find, for example, that functionally landless households in
different villages have as much or more in common (in terms of unobservables) than rich and poor
household in the same villages. The issue hinges not just on whether households are exposed to
the same environment. The crux is the way that the environment translates into elements of
outcome equations.
Consider the case in which m = p = q = 0, while n > 0. Across villages, the “eligible”
households look reasonably similar ex ante, but wealthier households in program villages have
unobservably better outcomes than others. Comparing outcomes of just the eligible households in
different villages will yield unbiased estimates of impacts (i.e., just looking at differences).
But estimating equation (1), the difference-in-difference, will yield impacts with

5An additional tension with the difference-in-difference estimates arises because no participatinghouseholds are included in the sample of ineligible villagers, even though some have landholdings equal to (orgreater than) those in the sample of ineligibles -- raising the question about whether households with over half anacre were truly sampled randomly. Another source of bias is due to positive spillovers to ineligible householdswithin program villages. The spillovers show up as increases in the overall welfare of the village. These impactswill be removed by taking differences-in-differences or by including village-level fixed effects in regressionanalyses. In that case, these positive spillovers diminish the measured average impact of the programs (Pitt andKhandker, 1998a), but they are unlikely to have qualitative impacts.
Using longitudinal data will not necessarily eliminate the concerns here. With longitudinal data,comparisons can be restricted to the same households at different points in time, and unobserved household-levelfixed factors that determine levels of outcomes can be differenced out. However, this is not a panacea sinceunobservables correlated with changes in outcomes remain. Imagine an individual deciding whether or not toapply for a loan. Their choice will rest ultimately with the potential income gain versus the cost of the loan. Sinceincome growth will be driven partly by unobserved variables, correlations remain between unobservables andchanges in outcomes before and after borrowing. In principle, evaluating first-differences of the data couldexacerbate bias since “true” variation may diminish relative to the impact of the unobservables. The sorts ofconcerns above will thus arise in evaluations using either cross-sectional or longitudinal data.
11
downward biases. This can be seen most easily by assuming that a2 = 0 and allowing m to be non-
zero. Estimating with village-level fixed effects yields an estimated impact $ ( ).α α1 1= − −n m
The bias will be negative when n > m. The sign on the coefficient can flip when the magnitude of
the unobservables for wealthy households is sufficiently larger than the unobservables for the
functionally landless -- and there is no reason to see this as a remote possibility given the degree
of polarization often evident in villages.
Given ignorance about the nature of unobservables, the best course is to consider both the
differences and differences-in-differences without prejudice. It turns out that, for the most part,
the qualitative results below are consistent across specifications. Appendix Table 2 gives
averages of selected village-level characteristics for the treatment and control groups, and almost
all are within similar ranges.5

12
3. Identifying assumptions: mistargeting
The key to the regression discontinuity design strategy is the exogeneity of landholdings,
and the implementation of the eligibility cut-off at a half acre, resting on the assumption that land
sales seldom occur. The assumptions can be checked, since the data set contains all land
transactions between December 1986 and 1992 for borrowers in the programs.
These records show considerable market activity for land, with purchases far outweighing
sales. The record of purchases undermines the received wisdom that in South Asia landholdings
can be taken as exogenous -- mainly acquired by gift or inheritance (e.g., Binswanger and
Rosenzweig, 1986).
Moreover, Table 2 shows considerable mistargeting: overall, 20-30% of borrowers are
over the mandated land cut-off. This evidence is similar to that found in a recent survey of BRAC
participants by Zaman (1997; he finds that 28% of households are mistargeted), but it is
considerably higher than previous evidence on Grameen. For example, Hashemi (1997, p. 44)
reports on a survey that found that 5.6% of participant households were mistargeted in 1982 and
4.2% in 1985. Much changed, though, between 1985 and 1991: Grameen expanded nearly seven
times, from covering 3,666 villages to covering 25,248 (Grameen Bank, 1993), so the expansion
of mistargeted households is far less surprising.
Figures 2 and 3 show these relationships graphically, using a nearest neighbor non-
parametric estimator of eligibility status (de facto) run on landholdings (with a bandwidth of 25
neighbors). The sample is restricted to households with less than 3 acres in program villages.
Figure 2 shows clearly that 0.5 acre is a focal point in the data. But while there is a steep decline
in the probability of eligibility after 0.5 acre, the probability hovers above 0.20 through most of

13
Pro
ba
bility o
f E
lig
ibility
Fig 2. Probability of Eligibility, nn = 25Land, after, decimals
25 50 75 100 125 150 200 250 300
0
.25
.5
.75
1
Fig 3. Probability of Borrowing
Pro
ba
bili
ty o
f B
orr
ow
ing
25 nearest neighborsLand, after, decimals
25 50 75 100 125 150 200 250 3000
.25
.5
.75
1
Pro
ba
bili
ty o
f B
orr
ow
ing
50 nearest neighborsLand, after, decimals
25 50 75 100 125 150 200 250 3000
.25
.5
.75
1
Pro
ba
bili
ty o
f B
orr
ow
ing
100 nearest neighborsLand, after, decimals
25 50 75 100 125 150 200 250 300
0
.25
.5
.75
1
Pro
ba
bili
ty o
f B
orr
ow
ing
200 nearest neighborsLand, after, decimals
25 50 75 100 125 150 200 250 300
0
.25
.5
.75
1

6The mistargeting could be explained simply by the exact nature of the eligibility rule, which is generallytaken to refer just to cultivated land, not to all land. However, data on cultivated land are available, and it does notchange the picture much. According to Hossein (1988, p. 25), after 1983, “a person from a household that ownsless than 0.5 acre of cultivated land, or assets with a value equivalent to less than 1.0 acre of medium-quality land,is eligible to receive a loan.” Prior to 1983, the cut-off had been 0.4 acre.
14
the sample, indicating the broad extent of mistargeting.
More strikingly, Figure 3 shows no substantial decline in the probability of borrowing at
0.5 acre. If anything, there is a temporary increase. The lack of discontinuity suggests while
regression-discontinuity design should work in principle, the lax implementation of the program
rules undermines the application here.
Particular problems arise since looseness in applying the rule is likely linked to unobserved
borrower quality. It would be natural, for example, for loan officers to bend the rules for
particularly promising potential borrowers, but not for others. While the data lack retrospective
landholdings for non-participants, the final column of Table 2 shows that the mis-targeting is not
just due to land accumulation after becoming a borrower. There is considerable mis-targeting on
the basis of initial holdings as well. (One decimal equals 1/100 acre.)6
The mistargeting also creates problems when comparing differences across villages.
Unlike in program villages, the “eligible” in control villages were chosen by the survey team
strictly on the basis of having total land holdings below 0.5 acre. Many are just at 0.5 acre or very
slightly below, but, as Table 2 shows, none are above. This asymmetry creates the problems of
comparability.
Table 3 shows that the asymmetry is often dramatic, with the largest landowner among
Grameen participants holding nearly 14 acres, slightly more than the largest “ineligible” land

7The largest initial landholding by Grameen borrowers was 5.72 acres. Pitt and Khandker exclude 41ineligible households with greater than 5 acres of land to aid comparability, but they do not exclude programparticipants on the basis of landholdings. Eight participants hold over fixe acres.
8One concern in a regression framework is that landholdings may absorb some of the impact ofmicrofinance. One way to address this problem is to instrument for current landholdings with initial landholdings. However, preliminary investigation suggests that doing so reduces precision and pushes measured credit impactseven further downward.
15
owner in Grameen villages.7 The average landholding for mistargeted households is about 1½
acres. Table 3 also shows that average landholdings for program villages and controls are similar
for those households holding less than 0.5 acre.
Table 4 shows patterns of accumulation by program participants: 883 of the 905
participants have land, and 191 added more land while 21 reduced landholdings. The
accumulation was not minor. For the 22% with positive accumulations, the ratio of the average
increase to average initial landholding is 59%. On the other hand, just 2% of participating
households in the sample reduced landholdings. This calms the fear that some households are
disposing of land to satisfy the eligibility criterion, but it is only partly helpful since the result
likely stems from laxness in the criterion’s implementation.
In general, households that have less land are buying homestead land and land containing
ponds, orchards, and bamboo groves, as well as land for cultivation. This is seen in Table 5.
Most of the land acquisitions come through inheritance or purchase, with gifts, dowry, and other
sources playing negligible roles. Inheritance and purchase account for roughly equal shares of
transactions, running counter to the “stylized fact” that nearly all of the action is from bequests.8
Since land data are available, it is possible to impose the 0.5 acre rule on the program
households and exclude the group that is cut off (and re-weight accordingly). The fact that there
16
is only data on initial landholdings for participants, coupled with the data showing accumulation,
poses a potential problem. Take two households, one that participates in a credit program, the
other from a control village. They both start with 0.3 acre. If the former is successful in
borrowing, they may choose to double their landholdings, forcing their removal from the re-
defined treatment group and biasing impacts downward if measured on the basis of current
landholdings. But the opposite could be the case if the control households accumulate relatively
more quickly. Defining groups based only on 1991-92 land data will generally be less favorable
for finding impacts than using the initial land data for participants. In using the latter data here,
the comparisons give the programs a slight edge, but not one that matters decisively.
4. Results
Tables 6 through 11 give simple difference of outcomes for control and treatment groups.
Interpretations of the results hinge on exploiting randomization in the survey design, coupled with
the proposition that there should be no bias due to the endogeneity of participation when
considering a strict, de jure notion of eligibility and considering the impact of access to programs,
rather than participation itself.
But it is useful to consider differences between borrowers and non-borrowers as well,
bearing in mind the selection problem. These comparisons are given in Table 12. The
differences-in-differences can also be extended to allow for covariates. These include the
logarithm of landholdings; an eligibility status indicator; sex, age, and education of household
head; maximum adult female/male education levels; indicators for absent male/female/spouse of
head; and the number of relatives of the head and spouse that hold land. In addition, a set of

9Data inconsistencies precluded investigating asset accumulation of women, another important indicator.
17
village level characteristics helps to control for non-random program placement (see Appendix
Table 2). Table 13 gives three sets of results for each dependent variable. The first set pertains to
a sample restricted to “functionally landless” households holding less than half an acre --
paralleling the differences shown in earlier tables. The second adds village-level variables, and
best compares “like with like” by restricting the sample but allowing for village-level differences.
And the third pertains to the full sample. In the latter, village-level fixed effects are included --
paralleling the differences-in-differences approach.
Table 6 gives impacts on per capita household consumption in the week prior to each of
the three survey rounds (total consumption excluding net savings).9 The logarithm of the three
seasonal measures is averaged to yield a measure of the average logarithm of consumption across
the year. Alternative specifications that replace per capita consumption with consumption per
adult equivalent differ little.
The top left panel of Table 6 gives weighted averages for groups by official de facto
eligibility status and location (i.e., using the codings taken from the survey that include the
mistargeted households). The three columns on the right give outcomes in Grameen, BRAC, and
BRDB villages, respectively, as absolute differences of the outcome in the control villages. The
bottom row gives differences between the first row and second. The three cells in the lower right
corner give differences-in-differences: impacts on eligible households relative to the levels of
ineligible fellow villagers and relative to the controls.
Putting the bottom row figures into percentage terms shows that on average the eligible
groups consume 31% - 52% less than the level of non-eligible groups in like villages. The

18
difference-in-difference with respect to Grameen villages is zero: there is no discernible impact on
log consumption relative to the controls. The difference-in-difference in BRAC villages is
similarly small (-2%), and for BRDB, the difference is -15%. None of these measures are
statistically significant at conventional levels, however.
The difference-in-differences are pushed down when the non-eligible group does
disproportionately well, and this appears to be the story here. Looking at the right-most columns
shows that eligible households in BRDB villages consume 6% less on average than eligible control
households. The reason for BRDB’s particularly poor showing in the difference-in-difference is
due to the fact that, at the same time, the non-eligible households consume 8% more than the
relevant control group, yielding the difference-in-difference of about 15%.
Table 7 shows the role that mistargeting plays. Using groupings based strictly on having
landholdings less than 0.5 acre removes the impact of the mistargeted households (weights are re-
calculated accordingly). Households in Grameen Bank villages, where the mistargeting was
greatest, now have net consumption levels 7% below the controls according to the difference-in-
difference (rather than zero difference). Similarly, they consume 7% less than the controls when
comparisons are kept just to the simple difference across households with less than 0.5 acre. In
contrast to the results above, this latter difference is statistically significant with 95% confidence.
The BRDB difference is also 7% below the level of the controls — and 19% below in the
difference-in-differences (and both are statistically significant). The BRAC difference-in-
difference is 6% below the controls, but not statistically significant. The results are echoed in the
first row of Table 13, where the point estimates are negative but not statistically significant.
These simple comparisons show that households eligible for microfinance participation

19
consume no more than similar households without access to programs. If the results are correct,
why do households participate? Table 8 shows that households may benefit from risk reduction.
The table does the same exercise as above with the average variance of the logarithm of per capita
household consumption, measured across the three seasons by household. The variance of the log
provides a simple measure of consumption variability from season to season. It weighs periods of
unusually low consumption more than unusually high consumption, in accord with common
notions of vulnerability. (All tables below report differences based on de jure classifications.)
The results here show that the households served by the microfinance programs all do
substantially better than control households in this respect. While the average levels of
consumption are lower, this table shows compensation via lower variability as well. The
difference-in-difference indicates a reduction of 47% for eligible Grameen households, 54% for
eligible BRAC households, and 51% for eligible BRDB households. The results are all
statistically significant at the 95% level (the 94% level for eligible BRAC households).
The relative reductions are dramatic. But they are driven mostly by the comparisons to
the ineligible households in villages with programs, and the simple differences yield reductions of
just 11 - 17% (echoed again in Table 13). The patterns stem from the fact that seasonal variability
is similar across landholding groups in the control villages, but relative variability is much higher
for the wealthier households in the villages with programs — a result that is surprising given that
they are likely better able to smooth consumption through borrowing and saving.
However, Table 9 suggests that most of the variability in consumption is reduced via
income smoothing, not consumption smoothing. Again, the non-eligible households within
program villages have much more variable levels than the eligible households. For them, the

20
variance of log labor is 44 - 79% higher than the controls, while for eligible households, the
variance is 3 - 13% lower. The difference-in-difference combines to show sharply lower relative
variances (39 - 46% lower). The t-statistics are relatively high, but not above standard confidence
levels; however, the differences-in-differences become significant at the 90% level once covariates
are added. The straight differences for Grameen in Table 13 yield point estimates that are not
much smaller.
Table 9 also provides information on average labor supply per adult. Eligible Grameen
households have 7% higher average labor supply than the controls, while BRAC households have
7% lower averages, with the former being significant. The differences-in-differences wash out
these results, yielding only large and significant results for BRDB households. On average,
eligible adults work 31% more than the relevant comparison group. Again, there qualitative
results carry through when covariates are added to Table 13.
Table 10 considers labor supply of men and women. The differences between program
villages and controls show that men and women work more in the program villages relative to the
controls (with the exception of women in BRAC villages). The results are robust for men in the
difference-in-differences: they appear to work disproportionately much. However, the results for
women are reversed once allowances are made via comparisons with wealthier villagers. The net
labor supply of women in Grameen villages is 56% of that of the controls. For women in BRAC
villages, the net labor supply impact is 70% of the controls. Once covariates are considered, the
BRAC difference-in-difference for female labor supply becomes statistically significant at the 90%
level.
The final issue is impacts on education. A key thrust of the programs is to promote health

10These results are very similar to those found by Chase (1997) in an independent study that used theWorld Bank/BIDS data set.
21
and education in addition to good businesses. Promoting the education of daughters is
highlighted in particular. On the face of it, the programs are very successful. In Grameen
villages, 62% of the sons (age 5 to 17) of borrowers are in school versus just 34% of the sons of
non-borrowers. Similarly, 55% of borrowers’ daughters are enrolled versus 41% for non-
borrowers’ daughters. (Table 12 shows similar numbers for the sample restricted to households
with less than half an acre.
However, the differences-in-differences in Table 11 show that all children in program
areas fare worse than those in controls, with the exception of sons born of poor households in
Grameen villages.10 The pure differences show that some in functionally landless households in
villages served by BRAC are more likely to be enrolled relative to children from other areas, but
this is also true for children in better-off households where BRAC operates. Adding covariates in
Table 13 does not change the basic story. The middle three columns show that the education of
daughters is notably lower for eligible households in program villages versus control villages.
Relative to the controls, there is no obvious success story here.
5. Interpretations and robustness
The results in the bottom two panels of Table 12 are close to what might be expected if
self-selection is key – or if spillovers are small and the programs make a large difference in the
lives of their clients. Those two panels show that the children of borrowers are substantially more
likely to be in school compared to the children of non-borrowers.

22
The table also gives results that would not be expected based on simple self-selection
stories. For example, the log of consumption per capita and its variance are very close for
borrower and non-borrower households in BRAC and Grameen villages. Slightly larger
differences are seen for the labor variables, but the differences here are markedly smaller than the
differences with non-eligible households.
Surprisingly, the variance of log consumption is higher for BRDB borrowers than non-
borrowers in BRDB villages. But the finding reinforces the assertion that consumption smoothing
is driven by income smoothing – since a similar relationship holds for the variance of log labor in
BRDB villages.
The results in Table 13 are qualitatively very similar to the simple differences described
above. As mentioned before, the education results, especially for daughters, are now murkier.
The gender-specific labor supply results are also more mixed now.
Overall, the key findings are strengthened, however: eligibility to participate in the
programs is associated with large decreases in the variability of consumption and labor supply.
The differences-in-differences for labor-smoothing are now measured with greater statistical
precision. As above, the results on reduced variability stem entirely from the differences-in-
differences; the simple differences show no real advantages to microfinance eligibility. The extent
to which this is a robust finding depends on the extent to which the higher variability levels for
non-eligible households in program villages represent the norms for those villages. That issue can
only be resolved with longitudinal data. Also as above, positive impacts on consumption remain
elusive.

23
6. Comparisons to previous work
The results obtained above contrast with those found using Pitt and Khandker’s (1998a)
WESML-LIML-FE approach. They find positive marginal impacts on consumption and male
schooling, and negative marginal impacts on labor supply. The labor supply results can be
reconciled. The female labor supply results here are also negative, and the average impacts found
here for males may be positive but declining. But the negative average impacts on consumption
are not easily reconciled with positive marginal impacts.
Instrumental variables approaches
The difference-in-difference strategy shares elements with a simple instrumental variables
approach, and it is helpful to draw the parallels in order to compare the main results here with
those in previous work. The strategy can be seen in relation to the groups in Figure 1. The idea
is to use membership in group C or D (which is arguably exogenous) as an instrument for
membership in group D only. The instrument is thus whether a household both lives in an area
served by a program and holds a half acre or less. Identification rests on there being no direct
impact of the interacted term on impacts of interest (once landholdings and location are controlled
for independently). The econometric specification also allows controls for a broad range of
covariates and village-level fixed effects (akin to using A and B as reference groups).
Figure 1 gives the notation that is used below. The indicator b = 1 if there is a
microfinance bank available, e = 1 if the household is eligible (or would be), and c = 1 if the
household actually receives credit. The variables equal zero otherwise.
When the outcome of interest is the vector of incomes Y, say, the impact of credit C is

11I thank Mark Pitt for stressing the importance of this distinction. In an earlier draft, two-stage leastsquares estimates were presented. The results were qualitatively similar to the results here, but the simpledifferences-in-differences are preferred.
24
specified linearly as:
(2).uXCY ++= γδ
Latent credit demand is given by
(3).* να += ZC
The matrix X includes household- and individual-specific variables, as well as a full set of village
fixed effects, and and reflect unmeasured household-specific variables (withu ν
Concern with selection bias is given by the possibility thatE u X Z e b E X Z e b[ , , , ] [ , , , ] ).= =ν 0
The identification problem is complicated by the fact that Z d X; i.e., there are no.0][E ≠νu
standard variables that explain latent credit demand but which do not plausibly also help explain
variation in outcomes of interest. A solution to the identification problem arises by noting that for
household i in village v
(4)
C e b
C CC C C e b
iv iv v
iv iv
iv iv iv iv v
= = == <= ≥ = =
0 0 0
0 00 1 1
if or
ifif and and
,
,.
*
* *
Thus, credit received can be rewritten as
(5)C e b c C e b c C Civ iv iv iv c iv v iv iv c= + −( ),*
where is the average amount borrowed by participants. Apart from the first line of equationCc
(4), this is a standard instrumental variables problem.11 Equation (5) suggests a potential

12This discussion captures the essence of Pitt and Khandker’s procedure. Their limited informationmaximum likelihood approach entails estimating credit demand in a first stage Tobit using just households inprogram villages that are eligible to borrow (eiv bv = 1). The resulting predicted credit amounts are then enteredinto the second stage, with others (eiv bv = 0) receiving zeroes for predicted credit demand. This essentially creates instruments of the form (eiv bv Ziv). In their application, Pitt and Khandker also explore the impact by gender andby each of the three programs using the same structure. Population weights capture weighted exogenous sampling(WESML). The instrumental variables approach parallels limited information maximum likelihood (LIML). Andadding village-level dummy variables addresses the fixed effects (FE).
25
instrument is the indicator of potential eligibility interacted with an indicator of program
availability (eiv bv). This instrument will be correlated with the first term on the right hand side of
equation (5), but not the second. Thus, it will deliver an estimate of average impacts, not
marginal.
The instrument set can be expanded to include variables correlated with second term in
equation (5). The candidates are interactions of household characteristics with the dummy
variable that equals one only if the household has program access and is eligible -- i.e., eiv bv Ziv,
where the Ziv include any or all variables in the latent credit demand equation.12 Since these
instruments will be correlated with the second term in equation (5), they explain the intensity of
participation, not just incidence (and the exclusion restriction on eiv bv can now be dropped.)
At its root, the strategy is an application of regression-discontinuity research design. But
as illustrated in Figure 3 above, violations of the eligibility rule undermine the use of this strategy.
Figures 4 and 5 explore more closely the empirical bases underlying the approach. Figure 4
echoes Table 1 in showing how the probability of borrowing increases with landholdings above
0.5 acre. The sample is restricted to eligible households in two overlapping

13The key explanatory variable is total borrowing from microfinance programs between December 1986and 1992, converted into 1992 prices using regional deflators. Thus a stock is being used to explain a series offlows.
26
Fig 4. Probability of Borrowing, Pitt-Khandker Samples
Pro
ba
bili
ty o
f B
orr
ow
ing
Pitt-Khandker Male Sample, nn=50Land, after, decimals
255075100125150200250300 400 5000
.25
.5
.75
1
Pro
ba
bili
ty o
f B
orr
ow
ing
Pitt-Khandker Female Sample, nn=50Land, after, decimals
255075100125150200250300 400 5000
.25
.5
.75
1P
rob
ab
ility
of B
orr
ow
ing
Pitt-Khandker Male Sample, nn=50Land, after, decimals
25 50 75 100 125 150 200 250 300
0
.25
.5
.75
1
Pro
ba
bili
ty o
f B
orr
ow
ing
Pitt-Khandker Female Sample, nn=50Land, after, decimals
25 50 75 100 125 150 200 250 300
0
.25
.5
.75
1
samples used by Pitt and Khandker (1998a). The “male access” sample excludes villages with
only female groups, and the “female access” sample excludes villages with only male groups.
The top two panels of Figure 5 show that cumulative borrowing also increases with
landholdings.13 The bottom two panels show that conditional on borrowing, the relationship is
flat after 0.5 acre. The figures show substantial variation on the high end. One consequence is
that, despite the instruments, the effects of endogeneity can slip in via mistargeting, as argued
above.
A contributing factor is that Pitt and Khandker’s framework for estimating marginal
impacts implicitly rests on a long series of exclusion restrictions. Their second stage includes six

14Entering these interactions in the second stage is technically feasible in their set-up. Despite theemphasis put on the quasi-experiment by Pitt and Khandker, identification does not rely on it. In their currentspecification, the control group (non-program village) data increases the efficiency of the estimates, but they arenot strictly required for identification. They would be needed, however, to identify interactions of eligibility statusand income determinants. Madajewicz (1997), e.g., provides an incentive-based argument that predictsheterogeneous impacts across wealth categories.
15The issue of non-linear responses is note by Pitt and Khandker (1998a) in their footnote 6: “to ensurethat the program is not driven by the linear relationship between landholdings and the outcome variable, we haveestimated the model while allowing for land to enter as a quadratic and successively higher level polynomial. Theprogram effect results reported below were not qualitatively altered by these changes.” However, following thediscussion above, the measured impact may reflect non-linear relationships in any of the explanatory variables, notjust land. Thus, exploring polynomials in land is inadequate to address the issue, especially given the small role ofland in predicting credit demand in their Table 1.
27
endogenous credit variables, pertaining to male and female borrowers from each of the three
programs. Each endogenous variable is associated with 16 instruments (since there are 16
variables in their first-stage gender-specific credit demand equations and these are then interacted
with program-specific indicator variables).
This provides considerable flexibility that remains unexploited. First, their second stage
includes these same sixteen variables on their own, but neither their interaction with eligibility
status (eiv) nor with status as a program village (bv).14 As a result, the instruments may pick up
any systematic differences between the landless and landed in, say, the impact of age on income,
even when the differences are not particular to landless households in program villages. If non-
linearities in the effects of explanatory variables are picked up by the instruments, the instruments
can also pick up the effects of unobserved heterogeneity, providing a plausible explanation for
their positive results on household consumption: “better” borrowers get bigger loans, yielding
what appear to be positive and significant marginal impacts.15 Exploring these issues further is
beyond the scope of this paper.
Pitt and Khandker (1998b) also consider impacts on seasonality. Their results by season

28
are consistent with the improved consumption-smoothing found here. Strikingly, they also find
that selection into the programs is determined by low levels of Aus season consumption levels,
where the period after Aus (just before the Aman harvest) is generally considered the most
difficult time of the year for poor households. However, their result that relative impacts are
greatest during Aus season are not replicable using the simple control-treatment framework here.
Implications for impacts by gender
Concern with gender is motivated by the observation that women tend to be more reliable
borrowers than men, with much lower probabilities of delinquency, and that women may allocate
resources differently from their spouses (Wood and Sharif, 1997). Pitt and Khandker (1998a)
interpret their finding that loans to women have higher marginal impacts than loans to men as an
indication of a lack of fungibility of capital and income within the household.
But since loans to males are larger on average, the difference can also be explained by the
standard theory of declining marginal returns to capital. Although the average loan sizes in Pitt
and Khandker (1998a) show females with much higher average borrowings (e.g., women
borrowed 956 taka from Grameen versus 374 taka borrowed by men; Pitt and Khandker, 1998a,
Table A1), the average is for the entire sample with zeroes included for non-borrowers. The
numbers turn around when calculated conditional on actually borrowing. Then males borrow
slightly more on average from Grameen (15,797 taka versus 14,128 taka). For BRAC, males
cumulatively borrowed 5,842 taka versus 4,711 taka for women, and for BRDB, males borrowed
6020 taka versus 4118 taka for women (see Appendix Table below).
Still, there may be important gender-specific heterogeneity. A more complicated selection

16Formally, instruments now take the form eiv bv Ziv Giv, where Giv is a dummy variable indicatingresidence in a village with just female or just male groups.
29
problem emerges now since participation in the program is not just a matter of whether a member
of the household should participate but also specifically who in the household should participate.
Pitt and Khandker identify their estimates by exploiting the fact that credit groups are never mixed
by gender (by regulation), and not all villages have groups of both genders. Thus, men in villages
with no male groups will not be eligible to borrow. Likewise for women. In the 87 villages
surveyed, 10 have no female groups and 22 have no male groups (and 40 have both, leaving 15
villages with no groups). Identification comes from comparing how men with access to male
groups compare to men without access. Likewise for women.16
This step requires additional identifying assumptions since the formation and composition
of groups is endogenous. The fact that a man is in a village with no male groups may say
something about the unobserved qualities of the men and the strength of their peer networks in
that village. If it says that the men are poor credit risks, then the evaluation will overstate the
pure impact on men who do participate. Similarly, if having a strong peer group increases
impacts directly, the identification procedure may reflect partly the role of peer groups in addition
to the role of the program. The village fixed effects may pick up much of this unobserved village
heterogeneity, but, as argued above, they will not control for features of peer networks that are
specific just to target (functionally landless) households in program villages.
7. Conclusions
The microfinance movement has captured the imagination of academics, policymakers,

30
and practitioners. It has demonstrated possibilities for lending to poor households and has
transformed discussions of poverty alleviation. However, few microfinance programs have
received rigorous statistical evaluations. Doing so is complicated by biases due to non-random
program placement and participation by clients. Simple measures of impacts are thus likely to be
driven partly by correlations of unobserved client quality and patterns of lending, with respect to
both participation and the size of borrowings. The results above show how misleading the simple
measures can be.
The study sets out a set of simple comparisons that take sources of bias into account.
Access to the programs is associated with substantially lower variation in labor supply and
consumption across seasons -- a benefit that may be considerable for poor agriculture-based
households. At the same time, no evidence was found to support claims that the programs
increase consumption levels or increase educational enrollments for children relative to levels in
control villages. One explanation is suggested by Todd (1996) who found that many borrowers
were using loans to purchase land, rather than to complete their proposed projects. Her anecdotal
evidence is consistent with the evidence of relatively frequent and large land purchases here. The
fruit of those investments are not apt to show up immediately, and it is possible that stronger
impacts of the microfinance programs would show up in time.
That said, the findings above are plausible given the high level of activity by non-
governmental organizations throughout Bangladesh. The control groups may not yet have credit
programs, but they are served in other ways by informal lenders (including relatives) and social
service organizations, so it should not be surprising that strong positive differences between
treatment and control villages remain elusive. The microfinance programs may make important

31
absolute differences in the lives of borrowers, even if the relative differences are small. Tens of
millions of dollars worth of subsidized resources support these programs, and the question now is
whether these benefits are justified by their substantial costs.

32
8. References
Angrist, Joshua, Guido Imbens, and Donald Rubin (1995), “Identification of Causal Effects UsingInstrumental Variables,” Journal of the American Statistical Association 91 (434), June: 444 -455.
Binswanger, Hans and Mark Rosenzweig (1986), “The Behavioural and Material Determinants ofProduction Relations in Agriculture,” Journal of Development Studies 32: 503 - 539.
Buntin, John (1997), “Bad Credit: Microcredit yields macroproblems,” The New Republic, March 31: 10-11.
Campbell, Donald T. (1969), “Reforms as Experiments,” American Psychologist 24: 409 - 429.
Chase, Jessica (1997), The effect of microfinance credit on children's education: evidence from theGrameen Bank. Harvard University Undergraduate Honors Thesis in Economics.
Deaton, Angus (1997), The Analysis of Household Surveys. Baltimore: The World Bank/Johns HopkinsUniversity Press.
Economist Magazine (1997), “Microlending: From Sandals to Suits,” February 1: 75.
Grameen Bank (1993), Annual Report 1992. Dhaka: Grameen Bank.
Hashemi, Syed (1997), “Those Left Behind: A Note on Targeting the Hardcore Poor,” chapter 11 inGeoffrey Wood and Iffath Sharif, eds., Who Needs Credit? Poverty and Finance in Bangladesh. Dhaka: University Press Limited.
Heckman, James J. (1997), “Instrumental Variables: A Study of Implicit Behavioral Assumptions Used inMaking Program Evaluations,” Journal of Human Resources 32 (3), Summer: 442 - 462.
Hossain, Mahabub (1988), Credit for Alleviation of Rural Poverty: The Grameen Bank in Bangladesh,International Food Policy Research Institute Report 65, February.
Madajewicz, Margaret (1997), “Capital for the Poor: The Role of Monitoring”, Harvard University, draft.
Microcredit Summit (1997), The Microcredit Summit Report. Washington, DC: RESULTS EducationalFund.
Moffitt, Robert (1991), “Program Evaluation with non-Experimental Data”, Evaluation Review 15 (3),June: 291 - 314.
Morduch Jonathan (1995), “Income Smoothing and Consumption Smoothing,” Journal of EconomicPerspectives 9(3), Summer, 103 - 114.
Morduch, Jonathan (1999), “The Microfinance Promise,”Journal of Economic Literature, forthcoming..

33
New York Times (1997), “Microloans for the very poor” [editorial], February 16.
Pitt, Mark and Shahidur Kandker (1998a), “The Impact of Group-Based Credit Programs on PoorHouseholds in Bangladesh: Does the Gender of Participants Matter?” Journal of PoliticalEconomy, October.
Pitt, Mark and Shahidur Kandker (1998b), “Credit Programs for the Poor and Seasonality in RuralBangladesh,” Brown University and World Bank, draft, January 9.
Pitt, Mark, Shahidur Khandker, Signe-Mary McKernan, and M. Abdul Latif (1997), “Credit Programs forthe Poor and Reproductive Behavior in Low Income Countries: Are the Reported CausalRelationships the Result of Heterogeneity Bias?” Brown University/World Bank/FTC/BIDS,manuscript.
Rahman, Mizanur and Julie Da Vanzo (1997), “Influence of the Grameen Bank on Contraceptive Use inBangladesh”, ICDDR,B/RAND working paper.
Rashid, Mansoora and Robert M. Townsend (1993), “Targeting Credit and Insurance: Efficiency,Mechanism Design, and Program Evaluation,” The World Bank and University of Chicago, draft.
Todd, Helen (1996), Women at the Center: Grameen Bank Borrowers after One Decade. Boulder:Westview Press.
Wood, Geoffrey and Iffath Sharif, eds. (1997), Who Needs Credit? Poverty and Finance in Bangladesh. Dhaka: University Press Limited.
Zaman, Hassan (1997), “Micro-Credit Programmes: Who Participates and What Does it Matter?” chapter10 in Geoffrey Wood and Iffath Sharif, eds., Who Needs Credit? Poverty and Finance inBangladesh. Dhaka: University Press Limited.

34
A
Not Eligible
b = 1e = 0c = 0
householdswith
over ½acre
B
Would not be Eligible
b = 0e = 0c = 0
C
Eligible but doesnot participate
b = 1e = 1c = 0
D
Participants
b = 1e = 1c = 1
½acreand
below
E
Would be Eligible
b = 0e = 1c = 0
Village 1: with Program“Treatment”
Village 2: with No Program“Control”
Figure 1: Typical Program and Non-Program Villages

35
Table 1
Percentage of Borrowers by Classification
(weighted, n = 1498)
Grameen BRAC BRDB
Borrowing by “eligible”households: under 0.5 acre (prior) over 0.5 acre (prior)
3960
4055
2583
By de facto eligibilitystatus: “Eligible” “Not Eligible”
440
420
290
By holdings prior toparticipation: Under 0.5 acre Over 0.5 acre
3819
3922
2411
By holdings at the time ofthe survey: Under 0.5 acre Over 0.5 acre
3818
4020
2510
Note: Data on land-holdings prior to 1991-92 only availablefor borrowers; “before” data for others is replaced with 1991-92 data. Landholdings comprise total land held byhousehold.

36
Table 2:
Distribution of landholdings by program and eligibility category
Percentage of Households by Landholding
Totalhouseholds
Under 6decimals
6 to 50decimals
Over 50decimals
InitialLand:
Over 50
GrameenVillages
Participants 312 24 46 30 28
Other Eligible 126 39 46 15 --
Ineligible 72 0 3 97 --
BRACVillages
Participants 285 37 40 24 21
Other Eligible 126 44 44 11 --
Ineligible 71 0 1 99 --
BRDBVillages
Participants 308 31 47 21 18
Other Eligible 126 41 59 0 --
Ineligible 72 0 1 99 --
ControlVillages
Eligible 255 35 65 0 --
Ineligible 45 0 0 100 –

37
Table 3:
Size of landholdings in 1991-92 by program and eligibility category
Average Land Size by Category (Decimals)
GroupAvg.
Under 6 6 to 50 Over 50
Avg s.d. Avg s.d. Avg s.d. max
GrameenVillages
Participants 56.4 2.8 1.6 21.2 12.7 152.7 158.1 1377
Other Eligible 28.2 2.8 1.5 22.9 14.4 110.2 51.4 200
Ineligible 292.4 -- -- 27.0 8.5 300.0 281.5 1330
BRACVillages
Participants 49.1 2.5 1.6 18.3 13.0 174.2 147.5 785
Other Eligible 19.6 2.5 1.4 21.2 13.1 81.6 45.5 206
Ineligible 323.4 -- -- 45.0 0.0 327.4 441.7 3360
BRDBVillages
Participants 43.8 2.5 1.4 20.8 11.7 154.8 103.6 631
Other Eligible 14.1 2.5 1.4 22.3 14.5 -- -- 50
Ineligible 429.2 -- -- 45.0 0.0 434.6 863.6 5750
ControlVillages
Eligible 15.7 3.1 1.3 22.4 14.4 -- -- --
Ineligible 233.5 -- -- -- -- 233.5 253.8 1343

38
Table 4: Average household land transactions while in program
(905 participating households, hundredths of an acre)
Land Type
Homestead Pond, etc. Cultivation Other Total
Number with type 871 274 386 88 882
Initial size 44.9 81.9 89.3 77.3 44.5
Number changing 91 20 125 16 212
Initial size 19.1 15.6 84.5 68.9 57.8
Size of change 4.3 9.8 41.0 8.6 27.6
Positive changes 85 17 111 14 191
Size of change 5.2 11.6 51.9 11.3 34.1
Negative changes 6 3 14 2 21
Size of change 8.8 0.8 45.3 10.5 2.3Sample restricted to 905 participating households; 23 landless households are excluded from figures above. Second column includes holdings of ponds, orchards, bamboo groves.
Table 5: Method of acquiring or disposing of land
Land type:Home-stead
Pond,orchard,
grove
Cultivation
OtherFor self To lease
Number with acquisition/disposal 91 20 102 60 16
Number with complete data 82 20 93 59 16
Method of acquisition/disposal:
Purchase 50 13 53 15 9
Inheritance 38 7 52 46 7
Gift, dowry, other 5 0 3 1 0Note: Sample restricted to 212 households with changes in land status. Method of acquisition/disposal is onlyprovided for households with complete data. Multiple methods may be used to complete an acquisition/disposal.

39
Table 6
Average logarithm of consumption per capita,Difference-in-difference using de facto classifications (n = 1798)
Grameen BRAC BRDB Difference
(1) (2) (3) Control (1) (2) (3)
“Eligible” 4.23 4.24 4.18 4.24 -.01(.33)
0(.16)
-.06**(1.98)
“Not eligible” 4.50 4.53 4.60 4.51 -.01 .02 .08
Difference -.27 -.29 -.42 -.27 0(.05)
-.02(.12)
-.14(1.54)
Absolute values of t-statistics of differences in parentheses; ** (*) significant with 95% (90%) confidence.
Table 7
Average logarithm of consumption per capita,Difference-in-difference using de jure classifications (n = 1562)
Grameen BRAC BRDB Difference
(1) (2) (3) Control (1) (2) (3)
Under 0.5 acre 4.17 4.21 4.17 4.24 -.07**(2.12)
-.03(1.08)
-.07**(2.33)
Over 0.5 acre 4.51 4.54 4.61 4.51 0 .03 .10
Difference -.34 -.33 -.44 -.27 -.07(.75)
-.06(.65)
-.17*(1.91)
Absolute values of t-statistics of differences in parentheses; ** (*) significant with 95% (90%) confidence.

40
Table 8
Average within-household variance of the logarithm of consumption per capita,Difference-in-difference using de jure classifications (n = 1536)
Treatment/control (%)
Grameen(1)
BRAC(2)
BRDB(3) Control (1) (2) (3)
Under 0.5 acre .061 .061 .057 .069 88.4(.87)
88.4(1.04)
82.6(1.42)
Over 0.5 acre .116 .132 .117 .069 168.1 191.3 169.6
Treatment/control (%)
52.6 46.2 48.7 100.0 52.6**(2.24)
46.2*(1.92)
48.7**(2.58)
Absolute values of t-statistics of differences in parentheses; ** (*) difference from 100 significant with 95% (90%)confidence.

41
Table 9
Labor supply per adult: average logarithm and within-household variance of the logarithm,
Difference-in-difference using de jure classifications (n = 1536)
Treatment/control (%)
Grameen(1)
BRAC(2)
BRDB(3) Control (1) (2) (3)
Under 0.5acre
Average
Variance
4.80
0.118
4.66
0.131
4.75
0.125
4.73
0.135
.07**(2.00)
87(0.62)
-.07(1.35)
97(0.30)
.02(0.71)
93(0.44)
Over 0.5acre
Average
Variance
4.57
0.187
4.44
0.233
4.25
0.212
4.52
0.130
.05
144
-.08
179
-.27
163
Treat-ment/
control(%)
Average
Variance(%)
0.23
63
0.22
56
0.50
59
0.21
104
.02(0.02)
61(1.52)
.01(0.24)
54(1.28)
.31**(2.69)
57(1.43)
Differences for average logarithm of household labor supply per capita are absolute. Differences of within-household variance of the log are in percentage terms. Absolute values of t-statistics of differences in parentheses;** (*) difference from 100 significant with 95% (90%) confidence.

42
Table 10
Average labor supply of men and women,Difference-in-difference using de jure classifications
Grameen BRAC BRDB Treatment/control (%)
(1) (2) (3) Control (1) (2) (3)
Under 0.5 acre
Male
Female
213
48
198
32
201
44
189
43
113**(3.66)
112(0.97)
105*(1.86)
74**(2.30)
107**(1.92)
102(0.23)
Over 0.5acre
Male
Female
172
34
154
18
132
18
161
17
107
200
96
106
82
103
Treatment/control (%)
Male
Female
124
141
129
178
152
244
117
253
106(0.63)
56(1.10)
109(0.86)
70(1.26)
131**(2.86)
95(0.48)
Samples include 2068 men and 1991 women. Absolute values of t-statistics of differences in parentheses; ** (*)difference from 100 significant with 95% (90%) confidence.

43
Table 11
Percentage of children age 5 to 17 enrolled in school,Difference-in-difference using de jure classifications (n = 1798)
Grameen BRAC BRDB Treatment/control (%)
(1) (2) (3) Control (1) (2) (3)
Under 0.5 acre
Male
Female
45.6
46.8
49.4
51.8
44.0
37.1
47.5
53.7
96.0(0.39)
87.2(1.29)
104.0(0.20)
96.5(0.43)
92.6(0.72)
69.1**(3.31)
Over 0.5acre
Male
Female
57.6
68.8
80.3
74.3
69.1
59.8
62.5
60.9
92.2
113.0
128.5
122.0
110.6
98.2
Treatment/control (%)
Male
Female
79.2
68.0
61.5
69.7
63.7
62.0
76.0
88.2
104.1(0.25)
77.2(1.08)
80.9**(2.04)
79.1(1.12)
83.7(1.23)
70.4(1.13)
Samples include 1055 boys and 1022 girls. Absolute values of t-statistics of differences in parentheses; ** (*)difference from 100 significant with 95% (90%) confidence.

44
Table 12:
Average outcomes for borrowers and non-borrowers
holding less than 0.5 acre
Variable
Householdswith less than
0.5 acreGrameen
Bank BRAC BRDB
Log consumption per capita borrowernon-borrower
4.184.17
4.214.21
4.214.15
Variance of log consumption borrowernon-borrower
.060
.062.060.062
.065
.053
Log labor per adult in past month borrowernon-borrower
4.834.78
4.664.65
4.784.74
Variance of per adult log labor borrowernon-borrower
.111
.123.114.143
.130
.124
Adult male labor hours in past month borrowernon-borrower
218208
212188
206199
Adult female labor hours in past month borrowernon-borrower
5242
3530
4942
% male school enrollment (age 5 - 17) borrowernon-borrower
57.430.1
51.048.0
54.144.1
% female school enrollment (age 5 - 17)
borrowernon-borrower
54.041.1
58.047.4
39.132.8
Note: Definitions and samples are comparable to those in Tables 7 - 11.

41
Table 13: Point estimates of average impacts of de jure eligibility after controlling for household and village characteristics
Sample under 0.5 acre only, with household characteristics
Under 0.5 acre, with village and household characteristics
Full sample, household vars and village-level fixed effects
Variable Grameen BRAC BRDB Grameen BRAC BRDB Grameen BRAC BRDB
Log consumption per capita
-.045 (.99)
-.036 (.78)
-.069* (1.68)
-.063 (1.18)
-.035 (0.70)
-.057 (1.36)
-.093 (1.48)
.027 (.41)
-.124* (1.71)
Variance of log consumption
-.006 (.54)
-.007 (.59)
-.008 (.67)
-.009 (.71)
-.005 (.39)
-.007 (.62)
-.043** (1.95)
-.051 (1.42)
-.043** (1.96)
Log labor per adult in past month
.076 (1.40)
-.062 (1.3)
.021 (.44)
.148* (1.85)
-.045 (.69)
.033 (.68)
-.019 (.22)
-.081 (.87)
.188** (2.01)
Variance of per adult log labor
-.017 (.55)
-.003 (.12)
-.009 (.30)
-.053 (1.46)
-.002 (.07)
-.011 (.39)
-.077* (1.78)
-.095 (1.35)
-.084* (1.85)
Adult male labor hours in past month
20** (3.11)
11* (1.72)
10* (1.57)
18.9** (2.37)
-.86 (.12)
7.4 (1.13)
6 (.53)
3 (.24)
22** (2.00)
Adult female labor hours in past month
4 (.63)
-19** (-2.75)
1 (.08)
21.7** (2.59)
6.3 (.79)
11.6 (.61)
-19* (1.85)
-16* (1.40)
5 (.45)
% males in school (age 5 - 17)
.045 (.31)
.012 (.09)
-.078 (.14)
.153 (0.77)
.303* (1.78)
.027 (.18)
.106 (.38)
.056 (.19)
-.109 (.44)
% females in school (age 5 - 17)
-.111 (.65)
-.088 (.61)
-.401** (2.50)
-.320* (1.68)
-.233 (1.24)
-.522** (2.97)
-.058 (.19)
.086 (.27)
-.067 (.22)
Note: Absolute values of t-statistics (or z-scores) in parentheses; ** (*) significant with 95% (90%) confidence. Gender-specific labor labor results estimated by Tobit. Schooling results estimated by probit. Other results estimated by ordinary least squares. Sample sizes correspond to the analogous tables above.
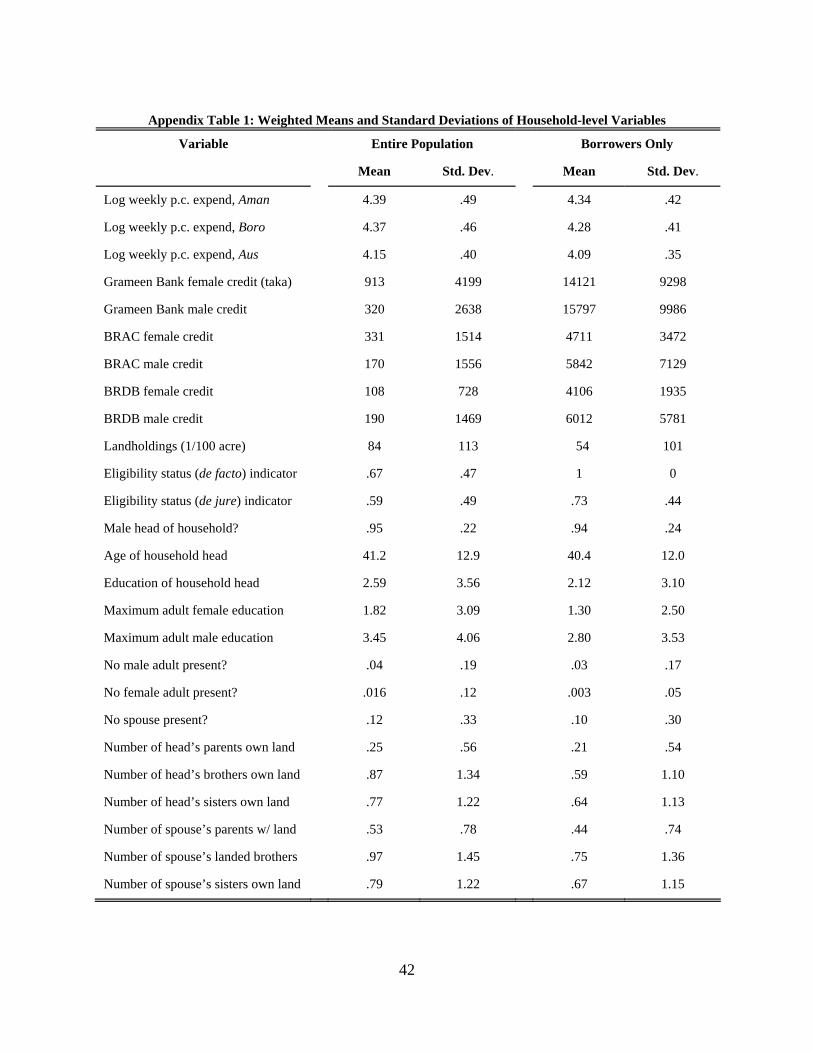
42
Appendix Table 1: Weighted Means and Standard Deviations of Household-level Variables
Variable Entire Population Borrowers Only
Mean Std. Dev. Mean Std. Dev.
Log weekly p.c. expend, Aman 4.39 .49 4.34 .42
Log weekly p.c. expend, Boro 4.37 .46 4.28 .41
Log weekly p.c. expend, Aus 4.15 .40 4.09 .35
Grameen Bank female credit (taka) 913 4199 14121 9298
Grameen Bank male credit 320 2638 15797 9986
BRAC female credit 331 1514 4711 3472
BRAC male credit 170 1556 5842 7129
BRDB female credit 108 728 4106 1935
BRDB male credit 190 1469 6012 5781
Landholdings (1/100 acre) 84 113 54 101
Eligibility status (de facto) indicator .67 .47 1 0
Eligibility status (de jure) indicator .59 .49 .73 .44
Male head of household? .95 .22 .94 .24
Age of household head 41.2 12.9 40.4 12.0
Education of household head 2.59 3.56 2.12 3.10
Maximum adult female education 1.82 3.09 1.30 2.50
Maximum adult male education 3.45 4.06 2.80 3.53
No male adult present? .04 .19 .03 .17
No female adult present? .016 .12 .003 .05
No spouse present? .12 .33 .10 .30
Number of head’s parents own land .25 .56 .21 .54
Number of head’s brothers own land .87 1.34 .59 1.10
Number of head’s sisters own land .77 1.22 .64 1.13
Number of spouse’s parents w/ land .53 .78 .44 .74
Number of spouse’s landed brothers .97 1.45 .75 1.36
Number of spouse’s sisters own land .79 1.22 .67 1.15

43
Appendix table 2: Selected village-level characteristics
Grameen BRAC BRDB Control
Variable avg s.d. avg s.d. avg s.d. avg s.d.
Primary coed school in village?* .79 .40 .46 .50 .80 .40 .67 .47
Rural health center in village?* .13 .34 0 0 .06 .23 .07 .25
Family planning clinic in village?* .29 .46 0 0 0 0 .07 .25
Is dai/midwife available?* .76 .43 .95 .21 .56 .50 .27 .44
Distance to closest bank (km)* 4.2 3.0 2.7 2.3 3.5 3.0 3.8 3.1
Price of coarse-grain rice* 10.5 .63 10.7 .66 10.5 .58 10.4 .57
Price of wheat flour* 9.1 .81 8.9 .75 9.0 .97 9.1 .77
Price of mustard oil* 52.9 5.0 54.0 4.5 54.3 3.0 53.2 3.4
Price of chicken eggs* 2.5 1.1 2.3 .32 2.2 .41 2.4 .21
Price of milk* 12.9 2.8 12.4 2.6 11.7 2.0 11.6 1.7
Price of potato* 7.5 .93 6.5 .86 7.0 .57 6.7 .62
Average male wage* 38.2 9.7 36.4 5.1 36.0 6.2 36.3 4.9
Average female wage* 17.9 3.7 16.6 8.2 19.5 6.8 18.4 7.1
Missing female wage = 1* .11 .18 .20 .31 .14 .23 .18 .24
Bank available? .17 .38 0 0 .13 .34 .13 .34
Monthly interest rate (< than 6 months, %) 13.5 6.0 16.5 6.2 11.3 2.6 15.0 10.1
Village electrification? .41 .49 .46 .50 .69 .46 .40 .49
Food program? .36 .32 .51 .43 .16 .23 .2 .20
Percent cultivated land irrigated .33 .34 .52 .27 .40 .32 .54 .24
Distance to closest coed primary school, km .26 .62 .33 .47 .32 .83 1.6 3.7
Distance to closest coed junior school, km 18.0 26.0 5.9 4.8 4.3 4.2 6.2 4.1
Distance to closest coed high school, km 1.9 2.3 1.9 1.6 2.1 1.8 2.8 3.1
Log household consumption per capita 4.32 .37 4.30 .39 4.32 .42 4.37 .43
Variance of log household consumption p. c. .081 .119 .080 .157 .077 .123 .069 .079
* Included in econometric specifications above.