does mandated disclosure induce a structural change in the determinants of nonaudit service...
TRANSCRIPT

Auditing: A Journal of Practice & Theory American Accounting AssociationVol. 30, No. 2 DOI: 10.2308/ajpt-50001May 2011pp. 51–76
Does Mandated Disclosure Induce aStructural Change in the Determinants of
Nonaudit Service Purchases?
Lawrence J. Abbott, Susan Parker, and Gary F. Peters
SUMMARY: We investigate the association between mandated fee disclosures and
structural changes in the determinants of nonaudit services (NAS). The Securities and
Exchange Commission (SEC) underscored the importance of understanding the impact
of disclosures when the Auditor Independence Rules of 2000 explicitly relied on market
responses to discipline NAS purchases. In contrast, the Sarbanes-Oxley Act of 2002
(SOX) relied upon prohibitions of NAS. Our findings suggest that market-based
approaches were functioning prior to SOX prohibitions. We find that after the SEC
mandated fee disclosures, NAS purchases become negatively associated with firms
seeking financing and positively associated with managerial ownership. We also
document a significantly smaller propensity for NAS purchases among larger firms,
compared to a nondisclosure environment. Last, we find that mandated disclosures
significantly increase the negative association between NAS purchases and effective
audit committees. Collectively, our findings are consistent with mandated disclosures
increasing agency cost incentives for limiting NAS purchases.
Keywords: nonaudit services; mandatory disclosures; auditor fees.
Data Availability: The data are available from public sources.
INTRODUCTION
The impact of nonaudit services (NAS) on perceived audit quality has been the subject of a
considerable amount of prior research. This stream of research includes investigations of
stock and bond markets’ reactions to NAS disclosure as a proxy for perceived auditor
Lawrence J. Abbott is an Associate Professor at the University of Wisconsin–Milwaukee, Susan Parker is anAssociate Professor at Santa Clara University, and Gary F. Peters is an Associate Professor at the Universityof Arkansas.
We thank the two anonymous reviewers and Clive Lennox (associate editor) for their useful comments and suggestions.
Editor’s note: Accepted by Clive Lennox.
Submitted: October 2009Accepted: August 2010
Published Online: May 2011
51
independence.1 These studies show that firms with higher levels of NAS purchases are associated
with higher costs of debt and equity capital (Dhaliwal et al. 2008; Brandon et al. 2004; Nam 2005),
as well as with lower earnings response coefficients (Francis and Ke 2006; Krishnan et al. 2005;
Higgs and Skantz 2006). Despite these findings, there is comparatively little research on how
mandated NAS disclosures impact subsequent NAS purchases. In this study, we investigate
whether the introduction of mandated NAS disclosures is associated with structural changes in the
relations between certain company characteristics and NAS purchases in pre- and post-disclosure
settings.2 We accomplish this by comparing NAS purchases made in 2000 (pre-disclosure) with
those made by the same set of firms (employing the same auditor) in 2001 (post-disclosure).
By examining the impact of mandated NAS disclosure on NAS purchasing behavior, our study
seeks to provide evidence on the potential regulatory efficacy of disclosure requirements such as the
Securities and Exchange Commission’s (SEC) Auditor Independence Rules of 2000, which
mandated audit fee and NAS disclosures. During the rule-making deliberations, the SEC adopted a
demand-side approach to regulating NAS purchases. In particular, the SEC sought to ‘‘let the
market decide’’ the optimal level of NAS purchases by imposing a mandatory NAS disclosure
regime. That is, in the event that the market imposed penalties on firms with relatively higher levels
of NAS, the penalties would provide registrants with market-based incentives to lower their NAS
purchases (Unger 2001; Levitt 2000). However, the subsequent Sarbanes-Oxley Act (SOX) took a
supply-side approach to the NAS issue by banning several NAS services (Canada et al. 2008; U.S.
House of Representatives 2002). Consequently, our test setting represents a unique window of
opportunity since it occurs after the Auditor Independence Rules of 2000, but before the SEC
altered the NAS definitions and before SOX.
This specific period setting provides a natural experiment in which to test the agency-based
demand for audit quality signals.3 The market’s initial price protection reaction to NAS disclosures
was economically significant (Dhaliwal et al. 2008; Francis and Ke 2006; Krishnan et al. 2005;
Higgs and Skantz 2006; Nam 2005; Brandon et al. 2004). Moreover, the ‘‘price protection’’
reaction was consistent with central tenets of the agency-based demand for audit quality (Watts and
Zimmerman 1983; Jensen and Meckling 1976). However, for timing reasons, we argue that
companies could not have incorporated the market’s negative reaction to the NAS disclosures into
their 2000 NAS purchase decisions, whereas NAS purchased in 2001 included the anticipated
reactions.4 By examining pre- and post-disclosure NAS purchases for the same set of firms, we
isolate the effect of the mandated NAS disclosures and concomitant market’s price protection
1 Whether NAS impairs actual audit quality is an empirical question on which we do not provide evidence.Examples of this literature stream include: DeFond et al. 2002; Ashbaugh et al. 2003; Dopuch et al. 2001;Ferguson et al. 2004; Frankel et al. 2002; Chung and Kallapur 2003; Ruddock et al. 2006; among others. Incontrast, our study focuses on the management response to perceived audit quality concerns.
2 It is important to note that we explore only shifts in the determinants of NAS purchases. We make no predictionson whether the overall level of NAS purchased may change, though we later present some descriptive data on theshift in NAS purchases.
3 We use the term audit quality signal to refer to publicly available proxies for audit quality. As investors cannotdirectly observe audit quality, they must use proxies for it, with the Big N/non-Big N dichotomy serving as themost pervasive audit quality signal. We posit the NAS/audit fee ratio is another publicly available signal ofperceived audit quality.
4 Hereafter, we refer to NAS purchased in 2000 (disclosed in 2001) as purchases in the ‘‘nondisclosureenvironment.’’ While the year 2000 NAS purchases were eventually disclosed, contracting parties most likelyacted in a manner consistent with a nondisclosure environment. This is because the disclosure requirements of theAuditor Independence Rules were enacted somewhat unexpectedly in November of 2000, with an effective datefor proxy statements filed beginning February 2001 (Abbott et al. 2003b). This suggests the companies purchasedthe majority of NAS prior to the promulgation of the Auditor Independence Rules. In addition, the contractingparties most likely could not have predicted the market’s reaction to the disclosures until the actual disclosuresappeared in 2001.
52 Abbott, Parker, and Peters
Auditing: A Journal of Practice & TheoryMay 2011

reaction on NAS purchasing behavior. Prior agency-based NAS research has either (1) not
explored subsequent year NAS purchases (Abbott et al. 2003a), or (2) documented the effect of
agency costs on auditor fees (Firth 1997; Parkash and Venable 1993), without addressing the role
of market reactions to mandated NAS disclosures in creating subsequent year agency effects. Thus,
we believe our paper advances the understanding of the influence of disclosure on the demand for
audit quality signals in a powerful, quasi-laboratory setting. Figure 1 summarizes our research
setting.
A final purpose of the study is to examine the impact of NAS disclosure on another key NAS
purchase stakeholder, the audit committee. Prior research provides evidence indicating that audit
committees have litigational incentives to reduce NAS purchases, regardless of the disclosure
environment (Abbott et al. 2003a). However, behavioral research by Gaynor et al. (2006) suggests
that NAS disclosures exacerbate an audit committee’s litigational concerns and incentives.
However, prior archival NAS research ignores the impact of disclosure on audit committees’
influence over NAS purchase decisions (e.g., Omer et al. 2006; Asthana and Krishnan 2006; Abbott
et al. 2003a; Firth 1997; Parkash and Venable 1993). Our study directly tests the behavioral results
of Gaynor et al. (2006) in an archival setting.
Our research design requires us to replicate the Abbott et al. (2003a) agency-based NAS
purchasing model using their sample of year 2000 NAS purchases. We then compare the same
model’s estimated coefficients to those produced using 2001 NAS purchases for the same set of
sample firms. We perform Chow tests for inter-year differences in the coefficient estimates to
determine if the mandated NAS disclosure environment structurally changed the relationships
between NAS and agency-based independent variables found in the Abbott et al. (2003a) model. By
keeping the sample firms, auditors, model, and independent variable values as consistent as
possible, we seek to isolate the effects of mandated NAS disclosure on NAS purchasing behavior.
Consistent with Abbott et al. (2003a), we find little support for an agency-based model for
NAS purchases in a nondisclosure environment—i.e., 2000 NAS purchases. In contrast, we
document statistically significant structural differences in the relation between the NAS/audit fee
ratio and three of our four primary agency conflict variables when switching to a disclosure
environment. We also find similar results when we use the same model to predict which firms were
more likely to reduce 2001 NAS purchases relative to 2000 NAS purchases. Specifically, we
document that inside ownership and financing activity become statistically significant determinants
of NAS purchasing behavior in the disclosure environment. In addition, the positive association
between company size and the demand for NAS decreases during the post-disclosure environment,
consistent with the larger agency costs of larger firms.5 We also document a statistically significant
increase in the magnitude of our audit committee effectiveness coefficient for the subsequent year
FIGURE 1Timing of NAS Purchases and Mandatory Disclosure Rules
5 We fail to document any relation—in either the disclosure or nondisclosure environments—between the NAS/audit fee ratio and our fourth agency conflict variable, leverage.
Does Mandated Disclosure Induce a Structural Change? 53
Auditing: A Journal of Practice & TheoryMay 2011

NAS purchases. The agency-based model’s R2 increases over 70 percent from the initial year (i.e.,
nondisclosure environment) to the subsequent year of NAS disclosure (i.e., disclosure
environment). We interpret these results as consistent with disclosures providing a market-based
mechanism for managers to weigh the costs and benefits of purchasing NAS.
We contribute to the literature in three ways. First, our results provide support for the
agency-based demand for publicly available audit quality signals in a powerful test setting. We find
evidence consistent with the SEC’s Auditor Independence Rules of 2000 fulfilling their intended
purpose of creating market-driven, demand-side incentives with respect to the NAS/audit fee ratio.
As such, the SOX supply-side approach of banning certain NAS may have hurt some registrants if
those banned NAS services previously served to increase overall audit quality (Abbott et al. 2007;
Gaynor et al. 2006). Second, the evidence provided herein suggests that registrants learned from the
market’s negative price protection reaction and, in accordance with agency theory, recalibrated their
subsequent year NAS purchases. Our test setting may serve to resolve some of the inconsistent
findings in prior research on the relation between agency costs and auditor choice, a second heavily
researched audit quality signal (Blouin et al. 2007; Barton 2005; DeFond 1992). Our test setting
avoids some of the issues arising in prior agency cost-auditor choice studies such as endogeneity
(Copley and Douthett 2002; Ireland and Lennox 2002), self-selection (Chaney et al. 2004; Ireland
and Lennox 2002), and auditor switching costs (Blouin et al. 2007; DeFond 1992). Finally, our
results provide archival, empirical support for the audit committee incentive arguments of Gaynor et
al. (2006).
We organize the remainder of our paper as follows. The second section reviews prior research
and develops our hypotheses. The third section describes our research design. The fourth section
presents our sample selection and results, as well as sensitivity analyses. The fifth section
concludes.
PRIOR RESEARCH AND HYPOTHESIS DEVELOPMENT
The Agency-Based Demand for Audit Quality Signals
Jensen and Meckling (1976) describe how agency conflict occurs as a result of the separation
of ownership and control of the firm. Critical to the current study, investors recognize the potential
for agency conflict resulting from this separation and rationally discount the representations/
disclosures of management, most notably management-prepared financial statements (Jensen and
Meckling 1976). In the process of discounting (price protection), investors impose agency costs on
management. Management, in turn, can mitigate these costs by voluntarily hiring independent
auditors for monitoring, thus increasing the visibility of their actions (Jensen and Meckling 1976).
Increases in the divergence between manager and investor preferences or decreases in visibility
dictate a greater degree of perceived agency conflict by market participants who, in turn, impose
greater agency costs on these firms. This creates the agency-based demand for audit quality
(DeFond 1992; Watts and Zimmerman 1983).
Since audit quality is generally not directly observable, the market—which imposes agency
costs on registrants—must use publicly available proxies for it, typically auditor size (Barton 2005;
DeFond 1992). Consistent with the auditor size signal, prior studies show that Big N audited
companies enjoy a higher earnings response coefficient (Teoh and Wong 1993) and lower costs of
debt and equity capital (Mansi et al. 2004; Pittman and Fortin 2004; Hogan 1997; Beatty 1989;
Balvers et al. 1988). Thus, Big N auditors can reduce agency costs (in the form of reduced
discounting of financial statement representations by the stock and/or bond market) by providing
financial statement users with a higher level of perceived audit quality. Collectively, prior research
suggests that managers with greater agency conflicts can enhance the efficacy of their financial
statements by providing signals of perceived audit quality.
54 Abbott, Parker, and Peters
Auditing: A Journal of Practice & TheoryMay 2011

NAS Purchase Disclosures as a Perceived Audit Quality Signal
The impact of NAS on auditor independence in fact and in appearance has been an academic
and regulatory concern for some time, particularly under the tenure of SEC Chairman Arthur Levitt
in the late 1990s. Levitt (2000) frequently voiced his concerns that consulting and other services
‘‘shorten the distance between the auditor and management’’ and that ‘‘independence—if not in fact,
then certainly in appearance—becomes a more elusive proposition.’’ Levitt originally proposed
banning all NAS services provided by the financial statement auditor (SEC 2000a). The AICPA and
Big 5 auditors strenuously objected to these proposals. Firms argued that in addition to the added
value of services provided to clients, NAS can increase the quality of financial statement audits.
After a heated debate, the parties reached a compromise in November 2000. FRR No. 56, Revisionof the Commission’s Auditor Independence Requirements, required all proxy statements filed after
February 4, 2001, to contain disclosures about audit and nonaudit fees (SEC 2000b). This
regulation represented a ‘‘market-based’’ approach to the NAS issue. That is, instead of prohibiting
the supply of NAS, the SEC allowed the market to be the ultimate arbiter of NAS’ impact on
auditor independence and allowed managers to weigh the subsequent costs and potential benefits of
NAS purchases.
With NAS disclosures, investors could potentially utilize the NAS/audit fee ratio as a means of
gauging unobservable audit quality. Although high NAS may not impair an auditor’s ability to
detect a material misstatement, investors may perceive that NAS reduces the auditor’s willingness
to demand a correction of a misstatement should one occur (Beck et al. 1988; DeAngelo 1981).
Recent research has examined whether the market perceives NAS as lowering audit quality. These
studies use research designs that largely mirror those investigating the Big N/non-Big N audit
quality signal. These studies find that high-NAS firms have lower earnings response coefficients
(Francis and Ke 2006; Higgs and Skantz 2006; Krishnan et al. 2005), as well as higher costs of debt
(Dhaliwal et al. 2008; Brandon et al. 2004) and equity capital (Nam 2005). In sum, these studies
suggest that market participants: (1) use the NAS ratio as an audit quality signal, (2) price-protect
themselves from perceived reductions in audit quality due to NAS in a manner consistent with
agency theory, (3) impose economically significant costs on high-NAS registrants via this price
protection, and (4) provide an agency-based set of incentives for registrants to adjust the NAS ratio
in an effort to increase perceived audit quality.
Prior Research on the Determinants of NAS Purchases
Prior research examining the explicit relation between agency conflict variables and the NAS
fee ratio is relatively limited. Examples include Parkash and Venable (1993), Firth (1997), and
Abbott et al. (2003a), among others. Parkash and Venable (1993) examine the relation between
recurring NAS fees and proxies for agency costs during the temporary ASR 250 time period of
1979–1981. However, it is important to recognize that the NAS fee environment studied by Parkash
and Venable (1993) was quite different compared to the 2000–2001 period. Specifically, Parkash
and Venable (1993) find a mean (median) NAS/audit fee ratio of 0.24 (0.17) for their sample of
Fortune 500 firms in 1979–1981 (the previous disclosure regime of ASR 250). In contrast, Abbott
et al. (2003b) document a mean (median) NAS/audit fee ratio of 1.60 (0.96) in 2000, which
represents a growth in NAS purchases (relative to audit fees) of at least 500 percent. The SECPS
(Securities and Exchange Commission Practice Section) data for the ASR 250 period suggested that
only 25 percent of firms purchased any NAS from their auditors and that only 5 percent incurred
NAS fees exceeding their audit fees (Abbott et al. 2003b). In contrast, Abbott et al. (2003b) showed
that more than 99 percent of sampled Big 5 auditees reported NAS purchases greater than zero in
the initial months of the current regime. Moreover, 51 percent of these reported an NAS fee greater
than the audit fee.
Does Mandated Disclosure Induce a Structural Change? 55
Auditing: A Journal of Practice & TheoryMay 2011

Parkash and Venable (1993) are able to partition NAS into recurring and nonrecurring
categories because ASR 250 required this distinction. They document a statistically significant,
positive relation between the recurring NAS/audit fee ratio and proxies for agency conflict, such as
managerial ownership and outside investment concentration. The authors also document a negative
relation between this ratio and leverage. Parkash and Venable (1993) do not find any inter-period
differences in slope coefficients between the initial year of study (1979) and the subsequent year
(1980), nor do they test for the relation between securities issuances and the NAS fee ratio. Similar
to Parkash and Venable (1993), Firth (1997) documents significant associations with certain agency
costs variables and NAS, using 1993 data from the U.K. However, neither study examines the
impact of the audit committee in the NAS purchase decision.
Using the initial year of the more recent NAS disclosure regime, Abbott et al. (2003a) extend
Parkash and Venable (1993) by examining the impact of audit committee involvement in the NAS
purchase decision. They posit that an effective audit committee’s demand for audit quality will
result in a reduced NAS/audit fee ratio, and find a negative relation between the presence of an
effective audit committee and the NAS/audit fee ratio.6 However, unlike Parkash and Venable
(1993) and Firth (1997), Abbott et al. (2003a) find little support for an agency cost-based demand
for a lower NAS/audit fee ratio. The authors state, ‘‘Given the time-frame and speed of the
(disclosure) rule’s enactment, the ability of managers to adjust the level of NAS . . . may have been
limited. This may explain why some of agency cost-based variables are not significant . . . in
subsequent periods, we may see a greater adjustment of NAS purchases in response to . . . the
response of the market to high NAS fee ratios.’’ Given the limitations of Parkash and Venable
(1993) and Firth (1997) and the findings of Abbott et al. (2003a), the current study extends and
complements prior literature by investigating whether the regulatory approach of prescribingmandated NAS disclosures can induce market discipline mechanisms consistent with agency cost
theory.
Hypothesis Development
The initial NAS disclosures proved to be enlightening to many interested parties. Much of the
investing public appeared surprised by both the frequency and magnitude of NAS services (Weil
2001). In particular, then SEC Commissioner Laura Unger, stated ‘‘we were all quite surprised to
learn this . . . in fact, the numbers appear to demonstrate the problem may be larger than we
originally thought’’ (Unger 2001). In a response to these disclosures and perhaps to the market’s
initial reaction to them, the (then) Big 5 audit firms intensely lobbied the SEC to change the
definitions of audit and nonaudit services.7 The lobbying efforts were successful, such that
beginning with the 2003 proxy season, the corresponding definitions of audit (nonaudit) services
were widened (narrowed) (SEC 2003).8
These developments have important implications for the current study. First, given the date that
the disclosure rules were enacted (November 15, 2000) and the lack of publicity about the proposed
regulation, it is very unlikely that NAS purchase decisions made by firms with December 31, 2000,
6 Note that the audit committee’s desire to reduce the NAS/audit fee ratio is present in the absence of NASdisclosures. The potential for disclosure in the context of litigation or SEC investigation, should allegations of amisstatement occur, is what motivates an effective audit committee to seek a reduction in the NAS/audit fee ratio.
7 This does not necessarily imply that the Big 4 performed market-reaction studies to the NAS disclosures. Therewere, however, numerous press articles that pointed to NAS as a potential factor in the Enron debacle, as well asto the demise of Arthur Andersen (McNamee 2002; Liesman et al. 2002; Weil 2001).
8 The SEC amended the definitions used in the disclosure regulation with the issuance of FTC release 33–8183,with early adoption for 2002 NAS purchases. The effect essentially reduced the NAS/audit fee ratio withoutcurtailing the supply of NAS provided (Weil and Rappaport 2003).
56 Abbott, Parker, and Peters
Auditing: A Journal of Practice & TheoryMay 2011

year-ends considered the potential for negative market reactions to NAS disclosures. This is
because the vast majority of 2000 NAS purchases would have been contracted by November 15,
2000, and contracting parties (i.e., management, audit committees, and auditors) could not have
anticipated the disclosure requirements and the market’s reaction—if any—to the disclosures at the
time of contracting. By contrast, the decisions to purchase NAS in 2001 most likely did incorporate
the potential impact of the market’s price protection reaction to the NAS disclosure. Collectively,
these events provide an opportunity to investigate whether the prescription of mandated NAS
disclosures induced a market-based response that structurally altered the relationship between NAS
purchases and agency- and governance-based company characteristics.9 Our agency-based
variables include insider ownership, leverage, external financing, and size. From a governance
perspective, we investigate the potential structural changes in the audit committee/NAS purchase
relation.
Inside Ownership
Following prior literature, we expect agency costs to decrease as insider ownership increases
due to the alignment of manager and owner incentives (DeFond 1992; Jensen and Meckling 1976).
Parkash and Venable (1993) argue that in the management-owned firm, managers have incentives
to capture the benefits of NAS from the incumbent external auditor, whereas the managers of
externally owned firms must weigh the potential benefits of NAS against the potential agency costs
induced by the perceived impairment of auditor independence. However, it is not clear that in the
absence of NAS disclosure the above trade-offs exist. This is consistent with the lack of significant
associations documented in Abbott et al. (2003a) between insider ownership and NAS purchased in
a nondisclosure environment.
In the presence of mandated NAS disclosure, market-imposed agency costs are more likely to
outweigh the potential benefits of NAS (Parkash and Venable 1993). Thus, we expect lower
(higher) levels of management ownership to be associated with lower (higher) perceived net
benefits from purchases of NAS when mandated disclosures are present. We anticipate the
disclosure environment and market reaction will increase management’s sensitivity to these
incentives. As such, we expect the coefficient estimate for insider ownership to increase under the
mandatory disclosure regime. To test this assertion, we compare the coefficient estimates in a period
when firms purchased NAS without mandated disclosures to the coefficient estimates in a period
with mandated disclosure. In turn, the test of our null hypothesis is binsider ownership2000 ¼binsider ownership2001. This leads to our first hypothesis (in alternative form):
H1: Mandatory NAS disclosures will create a positive association between insider ownership
and the NAS/audit fee ratio in comparison to the statistically insignificant association
documented in the nondisclosure regime.
Leverage
Chow (1982) and Parkash and Venable (1993) argue that higher levels of debt increase the
incentives for maintaining the perceived independence of the external auditor and thus, by
extension, decrease the level of NAS purchases. These authors posit that increased debt levels
correspond to more financial statement-based debt covenants, which require greater auditor
certification of compliance. However, it is unclear whether these underlying incentives could
9 We focus on the agency-based variables because the relations between these and the NAS purchase decisions arethose most likely to be structurally altered by the market’s perception of NAS as a proxy for audit quality.
Does Mandated Disclosure Induce a Structural Change? 57
Auditing: A Journal of Practice & TheoryMay 2011

impact NAS purchase decisions in a period when mandated disclosures were not anticipated. The
results of prior research suggest that the market’s initial perception of NAS was consistent with
NAS having a detrimental impact on auditor independence (Dhaliwal et al. 2008; Francis and Ke
2006; Higgs and Skantz 2006). As such, we assert that mandated disclosures will mitigate the
demand for NAS purchases in firms with greater levels of debt. Similar to our insider ownership
hypothesis, we test the leverage assertion by comparing the coefficient estimates in a period when
firms purchased NAS without mandated disclosures to the coefficient estimates in purchases in a
period with mandated disclosure. In turn, the test of the null hypothesis in this case is bleverage2000
¼ bleverage2001. This leads to our second hypothesis (in alternative form):
H2: Mandatory NAS disclosures will create a negative association between leverage and the
NAS/audit fee ratio, in comparison to the statistically insignificant association
documented in the nondisclosure regime.
External Financing
The results of Dhaliwal et al. (2008), Brandon et al. (2004), and Nam (2005) suggest that the
market imposed higher costs of debt and equity capital on firms with higher NAS once disclosures
were available. Dhaliwal et al. (2008) argue that the documented positive association between
higher interest rates and higher NAS purchases was a reaction to the perceived independence of the
firm’s auditors. This perception provides firms with an incentive to curtail NAS purchases from
auditors in a mandated disclosure environment. However, Abbott et al. (2003a) do not find a
significant relation between NAS fee ratios and demand for external financing in a nondisclosure
environment. Given the enhanced response of the capital markets, we expect that those firms
anticipating future external financing will curtail their NAS purchases under the mandatory
disclosure regime. Following the previous hypotheses, the test of the null hypothesis in this case is
bexternal financing2000¼ bexternal financing2001. This leads to our third hypothesis (in alternative
form):
H3: Mandatory NAS disclosure will create a negative relation between anticipated external
financing needs and the NAS/audit fee ratio, in comparison to the statistically insignificant
relation documented in the nondisclosure regime.
Size
Prior research generally finds a positive association between size and the purchase of NAS
(e.g., Palmrose 1986; Barkess and Simnett 1994; Firth 1997). The positive association is generally
attributable to the demands for services that come from larger companies exhibiting greater degrees
of complexity in systems design, as well as the demand for ‘‘one-off’’ consultancy associated with
company size. However, size is also associated with greater information asymmetry between
owners and their agents, creating greater market-imposed agency costs and greater demand for audit
quality among larger companies (DeFond 1992). As such, we expect larger companies to be more
sensitive to perceptions of impaired audit quality in the mandated disclosure environment and
reduce their demand for NAS from incumbent auditors accordingly.
Consistent with prior literature, we expect size to be positively associated with the demand for
NAS. However, we expect this association to decrease in the presence of mandated NAS
disclosures, consistent with the benefits of NAS being offset by the larger agency costs facing larger
companies. Following the previous hypothesis, we test this assertion by comparing parameter
estimates of company size in a period when companies made NAS purchase decisions without
mandated disclosure to purchase decisions made in a period with mandated disclosure. In turn, the
58 Abbott, Parker, and Peters
Auditing: A Journal of Practice & TheoryMay 2011
test of the null hypothesis in this case is bsize2000¼bsize2001. This leads to our fourth hypothesis (in
alternative form):
H4: Mandatory NAS disclosures will decrease the positive association between size and NAS/
audit fee ratio as documented in the nondisclosure regime.
Audit Committee Effectiveness
Our final hypothesis concerns the audit committee, a key stakeholder in the NAS purchase
decision. The role of the audit committee includes monitoring the financial reporting environment
of the company, and thus the perceived and real independence of auditors. Accordingly, we expect
effective audit committees to act as a mitigating factor in the purchase of NAS. Abbott et al.
(2003a) posit that litigation concerns arising from misstatements provide an incentive for audit
committees with high reputational investments to lower the NAS/audit fee ratio. Consistent with
their argument, they provide evidence of a significant, negative relation between ACE and the NAS
fee ratio. However, it remains an empirical question whether mandated disclosures will magnify the
negative association.
Gaynor et al. (2006) specifically investigate the impact of disclosure on the propensity of audit
committee members to lower the NAS/audit fee ratio. Gaynor et al. (2006) document a significantly
larger reduction in the NAS/audit fee ratio in a disclosure, rather than nondisclosure, setting. These
results are attributed to increased scrutiny by shareholders (and potential litigants) resulting from
the public dissemination of NAS information. However, Gaynor et al. (2006) utilize a laboratory
setting and thus do not provide archival evidence. We expect a relation between ACE and the NAS
fee ratio that is incrementally greater than that documented in Abbott et al. (2003a). The test of the
null hypothesis in this case is baudit committee2000¼ baudit committee2001. This leads to our final
hypothesis (in alternative form):
H5: Mandatory NAS disclosures will intensify the negative association between the presence
of an effective audit committee and the NAS/audit fee ratio as documented in the
nondisclosure regime.
RESEARCH DESIGN
Sample Selection
For comparative purposes, we utilize the sample previously used in Abbott et al. (2003a). Table
1 (Panel A) reconciles 2000 and 2001 observations. The original sample consisted of the 310
nonfinancial firms filing proxies with the SEC between February 5, 2001, and March 16, 2001, plus
an additional randomly chosen sample of 250 firms filing proxies from March 19, 2001, to June 30,
2001, for a total of 538 firms.10 Forty-seven firms merged, became private, or disappeared prior to
the release of the 2001 proxy statement, leaving 491 firms potentially available for inclusion. We
also deleted the 107 firms that were audited by Arthur Andersen or which switched auditors during
2001. These selection criteria control for distortions in NAS purchase decisions related to early
defections of Andersen clients, as this behavior may not accurately reflect the contracting decisions
made by these companies otherwise. Last, an additional 46 firms did not have sufficient information
10 The March 16, 2001, to June 30, 2001, sample was selected by creating a list of the firms filing during the periodin chronological order, and using systematic random sampling to generate sample of 250 firms from theapproximately 6,000 firms filing proxies within the period.
Does Mandated Disclosure Induce a Structural Change? 59
Auditing: A Journal of Practice & TheoryMay 2011

TABLE 1
Sample Selection Results
Panel A: Sample Reconciliation with Abbott et al. (2003a)
# of Sample Firms % of Original Sample
Original Abbott et al. (2003a) sample 538 100
Deleted firms:
Merged or acquired (8) (1.5)
Ceased reporting prior to issuance of 2001
proxy statement (32) (5.9)
Not included on Compustat in 2001 (7) (1.3)
Arthur Andersen clients or switched auditors (107) (19.9)
Total deleted firms (154) (28.6)
Firms potentially available for the current study 386 71.7
Insufficient data available on Compustat (46) (8.5)
Total used in regressions 338 63.0
Panel B: Industry Composition
Focus IndustryRelated Two-Digit
SIC Codes# of Sample
Firms % of SampleCompustat
Population %
Construction 15–17 5 1.5 1.0
Consumer Product
& Food 20–33 89 26.3 14.5
Energy 10–14, 46, 49 41 12.1 7.0
Financial Services 60–64, 67 3* 0.9 24.9
Information and
Communication 48, 73, 78, 79, 84 54 16.0 18.3
Manufacturing 34–39 104 30.8 18.2
Personal Services
and Healthcare 72, 80, 83 5 1.5 1.7
Professional,
Commercial,
Services, Education 75, 76, 82, 87, 89 4 1.1 2.3
Real Estate 65, 70 3 0.9 1.3
Retail and Wholesale 50–59 19 5.6 7.8
Transportation 40–42, 44, 45, 47 11 3.3 1.8
All Other 1, 2,7, 8, 99 0 0.0 1.2
Totals 338 100 100
* Firms included in this segment are from the insurance industry and nonbank financial services industry (i.e., brokeragehouses, etc.). Sample does not include banks and other financial institutions that face additional regulation unique to theirindustry.
60 Abbott, Parker, and Peters
Auditing: A Journal of Practice & TheoryMay 2011

on Compustat to calculate our additional financing variable. This resulted in a sample of 338 firms
available for both 2000 and 2001.11
Table 1 (Panel B) provides information about the distribution of industries in our sample
compared with the Compustat population. Our sample contains a higher proportion of consumer
products and food, energy, and manufacturing. Our sample also contains very few firms classified
as financial services firms, as Abbott et al. (2003a) excluded banking-related firms due to their
differing regulatory and financial structures. We performed t-tests and Mann-Whitney F-tests (not
reported) for differences in mean (median) total assets. We did not find any significant difference
between the sample and the Compustat population in terms of mean (median) size.
Regression Model
Following Abbott et al. (2003a), we employ the multivariate regressions below for years 2000
and 2001 to test our hypotheses.
NASAFRATIO2000;2001 ¼ b0 þ b1INOWN2000;2001 þ b2LEVERAGE2000;2001
þ b3FINANCE2000;2001 þ b4SIZE2000;2001 þ b5ACE2000;2001
þ b6BLOCK2000;2001 þ b7BIG42000;2001 þ b8ACQ2000;2001
þ b9CHGCEO2000;2001 þ b10RESTR2000;2001 þ b11RETURN2000;2001
þ e
where:
NASAFRATIO ¼ the ratio of total NAS fees (including nonaudit fees and any information
technology implementation fees) to total audit fees;
INOWN ¼ the cumulative percentage of voting control held by managers and directors;
LEVERAGE ¼ the ratio of long-term debt to total assets;
FINANCE ¼ the net cash flows derived from external financing deflated by total assets,
measured in the year subsequent to the NASAFRATIO year;
SIZE ¼ the natural log of total assets;
ACE ¼ an indicator variable equal to 1 if the audit committee is comprised entirely of
independent directors and meets at least four times during the year, and 0 otherwise;
BLOCK¼the cumulative ownership percentage of voting control held by blockholders holding at
least 5 percent of the outstanding common shares and who are unaffiliated with management;
BIG4¼ an indicator variable equal to 1 if the firm employs a Big 4 auditor, and 0 otherwise;
ACQ¼ the number of acquisitions made by the firm during the year or in the prior two years;
CHGCEO¼ an indicator variable equal to 1 if a new external CEO has been appointed during
the year or in the previous two years, and 0 otherwise;
RESTR¼ an indicator variable equal to 1 if a firm restructuring occurred during the year or in
the previous two years, and 0 otherwise; and
RETURN ¼ the total stock return (stock appreciation plus dividends) for the prior year.
Our primary tests compare the regression results from the fiscal year ended 12/31/2000 to
results pertaining to the fiscal year ended 12/31/2001.12 The subscripts on each variable indicate
11 Our overall sample size compares favorably with the per-year sample of Parkash and Venable (1993) and issomewhat smaller than that of Firth (1997), who includes 500 firms.
12 We collect year 2000 (2001) proxy data via the calendar year 2001 (2002) proxy statement as the 2001 (2002)proxy statement relates to the fiscal year ended 12/31/2000 (2001). In instances where the proxy statement forfiscal year 2000 (2001) was issued in the final two months of calendar year 2000 (2001) (less than 3 percent ofour observations), the applicable variables (NASAFRATIO, INOWN, ACE, CHGCEO, and BLOCK) are retrievedfrom proxy statements released in calendar year 2000 (2001) relating to fiscal year 2000 (2001).
Does Mandated Disclosure Induce a Structural Change? 61
Auditing: A Journal of Practice & TheoryMay 2011

that we run the regression model twice, once for the nondisclosure year (2000) and once for the first
year of mandatory disclosure (2001). Since our objective is to compare the results of the model
across the differing disclosure regimes, we then use a Chow test to determine whether the
coefficient estimates from the two models are statistically different. The Chow tests support our
hypotheses if the coefficient estimates significantly differ in the predicted directions between 2000
(nondisclosure period) and 2001 (disclosure period).
Variable Definitions
Table 2 describes the variables in detail.13 Our dependent variable (NASAFRATIO) is the ratio
of total NAS fees (including information technology, or IT, fees) to audit fees. Prior research
TABLE 2
Variable Definitions
Variable Name Description
AUDITFEE ¼ total audit fees (from proxy statements);
ITFEE ¼ total information technology implementation fees (from proxy statements);
NONAUDITFEE ¼ total nonaudit fees (excluding information technology fees) (from proxy statements);
NASAFRATIO ¼ ratio of total nonaudit service fees (including nonaudit fees and any information
technology implementation fees) to total audit fees;
DECRRATIO ¼ indicator variable with a value of 1 if the 2001 NASAFRATIO was less than the 2000
NASAFRATIO, 0 else;
DECRNAS ¼ indicator variable with a value of 1 if the firm’s total 2001 NAS fees (ITFEE þNONAUDITFEE) were less than firm’s total 2000 NAS fees, 0 else;
INOWN ¼ cumulative percentage of voting control held by managers and directors (from proxy
statements);
LEVERAGE ¼ ratio of long-term debt (Compustat item 9) to total assets (Compustat item 6);
FINANCE ¼ net cash flows received from external financing activities. Compustat item formula
(108 � 115 � 127) þ (111 � 114 � 301) following Bradshaw et al. (2006);
SIZE ¼ natural log of total assets (in millions) (Compustat item 6);
ACE ¼ audit committee effectiveness variable coded 1 for an audit committee that is
composed entirely of outside directors and meets at least four times annually, 0 else
(from proxy statements);
BLOCK ¼ cumulative ownership percentage of voting control held by blockholders holding at
least 5 percent of the outstanding common shares and are unaffiliated with
management (from proxy statements);
BIG4 ¼ indicator variable set to 1 if the firm employs a Big 4 auditor during the year, 0 else
(Compustat item 149);
ACQ ¼ indicator variable set to 1 if the firm made at least one acquisition during the year and
two preceding years, 0 else (based on Compustat item 129);
CHGCEO ¼ indicator variable set to 1 if a new external CEO has been appointed during the year
and two preceding years, 0 else (from proxy statements);
RESTR ¼ indicator variable set to 1 if the firm reported restructuring costs (Compustat item 376)
during the year, 0 else; and
RETURN ¼ total stock return (stock appreciation plus dividends) (Compustat items 26 and 199).
13 NASAFRATIO, INOWN, ACE, BLOCK, and CHGCEO are collected by hand from the applicable proxystatement. We collect the remaining variables from Compustat. More specific information is included inTable 2.
62 Abbott, Parker, and Peters
Auditing: A Journal of Practice & TheoryMay 2011
commonly uses this ratio as a proxy for perceived auditor independence (e.g., Davis and Hollie
2008; Dhaliwal et al. 2008; Krishnan et al. 2005; Brandon et al. 2004). In subsequent tests, we also
include alternative proxies for our dependent variable, including NAS fees scaled by total assets,
total sales, and total fees. We also use logistic regressions that utilize binary dependent variables
identifying reductions in NAS purchases.
INOWN captures the degree of voting control held by managers and directors. LEVERAGE is
the ratio of long-term debt to total assets. We measure securities issuance activities (FINANCE)
following the formula found in Bradshaw et al. (2006), recognizing inherent timing differences
between NAS purchases and NAS disclosures. For example, assuming Company A purchased
$300,000 in NAS services during year 2000, this $300,000 would be disclosed to the market during
2001 in the annual proxy statement. In 2001, Company A would (1) disclose $300,000 in year 2000
NAS purchases, (2) observe the general market reaction to the initial NAS disclosures, and (3)
recognize that 2001 NAS purchases would be disclosed in 2002, thus (potentially) impacting the
cost of capital for debt/equity issuances made in 2002. Accordingly, for the 2000 (2001)
regressions, we utilize 2001 (2002) values of the Bradshaw et al. (2006) FINANCE variable.
We measure SIZE as the natural log of total assets. Our hypothesis generally predicts that the
SIZE-induced demand (positive coefficient) for NAS will decrease during the post-disclosure
environment due to the increase in agency costs, which is positively associated with larger firms.
ACE, coded ‘‘1,’’ is the audit committee, is entirely independent, and meets at least four times per
year. We expect the mandatory disclosure regime to increase the sensitivity of audit committees to
the scrutiny of stakeholders concerning the disclosure of NAS purchases.
In addition to our test variables, we control for other factors that prior research has posited to
affect the NAS fee ratio. For these control variables, we do not believe the mandated NAS disclosure
environment will impact the relation between these determinants and the NAS/audit fee ratio. We
define BLOCK as the cumulative percentage of outstanding stock held by unaffiliated shareholders
with 5 percent or greater stakes. Following the results documented in Abbott et al. (2003a), we
expect this variable to be negative in the initial year as blockholders use the financial statements as a
means of monitoring and, thus, discourage high levels of NAS purchases. However, we do not
expect that mandated NAS disclosures will alter this coefficient estimate.14 The Big 4 auditors offer a
wider array of expertise and have more aggressively expanded into consulting services, thus we
control for the presence of a Big 4 auditor via our dichotomous BIG4 variable. As in Firth (1997), we
expect a positive association between BIG4 and our dependent variable. However, there is not an apriori reason for the mandated NAS disclosures to either intensify or mitigate this relation.
Firth (1997) notes that certain situations, such as new acquisitions (ACQ), CEO turnover
(CHGCEO), and restructuring (RESTR), give rise to increased demand for consulting services,
regardless of the NAS disclosure environment. Hence, we predict a positive association between the
NAS ratio and such special situations, but do not expect that changes in the disclosure environment
will impact this association. Firth (1997) also asserts that a poorly performing company may
demand more external consulting services to improve profitability. Firth (1997) finds significantly
higher NAS fee ratios when stock returns are lower, and therefore we expect a negative association
between the NAS fee ratio and prior-period stock returns (RETURN). Similar to ACQ, RESTR, and
14 From the perspective of the Abbott et al. (2003a) study, BLOCK is treated as an agency variable because theseauthors expect the NASAFRATIO to vary with the presence of parties who have an interest in the credibility offinancial reporting. However, BLOCK differs from our other test variables in that it is unclear whether the publicdisclosure of audit and nonaudit fees would have any impact on the relationship documented by Abbott et al.(2003a). We note that it is possible that large blockholders would be able to influence the firm’s NAS purchasedecisions, regardless of whether the audit and nonaudit fee information is public or not. Thus, it is difficult todetermine whether a hypothesis that predicts a change in the relationship between BLOCK and theNASAFRATIO prompted by new public disclosures is warranted. Thus, we treat BLOCK as a control variable.
Does Mandated Disclosure Induce a Structural Change? 63
Auditing: A Journal of Practice & TheoryMay 2011

CHGCEO, we do not expect the disclosure environment to impact the predicted negative relation
between RETURN and our dependent variable.
RESULTS
Descriptive Results
Table 3, Panels A and B, shows a comparison of the descriptive statistics for fiscal years 2000
and 2001. Fees (not adjusted for inflation) were somewhat larger in all categories in 2001,
compared to 2000. The median audit fee increased by approximately 5.9 percent, while the median
NAS fee increased by only 3.5 percent. When we delete the single, largest $79.5 ($35) million NAS
fee (not reported) in 2001 (2000), the mean NAS purchase decreases from $1,588,663 to
$1,478,044, or a fairly large (and statistically significant) 7 percent reduction in NAS from 2000 to
2001 (we report our sensitivity tests for outliers subsequently). This compares to an increase in
mean audit fees from $818,461 to $836,876 for the same period. In addition, we believe that
increases in nonaudit fees across the 25th and 50th percentiles most likely represent
‘‘continuations’’ of existing NAS arrangements, rather than registrants actively purchasing more
NAS. More specifically, NAS purchases at the 25th (50th) percentile increased less than 4 percent
(3.5 percent)—close to the U.S. inflation rate for the period. Moreover, NAS purchases at the 75th
percentile decreased from $1,495,000 to $1,361,164, representing a large (and statistically
significant) decline of nearly 9 percent. In contrast, audit fees increased at the 25th, 50th, and 75th
percentiles (as well as the mean audit fee) from 2000 to 2001. One interpretation consistent with
these results is that while the overall demand for NAS remained positive, purchases of NAS
services from incumbent auditors decelerated considerably in the wake of the market’s generally
unfavorable view of or reaction to the purchase of NAS (e.g., Unger 2001; Dhaliwal et al. 2008;
Brandon et al. 2004; Nam 2005).15
Table 3, Panel C, describes our DECRNAS and DECRRATIO variables. To further dif-
ferentiate those firms with increases versus decreases in NAS fees, we also utilize logistic
regressions in subsequent tests where we define the dependent as DECRNAS (coded ‘‘1’’ if the
total 2001 NAS fees are less than the 2000 NAS fees) and DECRATIO (coded ‘‘1’’ if the NAS
fee ratio decreased from 2000 to 2001). Of our sample, 177 firms (52.4 percent) exhibited
decreases in their NAS fees from 2000 to 2001. In contrast, 155 (6) firms exhibited increases (no
change) in their NAS fees.16 Similarly, 186 firms (55.2 percent) exhibited a decrease in their
NAS fee ratio from 2000 to 2001. In contrast, the remaining 146 (6) firms exhibited increases (no
change) in their NAS ratio.
With respect to our remaining variables, our sample firms experienced a slightly higher level of
restructurings (mean of 0.10 in 2001 versus 0.086 in 2000) and a slightly lower incidence of CEO
change (mean of 0.044 in 2000 and 0.029 in 2001). In 2000, 44 percent of the sample firms had
audit committees that were entirely independent and met at least four times during the year covered
by the proxy statement. In 2001, 48 percent of committees met these criteria. In 2000, the mean
15 The annualized growth rate of NAS in the U.S. for the ten-year period through 2000 was approximately 16.5percent (Jenkins and Krawczyk 2003). This compares to our mean NAS growth rate of less than 4 percent. Thus,it appears that the rapid growth in NAS purchases from incumbent auditors significantly decelerated in post-disclosure regime.
16 Less than 3 percent of our sample reported zero NAS fees, and there was almost complete overlap of these firmsacross 2000 and 2001, resulting in the six firms who exhibited no change in their NAS fees. Seven out of 338firms (or approximately 2.07 percent of our sample) had a NASAFRATIO of 0 in 2000, and six firms (or 1.77percent of our sample) had a NASAFRATIO of 0 in 2001. All six firms with a NASAFRATIO of 0 in 2001 had asimilar ‘‘0’’ value in 2000. Eliminating these firms did not qualitatively affect our results. Consequently, wereported OLS results in preference to the less common Tobit analysis (discussed in the sensitivity tests section).
64 Abbott, Parker, and Peters
Auditing: A Journal of Practice & TheoryMay 2011

TABLE 3
Descriptive Data
Panel A: Descriptive Statistics for 338 Sample Firms for Fiscal Year 2000
Variable Mean Median Min. Max. 25th % 75th % Std. Dev.
AUDITFEE $818,461 $424,524 $18,000 $6.7m $138,700 $844,695 $1,325,671
ITFEE $704,201 $0 $0 $17.9m $0 $0 $3,730,134
NONAUDITFEE $1,687,513 $306,920 $0 $35m $84,500 $1,495,000 $3,681,981
NASAFRATIO 1.984 1.092 0.000 17.95 0.485 2.347 2.499
INOWN 0.179 0.109 0.004 0.887 0.025 0.305 0.202
LEVERAGE 0.204 0.183 0.000 0.776 0.013 0.294 0.199
FINANCE 0.024 �0.006 �0.114 0.278 �0.052 0.046 0.008
ASSETS (in mil) $4,227 $611 $2.008 $47,603 $114 $2,861 $13,123
ACE 0.444 0.000 0.000 1.000 0.000 1.000 0.496
BLOCK 0.148 0.118 0.000 0.878 0.000 0.256 0.146
BIG4 0.940 1.000 0.000 1.000 1.000 1.000 0.236
ACQ 0.236 0.000 0.000 1.000 0.000 0.000 0.599
CHGCEO 0.044 0.000 0.000 1.000 0.000 0.000 0.206
RESTR 0.086 0.000 0.000 1.000 0.000 0.000 0.280
RETURN 0.049 0.025 �0.245 0.548 �0.022 0.233 0.504
Panel B: Descriptive Statistics for 338 Sample Firms for Fiscal Year 2001
Variable Mean Median Min. Max. 25th % 75th % Std. Dev.
AUDITFEE $836,876 $449,750 $26,000 $7.6m $157,025 $880,301 $1,346,228
ITFEE $640,475 $0 $0 $41.3m $0 $0 $4,262,491
NONAUDITFEE $1,708,878 $317,771 $0 $79.5m $87,798 $1,361,164 $4,167,371
NASAFRATIO 1.738 0.986 0.000 20.13 0.493 2.311 2.109
INOWN 0.163 0.101 0.003 0.856 0.024 0.287 0.225
LEVERAGE 0.199 0.185 0.000 0.778 0.012 0.291 0.198
FINANCE 0.021 �0.006 �0.112 0.224 �0.058 0.039 0.101
ASSETS (in mil) $4,540 $621 $2.003 $49,005 $118 $2,902 $13,774
ACE 0.476 0.000 0.000 1.000 0.000 1.000 0.499
BLOCK 0.149 0.112 0.000 0.876 0.000 0.243 0.149
BIG4 0.940 1.000 0.000 1.000 1.000 1.000 0.252
ACQ 0.254 0.000 0.000 1.000 0.000 0.000 0.613
CHGCEO 0.029 0.000 0.000 1.000 0.000 0.000 0.169
RESTR 0.104 0.000 0.000 1.000 0.000 0.000 0.304
RETURN 0.043 0.048 �0.333 0.605 �0.031 0.133 0.778
Panel C: Proportion of 338 Firms with Decreasing NAS from 2000–2001
Variable Mean Median Min. Max. 25th % 75th % Std. Dev.
DECRRATIO 0.524 1.000 0.000 1.000 0.000 1.000 0.4994
DECRNAS 0.552 1.000 0.000 1.000 0.000 1.000 0.4964
All variables are defined in Table 2, with the exception of ASSETS, which are denoted in millions, and are logged forregression purposes.
Does Mandated Disclosure Induce a Structural Change? 65
Auditing: A Journal of Practice & TheoryMay 2011

(median) total assets of our sample firms were $4.2 billion ($611 million), and in 2001, the mean
(median) was $4.5 billion ($621 million). Non-Big 4 auditors account for 9.4 percent (9.3 percent)
of the sample in 2000 (2001). Other variables showed little change between years.
We also conducted tests of the inter-period correlation from 2000 to 2001 for each of the test
and control variables (not reported). We document very high, significant, inter-period Pearson
pairwise correlations for all the independent variables except those measuring external financing,
acquisitions, CEO change, restructurings, and return.17 It seems reasonable that there would be
relatively little year-to-year change in variables such as leverage, managerial ownership, audit
committee characteristics, etc. It also seems reasonable that acquisitions, restructurings, CEO
changes, returns, and capital infusions would be less likely to be repeated in successive years. The
high correlations on some variables should increase our ability to isolate the effects of disclosure on
NAS purchasing behavior. In effect, only the disclosure environment is manipulated, while most of
our independent variables remain relatively constant across the two sample periods.
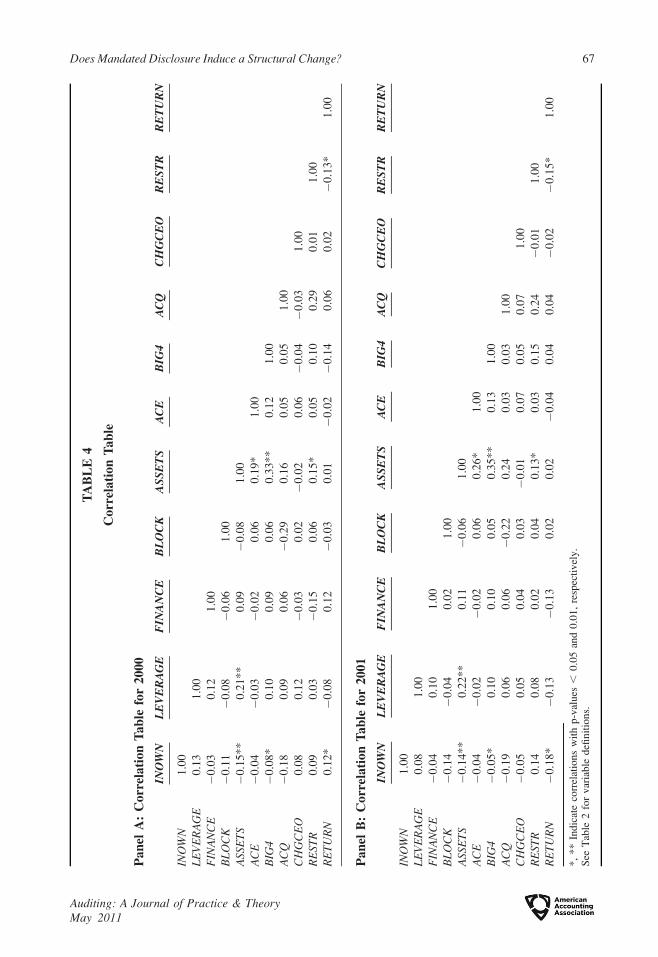
Table 4, Panels A and B, shows the cross-sectional correlations between the independent
variables for 2000 and 2001. Few of the correlations are significant, and many of the significant
correlations relate to size. In both years, ASSETS exhibits a significant positive correlation with
BIG4, LEVERAGE, and RESTR, and a negative correlation with INOWN. Profitability (RETURN) is
negatively correlated with restructuring and Big 4 auditor, and positively correlated with inside
ownership. Correlations between the independent variables are qualitatively similar within each
year, with the exception of the correlation between RETURN and BIG4, which is not significant in
2001. The similar correlations are consistent with our use of the same firms in our 2000 and 2001
sample years. Tests for multicollinearity (Belsley et al. 1980) did not reveal any areas of concern.
Univariate Results
Table 5 partitions the sample by increases or decreases in the NAS fee ratio (Panel A) and
whether NAS fees increased or decreased overall (Panel B). Panel A shows that the 189
observations that exhibited smaller NAS fee ratios in 2001 (relative to 2000) had significantly lower
inside ownership and were less likely to restructure. These firms were larger and more likely to seek
external financing. Panel B shows similar results when considering the 177 observations with lower
NAS fees in 2001 (compared to 2000) in dollar terms. However, high leverage does not appear to
spur reduction in subsequent year NAS fees. The univariate results are consistent with our first,
third, and fourth hypotheses.
The univariate results for our audit committee variable support our final hypothesis. As
expected, firms with effective audit committees were more likely to decrease their NAS purchases
in terms of both dollars and as a percentage of audit fees. This is consistent with effective audit
committees being more responsive to disclosed NAS, as NAS disclosure may serve as a potential
trigger for litigation (Huang et al. 2008; Church and Zhang 2005).
Chow Tests and Multivariate Results
Overall, the multivariate results corroborate the patterns documented in the univariate tests and
support the related hypotheses. For comparative purposes, the first column in Table 6 shows the
regression results for 2000, the year firms purchased NAS without the presence of mandatory
17 As an example, we calculated the pairwise correlation between our ACE variable values of 2000 and ACEvariable values in 2001. The pairwise correlation coefficient equaled 0.8755, suggesting very little change inACE between the two years. The inter-period correlations for INOWN, LEVERAGE, SIZE, and BLOCK are 0.84,0.94, 0.94, and 0.84, respectively. The inter-period correlation for BIG4 is 1.0, as we eliminated any firm that hadchanged auditors during 2001.
66 Abbott, Parker, and Peters
Auditing: A Journal of Practice & TheoryMay 2011
TA
BL
E4
Co
rrel
ati
on
Ta
ble
Pa
nel
A:
Co
rrel
ati
on
Ta
ble
for
20
00
INO
WN
LE
VE
RA
GE
FIN
AN
CE
BL
OC
KA
SS
ET
SA
CE
BIG
4A
CQ
CH
GC
EO
RE
ST
RR
ET
UR
N
INO
WN
1.0
0
LE
VE
RA
GE
0.1
31
.00
FIN
AN
CE
�0
.03
0.1
21
.00
BL
OC
K�
0.1
1�
0.0
8�
0.0
61
.00
ASS
ET
S�
0.1
5*
*0
.21
**
0.0
9�
0.0
81
.00
AC
E�
0.0
4�
0.0
3�
0.0
20
.06
0.1
9*
1.0
0
BIG
4�
0.0
8*
0.1
00
.09
0.0
60
.33
**
0.1
21
.00
AC
Q�
0.1
80
.09
0.0
6�
0.2
90
.16
0.0
50
.05
1.0
0
CH
GC
EO
0.0
80
.12
�0
.03
0.0
2�
0.0
20
.06
�0
.04
�0
.03
1.0
0
RE
STR
0.0
90
.03
�0
.15
0.0
60
.15
*0
.05
0.1
00
.29
0.0
11
.00
RE
TU
RN
0.1
2*
�0
.08
0.1
2�
0.0
30
.01
�0
.02
�0
.14
0.0
60
.02
�0
.13
*1
.00
Pa
nel
B:
Co
rrel
ati
on
Ta
ble
for
20
01
INO
WN
LE
VE
RA
GE
FIN
AN
CE
BL
OC
KA
SS
ET
SA
CE
BIG
4A
CQ
CH
GC
EO
RE
ST
RR
ET
UR
N
INO
WN
1.0
0
LE
VE
RA
GE
0.0
81
.00
FIN
AN
CE
�0
.04
0.1
01
.00
BL
OC
K�
0.1
4�
0.0
40
.02
1.0
0
ASS
ET
S�
0.1
4*
*0
.22
**
0.1
1�
0.0
61
.00
AC
E�
0.0
4�
0.0
2�
0.0
20
.06
0.2
6*
1.0
0
BIG
4�
0.0
5*
0.1
00
.10
0.0
50
.35
**
0.1
31
.00
AC
Q�
0.1
90
.06
0.0
6�
0.2
20
.24
0.0
30
.03
1.0
0
CH
GC
EO
�0
.05
0.0
50
.04
0.0
3�
0.0
10
.07
0.0
50
.07
1.0
0
RE
STR
0.1
40
.08
0.0
20
.04
0.1
3*
0.0
30
.15
0.2
4�
0.0
11
.00
RE
TU
RN
�0
.18
*�
0.1
3�
0.1
30
.02
0.0
2�
0.0
40
.04
0.0
4�
0.0
2�
0.1
5*
1.0
0
*,
**
Indic
ate
corr
elat
ions
wit
hp-v
alues
,0.0
5an
d0.0
1,
resp
ecti
vel
y.
See
Tab
le2
for
var
iable
defi
nit
ions.
Does Mandated Disclosure Induce a Structural Change? 67
Auditing: A Journal of Practice & TheoryMay 2011

disclosure requirements. The results show that in year 2000, none of our test variables are significant
except SIZE and ACE, consistent with the Abbott et al. (2003a) results from the original sample. The
significance of SIZE is also consistent with larger companies having more complex systems and a
wider range of activities in which NAS can add value to the client (Firth 1997). The significance of
ACE is as expected, given the audit committee’s concerns about monitoring auditor independence.
We then turn our attention to the results for 2001, the first year in which firms purchased NAS
conditioned upon mandatory disclosure. In general, we see that each of our test variables (INOWN,
FINANCE, SIZE, ACE) is significant and has the predicted sign, with the exception of LEVERAGE,
TABLE 5
Univariate Analysis
Panel A: Decreases and Increases in NAS/Audit Fee Ratios in 2001
Variable
Mean for Firmswith Decreased
NAS/Audit Fee Ratio
Mean for Firmswith Increased
NAS/Audit Fee Ratio F-statistic
INOWN 0.126 0.169 4.888*
LEVERAGE 0.189 0.227 1.013
FINANCE 0.035 �0.005 5.033*
ASSETS (in mil) $4,888.992 $4,103.115 6.018*
ACE 0.561 0.369 9.224**
BLOCK 0.143 0.158 1.005
BIG4 0.923 0.945 0.112
ACQ 0.238 0.275 0.224
CHGCEO 0.026 0.034 0.777
RESTR 0.079 0.134 6.881*
RETURN 0.045 0.041 0.995
Observations n ¼ 189 n ¼ 149
Panel B: Decreases and Increases in NAS Fees (in dollars) in 2001
Variable
Mean for Firmswith DecreasedNAS Fees ($)
Mean for Firmswith IncreasedNAS Fees ($) F-statistic
INOWN 0.133 0.163 5.012*
LEVERAGE 0.194 0.212 0.998
FINANCE 0.033 �0.005 5.278*
ASSETS (in mil) $4,905.077 $4,082.445 5.998*
ACE 0.559 0.379 9.138**
BLOCK 0.143 0.157 1.322
BIG4 0.924 0.943 0.130
ACQ 0.237 0.273 0.189
CHGCEO 0.028 0.031 0.552
RESTR 0.073 0.137 7.337*
RETURN 0.044 0.043 1.002
Observations n ¼ 177 n ¼ 161
*, ** Significant at p-values less than 0.05 and 0.01, respectively.See Table 2 for all variable definitions.
68 Abbott, Parker, and Peters
Auditing: A Journal of Practice & TheoryMay 2011

which was insignificant in both sample periods. To ascertain whether the disclosure environment
induces a change in the regression coefficients, we next conduct Chow tests. Our Chow tests,
discussed in greater detail in the succeeding paragraphs, support H1, H3, H4, and H5.
INOWN was negative and insignificant in 2000, and positive and significant in 2001. The
results of the Chow test show that the coefficient in 2001 is significantly different from the
coefficient in 2000 (p , 0.01 level). The tests support the prediction that greater managerial
ownership is associated with higher NAS purchases from the auditor when fees are subject to
disclosure, but not when firms purchase NAS in the absence of disclosures. This is consistent with
the need to weigh the benefits of NAS against the associated agency costs in the disclosure
environment. Similarly, the FINANCE variable also displays results consistent with the disclosure-
induced agency costs predicted by the hypotheses. The multivariate results suggest that firms
engaging in future financing exhibit a significantly negative association with the NAS fee ratio in
year 2001, but that such a relation was nonexistent in 2000. The Chow tests confirm that the 2001
and 2000 coefficients are significantly different from each other. Firms facing the need to raise
capital appear to be sensitive to the disclosure-induced agency costs of purchasing NAS. Thus, they
appear to have constrained their purchases of NAS once it became clear that the market imposed
higher costs of capital on firms disclosing higher NAS fee ratios.
We note the change in purchasing patterns based on company size (SIZE) continues to support
our fourth hypothesis. Although larger firms were more likely to purchase greater amounts of NAS
in both years, our Chow test confirms a significant decrease in the magnitude of this association in
the subsequent year. The decrease in magnitude of this coefficient is consistent with larger firms
being more sensitive to political costs (and concomitant market-imposed agency costs). This
TABLE 6
Regression Results
NASAFRATIO ¼ b0 þ b1INOWN þ b2LEVERAGEþ b3FINANCE þ b4SIZEþ b5ACE þ b6BLOCK þ b7BIG4þ b8ACQþ b9CHGCEOþ b10RESTRþ b11RETURN þ e
Variable Year 2000 Parameter Estimate t-stat Year 2001 Parameter Estimate t-stat
Intercept �2.984 �3.998** �2.916 �3.099**,a
INOWN �0.461 �0.776 0.393 3.692**,a
LEVERAGE 0.033 0.858 �0.297 �1.001
FINANCE 0.554 0.444 �0.152 �2.995**,a
SIZE 0.391 5.458** 0.364 4.192**,a
ACE �0.687 �3.449** �1.338 �4.985**,a
BLOCK �1.684 �2.446* �1.548 �2.362*
BIG4 0.543 0.885 0.448 0.885
ACQ �0.395 �0.788 �0.425 �0.598
CHGCEO 0.122 0.208 0.103 0.288
RESTR 1.063 2.003* 0.777 2.113*
RETURN 0.003 0.668 �0.081 �0.344
n ¼ 338 Adj R2 ¼ 0.1702 Adj R2 ¼ 0.2975 n ¼ 338
*, ** Significant at p-levels of less than 0.05 and 0.01, respectively.a Chow tests for differences in coefficients (year 2000 versus year 2001) significant at the 1 percent level. We do notmake a directional prediction for the effect of disclosure on our control variables, and thus the significance level fordifferences in the control variable coefficients reflects a two-tailed test.All variables per Table 2, except SIZE, which is the natural log of total assets (in millions).
Does Mandated Disclosure Induce a Structural Change? 69
Auditing: A Journal of Practice & TheoryMay 2011

suggests that the disclosures provided agency cost incentives for larger firms to curb their NAS
purchases to a greater extent than smaller firms.
Although firms with effective audit committees (ACE) are associated with relatively lower
levels of NAS in both years, the Chow test for differences in coefficient estimates between years
confirms that this negative association increases during the disclosure period (2001). This supports
the hypothesis that effective audit committees are more responsive to the level of NAS purchases
when they know that such purchases are subject to disclosure. This also provides empirical, archival
support for the results of Gaynor et al. (2006).
With respect to the control variables, our Chow test (two-tailed) for the difference in the
coefficients is not significant for blockholder ownership (BLOCK), although the coefficients exhibit
a significantly negative association with the purchase of NAS in both years. We speculate that the
element of public disclosure might be less important to blockholders who might have access to
information about a firm’s NAS purchases, or who may have the ability to influence the NAS
sourcing decision in the absence of public disclosure. Chow tests for differences in the coefficients
for our remaining control variables (BIG4, ACQ, CHGCEO, RESTR, and RETURN) are not
significant, suggesting that the mandated NAS disclosures did not structurally alter the relation
between these independent variables and the NAS/audit fee ratio.
We also observed a dramatic increase in the explanatory power of the agency-based demand
models from the initial disclosure year 2000 (R2¼ 0.1702) to year 2001 (R2¼ 0.2975). An F-test
for differences in the explanatory power of the regression models was significant at p-value , 0.01.
Overall, our results are consistent with firms choosing to adjust their NAS purchasing patterns once
it was clear that the market would impose agency costs on companies disclosing larger amounts of
NAS.
Logistic Regressions
While the market’s unfavorable reaction to the initial NAS disclosures was statistically and
economically significant, the overwhelming majority of firms continued to purchase some amount
of NAS in the mandatory disclosure environment. Given the size of the percentage changes of fees
(see descriptive statistics in Table 3), it appears that, in general, most firms either maintained their
current level of NAS services or decreased their purchases. However, as described in Table 3, some
firms exhibited increases in NAS fees. A continuation (or even increase) of NAS purchases is
consistent with companies continuing to weigh the potential costs and benefits from these types of
services, even in the presence of mandated disclosures. Thus, we extended our tests to discern
whether our NAS ratio results are consistent with certain firms decreasing their total NAS purchases
in response to newly imposed agency-related costs created by the disclosure environment. We
utilize logistic regressions where we define the dependent variables as DECRRATIO (coded 1 if the
sample firm decreased the NAS fee ratio from 2000 to 2001) and DECRNAS (coded 1 if the firm
decreased its purchases of NAS from the auditor in dollar terms from 2000 to 2001).18 Table 7
shows the results of these additional logistic regressions. The regression model is as follows:
18 We measure our independent variables using their 2001 values. However, one might easily argue that the 2000variables might be relevant to 2001 NAS purchases under some conditions. As a sensitivity test, we conductedlogistic regressions by substituting the 2000 values for our disclosure-impacted variables ACE, SIZE, andINOWN (and kept the CEOCHG, RESTR, ACQ, and RETURN variables intact with their 2001 values) and theresults are substantively unchanged. As such, we believe we have effectively isolated the impact of the change inNAS disclosure on purchasing behavior. We do not utilize changes in our independent variables becauseconceptually our hypotheses relate to how the disclosure environment in 2001 alters relations among ourvariables.
70 Abbott, Parker, and Peters
Auditing: A Journal of Practice & TheoryMay 2011
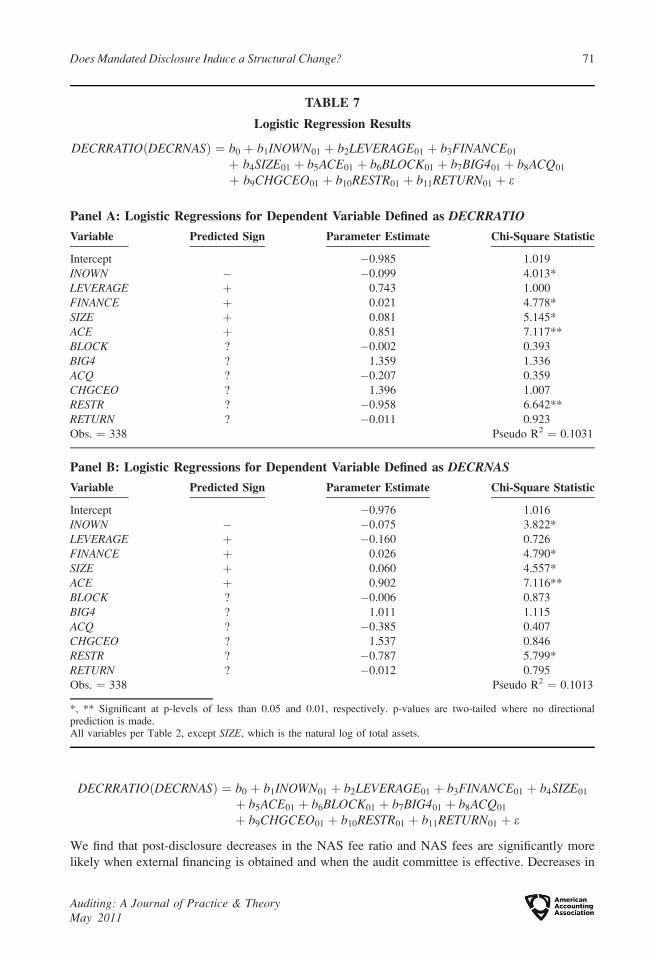
DECRRATIOðDECRNASÞ ¼ b0 þ b1INOWN01 þ b2LEVERAGE01 þ b3FINANCE01 þ b4SIZE01
þ b5ACE01 þ b6BLOCK01 þ b7BIG401 þ b8ACQ01
þ b9CHGCEO01 þ b10RESTR01 þ b11RETURN01 þ e
We find that post-disclosure decreases in the NAS fee ratio and NAS fees are significantly more
likely when external financing is obtained and when the audit committee is effective. Decreases in
TABLE 7
Logistic Regression Results
DECRRATIOðDECRNASÞ ¼ b0 þ b1INOWN01 þ b2LEVERAGE01 þ b3FINANCE01
þ b4SIZE01 þ b5ACE01 þ b6BLOCK01 þ b7BIG401 þ b8ACQ01
þ b9CHGCEO01 þ b10RESTR01 þ b11RETURN01 þ e
Panel A: Logistic Regressions for Dependent Variable Defined as DECRRATIO
Variable Predicted Sign Parameter Estimate Chi-Square Statistic
Intercept �0.985 1.019
INOWN � �0.099 4.013*
LEVERAGE þ 0.743 1.000
FINANCE þ 0.021 4.778*
SIZE þ 0.081 5.145*
ACE þ 0.851 7.117**
BLOCK ? �0.002 0.393
BIG4 ? 1.359 1.336
ACQ ? �0.207 0.359
CHGCEO ? 1.396 1.007
RESTR ? �0.958 6.642**
RETURN ? �0.011 0.923
Obs. ¼ 338 Pseudo R2 ¼ 0.1031
Panel B: Logistic Regressions for Dependent Variable Defined as DECRNAS
Variable Predicted Sign Parameter Estimate Chi-Square Statistic
Intercept �0.976 1.016
INOWN � �0.075 3.822*
LEVERAGE þ �0.160 0.726
FINANCE þ 0.026 4.790*
SIZE þ 0.060 4.557*
ACE þ 0.902 7.116**
BLOCK ? �0.006 0.873
BIG4 ? 1.011 1.115
ACQ ? �0.385 0.407
CHGCEO ? 1.537 0.846
RESTR ? �0.787 5.799*
RETURN ? �0.012 0.795
Obs. ¼ 338 Pseudo R2 ¼ 0.1013
*, ** Significant at p-levels of less than 0.05 and 0.01, respectively. p-values are two-tailed where no directionalprediction is made.All variables per Table 2, except SIZE, which is the natural log of total assets.
Does Mandated Disclosure Induce a Structural Change? 71
Auditing: A Journal of Practice & TheoryMay 2011

the NAS ratio (NAS fees) are also less likely when inside ownership is higher and when the
company is larger. Our logistic regression evidence supplements our Chow test results and yields
qualitatively similar evidence.
Sensitivity Tests
We pooled our two years of data and introduced interaction terms to test whether the test
variables exhibit significant changes in 2001. Our results from the pooled regression are
qualitatively the same as those obtained from the Chow tests and logistic regression. In addition, we
recognize that the ratio of NAS to audit fees is only one of many possible measures identified with
the perception of impaired audit independence. We used three additional measures including the
ratio of NAS to total fees, NAS fees scaled by total assets, and NAS fees scaled by total sales. Our
results are robust to these alternate specifications. We also note that audit fees exhibited extremely
high inter-period correlation of 0.9548. This indicates that changes in subsequent year NAS/audit
fee ratios are almost entirely attributable to changes in NAS.
Our results were not sensitive to alternative measures of leverage. The inclusion of (1)
industry-adjusted leverage (the difference between sample firm leverage and the mean leverage for
the two-digit industry), or (2) times interest earned to measure leverage did not change our
qualitative results. Our results are also consistent when using an alternate measure of FINANCE,
namely, total proceeds from the issuance of debt and/or equity securities.
Generally, IT fees were quite infrequent, but when present were quite large. Moreover, there
was very little serial correlation for these high IT implementation projects, such that very few firms
reporting high IT fees in 2000 also reported very high IT fees in 2001. As a sensitivity test, we
excluded those observations which reported financial systems implementation fees. The exclusion
of IT fees from NASAFRATIO (or NAS fee total) did not qualitatively change our results.
We truncated the observations, eliminating the top and bottom 1 percent and 5 percent of the
observations based on NAS fee ratio. Truncating at 5 percent excludes all firms with zero NAS fees,
as these comprise less than 3 percent of the sample in both years. Truncation of the highest (lowest)
1 percent and 5 percent of our dependent variable values did not materially alter our OLS regression
results. Given that a portion of our dependent variable observations were constrained at zero (see
footnote 16), we also used Tobit regression as an alternate statistical method, which left our results
qualitatively unchanged.
We also collected data related to the extent of foreign operations in order to better capture
company demand for NAS (from both Compustat and 10-K filings). Foreign sales (as a percentage
of total sales), the number of non-U.S. geographic segments disclosed, and a number of tax-related
variables (foreign taxes, pre-tax foreign income, deferred foreign taxes) were included in the
regressions individually and as a group. These variables were not significant, nor did their inclusion
qualitatively alter our reported results.
We also collected a number of additional corporate governance variables related to the board of
directors and audit committee: the percentage of independent board members, the number of board
meetings, state of incorporation, CEO/Chair duality, the percentage of financial experts on the audit
committee, and several measures of common stock and options holdings by the board and audit
committee. These variables were not significant either individually or collectively and their
inclusion did not qualitatively affect our reported results.
CONCLUSION
We examine whether public disclosures induced structural changes in the relation between
agency-related characteristics and nonaudit service (NAS) purchases. We find that after the SEC
mandated auditor fee disclosures, NAS purchases become negatively associated with firms seeking
72 Abbott, Parker, and Peters
Auditing: A Journal of Practice & TheoryMay 2011
financing and positively associated with managerial ownership. We also document a significantly
smaller propensity of NAS purchases among larger firms, compared to a nondisclosure
environment. Last, we find that mandated disclosures significantly increase the negative association
between NAS purchases and effective audit committees. Consistent with prior literature, we posit
that the market used the NAS fee ratio as a publicly available audit quality signal. We argue that the
availability of this information to the market was unanticipated (anticipated) by firms making NAS
purchases in 2000 (2001). As such, our research design isolates the impact of mandated NAS
disclosure on the NAS purchase decision. In so doing, our test setting provides a unique and
powerful setting to examine the effects of mandated disclosure on the agency-based demand for
audit quality signals. Our results suggest that the market’s price protection reaction to the NAS
disclosures triggered an NAS-agency conflict relation consistent with agency theory, but without
such disclosures, this relation did not exist.
Our results indicate that the Auditor Independence Rules of 2000 were effective in providing
registrants demand-side incentives regarding the purchase of NAS prior to the Sarbanes-Oxley Act
of 2002. Moreover, effective audit committees appeared to be even more averse to large NAS
purchases after the mandated NAS disclosures appeared. This provides empirical, archival support
for the results of Gaynor et al. (2006) and suggests that management and audit committees
responded to the disclosure approach originally enacted by the SEC. The disclosure approach
contrasts to that of the Sarbanes-Oxley Act, which took a supply-side approach to the NAS issue by
banning several types of NAS services, most notably internal audit outsourcing (Canada et al.
2008). This remains an important issue as regulators face similar decisions between relying on
disclosure and prohibiting NAS activities in the future.
Second, our evidence suggests that as it became clear that the market imposes costs on
high-NAS firms, firms altered their NAS purchases dependent upon the degree of some agency
cost-related characteristics. This suggests that a necessary precondition for firms to use NAS as an
agency-based audit quality signal is an economically significant amount of market price protection.
This may explain why the voluntary early disclosure of NAS fees in the U.K. did not seem to be
used to signal audit quality (Lennox 1999), as it was likely unclear whether the market would
impose agency costs on NAS purchases. In contrast, the results of Dhaliwal et al. (2008), Francis
and Ke (2006), Brandon et al. (2004), and others all suggest that this was the case in the U.S.
during the time period studied. In the face of mandated disclosures, our results suggest that firms
reacted to these incentives by varying the purchase of NAS (at least with respect to the NAS
purchases from their incumbent auditor) relative to the agency costs facing the company and did so
in a very timely manner.
In addition, the SEC did not originally require disclosure of extensive details of the types of
NAS purchased or the rationales for doing so. As such, the NAS fee ratio may be an imperfect
indicator of actual audit quality if not all NAS purchases have an equal impact on auditor
independence and thus audit quality. We encourage more research (analytical, archival, and
behavioral) to increase our understanding of the different incentives and purchasing patterns
exhibited in the mandated disclosure setting. For example, we encourage additional research on the
propensity to purchase ‘‘audit-related’’ services (in contrast to ‘‘audit’’ services) when those services
are distinguished from purchases of nonaudit services.19 In turn, this will give us more information
about the implications and determinants of audit quality and NAS disclosure environments.
19 During our study, the SEC defined three disclosure categories: ‘‘Audit Fees,’’ ‘‘Financial Information SystemsDesign and Implementation Fees,’’ and ‘‘All Other.’’ In 2003 the SEC amended the disclosure rules to explicitlydefine and separate the disclosure of ‘‘audit-related’’ from the ‘‘All Other’’ category (SEC 2003).
Does Mandated Disclosure Induce a Structural Change? 73
Auditing: A Journal of Practice & TheoryMay 2011

REFERENCES
Abbott, L. J., S. Parker, G. F. Peters, and K. Raghunandan. 2003a. An empirical investigation of audit fees,
nonaudit fees and audit committees. Contemporary Accounting Research 20 (2): 215–234.
Abbott, L. J., S. Parker, G. F. Peters, and D. V. Rama. 2003b. Audit, nonaudit and information technology
fees: Some empirical evidence. Accounting and the Public Interest 3 (1): 1–20.
Abbott, L. J., S. Parker, G. F. Peters, and D. V. Rama. 2007. Corporate governance, audit quality, and the
Sarbanes-Oxley Act: Evidence from internal audit outsourcing. The Accounting Review 82 (4): 803–
835.
Ashbaugh, H., R. LaFond, and B. Mayhew. 2003. Do nonaudit services compromise auditor independence?
Further evidence. The Accounting Review 78 (3): 611–639.
Asthana, S., and J. Krishnan. 2006. Factors associated with the early adoption of the SEC’s revised auditor
fee disclosure rules. Auditing: A Journal of Practice & Theory 25 (2): 41–52.
Balvers, R. J., B. McDonald, and R. E. Miller. 1988. Underpricing of new issues and the choice of auditor
as a signal of investment banker reputation. The Accounting Review 63 (4): 605–622.
Barkess, L., and R. Simnett. 1994. The provision of other services by auditors: Independence and pricing
issues. Accounting and Business Research 24 (94): 99–108.
Barton, J. 2005. Who cares about auditor reputation? Contemporary Accounting Research 22 (3): 549–586.
Beatty, R. 1989. Auditor reputation and the pricing of initial public offerings. The Accounting Review 64
(4): 693–709.
Beck, P., T. Frecka, and I. Solomon. 1988. A model of the market for MAS and audit services: Knowledge
spillovers and auditor-auditee bonding. Journal of Accounting Literature 7: 50–64.
Belsley, D. A., E. Kuh, and R. E. Welsch. 1980. Regression Diagnostics: Identifying Data and Sources ofCollinearity. New York, NY: Wiley.
Blouin, J., B. Grein, and B. Rountree. 2007. An analysis of forced auditor change: The case of former
Arthur Andersen clients. The Accounting Review 82 (3): 621–650.
Bradshaw, M., S. Richardson, and R. Sloan. 2006. The relation between corporate financing activities,
analysts’ forecasts and stock returns. Journal of Accounting and Economics 42 (1–2): 53–85.
Brandon, D., A. Crabtree, and J. Maher. 2004. Nonaudit fees, auditor independence, and bond ratings.
Auditing: A Journal of Practice & Theory 23 (2): 89–103.
Canada, J., J. R. Kuhn, and S. G. Sutton. 2008. Accidentally in the public interest: The perfect storm yielded
the Sarbanes-Oxley Act. Critical Perspectives on Accounting 19 (7): 987–1003.
Chaney, P., D. Jeter, and L. Shivakumar. 2004. Self-selection of auditors and audit pricing in private firms.
The Accounting Review 79 (1): 51–72.
Chow, C. W. 1982. The demand for external auditing: Size, debt and ownership influences. The AccountingReview 57 (2): 301–326.
Chung, H., and S. Kallapur. 2003. Client importance, nonaudit services and abnormal accruals. TheAccounting Review 78 (4): 931–955.
Church, B., and P. Zhang. 2005. The effect of nonaudit services and auditor fee disclosures on asset
valuation and auditor litigation: Experimental evidence. Working paper, University of Toronto.
Copley, P. A., and E. B. Douthett, Jr. 2002. The association between auditor choice, ownership retained,
and earnings disclosure by firms making initial public offerings. Contemporary Accounting Research19 (1): 49–75.
Davis, S. M., and D. Hollie. 2008. The impact of nonaudit service fee levels on investors’ perception of
auditor independence. Behavioral Research in Accounting 20 (1): 31–44.
DeAngelo, L. E. 1981. Auditor size and audit quality. Journal of Accounting and Economics 3 (3): 183–
199.
DeFond, M. L. 1992. The association between changes in client firm agency costs and auditor switching.
Auditing: A Journal of Practice & Theory 11 (1): 16–31.
DeFond, M. L., K. Raghunandan, and K. Subramanyam. 2002. Do nonaudit service fees impair auditor
independence? Evidence from going concern opinions. Journal of Accounting Research 40 (4):
1247–1274.
74 Abbott, Parker, and Peters
Auditing: A Journal of Practice & TheoryMay 2011

Dhaliwal, D., C. Gleason, S. Heitzman, and K. Melendrez. 2008. Auditor fees and cost of debt. Journal ofAccounting, Auditing and Finance 23 (1): 1–22.
Dopuch, N., R. R. King, and R. Schwartz. 2001. Independence in appearance and in fact: An experimental
investigation. Contemporary Accounting Research 20 (1): 79–114.
Ferguson, M., G. Seow, and D. Young. 2004. Nonaudit services and earnings management: U.K. evidence.
Contemporary Accounting Research 21 (4): 813–841.
Firth, M. 1997. The provision of nonaudit services by accounting firms to their audit clients. ContemporaryAccounting Research 14 (2): 1–21.
Francis, J., and B. Ke. 2006. Disclosure of fees paid to auditors and the market valuation of earnings
surprises. Review of Accounting Studies 11 (4): 97–106.
Frankel, R., M. Johnson, and K. Nelson. 2002. The relation between auditors’ fees for nonaudit services and
earnings management. The Accounting Review 77 (Supplement): 71–105.
Gaynor, L., L. McDaniel, and T. Neal. 2006. The effects of joint provision and disclosure of nonaudit
services on audit committee members’ decisions and investors’ preferences. The Accounting Review81 (4): 873–896.
Higgs, J., and T. Skantz. 2006. Audit and nonaudit fees and the market’s reaction to earnings
announcements. Auditing: A Journal of Practice & Theory 25 (1): 1–26.
Hogan, C. E. 1997. Cost and benefits of audit quality in the IPO market: A self-selection analysis. TheAccounting Review 72 (1): 67–86.
Huang, H., C. Lee, and E. R. Green. 2008. Nonaudit fees, auditor independence and auditor litigation.
Journal of Forensic Accounting IX: 157–174.
Ireland, J. C., and C. S. Lennox. 2002. The large audit firm fee premium: A case of selectivity bias? Journalof Accounting, Auditing and Finance 17 (1): 73–91.
Jenkins, J. G., and K. Krawczyk. 2003. Disclosure of nonaudit services fees: Perceptions of investors and
accounting professionals. The Journal of Applied Business Research (Fall): 73–80.
Jensen, M., and W. Meckling. 1976. Theory of the firm: managerial behavior, agency costs and ownership
structure. Journal of Financial Economics 3 (4): 305–360.
Krishnan, J., H. Sami, and Y. Zhang. 2005. Does the provision of nonaudit services affect investor
perceptions of auditor independence? Auditing: A Journal of Practice & Theory 24 (2): 111–135.
Lennox, C. S. 1999. Non-audit fees, disclosure and audit quality. The European Accounting Review 8 (2):
239–252.
Levitt, A. 2000. Renewing the covenant with investors. Speech before the New York University Center for
Law and Business, May 10.
Liesman, S., J. Weil, and M. Schroeder. 2002. Dirty books? Accounting debacles spark calls for change:
Here’s the rundown. Wall Street Journal (Feb 6): A1.
Mansi, S., W. Maxwell, and D. Miller. 2004. Does auditor quality and tenure matter to investors: Evidence
from the bond market. Journal of Accounting Research 42 (4): 755–793.
McNamee, M. 2002. Pitt’s accounting fix leaves a lot broke. BusinessWeek (February 24).
Nam, S. 2005. The impact of nonaudit services on capital markets. Working paper, Rutgers University.
Omer, T., J. Bedard, and D. Falsetta. 2006. Auditor-provided tax services: The effects of a changing
regulatory environment. The Accounting Review 81 (5): 1095–1117.
Palmrose, Z-V. 1986. The effect of nonaudit services on the pricing of audit services: Further evidence.
Journal of Accounting Research 24 (2): 405–421.
Parkash, M., and C. Venable. 1993. Auditee incentives for auditor independence: The case of nonaudit
services. The Accounting Review 68 (1): 113–133.
Pittman, J. A., and S. Fortin. 2004. Auditor choice and the cost of debt capital for newly public firms.
Journal of Accounting and Economics 37 (1): 113–136.
Ruddock, M., S. J. Taylor, and S. C. Taylor. 2006. NAS and earnings conservatism: Is auditor
independence impaired? Contemporary Accounting Research 23 (3): 701–746.
Securities and Exchange Commission. 2000a. Proposed Rule: Revision of the Commission’s AuditorIndependence Requirements. 17 CFR Parts 210 and 240 (Release Nos. 33-7870; 34-42994; 35-
27193; IC-24549; IA-1884; File No. S7-13-00). Washington, D.C.: SEC.
Does Mandated Disclosure Induce a Structural Change? 75
Auditing: A Journal of Practice & TheoryMay 2011

Securities and Exchange Commission. 2000b. Revision of the Commission’s Auditor IndependenceRequirements. (Release Nos. 33-7919; 34-43602; File No. S7-13-00). Washington, D.C.: SEC.
Securities and Exchange Commission. 2003. Final Rule: Strengthening the Commission’s RequirementsRegarding Auditor Independence. 17 CFR Parts 210, 240, 249 and 274. Release Nos. 33-8183; 34-
47265; 35-27642; IC-25915; IA-2103, FR-68, File No. S7-49-02. Washington, D.C.: SEC.
Teoh, S. H., and T. J. Wong. 1993. Perceived auditor quality and the earnings response coefficient. TheAccounting Review 68 (2): 346–366.
Unger, L. 2001. This year’s proxy season: Sunlight shines on auditor independence and executive
compensation. Remarks of Acting Chairman Laura S. Unger at the Center for Professional Education,
Inc., Washington, D.C., June 25. Available at: http://www.sec.gov/news/speech/spch502.htm
U.S. House of Representatives. 2002. The Sarbanes-Oxley Act of 2002. Public Law 107-204 [H. R. 3763].
Washington, D.C.: Government Printing Office.
Watts, R., and G. Zimmerman. 1983. Agency problems, auditing and the theory of the firm: Some evidence.
Journal of Law and Economics 26 (October): 613–633.
Weil, J. 2001. Double Enron role played by Andersen raises questions. Wall Street Journal (December 14):
A4.
Weil, J., and M. Rappaport. 2003. New SEC definition may cloud ‘‘audit fees’’. Wall Street Journal(January 22): C1.
76 Abbott, Parker, and Peters
Auditing: A Journal of Practice & TheoryMay 2011