does credit a ect deforestation? evidence from a rural ... · evidence from a rural credit policy...
TRANSCRIPT

Does Credit A!ect Deforestation?Evidence from a Rural Credit Policy in the Brazilian Amazon
CPI Technical Report
Climate Policy Initiative
Juliano Assunção
Clarissa Gandour
Romero Rocha
Rudi Rocha
January 2013
About CPIClimate Policy Initiative (CPI) is a policy e!ectiveness analysis and advisory organization whose mission is to assess, diagnose, and support the e!orts of key governments around the world to achieve low-carbon growth.
CPI is headquartered in San Francisco and has o"ces around the world, which are a"liated with distinguished research institutions. O"ces include: CPI Beijing a"liated with the School of Public Policy and Management at Tsinghua University; CPI Berlin; CPI Hyderabad, a"liated with the Indian School of Business; CPI Rio, a"liated with Pontifical Catholic University of Rio (PUC-Rio); and CPI Venice, a"liated with Fondazione Eni Enrico Mattei (FEEM). CPI is an independent, not-for-profit organization that receives long-term funding from George Soros.
DescriptorsSector Forestry and Land UseRegion Brazil
Keywords credit, land use, deforestation, conservation policies
Contact Juliano Assunção, CPI [email protected]
JEL codes Q23, Q24, Q28
Copyright © 2013 Climate Policy Initiative www.climatepolicyinitiative.org
All rights reserved. CPI welcomes the use of its material for noncommercial purposes, such as policy discussions or educational activities, under a Creative Commons Attribution-NonCommercial-ShareAlike 3.0 Unported License.
For commercial use, please contact [email protected].
Author A"liationsJ. Assunção, C. Gandour, Romero Rocha: Núcleo de Avaliação de Políticas Climáticas da
Pontifícia Universidade Católica do Rio de Janeiro (NAPC/PUC-Rio) & Climate Policy Initiative Rio de Janeiro (CPI Rio)
Rudi Rocha: Universidade Federal do Rio de Janeiro (UFRJ)

AbstractThe concession of rural credit in the Brazilian Amazon became conditional upon stricter legal and environmental requirements in 2008. This paper uses this policy change to investigate credit constraints in the region, and how the variation in credit impacts deforestation. Di!erences-in-di!erences estimation based on a panel of municipalities shows that the policy change led to a reduction in rural credit, particularly for cattle ranching. The e!ect is concentrated on medium and large loans. A two-stage estimation shows that the decrease in rural credit has curbed deforesta-tion, especially in municipalities where cattle ranching is the main economic activity.

1. Introduction
How does the availability of rural credit affect deforestation? Theory alone offersambiguous answers to this question. On the one hand, should credit be used to increaserural production by incorporating new lands for production, greater availability of creditwill likely lead to rising deforestation, as forest areas are cleared and converted intoagricultural land. On the other hand, should it be used to fund the capital expendituresrequired to improve agricultural technology and productivity, increases in availability ofrural credit may actually reduce land use and curb deforestation.
This paper shows that a reduction in rural credit has contributed to curb deforestationin the Brazilian Amazon Biome. The evidence is provided by the evaluation of Resolu-tion 3,545, introduced in 2008 by the Brazilian National Monetary Council (ConselhoMonetário Nacional, CMN). This resolution conditioned the concession of rural credit inthe Amazon Biome upon proof of compliance with legal and environmental regulations.We investigate several aspects of both the implementation and impact of this novel creditpolicy, and explore variations in rural credit concessions caused by this new regulation toestimate the effect of credit on deforestation.
We interpret the impact of credit on deforestation as evidence of credit constraints inthe region. Based on Banerjee and Duflo (2012), we argue that this potential rationingin the availability of subsidized credit may have tightened credit constraints, leading tochanges in farmers’ production decisions and thereby affecting deforestation. We developa very stylized economic model, which guides the interpretation of our results, showinghow a change in the availability of subsidized credit may either increase or decrease forestclearings.
Our results have two key policy implications. First, the evidence shows that condi-tional rural credit can be an effective policy instrument to combat deforestation. Second,and perhaps more important, our analysis suggests that the financial environment in theAmazon is characterized by significant credit constraints. Thus, policies that increase theavailability of financial resources may potentially lead to higher deforestation rates. Thisissue lies at the core of the recent debate about REDD policies that ultimately involvepayments for environmental services (see Alston and Andersson (2011), Angelsen (2010),and Angelsen and Wertz-Kanounnikoff (2008)).
Rural credit is an important source of funding for Brazilian agriculture, as well asa key policy instrument in the country. Rural credit is subsidized by the government.When Resolution 3,545 was implemented in 2008, the rural credit portfolio proposed bythe federal government and carried out by official banks and credit cooperatives totaledBRL 78 billion (USD 38.5 billion) for all of Brazil. In that same year, the Amazon Biomeportfolio provided BRL 2.5 billion (USD 1.24 billion) in rural credit. In this region,rural credit is distributed mostly through government banks, such as Banco do Brasil,
2

Banco da Amazônia and Banco do Nordeste. According to MAPA (2003), the officialrural credit portfolio covers about a third of the annual financial needs of the agriculturalsector in Brazil. As part of these needs are covered by producers’ own resources, thisportfolio represents an even larger share of external finance in the sector. Thus, any policymeasure that affects rural credit also affects one of Brazil’s main support mechanisms foragricultural production.
Three key aspects in the implementation of Resolution 3,545 helped us design ourempirical analysis. First, its conditions applied only to rural credit used in landhold-ings inside the Amazon Biome. Having access to both contract-level credit concessionmicrodata and deforestation satellite data for all of the Legal Amazon (a larger admin-istrative region), we are able to use Legal Amazon municipalities that are not in theAmazon Biome as a control group to evaluate the impact of the resolution in the biome.This aspect allows us to use a difference-in-differences approach for the evaluation of theresolution.
Second, credit takers who were beneficiaries of the National Program for the Strength-ening of Family Agriculture (Programa Nacional de Fortalecimento da Agricultura Fa-miliar, Pronaf) were subject to far less stringent conditions for credit concession. Pronafis designed to target small-scale producers, where eligibility for the program depends onthe producer’s farm size. As our data allows us to identify whether credit was contractedthrough Pronaf or non-Pronaf channels, we explore how, for a given municipality, creditconcession differed between small and mid-to-large-scale producers after the adoption ofResolution 3,545. We explore this second aspect in an alternative difference-in-differencesformulation.
Third, the resolution’s conditions were such that borrowers who proved that theyhad the intention to comply with environmental regulation were allowed access to credit.The key requirement was a formal commitment to adapt to the environmental rules overtime rather than at the current time. For practical purposes, this made intention tocomply equivalent to compliance, helping us validate our strategy for the estimation ofthe relationship between credit and deforestation. A possible concern for our identifica-tion strategy could arise from financially unconstrained farmers changing their choicesabout deforestation to prevent future credit restrictions. The way Resolution 3,545 wasimplemented mitigates the relevance of this issue.
Our analysis is based on a contract-level microdata set compiled by the Central Bankfrom Common Registry of Rural Operations (Registro Comum de Operações Rurais,Recor) data. This data set contains detailed information on all rural credit contractsnegotiated by official banks (public and private) and credit cooperatives in the 2002through 2011 period in the Legal Amazon states of Acre, Amazonas, Amapá, Maranhão,Mato Grosso, Pará, Rondônia, Roraima and Tocantins. We use this data to construct
3

a panel of total amount of rural credit at the municipality level. We also collect munic-ipality level data on satellite-based deforestation from the National Institute for SpaceResearch’s (Instituto Nacional de Pesquisas Espaciais, INPE) Project for MonitoringDeforestation in the Legal Amazon (Projeto de Monitoramento do Desflorestamento naAmazônia Legal, PRODES/INPE).
Our main difference-in-differences results indicate that Resolution 3,545 led to a reduc-tion in the concession of rural credit in the Amazon Biome. In counterfactual simulations,we estimate that approximately BRL 2.9 billion (USD 1.4 billion) were not loaned in the2008 through 2011 period due to restrictions imposed by Resolution 3,545. A reduc-tion in loans specific to cattle ranching activities accounted for 90% of this effect. Theresolution also led to a decrease in the concession of non-Pronaf credit, as compared toPronaf credit, within a given municipality. This is to be expected in light of the legalexemptions that were introduced for small-scale producers. Counterfactual simulationsconducted using the Pronaf vs non-Pronaf specifications yield results similar to thoseobtained using the biome vs non-biome specifications, which is reassuring in terms ofsupport for our identification strategy. Several robustness checks corroborate the use ofour main specifications.
We investigate potential heterogeneous effects of Resolution 3,545 by exploring specificelements of municipality and contract-level heterogeneity. First, we test if the policy’simpact differed among municipalities with different leading economic activities. Munici-palities are categorized as being either cattle or crop-oriented. Our findings suggest thatthe resolution had a significant negative impact on rural credit concession in both typesof municipalities, with a stronger effect on cattle-oriented ones.
Second, we analyze how Resolution 3,545 affected the size and the composition ofrural credit contracts in the Amazon Biome. Results show that the policy had a distribu-tional effect on cattle-specific contracts. The number of medium and large cattle-specificcontracts, as well as the number of medium crop-specific contracts decreased, while thenumber of small cattle-specific contracts slightly increased. We document no impact onsmall crop-specific contracts. This effect is likely the consequence of credit agents strivingto reallocate resources away from credit takers subject to the resolution’s conditions andtowards those facing less stringent legal restrictions.
Having shown that Resolution 3,545 caused a reduction in rural credit concession inthe Amazon Biome, we move on to test whether this reduction affected deforestation.Results from instrumental variable regressions indicate that the decrease in rural credithelped contain deforestation in the biome. In counterfactual simulations, we estimate thatover 2,700 square kilometers of forest would have been cleared from 2009 through 2011in the absence of the resolution-induced credit constraint. Considering that deforestationrates in the late 2000s and early 2010s were between 5,000 and 7,000 square kilometers
4
per year, the effect attributed to the resolution is quite substantial. We also find thatthe relationship between rural credit and deforestation varies according to the regionallyleading economic activity, with municipalities where cattle ranching predominates overcrop farming showing a stronger impact of credit on deforestation. Overall, the resultssuggest that there are relevant credit constraints affecting the deforestation activity in theBrazilian Amazon Biome, and that the expansion of agriculture at the extensive marginin the biome - particularly in cattle-oriented municipalities - is financially constrained.Again, we run several robustness checks that corroborate our results.
The remainder of the paper is structured as follows. Next section presents a shortliterature review. Section 2 presents an overview of related literature. Section 3 describesthe institutional context of rural credit and Resolution 3,545 at the time of policy im-plementation. Section 4 introduces the model that guides our empirical analysis anddefines the role of credit constraints within our framework. Section 5 describes the dataand presents stylized facts and trends on credit concession and deforestation. Section 6details the empirical strategy used to calculate the impact of Resolution 3,545 on creditand deforestation. Section 7 discusses results on policy effectiveness in restricting credit.Section 8 discusses results on the relationship between credit and deforestation. Section9 closes with final remarks.
2. Related literature
The literature analyzing the direct link between credit and deforestation is scarce.Binswanger (1991) discusses whether there exists a positive relationship between creditand deforestation. He argues that subsidized rural credit tends to increase the demandfor land, leading to a more rapid expansion of crop farmland and pasture, but does notformally test his hypotheses. Yet, rural credit policies could also encourage producersto increase productivity within a given area of land. Pfaff (1999) empirically studies therelationship between a proxy for credit supply and deforestation in the Brazilian Amazon.He finds that the number of bank branches is positively correlated with deforestation,thought this result is not significant in all specifications. Hargrave and Kis-Katos (2010)also find positive correlation between credit and deforestation in some regressions, and nosuch impact in others (including their preferred specification). Unlike previous studies,we explore a policy-induced and exogenous source of variation in rural credit. By usingthe policy change as an instrumental variable for credit supply, we are able to identify acausal relationship between credit and deforestation. We find a positive and robust effectof rural credit on deforestation.
Our results also provide a better understanding of the determinants of the recentBrazilian Amazon deforestation slowdown. After peaking at over 27,000 square kilome-ters per year in 2004, the deforestation rate in the Brazilian Legal Amazon decreased
5

substantially in the second half of the 2000s to about 5,000 square kilometers in 2011(INPE (2012)). The Amazon forest is the planet’s largest rainforest tract, as well as theworld’s most active agricultural frontier in terms of forest loss and CO2 emissions (FAO(2006), Morton et al. (2006), Santilli et al. (2005)).
There is a substantial stream of literature documenting the impact of long-run so-cioeconomic drivers of deforestation activity in the Amazon (for instance, previous worksinvestigate the effect of population, road density, and agroclimatic characteristics on de-forestation in the Amazon - see Chomitz and Thomas (2003), Reis and Guzmán (1994),Reis and Margulis (1991)). However, there is scarce empirical evidence on the imme-diate drivers of the recent and sharp deforestation slowdown in the region. This papercomplements the findings of Assunção et al. (2011). The authors show that, even whencontrolling for commodity prices and relevant fixed effects, conservation policies intro-duced starting in 2004 and 2008 helped avoid half of the forest clearings that would havebeen observed from 2002 through 2009 should the policies not have been adopted. Ourpaper isolates the credit channel and specifically tests whether credit constraints havebeen effective in curbing deforestation vis-a-vis other recent conservation efforts adoptedin the Brazilian Amazon.
Finally, our results contribute to a broader literature on rural credit. Previous studieshave found beneficial effects of the availability of credit in rural contexts. Credit sup-ply has been positively associated with poverty reduction (Burgess and Pande (2005)),agricultural investment and consumption smoothing (Rosenzweig and Wolpin (1993),Conning and Udry (2007)). In this paper we unfold a potential negative externality bydocumenting that the availability of rural credit may also lead to higher deforestation.
3. Institutional Context
Rural credit is one of Brazil’s most traditional ways to support agriculture (MAPA(2003)). It encompasses significant government subsidy. The Ministry of Agriculture(Ministério da Agricultura, Pecuária e Abastecimento, MAPA) estimates that approxi-mately 30% of the resources needed in a typical harvest year are funded by rural credit(MAPA (2003)). The remaining 70% come from producers’ own resources, as well asfrom other agents of agribusiness (such as trading companies) and other market mech-anisms (such as legal instruments that enable the pre-sale of production). In light ofthis, any policy measure that affects rural credit also affects one of Brazil’s main supportmechanisms for agricultural production.
In Brazil, rural credit is loaned according to rules and conditions established in theCentral Bank’s Manual of Rural Credit (Manual de Crédito Rural, MCR). It is used tofinance short-term operating funds, investment, and commercialization of rural produc-
6

tion.1 All agents comprising the National System of Rural Credit (Sistema Nacionalde Crédito Rural, SNCR), which encompasses public banks, private banks, and creditcooperatives, must abide by the MCR’s norms.
One of the key policy instruments for determining the concession of rural credit inBrazil is the annual Crop and Livestock Plan (Plano Agrícola e Pecuário, PAP), com-monly known as the Harvest Plan (Plano Safra). Published in the first semester of eachyear by the MAPA, the PAP summarizes the directives established for agricultural policyin each harvest year.2 The document is intended to serve as guidance for producers,informing them about elements central to agricultural production in the country. At thePAP’s core are the government’s plans regarding amounts of credit to be loaned to bothcommercial and family production3, as well as the subsidized interest rates that apply toa large fraction of planned credit loans.
From a total of BRL 14.7 billion (USD 7.3 billion) in the 2001/2002 harvest year, theamount of credit planned for rural commercial production in the PAP increased to BRL50.0 billion (USD 24.7 billion) in 2006/2007 and reached BRL 102.7 billion (USD 50.7billion) in 2011/2012. A large share - typically over half - of these resources were loanedunder fixed per year interest rates: 8.75% up to and throughout the 2006/2007 harvestyear, and 6.75% thereafter (see MAPA (2001), MAPA (2006), and MAPA (2011)).
Considering the annual SELIC4 rate of over 18% in the beginning of the 2000s and over8% in the beginning of the 2010s, the interest rates established in the PAP represented avery significant government subsidy for rural credit. Family production, whose plannedamount of credit increased from BRL 2.5 billion (USD 1.2 billion) in the 2001/2002 PAPto BRL 10.0 and 16.0 billion (USD 4.9 and 7.9 billion) in the 2006/2007 and 2011/2012PAPs respectively, received even greater subsidies, having access to annual interest ratesas low as 1% for specific categories of production.
3.1. Conservation Policy Efforts and Central Bank Resolution 3,545Brazilian conservation policies underwent profound revision in the 2000s. Most of
these changes occurred within the framework of the Action Plan for the Prevention and
1According to MAPA’s classification system, short-term operating funds credit is meant to cover theusual expenses of production cycles; investment credit is to be applied to durable goods or serviceswhose benefits last over an extended period of time; and commercialization credit is intended for usein ensuring supply and allowing for storage during periods of falling agricultural output prices. As, inpractice, some activities may fall into multiple categories, we restrict our attention to aggregate credit.
2In Brazil, a harvest year is the period covering July of a current year through June of the followingyear.
3A family producer is described in Law 11,326/2006 as one who practices rural activities while simultane-ously meeting the following criteria: (i) holds no more than four fiscal modules, where a fiscal module isdefined as the minimum area needed in each municipality to ensure the economic viability of exploringa rural establishment within that municipality; (ii) uses predominantly own family’s labor in establish-ment’s economic activities; (iii) meets a minimum of family income originating from establishment’seconomic activities; and (iv) manages establishment alongside own family.
4The SELIC rate is the Brazilian Central Bank’s overnight rate.7

Control of Deforestation in the Legal Amazon (Plano de Ação para a Prevenção e oControle do Desmatamento na Amazônia Legal, PPCDAm). Launched in 2004, this planinaugurated a new form of dealing with deforestation. It integrated action across differentgovernment institutions, and introduced innovative procedures for monitoring, environ-mental control, and territorial management in the Legal Amazon (Ipea et al. (2011),IPAM (2009)). Henceforth, policymakers sought to inhibit forest clearings and promoteforest conservation through three main policy efforts: the strengthening of command andcontrol operations, the expansion of protected territory, and the adoption of more restric-tive rural credit policies. The remainder of this section focuses on Resolution 3,545, themajor rural credit policy change of the end of the 2000s.
Published by the CMN on February 29th, 2008, Resolution 3,545 conditioned theconcession of rural credit for use in agricultural activities in the Amazon Biome uponpresentation of proof of borrowers’ compliance with environmental legislation, as well asof the legitimacy of their land claims and the regularity of their rural establishments. Themeasure, aimed at restricting credit for those who infringed environmental regulations,applied to all establishments in municipalities located entirely within the Amazon Biome.Resolution 3,583, published on July 1st, 2008, determined that in frontier municipalities,whose territory is only partially located within the biome, the conditions applied solelyto establishments located entirely or partially inside the biome. As the Amazon Biomeis contained within the Legal Amazon, all biome municipalities are necessarily locatedin the Legal Amazon, but not all Legal Amazon municipalities are part of the AmazonBiome (see Figure 1).
As all related institutions - public banks, private banks, and credit cooperatives - wereobligated to abide by the new rules, the resolution represented a potential restriction onofficial rural credit, and thereby on the fraction of it that is largely subsidized via lowerinterest rates. However, other sources of financing for agricultural activity, such as tradersand supplier’s credit, suffered no such restriction.
As determined in Resolution 3,545, to prove eligibility for taking credit, the borrowerhad to present: (i) the Certificate of Registry of the Rural Establishment (Certificadode Cadastro de Imóvel Rural, CCIR); (ii) a declaration stating the absence of currentembargoes caused by economic use of illegally deforested areas; and (iii) a state-issueddocument attesting the environmental regularity of the establishment hosting the projectto be financed, or, in the absence of such document, a state-issued certificate indicatingthat the documentation necessary for regularization had been received. The resolution’srequirements applied not only to landowners, but also to associates, sharecroppers andtenants. Implementation of Resolution 3,545 terms by all credit agents was optional asof May 1st, 2008, and obligatory as of July 1st, 2008.
Although seemingly restrictive at first, the conditioning measures of Resolution 3,545
8

were subject to a series of qualifications that loosened the severity of the new creditconstraints. This was particularly relevant for small-scale producers. In its original text,Resolution 3,545 already established exemptions for three groups of small credit takers.The first group, composed of Pronaf beneficiaries and rural producers operating in areassmaller than or equal to four fiscal modules5, was still required to present the CCIR, butcould replace the rest of the documentation by an individual declaration attesting theexistence of the required legal reserve and area of permanent protection, and the absenceof current embargoes caused by the economic use of illegally deforested areas within thecredit taker’s establishment.
The second group, encompassing beneficiaries of the National Program of Land Re-form (Programa Nacional de Reforma Agrária, PNRA) who fit into Pronaf groups A6
and A/C7, could replace all documentation by a declaration issued by the National In-stitute of Colonization and Land Reform (Instituto Nacional de Colonização e ReformaAgrária, Incra) either attesting the land reform settlement’s environmental regularity, orindicating that a term on the regularization of the settlement had been agreed upon. Anannex with a list of all land reform settlement beneficiaries had to be included in thedocumentation.
The third group, restricted to family producers fitting into Pronaf group B8, wasnot required to present any documentation. As the three groups referred to small-scaleproducers, these exemptions implied that Resolution 3,545 established less restrictiveconditions for small producers.
Soon after the compulsory adoption of the resolution, new CMN measures furtherloosened the requirements for the concession of rural credit to small producers. With thepassing of Resolution 3,599 on August 29th, 2008, borrowers from the first group could
5The actual size of a fiscal module varies according to municipality. It depends mainly on the conditions ofproduction in each municipality including, but not limited to, market dynamics, installed infrastructure,technological availability, and natural features such as soil quality and water availability.
6Pronaf Group A refers to family producers settled into PNRA land reform settlements, as well asto beneficiaries of the National Program of Land Credit (Programa Nacional de Crédito Fundiário,PNCF) who have not yet taken investment credit under the Program of Special Credit for Land Reform(Programa de Crédito Especial para a Reforma Agrária, Procera) or that have not yet reached themaximum credit limit for structural investment within Pronaf. The group also includes family producerswho were relocated due to the construction of dams for use in hydroelectric power generation or for theprovision of water to land reform settlements.
7Pronaf Group A/C refers to family producers settled into PNRA land reform settlements, as well as tobeneficiaries of the PNCF who not only possess the Group A/C Declaration of Eligibility for Pronaf(Declaração de Aptidão ao Programa, DAP), but who have also already contracted a first operation inGroup A, and have not obtained financing for working capital in a Pronaf group other than A/C.
8Pronaf Group B refers to family producers that meet all of following criteria: (i) explore a fraction ofland as owner, land reform settler, tenant or associate; (ii) live in or near the property; (iii) have accessto an area no greater than four fiscal modules; (iv) derive at least 30% of family income from both theagricultural and non-agricultural exploration of the property; (v) base exploration of the property onfamily labor; and (vi) have total family income of up to BRL 6,000 (USD 2,962.20), excluding socialbenefits. This group is known as Pronaf’s rural microcredit group.
9

present a declaration attesting not the existence, but the recomposition or regeneration ofthe required legal reserve and area of permanent protection within their establishments.Similarly, instead of attesting the land reform settlement’s environmental regularity, theIncra declaration presented by borrowers from the second group could attest that the landreform settlement had an environmental license or that the process for obtaining suchlicense had already been started. Resolution 3,599 and Resolution 3,618 from September30th, 2008, also included the following in the list of Pronaf beneficiaries exempted frompresenting any documentation: indigenous people, quilombolas,9, small-scale fishermen,inhabitants or users of conservation units of sustainable use, and regular inhabitants ofriver margins.
Small producers also benefitted from several exceptions introduced for specific harvestyears. The CMN determined that the CCIR could be substituted either by the DAP (adocument held strictly by eligible Pronaf beneficiaries) for program beneficiaries, or by aCCIR request for all other rural producers operating in areas no greater than four fiscalmodules. Resolution 3,618 introduced this new rule for the 2008/2009 harvest year, andResolution 3,735, published on June 17th, 2009, extended it to the 2009/2010 harvestyear.
From an institutional perspective, Resolution 3,545 established the same restrictionsand exceptions in all municipalities to which it applied and, thus, represented a homoge-neous policy change across regions. Even so, its impact on rural credit concession and,consequently, on deforestation may have differed across economic sectors due to struc-tural heterogeneity. A key structural difference we take into account is the compositionof sources used to meet financial requirements for crop and cattle production. Accordingto FAO (2007), the relative participation of official rural credit contracts has decreased,as agricultural financing, particularly for soybean production, has increasingly been ob-tained through contracts with traders, input and processing industries, and retailers andmarket operators. Government credit meets an estimated 30% of the financial require-ments of the soybean production sector in Brazil, but the remaining funds are providedby traders and the processing industry (40%), the input industry (15%), and farmers’own resources (10%), with the remaining 5% being attributed to other sources, such asmanufacturers of agricultural machinery (FAO (2007)). A crop farming sector that is notheavily dependent on official rural credit, as appears to be the case in Brazil, could com-pensate the decrease in official rural credit imposed by Resolution 3,545 with alternativesources of financing. Producers operating in this sector would thus be able to sustaininvestment and deforestation at the same levels as before the credit policy intervention.
Crop production in Brazil also experienced relevant technological advances starting inthe early 1990s, particularly with the widespread adoption of direct seeding (FAO (2007)).
9Quilombolas are inhabitants of quilombos settlements traditionally founded by escaped slaves.10
No such pattern was observed for livestock farming, which remains a low-productivitypractice in the country. Crop farmers likely invest a larger share of rural credit loansin the intensification of production, instead of expanding production by operating in theextensive margin as cattle ranchers do. In this case, a decrease in rural credit for cropfarmers might not lead to a decrease in forest clearings, since resources were not originallybeing used to push agricultural production into forest areas. We examine these potentialsectoral differences.
Resolution 3,545 was originally proposed as a means to restrict credit to those who didnot abide by environmental regulations in the Amazon Biome. However, the resolutionwas flexible for small producers already at its outset, and became increasingly so in arelatively short period of time. Additionally, although the resolution constituted an insti-tutional change at the federal level, regional heterogeneities may have influenced the wayin which the resolution impacted local access to credit and, thus, affected deforestation.It is therefore likely that Resolution 3,545’s effects differed among different segments ofproducers and regions. We explore this idea in the empirical analysis described in theremainder of this paper.
4. Model
This section presents the theoretical model that guides our empirical analysis. Themodel, inspired by Banerjee and Duflo (2012), focuses on how credit constraints can influ-ence deforestation when different production technologies are available to the producer.
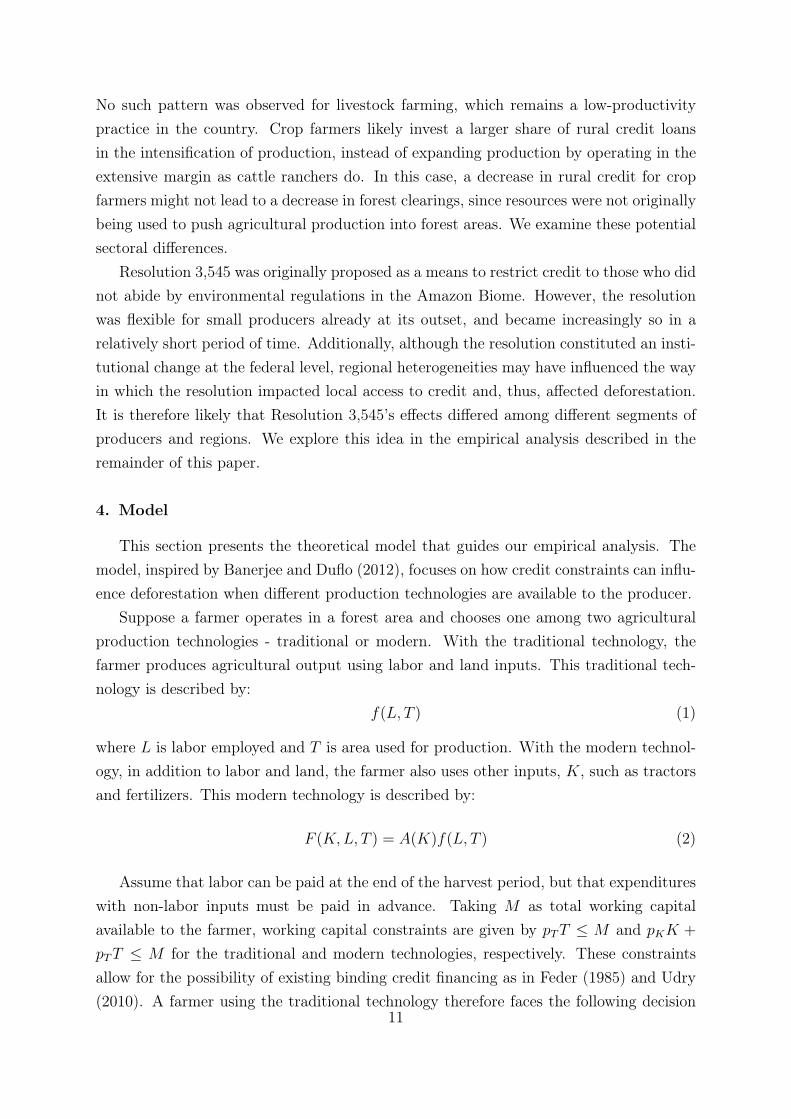
Suppose a farmer operates in a forest area and chooses one among two agriculturalproduction technologies - traditional or modern. With the traditional technology, thefarmer produces agricultural output using labor and land inputs. This traditional tech-nology is described by:
f(L, T ) (1)
where L is labor employed and T is area used for production. With the modern technol-ogy, in addition to labor and land, the farmer also uses other inputs, K, such as tractorsand fertilizers. This modern technology is described by:
F (K,L, T ) = A(K)f(L, T ) (2)
Assume that labor can be paid at the end of the harvest period, but that expenditureswith non-labor inputs must be paid in advance. Taking M as total working capitalavailable to the farmer, working capital constraints are given by pTT ≤ M and pKK +
pTT ≤ M for the traditional and modern technologies, respectively. These constraintsallow for the possibility of existing binding credit financing as in Feder (1985) and Udry(2010). A farmer using the traditional technology therefore faces the following decision
11

problem:
πtraditional(M) = maxL,T
f(L, T )− pLL− pTT (3)
subject to pTT ≤ M
Similarly, the decision problem for a farmer using the modern technology can be describedas:
πmodern(M) = maxK,L,T
A(K)f(L, T )− pKK − pLL− pTT (4)
subject to pKK + pTT ≤ M
Thus, a farmer with available working capital M chooses the modern technology if, andonly if, πmodern(M) ≥ πtraditional(M). Define M0 such that πmodern(M0) = πtraditional(M0).We assume that pk and A(K) are such that all farmers with M ≥ M0 choose the moderntechnology. In summary:
π (M) =
�πtraditional (M) ifM < M0
πmodern (M) ifM ≥ M0
(5)
Within this framework, with the farmer operating in a forest area, the choice of areato be used for production is equivalent to deforestation. We are therefore particularlyinterested in how optimal farmland size is affected by the availability of capital when thefarmer is allowed a choice of production technology.
To simplify the analysis, we consider specific functional forms for the productionfunctions, assuming that f(L, T ) = LβT γ and A(K) = Kα, where α > 0, β > 0, γ > 0
and α+β+γ < 1. The assumption of decreasing returns to scale helps determine a finiteoptimal farmland size. We focus on the characterization of the optimal land input. Forthe traditional technology, the optimal choice of farmland is given by:
Ttraditional(M) =
M
pT, ifM < M
T ∗traditional ifM ≥ M
(6)
(7)
where T ∗traditional ≡
�γ
pT
� 1−β1−β−γ
�β
pL
� β1−β−γ
and M = pTT∗traditional. For the modern tech-
nology, the optimal choice of farmland is given by:
Tmodern (M) =
γ
α + γ
M
pTifM < M
T ∗modern ifM ≥ M
(8)
12

where T ∗modern ≡
�α
pK
� α1−α−β−γ
�β
pL
� β1−α−β−γ
�γ
pT
� 1−α−β1−α−β−γ
and M = pKK∗modern+pTT
∗modern.
The relative values of M0, M and M define different possible cases. For example, aconfiguration such that M0 < M < M implies in the optimal farmland size graph shownin Figure 2.
Define M∗ as the farm’s total investment if the farmer can borrow as much as hewants at the interest rate r. Thus,
M∗(r) = argmaxM
Π(M)− (1 + r)M (9)
represents the first-best investment level.We assume that a typical farmer can be financed by two different sources and ignore,
for the sake of simplicity, the possibility of self-financing. A subsidized rural credit lineis available at cost rb, which is below the market interest rate rm, rb < rm. Denoting theamounts of subsidized rural credit and market credit as Mb and Mm, respectively, totalinvestment is given by M = Mb + Mm. Following Banerjee and Duflo (2012), we saythat a farmer is credit rationed at the subsidized interest rate if Mb < M∗(rb), and thata farmer is credit constrained if M < M∗(rm).
As argued in Section 3, Resolution 3,545 may have reduced the availability of sub-sidized rural credit for some farmers in the Amazon Biome. Yet, the supply of creditsupplied at the market rate by agents other than official banks (private and public) andcredit cooperatives was not directly affected by the resolution. Our theoretical modeloffers intuition on how farmers are expected to react to this change in the supply ofcredit, and thereby potentially affect deforestation, under different assumptions aboutthe availability of financial resources.
To restrict the analysis to a simple, yet interesting, situation, consider the case de-picted in Figure 2, where M0 < M < M . Other configurations can be considered anal-ogously. Start with the region where total investment lies below M . Increases in theavailability of resources within each technology region - (0,M0) or (M0,M) - affect landsize positively. There being no change in the choice of production technology, a reductionin credit leads to a decrease in optimal farmland size and thereby reduces deforestation.However, changes in the availability of resources that cause farmers to switch betweentechnology regions - from (0,M0) to (M0,M) or vice-versa - have an ambiguous effect onland size. A reduction in credit may lead the farmer to substitute the modern technologyfor the traditional one, potentially leading to an increase in optimal farmland size anddeforestation. In the region where total investment lies above M , farmers are not creditconstrained, so changes within this region do not affect optimal farmland size. Thus, areduction in Mb that keeps the farmer in the unconstrained region does not affect defor-
13

estation, but a reduction in the availability of resources that pushes that farmer into the(M0,M) interval will reduce optimal farmland size and deforestation. An even strongerreduction in the availability of resources that further pushes the farmer into the (0,M0)
interval has an ambiguous impact on deforestation. Propositions 1-3 summarize theseresults in the context of the credit reduction implied by Resolution 3,545.
Proposition 1: If the reduction in the availability of subsidized rural credit causes areduction in deforestation, we can conclude that: (i) farmers are credit constrained; and(ii) credit and deforestation have a positive relationship in the region.
Proposition 2: If the reduction in the availability of subsidized rural credit doesnot affect the amount of cleared land, we can conclude that: (i) either farmers are notcredit constrained (they could simply be substituting subsidized rural credit by marketcredit); or (ii) farmers are credit constrained, but are changing from the modern to thetraditional technology.
Proposition 3: If the reduction in the availability of subsidized rural credit impliesan increase in deforestation, we can conclude that: (i) farmers are credit constrained; and(ii) they are changing from the modern to the traditional technology.
In summary, a subsidized credit policy restriction can: (i) serve as evidence of creditconstraints if we observe an impact on deforestation; and (ii) reveal whether the rele-vant margin is change in optimal farmland size within a given technology (decreasingdeforestation) or change across production technologies (increasing deforestation).
5. Data, Descriptive Statistics and Stylized Facts
This section introduces the data used in our empirical evaluation of Resolution 3,545,presents descriptive statistics and discusses stylized facts to characterize aggregate trendsfor our variables of interest.
5.1. Data on Rural Credit
Our analysis is based on two panels of municipality-level data covering the 2002through 2011 period. The first panel is constructed from a contract-level microdataset of rural credit loan contracts compiled by the Central Bank from Recor data. Thisis an administrative microdata set encompassing all rural contract records negotiated byofficial banks - both public and private - and credit cooperatives in the Legal Amazonstates of Acre, Amazonas, Amapá, Maranhão, Mato Grosso, Pará, Rondônia, Roraimaand Tocantins.10 It contains detailed information about each contract, such as the exactday on which it was signed, its value in BRL, the contracted interest rate and maturationdate, its intended use by agricultural activity, and the category under which credit was
10Only a fraction of the state of Maranhão is considered part of the Legal Amazon. Our sample onlyincludes municipalities from this fraction.
14
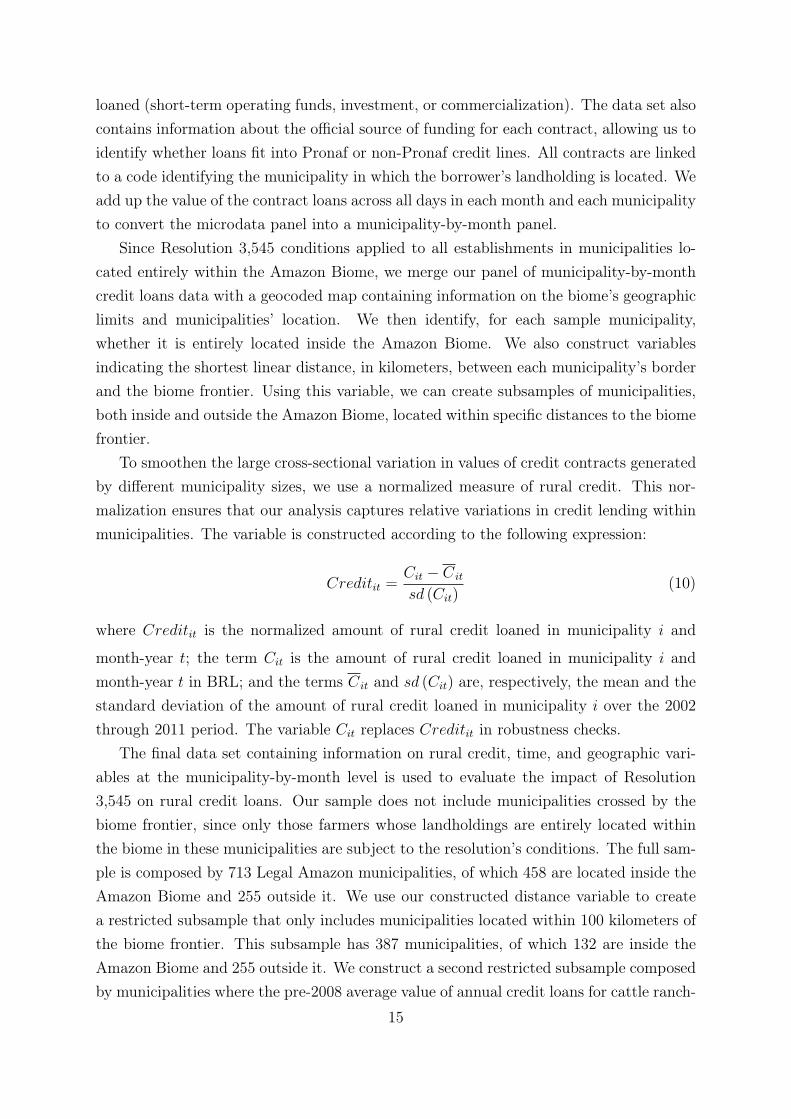
loaned (short-term operating funds, investment, or commercialization). The data set alsocontains information about the official source of funding for each contract, allowing us toidentify whether loans fit into Pronaf or non-Pronaf credit lines. All contracts are linkedto a code identifying the municipality in which the borrower’s landholding is located. Weadd up the value of the contract loans across all days in each month and each municipalityto convert the microdata panel into a municipality-by-month panel.
Since Resolution 3,545 conditions applied to all establishments in municipalities lo-cated entirely within the Amazon Biome, we merge our panel of municipality-by-monthcredit loans data with a geocoded map containing information on the biome’s geographiclimits and municipalities’ location. We then identify, for each sample municipality,whether it is entirely located inside the Amazon Biome. We also construct variablesindicating the shortest linear distance, in kilometers, between each municipality’s borderand the biome frontier. Using this variable, we can create subsamples of municipalities,both inside and outside the Amazon Biome, located within specific distances to the biomefrontier.
To smoothen the large cross-sectional variation in values of credit contracts generatedby different municipality sizes, we use a normalized measure of rural credit. This nor-malization ensures that our analysis captures relative variations in credit lending withinmunicipalities. The variable is constructed according to the following expression:
Creditit =Cit − C it
sd (Cit)(10)
where Creditit is the normalized amount of rural credit loaned in municipality i and
month-year t; the term Cit is the amount of rural credit loaned in municipality i andmonth-year t in BRL; and the terms C it and sd (Cit) are, respectively, the mean and thestandard deviation of the amount of rural credit loaned in municipality i over the 2002through 2011 period. The variable Cit replaces Creditit in robustness checks.
The final data set containing information on rural credit, time, and geographic vari-ables at the municipality-by-month level is used to evaluate the impact of Resolution3,545 on rural credit loans. Our sample does not include municipalities crossed by thebiome frontier, since only those farmers whose landholdings are entirely located withinthe biome in these municipalities are subject to the resolution’s conditions. The full sam-ple is composed by 713 Legal Amazon municipalities, of which 458 are located inside theAmazon Biome and 255 outside it. We use our constructed distance variable to createa restricted subsample that only includes municipalities located within 100 kilometers ofthe biome frontier. This subsample has 387 municipalities, of which 132 are inside theAmazon Biome and 255 outside it. We construct a second restricted subsample composedby municipalities where the pre-2008 average value of annual credit loans for cattle ranch-
15

ing was higher than that for crop production. This "cattle-oriented" subsample contains301 municipalities located inside the Amazon Biome and 154 outside it. Finally, we con-struct an analogous restricted subsample of municipalities where the pre-2008 averagevalue of annual credit loans for crop production was higher than that for cattle ranching.This "crop-oriented" subsample contains 133 located inside the Amazon Biome and 101outside it.
5.2. Data on Deforestation
The second panel of data relates rural credit loans to deforestation at the municipalitylevel. Data on deforestation is built from satellite-based images that are processed at themunicipality level and publicly released by PRODES/INPE. Because PRODES data isreported annually, we must first convert our municipality-by-month credit panel into amunicipality-by-year credit panel. We define deforestation as the annual deforestationincrement, that is, the area in square kilometers of forest cleared over the twelve monthsleading up to August of a given year.11 We recode credit loans accordingly, summing upmonthly data into an annual basis, where year t data sums information over the twelvemonths leading up to August of t.
For any given municipality, cloud cover during the period of remote sensing maycompromise the accuracy of satellite images, requiring images to be produced at a differenttime. As a result, image records for different years may span from less to more than twelvemonths. To control for measurement error, variables indicating unobservable areas areincluded in all regressions. This data is also publicly available at the municipality-by-yearlevel from PRODES/INPE.
To smoothen the cross-sectional variation in deforestation that arises from municipal-ity size heterogeneity, we use a normalized measure of the annual deforestation increment.The normalization ensures that our analysis considers relative variations in deforestationincrements within municipalities. The variable is constructed according to the followingexpression:
Deforestit =ADIit − ADI itsd (ADIit)
(11)
where Deforestit is the normalized annual deforestation increment for municipality i and
year t; ADIit is the annual deforestation increment measured in municipality i betweenthe 1st of August of t − 1 and the 31st of July of t; and ADI it and sd (ADIit) are,respectively, the mean and the standard deviation of the annual deforestation incrementcalculated for each i over the 2002 through 2011 period. The variable ADIit replacesDeforestit in robustness checks. Our sample does not include municipalities that showed
11More precisely, the annual deforestation increment of year t measures the area in square kilometersdeforested between the 1st of August of t− 1 and the 31st of July of t.
16

no variation in deforestation throughout the sample years, as this variation is needed tocalculate the normalized variable.
The final data set containing information on deforestation, rural credit, time, andgeographic variables at the municipality-by-year level is used to estimate the effects ofthe credit restriction on deforestation. Again, we do not include municipalities crossedby the biome frontier. The full sample comprises 575 Legal Amazon municipalities, ofwhich 439 are located inside the Amazon Biome and 136 outside it. We also construct thethree restricted subsamples introduced in Section 5.1. Their composition is as follows:251 municipalities within 100 kilometers of the Amazon Biome frontier (115 inside thebiome and 136 outside it); 406 cattle-oriented municipalities (301 inside the biome and105 outside it); and 141 crop-oriented municipalities (110 inside the biome and 31 outsideit).
5.3. Agricultural Output Prices and the Demand for Credit
Agricultural prices are endogenous to local agricultural production. Thus, to controlfor fluctuations in the demand for rural credit at the municipality level, we must constructoutput price series that capture exogenous variations in the demand for agricultural com-modities produced locally. As argued in Assunção et al. (2011), agricultural commodityprices recorded in the southern Brazilian state of Paraná are highly correlated with av-erage local crop prices calculated for the Legal Amazon sample municipalities. Hence,we use the Paraná agricultural commodity price series as exogenous indicators of localmarket conditions within our empirical context. Prices for beef cattle, soybean, cassava,rice, corn, and sugarcane were collected at the Agriculture and Supply Secretariat of theState of Paranáą (Secretaria de Agricultura e do Abastecimento do Estado do Paraná,SEAB-PR). Soybean, cassava, rice, and corn are predominant crops in the Legal Amazonin terms of harvested area. Although not a predominant crop in the region, sugarcane isalso included to take into consideration the recent expansion of Brazilian ethanol biofuelproduction. Together, the five crops account for approximately 70% of total harvestedarea averaged across sample years.
The Paraná price series are used to build two variables of interest. The first of thesevariables, an annual index of crop prices, is constructed in three steps. First, we calculatenominal monthly price series for each calendar year-month and culture. Annual pricesare deflated to year 2011 BRL and are expressed as an index with base year 2011.
Second, we calculate a weighted real price for each of the crops according to thefollowing expression:
PPAitc = PPtc ∗ Aic,2000−2001 (12)
where PPAitc is the weighted real price of crop c in municipality i and year t; PPtc is the
Paraná-based real price of crop c in year t expressed as an index with base year 2000; and17

Aic,2000−2001 is the share of municipal area used as farmland for production of crop c inmunicipality i averaged over the 2000 through 2001 period.12 This latter term capturesthe relative importance of crop c within municipality i’s agricultural production in theyears immediately preceding the sample periods. It thus serves as a municipality-specificweight that introduces cross-sectional variation in the commodity price series.
Third, we use principal component analysis on the weighted real crop prices to derivethe annual index of crop prices. This technique allows the price variations that arecommon to the five selected crops to be represented in one single measure. The resultingindex of crop prices captures the first principal component of the five weighted realprices. As the index maximizes the price variance, it represents a more comprehensivemeasure of the agricultural output price scenario for this analysis than the individualprices themselves. Moreover, by using the index of crop prices, which absorbs both cross-sectional and time-specific trends at the municipality level plausibly correlated with creditdemand, we overcome an important empirical limitation.
The second variable of interest is an annual index of cattle prices, which is derived anal-ogously to PPAitc. However, as land pasture is not observable, in this case Aci,2000−2001
is the ratio of heads of cattle to municipal area in municipality i averaged over the 2000through 2001 period.
5.4. Stylized Facts and Trends
This section presents stylized facts and trends for rural credit and deforestation overthe past ten years. In this set of descriptive results, the evolution of aggregate creditis influenced by both economic conditions and changes in the regulatory and institu-tional landscape. Tables and figures shown were built from the contract-level credit loanmicrodata set and the deforestation data set.
Table 1 presents descriptive statistics for average annual amounts of rural credit anddeforestation at the municipality level. Figures for Amazon Biome municipalities beforeand after the implementation of Resolution 3,545 are compared with those for LegalAmazon municipalities outside the biome. The statistics point towards more accentuatedaggregate rural credit growth in the post-resolution period in Legal Amazon municipalitieslocated outside the Amazon Biome, where borrowers were not subject to the resolution’srestrictions. Average Pronaf loans inside the biome also seem to have grown more thannon-Pronaf loans, as is to be expected in light of the exemptions introduced for small-scaleproducers operating in the Amazon Biome. Average deforestation, which is significantly
12Variables on annual municipality crop production (harvested area, quantum, or value in current prices)are based on data originally from the Municipal Crop Survey of the Brazilian Institute for Geog-raphy and Statistics (Pesquisa Agrícola Municipal do Instituto Brasileiro de Geografia e Estatística,PAM/IBGE).
18

higher in Amazon Biome municipalities, dropped sharply both inside and outside thebiome.
Stylized facts also hint at potential effects of Resolution 3,545. In Figure 3, averagerural credit loan trends for Amazon Biome municipalities do not seem to follow those forits unrestricted counterpart outside the biome in the post-2008 period. The differencein growth rates appears in both cattle and crop-oriented samples, suggesting that theresolution imposed a binding credit constraint for rural producers within the biome.Yet, as the pattern of credit loan trends differ for cattle and crop-oriented samples, ourempirical analysis explores whether the resolution’s impact depends on economic activityheterogeneity.
A closer look at the evolution of rural credit loans throughout 2008 reveals that theconstraint seems to have been anticipated by credit takers. Figure 4 illustrates thisphenomenon. While credit concession in 2006 and 2007 concentrated in the second halfof each year, it followed a very different pattern in 2008, peaking in April and againin June. The total amount of credit negotiated in 2008, however, is similar to that ofprevious years. Considering that the adoption of the measures established in Resolution3,545 was optional as of May 1st and compulsory as of July 1st, the unseasonable peaksin 2008 likely reflect borrowers’ efforts to have early access to resources that would soonbe restricted. Consequently, an accentuated decrease in the concession of credit was notobserved in 2008 despite the restrictions imposed by Resolution 3,545. This behavior ismore clearly seen in the trends for cattle-specific contracts than for crop-specific ones,perhaps due to the intrinsically seasonal component of crop production. Alternatively,this could be because crop farmers were less vulnerable to the reduction in subsidizedrural credit. As they were able to access credit from other sources even after the resolutionhad been adopted, they had less need to anticipate credit prior to the policy.
In addition to assessing the resolution’s impact on rural credit concession, we areinterested in understanding how it affected deforestation. Figure 5 portrays the evolutionof average municipality-level deforestation. Deforestation dropped significantly startingin the mid-2000s in Legal Amazon municipalities both inside and outside the AmazonBiome. In the post-2008 period, however, trends for biome municipalities appear tobehave differently from those for non-biome municipalities - deforestation exhibits moreaccentuated drops inside the biome immediately after the adoption of Resolution 3,545both in the cattle and the crop-oriented subsamples. Although not yet conclusive, thiscould be an indication both that deforestation is a credit-dependent activity and thatthere are relevant credit constraints for forest clearing in the Amazon Biome.
The stylized facts discussed in this section provide a descriptive overview of howResolution 3,545 might have affected the evolution of rural credit and deforestation inthe Amazon Biome. However, these facts capture the effects of other influencing factors,
19

particularly those of economic circumstances in the Amazon Biome during the period ofinterest. To evaluate the impact of Resolution 3,545, we must isolate the effect of theresolution from that of other determinants of rural credit.
6. Empirical Strategy
This section describes the empirical strategy used to identify the causal effect of ruralcredit on deforestation. Since only equilibrium prices and quantities are observed in thecredit market, many of the identification concerns mentioned in the literature have beenrelated to reverse causality and omitted variables. Reverse causality might take place ifthe expansion of agricultural activities beyond the farmer’s landholding is done at the ex-pense of public areas of forest. In this case, deforestation and appropriation of public landincrease real estate and collateralized asset-based lending, thereby allowing the farmer toovercome borrowing constraints. Omitted variables that are simultaneously associatedwith credit and land use, such as regional growth and agricultural output prices, mayalso trivially jeopardize identification. In this paper we limit identification problems byexploring the different margins of a credit policy break that generated exogenous varia-tions in credit supply, within and across municipalities of the Brazilian Amazon, in thelate 2000s.
Our strategy follows a two-stage procedure. First, we evaluate Resolution 3,545’simpact on rural credit market quantities. Then, we use different margins of this policychange to derive instrumental variables for rural credit, which help us identify a causaleffect of rural credit on deforestation in a two-stage least squares (2SLS) estimation.
6.1. First Stage: Impact on Rural Credit
We explore different dimensions of Resolution 3,545 to provide a general characteri-zation of its impacts on rural credit. First, the resolution specifically established that theconditions to credit concession applied to municipalities in the Amazon Biome only. Thisgenerates an explicit geographic cleavage between two groups of municipalities withinthe Legal Amazon. We refer to municipalities located entirely within the Amazon Biomeas the intervention group. Legal Amazon municipalities located outside the biome formthe control group. Although intervention and control groups may systematically differ interms of long-persistent geographical characteristics, both have been exposed to similareconomic fluctuations and political cycles. This is particularly consistent for municipal-ities near the biome frontier. This specific geographic break in Resolution 3,545, nestedwithin our monthly data on municipalities, allows us to perform a difference-in-differencesestimation defined by the following equation:
Creditit = αi + φt + β1(Biomei ∗ Post2008t) + β2Pricesit + β3Priorityit + �it (13)20

where Creditit is the normalized amount of rural credit loaned in municipality i and timet, which indexes a specific month throughout the period.
We estimate models for total municipality rural credit loans, as well as for cattle andcrop-specific loans separately. Our variable of interest is the interaction of a dummy indi-cating whether the municipality is located within the Amazon Biome, Biomei, with a vari-able that indicates the period after the implementation of Resolution 3,545, Post2008t,which includes all years from 2008 onwards. We consider all of 2008 as part of the post-resolution period to avoid finding a significant coefficient when, in fact, we are simplycapturing the anticipation effect (recall that credit concession in the biome was very lowin the first half of 2008 and very high in the second half).
The term αi includes municipality fixed effects, which absorb initial conditions andpersistent municipality characteristics, such as geography and transport infrastructure.The term φt includes month fixed effects, which also absorb year fixed effects by con-struction. These variables control for common time trends, such as seasonal fluctuationsin agricultural activity, macroeconomic conditions, common rural policies, and the po-litical cycle. The term Pricesit proxies for municipality-specific demand for credit, as itincludes annual cattle and crop price indices (current and lagged) varying over time atthe municipality level. Finally, the term Priorityit indicates municipalities included in apriority list of top deforesters, which have recently been the focus of conservation policyefforts. The parameter of interest β1 captures the causal effect of Resolution 3,545 onrural credit if the residuals contain no omitted variables driving the correlation betweenthe policy and either the demand for and/or supply of credit loans.
We rely on another difference-in-differences strategy to explore a second dimensionof Resolution 3,545’s design. As explained in Section 3.1, Resolution 3,545 establishedexemptions regarding requirements for small producers. Considering that Pronaf bene-ficiaries are, by definition, small producers, and taking into account that the restrictiveconditions were eased specifically for credit loans contracted via Pronaf credit lines, thecomparison between Pronaf and non-Pronaf loans within municipalities, before and af-ter the resolution, offers another source of exogenous variation in credit supply. Thespecificities of the policy design therefore enable us to construct intervention and controlgroups within municipalities located in the Amazon Biome. We take advantage of thisby estimating a triple-differences model that compares rural credit loans before and afterthe implementation of Resolution 3,545, in municipalities located inside and outside thebiome, and between Pronaf and non-Pronaf groups within municipalities. This strategy,based on an extension of model (13), is defined by the following equation:
Credititk = αi + φt + β1Nonpronafit + β2(Nonpronafit ∗Biomei)+
21

+β3(Nonpronafit ∗ Post2008t) + β4(Biomei ∗ Post2008t)+ (14)
+β5(Nonpronafit ∗Biomei ∗ Post2008t) + β6Pricesit + β7Priorityit + �itk
where Credititk is now the amount of rural credit loaned in municipality i, at time t, andof type k ∈ {Pronaf, non-Pronaf}. The term Nonpronafit is a dummy assuming value 1if (k = non-Pronaf) and 0 otherwise, which we interact with the dummies Post2008t andBiomei. The parameter of interest β5 is expected to capture the marginal variation innon-Pronaf credit loans within the Amazon Biome after the implementation of Resolution3,545.
We discuss some caveats associated with models (13) and (14) in robustness checks.In all specifications, standard errors are robust to arbitrary forms of heteroscedasticityand clustered at the municipality level to allow for correlation at a given time, and acrosstime within municipalities.
6.2. Second Stage: Impact on Deforestation
Using the municipality-by-year panel detailed in Section 5.2, we can therefore usemodels (13) and (14) as first stage regressions in a 2SLS approach, which helps us identifya causal effect of rural credit on deforestation.
We begin by defining a second stage specification for which model (13) is the firststage:
Deforestit = αi + φt + δ1 �Creditit + δ2Pricesit + δ3Priorityit +Xitδ4 + �it (15)
where Deforestit is deforested area in municipality i and year t, and �Creditit is the totalvalue of rural credit loans in municipality i and year t, instrumented by the interactionvariable (Biomei ∗ Post2008t). The terms αi, φt, Pricesit, and Priorityit are definedas in model (13), although the subscript t now indexes year. All regressions include theterm Xit, which adds controls for the size of unobservable areas (or measurement error)during the period of remote sensing.
The second stage specification alternatively uses model (14) as first stage, and isdefined analogously to model (15). In this case, however, the unit of observation isthe cell indexed by itk, where k ∈ {Pronaf, non-Pronaf}. The dependent variable isnow Deforestit, invariant to k. The variable of interest is �Credititk, the total value ofrural credit loans in municipality i and year t, instrumented by the interaction variablesBiomei ∗ Post2008t, Nonpronafit ∗ Post2008t, and Nonpronafit ∗Biomei ∗ Post2008t.
The identification hypothesis in both 2SLS specifications is that, conditioned uponthe control variables, instrumented credit is orthogonal to any latent determinant ofdeforestation. Alternatively, the instrumental variables should be strongly correlatedwith rural credit loans, but orthogonal to the error term in the second stage regression.
22

As argued above, this strategy is valid because Resolution 3,545 provides sources ofplausibly exogenous variation in rural credit loans in the Legal Amazon.
Resolution 3,545 was formally designed to restrict the concession of credit in theAmazon Biome, with exceptions rendered to small producers. As argued in the previ-ous section, these two dimensions of the resolution’s design provide potential sources ofexogenous variation in rural credit loans within the Legal Amazon.
A third dimension of its design strengthens the validity of using the resolution-inducedchange in rural credit as an exogenous source of variation. Resolution 3,545 conditionswere such that borrowers who proved that they had the intention to comply with en-vironmental regulation were allowed access to credit. This meant that producers whofeared the resolution might affect their future access to credit could signal an intent tochange their deforestation behavior in the future and be considered compliant with envi-ronmental regulation at the present. This could invalidate the exclusion restriction of ourinstrumental variable, since farmers who are not meeting environmental regulation at thepresent alter their deforestation behavior for reasons other than a concurrent reductionin credit caused by Resolution 3,545. However, this introduces a bias that runs in theopposite direction of our expected positive coefficient. After all, these producers willsuffer no credit effect (as their intention to comply makes them compliers), but still re-duce deforestation, driving downwards the coefficient of interest. In terms of meeting theresolution’s requirements, intention to comply is equivalent to compliance. Thus, therewere no other channels linking Resolution 3,545 and deforestation during the period ofinterest. This eliminates a potential source of concern regarding the validity of usingthe policy change as an instrument for credit and enables us to empirically examine therelationship between credit and deforestation.
7. Policy Implementation and Effectiveness
This section evaluates the impacts of Resolution 3,545 on rural credit loans. Westart by describing the main results obtained using the empirical strategies detailed inSection 6.1. We then explore heterogeneity and characterize the policy impact. Finally,we discuss caveats and present robustness checks.
7.1. Credit Constraint
Table 2 presents the results for regressions based on model (13) (Panel A) and model(14) (Panel B), using normalized rural credit at the municipality level as the dependentvariable. Coefficients in Panel A show that, conditioned upon controls, Resolution 3,545was associated with a reduction in rural credit concession in the Amazon Biome, as com-pared with the rest of the Legal Amazon. This effect is significant for total rural credit,as well as for cattle and crop-specific loans. The impact on cattle-specific loans is larger
23

than that on crop-specific loans, and the difference between their respective coefficients isstatistically significant. A plausible explanation for this difference is that cattle ranchingis relatively more land-intensive than crop farming, and therefore less compliant withenvironmental regulation. In fact, previous studies show that three quarters of the landcleared in the Legal Amazon have been used for cattle ranching-related activities, al-though the relative participation of crop farming-related activities in cleared forest areashas recently increased (see Chomitz and Thomas (2003) and Morton et al. (2006)).
Panel B corroborates the findings of Panel A, reporting even larger impacts whenconsidering the resolution’s impact on different kinds of credit takers. For a given mu-nicipality in the Amazon Biome, credit for the non-Pronaf category decreased relativelymore than for the Pronaf category. These results are to be expected, given that Resolu-tion 3,545 and associated legislation exempted small-scale producers - particularly Pronafbeneficiaries - from the more restrictive conditions.
In Table 3, we present results from a counterfactual analysis to quantify the magnitudeof the impact. Our estimates indicate that, in the absence of the policy, total rural creditand cattle-specific credit in the Amazon Biome would have been much greater than wasactually observed from 2008 onwards. Based on coefficients from Panel A, in which thecontrol group is composed of municipalities outside the Amazon Biome, we estimate thatapproximately BRL 2.9 billion (USD 1.4 billion) were not loaned in the 2008 through2011 period due to restrictions imposed by Resolution 3,545. This is equivalent to aboutBRL 725 million (USD 350 million) less credit per year. The reduction in cattle-specificcredit loans accounts for 90% of this difference. Estimates obtained from comparingthe resolution’s impact on Pronaf and non-Pronaf credit are very similar, although therelative role of cattle-specific loans is slightly smaller in this simulation.
7.2. HeterogeneityHaving estimated a significant impact of Resolution 3,545 on the concession of rural
credit in the Amazon Biome, we are now interested in exploring potential heterogeneouseffects arising from sectoral heterogeneity. Using the cattle-oriented and crop-orientedsubsamples described in Section 5.1, we test whether the resolution’s impact differedamong municipalities with different leading economic activity. These restricted samplesfurther allow us to test whether our estimated coefficients have been jeopardized bycomparing municipalities that are not, in fact, economically comparable.
Table 4 presents results obtained by reproducing the specifications of Table 2 us-ing the restricted cattle and crop-oriented subsamples. The significant negative coef-ficient estimated for our variable of interest in the cattle-oriented subsample confirmsthat Resolution 3,545 reduced cattle-specific loans inside the Amazon Biome, even whenthe comparison is made using only cattle-oriented municipalities both inside and outsidethe biome. This supports our main results, providing further evidence that the credit
24
constraint was caused by the policy change. Results are similar for the crop-orientedsubsample. In this case, however, restricting the sample to municipalities that are eco-nomically more alike has highlighted the policy impact, as estimated coefficients are evenhigher than in our original specifications.
We also consider the distribution of loan size to analyze the impact of heterogeneityalong a different dimension. The dependent variable is now the number of credit con-tracts in each municipality categorized according to contract size. This exercise uses thespecification that takes all municipalities in the Amazon Biome as the treatment group,and all Legal Amazon municipalities outside the biome as the control group. We startby dividing credit contracts into three categories based on their size: small (up to themedian), medium (between the median and the 75th percentile), and large (above the75th percentile). We then aggregate these contracts by municipality to use as dependentvariable. Given that small producers benefitted from less stringent conditions for creditconcession, while medium and large producers faced more restrictive conditions, we ex-pect Resolution 3,545 to have a negative impact on the number of medium and largecontracts, and a neutral impact on small contracts. In fact, a positive impact on smallcontracts could also be expected, should credit agents choose to reallocate resources awayfrom the more restricted group of credit takers and towards small producers.
Results shown in Table 5 indicate that, as expected, Resolution 3,545 had a significantnegative impact on the number of medium and large cattle-specific credit contracts. Theeffect on crop-specific contracts, which had been small when estimated in specificationsusing normalized rural credit as the dependent variable, is now significant and negativeonly for medium credit contracts. The absence of a significant negative impact on smallproducers is to be expected, but the coefficient estimated for the large producers showsthat, contrary to what was originally thought, large-scale crop producers were also notaffected by the conditional rural credit policy. This might be because they could moreeasily meet the conditions required in Resolution 3,545, be it due to their better orga-nizational capacity or to their greater access to resources needed to follow through withthe regularization procedure. After all, in regions where crop production is predominantin the Amazon Biome, rural economic activities are mostly based on large-scale soybeanfarmers, who might have other sources of credit financing and a large organized chainof production. Table 5 shows, moreover, that the resolution had a significant positiveeffect on small cattle-specific credit contracts. This corroborates the hypothesis statingthat Resolution 3,545 had a distributional effect, leading credit agents to change theirallocation of resources, moving it away from the group of credit takers subject to theresolution’s conditions and towards the group that received legal exemptions.
Overall, the results obtained so far show that Resolution 3,545 produced differentiatedeffects within the Amazon Biome. While the policy change led to a reduction in the
25

number of medium and large cattle-specific contracts and in the number of medium crop-specific contracts, it had no impact on both large and small crop-specific loans, and apositive impact on small cattle-specific loans. The resolution also appears to have ledto greater credit reduction in municipalities where cattle ranching is the main economicactivity, though the impact on rural credit in municipalities where crop production is themain economic activity is not negligible.
7.3. Caveats and Robustness Checks for Credit Results
Although our results are generally consistent with Resolution 3,545’s institutionalcontext, we run a series of tests to check their robustness. We focus on three sources ofpotential concern. First, it could be that our regressions capture a spurious effect due tothe definition of the intervention and comparison groups that we erroneously attributeto the policy change. Second, our identification strategy relies on the hypothesis that,after controlling for observable characteristics and municipality and time fixed effects,both intervention and control groups are comparable. Yet, municipalities in differentregions could differ in terms of regional economic dynamics or non-observable regionalcharacteristics. In this sense, comparing municipalities that are near to the AmazonBiome frontier with those that are far from it could jeopardize our results. Third, theuse of a normalized dependent variable could be driving our results.
We tackle these issues in three sets of robustness checks. First, we explore the res-olution’s conditions - namely, its restriction to the Amazon Biome and the exemptionscreated for small producers - to perform falsification tests. We start by considering thespecifications presented in Table 2, Panel A, in which municipalities inside the AmazonBiome are taken as the treatment group and compared to Legal Amazon municipalitiesoutside the biome. In the first falsification test, we repeat the exercise using the amountof credit loaned strictly to Pronaf beneficiaries as the dependent variable. As this groupof borrowers benefitted from the aforementioned institutional exemptions, we expect thisfalsification test to capture no significant impact of Resolution 3,545 on Pronaf creditinside the biome. If anything, the test could return a positive significant impact of theresolution on Pronaf credit, should its distributional impact actually have caused a shiftof credit towards unrestricted small producers inside the biome, as discussed in Section7.2. We then move on to the specifications presented in Table 2, Panel B, in which wecompare Pronaf and non-Pronaf credit inside and outside the Amazon Biome. In thesecond falsification test, we again repeat the specifications, but restrict our sample toLegal Amazon municipalities located outside the biome. As Resolution 3,545 conditionsdid not apply to the Legal Amazon as a whole, we expect this falsification test to captureno significant negative impact of the resolution on Pronaf and non-Pronaf credit outsidethe biome.
26

Panels A.1 and B.1 of Table 6 present the results for the two falsification tests. In PanelA.1, we note that the coefficient for the Biome ∗ Post2008 variable is now insignificant,as expected. When using crop-specific contracts, the coefficient is positive, althoughrelatively small, indicating that a small shift in allocation of financing resources towardsPronaf beneficiaries did occur for crop-specific loans. In Panel B.1, the coefficient ofinterest becomes non-negative, as expected. In fact, when focusing on cattle-specificcontracts, results indicate that non-Pronaf credit was increasing more than for Pronafbeneficiaries. Interestingly, should this pattern also apply to non-Pronaf credit inside theAmazon Biome, the real impact of Resolution 3,545 could be even higher than we haveestimated.
Our second set of robustness checks tests if results have been driven by regional oreconomic differences between municipalities. To do this, we create a subsample restrictedto municipalities that are within 100 kilometers of the Amazon Biome border. Treatmentand control groups still refer to Legal Amazon municipalities inside and outside thebiome, respectively, but now both treatment and control municipalities must meet themaximum distance to biome border criteria. This subsample contains municipalities thatare geographically closer to one another, and are thus thought to be more alike acrossboth observable and non-observable fixed characteristics and trends.
Panel A.2 and B.2 in Table 6 show the results for this second robustness check.Specifications are analogous to those of Table 2. Robustness results shown in Panel A.2are consistent with those of our main specifications and estimated coefficients are, in fact,higher. This suggests that municipalities closest to the biome frontier, which are probablyin a more economically dynamic region, are more heavily dependent on credit and werethus more affected by the conditions established in Resolution 3,545. Moreover, it seemsplausible that, in a region with more dynamic agricultural production, producers areless compliant with environmental regulations. Estimated coefficients of interest remainnegative and significant in Panel B.2, except in the specification for crop-specific loans,which is now less significant, although of magnitude similar to that of Table 2.
The third and final robustness check consists of replacing the normalized credit vari-able with an absolute measure of total rural credit to test if our results have been drivenby inaccuracies introduced via the normalization of the dependent variable. Results arepresented in Panels A.3 and B.3 of Table 6, again using the specifications of Table 2.Estimated coefficients are essentially the same as those obtained in our main regressions.
Overall, the robustness of our results support the specifications chosen for our mainregressions, as well as the interpretation of our results.
27

8. Credit Constraint and Deforestation
This section presents the results of the second stage of our 2SLS strategy, that is, theimpact of the credit constraint on deforestation in the Amazon Biome. As mentionedin Section 1, the direction of the effect of a reduction in credit on deforestation dependson how rural credit is used. If used to improve production techniques and intensifyproductivity per unit of land used for agricultural production, a credit restriction couldlimit productivity gains and thereby generate an incentive for producers who seek toexpand their production to move into new areas. If, however, credit is used to expandproduction at the extensive margin - to clear forest areas and accommodate a growingherd, for example - the expected result of a reduction in credit should be a decrease indeforestation. Which of these mechanisms prevails in the Amazon Biome is an empiricalquestion.
We can also think about our regressions as an econometric test about the existence ofbinding credit constraint in activities related to deforestation. The usual way to assess ifa firm is credit constrained in terms of investment, for instance, is to measure if the firmincreases its amount of investment following a policy change that facilitates its accessto credit (Banerjee and Duflo (2012)). Should the firm do so, it had not yet reachedits optimal amount of investment before the policy - the firm faced credit constraints.The argument we make here is analogous to that of the credit constrained firm, but runsin the opposite direction. If a deforester decreases the amount of forest cleared due toa restriction in subsidized credit - meaning he would increase deforestation if he hadmore subsidized credit - then the deforester is credit constrained. In other words, thedeforester requires access to credit to implement his activities, be it the actual clearingof forest or activities practiced after the forest area has been converted. If he is changinghis investment (deforestation) behavior as a response to a reduction in the availability ofsubsidized credit, then he is not substituting the lost subsidized credit for market credit,which serves as evidence that he is credit constrained.
At the same time, if farmers are decreasing the amount of deforestation in response toa reduction in subsidized credit availability, it means that, within the theoretical frame-work discussed in Section 4, they are not switching from the modern to the traditionaltechnology. Rather, they are adjusting their optimal farmland decision within regions offixed technology. Should they be changing between technologies, we would observe anincrease in deforestation as a response to a reduction in availability of subsidized credit.
8.1. Main Results
Table 7 presents results for the evaluation of how Resolution 3,545 affected deforesta-tion in the Amazon Biome. Column 1 displays coefficients estimated in a fixed effectsspecification without the use of instrumental variables (IV). The coefficient capturing the
28

impact of rural credit on deforestation is positive, but very small. As discussed in Section6, however, these specifications suffer from an endogeneity problem, due both to omittedvariables and simultaneity. The IV approach is used to tackle this problem. In column2, we present coefficients estimated in IV regressions that instrument rural credit by thepolicy variable Biome∗Post2009. Results suggest that credit has a positive and stronglysignificant relationship with deforestation, and that the reduction in the concession ofrural credit in the Amazon Biome caused by Resolution 3,545 contributed to the curbingof deforestation in the biome. In particular, municipalities that were most affected by theresolution-induced credit reduction were also the ones that presented the sharper dropsin deforestation. Similar results, shown in column 3 are obtained when using the tripleinteraction term Nonpronaf ∗Biome∗Post2009 as an instrumental variable, in additionto the variables Biome ∗ Post2009 and Nonpronaf ∗ Post2009.
To better grasp the economic significance of our results, we conduct counterfactualsimulations analogous to those presented in Section 7.1 but now using the specificationof Table 7, column 2. Results shown in Table 8 indicate that, in the absence of Resolu-tion 3,545, deforestation in the Amazon Biome would have been 2,783 square kilometersgreater than was actually observed in the 2009 through 2011 period. This is equivalentto an increase of about 18% over observed deforestation. In 2010, for example, deforesta-tion would have totaled 7,398 square kilometers had the resolution not been introduced,compared to the 5,657 square kilometers that were actually observed. This result isparticularly impressive if we take into consideration the comparatively low deforestationrates recorded during the same period.
Our results serve as evidence of the existence of binding credit constraints in theAmazon Biome. Farmers appear to have responded to a reduction in the availability ofsubsidized credit by changing their optimal allocation of resources and thereby reducingdeforestation. Were there no binding credit constraints, farmers’ actions would not haveresulted in a change in deforestation in the post-policy period. Moreover, our resultssuggest that the prevailing mechanism relating rural credit and forest clearings in theAmazon Biome is that in which credit is used to expand production by operating in theextensive margin of land use, and not by increasing productivity. The predominance ofcattle ranching in the region and the correlation between this activity and extensive landuse in the Amazon could explain these results. Intensification of land use for crop farmingin Brazil is also much more developed than for cattle ranching.
8.2. Heterogeneity
To test whether the relationship between credit and deforestation depends on regionalheterogeneity, particularly that of leading economic activity, we repeat the empirical exer-cise of Section 8.1 using cattle and crop-oriented municipalities. This allows to investigate
29

if different types of economic activity use credit differently, increasing production eitherat the extensive margin or at the intensive margin.
Table 9 presents heterogeneity results. Coefficients estimated for cattle-oriented mu-nicipalities, shown in Panels A.1 and B.1, are very similar to those of Table 7, confirmingthe positive relationship between credit and deforestation. The reduction in credit conces-sion caused by Resolution 3,545 therefore implied a reduction in deforestation in munici-palities where cattle ranching predominates. Yet, coefficients estimated for crop-orientedmunicipalities, shown in Panels A.2 and B.2, indicate that rural credit has no impacton deforestation. As has been documented before (see FAO (2007), crop production inBrazil underwent several technological improvements, allowing production to increase inthe intensive margin. If farmers are able to increase production via intensification, theydo not use credit to clear new land for production. In this case, changes in rural creditdo not affect deforestation.
The results can also be regarded as evidence that crop farmers are not credit con-strained. They may have compensated the reduction in subsidized rural credit withan increase in other sources of financing (market credit), thus maintaining their pre-resolution levels of investment, farmland and deforestation. Cattle ranchers, on the otherhand, seem to be credit constrained (or at least became constrained after the policychange), since they reduce the amount of deforestation in response to the reduction inthe availability of credit.
8.3. Robustness ChecksThe concerns mentioned in Section 7.3 also apply to our second-stage regressions. As
the Amazon is an extremely large area, municipalities in the treatment groups system-atically differ from those in the control groups. To tackle this issue, we run robustnesschecks using the subsample of municipalities within 100 kilometers of the biome border.Results for this test, shown in Panels A.1 and B.1 of Table 10, indicate that not only areestimated coefficients significant, but also greater in magnitude. As the frontier coversan area with very high deforestation rates - it contains a large fraction of the so-called"Arc of Deforestation," deforestation hotspots in the Brazilian Amazon - this result is tobe expected. As argued in Section 7.3, the economic dynamics of this region likely makesthis area more dependent on rural credit. An exogenous reduction in rural credit wouldtherefore have a higher impact on agricultural activities in the region, and thereby morestrongly affect deforestation.
To test whether our results are driven by the use of the normalized variables, wealso repeat 2SLS estimations using absolute values for the deforestation and rural creditvariables. Results presented in Panels A.2 and B.2 of Table 10 show that coefficientsestimated using IV regressions remain positive and significant, although their magnitudevaries according to the specification.
30

Finally, to test whether our results are driven by a natural convergence of high to lowdeforestation rates, we control for an interaction between a non-linear trend and the 2002deforestation rates in each municipality. If the results are driven only by the convergenceprocess, our main coefficient should become zero. Results presented in Panels A.3 and B.3of Table 10 show that coefficients remain positive and significant even when we controlfor these trends. First stage results are also significant when controlling for these trends,indicating that our instruments are not weak. These estimates corroborate the idea thatour results are not driven by a natural process of convergence.
The robustness tests conducted support our main specifications and interpretation ofresults. The significant reduction in rural credit concession caused by Resolution 3,545seems to have played an important role in curbing forest clearings in the Amazon Biomein the late 2000s and early 2010s.
9. Final Comments
In this work, we investigate the reduction in the availability of credit implied byResolution 3,545. We focus on key aspects of the implementation and consequencesof this novel credit policy, exploring the associated exogenous variation in rural creditconcessions to empirically evaluate the resolution’s impact on both rural loans and forestclearings.
We document that credit takers anticipated the credit constraint imposed by Resolu-tion 3,545, but that the policy change did, in fact, lead to a reduction in the concession ofrural credit in the Amazon Biome. Counterfactual simulations suggest that, in the 2008through 2011 period, approximately BRL 2.9 billion (USD 1.4 billion) were not loaneddue to restrictions imposed by the resolution. This result was largely driven by a reduc-tion in cattle-specific loans. Resolution 3,545 also caused a decrease in total amount ofnon-Pronaf credit, as compared to Pronaf credit, within the biome. This is to be expectedin light of the legal exemptions that were introduced for small-scale producers regardinglegal requirements to access rural credit.
Estimations from instrumental variable regressions further show that the resolution-induced restriction in credit helped contain deforestation in the Amazon Biome. Thisresult suggests that the expansion of agriculture at the extensive margin in the biomeis financially constrained. Counterfactual simulations indicate that over 2,700 squarekilometers of forest would have been cleared from 2009 through 2011, had Resolution3,545 not been implemented. Considering that deforestation rates in the late 2000s andearly 2010s were around 7,000 square kilometers per year, the effect attributed to theresolution is quite substantial.
The results have two key policy implications. First, the evidence shows that condi-tional rural credit can be an effective policy instrument to combat deforestation. Along
31

these lines, the differential effects across sectors and regions suggest that it might comple-ment rather than substitute other conservation efforts. The pre-existent socioeconomiccircumstances matter - credit reduction came mostly from the reduction of cattle loansrather than crop loans. The implementation details also matter. The lag between theannouncement and enforcement of the resolution induced farmers to anticipate credit in2008, mitigating part of the effect. Also, less stringent requirements and exemptions havedetermined that large producers were more affected than small producers.
Second, our analysis suggests that the financial environment in the Amazon is charac-terized by significant credit constraints. Especially in municipalities where cattle ranchingis the predominant activity, fewer resources correspond with less deforestation. This is akey finding with implications for policy design. In particular, policies that increase theavailability of financial resources (for example, payments for environmental services) maylead to higher deforestation rates, depending on the economic environment and exist-ing resources in the area. Our results do not suggest that these policies will necessarilyincrease deforestation, but that these policies should take into account the nature of finan-cial constraints that are prevailing in the Amazon, avoiding potentially adverse reboundeffects.
Acknowledgments
Arthur Bragança, Luiz Felipe Brandão, Pedro Pessoa and Ricardo Dahis providedexcellent research assistance. We thank the Ministry of the Environment, particularlyRoque Tumolo Neto, for their continuous support. We are also grateful to Arthur Bran-gança, Dimitri Szerman, Joana Chiavari, and Pedro James Hemsley for helpful comments.
References
Alston, L. J. and Andersson, K. (2011). Reducing Greenhouse Gas Emissions by Forest Protection: TheTransaction Costs of REDD. Working Paper 16756, The National Bureau of Economic Research.
Angelsen, A. (2010). Policies for Reduced Deforestation and Their Impact on Agricultural Production.Proceedings of the National Academy of Sciences, 107(46):19639.
Angelsen, A. and Wertz-Kanounnikoff, S. (2008). Moving Ahead with REDD: Issues, Options and Im-plications. Center for International Forestry Research (CIFOR).
Assunção, J., Rocha, R., and Gandour, C. C. e. (2011). Deforestation Slowdown in the Legal Amazon:Prices or Policies? Working Paper 1.
Banerjee, A. V., M. K. and Duflo, E. (2012). Do firm want to borrow more? testing credit constraintsusing a directed lending program. Mimeo, MIT.
Binswanger, P. H. (1991). Brazilian policies that encourage deforestation in the amazon. World Devel-opment, 19(7):821–829.
Brasil, Ministério da Agricultura, Pecuária e Abastecimento (2001). Plano Agrícola e Pecuário 2001–2002. Secretaria de Política Agrícola, Brasília.
32

Brasil, Ministério da Agricultura, Pecuária e Abastecimento (2003). Plano Agrícola e Pecuário 2003–2004. Secretaria de Política Agrícola, Brasília.
Brasil, Ministério da Agricultura, Pecuária e Abastecimento (2006). Plano Agrícola e Pecuário 2006–2007. Secretaria de Política Agrícola, Brasília.
Brasil, Ministério da Agricultura, Pecuária e Abastecimento (2011). Plano Agrícola e Pecuário 2011–2012. Secretaria de Política Agrícola, Brasília.
Burgess, R. and Pande, R. (2005). Do rural banks matter? evidence from the indian social bankingexperiment. American Economic Review, 95:780–795.
Chomitz, K. and Thomas, T. (2003). Determinants of Land Use in Amazônia: A Fine-Scale SpatialAnalysis. American Journal of Agricultural Economics, 85(4):1016–1028.
Conning, J. and Udry, C. (2007). Rural Financial Markets in Developing Countries. In The Handbookof Agricultural Economics, Vol. 3.
Conselho Monetário Nacional (2008). Resolução 3.545 de 29 de Fevereiro de 2008.FAO (2006). Global Forest Resources Assessment 2005: Progress Towards Sustainable Forest Manage-
ment. Rome: Food and Agriculture Organization (FAO).FAO (2007). Future expansion of soybean 2005-2014: implications for food security, sustainable rural
development and agricultural policies in the countries of mercosur and bolivia. Technical report, FAORegional Office for Latin America and the Caribbean.
Feder, G. (1985). The Relation Between Farm Size And Farm Productivity: The Role Of Family Labor,Supervision And Credit Constraints. Journal of Development Economics, 18(2-3):297–313.
Hargrave, J. and Kis-Katos, K. (2010). Economic Causes of Deforestation in the Brazilian Amazon: APanel Data Analysis for 2000s. In Proceedings of the German Development Economics Conference,Hannover. Verein für Socialpolitik, Research Committee Development Economics.
INPE (2012). Projeto prodes - monitoramento da floresta amazônica brasileira por satélite. Technicalreport, INPE. http://www.obt.inpe.br/prodes/index.php.
IPAM (2009). Evolução na Política para o Controle do Desmatamento na Amazônia Brasileira: OPPCDAm. Clima e Floresta, 15.
Ipea, Cepal, and GIZ (2011). Avaliação do Plano de Ação para a Prevenção e Controle do Desmatamentoda Amazônia Legal. Technical report.
Morton, D. C., DeFries, R. S., Shimabukuros, Y. E., Anderson, L. O., Arai, E., Espirito-Santo, F.,Freitas, R., and Morisette, J. (2006). Cropland Expansion Changes Deforestation Dynamics in theSouthern Brazilian Amazon. Proceedings of the National Academy of Sciences, 103(39):14637Ű–14641.
Pfaff, A. S. (1999). What Drives Deforestation in the Brazilian Amazon? Evidence from Satellite andSocioeconomic Datal. Journal of Environmental Economics and Management, 37(1):26–43.
Presidência da República (2006). Lei No. 11.326 de 24 de julho de 2006.Reis, E. and Guzmán, R. (1994). An Econometric Model of Amazon Deforestation. In K. Brown and
D. Pearce, eds. The Causes of Tropical Deforestation. London: UCL Press, pages 172–191.Reis, E. and Margulis, S. (1991). Options for Slowing Amazon Jungle Clearing. In R. Dornbusch and
J.M. Poterba, eds. Global Warming: Economic Policy Responses. Cambridge, MA: MIT Press, pages335–375.
Rosenzweig, M. and Wolpin, K. I. (1993). Credit Market Constraints, Consumption Smoothing, andthe Accumulation of Durable Production Assets in Low-Income Countries: Investments in Bullocksin India. Journal of Political Economy, 101:223–244.
Santilli, M., Moutinho, P., Schwartzman, S., Nepstad, D., Curran, L., and Nobre, C. (2005). TropicalDeforestation and the Kyoto Protocol. Climatic Change, 71:267–276.
Udry, C. (2010). The economics of agriculture in africa: Notes toward a research program. Mimeo, Yale.
33

Figure 1: The Brazilian Amazon Biome and Legal Amazon
34

Figure 2: Theoretical Model - Optimal Farmland Size (M0 < M < M)
!"#$%&'&%()'*+,-'
MMMM0
./%)+#!(%&'.-01(!&!23'40!(*./%+(-)5'
$!)-/('.-01(!&!23'40!(*./%+(-)5'
$!)-/('.-01(!&!23'
46(0!(*./%+(-)5'
35

Figure 3: Annual Concession of Rural Credit in the Legal Amazon (municipality-levelaverage value of rural credit loans, 2002-2011)
(a) Cattle-oriented sample
!""
#""
$""
%""
&""
!"#$
%&'()*+'&,
-./01$
2
"
'""
(""
(""( (""! (""# (""$ (""% (""& ("") (""* ("'" ("''
+,-./0123456+728/+41 /7./0123456+728/+41
(b) Crop-oriented sample
!"###
!"$##
%"###
%"$##
!"#$
%&'()*+'&,
-./01$
2
#
$##
%##% %##& %##' %##$ %##( %##) %##* %##+ %#!# %#!!
,-./01234567,8390,52 08/01234567,8390,52
Notes: Authors’ elaboration based on data from Recor/Central Bank.
36

Figure 4: Monthly Concession of Rural Credit in the Amazon Biome (total value of ruralcredit loans, 2006-2008)
(a) Cattle-specific contracts
!"#
$##
$"#
%##
%"#
!"#$
%&'()*+',
%--%./0
#
"#
!##
$##& $##' $##(
(b) Crop-specific contracts
!"
#"
$""
$%"
$&"
!"#$
%&'()*+',
%--%./0
"
%"
&"
%""! %""' %""#
Notes: Authors’ elaboration based on data from Recor/Central Bank.
37

Figure 5: Deforestation in the Legal Amazon (municipality-level average deforestation,2002-2011)
(a) Cattle-oriented sample
!
"
#
$
%
&
'(
)(
!(
"(
#(
$(
%(
!"#$%"&'"!
()%")(*+,
- .
(
'
*
)
(
'(
*(
)(
*((* *(() *((! *((" *((# *(($ *((% *((& *('( *(''
+,-+./012345,06+52/078/9:03;+-< 5=:-+./012345,06+52/07>+?@:03;+-<
(b) Crop-oriented sample
!
"
#
$
%
&
'(
'"
)(
)"
*(
*"
!(
!"#$%"&'"!
()%")(*+,
- .
(
'
)
*
(
"
'(
'"
)(() )((* )((! )((" )((# )(($ )((% )((& )('( )(''
+,-+./012345,06+52/078/9:03;+-< 5=:-+./012345,06+52/07>+?@:03;+-<
Notes: Authors’ elaboration based on data from PRODES/INPE.
38

Table 1: Municipality-Level Average Annual Rural Credit and Deforestation Before and After Resolution 3,545 (credit in BRL thousandby type of contract; deforestation in km2)
Aggregate Credit Pronaf Credit Non-Pronaf Credit DeforestationTotal Cattle Crop Total Cattle Crop Total Cattle Crop
Panel A: All municipalities
Inside biome Pre-resolution 5,509 3,531 1,978 1,254 841 413 4,255 2,690 1,565 40.36Post-resolution 6,360 4,429 1,930 1,976 1,458 518 4,383 2,971 1,413 14.90
Outside biome Pre-resolution 12,092 2,865 9,227 784 475 309 11,308 2,390 8,918 3.03Post-resolution 15,594 5,371 10,223 1,110 776 334 14,484 4,595 9,889 1.72
Panel B: Cattle-oriented municipalities
Inside biome Pre-resolution 5,799 4,655 1,144 1,581 1,152 430 4,218 3,504 714 49.57Post-resolution 6,954 5,843 1,110 2,396 1,941 455 4,558 3,902 656 18.07
Outside biome Pre-resolution 4,865 2,987 1,878 757 490 267 4,108 2,497 1,611 2.64Post-resolution 7,894 5,715 2,180 1,024 774 250 6,870 4,940 1,930 1.95
Panel C: Crop-oriented municipalities
Inside biome Pre-resolution 5,841 1,620 4,221 738 289 449 5,103 1,331 3,772 21.60Post-resolution 6,127 2,010 4,118 1,352 613 739 4,775 1,397 3,379 8.27
Outside biome Pre-resolution 23,112 2,679 20,433 826 453 373 22,286 2,226 20,060 4.41Post-resolution 27,334 4,848 22,486 1,242 780 462 26,093 4,068 22,025 0.90
Notes: Descriptive statistics for average values of annual rural credit are calculated using municipality-level data constructed from the Recor
contract-level microdata set. Statistics are shown for aggregate rural credit, and for Pronaf and Non-Pronaf credit separately. Descriptive
statistics for deforestation are calculated using municipality-level satellite-based deforestation data from PRODES/INPE. Figures in Panel A are
for the full, unrestricted sample; in Panel B for the cattle-oriented subsample; and in Panel C for the crop-oriented subsample.
39

Table 2: The Effect of Resolution 3,545 on Rural Credit in the Amazon Biome
Panel A: Biome as treatment group
Total Cattle Crop
Biome * Post2008 -0.216 -0.289 -0.078(0.029)*** (0.033)*** (0.024)***
Observations 85,440 85,440 85,440Number of Municipalities 712 712 712Year and Municipality FE Yes Yes YesSample Legal Amazon Legal Amazon Legal Amazon
Panel B: Biome and non-Pronaf as treatment groups
Total Cattle Crop
Biome * Non-Pronaf * Post2008 -0.369 -0.407 -0.189(0.039)*** (0.041)*** (0.033)***
Non-Pronaf * Post2008 0.064 0.116 -0.005(0.030)** (0.031)*** (0.025)
Biome * Non-Pronaf 0.148 0.163 0.076(0.016)*** (0.016)*** (0.013)***
Biome * Post2008 0.026 0.007 0.064(0.030) (0.033) (0.025)***
Non-Pronaf -0.025 -0.046 0.002(0.012)** (0.012)*** (0.010)
Observations 170,880 170,880 170,880Number of Municipalities 712 712 712Year and Municipality FE Yes Yes YesSample Legal Amazon Legal Amazon Legal Amazon
Notes: Coefficients shown are estimated using fixed effects specifications in a municipality-by-
month panel data set covering the 2002 through 2011 period. The sample includes all Legal
Amazon municipalities that are not crossed by the Amazon Biome frontier. The dependent
variable is normalized rural credit at the municipality level calculated using all contracts (column
1), cattle-specific contracts only (column 2), and crop-specific contracts only (column 3). All
regressions include controls for municipality fixed effects, month-year fixed effects, cattle prices
(current and lagged), crop prices (current and lagged), and priority municipality status. Robust
standard errors are clustered at the municipality level. Significance: *** p<0.01, ** p<0.05, *
p<0.10.
40

Table 3: Counterfactual Simulations - The Effect of Resolution 3,545 on Rural Credit in the Amazon Biome (credit in BRL million)
Panel A: Biome as treatment group
Year Total Cattle Crop
Observed Estimated Difference Observed Estimated Difference Observed Estimated Difference
2002 1,595 1,092 5032003 2,306 1,312 9942004 3,002 1,679 1,3242005 2,982 1,945 1,0372006 2,623 1,856 7672007 2,630 1,818 8122008 2,506 3,174 668 1,740 2,253 512 765 944 1792009 2,772 3,594 821 1,845 2,564 719 927 1,079 1522010 3,203 3,852 649 2,271 2,873 601 932 1,008 762011 3,170 3,928 758 2,258 3,037 779 912 945 33
2008-2011 Total 11,651 14,547 2,896 8,114 10,727 2,611 3,536 3,976 440
Panel B: Biome and non-Pronaf as treatment groups
Year Total Cattle Crop
Observed Estimated Difference Observed Estimated Difference Observed Estimated Difference
2002 1,595 1,092 5032003 2,306 1,312 9942004 3,002 1,679 1,3242005 2,982 1,945 1,0372006 2,623 1,856 7672007 2,630 1,818 8122008 2,506 3,036 530 1,740 2,052 312 765 943 1782009 2,772 3,607 835 1,845 2,449 604 927 1,085 1582010 3,203 3,795 592 2,271 2,694 423 932 1,002 702011 3,170 3,905 736 2,258 2,886 628 912 933 21
2008-2011 Total 11,651 14,342 2,693 8,114 10,081 1,967 3,536 3,963 427
Notes: Counterfactual simulations are conducted using the sample, specifications and estimated coefficients from Table 2. Results shown are
for total rural credit (columns 1-3), cattle-specific contracts (columns 4-6), and crop-specific contracts (columns 7-9). Observed rural credit is
obtained from Recor/Central Bank and estimated rural credit is calculated by replacing the coefficient of the policy variable by zero.
41

Table 4: Sectoral Heterogeneity - Cattle-Oriented and Crop-Oriented Sub-samples
Panel A: Biome as treatment group
Cattle-oriented Crop-oriented
Biome * Post2008 -0.300 -0.128(0.042)*** (0.040)***
Observations 54,600 27,960Number of Municipalities 455 233Year and Municipality FE Yes YesSample Legal Amazon Legal Amazon
Panel B: Biome and non-Pronaf as treatment groups
Cattle-oriented Crop-oriented
Biome * Non-Pronaf * Post2008 -0.490 -0.246(0.053)*** (0.060)***
Non-Pronaf * Post2008 0.193 -0.030(0.040)*** (0.041)
Biome * Non-Pronaf 0.196 0.098(0.021)*** (0.024)***
Biome * Post2008 0.069 0.048(0.041)* (0.042)
Non-Pronaf -0.077 0.012(0.016)*** (0.016)
Observations 109,200 55,920Number of Municipalities 455 233Year and Municipality FE Yes YesSample Legal Amazon Legal Amazon
Notes: Coefficients shown are estimated using fixed effects specifications in a
municipality-by-month panel data set covering the 2002 through 2011 period.
The cattle-oriented subsample includes Legal Amazon municipalities that are
not crossed by the Amazon Biome frontier where the pre-2008 average value of
annual credit loans for cattle ranching was higher than that for crop production;
the crop-oriented subsample is defined analogously. The dependent variable is
normalized rural credit at the municipality level calculated using cattle-specific
contracts only (column 1), and crop-specific contracts only (column 2). All re-
gressions include controls for municipality fixed effects, month-year fixed effects,
cattle prices (current and lagged), crop prices (current and lagged), and priority
municipality status. Robust standard errors are clustered at the municipality
level. Significance: *** p<0.01, ** p<0.05, * p<0.10.
42

Table 5: The Effect of Resolution 3,545 on the Distribution of Rural Credit Contracts by Contract Size
Number of cattle-specific contracts, by contract size Number of crop-specific contracts, by contract size
Small Medium Large Small Medium Large
Biome * Post2008 3.405 -0.798 -1.345 1.642 -0.486 0.107(1.508)** (0.421)* (0.331)*** (1.757) (0.263)* (0.234)
Crops price index 2.486 -0.300 0.428 -0.872 0.641 -0.215(3.938) (0.705) (2.458) (3.708) (0.529) (0.696)
Crops price index (lagged) 16.342 -1.823 0.951 1.294 0.232 3.368(4.220)*** (0.805)** (0.735) (3.626) (0.760) (1.599)**
Cattle price index (1st sem) 0.286 -0.053 -0.344 0.342 -0.114 12.650(0.148)* (0.055) (0.658) (0.173)** (0.041)*** (2.959)***
Cattle price index (lagged) 0.295 0.064 -0.034 0.242 0.159 -0.029(0.125)** (0.058) (0.059) (0.170) (0.035)*** (0.022)
Priority municipalities 1.190 -4.267 0.073 -1.142 -1.292 0.032(4.305) (2.045)** (0.062) (6.908) (0.790) (0.030)
Observations 93,720 93,720 93,720 93,720 93,720 93,720Number of Municipalities 781 781 781 781 781 781Year and Municipality FE Yes Yes Yes Yes Yes Yes
Notes: Coefficients shown are estimated using fixed effects specifications in a municipality-by-month panel data set covering the 2002 through 2011 period. The
sample includes all Legal Amazon municipalities that are not crossed by the Amazon Biome frontier. The dependent variable is the number of small, medium, and
large cattle-specific contracts only (columns 1-3) and the number of small, medium, and large crop-specific contracts only (columns 4-6). All regressions include
controls for municipality fixed effects, month-year fixed effects, cattle prices (current and lagged), crop prices (current and lagged), and priority municipality
status. Robust standard errors are clustered at the municipality level. Significance: *** p<0.01, ** p<0.05, * p<0.10.
43

Table 6: Robustness Checks - Falsification Tests, Alternative Sample and Alternative Dependent Variable
Panel A.1: Falsification test - Panel A.2: Alternative sample - Panel A.3: Alternative dependent variable -Pronaf credit as dependent variable municipalities within 100km of biome frontier absolute values of rural credit
Total Cattle Crop Total Cattle Crop Total Cattle Crop
Biome * Post2008 0.036 0.014 0.064 -0.159 -0.199 -0.106 -277.415 -144.285 -133.130(0.030) (0.032) (0.025)** (0.041)*** (0.046)*** (0.034)*** (57.051)*** (27.769)*** (49.758)***
Observations 85,440 85,440 85,440 46,320 46,320 46,320 85,440 85,440 85,440Number of Municipalities 712 712 712 386 386 386 712 712 712Year and Municipality FE Yes Yes Yes Yes Yes Yes Yes Yes YesSample Legal Amazon Legal Amazon Legal Amazon <100km <100km <100km Legal Amazon Legal Amazon Legal Amazon
Panel B.1: Falsification test - Panel B.2: Alternative sample - Panel B.3: Alternative dependent variable -subsample of Legal Amazon municipalities outside biome municipalities within 100km of biome frontier absolute values of rural credit
Total Cattle Crop Total Cattle Crop Total Cattle Crop
Biome * Non-Pronaf * Post2008 -0.096 -0.156 -0.047 -287.182 -186.752 -100.430(0.057)* (0.060)*** (0.045) (57.198)*** (26.928)*** (50.230)**
Non-Pronaf * Post2008 0.064 0.116 -0.005 0.064 0.116 -0.005 237.473 158.671 78.801(0.030)** (0.031)*** (0.025) (0.030)** (0.031)*** (0.025) (53.112)*** (21.711)*** (48.697)
Biome * Non-Pronaf 0.038 0.062 0.019 -626.448 -5.130 -621.319(0.023)* (0.024)*** (0.018) (157.541)*** (26.126) (147.809)***
Biome * Post2008 -0.060 -0.057 -0.021 4.883 21.233 -16.350(0.043) (0.046) (0.034) (12.823) (9.166)** (8.443)*
Non-Pronaf -0.025 -0.046 0.002 -0.025 -0.046 0.002 876.975 159.534 717.441(0.012)** (0.012)*** (0.010) (0.012)** (0.012)*** (0.010) (154.199)*** (20.239)*** (145.679)***
Observations 61,200 61,200 61,200 92,640 92,640 92,640 170,880 170,880 170,880Number of Municipalities 712 712 712 386 386 386 712 712 712Year and Municipality FE Yes Yes Yes Yes Yes Yes Yes Yes YesSample Outside Biome Outside Biome Outside Biome <100km <100km <100km Legal Amazon Legal Amazon Legal Amazon
Notes: Coefficients shown are estimated using fixed effects specifications in a municipality-by-month panel data set covering the 2002 through 2011 period. The sample includes all Legal Amazon municipalities
that are not crossed by the Amazon Biome frontier, unless otherwise stated. Falsification tests are performed using normalized Pronaf rural credit as the dependent variable (Panel A.1) and a subsample of Legal
Amazon municipalities located outside the Amazon Biome (Panel B.1). Alternative specifications tested include using a restricted sample of municipalities within 100 km of biome frontier (Panels A.2 and B.2) and
absolute value of rural credit as the dependent variables (Panels A.3 and B.3). The dependent variables are calculated using all contracts (columns 1, 4 and 7), cattle-specific contracts only (columns 2, 5 and 8),
and crop-specific contracts only (columns 3, 6 and 9). All regressions include controls for municipality fixed effects, month-year fixed effects, cattle prices (current and lagged), crop prices (current and lagged), and
priority municipality status. Robust standard errors are clustered at the municipality level. Significance: *** p<0.01, ** p<0.05, * p<0.10.
44
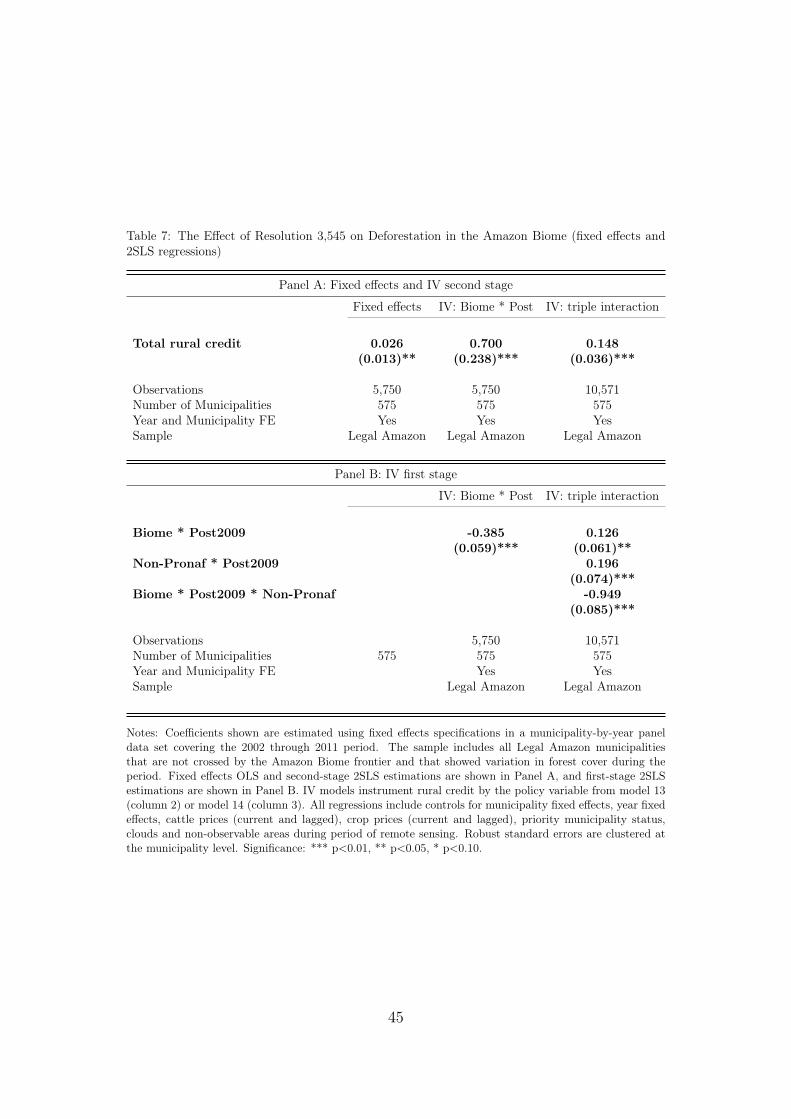
Table 7: The Effect of Resolution 3,545 on Deforestation in the Amazon Biome (fixed effects and2SLS regressions)
Panel A: Fixed effects and IV second stage
Fixed effects IV: Biome * Post IV: triple interaction
Total rural credit 0.026 0.700 0.148(0.013)** (0.238)*** (0.036)***
Observations 5,750 5,750 10,571Number of Municipalities 575 575 575Year and Municipality FE Yes Yes YesSample Legal Amazon Legal Amazon Legal Amazon
Panel B: IV first stage
IV: Biome * Post IV: triple interaction
Biome * Post2009 -0.385 0.126(0.059)*** (0.061)**
Non-Pronaf * Post2009 0.196(0.074)***
Biome * Post2009 * Non-Pronaf -0.949(0.085)***
Observations 5,750 10,571Number of Municipalities 575 575 575Year and Municipality FE Yes YesSample Legal Amazon Legal Amazon
Notes: Coefficients shown are estimated using fixed effects specifications in a municipality-by-year panel
data set covering the 2002 through 2011 period. The sample includes all Legal Amazon municipalities
that are not crossed by the Amazon Biome frontier and that showed variation in forest cover during the
period. Fixed effects OLS and second-stage 2SLS estimations are shown in Panel A, and first-stage 2SLS
estimations are shown in Panel B. IV models instrument rural credit by the policy variable from model 13
(column 2) or model 14 (column 3). All regressions include controls for municipality fixed effects, year fixed
effects, cattle prices (current and lagged), crop prices (current and lagged), priority municipality status,
clouds and non-observable areas during period of remote sensing. Robust standard errors are clustered at
the municipality level. Significance: *** p<0.01, ** p<0.05, * p<0.10.
45

Table 8: Counterfactual Simulations - The Effect of Resolution 3,545 on Deforestation in theAmazon Biome
Year IV: Biome * Post IV: triple interaction
Observed Estimated Difference Observed Estimated Difference
2002 21,549 21,549 18,8102003 25,686 25,686 22,8442004 23,087 23,087 19,1762005 20,087 20,087 19,8472006 9,946 9,946 10,7172007 10,565 10,565 10,8252008 11,295 11,295 12,2522009 5,220 5,688 468 5,220 6,446 1,2262010 5,657 7,398 1,741 5,657 7,390 17342011 5,119 5,693 574 5,119 5,219 101
2009-2011 Total 15,995 18,778 2,783 15,995 19,056 3,061
Notes: Counterfactual simulations are conducted using the sample, specifications and estimated co-
efficients from Table 7. Instruments used are Biome * Post (columns 1-3) and Biome * Post, Non-
Pronaf * Post, and Non-Pronaf * Biome * Post (columns 4-6). Observed deforestation is obtained
from PRODES/INPE and estimated deforestation is calculated by replacing the coefficient of the policy
variable by zero.
46

Table 9: The Effect of Resolution 3,545 on Deforestation in the Amazon Biome Using Cattle and Crop-Oriented Subsamples (fixed effects and 2SLSregressions)
Panel A: Fixed effects and IV second stage
Panel A.1: Cattle-oriented municipalities Panel A.2: Crop-oriented municipalities
Fixed effects IV: Biome*Post IV: triple interaction Fixed effects IV: Biome*Post IV: triple interaction
Total rural credit 0.023 1.033 0.225 0.040 -0.212 -0.027(0.015) (0.334)*** (0.051)*** (0.026) (0.308) (0.034)
Observations 4,120 4,120 7,904 1,410 1,410 2,593Number of Municipalities 412 412 412 141 141 141Year and Municipality FE Yes Yes Yes Yes Yes YesSample Legal Amazon Legal Amazon Legal Amazon Legal Amazon Legal Amazon Legal Amazon
Panel B: IV first stage
Panel B.1: Cattle-oriented municipalities Panel B.2: Crop-oriented municipalities
IV: Biome*Post IV: triple interaction IV: Biome*Post IV: triple interaction
Biome * Post2009 -0.389 0.161 -0.353 0.041(0.067)*** (0.069)** (0.129)*** (0.130)
Non-Pronaf * Post2009 0.279 -0.084(0.083)*** (0.159)
Biome * Post2009 * Non-Pronaf -0.954 -0.894(0.096)*** (0.180)***
Observations 4,120 7,904 1,410 2,593Number of Municipalities 412 412 141 141Year and Municipality FE Yes Yes Yes YesSample Legal Amazon Legal Amazon Legal Amazon Legal Amazon
Notes: Coefficients shown are estimated using fixed effects specifications in a municipality-by-year panel data set covering the 2002 through 2011 period. The sample
includes all Legal Amazon municipalities that are not crossed by the Amazon Biome frontier and that showed variation in forest cover during the period. Samples are
restricted to cattle (Panels A.1 and B.1) and crop-oriented (Panels A.2 and B.2) municipalities. Fixed effects OLS and second-stage 2SLS estimations are shown in Panel
A, and first-stage 2SLS estimations are shown in Panel B. IV models instrument rural credit by the policy variable from model 13 (columns 2 and 5) or model 14 (columns
3 and 6). All regressions include controls for municipality fixed effects, year fixed effects, cattle prices (current and lagged), crop prices (current and lagged), priority
municipality status, clouds and non-observable areas during period of remote sensing. Robust standard errors are clustered at the municipality level. Significance: ***
p<0.01, ** p<0.05, * p<0.10.
47

Table 10: Robustness Checks - IV Regressions with Alternative Sample, Alternative Dependent Variable and Controlling for the Interaction Between a Non-Linear Trend and Initial Deforestation
Panel A - IV Second Stage
Panel A.1: Alternative sample - Panel A.2: Alternative variables - Panel A.3: Controlling for the interactionmunicipalities within 100 km of biome frontier absolute values of total rural credit and deforestation between a non-linear trend and initial deforestation
IV-Biome*Post IV- Triple interaction IV-Biome*Post IV- Triple interaction IV-Biome*Post IV- Triple interaction
Total Rural Credit 1.514 1.242 3.621 0.131 0.619 0.127(0.602)** (0.413)*** (1.300)*** (0.039)*** (0.224)*** (0.034)***
Observations 2,510 4,868 5,750 10,610 5,750 10,571Number of Municipalities 251 251 575 575 575 575Year and Municipality FE Yes Yes Yes Yes Yes YesSample <100km <100km Legal Amazon Legal Amazon Legal Amazon Legal Amazon
Panel B - IV First Stage
Panel B.1: Alternative sample - Panel B.2: Alternative variables - Panel B.3: Controlling for the interactionmunicipalities within 100 km of biome frontier absolute values of total rural credit and deforestation between a non-linear trend and initial deforestation
IV- Biome*Post IV- Triple interaction IV- Biome*Post IV- Triple interaction IV- Biome*Post IV- Triple interaction
Biome * Post2009 -0.29 -0.081 -3.667 0.015 -0.376 0.131(0.072)*** (0.076) (0.638)*** (0.833) (0.081)*** (0.085)
Non-Pronaf * Post 2009 0.196 2.594 0.196(0.071)*** (1.014)** (0.092)**
Biome * Post2009 * Non-Pronaf -0.283 -3.615 -0.949(0.105)*** (1.169)*** (0.111)***
Observations 2,510 4,868 5,750 10,610 5,750 10,571Number of Municipalities 251 251 575 575 575 575Year and Municipality FE Yes Yes Yes Yes Yes YesSample <100km <100km Legal Amazon Legal Amazon Legal Amazon Legal Amazon
Notes: Coefficients shown are estimated using fixed effects specifications in a municipality-by-month panel data set covering the 2002 through 2011 period. Second-stage 2SLS estimations are shown in Panel A,
and first-stage 2SLS estimations are shown in Panel B. IV models instrument rural credit by the policy variable from model 13 (columns 1, 3 and 5) or model 14 (columns 2, 4 and 6). Alternative specifications
tested include using a restricted sample of municipalities within 100 km of biome frontier (Panels A.1 and B.1); absolute value (instead of normalized value) of rural credit and deforestation variables (Panels A.2 and
B.2); and controlling for the interaction between deforestation initial values and a non-linear trend (Panels A.3 and B.3). All regressions include controls for municipality fixed effects, year fixed effects, cattle prices
(current and lagged), crop prices (current and lagged), priority municipality status, clouds and non-observable areas during period of remote sensing. Robust standard errors are clustered at the municipality level.
Significance: *** p<0.01, ** p<0.05, * p<0.10.
48