an overview of rural credit markets
TRANSCRIPT
An Overview of Rural Credit Markets
September 21, 2021
Congressional Research Service
https://crsreports.congress.gov
R46914

Congressional Research Service
SUMMARY
An Overview of Rural Credit Markets The financial industry has a substantial presence in metropolitan centers such as New York City,
Chicago, and San Francisco, and one could argue these areas enjoy access to a range of financial
services. However, in the United States, a significant portion of the population lives in rural
areas, and access to financial services—specifically credit products—varies compared to that in
urban areas.
One reason for this variation is that the demographics and economics of rural areas differ from
those of urban areas in a number of ways. For example, people in rural areas are statistically
more likely to be older and have lower incomes relative to urban communities. Further, local
rural economies tend to be less diversified in terms of number and types of industries present, making them more susceptible
to economic shocks. In some cases, these differences can affect interactions with credit markets and access to credit in rural
areas and urban areas.
One difference is the demand for certain financial products. For example, many homes in both rural and urban areas are
financed with mortgages offered by banks or nonbank lenders. However, in part because housing is relatively cheaper in rural
areas, homeownership rates are higher, and the proportion of homes with an outstanding mortgage is lower. In addition,
different financing tools are required for structures such as manufactured homes, over half of which are found in rural areas,
comprising roughly 15% of rural households. Manufactured homes can be financed without a mortgage using a special type
of loan called a chattel loan. These loans are used to finance residential structures attached to land and can carry different
terms and pricing structures and lack the same protections as consumer mortgages. Another example can be found in
agricultural credit markets. Many rural businesses are tied to agricultural industries, and some lenders specialize in providing
loans to farmers and other agricultural businesses, which depend on that funding to support seasonal crop yields. Another
potential difference is access to some financial services. For example, while most U.S. households have bank accounts, the
ability to use a bank in rural areas can be more limited than it might be in urban areas by factors such as geographic
proximity to a physical branch or access to broadband for use of internet banking services.
Federal agencies dedicated to increasing the availability of credit to small businesses and potential homeowners have
established a range of programs and policies geared toward rural areas. Typically, the federal government provides low-cost
loans, loan guarantees, or capital to rural borrowers or intermediaries through these programs. In some circumstances, the
federal government has set up government-sponsored enterprises to facilitate credit to agricultural business. As a whole, the
federal government (and thus, ultimately, taxpayers) takes on financial risk to support these programs, even if some of the
programs earn positive income in a typical year.
Native American communities, many of which exist in mostly rural parts of the United States, have historically had among
the highest poverty rates in the nation, particularly on tribal reservations or trust land. Credit access is broadly
underdeveloped in Native American communities, which constrains economic development. The federal government
supports economic development in tribal nations through various development, community development, and housing
programs.
R46914
September 21, 2021
Andrew P. Scott, Coordinator Analyst in Financial Economics
An Overview of Rural Credit Markets
Congressional Research Service
Contents
Introduction ..................................................................................................................................... 1
Rural Economic and Financial Overview ........................................................................................ 2
Rural Consumer Financial Services ................................................................................................ 5
Housing Finance in Rural Areas................................................................................................ 5 USDA Rural Housing Service ............................................................................................ 7 Fannie Mae and Freddie Mac “Duty to Serve” Requirements ............................................ 9 Manufactured Housing and Chattel Lending .................................................................... 10
Retail Banking and Alternative Credit .................................................................................... 12 Banking Deserts ................................................................................................................ 12 Other Credit Issues Facing Rural Communities ............................................................... 14
Agricultural and Commercial Financial Services .......................................................................... 15
Farm and Other Agricultural Lending Programs ..................................................................... 15 USDA Farm Service Agency (FSA) ................................................................................. 15 Farm Credit System and Farmer Mac ............................................................................... 16 Composition of Farm Loans ............................................................................................. 17 Commercial Bank Lending to Farms ................................................................................ 17
Rural Commercial Lending Programs ..................................................................................... 18 Small Business Administration Agricultural Programs .................................................... 19 USDA Rural Business Support ......................................................................................... 23
Credit in Native American Communities ...................................................................................... 26
Federal Programs to Promote Native Credit Access ......................................................... 28
Figures
Figure 1. Bank Branches of the Six Largest Banks in Affected Counties ..................................... 14
Figure 2. Market Shares, by Lender, of Total Farm Debt, 1960-2019........................................... 17
Figure 3. Bank Lending to Farms .................................................................................................. 18
Figure 4. Mapping Native American Financial Institutions .......................................................... 28
Tables
Table 1. Select Characteristics of Rural Areas Compared to Entire United States .......................... 2
Table 2. Select Characteristics of Housing in Rural Areas Compared to Entire United
States ............................................................................................................................................ 6
Contacts
Author Information ........................................................................................................................ 31

An Overview of Rural Credit Markets
Congressional Research Service 1
Introduction Financial services in rural areas can be very similar to those of urban consumers, but in some
cases the interactions between rural consumers and credit markets can differ. These differences
are in part due to variation in the demographic, geographic, and economic conditions in some
rural areas. For example, access to credit in rural areas can be limited by geographic distance and
lack of auxiliary services such as widespread broadband coverage. In some cases, policymakers
have also developed programs specifically for rural consumers and economies.
Several congressional committees have an interest in rural financial services. For example, the
Senate Committee on Banking, Housing, and Urban Affairs and the House Committee on
Financial Services have recently held hearings that discussed aspects of the rural financial
system.1 Additionally, the Senate Committee on Agriculture, Nutrition, and Forestry and the
House Committee on Agriculture routinely examine a range of financial and economic issues
pertinent to farming and other agricultural business. Additionally, roughly every five years, a
package of legislation known as the “farm bill” expires, and a new version may be debated and is
typically enacted. The farm bill contains numerous provisions, some of which pertain to financial
services and rural development issues discussed in more detail below. The most recent farm bill,
P.L. 115-334, was enacted in 2018 and expires in 2023.2
This report provides an overview of rural credit markets and key federal programs that support
credit in rural areas. The term rural is not a well-defined concept across the range of financial
services policy issues; for the purposes of this report, statistical claims will generally rely on U.S.
Census Bureau distinctions, and policy discussions will defer to federal agency determinations for
rural programs.3 Broadly, it will illustrate that some consumer and commercial credit markets
operate in ways similar to urban markets but that others, such as housing and agricultural credit
markets, rely upon specific federal programs that support access to credit to meet demand for
funding. The report is organized into four sections:
1. An overview of rural and economic conditions;
2. A discussion of rural consumer financial services, with a focus on consumer
banking and housing finance;
3. A discussion of rural commercial financial services, with a focus on farm credit
and small business lending programs; and
4. An overview of key credit issues in Native American communities.
1 For example, in April 2021, the Senate Committee on Banking, Housing, and Urban Affairs held a hearing that
examined access to financial services in rural economies. Additionally, the House Committee on Financial Services
held a hearing on large bank oversight, which touched on bank branching in rural areas, in May 2021. See Senate
Committee on Banking, Housing, and Urban Affairs, “An Economy That Works for Everyone: Investing in Rural
Communities,” April 20, 2021, https://www.banking.senate.gov/hearings/an-economy-that-works-for-everyone-
investing-in-rural-communities.
2 More information on the 2018 farm bill can be found at CRS Report R45984, 2018 Farm Bill (P.L. 115-334) Primer
Series: A Guide to Omnibus Farm and Food Legislation, by Mark A. McMinimy.
3 Different agencies define rural differently. The U.S. Census Bureau defines rural as any population, housing, or
territory not in an urban area. Urban areas consist of two types of geographies: (1) urbanized areas, which have a
population of 50,000 or more; and (2) urban clusters, which have a population of at least 2,500 and less than 50,000.
According to this designation, rural and nonmetro are not synonymous, and over 50% of people living in rural areas
are also within a metro area. For more information, see U.S. Census Bureau, Rural America, https://mtgis-
portal.geo.census.gov/arcgis/apps/MapSeries/index.html?appid=49cd4bc9c8eb444ab51218c1d5001ef6.

An Overview of Rural Credit Markets
Congressional Research Service 2
Rural Economic and Financial Overview Rural areas face many financial services policy issues that are distinct from the overall country
because of differences in the economic characteristics of rural America. Understanding these
differences, many of which are described below and in Table 1, may shed some light on the
potentially different overall demand that rural consumers may have for credit products and the
willingness of financial institutions to supply them.
Table 1. Select Characteristics of Rural Areas Compared to Entire United States
Selected Social and Economic Characteristics Rural Areas United States
Median Age 43.6 38.1
Race
White 87.6% 72.5%
Black or African American 6.0% 12.7%
American Indian and Alaska Natives 1.7% 0.8%
Asian 1.1% 5.5%
Native Hawaiian and Other Pacific Islander 0.1% 0.2%
Hispanic or Latino Ethnicity* 6.8% 18%
Educational Attainment
High School Graduate or Higher 88.3% 88.0%
Bachelor’s Degree or Higher 23.5% 32.1%
Labor Force Participation Rate 58.7% 63.4%
Employed 55.7% 59.6%
Unemployed 2.8% 3.4%
Median Household Income $61,215 $62,843
Percentage of Families Whose Income in the Past 12 Months Is Below
the Poverty Level
8.1% 9.5%
Source: U.S. Census Bureau, 2019 American Community Survey, five-year estimates, Tables DP02, DP03, and
DP05.
Notes: The data in this table are aggregate numbers that describe rural America as a whole. However, it should
be noted that rural America is not uniform. For example, the poverty rate in rural America over the 2015-2019
period was lower than in the country as a whole despite significant localized poverty—poverty rates in the rural
South and on American Indian Reservations were higher than the country average.
*As defined by the Census Bureau, Hispanic or Latino individuals can be any race.
As described in Table 1, rural areas are different from the United States as a whole in certain
ways that may affect access to and participation in credit markets. First, income is a key
determinant of creditworthiness. Rural America has a lower median household income than the
national average. But the national average masks regional differences. The rural South had a
median household income of $46,891 over the 2015-2019 period, and the median household
income on American Indian Reservation and Trust Land (much of which is located within rural
areas) was even lower at $39,117. Likewise, while the poverty rate was lower for rural America
compared to the country as a whole, certain regions experienced significantly higher poverty rates
than the national average; the poverty rates in the rural South and on Reservations were 10.2%
and 20.5%, respectively, compared to the national average of 9.5% over the 2015-2019 period. In

An Overview of Rural Credit Markets
Congressional Research Service 3
addition, rural populations tend to be older and participate in the labor force at a lower rate, which
suggests that more borrowers may be exiting the workforce for retirement or are already on a
fixed income.
Second, there is less economic diversification in localized areas. Rural areas as a whole vary in
the industries employing rural residents, but some localized areas are more heavily reliant on
certain industries, such as farming, mining, and manufacturing. Consequently, certain
communities face greater sensitivity to trends in agriculture prices or energy prices or the
performance of primary industry domiciled in the area.4 Economic shocks in areas with lower
economic diversification can lead to quicker contractions of credit and financial strains on small,
local financial institutions, making access to loans potentially more difficult at times when it is
needed most.
Further, despite the population of rural areas increasing as a whole in recent years,5 between 2010
and 2018, over 70% of rural counties lost population.6 The population loss has occurred across
states but more significantly so in the Eastern United States.7 Net outmigration, falling birth rates,
and an aging population have all contributed to the localized population losses.8 Shrinking areas
may find it difficult to attract new financial institutions.
Rural America additionally has some demographic differences from the United States as a whole.
Although certain demographic differences—including age, race, and national origin, among
others—cannot legally be used as determinants of creditworthiness of individuals,9 Congress is
nevertheless concerned about access to credit for low-income, minority, and other traditionally
underserved populations. As shown in Table 1, rural America has a higher percentage of White
and American Indian and Alaska Natives individuals and a lower percentage of Black, Hispanic,
and Asian individuals than does the country as a whole. Rural America additionally has an older
population on average10 and contains fewer college graduates, which may affect demand for
different types of financial products and financial literacy.
Rural areas also have somewhat different financial characteristics than does the country as a
whole:
Higher homeownership rate. The homeownership rate is higher in rural areas
(81.6%) compared to the country as a whole (64%) for 2015-2019.11 Although
more rural homeowners would, therefore, be able to build wealth and access
credit markets using their homes as collateral, rural homes tend to have lower
4 U.S. Department of Agriculture (USDA) Economic Research Service (ERS), Rural Economy,
https://www.ers.usda.gov/data-products/ag-and-food-statistics-charting-the-essentials/rural-economy/.
5 As measured by the Census Bureau, rural America as a whole increased in population by over 3% between the five-
year periods ending in 2015 and 2019.
6 Christopher J. Raslavich et al., FDIC Community Banking Study, Federal Deposit Insurance Corporation (FDIC),
December 2020, p. 39, https://www.fdic.gov/resources/community-banking/report/2020/2020-cbi-study-full.pdf.
7 ERS, Rural Economy. Note that ERS defines rural differently than the Census Bureau does, and therefore results may
differ between the two sources.
8 ERS, Population and Migration Overview, https://www.ers.usda.gov/topics/rural-economy-population/population-
migration/.
9 The Economic Credit and Opportunity Act (15 U.S.C. §§1691 et seq.) prohibits credit discrimination on the basis of
race, religion, national origin, sex, marital status, or age.
10 The percentage of the population 65 years and older was 18.9% in rural America as compared to 15.6% nationwide
over the five-year period from 2015 to 2019, according to the Census Bureau’s 2019 American Community Survey.
11 U.S. Census Bureau, 2019 American Community Survey, five-year estimates, Table DP04.
An Overview of Rural Credit Markets
Congressional Research Service 4
values, and thus smaller amounts can potentially be borrowed against them, on
average.
Fewer financial services providers located nearby. Some rural areas are not in
physical proximity to many or any financial services providers. For example, in a
study of census tracts, the Bank Policy Institute found that 9.9% of rural
Americans lived in banking deserts—areas without a nearby bank branch—
compared to 1.7% of urban Americans in 2017.12 A Federal Reserve research
note found that at least 25% of rural households were at least 50 miles from their
nearest bank branches in 2016.13 This could result in less credit, less competition,
and a smaller range of financial products being readily available to these
households and businesses.
Proportionately more small financial institutions. Rural consumers and
businesses are more likely to live in areas where large financial institutions are
not located. This may limit the availability of credit and range of financial
services offered.14
Some rural businesses may lack access to capital markets. Large and
innovative companies are more likely to be located in metropolitan areas, as are
nonbank financial firms that specialize in serving them. Together, these firms,
whether large or small, form local economic clusters that allow them, among
other things, to access nonbank credit through bond markets, private equity,
venture capital, and other nontraditional sources. These forms of financing have
grown in recent years and can expand access to credit and provide more flexible
financing to businesses. Thus, rural businesses—particularly small rural
businesses—may be more dependent on traditional bank loans to finance
operations and may have less access to nonbank credit on more favorable terms.15
Further, smaller business may seek smaller loans, which are not as profitable for
lenders to make.16
Less use of—or access to—technology. An alternative to physical proximity to
banks and other financial institutions is access to mobile banking and payments.
12 11.4% of Americans living in “mixed” Census tracts lived in banking deserts. For this study, the Bank Policy
Institute defined banking deserts “as a geographic area with no bank branch within 2 miles of the center of a census
tract in an urban area, within 5 miles in a mixed area or within 10 miles in a rural area.” If a desert was defined as 10
miles for all types of tracts, fewer urban and mixed residents would live in banking deserts. Francisco Covas, Some
Facts About Bank Branches and LMI Customers, April 4, 2019, https://bpi.com/some-facts-about-bank-branches-and-
lmi-customers/.
13 David Benson, Serafin Grundl and Richard Windle, “How Do Rural and Urban Retail Banking Customers Differ?,”
FEDS Notes, June 12, 2020, https://www.federalreserve.gov/econres/notes/feds-notes/how-do-rural-and-urban-retail-
banking-customers-differ-20200612.htm.
14 According to the FDIC, “In all, community banks were almost three times more likely than noncommunity
institutions to locate their offices in a nonmetro area in 2011, and were four times more likely to operate offices in rural
counties.… In 2011, there were 629 U.S. counties, with just over 6 million in population, where community banks
operated offices, but where no noncommunity banking offices were present. Three-quarters of these counties were
rural.” The FDIC’s definition of community banks is based on size and business model. FDIC, FDIC Community
Banking Study, December 2012, p. 3-5, https://www.fdic.gov/resources/community-banking/report/2012/2012-cbi-
study-3.pdf.
15 Matthew McKenna, “Rural America Is Ripe with Potential, Starving for Capital,” The Hill, July 28, 2018,
https://thehill.com/opinion/finance/399210-rural-america-is-ripe-with-potential-starving-for-capital.
16 For more on small business credit needs, see CRS Report R45878, Small Business Credit Markets and Selected
Policy Issues, by Darryl E. Getter.

An Overview of Rural Credit Markets
Congressional Research Service 5
A Federal Reserve research note found that fewer rural households used online
banking or used the internet to find information on borrowing and saving.17 This
may reflect a lack of technology accessible to rural customers and used by rural
financial institutions. According to the Federal Communications Commission,
83% of the rural population had access to broadband compared to 96% of the
U.S. population, and 91% had access to faster 4G mobile compared to 97% of the
U.S. population at the end of 2019.18 According to Pew, fewer rural adults had
access to smartphones (71% versus 83%), tablets, and computers in 2019.19
Likewise, rural financial firms may be less likely to offer digital products.
According to the Federal Deposit Insurance Corporation, rural community banks
surveyed were disproportionately low technology adopters.20
As a result of these demographic and economic differences, to some extent, rural businesses and
consumers demand different financial products and have access to different financial services
than does the rest of the country. In some financial markets, a different set of institutions or
products have arisen over time to serve these unique needs, as will be discussed in more detail
below. In other markets, the federal government has intervened to try to compensate where these
differences are perceived to result in a lack of access to credit and financial services.
Rural Consumer Financial Services
Housing Finance in Rural Areas
As shown in Table 2, more than one-fifth of all housing units in the United States (about 21%)
are located in areas designated by Census Bureau as rural. Housing in rural areas differs in
several ways from housing in the nation as a whole. While there are multifamily units21 in rural
areas, single-family detached housing accounts for a larger share of the housing stock in rural
areas than in the United States as a whole. Manufactured housing is also more prevalent—56% of
all manufactured homes in the United States are located in rural areas. The homeownership rate is
notably higher in rural areas, and housing costs for both renters and owners are significantly
lower, with a larger share of owners owning their homes without a mortgage. Although lower
housing prices and costs would be expected to translate into lower housing cost burdens for rural
owners and renters compared to the nation as a whole, over 25% of rural mortgage borrowers and
over 40% of rural renters pay 30% or more of their incomes toward their housing costs.22
17 Benson, Grundl and Windle, “How Do Rural and Urban Retail Banking Customers Differ?”
18 Federal Communications Commission, “Fourteenth Broadband Deployment Report,” Appendix A, p. 57,
https://docs.fcc.gov/public/attachments/FCC-21-18A1.pdf. Broadband is defined as 25/3 mbps and faster; 4G is
defined as 10/3 mbps. For more information, see CRS Report R46613, The Digital Divide: What Is It, Where Is It, and
Federal Assistance Programs, by Colby Leigh Rachfal.
19 Andrew Perrin, Digital Gap Between Rural and Nonrural America Persists, Pew Research Center, May 31, 2019,
https://www.pewresearch.org/fact-tank/2019/05/31/digital-gap-between-rural-and-nonrural-america-persists/.
20 Raslavich et al., FDIC Community Banking Study, p. 6-16.
21 Multifamily housing is generally defined as housing with five or more separate housing units.
22 While a variety of measures are used to determine the burden of living costs, one measure of cost burden that is
generally accepted is 30% of income for housing costs; this has been used by the Department of Housing and Urban
Development (HUD) and others for some time. For more on housing affordability measures, see HUD USER, “Rental
Burdens: Rethinking Affordability Measures,” https://www.huduser.gov/portal/pdredge/
pdr_edge_featd_article_092214.html#:~:text=
HUD%20defines%20cost%2Dburdened%20families,of%20one's%20income%20on%20rent.

An Overview of Rural Credit Markets
Congressional Research Service 6
Table 2. Select Characteristics of Housing in Rural Areas Compared to Entire
United States
Selected Housing Characteristics Rural Areas United States
Total housing units 29,163,765 137,428,986
Share single-family detached 77.3% 61.6%
Share manufactured housing 16.3% 6.2%
Owner-occupied units 19,152,308 77,274,381
Homeownership rate 81.6% 64.0%
Share with a mortgage 54.6% 62.7%
Median home value (owner-occupied, $) $172,200 $217,500
Share cost-burdened (owners with a mortgage, 30%+ income toward
housing costs)
25.8% 27.8%
Renter-occupied units 4,315,153 43,481,667
Renter rate 18.4% 36.0%
Median monthly renter costs ($) $789 $1,062
Share cost-burdened (30%+ income toward housing costs) 41.8% 49.6%
Source: U.S. Census Bureau, 2019 American Community Survey, five-year estimates, Table DP04. Rural as defined
by U.S. Census.
Mortgages are the prevalent financing tool for homeowners, and the same types of federal
support—including federal loan guarantees and secondary market support from government-
sponsored enterprises (GSEs)23—support mortgage lending in rural areas as in other areas.24
However, the differences in rural housing markets may impact rural mortgage lending.25 For
example, lower incomes and lower rates of employment may affect the ability of prospective
homebuyers to obtain mortgages. Fewer financial services companies offering mortgages and
other factors may impact mortgage availability and costs;26 furthermore, smaller community
banks and credit unions make up a larger share of mortgage lending in rural areas, increasing the
importance of these types of institutions in such areas.27 In addition, other features of rural areas
may present certain challenges for mortgage finance, such as difficulties obtaining accurate
appraisals when there are few comparable home sales in an area.28
23 There are a number of GSEs discussed in this report. The housing GSEs are Fannie Mae, Freddie Mac, and the
Federal Home Loan Bank Board and were set up by Congress to support liquidity in the mortgage markets. Later in this
report, the Farm Credit System—a GSE set up to support credit intermediation in the farming industry—is discussed.
24 For more on mortgage finance, see CRS Report R42995, An Overview of the Housing Finance System in the United
States, by Katie Jones, Darryl E. Getter, and Andrew P. Scott.
25 For example, see Nuno Mota, Rural Mortgage Lending Over the Last Decade, Fannie Mae Economic and Strategic
Research Department, 2016, https://www.fanniemae.com/sites/g/files/koqyhd191/files/migrated-files/resources/file/
research/datanotes/pdf/working-paper-102716.pdf; and a discussion of challenges related to housing markets in rural
areas in Freddie Mac’s 2018-2021 Duty to Serve Plan, including page RH2 and pages RH5-RH7, at Freddie Mac,
“Duty to Serve,” https://www.fhfa.gov/PolicyProgramsResearch/Programs/Documents/FreddieMacDTSPlan_2018-
2021.pdf.
26 Freddie Mac, “Duty to Serve,” p. RH6.
27 Michael Calhoun, Tom Feltner, and Peter Smith, Supporting Mortgage Lending in Rural Communities, Brookings
Institution, January 2018, pp. 8-9, https://www.brookings.edu/wp-content/uploads/2018/01/
es_2018_01_10_rural_housing_report.pdf.
28 Freddie Mac, “Duty to Serve,” p. RH6.
An Overview of Rural Credit Markets
Congressional Research Service 7
Rural homebuyers can obtain mortgages through any of the channels available to homebuyers in
general, including mortgages insured by the Federal Housing Administration (FHA) or
Department of Veterans Affairs, conforming mortgages to be purchased by the Federal National
Mortgage Association (known as Fannie Mae) or Federal Home Loan Mortgage Corporation
(known as Freddie Mac), and mortgages that may be held in a financial institution’s own
portfolio. Similarly, developers of multifamily housing in rural areas can access commercial real
estate loans—including those insured by FHA or backed by Fannie Mae or Freddie Mac—and
those developing affordable housing in rural areas can access government subsidy programs—
such as the Low Income Housing Tax Credit program—to the extent they are available. There are,
however, certain federal mortgage and subsidy programs targeted specifically to rural areas. In
addition, certain types of specialized housing finance, such as financing manufactured homes or
housing on tribal lands, are of greater relevance in rural areas. This section briefly discusses
certain programs and activities related to housing finance that are targeted to rural areas or that
may be of particular interest for rural areas.
USDA Rural Housing Service
While rural communities and their residents may benefit from any federal housing program, the
USDA’s Rural Housing Service (RHS) administers a number of federal housing programs
specifically for rural communities. These programs are generally designed to support housing for
low-income households in rural areas and are referred to by the section of the Housing Act of
1949 (Title V of P.L. 81-171; 42 U.S.C. §§1471 et seq.) under which they are authorized. The
definitions of rural and rural area for the purposes of USDA rural housing programs are different
than those used by the Census Bureau and are established in statute based on population
thresholds and other characteristics, such as being “rural in character” or having a “serious lack of
mortgage credit for lower and moderate income families.”29
Over the years, some have questioned whether separate mortgage programs for rural areas are
necessary or whether there are efficiencies to be gained by having the Department of Housing and
Urban Development (HUD) administer these programs rather than RHS, given the similarities
between certain RHS and HUD programs.30 Rural housing advocates, meanwhile, have argued
that the rural housing programs help to address specific needs in rural areas not addressed by
other programs and that RHS is better equipped than HUD is to focus on rural needs and deliver
services in rural areas.31
Single-Family Programs
Two RHS mortgage programs, in particular, support homeownership for certain rural households.
1. Section 502 Direct Loan Program.32 Through this program, USDA makes loans
directly to low- and very-low-income borrowers in rural areas to purchase, build,
rehabilitate, improve, or relocate homes. Among other requirements, eligible
29 See 42 U.S.C. §1490.
30 For example, see the Trump Administration’s Delivering Government Solutions in the 21st Century Reform Plan and
Reorganization Recommendations, p. 35, https://www.whitehouse.gov/wp-content/uploads/2018/06/Government-
Reform-and-Reorg-Plan.pdf.
31 See, for example, Leslie Strauss, “Why Keep Rural Housing Programs at USDA?,” Shelterforce, July 18, 2012,
https://shelterforce.org/2012/07/18/why_keep_rural_housing_programs_at_usda/.
32 For more information on Section 502 Direct Loans, see USDA’s website at https://www.rd.usda.gov/programs-
services/single-family-housing-direct-home-loans.

An Overview of Rural Credit Markets
Congressional Research Service 8
borrowers must be without decent, safe, and sanitary housing and must be unable
to obtain mortgage financing from other sources with terms and conditions that
the borrower could be reasonably expected to meet. Some borrowers may qualify
for payment subsidies to make payments more affordable.
2. Section 502 Guaranteed Loan Program.33 Through this program, USDA
guarantees eligible mortgages made by private lenders to eligible low- and
moderate-income households (up to 115% of area median income) to purchase,
build, rehabilitate, improve, or relocate homes.
The share of Section 502 loans issued through the guaranteed program has significantly increased
over time relative to the direct program.34 In FY2020, there were about 138,000 guaranteed loans
originated compared to about 6,000 direct loans.35 The direct loan program serves a lower-income
population than the guaranteed loan program does and has a higher cost to the federal
government.
The RHS mortgage programs are relatively small, and most mortgages made in rural areas are not
RHS mortgages. For example, based on data from the Home Mortgage Disclosure Act, about
71% of mortgages originated in rural and small town areas in 2017 were conventional (non-
government-insured) loans. Fourteen percent were insured by FHA, 10% were guaranteed by the
Department of Veterans Affairs, and 5% were RHS loans.36
In addition to the mortgage programs, RHS also administers certain other single-family housing
programs. These include loans and grants to finance home repairs for eligible very-low-income
households (Section 504); loans to purchase and develop housing sites (Section 524), including
site loans for housing constructed through self-help homeownership programs (Section 523); and
grants to provide technical assistance in support of self-help homeownership programs.37 Self-
help homeownership programs are programs through which participants contribute their own
labor to the construction of their homes.
Multifamily and Farm Labor Housing Programs
In addition to single family programs, RHS administers programs to subsidize the financing of
affordable multifamily housing in rural areas.
Section 515 Multifamily Housing Direct Loans.38 This program offers direct
loans to finance the development or redevelopment of rental housing for low-
income individuals and families in rural areas. The loans are typically subsidized
33 For more information on Section 502 Guaranteed Home Loans, see USDA’s website at https://www.rd.usda.gov/
programs-services/single-family-housing-guaranteed-loan-program.
34 Housing Assistance Council, USDA Rural Housing Program Historic Activity Report, pp. 5 and 7,
http://ruralhome.org/storage/documents/rd_obligations/historic/Historic.pdf.
35 Housing Assistance Council, USDA Rural Development Housing Activity, September—Fiscal Year 2020, Monthly
Obligation Report, p. 1, http://ruralhome.org/storage/documents/rd_obligations/fy2020/CombinedSepFY20.pdf.
36 See the Housing Assistance Council’s tabulations of Home Mortgage Disclosure Act data at
http://www.ruraldataportal.org/search.aspx, by selecting “Housing Finance Data” and “Loan Type.”
37 For more information on RHS single-family housing programs, see https://www.rd.usda.gov/programs-services/all-
programs/single-family-housing-programs.
38 For more information on Section 515 Direct Loans, see https://www.rd.usda.gov/programs-services/multifamily-
housing-direct-loans.
An Overview of Rural Credit Markets
Congressional Research Service 9
to a 1% interest rate, and borrowers are required to charge rents that are
affordable to low-income tenants.
Section 538 Multifamily Housing Guaranteed Loans.39 This program offers
federal loan guarantees—covering up to 90% of the loan amount—to eligible
borrowers who are building or preserving affordable rural rental housing. Units
financed with Section 538 loans are subject to rent caps and tenant income
eligibility requirements.
Section 514/516 Farm Labor Loans and Grants.40 Section 514 offers direct
loans for the development of housing on-farm (typically single family housing)
and off-farm (multifamily housing) for farm laborers. Section 516 grants are
offered to Section 514 multifamily loan recipients to further subsidize
development costs. Like Section 515, Section 514 loans are generally subsidized
to a 1% interest rate.
Section 521 Rural Rental Assistance.41 Section 521 rural rental assistance is
available to further subsidize the rents of eligible residents of Section 515 and
Section 514 properties. Tenants pay 30% of their income toward their rents, and
the rental assistance subsidizes tenants’ remaining rental and utility costs.
Currently, there are roughly 370,000 households living in 12,831 Section 515 properties and
14,548 households living in a total of 517 Section 514/516 farm labor housing properties. Within
those properties, about 268,916 households receive Section 521 rental assistance.42
Attention has been paid in recent years to preserving USDA-assisted affordable housing units as
they age or reach mortgage maturity. Since FY2011, for example, all funding for new Section 515
loans has gone to refinancing existing Section 515 properties rather than the development of new
units. The quality and availability of housing for farm laborers, especially migrant and seasonal
farm laborers, is of perennial policy interest. The farm labor housing program statute was recently
amended to expand eligibility that had previously been limited to citizens and permanent
residents to include temporary agricultural workers.43
Fannie Mae and Freddie Mac “Duty to Serve” Requirements
In 2008, in recognition of challenges related to mortgage liquidity and access to capital in certain
types of markets, Congress established “Duty to Serve” (DTS) requirements for the GSEs Fannie
Mae and Freddie Mac.44 These requirements direct each GSE to develop three-year plans
detailing activities that they will undertake to increase access to the secondary mortgage market
39 For more information on Section 538 Guaranteed Loans, see https://www.rd.usda.gov/programs-services/
multifamily-housing-loan-guarantees.
40 For more information on Farm Labor Housing, see https://www.rd.usda.gov/programs-services/farm-labor-housing-
direct-loans-grants.
41 For more information on Rural Rental Assistance, see https://www.rd.usda.gov/programs-services/multi-family-
housing-rental-assistance.
42 These data are taken from USDA’s Multi-Family Housing Annual Fair Housing Occupancy Reports at
https://www.rd.usda.gov/sites/default/files/RDUL-Occupancy.pdf. These reports do not include data on Section 538
properties.
43 Eligibility was expanded by P.L. 115-141.
44 For more on Fannie Mae, Freddie Mac, and “Duty to Serve,” see CRS Report R46746, Fannie Mae and Freddie
Mac: Recent Administrative Developments, by Darryl E. Getter.

An Overview of Rural Credit Markets
Congressional Research Service 10
for mortgages benefitting low- and moderate-income households in three specified underserved
markets, two of which are rural housing and manufactured housing.45
The regulations implementing the DTS requirements specify the types of activities for which the
GSEs can receive DTS credit. For the rural underserved market,46 they can receive credit for
activities related to housing in high-needs rural regions, housing for high-needs rural populations,
financing by small financial institutions in rural areas, and small multifamily rental properties in
rural areas, as well as additional activities approved by the Federal Housing Finance Agency
(FHFA) director.47 High-needs rural regions is defined as Middle Appalachia, the Lower
Mississippi Delta, colonias,48 and rural tracts in persistent poverty counties, while high-needs
rural populations is defined as members of federally recognized Indian tribes located in Indian
areas or agricultural workers, respectively, in rural areas.49 For the manufactured housing
underserved market, discussed more below, the GSEs can receive credit for activities related to
manufactured homes titled as real property; manufactured homes titled as personal property
(chattel loans); manufactured housing communities owned by governmental entities, nonprofits,
or residents; and manufactured housing communities with certain tenant protections for
manufactured homeowners who rent home sites in the community, as well as other activities
approved by the FHFA director.50
Fannie Mae’s and Freddie Mac’s DTS plans detail specific activities they plan to undertake in
each of these areas, and FHFA annually evaluates their performance.51
Manufactured Housing and Chattel Lending
Manufactured housing is more common in rural areas than in the United States as a whole.52
Manufactured homes, on average, are more affordable than site-built homes53 and can be placed
on land owned by the homeowner or on rented land.54 Many manufactured homes are located in
45 12 U.S.C. §4565. For more information, see the Federal Housing Finance Agency (FHFA) website at
https://www.fhfa.gov/PolicyProgramsResearch/Programs/Pages/Duty-to-Serve.aspx.
46 For the purposes of the DTS requirements, FHFA defined rural area to mean census tracts outside of metropolitan
statistical areas (MSAs), as defined by the Office of Management and Budget, or census tracts in MSAs that are
“outside of the metropolitan statistical area’s Urbanized Areas as designated by the USDA Rural-Urban Commuting
Area (RUCA) Code #1, and outside of tracts with a housing density of over 64 housing units per square mile for
USDA’s RUCA Code #2.” See 24 C.F.R. §1282.1 and FHFA, “Duty to Serve Markets,” https://www.fhfa.gov/
PolicyProgramsResearch/Programs/Pages/Duty-to-Serve-Markets.aspx.
47 12 C.F.R. §1282.35.
48 While specific definitions can vary, in general, colonias are residential communities in the United States located
close to the border with Mexico that lack certain basic infrastructure, such as water or sewer facilities.
49 12 C.F.R. §1282.1.
50 12 C.F.R. §1282.33.
51 Each GSE’s DTS plan and additional materials are available on FHFA’s DTS website at https://www.fhfa.gov/
PolicyProgramsResearch/Programs/Pages/Duty-to-Serve.aspx.
52 Manufactured housing is the term used to describe homes constructed in a factory setting in accordance with HUD’s
Manufactured Housing Construction and Safety Standards (sometimes called the HUD Code) and transported to the
home site on a permanent chassis. The HUD Code took effect in June 1976 and is the building code with which
manufactured homes must comply, rather than the local building codes that apply to site-built homes. Similar homes
that were built prior to the HUD Code are generally referred to as “mobile homes.”
53 Housing Assistance Council, Manufactured Housing in Rural America, Rural Research Brief, July 2020, p. 02,
https://ruralhome.org/wp-content/uploads/2021/05/Manufactured_Housing_RRB.pdf.
54 Consumer Financial Protection Bureau (CFPB), Manufactured Housing Finance: New Insights from the Home
Mortgage Disclosure Act Data, May 2021, pp. 33-36, https://files.consumerfinance.gov/f/documents/

An Overview of Rural Credit Markets
Congressional Research Service 11
manufactured home communities where homeowners pay lot rents for the site on which their
homes are situated.55
Manufactured homes can generally be financed in two main ways. Manufactured homes can be
financed using a traditional mortgage—including mortgages insured by a federal agency or
eligible for purchase by Fannie Mae or Freddie Mac—if certain conditions are met, including that
the home must be titled as real property, and the mortgage encumbers both the home and the land
to which it is attached. Alternatively, manufactured homes can be financed using chattel loans—
that is, personal property loans that encumber only the home itself and not the land. Compared to
mortgages, chattel loans are generally thought to carry higher interest rates and have fewer
consumer protections.56 While most chattel loans are obtained by borrowers who do not own the
land where their homes are sited and thus cannot title their homes as real property and qualify for
a mortgage, a non-trivial share of borrowers who do own the land have chattel financing.57 Such
manufactured homeowners may choose chattel loans for various reasons, including, among other
things, lower upfront costs or not wanting to encumber the land.58
Federal support for financing chattel loans is limited. Through its Title I program, FHA is to
insure personal property loans for a manufactured home, a lot, or a home and lot in
combination,59 though the program is relatively small.60 As part of their DTS requirements,
Fannie Mae and Freddie Mac are pursuing a variety of activities related to manufactured housing
finance.61 While these activities had included proposed chattel loan pilot programs, both GSEs
have encountered challenges in pursuing these pilots and have not included chattel loan activities
in their draft DTS plans for 2022-2024.62
cfpb_manufactured-housing-finance-new-insights-hmda_report_2021-05.pdf.
55 The hybrid model of owning a manufactured home and renting the land on which it is sited has implications for
owners, including more limited potential for building wealth through homeownership and challenges related to the
costs and difficulties of moving a manufactured home once it is placed. Given the costs of moving a home that has been
sited, owners may have difficulty relocating in the case of rent increases, changes in community amenities or services,
or community closures. See, for example, Housing Assistance Council, Manufactured Housing in Rural America.
56 For example, see Laurie Goodman and Bhargavi Ganesh, Challenges to Obtaining Manufactured Home Financing,
Urban Institute Housing Finance Policy Center, June 2018, https://www.urban.org/sites/default/files/publication/98687/
challenges_to_obtaining_manufactured_home_financing_0.pdf; Nick Bourke and Rachel Siegel, Protections for
Owners of Manufactured Homes Are Uncertain, Especially During Pandemic, Pew, September 11, 2020,
https://www.pewtrusts.org/en/research-and-analysis/articles/2020/09/11/protections-for-owners-of-manufactured-
homes-are-uncertain-especially-during-pandemic; and CFPB, Manufactured-Housing Consumer Finance in the United
States, September 2014, pp. 6 and 24, https://files.consumerfinance.gov/f/201409_cfpb_report_manufactured-
housing.pdf.
57 CFPB, Manufactured Housing Finance: New Insights from the Home Mortgage Disclosure Act Data, p. 48.
58 CFPB, Manufactured Housing Finance: New Insights from the Home Mortgage Disclosure Act Data, pp. 33-43; and
CFPB, Manufactured-Housing Consumer Finance in the United States, pp. 23-35.
59 The Title I program for manufactured homes is authorized at 12 U.S.C. §1703 and regulations are at 24 C.F.R. Part
201. For more information, see HUD’s website at https://www.hud.gov/program_offices/housing/sfh/title.
60 As of April 2021, HUD was currently insuring about 9,500 Title I manufactured home loans. See FHA, FHA Single
Family Production Report, April 2021 Credit Risk Report, p. 4, https://www.hud.gov/sites/dfiles/Housing/images/
FHAProdReport_Apr2021.pdf. For data on new Title I manufactured home loans insured in recent years, see FHA,
Annual Management Report Fiscal Year 2020, p. 14, https://www.hud.gov/sites/dfiles/Housing/documents/
FHAFY2020ANNUALMGMNTRPT.pdf.
61 For more information on Fannie Mae’s and Freddie Mac’s planned DTS activities related to manufactured housing,
and their progress on those activities, see FHFA’s Duty to Serve Quarterly and Annual Reports at
https://www.fhfa.gov/PolicyProgramsResearch/Programs/Pages/DTS-2020-Enterprise-Quarterly-and-Annual-
Reports.aspx.
62 See Freddie Mac’s draft Duty to Serve Underserved Markets Plan for 2022-2024, p. MH6, https://www.fhfa.gov/

An Overview of Rural Credit Markets
Congressional Research Service 12
Retail Banking and Alternative Credit
In the United States, robust consumer credit markets allow most consumers to access financial
services and credit products to meet their needs in traditional financial markets. However, some
consumers—including some who live in rural areas—can sometimes find it more difficult to get
their first bank accounts, establish a credit history, and gain access to affordable credit. Safe and
affordable financial services are an important tool for most American households to help them
avoid financial hardship and build assets over the course of their lives.63
While urban areas have a higher percentage of unbanked households, rural households were more
likely to be unbanked than suburban households (6.2% of rural households vs. 3.7% of suburban
households).64 For consumers living in rural areas, not having high-speed internet or living further
from bank branches may make it more difficult to access banking services. For example, online
and mobile banking has grown more popular in recent years. In 2019, over half of all households
accessed their bank accounts primarily through online or mobile banking.65 However, rural
consumers are less likely than other consumers to use online banking or use the internet to find
borrowing or savings information.66
Banking Deserts
Bank access may also have a geographic component, as some observers are concerned that
banking deserts—areas without bank branches nearby—exist in certain communities. For
example, a recent Federal Reserve study identified counties that were deeply affected by bank
branch closures, which it defined as counties that had 10 or fewer branches and lost at least 50%
of those branches from 2012 to 2017.67 The study identified 44 counties (out of a total of over
3,100 counties examined) that met that criteria, of which 39 are rural.
The degree to which banking deserts is a growing concern for American customers is up for
debate. For example, while the counties noted above were deeply affected by bank branch
closures, this represents just over 1% of counties in the United States. Further, as an alternative
method of measuring banking deserts, the Bank Policy Institute analyzed bank regulatory data to
PolicyProgramsResearch/Programs/Documents/FRE-2022-24-proposed-UMP.pdf; Fannie Mae’s draft Duty to Serve
Underserved Markets Plan for 2022-2024, p. 18, https://www.fhfa.gov/PolicyProgramsResearch/Programs/Documents/
FNM-2022-24-proposed-UMP.pdf; and FHFA, Annual Housing Report, January 1, 2019-December 31, 2019, October
30, 2020, p. 19, https://www.fhfa.gov/AboutUs/Reports/ReportDocuments/Annual-Housing-Report-2020.pdf.
63 For more background on disparities in access to financial products and services, see CRS Testimony TE10060, How
Invidious Discrimination Works and Hurts: An Examination of Lending Discrimination and Its Long-Term Economic
Impacts on Borrowers of Color, by Cheryl R. Cooper. For more background on financial inclusion and credit access
policy issues, see CRS Report R45979, Financial Inclusion and Credit Access Policy Issues, by Cheryl R. Cooper.
64 FDIC, How America Banks: Household Use of Banking and Financial Services, 2019 FDIC Survey, October 2020,
p. 2, https://www.fdic.gov/analysis/household-survey/2019report.pdf. The FDIC defines rural as households that do
not reside in a metropolitan statistical area, as defined by the Office of Management and Budget. For more background
on access to bank account policy issues, see CRS In Focus IF11631, Financial Inclusion: Access to Bank Accounts, by
Cheryl R. Cooper.
65 FDIC, How America Banks, p. 4.
66 Benson, Grundl, and Windle, How Do Rural and Urban Retail Banking Customers Differ?
67 The study notes that this definition omits “many areas of the country that struggle with access to financial services,
including many rural and tribal communities.” Federal Reserve, Perspectives from Main Street: Bank Branch Access in
Rural Communities, 2019, https://www.federalreserve.gov/publications/november-2019-bank-branch-access-in-rural-
communities.htm. A list of deeply affected counties is available at https://www.federalreserve.gov/publications/
november-2019-bank-branch-access-in-rural-communities-accessible.htm#xfigure1-countiesdeeplyaffectedbyban-
a0aa696d.

An Overview of Rural Credit Markets
Congressional Research Service 13
determine branch presence in low-income, low-to-moderate-income, and minority communities
in 2017 using census tracts, which provides a finer level of detail than county data.68 This study
found that the percentage of the population living in banking deserts declined slightly between
2010 and 2017, with a relatively larger decline among residents living in banking deserts in rural
tracts.
Branch offices are important to many consumers, even as mobile and online banking have
become more popular. For example, most banked households visit bank branches regularly, and
over a quarter of banked households visit 10 or more times in a year, as of 2019.69 Older and rural
households were more likely to visit bank branches than were other banked households.70
However, in the past decade, the number of bank branch offices has declined in the United States
due to many causes, such as bank consolidations and the rise of online banking.71 Some argue that
this has left some communities without any nearby bank branches, particularly in lower-income,
non-urban areas, making it more difficult to access quality banking services.72 In affected
communities, consumers are more likely to report increased costs and reduced convenience in
accessing financial services.73 Community banks and credit unions are often viewed as essential
to addressing banking deserts.74 Community banks in rural areas with depopulation trends might
find it more challenging to continue to operate profitably in the future, although strong
performance on agricultural loans has supported these banks in recent years.75 Also, it remains to
be seen whether the Coronavirus Disease 2019 (COVID-19) pandemic will have long-lasting
effects on the role of branches in banking access.
Another concern some have raised is the absence of large banks in rural areas. While large banks
are often characterized by a nationwide presence, CRS analyzed branch location data for the six
largest banks from S&P Global and found one branch (Wells Fargo, Madison County, FL) located
in any of the counties identified by the Fed as deeply affected. The location of the six banks’
branches and the deeply affected counties are shown in Figure 1.
68 Francisco Covas, Some Facts About Bank Branches and LMI Customers, Bank Policy Institute, April 4, 2019,
https://bpi.com/some-facts-about-bank-branches-and-lmi-customers/. The Bank Policy Institute uses Community
Reinvestment Act definitions for low-income, low-to-moderate-income, and minority.
69 FDIC, How America Banks, p. 23.
70 FDIC, How America Banks, p. 24.
71 For more information on bank consolidation trends, see CRS Report R46699, Banking Policy Issues in the 117th
Congress, coordinated by David W. Perkins; and CRS Insight IN11062, BB&T and SunTrust: The Latest Proposed
Merger in a Long-Term Trend of Banking Industry Consolidation, by David W. Perkins.
72 Drew Dahl and Michelle Franke, “Banking Deserts” Become a Concern as Branches Dry Up, Federal Reserve Bank
of St. Louis, July 25, 2017, https://www.stlouisfed.org/publications/regional-economist/second-quarter-2017/banking-
deserts-become-a-concern-as-branches-dry-up; Donald Morgan, Maxim Pinkovskiy, and Bryan Yang, Banking
Deserts, Branch Closings, and Soft Information, Federal Reserve Bank of New York, March 7, 2016,
https://libertystreeteconomics.newyorkfed.org/2016/03/banking-deserts-branch-closings-and-soft-information.html; and
Covas, Some Facts About Bank Branches and LMI Customers.
73 Board of Governors of the Federal Reserve System, Perspectives from Main Street: Bank Branch Access in Rural
Communities, p. 2.
74 For more information, see CRS In Focus IF11631, Financial Inclusion: Access to Bank Accounts, by Cheryl R.
Cooper.
75 Raslavich et al., FDIC Community Banking Study, p. 39.

An Overview of Rural Credit Markets
Congressional Research Service 14
Figure 1. Bank Branches of the Six Largest Banks in Affected Counties
Source: CRS analysis of Bank Policy Institute and Federal Reserve data.
Other Credit Issues Facing Rural Communities
In addition, rural households might find it more challenging than other U.S. populations to enter
the credit reporting system and develop credit records, making it more difficult for these
households to obtain affordable credit products.76 Credit invisibility, or not having a credit record
at the three nationwide credit reporting agencies, is higher in rural areas77 (about 15% in rural
areas versus about 11% in the U.S. population)78 and in areas where fewer households have high-
speed internet.79 In addition, credit-invisible consumers in rural areas are less likely to enter the
credit reporting system through a credit card than credit-invisible consumers in other parts of the
country.80 Possibly for these reasons, rural households were less likely to use bank credit (such as
76 For background on the credit reporting system, see CRS Report R44125, Consumer Credit Reporting, Credit
Bureaus, Credit Scoring, and Related Policy Issues, by Cheryl R. Cooper and Darryl E. Getter.
77 See Kenneth P. Brevoort et al., Data Point: The Geography of Credit Invisibility, CFPB, September 2018, pp. 10-11,
https://www.consumerfinance.gov/data-research/research-reports/data-point-geography-credit-invisibility/.
78 Brevoort et al., Data Point: The Geography of Credit Invisibility, p. 11; and Kenneth P. Brevoort, Philipp Grimm,
and Michelle Kambara, Data Point: Credit Invisibles, CFPB, May 2015, p. 6, http://files.consumerfinance.gov/f/
201505_cfpb_data-point-credit-invisibles.pdf.
79 The highest rates of credit invisibility for consumers over 25 years old are in rural areas, and these rates do not vary
much based on neighborhood income. See Brevoort et al., Data Point: The Geography of Credit Invisibility, pp. 11-12,
20.
80 Brevoort et al., Data Point: The Geography of Credit Invisibility, p. 13.
An Overview of Rural Credit Markets
Congressional Research Service 15
credit cards) and more likely to use nonbank credit products than were suburban and urban
households.81
Nonbank credit products that rural consumers are more likely to use include rent-to-own services,
payday loans, auto title loans, pawn shop loans, and tax refund anticipation loans.82 Households
may use these types of financial products and services outside of the banking system by choice or
due to a lack of understanding other financial options or lack of access to traditional institutions
and poor credit history. While products outside the banking sector may better suit some
households’ needs, many of these products are regulated at the state level and so might differ in
the level of consumer protections or other benefits that banks provide.83 Some argue that these
products are more expensive and are more likely than bank products to lead to debt traps.84 Bank
credit under certain circumstances may be less expensive for borrowers if, for example, they have
good credit histories. For other consumers, nonbank credit financial products might better serve
their needs due to fee structure or less stringent underwriting.85
Agricultural and Commercial Financial Services This section discusses lending to two general sectors of the rural economy: farming businesses
and nonfarm businesses. While these businesses have access to traditional forms of credit and
federal support, such as commercial lending or Small Business Administration (SBA) loans, the
discussion below focuses largely on federal programs specifically set up to support farms and
businesses in rural areas and mentions traditional programs for context where necessary.
Farm and Other Agricultural Lending Programs
Several types of lenders make loans to farmers. Some are government entities or have a statutory
mandate to serve agriculture, and others are private financial institutions such as commercial
banks and insurance companies.86
USDA Farm Service Agency (FSA)
The Farm Service Agency (FSA) is housed under USDA and makes direct farm ownership loans
and operating loans to family-sized farms that are unable to obtain credit elsewhere. FSA also
81 FDIC, How America Banks, pp. 9, 49-51.
82 FDIC, How America Banks, p. 8.
83 For example, small-dollar credit from banks and nonbanks demonstrates how products are potentially regulated
differently. For more, see CRS Report R44868, Short-Term, Small-Dollar Lending: Policy Issues and Implications, by
Darryl E. Getter.
84 Consumer groups often raise concerns regarding the affordability of small-dollar loans. Some borrowers may fall
into debt traps, situations where borrowers repeatedly roll over existing loans into new loans and find it difficult to
repay outstanding balances.
85 The extent to which borrowers’ financial situations would be helped or harmed by using expensive credit or having
limited access to credit is widely debated. Credit is an important way households pay for unexpected expenses and
compensate for emergencies, such as a car or home repair, a medical expense, or a pay cut. Research suggests that
access to this type of short-term credit can help households during short-term emergencies, yet unsustainable debt can
harm households. See CFPB, “Payday, Vehicle Title, and Certain High-Cost Installment Loans,” 84 Federal Register
4292-4294, February 14, 2019; and CFPB, “Payday, Vehicle Title, and Certain High-Cost Installment Loans,” 82
Federal Register 54842-54846, November 17, 2017.
86 For more information on agricultural lending, see CRS Report R46768, Agricultural Credit: Institutions and Issues,
by Jim Monke.

An Overview of Rural Credit Markets
Congressional Research Service 16
guarantees timely payment of principal and interest on qualified loans that are made by
commercial banks and the Farm Credit System (FCS). Farm bills have modified FSA’s
permanent authority in Title 7, Sections 1921 et seq., of the United States Code. At the end of
FY2019, FSA had a portfolio of $12 billion of direct loans to 87,000 borrowers and loan
guarantees of $16 billion for 39,000 borrowers.87 FSA direct loans are about 3% of the market for
farm debt, and loan guarantees cover about another 5% of the market.88
Farm Credit System and Farmer Mac
There are two GSEs in farm loan markets: the FCS and Farmer Mac. The Farm Credit
Administration, a federal agency, regulates the farm GSEs.89
Congress established the FCS in 1916 to provide a dependable and affordable source of credit to
rural areas at a time when commercial lenders avoided farm loans. At the end of FY2020, the
FCS had a total portfolio of $315 billion of loans, including over $190 billion of farm loans.90 The
FCS holds about 43% of total farm debt. The FCS is not a government agency, nor is it
guaranteed by the U.S. government; it is a network of over 70 borrower-owned lending
institutions operating as a GSE. It is a for-profit lender with a statutory mandate to serve
agriculture. Funds are raised through the sale of bonds in capital markets, and these funds are
used to make loans to eligible creditworthy borrowers.91 The FCS is unique among the GSEs
because it is a retail lender making loans directly to farmers and thus is in direct competition with
commercial banks. Because of this direct competition for creditworthy borrowers, the FCS and
commercial banks often have an adversarial relationship in the policy realm. Commercial banks
have asserted unfair competition from the FCS for borrowers because of tax advantages that can
lower the relative cost of funds from the FCS.92 The FCS counters by citing its statutory mandate
(and limitations) to serve agricultural borrowers in good times and bad times.93 Both the FCS and
commercial banks support FSA’s loan programs, as FSA offers guarantees that these lenders use
and tends to serve farmers who otherwise may not be able to obtain credit.
87 Direct farm ownership (real estate) loans are limited to $600,000 per borrower, direct operating loans to $400,000,
and microloans in each category to $50,000. Guaranteed loans may be up to $1,776,000 and are adjusted for inflation.
In addition, direct emergency loans are available for disasters. For more, see FSA, “Farm Loan Program,”
http://www.fsa.usda.gov/dafl; and FSA, “Farm Loan Programs Loan Servicing Data,” https://www.fsa.usda.gov/
programs-and-services/farm-loan-programs/program-data.
88 FSA is subject to appropriations. During FY2021, an appropriation of $68 million in budget authority (plus $307
million for salaries and expenses) is supporting $9.9 billion of new direct loans and guarantees. For more, see CRS
Report R45974, Agriculture and Related Agencies: FY2020 Appropriations; and USDA’s farm sector balance sheet at
https://www.ers.usda.gov/data-products/farm-income-and-wealth-statistics.
89 For more information, see CRS In Focus IF10767, Farm Credit Administration and Its Board Members, by Jim
Monke.
90 Federal Farm Credit Banks Funding Corporation, “2020 Annual Information Statement of the Farm Credit System,”
March 2021.
91 Statutes and oversight by the House and Senate Agriculture Committees determine the scope of FCS activity (Farm
Credit Act of 1971, as amended; 12 U.S.C. §§2001 et seq.). Benefits such as tax exemptions are also provided.
Eligibility is limited to farmers, certain farm-related agribusinesses, rural homeowners in towns under 2,500
population, and cooperatives. For more, see CRS Report RS21278, Farm Credit System, by Jim Monke.
92 For example, American Bankers Association, letter to House and Senate Agriculture Committees, February 2, 2015,
https://www.aba.com/-/media/documents/letters-to-congress-and-regulators/lettersenateagcommrefcs-
oversight020215.pdf?rev=8bf6631e18604164971ec9867e7c5516.
93 For example, Farm Credit Council, letter to House and Senate Agriculture Committees, February 5, 2015,
http://www.fccouncil.com/files/FCC_Letters_in_Response_to_ABA_5Feb2015.pdf.

An Overview of Rural Credit Markets
Congressional Research Service 17
Farmer Mac is a separate GSE that provides a secondary market for agricultural loans. It
purchases mortgages from private lenders as well as loans guaranteed by USDA and from lenders
organized as cooperatives to finance utilities in rural areas, and it guarantees mortgage-backed
securities that are bought by investors.94 Some consider it related to the FCS because the Farm
Credit Administration is its regulator and it was created by the same legislation, but it is
financially and organizationally a separate entity.
Composition of Farm Loans
Farm debt totaled around $432 billion at the end of 2020, around two-thirds of which is real estate
debt. As is seen in Figure 2, the FCS and commercial banks are the largest providers of farm debt
with 43% and 40%, respectively, of total farm debt outstanding, and the FCS’s share of farm debt
has been growing since the 1990s. The FCS is the largest lender for real estate loans (47%), and
commercial banks are the largest lender for non-real-estate loans (46%).
Figure 2. Market Shares, by Lender, of Total Farm Debt, 1960-2019
Source: CRS, using USDA Economic Research Service (ERS) year-end data, as of February 5, 2021.
Notes: Shares in the graph are for direct loans. Guarantees issued on other lenders’ loans are not shown. FSA
issued guarantees on about 5% of farm loans that are not shown separately but are included in the shares of
commercial banks and the Farm Credit System. ERS began publishing data on Farmer Mac in 2002.
Commercial Bank Lending to Farms
While the FCS has become increasingly important in recent years, Figure 2 shows that
commercial bank lending is an important source of credit for farms. Commercial lending to
agricultural borrowers can generally be broken into real estate and non-real-estate loans. Total
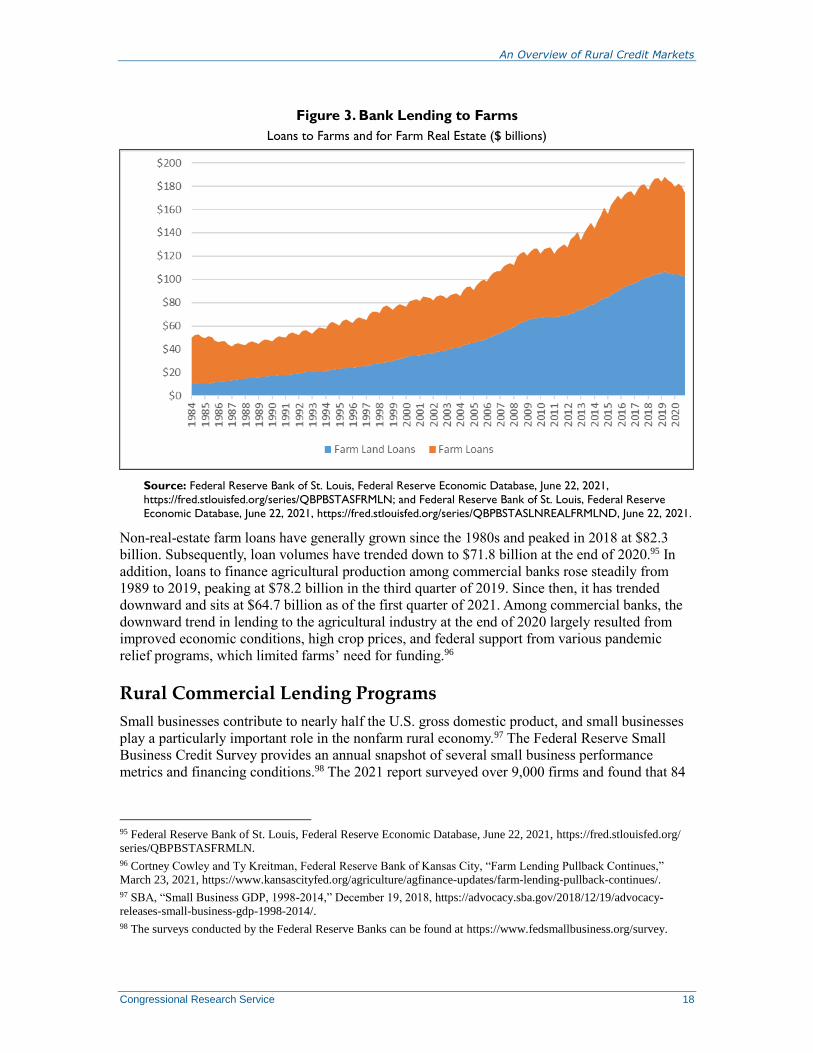
bank lending peaked at $187 billion at the end of 2018, as shown in Figure 3. At the end of 2020,
total farm lending by commercial banks totaled almost $175 billion, with roughly $103 billion
(59%) of that coming from farmland real estate loans.
94 For more information, see FCA, “About Farmer Mac,” https://www.fca.gov/farmer-mac-oversight/about-farmer-
mac; and CRS In Focus IF11595, Farmer Mac and Its Board Members, by Jim Monke.
An Overview of Rural Credit Markets
Congressional Research Service 18
Figure 3. Bank Lending to Farms
Loans to Farms and for Farm Real Estate ($ billions)
Source: Federal Reserve Bank of St. Louis, Federal Reserve Economic Database, June 22, 2021,
https://fred.stlouisfed.org/series/QBPBSTASFRMLN; and Federal Reserve Bank of St. Louis, Federal Reserve
Economic Database, June 22, 2021, https://fred.stlouisfed.org/series/QBPBSTASLNREALFRMLND, June 22, 2021.
Non-real-estate farm loans have generally grown since the 1980s and peaked in 2018 at $82.3
billion. Subsequently, loan volumes have trended down to $71.8 billion at the end of 2020.95 In
addition, loans to finance agricultural production among commercial banks rose steadily from
1989 to 2019, peaking at $78.2 billion in the third quarter of 2019. Since then, it has trended
downward and sits at $64.7 billion as of the first quarter of 2021. Among commercial banks, the
downward trend in lending to the agricultural industry at the end of 2020 largely resulted from
improved economic conditions, high crop prices, and federal support from various pandemic
relief programs, which limited farms’ need for funding.96
Rural Commercial Lending Programs
Small businesses contribute to nearly half the U.S. gross domestic product, and small businesses
play a particularly important role in the nonfarm rural economy.97 The Federal Reserve Small
Business Credit Survey provides an annual snapshot of several small business performance
metrics and financing conditions.98 The 2021 report surveyed over 9,000 firms and found that 84
95 Federal Reserve Bank of St. Louis, Federal Reserve Economic Database, June 22, 2021, https://fred.stlouisfed.org/
series/QBPBSTASFRMLN.
96 Cortney Cowley and Ty Kreitman, Federal Reserve Bank of Kansas City, “Farm Lending Pullback Continues,”
March 23, 2021, https://www.kansascityfed.org/agriculture/agfinance-updates/farm-lending-pullback-continues/.
97 SBA, “Small Business GDP, 1998-2014,” December 19, 2018, https://advocacy.sba.gov/2018/12/19/advocacy-
releases-small-business-gdp-1998-2014/.
98 The surveys conducted by the Federal Reserve Banks can be found at https://www.fedsmallbusiness.org/survey.

An Overview of Rural Credit Markets
Congressional Research Service 19
percent of employer firms are in urban areas.99 In 2017, the Federal Reserve banks that produce
the report published analysis specifically on businesses in rural areas, analyzing their financing
needs and condition.100 The survey found that, compared to small businesses in urban areas, rural
firms were:
older, more stable, and less likely to apply for financing;
less constrained by credit risk and financial challenges; and
more dependent on smaller banking institutions.
A 2019 report101 by the SBA on rural businesses stated that since 2000, growth in the number of
businesses in rural counties (7.2%) lagged metropolitan counties (30.9%). Further, most growth
in rural counties happened in a few western states, with the highest growth happening in New
Mexico, Oregon, Hawaii, Utah, and California. As noted earlier in this report, rural economies
can also be less economically diverse, which suggests they may be more vulnerable to local
economic shocks.
Federal programs set up to help small businesses, as well as other agencies set up to help
agricultural business, have specific programs in place that provide credit to businesses in rural
areas and are detailed below.
Small Business Administration Agricultural Programs
The SBA administers several types of programs to support small businesses in rural areas,
including loan guarantee and venture capital programs to enhance small business access to
capital; federal contracting programs to increase small business opportunities; direct loan
programs for businesses, homeowners, and renters to assist their recovery from natural disasters;
and small business management and technical assistance training programs to assist business
formation and expansion. Many of these programs are targeted toward agricultural businesses.
Historically, Congress prevented most agricultural businesses from accessing the SBA’s lending
and training programs as part of an effort to limit duplication of the agency’s activities with other
federal agencies.102 However, in 1976, Congress created an exception to this directive by allowing
the SBA to provide loans and training assistance to “agricultural enterprises.”103 Agricultural
enterprises are defined as “small business concerns” (meeting SBA’s size and other eligibility
99 Federal Reserve System, “Small Business Credit Survey: Report on Employer Firms,” 2021, p. 31,
https://www.fedsmallbusiness.org/medialibrary/FedSmallBusiness/files/2021/2021-sbcs-employer-firms-report.
100 Federal Reserve Bank of Richmond, “Report on Rural Employer Firms,” December 2017,
https://www.richmondfed.org/-/media/richmondfedorg/community_development/resource_centers/small_business/pdf/
credit_survey/sbcs_report_rural_employer_firms_2016.pdf.
101 Daniel Wilmoth, “Small Business Facts: Growth in Number of Rural Establishments,” December 2019,
https://cdn.advocacy.sba.gov/wp-content/uploads/2020/02/04111621/Rural-Business-Growth-Fact-Sheet1.pdf.
102 These provisions are contained within 15 U.S.C. §647.
103 See P.L. 94-305, An Act to amend the Small Business Act and Small Business Investment Act of 1958; and 15
U.S.C. §647(b).
An Overview of Rural Credit Markets
Congressional Research Service 20
standards104) that are engaged in the production of food and fiber, ranching, raising of livestock,
aquaculture, and all other farming and agricultural-related industries.105
The SBA’s ability to provide disaster loans to agricultural businesses is limited to small
agricultural cooperatives, small nurseries affected by a drought disaster declared by the Secretary
of Agriculture, and small aquaculture businesses. Also, the SBA’s ability to provide business
loans to agricultural businesses is generally limited to “agricultural enterprises” that are unable to
secure financing on reasonable terms elsewhere.106 As discussed in the text box below, Congress
expressly authorized the SBA to provide financial assistance to a broader range of agricultural
businesses for the SBA’s Paycheck Protection Program and Economic Injury Disaster Loan
program during the COVID-19 pandemic.
Given that USDA and the SBA both offer programs and services to agricultural businesses, the
two agencies have, from time to time, entered into memoranda of understanding to facilitate inter-
agency cooperation. For example, in 2018, USDA and the SBA signed a memorandum of
understanding to convene interagency working groups to address capital access and investment in
rural America and ways to assist rural businesses.107
104 See CRS Report R40860, Small Business Size Standards: A Historical Analysis of Contemporary Issues, by Robert
Jay Dilger.
Of note, P.L. 99-272, the Consolidated Omnibus Budget Reconciliation Act of 1985 (Title XVIII—Small Business
Programs), made it easier for agricultural enterprises to be considered small by specifying that all agricultural industries
would be considered small if they had no more than $500,000 in average annual gross receipts over the previous three
years. In 2000, P.L. 106-554, the Consolidated Appropriations Act, 2001 (Appendix I—the Small Business
Reauthorization Act of 2000), increased that threshold to no more than $750,000 in average annual gross receipts. In
2016, P.L. 114-328, the National Defense Authorization Act for Fiscal Year 2017, directed the SBA to establish size
standards for agricultural enterprises in the same manner as other industries and include them in the required five-year
rolling review process mandated by P.L. 111-240, the Small Business Jobs Act of 2010. In 2019, the SBA increased the
size standard threshold for most agricultural enterprises to no more than $1 million in average annual receipts to
account for inflation. See SBA, “Small Business Size Standards: Adjustment of Monetary-Based Size Standards for
Inflation,” 84 Federal Register 34261-34281, July 18, 2019. The SBA has proposed increasing these thresholds further;
see SBA, “Small Business Size Standards: Agriculture, Forestry, Fishing and Hunting; Mining, Quarrying, and Oil and
Gas Extraction; Utilities; Construction,” 85 Federal Register 62239-62266, October 2, 2020.
105 P.L. 94-305 (“An Act to amend the Small Business Act and Small Business Investment Act of 1958 to provide
additional assistance under such Acts, to create a pollution control financing program for small business, and for other
purposes”). Additionally, Congress specified in conference report language that these agricultural businesses should
continue to utilize USDA’s programs and services, but if “satisfactory financial assistance is not available” there,
agricultural small businesses “shall not be excluded” from seeking SBA business loans and training assistance. See
U.S. Congress, House Committee of Conference, Small Business Act and Small Business Investment Act, conference
report to accompany S. 2498, 94th Cong., 2nd sess., May 10, 1976, H.Rept. 94-1115 (Washington: GPO, 1976), p. 14.
106 Also known as the “credit unavailable elsewhere” requirement, this provision requires the SBA to direct and
conduct oversight of the methods used by lenders to determine whether a borrower is able to obtain credit elsewhere on
reasonable terms. See 15 U.S.C. §636(a)(1)(A)(i). The SBA currently requires lenders to identify, discuss, and retain in
each credit file the specific credit weaknesses that substantiate this requirement. See SBA, “7(a) Loan Program
Clarification—Credit Unavailable Elsewhere Requirement,” SBA Information Notice, 5000-1376, March 25, 2016,
https://www.sba.gov/document/information-notice-5000-1376-7a-loan-program-clarification-credit-unavailable-
elsewhere-requirement.
107 USDA and SBA, Memorandum of Understanding Relative to Cooperation and Coordination on Obligations of
Shared Concern, April 4, 2018, https://www.usda.gov/sites/default/files/documents/usda-sba-mou.pdf.

An Overview of Rural Credit Markets
Congressional Research Service 21
SBA Paycheck Protection Program108
The Coronavirus Aid, Relief, and Economic Security Act (CARES Act; P.L. 116-136) provided $349 billion for a
new, SBA Paycheck Protection Program (PPP). The American Rescue Plan Act of 2021 (P.L. 117-2), among other
provisions, increased the PPP authorization amount to $813.7 billion and provided $53.6 billion for SBA program
enhancements. The PPP Extension Act of 2021 (P.L. 117-6) extended the acceptance of PPP applications through
May 31, 2021, and authorized the SBA to process any pending applications submitted on or before that date
through June 30, 2021. These loans were provided by private lenders approved by the SBA for businesses affected
by COVID-19. These loans are 100% guaranteed by the SBA, have a maximum term of either two or five years
depending on when the loan was issued, carry a 1% interest rate, and are forgivable if the borrower uses the loan
proceeds for eligible expenses (e.g., payroll, business rent, mortgage obligations, or utilities) and meets other
criteria (e.g., wage and employment retention).109
PPP loans were available to any business that meets general loan eligibility criteria (e.g., criteria related to the
applicant’s criminal history, current exclusion from participation in federal programs, bankruptcy status,
certification that the proceeds are needed due to current economic uncertainty to support ongoing operations)
and meets the SBA’s small business size standards. In addition, any business and certain nonprofit organizations,
such as 501(c)(3) nonprofit organizations and 501(c)(19) veterans organizations, were also generally eligible if they
have (1) 500 or fewer employees or (2) meet the SBA’s size standard if more than 500 employees are eligible.
SBA PPP guidance notes that, in addition to having 500 or fewer employees, agricultural producers, farmers, and
ranchers were eligible for the PPP if the business fits within its revenue-based industry size standard, which, for
most agricultural enterprises, is average annual receipts of no more than $1 million.110 Additionally, they could
qualify for PPP loans if their businesses meet SBA’s “alternative size standard,” which is currently (1) maximum net
worth of not more than $15 million and (2) the business’s average net income after federal income taxes
(excluding any carry-over losses) for the two full fiscal years before the date of the application is not more than $5
million.111
As of May 31, 2021, firms in agriculture, forestry, fishing, and hunting have received 523,884 PPP loans totaling
over $10.0 billion, or about 4.5% of the total number of PPP loans approved (over 11.1 million loans) and about
1.2% of the total amount (nearly $800 billion) that has been approved.112
SBA Disaster Loan Program113
The SBA administers several types of loans through its Disaster Loan Program to help businesses,
private nonprofit organizations, and households recover from federally certified disasters. The
108 For additional information and analysis of the Paycheck Protection Program, see CRS Report R46284, COVID-19
Relief Assistance to Small Businesses: Issues and Policy Options, by Robert Jay Dilger, Bruce R. Lindsay, and Sean
Lowry.
109 PPP loans issued prior to June 5, 2020, have a maturity of two years. Loans issued after June 5, 2020, have a
maturity of five years.
110 PPP loan amounts issued in 2020 were based on farmers’ net income after deductions and expenses. Because of the
amount of depreciation farmers claim on equipment, this amount was either negative or relatively low for many
farmers. P.L. 116-260, the Consolidated Appropriations Act, 2021 (Title III—Economic Aid to Hard-Hit Small
Businesses, Nonprofits, and Venues Act), allowed farmers that report income or expenses on a Schedule F or
equivalent successor schedule to use gross income instead of net profit when calculating 2021 PPP loan amounts.
111 See SBA, “Paycheck Protection Program Loans: Frequently Asked Questions (FAQs),” April 6, 2021,
https://www.sba.gov/document/support-faq-ppp-borrowers-lenders.
The SBA’s alternative size standard was created by P.L. 111-240, the Small Business Jobs Act, and remains in force
until the SBA adopts a different alternative size standard. The SBA has announced that it anticipates that it will propose
an alternative size standard later in 2021. See SBA, “Semiannual Regulatory Agenda,” 86 Federal Register 16973,
March 31, 2021.
112 SBA, “Paycheck Protection Program (PPP) Report: Approvals through May 31, 2021,” https://www.sba.gov/
document/report-paycheck-protection-program-weekly-reports-2021.
113 For additional information and analysis of the SBA Disaster Loan Program, see CRS Report R44412, SBA Disaster
Loan Program: Frequently Asked Questions, by Bruce R. Lindsay.

An Overview of Rural Credit Markets
Congressional Research Service 22
SBA’s Disaster Loan Program includes Economic Injury Disaster Loans (EIDLs) which provide
up to $2 million for working capital expenses (including fixed debts, payroll, accounts payable,
and other bills) that cannot be met as a direct result of the disaster.
SBA Disaster Loans and the COVID-19 Pandemic
P.L. 116-123, the Coronavirus Preparedness and Response Supplemental Appropriations Act, 2020, among other
provisions, made economic injury from COVID-19 an eligible EIDL expense.
As mentioned, agricultural enterprises (other than agricultural cooperatives, aquaculture enterprises, and eligible
nurseries) have not been eligible for SBA disaster assistance since 1985. The CARES Act, however, expanded
COVID-19-related SBA EIDL eligibility to include businesses with 500 or fewer employees, sole proprietorships
(with or without employees), independent contractors, cooperatives, employee-owned businesses, tribal
businesses, and agricultural enterprises with 500 or fewer employees.114 The CARES Act does not supplant the Small Business Act’s prohibition on the duplication of programs and services offered by other federal agencies.
Rather, the CARES Act expanded eligibility to include agricultural enterprises with 500 or fewer employees for
COVID-19-related EIDLs. These businesses remain ineligible for EIDL assistance for other federally declared
disasters (such as hurricanes or wildfires).
SBA COVID-19 EIDLs have loan terms of up to 30 years with 3.75% interest for small businesses and 2.75%
interest for private nonprofit organizations. Due to unprecedented demand, the SBA lowered the maximum
COVID-19 EIDL loan amount from $2 million to $500,000 on March 16, 2020; lowered it further to six months of
economic injury up to $150,000 on May 3, 2020; and increased it to 24 months of economic injury up to $500,000
on April 6, 2021.115
As of April 29, 2021, SBA has approved 118,979 EIDL applications for $6.9 billion for the industries of
“agriculture, forestry, fishing and hunting.”116 In addition to expanding eligibility, the CARES Act included loan
deferrals and established an “Emergency EIDL Grant program” (also referred to as an “EIDL advance”) to provide
applicants with advance payments of up to $10,000.117 The advance payment did not have to be repaid, even if the
borrower was later denied the EIDL. Due to high demand, the SBA limited the advance to $1,000 per employee,
up to the statutory cap of $10,000.118 The Emergency EIDL grant could be used to keep employees on payroll; pay
for sick leave; meet increased production costs due to supply chain disruptions; or pay business obligations,
including debts, rent, and mortgage payments.119
114 EIDL eligibility includes small agricultural cooperatives, small aquaculture businesses, and nurseries deriving more
than 50% of their annual receipts from the production of nursery or other agricultural products. For more information,
see CRS Insight IN11357, COVID-19-Related Loan Assistance for Agricultural Enterprises, by Robert Jay Dilger,
Bruce R. Lindsay, and Sean Lowry.
115 SBA, Office of Inspector General, “Inspection of Small Business Administration’s Initial Disaster Assistance
Response to the Coronavirus Pandemic,” October 28, 2020, https://www.sba.gov/document/report-21-02-inspection-
small-business-administrations-initial-disaster-assistance-response-coronavirus-pandemic; and SBA, “SBA to Increase
Lending Limit for COVID-19 Economic Injury Disaster Loans,” March 24, 2021, https://www.sba.gov/article/2021/
mar/24/sba-increase-lending-limit-covid-19-economic-injury-disaster-loans.
116 Based on email provided on April 29, 2021, by SBA Office of Congressional and Legislative Affairs.
117 The SBA stopped accepting COVID-19-related EIDL and Emergency EIDL Advance Payment grant applications on
April 15, 2021, because the SBA was approaching its disaster loan assistance credit subsidy limit.
118 For an overview of the SBA EIDL Emergency Grants, see CRS Insight IN11370, SBA EIDL and Emergency EIDL
Grants for COVID-19, by Bruce R. Lindsay. For data on SBA EIDL Emergency Grants, see CRS Insight IN11379,
SBA EIDL and Emergency EIDL Grants: Data by State, by Bruce R. Lindsay and Maura Mullins.
119 The American Rescue Plan Act of 2021 (P.L. 117-2) established a “Targeted EIDL Advance.” The Targeted EIDL
Advance is a payment of the difference between the amount the small business received and the $10,000 maximum.
Eligible businesses that received previous advances in amounts less than $10,000 are prioritized for the Targeted EIDL
Advance. Second priority entities are those that applied for EIDL advances before December 27, 2020, but did not
receive them because funding was exhausted in mid-July 2020. Eligible businesses must be located in low-income
communities as defined by Section 45D(e) of the Internal Revenue Code; suffered greater than 30 percent economic
loss over an eight-week period since March 2, 2020, compared to the previous year; and have 300 or fewer employees.
Most agricultural enterprises, however, are not eligible for the Targeted EIDL Advance. Rather, the Targeted EIDL
Advance is limited to aquaculture businesses, agricultural cooperatives, and retail nurseries. See SBA, FAQ Regarding
Targeted EIDL Advance, April 27, 2021, p. 7, https://www.sba.gov/document/support-faq-regarding-targeted-eidl-

An Overview of Rural Credit Markets
Congressional Research Service 23
USDA Rural Business Support
USDA’s Rural Business-Cooperative Service (RBCS) administers a number of programs that
provide financing or technical assistance to businesses in eligible rural areas, including direct loan
or loan guarantee programs, grant programs, technical assistance programs, and a venture capital
program. Congress reauthorizes these programs in periodic farm bills, most recently in the 2018
farm bill (P.L. 115-334). Eligible rural areas vary by program, but for all programs discussed
below, an eligible rural area is an area with a population of 50,000 or fewer inhabitants and not
contiguous to an urbanized area with a population of greater than 50,000. Some RBCS programs
provide support similar to SBA programs. However, RBCS targets its assistance specifically to
businesses in rural areas, in part because small businesses in rural areas that are in need of credit
can face difficulty competing for loans, including SBA assistance, with small businesses in
suburban or urban areas. This is due to a number of factors, including fewer customers spread
across larger geographic areas, and other rural financial characteristics mentioned earlier in this
report (see “Rural Economic and Financial Overview”). Selected RBCS credit and venture capital
programs are described below.
Business and Industry Loan Guarantee Program
The Business and Industry Loan Guarantee Program guarantees loans made by private lenders to
eligible entities to support business formation or expansion in rural areas.120 Eligible lenders
include federal- and state-chartered banks, credit unions, savings and loan associations, and Farm
Credit institutions. Eligible loan borrowers include Indian tribes, public entities, individuals, and
for-profit or nonprofit entities, including corporations and cooperatives. Program regulations set
the maximum guarantee at 90% of the eligible guaranteed loan loss, but RBCS typically sets a
maximum guarantee of 80% in annual Federal Register notices.121 The maximum loan amount
eligible for a guarantee is $25 million, with limited exceptions for loans for agricultural
processing. Interest rates are negotiated between the lender and borrower, and the maximum loan
term is 40 years.122
advance.
120 For additional information, see RBCS, “Business and Industry Loan Guarantees,” https://www.rd.usda.gov/
programs-services/business-industry-loan-guarantees.
121 See USDA, “OneRD Annual Notice of Guarantee Fee Rates, Periodic Retention Fee Rates, Loan Guarantee
Percentage and Fee for Issuance of the Loan Note Guarantee Prior to Construction Completion for Fiscal Year 2022,”
86 Federal Register 35262, July 2, 2021, https://www.federalregister.gov/documents/2021/07/02/2021-14193/onerd-
annual-notice-of-guarantee-fee-rates-periodic-retention-fee-rates-loan-guarantee-percentage.
122 7 C.F.R. §5001.

An Overview of Rural Credit Markets
Congressional Research Service 24
Recent Funding for Business and Industry Loan Guarantee Program
Congress funds the Business and Industry Loan Guarantee Program in annual Agriculture appropriations acts.
Congress provided authority to guarantee up to $1.3 billion in loans per year in FY2020 and FY2021. In March
2020, Congress included supplemental funding to support $1 billion in Business and Industry Loan Guarantees in
the CARES Act (P.L. 116-136). This funding was to remain available until September 15, 2021, or until fully
obligated, whichever came first. RBCS established separate requirements for the CARES Act loan guarantees,
which are similar to the traditional loan guarantees but differ in a few ways. The CARES Act loan guarantees may
be used only for working capital to prevent, prepare for, or respond to the effects of the COVID-19 pandemic.
The maximum loan guarantee is 90% of the eligible guaranteed loan loss, and the maximum loan term is 10
years.123 In its FY2022 budget request, the Biden Administration proposed an additional $500 million in budget
authority for the program.124 Congress has not adopted this proposal to date.
Rural Business Investment Program
The Rural Business Investment Program (RBIP) authorizes the creation of Rural Business
Investment Companies (RBICs) to increase access to capital for smaller enterprises125 in rural
areas.126 RBICs authorized under the program are essentially rural venture capital funds
comprised of at least $5 million in private equity capital. The RBIP may establish leveraged
RBICs—RBICs created with the support of federal capital—or non-leveraged RBICs—RBICs
created without the support of federal capital.127 A leveraged RBIC raises private capital and then
requests federal capital from USDA to supplement (leverage) that private capital. USDA provides
federal capital to the RBIC in the form of guaranteeing debentures the RBIC issues.128 When the
RBIC makes profits on its investments, it repays the federal capital to USDA.
Eligible applicants for the RBIP include newly formed for-profit entities or newly formed
subsidiaries of for-profit entities. The applicant must have private capital of at least $5 million,
and the management team must have experience in community development financing or venture
capital financing.129 Once approved and licensed as an RBIC, the entity must invest at least 75%
of its funds in rural areas with a population of 50,000 or fewer and at least 50% of its funds in
smaller enterprises. An RBIC may make up to 10% of its investments in urban areas with a
123 For additional information, see RBCS, “Business and Industry CARES Act Program,” https://www.rd.usda.gov/
programs-services/business-and-industry-cares-act-program.
124 USDA, “2022 USDA Explanatory Notes—Rural Business-Cooperative Service,” p. 13, https://www.usda.gov/sites/
default/files/documents/32RBS2022Notes.pdf.
125 A smaller enterprise is defined as an enterprise with a net financial value of not more than $6 million in net worth
with annual revenue of not more than $2 million. See 7 U.S.C. §2009cc(15).
126 For additional information, see RBCS, “Rural Business Investment Program,” https://www.rd.usda.gov/programs-
services/rural-business-investment-program.
127 Many banks view non-leveraged RBICs as means to obtain higher returns on their investments than banks could
obtain from traditional loans, because investments in RBICs are exempt from federal regulations that restrict banks’
direct investments in private companies. Therefore, some venture capitalists form non-leveraged RBICs to increase
their likelihood of obtaining investments from these banks.
128 RBCS defines debenture for the purposes of the RBIP as “a debt obligation issued by RBICs … and held or
guaranteed by the Agency.” The RBIP limits the maximum amount of leverage for an RBIC to the lesser of 200% of
the RBIC’s leverageable capital or $105 million. See 7 C.F.R. §4290.1150. Leverageable capital is defined as private
capital excluding non-cash assets and unfunded commitments. See 7 C.F.R. §4290.50.
129 7 U.S.C. §2009cc-3 and §2009cc-8. Statute authorizes USDA to approve an application if the applicant has private
capital of more than $2.5 million but provides a viable business plan with a reasonable timetable for achieving private
capital of $5 million.

An Overview of Rural Credit Markets
Congressional Research Service 25
population of 150,000 or greater. The RBIP also authorizes USDA to make grants to RBICs or
other entities to provide operational assistance to smaller enterprises financed by an RBIC.130
Congress first established the RBIP in the Farm Security and Rural Investment Act of 2002 (P.L.
107-171, §6029), which provided mandatory funding of “such sums as necessary” for the cost of
guaranteeing $280 million in debentures and mandatory funding of $44 million for program
grants. Mandatory funding was to remain available until expended. In the Consolidated
Appropriations Act, 2005 (P.L. 108-447, Division A, Title VII, §753), Congress provided $10
million in discretionary appropriations for the RBIP. However, the Deficit Reduction Act of 2005
(P.L. 109-171) terminated the authorization of funding for RBIP starting in FY2007 and rescinded
any unobligated prior year funds. Subsequent farm bills have reauthorized the program, most
recently the 2018 farm bill, which also authorized discretionary funding of $20 million per year
for FY2019-FY2023. However, Congress has not appropriated funding for leveraging RBICs or
for program grants since FY2005. RBCS established one leveraged RBIC under the RBIP prior to
the rescission of program funds. Since then, RBCS has certified nine non-leveraged RBICs.131
Revolving Loan Fund Programs
RBCS administers multiple programs that allow loan borrowers to establish revolving loan funds
(RLFs) to provide assistance to small businesses in rural areas. Under these programs, RBCS
makes a loan to an intermediary, which uses the loan funds to establish an RLF. The intermediary
uses the RLF to make loans to small businesses or other ultimate recipients for business
formation and expansion or economic development projects in rural areas. As the ultimate
recipients repay their loans, the intermediary uses the funds from these repayments to make new
loans (i.e., revolves the funds). The three RBCS RLF programs are summarized below.
Intermediary Relending Program. RBCS makes loans at 1% interest to local
intermediaries, which establish RLFs.132 Eligible intermediaries include nonprofit
organizations, federally recognized tribes, cooperatives, and public agencies.
Eligible ultimate recipients include public or private organizations or individuals.
Ultimate recipients may use loans for a variety of business formation and
expansion costs—including for land, facilities, or equipment—start-up costs, and
feasibility studies. RBCS may loan an intermediary up to $2 million initially and
up to $1 million at a time thereafter, but the intermediary’s total aggregate debt to
RBCS may not exceed $15 million. Intermediaries may loan ultimate recipients
the lesser of $250,000 or 75% of the project cost.
Rural Economic Development Loan and Grant Program. RBCS makes loans
at 0% interest133 to local utilities, which then establish RLFs.134 Eligible
intermediaries include current and former borrowers of USDA rural electric and
130 7 U.S.C. §2009cc-7 and §2009cc-8.
131 For a list of certified RBICs, see USDA, “Rural Business Incorporated Company (RBIC) Program: List of Fully
Certified RBICs,” https://www.rd.usda.gov/sites/default/files/USDA_RD_CertifiedRBICs.pdf.
132 For additional information, see RBCS, “Intermediary Relending Program,” https://www.rd.usda.gov/programs-
services/intermediary-relending-program.
133 RBCS refers to these loans as grants that must be repaid to RBCS when the RLF is terminated. Because the term
grant typically refers to an award that does not require repayment, these awards are referred to as 0% interest loans in
this section for clarity. See 7 C.F.R. §4280.3 and RBCS, “Rural Economic Development Loan and Grant Program,”
https://www.rd.usda.gov/programs-services/rural-economic-development-loan-grant-program.
134 For additional information, see RBCS, “Rural Economic Development Loan and Grant Program,”
https://www.rd.usda.gov/programs-services/rural-economic-development-loan-grant-program.

An Overview of Rural Credit Markets
Congressional Research Service 26
telecommunications loans. Eligible ultimate recipients include public bodies and
other nonprofit entities and certain for-profit entities. Ultimate recipients may use
loans for economic development projects, including business incubators,
feasibility studies, facilities and equipment to provide medical care, and facilities
and equipment to provide education or training to local entities on economic
development. RBCS sets the maximum loan amount for loans to intermediaries
annually. The maximum loan amount for FY2021 was $300,000.135 Statute and
program regulations do not specify maximum loan amounts from the
intermediary to the ultimate recipients. Intermediaries and ultimate recipients
must provide matching funds equal to 20% of the loan amount and project cost,
respectively. This program also authorizes intermediaries to make pass-through
loans to ultimate recipients rather than establishing RLFs.
Rural Microentrepreneur Assistance Program. RBCS makes loans to
intermediaries, which establish RLFs.136 Loans from RBCS to the intermediary
have an interest rate of 1%-2%, depending on how long the intermediary has
participated in the program. Eligible intermediaries include Indian tribes,
nonprofit entities, and public institutions of higher education. Eligible ultimate
recipients include businesses located in rural areas and having 10 or fewer full-
time equivalent employees. Ultimate recipients may use loans for business
expenses including working capital, debt refinancing, purchasing equipment and
supplies, and improving real estate. The maximum loan amount from RBCS to
the intermediary is $500,000. RBCS may make multiple loans to the same
intermediary, but the intermediary’s total aggregate debt to RBCS may not
exceed $2.5 million. Intermediaries may loan ultimate recipients the lesser of
$50,000 or 75% of the project cost. The program also authorizes RBCS to make
grants of up to $205,000 to intermediaries to provide technical assistance to small
businesses in rural areas.
Credit in Native American Communities Many Native American communities in the United States, such as the American Indian and
Alaskan Native populations, are located in rural areas and face many of the same issues with
access to financial services as discussed above. This section provides an overview of the issues
and programs specifically impacting Native American communities, which have historically had
among the highest poverty rates in the nation,137 particularly on tribal reservations or trust land—
much of it rural. American Indians and Alaska Natives living in tribal areas also experience
higher rates of physically substandard or overcrowded housing than does the population as a
whole.138 In addition, various factors present challenges for mortgage lending in tribal areas,
135 RBCS, “Notice of Solicitation of Applications for Inviting Applications for the Rural Economic Development Loan
and Grant Programs for Fiscal Year 2021,” 85 Federal Register 57816, https://www.federalregister.gov/documents/
2020/09/15/2020-20251/notice-of-solicitation-of-applications-for-inviting-applications-for-the-rural-economic-
development.
136 For additional information, see RBCS, “Rural Microentrepreneur Assistance Program,” https://www.rd.usda.gov/
programs-services/rural-microentrepreneur-assistance-program.
137 Northwestern University, What Drives Native American Poverty?, Institute for Policy Research, February 24, 2020,
https://www.ipr.northwestern.edu/news/2020/redbird-what-drives-native-american-poverty.html.
138 Nancy Pindus et al., Housing Needs of American Indians and Alaska Natives in Tribal Areas, prepared for HUD,
January 2017, pp. xviii-xxii, https://www.huduser.gov/portal/sites/default/files/pdf/HNAIHousingNeeds.pdf.

An Overview of Rural Credit Markets
Congressional Research Service 27
including the legal status of trust land.139 More broadly, credit access and financial literacy, which
can promote individual economic opportunity and drive economic development in communities,
are broadly underdeveloped in Native American communities.
The lack of access to capital and credit is a major constraint on economic development in Native
American communities. A 2015 study of Indian consumer credit, consistent with preceding
literature, showed lower credit access and penetration and that credit files within Indian
reservations are more likely to lack credit risk scores.140 In particular, the study found that the use
of credit, especially mortgages, is low on reservations. However, the authors also found that
certain other forms of credit, particularly auto loans, are somewhat more prevalent and that there
was significant variation across different tribal lands.
A 2016 University of Arizona report commissioned by the Department of the Treasury’s
Community Development Financial Institutions Fund (CDFI Fund)141 examined credit access in
tribal communities.142 An earlier 2001 report had shown that Native lands are “not generally
served by a variety of financial institutions,” which perpetuates and exacerbates challenges with
capital access and economic development.143 The 2016 report, however, highlighted the
improving banking landscape based on the growth of Native Community Development Financial
Institutions (which Treasury calls Native CDFIs),144 which provide a variety of credit and
financial services to tribal citizens. The report suggested that the proliferation of Native CDFIs is
in part attributable to increased self-determination and autonomy among tribal governments.145
But the report also noted that numerous challenges, including Native CDFI capitalization and
data-driven performance management, remain major impediments to credit access on Indian
lands.
The Federal Reserve Bank of Minneapolis’s Center for Indian Country Development maintains a
data visualization tool that maps the headquarter locations and asset sizes of banks and credit
unions owned by, and CDFIs primarily serving, American Indian, Alaska Native, and Native
Hawaiian individuals and communities (see Figure 4).
139 David Listokin et al., Mortgage Lending on Tribal Land, prepared for HUD, January 2017,
https://www.huduser.gov/portal/sites/default/files/pdf/NAHSG-Lending.pdf.
140 Valentina Dimitrova-Grajzl et al., “Consumer Credit on American Indian Reservations,” Economic Systems, vol. 39,
no. 3 (September 2015), pp. 518-540.
141 For more information on the CDFI Fund, see CRS Report R42770, Community Development Financial Institutions
(CDFI) Fund: Programs and Policy Issues, by Sean Lowry.
142 Miriam Jorgensen, Access to Capital and Credit in Native Communities, Native Nations Institute, University of
Arizona, 2016, http://nni.arizona.edu/application/files/6315/2822/4505/
Accessing_Capital_and_Credit_in_Native_Communities.pdf.
143 CDFI Fund, The Report of the Native American Lending Study, November 2001, https://www.cdfifund.gov/sites/
cdfi/files/documents/2001_nacta_lending_study.pdf.
144 According to the 2016 report, a CDFI provides credit and financial services to underserved markets. The Treasury
Department defines a Native CDFI as a CDFI that focuses at least 50 percent of its business activities on American
Indians, Alaska Natives, or Native Hawaiians.
145 For more information on trends in federal-tribal relations, see CRS Report R46647, Tribal Land and Ownership
Statuses: Overview and Selected Issues for Congress, by Tana Fitzpatrick.
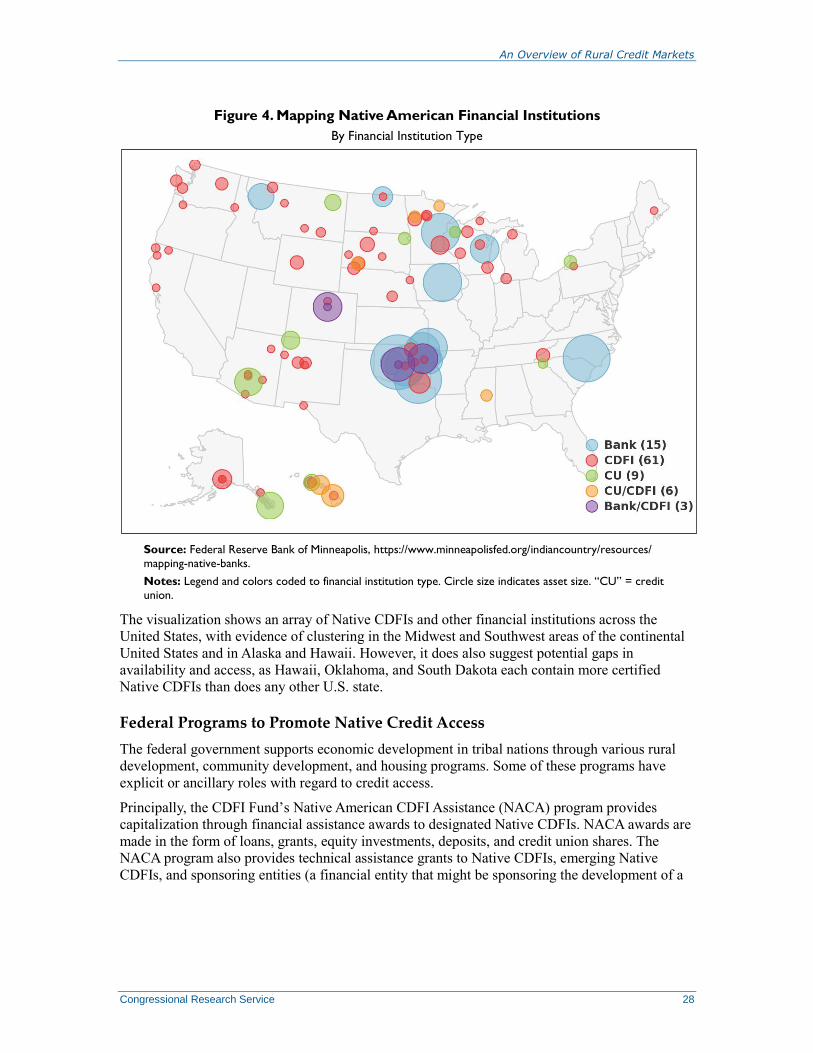
An Overview of Rural Credit Markets
Congressional Research Service 28
Figure 4. Mapping Native American Financial Institutions
By Financial Institution Type
Source: Federal Reserve Bank of Minneapolis, https://www.minneapolisfed.org/indiancountry/resources/
mapping-native-banks.
Notes: Legend and colors coded to financial institution type. Circle size indicates asset size. “CU” = credit
union.
The visualization shows an array of Native CDFIs and other financial institutions across the
United States, with evidence of clustering in the Midwest and Southwest areas of the continental
United States and in Alaska and Hawaii. However, it does also suggest potential gaps in
availability and access, as Hawaii, Oklahoma, and South Dakota each contain more certified
Native CDFIs than does any other U.S. state.
Federal Programs to Promote Native Credit Access
The federal government supports economic development in tribal nations through various rural
development, community development, and housing programs. Some of these programs have
explicit or ancillary roles with regard to credit access.
Principally, the CDFI Fund’s Native American CDFI Assistance (NACA) program provides
capitalization through financial assistance awards to designated Native CDFIs. NACA awards are
made in the form of loans, grants, equity investments, deposits, and credit union shares. The
NACA program also provides technical assistance grants to Native CDFIs, emerging Native
CDFIs, and sponsoring entities (a financial entity that might be sponsoring the development of a

An Overview of Rural Credit Markets
Congressional Research Service 29
Native CDFI) to increase the capacity of these institutions to serve Native American
communities.146
USDA’s Rural Development (USDA-RD) agency offers a wide variety of both targeted and
broad-based programs to facilitate community and economic development in primarily rural tribal
areas.147 These programs include funding for community facilities, business and industry loan
guarantees, broadband deployment, and provision of basic infrastructure, among others. A
number of these programs have relevance to credit access, including a number of loan and loan
guarantee, technical assistance, and housing programs. For example, USDA-RD’s Intermediary
Relending Program provides low-interest loans to local lenders to re-lend to businesses to support
local economic development.148
Case Study: 502 Direct Native CDFI Relending Pilot Program
The establishment and popularity of a USDA-RD pilot program for American Indian beneficiaries highlights both the issue of credit access in Native American communities and the role that Native CDFIs can play in increasing
access and awareness. In 2018, USDA-RD established a pilot program based on the Single Family Housing Direct
Loan program, also known as the Section 502 Direct Loan Program,149 to provide direct mortgage loans to Native
beneficiaries. The pilot program, known as the 502 Direct Native CDFI Relending Pilot Program, used two Native
CDFIs in South Dakota as intermediaries to re-lend funds as a way of increasing participation among eligible low-
income families on tribal lands in the Dakotas. USDA-RD lent $800,000 to each of two native CDFIs in South
Dakota, Mazaska Owecaso Otipit Financial and Four Bands Community Fund, to relend to eligible homebuyers for
mortgages on South Dakota and some North Dakota tribal lands. Each CDFI also contributed $200,000 for the
mortgages, bringing the total pilot program’s capitalization to $2 million.
A February 2020 progress report on the Native CDBG Relending Pilot Program by the South Dakota Native
Homeownership Coalition,150 of which both CDFIs are members, noted that deployment of the funds began in
October 2019, and by February 2020 approximately 50% of the loan capital had been deployed, resulting in eight
new homeowners. Of the program, coalition leadership noted that it was “more than was deployed in the
previous nine years prior to the start of the program.”151 The progress report reported eight pilot loans deployed
as of February 2020 with an average amount of $97,951 and reported consistent demand.
In August 2020, the South Dakota congressional delegation sent a letter to USDA leadership requesting the pilot’s
continuation.152 The letter noted that “the Native CDFIs have deployed nearly $2 million in mortgage capital [or
approximately the entirety of the pilot’s total capitalization] to eligible 502 borrowers in less than a year, more
than three times the amount of capital deployed to the same reservations in the previous nine years.” The letter
also says that the Native CDFIs “estimate that there is demand for more than $3 million worth of 502 direct loans
should additional funding be provided.”
146 CDFI Fund, Native Initiatives, https://www.cdfifund.gov/programs-training/programs/native-initiatives.
147 USDA-RD, Programs and Services for Tribes, https://www.rd.usda.gov/programs-services/programs-services-
tribes.
148 USDA-RD, Intermediary Relending Program, https://www.rd.usda.gov/programs-services/intermediary-relending-
program.
149 USDA-RD, Single Family Housing Direct Home Loans, https://www.rd.usda.gov/programs-services/single-family-
housing-direct-home-loans.
150 South Dakota Native Homeownership Coalition, Progress Report: 502 Direct Native CDFI Relending Pilot
Program, February 2020, https://www.sdnativehomeownershipcoalition.org/2019/wp-content/uploads/2020/03/502-
Success-Report_v2.pdf.
151 South Dakota Native Homeownership Coalition, Pilot Program Increases Rates of Mortgage Lending on South
Dakota’s Reservations, accessed July 20, 2021, https://www.sdnativehomeownershipcoalition.org/news/pilot-program-
increases-rates-of-mortgage-lending-on-south-dakotas-reservations/.
152 Letter from John Thune, Senator, M. Michael Rounds, Senator, and Dusty Johnson, Member of Congress, to Sonny
Perdue, Secretary of Agriculture, August 4, 2020, https://www.sdnativehomeownershipcoalition.org/2019/wp-content/
uploads/2019/10/SD-Delegation-Letter-re-502-Relending-Pilot-August-4-2020.pdf.
An Overview of Rural Credit Markets
Congressional Research Service 30
HUD’s Indian Community Development Block Grant Program also provides flexible competitive
funding for both economic and community development purposes as well as urgent needs.153
These funds can be used for a variety of purposes, including lending, subsidies, and revolving
loan programs.154 Other federal economic development programs provide tribal entities with
access to funding from the Economic Development Administration as well as federal regional
commissions and authorities, which serve specific geographic jurisdictions, and may also be used
for capitalization or sub-lending activities. In addition, certain federal programs specifically
support housing in tribal areas.155 These include HUD’s Indian Housing Block Grant, which
provides formula funding to tribes for affordable housing activities,156 and the Section 184
program, through which HUD guarantees mortgages made by private lenders to tribal members in
eligible areas.157
153 For more information, see CRS In Focus IF11749, The Indian Community Development Block Grant (ICDBG)
Program: An Overview, by Michael H. Cecire.
154 HUD, Indian Community Block Grant Awards, https://www.hud.gov/sites/documents/ICDBG_SUMMARIES.PDF.
155 Native Hawaiians, though they are not generally included in federal programs that serve American Indian and
Alaskan Native communities, also experience higher rates of many housing problems. HUD’s Native Hawaiian
Housing Block Grant and Section 184A programs provide funding and mortgage guarantees, respectively, to address
housing needs of Native Hawaiians eligible to reside on the Hawaiian Home Lands. See Kristen Corey et al., Housing
Needs of Native Hawaiians, prepared for HUD, May 2017, pp. xv-xvii, https://www.huduser.gov/portal/sites/default/
files/pdf/HNNH.pdf.
156 For more information on the Indian Housing Block Grant and related programs, see CRS Report R43307, The
Native American Housing Assistance and Self-Determination Act of 1996 (NAHASDA): Background and Funding, by
Katie Jones.
157 For more information, see HUD, “Section 184 Indian Home Loan Guarantee Program,” https://www.hud.gov/
program_offices/public_indian_housing/ih/homeownership/184.

An Overview of Rural Credit Markets
Congressional Research Service R46914 · VERSION 2 · NEW 31
Author Information
Andrew P. Scott, Coordinator
Analyst in Financial Economics
Marc Labonte
Specialist in Macroeconomic Policy
Alyssa R. Casey
Analyst in Agricultural Policy
Bruce R. Lindsay
Specialist in American National Government
Michael H. Cecire
Analyst in Intergovernmental Relations and
Economic Development Policy
Maggie McCarty
Specialist in Housing Policy
Cheryl R. Cooper
Analyst in Financial Economics
Jim Monke
Specialist in Agricultural Policy
Robert Jay Dilger
Senior Specialist in American National Government
Lida R. Weinstock
Analyst in Macroeconomic Policy
Katie Jones
Analyst in Housing Policy
Disclaimer
This document was prepared by the Congressional Research Service (CRS). CRS serves as nonpartisan
shared staff to congressional committees and Members of Congress. It operates solely at the behest of and
under the direction of Congress. Information in a CRS Report should not be relied upon for purposes other
than public understanding of information that has been provided by CRS to Members of Congress in
connection with CRS’s institutional role. CRS Reports, as a work of the United States Government, are not
subject to copyright protection in the United States. Any CRS Report may be reproduced and distributed in
its entirety without permission from CRS. However, as a CRS Report may include copyrighted images or
material from a third party, you may need to obtain the permission of the copyright holder if you wish to
copy or otherwise use copyrighted material.