dod, and others. we are now seeing a much broader … “this report was prepared by savannah river...
TRANSCRIPT

Page 2 of 132
Disclaimer: “This report was prepared by Savannah River Nuclear Solutions, LLC (SRNS) for the United States Department of Energy under Contract No. DE-AC09-08SR22470 and is an account of
work performed under that contract. Neither the Unites States Government nor any agency thereof, nor any of their employees, not any of their contractors, subcontractors or their employees assume
any legal liability or responsibility for any third party’s use of the results of such use of any information, apparatus, product, or process disclosed, or represent that its use would not infringe
privately owned rights. Reference herein to any specific commercial product, process or services by trademark, name, manufacturer or otherwise does not necessarily constitute or imply endorsement
recommendation, or favoring of same by SRNS or the United States Government or any agency thereof.”
STI No.: SRNL-MS-2016-00071
Page 3 of 132
Laboratory Director’s Message. ...................................................................................................... 5
Overview of 2015 Laboratory Directed Research and Development Program .............................. 6
FY15 Environmental Stewardship
Reinventing the Nuclear Waste Chemical Processing Flowsheet using Advanced Continuous Chemical Reactors and Separations ............................................................................................... 8
Smart Manufacturing: replacing analytical sample control with model predictive control ....... 11
Low Temperature Waste Form Process Intensification ............................................................... 15
Reactive Amendment Saltstone: A Novel Approach for Improved Sorption/Retention of Radionuclides such as Technetium and Iodine ............................................................................. 24
Functionalized Magnetic Mesoporous Silica Nanoparticles for U and Tc Removal ..................... 36
Identification of Mercury Sources in Aquatic Media of Savannah River Site Waters by Isotopic Analysis ......................................................................................................................................... 42
Development of Liquid Phase Water Detritiation Technology ..................................................... 45
Large Particle Titanate Sorbents ................................................................................................... 50
FY15 National Security
eDPS Aerosol Collection ................................................................................................................ 55
Direct LiT Electrolysis in a Metallic Lithium Fusion Blanket .......................................................... 61
Far Field Modeling Methods for Characterizing Surface Detonations ......................................... 65
Advancement of Tritium Powered Betavoltaic Battery Systems ................................................. 70
Alternate Tritium Production Methods Using a Liquid Lithium Target ........................................ 74
Field Development for Undeclared/Declared Nuclear Testing for Treaty Verification ................ 80
Nano-carbon Dyes for Use in Plastic Scintillators ......................................................................... 95
Characterization of High Explosives Detonations Via Laser-Induced Plasmas ............................. 99
Magnetically/plasmonically induced heat generation for controlled hydrogen isotope release from nano-hydrides .................................................................................................................... 103
Graphene-Based Gas Separation Membranes ........................................................................... 108
FY15 Clean Energy
Novel Ceramic Membranes for Efficient Utilization of Natural Gas ........................................... 113
MAX Phase Materials and Coatings for High Temperature Heat Transfer Applications ............ 117
Resilient Electrical Grid Synchrophasor ...................................................................................... 123

Page 4 of 132
Multi-Component Separation and Purification of Natural Gas .................................................. 127

Page 5 of 132
An innovative and effective Laboratory Directed Research and Development (LDRD) program is the foundation of a National Laboratory, ensuring the nation’s current and future needs in environment, security, energy and policy matters. Additionally, LDRD activities promote workforce development by providing the opportunity for technical staff, whether existing or new hires, to engage in cutting-edge R&D in response to the ever-challenging world of change that offers context for their work. For example, groundbreaking research efforts in the fields of materials science, microelectronics, photonics and computational science have led to new scientific discoveries and strategic partnerships with DOE, DHS,
DOD, and others. We are now seeing a much broader level of convergence between information and traditional domains, such as power, water, manufacturing and transportation. Thus, we are challenged to harness these advances and use them to create innovations to resolve our DOE mission requiring unique skill sets and thought-processes that are outside the bounds of traditional research practices. I am enthusiastic about the growth and opportunities that the Savannah River National Laboratory (SRNL) LDRD program is creating for the laboratory and the nation. The program continues to demonstrate advancements in the scientific underpinnings that reveal the quality of SRNL’s research.
This report reflects both the execution of our LDRD program within the objectives and guidelines outlined by the DOE through the DOE Order 413.2B. The projects described herein reflect the innovation required to fulfill SRNL’s strategic vision and provide great value to the DOE and the nation. The diversity exhibited in the research and development projects underscores the DOE Office of Environmental Management (DOE-EM) mission and enhances that mission by developing the technical capabilities and human capital necessary to support future DOE-EM national needs. Our nation is embarking on a renewed effort to reinvigorate manufacturing through innovation, and I am proud to say that our LDRD program is the compass for SRNL’s efforts that utilize and build upon our core values in efficiency and safety by applying the principles of smart manufacturing and process intensification towards not only resolving the nation’s legacy waste cleanup program, but advancing security and materials technologies that will be critical to these efforts.
On behalf of the SRNL Senior Management team, I would like to congratulate those members of the SRNL staff, and their collaborators, for their accomplishments and the quality of their work. Their efforts create a product that continues to be a critical mechanism to demonstrate the importance of SRNL’s competencies to the nation.

Page 6 of 132
Overview of 2015 Laboratory Directed Research and Development Program
Laboratory Directed Research and Development is a congressionally authorized program that provides the ‘innovation inspiration’ from which many of the Laboratory’s multi-discipline advancements are made in both science and engineering technology. While national security innovations cannot be easily planned or legislated, the flexibility and forward-looking nature of the LDRD program enables the Lab to accomplish long-range, innovative research that direct program funding is simply unwilling or unable to pursue. LDRD anticipates solutions to future mission needs by validating the fundamental hypotheses and creating the core technologies from which such innovations can arise. By building upon the synergy among the EM, NNSA, and EERE missions and the work from other federal agencies, the LDRD program serves as a key element in maintaining the vitality of SRNL’s technical programs.The LDRD program aims to position the Laboratory for new business in environmental stewardship, national security, and clean energy by leveraging the unique capabilities of the Laboratory to yield foundational scientific research in core business areas, while aligning with SRNL strategic initiatives and maintaining a vision for future national needs.
The FY15 LDRD Program focus areas are as follows:
Environmental Stewardship – Unique concepts that lead to new approaches and options for critical EM risk reduction challenges in processing high activity liquid waste and nuclear materials, remediating contaminated soil, groundwater and facilities, as well as validating long-term remediation strategies.
National Security - Unique concepts that address national security mission area needs that are currently underserved by the DOE Lab system. Game-changing innovations and tools that advance the national security agenda for the United States Government, including monitoring, nonproliferation, and deterrence.
Clean Energy – Advanced research in the development, demonstration, and deployment of clean energy technologies; innovative technologies to assure the future utilization of clean, reliable energy that dramatically improves the energy supply and efficiency of industrial, manufacturing, transportation, and/or building technologies, and strengthens SRNL’s Core Capabilities.
Tangible accomplishments resulting from persistent technical efforts in FY15 include:
Scientific Productivity
Research efforts supported by the LDRD program led to securing intellectual property and peer reviewed publications. Eight invention disclosures were submitted, along with two patent applications related to research supported through the FY15 LDRD program. Additionally, four projects published results in peer reviewed journals.

Page 7 of 132
Post-Doctoral and Student Involvement
• Twenty-two post-doctoral researchers were members of 13 LDRD supported research teams in FY15, ten performed research at SRNL.
• Four LDRD projects supported graduate student involvement in FY15. Four projects supported undergraduate participation.

Page 8 of 132
Project Team: D. P. Lambert (Primary); D. J. Adamson, Dr. M. B. Gorensek Subcontractor: Proteaf Industries Thrust Area: ES Project Start Date: February 11, 2014 Project End Date: September 30, 2015
Reinventing the Nuclear Waste Chemical Processing Flowsheet using Advanced Continuous Chemical Reactors and Separations
Process Intensification principles were used to identify two continuous reactors suitable for use in the Defense Waste Processing Facility (DWPF). An Oscillating Helical Reactor was chosen for the continuous reactor and two subcontracts were awarded to Proteaf to manufacture the equipment and provide technical support for this project. The equipment was delivered to SRNL on September 30, 2014. A second subcontract was awarded to Proteaf in FY15. Two deliveries of equipment were received
in June and August 2015. The equipment was assembled and water testing was complete. No testing with sludge simulants was initiated. Objectives
• Procure Helical Reactor. Setup continuous reactor (Ready for testing) • Phase 1 – Demonstrate high solids mixing • Phase 2 – Demonstrate slurry neutralization • Phase 3 – Demonstrate mercury reduction
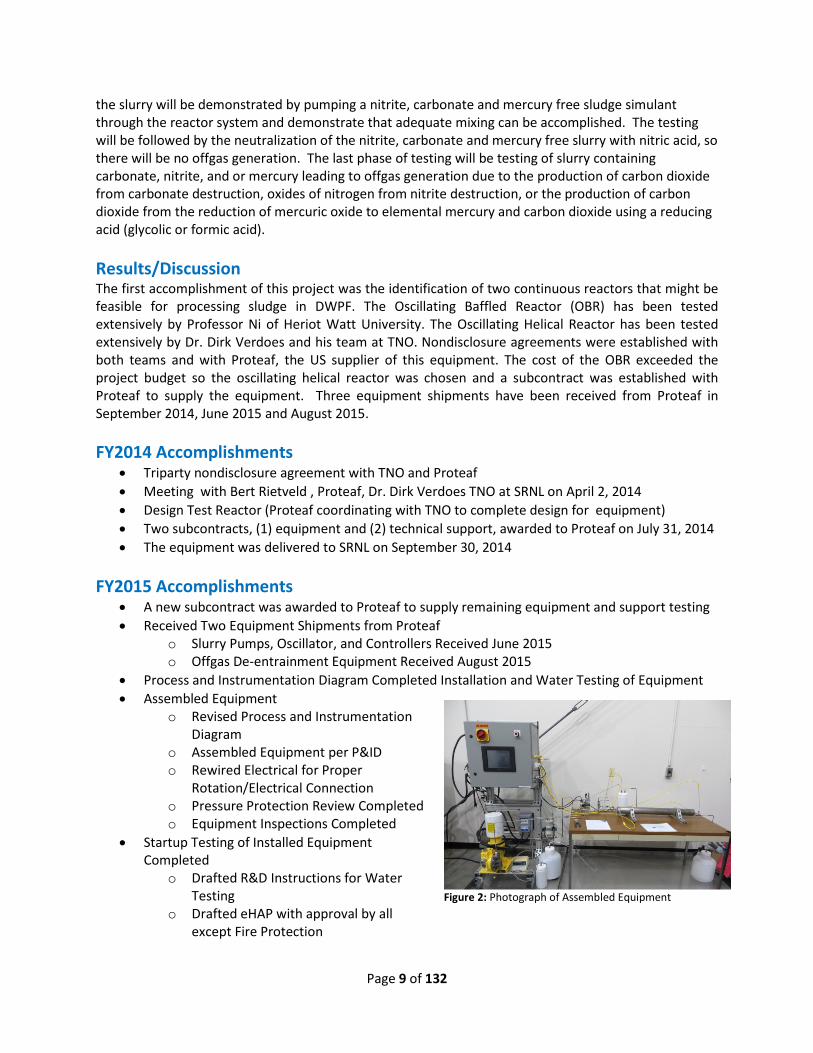
Introduction The project objective is to determine the feasibility of using a continuous reactor for the chemical processing of sludge to replace the semibatch process in the Defense Waste Processing Facility. The first task was to identify continuous reactors that could be suitable for this testing. An oscillating helical reactor (Figure 1) was chosen as it has laminar flow and good mixing can be achieved due to the oscillation, leading to a much smaller volume reactor. An oscillating baffled reactor was not chosen primarily because it was too expensive for this project. Proteaf was selected to produce the experimental reactor and associated equipment (Vessels, pump, oscillator, offgas de-entrainment equipment, etc.) with support from TNO. The equipment was delivered to SRNL on September 30, 2014 so no testing was completed in FY14. Approach The chemical processing of sludge is complicated due to chemical complexity and challenging rheology of the slurry, and the large offgas generation during processing. First the safety considerations will be addressed using SRNL’s electronic Hazard Assessment Process and a Job Hazard Analysis. Initial testing will be completed with water to demonstrate the equipment works as planned. Next the processing of
Figure 1. Schematic of Helical Reactor.
Page 9 of 132
the slurry will be demonstrated by pumping a nitrite, carbonate and mercury free sludge simulant through the reactor system and demonstrate that adequate mixing can be accomplished. The testing will be followed by the neutralization of the nitrite, carbonate and mercury free slurry with nitric acid, so there will be no offgas generation. The last phase of testing will be testing of slurry containing carbonate, nitrite, and or mercury leading to offgas generation due to the production of carbon dioxide from carbonate destruction, oxides of nitrogen from nitrite destruction, or the production of carbon dioxide from the reduction of mercuric oxide to elemental mercury and carbon dioxide using a reducing acid (glycolic or formic acid). Results/Discussion The first accomplishment of this project was the identification of two continuous reactors that might be feasible for processing sludge in DWPF. The Oscillating Baffled Reactor (OBR) has been tested extensively by Professor Ni of Heriot Watt University. The Oscillating Helical Reactor has been tested extensively by Dr. Dirk Verdoes and his team at TNO. Nondisclosure agreements were established with both teams and with Proteaf, the US supplier of this equipment. The cost of the OBR exceeded the project budget so the oscillating helical reactor was chosen and a subcontract was established with Proteaf to supply the equipment. Three equipment shipments have been received from Proteaf in September 2014, June 2015 and August 2015. FY2014 Accomplishments
• Triparty nondisclosure agreement with TNO and Proteaf • Meeting with Bert Rietveld , Proteaf, Dr. Dirk Verdoes TNO at SRNL on April 2, 2014 • Design Test Reactor (Proteaf coordinating with TNO to complete design for equipment) • Two subcontracts, (1) equipment and (2) technical support, awarded to Proteaf on July 31, 2014 • The equipment was delivered to SRNL on September 30, 2014
FY2015 Accomplishments
• A new subcontract was awarded to Proteaf to supply remaining equipment and support testing • Received Two Equipment Shipments from Proteaf
o Slurry Pumps, Oscillator, and Controllers Received June 2015 o Offgas De-entrainment Equipment Received August 2015
• Process and Instrumentation Diagram Completed Installation and Water Testing of Equipment • Assembled Equipment
o Revised Process and Instrumentation Diagram
o Assembled Equipment per P&ID o Rewired Electrical for Proper
Rotation/Electrical Connection o Pressure Protection Review Completed o Equipment Inspections Completed
• Startup Testing of Installed Equipment Completed
o Drafted R&D Instructions for Water Testing
o Drafted eHAP with approval by all except Fire Protection
Figure 2: Photograph of Assembled Equipment

Page 10 of 132
• Completed Water Testing of Assembled Process • Purchased Acid Pump
Future Directions The Following Testing is needed to demonstrate the viability of the continuous helical reactor in processing sludge simulant:
• Complete Hazard Assessment and Procedure Development – Dan Lambert • Phase 1 -- Demonstrate high solids mixing – one month
o DWPF slurries are rheologically thick mixture of insoluble solids and solution o Maintaining well mixed slurry is key in controlling chemical reactions o Laminar flow with oscillation is used for good mixing o Install acid pump o Modify Hazard Assesment and update R&D Directions for processing with acid
• Phase 2 – Demonstrate slurry neutralization – one month o The first and simplest chemical reaction is neutralization of NaOH with acid o Neutralization will be characterized to determine kinetics of reaction o Simple slurry with added acid will be used to demonstrate neutralization o Set up the Helical Reactor System – Proteaf and SRNL o Install offgas de-entrainment equipment o Modify Hazard Assesment and update R&D Directions for processing with offgas
• Phase 3 – Demonstrate reaction with offgas generation – one month o One of the more complicated reactions is reduction of mercury o This requires a reducing acid (any acid can neutralize NaOH) o Reduction demonstrates reaction producing offgas (carbon dioxide)
• Sample Analysis and Report Writing – one month FY 2014 Publications/Presentations D.P. Lambert, Reinventing the Nuclear Waste Chemical Processing Flowsheet using Advanced Continuous Chemical Reactors and Separations, Midyear Review of Process Intensification and Smart Manufacturing Projects,LDRD-2014-00097, August 14, 2014.
FY 2015 Publications/Presentations D.P. Lambert, Reinventing the Nuclear Waste Chemical Processing Flowsheet using Advanced Continuous Chemical Reactors and Separations, Poster for End of Year Review of Process Intensification and Smart Manufacturing Projects,LDRD-2014-00097, October 15, 2014.
Acronyms DWPF Defense Waste Processing Facility OBR Oscillating Baffled Reactor SRNL Savannah River National Lab TNO Essentially the national laboratory of Netherlands

Page 11 of 132
Project Team: M.B. Gorensek (Primary), D.P. Lambert, and T.B. Edwards Subcontractor: C.-C. Chen (Texas Tech University) Thrust Area: ES Project Start Date: February 11, 2014 Project End Date: September 30, 2015
Smart Manufacturing: replacing analytical sample control with model predictive control
Liquid waste operations at SRS rely on sampling and analysis for product quality control, dictating long wait times and round-the-clock analytical staffing. We are building a detailed model of Sludge Receipt and Adjustment Tank (SRAT) and Slurry Mix Evaporator (SME) operations that could be used instead of sampling and analysis to control Defense Waste Processing Facility (DWPF) operations. Since the model’s predictions need to be at least as reliable as the analyses it is intended to replace, we have teamed with a world-class electrolyte properties expert to equip it with a new electrolyte-NRTL properties package that
accurately and efficiently simulates sludge properties. Our team also includes one of the DWPF Product Composition and Control System (PCCS) developers who knows the uncertainties in the sludge sample analyses and their impact on product quality requirements. The work to date has focused on demonstrating this capability with bench scale sludge simulant experiments. FY2015 Objectives
• Add glycolic acid flowsheet process chemistry to the formic acid flowsheet electrolyte-NRTL properties package.
• Build dynamic model of lab-scale SRAT/SME sludge batch simulant experiments for the formic acid flowsheet.
• Demonstrate uncertainty of predicted sludge batch compositions equal to or less than those of sample analyses.
• Quantify potential cost savings for DWPF due to reduced analytical support requirement and accelerated production schedule.
Introduction Nuclear materials processing across the DOE complex uses traditional analytical sample control, relying on hold points at critical steps to verify by analysis that composition/properties meet product acceptability criteria. Waiting for analyses accounts for much of the processing time. Analyses also add cost and require round-the-clock laboratory staffing. SRNL sees radiochemical processes of the future as highly automated systems that take advantage of SM concepts, using advanced automation, process control, and information technology to optimize performance. We are developing a model of the DWPF sludge treatment process that provides material balances with sufficient detail to replace analytical sampling hold points. This includes an electrolyte properties model tailored to DWPF compositions, capturing only those components needed for process control. The model is robust and should be fast enough to serve as the basis for a truly predictive control system. The immediate significance is that this has the potential to reduce batch processing times up to 40%, increasing DWPF capacity by up to 67%. Fewer analyses would be needed, and could be scheduled during normal working hours (as confirmation), reducing analytical costs and staffing needs. Finally, this

Page 12 of 132
represents a first step toward implementation of SM concepts at SRS, leading the way toward similar improvements in other SRS facilities. When fully implemented, SM will have the potential to allow global optimization of SRS operations, enabling rapid, effective response to any changes in manufacturing conditions (e.g., funding, mission, staffing, priorities, etc.) This requires good real-time models of SRS processes. SRNL has the opportunity to establish technical leadership in SM since it has direct access to actual nuclear waste operations and the requisite modeling expertise. The significant cost savings that could be demonstrated by application of this technology to DWPF operations should open up other funding opportunities. Approach A major thrust of the project was to custom fit (to all available data) electrolyte-NRTL properties packages (speciation and parameter sets) for use with the Aspen Plus™ properties model to simulate sludge processing streams. This gives phase equilibrium and energy balance calculations the kind of accuracy that is essential if the process model will ever replace grab sampling and analysis. Prof. Chau-Chyun Chen of Texas Tech University (TTU), the author of the Chen electrolyte-NRTL properties model had primary responsibility for this aspect of the project. The work had two parts: the first, completed in FY 2014, was a properties package for the formic acid flowsheet model, while the second, slated for FY 2015, was an expanded package for the glycolic acid flowsheet model that takes into account the more complicated chemistry of glycolic acid in sludge streams. After agreement was reached on which components needed to be included in the properties packages, Prof. Chen and his graduate students at TTU were to search for available data, establish relevant speciation, and regress the requisite pure component property and binary interaction parameters. The final product in both cases was to be a complete properties package that could be imported into an aspenONE® simulation file along with a report describing the package in detail and demonstrating the properties models’ fit to the available data. The main focus of the project was on the SRAT/SME process model. The initial intent was to build a dynamic process model in Aspen Custom Modeler (ACM). However, the process chemistry includes reactions that yield gaseous products, making it necessary to use true compositions instead of apparent components, which ACM cannot easily accommodate. After trying unsuccessfully to build a dynamic model in ACM using the true composition basis, the decision was made to switch to a pseudo-dynamic Aspen Plus™ model in which time intervals are simulated as consecutive steady-state operations. Figure 1 shows the first three steps in the Aspen Plus™ simulation of a lab-scale experiment with sludge batch simulant SB6-H (Flowsheet Development Run GF-21). The plan is to demonstrate that this model can predict the results of lab-scale SRAT/SME simulant runs with equal or better confidence than analytical measurements, first for the formic acid flowsheet, and then for the glycolic acid flowsheet.
B1
B2
B3
C3A
C2A
C1A
22.4
1.013
S1
25.0
1.013
P1
70.8
1.013
V1
70.8
1.013
S2
93.0
1.013
V2
93.0
1.013
S3
25.0
1.013
P2
25.0
1.013
P3
93.0
1.013V3
93.0
1.013
S4
25.0
1.013
FL1
25.0
1.013
T1
4.0
1.013
V3AV
4.0
1.013
V3AL
22.0
1.013
V2AV
22.0
1.013
V2AL
22.0
1.013
V1AV
22.0
1.013
V1AL
Temperature (C)
Pressure (bar)
4.0
1.013
V1BV
4.0
1.013V1BL
C1B
MIX1
21.2
1.013
V1L
4.0
1.013V2BL
21.9
1.013
V2L
4.0
1.013
V2BV
MIX2
C2B
4.0
1.013
V3BV
4.0
1.013V3BL
4.0
1.013
V3L
C3B
MIX3
Figure 1. Excerpt (first three time steps) from Aspen Plus™ flowsheet model used to simulate bench scale SRAT/SME tests with sludge batch simulant
B1
B2
B3
C3A
C2A
C1A
22.4
1.013
S1
25.0
1.013
P1
70.8
1.013
V1
70.8
1.013
S2
93.0
1.013
V2
93.0
1.013
S3
25.0
1.013
P2
25.0
1.013
P3
93.0
1.013V3
93.0
1.013
S4
25.0
1.013
FL1
25.0
1.013
T1
4.0
1.013
V3AV
4.0
1.013
V3AL
22.0
1.013
V2AV
22.0
1.013
V2AL
22.0
1.013
V1AV
22.0
1.013
V1AL
Temperature (C)
Pressure (bar)
4.0
1.013
V1BV
4.0
1.013V1BL
C1B
MIX1
21.2
1.013
V1L
4.0
1.013V2BL
21.9
1.013
V2L
4.0
1.013
V2BV
MIX2
C2B
4.0
1.013
V3BV
4.0
1.013V3BL
4.0
1.013
V3L
C3B
MIX3

Page 13 of 132
Results/Discussion The major effort in FY 2015 was on building the SRAT/SME process model. As noted above, ACM was the initial platform choice. However, ACM is intended to use apparent components when simulating electrolyte systems because the introduction of electrolyte equilibrium reactions with true compositions (i.e., all ionic species tracked individually) leads to problem over-specification (i.e., more equations than unknowns due to conflicting equilibrium and component balance equations). Work-arounds were suggested by AspenTech, but the available documentation was poor and convergence difficult. After considerable effort, the dynamic ACM model was abandoned in favor of a less elegant yet effective “pseudo-dynamic” Aspen Plus™ model, which treats time intervals as consecutive steady-state operations. True composition simulations do not pose any difficulty for Aspen Plus™. Figure 2 compares the results of an Aspen Plus simulation of Flowsheet Development Run GF-21 using sludge batch simulant SB6-H. As can be seen from the plot, the match between experimental data and the model is good for some variables. Further work is needed to resolve discrepancies in the water balance and to verify that the reduction reactions proceed as expected. The formic acid flowsheet properties package delivered at the end of FY 2014 was updated several times to correct some inadvertent omissions and minor errors. It included a new, more accurate model of the H2O-HNO3-NaNO3 ternary that was of enough potential interest outside of SRS to merit publication in Fluid Phase Equilibria. (Figure 3 shows one of the comparisons between the properties model and the available data that was published in this paper.) Work began on extending the properties package to include glycolic acid chemistry. Solubility equilibria are being added for Al(OH)3, Ca(OH)2, Fe(OH)3, Mn(OH)2, Mg(OH)2, and Ni(OH)2, as are interaction parameters for the water-glycolic acid and water-sodium glycolate binaries. Provisions are also being made to add reactions for the reduction of Mn4+ and Fe3+ to Mn2+ and Fe2+. FY2015 Accomplishments
• Completed 76-component formic acid flowsheet properties package with 11 electrolyte equilibrium and 15 dissociation reactions.
Figure 2 Comparison between results of Aspen Plus™ simulation of Flowsheet Development Run GF-21 for sludge batch simulant SB6-H with experimental data.
Figure 3 Comparison of isobaric vapor–liquid equilibrium data (dots) and model correlation results (lines) from Fluid Phase Equilibria paper.
Page 14 of 132
• Published paper in Fluid Phase Equilibria on the solution thermodynamics and phase equilibria of the H2O-HNO3-NaNO3 ternary.
• Built pseudo-dynamic model of lab-scale SRAT/SME experiments and began verification and validation against lab data.
• Began work on expanding the formic acid flowsheet properties package to account for solubilized metal hydroxides (Al(OH)3, Ca(OH)2, Fe(OH)3, Mn(OH)2, Mg(OH)2, and Ni(OH)2), water-glycolic acid and water-sodium glycolate binary interactions, and reduction of Mn4+ and Fe3+ to Mn2+ and Fe2+.
Future Directions
• Complete glycolic acid flowsheet properties package with 6 additional metal hydroxide solubilities, glycolic acid and sodium glycolate interactions with water, and Mn4+ and Fe3+ reduction chemistry.
• Complete pseudo-dynamic model of lab-scale SRAT/SME sludge batch simulant experiments that predicts sludge batch simulant compositions with equal or lesser uncertainty than actual analyses.
• Quantify potential cost savings for DWPF due to reduced analytical support requirement and accelerated production schedule.
• Present results to DWPF plant engineers to evaluate for potential implementation. FY 2015 Publications/Presentations 1. Meng Wang, Maximilian B. Gorensek, Chau-Chyun Chen. Thermodynamic representation of aqueous sodium nitrate and nitric acid solution with electrolyte NRTL model. Fluid Phase Equilibria (2015), http://dx.doi.org/10.1016/j.fluid.2015.04.015. 2. Maximilian B. Gorensek, Dan P. Lambert, Meng Wang and Chau-Chyun Chen. Comprehensive Thermodynamic Model for Aqueous Nitric Acid and Sodium Nitrate Solution with Electrolyte NRTL Equation. Paper 182b, to be presented at the 2015 AIChE Annual Meeting, Salt Lake City, UT, November 8-13, 2015. Acronyms ACM Aspen Custom Modeler AspenTech Aspen Technology, Inc. DOE Department of Energy DWPF Defense Waste Processing Facility FY Fiscal Year NRTL Non Random Two-Liquid PCCS Product Composition and Control System SME Slurry Mix Evaporator SRAT Sludge Receipt and Adjustment Tank SRNL Savannah River National Laboratory SRS Savannah River Site TTU Texas Tech University

Page 15 of 132
Project Team: K. M. Fox, A. D. Cozzi, E. K. Hansen, and K. A. Hill Thrust Area: ES Project Start Date: February 1, 2014 Project End Date: September 30, 2015
Low Temperature Waste Form Process Intensification
Low temperature waste forms are utilized for the immobilization of low activity waste and other hazardous materials. These waste forms benefit from the use of inexpensive raw materials (and materials that would otherwise be considered wastes themselves) and require a minimal amount of energy for processing. However, the volume of low temperature waste forms can be large relative to the volume of waste immobilized. The process of
immobilizing waste in a low temperature waste form would be significantly intensified by increasing the concentration of waste in the material. Improved understanding of waste incorporation in low temperature waste forms will allow for volume reductions of 50% or more, which will greatly reduce the disposal footprint and cost. FY2015 Objectives
• Develop an improved understanding of the retention of contaminants in low temperature, cementitious waste forms such that a step-change reduction in waste form volume can be achieved
• Identify potential processing issues when waste concentration is increased • Measure waste form performance when formulated at high waste concentrations • Identify changes to dry blend composition that improve waste form performance
Introduction The objective of this study was to develop an improved understanding of the retention of contaminants in low temperature, cementitious waste forms such that a step-change reduction in waste form volume can be achieved. Figure 1 demonstrates this potential reduction in waste form volume. The area within the solid red outline represents the region of recent operation of the Saltstone Production Facility at the Savannah River Site (SRS). The area within the dotted and shaded red outline represents compositions tested by SRNL in a preliminary study for Hanford Cast Stone development, where it was shown that a waste form could be produced with a concentrated feed material and retain acceptable properties.1 As shown in Figure 1, concentrating a low activity waste (LAW) salt solution feed from 5 M sodium to 8 M sodium would reduce the volume of the waste form by approximately 50%, and would reduce mission life cycle costs by a similar percentage.
Figure 1. Calculated waste form volume as a function of sodium molarity and water to premix ratio

Page 16 of 132
Figure 2. Rheometer for measurement of viscosity of fresh slurries.
The study reported here continued to investigate the properties and performance of low temperature forms fabricated with high sodium concentration simulated LAW solutions, along with the addition of new dry blend (or premix) components. It was hypothesized that variation in the amounts of blast furnace slag and fly ash in the dry blend composition, as well as the addition of geopolymer materials, could offer improved retention of contaminants of concern, while continuing to meet other material processing and performance requirements. Approach A series of low temperature waste form test mixes was developed in two stages for this study. The first stage was a set of three mixes designed to test hydraulic conductivity of waste forms produced with higher sodium concentration LAW feeds. The second stage was a larger set of mixes designed to test the impact of changes to the dry blend composition when combined with higher sodium concentration LAW feeds, in terms of both fresh and cured properties. After preparation in the laboratory, the fresh properties of the mixes were measured. Fresh properties, including density, flowability, gel time, plastic viscosity (Figure 2), and yield stress determine the processability of the slurry. The intent was to develop formulations that can be processed using existing equipment and facilities, thus minimizing the need for any capital expenditures to process the waste form at higher waste concentrations. The experimental mixes were then cured for at least 28 days in preparation for cured properties measurements. Cured properties, including compressive strength and hydraulic conductivity (Figure 3), are indicative of the performance of the waste form in the disposal environment. Results/Discussion The results of selected fresh properties measurements identified no issues with processing slurries formulated with concentrated salt solutions and the additional dry blend components. Fresh densities were close to the calculated values for each mix, indicating no issues with preparation. Rheology measurements showed increases in plastic viscosity for all the test mixes relative to current SRS saltstone, but the slurries remained sufficiently flowable. Flow testing confirmed the results of rheology testing. The mix prepared with all metakaolin as the dry blend was the exception, and was too viscous for the rheology measurement. Gel times were generally longer than that of current SRS saltstone. This means that the mixes had a longer working time, but the potential impact on disposal method needs to be determined. The mix prepared with all metakaolin was again the exception, with a relatively short gel time of 31 minutes. The rheology, flow, and gel time data indicated that the all metakaolin mix reacted most quickly.

Page 17 of 132
Figure 3. Permeameter for measuring hydraulic performance of high salt concentration waste forms.
The cured properties measured included compressive strength and hydraulic conductivity for select samples. All of the text mixes had had sufficient compressive strength (>500 psi) after more than 28 days of curing, with the exception of the all fly ash and all metakaolin mixes. These two mixes remained plastic after the curing period. The addition of metakaolin improved compressive strength, but only when used in combination with cement and slag or fly ash. Hydraulic conductivity was measured for only two of the text mixes due to time constraints. The two mixes performed well, with the results indicating that increasing the concentration of salts in the LAW simulant did not impact the hydraulic performance of the waste form. The impact of zeolite additions to the dry blend could not be determined from these tests due to the low measured values of hydraulic conductivity. FY2015 Accomplishments
• Demonstrated successful immobilization of wastes concentrated to 10 M sodium (double that of current process)
• Fresh properties, which dictate the ability to produce this waste form in an economical facility, have been measured and demonstrate the ability to process with existing equipment
• Cured properties, including compressive strength and hydraulic conductivity, demonstrate acceptable performance of the waste form when waste concentration is doubled
• Modifications to the dry blend composition, particularly the addition of metakaolin, enable significant increases in waste concentration without detracting from performance of the waste form
Future Directions
• Additional testing should include hydraulic conductivity measurements for mixes prepared with 10 M Na salt solutions.
• A method for hydraulic conductivity measurements with a lower detection limit should be developed.
• More data are needed regarding mixes with metakaolin additions. The mechanisms by which metakaolin improves the waste form properties and performance are not yet understood.
• Leachability data are needed for mixes formulated with high sodium concentration feeds, for both simulants and radioactive salt solutions. These data could then be used to determine acceptability of the waste forms and to predict long term performance of the waste forms in the disposal environment.

Page 18 of 132
FY 2015 Publications/Presentations • Fox, K. M., A. D. Cozzi, K. A. Roberts, and T. B. Edwards, “Cast Stone Formulation for Nuclear
Waste Immobilization at Higher Sodium Concentrations,” International Journal of Applied Ceramic Technology (in press).
• Fox, K. M., A. D. Cozzi, E. K. Hansen, and K. A. Hill, “Low Temperature Waste Form Process Intensification: FY2015 Progress Report,” U.S. Department of Energy Report SRNL-STI-2015-00448, Revision 0, Savannah River National Laboratory, Aiken, SC (2015).
References
1. Fox, K. M., K. A. Roberts, and T. B. Edwards, “Cast Stone Formulation at Higher Sodium Concentrations,” U.S. Department of Energy Report SRNL-STI-2013-00499, Revision 2, Savannah River National Laboratory, Aiken, SC (2013).
Acronyms LAW Low Activity Waste SRNL Savannah River National Laboratory SRS Savannah River Site
Page 19 of 132
Project Team: L. Sexton, S. Branney, J. Wilson, P. O’Rourke, M. Holland, M. Jones Subcontractor: Clemson University Thrust Area: ES Project Start Date: February 1, 2014 Project End Date: September 30, 2015
Investigation of In-Line Monitoring Options at H Canyon/HB Line for Plutonium Oxide Production
H Canyon and HB Line have a production goal of 1 MT per year of plutonium oxide feedstock for the MOX facility by FY17 (AFS-2 mission). In order to meet this goal, steps will need to be taken to improve processing efficiency. One concept for achieving this goal is to implement in-line process monitoring at key measurement points within the facilities. In-line monitoring during operations has the potential to increase throughput and efficiency while reducing costs associated with laboratory sample analysis. In the work reported
here, we mapped the plutonium oxide process, identified key measurement points, investigated alternate technologies that could be used for in-line analysis, and initiated a throughput benefit analysis. Introduction In 2011, the H Canyon and HB Line facilities were chosen to begin dissolving and purifying excess plutonium oxide for initial feedstock material for the Mixed Oxide (MOX) Fuel Fabrication Facility. The goal for production is to provide 1 metric ton (MT) per year of MOX feedstock by FY17. Meeting this goal will be challenging unless measures are taken to reduce waste and/or increase throughput. In-line process monitoring could provide the needed tools to help meet H Canyon/HB Line production goals.
For process monitoring and accountability, H Canyon and HB Line typically pull samples at various points during processing, which are sent to F/H Laboratory or HB Line Laboratory for analysis. The analyses performed in F/H Laboratory can take several days to complete leading to pauses in production. Setting up in-line monitoring equipment at the key measurement points within the process could lead to significant time savings and increased processing efficiency. Reducing the number of samples pulled for laboratory analysis would also lead to a reduction in cost for facility operation.
Approach In the work discussed here, we completed five tasks to investigate the benefits that could result from implementation of in-line analysis. The first task was to map the H Canyon/HB Line processing path for plutonium oxide production. This included developing a flow chart of the process with current sampling locations and analysis techniques used at each point. The second task was to identify key measurement points during the process for quality control and accountability and identify any gaps in the current monitoring scheme. The third task was to identify alternate technologies that could be used in-line for process control and accountability to replace the currently used laboratory techniques. Task four was to conduct initial proof-of-concept testing with the proposed in-line instruments. The final task was to perform a benefit analysis to provide an estimate of the potential gains in processing efficiency resulting from implementation of in-line monitoring.

Page 20 of 132
Results/Discussion The plutonium oxide production processing path in H Canyon and HB Line was mapped out using documentation on the AFS-2 mission and expert input from the facilities. Sampling points and analytical techniques used on collected samples were also identified. The key measurement points for process control and accountability were also identified through H Canyon/HB Line documents and interviews with personnel. Key measurement points/hold points identified in H Canyon include several tanks prior to transfer to HB Line that measure for Pu valence state, process related conditions (acidity, impurities, Pu concentration) and accountability (isotopics & Am-241). Several hold points for total Pu and acidity were identified in HB Line. Hold points were also identified on the back end of the process (i.e., solution returning to H Canyon from HB Line) for verifying the oxalate kill step was completed.
Several technologies amenable to in-line utilization were suggested to replace the currently used laboratory techniques. These include:
• X-ray fluorescence (XRF) to replace inductively coupled plasma mass spectrometry (ICP-MS) for metal impurity analysis (F/H Lab),
• In-line gamma spectroscopy to replace isotope dilution mass spectrometry (IDMS) for Pu isotopics and total Pu (F/H Lab) and alpha spectroscopy and ChemCheck for Pu isotopic ratio analysis and U concentration (F/H Lab)
• UV-vis spectroscopy to replace free acid titration (F/H Lab) and oxalate titration (HB Line Lab) for acidity and Pu DAS for total Pu (HB Line Lab)
After identification of these technologies, XRF and gamma spectroscopy were selected for initial proof-of-concept studies. XRF spectra was taken of a liquid Pu sample and an evaporated sample on a thin polymer film (Figure 1). Liquid sampling shows good sensitivity however, the background is limited by Compton scattering from water. The evaporated sample shows much better sensitivity due to the reduction in background from the water. However with
Figure 1. (top) XRF Spectra of liquid Pu sample from batch 3 of AFS-2 campaign, (bottom) XRF Spectra of evaporated Pu sample and a 100 ng mix multi-element standard.

Page 21 of 132
both samples a wide range of impurities can be detected and based on data obtained with multi-element standards the limit of detection is estimated to be around 10-50 ppm.
Several measurements were taken as part of this work with both HPGe (High Purity Germanium) and NaI detectors. The HPGe measurements were carried out in F-area labs on both AFS-2 and UNF samples. The samples remained inside a fume hood while the detector measured the samples from outside. It was not possible to shield the detector adequately in the lab these measurements were taken. As a result, the scatter background from Cs-137 present in the area (Cs-137 is somewhat ubiquitous in F-area) obscured any signal from the plutonium in the AFS-2 solution.
Several of the sampler’s in the H-canyon sampler aisle were measured while circulating solution both with the sampler boxes closed and open. Again, the scatter background from the significant Cs-137 peak made it difficult to identify features associated with Pu but in several spectra, these features are visible. For example, a spectrum taken at the 7.4 sampler with the door open shows the 104 keV Pu-241 peak. The two spectra below are a reference spectrum taken the previous day with a Co-60, a Cs-137 and an Am-241 source, and the spectrum obtained at the 7.4 sampler while the door was open and the sampler was running. This demonstrates that even an appropriately shielded NaI detector may be able to quantify Pu in solution although an HPGe would make this determination more precise.
Figure 2. Reference spectrum (black) and spectrum from 7.4 sampler while open and running (blue).

Page 22 of 132
In FY15 a subcontract was also established with Clemson University to investigate a liquid sampling–atmospheric pressure glow discharge (LS-APGD) source for potential utilization for on-line or at-line measurements in H Canyon. Direct LC detection uses the mobile phase itself as an electrode in the source plasma circuit. This idea was first realized by Couch and Brenner and the Marcus group at Clemson has capitalized on this concept to develop a LS-APGD source that operates at relatively low currents (<30 mA) and solution flow rates (<50 μL min-1), that has been interfaced with a LC-MS mass analyzer yielding a relatively simple alternative for ICP mass spectrometry applications. Clemson University conducted the following tasks with guidance and feedback from SRNL: (1) develop a conceptual design for an in-line or on-line analytical instrument that could be used in H Canyon. (2) Address issues that may be related to exhaust of Pu produced during ionization. (3) Perform initial testing of surrogate materials.
The conceptual design for operation of the technology in H Canyon was developed in the context of a small footprint optical emission and mass spectrometer system. The system was designed to accept aliquots of system samplings with use of a discrete injection system, potentially with an autosampler. In the case of the optical system, a multichannel optical spectrometer was utilized for testing. In the case of MS, a ThermoScientific LCQ ion trap analyzer system was employed. Although it has many analytical limitations, it is an excellent test bed for microplasma source design and evaluation.
The basic operation of the LS-APGD microplasma involves the complete vaporization of the electrolyte/sample solution. In principle, all of this vapor would need to be exhausted in order to quantitatively capture radionuclides that are present in each sample. Clearly, these species will only exist during the course of an actual source injection, with the remainder of the time of source operation producing a vapor consisting of 5% HNO3.
An initial test matrix, two different matrices, were employed for the source evaluation. In the first case, a “high-solids” surrogate solution (High Purity Standards (Charleston, SC) MS-744-001 (ADS Mix 1) Solution A) consisting of 22 elements at concentrations of 1000 mg L-1 each was evaluated. Thus the total solids content of this test solution was 2.2%. This solution was employed to test the ability of the microplasmas to operate stably under high solids conditions, as would be expected in the upstream end of H-canyon. Three test elements (Ag, Cs, and Ce) were added at final concentrations of 100 µg mL-1 in the matrix solutions at dilutions of 0, 10, 100, and 1000 X. In principle, maintaining a constant spike content will reveal any potential matrix effects related to the source operation and analytical performance. As a general rule, both plasma sources operated most consistently having greater test matrix dilution factors.
The second test matrix was composed of a 3 g L-1 uranium nitrate solution in 5% HNO3 (High Purity Standards (Charleston, SC)). In this case, the test solution was prepared as a surrogate for the predominately-plutonium containing solutions at the downstream end of the H-canyon process. The challenge here was the role of the high matrix concentration on the precision of the measurements.
The initial evaluation of the use of the LS-APGD microplasma ionization source for the analysis of what could be termed as “heavy matrices” indicated that there is little detrimental effect on the overall

Page 23 of 132
operation of the plasma nor its analytical performance for solutions having less than ~0.1% dissolved solids. With regards to the two test samples, the 2% multielement solution was best analyzed following 100 and 1000X dilution, while the 3 g L-1 (0.3%) uranium solution was readily analyzed following 10 – 100X dilution. In the case of the multielement solution, limits of detection for the three spike elements (Ag, Cs, and Ce) were on the single µg mL-1 level. To be clear, there is much to be learned about de-clustering of background water-related ions and in the use of an ion trap mass spectrometer for quantitative analysis. Based on the initial efforts, though, it seems clear that the physical attributes of the LS-APGD microplasma, its tolerance of complex matrices, and low sample/waste volumes are in line for implementation on-line or in-line for analysis of measurement points in H Canyon.
An H Canyon/HB Line AFS-2 throughput model was used to estimate processing efficiency gains that could be expected by reducing sample analysis turnaround times. Assumptions used in the model included: AFS-2 is only process running, no labor restrictions, oxalate kill performed in HB Line, 1 precipitator/1 furnace running, and 1 kg cans. The model was run using four different scenarios, described below:
Traditional Sampling Scenarios:
1) 48 hour sample turnaround times for all H Canyon samples, 48 hour sample turnaround times for JT-72, NT-21, and 8 hour sample turnaround times for NT-51
2) 48 hour sample turnaround times for all H Canyon samples, 4 hour sample turnaround times for all HB Line samples
In-line Monitoring Scenarios:
3) 12 hours sample turnaround times for all H Canyon samples, 0.5 hour sample turnaround times for JT-72 and NT-21, 0.1 hour sample turnaround time for NT-51 – In-line UV-vis, XRF, and gamma systems at key measurement points
4) 0 hour sample turnaround times for all samples – completely automated system with in-line monitoring and feedback control
*48 hour turnaround time is an estimate based on historical turnaround times associated with ICP-MS and Pu-IDMS analysis performed in F/H Laboratory. ** Variations in HB Line Laboratory turnaround times based on information from different sources. ***Sample analysis turnaround times for in-line monitoring scenarios are estimates Results from the model suggest, using traditional sampling scenario 2 as a base, that one could expect a 40% increase in throughput by moving to in-line monitoring scenario 3 and a 70% increase in throughput by moving to scenario 4.

Page 24 of 132
Project Team: K. L. Dixon (Primary), A. S. Knox, A. D. Cozzi, G. P. Flach and K. A. Hill Thrust Area: ES Project Start Date: October 1, 2014 Project End Date: September 30, 2015
Reactive Amendment Saltstone: A Novel Approach for Improved Sorption/Retention of Radionuclides such as Technetium and Iodine
Low-level radioactive waste at the Savannah River Site (SRS) is blended with a mixture of cementitious materials and pumped into storage vaults where it hardens into a monolith known as saltstone. The release of radionuclides, particularly technetium (99Tc) and iodine (129I), into the environment from saltstone is a concern because these radionuclides are the primary contributors to dose. This study examined the use of reactive amendments (hydroxyapatite, activated
carbon, and two types of organoclays) that prior research suggests may improve retention of 99Tc and 129I. Tests were conducted using surrogates for 99Tc (NaReO4) and 129I (NaI). Results showed that adding up to 10% of organoclay improved the retention of Re without adversely impacting hydraulic properties. To a lesser extent, iodine retention was also improved by adding up to 10% organoclay. Numerical modeling showed that using organoclay as a reactive barrier may significantly retard 99Tc release from saltstone disposal units. FY2015 Objectives The main objective of this project was development of reactive amendment saltstone (RAS) formulations using novel sequestering agents that will improve retention of Tc and I in saltstone. More specific objectives of this project were the following:
• identification of active amendments based on previous research for incorporation into the existing saltstone dry blend,
• development of multiple formulations of reactive amendment saltstone (RAS), • experimental identification of RAS formulations that strongly sorb and retain 99Tc and 129I, • evaluation of basic physical and hydraulic properties of RAS, and lastly to • conduct numerical modeling to demonstrate the selected RAS benefit of improving 99Tc and 129I
retention over model time scales. Introduction The U.S. Department of Energy (DOE) has made a substantial investment in the treatment and disposal of radioactive liquid wastes stored in tanks at the Savannah River Site (SRS). Multiple treatment processes are employed that result in both high and low-level liquid radioactive waste streams. The low-level waste stream is blended with a mixture of cementitious materials at the Saltstone Processing Facility (SPF) and pumped into storage vaults where it hardens into a cement monolith. The release of radionuclides, particularly iodine (129I) and technetium (99Tc), into the environment from saltstone is a primary concern (SRR, 2014). The most recent Special Analysis (SA) conducted for the Saltstone Disposal Facility (SDF) identifies 129I and 99Tc as the primary contributors to dose (SRR, 2014). Dose from 129I and 99Tc is strongly influenced by the partition coefficient (Kd) value over the model time scale (10000 years). Early in the life cycle of saltstone, reducing conditions prevail due to the slag, fly ash, and cement contained in the saltstone dry blend. Under reducing conditions, the speciation of Tc is

Page 25 of 132
dominated by Tc(IV) forming relatively low solubility compounds. For example, at cementitious conditions, the solubility of TcO2∙1.6H2O (a commonly assumed phase) is approximately 1E-8 moles/liter. Under reducing conditions Tc can also form low solubility sulfide compounds, if sufficient reduced sulfur is available. Under reduced conditions, Tc is precipitated and not very mobile. In oxidizing conditions, Tc(VII) exists as pertechnetate (TcO4
-) which is soluble and only weakly sorbs to soils. Thus, under oxidizing conditions, Tc is typically highly mobile due to its low partition coefficient (<1.0 ml/g). Improving the partition coefficient of Tc may significantly reduce dose over the model timescales. Chemically reactive amendments have been used to improve contaminant retention in active capping systems (Knox et al. 2014) and have potential to improve the retention properties of saltstone. Additionally, Li et al. (2014) demonstrated the effectiveness of several active amendments (i.e. sorbents) at removing 99Tc and 129I from groundwater. The objectives of this project were to examine the use of active amendments as additives to the existing saltstone dry blend and to examine the use of active amendments as a reactive barrier to reduce the flux of 99Tc and 129I from saltstone disposal units. Approach Four active amendments were selected for incorporation into the existing saltstone dry blend – hydroxyapatite, activated carbon, organoclay-OCB (ClayFlocTM 750), and organoclay-MRMTM (Figure 1).
Figure 1 - Amendments tested for development of RAS.

Page 26 of 132
Figure 2 - Preparation of RAS formulations. Saltstone dry blend is comprised of 45% blast furnace slag, 45% fly ash, and 10% Portland cement. Active amendments were incorporated into the saltstone dry blend on a weight percentage basis by replacing an equivalent amount of fly ash. Eleven formulations, with up to 10% active amendment, were batched with salt simulant spiked with non-radioactive surrogates for 99Tc (NaReO4) and 129I (NaI). Samples were poured in 2x4 inch plastic molds and allowed to cure for at least 28 days at ambient temperature under laboratory conditions (Figure 2). Following the minimum 28 day curing period, samples from each formulation were crushed to yield a sand fraction and subjected to EPA 1311 toxicity characteristic leaching protocol (TCLP) testing using extraction fluid 1, extraction fluid 2, and a 10% nitric acid fluid (Figure 3). Aliquots from the leaching tests were submitted for both rhenium and iodine analysis. For rhenium analysis, samples were analyzed by Inductively Coupled Plasma–Atomic Emission Spectrometry (SRNL, 2014). For iodine analysis, samples were analyzed by Gas Chromatography–Mass Spectrometry (Zhang, 2010). The results from the TCLP testing were used as a screening tool to identify the most promising amendments. Based on the TCLP results, batch sorption experiments were conducted similar to those described by Li et al. (2014) except that spiked salt simulant was used as the test fluid rather than simulated groundwater. Sorption to the selected amendments was calculated as described by Li et al. (2014). Sorption coefficients determined from these experiments were used in the existing saltstone performance assessment (PA) model to demonstrate potential benefit (i.e. dose reduction) from the incorporation of the active amendments in the saltstone dry blend.
Figure 3 - Two TCLP extractions for screening successful RAS formulations. Sample preparation (gravel and sand fractions) and extraction process (120 samples).

Page 27 of 132
Samples containing the selected active amendments were tested for compressive strength following ASTM C39/C39M and hydraulic conductivity following ASTM D-5084 (Figure 4). The results of these tests were compared to the properties of the baseline saltstone formulation to identify impacts to performance properties associated with incorporation of the active amendments into the saltstone dry blend.
Figure 4 - Uniaxial compressive strength and hydraulic conductivity of RAS was measured following ASTM methods. Results/Discussion Identification of RAS formulations that strongly sorb and retain 99Tc and 129I Multiple extractions were performed on the 11 RAS formulations loosely following the EPA 1311 TCLP procedure. Extractions were initially performed using the standard TCLP extraction fluids and subsequently using a 10% nitric acid fluid for selected amendments. These extracts were selected to assure performance of RAS formulations under changing conditions (pH and redox); these conditions determine Tc and I speciation and their retention in saltstone as indicated by Kaplan (2009) and Li and Kaplan (2012). Analytical results from these leaching experiments indicate that organoclay-OCB and organoclay-MRMTM have the most potential for improving sorption and retention of Tc and to a lesser extent I (Figures 5-7) even under drastically changing pH values from 12 to 2.

Page 28 of 132
Figure 5 - Desorption percentage of rhenium from baseline and RAS formulations with active amendments based on two TCLP Extraction Fluids, fluid 1 and 2 with the final pH 12 and 10 after contact with saltstone or RAS, respectively.
Figure 6 - Desorption percentage of rhenium from active amendments using 10% nitric extract.

Page 29 of 132
Figure 7 - Desorption percentage of iodine from baseline and RAS formulations with active amendments based on two TCLP Extraction Fluids, fluid 1 and 2 with the final pH 12 and 10 after contact with saltstone or RAS, respectively. Based on the results of the desorption experiments, organoclay-OCB and organoclay-MRMTM were selected as the most promising amendments. Batch sorption experiments were conducted with these amendments using spiked salt simulant. Iodine analysis proved problematic and as a result no useful iodine data were obtained from the sorption experiments. Sorption coefficients were calculated for rhenium using 10 replicates for each amendment. The calculated rhenium sorption coefficients for organoclay-OCB and organoclay-MRMTM were 29.1 (pH~13) and 48.5 ml/g (pH~13), respectively (Figure 8). Hydraulic and Physical Properties Samples containing 10% organoclay-OCB, organoclay-MRMTM, and the baseline saltstone formulation were tested for compressive strength and hydraulic conductivity. The compressive strength data are shown in Table 1. The compressive strength of typical SRS saltstone (28 day cure) has been reported by Reigel et al. (2012) as approximately 1850 psi and the minimum requirement for saltstone is 500 psi. Compared to typical saltstone, all three formulations substantially exceeded the strength of typical saltstone including the baseline mix. This may be partially explained by the longer curing period for the samples tested for this project (>90 days compared to >28 days). Although the addition of 10% organoclay (OCB and MRMTM) resulted in a reduction in compressive strength compared to the baseline formulation, both mixes substantially exceeded the minimum required 500 psi.

Page 30 of 132
Figure 8 - Rhenium partition coefficients for organoclay-OCB and organoclay-MRM in salt simulant compared to oxidized saltstone. Table 1. Compressive Strength and Hydraulic Conductivity Data for Test Mixes
Mix ID
> 90-day Compressive Strength (psi)
Hydraulic Conductivity (cm/sec)
Baseline 4599 3.4E-08 10% Organoclay-OCB 2797 1.0E-09 10% Organoclay-MRM 2947 1.5E-08 Hydraulic conductivity tests were conducted on the two formulations containing 10% organoclay (OCB and MRMTM) and the baseline formulation (Table 1). The hydraulic conductivity of typical SRS saltstone is reported as 2.0E-09 cm/sec (Reigel et al. 2012). However, the hydraulic conductivity of saltstone varies considerably as a function of compositional and operational factors and can span more than two orders of magnitude depending on factors such as curing temperature, length of curing, water to premix ratio, and simulant content (Reigel et al. 2011). The hydraulic conductivity of the baseline formulation tested for this project was somewhat higher than typical SRS saltstone. The addition of 10% organoclay (OCB and MRM) did not appear to adversely impact hydraulic conductivity. Performance Assessment Implications Figure 9 depicts PORFLOW simulation results at 15,000 years for Tc-99 transport, dissolved oxygen transport, and reduction capacity consumption for a representative Saltstone Performance Assessment (PA) modeling case (SRNL-STI-2014-00505 Rev. 0). Also, shown is the Tc-99 molar transport rate to the water table from 1000 to 100,000 years. The PA analysis assumes a solubility limit of 1.e-8 mol/L and

Page 31 of 132
negligible sorption (Kd = 0.01 mL/g) in cementitious materials under reducing conditions, and minimal sorption under oxidizing conditions (Kd = 0.5 mL/g). Through 30,000+ years, Tc-99 is released from the bottom of the Saltstone at solubility. In the upper portion of the grout, dissolved oxygen infiltration consumes reduction capacity. Tc-99 released from the upper grout zone migrates downward into the reduced grout region and is recaptured via the solubility limit. The increasing Tc-99 release to the water table is due to increasing advective flow through grout; the concentration is essentially fixed at the solubility limit. When the oxidation front breaks through the bottom of the disposal unit, Tc-99 concentrations increase significantly as indicated by the peak release observed after 30,000 years in the lower-right image of Figure 9. Figure 10 shows the same Tc-99 data from Figure 9 but plotted on linear rather than logarithmic scales and the period 0-10,000 years. Also plotted are the release curves for grout amended with organoclay-OCB and organoclay-MRMTM, which are assumed to increase the sorption coefficient under both reducing and oxidizing conditions to Kd = 29.1 and 48.5 mL/g respectively. The organoclay amendments are observed to have no appreciable impact. The reason is the solubility limit under reducing conditions is controlling the concentration of Tc-99 in the lower portion of grout, rather than sorption. This fact can be seen more clearly from Figure 11, which shows the relationships between liquid and solid phase Tc-99 concentration in the PORFLOW simulations. The baseline and organoclay sorption coefficients impart varying slopes to the liquid versus solid concentration curves, but all three curves flat-line at 1.e-8 mol/L = 1.e-11 mol/mL due to the solubility constraint. The approximate PA initial condition is shown in Figure 11 and corresponds to an effective Kd of 650 mL/g. Because of the high initial inventory of Tc-99, the solid concentration is high and the liquid concentration is controlled by solubility. Figure 12 illustrates simulated Tc-99 release when organoclay amendments are present in the concrete barrier surrounding grout. Here the amendments are observed to significantly retard Tc-99 release through several thousand years. The reason is that Tc-99 concentration is controlled by sorption rather than solubility within the initially clean concrete. Inclusion of organoclay as an amendment to the disposal unit concrete, or as a new permeable reactive barrier, would significantly reduce Tc-99 doses in the 0-1000 year compliance period and beyond.

Page 32 of 132
Figure 9 - PORFLOW results at 15,000 years (SRNL-STI-2014-00505 Figure 11-11) for a representative Saltstone Performance Assessment base case simulation.
Figure 10 - Tc-99 flux to the water table for the FY14 Saltstone Disposal Unit Column Degradation Sensitivity Analysis modeling case (SRNL-STI-2014-00505), without and with organoclays (MRM and OC) added to grout.

Page 33 of 132
Figure 11 - Relationship between liquid and solid phase Tc-99 concentrations in grout in PORFLOW simulations.
Figure 12 - Tc-99 flux to the water table for the FY14 Saltstone Disposal Unit Column Degradation Sensitivity Analysis modeling case (SRNL-STI-2014-00505), without and with organoclays (MRM and OC) added to concrete. FY2015 Accomplishments The primary benefit of this research is a potential reduction in radionuclide mobility achieved through the use of active amendments as a reactive barrier between saltstone and the environment.
The specific accomplishments of the project are the following:

Page 34 of 132
• Identified four active amendments for testing in RAS based on prior research including hydroxyapatite, activated carbon, organoclay-OCB (ClayFlocTM 750), and organoclay-MRMTM.
• Developed and batched eleven formulations of RAS with up to 10% (weight percent basis) active amendments.
• Conducted leaching experiments using three different extraction fluids to identify successful formulations of RAS. Organoclay-OCB and organoclay-MRMTM were identified as the most promising for improved retention of technetium and iodine on saltstone.
• Conducted batch sorption experiments using organoclay-OCB and organoclay-MRMTM and spiked salt simulant to determine partition coefficients.
• Measured compressive strength of RAS containing 10% organoclay (OCB and MRMTM). Compressive strength of RAS was somewhat lower than baseline but substantially exceeded design criteria of 500 psi.
• Conducted numerical modeling using existing saltstone PA model to investigate potential benefits from incorporating organoclays into the saltstone dry blend.
• Conducted numerical modeling using existing saltstone PA model to investigate potential benefits from incorporating organoclays into reactive barriers.
Future Directions
• Verification of long term sorption/desorption of radionuclides (or surrogates) from RAS and concrete formulations containing organoclays
• Verify partition coefficients used in numerical modeling • Evaluate the cost of incorporating organoclay into the concrete surrounding saltstone or as a
new permeable barrier
FY 2015 Publications/Presentations 1. Presented poster at SRNL Annual LDRD Year End Review 2. Dixon, K. L., Knox, A. S., Cozzi, A. D., Flach, G. P., Hill, K. A. Reactive Amendments Saltstone: A Novel
Approach for Improved Sorption/Retention of Radionuclides such as Technetium and Iodine. Summary Report for LDRD-2015-00001, SRNL-STI-2015-00476 (in draft).
References 1. ASTM, “Standard Test Method for Compressive Strength of Cylindrical Concrete Specimens,” ASTM
C39/39M, (2010). 2. ASTM, “Standard Test Methods for Measurement of Hydraulic Conductivity of Saturated Porous
Materials Using a Flexible Wall Permeameter,” ASTM D-5084, (2003). 3. Dien, L. and Kaplan, D. I., 2012. Solubility of Technetium Dioxides (TcO2-c, TcO2∙1.6H2O and
TcO2∙2H2O) in Reducing Cementitious Material Leachates: A Thermodynamic Calculation, SRNL-STI-2012-00769, Revision 1, Savannah River National Laboratory, Aiken, SC.
4. G. P. Flach, G. P. and Taylor, G. A. 2014. Sensitivity Analysis for Saltstone Disposal Unit Column Degradation Analyses. SRNL-STI-2014-00505, Revision 0. October 2014.
5. Kaplan, D. I. 2009. Geochemical Data Package for Performance Assessment Calculations Related to the Savannah River Site, SRNL-STI-2009-00473, Revision 0, Savannah River National Laboratory, Aiken, SC.
6. Kaplan, D. I. and Knox, A. S. (2013). Identifying Optimal Applications for Low-cost, Highly Effective Sorbents for Cs, I, & Tc. LDRD-2013-00010, Final Report.

Page 35 of 132
7. Knox, A.S., Paller, M.H., and Dixon, K. L. 2014. Evaluation of active cap materials for metal retention in sediments, Remediation: The Journal of Environmental Cleanup Costs, Technologies, & Techniques, 24(3):49-69.
8. Li, D., Kaplan, D. I., Knox, A. S., Crapse, K. P., Diprete, D. P. 2014. Aqueous 99Tc, 129I, and 137Cs removal from contaminated groundwater and sediments using highly effective low-cost sorbents, Journal of Environmental Radioactivity, 136, 56-63.
9. Reigel, M. M., T. B. Edwards, and B. R. Pickenheim. 2011. Process Formulations and Curing Conditions that Affect Saltstone Properties, SRNL-STI-2011-00665, Revision 0, Savannah River National Laboratory, Aiken, SC.
10. Reigel, M. M., B. R. Pickenheim, and W. E. Daniel. 2012. Operational and Compositional Factors that Affect the Performance Properties of ARP/MCU Saltstone Grout, SRNL-STI-2012-00558, Revision 0, Savannah River National Laboratory, Aiken, SC.
11. SRNL. 2014. Inductively Coupled Plasma – Atomic Emission Spectrometer Agilent 730 ES Operating Procedure, ITS-0079, Savannah River National Laboratory, Aiken, SC.
12. SRR. 2014. FY2014 Special Analysis for the Saltstone Disposal Facility at the Savannah River Site. SRR-CWDA-2014-00006, Revision 1.
13. Zhang, S.; Schwehr, K. A.; Ho, Y. F.; Xu, C.; Roberts, K. A.; Kaplan, D. I.; Brinkmeyer, R.; Yeager, C. M.; Santschi, P. H. 2010. A Novel Approach for the Simultaneous Determination of Iodide, Iodate and Organo-Iodide for I-127 and I-129 in Environmental Samples Using Gas Chromatography-Mass Spectrometry. Environmental Science & Technology 2010, 44 (23), 9042-9048.
Acronyms AC Activated Carbon GC-MS Gas Chromatography-Mass Spectrometry HA Hydroxyapatite I iodine ICP-AES Inductively Coupled Plasma-Optical Emission Spectrometry Kd partition coefficient M molar MRM Organoclay-MRM OC Organoclay-OCB PRB permeable reactive barriers RAS reactive amendment saltstone Re rhenium SRS Savannah River Site Tc technetium TCLP Toxicity Characteristic Leaching Protocol wt% weight percent

Page 36 of 132
Functionalized Magnetic Mesoporous Silica Nanoparticles for U and Tc Removal
Remediation of U and Tc remains an unresolved technical challenge because U adsorbs weakly to sediment minerals at pH ≤ 4 (e.g., F-Area) and pH > 8 (e.g., Hanford, Idaho National Lab, and the former Yucca Mt. repository), and Tc has little or no adsorption to common environmental minerals. The overarching objective of this project was to develop novel and cost-effective functionalized magnetic mesoporous silica nanoparticles
(MMSNs) for U and Tc removal. Mesoporous silica nanoparticles (MSNs) and MMSNs were successfully functionalized by grafting various functional molecules. The functionalized MSNs and MMSNs removed 2-6 orders of magnitudes greater amounts of U from pH = 3.5 or pH = 9.6 groundwater than unfunctionalized nanoparticles or silica. The adsorption reactions were fast and completed within one hour, and the removal capacities could be up to 40 mg/g and 130 mg/g from the pH 3.5 and 9.6 groundwater, respectively. In addition, these MMSNs were effective and fast for U extraction from seawater, with Kd up to 1.4×10⁵ mL/g, and a U-binding capacity up to 50 mg/g. The chemical bonding mechanisms between U species and functional ligands were determined using synchrotron radiation X-ray absorption spectroscopy. These results provide an applied scientific foundation for solving critical DOE and industrial needs related to nuclear environmental stewardship and nuclear power production.
FY2015 Objectives • Synthesis and characterization of four new functionalized magnetic mesoporous silica nanoparticles
(MMSNs), as well as additional samples of the functionalized MMSNs developed during FY14. • Determination of adsorption capacity and kinetics of U removal from pH = 3.5 and 9.6 groundwater,
and seawater simulant, by the functionalized MMSNs. • Determination of geochemical parameters (e.g., pH, ion strength) in which the functionalized
MMSNs are effective for U removal. • Characterization of U bonding to nanoparticles by various spectroscopic and microscopic methods. • Separation and regeneration of U-loaded nanoparticles.
Introduction U is the most common radioactive contaminant in the DOE complex, at U mine / processing sites, and fuel cell rod storage basins. There are two common oxidation states of U in natural environments and waste streams, U(IV) and U(VI). U(VI) is normally more mobile, bioavailable and toxic than its counterpart U(IV). The aqueous U(VI) species exists commonly in extremely acidic (pH < 4) or naturally-occurring basic carbonate (pH > 8) conditions. It has little or zero adsorption to sediments under pH < 4 or pH > 8 aqueous conditions due to repulsive surface charges between U species and sediment minerals,[1] which leads to severe difficulties in its remediation. Existing technologies for U contaminant treatment include various biotic and abiotic reduction processes.[2, 3] However, these processes have
Project Team: D. Li, D. I. Kaplan, S. M. Serkiz, S. Larsen (University of Iowa) Thrust Area: ES Project Start Date: October 1, 2014 Project End Date: September 30, 2015

Page 37 of 132
several shortcomings in the field applications. There is, therefore, a great need to address this knowledge gap and to develop novel and cost-effective technologies for remediation of acid/base U contaminated systems. In addition, seawater appears as a potentially promising and less environmentally damaging source for uranium, but additional technology development is necessary. Tc is a key risk driver at the Savannah River Site (SRS) and other DOE environmental management sites (most notably the Hanford Site, Paducah Gaseous Diffusion Plant, and Oak Ridge National Laboratory). The anionic TcO4
- is mobile and difficult to immobilized with sorbents.[4] For waste streams with a high content of TcO4
-, reductant materials (Fe3S4, soluble or structural Fe(II), zero-valence iron) and reducing bacteria can reduce Tc(VII) to Tc(IV) and remove Tc effectively.[5, 6] But like U(IV), the reduced Tc form (e.g., TcO2 • nH2O) is susceptible to re-oxidation under most natural environmental conditions and the mobile TcO4
- will be released to the environments.[7] There are currently no demonstrated technologies that are highly efficient and cost-effective for separation of Tc-containing nuclear waste streams and remediation of aqueous Tc in the contaminated sites. Built on the success of the FY14 project, during FY15, we synthesized and characterized four new surface-functionalized MMSNs, as well as additional samples of the functionalized MMSNs developed during FY14. We determined the adsorption capacity and kinetics of U removal by synthesized functionalized MMSNs from pH 3.5 groundwater, pH 9.6 groundwater, and seawater simulant. Additionally, the effect of key geochemical parameters (e.g., pH, ion strength) on U sorption to the MMSNs were also quantified.
Approach MMSNs were synthesized using surfactant-template self-assembling methods (Figure 1A).[8, 9] Functionalized MMSNs were made by grafting various functional molecules (Figure 1B).[10, 11] All synthesized nanoparticles were characterized using powder X-ray diffraction (PXRD), small angle XRD, thermal gravity analysis (TGA), BET surface area, transmission electron microscope (TEM), and 13C solid-state cross-polarization magnetic resonance spectroscopy (CP-NMR). Functionalized MMSNs were evaluated for U and Tc removal from pH = 3.5 and pH = 9.6 groundwater under atmospheric (PCO2 = 10-3.5 atm) conditions, and for U extraction from seawater simulant. Adsorption coefficient (Kd, mL/g) and the equilibrium sorption capacity (qe, mg/g) were calculated using formula 1 and 2, respectively:
(1)
(2)
Figure 1. Synthesis of functionalized MMSNs

Page 38 of 132
where C0 and C were U or Tc concentrations before and after adsorption, respectively, V was the total volume of liquid phase (i.e., groundwater), and M was the mass of nanoparticle sorbent. Oxidation state and chemical bonding of U onto the functionalized MSNs and MMSNs were investigated using synchrotron radiation X-ray absorption near-edge structure (XANES) and extended X-ray absorption fine structure (EXAFS).
Results/Discussion
1. U removal from pH = 3.5 groundwater Adsorption coefficient (Kd), equilibrium sorption capacity (qe), reaction rate of the functionalized MMSNs for U removal from the pH = 3.5 groundwater are shown in Figure 2A, 2B and 2C, respectively. The Kd values for functionalized MSNs and MMSNs were 4-6 orders of magnitude greater than those of unfunctionalized nanoparticles and silica. The sorption capacity of the functionalized MMSNs for U removal varied, up to 40 mg/g. The sorption reactions were fast, and completed within the first hour.
A
Kd
(mL/
g)
1e-2
1e-1
1e+0
1e+1
1e+2
1e+3
1e+4
1e+5
1 m si
lica
MSNs
MMSNs
MMSNs-NH 2
MMSNs-HS
MSNs-DIM
MMSNs-DIM
MSNs-BT
MMSNs-BT
MSNs-AD
MMSNs-AD
MMSNs-PP
MMSNs-PPI
MMSNs-PAM
AM
MMSNs-PPA
B
Ce (g/mL)0 20 40 60 80 100 120
q e (m
g/g)
0
10
20
30
40MMSNs-BT MMSNs-DIMMMSNs-AD MMSNs-PPMMSNs-PPAMMSNs-PPI
C
Time (hours)0 10 20 30 40 50
q e (m
g/g)
0.0
0.2
0.4
0.6
MMSNs-BT MMSNs-DIMMMSNs-AD MMSNs-PPMMSNs-PPAMMSNs-PPI
Figure 2. Adsorption coefficient (Kd, A), equilibrium sorption capacity (qe, B), and reaction rate (C) of the functionalized MMSNs for U removal from pH = 3.5 groundwater.
2. U removal from pH = 9.6 groundwater
Similarly, the Kd , qe and reaction rate for U onto functionalized MMSNs in the pH = 9.6 groundwater are shown in Figure 3A, 3B, and 3C, respectively. The Kd values for functionalized MSNs and MMSNs were 2-4 orders of magnitude greater than those of unfunctionalized nanoparticles and silica. They removed U from pH = 9.6 groundwater to as low as <0.7 ppb. The sorption capacity of the functionalized MMSNs for U removal varied, up to 130 mg/g. The sorption reactions were fast, and completed within the first hour.
A
Kd
(mL/
g)
1e+1
1e+2
1e+3
1e+4
1e+5
1e+6
1 m si
lica
MSNs
MMSNs
MMSNs-NH 2
MMSNs-HS
MSNs-DIM
MMSNs-DIM
MSNs-BT
MMSNs-BT
MSNs-AD
MMSNs-AD
MMSNs-PP
MMSNs-PPA
MMSNs-PPI
MMSNs-PAM
AM
B
C
Time (hours)0 10 20 30 40 50
q e (m
g/g)
0.0
0.2
0.4
0.6
0.8
MMSNs-BT MMSNs-DIM MMSNs-AD MMSNs-PPMMSNs-PPAMMSNs-PPIMMSNs-PAMAM
Figure 3. Adsorption coefficient (Kd, A), equilibrium sorption capacity (qe, B), and reaction rate (C) of the functionalized MMSNs
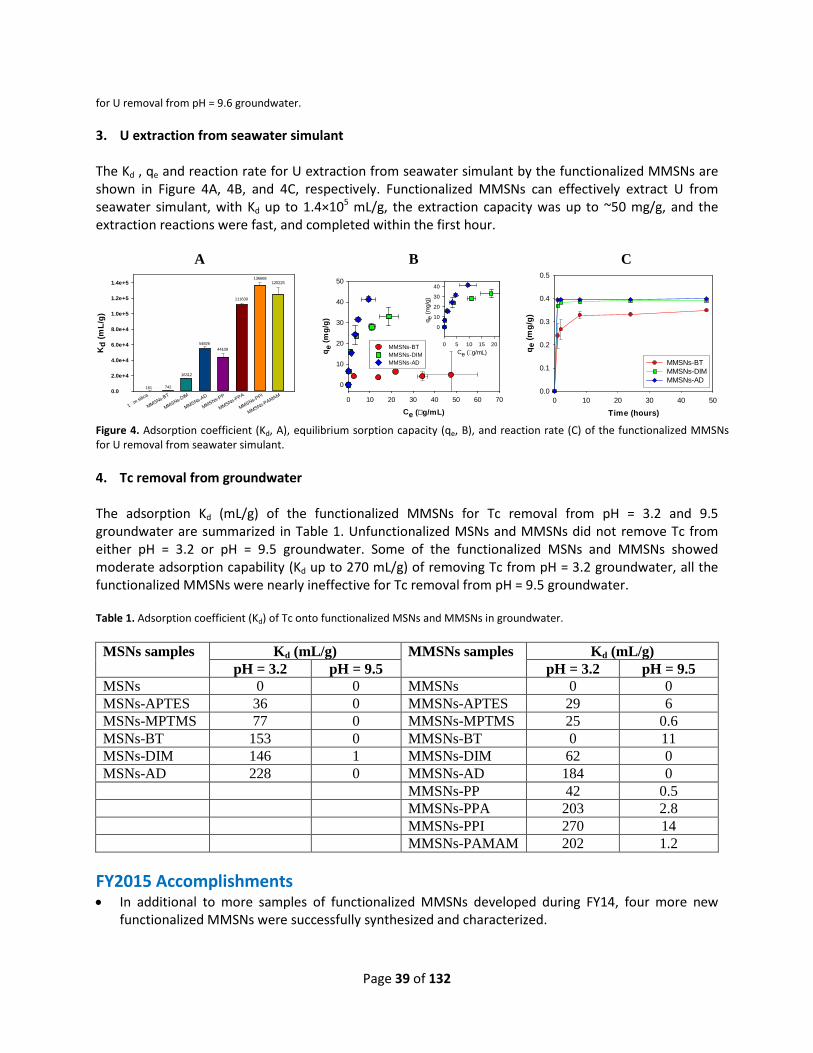
Page 39 of 132
for U removal from pH = 9.6 groundwater. 3. U extraction from seawater simulant The Kd , qe and reaction rate for U extraction from seawater simulant by the functionalized MMSNs are shown in Figure 4A, 4B, and 4C, respectively. Functionalized MMSNs can effectively extract U from seawater simulant, with Kd up to 1.4×10⁵ mL/g, the extraction capacity was up to ~50 mg/g, and the extraction reactions were fast, and completed within the first hour.
A
Kd
(mL/
g)
0.0
2.0e+4
4.0e+4
6.0e+4
8.0e+4
1.0e+5
1.2e+5
1.4e+5
MMSNs-BT
MMSNs-DIM
MMSNs-AD
MMSNs-PP
MMSNs-PPA
MMSNs-PPI
MMSNs-PAMAM
742
16312
5482644109
111639
136668125225
1 m silica
161
B
Ce (g/mL)0 10 20 30 40 50 60 70
q e (m
g/g)
0
10
20
30
40
50
MMSNs-BTMMSNs-DIMMMSNs-AD
Ce (g/mL)0 5 10 15 20
q e (m
g/g)
0
10
20
30
40
C
Time (hours)0 10 20 30 40 50
q e (m
g/g)
0.0
0.1
0.2
0.3
0.4
0.5
MMSNs-BT MMSNs-DIMMMSNs-AD
Figure 4. Adsorption coefficient (Kd, A), equilibrium sorption capacity (qe, B), and reaction rate (C) of the functionalized MMSNs for U removal from seawater simulant. 4. Tc removal from groundwater The adsorption Kd (mL/g) of the functionalized MMSNs for Tc removal from pH = 3.2 and 9.5 groundwater are summarized in Table 1. Unfunctionalized MSNs and MMSNs did not remove Tc from either pH = 3.2 or pH = 9.5 groundwater. Some of the functionalized MSNs and MMSNs showed moderate adsorption capability (Kd up to 270 mL/g) of removing Tc from pH = 3.2 groundwater, all the functionalized MMSNs were nearly ineffective for Tc removal from pH = 9.5 groundwater. Table 1. Adsorption coefficient (Kd) of Tc onto functionalized MSNs and MMSNs in groundwater. MSNs samples Kd (mL/g) MMSNs samples Kd (mL/g)
pH = 3.2 pH = 9.5 pH = 3.2 pH = 9.5 MSNs 0 0 MMSNs 0 0 MSNs-APTES 36 0 MMSNs-APTES 29 6 MSNs-MPTMS 77 0 MMSNs-MPTMS 25 0.6 MSNs-BT 153 0 MMSNs-BT 0 11 MSNs-DIM 146 1 MMSNs-DIM 62 0 MSNs-AD 228 0 MMSNs-AD 184 0 MMSNs-PP 42 0.5 MMSNs-PPA 203 2.8 MMSNs-PPI 270 14 MMSNs-PAMAM 202 1.2
FY2015 Accomplishments • In additional to more samples of functionalized MMSNs developed during FY14, four more new
functionalized MMSNs were successfully synthesized and characterized.

Page 40 of 132
• Functionalized MMSNs were very effective for U removal from pH = 3.5 or pH = 9.6 groundwater under atmospheric PCO2 = 10-3.5 atm.
• At pH = 3.5, U removal was as much as 99%, Kd values increased by a magnitude of 4-6 orders compared to most of common minerals and non-grafted MMSNs. The capacity of the functionalized MMSNs for U removal was up to 40 mg/g. The sorption reactions were fast, and completed within the first hour.
• At pH = 9.6, U removal was nearly 100%, Kd values increased by 2-4 orders of magnitude compared to most of common minerals. They removed U from pH = 9.6 groundwater to as low as <0.7 ppb. The capacity of the functionalized MMSNs for U removal was up to 130 mg/g. The sorption reactions were fast, and completed within the first hour.
• Functionalized MMSNs can effectively extract U from seawater simulant, with Kd up to 1.4×10⁵ mL/g, the extraction capacity was up to ~50 mg/g, and the extraction reactions were fast, and completed within the first hour.
• Some of the functionalized MSNs and MMSNs had moderate Kd values for Tc removal from pH = 3.2 groundwater, but became ineffective in the pH = 9.6 groundwater.
Future Directions • Develop more novel functionalized MMSNs for Tc removal from groundwater and liquid nuclear
wastes. • Conduct spectroscopic and microscopic characterization to determine chemical bonding of U and Tc
species with functional molecules. • Submit publications and a second patent application. References 1. Pabalan, R. T.; Turner, D. R.; Bertetti, F. P.; Prikryl, J. A., Uranium(VI) sorption onto selected mineral surfaces. In Adsorption of Metals by Geomedia: Variable, Mechanisms, and Model Applications, Jenne, E. A., Ed. Academic Press: San Diego, USA, 1998; pp 99-130. 2. Wu, W. M.; Carley, J.; Luo, J.; Ginder-Vogel, M. A.; Cardenas, E.; Leigh, M. B.; Hwang, C. C.; Kelly, S. D.; Ruan, C. M.; Wu, L. Y.; Van Nostrand, J.; Gentry, T.; Lowe, K.; Mehlhorn, T.; Carroll, S.; Luo, W. S.; Fields, M. W.; Gu, B. H.; Watson, D.; Kemner, K. M.; Marsh, T.; Tiedje, J.; Zhou, J. Z.; Fendorf, S.; Kitanidis, P. K.; Jardine, P. M.; Criddle, C. S., In situ bioreduction of uranium (VI) to submicromolar levels and reoxidation by dissolved oxygen. Environmental Science & Technology 2007, 41, (16), 5716-5723. 3. Gu, B.; Liang, L.; Dickey, M. J.; Yin, X.; Dai, S., Reductive precipitation of uranium(VI) by zero-valent iron. Environmental Science & Technology 1998, 32, (21), 3366-3373. 4. Icenhower, J. P.; Qafoku, N. P.; Zachara, J. M.; Martin, W. J., THE BIOGEOCHEMISTRY OF TECHNETIUM: A REVIEW OF THE BEHAVIOR OF AN ARTIFICIAL ELEMENT IN THE NATURAL ENVIRONMENT. American Journal of Science 2010, 310, (8), 721-752. 5. Fredrickson, J. K.; Zachara, J. M.; Kennedy, D. W.; Kukkadapu, R. K.; McKinley, J. P.; Heald, S. M.; Liu, C. X.; Plymale, A. E., Reduction of TcO4- by sediment-associated biogenic Fe(II). Geochimica Et Cosmochimica Acta 2004, 68, (15), 3171-3187. 6. Liang, L. Y.; Gu, B. H.; Yin, X. P., Removal of technetium-99 from contaminated groundwater with sorbents and reductive materials. Separations Technology 1996, 6, (2), 111-122. 7. Morris, K.; Livens, F. R.; Charnock, J. M.; Burke, I. T.; McBeth, J. M.; Begg, J. D. C.; Boothman, C.; Lloyd, J. R., An X-ray absorption study of the fate of technetium in reduced and reoxidised sediments and mineral phases. Applied Geochemistry 2008, 23, (4), 603-617. 8. Feng, X.; Fryxell, G. E.; Wang, L. Q.; Kim, A. Y.; Liu, J.; Kemner, K. M., Functionalized monolayers on ordered mesoporous supports. Science 1997, 276, (5314), 923-926.

Page 41 of 132
9. Wu, P. G.; Zhu, J. H.; Xu, Z. H., Template-assisted synthesis of mesoporous magnetic nanocomposite particles. Advanced Functional Materials 2004, 14, (4), 345-351. 10. Barquist, K.; Larsen, S. C., Chromate adsorption on amine-functionalized nanocrystalline silicalite-1. Microporous and Mesoporous Materials 2008, 116, (1-3), 365-369. 11. Fryxell, G. E.; Mattigod, S. V.; Lin, Y. H.; Wu, H.; Fiskum, S.; Parker, K.; Zheng, F.; Yantasee, W.; Zemanian, T. S.; Addleman, R. S.; Liu, J.; Kemner, K.; Kelly, S.; Feng, X. D., Design and synthesis of self-assembled monolayers on mesoporous supports (SAMMS): The importance of ligand posture in functional nanomaterials. Journal of Materials Chemistry 2007, 17, (28), 2863-2874.

Page 42 of 132
Project Team: H.A. Brant (Primary), and C.R. Shick, Jr. Thrust Areas: ES and NS Project Start Date: October 1, 2014 Project End Date: September 30, 2015
Identification of Mercury Sources in Aquatic Media of Savannah River Site Waters by Isotopic Analysis
Mercury (Hg) is a toxic element that is found both naturally and as an introduced contaminant in most Savannah River Site (SRS) aquatic environments. Extensive research has documented Hg impacts to these waterways; however, none of these studies have been able to investigate Hg isotope fractionation. Recent advances in multi-collector inductively coupled plasma mass spectrometry (MC-ICP-MS) has generated the
ability to conduct highly precise measurements necessary to detect the small differences in isotope ratios of heavy elements, including Hg. Hg has seven stable isotopes that undergo mass dependent and mass independent fractionation. Different processes, both natural and anthropogenic, contribute or alter the fractionation, likely creating a unique isotope ratio. The measurement of this ratio in environmental samples could potentially differentiate between pollution sources and processes. Determining the point source of Hg environmental contamination through the use of isotopic analysis may lead to improved characterization, monitoring and/or modeling and regulation. We propose to measure the Hg isotopic composition of SRS aquatic media to potentially identify Hg sources as they relate to nuclear processing activities, and to explicate the relationship between these sources and their fate in the environment. FY2015 Objectives
• Optimize our existing multi-collector inductively coupled mass spectrometer (MC-ICP-MS) capabilities to include Hg isotopes.
• Determine the Hg isotope composition of aquatic media within streambeds associated with different processing activities of the SRS, and those that are not directly impacted by SRS discharges.
• Determine if the Hg isotope composition of aquatic media differ between the streams that have and have not been impacted by processing activities.
Introduction Hg contamination of the SRS waterways have been well documented.1 This data was referenced to provide insight on the selection of twenty four stream locations for media sampling; including those receiving Hg discharges from different sources of mission related activities and those not influenced by processing activities of the SRS. We would expect to see differences in the Hg isotopes as related to source. The use of Hg isotopic composition to identify source has been demonstrated in sediments downstream of the Y-12 National Security Complex in Oak Ridge, TN (Figure 1).2
Figure 1. Hg isotope composition (δ202Hg vs Δ199Hg) of fine and bulk sediments from different tributaries of the Clinch River, Oak Ridge, TN. The Y-12 derived Hg contamination was distinguishable among other Hg sources of the region.2
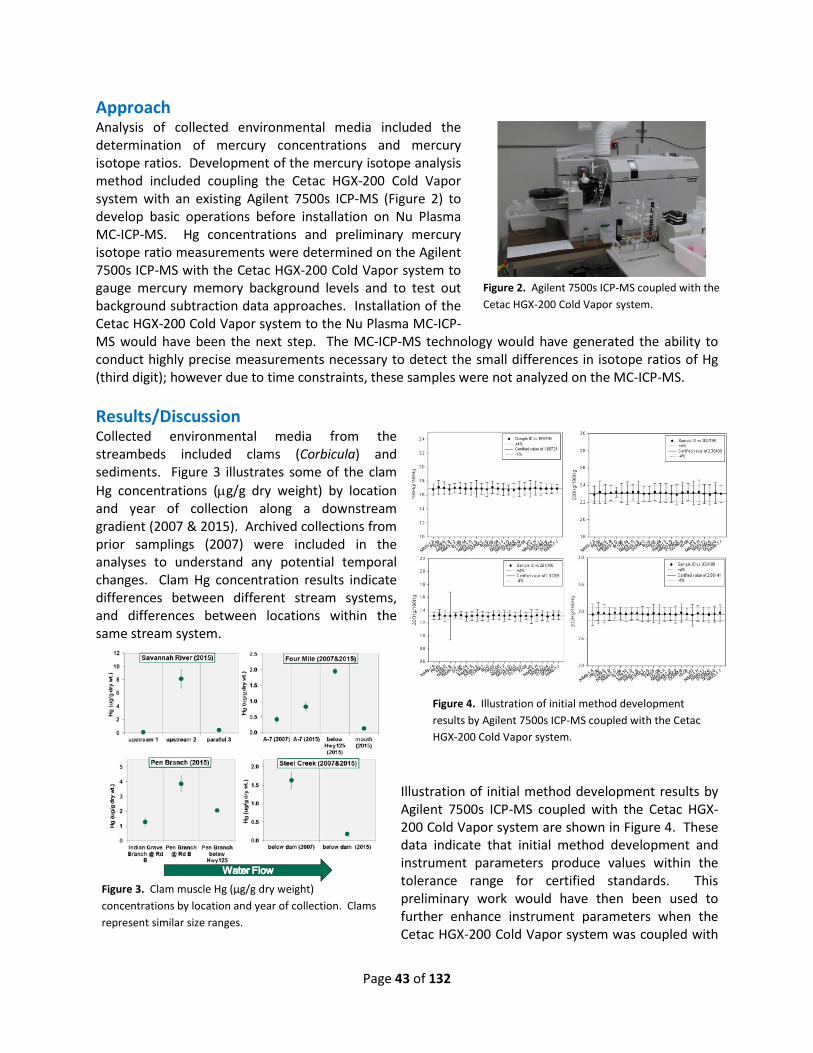
Page 43 of 132
Approach Analysis of collected environmental media included the determination of mercury concentrations and mercury isotope ratios. Development of the mercury isotope analysis method included coupling the Cetac HGX-200 Cold Vapor system with an existing Agilent 7500s ICP-MS (Figure 2) to develop basic operations before installation on Nu Plasma MC-ICP-MS. Hg concentrations and preliminary mercury isotope ratio measurements were determined on the Agilent 7500s ICP-MS with the Cetac HGX-200 Cold Vapor system to gauge mercury memory background levels and to test out background subtraction data approaches. Installation of the Cetac HGX-200 Cold Vapor system to the Nu Plasma MC-ICP-MS would have been the next step. The MC-ICP-MS technology would have generated the ability to conduct highly precise measurements necessary to detect the small differences in isotope ratios of Hg (third digit); however due to time constraints, these samples were not analyzed on the MC-ICP-MS. Results/Discussion Collected environmental media from the streambeds included clams (Corbicula) and sediments. Figure 3 illustrates some of the clam Hg concentrations (µg/g dry weight) by location and year of collection along a downstream gradient (2007 & 2015). Archived collections from prior samplings (2007) were included in the analyses to understand any potential temporal changes. Clam Hg concentration results indicate differences between different stream systems, and differences between locations within the same stream system.
Illustration of initial method development results by Agilent 7500s ICP-MS coupled with the Cetac HGX-200 Cold Vapor system are shown in Figure 4. These data indicate that initial method development and instrument parameters produce values within the tolerance range for certified standards. This preliminary work would have then been used to further enhance instrument parameters when the Cetac HGX-200 Cold Vapor system was coupled with
Figure 2. Agilent 7500s ICP-MS coupled with the Cetac HGX-200 Cold Vapor system.
Figure 4. Illustration of initial method development results by Agilent 7500s ICP-MS coupled with the Cetac HGX-200 Cold Vapor system.
Figure 3. Clam muscle Hg (µg/g dry weight) concentrations by location and year of collection. Clams represent similar size ranges.

Page 44 of 132
the Nu Plasma MC-ICP-MS. Time constraints did not allow for this step; however, the preliminary work with the Agilent 7500s demonstrated that collected clams and sediments for various locations were processed and measured for total Hg concentrations. Also, the Agilent 7500s coupled with the Cetac HGX-200 Cold Vapor System was used to test out background concerns and correction methods. As a proof-of-concept, natural Hg isotope ratios for natural Hg material as well as collected samples were observed and supported further work with the Nu Plasma MC-ICP-MS coupled with the Cetac HGX-200 Cold Vapor System. FY2015 Accomplishments
• Sampled twenty four stream locations that encompass regional background, those impacted by site activities, and those impacted by non-site activities.
• Developed an analytical process that allowed an understanding of laboratory and reagent backgrounds, certified reference material recovery in tolerance ranges, and initial instrument parameters that produce acceptable precision for initial coupling.
• Demonstrated initial results, both concentration and ratios, utilizing the Agilent 7500s ICP-MS coupled with the Cetac HGX-200 Cold Vapor system.
Future Directions
• Complete Hg concentration analysis for all samples. • Determine Hg isotope variations with the Cetac HGX-200 Cold Vapor system coupled to Nu
Plasma MC-ICP-MS. High precision needed for fractionation determinations (δxxxHg and ΔxxxHg).
• Collaborate with University of Michigan to further instrument method development or employ their services for analyses.
• Summarize data, compare findings to literature, and submit for publication. Describe what will be done next and future anticipated accomplishments.
FY 2015 Publications/Presentations
1. Year End Review poster presentation. October 29th, 2015. Aiken, SC. References
1. Final Report on the Aquatic Mercury Assessment Study. N.V. Halverson, J.A. Bowers, M.H. Paller, D.G. Jackson, J.K. King, D.L. Dunn. 2008. SRNS-STI- 2008-00106. doi:10.2172/939852.
2. Identification of Multiple Mercury Sources to Stream Sediments near Oak Ridge, TN, USA. Patrick M. Donovan, Joel D. Blum, Jason D. Demers, Baohua Gu, Scott C. Brooks, and John Peryam. Environmental Science & Technology. 2014. 48 (7), 3666-3674.
Acronyms Hg-Mercury SRS- Savannah River Site ICP-MS-Inductively Coupled Mass Spectrometer MC-ICP-MS- Multi-Collector Inductively Coupled Mass Spectrometer

Page 45 of 132
PI: S. Xiao, H. T. Sessions, J. Klein, R. Rabun
R&D team: L. Angelette (postdoc), J. Cooper (Tritium Intern), B. Randall, D. Allison, S. Redd
SRNS support (tritium study): T. Young, L.Youmans, J. Hutchison, K. Damon
Subcontract: Clemson University
Thrust Area(s): ES and NS Project Start Date: October 1, 2014 Project End Date: September 30, 2015
Development of Liquid Phase Water Detritiation Technology
An innovative 3-step SRNL concept is being developed, leverageing the SRNL expertise in isotope separation. Lab capability was established in SRNL to develop water isotope separation technologies, including analytical method for trace levels of deuterium analysis. Experimental separation of HDO/H2O was achieved as a surrogate for HTO/H2O detritiation process. The project is ahead of schedule, and has added an additional task of a university contract to investigate water isotope separation using a Nafion membrane. The team worked very hard, and obtained initial tritium data by the end of FY15. A preliminary tritium study demonstrated 17% tritium removal in a short one-foot packed
column using a 1900 pCi/ml environmental water sample. The innovative water detritiation process, if fully developed, could have broad impacts to heavy water from SRS legacy moderator, TVA (Tennessee Valley Authority) cooling water, nuclear power industry, and environmental remediation, etc. The continuation of this project is critical to develop this discovery.
FY2015 Objectives
• Acquire capability of trace level quantitative analysis of HDO in H2O • Establish experimental separation of HDO from H2O
Introduction An efficient water detritiation process, if fully developed, could have broad impacts to heavy water from SRS legacy moderator, TVA (Tennessee Valley Authority) cooling water, nuclear power industry, and environmental remediation, etc. Over the past four decades no breakthrough technologies have been developed to process tritium-contaminated water efficiently and economically [1-5] despite continuing interest and efforts. A number of materials/processes have been reported to have isotopic effects with water molecules [6-8], including a SRS patent [9] by Dr. Myung Lee (inventor of TCAP-Thermal Cycling Absorption Process). The potential for a direct isotope separation of water molecules is of considerable interest. This project achieved direct HDO/H2O separation experimentally as a surrogate for HTO/H2O separation. Further fundamental studies on isotope separation factor and separation mechanisms would augment this breakthrough development. Until now, no technology existed to remove low levels of tritium contamination economically. Approach A novel three-step engineering concept is illustrated in Figure 1 as an example configuration. • Scalable 3-Step Concept Water Detritiation Process

Page 46 of 132
o WIE (Water Isotope Exchange) - discharge majority clean water and develop tritium concentration profile along the column
o CIE (Catalytic Isotope Exchange) to regenerate the column and to convert HTO into HT gas o TCAP to separate HT/H2
• Collaboration between the SRNL Environmental & Waste Management and National Security directorates in this area (between DOE EM and NNSA)
a) Water Isotope Exchange for Cleaning b) Catalytic Isotope Exchange for Regeneration
Figure 1. Conceptual 3-step process cleans up tritiated water with no secondary contaminated streams Effective treatment of low-level tritiated water is technically very challenging due to the large volume of water that needs processing. However, the extremely low concentration also provides ample capacity for a column to remove tritiated water if the isotopic separation factor is adequate to establish a concentration profile. In the SRNL 3-step concept, TCAP is a mature technology for elemental hydrogen isotope separation. CIE has been demonstrated at SRS with 1,000 DF (decontamination factor) and 99.9% tritium recovery [10]. The development of WIE is critical for the success of the SRNL concept and herein the focus of this project.
Results/Discussion To develop technologies in the laboratory on removal of low concentrations of tritiated water, deionized water with about 150 ppm deuterium (natural abundance) was used for HDO/H2O separation experiments as a surrogate for H2O/HTO separation. The first challenge was the accurate analysis of the
isotopeexchangecolumn6' ID x 70'
condensercontaminated water16.8 ppt tritium (6,000 Bq/ml)1000 T/day (1.0 LHSV)
clean water, H2O (HTO < 60 Bq/ml)
Triti
um c
once
ntra
tion
prof
ile
TCAP
isotopeexchangecolumn6' ID x 70'
condenser
heater
gas /vapor
100 vol ppm HT in H2
H2 stripping
TCAP
ExhaustH2: 52 liter/hr0.1 ppm T2
T2: 62 ml/day99% recovery
H2O +HTO + O H O THT +H2 + O T O HPt

Page 47 of 132
trace levels of deuterium. Several instruments were considered, including Residual Gas Analyzer (RGA mass spectrometer), Fourier Transform Infrared Spectroscopy (FTIR), precision densitometer, and refractive index. Tunable laser spectroscopy was identified as the best analytical method for the experiments. Instruments were acquired and methods were developed for determining trace amounts of deuterium in water. Figure 2 shows the instrument calibration of water standards. Water isotope D/H ratio is reported by the analytical instrument as δD‰ – a deviation from the natural abundance at 155.76 ± 0.1 ppm (Vienna standard mean ocean water), calculated with the following equation.
ppm deuterium 1000
‰76.15576.155 =×+
Dd
Figure 2. Trace Level Water D/H Calibration
Figure 3. HDO/H2O Separation over Time
Direct HDO/H2O separation was achieved experimentally in a packed column (Figure 3). HDO removal capacity reached about 400 µmol D/g column packing material, which is huge for tritiated water typically at 10-12 molar T/H ratio. The breakthrough finding has significance in water detritiation since the HTO/H2O separation follows the same principle but has even greater isotopic effect.
By collaborating with the Environmental Bioassay and Analytical Laboratory in 735-B (SRNS), water detritiation was confirmed using an environmental water sample with 1900 pCi/mL tritium. Preliminary results show a reproducible 17% reduction in tritium from a one-foot short column, emphasizing that tritium removal was successful from low-concentration tritium feed water. The results imply over 50% tritium removal with a 4-foot column, or 99% tritium removal with a 25-foot column. The continuation of this project is critical to develop this breakthrough discovery.
FY2015 Accomplishments The project is currently ahead of schedule as evidenced in the following milestone status:
Go/No-go Milestone Target Date Completion Date
Acquire capability of trace level quantitative analysis of HDO in H2O
February 2015 December 2014
Establish experimental separation of HDO from H2O August 2015 February 2015
Additional scope: Clemson university contract for HDO / H2O separation using Nafion membrane
September 2015 July 2015

Page 48 of 132
Collected initial tritium data (exceeding expectations) 2017 September 2015 Future Directions • Parameter study for process optimization
o For throughput, column capacity, decontamination factor (DF) • Fundamental studies on isotope separation
o isotope separation factor (SF) o separation mechanisms
• Follow up Clemson subcontract o water isotope separation using bithermal Nafion membrane o improve Myung Lee's patented process
FY 2015 Publications/Presentations Henry T. Sessions Jr, Xin Xiao, “Potential health effects of Deuterium depleted water”, SRNL-MS-2015-00077, presented to Department of Neuroscience and Regenerative Medicine, Georgia Regents University, Augusta, GA, May 14, 2015. References 1. K. H. Lin, “Tritium Enrichment by Isotope Separation Technique”, ORNL-TM-3976, Oak Ridge
National Laboratory, 1972. 2. H. K. RAE, “Selecting Heavy Water Processes” in Separation of Hydrogen isotopes, ACS Symposium
Series 68, Washington D.C., (1978), Chalk River Nuclear Laboratories, Atomic Energy of Canada, Ontario, Canada.
3. C. M. King, V. V. Brunt, R. B. King, A. R. Garber, “Concepts for Detritiation of Waste Liquids”, WSRC-MS-91-027, Savannah River Site, 1991.
4. H. H. Fulbright, A. L. Schwirian-Spann, B. B. Looney, K. M. Jerome, V. Van Brunt, “Status and Practicality of Detritiation and Tritium Production Strategies for Environmental Remediation”, Savannah River Site, WSRC-RP-96-0075, 1996.
5. D.J. Geniesse, G.E. Stegen, “2009 Evaluation of Tritium Removal and Mitigation Technologies for Wastewater Treatment”, DOE/RL-2009-18, Hanford Site.
6. Y. Iwai, T. Yamanishi, “Isotopic Distribution Coefficient of Tritiated Water Adsorbed on Faujasite-Type Zeolite”, Fusion Science and Technology, Vol 56, 158, 2009.
7. S. Tanaka, F. Ono, Y. Takahashi, R. Kiyose, “Removal of Tritiated Water Vapor by Adsorption on Molecular Sieves - Effects of Co-Existing H2O”, Fusion Technol. 8 (1985) 2196.
8. X. Cao, G. Cheng, “Reemission of Tritium from Tritium-Sorbed Molecular Sieve”, Fusion Sci. Technol. 48 (2005) 593.
9. Myung W. Lee, “Method and Apparatus for Separation of Heavy and Tritiated Water”, US Patent 6,332,914 (2001).
10. L.K. Heung, G.W. Gibson, M.S. Ortman, “Tritium Stripping by a Catalytic Exchange Stripper”, Fusion Technology, Vol. 21, 588, 1992.
Acronyms CIE - Catalytic Isotope Exchange DF - Decontamination Factor EM – Environmental Management

Page 49 of 132
FTIR - Fourier Transform Infrared Spectroscopy LDRD - Laboratory Directed Research and Development NNSA - National Nuclear Security Administration RGA – Residue Gas Analyzer (mass spectrometer) SF – Separation Factor SRS – Savannah River Site SRNL - Savannah River National Laboratory SRNS - Savannah River Nuclear Solutions, LLC. TCAP - Thermal Cycling Absorption Process TVA - Tennessee Valley Authority WIE – Water Isotope Exchange

Page 50 of 132
Project Team: K. M. L. Taylor-Pashow (Primary), and D. T. Hobbs Thrust Area: ES Project Start Date: March 1, 2014 Project End Date: September 30, 2015
Large Particle Titanate Sorbents
This research project was aimed at developing a synthesis technique for producing large particle size monosodium titanate (MST). Two approaches were evaluated, increasing the particle size of the material enough to improve filtration performance in batch contact deployment, and preparing a form of the material suitable for column deployment. Filtration performance of larger particle MST was improved in dead-end filtration testing; however,
filtration testing on a crossflow filter did not show improved filtration rate over the baseline material. Attempts were also made to coat zirconium oxide microspheres (196 µm) with MST to prepare a large spherical particle for column deployment. These attempts proved unsuccessful. An alternate approach was then taken to synthesize a porous MST monolith that could be deployed in a column configuration. Conditions were found to prepare an MST monolith that showed comparable Sr uptake to a previously evaluated form of engineered MST. FY2015 Objectives
• Scale-up synthesis of large particle MST to confirm reproducibility and prepare sufficient material for crossflow filter testing
• Examine performance of material in a crossflow filter and compare to baseline MST • Prepare MST in a form suitable for column deployment
Introduction The high level waste (HLW) mission at SRS involves the processing of sludge and salt (supernate and saltcake). The sludge is incorporated in HLW glass during the vitrification process, while the salt is treated to remove Cs, Sr, and actinides. The separated radionuclides are incorporated into the HLW borosilicate glass along with the sludge during the vitrification process, while the decontaminated salt solution is disposed of onsite in a grout waste form referred to as Saltstone. The current salt treatment processes are performed at the pilot-scale Actinide Removal Process (ARP) and Modular Caustic-Side Solvent Extraction Unit (MCU) facilities. The larger Salt Waste Processing Facility (SWPF), currently under construction, is designed to have a throughput of about seven times that of the ARP/MCU facilities.
Filtration is the current throughput-limiting step in the ARP/MCU and SWPF. It is believed that the particle size and particle size distribution of the MST are significant contributors to low filtration fluxes that have been observed in the ARP facility. Current purchase specifications allow the vendor to supply MST powder that has as much as 10% of the material with a particle size less than 0.8 μm. The nominal pore diameter of the crossflow filter used in the ARP facility and SWPF is 0.1 μm, and a 0.5-μm filter was recently installed. Thus, the possible high fraction of fines less than 0.8 μm could be plugging the pores of the crossflow filter media resulting in reduced filtration flux. Increasing the particle size and narrowing the particle size distribution would be expected to increase the filter performance and,
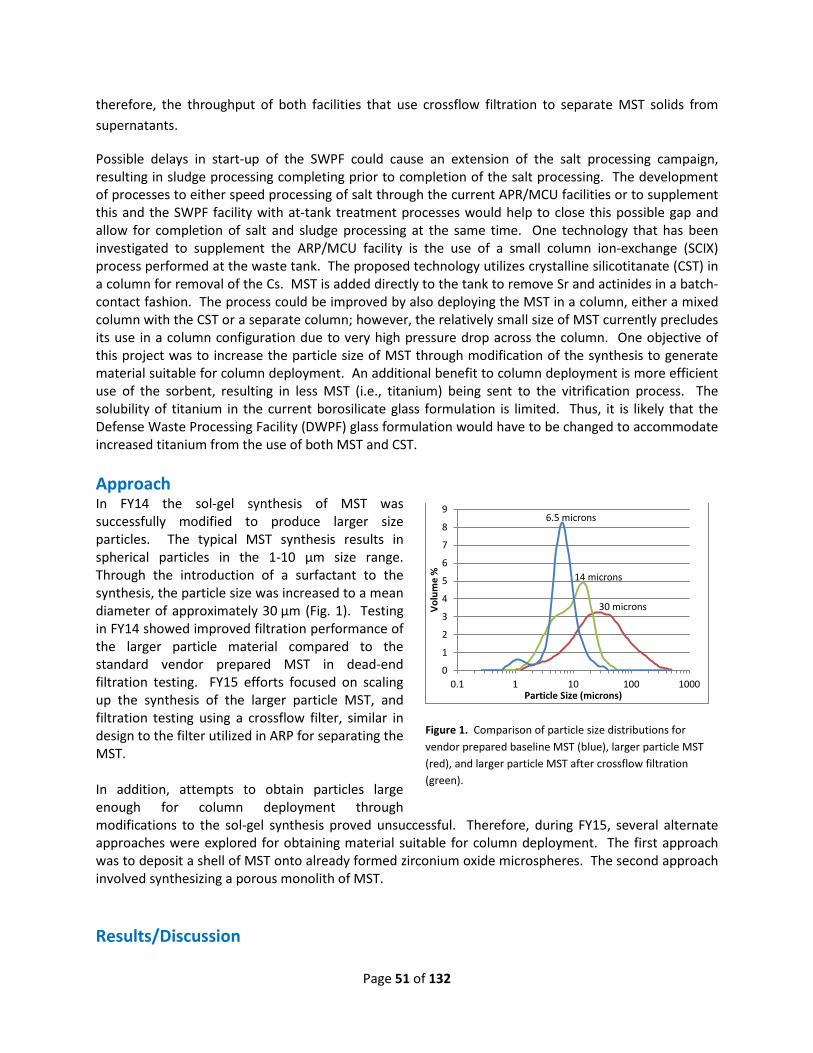
Page 51 of 132
therefore, the throughput of both facilities that use crossflow filtration to separate MST solids from supernatants.
Possible delays in start-up of the SWPF could cause an extension of the salt processing campaign, resulting in sludge processing completing prior to completion of the salt processing. The development of processes to either speed processing of salt through the current APR/MCU facilities or to supplement this and the SWPF facility with at-tank treatment processes would help to close this possible gap and allow for completion of salt and sludge processing at the same time. One technology that has been investigated to supplement the ARP/MCU facility is the use of a small column ion-exchange (SCIX) process performed at the waste tank. The proposed technology utilizes crystalline silicotitanate (CST) in a column for removal of the Cs. MST is added directly to the tank to remove Sr and actinides in a batch-contact fashion. The process could be improved by also deploying the MST in a column, either a mixed column with the CST or a separate column; however, the relatively small size of MST currently precludes its use in a column configuration due to very high pressure drop across the column. One objective of this project was to increase the particle size of MST through modification of the synthesis to generate material suitable for column deployment. An additional benefit to column deployment is more efficient use of the sorbent, resulting in less MST (i.e., titanium) being sent to the vitrification process. The solubility of titanium in the current borosilicate glass formulation is limited. Thus, it is likely that the Defense Waste Processing Facility (DWPF) glass formulation would have to be changed to accommodate increased titanium from the use of both MST and CST. Approach In FY14 the sol-gel synthesis of MST was successfully modified to produce larger size particles. The typical MST synthesis results in spherical particles in the 1-10 µm size range. Through the introduction of a surfactant to the synthesis, the particle size was increased to a mean diameter of approximately 30 µm (Fig. 1). Testing in FY14 showed improved filtration performance of the larger particle material compared to the standard vendor prepared MST in dead-end filtration testing. FY15 efforts focused on scaling up the synthesis of the larger particle MST, and filtration testing using a crossflow filter, similar in design to the filter utilized in ARP for separating the MST. In addition, attempts to obtain particles large enough for column deployment through modifications to the sol-gel synthesis proved unsuccessful. Therefore, during FY15, several alternate approaches were explored for obtaining material suitable for column deployment. The first approach was to deposit a shell of MST onto already formed zirconium oxide microspheres. The second approach involved synthesizing a porous monolith of MST. Results/Discussion
Figure 1. Comparison of particle size distributions for vendor prepared baseline MST (blue), larger particle MST (red), and larger particle MST after crossflow filtration (green).
0
1
2
3
4
5
6
7
8
9
0.1 1 10 100 1000
Volu
me
%
Particle Size (microns)
30 microns
14 microns
6.5 microns
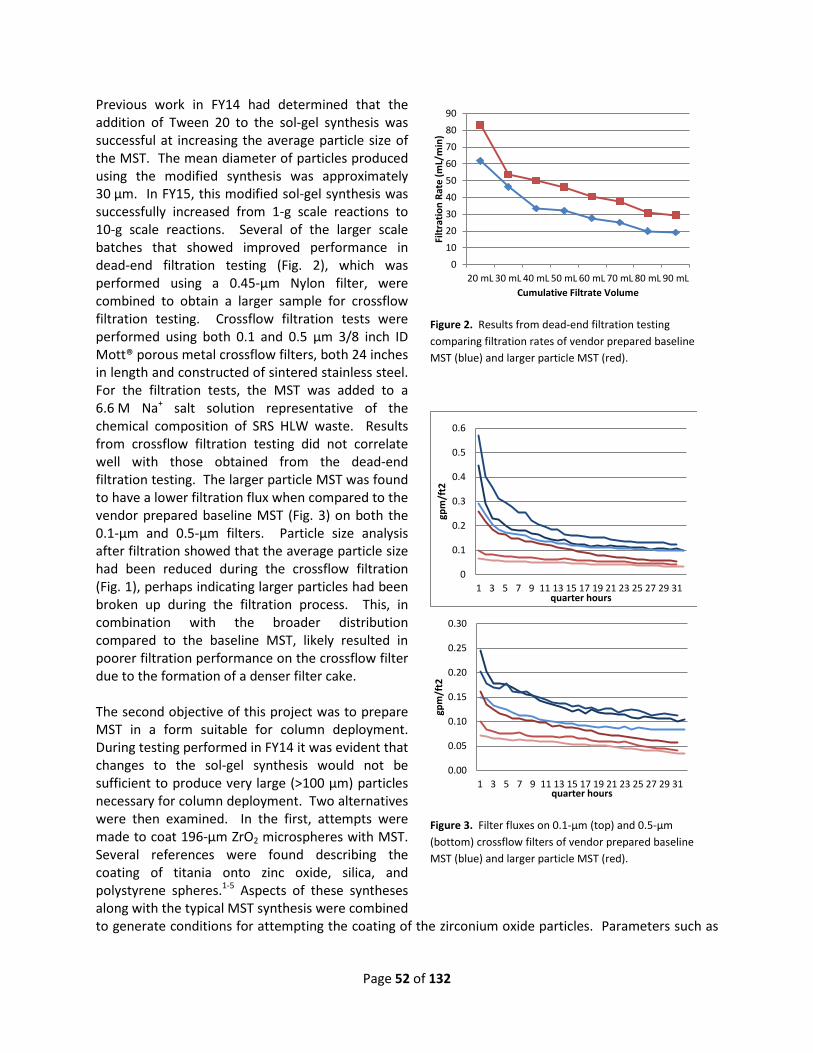
Page 52 of 132
Previous work in FY14 had determined that the addition of Tween 20 to the sol-gel synthesis was successful at increasing the average particle size of the MST. The mean diameter of particles produced using the modified synthesis was approximately 30 µm. In FY15, this modified sol-gel synthesis was successfully increased from 1-g scale reactions to 10-g scale reactions. Several of the larger scale batches that showed improved performance in dead-end filtration testing (Fig. 2), which was performed using a 0.45-µm Nylon filter, were combined to obtain a larger sample for crossflow filtration testing. Crossflow filtration tests were performed using both 0.1 and 0.5 µm 3/8 inch ID Mott® porous metal crossflow filters, both 24 inches in length and constructed of sintered stainless steel. For the filtration tests, the MST was added to a 6.6 M Na+ salt solution representative of the chemical composition of SRS HLW waste. Results from crossflow filtration testing did not correlate well with those obtained from the dead-end filtration testing. The larger particle MST was found to have a lower filtration flux when compared to the vendor prepared baseline MST (Fig. 3) on both the 0.1-µm and 0.5-µm filters. Particle size analysis after filtration showed that the average particle size had been reduced during the crossflow filtration (Fig. 1), perhaps indicating larger particles had been broken up during the filtration process. This, in combination with the broader distribution compared to the baseline MST, likely resulted in poorer filtration performance on the crossflow filter due to the formation of a denser filter cake. The second objective of this project was to prepare MST in a form suitable for column deployment. During testing performed in FY14 it was evident that changes to the sol-gel synthesis would not be sufficient to produce very large (>100 µm) particles necessary for column deployment. Two alternatives were then examined. In the first, attempts were made to coat 196-µm ZrO2 microspheres with MST. Several references were found describing the coating of titania onto zinc oxide, silica, and polystyrene spheres.1-5 Aspects of these syntheses along with the typical MST synthesis were combined to generate conditions for attempting the coating of the zirconium oxide particles. Parameters such as
Figure 2. Results from dead-end filtration testing comparing filtration rates of vendor prepared baseline MST (blue) and larger particle MST (red).
0102030405060708090
20 mL 30 mL 40 mL 50 mL 60 mL 70 mL 80 mL 90 mL
Filtr
atio
n Ra
te (m
L/m
in)
Cumulative Filtrate Volume
Figure 3. Filter fluxes on 0.1-µm (top) and 0.5-µm (bottom) crossflow filters of vendor prepared baseline MST (blue) and larger particle MST (red).
0
0.1
0.2
0.3
0.4
0.5
0.6
1 3 5 7 9 11 13 15 17 19 21 23 25 27 29 31
gpm
/ft2
quarter hours
0.00
0.05
0.10
0.15
0.20
0.25
0.30
1 3 5 7 9 11 13 15 17 19 21 23 25 27 29 31
gpm
/ft2
quarter hours

Page 53 of 132
reaction temperature, reactant concentrations, and reactant addition rates were varied. X-ray fluorescence (XRF) analysis of samples indicated the presence of Ti on some of the samples produced. These samples were then tested for Sr uptake from a HLW simulant solution spiked with 85Sr. Although Ti was present, no uptake of 85Sr was observed in any of the samples. This indicated the Ti that was deposited was not in the form of MST, or that insufficient MST was deposited. Attempts to increase the amount of MST on the surface through repeated coatings also proved unsuccessful. After the coating reactions proved unsuccessful, an alternate approach for preparing material suitable for a column was evaluated. This approach involved the attempted synthesis of a porous monolith of MST which could be used as a column. Several references were found describing the preparation of porous titania monoliths starting from Ti precursors such as Ti(OiPr)4 (which is used for normal MST synthesis) and Ti(OnPr)4.6-8 Attempts were made to reproduce these syntheses, including the addition of sodium methoxide to prepare MST monoliths. Conditions were found that appeared to produce a continuous structure versus just an agglomeration of particles. A representative scanning electron microscopy (SEM) image of this sample is shown in Figure 4. Batch contact testing was performed with a sample of this material to ensure the material retained typical MST sorption performance. Batch contact testing showed 85Sr uptake comparable to a previously investigated form of engineered MST.9 The decontamination factor (DF) obtained with samples of the MST monolith averaged 7.7 compared to 6.6 for the engineered MST in this experiment. FY2015 Accomplishments
• Increased scale of reactions to produce larger particle MST from 1 g to 10 g scales. • Performed filtration testing of larger particle MST on both dead-end and crossflow filters.
o Results from dead-end filter testing indicated improved filtration rates over baseline MST; however, decreased filtration flux was observed in crossflow filter testing.
• Prepared porous monolith of MST that showed 85Sr uptake comparable to that of previously developed engineered MST in batch contact testing.
Future Directions
• Optimize synthesis of porous MST monolith • Perform column testing with MST monolith to determine capacity and loading characteristics
FY 2015 Publications/Presentations None References
1. Ocaña, M.; Hsu, W. P.; and Matijević, E. “Preparation and Properties of Uniform-Coated Colloidal Particles. 6. Titania on Zinc Oxide” Langmuir, 1991, 7, 2911-2916.
Figure 4. SEM image of MST monolith sample.

Page 54 of 132
2. Hanprasopwattana, A.; Srinivasan, S.; Sault, A. G.; and Datye, A. K. “Titania Coatings on Monodisperse Silica Spheres (Characterization Using 2-Propanol Dehydration and TEM)” Langmuir, 1996, 12, 3173-3179.
3. Guo, X-C; and Dong, P. “Multistep Coating of Thick Titania Layers on Monodisperse Silica Nanospheres” Langmuir, 1999, 15, 5535-5540.
4. Imhof, A. “Preparation and Characterization of Titania-Coated Polystyrene Spheres and Hollow Titania Shells” Langmuir, 2001, 17, 3579-3585.
5. deKrafft, K. E.; Wang, C.; and Lin, W. “Metal-Organic Framework Templated Synthesis of Fe2O3/TiO2 Nanocomposite for Hydrogen Production” Adv. Mater. 2012, 24, 2014-2018.
6. Chen, Y.; Yi, Y.; Brennan, J. D.; and Brook, M. A. “Development of Macroporous Titania Monoliths Using a Biocompatible Method. Part 1: Material Fabrication and Characterization” Chem. Mater., 2006, 18, 5326-5335.
7. Konishi, J.; Fujita, K.; Nakanishi, K.; and Hirao, K. “Monolithic TiO2 with Controlled Multiscale Porosity via a Template-Free Sol-Gel Process Accompanied by Phase Separation” Chem. Mater., 2006, 18, 6069-6074.
8. Hasegawa, G.; Kanamori, K.; Nakanishi, K.; and Hanada, T. “Facile Preparation of Hierarchically Porous TiO2 Monoliths” J. Am. Ceram. Soc., 2010, 93, 3110-3115.
9. Taylor-Pashow, K. M. L.; Nash, C. A.; and Hobbs, D. T. “Testing and Characterization of Engineered Forms of Monosodium Titanate (MST)” SRNL-STI-2012-00193, Rev. 0, May 2012.
Acronyms ARP Actinide Removal Process CST crystalline silicotitanate DF decontamination factor DWPF Defense Waste Processing Facility FY fiscal year HLW high level waste ID internal diameter MCU Modular Caustic-Side Solvent Extraction Unit MST monosodium titanate SCIX Small Column Ion Exchange SEM scanning electron microscopy SRS Savannah River Site SWPF Salt Waste Processing Facility XRF X-ray fluorescence
Page 55 of 132
Project Team: J. L. Venzie (Primary), M. J. Siegfried, M. S. Wellons Thrust Area: NS Project Start Date: October 1, 2013 Project End Date: September 30, 2015
eDPS Aerosol Collection
The eDPS Aerosol Collection project is focused on improving current electrostatic particle collection science and technology. By leveraging selected characteristic features, particles of interest can be manipulated during the collection process into a physical configuration conducive to subsequent microscopy and micro-scale laboratory analyses. In order to achieve this goal, a fundamental research and development effort is required to build
an accurate model/understanding of how the desired particles behave in electric fields at atmospheric pressure and what physical and chemical characteristics dominate, or could be made to dominate, their trajectories. Aspects of this work are related to ion mobility mass spectrometry and traditional aerosol science, but critical knowledge is lacking and must be developed as part of this effort. FY2015 Objectives
• Procure computational fluid dynamic (CFD) software. • Simulate existing collector design. • Identify physics and chemistry effecting particle collection. • Evaluate several collector technologies. • Define bias and uncertainty metrics for collectors.
Introduction SRNL has successfully leveraged electrostatic precipitator (ESP) based aerosol collection technology for national security applications and made it available to selected U.S. agencies and departments. The current state of ESP technology is fundamentally an indiscriminate design, i.e. used to collect a broad range of sizes and types of particles. To date, this feature has been a benefit for SRNL’s current customers. However, in order to expand into new markets, SRNL needs to use the empirical knowledge gained to date through the application of the Lab’s current technology to guide fundamental research into aerosol particle collection physics and the manipulation of particles during the collection process. The ability to collect samples in such a way that the particles of interest can be easily and quickly found for individual analysis increases the efficiency of numerous techniques, such as scanning electron microscopy, secondary ion mass spectrometry, x-ray diffraction, Raman microscopy, etc. These and other similar per-particle analytical techniques are being used to obtain ever more information from the source of the collected particles, and finding the informative particles amongst background material is challenging for all of them. The ultimate goal of this work is the ability to deploy aerosol collectors that provide a level of “sample preparation” during the collection process itself. This project will not only allow SRNL to make a significant contribution to collection technology within the DOE mission space, it will also reinforce and grow SRNL’s reputation as a DOE center of expertise in aerosol sampling. In addition to maintaining our current customer relationships, the basic research being performed in this LDRD is enabling SRNL to expand its reputation into the larger open aerosol

Page 56 of 132
science community and will provide a vehicle to transition existing particle knowledge and expertise into the broader community as appropriate. The potential applications for advanced particle collection for particulate analysis are broad and the ability to perform this type of collection is of interest, not only to the nonproliferation community, but the biology, industrial hygiene and pharmaceutical fields as well. Approach The eDPS Aerosol Collection project focuses on building the knowledge and infrastructure to perform advanced aerosol collection research and development. This overarching objective is being executed via three main areas. The primary research area is developing the capability to simulate the complex interaction of forces that influence a particle’s trajectory in an ESP type collector. Commercially available modeling software is being used in to simulate the effects of air flow, static and dynamic electric fields, and magnetic fields on particles. Once developed and validated against existing collector designs these models will be incorporated into the R&D and engineering processes currently serving our customers. The secondary key area is the upgrading of an existing aerosol chamber to an automated collector test bed. Computer controlled power supplies, particle generators, data acquisition, and modular test components make it possible to quickly build and test new designs. These areas focus on basic research and long term returns. The eDPS project also incorporated a third area to explore possibilities based on commercially available equipment adapted for this purpose. Results/Discussion A primary concern for aerosol and particulate scientists is understanding and accounting for biases introduced throughout the generation, transport, sampling, and analysis processes. This year the eDPS team has evaluated several aerosol collectors. Both commercially available and SRNL developed collectors were studied. Figure 1 shows the probability distribution functions for the equivalent circular diameter of sea spray aerosol particles collected by four different aerosol collectors. The SKC (Sioutas Personal Cascade Impactor, SKC Inc., Eighty Four, PA) and the NGI (model 170 Next Generation Impactor, MSP Corporation, Shoreview, MN) both function based on aerosol mobility physics while the ACE (SRNL) and ImpACE (SRNL) are electrostatic precipitators. The four collectors were set up to simultaneously collect sea spray for three hours at a beach front location near Charleston, SC. Probability density functions for the feature areas for each of the detectors. A smooth kernel distribution is
calculated from the raw data with bandwidth selection following Silverman's rule. The plot gives the probability that an observed value will fall between x and x+dx. This has the effect of normalizing the four data sets (i.e. the area under each curve is 1). Table 1 gives the particle (feature) count for each
Figure 1: Particle size distributions for four simultaneous sea spray aerosol collections use four different collectors.

Page 57 of 132
Figure 3: Particle trajectories fin the ACE simulation. Probability of collection is a function of particle size (charge and drag) and initial proximity to corona wire (charge).
collector, giving an indication of overall efficiency. Figure 1 clearly highlights the potential for miss-interpretation of the data if the effects of a given collector are not taken into account. In order to understand the underlying principles that give rise to the collection bias seen above, it is necessary to develop a model that captures the physics that define the fate of a particle in the collector. Figure 2 illustrates the electric potentials (a) and air velocity (b) in a simulation of the SRNL
ACE collector. Due to the device being symetrical in the vertical and horizontal axes, it is only necessary to model one quarter of the device when the appropriate mirroring functions are included. The model was developed in COMSOL Multiphysics (COMSOL, Inc., Burlington, MA). Once the device has been simulated and the static forces calculated, it is possible to calculate the trajectories of individual particles. Figure 3 shows the trajectories of a population of particles consisting of four sizes (0.01 µm, 0.1 µm, 1 µm, and 10 µm) emitted from each of 100 random locations. Each particle picks up electric charges in the corona region according to Cochet’s model1,2.
These simulations provide insight into the balance of forces needed to collect any given particle and the potential for introducing collection bias. The probability that a particle is collected in an ACE device fundamentally depends on the balance between the horizontal drag force or air resistance and the number of charges on the particle creating an electric force in the collector’s electric field. Figure 4 shows the fate of the 400 particles based on their initial location in the collector inlet.
Table 1: Feature Count Net Features SKC 9994 NGI 10539 ACE 2021 IACE 4301 Total 26855
(a) (b)
Figure 2: Electric potential (a) and air flow velocity (b) in the SRNL ACE electrostatic precipitator.

Page 58 of 132
Figure 4: Particle fate as a function of initial position prior to entering charging region. One quarter of the end view is shown, and the corona wire is located at the 0,0 origin.
Figures 4 and 5 show how the particle population and specific collector geometry can affect collection efficiency and bias. Figure 5 also illustrates how the selection of the collector plates, selected for SEM analysis, can introduce bias and could potentially lead to miss-interpretation of the particle population being analyzed. Collection efficiencies were calculated to be approximately 70% by depletion, i.e. determined by measuring the number of particles that remain in the exiting air flow. The efficiency looking at the collector plate was approximately 30%. This discrepancy is consistent with published work out of PNNL.3
Figure 5: Probability of collection locations for the 400 particles.

Page 59 of 132
FY2015 Accomplishments • Developed, built and tested an impactor-electrostatic precipitator (Imp-ACE) based collector
designed to prevent the collection of unwanted macroscopic particles. • Performed two sea spray aerosol (SSA) collections for inter-collector characterization. • Developed cluster analysis tools used to improve the automated classification of particles by the
scanning electron microscopes. • Established computational capabilities integrated with R&D, design and production within the
National Security directorate. • Upgraded aerosol science laboratory capabilities for aerosol physics experiments and
characterization of new designs. • Improved fundamental understanding of collector dynamics using complex real-world samples. • Developed computational simulations that have provided physics based explanations for
empirical observations. Future Directions Information and capabilities developed as part of this LDRD project have already been incorporated into several proposals to R&D funding agencies including:
• Defense Threat Reduction Agency J9 NTFC/A • Department of Homeland Security / National Technical Nuclear Forensics Center • National Nuclear Security Administration Office of Defense Nuclear Nonproliferation Research
and Development This project has also enhanced SRNL’s ability to characterize bulk powder samples and the mathematical and statistical techniques needed to extrapolate meaningful information about the bulk material from SEM and other per-particle analytical measurements. Spin-off projects already begun in fiscal year 2016 are exploring techniques for identifying probative signatures based on the clustering in multiple orthogonal data sets. FY 2015 Publications/Presentations 1. J. Venzie; Quality Control and Verification/Validation in Technical Nuclear Forensics R&D; University
of Washington; July 2015. 2. J. Venzie, H. Ajo, N. Bridges, T. Shehee, R. Rogers; Analysis of SRS HB-Line Alternative Feedstock Two
Plutonium Oxide; DHS NTNFC Academic Collaboration and Program Review, August, 2015. 3. J. Venzie; Finding a Needle in the Haystack and What Does It Mean?; University of Missouri, March
2015. References 1. Parker, K. R. (1997). Applied Electrostatic Precipitation. London, UK, Blackie Academic & Professional. 2. Hinds, W. C. (1999). Aerosol Technology : properties, behavior, and measurement of airborne
particles. New York, NY, John Wiley & Sons, Inc. 3. Laskin, A. and J. P. Cowin (2002). "On deposition efficiency of point-to-plate electrostatic
precipitator." Journal of Aerosol Science 33(3): 405-409. Acronyms ACE Aerosol Contaminant Extractor – an electrostatic precipitator developed at
SRNL.

Page 60 of 132
CFD Computational Fluid Dynamics – modeling of fluid (or air) flow. DOE U.S. Department of Energy eDPS Title of this project. ESP Electrostatic Precipitator – particle collector technology using electric fields. ImpACE Impactor-Aerosol Contaminant Extractor LDRD Laboratory Directed Research and Development NTS Nonproliferation Technology Section – SRNL organization executing this LDRD. PDF Probability Distribution Function – probability that a variable will be less than or
equal to a given value. SEM Scanning Electron Microscope SRNL Savannah River National Laboratory

Page 61 of 132
Project Team: B. L. García Díaz (Primary) H. R. Colón Mercado M. C. Elvington J. A. Teprovich A. A. Rodríguez Vaquer D.W. Babineau Thrust Area: NS Project Start Date: October 1, 2013 Project End Date: September 30, 2015
Direct LiT Electrolysis in a Metallic Lithium Fusion Blanket
A process that simplifies the extraction of tritium from molten lithium based breeding blankets was developed. The process is based on the direct electrolysis of LiT using a ceramic Li ion conductor that replaces the molten salt extraction step. Extraction of T2 from LiT in the blankets/targets of fission/fusion reactors is critical in order to maintain low concentrations. This is needed to decrease the potential T permeation to the surroundings and large releases from unforeseen accident scenarios. Because of the high affinity of T to the blanket, extraction is complicated at the required low levels. This work identified, developed and tested the use of ceramic lithium ion conductors capable of sustaining LiT electrolysis at high
temperatures. An electrochemical cell was designed, fabricated, and used to test the proposed process. At the LiH concentrations tested, successful electrolysis of LiH was confirmed with residual gas analyzer and electrochemical measurements. FY2015 Objectives
• Conductivity tests in high temperature cell and electrolyte optimizations • Analytical demonstration of LiH decomposition in metallic Li electrode • High temperature electrochemical characterization
Introduction Liquid tritium breeder materials, such as lithium and Pb-Li eutectic, are attractive as their breeding potential is very high and separate neutron multipliers are not necessarily required. Because of it being a liquid, the tritium recovery system can be designed outside the neutron environment and will not suffer from radiation damage. In the designs where the breeding material is also used as a coolant, the nuclear heating is directly deposited inside the breeding material simplifying blankets designs. However, there are a number of engineering design difficulties such as magneto-hydrodynamic pressure drops, corrosiveness of liquid metal, efficient tritium recovery and containment from the liquid metal breeder.[1,2] In most applications, the tritium inventory in the blanket has to be kept low (~1 appm) for a reliable and safe operation. The extraction of tritium can be problematic since the tritium in the blanket exists bound to lithium in the form of LiT. Extraction from liquid Li is considered more challenging due to the high solubility of LiT in the melt. On the other hand, the solubility of LiT in Pb-Li eutectic is several orders of magnitude lower, making extraction somewhat less challenging. Nevertheless the state of the art extraction approaches are essentially similar. Among the considered extraction technologies are molten salt extraction followed by electrolysis (Maroni Process), “gettering”, permeation followed by molten liquid extraction, fractional distillation, cold trapping and a combination of all. However, all of the proposed extraction technologies require a series of complicated mechanical steps (expensive

Page 62 of 132
mechanical parts with limited lifetimes) in order to carry out the separation and prevent the buildup of impurities in the extraction process [1]. This work simplifies and eliminates many of the problems associated with the current extraction technologies. Approach In the typical Maroni process, molten Li is mixed with a molten salt in order to extract the LiT. Afterwards, the LiT is electrolyzed and the hydrogen extracted. Our approach simplifies the process by incorporating a solid Li ion conductor to eliminate many of the mechanical steps in the extraction section. Figure 1 (left) shows the Maroni process. The shaded area indicates the section where the SRNL approach can be incorporated. Figure 1 (right) shows the electrochemical cell designed during FY14 to perform the Li/LiH electrolysis
Results/Discussion Two main versions of the electrochemical cell were designed, made and used to test the materials. Typically the electrolyte consisted of Li7La3Zr2O12 (LLZO) that has been pressed and sintered into a pellet. Once prepared, the pellet was characterized using X-ray Diffraction (XRD) to confirm cubic phase formation. Heat treatments and mixing conditions were explored to determine the optimal synthesis methodology for the cubic phase formation and development of mechanically stable pellet. Figure 2 shows the XRD confirmation of the cubic and tetragonal phases during synthesis optimization. Ionic conductivity was evaluated as well to confirm high conductivity phase formation.
Figure 1. (left) Simplified Maroni process [3]. Shaded area depicts where the SRNL process approach can be incorporated. (right) Electrochemical cell design for LiH electrolysis
T2
2e-
Anode
T −
T −
Li(l)
Li(l)
Li +
Li +
2e-Electrolyte
Cathode
Figure 2. XRD (left) and ionic conductivity (right) examination of the LLZO solid electrolyte.
2.2 2.4 2.6 2.8 3.0 3.2
1E-7
1E-6
1E-5
1E-4
1E-3 Tetragonal phase (heating) Tetragonal phase (cooling) Cubic phase (heating) Cubic phase (cooling)
Ioni
c Co
nduc
tivity
(S/c
m)
1000/T (K-1)

Page 63 of 132
The electrolysis cell consisted of a Li/LiH electrode, the LLZO electrolyte and a gold contact counter electrode. The evolution of H2 was monitored in-situ with a residual gas analyzer (RGA) during cell operation. Figure 3 (left) shows the validation run of the proposed process at 350 °C as well as a picture of the prepared electrode. The results show a direct correlation between the point when the potential is applied and the point when H2 is released from the Li/LiH electrode. The H2 signal slowly decays as the LiH closest to the electrolyte is consumed. Figure 3 (right) shows the Tafel polarization for the LiH electrolysis at 350 °C. An exchange current density of 3.06 mA/cm2 and limited current density of 20.4 mA/cm2 was observed. Improvements such as operation at higher temperatures and fluidization of the working electrode should result in higher current densities.
FY2015 Accomplishments
• Successfully synthesized and evaluated Li-ion conducting materials • Filed U.S. provisional application • Developed an electrochemical cell based on Li-ion conducting electrolytes that can be immersed
directly into the metallic cooling blanket • Evaluated the feasibility of cell operation for LiH decomposition • Characterized the decomposition of LiH in Li metal
Future Directions
• Improve electrolyte and cell geometry in order to perform experiments under truly molten conditions and avoid shorting
• Test under low concentration of hydrogen isotopes • Engage with researchers at national laboratories to discuss how to incorporate the modified
extraction process in projects requiring hydrogen extraction FY 2015 Publications/Presentations None References 1. H. Moriyama, S. Tanaka, D.K. Sze, J. Reimann, A. Terlain. Fusion Engineering and Design, 28 (1995) 226-239 2. S. Malang, R. Mattas. Fusion Engineering and Design, 27 (1995) 399-406
Figure 3. (left) Electrolysis at 350 °C using LLZO electrolyte, gold counter electrode and Li/LiH as a working electrode. Inset shows LLZO pellet. (right) Tafel polarization for the electrolysis of LiH.

Page 64 of 132
3. V. Maroni, R. Wolson, G. Staahl. Nuclear Technology, 25 (1975) 83-91.List any references used in the report. Acronyms LiH lithium hydride LiT tritium tritide LLZO lithium lanthanum zirconium oxide T tritium XRD X-ray diffraction

Page 65 of 132
Project Team: A. Garrett (Primary), E. Villa-Aleman, M. Summer, S. Chiswell Thrust Area: NS Project Start Date: October 1, 2013 Project End Date: September 30, 2015
Far Field Modeling Methods for Characterizing Surface Detonations
Savannah River National Laboratory (SRNL) analyzed particle samples collected during experiments that were designed to replicate tests of nuclear weapons components that involve detonation of high explosives (HE). SRNL collected the particle samples in the HE debris cloud using innovative rocket propelled samplers. SRNL used scanning electronic microscopy to determine the elemental constituents of the particles and their size distributions. Depleted uranium composed about
7% of the particle contents. SRNL used the particle size distributions and elemental composition to perform transport calculations that indicate in many terrains and atmospheric conditions the uranium bearing particles will be transported long distances downwind. This research established that HE tests specific to nuclear proliferation should be detectable at long downwind distances by sampling airborne particles created by the test detonations. FY2015 Objectives
• Measure particle size distributions as a function of elemental composition. • Perform particle transport and deposition calculations to determine if large percentages of
uranium-bearing particles would remain airborne at distances of 25 km or more downwind.
Introduction There are relatively few signatures of nuclear proliferation near the end of the production process when weapon components are being fabricated, tested and assembled. One signature that can be potentially be detected far from the test location is particulate debris from high explosives (HE) detonations. The HE tests verify that the non-nuclear initiator of a nuclear weapon explosion works. The debris cloud created by the HE test contains particles composed of the initiator components, which include depleted uranium. The uranium-bearing particles will range in size from sub-micron diameters that may be transported long distances downwind to millimeter or larger pieces that will fall to the ground quickly. If no other airborne sources of uranium are in the area, the uranium-bearing particles would be a strong indicator of a HE test relating to nuclear weapons. In order to gain knowledge about signatures created by HE nuclear weapons components tests. The Department of Energy (DOE) conducted a series of experiments that simulated actual HE component tests. SRNL successfully used an innovative method to collect particles in the debris cloud in which the particle collectors were mounted on a rocket that was fired into the debris cloud immediately after the detonation. This created a unique data set for analysis of the particles created by nuclear weapons related HE detonation. The first objective of this project was to analyze the particle samples to determine their elemental constituents and size distributions. The second objective was to use this information to perform transport and deposition calculations to determine how far downwind the signature of a nuclear weapon related HE test could be detected by collecting uranium-bearing particles created by the HE detonation.

Page 66 of 132
Approach The approach to analyzing the particle samples was a two-step process. First, the elemental constituents of the particle samples had to be determined, and the size distributions for the different types of particles had to be computed. Commercially available software for automated particle counting was used as well as a particle counting code developed by SRNL. Both codes produced similar size distributions, but the SRNL code was able to isolate and count smaller particles than the commercially available code as shown in Figure 1. After the particle size distributions by element were derived from the particle data, SRNL ran transport and deposition codes to determine how far downwind a significant part of the uranium-bearing particles would remain airborne. If the transport calculations showed that a large percentage of the uranium-bearing particles remained in the atmosphere far downwind from the detonation site, then this would verify that the uranium particles are a viable signature of nuclear weapons initiators or “triggers”.
Results/Discussion SRNL extracted particle elemental composition from their characteristic x-ray spectrum by using Oxfords Energy Dispersive Spectrometer (EDS) detector. The primary elemental constituents found were carbon (C), copper (Cu), iron (Fe), oxygen (O), sulfur (S), aluminum (Al) and uranium (U). Percent composition of the particles on an element-by-element basis is shown in Figure 2. Results are shown for a lower resolution full image of particles deposited on collection media and a higher resolution subsection of the same image. The totals in both cases add up to more than 90%, indicating that the 7 elements listed above account for most of the material in the particles. Commercially available software and a code written by SRNL were both used to count the particles in the images of the particles deposited on the collection media. Both codes produced particle size distributions similar to the one shown in Figure 3. The size distributions have sharp peaks at about 100 nanometers (nm) for uranium and carbon, and the other elements as well. This is a key result of this research, because all particles with diameters of about 100 nm have negligible gravitational settling velocities and because these particles also are not removed from the atmosphere efficiently by either Brownian motion (< 100 nm) or impaction (>100 nm)1. As a result, the particles created by HE tests of nuclear triggers appear to be largely in a size range that will travel far downwind before they are deposited.
Figure 1 Uranium brightness map derived from particle collection media.

Page 67 of 132
FY2015 Accomplishments Particle size distributions as a function of elemental composition were derived from particle samples: Distributions were sharply peaked at about 100 nanometer diameters 100 nanometer uranium particles have negligible fall velocities and can potentially be transported long distances downwind from source. Transport and deposition calculations verified that large percentages of 100 nm
particles would remain airborne at distances of 25 km or more downwind: Slowest particle cloud depletion at night in stable conditions. Forested areas remove particles from atmosphere more rapidly than bare surfaces.
Figure 4 shows results of transport and deposition calculations for 100 nm uranium particles for 6 different atmospheric stability classes, ranging from most unstable (A) when strong solar heating is producing rapid turbulent mixing to most stable (F) characteristic of clear nights with minimal turbulence. In all cases, more than 40% of the particles were still airborne 25 km downwind from the source location. The deposition velocity used in the computations shown in Figure 4 was 0.02 cm/sec,
which is appropriate for a minimally vegetated surface, such as a desert1,2. If the debris cloud is being transported over a forest, the deposition velocity will be higher, approximately 0.5 cm/sec.2
Figure 6 shows the predicted deposition as a function of downwind distance for a debris cloud passing over a forest (deposition velocity = 0.5 cm/sec). The removal rates are much higher, because the probability of a particle impacting and sticking to the surface of a leaf or branch is much greater than the
Figure 2: Elemental composition of particles.
Figure 3: Size distributions of particles largely composed of uranium and carbon.

Page 68 of 132
probability of impacting and sticking to bare ground. Figure 5 indicates that most particles would be scavenged from a debris cloud passing over a forest in unstable atmospheric conditions, but significant numbers of particles would remain airborne in more stable conditions.
Figure 4: Computed removal rate of 100 nm uranium particles over desert (bare) surface.

Page 69 of 132
Future Directions
• Challenge/Barrier 1: gain entry into DOE’s HE test program – Currently only weapons labs – Use SRNL data collection technologies (debris cloud sampling with rockets; ACE particle
collector) • Challenge/Barrier 2: develop airborne systems with on-board real-time particle sample analysis
– Better detection of small, irregular debris clouds that travel long distances before being depleted
• Challenge/Barrier 3: develop multi-element signature for HE weapons test debris particles FY 2015 Publications/Presentations 1. SRNL anticipates presenting these results to DOE-HQ (NA-22) late in calendar 2015 or early in 2016. References
1. Giorgi, F., 1988: “Dry deposition velocities of atmospheric aerosols as inferred by applying a particle dry deposition parameterization to a general circulation model”, Tellus, 40B, 23-41.
2. Ould-Dada, Z., 2002: “Dry deposition profile of small particles within a model spruce canopy”, Science of the Total Environment, 286, 83-96.
Figure 5: Computed removal rate of 100 nm uranium particles from debris cloud passing over forest.

Page 70 of 132
Project Team: G. Staack (PI), J. Gaillard (PI), D. Hitchock, B. Peters, H. Colon-Mercado, J. Teprovich, J. Coughlin, K. Neikirk, C. Fisher Collaborators: Prof. T. DeVol at Clemson University and Dr. C. Thomas at Widetronics. Thrust Area: NS Project Start Date: October 1, 2013 Project End Date: September 30, 2015
Advancement of Tritium Powered Betavoltaic Battery Systems
Due to their decades-long service life and reliable power output under extreme conditions, betavoltaic batteries offer distinct advantages over traditional chemical batteries, especially in applications where frequent battery replacement is hazardous, or cost prohibitive. Although many beta emitting isotopes exist, tritium is considered ideal in betavoltaic applications for several reasons: 1) it is a “pure” beta emitter, 2) the beta is not energetic enough to damage the semiconductor, 3) it has a moderately long half-life, and 4) it is readily available. Unfortunately, the widespread application of tritium powered betavoltaics is limited, in part, by their low power output. This research targets improving the power
output of betavoltaics by increasing the flux of beta particles to the energy conversion device (the p-n junction) through the use of low Z nanostructured tritium trapping materials. FY2015 Objectives
• Optimize hydride films –Optimization of hydrogen pressure, material temperatures, and loading times required to create hydrogenated films while maintaining their integrity. Produce next generation tritium loaded films that would maximize tritium loading while minimizing beta particle self-absorption.
• Develop a tritium charging vessel – Completion of the design and fabrication of several tritium certified vessels. These vessels are novel in that they will allow measurements to be made of both the resistivity of the films and power output of the devices in real time during tritium loading at temperatures up to 450 °C and pressures up to 950 PSIG.
• Tritium exposure of films while monitoring resistivity and power output- Tritium loading of films using the optimized hydride parameters while measuring real-time changes in resistivity to confirm tritium loading, and monitoring the power output of the device after the loading is complete.
• Quantification of tritium loading – Quantification of tritium loading using liquid scintillation and digestion.
Introduction Like all nuclear batteries, betavoltaics convert energy from the decay of a radioactive material into electricity. Unlike other nuclear batteries, however, betavoltaics rely on the kinetic energy of a beta decay rather than the thermal energy (heat) generated by the decay as in thermionics and thermoelectrics. Betavoltaics generate electricity when a semiconducting p-n junction is exposed to a beta-particle which in turn excites an electron-hole pair(s) thereby generating an electric current. A simple schematic of this setup is shown in Figure 1.
Figure 1. Diagram of a typical betavoltaic cell.

Page 71 of 132
Conversion of the energy from the beta decay of a radioactive source was initially proposed in the early 1950s. Testing by Rappaport using 90Sr→90Y→90Zr not only proved the concept of betavoltaics, but also provided basic theory behind their operation. Unfortunately, the high energy beta emitted by 90Y decay (2.28 MeV) damaged the semiconductor, resulting in a decrease in power output of ~90% over a period of one week. More recent efforts have focused on the use of lower-energy beta emitting materials to minimize long-term damage to the energy collection device. Furthermore, recent research has shown large bandgap semiconducting materials to increase the conversion efficiency of betavoltaic devices.[1] More recent research with tritium has addressed the needs for a low energy beta emitter and for large bandgap semiconductors in the form of SiC p-n junctions. However, the flux of beta particles inside the device is still a pressing issue. In the case of tritium betavoltaics this issue has partially been overcome through the use of tritiated thin films due to their ability to store significantly more tritium per unit volume when compared to gaseous tritium. [1] Approach As mentioned above, the main hurdle for the widespread implementation of tritium betavoltaics is the low beta particle flux delivered to the p-n junction in current devices. The goal of this research is to increase this flux through two avenues: 1) the use of nanostructured tritium trapping materials to increase the amount of tritium stored in the film, and 2) the use of low z tritium trapping materials to decrease self-absorption of the beta particles before they reach the p-n junction. Traditionally, pressure, volume, and temperature (PVT) measurements have been used to verify and monitor the hydrogenation/tritiation of a material under a given set of conditions. Because only minute amounts of gas are absorbed by thin films, an alternate method was developed. The test cell shown in Figure 2 is equipped to monitor the resistivity of the film real-time during the loading process. Resistivity is monitored because the films transition from metallic conductors to insulators as loading progresses. Additionally, the electrical feedthroughs in the tritium loading cell provide the capability to monitor the power output of an experimental device without removing it from the cell. To confirm the loading conditions, a test station was also designed and built at the Hydrogen Research and Technology Lab (HRTL) to load samples with protium in order to demonstrate that the loading technique was sound
Figure 2. Tritium loading cell designed and fabricated at SRNL.

Page 72 of 132
before initiating testing with tritium. Results/Discussion In FY15, palladium-capped magnesium thin films were deposited using traditional rotating substrate sputtering. In addition, nanostructured palladium capped magnesium thin films were deposited using Oblique Angle sputtering Deposition (OAD). The OAD films, shown in Figure 3, were grown in a sputter deposition chamber with a sample-to-source angle of ~85ᴼ. The goal of the nanostructured magnesium films was to increase the mass of tritium stored in a given volume by increasing the surface area of the film, thereby allowing more complete hydrogenation. A test station was also built at HRTL to test the protium loading of thin films in order to evaluate the appropriate PVT conditions for tritium loading. A number of experiments were performed in which the resistance of the film was monitored during the hydrogen loading process under different conditions. Figure 4 shows a sample resistivity (ρ) versus time plot for a loading sequence. Arrows indicate changes in reaction rate (the slope of the ρ versus T plot) that correspond to changes in the H2 pressure (20-50-150 psi) in the chamber. As expected, the H2 loading rate increased with increased pressure. In FY15, the tritium loading cell design that met tritium requirements related to materials, pressure protection and welding, was finalized. A supporting ASME code calculation was performed (Design
temperature: 450 °C and Design Pressure: 950 psig) and Record Drawings for Tritium Facility installation within the glovebox were developed. Certification and approval of the electrical feedthroughs in the cell were particularly important. In order to achieve the desired pressures and temperatures a Ceramtec™ fitting was chosen. This choice was key to the project as it supported a small cell size that facilitates favorable process heat transfer conditions. The fitting contains a complex mix of metal, ceramic, and braze alloy making code extrapolation of unheated pressure test results particularly challenging. Therefore, the component had to be pressure and leak tested at the operating temperature of 450 °C. This was the first heated
leak/pressure test completed in the SRNL High Pressure lab. Figure 2 shows an assembled certified tritium loading cell. Currently three cells are ready to be deployed in the tritium facility (assembled and pressure/leak certified) with a further 9 cells assembled awaiting pressure and leak certification. FY2015 Accomplishments
• Grew nanostructured Mg films capped with Pd using OAD in a sputtering chamber at SRNL. • Built a test station for protium loading thin films in an environment similar to the tritium facility • Protium loaded Pd capped Mg films grown at SRNL • Completed design and certification of a tritium approved loading cell with the capability of
monitoring electrical properties real-time.
Figure 3. Microstructured Mg film (Pd capped, ~5nm) grown using Oblique Angle Deposition (OAD).
Figure 4. Normalized resistivity as a function of time during hydrogen loading of a Pd capped Mg film.

Page 73 of 132
• Completed fabrication of 12 loading cells • Completed pressure and leak testing on three loading cells
Future Directions
• Tritium loading of films is anticipated in FY16, contingent upon receipt of additional funding. FY 2015 Publications/Presentations No external publications or presentations have been made to date. References 1. L. C. Olsen, "Review of Betavoltaic Energy Conversion," in Proc. 12th Space Photovolt. Res. Technol. Conf, 1993, p. 256. Acronyms OAD: Oblique Angle Deposition SRNL: Savannah River National Laboratory PVT: pressure, volume, and temperature HRTL: Hydrogen Research and Technology Lab

Page 74 of 132
Project Team: J. Wilson, S. J. Branney, C. G. Verst, S. O. Sheetz, and C. M. Mussi Thrust Area: NS Project Start Date: October 1, 2014 Project End Date: September 30, 2015
Alternate Tritium Production Methods Using a Liquid Lithium Target
For over 60 years, the Savannah River Site’s primary mission has been the production of tritium. From the beginning, the Savannah River National Laboratory (SRNL) has provided the technical foundation to ensure the successful execution of this critical defense mission. SRNL has developed most of the processes used in the tritium mission and provides the research and development necessary to supply this critical component. This project was executed by first developing reactor models that could be used as a neutron source. In parallel to
this development calculations were carried out testing the feasibility of accelerator technologies that could also be used for tritium production. Targets were designed with internal moderating material and optimized target was calculated to be capable of 3000 grams using a 1400 MWt sodium fast reactor, 850 grams using a 400 MWt sodium fast reactor, and 100 using a 62 MWt reactor, annually. FY2015 Objectives
• Examine different methods that have been studied for the production of tritium to determine which are the most feasible.
• Using MCNP and ORIGEN, develop initial models for scoping calculations to see if the chosen technologies will be able to meet tritium production needs.
• Develop and evaluate different liquid lithium targets to optimize production of tritium. • Incorporate the different targets into the models to find the optimal combination for production
and impact on unobligated US origin Uranium. Introduction For over 60 years, the Savannah River Site’s primary mission has been the production of tritium. From the beginning, the Savannah River National Laboratory (SRNL) has provided the technical foundation to ensure the successful execution of this critical defense mission. SRNL has developed most of the processes used in the tritium mission and provides the research and development necessary to supply this critical component. Utilizing the results of Texas A&M University (TAMU) senior design projects on tritium production in four different small modular reactors (SMR), SRNL developed a model evaluating tritium production versus uranium utilization [1]. The SRNL Technical Advisory Committee (TAC) ran a Monte Carlo N-Particle (MCNP) model of a basic Sodium Fast Reactor for Comparison [2]. As a result, it was concluded to leverage an approved LDRD program at SRNL for extraction of tritium from liquid lithium. This analysis examined alternative
Figure 1. 400 MWt Sodium Fast Reactor Used for Initial Target Development.

Page 75 of 132
methods of producing tritium using a liquid lithium target or blanket, instead of using solid targets, which will allow for continuous production and extraction of tritium from the blanket and build upon the current LDRD investigating separation of lithium-tritide within liquid lithium. This analysis investigated different modes of producing neutrons and tritium, fast reactors, heavy water reactors, and other technologies. This analysis also branched out and looked at the potential of using solid lithium targets for the production of tritium. Approach The approach taken for this project was to examine various neutron source technologies that could be used for the production of tritium utilizing a liquid lithium target or blanket. Starting point for liquid target design was to examine fusion breeding blankets and try to utilize the work that has been done on tritium production for fusion power systems. Using the knowledge that has been gained from the research that has been completed on these systems, the initial design took a very large blanket around a sodium fast reactor made of natural lithium. This project was executed by first developing reactor models that could be used as a neutron source. In parallel to this development calculations were carried out testing the feasibility of accelerator technologies that could also be used for tritium production. Results/Discussion Three reactors were modeled to use as a neutron source for this project. The first was a 62 MWt sodium cooled fast reactor using a metal U-Zr fuel. The next reactor modeled was a 400 MWt sodium cooled fast reactor fueled with UO2 ceramic fuel. The final reactor that was modeled for this project was 1400 MWt sodium cooled fast reactor that was fueled with U-Pu-Zr, U-Zr, Pu-Zr and MOX fuel. The reason sodium fast reactors were used for this effort was the operating experience of the sodium fast reactors and the available literature on the different reactors. Choosing to examine a fast reactor was to try and take advantage of the higher energy neutron spectrum. The higher leakage of neutrons from the core of a fast reactor was another reason they were utilized in this project. By utilizing the leakage neutrons, for an external target, it would be possible to design a core that would be able to be utilized for a longer cycle with lower fissile content than one with internal targets. These three reactors were modeled with simple targets which were just a cylindrical shell on the outside of the reactor. These targets were modeled with varying rations of Li-6 enrichment, from natural lithium to a fully enriched Li-6 target. From these initial models it was obvious that the external target would need to have some type of moderating material designed into the target to increase tritium production. From these models it was obvious that the 62 MWt reactor did not produce enough leakage neutrons to be a viable production source. Target optimization was carried out on the 400 MWt reactor. The targets were designed with internal moderating material, polyethylene clad in stainless steel was used, and without a variation in size from the initial models. This was done so that the effects of the various amount of moderation and lithium enrichment values could be varied with direct comparison the initial models. The maximum production in this target design with the 400 MWt reactor was calculated to be 800 grams of tritium annually with pure Li-6 target and 700 grams annually with a natural lithium
Figure 2. Section of the liquid lithium target after optimization (blue-lithium, red-moderator, yellow-steel)

Page 76 of 132
target. These targets were massive and were not a feasible design to be considered for actual production. The next step was to utilize the 1400 MWt reactor model to develop a more reasonably sized target. The optimization of the target was done by selecting multiple moderator geometries and size of the vessel that contained the lithium and moderator. The result of this optimization was a target that would run on the leakage neutrons from the 1400 MWt reactor and was calculated of being capable of producing 3200 grams of tritium annually, using natural lithium and 4500 grams with pure Li-6. The next step that was taken was to examine the same type of target with solid lithium in various forms, Li-Al alloy, LiAl2O, and LiO2. Though these solid targets performed slightly worse than the liquid target, they were calculated to still be capable of producing up to 3000 grams of tritium annually with natural lithium. FY2015 Accomplishments
• Developed a potential replacement target design to the current tritium production method that can be adapted to any reactor design.
• Evaluated current fusion system tritium breeding concepts and possible incorporation into other tritium production technologies.
Future Directions This project will feed into the discussions on the next generation of tritium production and can be leveraged into tritium breeding work for fusion power systems.
FY 2015 Publications/Presentations None
References
1. S. Sheetz, M. Jones, and J. Wilson, “PDRD (SR13046) Tritium Production Final Report,” SRNL-STI-2013-00547, Revision 0, September 2013.
2. Milton E. Vernon, Steven A. Wright, and Paul S. Pickard, “TAC Report: Evaluation of Tritium Production with Small Modular Reactors,” SRNL Technical Advisory Committee, August 2013.
Acronyms Li Lithium MWt Megawatts Thermal Pu Plutonium U Uranium Zr Zirconium

Page 77 of 132
Project Team: M. J. Siegfried (Primary), E. Villa-Aleman, G. Hall Thrust Area: NS Project Start Date: October 1, 2014 Project End Date: September 30, 2015
Laser-Induced Ionization Efficiency Enhancement on a Filament for Thermal Ionization Mass Spectrometry
The evaluation of trace Uranium and Plutonium isotope ratios for nanogram to femtogram material quantities is a vital tool for nuclear counter-proliferation and safeguard activities. Thermal Ionization Mass Spectrometry (TIMS) is generally accepted as the state of the art technology for highly accurate and ultra-trace measurements of these actinide ratios. However, the very low TIMS ionization yield (typically less than 1%)
leaves much room for improvement.
Enhanced ionization of Nd and Sm from a TIMS filament was demonstrated using wavelength resonance with a nanosecond (pulse width) laser operating at 10 Hz when light was directed toward the filament.1 For this study, femtosecond and picosecond laser capabilities were to be employed to study the dissociation and ionization mechanisms of actinides/lanthanides and measure the enhanced ionization of the metal of interest. Since the underlying chemistry of the actinide/lanthanide carbides produced and dissociated on a TIMS filament is not well understood, the experimental parameters affecting the photodissociation and photoionization with one and two laser beams were to be investigated.
FY2015 Objectives • Enhance ionization efficiency for thermal ionization mass spectrometry using picosecond and
femptosecond lasers • Demonstrate tunable picosecond lasers can be used to enhance the ionization efficiency of
actinides and lanthanides on a heated TIMS filament • Develop a deeper understanding of the analyte carbide formation, dissociation, and ionization
from the heated TIMS filament
Introduction The measurement of lanthanide and actinide isotope ratios for nanograms to femtograms material quantities is a vital tool for nuclear counter-proliferation and safeguard activities. This is especially true in the evaluation of trace Uranium isotopes such as 232U, 233U, and 236U, as well as Plutonium isotope ratios. Thermal Ionization Mass Spectrometry (TIMS) is generally accepted as the state of the art technology for ultra-low level measurements of these actinide ratios. The standard sample preparation method for low level TIMS analysis consists of loading samples onto anion exchange resin beads and then loading beads onto Rhenium filaments. Currently, the efficiency of a typical TIMS instrument running U or Pu represents the detection of <0.5% of the total number of atoms loaded into the instrument. This fairly poor sample utilization creates significant room for improvement, and new sample ionization methods could generate an order of magnitude or more increase in detection efficiency. This would serve to push down detection limits and allow the measurement of even smaller samples, or alternatively give much higher precision measurements, especially on minor isotope ratios, of sample sizes routinely measured now.

Page 78 of 132
The exact chemical processes that take place on a TIMS filament and lead to ionization of the analyte of interest have not been well characterized. Experimental evidence suggests that the actinide metals would vaporize at temperatures much below those at which a TIMS filament is known to operate (>2000 °C) and thus be lost as undetectable neutral species. Laser induced ionization of molecular species on filaments or desorbed from the filament were conducted approximately 30 years ago. The laser ionization experiments of Nd and Sm were conducted with a nitrogen pumped dye laser at 1.0 Hz. Further research in this area declined due to the low duty cycle of the nanosecond laser. Femtosecond and picosecond lasers operating at 80 MHz has widened the field for unique experimentation. For this study, femtosecond laser capabilities were employed to study the dissociation and ionization mechanisms of actinides/lanthanides and measure the enhanced ionization of the metal of interest. The goal of this project is to identify the parameters that could lead to a significant enhancement in the TIMS sample ionization efficiency. The new ultrafast laser capabilities will be employed to study the dissociation and ionization mechanisms of actinides/lanthanides and measure the enhanced ionization of the metal of interest. In order to reduce costs related to work with Pu and U, all experiments in this LDRD will be conducted with Sm. Approach A vacuum chamber/pump with several optical ports for laser inputs and optical detectors and a residual gas analyzer was designed and assembled on the side of an optical table. Optical ports will be used for laser inputs and diagnostic sensors. The vacuum system will be equipped with an RGA to measure ion current at masses up to 300 amu. The performance of the vacuum system will be tested with gauging, the performance of the RGA with bare rhenium filaments. The loaded filaments will be made by evaporating elemental analysis Nd and Sm standards onto rhenium. The emission spectra of a rhenium filament with resin/Nd/Sm will be investigated in a vacuum chamber at incremental temperatures up to the ionization temperature while monitoring the ion mass. Filaments loaded with Nd and Sm will be heated just below the required temperature for thermal ionization. A series of experiments with the laser tuned on and off the resonance ionization of the element of interest will be conducted. Most lanthanides and actinides can be photoionized by a simple two-photon resonance ionization spectroscopy (RIS) process. Nd, with isotopes at 143, 145, 146, 148 and 150 (fission products) and 142 (not fission product) can be resonantly ionized with a laser tuned at 425.8 nm. Sm can be resonantly ionized with the laser tuned at 429.9 nm. Both wavelengths can be accessed with the second harmonic of the ultrafast Ti:Saphire fundamental laser wavelength. The advantage of ultrafast lasers over nanosecond lasers like nitrogen laser is the short duration pulse which can induce multiple harmonic processes efficiently. A series of experiments will evaluate the use of a laser in the photodissociation of metal carbides on the filament surface. The laser wavelength and power on the filament surface will be changed while monitoring the masses with the RGA. Non-resonant studies will be conducted in the fundamental, 2nd and 3rd harmonics of the laser. Similarly, a series of studies will be conducted the picosecond or femtosecond laser tuned at the resonance wavelength. A filament loaded with Sm and Nd will be evaluated to understand ionization efficiency of one element in the presence of the other.

Page 79 of 132
Results/Discussion A vacuum chamber capable of heating a TIMS filament, optically measuring filament temperature, and capable of acquiring a mass spectrum of generated ions was designed, built, and assembled adjacent to the side of a laser table. The system was first demonstrated by acquiring a mass spectrum when heating a bare rhenium TIMS filament. Ionization enhancement was demonstrated when samarium was resonantly ionized using a femptosecond laser; consequently enhancing the resulting mass spectrum signal. FY2015 Accomplishments
• Designed and installed a vacuum chamber capable of heating a TIMS filament, optically measuring filament temperature, and capable of acquiring a mass spectrum of generated ions
• Demonstrated a MS spectrum was obtained when heating a Rhenium Filament • Demonstrated an ionization enhancement of ~13% when Sm was resonantly ionized using a
laser tuned at the resonance ionization wavelength Future Directions
• Optimize laser settings, filament temperature, and optics for resonance ionization • Investigate emission spectra of a rhenium filament with Nd/Sm at different temperatures. • Conduct a series of experiments to evaluate the use of a laser in the photoionization of metal
carbides on the filament surface. • Compare distribution of ions/neutrals of thermal vs. laser induced ionization • Evaluate targeted/selective photoionization of Nd/Sm
FY 2015 Publications/Presentations None References
1. D.L. Donohue, J.P. Young and D.H. Smith, “Determination of Rare-Earth Isotope Ratios by Resonance Ionization Mass Spectrometry”, International Journal of Mass Spectrometry and Ion Physics, 43 (1982) 293-307.
Acronyms TIMS – Thermal Ionization Mass Spectrometry

Page 80 of 132
Project Team: M. R. Kriz (Primary), R. M. Achey, J. R. Cadieux, M. C. Duff, R. K. Huffman, D. B. Hunter, E. M. Kriikku and T. N. Riley Thrust Area: NS Project Start Date: October 1, 2014 Project End Date: September 30, 2015
Field Development for Undeclared/Declared Nuclear Testing for Treaty Verification
Radioxenon is a critical part of the Comprehensive Nuclear Test Ban Treaty (CTBT) for the detection/confirmation of undeclared/declared nuclear weapons tests. Treaty verification monitoring for radioxenon is another application for post-event monitoring on-site; however, this is not currently conducted because there are no simple portable field devices for measurements. Phase I assessed the development of a small, robust beta-gamma coincidence counting system, that combines
collection and in situ detection methodologies. Phase II of the project began development of the custom electronics enabling 2D beta-gamma coincidence analysis in a field portable system. This will be a significant advancement for field detection/quantification of short-lived xenon isotopes that would not survive transport time for laboratory analysis. FY2015 Objectives
• Development of a small field detector system for beta-gamma coincidence counting that could combine SRNL molecular sieves with in situ detection of radioxenon directly from air
• Correlation of the beta signal (time stamp, energy & pulse height) with the gamma signal (time stamp & pulse height)
• Characterization of the beta-gamma detector (quantification of the beta signal, beta signal efficiency and detector linearity)
• Gas transfer mechanism from collection sieve to gas scintillation cell
Introduction Radioxenon is a critical part of the Comprehensive Nuclear Test Ban Treaty (CTBT) for the detection/confirmation of undeclared/declared nuclear weapons tests. Noble gases are ideal signatures to detect clandestine nuclear events since they are difficult to contain and can diffuse and migrate through soils due to their inert nature. Radioxenon is used instead of other radioactive noble gases due to the poor production rates, short half-lives, high background levels or issues with global scale monitoring of other noble gases [1]. There are four key radioxenon isotopes used in monitoring: 135Xe (9 hour half-life), 133mXe (2 day half-life), 133Xe (5 day half-life) and 131mXe (12 day half-life). By measuring the activity ratios of 133mXe/131mXe versus 135Xe/133Xe, it is possible to distinguish between civilian sources (nuclear power plants and medical isotope production facilities) and nuclear explosions [2]. The International Monitoring System (IMS) currently uses large laboratory devices located throughout the world for xenon monitoring, such as the Swedish SAUNA (Swedish Automatic Unit for Noble Gas Acquisition), the French SPALAX (Système de Prélèvement d’air Automatique en Ligne avec l‘Analyse des radioXenon), or the Russian ARIX (Analyzer for Xenon Measurements). The current systems are large laboratory devices that require a climate controlled building. Treaty verification monitoring for radioxenon is another application for post-event monitoring on-site; however, this is not currently conducted because there are no simple portable field devices for measurements. The objective of this

Page 81 of 132
research is to develop the necessary components for a portable beta-gamma coincidence counting system that would allow for on-site monitoring for radioxenon. Savannah River National Laboratory (SRNL) is a leader in the field of gas collections and has developed highly selective molecular sieves that allow for the collection of xenon gas directly from air. Using these molecular sieves, SRNL has the ability to collect radioxenon on location, but the various commercially available components of a portable beta gamma coincidence counting system have not been integrated into a small, portable fieldable device. This work has focused on the development of custom electronics for beta-gamma coincidence counting using a small, USB powered device. Beta-gamma coincident counting is advantageous for two reasons. First, the measurement sensitivity is improved by a lower of the background, relative to gamma counting alone (Figure 1). Second, more isotopic information is available using beta-gamma counting as opposed to gamma counting alone (Figure 2).
Figure 1: Spectra of 133Xe showing background reduction in coincidence mode
Figure 2: Conceptual 2D beta-gamma spectra [3]
Approach This project is a continuation of the FY14 LDRD project “Field detector development for undeclared/declared nuclear testing for treaty verification monitoring” and is a collaboration of scientists and engineers. Phase I began the assessment of a small, robust/portable beta-gamma coincidence counting system using the following approach:
• Demonstrating beta-gamma coincidence counting of xenon using COTS rack mount lab scale electronics and an Ortec digiBase multichannel analyzer
• Initial development of the custom electronics necessary to perform beta-gamma counting using one USB interface
• Evaluation of commercially available hardware from Amptek and Ortec for the beta and gamma spectrometry interfaces
• Design and fabrication of a gas scintillation cell Phase II of this project focused on continued development of the custom electronics and the continued development of the gas scintillation cell and beta-gamma detector characterization. For the development of the custom electronics, two approaches were taken to address the timing challenges and integration of the electronics and data collection. The first was the development of a Visual Studio software application and the second was the design of an embedded hardware circuit board. The continued development of the gas scintillation cell looked and fabrication using three different plastic

Page 82 of 132
scintillators. A sample of radioxenon gas was collected and used to evaluate the gas cell and beta-gamma detector system. Results/Discussion This project continued the development of a small, robust beta-gamma coincidence counting system, which will combine collection and in situ detection methodologies. This will be a significant advancement for field detection/quantification of short-lived xenon isotopes that would not survive transport time for laboratory analysis. During Phase I of the “Field detector development for undeclared/declared nuclear testing for treaty verification monitoring” LDRD, we successfully performed baseline xenon beta-gamma coincidence counting with lab scale electronics and then demonstrated that an Ortec digiBase could perform similar beta-gamma coincidence counting. Using a 181Hf solution, a background reduction of more than 500x was achieved for measuring beta-gamma coincidence signals over measuring gamma signals alone with an unshielded detector resulting in a sensitivity improvement of almost 25x, see Figure 3. The initial development of the custom electronics necessary for beta-gamma counting started with an evaluation of the electronic circuit configuration and selection of the multichannel analyzers for the beta spectrometry and gamma spectroscopy interfaces, Amptek DP5G and Amptek TB-5, respectively, see Figure 4. A gas cell was designed and fabricated with Eljen Technology plastic scintillators. Two different geometry designs for the gas cells were considered: a circular designs and a square cell design, see Figure 5. The two gas cell designs were fabricated and evaluated; and the circular cell design was chosen for further testing.
Figure 3: Spectra of 181Hf using no gate delay and a 1.25 us gate delay, a ~500x background reduction is achieved
Figure 4: Electronic components
selected for beta-gamma coincidence system
Figure 5: Gas cell protoypes
Phase II of this project focused on the continued development of the custom electronics necessary to perform beta-gamma coincidence counting. The beta-gamma coincidence counting system consists of three basic components: 1) the beta subsystem, 2) the gamma subsystem and 3) a controller to perform basic setup and control of the Beta/Gamma subsystems and creation of a data stream for analysis, see Figure 6. The beta subsystem processes incoming pulses from the beta PMT to create a time record with beta energy. The beta pulse produces an external signal which is applied to the gamma subsystem and serves as a gate to enable gamma data collection (timestamp and energy). The gamma pulses outside this gate window are ignored. Upon receipt of a valid gamma pulse, the controller searches the beta record for a matching timestamp and creates a record of the coincident beta and gamma pulse energies and timestamps. Two approaches were taken to address the timing challenges and integration of the electronics and data collection: development of a custom Visual Studio software application and design of a custom embedded hardware circuit board. The Visual Studio software application is a PC based application that allows the user to control the set-up of both the beta and gamma systems prior to data collection. The software script synchronizes the time bases between the two systems and analyzes the data streams for coincident data sets, see Figure 7. The advantage of the Visual Studio software

Page 83 of 132
application is that it allows for better user interaction during the development cycle including enhanced monitoring of the beta/gamma subsystems, more control over hardware setup and operation and easily obtainable data records for faster analysis. The embedded system is a small printed circuit board with an integral microcontroller that will control all beta/gamma subsystem setup and control. It will also produce the output file stream containing the beta-gamma coincidence data. This hardware is tailored specifically for embedding in field measurement systems and provides little in the way of a user interface with its primary interface target being another microcontroller. Both the desktop and embedded solutions utilize the same beta-gamma collection hardware.
Figure 6: Block diagram for the beta-gamma coincidence
system
Figure 7: Visual Studio application interface screen.
In addition to the custom electronics development work, the LDRD made significant progress in the development and testing of the gas scintillation cell and the beta-gamma detector characterization. Scintillation gas cells were designed to fit within existing NaI well detectors and were fabricated using three different scintillation plastics from Eljen Technology: EJ-200, EJ-204, & EJ-212. These scintillators were chosen based on their overall properties and are equivalent to other scintillators used in literature (i.e. EJ-204 is equivalent to the St. Gobain BC-404 plastic scintillator used in the SAUNA system, EJ-212 is equivalent to St. Gobain BC-400 used in Phoswich detectors, and EJ-200 is a good general purpose scintillator). The impact of the epoxy used in fabrication of the gas cell and the silicon interface for the PMT on the background of the beta spectrum was investigated and these components were found to have no contribution to the beta spectrum. The Amptek DP5G MCA performance was evaluated using a 207Bi sample and was found to perform in an equivalent manner to the Ortec digiBase. Using the beta-gamma coincidence counting, a reduction in background of 320x was achieved, see Figure 8, and the 40K contaminate peak is no longer present. A screen-shot of the oscilloscope trace detailing the gate window for allowing beta-gamma coincidence is shown in Figure 9.
Figure 8:
207Bi spectrum showing a background
reduction of ~320x in beta-gamma coincidence mode.
Figure 9: Oscilloscope trace showing the beta
pulse triggering the gamma.
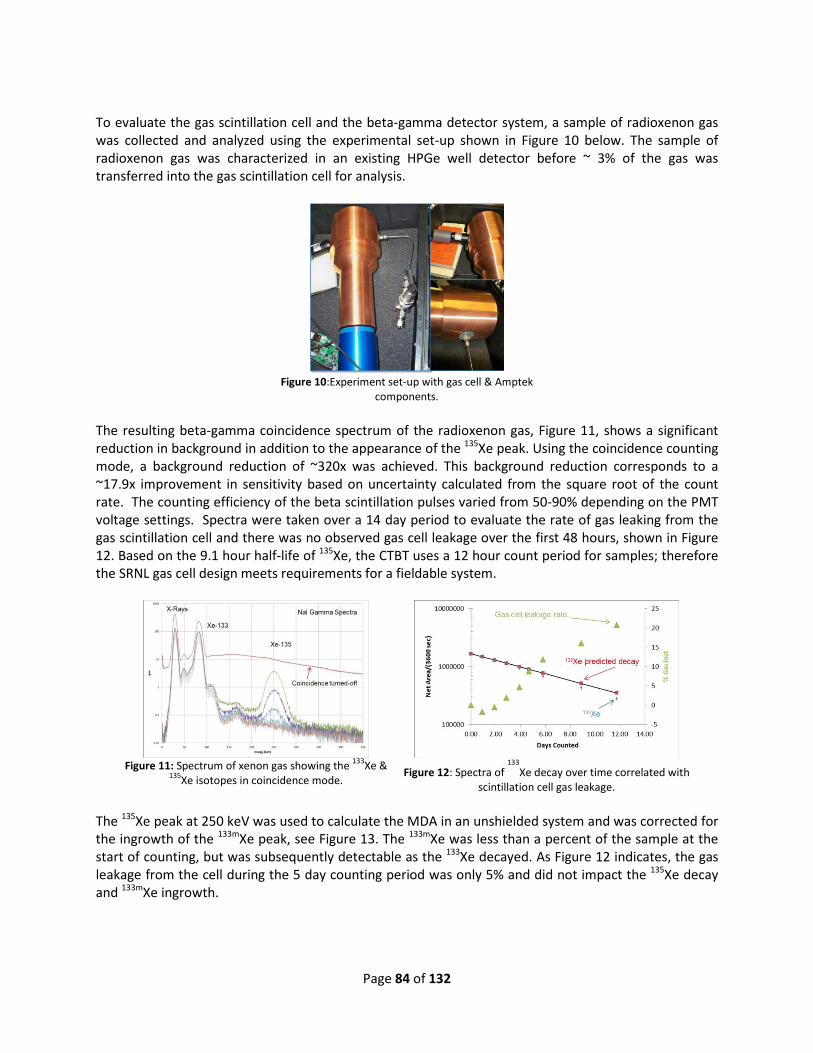
Page 84 of 132
To evaluate the gas scintillation cell and the beta-gamma detector system, a sample of radioxenon gas was collected and analyzed using the experimental set-up shown in Figure 10 below. The sample of radioxenon gas was characterized in an existing HPGe well detector before ~ 3% of the gas was transferred into the gas scintillation cell for analysis.
Figure 10:Experiment set-up with gas cell & Amptek
components. The resulting beta-gamma coincidence spectrum of the radioxenon gas, Figure 11, shows a significant reduction in background in addition to the appearance of the 135Xe peak. Using the coincidence counting mode, a background reduction of ~320x was achieved. This background reduction corresponds to a ~17.9x improvement in sensitivity based on uncertainty calculated from the square root of the count rate. The counting efficiency of the beta scintillation pulses varied from 50-90% depending on the PMT voltage settings. Spectra were taken over a 14 day period to evaluate the rate of gas leaking from the gas scintillation cell and there was no observed gas cell leakage over the first 48 hours, shown in Figure 12. Based on the 9.1 hour half-life of 135Xe, the CTBT uses a 12 hour count period for samples; therefore the SRNL gas cell design meets requirements for a fieldable system.
Figure 11: Spectrum of xenon gas showing the 133Xe &
135Xe isotopes in coincidence mode.
Figure 12: Spectra of
133Xe decay over time correlated with
scintillation cell gas leakage. The 135Xe peak at 250 keV was used to calculate the MDA in an unshielded system and was corrected for the ingrowth of the 133mXe peak, see Figure 13. The 133mXe was less than a percent of the sample at the start of counting, but was subsequently detectable as the 133Xe decayed. As Figure 12 indicates, the gas leakage from the cell during the 5 day counting period was only 5% and did not impact the 135Xe decay and 133mXe ingrowth.

Page 85 of 132
Figure 13:
135Xe decay over time. Blue diamonds show measured peak area, the green
triangles are corrected for the 133mXe peak overlap and the red squares are predicted 135
Xe decay based on the half-life. Analysis of the radioxenon sample in the gas scintillation cell demonstrated that the existing zeolite collection transfer technology is suitable for use with the beta-gamma gas scintillation cell. The experimental set-up shown in Figure 10 demonstrated that beta-gamma coincidence counting is feasible using the Amptek hardware and the development of the Visual Studio application script will demonstrate that pulse height analysis is possible with the Amptek hardware, which will allow for analysis of all 4 xenon isotopes with 2D beta-gamma plots. The embedded hardware circuit board is the implementation of these two concepts in a fieldable form. FY2015 Accomplishments
• Fabrication of gas cells with 3 different scintillation material (i.e. EJ-200, EJ-204, EJ-212) • Examined beta spectra of scintillation gas cell components: No contribution to the beta
spectrum from the epoxy used in gas cell fabrication or the silicon PMT interface • Selected Amptek TB-5 for gamma interface and Amptek DP5G for beta PMT interface • Fabrication of 3 testing systems for electronics development and gas cell calibration/nuclear
counting testing • Proved that beta-gamma coincidence was possible with the Amptek modules through both
selective gating and data stream collection • Initial development of the custom Visual Studio Application software • Initial design and development of the custom embedded beta-gamma control hardware. • Tested the gas cell and beta-gamma detectors with radioxenon gas sample • Beta counting was 50- 90% efficient depending on PMT voltage • Gas scintillation cell showed no leakage in first 48 hours • Demonstrated detector linearity over five orders of magnitude for both the beta as well as
gamma detectors
Future Directions • Continued development of the design for integrated microcontroller and fabrication of
microcontroller • Comparison of the EJ-200, EJ-204 and EJ-212 scintillation plastics • Collection and analysis of all four radioxenon isotopes using the developed 2D beta-gamma
system • Prepare manuscript for publication

Page 86 of 132
FY 2015 Publications/Presentations 1. A mid-year progress presentation was given at SRNL. 2. A presentation detailing the project concepts and the progress of Phase I/Phase II work was given to potential government funding sources to leverage follow-on funding after project completion. References 1. Zähringer et al., J Radioanal Nucl Chem, 282, 2009, 737-742 2. Kalinowski et al., Pure Appl Geophys, 167, 2010, 517-539 3. Fritioff, T. How to detect a nuclear explosion using a SAUNA, 2011 presentation Acronyms ARIX: Analyzer for Xenon Measurements COTS: Commercial off the shelf CTBT: Comprehensive Nuclear Test Ban Treaty IMS: International Monitoring System MCA: Multichannel analyzer PMT: Photomultipler tube SAUNA: Swedish Automatic Unit for Noble Gas Acquisition SPALAX: Système de Prélèvement d’air Automatique en Ligne avec l‘Analyse des radioxenon SRNL: Savannah River National Laboratory

Page 87 of 132
Project Team: R. Achey (Primary), D. Hunter Thrust Area: NS Project Start Date: October 1, 2014 Project End Date: September 30, 2015
Argon Collection and Purification for Proliferation Detection
SRNL has developed a continuous gas enrichment system that produces an output stream containing 97% argon from whole air using adsorbent separation technology. The vacuum swing adsorption (VSA) enrichment system is easily scalable to deliver ten liters or more of argon within twelve hours. Testing has shown that gas chromatographic separation using a column of modified hydrogen mordenite molecular sieve is
capable of further purifying the sample to better than 99% purity after separation from the helium carrier gas. The combination of these concentration and purification systems has the capability of being used for a field-deployable system for collecting argon samples suitable for ultra-low-background proportional counting for detecting declared/undeclared underground nuclear detonations under the On-Site Inspection program of the Comprehensive Nuclear-Test-Ban-Treaty Organization verification regime. FY2015 Objectives
• Develop a VSA argon enrichment system that outputs 10 L of 97% pure argon within 12 hours from a whole air input without the use of cryogenics or refrigeration.
• Develop a gas chromatographic purification step that purifies the output of the VSA system to 99.99% argon.
Introduction In order to determine whether a seismic event was a declared/undeclared underground nuclear weapon test, environmental samples must be taken and analyzed for signatures that are unique to a nuclear explosion.1 Gas samples are analyzed for signature gases, especially radioactive xenon. Underground nuclear tests also produce radioactive argon, but that signature is not well monitored.2 The high-energy neutron flux produced by underground nuclear detonations can convert 40Ca in the soil into 37Ar by capture of a neutron and emission of an alpha particle. The quantity of 37Ar that is produced by an underground nuclear detonation greatly exceeds the amount that is naturally occurring.3 37Ar has a half-life of 35 days, allowing detection of emissions produced by an underground nuclear detonation weeks after it occurs. Because the longest half-life of the xenon isotopes produced by a nuclear explosion is 11 days for 131mXe, 37Ar gives the opportunity to detect the signature of a nuclear explosion for a longer time after the event. Despite efforts to contain the products of the detonation, 37Ar eventually escapes into the atmosphere because its formation is in the overburden surrounding an underground nuclear test.3 Even if there is no immediate venting of the explosion products, variation in atmospheric pressure due to weather fronts will draw the gases up from the ground, a process known as barometric pumping.4 Collection of large samples of argon from the atmosphere, along with ultra-low-background proportional counting techniques, can detect the 37Ar even at long distance. A 37Ar signature along with other signatures can more conclusively determine whether an event was a nuclear test.

Page 88 of 132
Approach An argon concentration system using VSA was developed for the initial separation of argon from whole air. The system passes air over a bed of molecular sieve that adsorbs the major components of air while allowing argon to pass through. The molecular sieve has been modified to reduce the pore size. The tailoring of the pore size enables a size exclusion separation; inhibiting noble gases from entering the pores while still letting nitrogen and oxygen enter the pores. This step performs the majority of the separation necessary, producing an output that is 97% argon. For further purification, a separation using a gas chromatographic column was explored. This step removes most of the remaining impurities from the argon to produce, after
separation of the argon from the helium carrier stream, an output with purity better than 99%. Results/Discussion A benchtop VSA enrichment system was assembled and tested, shown in Fig. 1. Figure 2 shows the flow diagram for the VSA system. Dry input air at a flow of 20 L/min is fed into a canister filled with modified sodium mordenite molecular sieve zeolite. Nitrogen
and oxygen are preferentially adsorbed by the molecular sieve, allowing a stream enriched in argon to flow from the output of the canister. Before nitrogen and oxygen start to pass through the bed in high concentration, the flow is stopped and the argon-enriched gas in the output manifold is pumped into a holding reservoir. After one canister is saturated, the input flow is switched to the other canister and the saturated canister is regenerated under vacuum. Production is
alternated back and forth between the pair of canisters to provide a continuous output of gas enriched in argon. The output of the first enrichment stage is fed from the reservoir into a second enrichment stage consisting of a canister filled with the same molecular sieve. This canister is a special design to improve efficiency of concentration. The input flow to the second enrichment stage is started when the
Figure 1. Example benchtop VSA system for argon enrichment.
Figure 2: Flow diagram for VSA system for argon enrichment
Figure 3. Chromatogram of VSA output for residual contamination assessment

Page 89 of 132
pressure in the holding reservoir reaches a set level. The output of the second VSA enrichment stage at 97% argon is 5 L in 12 hours. If the VSA system is run with an output of 90% argon, then the system developed outputs over 10 L of argon in 12 hours and no scale up of the VSA system is necessary. A gas chromatographic column was tested for purification of the VSA output. It was found that a column packed with modified hydrogen mordenite performs well for separating argon from the residual impurities, producing an output with purity better than 99% when separated from the helium carrier gas. A chromatogram of the column output is shown in Fig. 3. In the chromatographic purification step, the output of the VSA is flowed over a column filled with modified hydrogen mordenite. Pulses of input gas are interspersed and the argon peaks are routed to the final output sample, while the other peaks are discarded. A column containing molecular sieve could be sized appropriately to purify 10 L of argon in 12 hours. The chromatographic separation can easily handle 90% argon in the input with 10% impurities, which would allow use of the VSA system on the scale developed and no scale-up of the VSA would be necessary for a full-size system. FY2015 Accomplishments
• Developed a VSA system that produces 5 L of 97% argon in 12 hours continuously from whole air without the use of cryogenics. The system is easily scalable to provide 10 L of argon in 12 hours.
• Developed a chromatographic separation that can remove most of the residual impurities, scalable to handle necessary production rate.
Future Directions
• Integrate the argon concentration steps into a benchtop demonstration system and perform testing and optimization of the complete system.
• Implement final separation of the argon from the helium carrier stream of the gas chromatographic separation step using adsorption on activated charcoal (a widely-used separation technique).
• Obtain customer funding for development of field-deployable argon collection system. FY2015 Publications/Presentations 1. Mid-year review presentation, February 2015 References 1. Schulze, J.; Auer, M.; Werzi, R. Appl. Rad. and Isot. 2000, 53, 23. 2. Aalseth, C.E.; Day, A.R.; Haas, D.A.; Hoppe, E.W.; Hyronimus, B.J.; Keillor, M.E.; Mace, E.K.; Orrell, J.L.; Seifert, A.; Woods, V.T. Nucl. Inst. and Meth. in Phys. Res. A 2011, 652, 58. 3. Haas, D.A.; Orrell, J.L.; Bowyer, T.W.; McIntyre, J.I.; Miley, H.S.; Aalseth, C.E.; Hayes, J.C. “The Science Case for 37Ar as a Monitor for Underground Nuclear Explosions”, Report No. PNNL-19458, 2010. 4. Carrigan, C.R.; Heinle, R.A.; Hudson, G.M.; Nitao, J.J.; Zucca, J.J. “Barometric Gas Transport Along Faults and Its Application to Nuclear Test-Ban Monitoring”, Report No. UCRL-JC-127585, 1997.
Acronyms CTBTO: Comprehensive Nuclear-Test-Ban Treaty Organization VSA: Vacuum Swing Adsorption

Page 90 of 132
Project Team: J. Gray (Primary), B. Huffer, B. Peters, L. Sexton, J. Gaillard, S. Serkiz Subcontractor: T. DeVol (Clemson University) Thrust Area: NS Project Start Date: October 1, 2014 Project End Date: September 30, 2015
Nanostructured Neutron Conversion Material for Gas-Filled Proportional Detectors
This work sought to develop a novel neutron detector that could achieve detection efficiencies similar to current helium-3 (3He) gas proportional counters without the use of 3He, thereby, alleviating the need for 3He, which is in short supply. Additionally, SRNLs proportional counter (PC) could be an alternative to boron-lined and gaseous BF3 PCs. This design is amenable to retrofitting boron nanomaterials into a commercially available proportional counter. The porous buckypapers and aerogels fabricated in this work were positioned between the anode and cathode of the PC. The boron-10 (10B) within the buckypaper serves as a
neutron conversion material and, because of its particle size (nm) relative to the self-absorbance distance of the neutron reaction products (7Li and α particle), shows little to no “wall effect”. Calculations indicate that by using isotopically enriched 10B we can increase detection sensitivity while maintaining similar gamma discrimination performance compared to 3He. This design takes advantage of recent advancements in nanotechnology to fabricate freestanding porous buckypapers/ aerogels/ membranes comprised of boron-10 nitride nanotubes or nanofibers (10BNNTs or 10BNNFs). Through testing with commercially available BNNTs having a natural isotopic distribution, SRNL has successfully shown effective neutron detection, enhanced gamma discrimination, and a lessened wall effect (i.e., nearer full-energy spectra). FY2015 Objectives
• Objective 1. BNNT paper/aerogels: SRNL will produce BNNT buckypapers with varying porosities and thicknesses.
• Objective 2. Radiation detection: SRNL will construct and test a proportional counter with the assistance of Clemson University.
• Objective 3. BNNT production: SRNL will produce and purify 10BN nanotubes using a high-energy ball-milling/annealing process currently housed at SRNL.
Introduction PCs are a common type of gas-filled radiation detection device, used in various areas of the nuclear industry, which are capable of distinguishing between a wide range of radiation types and energies. Solid state neutron PCs that incorporate boron-10 (10B) as the neutron absorber are actively being pursued and are promising alternatives to the common gaseous BF3 PCs because of their fill gas flexibility, low toxicity, and robustness. These B-lined PCs, however, suffer from “wall effects”, where one of the two reaction products (either 7Li or α) is unable to escape into the detector fill gas, resulting in significant energy loss of the reaction products. Figure 1a depicts this 50% loss in reaction products and its corresponding neutron spectrum. Significant loss of the reaction products greatly reduces the neutron sensitivity, efficiency, and adequately discriminate gamma radiation.

Page 91 of 132
During FY15, SRNL began the development of an advanced neutron detector utilizing freestanding porous nanomaterial membranes designed to eliminate wall effects as well as self-absorbance of neutron reaction products (α, 7Li) typical of micron-sized and larger neutron-conversion layers. Specifically, our detector uses a porous freestanding nanostructured boron neutron converter material that will ultimately be composed of isotopically enriched 10B nitride nanotubes (10BNNTs) that are positioned in a conventional PC between the anode and cathode. Simple calculations predict that this detector (when using B enriched in 10B) can achieve a neutron detection sensitivities 3-5X that of similarly sized 3He detectors (shown in Figure 1b) with comparable efficiencies and increased gamma discrimination. Additionally, because the diameter of the BNNTs is several orders of magnitude less than the range of neutron reaction products in solids, the α-particles and 7Li ions can easily transverse the full length of the buckypaper with minimal energy losses. Experimental optimization of the neutron conversion layer was performed in collaboration with Clemson University, building upon two strengths of the assembled research team: manufacturing of nanoscale devices and radiation detection and measurements.
The overarching objective of this project is to evaluate the neutron detection response of a PC with a porous 10BN nanomaterial film as a neutron absorber. If this material performs as preliminary calculations predict, increased sensitivities, and gamma discrimination compared to currently used 3He detector with the same detection volume are expected. Additionally, the SRNL design is expected to lead to significant improvement in spectra resolution over conventional boron-lined proportional counters that ultimately results from greater energy capture of both neutron reaction products (α, 7Li).
Figure 1 a) Cross-sectional schematic of B-lined PC tube and corresponding spectrum demonstrating the wall-effect. b) Schematic of 3He filled PC tube and its corresponding spectrum showing a clear full energy peak.

Page 92 of 132
Approach Recent advancements in nanotechnology have allowed the fabrication of freestanding nanotube buckypapers/aerogels with 20-99 % porosity using 10BNNTs and nanofibers (Figure 2 shows a buckypaper rolled into a cylinder). The BNNT buckypaper is a robust material and with the requisite number of boron atoms (especially, 10B) for neutron capture in our design, would be positioned in a traditional proportional detector between the anode and cathode as a neutron conversion layer. A schematic of the PC design, buckypaper configuration, and corresponding neutron reaction product interaction with the fill gas is shown in cross-section view in Figure 3. Using the scaling factor approach, our calculations show that a 200 micron thick 10BNNT buckypaper (96% 10B) with 20%
porosity would be 32.5% more sensitive to neutrons than a typical 3He detector. Because sensitivity scales with buckypaper porosity, a 1mm thick paper could provide 9-15 cps/ng, assuming 25-60% porosity and minimal loss of the reaction product energy within the buckypaper. For this calculation it is assumed that our detector design will have a response function that is more typical to a 10BF3 gas-filled detector than a 10B-lined proportional detector with its associated “wall-effects.”
Additionally, the diameter of the 10BNNTs and boron nanofibers (~10-50 nm) are several orders of magnitude smaller than the range of the 10B reaction products. As a result of this, the reaction products can transverse through the BNNT buckypaper and into the fill gas without significant energy loss. When we combine this with the effects of increased porosity, the number of neutron reaction products that escape the buckypaper is calculated to increase and begin depositing a greater fraction of the energy of the neutron reaction products into the fill gas. Ultimately, through the optimization of the size of the 10BNNTs and conversion-layer porosity, the incorporation of those nanotubes into a buckypaper/aerogel, and the design of the
PC, should result in a more sensitive neutron detection device.
Results/Discussion Initial experiments were designed around the parallel plate concept, where the porous BNNT conversion layer is suspended between anode and cathode plates (Figure 4) and sealed inside the PC. The PC is then filled with between 4-5 atm of P-10 gas.
Initial experiments were conducted using commercially available BNNTs having a natural isotopic abundance (Figure 2) fashioned into a pure BNNT freestanding paper using standard vacuum filtration techniques. Preliminary testing revealed potential charging effects as a result of the non-conducting
Figure 3 Cross-sectional schematic diagram of free standing 10BN buckypaper/ aerogel film with cylinder geometry (bottom), and illustration of the operational principle (top) of the proportional counter.
Figure 2 Images of boron nitride nanotubes (BNNT) buckypaper and CNT aerogel with arrows indicating the corresponding SEM images.
Figure 4 SRNL’s initial PC design (parallel plate) with schematic (left).

Page 93 of 132
natural BNNT paper. To impart conductivity into the structure, we produced a paper initially containing 65wt% BNNT and 35wt% multi-walled carbon nanotubes (CNTs) and confirmed energy deposition from both neutron reaction products. Initial non-optimized spectra using 19:1 and 3:7 ratios of BNNT to CNT show decreasing count rates as a function of time, suggesting charging problems. After collection for approximately 2 minutes, we see the count rate drop from 10 cps to 0.01 cps and a significant lag in voltage response when we attempt to drop to lower voltages. Optimization of the BNNT/CNT ratio was conducted and to confirm that the device was detecting neutron reaction products and that those reaction products had the ability to escape the BNNT:CNT conversion layer, SRNL monitored the response of the PC when exposed to a Po-210 source (pure α emitter). Figure 5 shows the resulting count rate spectra for both an unimpeded α-particle traveling through the PC and one passing through the conversion material. While the conversion material does slightly alter the overall shape and energy distribution, the total counts remained unchanged. With the optimized 4:1 BNNT:CNT conversion material, we observe a clear difference in response between the neutron, gamma irradiation, and background, and the resulting spectrum for neutrons shows some full energy (both reaction products captured) deposition (Figure 6). In addition to clear gamma discrimination, we no longer observe charge collection on the surface of the conversion material, resulting in collection stability over extended periods of time (e.g., hours or days). This indicates that heavy-charged particles and electrons can transverse through the porous BN nanomaterials with minimal energy losses. Therefore, we can confirm that in the spectra shown in Figure 6, the counts from channel 200-300 are attributed to energy deposited from both reaction products in the fill gas, while counts around channels 100 and 150 are attributed to the 7Li and α reaction products, respectively. It should be noted that the small gamma signal (blue trace in Figure 6) is most likely related to electrical interference. This test will need to be repeated to verify authenticity.
Additionally, SRNL began producing BNNT (normal isotopic distribution) aerogels using a supercritical drying technique, which involved replacing the ethanol used to disperse the BNNT material with CO2 under high pressures. Initial attempts, using pure BNNT materials, produced an aerogel that had less porosity than desired and that remained slightly tacky. The resulting neutron detection did not produce spectra that were comparable to that shown in Figure 6, as breakdown of the aerogel and charge collection were major issues. As a path forward, SRNL will begin producing BNNT:CNT aerogels and aerogels with a capping material thin enough to ensure that it does not block the transfer of the neutron reaction products to the fill gas.
Our goal in follow-on work is to produce optimized buckypapers/aerogels that exhibit significantly more full-energy deposition and less wall effects. Overall in FY15, SRNL produced BNNT:CNT buckypaper composities of varrying concentrations (ranging from 1:1 to 19:1) and thicknesses that showed good energy distribution and increased gamma discrimination. SRNL has shown that by incorporating approximaly 25% CNT with the
α
7Li
Figure 6 Neutron, gamma-ray, and background spectra from a 4:1 BNNT:CNT composite paper placed between the anode and cathode of the SRNL developed PC .
7Li+α
Figure 5 Po-210 alpha particle response for SRNL’s parallel plate PC with and without conversion layer material in place.

Page 94 of 132
BNNTs, when making the conversion material, imparts sufficient conductivity that greatly decreases charging effects. Our future goal is to obtain significantly more full energy deposition and less wall effect by moving away from the ionization region and into the proportional region. This will require further investigation of the charging effects to decrease the background signal and false gamma counts as the PC is operated at higher voltages. We will begin further conversion layer optimization by modeling the manner in which the electric field surrounding the material changes as the relative permittivity of the neutron conversion material is maniuplated.
FY2015 Accomplishments Brief descriptions of accomplishments to date are found herein:
• Commercial BN nanotubes with a natural isotopic ratio have been successfully incorporated into buckypapers and aerogels.
• Demonstrated the transport of heavy-charged particles and electrons through porous BN nanomaterials with minimal energy losses by comparing the energy deposition spectrum for xMeV α-particles using BN nanomaterial buckypapers and a typical fragment ionization chamber count (Figure 5).
• Initial neutron measurements have been conducted and show high gamma discrimination and promising neutron detection resolution (See Figure 6).
• Effectively reduced background contributions and improved detector performance by elimination of surface charge collection. This was accomplished through the use of conductive dopants.
Future Directions • Improve detection energy spectra, detector response, and effective gamma discrimination
through the adjustment of timing and shaping constants. • Incorporate 10B into BN buckypaper/aerogel. • Determine best candidates for nanoscaled 10BN-based materials and compare detection
efficiency to traditional detector designs. References
1) Nelson et al., “A novel method for detecting neutrons using low density high porosity aerogel and saturated foam,” Nuclear Inst. Meth., A 686 (2012) 100-105.
2) Kim et al., “Hydrogen-catalyzed, pilot-scale production of small-diameter boron nitride nanotubes and their macroscopic assemblies,” ACS Nano 8 (2014) 6211–6220.
Acronyms 10BNNTs - Boron-10 nitride nanotubes CNT - Carbon nanotube PC - Proportional Counter SRNL - Savannah River National Laboratory
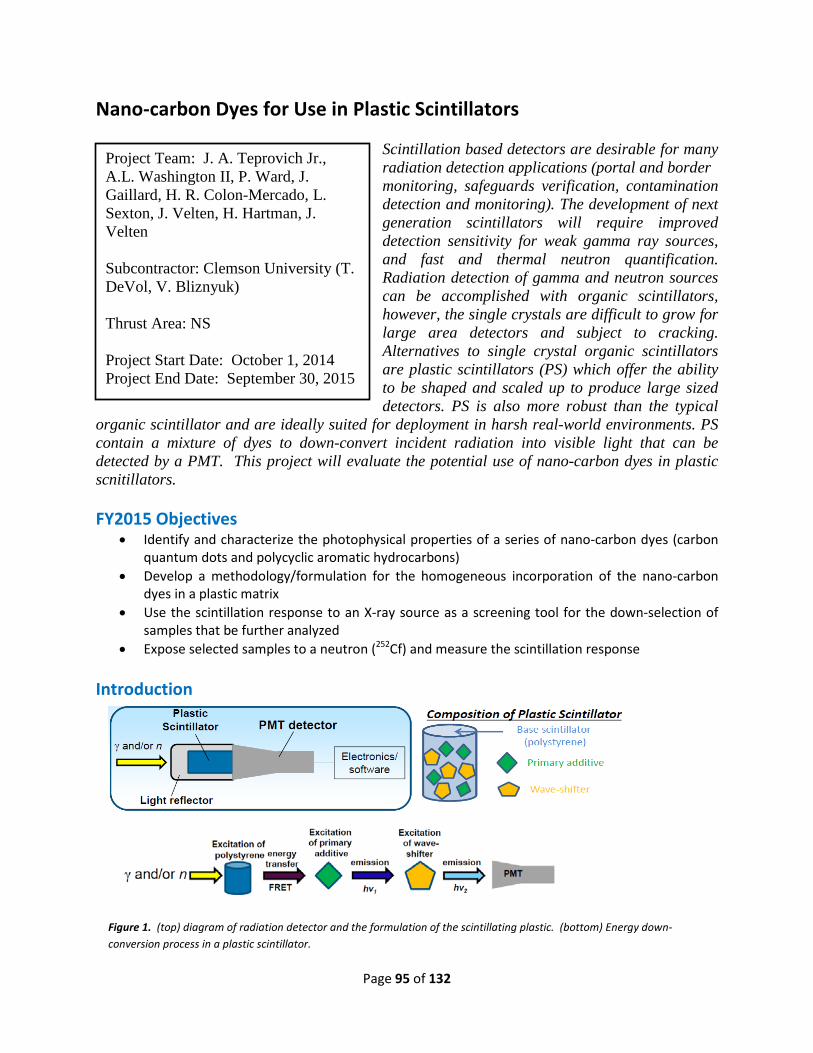
Page 95 of 132
Project Team: J. A. Teprovich Jr., A.L. Washington II, P. Ward, J. Gaillard, H. R. Colon-Mercado, L. Sexton, J. Velten, H. Hartman, J. Velten Subcontractor: Clemson University (T. DeVol, V. Bliznyuk) Thrust Area: NS Project Start Date: October 1, 2014 Project End Date: September 30, 2015
Nano-carbon Dyes for Use in Plastic Scintillators
Scintillation based detectors are desirable for many radiation detection applications (portal and border monitoring, safeguards verification, contamination detection and monitoring). The development of next generation scintillators will require improved detection sensitivity for weak gamma ray sources, and fast and thermal neutron quantification. Radiation detection of gamma and neutron sources can be accomplished with organic scintillators, however, the single crystals are difficult to grow for large area detectors and subject to cracking. Alternatives to single crystal organic scintillators are plastic scintillators (PS) which offer the ability to be shaped and scaled up to produce large sized detectors. PS is also more robust than the typical
organic scintillator and are ideally suited for deployment in harsh real-world environments. PS contain a mixture of dyes to down-convert incident radiation into visible light that can be detected by a PMT. This project will evaluate the potential use of nano-carbon dyes in plastic scnitillators. FY2015 Objectives
• Identify and characterize the photophysical properties of a series of nano-carbon dyes (carbon quantum dots and polycyclic aromatic hydrocarbons)
• Develop a methodology/formulation for the homogeneous incorporation of the nano-carbon dyes in a plastic matrix
• Use the scintillation response to an X-ray source as a screening tool for the down-selection of samples that be further analyzed
• Expose selected samples to a neutron (252Cf) and measure the scintillation response
Introduction
Figure 1. (top) diagram of radiation detector and the formulation of the scintillating plastic. (bottom) Energy down-conversion process in a plastic scintillator.

Page 96 of 132
It has been recently demonstrated by a group at LLNL that it is possible to discriminate between high energy neutrons and gamma radiation by means of pulse shape discrimination (PSD) utilizing a PS composed of polyvinyl toluene plastic doped with 2,5-diphenyloxazole (PPO) as a dye.[1] They were able to achieve a PSD of gamma and neutrons that has a figure of merit (FOM) comparable to that of common liquid scintillators. Building upon the PS work of the LLNL group, the addition of a second dye material (known as a wave-shifter) was necessary. This additional dye component is necessary to minimize self-absorption, increase attenuation length, and aid in light collection in complex geometries resulting in an improved PSD capability. In general, all of the state-of the-art PS examined for gamma and neutron PSD contain 3 common components (Figure 1): the base scintillator/plastic (i.e. polyvinyl toluene or polystyrene), primary additive dye (i.e. PPO), and a wave-shifter dye(i.e. 1,4-di-(2-(5-phenyloxazolil))-benzene, POPOP).[2,3] The purpose of the base plastic is to interact with the incident radiation, which is the dominant component of the PS, and serves as an energy donor to the primary additive through a Forster resonance energy transfer (FRET) mechanism. FRET is a non-radiative energy transfer process involving a resonant dipole-dipole interaction between two electronically similar species. This strong coupling (between the base plastic and primary additive) sharply increases the sampling speed and the light yield of the PS. The primary additive (now in the excited state) emits a photon as it returns to the ground state. Typically, this emitted photon has energy in the UV portion of the spectrum and not optimal for detection by the PMT detector. The purpose of the wave-shifter is to absorb the UV photon emitted by the primary additive and emit another photon further toward the red portion (longer wavelength) of the visible spectrum where the PMT has higher spectral sensitivity (Figure 1, bottom). The discrimination between fast and thermal neutrons requires the incorporation of neutron targets (i.e. 6Li and 10B) into the PS. Some research groups have successfully achieved Li and B loading of up to 5 wt % in a polystyrene based PS containing 2,5-diphenyloxazole (PPO) as the primary additive and 9,10-diphenylanthracene (DPA) as the wave-shifter. [4,5] Upon the addition of 5 wt % B to the composite, the same composite is now capable of distinguishing simultaneously between fast and thermal neutrons as well as gamma radiation. Approach SRNL synthesized nano-carbon dyes (polycyclic aromatic hydrocarbons and carbon quantum dots) and optimized their photophysical properties for scintillation applications. This will include a thorough photophysical characterization of candidate nano-carbon dyes by a variety of spectroscopic techniques (absorption, emission and excitation spectra). Clemson University and SRNL will develop a methodology to incorporate the nano-carbon dyes into a base scintillating plastic such as polystyrene or polyvinyl toluene. Clemson University will be responsible for evaluating the scintillating ability of the PS samples by first using an X-ray source as a screening tool. The promising samples from the screening tests will be excited by a 252Cf source. The ability of the PS to simultaneously discriminate between gamma and neutron (fast and thermal) will be measured by researchers at Clemson University. The primary focus is to develop neutron (fast and thermal) and gamma-ray discriminating multi-functional composites that can be mass produced at low cost and have the potential to be integrated into portable or large area detectors.

Page 97 of 132
Results/Discussion Two candidate nano-carbon dyes were identified and examined as potential dyes for PS: carbon quantum dots (CQD) and polycyclic aromatic hydrocarbons (PAH). The absorption, emission, and excitation spectra for the candidate nano-carbon dyes were obtained. It was found that the emission maximum of the CQDs is tunable based ion the concentration of the dye in solution with blue emission
observed for low dye concentrations and red emission observed for high dye concentrations. The PAH dyes showed an emission maximum at ~500 nm in a variety of solvent and concentrations. The quantum yield for the CQDs is 12% while the PAHs have quantum yields of 55% in solution. A methodology was developed to infuse polystyrene and polyvinyl toluene (PVT) using a divinyl benzene (DVB) cross-linker with various concentrations of the
nano-carbon dyes by in-situ polymerization. A series of sample were prepared with the CQDs and PAHs serving as the primary or wave-shifting dye. Additional samples were prepared with added carborane (C2B12H12) to improve the neutron detection efficiency. Excitation with an X-ray source was used as a screening tool to determine which candidate nano-carbon dye containing samples should be further studied. This determined that the CQD dyes were not ideal candidates due to their low light output while the PAH containing samples showed good light output and should be further evaluated. Selected samples were also excited by a 252Cf source and shown in Figure 4. Sample #42 is a blank polyvinyl toluene sample without any added dye. Sample #43 is a commercial plastic scintillator. Samples #46 and #50 are PS samples containing the PAH dyes. This indicates that we are able to successfully prepare PAH containing PS that behave similar to commercially available PS. The use of PAH in this application is
Figure 2. (left) Fluorescence of CQDS with increasing concentration. (middle) Comparison of PAH/PPO solution fluorescence with commercially available plastic scintillator, (right) Fluorescence comparison of PAH and PPO in PVT.
400 500 600 700 800 9000.0
0.2
0.4
0.6
0.8
1.0
Wavelength (nm)
Emis
sion
Inte
nsity
(a.u
.) Excit. at 350nm 0.0063 mg/mL 0.0158 mg/mL 0.0315 mg/mL 0.1544 mg/mL 0.3014 mg/mL 0.4416 mg/mL 0.5755 mg/mL 0.7033 mg/mL 0.8256 mg/mL 0.9428 mg/mL 1.055 mg/mL
350 400 450 500 550 600 650 7000.0
0.2
0.4
0.6
0.8
1.0
Emis
sion
Inte
nsity
(a.u
.)Wavelength (nm)
BC400 - St. Gobain PPO + PAH (low) PPO + PAH (high)
300 400 500 600 7000.0
0.2
0.4
0.6
0.8
1.0
Wavelength (nm)
Emis
sion
(a.u
.)
PVT blank PPO + DVB + PPO blank 0.5g PAH/PVT + DVB + PPO 2.0g PAH/PVT + DVB + PPO
Figure 3. PVT containing PAH samples as the primary and wave-shifting dye in normal room lighting and UV excitation. Carborane and PPO containing samples are shown as well.
PVT-DVB-PAH PVT-DVB-PAH-carborane
PVT-DVB-PPO-PAH PVT-DVB-PAH-PPO-carborane
Figure 4. Response of selected PS samples to 252Cf excitation.

Page 98 of 132
worthy of further study because they are relatively abundant and present in crude oil and coal deposits. This could potentially lead to lower cost plastic scintillators because the fluorescent dye is its most expensive component.[2] Also, the PAH dye could potentially be more stable than commonly used dyes (i.e PPO) over longer periods owning to its similarity to graphene and lack of heteroatoms (i.e. N, O). FY2015 Accomplishments
• Measured the photophysical properties (absorption, excitation, and emission) of CQDs and PAHs in solution and in base plastics (polystyrene and polyvinyl toluene)
• Quantum yields of greater than 50% were achieved for PAH samples • Developed a formulation and methodology for infusing the base plastic with the PAHs and CQDs
while maintaining good optical transparency • Utilized an X-ray source as a screening tool on 60+ samples to identify which formulation will be
suitable for scintillation applications • Exposed samples to a 252Cf source and measured the light output for the most promising
samples identified by the X-ray screening technique Future Directions
• Compare the scintillation ability of the PAH containing PS with known PS formulations reported in the literature
• Determine the Figure of Merit (FOM) values for pulse-shaped discrimination (PSD) of the nano-carbon dye and boron infused PS to discriminate between thermal and fast neutrons simultaneously
• Examine the use of the nano-carbon dyes in other energy conversion device such as PV solar cells for improved light harvesting and increased
FY 2015 Publications/Presentations 1. “Science and Technology of Hydrogen in Energy Storage and Conversion Devices” Clemson
University, Department of Chemistry Seminar Series (November, 2014) 2. “Synthesis and photophysical characterization of fullerene derived polycyclic aromatic
hydrocarbons (PAH)” manuscript in preparation. References [1] Nuclear Instruments and Methods in Physics Research A 668 (2012) 88–93 [2] Nuclear Instruments and Methods in Physics Research A 750 (2014) 1–11 [3] Nuclear Instruments and Methods in Physics Research A 761 (2014) 92–98 [4] Nuclear Instruments and Methods in Physics Research A 751 (2014) 62-69 [5] Nuclear Instruments and Methods in Physics Research A 729 (2013) 747–754 Acronyms CPS- Counts per second CQDs – carbon quantum dots PAHs – polycyclic aromatic hydrocarbons PMT – photomultiplier tube PPO – 2,5-diphenyloxazole PS – plastic scintillator
Page 99 of 132
Project Team: E. Villa-Aleman and W. Spencer Thrust Area: NS Project Start Date: October 1, 2014 Project End Date: September 30, 2016
Characterization of High Explosives Detonations Via Laser-Induced Plasmas
SRNL has collected and analyzed particulates from the detonation of devices with high explosives (HE) since 2004. SRNL developed passive and electrostatic precipitator-based collectors (such as rockets) to collect particulates near and far away from the plumes created by the detonation of HE devices. The temporal formation of particulates and the correlation with radiant emissions are not well understood. Large field-scale experiments are expensive and infrequent. On-demand simulated laboratory-scale experiments are needed to further
our knowledge of the chemistry and particle formation. Our goal is to develop a laboratory experimental test bed to develop new optical measurement and particle collection concepts and methodologies that can be used to correlate the particle formation process with the optical observables of the detonation fireball. Since handling small quantities of explosives in the laboratory is challenging, laser-induced plasmas can be used to simulate micro-explosions, with the intent to study the temporal behavior of the fireball observed in field tests. The temporal evolution of the plasma, generated with a Nd:YAG laser and conducted with different atmospheric conditions, will be probed with a variety of lasers including ultrafast lasers. These experiments will help design future equipment for large-scale HE tests to measure unique signatures of the device. Concurrently with laser probes, temporal and spectral emissions of the plasma and laser light scattering will be analyzed with high speed thermal and visible cameras. FY2015 Objectives
• Set in motion the infrastructure in the laser laboratory to conduct work for the LDRD. • Review scientific literature and identify requirements for the project. • Procure equipment and materials. • Design and develop an experimental laser ablation test bed to simulate HE detonations and the
collection of particulates and development of diagnostic equipment. • Develop a better understanding of plasma phenomena and characterization of transient and
stable products. • Track generated species in plasmas from atoms to molecules to particulates.
Introduction The nuclear program status of a country can be defined, in part, by the types of tests conducted at different facilities. High explosive tests are used to explore materials’ properties that will be used in nuclear device. These tests release effluents to the environment characteristic of a typical experiment. SRNL has conducted particulate matter (PM) collection campaigns during cold hydrodynamic tests since 2004. Analysis of the particulate matter collected during the detonation can provide a traceable path to

Page 100 of 132
the unique construction of the device. Optical spectroscopic methods can help characterize materials from these detonations. Laser ablation plasmas have been used for over 20 years to introduce material into a carrier gas for elemental analysis with mass spectrometry. Coating deposition is also another application for plasmas produced with lasers. Depending on the laser power density at the target, temperatures of several thousand degrees are common. Laser ablation plasmas can be used to simulate detonations with HE. It is the goal to use the laser generated plasma approach to understand potential observables in HE experiments. Significant progress was made in FY15 to create an experimental plan, assemble two experimental test beds, procure materials and equipment, repair instrumentation, design and fabricate fiber optics assemblies required to conduct highly advanced characterization experiments. Approach The proposed approach creates development test platforms to characterize atomic, molecular emissions and particulates formed from the laser ablation of several targets. During the course of this research, several tasks will be completed: 1) design and build a test bed for instrument development, 2) characterize “simulated explosions” using spectroscopy techniques and particle collection methodologies, and 3) correlate particulate formation with other observable phenomena like optical emission. Test beds Two laser ablations test bed systems will be assembled to characterize laser ablation plumes. One test bed will be used to conduct ultraviolet-visible-near-infrared experiments and the other test bed will be used to characterize the thermal/molecular emission and absorption in the infrared spectral region. Nd:YAG lasers, with energies up to 1 Joule, will be used to create an ablation plume from a target of a selected material. A stage with a set angular velocity will be used to provide new surface material for the ablation/plasma creation. Spectral and Particulate Characterization The spectral emission of the plasma will be characterized with an ICCD detector. Other spectroscopies such as absorption, laser induced luminescence, Raman spectroscopy will be used to study atomic, molecular and particle characterization. New technologies (picosecond laser with a fast gated imager) will be used for Raman characterization in the presence of high intensity luminescence. Picosecond and femtosecond lasers will be used as probe lasers of the plume. New concepts in particulate collections will be evaluated to acquire temporal information during the coalescence of gaseous molecular species to particle formation. Particle collectors with deflectors for ionized particulates will be considered in this research. In these experiments, aluminum, steel, carbon and soil will be used to evaluate particle formation. Ablation of a depleted uranium metal target will be considered as a possible source of nanograms of material for reactions with aluminum. Several experiments will be conducted to explore the different aspects of plasma attributes. The particle research falls closely in the field of particle archaeology, in the sense that we would like to find how particle formation takes place in an explosion and how to identify its temporal evolution in order to improve our collections in the field. These experiments conducted in the laboratory will help us evaluate future technologies that will be deployed in the field during HE experiments enabling SRNL to continue its presence in these campaigns.

Page 101 of 132
Results/Discussion The LDRD strategic project is a two year research & development work that will develop new technologies and methodologies to characterize the detonation of HE via laser-induced plasmas in the laboratory. Since solids, gases and ionized matter are present in any explosion/implosion, this research will concentrate in the characterization of materials that might be present in these devices. The scientific literature was reviewed to develop an experimental plan in order to identify measurable phenomena. Spectral emission from elemental and molecular species is critical in the analysis of laser plasmas. Spectral information might be obtained through fluorescence, laser-induced fluorescence, Raman spectroscopy and absorption spectroscopy. Particulates generated in a detonation have different sources which include spallation and particle growth from molecular gases. Temperature is also an important aspect of any given detonation. Shockwaves provide information on energy propagation. The requirements suggest developing a system that can simulate an explosion via laser-induced ablation of a target and characterization of light emission from the ultraviolet through the infrared region of the electromagnetic spectrum. Since spectral information is highly dependent on the temporal behavior, technologies are required to investigate the dependence of spectral on the temporal scale. The path forward for this project requires the assembling of a test bed system capable to produce “explosions on demand” and use the system to measure observables in laser ablation plasma to real world detonations. The following information captures some of the work conducted in FY15 in preparation to full scale experimentation in FY16.
1. Two laser ablation experimental
setups were assembled to study laser generated plumes in the ultraviolet-visible-near infrared spectral region and in the mid to long-infrared spectral region.
a. One laser ablation system was assembled with a step-scan Fourier transform infrared (SS-FTIR) spectrometer to monitor surface and gaseous molecular species with a temporal resolution of 50 nanoseconds. The performance of the ablation system was good but the SS-FTIR performed below expectations. The problem was identified as a bad connector within the spectrometer. The SS-FTIR will enable study of the temporal evolution of surface species and the oxidation of material followed by the generation of particulates.
b. A second laser ablation experimental setup was built to study laser-induced fluorescence, particle collection and shock waves. The system performance was demonstrated with an Al target. The primary Intensified Charge Coupled Display detector (ICCD) developed timing problems and the detector with the spectrograph was sent for repairs. A more limited spectrograph was used to further demonstrate ablation and thermal emission.
Figure 1. Experimental laser ablation setup assembled in the laboratory for technology development.

Page 102 of 132
2. Laser ablation of aluminum and copper targets was demonstrated with both systems.
3. A picosecond gate imager was procured and will be fully operational in FY16 to study fast phenomena.
4. An ion lens kit was procured to collect particulates from laser ablation pulse. A design of the new collector is under way.
5. A new device to measure spectral information from fast phenomena was designed, built and tested in the laboratory. The concept will enable observation of the spectral evolution of an explosion or any transient phenomenon into microsecond segment intervals.
FY2015 Accomplishments
• Assembled and tested two laser ablation systems. • Demonstrated temporal detection of light pulses with SS-FTIR. • Developed a unique fiber optic assembly for multi-point emission characterization. • Demonstrated the capability to measure temporally decaying spectral information.
Future Directions
• Measure the temporal IR emissivity spectra of different materials with the SS-FTIR. • Measure Raman spectroscopy in the presence of high intensity light source with a picosecond
laser coupled to a gated imager operating at 76 MHz and 250 ps. • Build a particle collector, collect particulates and analyze with a scanning electron microscope
(SEM). • Assemble a shadowgraph system.
FY 2015 Publications/Presentations None References 1. None Acronyms HE High Explosives SS-FTIR Step-Scan Fourier Transform Infrared Spectrometry SEM Scanning Electron Microscopy ps Picosecond ns Nanosecond
Figure 2. Experimental breadboard for temporal and spectral separation of fast phenomena.

Page 103 of 132
Project Team: S. Hunyadi Murph (PI), G. Larsen, R. Lascola, H. Sessions, W. Farr, D. Baumert Subcontractor: Greenway/ARC Thrust Area: NS Project Start Date: October 1, 2014 Project End Date: September 30, 2016
Magnetically/plasmonically induced heat generation for controlled hydrogen isotope release from nano-hydrides
This project is directly related to the Tritium Production and Readiness Mission but can be used in fields of separations to remotely load/unload environmental analytes, sensing, manipulation and photothermal destruction of analytes, catalytic processes, biological imaging and magnetic manipulation, hyperthermia applications, energy storage materials among others. The ultimate goal of this project is to generate heat wirelessly, targeted, on demand (“flip of a switch”) from a plasmonic (light) or alternating electromagnetic field for the targeted release of hydrogen gas that
will eradicate the use of hot/cold nitrogen (HCN) processes. This new proposed design demonstrates that plasmonically or magnetically induced heat generation for controlled isotope release from hydride beds is a viable and simple alternative. It is easy to implement and will eliminate the use of bulky HCN systems. With a very small footprint, the proposed technology will also provide a safer method of handling radioactive materials. FY2015 Objectives
• Fabrication and physico-chemical characterization of a suite of test nano-hydride materials • Design, monitor and evaluate surface temperature profiles on a thermosensitive molecular
probe model analyte
Introduction A hot/cold nitrogen (HCN) circulation system is currently being used in the Tritium facility for heating and cooling of hydride storage beds, hydrogen isotope separation through TCAP units, and flow-through beds for inert gas species separation. While operational, the hot/cold nitrogen system requires the use of large compressors, heat exchanges, valves and piping that is bulky and maintenance intensive. Therefore, one of the top priorities of the Tritium Facility is eliminating HCN system. A new technology is sought that will eradicate the use of hot/cold nitrogen to adequately perform the aforementioned processes. We propose to develop heat-responsive magnetic nanomaterials for the controlled release of hydrogen gas. The triggered release of hydrogen gas molecules will be achieved via localized heating induced from a controlled oscillating electromagnetic or plasmonic field. In an oscillating magnetic field system, the magnetic nanoparticles act as a local “hot-spot” to heat up the surrounding environment by hysteresis loss or relaxation mechanisms. This occurs because the magnetic moment of the nanoparticle changes direction to line up with the external field, which can cause local heating. This change of direction can take place two different ways: Brownian relaxation, where the nanoparticle physically rotates so the moment lines up with the external field, and Neel relaxation, where the particle is stationary, but the magnetic moment rotates in the fixed lattice.

Page 104 of 132
The use of optically tunable plasmonic nanoparticles, specifically gold or gold based (Au-Co, Au-Fe2O3) nanoparticles in conjunction with low laser power devices is also an attractive option, as it capitalizes on plasmonic heating of metallic nanoparticles tuned to absorb light strongly in the Vis-NIR region. Basically, because the metallic portion of these particles strongly absorbs light in the VIS-near infrared, these particles can be remotely heated thereby releasing the heat and/or the “payloads” remotely on demand. Utilizing magnetic and/or plasmonic nanoparticles for heat generation has a range of advantages over conventional heating methods: • Energy input is noncontact, selective, localized and targeted. • Heat generation occurs wirelessly, remotely and the resultant heat is also targeted. • Heating can be very rapid (~50°C/s) while the surrounding area is not subjected to extreme heat. • Heat delivered can be modulated by suitable selection of alternating electromagnetic or
plasmonic field, such as amplitude and frequency of the alternating magnetic field, shape of the magnetization curve, VIS-near IR, as well as material’s type, size, shape and crystallinity.
• The magnetic/plasmonic nanoparticles can be selectively placed in regions where heat is necessary and stimulated to generate the desired amount of heat in a controlled manner.
• Heating can be self-controlling based on the Curie temperature or plasmon band of the material.
Approach The main goal of this research is fabrication and evaluation of heat-responsive magnetic nanomaterials for the controlled release of hydrogen gas via localized heating induced from a controlled alternating electromagnetic or plasmonic field. The triggered release of hydrogen gas molecules will be achieved via localized heating induced from a controlled oscillating electromagnetic field. The first task of this project focused on the design, synthesis and physico-chemical characterization of multifunctional nanoparticles responsive to plasmonic and magnetic field that have exceptional gas storage capabilities. The proposed multifunctional engineered nanomaterials consist of building blocks strategically selected on the basis of their individual structural properties. The second task of this project assessed the heating effect generated from the plasmonic-magnetic particles induced from a controlled oscillating electromagnetic or plasmonic field. The thermal decomposition of a thermosensitive molecular probe model analyte was used to evaluate the local temperature profile at the nanoparticle surface since the nanoparticle’s surface becomes much hotter than the macroscopic environment. The third task will be completed in FY16 and will center on the controlled release of the hydrogen gas captured by the metal hydride via the remote heating effect of the magnetic-plasmonic functionality induced by oscillating external magnetic or plasmonic field. This study will allow us to predict the surface temperature gradients induced by a multifunctional nanoparticle exposed in an oscillating magnetic or plasmonic field. Our study will couple the application of multifactorial experimental design with the use of advanced nanoparticle synthesis techniques to explore these processes. The heating performance as a function of particle size and compositions,
Figure 1 Multifunctional Au-Fe2O3 nanorings.

Page 105 of 132
environment, analyte loading, magnetic/plasmonic field induction power, the exposure time to the magnetic /plasmonic field, heat and mass transfer in metal hydride system, etc. will be achieved. These results should serve as a powerful predictor of variables that could be tailored and successfully applied in the Tritium Facility. This new proposed design will ultimately demonstrate that magnetically/plasmonically induced heat generation for controlled isotope release from hydride beds is a viable and simple alternative. It is easy to implement and will eliminate the use of bulky HCN systems. With a very small footprint, the proposed technology will also provide a safer method of handling radioactive materials. Results/Discussion Multifunctional nanomaterials of different size, shape and compositions have been created by wet chemical procedures that are amenable for scaling up. A variety of characterization techniques, electron microscopy, XRD, EDX, EDX mapping, ICP-MS, UV-Vis, etc., were employed to evaluate materials’ physico-chemical properties (Figure 1). During FY15, we also focused on investigating, optimizing, and controlling the remote heating of nanoparticles using electromagnetic radiation (light). The design and setup of photothermal heating experimental device was completed. A variety of multifunctional nanoparticles were investigated for remote heating through light localization (plasmonic heating). Data shows that all samples tested displayed laser induced heating effects. The solution temperature/mass loss is generally an increasing function of concentration and laser power. Steam generation (i.e., mass loss) indicates a higher local temperature than bulk values. During FY15, we also evaluated the local temperature measurements using DNA molecular beacons. The local temperatures in the vicinity of the remotely heated nanoparticles are expected to be higher than the measured bulk temperatures. Thus, in order to measure these local temperatures, a DNA molecular beacon nanothermometry procedure was developed and tested. DNA molecular beacons consisting of a stem loop DNA strand with a fluorophore attached to one end and a quencher (Au nanoparticle) attached to the other end were selected as the thermosensitive probe. Our studies show that the local temperature is always higher than the bulk temperature at a given time. In order to numerically investigate the temperature rise due nanoparticle heating, the diffusive heat flow equation has been employed. This method can be extended to any system of remotely excited nanoparticles (either through the photothermal effect or magnetic induction) as long as the nanoparticles are non-interacting and the power generated by the nanoparticle is known. In order to demonstrate the hydrogen storage in our multifunctional nanoparticles initial scoping H2 adsorption tests have been performed by bubbling H2 gas for a determined time. Significant changes were observed in the UV-vis and Raman spectra for the Fe2O3-Au-Pd, suggesting hydride formation. Adsorption-desorption of analytes of interest on nanoparticles of interest via plasmonic heating were successfully demonstrated in solution. The design and purchase of quartz crystal microbalance system and MicroDoser to characterize hydrogen sorption of nanoparticles was completed. FY2015 Accomplishments
• Prepared and characterized a library of multifunctional nanoparticles (Nps) of different size, shape, composition and properties: MPH, where M= Fe2O3, Co; P= Au, Ag; H= Pd;
• Designed, built and demonstrated the operation of a custom-made plasmonic heating device (532 nm)
• Theoretically evaluated the temperature rise at the Nps surface (in solution) due to the plasmonic absorbance of nanoparticles of different radii as a function of light flux;

Page 106 of 132
• Nps samples were evaluated for heating processes through light localization (plasmonic heating) studies:
o (a) All samples tested showed laser induced heating effects; o (b) The solution temp./mass loss is generally an increasing function of concentration and
laser power; o (c) Steam generation (i.e., mass loss) indicates a higher local temperature than bulk
values; • Functionalized Nps with fluorescent molecular beacons (DNAs) to act as nanothermometers for
mapping temperature profiles on the NP surface; • Generated localized surface and bulk temperature gradients/profiles on the nanothermometers
via plasmonic and bulk heating; • Conducted photothermal absorption/desorption studies of molecule dyes on Nps; • Demonstrate hydrogen sorption onto Pd nanoparticles • Designed and purchased a quartz crystal microbalance system and MicroDoser to characterize
hydrogen sorption of nanoparticles. • Purchased a magnetically inducing heating device
Future Directions Evaluation and optimization of heat-responsive magnetic-hydride materials with hydrogen analogues from a controlled plasmonic or oscillating electromagnetic field.
• Characterization of gas absorption/desorption kinetics, capacity, thermodynamic properties, as well as cycling performance on our materials. Scoping experiments were already conducted in FY15 to investigate hydrogen absorption on Pd-based Nps exposed to a plasmonic field.
• Optimize the heating efficiency from a controlled oscillating electromagnetic field or plasmonic field as function of material and magnetic field property data.
• Create a multifactor experimental map diagram that will predict the surface temperature gradients induced by a paramagnetic nano/micro- particle exposed in an oscillating magnetic/plasmonic field that will be applied with hydrogen analogues.
FY 2015 Publications/Presentations Peer-reviewed manuscripts: 1. Hunyadi Murph, S.E. (invited manuscript and video); Larsen, G.; Lascola, R. “Multifunctional Hybrid
Fe2O3-Au Nanoparticles for Efficient Plasmonic Heating”, JOVE, 2015, accepted. 2. Larsen, G.; Hunyadi Murph, S.E. (invited) “Hybrid Fe2O3-Au Nanoparticles: Synthesis and
Photothermal Properties”, Tech Connect World Innovation Conference Proceedings, Nanotech, 2015, 219-222.
3. Kun, Y.; Larsen, G.; Hunyadi Murph, S.E. (invited); Zhao, Y. “Fe2O3/TiO2 Core-Shell Nanorod Array for Visible Light Photocatalysis” submitted, Catalysis Today, 2015.
4. Hunyadi Murph, S.E. , Larsen, G.; Farr, W. “A Simple Route to Obtain Multifunctional Fe2O3-Au Nanoparticles with Different Shapes for Photothermal Catalysis and Magnetic Recyclability”, JMCA, 2015, to be submitted.
5. Hunyadi Murph, S.E. (invited book), Larsen, G. “Anisotropic Nanomaterials and Nanostructures: Fundamentals and Applications”, Nanostructure Science and Technology series, Springer Publisher, 2016, to be submitted.

Page 107 of 132
Presentations: 1. American Chemical Society, Boston, MA :
a. (invited) “Sensing and Imaging with Isotropic and Anisotropic Metallic Nanostructures” b. (invited video) “Multifunctional nanostructures: Turning ‘Rust’ into Gold”, c. “Multifunctional nanostructures: Fundamentals and applications”
2. TechConnect World Innovation Conference, Washington, DC, USA a. “Multifunctional Nanostructures and Nanoarchitectures”
3. American Chemical Society, Denver, CO. a. “Hybrid core-shell and coupled nanostructures: Design and Applications”
4. The Minerals, Metals & Materials Society (TMS), Orlando, FL. a. (invited) “Metallic and Hybrid Nano-architectures: Synthesis, properties and Applications”
5. Georgia Regents University, Augusta, GA. a. (invited) “Nanotechnology Innovations at SRNL: Fundamentals and Applications” b. “Educational Outreach & Internship Opportunities at SRNL”
6. Georgia Southern University, Statesboro, GA a. (invited) “Engineered NanoMaterials: Synthesis, Fundamentals and Applications” b. (invited) “Educational Outreach & Internship Opportunities at SRNL”
Acronyms Np- nanoparticle, NPs- nanoparticles HCN- hot/cold nitrogen NPH- metal plasmonic hydride Au-Fe2O3- gold-iron oxide
Page 108 of 132
Project Team: S. Serkiz, J. Gaillard, D. Saini, J. Velten, D. Hitchcock, B. Peters (SRNL), A. Rao, S. Bhattacharya (Clemson University) Subcontractor: Clemson University Thrust Area: NS Project Start Date: October 1, 2014 Project End Date: September 30, 2016
Graphene-Based Gas Separation Membranes
Gas separation is wide spread in many industrial and commercial processes. Thin membranes are highly suitable for the role of selective barriers but are limited by their mechanical strength, chemical compatibility, and target molecule selectivity. In this work, we focus on developing graphene-membrane based gas separation systems. By introducing suitable and controlled defects and pores in continuous graphene sheets, the properties of this otherwise impermeable one atomic thick membrane can be tuned to selectively separate gaseous species. With this principle, our primary goal is to
achieve efficient removal of trace gases (H2S, He, Ar, N2, H2O, and CO2) from natural gas streams and separation of impurities (NH3, H2O, and He) from tritium process streams. The results from the proposed work are expected to improve both portable and large-scale gas-separation processes.
FY2015 Objectives
• Establish contract with Clemson University to produce continuous graphene sheets via a chemical vapor deposition synthesis route
• Document the experimental plan and Hazards and Procedures (eHAP) • Synthesize graphene and graphene oxide films • Introduce defects in the membranes • Characterize “as-prepared” and “defects-induced” membranes • Characterize the permeability of membranes for various gases
Introduction Membrane-based gas separation systems have gathered tremendous interest owing to their high efficiency and low energy consumption. In principle, these membranes should be as thin as possible to maximize flux [1]. However, thin membranes suffer from poor mechanical strength which poses a major hindrance to their applications. Graphene, a two dimensional carbon allotrope, has emerged as the thinnest known material possessing ultra-high mechanical strength, chemical inertness, and thermal stability. These properties meet the requisite characteristics of gas separation membranes. In their ideal form (i.e., continuous sheet with no defects), graphene membranes are impermeable to all gases, including hydrogen. This property is attributed to the overlapping π-orbitals that form a dense delocalized electron cloud blocking all gaseous species. However, their permeability can be tuned by introducing defects into the continuous graphene sheet [2]. These defects disrupt the orbital structure rendering it permeable to specific molecules. This project is aimed at developing methods to engineer the permeability of graphene membranes via introduction of defects by either the removal of carbon atoms or the addition of dopant atoms.

Page 109 of 132
To reach our intended goals, we have fabricated suspended graphene membranes for the purpose of investigating their permeation properties. In our preliminary experiments, we used a high-energy electron beam (e-beam) and reactive ion etching processes to introduce structural defects in the suspended graphene sheets. These graphene membranes, both pristine and defect-induced, have been spectroscopically characterized and imaged at the atomic level using aberration-corrected transmission electron microscope (TEM) at the Center for Nanophase Materials Science (CNMS) at Oak Ridge National Lab (ORNL). Besides developing these defect engineering processes, a sensitive gas permeation characterization system based on mass spectrometry is currently under development. Approach We plan to take advantage of the unique properties of graphene to design and fabricate graphene membranes for highly selective gas separation processes by manipulating their chemical functionality, surface charge, and the number and character of defect sites (holes or nitrogen/ boron dopants in the graphene lattice structure). From an engineering standpoint, stacked platelet (Fig 1A & B) and porous continuous-sheet membrane (Fig 1C) designs will be produced from modified graphene materials and subsequently evaluated. In FY16 we plan to develop scalable and economically viable routes to fabricate graphene-based membrane systems. The proposed work leverages ongoing NSF funded work in the area of scalable production of carbon nanotubes (Clemson) and the development of permeation barriers and radiation resistant polymers (SRNL) funded by the PDRD program. Results/Discussion During FY15, single/few layered graphene membranes were synthesized on copper foil substrates using the chemical vapor deposition (CVD) method (Fig 2a top). Raman spectroscopy of the as-synthesized graphene (Fig 2a bottom) showed a graphitic order and a low defect peak signifying the high quality of the prepared membranes. By etching the underlying copper, graphene was then carefully transferred (Fig 2b) to two types of substrates, a VCR fitting for permeation testing and holey carbon TEM grids for imaging.
Figure 1. A) top view of dispersed nanoplatelets of graphene; (B) side view of intercalated nanoplatelet design; (C) schematic of continuous sheet design and process (note: pink spheres represent solute and blue spheres solvent).[3]

Page 110 of 132
a. VCR fitting with pre-defined holes for gas permeation testing: Fig. 2c shows an example a bore of 0. 018 mm diameter, drilled through the ¼” VCR made of either copper or nickel coated stainless steel. For investigating graphene-VCR adhesion, CVD prepared membranes were transferred to pristine copper, nickel or steel VCRs as well as VCRs (Ni and Cu) with a graphene layer grown on it prior to the transfer (note: graphene grown on top of the VCRs in the CVD does not cover the pre drilled hole so a second layer must be transferred to the VCR to create the membrane). For micron-sized VCR holes, the suspended graphene usually broke. In that case, a thin layer of Poly(methyl methacrylate) (PMMA) was used as a supporting film. b. Holey carbon TEM grids for imaging the lattice structure and introducing structural defects via e-
beam or ions:
Using the rapid access proposal system at the CNMS at ORNL we were awarded three days on the high resolution aberration-corrected TEM. Fig. 3a shows an as synthesized CVD grown graphene film transferred to a TEM grid. The transferred graphene film shows no damage and is continuous, however, large areas of the films showed signs of surface impurities, shown Fig. 3b (most likely Si or O2). Shown in Fig. 3c is graphene exposed to reactive ion etching. This sample had islands of a different contrast clearly seen in the dark field image (inset) that have yet to be identified. It is worth mentioning that Raman spectra were taken before and after the transfer to confirm that there was no damage to the films prior to inducing defects. In addition to the bottom-up CVD synthesis technique we also prepared continuous graphene films via a top-down method, namely photo reduction of graphene oxide (GO) films. In this method, a thin copper film (50 nm) is sputtered on the substrate. Next, a layer of
graphene oxide is coated over the copper film (Fig. 3d shows an aberration corrected TEM image of
Figure 2. a) Cartoon rendering of a graphene film grown on copper foil via the CVD method (top), and Raman spectrum of the as-grown graphene (below) (b) schematic of the graphene transfer process via etching of the underlying copper (c) Graphene suspended on a hole drilled in a VCR fitting.
Figure 3. TEM of (a,b) as-produced graphene (c) graphene treated using reactive ion etching (note: regular defect structure) inset: dark field image of the same region (d) reduced graphene oxide nanoplatelets grown using photo-reduction.
a) b)
c) d)

Page 111 of 132
exfoliated graphene oxide nanoplatelets). Finally the GO film is irradiated with UV light from a Xe-lamp. In the presence of underlying metal catalyst, energy from the incident light reduces the GO to reduced-graphene oxide (i.e., graphene). A cartoon depicting this process is shown in Fig. 4. Under prolonged irradiation, we also observed “stitching” of the graphene grains or edges that result in a continuous graphene membrane. This edge-stitched graphene can then be transferred to desired substrates using the standard method outlined above. To characterize the permeation properties, we plan to employ mass spectrometry, which will allow for the investigation of both the permeability and selectivity of the membrane. We have designed and assembled the setup (schematic shown in Fig. 5) required for performing the permeation test, and are currently optimizing the procedure.
FY2015 Accomplishments
• Synthesis: -multiple single to few layer graphene sheets have been synthesized via CVD -continuous sheet graphene has been produced from graphene platelets by edge stitching
• Membrane/Substrate System: - transfer of graphene to the substrate using PMMA has been demonstrated -developing synthesis route for direct growth on the substrate
• Characterization -Raman spectra collected on as-synthesized graphene -TEM/SEM collected on selected samples
• Gas Permeation Testing -development of gas permeation setup in progress
• Rapid access proposal for access to the CNMS facility to image these membranes for atomic resolution was awarded -spent three days imaging membranes using high resolution aberration corrected TEM. -five additional days of TEM time remain on this award.
Future Directions
• Permeation Measurements: - Fabricate suspended graphene membranes using smaller bore VCR fittings to eliminate the
need of PMMA support film - Optimize the permeation set up
• CNMS proposal: - Submit second proposal to CNMS for aberration-corrected TEM time, neutron activation,
and nanolithography
Figure 5. Schematic of the designed permeation test setup. The detection of the permeated through the graphene membranes will be done via mass spectrometer.
Figure 4. Schematic depicting the photo reduction process.

Page 112 of 132
• Defect Engineering: - Introduce defects via neutron exposure - Establish a protocol of controlling lattice defects using e-beam - Introduce defects through nitrogen and boron doping
• Scale up the gas separation process
FY 2015 Publications/Presentations 1. Velten J., Peters B., Saini D., Serkiz S., and Gaillard J. (2015, November). “Carbon nanomaterials
composites for barrier layers in butyl rubber matrices: study of permeation, radiolysis, and mechanical properties” Presented at the fall MRS meeting, Boston, MA
References
[1] Koenig et al. Nature Nanotechnology, Vol 7, 2012, p 728 [2] Sun et al. Langmuir 2014, 30, pp 675−682 [3] Paul, Science 2012, 335 (6067) pp. 413-414
Acronyms CNMS: Center for Nanophase Materials Sciences CVD: chemical vapor deposition e-beam: electron beam GO: graphene oxide ORNL: Oak Ridge National Lab PMMA: Poly(methyl methacrylate) SEM/TEM: Scanning/Transmission Electron Microscope

Page 113 of 132
Project Team: E. B. Fox (Primary), R. Fuentes, J. Amoroso, H. Colon-Mercado, K. Brinkman Subcontractor: F. Chen (USC) Thrust Area: CE Project Start Date: January 15, 2014 Project End Date: September 30, 2015
Novel Ceramic Membranes for Efficient Utilization of Natural Gas
The exploitation of large shale gas reserves in the U.S. has enabled the drastic decrease in NG prices. This provides a cheap, clean source of gas for chemical processing and H2 technologies provided that improved separations can be developed. Two membrane systems (oxygen and hydrogen) will be processed and tested in conjunction with catalytic cracking of the gas feed. This project focuses on the development of an improved reactor design which
can target product specific feeds.
FY2015 Objectives • Characterization of ceramic membrane materials for hydrogen separation. • Synthesis and characterization of ceramic materials for oxygen permeation
Introduction Large reserves of natural gas have enabled the expansion of US chemical industries and national energy independence. Natural gas is the primary source of hydrogen and synthesis gas used for chemical, transportation, and industrial needs. To utilize this hydrogen/carbon monoxide product in specialty chemical production, it is important to carefully control the H2/CO ratio in the feed. This project is developing an improved reactor design for natural gas cracking and purification. Two membrane systems (oxygen and hydrogen) will be processed and tested in conjunction with catalytic cracking of the gas feed. This project focuses on the development of an improved reactor design which can target product specific feeds.
One proposed method is the Oxygen Membrane Reactor (OMR)1-3, in which an oxygen selective membrane is used to transport oxygen from air to the feedstock for reaction. The benefits of an OMR include in-situ purification of oxygen from feed air to high purity oxygen for the reaction with a decrease in costs for the air separation unit. This work will detail the synthesis, characterization, and performance of BaCo0.7Fe0.2Nb0.1O3-δ (BCFNO) oxygen permeation membranes, which will be coupled in an oxygen membrane reactor system. Hydrogen separation membranes based on high temperature proton conductors are pursued in this project because of their potential to greatly reduce the energy and capital cost of large-scale hydrogen production from steam methane reforming. A key to
Figure 1. Schematic of an Oxygen Membrane Reformer
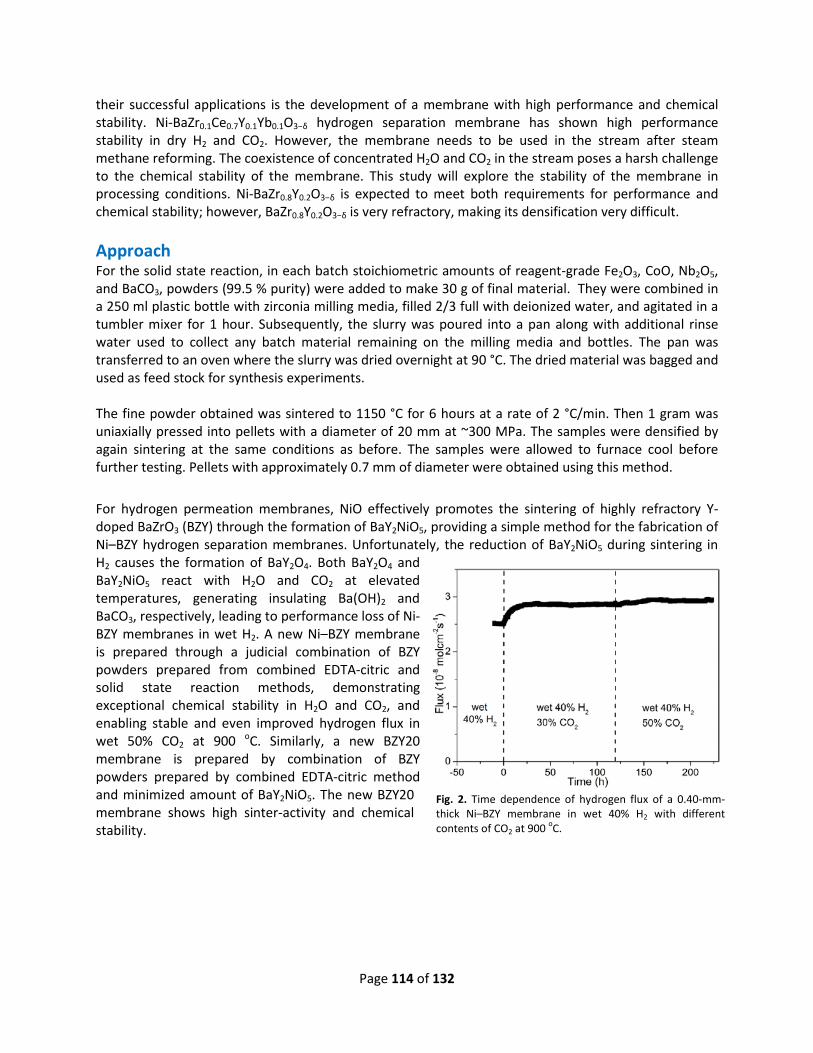
Page 114 of 132
their successful applications is the development of a membrane with high performance and chemical stability. Ni-BaZr0.1Ce0.7Y0.1Yb0.1O3−δ hydrogen separation membrane has shown high performance stability in dry H2 and CO2. However, the membrane needs to be used in the stream after steam methane reforming. The coexistence of concentrated H2O and CO2 in the stream poses a harsh challenge to the chemical stability of the membrane. This study will explore the stability of the membrane in processing conditions. Ni-BaZr0.8Y0.2O3−δ is expected to meet both requirements for performance and chemical stability; however, BaZr0.8Y0.2O3−δ is very refractory, making its densification very difficult. Approach For the solid state reaction, in each batch stoichiometric amounts of reagent-grade Fe2O3, CoO, Nb2O5, and BaCO3, powders (99.5 % purity) were added to make 30 g of final material. They were combined in a 250 ml plastic bottle with zirconia milling media, filled 2/3 full with deionized water, and agitated in a tumbler mixer for 1 hour. Subsequently, the slurry was poured into a pan along with additional rinse water used to collect any batch material remaining on the milling media and bottles. The pan was transferred to an oven where the slurry was dried overnight at 90 °C. The dried material was bagged and used as feed stock for synthesis experiments. The fine powder obtained was sintered to 1150 °C for 6 hours at a rate of 2 °C/min. Then 1 gram was uniaxially pressed into pellets with a diameter of 20 mm at ~300 MPa. The samples were densified by again sintering at the same conditions as before. The samples were allowed to furnace cool before further testing. Pellets with approximately 0.7 mm of diameter were obtained using this method.
For hydrogen permeation membranes, NiO effectively promotes the sintering of highly refractory Y-doped BaZrO3 (BZY) through the formation of BaY2NiO5, providing a simple method for the fabrication of Ni–BZY hydrogen separation membranes. Unfortunately, the reduction of BaY2NiO5 during sintering in H2 causes the formation of BaY2O4. Both BaY2O4 and BaY2NiO5 react with H2O and CO2 at elevated temperatures, generating insulating Ba(OH)2 and BaCO3, respectively, leading to performance loss of Ni-BZY membranes in wet H2. A new Ni–BZY membrane is prepared through a judicial combination of BZY powders prepared from combined EDTA-citric and solid state reaction methods, demonstrating exceptional chemical stability in H2O and CO2, and enabling stable and even improved hydrogen flux in wet 50% CO2 at 900 oC. Similarly, a new BZY20 membrane is prepared by combination of BZY powders prepared by combined EDTA-citric method and minimized amount of BaY2NiO5. The new BZY20 membrane shows high sinter-activity and chemical stability.
Fig. 2. Time dependence of hydrogen flux of a 0.40-mm-thick Ni–BZY membrane in wet 40% H2 with different contents of CO2 at 900 oC.

Page 115 of 132
Results/Discussion Sintered Ni–BZY membranes contain BaY2O4 islands after reduction. This is because BaY2NiO5 reacts with H2, forming BaY2O4. BaY2O4 easily reacts with H2O and CO2 forming Ba(OH)2 and BaCO3, respectively. Therefore, Ni–BZY20 membranes are chemically instable in wet CO2, and the hydrogen flux of Ni–BZY membranes degrade significantly in wet H2 at 900 oC. We have discovered that the chemical stability of Ni–BZY membranes can be improved by replacing a portion of BZY20-SSR powder in the starting material with BZY20-CEC powder. The new Ni–BZY membrane fabricated with 20% BZY20-SSR and 80% BZY20-CEC powders demonstrated
very stable and improved permeation flux in wet 50% CO2 at 900 oC, as shown in Fig. 2. The phase composition and membrane microstructure were also intact after the permeation test, indicating the excellent chemical stability of the new Ni-BZY membrane. With the knowledge shown above, we also fabricated BZY20 ceramic with the BZY20-CEC powders and minimized the amount of BaY2NiO5. The mixture of BZY20 and BaY2NiO5 preserves the chemical stability of BZY20 but has greatly improved sinter-activity. After adding 4wt.% BaY2NiO5, dense BZY20 ceramic can be obtained after sintering at ~1450 oC instead of 1700 oC. The ceramic is stable after annealing in wet CO2 at 900 oC for 50 h. The high chemical stability and sintering activity make the BZY20 membrane very promising for application as electrolyte of solid oxide fuel cells. The fabrication for BCFNO as oxygen permeability membranes was accomplished by the sintering of the powder at high temperatures. Figure 3 shows the X-Ray Diffraction (XRD) spectra of the BCFN in-situ at different temperatures up to 1050 °C. The phase evolution of BCFNO structure can be appreciated forming at temperatures higher than 970 °C and then when it is cooling it can be seen a phase transformation. Permeability studies were performed cooling gradually after it was sintered. The results are presented in Figure 4. The trend of oxygen flux indicates that at high temperature the oxygen flux increases linearly. However at 700 °C the oxygen flux decreases significantly. Analyzing the results with the XRD data it seems that the gradual change in structure at low temperatures affects the oxygen permeability properties of the material. However, it is demonstrated that the material has oxygen permeability properties when the structure is a pure cubic perovskite BCFNO.
Fig. 3. X-Ray Diffraction spectra of BCFNO at different temperatures at a heating and cooling rate.
2.00E-054.00E-056.00E-058.00E-051.00E-041.20E-041.40E-041.60E-04
650 750 850 950 1050
Oxy
gen
Flux
Tre
nd (a
.u.)
Temperature (°C)
Fig. 4. Oxygen permeability Trend with Temperature

Page 116 of 132
FY2015 Accomplishments • Systematically investigated the chemical stability of Ni-BZY membrane. • Identified the reason of the chemical instability of the Ni-BZY membrane. • Proposed a solution to improve the chemical stability of the Ni-BZY membrane. • Demonstrated the long-term performance stability of Ni-BZY in concentrated H2O and CO2. • Fabricated a BZY20 electrolyte material with both high chemical stability and sintering activity. • Fabricated a BCFNO perovskite with high crystallinity for oxygen permeation at 970 °C. • Permeability results for oxygen showed that high oxygen flux can be attained while there are no
structural changes for the BCFNO.
Future Directions • Further improve the performance of Ni-BZY membranes by fabricating asymmetric membranes. • Fabricate solid oxide fuel cells based on BZY20 electrolyte using BaY2NiO5 sintering aid. • Perform conductivity studies of BCFNO.
FY 2015 Publications/Presentations
• Shumin Fang, Siwei Wang, Kyle S. Brinkman, Qing Su, Haiyan Wang, Fanglin Chen, Relationship between fabrication method and chemical stability of Ni–BaZr0.8Y0.2O3-δ membrane, Journal of Power Sources, 2015, 278, 614-622.
References 1. Shumin Fang, Siwei Wang, Kyle S. Brinkman, Fanglin Chen, A sinteractive Ni–BaZr0.8Y0.2O3-δ composite membrane for hydrogen separation. Journal of Materials Chemistry A, 2014, 2, 5825-5833. Acronyms
• BCFNO – BaCo0.7Fe0.2Nb0.1O3-δ • OMR – Oxygen Membrane Reformer

Page 117 of 132
Project Team: M. J. Martínez-Rodríguez (Primary), B. L. García-Díaz, L. Olson, R. Fuentes, and R. Sindelar Subcontractor: B. Hauch and K. Sridharan (University of Wisconsin-Madison) Thrust Area: CE Project Start Date: October 1, 2014 Project End Date: September 30, 2015
MAX Phase Materials and Coatings for High Temperature Heat Transfer Applications
Molten salts have been used as heat transfer fluids in a variety of applications within proposed Gen IV nuclear designs and in advanced power system such as Concentrating Solar Power (CSP). However, operating at elevated temperatures can cause corrosion in many materials. This work developed coating technologies for MAX phase materials on Haynes-230 and characterized the corrosion of the coatings in the presence of commercial MgCl2-KCl molten salt. Cold spraying of Ti2AlC and physical vapor deposition (PVD) of Ti2AlC or Zr2AlC were tested to determine the most effective form of coating MAX phases on structural substrates. Corrosion testing at 850 °C for 100 hours showed that 3.9 µm Ti2AlC by PVD was slightly protective
while 117 µm Ti2AlC by cold spray and 3.6 µm Zr2AlC by PVD were completely protective. None of the tests showed decomposition of the coating (Ti or Zr) into the salt.
FY2015 Objectives • Perform thermodynamic modeling of MAX phase materials in molten salts. • Develop MAX phase coating technology. • Perform corrosion testing in high temperature molten salts. • Analyze and characterize samples after testing.
Introduction DOE NE and EERE programs have increasingly come to the conclusion that power production efficiency from nuclear and concentrating solar power applications is limited by reliance on low temperature thermodynamic power cycles. High temperature power cycles such as the Brayton cycle or superheated Rankine cycle have the ability to make significant improvements on lower temperature steam driven cycles. However, the high temperature power cycles require efficient high temperature heat transfer and materials that have high durability under these conditions. Molten salts are one of the main classes of proposed heat transfer media at these temperature due to high volumetric heat capacity and other heat transfer characteristics, but high temperature molten salts can cause significant corrosion.
SRNL researchers have investigated the corrosion of advanced alloys in molten fluoride salts such as a LiF-NaF-KF eutectic mixture (FLiNaK) [1-5]. Figure 1 shows EDS images for Hastelloy metals that have significant changes in composition after being exposed to FLiNaK salts. These materials and other high strength Ni-Fe-Cr superalloys show leaching of Cr at these conditions that eliminates the passive layer on the material surface that prevents corrosion in most applications.

Page 118 of 132
Figure 1. SEM of Hastelloy-N cross-section (left) with EDS x-ray maps of chromium (center), and molybdenum (right). Reproduced from [1].
Use of many ceramic materials for heat transfer applications with molten salts is complicated both by their lack of chemical compatibility and by their low thermal conductivity. MAX phase materials (layered structure with the chemical formula Mn+1AXn, where n = 1, 2, or 3, M is an early transition metal, A is an A-group element, and X is carbon and/or nitrogen) have metallic electrical conductivity, thermal conductivity, and mechanical strength while having the chemical resistance of ceramics. These properties make it ideal for heat transfer applications. Coatings of MAX phase materials on high temperature alloys would be a low cost method to create heat transfer systems for high temperature power cycles. Due to their relatively new development that started in the mid-1990’s, little research on MAX phase coatings or compatibility with molten salts has been performed. This project seeks to develop expertise in developing and characterizing MAX phase coatings at SRNL.
Approach The stable corrosion products from expose of MAX phase materials in molten MgCl2-KCl salt at high temperatures were calculated using the minimization of Gibbs Energy. These calculations were performed using FACTSage thermodynamic modeling software. Results from these models were used to understand the stability of selected MAX phase compositions and to identify if the materials would be resistant to corrosion. Cold spraying and physical vapor deposition (PVD) were tested to determine the most effective form of coating MAX phases on structural substrates. SRNL worked with partners at the University of Wisconsin-Madison (UW) to cold spray MAX phase materials on Ni-Fe-Cr alloys. UW and SRNL have jointly developed MAX cold-spraying techniques for Zr alloys and adapted these techniques for much harder Fe-Ni-Cr alloys. SRNL synthesized MAX coatings using a combination of PVD and annealing to create a nano-laminate structure. With PVD, coatings can be made less than 1 micron while cold-spray coatings need to be at least 25 microns.
Haynes-230 was used as the base alloy for testing. Coated samples with the selected MAX phase materials were subjected to corrosion testing in commercial MgCl2-KCl molten salt. These tests consisted of long-term exposure (100 h) to the molten salt at 850°C to measure weight loss as the primary metrics of the corrosion rate. The amorphous film conversion to the MAX phase was evaluated by XRD. Microscopic analysis of changes in coating morphology was characterized by SEM and EDS. The corrosion products were analyzed by ICP-OES.
EDS X-Ray Mapping of Cr EDS X-Ray Mapping of Mo
Cross-section Surface Cr depletion Mo enriched

Page 119 of 132
Results/Discussion Thermodynamic modeling for Ti2AlC in MgCl2-KCl at 850 °C was performed using FACTSage. The thermodynamic properties for Ti2AlC were obtained from literature [6, 7] while the properties for MgCl2-KCl are included with the software database. Results from this simulation shows that the stable products for this system are MgCl2, KCl, TiC2 and TiAl. Although the simulation shows the apparent decomposition of Ti2AlC, MAX materials have properties of metals and ceramics which make them more stable and resistant to oxidation. This means that the kinetics for this decomposition could be very slow. Therefore, Haynes-230 samples were coated with Ti2AlC using cold spray and PVD techniques and tested under the actual conditions. Additional samples of Haynes-230, coated with Zr2AlC by PVD, were also tested in MgCl2-KCl molten salt at 850°C. MAX phases for Ti2AlC and Zr2AlC amorphous films were obtained by furnace annealing at 900°C for 20 min. XRD development for the two coating materials are shown in Figure 2. The presence of additional peaks in the region of 2θ = 40°, after furnace annealing, confirm the conversion to the MAX phase. Results for the coated samples are presented based on the total surface area of the coupons and normalized for the actual exposed or uncoated area. Based on the total area, it is expected that a sample for which the coating did not protect it will show a corrosion rate similar to the uncoated sample. Conversely, and still based on the total area, corrosion rates for samples which the coating protected the coated side will be lower than the corrosion rate of the uncoated samples. However, for the latter case, if the values are normalized for the actual exposed area, it is expected that the corrosion rates are similar to the uncoated samples. That is, the protected side (coated) will not corrode while the unprotected side (uncoated) will corrode at the rate of the base metal. Table 1 shows that the Ti2AlC by PVD coating was slightly protective while the Ti2AlC by cold spray and Zr2AlC by PVD coatings were completely protective. This can be confirmed when the corrosion rates are normalized for the exposed area. For the samples coated with Ti2AlC by cold spray the normalized corrosion rate is similar to the corrosion rate of the uncoated samples. However, for the samples coated with Zr2AlC by PVD, the normalized corrosion rate is lower than the corrosion rate of the uncoated samples. This implies that the Zr2AlC decreases weight loss from uncoated areas of the samples.
Figure 2. XRD development of Ti2AlC and Zr2AlC furnace annealing.
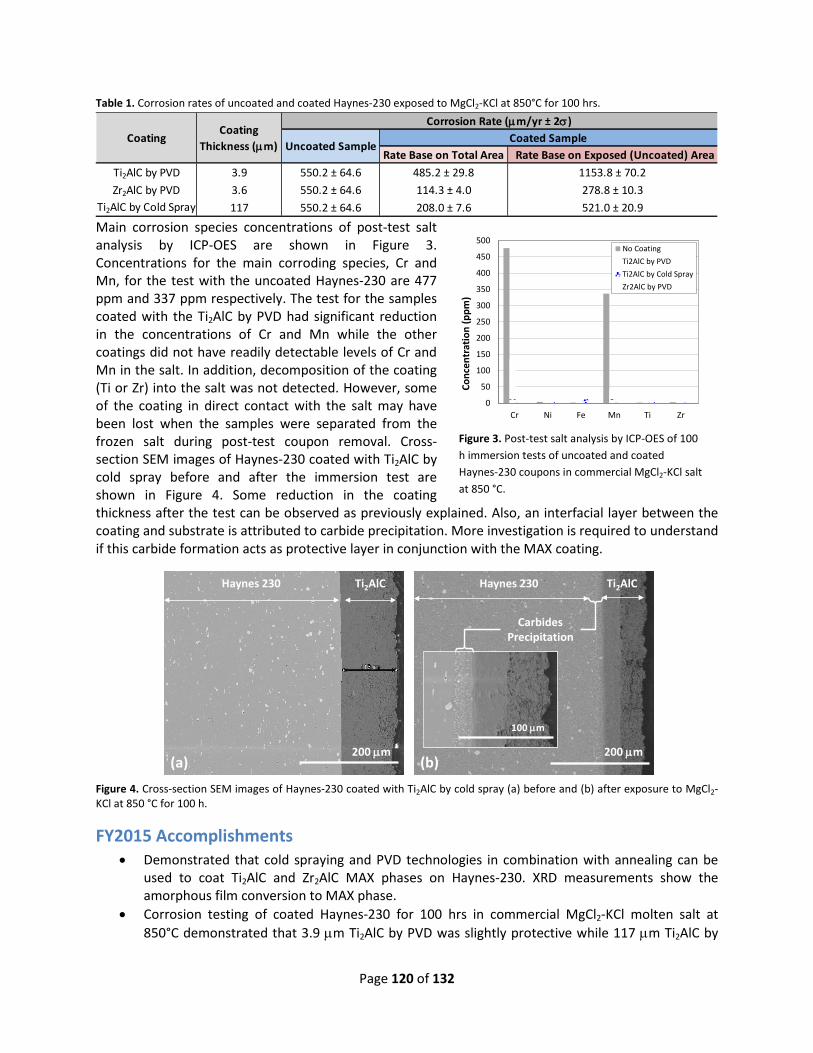
Page 120 of 132
Table 1. Corrosion rates of uncoated and coated Haynes-230 exposed to MgCl2-KCl at 850°C for 100 hrs.
Main corrosion species concentrations of post-test salt analysis by ICP-OES are shown in Figure 3. Concentrations for the main corroding species, Cr and Mn, for the test with the uncoated Haynes-230 are 477 ppm and 337 ppm respectively. The test for the samples coated with the Ti2AlC by PVD had significant reduction in the concentrations of Cr and Mn while the other coatings did not have readily detectable levels of Cr and Mn in the salt. In addition, decomposition of the coating (Ti or Zr) into the salt was not detected. However, some of the coating in direct contact with the salt may have been lost when the samples were separated from the frozen salt during post-test coupon removal. Cross-section SEM images of Haynes-230 coated with Ti2AlC by cold spray before and after the immersion test are shown in Figure 4. Some reduction in the coating thickness after the test can be observed as previously explained. Also, an interfacial layer between the coating and substrate is attributed to carbide precipitation. More investigation is required to understand if this carbide formation acts as protective layer in conjunction with the MAX coating.
Figure 4. Cross-section SEM images of Haynes-230 coated with Ti2AlC by cold spray (a) before and (b) after exposure to MgCl2-KCl at 850 °C for 100 h.
FY2015 Accomplishments • Demonstrated that cold spraying and PVD technologies in combination with annealing can be
used to coat Ti2AlC and Zr2AlC MAX phases on Haynes-230. XRD measurements show the amorphous film conversion to MAX phase.
• Corrosion testing of coated Haynes-230 for 100 hrs in commercial MgCl2-KCl molten salt at 850°C demonstrated that 3.9 µm Ti2AlC by PVD was slightly protective while 117 µm Ti2AlC by
Rate Base on Total Area Rate Base on Exposed (Uncoated) AreaTi2AlC by PVD 3.9 550.2 ± 64.6 485.2 ± 29.8 1153.8 ± 70.2Zr2AlC by PVD 3.6 550.2 ± 64.6 114.3 ± 4.0 278.8 ± 10.3
Ti2AlC by Cold Spray 117 550.2 ± 64.6 208.0 ± 7.6 521.0 ± 20.9
CoatingCoating
Thickness (µm)
Corrosion Rate (µm/yr ± 2σ)
Uncoated SampleCoated Sample
(a) (b)200 µm
Ti2AlCHaynes 230 Ti2AlCHaynes 230
CarbidesPrecipitation
200 µm
100 µm
0
50
100
150
200
250
300
350
400
450
500
Cr Ni Fe Mn Ti Zr
Conc
entr
atio
n (p
pm)
No CoatingTi2AlC by PVDTi2AlC by Cold SprayZr2AlC by PVD
Figure 3. Post-test salt analysis by ICP-OES of 100 h immersion tests of uncoated and coated Haynes-230 coupons in commercial MgCl2-KCl salt at 850 °C.

Page 121 of 132
cold spray and 3.6 µm Zr2AlC by PVD were completely protective. Post-test salt analysis showed 71% and 87% reduction in the Cr and Mn concentrations, respectively, for the test with the Ti2AlC by PVD while the other coatings showed 100% reduction of Cr and Mn in the salt.
• Post-test salt analysis showed no decomposition of the coatings (Ti or Zr) into the salt.
Future Directions This project has developed a coating technology that has significant opportunity to be used for nuclear and CSP applications. The following path forward has been established from this work:
• Evaluate the opportunity to develop intellectual property around MAX phase coatings. • Publish work results in a scientific journal. • Leverage on the DOE SunShot program to present results from this LDRD work during SunShot
project review. • Use the outcome from this project to seek funding on DOE NE program, the DOE SunShot
program, or programs in other federal agencies requiring materials that have high service temperatures.
FY 2015 Publications/Presentations 1. A publication in a scientific journal is expected from this work.
References 1. Olson, L.C., J.W. Ambrosek, K. Sridharan, M.H. Anderson, and T.R. Allen, Materials corrosion in
molten LiF-NaF-KF salt. Journal of Fluorine Chemistry, 2009. 130(1), p. 67-73. 2. Ludwig, D., L. Olson, K. Sridharan, M. Anderson, and T. Allen, High temperature electrochemistry of
molten fluoride salt for measurement of dissolved chromium. Corrosion Engineering Science and Technology, 2011. 46(4), p. 360-364.
3. Olson, L., K. Sridharan, M. Anderson, and T. Allen, Intergranular corrosion of high temperature alloys in molten fluoride salts. Materials at High Temperatures, 2010. 27(2), p. 145-149.
4. Olson, L., K. Sridharan, M. Anderson, and T. Allen, Nickel-plating for active metal dissolution resistance in molten fluoride salts. Journal of Nuclear Materials, 2011. 411(1-3), p. 51-59.
5. Schmidt, J., M. Scheiffele, M. Crippa, P.F. Peterson, E. Urquiza, K. Sridharan, L.C. Olson, M.H. Anderson, T.R. Allen, and Y. Chen, Design, Fabrication, and Testing of Ceramic Plate-Type Heat Exchangers with Integrated Flow Channel Design. International Journal of Applied Ceramic Technology, 2011. 8(5), p. 1073-1086.
6. Du, Y.L., Z.M. Sun, H. Hashimoto, and W.B. Tian, First-Principles Study on Thermodynamic Properties of Ti2AlC and Ti2SC. Materials Transactions, 2009. 50(9), p. 2173-2176.
7. Thien, D., S. Gibbons, R. Kinra, and R. Arroyave, Ab-initio aprroach to the electronic, structural, elastic, and finite-temperature thermodynamic properties of Ti(2)AX (A = Al or Ga and X = C or N). Journal of Applied Physics, 2011. 110(9).
Acronyms CSP Concentrated solar power EDS Energy dispersive spectroscopy FACTSage FACT stands for Facility for the Analysis of Chemical Thermodynamics. FACTSage is the
fusion of two software packages in the field of computational thermochemistry: FACT-Win and ChemSage.
FLiNaK Eutectic mixture of LiF-NaF-KF

Page 122 of 132
ICP-OES Inductively coupled plasma optical emission spectrometry MAX Material where M is an early transition metal, A is an A-group element, and X is carbon
and/or nitrogen PVD Physical vapor deposition SEM Scanning electron microscopy SRNL Savannah River National Laboratory UW University of Wisconsin-Madison XRD X-ray diffraction

Page 123 of 132
Project Team: J. V. Cordaro (Primary), D. J. Shull, E. M. Kriikku Subcontractor: Schweitzer Engineering Lab Thrust Area: CE Project Start Date: October 1, 2014 Project End Date: September 30, 2016
Resilient Electrical Grid Synchrophasor Utility companies are deploying Synchrophasors to provide real time synchronized power measurements. These devices diagnose problems and allow for more efficient power transmission. The GPS Constellation provides precise timing signals to all Synchrophasors. Due to the relatively weak signals from space, valid GPS signals can be overwhelmed (jammed) or fooled by false signals (spoofed). As utilities deploy Synchrophasors, the US Electrical grid will become more vulnerable to a cyber-attack on GPS. The result could be a large power outage. This
project demonstrated the key components of a spoof and jam resistant time base that detects GPS spoofing or jamming and switches over to Iridium Satellite Constellation timing signals. FY2015 Objectives
• Demonstrate the GPS and Iridium dual clock security benefits for US grid Synchrophasors. • Develop a spoof and jam resistant time base that will automatically detect GPS spoofing or
jamming and switch over to the Iridium Satellite Constellation timing signals.
Introduction Electrical Syncrophasors are now being deployed on the US Electrical Grid by utilities to provide real time synchronized power measurements. These high speed devices are used to diagnose the electrical grid health, allow the utilities to use existing power more efficiently, and push more power through the grid while reducing the likelihood of brownouts or blackouts. They are considered one of the most important measuring devices in the modernization of the US Electrical Grid. Syncrophasors across the grid are dependent on precise common timing which is provided by the US Global Positioning Satellite (GPS) Constellation. Due to the relatively weak signals from space, however, valid GPS signals can be overwhelmed or jammed by an interfering source or fooled by a false (spoofer) signal. As the utilities become more dependent on Syncrophasors, the US Electrical grid will become more vulnerable to a Cyber-attack on GPS. The result could be catastrophic for the US Grid. By sending erroneous time to Syncrophasors, phase angles are artificially altered indicating a need for more or less power. This could cause an overvoltage or under voltage (brownout) condition. By spoofing multiple Syncrophasors, a cascading power outage could occur.
This LDRD project will develop a spoof and jam proof time base that will automatically detect GPS spoofing or jamming and switch over to Iridium Satellite Constellation timing signals. The Iridium signals are 1000 times more powerful than GPS and contain a random number from each spot beam, both features increase security.

Page 124 of 132
Figure 1. High Level Diagram of Test Setup
Approach Figure 1 shows the GPS and Iridium satellite signals being received by the test equipment. The Iridium signals are approximately 1000 times stronger than the GPS signals and thus can be inside a building or under other occlusions. Figure 2 shows the test equipment setup and the instruments used to compare GPS vs. Iridium time base and hardware spoof the SEL-2407 GPS receiver (not open air, laboratory only). This is a state of the art GPS receiver that is the industry standard for the US Electrical Grid. It has several IRIG timing outputs that are used to synchronize SCADA systems, protective relays and other grid hardware.
Iridium Receiver SEL-2407
Iridium Antenna
GNSS SimulatorSpectracom GSG-62
RF
OscilloscopeTektronix DPO3054
1PPS (Iridium) 1PPS (Spoof)
GNSS Antenna PCTel GNSS1-TMG-40N
1PPS (Reference)
10MHz +/- Spoof Rate
Frequency GeneratorTektronix AFG3102
10MHz / 1PPS ReferenceFluke 91010MHz
1PPS Trigger
Figure 2. Diagram of Test System

Page 125 of 132
Figure 3. GPS vs. Iridium Pulse Per Second Output, time scale 200 nano sec per division Results/Discussion The oscilloscope in Figure 3 shows four traces. Trace 1, 2 and 4 are from the GPS receiver at different points in the test setup. Trace 3 (Magenta) is from the Satelles Time and Location (STL) Iridium receiver. The time base on the scope is 200 nano seconds per division. The actual time between the GPS Pulse Per Second (PPS) output and the STL Iridium PPS is shown in Figure 4 using a calibrated frequency counter in the time interval mode. At the time the screen shot was taken, the frequency counter shows a delta of 200 nano seconds. Figure 5 shows the results from a 24-hour continuous test comparing GPS vs. Iridium time base. The spikes are caused by Iridium Satellite Vehicles (SV) that were not broadcasting the Iridium bursts as the SV flew over the Savannah River Site. The data supports the project goal of a stand-alone Iridium receiver capable of maintaining +/- 1 microsecond vs. GPS for critical timing receivers.
Figure 4. Delta between GPS and Iridium Time in seconds
GPS Receiver Trace
STL Iridium Receiver Trace
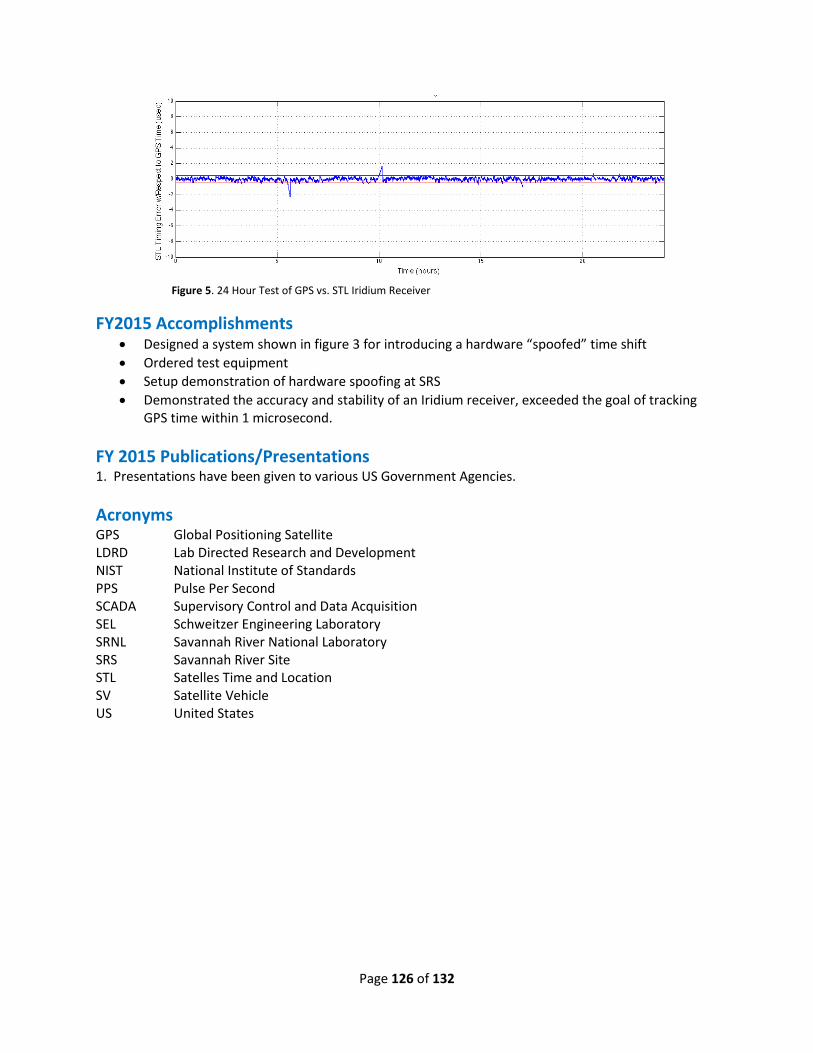
Page 126 of 132
FY2015 Accomplishments • Designed a system shown in figure 3 for introducing a hardware “spoofed” time shift • Ordered test equipment • Setup demonstration of hardware spoofing at SRS • Demonstrated the accuracy and stability of an Iridium receiver, exceeded the goal of tracking
GPS time within 1 microsecond. FY 2015 Publications/Presentations 1. Presentations have been given to various US Government Agencies. Acronyms GPS Global Positioning Satellite LDRD Lab Directed Research and Development NIST National Institute of Standards PPS Pulse Per Second SCADA Supervisory Control and Data Acquisition SEL Schweitzer Engineering Laboratory SRNL Savannah River National Laboratory SRS Savannah River Site STL Satelles Time and Location SV Satellite Vehicle US United States
Figure 5. 24 Hour Test of GPS vs. STL Iridium Receiver
Page 127 of 132
Project Team: D. A. Tamburello (Primary), B. J. Hardy, and D. L. Anton Subcontractor: P. Benard (UQTR), D. Sholl (GT), K. Walton (GT), and M. Sulic (SRC) Thrust Area: CE Project Start Date: October 1, 2014 Project End Date: September 30, 2016
Multi-Component Separation and Purification of Natural Gas
It is proposed to prove the applicability of the multi-component potential theory of adsorption (MPTA) to a real world natural gas adsorbent system to properly characterize the adsorbent’s selectivity for an individual gas component using only the single component isotherms. Thus, the real world gas separation/purification application of a specific adsorbent for a given gas stream can be obtained simply and effectively without the need for large experimental efforts or costly system modifications until after an initial computational screening of perspective materials has been completed. While the current research effort will use natural gas, which is the world’s largest
industrial gas separations application, to validate the MPTA, the tools gained through this effort can be applied to a gas separation effort, such as CO2, H2, deuterium, or tritium. FY2015 Objectives
• Identify the adsorbent(s) and gas mixture compositions(s) to be analyzed. • Complete the derivation of MPTA and apply it to specific adsorbent(s) for specific single-
component and multi-component gas composition(s). • Complete construction of a test stand for validation of the MPTA. • Demonstrate the utility of MPTA-predicted adsorbent selectivity for real-world gas
separation/purification. • Augment/update the MPTA for application to real-world gas separation/purification. • Explore in-situ growth of an adsorbent directly onto a heat exchanger surface for adsorption
temperature control. • Explore novel activated carbon (AC) pellet creation without adsorption losses from binders.
Introduction Over the past decade, several technical developments (such as hydraulic fracturing) have led to an exponential increase in discovering new domestic natural gas reserves. In 2010, nearly 24% of the world’s energy demands were supplied by natural gas, which is an increase of 7.4% from the previous year1. Raw natural gas composition can vary substantially from source to source. Typically, methane accounts for 75% to 95% of the total gas, with the rest of the gas containing ethane, propane, butane, other higher hydrocarbons, and impurities, with the most common including H2O, CO2, N2, and H2S. All natural gas requires some treatment, if only to remove H2O; however, the composition of natural gas delivered to the commercial pipeline grids is tightly controlled. Natural gas processing is the largest industrial gas separation application in the world, with an estimated $5 billion natural gas separations equipment market in 20082. Even with the economic and environmental incentives, as much as 20% of the worldwide natural gas reserves require extensive treatment (2008 estimate) and remain unusable due to high costs of purification and delivery to the commercial pipeline grid2. Sub-quality natural gas reserves—defined as fields containing more than 2% CO2, 4% N2, or 4 ppm H2S—make up an estimated

Page 128 of 132
50% of the world’s natural gas volume1. The development of sub-quality, remote, and unconventional fields (i.e., landfill gas) can present new challenges to gas separation that require more efficient and economically viable approaches to the conventional CO2 and N2 removal processes1. Adsorbent technologies, such as the use of activated carbons, zeolites, or metal-organic frameworks (MOFs) are already widely used in the natural gas industry for separation of impurities3. “Central to the development and implementation of adsorption-based processes are the various selectivity mechanisms that give rise to the separation of components within the gas mixture.”1
The selectivity of an adsorbent depends on the interactions between various components with the adsorbent surface, as well as on the intermolecular interactions between components themselves. For this reason, estimating the selectively and describing the thermal response and transport processes of a gas mixture in a given adsorbent requires much more than knowledge of single component adsorption isotherms; although the individual single-component isotherms do play a critical role in predicting the adsorbent-mixture behavior. There are several theoretical approaches to understanding and predicting mixture adsorption, such as DFT, IAST, RAST, VST, and CLM. While some of these approaches can
describe the properties of mixture adsorption reasonably well, they typically describe ideal systems that behave very differently from actual adsorbents whose pore structures and surface areas generally vary significantly from ideality4. However, Dunbar et al. (2012) presented a very promising and versatile new approach for modeling the properties of non-ideal real gas mixture adsorption called MPTA. MPTA considers the mixture as a heterogeneous substance segregated in the external field of the adsorbent as shown Figure 1. A crucial advantage of MPTA is its capacity to accurately predict excess adsorption of various gases on adsorbents with very few fitting parameters due to the use
of the same equations of state for both the bulk and adsorbed phases. For this and other reasons, MPTA and proving its capabilities in predicting real world gas separation/purification applications—specifically, natural gas adsorption—is the focus of the current research. Through the results of this work, new adsorbents can be tested computationally in specific separation applications without the need for costly experimental efforts. In addition, existing gas separation technologies, such as PSA and TSA systems, will be improved through process intensification by accurately modeling these real world gas separation operations and testing new operating conditions, components, or adsorbent materials. Finally, the performance of new separation operations that combine existing technologies, such as a TAPSA system, can be modeled accurately to predict their performance without the need for excessive experimental efforts. Approach This program has two primary efforts: 1) theory derivation and adaptation and 2) experimental measurements and application. The first effort consists of an initial derivation of the MPTA and its adaptation to a specific gas composition. The mass and energy balances together with equations for the multicomponent isotherms and excess internal energy will be coupled to the real gas properties (compressibility, enthalpy, viscosity, etc.) to create a global model describing an ANG system. The second effort consists of adsorbent selection, gas composition selection, and experimental set-up. From the over fifty adsorbents currently in use by the petrochemical industry for natural gas separation, two
Figure 1. Basic principles of MPTA4

Page 129 of 132
to three will be chosen for analysis based on their availability, their ease of synthesis, and the availability of literature data. These two efforts will merge together as the experimental data is taken and the models are validated. The remainder of the project will then consist of model validation and augmentation using both single-component and multi-component isotherm measurements. The single-component experimental data will then be fed into the MPTA model to predict and compare with the multi-component data for validation. As necessary, the MPTA model will be updated to correct for discrepancies and improve accuracy. By validating the MPTA model’s viability to describe the adsorption selectivity of an individual component of a gas mixture using only single component isotherm data, this work will prove the predictive capability of using specific adsorbents for specific gas separation applications. This project also includes a secondary effort aimed at improving adsorbents and their application in PSAs. Most adsorbents have extremely poor thermal conductivity, which can make the thermal control necessary for effective separation applications difficult. Growing an adsorbent directly onto a heat exchanger surface—dubbed in-situ adsorbent growth—minimizing thermal resistance with the heat exchanger surface and maximizes an adsorbent’s thermal control. Additionally, many applications will use compaction to increase an adsorbent’s thermal conductivity. However, many adsorbents cannot be compacted without either destroying adsorption sites or using a binder, both of which inhibit gas uptake and, thus, decrease adsorption capacity. To minimize these losses, another effort within this project seeks to create activated carbon compacts using another adsorbent as a binder. Results/Discussion A literature review of MPTA, including but not limited to, the initial development by Polanyi from 1920, and subsequent work by Shapiro, Stenby, Benard, and Dunbar has been completed. After consulting with the subcontractors at UQTR and GT, a mathematical formulation for the MPTA has been developed at SRNL and has been programmed into Mathcad® using the Dubinin potential to represent the adsorbent. However, because this potential lacks a near field repulsion term, it was found that either a lower limit must be imposed on the approach of a gas to the adsorbent surface or an upper limit must be applied to the density of the adsorbate as the surface of the adsorbent is approached. The limiting distance from the adsorbent surface would be representative of the molecular radius of the adsorbed gas, while the limiting density would be related to the condensed form of the adsorbate. Figure 2 shows MPTA fits of CH4 on MOF-5 compared with UNILAN isotherm model fits. Note that the MPTA fits the isotherm data as well, if not better than the UNILAN model, which is the accepted standard for the ARPA-E natural gas research programs. Experimental measurements of single-component excess adsorption isotherms of CH4, N2, and CO2 on UiO-66, MOF-5, and AC have been completed. In addition, single-component excess adsorption isotherms of H2 on MOF-5 and AC have also been measured. Figure 3 shows representative isotherm
Figure 2. MPTA fits and UNILAN model of CH4 on MOF-5 isotherm data.
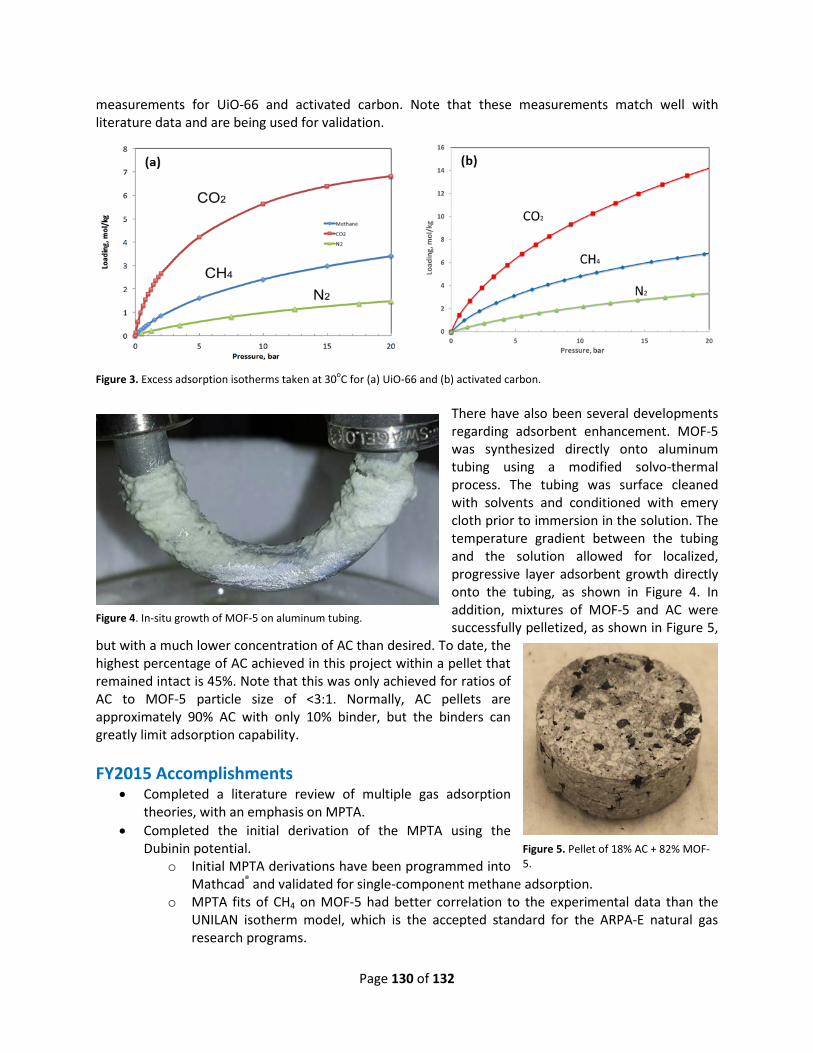
Page 130 of 132
measurements for UiO-66 and activated carbon. Note that these measurements match well with literature data and are being used for validation.
Figure 3. Excess adsorption isotherms taken at 30oC for (a) UiO-66 and (b) activated carbon.
There have also been several developments regarding adsorbent enhancement. MOF-5 was synthesized directly onto aluminum tubing using a modified solvo-thermal process. The tubing was surface cleaned with solvents and conditioned with emery cloth prior to immersion in the solution. The temperature gradient between the tubing and the solution allowed for localized, progressive layer adsorbent growth directly onto the tubing, as shown in Figure 4. In addition, mixtures of MOF-5 and AC were successfully pelletized, as shown in Figure 5,
but with a much lower concentration of AC than desired. To date, the highest percentage of AC achieved in this project within a pellet that remained intact is 45%. Note that this was only achieved for ratios of AC to MOF-5 particle size of <3:1. Normally, AC pellets are approximately 90% AC with only 10% binder, but the binders can greatly limit adsorption capability. FY2015 Accomplishments
• Completed a literature review of multiple gas adsorption theories, with an emphasis on MPTA.
• Completed the initial derivation of the MPTA using the Dubinin potential.
o Initial MPTA derivations have been programmed into Mathcad® and validated for single-component methane adsorption.
o MPTA fits of CH4 on MOF-5 had better correlation to the experimental data than the UNILAN isotherm model, which is the accepted standard for the ARPA-E natural gas research programs.
Figure 4. In-situ growth of MOF-5 on aluminum tubing.
Figure 5. Pellet of 18% AC + 82% MOF-5.

Page 131 of 132
• Identified potential adsorbent materials and gas mixture compositions. o UiO-66 and AC will be the primary adsorbents examined, with MOF-5 as a secondary. o Study gases include N2, CO2, H2, CH4, C2H6, C3H8, and C4H10 (n-butane and iso-butane).
• Completed validation measurements of single-component excess adsorption isotherms of CH4, N2, and CO2, on UiO-66, MOF-5, and AC.
o Completed single-component excess adsorption isotherms of H2 on MOF-5 and AC. • Crystalized MOF-5 directly onto aluminum tubing.
o Additional operating conditions need to be explored to improve the process • Successfully pelletized mixtures of AC and MOF-5.
Future Directions
• Atomistic modeling of the adsorption process for gas mixtures. o Better understand of preferential adsorption. o Possible adsorbent modifications/improvements. o Possible alternative operating conditions.
• Improvement of the MPTA using single-component adsorption isotherms o Validate/Refine the MPTA derivation based on experimental data o Develop a method to overcome potential field limitations—such as pore condensation—
wherever possible • Improvement of the MPTA using multi-component mixture adsorption isotherms
o Validate/Refine the MPTA derivation based on experimental data o Quantify differences based on static and flowing mixture adsorption o Alter/improve single-component potential fields for increased accuracy
• Techno-economic analysis of TAPSA vs. PSA vs. TSA • Build a functional PSA / TSA system to examine real-world operation
FY 2015 Publications/Presentations As of the writing of this document, no reports/publications/presentations have been made outside of internal documents, internal team progress meetings, and the SRNL LDRD reviews. References
1. Rufford, T.E.; Smart, S.; Watson, G.C.Y.; Graham, B.F.; Boxall, J.; Diniz da Costa, J.C.; May, E.F. “The removal of CO2 and N2 from natural gas: A review of conventional and emerging process technologies” Journal of Petroleum Science and Engineering 2012, 94-95, 123.
2. Baker, R.W.; Lokhandwala, K. “Natural Gas Processing with Membranes: An Overview” Ind. Eng. Chem. Res. 2008, 47, 2109.
3. Furukawa, H.; Ko, N.; Go, Y. B.; Aratani, N.; Choi, S. B.; Choi, E.; Yazaydin, A. O.; Snurr, R. Q.; O’Keeffe, M.; Kim, J.; Yaghi, O. M. “Ultrahigh Porosity in Metal-Organic Frameworks” Science 2010, 329, 424.
4. Dunbar, E.; Zacharia, R.; Chahine, R.; Benard, P. “Modified potential theory for modeling supercritical gas adsorption” International Journal of Hydrogen Energy 2012, 37, 9137.
Acronyms AC Activated Carbon ANG Adsorbent Natural Gas ARPA-E Advanced Research Projects Agency – Energy

Page 132 of 132
CLM Corrected Langmuir Model DFT Density Functional Theory GT Georgia Institute of Technology IAST Ideal Adsorption Solution Theory MOF Metal Organic Framework MPTA Multi-component Potential Theory of Adsorption PSA Pressure Swing Adsorption RAST Real Adsorbed Solution Theory SRC Savannah River Consulting TAPSA Temperature Assisted Pressure Swing Adsorption TSA Temperature Swing Adsorption UQTR Université du Québec à Trois-Rivières VST Vacancy Solution Theory