attentional processes in children with adhd: an event-related potential study using the attention...
TRANSCRIPT
International Journal of Psychophysiology 81 (2011) 82–90
Contents lists available at ScienceDirect
International Journal of Psychophysiology
j ourna l homepage: www.e lsev ie r.com/ locate / i jpsycho
Attentional processes in children with ADHD: An event-related potential studyusing the attention network test
Oliver Kratz a,⁎, Petra Studer a, Susanne Malcherek a,c, Karlheinz Erbe d,Gunther H. Moll a, Hartmut Heinrich a,b
a Department of Child & Adolescent Mental Health, University of Erlangen-Nürnberg, Schwabachanlage 6, 91054 Erlangen, Germanyb Heckscher-Klinikum München, Deisenhofener Str. 28, 81539 München, Germanyc Practice of Child and Adolescent Psychiatry, Bleickenallee 38, 22763 Hamburg, Germanyd Practice of Child and Adolescent Psychiatry, Luisenstr. 10, 96047 Bamberg, Germany
⁎ Corresponding author at: Department of ChildUniversity of Erlangen-Nürnberg, Schwabachanlage 6,Tel.: +49 9131 8539122; fax: +49 9131 8539126.
E-mail address: [email protected] (O. Kra
0167-8760/$ – see front matter © 2011 Elsevier B.V. Adoi:10.1016/j.ijpsycho.2011.05.008
a b s t r a c t
a r t i c l e i n f oArticle history:Received 29 October 2010Received in revised form 13 May 2011Accepted 22 May 2011Available online 12 June 2011
Keywords:ADHDP3ERPAttention Network TestCue processing
A variety of event-related potential (ERP) based studies have shown differences in neuronal processesunderlying attention, inhibition and error processing in children with attention-deficit/hyperactivity disorder(ADHD) compared to controls. However, so far there are no studies that have compared children with ADHDand typically developing (TD) children regarding effects in ERP components associated with the attentionnetwork test (ANT). The ANT allows to differentiate between three particular aspects of attention: alerting,orienting, conflict.Twenty-five children with ADHD and 19 TD children (comparable with respect to age, sex, and IQ) performedthe ANT while ERPs were recorded. Based on DSM-IV, the group of children with ADHD was divided in aninattentive (ADHDin, n=10) and a combined (ADHDcom, n=15) subgroup.On the performance level, the ADHD group showed a significantly higher variability of reaction times.Concerning ERP measures, smaller cue-P3 amplitudes were found in the ADHD group indicating that childrenwith ADHD allocate less attentional resources for cue processing. In addition, the target-P3 in ADHD showedsmaller amplitudes. Subgroup analysis revealed reduced cue-P3 amplitudes in both subgroups and reducedtarget-P3 amplitudes in ADHDin compared to TD children. Except for a higher alerting score in ADHD aftercorrection for cue-P3 group differences, performance data revealed no group differences specific for the threeattention networks. No group differences related to the attention networks were observed at the ERP level.Our results suggest that deviant attentional processing in children with ADHD is only partly related to ANT-specific effects. Findings are compatible with the model of a suboptimal energetic state regulation in ADHD.Furthermore, our results suggest that deviant cue processing in ADHD and related differences in taskmodulations should be accounted for in data analysis.
& Adolescent Mental Health,D-91054 Erlangen, Germany.
tz).
ll rights reserved.
© 2011 Elsevier B.V. All rights reserved.
1. Introduction
Attention-deficit/hyperactivity disorder (ADHD) is one of themostcommon childhood developmental psychiatric disorders (prevalencein childhood: about 5%; Polanczyk et al., 2007) and is characterized bydevelopmentally inappropriate cardinal symptoms of inattention,motor hyperactivity and impulsivity.
The Diagnostic and Statistical Manual of Mental Disorders (DSM-IV; American Psychiatric Association, 2000) lists three subtypes:predominantly inattentive (ADHDin); predominantly hyperactive-impulsive (ADHDhi); and combined type (ADHDcom). Research hasfocused on the combined and the inattentive subtype. Inattention
comprises difficulties to direct and maintain selective attention tomotivationally relevant tasks; impulsivity is described by actingrashly without apparently considering the consequences, whilehyperactivity refers to excessive and inappropriate motor activity(Bush, 2010).
Attention is based on a complex interaction of neural systems. Thevery influential attention network theory hypothesized by Posner andPetersen (1990) describes a selective attention system with threefunctionally and anatomically segregated networks with specific andseparable forms of attention known as alerting, orienting and executiveattention (Posner and Rothbart, 2007). The executive attentionnetwork is also referred to as the conflict network.
The three networks can be described in the following way (Boothet al., 2007; Posner and Rothbart, 2007). Alerting is related to arousaland vigilance and means achieving and maintaining a state of beingvery sensitive to incoming stimuli combined with a readiness to react.Alertness can be examined using warning signals prior to targets. The

83O. Kratz et al. / International Journal of Psychophysiology 81 (2011) 82–90
alerting network includes the locus coeruleus, the parietal and rightfrontal cortex. Orienting is defined as selecting information fromsensory input and shifting attention, i.e. disengaging and reengagingattention. Orienting can be studied by presenting a cue with spatialinformation about the target location which directs attention towardsa cued location. This network contains the frontal eye fields, thesuperior colliculus, the temporal parietal junction and the superiorparietal cortex. The conflict network comprises mechanisms formonitoring and resolving conflict among thoughts, feelings, andresponses. Conflict effects can be studied in tasks presenting a centraltarget stimulus in combination with surrounding congruent orincongruent flankers. The network includes the basal ganglia, anteriorcingulate, and the lateral ventral prefrontal cortex.
A range of experimental, neuroimaging, and clinical studies havesupported the attention network theory, which is of special interest instudies of attentional disorders like ADHD (Adolfsdottir et al., 2008).Posner and Petersen (1990) developed an experimental task called theAttention Network Test (ANT). This test combines cued detection(Posner, 1980) with a flanker-type paradigm (Eriksen and Eriksen,1974) and allows the behavioral assessment of attentional dimensionsof alerting, orienting, and executive function via specific reaction time(RT) patterns (Fan et al., 2002). For example, an alerting score iscalculated by subtracting the RT of double cue or neutral cue conditionsfrom the RT of the no-cue condition. A higher alerting score could be dueto difficulties in maintaining alertness without a cue and thus indicateweaker alerting. On the other hand, larger numbers could also reflectmore efficient use of cues (Fan and Posner, 2004).
Further studies used modified versions of the ANT to studydevelopmental cognitive characteristics in children (Rueda et al.,2004; Wangler et al., 2011).
In line with other cognitive tasks, general performance measuresin the ANT in children with ADHD and healthy controls showed loweraccuracy, longer reaction times (RT) or a higher variability of reactiontime in children with ADHD (e.g. Adolfsdottir et al., 2008; Booth et al.,2007; Johnson et al., 2008; Mullane et al., 2011). However, regardingthe three attention networks, mixed results are reported in theliterature. Johnson et al. (2008) as well as Mullane et al. (2011) founddeficits in the alerting and conflict networks in children with ADHD,while no differences were observed for the orienting network. Inaddition, Mullane et al. (2011) analyzed performance in the ADHDinand the ADHDcom subgroup and reported no differences between thesubgroups. In a study combining the ANT with functional magneticresonance imaging (fMRI) measures (Konrad et al., 2006), at theperformance level only the conflict network was affected in childrenwith ADHD compared to controls. However, fMRI analysis revealeddeviant brain activation patterns in all three attention networks.
In contrast to these results, two other studies (Adolfsdottir et al.,2008; Booth et al., 2007) observed no differences between childrenwith ADHD and controls on any of the three networks.
A recent study has aimed to link event-related potential (ERP)components to corresponding attention networks in healthy adults(Neuhaus et al., 2010). So far, there are no studies combining ERPmeasures and the ANT in children with ADHD. However, ERPcomponents (e.g. P3, contingent negative variation, N2) that are ofinterest in ADHD have been assessed with other tasks like thecontinuous performance test (CPT) or go/no-go paradigms (for areview see Barry et al., 2003). Therefore, studying these ERPcomponents in relation with the ANT in children with ADHD couldhighlight neuronal processes underlying the attention networks inADHD.
The P3 in general is thought to reflect processes involved instimulus evaluation (Kok, 2001). The cue-P3 reflects covert atten-tional orienting to potential targets. It precedes the response controlprocesses during target processing in a critical but behaviorally silentperiod (Overtoom et al., 1998; van Leeuwen et al., 1998). The amountof cortical activity related to processing of incoming information
(Neuhaus et al., 2010) as well as response control processes (motorselection and inhibition) are reflected in the P3 components to cuedtarget or non-target stimuli (Brandeis et al., 1998; van Leeuwen et al.,1998). Childrenwith ADHD show reduced P3 amplitudes compared tocontrols in different paradigms (Banaschewski and Brandeis, 2007). Ingo/no-go paradigms and studies employing a cued CPT target-P3amplitudes (Benikos and Johnstone, 2009b; Groom et al., 2009;Spronk et al., 2008; Wiersema et al., 2006b) as well as cue-P3amplitudes (Banaschewski et al., 2003; Benikos and Johnstone,2009b; Brandeis et al., 2002; Doehnert et al., 2010; Spronk et al.,2008) were found to be smaller in ADHD. The findings of reduced cue-P3 amplitudes in this context have been interpreted as eitherimpaired “attentional orienting” or resource allocation (Doehnertet al., 2010) indicating a suboptimal energetic state regulation(Banaschewski et al., 2003).
The CNV is a slow central negative component in reaction to awarning stimulus and related to anticipation and/or preparation(McCallum et al., 1988). Previous studies have reported variableresults: some studies found the CNV to be reduced with ADHD whileother studies showed a reduction only for special conditions or do notfind differences between children with ADHD and controls. Anattenuation of the CNV in ADHD was observed for CPT studies (e.g.Banaschewski et al., 2003; Banaschewski et al., 2008; Sartory et al.,2002) thus indicating impaired preparatory processes following cues.In a go/no-go task, the CNV was reported to be reduced in the ADHDgroup but only in the fast condition with a mean event-rate of 500 ms(Benikos and Johnstone, 2009). In a CPT study (Doehnert et al., 2010),the CNV was observed to be smaller for older children with ADHD(mean age about 12 years) compared to controls while the CNV didnot differ for younger children (mean age about 10.5 years). However,an attenuation of CNVwith ADHD is not described in other CPT studies(Strandburg et al., 1996; van Leeuwen et al., 1998).
The N2 is a frontal negative component about 200–450 ms afteronset of the stimulus which is thought to be associated with theprocess of monitoring or resolution of conflict (Albrecht et al., 2008;Johnstone et al., 2010; Kopp et al., 1996). Mixed results were reportedin studies investigating the N2 in children with ADHD compared tocontrols in Flanker tasks, a task which is similar to the ANT. Severalstudies show a reduced N2 in ADHD for the incongruent condition(Albrecht et al., 2008; Johnstone et al., 2009; Johnstone et al., 2010)while there are also findings of a general reduction of N2 in ADHD(Wild-Wall et al., 2009). In addition, also larger overall N2 amplitudes(Jonkman et al., 2007) as well as enhanced N2 amplitudes for neutralstimuli (Johnstone et al., 2009) were reported in ADHD.
The aim of the present study was to explore ERPs associated withthe ANT in children with ADHD compared to typically developing(TD) children. We expected to replicate findings of a higher error rateand a higher variability of reaction times for children with ADHD andwe were interested whether reaction times differed between groups.Furthermore, we wanted to examine whether group differences onthe performance level are displayed in distinct attention networks.
As ERPs may reveal specific differences in covert informationprocessing even without the presence of overt performance differ-ences (Banaschewski et al., 2003), we analysed ERPs related to theattention networks in children with ADHD and controls. Groupdifferences in ERP components related to the processing of cue andtarget stimuli (cue-P3, target-P3, CNV, and frontal negative compo-nents) were to be examined in the context of the attention networks.Due to the exploratory character of this study in relating ANT and ERPsin ADHD we had no directed hypotheses regarding attention networkrelated ERP group differences. Yet, independent of the attentionnetworks we expected to find general differences between groups,e.g. smaller P3 amplitudes, smaller CNV, and smaller frontal negativecomponent amplitudes in ADHD. In addition, as an exploratoryanalysis we were interested if the ADHDin and ADHDcom subtypesshow a differential pattern.

84 O. Kratz et al. / International Journal of Psychophysiology 81 (2011) 82–90
2. Methods
2.1. Participants
A total of 44 children aged eight to eleven years with an estimatedfull scale IQ above 80 participated in the study. They either werechildren with a diagnosis of ADHD (n=25) or TD children (controls)without a psychiatric or neurological disorder (n=19). Patients wererecruited from a child and adolescent psychiatric practice as well asfrom the outpatient department of the clinic. Controls were recruitedfrom the personal environment of employees of the clinic. All childrenhad normal or corrected-to-normal vision. The two groups did notdiffer concerning the demographic variables age, sex or IQ (seeTable 1).
All children of the ADHD group fulfilled DSM-IV criteria forADHDin or ADHDcom (American Psychiatric Association, 2000) andhad no comorbid diagnoses other than dyslexia, emotional disorder,and oppositional defiant disorder. Diagnoses were based on a clinicalinterview conducted by a child and adolescent psychiatrist or aclinical psychologist and ADHD was confirmed using the DiagnosticChecklist for Hyperkinetic Disorders/ADHD (Döpfner and Lehmkuhl,2000). All children were drug-naive and remained without medica-tion during participation in the study. After participating in this studya medication treatment was offered to these children with ADHD ifindicated. 15 children belonged to the ADHDcom subtype, 10 childrento the ADHDin subtype. Age did not differ between the two subgroupswhile IQ was significantly lower in ADHDin than in controls.
Behavior ratings were assessed with the German ADHD rating scale(FBB-HKS: Döpfner and Lehmkuhl, 2000) for both groups. The FBB-HKS isa 20-item questionnaire related to the DSM-IV and InternationalClassification of Diseases (ICD-10) criteria for ADHD. Parents rated theseverity of each item on a scale from 0 to 3. The questionnaire provides atotal score, i.e. the mean value of all items, as well as subscores forinattention and hyperactivity/ impulsivity. None of the TD children had ascore in the ADHD rating scale (total score and subscales respectively) ofmore than one standard deviation above normative means. The controlandADHDgroupdifferedonall scales of the FBB-HKS as expected (t(40)b−7.27; pb .001). The ADHDcom and ADHDin subgroups did not differ inthe FBB-HKS total score (t(22)=1.38, n.s.) nor in the inattentive subscale(t(22)=− .20, n.s.). However, ADHDcom exhibited larger values in thehyperactivity/impulsivity subscale (t(21)=2.45; pb .05) compared toADHDin.
Table 1Demographic and clinical characteristics of the control group and the group of childrenwith ADHD as well as for ADHDin and ADHDcom.
Children with ADHD(n=25):
Controls(n=19)
ADHDcom(n=15)
ADHDin(n=10)
Age (years) 9.7±1.0 10.2±1.09.8±1.0 9.6±1.1
IQ 109.5±11.7 114.6±11.1114.3±11.3 102.2±8.4
Sex (boys/girls) 19/6 15/410/5 9/1
Dyslexia 4 01 3
Oppositional defiant disorder 2 02 0
Emotional disorder 2 01 1
FBB-HKS: total score 1.48±.38 .34±.221.56±.37 1.34±.38
FBB-HKS: inattention 1.78±.44 .50±.331.77±.44 1.81±.47
FBB-HKS: hyperactivity/impulsivity 1.24±.49 .21±.201.42±.48 0.96±.38
The experiment was conducted in accordancewith the Declarationof Helsinki and was approved by the Ethics Committee of the MedicalFaculty of the University of Erlangen–Nuremberg. Assent wasobtained from the children and written informed consent from theirparents.
2.2. Procedure and task design
The children of both groups performed the attention network test(Fan et al., 2002; Posner and Petersen, 1990), which measures threedistinct networks of attention (alerting, orienting, conflict) whilebrain activity wasmeasured. The parents of the children of the controlgroup received 20 Euro as an expense allowance. This expenseallowance was not provided for the parents of the children withADHD. After participating in this study, the childrenwith ADHD eithertook part in a medication treatment study or in an attention trainingstudy.
The children's version of the ANT (Rueda et al., 2004) was realizedin Presentation (Neurobehavioral Systems, Albany, CA, USA). Fig. 1shows a schematic illustration of the ANT version used in this study.Children were instructed to visually fixate on a cross located in thecenter of the computer screen. They were told to then feed a hungryfish that would appear above or below the fixation cross (about 1°) bypressing the button of the mouse that matched the direction in whichthe fish was pointing. This target fish was the center fish presented ina row of five fish and was visible for 350 ms. The flanking fish eitherlooked in the same direction (congruent trials) or in the oppositedirection (incongruent trials) than the center fish. Presentation of theflanking fish started 100 ms before the center fish appeared.
One of three cue conditions (equal probability) preceded thepresentation of the fish. In the NoCue condition, the fish werepresented without a cue stimulus. In the NeutralCue condition, anasterisk at the center of the screen indicated that the target fish wasabout to appear soon. In the SpatialCue condition, an asterisk waspresented at the location of the target fish, indicating not only that thetarget was about to appear soon but also its location on the screen. Inthis task all cues were valid. Cue stimuli were presented for 150 ms,starting 1400 ms before the appearance of the target fish. Incomparison to the original ANT child version (Rueda et al., 2004),the interval between cue and target stimulus was prolonged from600 ms to 1400 ms to elicit a CNV in the ERPs.
Each fish subtended 1.6° of visual angle and the contours ofadjacent fish were separated by 0.21°. Viewing distance was about72 cm. The intertrial interval varied randomly between 3.5 and 5.0 s.
The children were instructed in a standardized way beforeperforming a practice block of 24 trials. The test itself consisted offour blocks of 48 trials each. After each block the number of correctresponses was presented on the screen together with a fish blowingbubbles if the children achieved 40 ormore correct responses. The test(incl. short breaks between the blocks) lasted about 15 minutes.
The following performance measures were determined accordingto Fan et al. (2002): hits, median of RT, variability of RT (RT_STD),alerting score (RT for NoCue trials minus RT for NeutralCue trials),orienting score (RT for NeutralCue trials minus RT for SpatialCuetrials) and conflict score (RT for incongruent trials minus RT forcongruent trials). Reaction time measures were based on trials withcorrect responses. Reaction times between 200 and 1500 ms afteronset of the target stimulus were considered for analysis.
2.3. ERP recordings and analysis
During the ANT brain electrical activity was recorded with aBrainAmp amplifier (Brain Products, Munich, Germany) using 23sintered Ag/AgCl electrodes positioned according to an extended 10–20 system (reference: FCz, ground: CPz). Vertical and horizontalelectrooculogram was recorded with electrodes placed above and

flankers
two target conditions
congruent incongruentcue
+*
+
+
++
target
+ *
+*
+*
NeutralNoCue Spatial
+
three cue conditions
NeutralCue
NoCue SpatialCue
+
Fig. 1. Schematic illustration of the Attention Network Test (ANT). In each trial, one of three cue conditions (NoCue, NeutralCue, and SpatialCue) preceded the target fish which eitherpointed to the left or to the right. The flanker fish either pointed in the same (congruent) or opposite direction than the target fish (incongruent). Children were asked to feed thetarget fish by pressing the button that matched the direction in which the target fish was pointing.
85O. Kratz et al. / International Journal of Psychophysiology 81 (2011) 82–90
below the right eye and at the outer canthi. The sampling rate was setto 500 Hz (bandwidth: 0.016 – 120 Hz) and impedances were keptbelow 20 kΩ.
The VisionAnalyzer software (Brain Products, Munich, Germany)was used for data analysis. A 50 Hz notch filter was applied andelectrical activity was filtered from .05 to 30 Hz using 24 dB/octButterworth filters. Eye movement artefacts were corrected by meansof independent component analysis (Jung et al., 2000). Signals wererereferenced to linked-mastoids. If the amplitude exceeded ±100 μVat any electrode, a section of −300 to +700 ms around this artefactwas excluded from further analyses.
For data analysis of the preparatory interval data was segmentedinto segments of 1800 ms length, starting 230 ms before presentationof the cue stimulus. Analysis of target processing was based onsegments of 1250 ms length starting 125 ms before target presenta-tion. For these segments, separate averaged event-related responseswere calculated based on cue and target stimuli. No baselinecorrection was applied to avoid distortion of the ERP topography(e.g. Brandeis et al., 1998).1 These averaged responses were onlyincluded in further analyses if at least 20 artefact-free segments wereobtained for trials with correct responses. Segments containingartefacts in any channel were removed in all channels. On average,the analyses were based on about 45 artefact-free trials per cuecondition and on about 69 trials per congruent/incongruent condition.
P3 amplitudes to cue as well as to target stimuli were maximal atPz (see Figs. 2 and 3). For this reason, the P3 was determined as themean amplitude at Pz in the time window 400 to 800 ms after cuepresentation for cue trials and in the timewindow 270 to 550 ms aftertarget presentation for target trials.
Two frontal negative components lie within the circumscribedtimewindow of about 200 – 450 ms (Johnstone et al., 2010) whichwerefer to as earlier and later frontal negative component. For an earlierfrontal negative component in the congruent and incongruent
1 However, baseline-corrected ERP data analysis revealed the same result patternsas the data reported in the present paper.
condition at Fz the mean amplitude was determined in a timewindow of 190 to 270 ms after the target stimuli (see Fig. 3). Inaddition, a later frontal negative component was measured as themean amplitude in a time window of 300 to 450 ms after the targetstimulus.
As the CNV was most pronounced at Cz, it was determined at thiselectrode as themean amplitude in the timewindow 1000 to 1300 msfollowing cue onset for all cue conditions (see Fig. 2).
2.4. Statistical analysis
To study differences in ANT performance between children withADHD and healthy controls, two-tailed independent t-tests werecalculated for all basic performance measures. In order to analysenetwork effects ANOVAs were calculated either with the within-subject factor ALERTING (NoCue, NeutralCue), ORIENTING (Neutral-Cue, SpatialCue) or CONFLICT (congruent, incongruent) and thebetween-subject factor GROUP (ADHD, control). For all thoseperformance measures yielding significant results, in an additionalpost-hoc test each of the two ADHD subgroups was compared to thecontrol group.
Concerning ERP measures, differences between the two groupswere analysed in repeated measure ANOVAs with between-subjectfactor GROUP and a within-subject factor depending on the networkto be studied (ALERTING, ORIENTING, or CONFLICT):
– For the analysis of the cue-P3 as well as the CNV the two-levelfactor ORIENTING was used as within-subject factor.
– Analysis of the mean target-P3 amplitudes related to the differentcue conditions was divided into two analyses. One analysis wasbased on a two-level within-subject factor ALERTING and the otheron a two-level within-subject factor ORIENTING.
– For the analysis of the target-P3 as well as the earlier and laterfrontal negative components in congruent and incongruent trials atwo-level within-subject factor CONFLICT was employed.

-5
µV
-
ADHD
-5
µV
-
Controls
Cue-P3 (Pz)
5
0
5
0
0 500 1000 1500ms
+ Cue F T0 500 1000 1500
+ms
Cue F T
µV
-
µV
-
CNV (Cz)
-5
0
-5
5
+ms
0
Cue
500 1000 1500 0 500 1000 1500T
5
+ms
Cue T
0
Fig. 2. Grand average ERPs during the ANT for the preparatory interval from presentation of the cue to the appearance of the target stimulus. The ERPs are depicted for children withADHD (left) and typically developing children (right). Top: ERPs at electrode Pz. The two small vertical lines above the x-axis indicate the time window onwhich the cue-P3 analysisis based. Bottom: ERPs at electrode Cz. The two small vertical lines above the x-axis indicate the time window for the CNV analysis. Task blocks with no, neutral, and spatial cues aredepicted as black, red, and green lines respectively. The cue appeared at 0 ms, the flanker fish (F) at 1400 ms, and the target fish (T) at 1500 ms. Negative amplitude values are plottedupwards. Spline-interpolated maps illustrate the topography of the components (top: cue-P3, bottom: CNV) in the spatial cue condition. Blue and red colors indicate negative andpositive amplitude values respectively in a range from −8 to 8 μV for cue-P3 amplitudes and in a range from −4 to 4 μV for CNV amplitudes.
86 O. Kratz et al. / International Journal of Psychophysiology 81 (2011) 82–90
If significant effects containing the factor GROUP were obtained,additional post-hoc tests were run for each ADHD subgroupseparately.
The calculation methods described above allow to display ANTmodulated network effects at the level of ERPs. These calculations wereperformed in an analogue way as for network effects at the performancelevel. Formean cue-P3 amplitudes aswell as for the CNVno alerting effectwas calculated as there is no P3 and no CNV in the NoCue condition.
Significancewas assumed if pb0.05. For the ANOVAs, effect sizes interms of partial eta square (part. η2) were computed and interpretedfollowing the notion that part. η2N0.01 indicates small, part. η2N0.06medium, and part. η2N0.14 large effects (Cohen, 1988). In addition tot-tests, effect sizes (Cohen's d) were computed as the absolute valueof the difference of a score in the control group and the ADHD groupdivided by the pooled standard deviations of these scores.
3. Results
3.1. Performance measures
The results on the performance level are summarized in Table 2. Allchildren included in the statistical analysis had a minimum of 70%correct responses. The twogroups did not differ in thenumber of correctresponses achieved (t(42)=.31; n.s.). Regarding themedian of reactiontimes, a trend was obtained (t(42)=1.98; pb .1; Cohen's d=−.58|)indicating longer reaction times in ADHD. Analysis of the RT_STDrevealed a significant effect (t(42)=3.17; pb .01; Cohen's d=−.94|)indicating ahigher variability of reaction times in theADHDgroup. Post-hoc tests revealed that this effect is also present for ADHDin (t(27)=2.35; pb .05; Cohen's d=−.99|; RT_STDADHDin=153.18±51.23) aswell as for the ADHDcom (t(32)=2.61; pb .05; Cohen's d=−.89|;RT_STDADHDcom=142.58±39.22) subgroups.
Regarding the three attention networks repeated measure ANO-VAS indicated that independent of group comparisons an alerting(ALERTING: F(1,42)=45.33, pb .001, part. η2= .52), orienting(ORIENTING: F(1,42)=45.44, pb .001, part. η2=.52) and conflict(ORIENTING: F(1,42)=312.83, pb .001, part. η2=.88) effect werepresent in the data. This shows that despite the longer cue-targetinterval in our version of the ANT reaction time was modulated asintended by the ANT.
However, regarding group comparisons based on these networkmeasures no differences between groups were observed for thealerting (ALERTING * GROUP: F(1,42)=2.60, p=.11, n.s.), orienting(ORIENTING * GROUP: F(1,42)=.02, n.s.), or conflict score (CONFLICT *GROUP: F(1,42)=1.48, n.s.) though the significance value for thealerting score was close to the p=.10 level.
3.2. Event-related potential measures
3.2.1. Group independent ERP analysis of network effectsIndependent of group comparisons, network effects were present
in our data indicating that the ANT also exerts network relatedmodulating effects on ERP measures.
At the level of cue-P3mean amplitudes at Pz, an orienting effect wasobserved as smaller mean amplitudes were present in the NeutralCuecompared to the SpatialCue condition (ORIENTING: F(1,42)=35.10,pb .001, part. η2=.46).
For the target-P3 analysis at Pz, no alerting effect was observed(TARGET-CUE 1: F(1,42)=2.15, n.s.). An orienting effect was reflectedin larger mean amplitudes in the neutral compared to the spatialcondition (TARGET-CUE 2: F(1,42)=12.03, p=.001, part. η2=.22).In addition, a conflict effect was observed, i.e. mean amplitudes in thecongruent condition were smaller than in the incongruent condition(CONFLICT: F(1,42)=8.76, pb .01, part. η2=.17).

ADHD ControlsµV
-5
-10
µV
-
-5
-10-
0 0 Frontal negativecomponents (Fz)
-5
µV-
-5
µV-
5
0 500 1000
+ms
Target 5
0 500 1000ms
+ Target
Target-P3 (Pz)
10
5
0
10
5
0
20
15
0 500 1000ms+ Target
20
15
0 500 1000ms+ Target
Fig. 3. Grand average ERPs during the ANT for target processing in children with ADHD (left) and typically developing children (right). Top: ERPs at electrode Fz. The first two smallvertical lines above the x-axis indicate the time window for the earlier frontal negative component analysis and the second two small vertical lines for the later frontal negativecomponent analysis. Bottom: ERPs at electrode Pz. The two small vertical lines above the x-axis indicate the time window on which the target-P3 analysis is based. Task blocks withcongruent and incongruent trials are depicted as black and red lines respectively. The target appeared at 0 ms. Negative amplitude values are plotted upwards. Spline-interpolatedmaps illustrate the topography of the components (top: later frontal negative component, bottom: target-P3;) in the incongruent condition. Blue and red colors indicate negative andpositive amplitude values respectively in a range from −10 to 25 μV for later frontal negative component amplitudes and in a range from −25 to 25 μV for target-P3 amplitudes.
87O. Kratz et al. / International Journal of Psychophysiology 81 (2011) 82–90
As no CNV is elicited without a cue stimulus, for CNV analysis onlythe orienting network is considered. Larger CNV mean amplitudes atCz were visible in the SpatialCue compared to the NeutralCuecondition (ORIENTING: F(1,42)=12.82, p=.001, part. η2=.23).
While for the earlier frontal negative component no conflict effectwasobtained (CONFLICT: F(1,42)=.29, n.s.), a conflict effect was present forthe later frontal negative component (CONFLICT: F(1,42)=9.97, pb .01,
Table 2Performance measures of the ANT for both groups.
Children with ADHD Controls
Number of hitsHits all 173.4±17.9 175.1±17.2Hits NoCue 59.36±4.98 60.37±4.63Hits NeutralCue 57.08±6.70 57.63±7.40Hits SpatialCue 57.00±7.31 57.11±6.28Hits congruent 91.72±4.60 91.79±5.94Hits incongruent 81.72±14.14 83.32±11.63
Reaction time measuresRT (ms) 567.0±124.2 508.3±70.2RT_STD (ms) 146.8±43.7 112.0±29.0RT NoCue (ms) 598.34±135.03 531.16±77.02RT NeutralCue (ms) 560.42±124.94 507.90±73.48RT SpatialCue (ms) 532.82±122.39 479.08±73.98RT Congruent (ms) 527.76±126.17 471.97±76.56RT Incongruent (ms) 607.94±123.46 541.84±67.44Alerting (ms) 37.9±34.1 23.3±23.0Orienting (ms) 27.6±27.9 28.8±27.0Conflict (ms) 80.2±27.4 69.9±28.5
Group mean values±standard deviations are depicted. The total number of trials (andthus, the maximum number of hits) was 192. For each cue condition, 64 trials werepresented. The task comprised 96 congruent and 96 incongruent trials. RT: median ofreaction time, RT_STD: variability of reaction times.
part. η2=.19) related to larger amplitudes in the congruent compared tothe incongruent condition.
3.2.2. Group comparisons: cue-P3For the mean cue-P3 amplitudes at electrode Pz (see Fig. 2), the
ANOVA revealed a significantGROUPeffect (F(1,42)=10.00; pb .01; part.η2=.19) indicating smaller mean cue-P3 amplitudes in ADHD. Nosignificant ORIENTING * GROUP interaction was obtained (F(1,42)=.24,n.s.).
A post-hoc analysis for both subgroups revealed a comparable resultpattern with respect to reported group differences. In the ADHDin andADHDcom analysis a significant effect for GROUP (ADHDin: F(1,27)=8.69; p=.01; part. η2=.24; ADHDcom: F(1,32)=5.09; pb .05; part.η2=.14) was obtained.
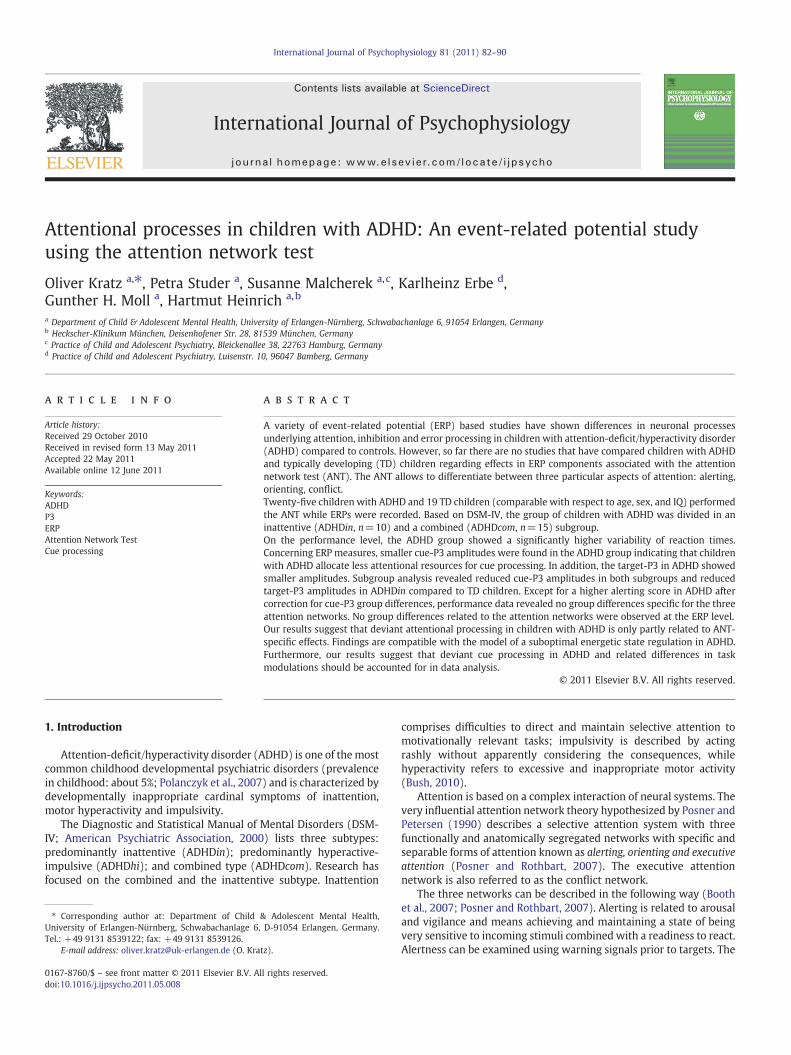
Smaller cue-P3 amplitudes in children with ADHD indicated thatthey allocated less attentional resources for cue processing, rathersuggesting an inefficient use of cue stimuli, which should beassociated with a smaller alerting score at the performance level(Fan and Posner, 2004; see also Introduction section). However, atendency (p=.11) for a higher alerting score in ADHD was present(see 3.1 Performance measures) which is consistent with Fan andPosner (2004) who suggest that a higher alerting score could be dueto difficulties in maintaining alertness without a cue and thus indicateweaker alerting. Both aspects have to be considered when evaluatingthe alerting network in children with ADHD.
Therefore, we computed a forward logistic regression model(outcome variable: group) entering mean cue-P3 amplitudes of theNeutralCue condition at Pz and the RT measure of the alertingnetwork (alerting score) into the analysis. Both parameters turned outto be significant (cue-P3: B=−.43, pb .01; alerting: B=.04, pb .05)with opposite sign. Thus, the post-hoc analysis revealed a significantlyhigher alerting score (after controlling for cue-P3 amplitudes) inchildren with ADHD (see also Fig. 4).
50
75
100 ADHDControls
0
25
Ale
rtin
g sc
ore
(ms)
-50
-25
-5 0 5 10
Cue-P3 (Pz, NeutralCue, µV)
Fig. 4. Scatterplot ANT alerting score vs. cue-P3 amplitude (Pz, NeutralCue trials): Forcomparable cue-P3 amplitudes, the alerting score of a child with ADHD wassignificantly higher compared to a child of the control group. Red rectangles: childrenwith ADHD; blue, open rectangles: TD children (controls).
88 O. Kratz et al. / International Journal of Psychophysiology 81 (2011) 82–90
3.2.3. Group comparisons: target-P3For the target-P3 at electrode Pz (see Fig. 3), the ANOVA related to
the alerting network found a significant GROUP effect (F(1,42)=4.97;pb .05; part. η2=.11) indicating smaller mean amplitudes in ADHDcompared to controls. Moreover, a trendwas present for the ALERTING*GROUP interaction (F(1,42)=3.78; pb .10; part. η2=.08) due tosmaller mean target-P3 amplitudes in the NeutralCue compared to theNoCue condition in controls (t(18)=−3.35, pb .01) in contrast toADHD (t(24)=.31, n.s.). The post-hoc analysis revealed a similarpattern forADHDin: a significant effect for groupwasobserved (GROUP:F(1,27)=6.66; pb .05; part. η2=.20) together with a trend for theALERTING*GROUP interaction (F(1,27)=3.88; pb .10; part. η2=.13).These group differences were not obtained for ADHDcom (GROUP:F(1,32)=1.15; n.s.; ALERTING* GROUP: F(1,32)=2.65, n.s.).
The target-P3 analysis at electrode Pz related to the orienting networkrevealed a trend for group differences in mean target-P3 amplitudes(GROUP: F(1,42)=3.70; pb .10; part. η2=.08) while no significantORIENTING* GROUP interaction was obtained (F(1,42)=.01, n.s.). Thepost-hoc analysis revealed a similar pattern for ADHDin: a significanteffect for group was observed (GROUP: F(1,27)=5.82; pb .05; part.η2=.18) but no group differences in orienting (ORIENTING* GROUP:F(1,27)=.01, n.s.). ForADHDcomnodifferenceswere obtained (GROUP:F(1,32)=.66; n.s.; ORIENTING* GROUP: F(1,32)=.05, n.s.).
Correspondingly, also for the ANOVA related to the conflict networksignificant group differences were present (GROUP (F(1,42)=4.64;pb .05; part. η2=.10), i.e. smaller mean target-P3 amplitudes werefound in ADHD. The CONFLICT * GROUP interaction was not significant(F(1,42)=.79, n.s.). Post-hoc analysis revealed that the GROUP effectwas due to differences betweenADHDin and the control group (GROUP:F(1,27)=6.48; pb .05; part. η2=.19) while no differences wereobtained for ADHDcom (GROUP: F(1,32)=1.05, n.s.).
3.2.4. Group comparisons: CNVFor the CNV at electrode Cz (see Fig. 2), the repeated measure
ANOVA revealed no significant effect for GROUP (F(1,42)=.30; n.s.)and no significant ORIENTING * GROUP interaction (F(1,42)=.80;n.s.).
3.2.5. Group comparisons: frontal negative componentsThe ANOVA for the earlier frontal negative component at Fz (see
Fig. 3) neither yielded a significant GROUP effect: F(1,42)=1.05, n.s.)nor a significant CONFLICT * GROUP: interaction (F(1,42)=.51, n.s.).
For the later frontal negative wave (see Fig. 3) also no significantCONFLICT * GROUP interaction was observed (F(1,42)=.42, n.s.).However, a significant GROUP effect was present (F(1,42)=4.87;
pb .05; part. η2=.10) related to more negative mean amplitudes inADHD. For both subgroups a trend for group differences compared tothe control group was revealed (ADHDcom: GROUP: F(1,32)=3.43;pb .10; part. η2=.10; ADHDin: GROUP: F(1,27)=3.91; pb .10; part.η2=.13).
4. Discussion
Comparing attentional functioning of children with ADHD and TDchildren during the ANT revealed several group differences in bothperformance measures and ERP components.
The results may have been influenced by the fact that an expenseallowance of 20 € was only given to the families of the TD group. Onthe other hand, children of the ADHD group had the same hit ratemaking differences in reward-dependingmotivation between the twogroups rather unlikely.
4.1. Attention networks
On the performance level, the calculation of correspondingreaction time differences revealed no group differences betweenADHD and TD children related to the alerting, orienting or conflictnetwork. These results are in line with Booth et al. (2007) andAdolfsdottir et al. (2008) and in contrast to other findings (Johnson etal., 2008; Konrad et al., 2006; Mullane et al., 2011).
Our ERP measures also did not display group effects regarding thethree attention networks when comparing the results of the childrenwith ADHD and controls.
Analysis of the target-P3 revealed smaller amplitudes, but failed todisplay specific ADHD related deficits in any of the three attentionnetworks. Similarly, group differences were revealed for the laterfrontal negative component without being specific for any attentionnetwork. Concerning the CNV and the earlier frontal negativecomponent, we neither found differences between ADHD and TDchildren nor group differences in any of the three attention networks.
Yet, the possible role of smaller cue-P3 amplitudes in ADHD leadsto an interesting consideration. Smaller cue-P3 amplitudes are arobust finding in children with ADHD, which has also been describedin several ERP studies using a cued CPT (Banaschewski et al., 2003;Brandeis et al., 2002; van Leeuwen et al., 1998). This finding indicatesthat children with ADHD allocate less attentional resources for theprocessing of cues. Hence, these children may make less efficient useof a warning stimulus which, at the performance level, would beassociated with a smaller alerting score (Fan and Posner, 2004).
On the other hand, the less alert a subject is, the larger the alertingeffect of a cue stimulus can possibly be. In this respect, some of theprevious ANT studies had reported a higher alerting score in childrenwith ADHD indicating weaker alerting in children with ADHD(Johnson et al., 2008; Mullane et al., 2011). In our study, there wasa tendency (p=0.11) for a higher alerting score in children withADHD. However, as outlined above, the alerting score is also affectedby cue processing.
Applying a logistic regression analysis, we intended to disentangleboth aspects contributing to the alerting score in an opposite way(inefficient use of cue stimuli, difficulties in maintaining alertness).The cue-P3 and the alerting score (controlled for cue-P3 effects) weresignificant predictor variables, i.e. that both factors contributedsignificantly to differentiate between TD children and children withADHD (see Fig. 4). Thus, our study provides evidence that, on the onehand, childrenwith ADHDmay use cue stimuli less efficiently but that,on the other hand, a cue stimulus seems to be more crucial forchildren with ADHD to maintain an alert/attentive state, to reducelapses in attention (Spencer et al., 2009) and to enhance targetperformance.
Overall, the comparability of different ANT-based studies appearsto be limited due to methodological differences, which might
89O. Kratz et al. / International Journal of Psychophysiology 81 (2011) 82–90
contribute to mixed results in the literature. Konrad (2006) reporteddeficits in executive attention in ADHD using a modified ANT version,while Mullane (2011) showed weaker alerting and executiveattention in ADHD using auditory instead of visual cues, and Johnsonet al. (2008) observed deficits in the alerting and conflict networkbased on a modified calculation method.
The IQ of the participants as a factor for variable ANT results hasbeen discussed by Mullane and colleagues (2011), however both asample with higher (Booth et al., 2007) and lower IQ (Adolfsdottir etal., 2008) did not show group differences related to the attentionnetworks. In our opinion, IQ cannot explain the mixed results.
Although Johnson and colleagues (2008) observed deficits in thealerting and conflict network in ADHD, they concluded that sensitivityto the ANT manipulations was relatively poor and that rathervariability provides a sensitive marker of a cognitive dysfunction inADHD. This dysfunction is reflected on a more general level and notwithin discrete cognitive systems. This is a notion strongly supportedby Adolfsdottir and colleagues (2008). Our findings point in the samedirection as group differences observed were only partly – and onlydue to special considerations - related to the attention networks whilerobust differences were observed on a more general level (e.g. RTvariability, cue-P3 amplitudes).
4.2. State regulation
Group comparisons on the performance level independent of theattention networks revealed a higher variability of reaction times inADHD (overall and in both subtypes) compared to TD children whichis in line with previous ANT findings (e.g. Adolfsdottir et al., 2008;Johnson et al., 2008). Increased reaction time variability might reflectfluctuating topdown attentional control and deficits in sustainedattention (Johnson et al., 2007). Variable responding, as seen in ourbehavioural results, might be explained by lapses of attention(Spencer et al., 2009) which in turn influence attention allocation.
Increased variability in response time performance on cognitivetasks is one of the most consistent findings in research into ADHD(Johnson et al., 2007). Furthermore, increased reaction time variabil-ity is consistent with explanatory accounts of ADHD that emphasizesuboptimal energetic state regulation (Johnson et al., 2007; Sergeant,2005) as variable reaction times are thought to be related to aninability to maintain an optimal level of arousal (Johnstone et al.,2010).
In contrast to other ANT studies (Adolfsdottir et al., 2008; Konradet al., 2006; Mullane et al., 2011) we did not find group differencesregarding the number of correct responses. Yet, e.g. in the study ofAdolfsdottir and colleagues (2008) IQ of the ADHD group was ratherlow which might explain the higher error rates in ADHD observed intheir study.
On the ERP level, our data revealed both reduced cue- and target-P3 amplitudes in ADHD. Smaller P3 amplitudes reflect a reducedamount of attention allocated to stimulus processing and evaluation(Banaschewski et al., 2003). This result points to a more generaldeficit in attentional resource allocation in ADHD. Attentionalprocesses appeared to be qualitatively altered with the main deficitobserved during cue processing, i.e. during attentional preparation.This hypothesis of a more general attentional dysfunction in ADHD isin line with several ERP studies (Banaschewski et al., 2003; Wiersemaet al., 2006a; Wiersema et al., 2006b) that related their findings ofreduced P3 amplitudes to suboptimal energetic state regulation(Sergeant, 2000; Sergeant, 2005).
In target trials, two frontal negative components could beidentified in the time-window of 200–450 ms with the secondcomponent indicating a conflict effect (i.e., more negative inincongruent compared to congruent trials). This second frontalnegative component/N2 was generally larger in children withADHD, comparable to the results of Jonkman et al. (2007) though
results are not consistent in the literature (Wild-Wall et al., 2009). Noconflict-specific N2 effect with respect to ADHD could be detected(neither a conflict-specific P3 effect). Correspondingly, on theperformance level, the conflict score did not differ significantlybetween children with ADHD and controls. Thus, using our version ofthe ANT with child friendly stimuli, no evidence was obtained for adeficit in conflict monitoring and resolution in children with ADHD incontrast to other ERP studies using flanker tasks (Albrecht et al., 2008;Johnstone et al., 2009; Johnstone et al., 2010; Wild-Wall et al., 2009)who observed a reduced N2 in ADHD for incongruent trials.
Besides the characteristics of the stimuli, task demands may alsoaccount for the mixed N2 results. In a flanker task, Albrecht et al.(2008) observed a reduced N2 enhancement in the incongruentcompared to the congruent condition in children with ADHDcompared to controls. In their task, an adaptive feedback procedurewas used to control the number of correct congruent and incongruentresponses in combinationwith the speed of responses, thus increasingthe demands for the participants.
Regarding the CNV, we did not observe significant groupdifferences between ADHD and controls (though it tended to besmaller in children with ADHD). In contrast, the majority of otherstudies reported an attenuation of the CNV in CPT tasks in childrenwith ADHD (for a review see Banaschewski and Brandeis, 2007) thuspointing towards impaired preparatory processes following cues.
The young age of the children and the small sample size might be areason for missing CNV differences in our study. In a CPT study(Doehnert et al., 2010), the CNV was observed to be smaller for olderchildren with ADHD (mean age about 12 years) compared to controlswhile the CNV did not significantly differ for younger children (meanage about 10.5 years) which are of a similar age as the children in ourstudy. The CNV in our study corresponds to the late CNV described inother studies, which is described to be mature at about the age of10 years (Doehnert et al., 2010; Jonkman et al., 2003). As the childrenof our sample (mean age: 10 years) lie around this maturation areathe number of children with a mature late CNV may be too small toobtain significant CNV group differences. In addition, the data ofBender et al. (2005) show that the late CNV at Cz increases with agefrom 6 to 18 years in addition to showing that from 12 years themaximum of the CNV lies at central electrode sites while for youngerchildren CNV topography is different, e.g. more lateralized.
In this respect, the model of suboptimal energetic state regulationin ADHD with respect to response preparation processes(Banaschewski et al., 2003; Sergeant, 2005) could not be supportedby our CNV-results possibly due to the young age of our sample.
Overall, especially our P3 findings support the model of sub-optimal energetic state regulation in ADHD.
4.3. ADHD subtypes
Comparing ADHD and controls, a subgroup analysis of our datarevealed a reduced cue-P3 in both ADHD subgroups whereas areduced target-P3 was only present for ADHDin. In a go/no-go taskwith adults, Rodriguez and Baylis (2007) also reported reducedtarget-P3 amplitudes in ADHDin compared to controls, but not inADHDcom.
The ADHDin in our study had a significantly lower IQ than thecontrol group. For this reason we performed additional analyses inwhich we matched the IQ of the inattentive subgroup and the controlgroup by reducing the size of the control group. Despite small groupsizes (ADHDin: n=10, controls: n=12) statistics revealed the sameeffects as those obtained for the original groups with differing IQs. Forthis reason, we assume that IQ was not responsible for effectsconcerning this subgroup.
As both subgroups displayed deviant cue processing this repre-sents a central result of our study. This view corresponds to vanLeeuwen and colleagues (1998) who concluded that impaired

90 O. Kratz et al. / International Journal of Psychophysiology 81 (2011) 82–90
orienting to cues rather than impaired executive target processingwas displayed in children with ADHD.
5. Conclusion
Deviant attentional processing in ADHD was only partly related todistinct attention network effects. Robust differences both inperformance as well as ERP measures were rather observed on amore basic level and thus support the model of suboptimal energeticstate regulation in ADHD. Future studies with larger samples shouldaccount for the heterogeneity of ADHD by including subgroups andcomorbidities in order to shed more light onto the so far mixedresults.
Acknowledgements
We would like to thank Martin Deinzer and Jeska Baack for theirvaluable support.
References
Adolfsdottir, S., Sorensen, L., Lundervold, A.J., 2008. The attention network test: acharacteristic pattern of deficits in children with ADHD. Behav. Brain Funct. 4, 9.
Albrecht, B., Brandeis, D., Uebel, H., Heinrich, H., Mueller, U.C., Hasselhorn, M.,Steinhausen, H.C., Rothenberger, A., Banaschewski, T., 2008. Action monitoring inboys with attention-deficit/hyperactivity disorder, their nonaffected siblings, andnormal control subjects: evidence for an endophenotype. Biol. Psychiatry 64,615–625.
American Psychiatric Association, 2000. Diagnostic and Statistical Manual of MentalDisorders. American Psychiatric Press, Washington DC.
Banaschewski, T., Brandeis, D., 2007. Annotation: what electrical brain activity tells usabout brain function that other techniques cannot tell us – a child psychiatricperspective. J. Child Psychol. Psychiatry 48, 415–435.
Banaschewski, T., Brandeis, D., Heinrich, H., Albrecht, B., Brunner, E., Rothenberger, A.,2003. Association of ADHD and conduct disorder–brain electrical evidence for theexistence of a distinct subtype. J. Child Psychol. Psychiatry 44, 356–376.
Banaschewski, T., Yordanova, J., Kolev, V., Heinrich, H., Albrecht, B., Rothenberger, A.,2008. Stimulus context and motor preparation in attention-deficit/hyperactivitydisorder. Biol. Psychol. 77, 53–62.
Barry, R.J., Johnstone, S.J., Clarke, A.R., 2003. A review of electrophysiology in attention-deficit/hyperactivity disorder: II. Event-related potentials. Clin. Neurophysiol. 114,184–198.
Bender, S., Weisbrod, M., Bornfleth, H., Resch, F., Oelkers-Ax, R., 2005. How do childrenprepare to react? Imaging maturation of motor preparation and stimulusanticipation by late contingent negative variation. NeuroImage 27, 737–752.
Benikos, N., Johnstone, S.J., 2009. Arousal-state modulation in children with AD/HD.Clin. Neurophysiol. 120, 30–40.
Booth, J.E., Carlson, C.L., Tucker, D.M., 2007. Performance on a neurocognitive measureof alerting differentiates ADHD combined and inattentive subtypes: a preliminaryreport. Arch. Clin. Neuropsychol. 22, 423–432.
Brandeis, D., Banaschewski, T., Baving, L., Georgiewa, P., Blanz, B., Warnke, A.,Steinhausen, H.C., Rothenberger, A., Scheuerpflug, P., 2002. Multicenter P300brain mapping of impaired attention to cues in hyperkinetic children. J. Am. Acad.Child Adolesc. Psychiatry 41, 990–998.
Brandeis, D., van Leeuwen, T.H., Rubia, K., Vitacco, D., Steger, J., Pascual-Marqui, R.D.,Steinhausen, H.C., 1998. Neuroelectric mapping reveals precursor of stop failures inchildren with attention deficits. Behav. Brain Res. 94, 111–125.
Bush, G., 2010. Attention-deficit/hyperactivity disorder and attention networks.Neuropsychopharmacology 35, 278–300.
Cohen, J.D., 1988. Statistical power analysis for the behavioral sciences, 2nd ed.Erlbaum, Hillsdale, New York.
Doehnert, M., Brandeis, D., Imhof, K., Drechsler, R., Steinhausen, H.C., 2010. Mappingattention-deficit/hyperactivity disorder from childhood to adolescence–no neuro-physiologic evidence for a developmental lag of attention but some for inhibition.Biol. Psychiatry 67, 608–616.
Döpfner, M., Lehmkuhl, G., 2000. DISYPS_KJ_ Diagnostik-System für psychischeStörungen im Kindes- und Jugendalter. Hans Huber, Bern.
Eriksen, B.A., Eriksen, C.W., 1974. Effects of noise letters upon the identification of atarget letter in a nonsearch task. Percept. Psychophys. 16, 143–149.
Fan, J., McCandliss, B.D., Sommer, T., Raz, A., Posner, M.I., 2002. Testing theefficiency and independence of attentional networks. J. Cogn. Neurosci. 14,340–347.
Fan, J., Posner, M., 2004. Human attentional networks. Psychiatr. Prax. 31 (Suppl. 2),S210–S214.
Groom, M.J., Scerif, G., Liddle, P.F., Batty, M.J., Liddle, E.B., Roberts, K.L., Cahill, J.D., Liotti,M., Hollis, C., 2009. Effects of motivation and medication on electrophysiologicalmarkers of response inhibition in children with attention-deficit/hyperactivitydisorder. Biol. Psychiatry 67, 624–631.
Johnson, K.A., Kelly, S.P., Bellgrove, M.A., Barry, E., Cox, M., Gill, M., Robertson, I.H., 2007.Response variability in attention deficit hyperactivity disorder: evidence forneuropsychological heterogeneity. Neuropsychologia 45, 630–638.
Johnson, K.A., Robertson, I.H., Barry, E., Mulligan, A., Daibhis, A., Daly, M., Watchorn, A.,Gill, M., Bellgrove, M.A., 2008. Impaired conflict resolution and alerting in childrenwith ADHD: evidence from the Attention Network Task (ANT). J. Child Psychol.Psychiatry 49, 1339–1347.
Johnstone, S.J., Barry, R.J., Markovska, V., Dimoska, A., Clarke, A.R., 2009. Responseinhibition and interference control in children with AD/HD: a visual ERPinvestigation. Int. J. Psychophysiol. 72, 145–153.
Johnstone, S.J., Watt, A.J., Dimoska, A., 2010. Varying required effort during interferencecontrol in children with AD/HD: task performance and ERPs. Int. J. Psychophysiol.76, 174–185.
Jonkman, L.M., Lansbergen, M., Stauder, J.E., 2003. Developmental differences inbehavioral and event-related brain responses associated with response preparationand inhibition in a go/nogo task. Psychophysiology 40, 752–761.
Jonkman, L.M., vanMelis, J.J., Kemner, C., Markus, C.R., 2007. Methylphenidate improvesdeficient error evaluation in children with ADHD: an event-related brain potentialstudy. Biol. Psychol. 76, 217–229.
Jung, T.P., Makeig, S., Westerfield, M., Townsend, J., Courchesne, E., Sejnowski, T.J., 2000.Removal of eye activity artifacts from visual event-related potentials in normal andclinical subjects. Clin. Neurophysiol. 111, 1745–1758.
Kok, A., 2001. On the utility of P3 amplitude as a measure of processing capacity.Psychophysiology 38, 557–577.
Konrad, K., Neufang, S., Hanisch, C., Fink, G.R., Herpertz-Dahlmann, B., 2006.Dysfunctional attentional networks in children with attention deficit/hyperactivitydisorder: evidence from an event-related functional magnetic resonance imagingstudy. Biol. Psychiatry 59, 643–651.
Kopp, B., Rist, F., Mattler, U., 1996. N200 in the flanker task as a neurobehavioral tool forinvestigating executive control. Psychophysiology 33, 282–294.
McCallum, W.C., Cooper, R., Pocock, P.V., 1988. Brain slow potential and ERP changesassociated with operator load in a visual tracking task. Electroencephalogr. Clin.Neurophysiol. 69, 453–468.
Mullane, J.C., Corkum, P.V., Klein, R.M., McLaughlin, E.N., Lawrence, M.A., 2011. Alerting,orienting, and executive attention in children With ADHD. J. Atten. Disord. 15 (4),310–320.
Neuhaus, A.H., Urbanek, C., Opgen-Rhein, C., Hahn, E., Ta, T.M., Koehler, S., Gross, M.,Dettling, M., 2010. Event-related potentials associated with Attention NetworkTest. Int. J. Psychophysiol. 76, 72–79.
Overtoom, C.C., Verbaten, M.N., Kemner, C., Kenemans, J.L., van Engeland, H., Buitelaar, J.K.,Camfferman, G., Koelega, H.S., 1998. Associations between event-related potentials andmeasures of attention and inhibition in the Continuous Performance Task in childrenwith ADHD and normal controls. J Am Acad Child Adolesc Psychiatry 37 (9), 977–985.
Polanczyk, G., de Lima, M.S., Horta, B.L., Biederman, J., Rohde, L.A., 2007. The worldwideprevalence of ADHD: a systematic review and metaregression analysis. Am. J.Psychiatry 164, 942–948.
Posner, M.I., 1980. Orienting of attention. Q. J. Exp. Psychol. 32, 3–25.Posner, M.I., Petersen, S.E., 1990. The attention system of the human brain. Annu. Rev.
Neurosci. 13, 25–42.Posner, M.I., Rothbart, M.K., 2007. Research on attention networks as a model for the
integration of psychological science. Annu. Rev. Psychol. 58, 1–23.Rodriguez, P.D., Baylis, G.C., 2007. Activation of brain attention systems in individuals
with symptoms of ADHD. Behav. Neurol. 18, 115–130.Rueda,M.R., Fan, J.,McCandliss, B.D.,Halparin, J.D.,Gruber,D.B., Lercari, L.P., Posner,M.I., 2004.
Development of attentional networks in childhood. Neuropsychologia 42, 1029–1040.Sartory, G., Heine, A., Müller, B.W., Elvermann-Hallner, A., 2002. Event- and motor-
related potentials during the continuous performance task in attention-deficit/hyperactivity disorder. J. Psychophysiol. 16, 97–106.
Sergeant, J., 2000. The cognitive-energetic model: an empirical approach to attention-deficit hyperactivity disorder. Neurosci. Biobehav. Rev. 24, 7–12.
Sergeant, J.A., 2005. Modeling attention-deficit/hyperactivity disorder: a criticalappraisal of the cognitive-energetic model. Biol. Psychiatry 57, 1248–1255.
Spencer, S.V., Hawk Jr., L.W., Richards, J.B., Shiels, K., Pelham Jr., W.E., Waxmonsky, J.G.,2009. Stimulant treatment reduces lapses in attention among children with ADHD:the effects of methylphenidate on intra-individual response time distributions. J.Abnorm. Child Psychol. 37, 805–816.
Spronk, M., Jonkman, L.M., Kemner, C., 2008. Response inhibition and attentionprocessing in 5- to 7-year-old children with and without symptoms of ADHD: AnERP study. Clin. Neurophysiol. 119, 2738–2752.
Strandburg, R.J., Marsh, J.T., Brown, W.S., Asarnow, R.F., Higa, J., Harper, R., Guthrie, D.,1996. Continuous-processing-related event-related potentials in children withattention deficit hyperactivity disorder. Biol. Psychiatry 40, 964–980.
van Leeuwen, T.H., Steinhausen, H.C., Overtoom, C.C., Pascual-Marqui, R.D., van'tKlooster, B., Rothenberger, A., Sergeant, J.A., Brandeis, D., 1998. The continuousperformance test revisited with neuroelectric mapping: impaired orienting inchildren with attention deficits. Behav. Brain Res. 94, 97–110.
Wangler, S., Gevensleben, H., Albrecht, B., Studer, P., Rothenberger, A., Moll, G.H., Heinrich,H., 2011. Neurofeedback in children with ADHD: specific event-related potentialfindings of a randomized controlled trial. Clin. Neurophysiol. 122, 942–950.
Wiersema, R., van der Meere, J., Antrop, I., Roeyers, H., 2006a. State regulation in adultADHD: an event-related potential study. J. Clin. Exp. Neuropsychol. 28, 1113–1126.
Wiersema, R., van der Meere, J., Roeyers, H., Van Coster, R., Baeyens, D., 2006b. Eventrate and event-related potentials in ADHD. J. Child Psychol. Psychiatry 47, 560–567.
Wild-Wall, N., Oades, R.D., Schmidt-Wessels, M., Christiansen, H., Falkenstein, M., 2009.Neural activity associated with executive functions in adolescents with attention-deficit/hyperactivity disorder (ADHD). Int. J. Psychophysiol. 74, 19–27.