documentation trace ftrace
TRANSCRIPT

8/6/2019 Documentation Trace Ftrace
http://slidepdf.com/reader/full/documentation-trace-ftrace 1/30
1 ftrace Function Tracer========================
Copyright 2008 Red Hat Inc.5 Author: Steven Rostedt <[email protected]>
License: The GNU Free Documentation License, Version 1.2(dual licensed under the GPL v2)
Reviewers: Elias Oltmanns, Randy Dunlap, Andrew Morton,John Kacur, and David Teigland.
10
Written for: 2.6.28 rc2
Introduction
15 Ftrace is an internal tracer designed to help out developers anddesigners of systems to find what is going on inside the kernel.It can be used for debugging or analyzing latencies andperformance issues that take place outside of user space.
20 Although ftrace is the function tracer, it also includes aninfrastructure that allows for other types of tracing. Some of the tracers that are currently in ftrace include a tracer to
trace context switches, the time it takes for a high prioritytask to run after it was woken up, the time interrupts are
25 disabled, and more (ftrace allows for tracer plugins, whichmeans that the list of tracers can always grow).
Implementation Details30
See ftrace design.txt for details for arch porters and such.
35 The File System
Ftrace uses the debugfs file system to hold the control files aswell as the files to display output.
40
When debugfs is configured into the kernel (which selecting any ftraceoption will do) the directory /sys/kernel/debug will be created. To mountthis directory, you can add to your /etc/fstab file:
45 debugfs /sys/kernel/debug debugfs defaults 0 0
Or you can mount it at run time with:
mount t debugfs nodev /sys/kernel/debug50
For quicker access to that directory you may want to make a soft link toit:
ln s /sys/kernel/debug /debug55
Any selected ftrace option will also create a directory called tracingwithin the debugfs. The rest of the document will assume that you are inthe ftrace directory (cd /sys/kernel/debug/tracing) and will only concentrateon the files within that directory and not distract from the content with
60 the extended "/sys/kernel/debug/tracing" path name.
That’s it! (assuming that you have ftrace configured into your kernel)
linux/Documentation/trace/ftrace.txt (v2.6.39) 1

8/6/2019 Documentation Trace Ftrace
http://slidepdf.com/reader/full/documentation-trace-ftrace 2/30
After mounting the debugfs, you can see a directory called65 "tracing". This directory contains the control and output files
of ftrace. Here is a list of some of the key files:
Note: all time values are in microseconds.70
current_tracer:
This is used to set or display the current tracerthat is configured.75
available_tracers:
This holds the different types of tracers thathave been compiled into the kernel. The
80 tracers listed here can be configured byechoing their name into current_tracer.
tracing_on:
85 This sets or displays whether writing to the trace
ring buffer is enabled. Echo 0 into this file to disablethe tracer or 1 to enable it.
trace:90
This file holds the output of the trace in a humanreadable format (described below).
trace_pipe:95
The output is the same as the "trace" file but thisfile is meant to be streamed with live tracing.
Reads from this file will block until new data isretrieved. Unlike the "trace" file, this file is a00 consumer. This means reading from this file causes
sequential reads to display more current data. Oncedata is read from this file, it is consumed, andwill not be read again with a sequential read. The"trace" file is static, and if the tracer is not
05 adding more data,they will display the sameinformation every time they are read.
trace_options:
10 This file lets the user control the amount of data
that is displayed in one of the above outputfiles.
tracing_max_latency:15
Some of the tracers record the max latency.For example, the time interrupts are disabled.This time is saved in this file. The max tracewill also be stored, and displayed by "trace".
20 A new max trace will only be recorded if thelatency is greater than the value in thisfile. (in microseconds)
buffer_size_kb:25
This sets or displays the number of kilobytes each CPU
2 linux/Documentation/trace/ftrace.txt (v2.6.39)

8/6/2019 Documentation Trace Ftrace
http://slidepdf.com/reader/full/documentation-trace-ftrace 3/30
buffer can hold. The tracer buffers are the same sizefor each CPU. The displayed number is the size of theCPU buffer and not total size of all buffers. The
130 trace buffers are allocated in pages (blocks of memorythat the kernel uses for allocation, usually 4 KB in size).If the last page allocated has room for more bytesthan requested, the rest of the page will be used,making the actual allocation bigger than requested.
135 ( Note, the size may not be a multiple of the page size
due to buffer management overhead. )
This can only be updated when the current_traceris set to "nop".
140
tracing_cpumask:
This is a mask that lets the user only traceon specified CPUS. The format is a hex string
145 representing the CPUS.
set_ftrace_filter:
When dynamic ftrace is configured in (see the150 section below "dynamic ftrace"), the code is dynamically
modified (code text rewrite) to disable calling of thefunction profiler (mcount). This lets tracing be configuredin with practically no overhead in performance. This alsohas a side effect of enabling or disabling specific functions
155 to be traced. Echoing names of functions into this filewill limit the trace to only those functions.
This interface also allows for commands to be used. See the"Filter commands" section for more details.
160
set_ftrace_notrace:
This has an effect opposite to that of set_ftrace_filter. Any function that is added here will not
165 be traced. If a function exists in both set_ftrace_filterand set_ftrace_notrace, the function will _not_ be traced.
set_ftrace_pid:
170 Have the function tracer only trace a single thread.
set_graph_function:
Set a "trigger" function where tracing should start175 with the function graph tracer (See the section
"dynamic ftrace" for more details).
available_filter_functions:
180 This lists the functions that ftracehas processed and can trace. These are the functionnames that you can pass to "set_ftrace_filter" or"set_ftrace_notrace". (See the section "dynamic ftrace"below for more details.)
185
The Tracers
linux/Documentation/trace/ftrace.txt (v2.6.39) 3

8/6/2019 Documentation Trace Ftrace
http://slidepdf.com/reader/full/documentation-trace-ftrace 4/30
90 Here is the list of current tracers that may be configured.
"function"
Function call tracer to trace all kernel functions.95
"function_graph"
Similar to the function tracer except that the
function tracer probes the functions on their entry00 whereas the function graph tracer traces on both entry
and exit of the functions. It then provides the abilityto draw a graph of function calls similar to C codesource.
05 "irqsoff"
Traces the areas that disable interrupts and savesthe trace with the longest max latency.See tracing_max_latency. When a new max is recorded,
10 it replaces the old trace. It is best to view thistrace with the latency format option enabled.
"preemptoff"
15 Similar to irqsoff but traces and records the amount of time for which preemption is disabled.
"preemptirqsoff"
20 Similar to irqsoff and preemptoff, but traces andrecords the largest time for which irqs and/or preemptionis disabled.
"wakeup"25
Traces and records the max latency that it takes forthe highest priority task to get scheduled afterit has been woken up.
30 "hw branch tracer"
Uses the BTS CPU feature on x86 CPUs to traces allbranches executed.
35 "nop"
This is the "trace nothing" tracer. To remove alltracers from tracing simply echo "nop" intocurrent_tracer.
40
Examples of using the tracer
45 Here are typical examples of using the tracers when controllingthem only with the debugfs interface (without using anyuser land utilities).
Output format:50
Here is an example of the output format of the file "trace"
4 linux/Documentation/trace/ftrace.txt (v2.6.39)

8/6/2019 Documentation Trace Ftrace
http://slidepdf.com/reader/full/documentation-trace-ftrace 5/30
255 # tracer: function## TASK PID CPU# TIMESTAMP FUNCTION# | | | | |
bash 4251 [01] 10152.583854: path_put < path_walk260 bash 4251 [01] 10152.583855: dput < path_put
bash 4251 [01] 10152.583855: _atomic_dec_and_lock < dput
A header is printed with the tracer name that is represented by265 the trace. In this case the tracer is "function". Then a header
showing the format. Task name "bash", the task PID "4251", theCPU that it was running on "01", the timestamp in <secs>.<usecs>format, the function name that was traced "path_put" and theparent function that called this function "path_walk". The
270 timestamp is the time at which the function was entered.
Latency trace format
275 When the latency format option is enabled, the trace file givessomewhat more information to see why a latency happened.Here is a typical trace.
# tracer: irqsoff 280 #
irqsoff latency trace v1.1.5 on 2.6.26 rc8
latency: 97 us, #3/3, CPU#0 | (M:preempt VP:0, KP:0, SP:0 HP:0 #P:2)
285 | task: swapper 0 (uid:0 nice:0 policy:0 rt_prio:0)
=> started at: apic_timer_interrupt=> ended at: do_softirq
290 # _ => CPU## / _ => irqs off # | / _ => need resched# || / _ => hardirq/softirq# ||| / _ => preempt depth
295 # |||| /# ||||| delay# cmd pid ||||| time | caller# \ / ||||| \ | /<idle> 0 0d..1 0us+: trace_hardirqs_off_thunk (apic_timer_interrupt)
300 <idle> 0 0d.s. 97us : __do_softirq (do_softirq)<idle> 0 0d.s1 98us : trace_hardirqs_on (do_softirq)
This shows that the current tracer is "irqsoff" tracing the time305 for which interrupts were disabled. It gives the trace version
and the version of the kernel upon which this was executed on(2.6.26 rc8). Then it displays the max latency in microsecs (97us). The number of trace entries displayed and the total numberrecorded (both are three: #3/3). The type of preemption that was
310 used (PREEMPT). VP, KP, SP, and HP are always zero and arereserved for later use. #P is the number of online CPUS (#P:2).
The task is the process that was running when the latencyoccurred. (swapper pid: 0).
315
linux/Documentation/trace/ftrace.txt (v2.6.39) 5

8/6/2019 Documentation Trace Ftrace
http://slidepdf.com/reader/full/documentation-trace-ftrace 6/30
The start and stop (the functions in which the interrupts weredisabled and enabled respectively) that caused the latencies:
apic_timer_interrupt is where the interrupts were disabled.20 do_softirq is where they were enabled again.
The next lines after the header are the trace itself. The headerexplains which is which.
25
cmd: The name of the process in the trace.
pid: The PID of that process.
CPU#: The CPU which the process was running on.30
irqs off: ’d’ interrupts are disabled. ’.’ otherwise.Note: If the architecture does not support a way to
read the irq flags variable, an ’X’ will alwaysbe printed here.
35
need resched: ’N’ task need_resched is set, ’.’ otherwise.
hardirq/softirq:’H’ hard irq occurred inside a softirq.
40 ’h’ hard irq is running’s’ soft irq is running’.’ normal context.
preempt depth: The level of preempt_disabled45
The above is mostly meaningful for kernel developers.
time: When the latency format option is enabled, the trace fileoutput includes a timestamp relative to the start of the
50 trace. This differs from the output when latency formatis disabled, which includes an absolute timestamp.
delay: This is just to help catch your eye a bit better. Andneeds to be fixed to be only relative to the same CPU.
55 The marks are determined by the difference between thiscurrent trace and the next trace.
’!’ greater than preempt_mark_thresh (default 100)’+’ greater than 1 microsecond’ ’ less than or equal to 1 microsecond.
60
The rest is the same as the ’trace’ file.
trace_options65
The trace_options file is used to control what gets printed inthe trace output. To see what is available, simply cat the file:
70 cat trace_optionsprint parent nosym offset nosym addr noverbose noraw nohex nobin \noblock nostacktrace nosched tree nouserstacktrace nosym userobj
To disable one of the options, echo in the option prepended with
75 "no".
echo noprint parent > trace_options
6 linux/Documentation/trace/ftrace.txt (v2.6.39)
8/6/2019 Documentation Trace Ftrace
http://slidepdf.com/reader/full/documentation-trace-ftrace 7/30
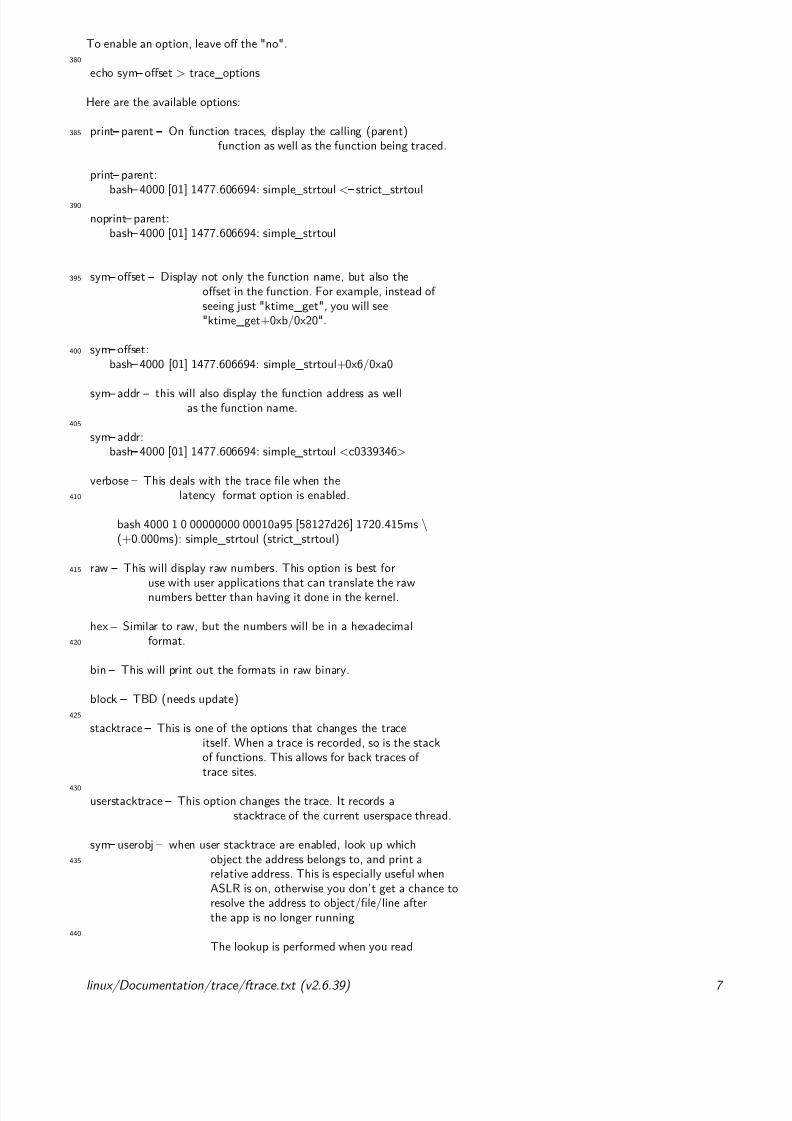
To enable an option, leave off the "no".380
echo sym offset > trace_options
Here are the available options:
385 print parent On function traces, display the calling (parent)function as well as the function being traced.
print parent:bash 4000 [01] 1477.606694: simple_strtoul < strict_strtoul390
noprint parent:bash 4000 [01] 1477.606694: simple_strtoul
395 sym offset Display not only the function name, but also theoffset in the function. For example, instead of seeing just "ktime_get", you will see"ktime_get+0xb/0x20".
400 sym offset:
bash 4000 [01] 1477.606694: simple_strtoul+0x6/0xa0
sym addr this will also display the function address as wellas the function name.
405
sym addr:bash 4000 [01] 1477.606694: simple_strtoul <c0339346>
verbose This deals with the trace file when the410 latency format option is enabled.
bash 4000 1 0 00000000 00010a95 [58127d26] 1720.415ms \
(+0.000ms): simple_strtoul (strict_strtoul)
415 raw This will display raw numbers. This option is best foruse with user applications that can translate the rawnumbers better than having it done in the kernel.
hex Similar to raw, but the numbers will be in a hexadecimal420 format.
bin This will print out the formats in raw binary.
block TBD (needs update)425
stacktrace This is one of the options that changes the traceitself. When a trace is recorded, so is the stackof functions. This allows for back traces of trace sites.
430
userstacktrace This option changes the trace. It records astacktrace of the current userspace thread.
sym userobj when user stacktrace are enabled, look up which435 object the address belongs to, and print a
relative address. This is especially useful whenASLR is on, otherwise you don’t get a chance to
resolve the address to object/file/line afterthe app is no longer running
440
The lookup is performed when you read
linux/Documentation/trace/ftrace.txt (v2.6.39) 7

8/6/2019 Documentation Trace Ftrace
http://slidepdf.com/reader/full/documentation-trace-ftrace 8/30
trace,trace_pipe. Example:
a.out 1623 [000] 40874.465068: /root/a.out[+0x480] < /root/a.out[+045 x494] < /root/a.out[+0x4a8] < /lib/libc 2.7.so[+0x1e1a6]
sched tree trace all tasks that are on the runqueue, atevery scheduling event. Will add overhead if there’s a lot of tasks running at once.
50
latency format This option changes the trace. Whenit is enabled, the trace displaysadditional information about thelatencies, as described in "Latency
55 trace format".
overwrite This controls what happens when the trace buffer isfull. If "1" (default), the oldest events arediscarded and overwritten. If "0", then the newest
60 events are discarded.
ftrace_enabled
65 The following tracers (listed below) give different outputdepending on whether or not the sysctl ftrace_enabled is set. Toset ftrace_enabled, one can either use the sysctl function orset it via the proc file system interface.
70 sysctl kernel.ftrace_enabled=1
or
echo 1 > /proc/sys/kernel/ftrace_enabled75
To disable ftrace_enabled simply replace the ’1’ with ’0’ in theabove commands.
When ftrace_enabled is set the tracers will also record the80 functions that are within the trace. The descriptions of the
tracers will also show an example with ftrace enabled.
irqsoff 85
When interrupts are disabled, the CPU can not react to any otherexternal event (besides NMIs and SMIs). This prevents the timer
interrupt from triggering or the mouse interrupt from letting90 the kernel know of a new mouse event. The result is a latency
with the reaction time.
The irqsoff tracer tracks the time for which interrupts aredisabled. When a new maximum latency is hit, the tracer saves
95 the trace leading up to that latency point so that every time anew maximum is reached, the old saved trace is discarded and thenew trace is saved.
To reset the maximum, echo 0 into tracing_max_latency. Here is00 an example:
# echo irqsoff > current_tracer# echo latency format > trace_options# echo 0 > tracing_max_latency
8 linux/Documentation/trace/ftrace.txt (v2.6.39)

8/6/2019 Documentation Trace Ftrace
http://slidepdf.com/reader/full/documentation-trace-ftrace 9/30
505 # echo 1 > tracing_on# ls ltr[...]# echo 0 > tracing_on# cat trace
510 # tracer: irqsoff #irqsoff latency trace v1.1.5 on 2.6.26
latency: 12 us, #3/3, CPU#1 | (M:preempt VP:0, KP:0, SP:0 HP:0 #P:2)515
| task: bash 3730 (uid:0 nice:0 policy:0 rt_prio:0)
=> started at: sys_setpgid=> ended at: sys_setpgid
520
# _ => CPU## / _ => irqs off # | / _ => need resched# || / _ => hardirq/softirq
525 # ||| / _ => preempt depth# |||| /
# ||||| delay# cmd pid ||||| time | caller# \ / ||||| \ | /
530 bash 3730 1d... 0us : _write_lock_irq (sys_setpgid)bash 3730 1d..1 1us+: _write_unlock_irq (sys_setpgid)bash 3730 1d..2 14us : trace_hardirqs_on (sys_setpgid)
535 Here we see that that we had a latency of 12 microsecs (which isvery good). The _write_lock_irq in sys_setpgid disabledinterrupts. The difference between the 12 and the displayedtimestamp 14us occurred because the clock was incremented
between the time of recording the max latency and the time of 540 recording the function that had that latency.
Note the above example had ftrace_enabled not set. If we set theftrace_enabled, we get a much larger output:
545 # tracer: irqsoff #irqsoff latency trace v1.1.5 on 2.6.26 rc8
latency: 50 us, #101/101, CPU#0 | (M:preempt VP:0, KP:0, SP:0 HP:0 #P:2)550
| task: ls 4339 (uid:0 nice:0 policy:0 rt_prio:0)
=> started at: __alloc_pages_internal=> ended at: __alloc_pages_internal
555
# _ => CPU## / _ => irqs off # | / _ => need resched# || / _ => hardirq/softirq
560 # ||| / _ => preempt depth# |||| /# ||||| delay# cmd pid ||||| time | caller
# \ / ||||| \ | /565 ls 4339 0...1 0us+: get_page_from_freelist (__alloc_pages_internal)
ls 4339 0d..1 3us : rmqueue_bulk (get_page_from_freelist)ls 4339 0d..1 3us : _spin_lock (rmqueue_bulk)
linux/Documentation/trace/ftrace.txt (v2.6.39) 9

8/6/2019 Documentation Trace Ftrace
http://slidepdf.com/reader/full/documentation-trace-ftrace 10/30
ls 4339 0d..1 4us : add_preempt_count (_spin_lock)ls 4339 0d..2 4us : __rmqueue (rmqueue_bulk)
70 ls 4339 0d..2 5us : __rmqueue_smallest (__rmqueue)ls 4339 0d..2 5us : __mod_zone_page_state (__rmqueue_smallest)ls 4339 0d..2 6us : __rmqueue (rmqueue_bulk)ls 4339 0d..2 6us : __rmqueue_smallest (__rmqueue)ls 4339 0d..2 7us : __mod_zone_page_state (__rmqueue_smallest)
75 ls 4339 0d..2 7us : __rmqueue (rmqueue_bulk)ls 4339 0d..2 8us : __rmqueue_smallest (__rmqueue)
[...] ls 4339 0d..2 46us : __rmqueue_smallest (__rmqueue)ls 4339 0d..2 47us : __mod_zone_page_state (__rmqueue_smallest)
80 ls 4339 0d..2 47us : __rmqueue (rmqueue_bulk)ls 4339 0d..2 48us : __rmqueue_smallest (__rmqueue)ls 4339 0d..2 48us : __mod_zone_page_state (__rmqueue_smallest)ls 4339 0d..2 49us : _spin_unlock (rmqueue_bulk)ls 4339 0d..2 49us : sub_preempt_count (_spin_unlock)
85 ls 4339 0d..1 50us : get_page_from_freelist (__alloc_pages_internal)ls 4339 0d..2 51us : trace_hardirqs_on (__alloc_pages_internal)
90 Here we traced a 50 microsecond latency. But we also see all thefunctions that were called during that time. Note that byenabling function tracing, we incur an added overhead. Thisoverhead may extend the latency times. But nevertheless, thistrace has provided some very helpful debugging information.
95
preemptoff
00 When preemption is disabled, we may be able to receiveinterrupts but the task cannot be preempted and a higher
priority task must wait for preemption to be enabled againbefore it can preempt a lower priority task.
05 The preemptoff tracer traces the places that disable preemption.Like the irqsoff tracer, it records the maximum latency forwhich preemption was disabled. The control of preemptoff traceris much like the irqsoff tracer.
10 # echo preemptoff > current_tracer# echo latency format > trace_options# echo 0 > tracing_max_latency# echo 1 > tracing_on# ls ltr
15 [...]# echo 0 > tracing_on# cat trace
# tracer: preemptoff #
20 preemptoff latency trace v1.1.5 on 2.6.26 rc8
latency: 29 us, #3/3, CPU#0 | (M:preempt VP:0, KP:0, SP:0 HP:0 #P:2)
| task: sshd 4261 (uid:0 nice:0 policy:0 rt_prio:0)25
=> started at: do_IRQ
=> ended at: __do_softirq
# _ => CPU#30 # / _ => irqs off
10 linux/Documentation/trace/ftrace.txt (v2.6.39)

8/6/2019 Documentation Trace Ftrace
http://slidepdf.com/reader/full/documentation-trace-ftrace 11/30
# | / _ => need resched# || / _ => hardirq/softirq# ||| / _ => preempt depth# |||| /
635 # ||||| delay# cmd pid ||||| time | caller# \ / ||||| \ | /
sshd 4261 0d.h. 0us+: irq_enter (do_IRQ)sshd 4261 0d.s. 29us : _local_bh_enable (__do_softirq)
640
sshd 4261 0d.s1 30us : trace_preempt_on (__do_softirq)
This has some more changes. Preemption was disabled when aninterrupt came in (notice the ’h’), and was enabled while doing
645 a softirq. (notice the ’s’). But we also see that interruptshave been disabled when entering the preempt off section andleaving it (the ’d’). We do not know if interrupts were enabledin the mean time.
650 # tracer: preemptoff #preemptoff latency trace v1.1.5 on 2.6.26 rc8
latency: 63 us, #87/87, CPU#0 | (M:preempt VP:0, KP:0, SP:0 HP:0 #P:2)655
| task: sshd 4261 (uid:0 nice:0 policy:0 rt_prio:0)
=> started at: remove_wait_queue=> ended at: __do_softirq
660
# _ => CPU## / _ => irqs off # | / _ => need resched# || / _ => hardirq/softirq
665 # ||| / _ => preempt depth# |||| /# ||||| delay# cmd pid ||||| time | caller# \ / ||||| \ | /
670 sshd 4261 0d..1 0us : _spin_lock_irqsave (remove_wait_queue)sshd 4261 0d..1 1us : _spin_unlock_irqrestore (remove_wait_queue)sshd 4261 0d..1 2us : do_IRQ (common_interrupt)sshd 4261 0d..1 2us : irq_enter (do_IRQ)sshd 4261 0d..1 2us : idle_cpu (irq_enter)
675 sshd 4261 0d..1 3us : add_preempt_count (irq_enter)sshd 4261 0d.h1 3us : idle_cpu (irq_enter)sshd 4261 0d.h. 4us : handle_fasteoi_irq (do_IRQ)
[...]sshd 4261 0d.h. 12us : add_preempt_count (_spin_lock)
680 sshd 4261 0d.h1 12us : ack_ioapic_quirk_irq (handle_fasteoi_irq)sshd 4261 0d.h1 13us : move_native_irq (ack_ioapic_quirk_irq)sshd 4261 0d.h1 13us : _spin_unlock (handle_fasteoi_irq)sshd 4261 0d.h1 14us : sub_preempt_count (_spin_unlock)sshd 4261 0d.h1 14us : irq_exit (do_IRQ)
685 sshd 4261 0d.h1 15us : sub_preempt_count (irq_exit)sshd 4261 0d..2 15us : do_softirq (irq_exit)sshd 4261 0d... 15us : __do_softirq (do_softirq)sshd 4261 0d... 16us : __local_bh_disable (__do_softirq)sshd 4261 0d... 16us+: add_preempt_count (__local_bh_disable)
690 sshd 4261 0d.s4 20us : add_preempt_count (__local_bh_disable)sshd 4261 0d.s4 21us : sub_preempt_count (local_bh_enable)sshd 4261 0d.s5 21us : sub_preempt_count (local_bh_enable)
[...]
linux/Documentation/trace/ftrace.txt (v2.6.39) 11

8/6/2019 Documentation Trace Ftrace
http://slidepdf.com/reader/full/documentation-trace-ftrace 12/30
sshd 4261 0d.s6 41us : add_preempt_count (__local_bh_disable)95 sshd 4261 0d.s6 42us : sub_preempt_count (local_bh_enable)
sshd 4261 0d.s7 42us : sub_preempt_count (local_bh_enable)sshd 4261 0d.s5 43us : add_preempt_count (__local_bh_disable)sshd 4261 0d.s5 43us : sub_preempt_count (local_bh_enable_ip)sshd 4261 0d.s6 44us : sub_preempt_count (local_bh_enable_ip)
00 sshd 4261 0d.s5 44us : add_preempt_count (__local_bh_disable)sshd 4261 0d.s5 45us : sub_preempt_count (local_bh_enable)
[...]
sshd 4261 0d.s. 63us : _local_bh_enable (__do_softirq)sshd 4261 0d.s1 64us : trace_preempt_on (__do_softirq)05
The above is an example of the preemptoff trace withftrace_enabled set. Here we see that interrupts were disabledthe entire time. The irq_enter code lets us know that we entered
10 an interrupt ’h’. Before that, the functions being traced stillshow that it is not in an interrupt, but we can see from thefunctions themselves that this is not the case.
Notice that __do_softirq when called does not have a15 preempt_count. It may seem that we missed a preempt enabling.
What really happened is that the preempt count is held on thethread’s stack and we switched to the softirq stack (4K stacksin effect). The code does not copy the preempt count, butbecause interrupts are disabled, we do not need to worry about
20 it. Having a tracer like this is good for letting people knowwhat really happens inside the kernel.
preemptirqsoff 25
Knowing the locations that have interrupts disabled or
preemption disabled for the longest times is helpful. Butsometimes we would like to know when either preemption and/or30 interrupts are disabled.
Consider the following code:
local_irq_disable();35 call_function_with_irqs_off();
preempt_disable();call_function_with_irqs_and_preemption_off();local_irq_enable();call_function_with_preemption_off();
40 preempt_enable();
The irqsoff tracer will record the total length of call_function_with_irqs_off() andcall_function_with_irqs_and_preemption_off().
45
The preemptoff tracer will record the total length of call_function_with_irqs_and_preemption_off() andcall_function_with_preemption_off().
50 But neither will trace the time that interrupts and/orpreemption is disabled. This total time is the time that we cannot schedule. To record this time, use the preemptirqsoff
tracer.
55 Again, using this trace is much like the irqsoff and preemptoff tracers.
12 linux/Documentation/trace/ftrace.txt (v2.6.39)

8/6/2019 Documentation Trace Ftrace
http://slidepdf.com/reader/full/documentation-trace-ftrace 13/30
# echo preemptirqsoff > current_tracer# echo latency format > trace_options
760 # echo 0 > tracing_max_latency# echo 1 > tracing_on# ls ltr[...]# echo 0 > tracing_on
765 # cat trace
# tracer: preemptirqsoff #preemptirqsoff latency trace v1.1.5 on 2.6.26 rc8
770 latency: 293 us, #3/3, CPU#0 | (M:preempt VP:0, KP:0, SP:0 HP:0 #P:2)
| task: ls 4860 (uid:0 nice:0 policy:0 rt_prio:0)
=> started at: apic_timer_interrupt775 => ended at: __do_softirq
# _ => CPU## / _ => irqs off
# | / _ => need resched780 # || / _ => hardirq/softirq
# ||| / _ => preempt depth# |||| /# ||||| delay# cmd pid ||||| time | caller
785 # \ / ||||| \ | /ls 4860 0d... 0us!: trace_hardirqs_off_thunk (apic_timer_interrupt)ls 4860 0d.s. 294us : _local_bh_enable (__do_softirq)ls 4860 0d.s1 294us : trace_preempt_on (__do_softirq)
790
The trace_hardirqs_off_thunk is called from assembly on x86 wheninterrupts are disabled in the assembly code. Without thefunction tracing, we do not know if interrupts were enabled
795 within the preemption points. We do see that it started withpreemption enabled.
Here is a trace with ftrace_enabled set:
800
# tracer: preemptirqsoff #preemptirqsoff latency trace v1.1.5 on 2.6.26 rc8
805 latency: 105 us, #183/183, CPU#0 | (M:preempt VP:0, KP:0, SP:0 HP:0 #P:2)
| task: sshd 4261 (uid:0 nice:0 policy:0 rt_prio:0)
=> started at: write_chan810 => ended at: __do_softirq
# _ => CPU## / _ => irqs off # | / _ => need resched
815 # || / _ => hardirq/softirq
# ||| / _ => preempt depth# |||| /# ||||| delay# cmd pid ||||| time | caller
linux/Documentation/trace/ftrace.txt (v2.6.39) 13

8/6/2019 Documentation Trace Ftrace
http://slidepdf.com/reader/full/documentation-trace-ftrace 14/30
20 # \ / ||||| \ | /ls 4473 0.N.. 0us : preempt_schedule (write_chan)ls 4473 0dN.1 1us : _spin_lock (schedule)ls 4473 0dN.1 2us : add_preempt_count (_spin_lock)ls 4473 0d..2 2us : put_prev_task_fair (schedule)
25 [...]ls 4473 0d..2 13us : set_normalized_timespec (ktime_get_ts)ls 4473 0d..2 13us : __switch_to (schedule)
sshd 4261 0d..2 14us : finish_task_switch (schedule)
sshd 4261 0d..2 14us : _spin_unlock_irq (finish_task_switch)30 sshd 4261 0d..1 15us : add_preempt_count (_spin_lock_irqsave)
sshd 4261 0d..2 16us : _spin_unlock_irqrestore (hrtick_set)sshd 4261 0d..2 16us : do_IRQ (common_interrupt)sshd 4261 0d..2 17us : irq_enter (do_IRQ)sshd 4261 0d..2 17us : idle_cpu (irq_enter)
35 sshd 4261 0d..2 18us : add_preempt_count (irq_enter)sshd 4261 0d.h2 18us : idle_cpu (irq_enter)sshd 4261 0d.h. 18us : handle_fasteoi_irq (do_IRQ)sshd 4261 0d.h. 19us : _spin_lock (handle_fasteoi_irq)sshd 4261 0d.h. 19us : add_preempt_count (_spin_lock)
40 sshd 4261 0d.h1 20us : _spin_unlock (handle_fasteoi_irq)sshd 4261 0d.h1 20us : sub_preempt_count (_spin_unlock)
[...]sshd 4261 0d.h1 28us : _spin_unlock (handle_fasteoi_irq)sshd 4261 0d.h1 29us : sub_preempt_count (_spin_unlock)
45 sshd 4261 0d.h2 29us : irq_exit (do_IRQ)sshd 4261 0d.h2 29us : sub_preempt_count (irq_exit)sshd 4261 0d..3 30us : do_softirq (irq_exit)sshd 4261 0d... 30us : __do_softirq (do_softirq)sshd 4261 0d... 31us : __local_bh_disable (__do_softirq)
50 sshd 4261 0d... 31us+: add_preempt_count (__local_bh_disable)sshd 4261 0d.s4 34us : add_preempt_count (__local_bh_disable)
[...]sshd 4261 0d.s3 43us : sub_preempt_count (local_bh_enable_ip)
sshd 4261 0d.s4 44us : sub_preempt_count (local_bh_enable_ip)55 sshd 4261 0d.s3 44us : smp_apic_timer_interrupt (apic_timer_interrupt)
sshd 4261 0d.s3 45us : irq_enter (smp_apic_timer_interrupt)sshd 4261 0d.s3 45us : idle_cpu (irq_enter)sshd 4261 0d.s3 46us : add_preempt_count (irq_enter)sshd 4261 0d.H3 46us : idle_cpu (irq_enter)
60 sshd 4261 0d.H3 47us : hrtimer_interrupt (smp_apic_timer_interrupt)sshd 4261 0d.H3 47us : ktime_get (hrtimer_interrupt)
[...]sshd 4261 0d.H3 81us : tick_program_event (hrtimer_interrupt)sshd 4261 0d.H3 82us : ktime_get (tick_program_event)
65 sshd 4261 0d.H3 82us : ktime_get_ts (ktime_get)sshd 4261 0d.H3 83us : getnstimeofday (ktime_get_ts)
sshd 4261 0d.H3 83us : set_normalized_timespec (ktime_get_ts)sshd 4261 0d.H3 84us : clockevents_program_event (tick_program_event)sshd 4261 0d.H3 84us : lapic_next_event (clockevents_program_event)
70 sshd 4261 0d.H3 85us : irq_exit (smp_apic_timer_interrupt)sshd 4261 0d.H3 85us : sub_preempt_count (irq_exit)sshd 4261 0d.s4 86us : sub_preempt_count (irq_exit)sshd 4261 0d.s3 86us : add_preempt_count (__local_bh_disable)
[...]75 sshd 4261 0d.s1 98us : sub_preempt_count (net_rx_action)
sshd 4261 0d.s. 99us : add_preempt_count (_spin_lock_irq)sshd 4261 0d.s1 99us+: _spin_unlock_irq (run_timer_softirq)sshd 4261 0d.s. 104us : _local_bh_enable (__do_softirq)
sshd 4261 0d.s. 104us : sub_preempt_count (_local_bh_enable)80 sshd 4261 0d.s. 105us : _local_bh_enable (__do_softirq)
sshd 4261 0d.s1 105us : trace_preempt_on (__do_softirq)
14 linux/Documentation/trace/ftrace.txt (v2.6.39)

8/6/2019 Documentation Trace Ftrace
http://slidepdf.com/reader/full/documentation-trace-ftrace 15/30
This is a very interesting trace. It started with the preemption885 of the ls task. We see that the task had the "need_resched" bit
set via the ’N’ in the trace. Interrupts were disabled beforethe spin_lock at the beginning of the trace. We see that aschedule took place to run sshd. When the interrupts wereenabled, we took an interrupt. On return from the interrupt
890 handler, the softirq ran. We took another interrupt whilerunning the softirq as we see from the capital ’H’.
wakeup895
In a Real Time environment it is very important to know thewakeup time it takes for the highest priority task that is wokenup to the time that it executes. This is also known as "schedule
900 latency". I stress the point that this is about RT tasks. It isalso important to know the scheduling latency of non RT tasks,but the average schedule latency is better for non RT tasks.Tools like LatencyTop are more appropriate for suchmeasurements.
905
Real Time environments are interested in the worst case latency.That is the longest latency it takes for something to happen,and not the average. We can have a very fast scheduler that mayonly have a large latency once in a while, but that would not
910 work well with Real Time tasks. The wakeup tracer was designedto record the worst case wakeups of RT tasks. Non RT tasks arenot recorded because the tracer only records one worst case andtracing non RT tasks that are unpredictable will overwrite theworst case latency of RT tasks.
915
Since this tracer only deals with RT tasks, we will run this
slightly differently than we did with the previous tracers.Instead of performing an ’ls’, we will run ’sleep 1’ under’chrt’ which changes the priority of the task.
920
# echo wakeup > current_tracer# echo latency format > trace_options# echo 0 > tracing_max_latency# echo 1 > tracing_on
925 # chrt f 5 sleep 1# echo 0 > tracing_on# cat trace
# tracer: wakeup#
930 wakeup latency trace v1.1.5 on 2.6.26 rc8
latency: 4 us, #2/2, CPU#1 | (M:preempt VP:0, KP:0, SP:0 HP:0 #P:2)
| task: sleep 4901 (uid:0 nice:0 policy:1 rt_prio:5)935
# _ => CPU## / _ => irqs off # | / _ => need resched
940 # || / _ => hardirq/softirq# ||| / _ => preempt depth
# |||| /# ||||| delay# cmd pid ||||| time | caller
945 # \ / ||||| \ | /
linux/Documentation/trace/ftrace.txt (v2.6.39) 15

8/6/2019 Documentation Trace Ftrace
http://slidepdf.com/reader/full/documentation-trace-ftrace 16/30
<idle> 0 1d.h4 0us+: try_to_wake_up (wake_up_process)<idle> 0 1d..4 4us : schedule (cpu_idle)
50 Running this on an idle system, we see that it only took 4microseconds to perform the task switch. Note, since the tracemarker in the schedule is before the actual "switch", we stopthe tracing when the recorded task is about to schedule in. Thismay change if we add a new marker at the end of the scheduler.
55
Notice that the recorded task is ’sleep’ with the PID of 4901and it has an rt_prio of 5. This priority is user space priorityand not the internal kernel priority. The policy is 1 forSCHED_FIFO and 2 for SCHED_RR.
60
Doing the same with chrt r 5 and ftrace_enabled set.
# tracer: wakeup#
65 wakeup latency trace v1.1.5 on 2.6.26 rc8
latency: 50 us, #60/60, CPU#1 | (M:preempt VP:0, KP:0, SP:0 HP:0 #P:2)
| task: sleep 4068 (uid:0 nice:0 policy:2 rt_prio:5)70
# _ => CPU## / _ => irqs off # | / _ => need resched
75 # || / _ => hardirq/softirq# ||| / _ => preempt depth# |||| /# ||||| delay# cmd pid ||||| time | caller
80 # \ / ||||| \ | /ksoftirq 7 1d.H3 0us : try_to_wake_up (wake_up_process)ksoftirq 7 1d.H4 1us : sub_preempt_count (marker_probe_cb)ksoftirq 7 1d.H3 2us : check_preempt_wakeup (try_to_wake_up)ksoftirq 7 1d.H3 3us : update_curr (check_preempt_wakeup)
85 ksoftirq 7 1d.H3 4us : calc_delta_mine (update_curr)ksoftirq 7 1d.H3 5us : __resched_task (check_preempt_wakeup)ksoftirq 7 1d.H3 6us : task_wake_up_rt (try_to_wake_up)ksoftirq 7 1d.H3 7us : _spin_unlock_irqrestore (try_to_wake_up)[...]
90 ksoftirq 7 1d.H2 17us : irq_exit (smp_apic_timer_interrupt)ksoftirq 7 1d.H2 18us : sub_preempt_count (irq_exit)ksoftirq 7 1d.s3 19us : sub_preempt_count (irq_exit)
ksoftirq 7 1..s2 20us : rcu_process_callbacks (__do_softirq)[...]
95 ksoftirq 7 1..s2 26us : __rcu_process_callbacks (rcu_process_callbacks)ksoftirq 7 1d.s2 27us : _local_bh_enable (__do_softirq)ksoftirq 7 1d.s2 28us : sub_preempt_count (_local_bh_enable)ksoftirq 7 1.N.3 29us : sub_preempt_count (ksoftirqd)ksoftirq 7 1.N.2 30us : _cond_resched (ksoftirqd)
00 ksoftirq 7 1.N.2 31us : __cond_resched (_cond_resched)ksoftirq 7 1.N.2 32us : add_preempt_count (__cond_resched)ksoftirq 7 1.N.2 33us : schedule (__cond_resched)ksoftirq 7 1.N.2 33us : add_preempt_count (schedule)ksoftirq 7 1.N.3 34us : hrtick_clear (schedule)
05 ksoftirq 7 1dN.3 35us : _spin_lock (schedule)ksoftirq 7 1dN.3 36us : add_preempt_count (_spin_lock)ksoftirq 7 1d..4 37us : put_prev_task_fair (schedule)ksoftirq 7 1d..4 38us : update_curr (put_prev_task_fair)
16 linux/Documentation/trace/ftrace.txt (v2.6.39)

8/6/2019 Documentation Trace Ftrace
http://slidepdf.com/reader/full/documentation-trace-ftrace 17/30
[...]1010 ksoftirq 7 1d..5 47us : _spin_trylock (tracing_record_cmdline)
ksoftirq 7 1d..5 48us : add_preempt_count (_spin_trylock)ksoftirq 7 1d..6 49us : _spin_unlock (tracing_record_cmdline)ksoftirq 7 1d..6 49us : sub_preempt_count (_spin_unlock)ksoftirq 7 1d..4 50us : schedule (__cond_resched)
1015
The interrupt went off while running ksoftirqd. This task runsat SCHED_OTHER. Why did not we see the ’N’ set early? This may
be a harmless bug with x86_32 and 4K stacks. On x86_32 with 4Kstacks configured, the interrupt and softirq run with their own1020 stack. Some information is held on the top of the task’s stack
(need_resched and preempt_count are both stored there). Thesetting of the NEED_RESCHED bit is done directly to the task’sstack, but the reading of the NEED_RESCHED is done by looking atthe current stack, which in this case is the stack for the hard
1025 interrupt. This hides the fact that NEED_RESCHED has been set.We do not see the ’N’ until we switch back to the task’sassigned stack.
function1030
This tracer is the function tracer. Enabling the function tracercan be done from the debug file system. Make sure theftrace_enabled is set; otherwise this tracer is a nop.
1035
# sysctl kernel.ftrace_enabled=1# echo function > current_tracer# echo 1 > tracing_on# usleep 1
1040 # echo 0 > tracing_on# cat trace
# tracer: function
## TASK PID CPU# TIMESTAMP FUNCTION1045 # | | | | |
bash 4003 [00] 123.638713: finish_task_switch < schedulebash 4003 [00] 123.638714: _spin_unlock_irq < finish_task_switchbash 4003 [00] 123.638714: sub_preempt_count < _spin_unlock_irqbash 4003 [00] 123.638715: hrtick_set < schedule
1050 bash 4003 [00] 123.638715: _spin_lock_irqsave < hrtick_setbash 4003 [00] 123.638716: add_preempt_count < _spin_lock_irqsavebash 4003 [00] 123.638716: _spin_unlock_irqrestore < hrtick_setbash 4003 [00] 123.638717: sub_preempt_count < _spin_unlock_irqrestorebash 4003 [00] 123.638717: hrtick_clear < hrtick_set
1055 bash 4003 [00] 123.638718: sub_preempt_count < schedule
bash 4003 [00] 123.638718: sub_preempt_count < preempt_schedulebash 4003 [00] 123.638719: wait_for_completion < __stop_machine_runbash 4003 [00] 123.638719: wait_for_common < wait_for_completionbash 4003 [00] 123.638720: _spin_lock_irq < wait_for_common
1060 bash 4003 [00] 123.638720: add_preempt_count < _spin_lock_irq[...]
Note: function tracer uses ring buffers to store the above1065 entries. The newest data may overwrite the oldest data.
Sometimes using echo to stop the trace is not sufficient becausethe tracing could have overwritten the data that you wanted to
record. For this reason, it is sometimes better to disabletracing directly from a program. This allows you to stop the
1070 tracing at the point that you hit the part that you areinterested in. To disable the tracing directly from a C program,
linux/Documentation/trace/ftrace.txt (v2.6.39) 17

8/6/2019 Documentation Trace Ftrace
http://slidepdf.com/reader/full/documentation-trace-ftrace 18/30
something like following code snippet can be used:
int trace_fd;75 [...]
int main(int argc, char ∗ argv[]) {[...]trace_fd = open(tracing_file("tracing_on"), O_WRONLY);[...]
80 if (condition_hit()) {
write(trace_fd, "0", 1);}[...]
}85
Single thread tracing
90 By writing into set_ftrace_pid you can trace asingle thread. For example:
# cat set_ftrace_pid
no pid95 # echo 3111 > set_ftrace_pid
# cat set_ftrace_pid3111# echo function > current_tracer# cat trace | head
00 # tracer: function## TASK PID CPU# TIMESTAMP FUNCTION# | | | | |
yum updatesd 3111 [003] 1637.254676: finish_task_switch < thread_return05 yum updatesd 3111 [003] 1637.254681: hrtimer_cancel < schedule_hrtimeout_range
yum updatesd 3111 [003] 1637.254682: hrtimer_try_to_cancel < hrtimer_cancelyum updatesd 3111 [003] 1637.254683: lock_hrtimer_base < hrtimer_try_to_cancelyum updatesd 3111 [003] 1637.254685: fget_light < do_sys_pollyum updatesd 3111 [003] 1637.254686: pipe_poll < do_sys_poll
10 # echo 1 > set_ftrace_pid# cat trace |head# tracer: function## TASK PID CPU# TIMESTAMP FUNCTION
15 # | | | | |##### CPU 3 buffer started ####
yum updatesd 3111 [003] 1701.957688: free_poll_entry < poll_freewaityum updatesd 3111 [003] 1701.957689: remove_wait_queue < free_poll_entry
yum updatesd 3111 [003] 1701.957691: fput < free_poll_entry20 yum updatesd 3111 [003] 1701.957692: audit_syscall_exit < sysret_audit
yum updatesd 3111 [003] 1701.957693: path_put < audit_syscall_exit
If you want to trace a function when executing, you could usesomething like this simple program:
25
#include <stdio.h>#include <stdlib.h>#include <sys/types.h>#include <sys/stat.h>
30 #include <fcntl.h>
#include <unistd.h>#include <string.h>
#define _STR(x) #x
18 linux/Documentation/trace/ftrace.txt (v2.6.39)

8/6/2019 Documentation Trace Ftrace
http://slidepdf.com/reader/full/documentation-trace-ftrace 19/30
1135 #define STR(x) _STR(x)#define MAX_PATH 256
const char ∗ find_debugfs(void){
1140 static char debugfs[MAX_PATH+1];static int debugfs_found;char type[100];FILE ∗ fp;
1145 if (debugfs_found)return debugfs;
if ((fp = fopen("/proc/mounts","r")) == NULL) {perror("/proc/mounts");
1150 return NULL;}
while (fscanf(fp, "%∗ s %"STR(MAX_PATH)
1155 "s %99s %∗ s %∗ d %∗ d\n",debugfs, type) == 2) {
if (strcmp(type, "debugfs") == 0)break;
}1160 fclose(fp);
if (strcmp(type, "debugfs") != 0) {fprintf(stderr, "debugfs not mounted");return NULL;
1165 }
strcat(debugfs, "/tracing/");debugfs_found = 1;
1170 return debugfs;}
const char ∗ tracing_file(const char ∗ file_name){
1175 static char trace_file[MAX_PATH+1];snprintf(trace_file, MAX_PATH, "%s/%s", find_debugfs(), file_name);return trace_file;
}
1180 int main (int argc, char ∗ ∗ argv){
if (argc < 1)exit( 1);
1185 if (fork() > 0) {int fd, ffd;char line[64];int s;
1190 ffd = open(tracing_file("current_tracer"), O_WRONLY);if (ffd < 0)
exit( 1);write(ffd, "nop", 3);
1195 fd = open(tracing_file("set_ftrace_pid"), O_WRONLY);s = sprintf(line, "%d\n", getpid());write(fd, line, s);
linux/Documentation/trace/ftrace.txt (v2.6.39) 19
8/6/2019 Documentation Trace Ftrace
http://slidepdf.com/reader/full/documentation-trace-ftrace 20/30
write(ffd, "function", 8);00
close(fd);close(ffd);
execvp(argv[1], argv+1);05 }
return 0;}
10
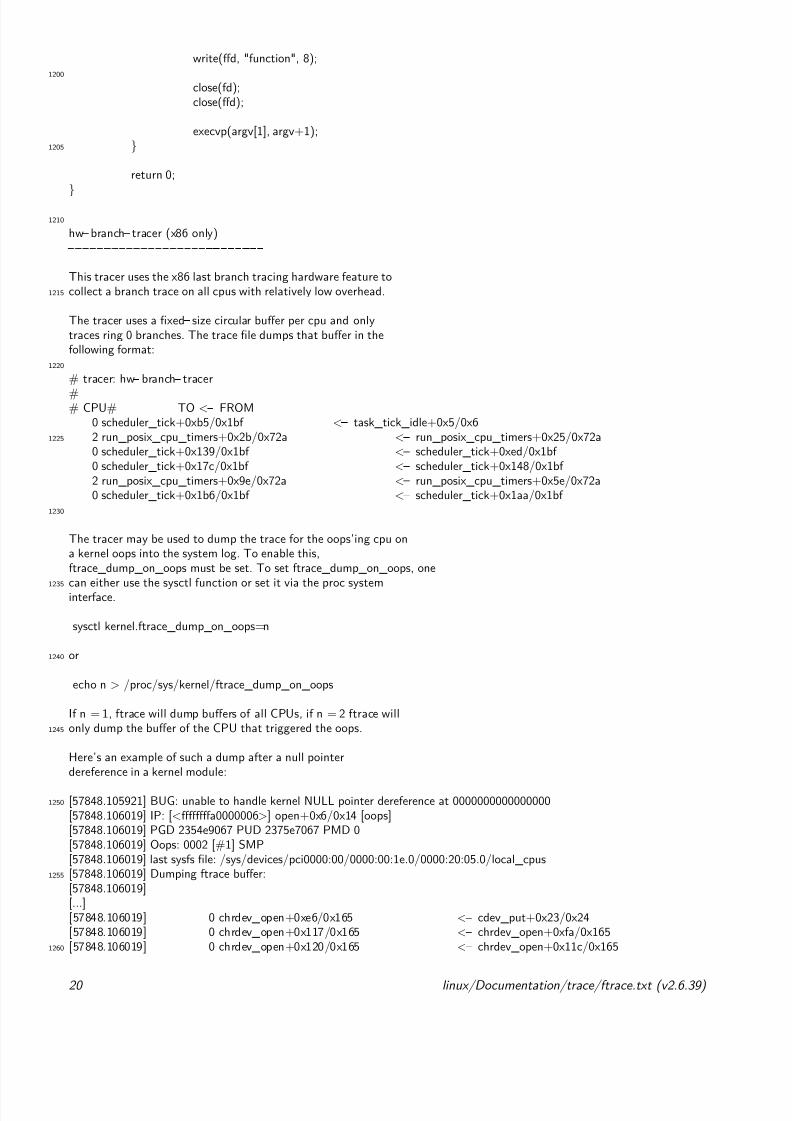
hw branch tracer (x86 only)
This tracer uses the x86 last branch tracing hardware feature to15 collect a branch trace on all cpus with relatively low overhead.
The tracer uses a fixed size circular buffer per cpu and onlytraces ring 0 branches. The trace file dumps that buffer in thefollowing format:
20
# tracer: hw branch tracer## CPU# TO < FROM
0 scheduler_tick+0xb5/0x1bf < task_tick_idle+0x5/0x625 2 run_posix_cpu_timers+0x2b/0x72a < run_posix_cpu_timers+0x25/0x72a
0 scheduler_tick+0x139/0x1bf < scheduler_tick+0xed/0x1bf 0 scheduler_tick+0x17c/0x1bf < scheduler_tick+0x148/0x1bf 2 run_posix_cpu_timers+0x9e/0x72a < run_posix_cpu_timers+0x5e/0x72a0 scheduler_tick+0x1b6/0x1bf < scheduler_tick+0x1aa/0x1bf
30
The tracer may be used to dump the trace for the oops’ing cpu ona kernel oops into the system log. To enable this,ftrace_dump_on_oops must be set. To set ftrace_dump_on_oops, one
35 can either use the sysctl function or set it via the proc systeminterface.
sysctl kernel.ftrace_dump_on_oops=n
40 or
echo n > /proc/sys/kernel/ftrace_dump_on_oops
If n = 1, ftrace will dump buffers of all CPUs, if n = 2 ftrace will45 only dump the buffer of the CPU that triggered the oops.
Here’s an example of such a dump after a null pointerdereference in a kernel module:
50 [57848.105921] BUG: unable to handle kernel NULL pointer dereference at 0000000000000000[57848.106019] IP: [<ffffffffa0000006>] open+0x6/0x14 [oops][57848.106019] PGD 2354e9067 PUD 2375e7067 PMD 0[57848.106019] Oops: 0002 [#1] SMP[57848.106019] last sysfs file: /sys/devices/pci0000:00/0000:00:1e.0/0000:20:05.0/local_cpus
55 [57848.106019] Dumping ftrace buffer:[57848.106019]
[...][57848.106019] 0 chrdev_open+0xe6/0x165 < cdev_put+0x23/0x24[57848.106019] 0 chrdev_open+0x117/0x165 < chrdev_open+0xfa/0x165
60 [57848.106019] 0 chrdev_open+0x120/0x165 < chrdev_open+0x11c/0x165
20 linux/Documentation/trace/ftrace.txt (v2.6.39)

8/6/2019 Documentation Trace Ftrace
http://slidepdf.com/reader/full/documentation-trace-ftrace 21/30
[57848.106019] 0 chrdev_open+0x134/0x165 < chrdev_open+0x12b/0x165[57848.106019] 0 open+0x0/0x14 [oops] < chrdev_open+0x144/0x165[57848.106019] 0 page_fault+0x0/0x30 < open+0x6/0x14 [oops][57848.106019] 0 error_entry+0x0/0x5b < page_fault+0x4/0x30
1265 [57848.106019] 0 error_kernelspace+0x0/0x31 < error_entry+0x59/0x5b[57848.106019] 0 error_sti+0x0/0x1 < error_kernelspace+0x2d/0x31[57848.106019] 0 page_fault+0x9/0x30 < error_sti+0x0/0x1[57848.106019] 0 do_page_fault+0x0/0x881 < page_fault+0x1a/0x30[...]
1270
[57848.106019] 0 do_page_fault+0x66b/0x881<
is_prefetch+0x1ee/0x1f2[57848.106019] 0 do_page_fault+0x6e0/0x881 < do_page_fault+0x67a/0x881[57848.106019] 0 oops_begin+0x0/0x96 < do_page_fault+0x6e0/0x881[57848.106019] 0 trace_hw_branch_oops+0x0/0x2d < oops_begin+0x9/0x96[...]
1275 [57848.106019] 0 ds_suspend_bts+0x2a/0xe3 < ds_suspend_bts+0x1a/0xe3[57848.106019][57848.106019] CPU 0[57848.106019] Modules linked in: oops[57848.106019] Pid: 5542, comm: cat Tainted: G W 2.6.28 #23
1280 [57848.106019] RIP: 0010:[<ffffffffa0000006>] [<ffffffffa0000006>] open+0x6/0x14 [oops][57848.106019] RSP: 0018:ffff880235457d48 EFLAGS: 00010246[...]
1285 function graph tracer
This tracer is similar to the function tracer except that itprobes a function on its entry and its exit. This is done by
1290 using a dynamically allocated stack of return addresses in eachtask_struct. On function entry the tracer overwrites the returnaddress of each function traced to set a custom probe. Thus theoriginal return address is stored on the stack of return addressin the task_struct.
1295
Probing on both ends of a function leads to special featuressuch as:
measure of a function’s time execution1300 having a reliable call stack to draw function calls graph
This tracer is useful in several situations:
you want to find the reason of a strange kernel behavior and1305 need to see what happens in detail on any areas (or specific
ones).
you are experiencing weird latencies but it’s difficult tofind its origin.
1310
you want to find quickly which path is taken by a specificfunction
you just want to peek inside a working kernel and want to see1315 what happens there.
# tracer: function_graph## CPU DURATION FUNCTION CALLS
1320 # | | | | | | |
0) | sys_open() {0) | do_sys_open() {
linux/Documentation/trace/ftrace.txt (v2.6.39) 21

8/6/2019 Documentation Trace Ftrace
http://slidepdf.com/reader/full/documentation-trace-ftrace 22/30
0) | getname() {25 0) | kmem_cache_alloc() {
0) 1.382 us | __might_sleep();0) 2.478 us | }0) | strncpy_from_user() {0) | might_fault() {
30 0) 1.389 us | __might_sleep();0) 2.553 us | }0) 3.807 us | }
0) 7.876 us | }0) | alloc_fd() {35 0) 0.668 us | _spin_lock();
0) 0.570 us | expand_files();0) 0.586 us | _spin_unlock();
40 There are several columns that can be dynamicallyenabled/disabled. You can use every combination of options youwant, depending on your needs.
The cpu number on which the function executed is default45 enabled. It is sometimes better to only trace one cpu (see
tracing_cpu_mask file) or you might sometimes see unorderedfunction calls while cpu tracing switch.
hide: echo nofuncgraph cpu > trace_options50 show: echo funcgraph cpu > trace_options
The duration (function’s time of execution) is displayed onthe closing bracket line of a function or on the same linethan the current function in case of a leaf one. It is default
55 enabled.
hide: echo nofuncgraph duration > trace_options
show: echo funcgraph duration > trace_options
60 The overhead field precedes the duration field in case of reached duration thresholds.
hide: echo nofuncgraph overhead > trace_optionsshow: echo funcgraph overhead > trace_options
65 depends on: funcgraph duration
ie:
0) | up_write() {70 0) 0.646 us | _spin_lock_irqsave();
0) 0.684 us | _spin_unlock_irqrestore();0) 3.123 us | }0) 0.548 us | fput();0) + 58.628 us | }
75
[...]
0) | putname() {0) | kmem_cache_free() {
80 0) 0.518 us | __phys_addr();0) 1.757 us | }0) 2.861 us | }
0) ! 115.305 us | }0) ! 116.402 us | }
85
+ means that the function exceeded 10 usecs.
22 linux/Documentation/trace/ftrace.txt (v2.6.39)

8/6/2019 Documentation Trace Ftrace
http://slidepdf.com/reader/full/documentation-trace-ftrace 23/30
! means that the function exceeded 100 usecs.
1390 The task/pid field displays the thread cmdline and pid whichexecuted the function. It is default disabled.
hide: echo nofuncgraph proc > trace_optionsshow: echo funcgraph proc > trace_options
1395
ie:
# tracer: function_graph#
1400 # CPU TASK/PID DURATION FUNCTION CALLS# | | | | | | | | |0) sh 4802 | | d_free() {0) sh 4802 | | call_rcu() {0) sh 4802 | | __call_rcu() {
1405 0) sh 4802 | 0.616 us | rcu_process_gp_end();0) sh 4802 | 0.586 us | check_for_new_grace_
w
y
period();0) sh 4802 | 2.899 us | }
0) sh 4802 | 4.040 us | }0) sh 4802 | 5.151 us | }
1410 0) sh 4802 | + 49.370 us | }
The absolute time field is an absolute timestamp given by thesystem clock since it started. A snapshot of this time is
1415 given on each entry/exit of functions
hide: echo nofuncgraph abstime > trace_optionsshow: echo funcgraph abstime > trace_options
1420 ie:
## TIME CPU DURATION FUNCTION CALLS# | | | | | | | |
1425 360.774522 | 1) 0.541 us | }360.774522 | 1) 4.663 us | }360.774523 | 1) 0.541 us | __wake
w
y
_up_bit();360.774524 | 1) 6.796 us | }360.774524 | 1) 7.952 us | }
1430 360.774525 | 1) 9.063 us | }360.774525 | 1) 0.615 us | journal_mark_
w
y
dirty();360.774527 | 1) 0.578 us | __brelse();360.774528 | 1) | reiserfs_prepare_
w
y
for_journal() {360.774528 | 1) | unlock_buffer
w
y
() {1435 360.774529 | 1) | wake_up_
w
y
bit() {360.774529 | 1) | bit_
w
y
waitqueue() {360.774530 | 1) 0.594 us | __
w
y
phys_addr();
1440 You can put some comments on specific functions by usingtrace_printk() For example, if you want to put a comment inside
linux/Documentation/trace/ftrace.txt (v2.6.39) 23

8/6/2019 Documentation Trace Ftrace
http://slidepdf.com/reader/full/documentation-trace-ftrace 24/30
the __might_sleep() function, you just have to include<linux/ftrace.h> and call trace_printk() inside __might_sleep()
45 trace_printk("I’m a comment!\n")
will produce:
1) | __might_sleep() {50 1) | /∗ I’m a comment! ∗ /
1) 1.449 us | }
You might find other useful features for this tracer in the55 following "dynamic ftrace" section such as tracing only specific
functions or tasks.
dynamic ftrace
60
If CONFIG_DYNAMIC_FTRACE is set, the system will run withvirtually no overhead when function tracing is disabled. The waythis works is the mcount function call (placed at the start of
every kernel function, produced by the pg switch in gcc),65 starts of pointing to a simple return. (Enabling FTRACE will
include the pg switch in the compiling of the kernel.)
At compile time every C file object is run through therecordmcount.pl script (located in the scripts directory). This
70 script will process the C object using objdump to find all thelocations in the .text section that call mcount. (Note, only the.text section is processed, since processing other sections like.init.text may cause races due to those sections being freed).
75 A new section called "__mcount_loc" is created that holds
references to all the mcount call sites in the .text section.This section is compiled back into the original object. Thefinal linker will add all these references into a single table.
80 On boot up, before SMP is initialized, the dynamic ftrace codescans this table and updates all the locations into nops. Italso records the locations, which are added to theavailable_filter_functions list. Modules are processed as theyare loaded and before they are executed. When a module is
85 unloaded, it also removes its functions from the ftrace functionlist. This is automatic in the module unload code, and themodule author does not need to worry about it.
When tracing is enabled, kstop_machine is called to prevent90 races with the CPUS executing code being modified (which can
cause the CPU to do undesirable things), and the nops arepatched back to calls. But this time, they do not call mcount(which is just a function stub). They now call into the ftraceinfrastructure.
95
One special side effect to the recording of the functions beingtraced is that we can now selectively choose which functions wewish to trace and which ones we want the mcount calls to remainas nops.
00
Two files are used, one for enabling and one for disabling thetracing of specified functions. They are:
set_ftrace_filter
24 linux/Documentation/trace/ftrace.txt (v2.6.39)

8/6/2019 Documentation Trace Ftrace
http://slidepdf.com/reader/full/documentation-trace-ftrace 25/30
1505
and
set_ftrace_notrace
1510 A list of available functions that you can add to these files islisted in:
available_filter_functions
1515 # cat available_filter_functionsput_prev_task_idlekmem_cache_createpick_next_task_rtget_online_cpus
1520 pick_next_task_fairmutex_lock[...]
If I am only interested in sys_nanosleep and hrtimer_interrupt:1525
# echo sys_nanosleep hrtimer_interrupt \> set_ftrace_filter
# echo function > current_tracer# echo 1 > tracing_on
1530 # usleep 1# echo 0 > tracing_on# cat trace
# tracer: ftrace#
1535 # TASK PID CPU# TIMESTAMP FUNCTION# | | | | |
usleep 4134 [00] 1317.070017: hrtimer_interrupt < smp_apic_timer_interruptusleep 4134 [00] 1317.070111: sys_nanosleep < syscall_call
<idle> 0 [00] 1317.070115: hrtimer_interrupt < smp_apic_timer_interrupt1540
To see which functions are being traced, you can cat the file:
# cat set_ftrace_filterhrtimer_interrupt
1545 sys_nanosleep
Perhaps this is not enough. The filters also allow simple wildcards. Only the following are currently available
1550
<match>∗ will match functions that begin with <match>∗<match> will match functions that end with <match>∗<match>∗ will match functions that have <match> in it
1555 These are the only wild cards which are supported.
<match>∗<match> will not work.
Note: It is better to use quotes to enclose the wild cards,1560 otherwise the shell may expand the parameters into names
of files in the local directory.
# echo ’hrtimer_∗ ’ > set_ftrace_filter
1565 Produces:
# tracer: ftrace
linux/Documentation/trace/ftrace.txt (v2.6.39) 25
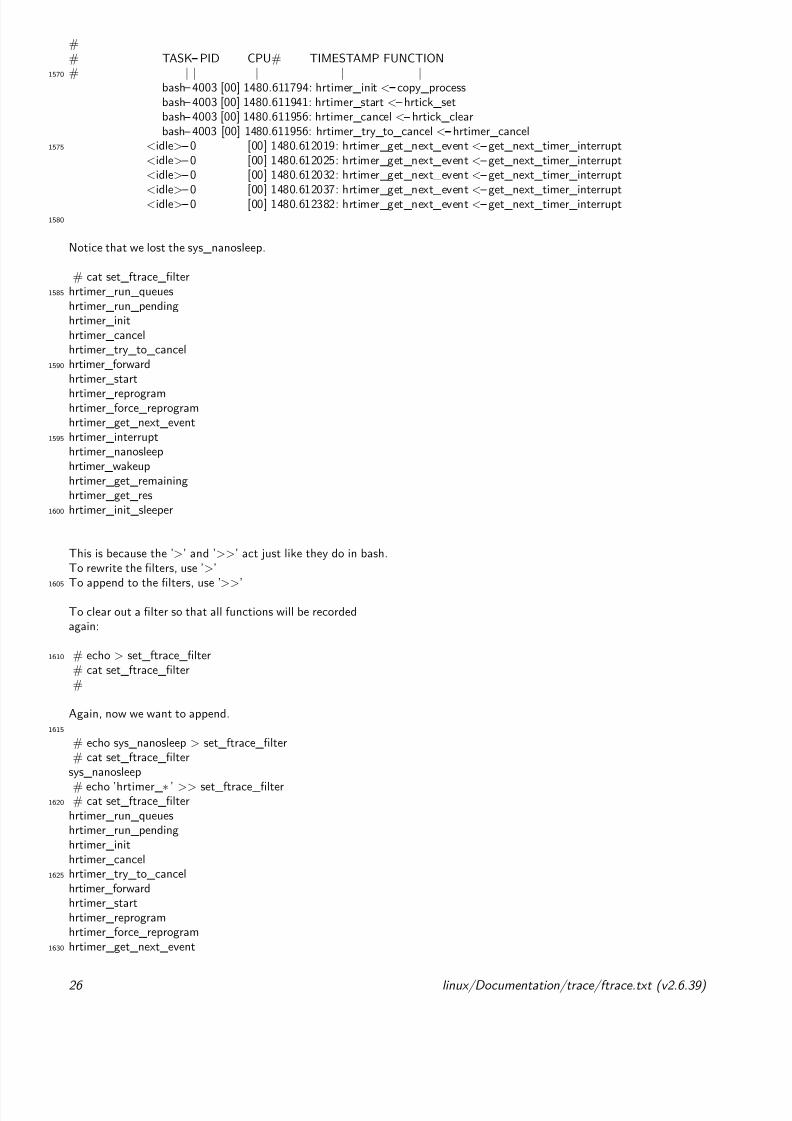
8/6/2019 Documentation Trace Ftrace
http://slidepdf.com/reader/full/documentation-trace-ftrace 26/30
## TASK PID CPU# TIMESTAMP FUNCTION
70 # | | | | |bash 4003 [00] 1480.611794: hrtimer_init < copy_processbash 4003 [00] 1480.611941: hrtimer_start < hrtick_setbash 4003 [00] 1480.611956: hrtimer_cancel < hrtick_clearbash 4003 [00] 1480.611956: hrtimer_try_to_cancel < hrtimer_cancel
75 <idle> 0 [00] 1480.612019: hrtimer_get_next_event < get_next_timer_interrupt<idle> 0 [00] 1480.612025: hrtimer_get_next_event < get_next_timer_interrupt<
idle>
0 [00] 1480.612032: hrtimer_get_next_event<
get_next_timer_interrupt<idle> 0 [00] 1480.612037: hrtimer_get_next_event < get_next_timer_interrupt<idle> 0 [00] 1480.612382: hrtimer_get_next_event < get_next_timer_interrupt
80
Notice that we lost the sys_nanosleep.
# cat set_ftrace_filter85 hrtimer_run_queues
hrtimer_run_pendinghrtimer_inithrtimer_cancelhrtimer_try_to_cancel
90 hrtimer_forwardhrtimer_starthrtimer_reprogramhrtimer_force_reprogramhrtimer_get_next_event
95 hrtimer_interrupthrtimer_nanosleephrtimer_wakeuphrtimer_get_remaininghrtimer_get_res
00 hrtimer_init_sleeper
This is because the ’>’ and ’>>’ act just like they do in bash.To rewrite the filters, use ’>’
05 To append to the filters, use ’>>’
To clear out a filter so that all functions will be recordedagain:
10 # echo > set_ftrace_filter# cat set_ftrace_filter#
Again, now we want to append.15
# echo sys_nanosleep > set_ftrace_filter# cat set_ftrace_filter
sys_nanosleep# echo ’hrtimer_∗ ’ >> set_ftrace_filter
20 # cat set_ftrace_filterhrtimer_run_queueshrtimer_run_pendinghrtimer_inithrtimer_cancel
25 hrtimer_try_to_cancelhrtimer_forward
hrtimer_starthrtimer_reprogramhrtimer_force_reprogram
30 hrtimer_get_next_event
26 linux/Documentation/trace/ftrace.txt (v2.6.39)

8/6/2019 Documentation Trace Ftrace
http://slidepdf.com/reader/full/documentation-trace-ftrace 27/30
hrtimer_interruptsys_nanosleephrtimer_nanosleephrtimer_wakeup
1635 hrtimer_get_remaininghrtimer_get_reshrtimer_init_sleeper
1640
The set_ftrace_notrace prevents those functions from beingtraced.
# echo ’∗ preempt∗ ’ ’∗ lock∗ ’ > set_ftrace_notrace
1645 Produces:
# tracer: ftrace## TASK PID CPU# TIMESTAMP FUNCTION
1650 # | | | | |bash 4043 [01] 115.281644: finish_task_switch < schedulebash 4043 [01] 115.281645: hrtick_set < schedule
bash 4043 [01] 115.281645: hrtick_clear < hrtick_setbash 4043 [01] 115.281646: wait_for_completion < __stop_machine_run
1655 bash 4043 [01] 115.281647: wait_for_common < wait_for_completionbash 4043 [01] 115.281647: kthread_stop < stop_machine_runbash 4043 [01] 115.281648: init_waitqueue_head < kthread_stopbash 4043 [01] 115.281648: wake_up_process < kthread_stopbash 4043 [01] 115.281649: try_to_wake_up < wake_up_process
1660
We can see that there’s no more lock or preempt tracing.
Dynamic ftrace with the function graph tracer
1665
Although what has been explained above concerns both thefunction tracer and the function graph tracer, there are somespecial features only available in the function graph tracer.
1670
If you want to trace only one function and all of its children,you just have to echo its name into set_graph_function:
echo __do_fault > set_graph_function1675
will produce the following "expanded" trace of the __do_fault()function:
0) | __do_fault() {1680 0) | filemap_fault() {
0) | find_lock_page() {0) 0.804 us | find_get_page();0) | __might_sleep() {0) 1.329 us | }
1685 0) 3.904 us | }0) 4.979 us | }0) 0.653 us | _spin_lock();0) 0.578 us | page_add_file_rmap();0) 0.525 us | native_set_pte_at();
1690 0) 0.585 us | _spin_unlock();0) | unlock_page() {0) 0.541 us | page_waitqueue();0) 0.639 us | __wake_up_bit();
linux/Documentation/trace/ftrace.txt (v2.6.39) 27

8/6/2019 Documentation Trace Ftrace
http://slidepdf.com/reader/full/documentation-trace-ftrace 28/30
0) 2.786 us | }95 0) + 14.237 us | }
0) | __do_fault() {0) | filemap_fault() {0) | find_lock_page() {0) 0.698 us | find_get_page();
00 0) | __might_sleep() {0) 1.412 us | }0) 3.950 us | }
0) 5.098 us | }0) 0.631 us | _spin_lock();05 0) 0.571 us | page_add_file_rmap();
0) 0.526 us | native_set_pte_at();0) 0.586 us | _spin_unlock();0) | unlock_page() {0) 0.533 us | page_waitqueue();
10 0) 0.638 us | __wake_up_bit();0) 2.793 us | }0) + 14.012 us | }
You can also expand several functions at once:15
echo sys_open > set_graph_functionecho sys_close >> set_graph_function
Now if you want to go back to trace all functions you can clear20 this special filter via:
echo > set_graph_function
25 Filter commands
A few commands are supported by the set_ftrace_filter interface.Trace commands have the following format:30
<function>:<command>:<parameter>
The following commands are supported:
35 modThis command enables function filtering per module. Theparameter defines the module. For example, if only the write∗functions in the ext3 module are desired, run:
40 echo ’write∗ :mod:ext3’ > set_ftrace_filter
This command interacts with the filter in the same way asfiltering based on function names. Thus, adding more functionsin a different module is accomplished by appending (>>) to the
45 filter file. Remove specific module functions by prepending’!’:
echo ’!writeback∗ :mod:ext3’ >> set_ftrace_filter
50 traceon/traceoff These commands turn tracing on and off when the specifiedfunctions are hit. The parameter determines how many times the
tracing system is turned on and off. If unspecified, there isno limit. For example, to disable tracing when a schedule bug
55 is hit the first 5 times, run:
28 linux/Documentation/trace/ftrace.txt (v2.6.39)

8/6/2019 Documentation Trace Ftrace
http://slidepdf.com/reader/full/documentation-trace-ftrace 29/30
echo ’__schedule_bug:traceoff:5’ > set_ftrace_filter
These commands are cumulative whether or not they are appended1760 to set_ftrace_filter. To remove a command, prepend it by ’!’
and drop the parameter:
echo ’!__schedule_bug:traceoff’ > set_ftrace_filter
1765
trace_pipe
The trace_pipe outputs the same content as the trace file, but1770 the effect on the tracing is different. Every read from
trace_pipe is consumed. This means that subsequent reads will bedifferent. The trace is live.
# echo function > current_tracer1775 # cat trace_pipe > /tmp/trace.out &
[1] 4153# echo 1 > tracing_on# usleep 1
# echo 0 > tracing_on1780 # cat trace
# tracer: function## TASK PID CPU# TIMESTAMP FUNCTION# | | | | |
1785
## cat /tmp/trace.out
bash 4043 [00] 41.267106: finish_task_switch < schedulebash 4043 [00] 41.267106: hrtick_set < schedule
1790 bash 4043 [00] 41.267107: hrtick_clear < hrtick_set
bash 4043 [00] 41.267108: wait_for_completion < __stop_machine_runbash 4043 [00] 41.267108: wait_for_common < wait_for_completionbash 4043 [00] 41.267109: kthread_stop < stop_machine_runbash 4043 [00] 41.267109: init_waitqueue_head < kthread_stop
1795 bash 4043 [00] 41.267110: wake_up_process < kthread_stopbash 4043 [00] 41.267110: try_to_wake_up < wake_up_processbash 4043 [00] 41.267111: select_task_rq_rt < try_to_wake_up
1800 Note, reading the trace_pipe file will block until more input isadded. By changing the tracer, trace_pipe will issue an EOF. Weneeded to set the function tracer _before_ we "cat" thetrace_pipe file.
1805
trace entries
Having too much or not enough data can be troublesome in1810 diagnosing an issue in the kernel. The file buffer_size_kb is
used to modify the size of the internal trace buffers. Thenumber listed is the number of entries that can be recorded perCPU. To know the full size, multiply the number of possible CPUSwith the number of entries.
1815
# cat buffer_size_kb1408 (units kilobytes)
Note, to modify this, you must have tracing completely disabled.
linux/Documentation/trace/ftrace.txt (v2.6.39) 29

8/6/2019 Documentation Trace Ftrace
http://slidepdf.com/reader/full/documentation-trace-ftrace 30/30
20 To do that, echo "nop" into the current_tracer. If thecurrent_tracer is not set to "nop", an EINVAL error will bereturned.
# echo nop > current_tracer25 # echo 10000 > buffer_size_kb
# cat buffer_size_kb10000 (units kilobytes)
The number of pages which will be allocated is limited to a30 percentage of available memory. Allocating too much will produce
an error.
# echo 1000000000000 > buffer_size_kbbash: echo: write error: Cannot allocate memory
35 # cat buffer_size_kb85
40 More details can be found in the source code, in the41 kernel/trace/∗ .c files.