ftrace linux kernel tracing · ftrace linux kernel tracing steven rostedt [email protected]...
TRANSCRIPT

FtraceLinux Kernel Tracing
Steven [email protected]@goodmis.org
http://people.redhat.com/srostedt/trace-tokyo-2010.odp

Who am I?

What is Ftrace?

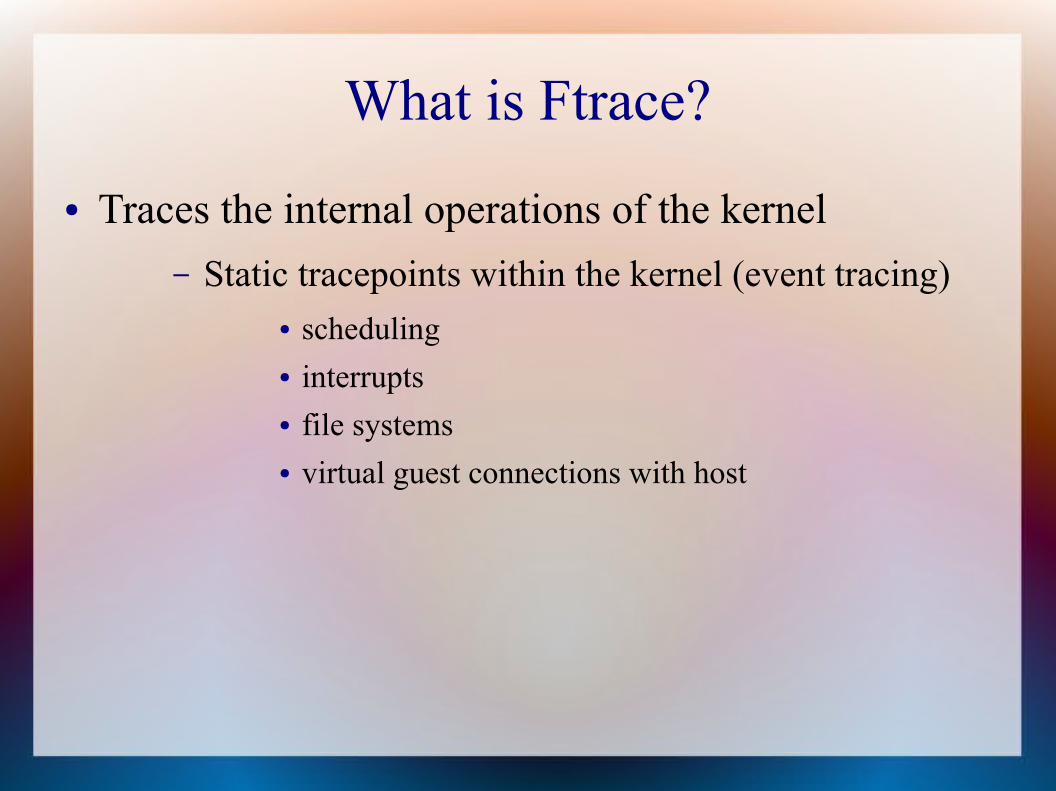
What is Ftrace?● Traces the internal operations of the kernel

What is Ftrace?● Traces the internal operations of the kernel
– Static tracepoints within the kernel (event tracing)
What is Ftrace?● Traces the internal operations of the kernel
– Static tracepoints within the kernel (event tracing)● scheduling● interrupts● file systems● virtual guest connections with host

What is Ftrace?● Traces the internal operations of the kernel
– Dynamic kernel function tracing

What is Ftrace?● Traces the internal operations of the kernel
– Dynamic kernel function tracing● trace all functions within the kernel● pick and choose what functions to trace
– less functions == less overhead● call graphs● stack usage

What is Ftrace?● Traces the internal operations of the kernel
– Latency tracers
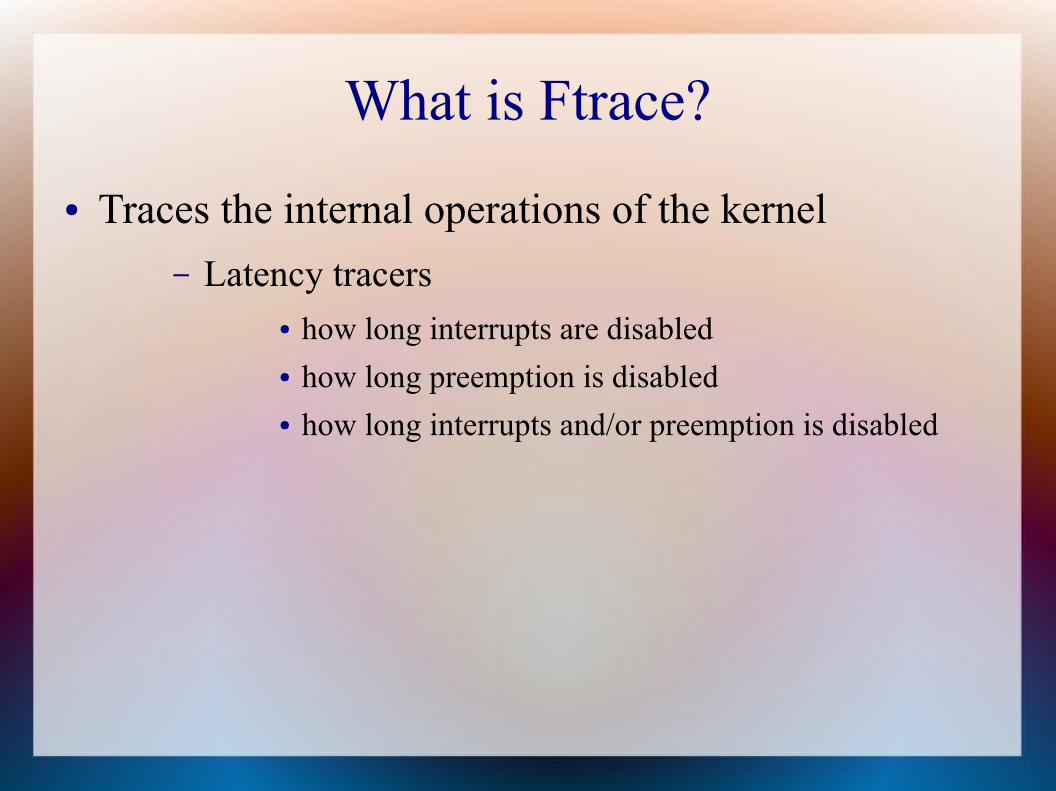
What is Ftrace?● Traces the internal operations of the kernel
– Latency tracers● how long interrupts are disabled● how long preemption is disabled● how long interrupts and/or preemption is disabled
What is Ftrace?● Traces the internal operations of the kernel
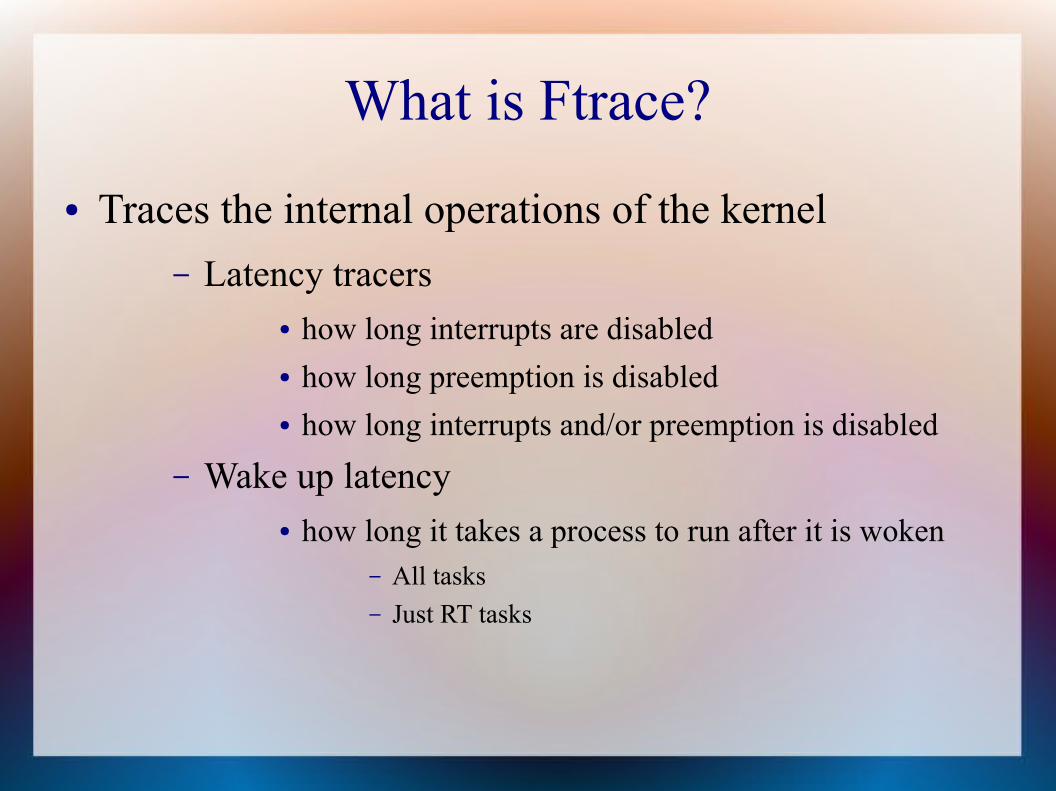
– Latency tracers● how long interrupts are disabled● how long preemption is disabled● how long interrupts and/or preemption is disabled
– Wake up latency● how long it takes a process to run after it is woken
– All tasks– Just RT tasks
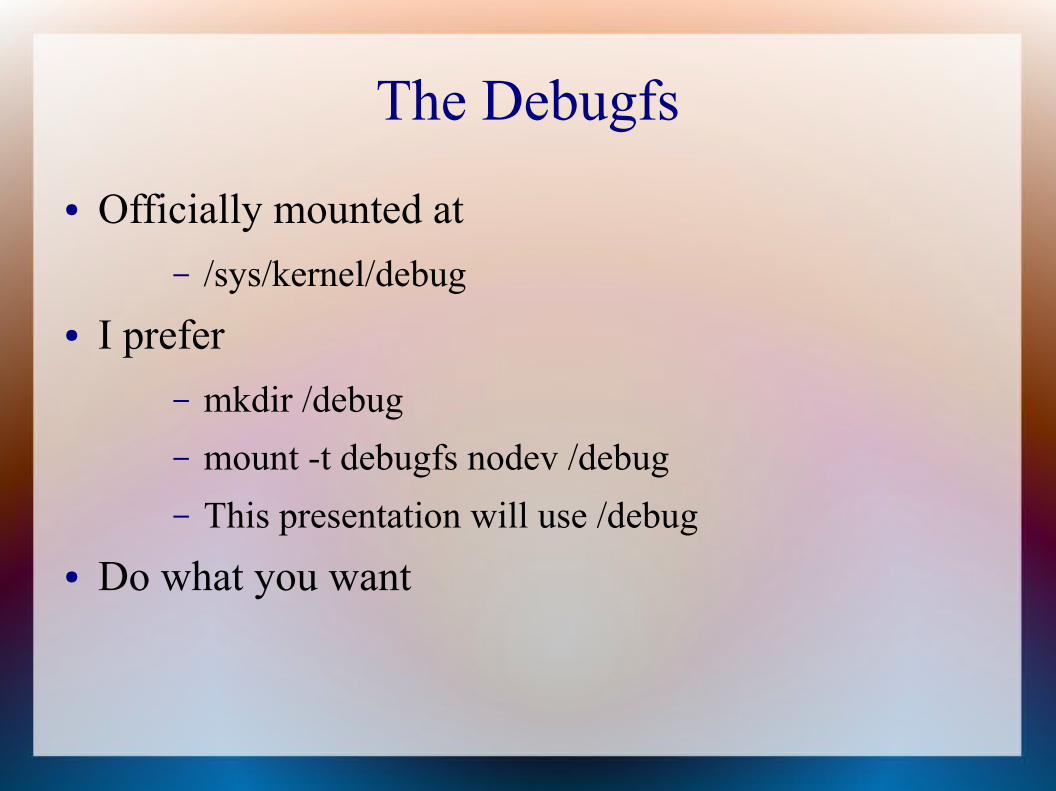
The Debugfs● Officially mounted at
– /sys/kernel/debug● I prefer
– mkdir /debug– mount -t debugfs nodev /debug– This presentation will use /debug
● Do what you want
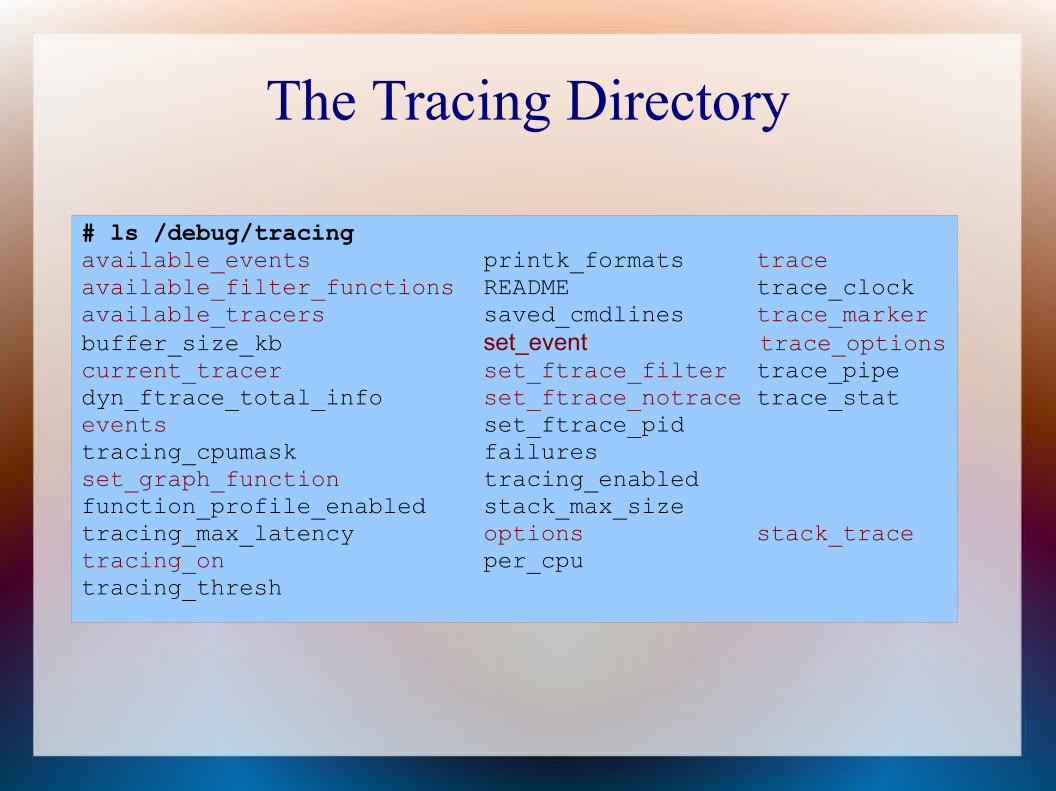
The Tracing Directory
# ls /debug/tracingavailable_events printk_formats traceavailable_filter_functions README trace_clockavailable_tracers saved_cmdlines trace_markerbuffer_size_kb set_event trace_optionscurrent_tracer set_ftrace_filter trace_pipedyn_ftrace_total_info set_ftrace_notrace trace_statevents set_ftrace_pid tracing_cpumask failures set_graph_function tracing_enabledfunction_profile_enabled stack_max_size tracing_max_latency options stack_trace tracing_on per_cpu tracing_thresh
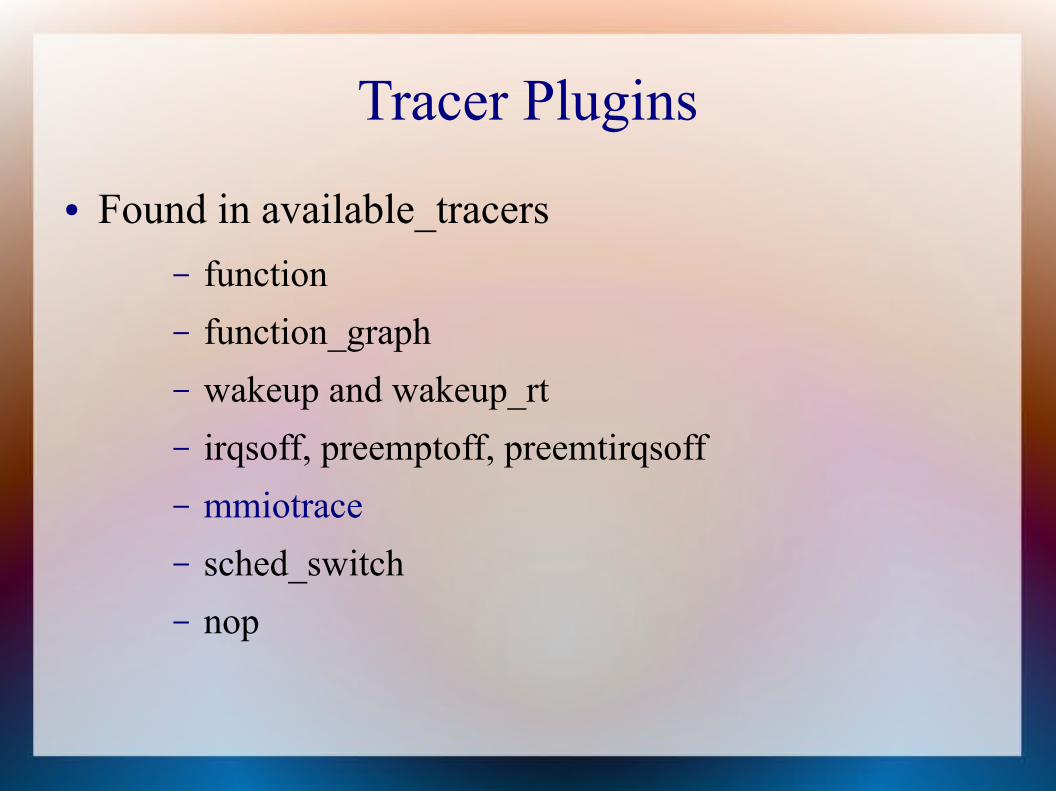
Tracer Plugins● Found in available_tracers
– function– function_graph– wakeup and wakeup_rt– irqsoff, preemptoff, preemtirqsoff– mmiotrace – sched_switch– nop
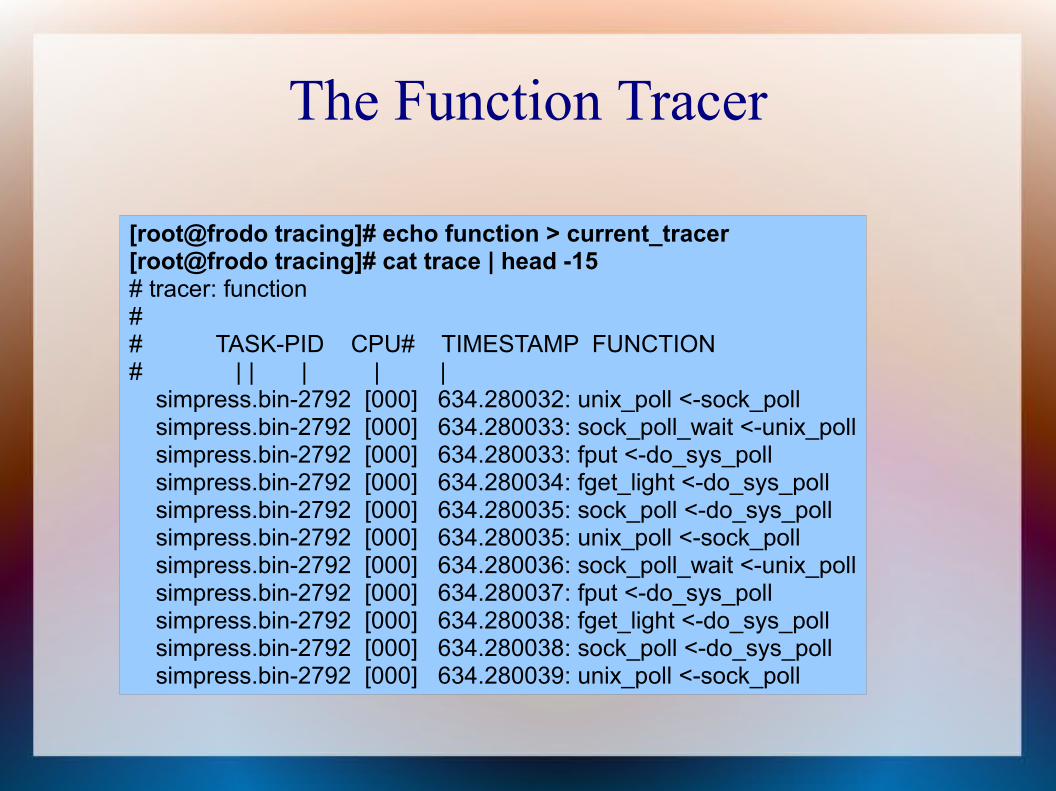
The Function Tracer
[root@frodo tracing]# echo function > current_tracer [root@frodo tracing]# cat trace | head -15# tracer: function## TASK-PID CPU# TIMESTAMP FUNCTION# | | | | | simpress.bin-2792 [000] 634.280032: unix_poll <-sock_poll simpress.bin-2792 [000] 634.280033: sock_poll_wait <-unix_poll simpress.bin-2792 [000] 634.280033: fput <-do_sys_poll simpress.bin-2792 [000] 634.280034: fget_light <-do_sys_poll simpress.bin-2792 [000] 634.280035: sock_poll <-do_sys_poll simpress.bin-2792 [000] 634.280035: unix_poll <-sock_poll simpress.bin-2792 [000] 634.280036: sock_poll_wait <-unix_poll simpress.bin-2792 [000] 634.280037: fput <-do_sys_poll simpress.bin-2792 [000] 634.280038: fget_light <-do_sys_poll simpress.bin-2792 [000] 634.280038: sock_poll <-do_sys_poll simpress.bin-2792 [000] 634.280039: unix_poll <-sock_poll
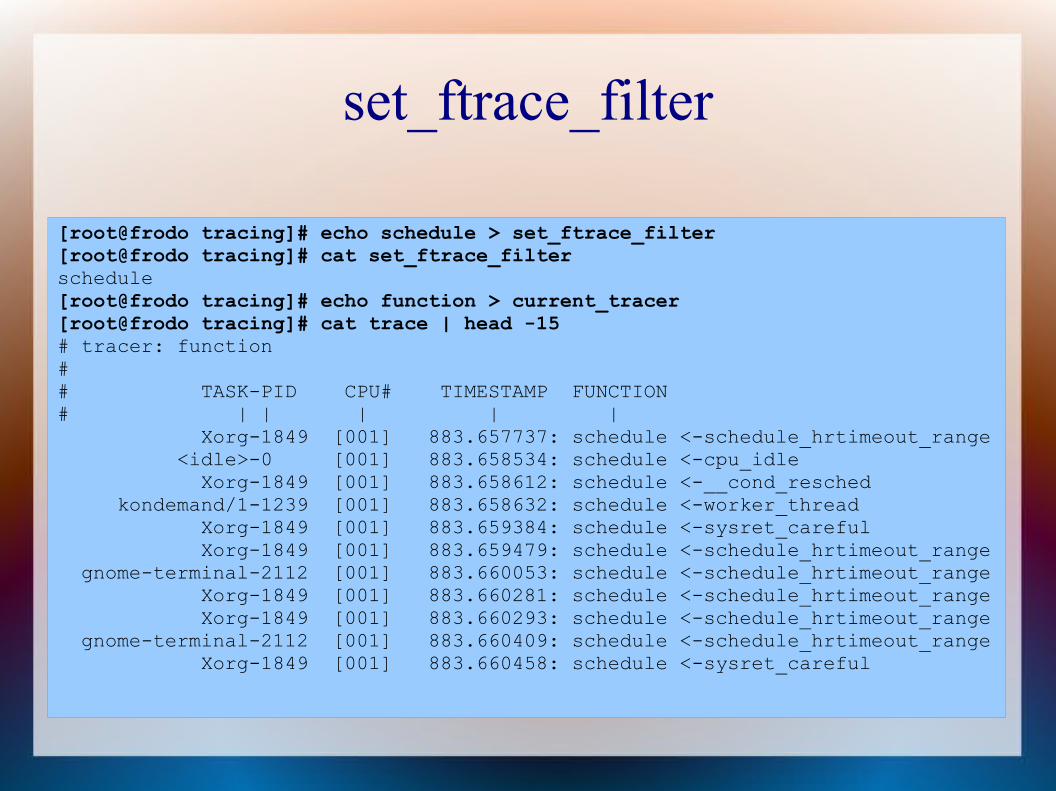
set_ftrace_filter
[root@frodo tracing]# echo schedule > set_ftrace_filter [root@frodo tracing]# cat set_ftrace_filterschedule[root@frodo tracing]# echo function > current_tracer [root@frodo tracing]# cat trace | head -15# tracer: function## TASK-PID CPU# TIMESTAMP FUNCTION# | | | | | Xorg-1849 [001] 883.657737: schedule <-schedule_hrtimeout_range <idle>-0 [001] 883.658534: schedule <-cpu_idle Xorg-1849 [001] 883.658612: schedule <-__cond_resched kondemand/1-1239 [001] 883.658632: schedule <-worker_thread Xorg-1849 [001] 883.659384: schedule <-sysret_careful Xorg-1849 [001] 883.659479: schedule <-schedule_hrtimeout_range gnome-terminal-2112 [001] 883.660053: schedule <-schedule_hrtimeout_range Xorg-1849 [001] 883.660281: schedule <-schedule_hrtimeout_range Xorg-1849 [001] 883.660293: schedule <-schedule_hrtimeout_range gnome-terminal-2112 [001] 883.660409: schedule <-schedule_hrtimeout_range Xorg-1849 [001] 883.660458: schedule <-sysret_careful
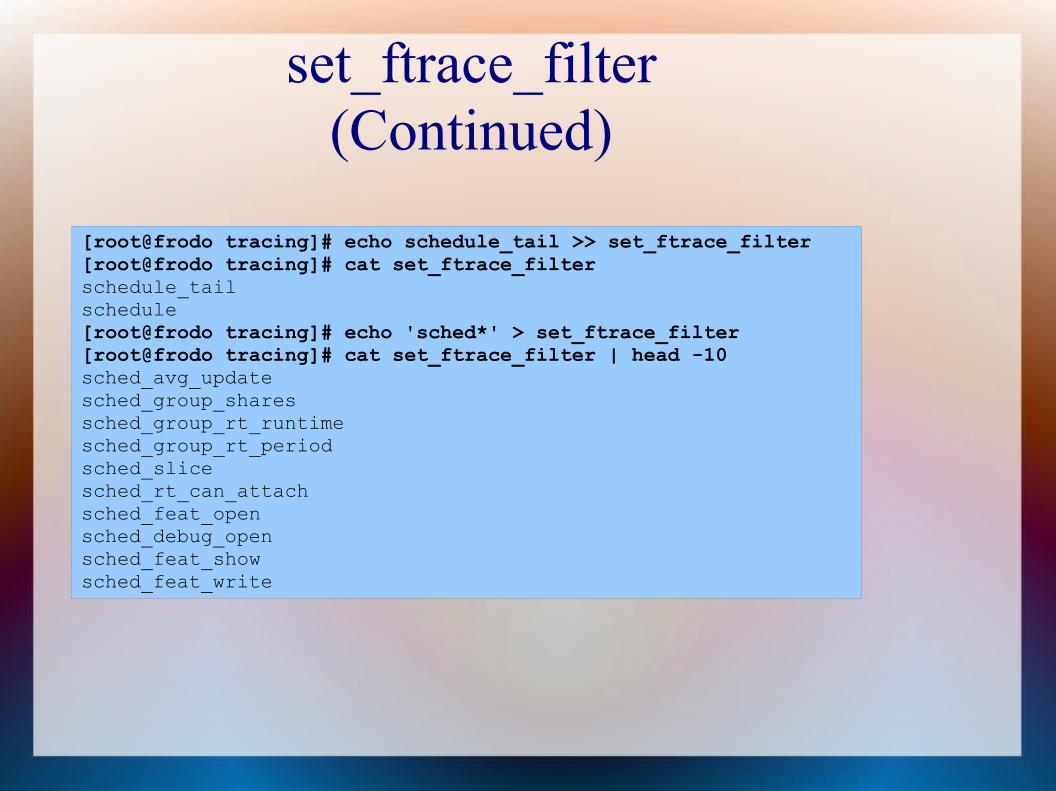
set_ftrace_filter(Continued)
[root@frodo tracing]# echo schedule_tail >> set_ftrace_filter [root@frodo tracing]# cat set_ftrace_filterschedule_tailschedule[root@frodo tracing]# echo 'sched*' > set_ftrace_filter[root@frodo tracing]# cat set_ftrace_filter | head -10sched_avg_updatesched_group_sharessched_group_rt_runtimesched_group_rt_periodsched_slicesched_rt_can_attachsched_feat_opensched_debug_opensched_feat_showsched_feat_write

Acceptable Globs● match*
– Selects all functions starting with “match”● *match
– Selects all functions ending with “match”● *match*
– Selects all functions with “match” in its name
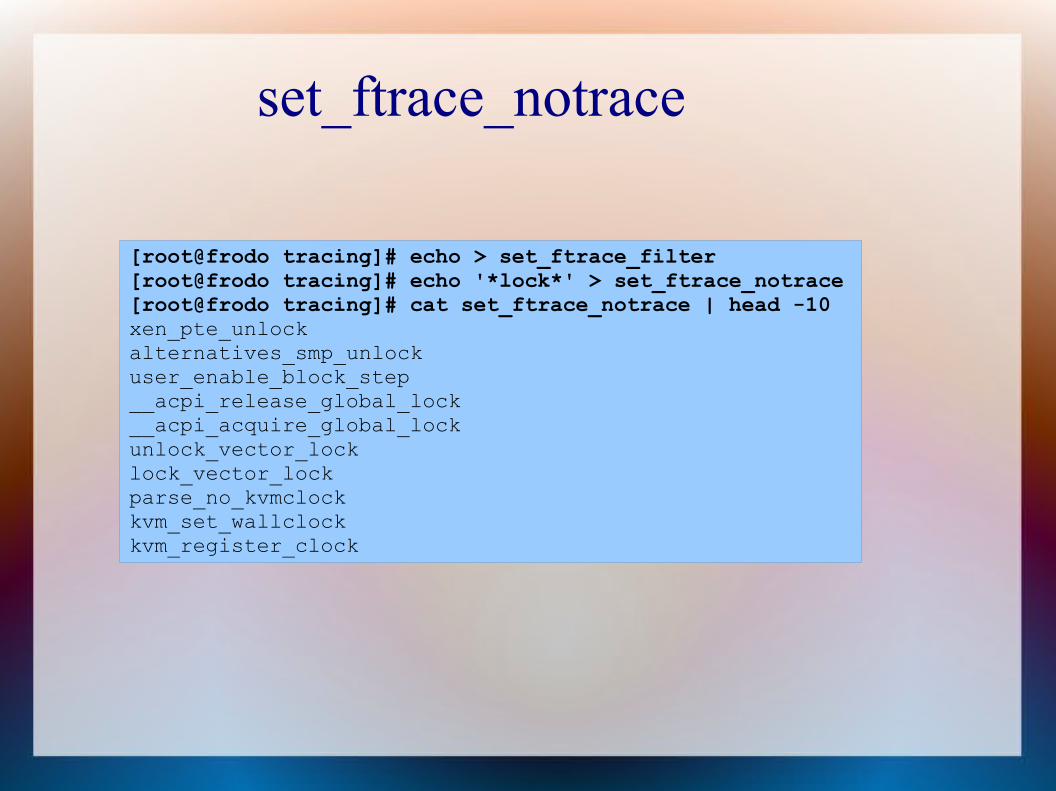
set_ftrace_notrace
[root@frodo tracing]# echo > set_ftrace_filter [root@frodo tracing]# echo '*lock*' > set_ftrace_notrace [root@frodo tracing]# cat set_ftrace_notrace | head -10xen_pte_unlockalternatives_smp_unlockuser_enable_block_step__acpi_release_global_lock__acpi_acquire_global_lockunlock_vector_locklock_vector_lockparse_no_kvmclockkvm_set_wallclockkvm_register_clock
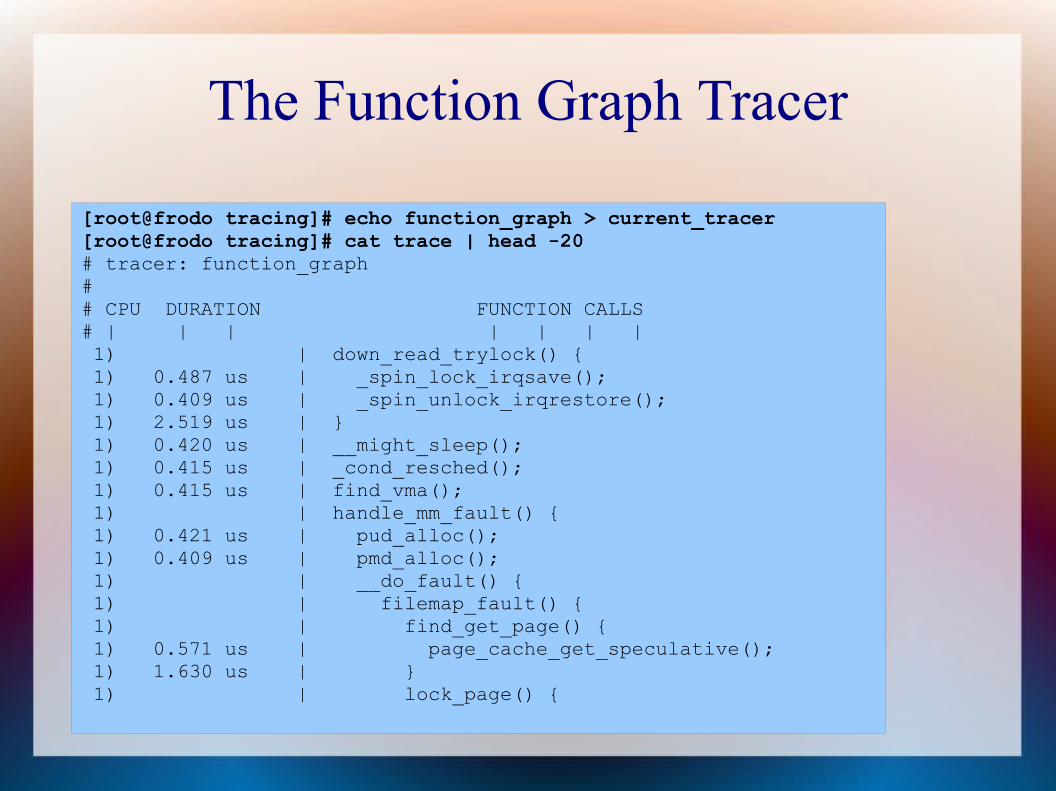
The Function Graph Tracer
[root@frodo tracing]# echo function_graph > current_tracer [root@frodo tracing]# cat trace | head -20# tracer: function_graph## CPU DURATION FUNCTION CALLS# | | | | | | | 1) | down_read_trylock() { 1) 0.487 us | _spin_lock_irqsave(); 1) 0.409 us | _spin_unlock_irqrestore(); 1) 2.519 us | } 1) 0.420 us | __might_sleep(); 1) 0.415 us | _cond_resched(); 1) 0.415 us | find_vma(); 1) | handle_mm_fault() { 1) 0.421 us | pud_alloc(); 1) 0.409 us | pmd_alloc(); 1) | __do_fault() { 1) | filemap_fault() { 1) | find_get_page() { 1) 0.571 us | page_cache_get_speculative(); 1) 1.630 us | } 1) | lock_page() {
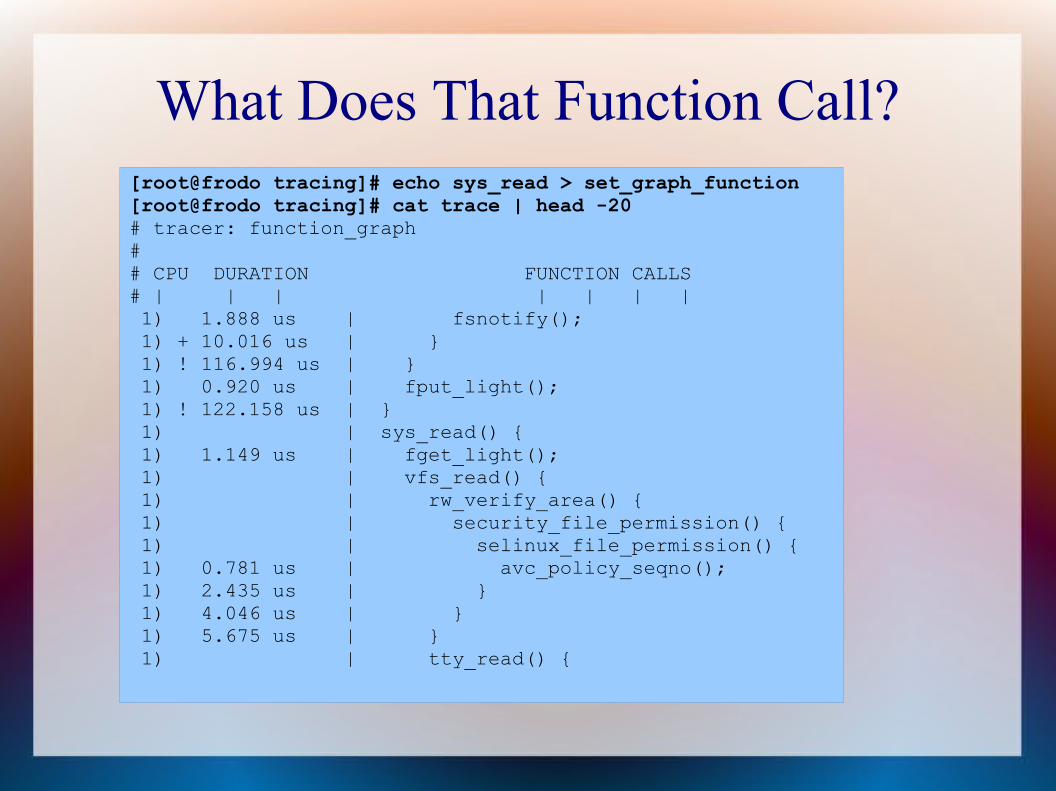
What Does That Function Call?[root@frodo tracing]# echo sys_read > set_graph_function [root@frodo tracing]# cat trace | head -20# tracer: function_graph## CPU DURATION FUNCTION CALLS# | | | | | | | 1) 1.888 us | fsnotify(); 1) + 10.016 us | } 1) ! 116.994 us | } 1) 0.920 us | fput_light(); 1) ! 122.158 us | } 1) | sys_read() { 1) 1.149 us | fget_light(); 1) | vfs_read() { 1) | rw_verify_area() { 1) | security_file_permission() { 1) | selinux_file_permission() { 1) 0.781 us | avc_policy_seqno(); 1) 2.435 us | } 1) 4.046 us | } 1) 5.675 us | } 1) | tty_read() {
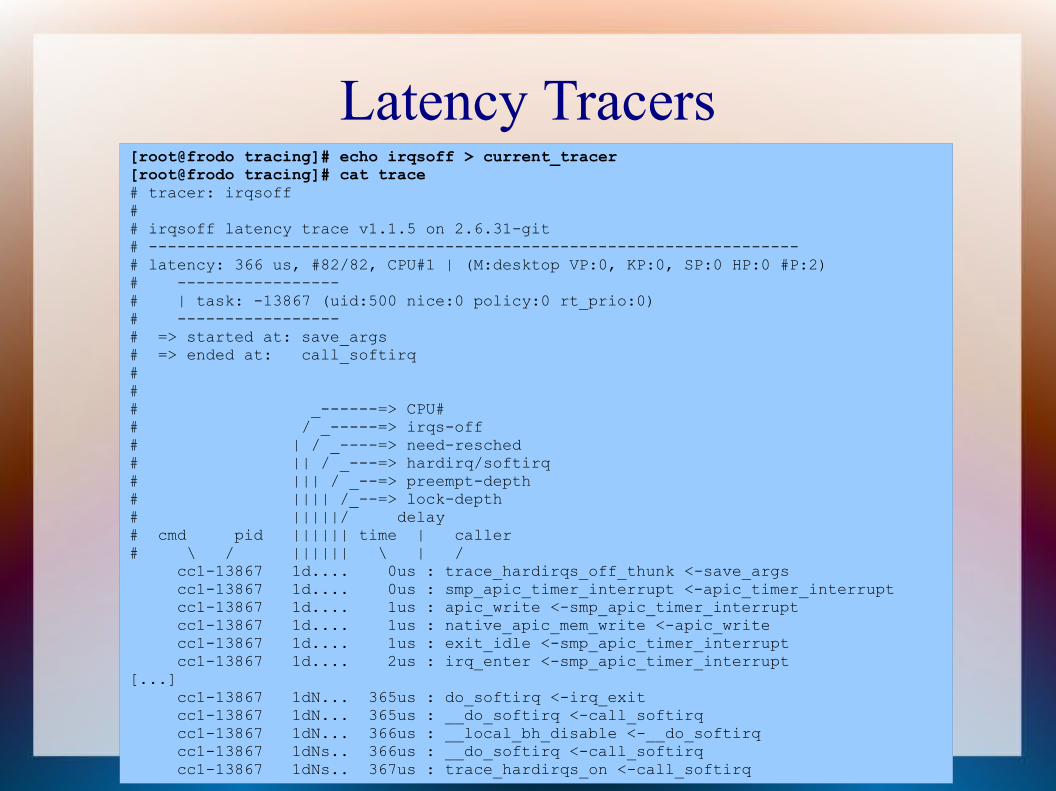
Latency Tracers[root@frodo tracing]# echo irqsoff > current_tracer [root@frodo tracing]# cat trace# tracer: irqsoff## irqsoff latency trace v1.1.5 on 2.6.31-git# --------------------------------------------------------------------# latency: 366 us, #82/82, CPU#1 | (M:desktop VP:0, KP:0, SP:0 HP:0 #P:2)# -----------------# | task: -13867 (uid:500 nice:0 policy:0 rt_prio:0)# -----------------# => started at: save_args# => ended at: call_softirq### _------=> CPU# # / _-----=> irqs-off # | / _----=> need-resched # || / _---=> hardirq/softirq # ||| / _--=> preempt-depth # |||| /_--=> lock-depth # |||||/ delay # cmd pid |||||| time | caller # \ / |||||| \ | / cc1-13867 1d.... 0us : trace_hardirqs_off_thunk <-save_args cc1-13867 1d.... 0us : smp_apic_timer_interrupt <-apic_timer_interrupt cc1-13867 1d.... 1us : apic_write <-smp_apic_timer_interrupt cc1-13867 1d.... 1us : native_apic_mem_write <-apic_write cc1-13867 1d.... 1us : exit_idle <-smp_apic_timer_interrupt cc1-13867 1d.... 2us : irq_enter <-smp_apic_timer_interrupt[...] cc1-13867 1dN... 365us : do_softirq <-irq_exit cc1-13867 1dN... 365us : __do_softirq <-call_softirq cc1-13867 1dN... 366us : __local_bh_disable <-__do_softirq cc1-13867 1dNs.. 366us : __do_softirq <-call_softirq cc1-13867 1dNs.. 367us : trace_hardirqs_on <-call_softirq
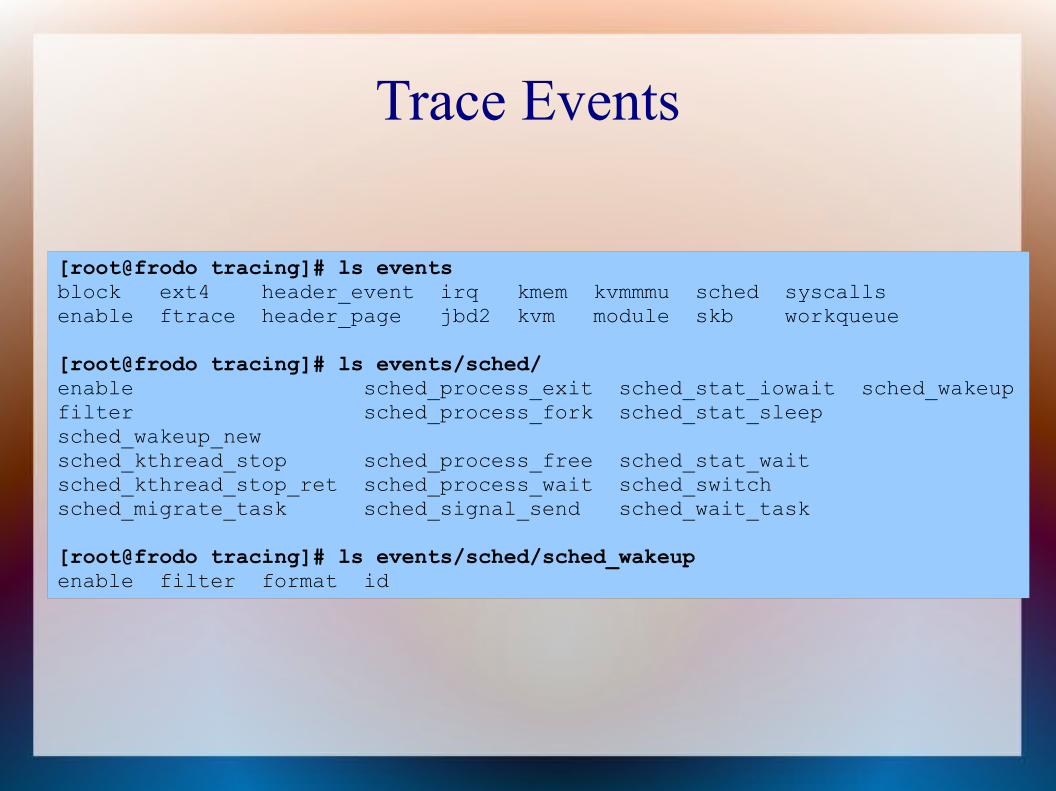
Trace Events
[root@frodo tracing]# ls eventsblock ext4 header_event irq kmem kvmmmu sched syscallsenable ftrace header_page jbd2 kvm module skb workqueue
[root@frodo tracing]# ls events/sched/enable sched_process_exit sched_stat_iowait sched_wakeupfilter sched_process_fork sched_stat_sleep sched_wakeup_newsched_kthread_stop sched_process_free sched_stat_waitsched_kthread_stop_ret sched_process_wait sched_switchsched_migrate_task sched_signal_send sched_wait_task
[root@frodo tracing]# ls events/sched/sched_wakeupenable filter format id
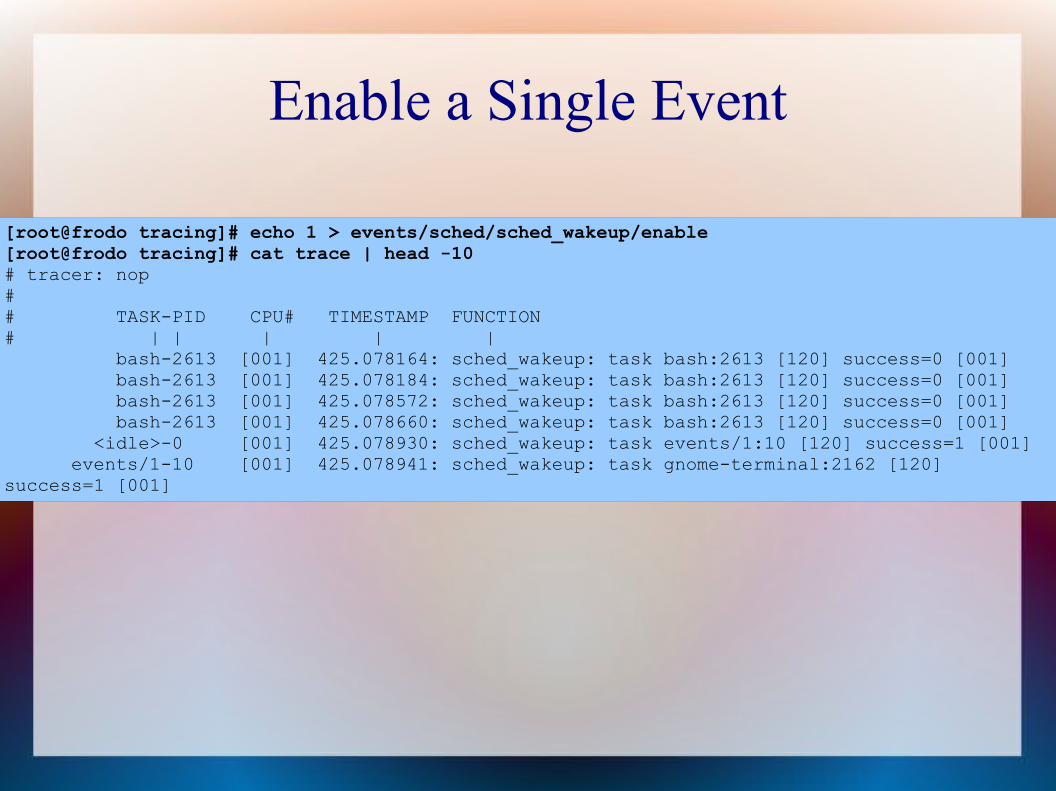
Enable a Single Event
[root@frodo tracing]# echo 1 > events/sched/sched_wakeup/enable [root@frodo tracing]# cat trace | head -10# tracer: nop## TASK-PID CPU# TIMESTAMP FUNCTION# | | | | | bash-2613 [001] 425.078164: sched_wakeup: task bash:2613 [120] success=0 [001] bash-2613 [001] 425.078184: sched_wakeup: task bash:2613 [120] success=0 [001] bash-2613 [001] 425.078572: sched_wakeup: task bash:2613 [120] success=0 [001] bash-2613 [001] 425.078660: sched_wakeup: task bash:2613 [120] success=0 [001] <idle>-0 [001] 425.078930: sched_wakeup: task events/1:10 [120] success=1 [001] events/1-10 [001] 425.078941: sched_wakeup: task gnome-terminal:2162 [120] success=1 [001]
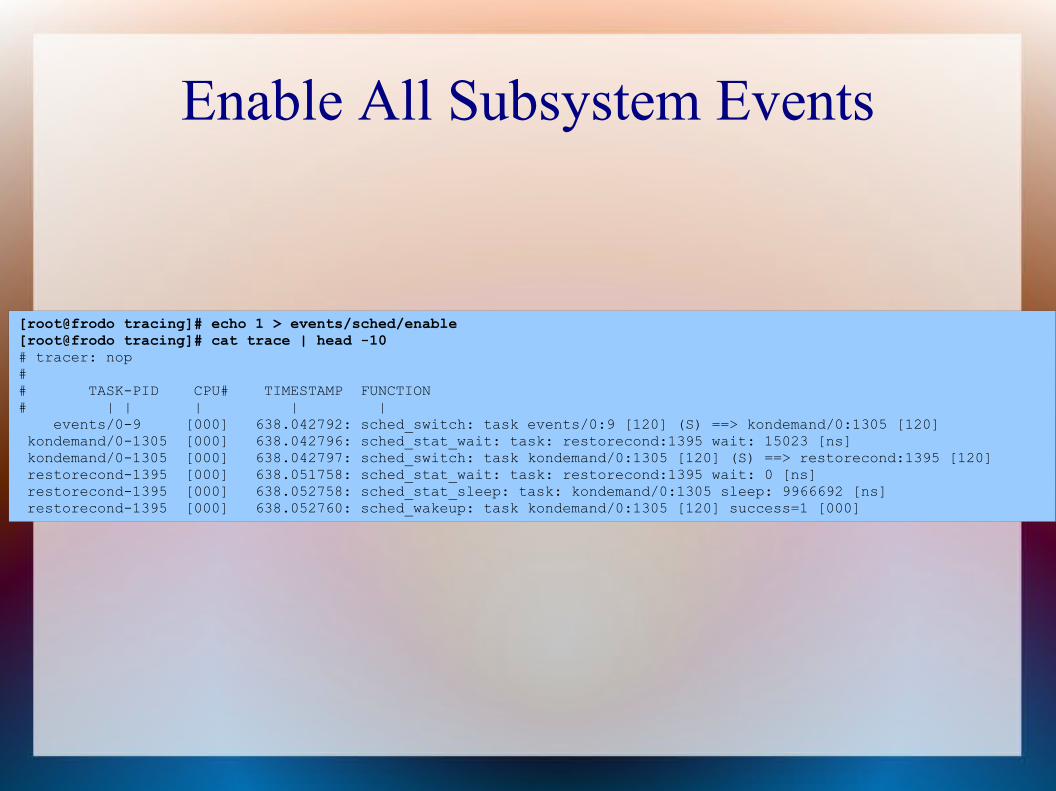
Enable All Subsystem Events
[root@frodo tracing]# echo 1 > events/sched/enable [root@frodo tracing]# cat trace | head -10# tracer: nop## TASK-PID CPU# TIMESTAMP FUNCTION# | | | | | events/0-9 [000] 638.042792: sched_switch: task events/0:9 [120] (S) ==> kondemand/0:1305 [120] kondemand/0-1305 [000] 638.042796: sched_stat_wait: task: restorecond:1395 wait: 15023 [ns] kondemand/0-1305 [000] 638.042797: sched_switch: task kondemand/0:1305 [120] (S) ==> restorecond:1395 [120] restorecond-1395 [000] 638.051758: sched_stat_wait: task: restorecond:1395 wait: 0 [ns] restorecond-1395 [000] 638.052758: sched_stat_sleep: task: kondemand/0:1305 sleep: 9966692 [ns] restorecond-1395 [000] 638.052760: sched_wakeup: task kondemand/0:1305 [120] success=1 [000]
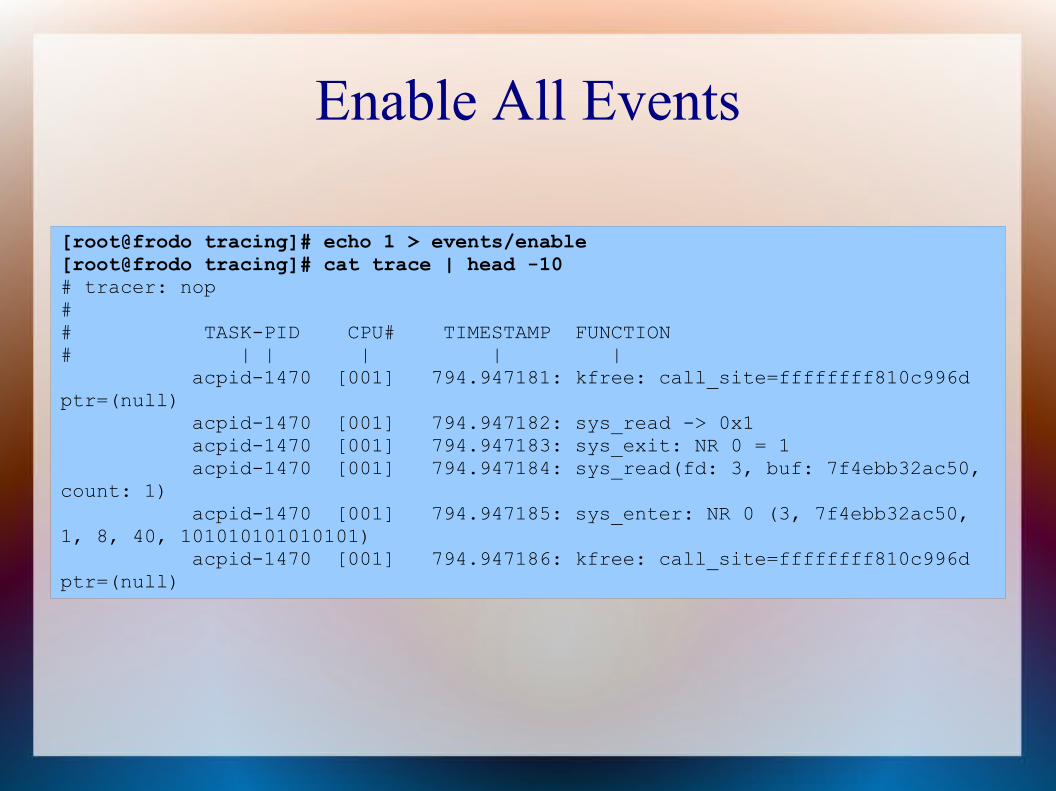
Enable All Events
[root@frodo tracing]# echo 1 > events/enable [root@frodo tracing]# cat trace | head -10# tracer: nop## TASK-PID CPU# TIMESTAMP FUNCTION# | | | | | acpid-1470 [001] 794.947181: kfree: call_site=ffffffff810c996d ptr=(null) acpid-1470 [001] 794.947182: sys_read -> 0x1 acpid-1470 [001] 794.947183: sys_exit: NR 0 = 1 acpid-1470 [001] 794.947184: sys_read(fd: 3, buf: 7f4ebb32ac50, count: 1) acpid-1470 [001] 794.947185: sys_enter: NR 0 (3, 7f4ebb32ac50, 1, 8, 40, 101010101010101) acpid-1470 [001] 794.947186: kfree: call_site=ffffffff810c996d ptr=(null)

Enable Multiple Events
[root@frodo tracing]# echo 1 > events/sched/sched_wakeup/enable [root@frodo tracing]# echo 1 > events/sched/sched_wakeup_new/enable[root@frodo tracing]# echo 1 > events/sched/sched_switch/enable[root@frodo tracing]# cat trace | head -15# tracer: nop## TASK-PID CPU# TIMESTAMP FUNCTION# | | | | | bash-2913 [001] 574.988228: sched_wakeup: task bash:2913 [120] success=0 [001] bash-2913 [001] 574.988264: sched_wakeup: task bash:2913 [120] success=0 [001] bash-2913 [001] 574.988425: sched_wakeup: task bash:2913 [120] success=0 [001] bash-2913 [001] 574.988440: sched_switch: task bash:2913 [120] (S) ==> swapper:0 [140] <idle>-0 [001] 574.988744: sched_wakeup: task events/1:10 [120] success=1 [001] <idle>-0 [001] 574.988754: sched_switch: task swapper:0 [140] (R) ==> events/1:10 [120] events/1-10 [001] 574.988760: sched_wakeup: task gnome-terminal:2158 [120] success=1 [001] events/1-10 [001] 574.988764: sched_switch: task events/1:10 [120] (S) ==> gnome-terminal:2158 [120] gnome-terminal-2158 [001] 574.988855: sched_switch: task gnome-terminal:2158 [120] (S) ==> swapper:0 [140] <idle>-0 [000] 574.991204: sched_wakeup: task phy0:1041 [120] success=1 [000] <idle>-0 [000] 574.991211: sched_switch: task swapper:0 [140] (R) ==> phy0:1041 [120]
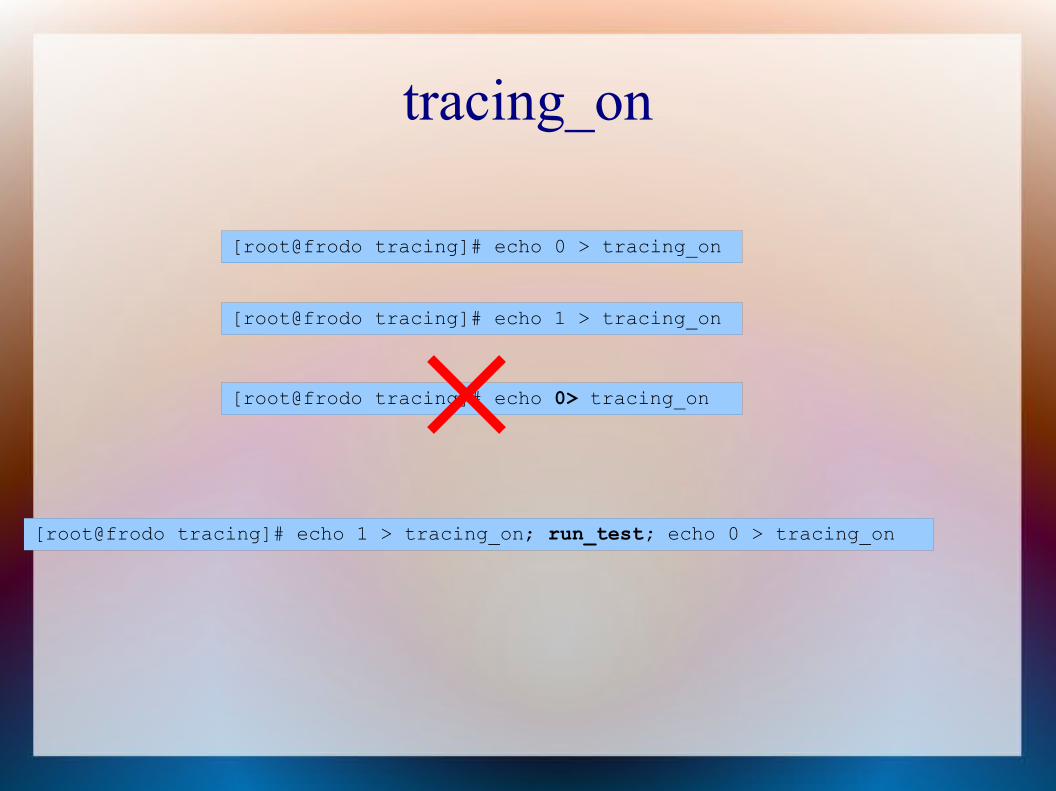
tracing_on
[root@frodo tracing]# echo 0 > tracing_on
[root@frodo tracing]# echo 1 > tracing_on
[root@frodo tracing]# echo 0> tracing_on
[root@frodo tracing]# echo 1 > tracing_on; run_test; echo 0 > tracing_on
stack_trace● echo 1 >
/proc/sys/kernel/stack_tracer_enabled● kernel command line “stacktrace”
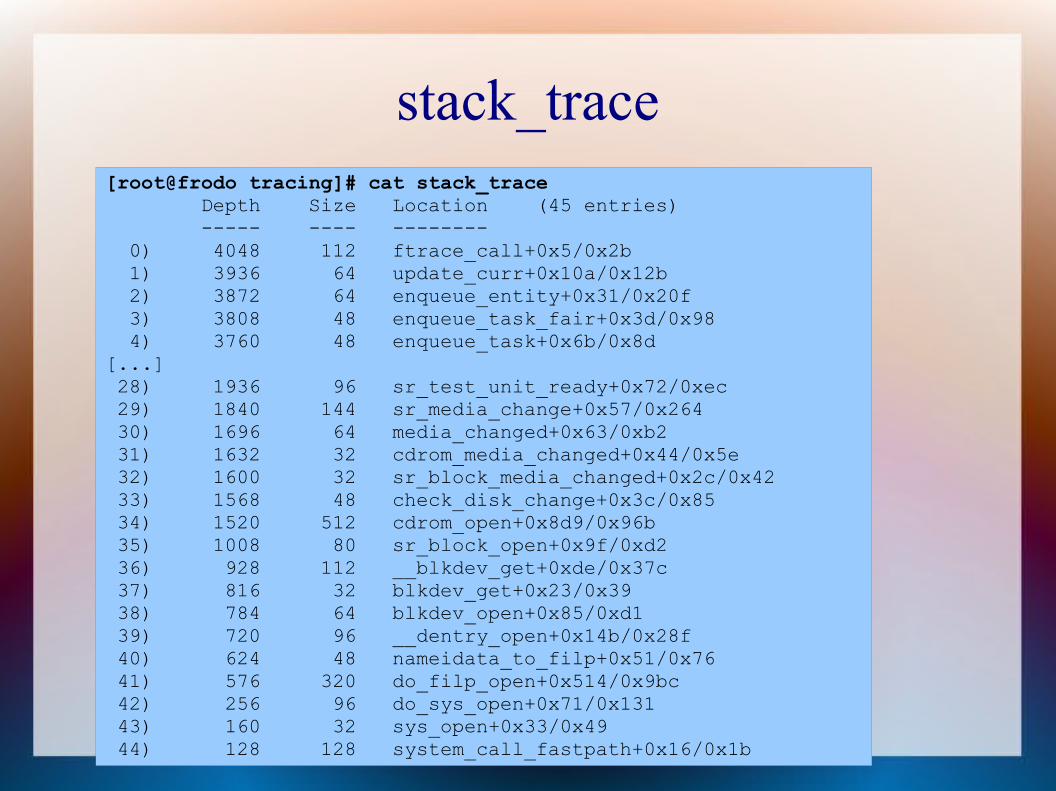
stack_trace[root@frodo tracing]# cat stack_trace Depth Size Location (45 entries) ----- ---- -------- 0) 4048 112 ftrace_call+0x5/0x2b 1) 3936 64 update_curr+0x10a/0x12b 2) 3872 64 enqueue_entity+0x31/0x20f 3) 3808 48 enqueue_task_fair+0x3d/0x98 4) 3760 48 enqueue_task+0x6b/0x8d[...] 28) 1936 96 sr_test_unit_ready+0x72/0xec 29) 1840 144 sr_media_change+0x57/0x264 30) 1696 64 media_changed+0x63/0xb2 31) 1632 32 cdrom_media_changed+0x44/0x5e 32) 1600 32 sr_block_media_changed+0x2c/0x42 33) 1568 48 check_disk_change+0x3c/0x85 34) 1520 512 cdrom_open+0x8d9/0x96b 35) 1008 80 sr_block_open+0x9f/0xd2 36) 928 112 __blkdev_get+0xde/0x37c 37) 816 32 blkdev_get+0x23/0x39 38) 784 64 blkdev_open+0x85/0xd1 39) 720 96 __dentry_open+0x14b/0x28f 40) 624 48 nameidata_to_filp+0x51/0x76 41) 576 320 do_filp_open+0x514/0x9bc 42) 256 96 do_sys_open+0x71/0x131 43) 160 32 sys_open+0x33/0x49 44) 128 128 system_call_fastpath+0x16/0x1b
trace-cmd● Version 1.1-rc1
git://git.kernel.org/pub/scm/linux/kernel/git/rostedt/trace-cmd.git
trace-cmd● binary tool to read Ftrace's buffers
– Records into a trace.dat file for later reads– Reads the trace.dat file
● Can record on big endian, read in little, and vice versa– Reads the raw buffers using splice– Will automatically mount debugfs if it is not
mounted● Must have root access (sudo)
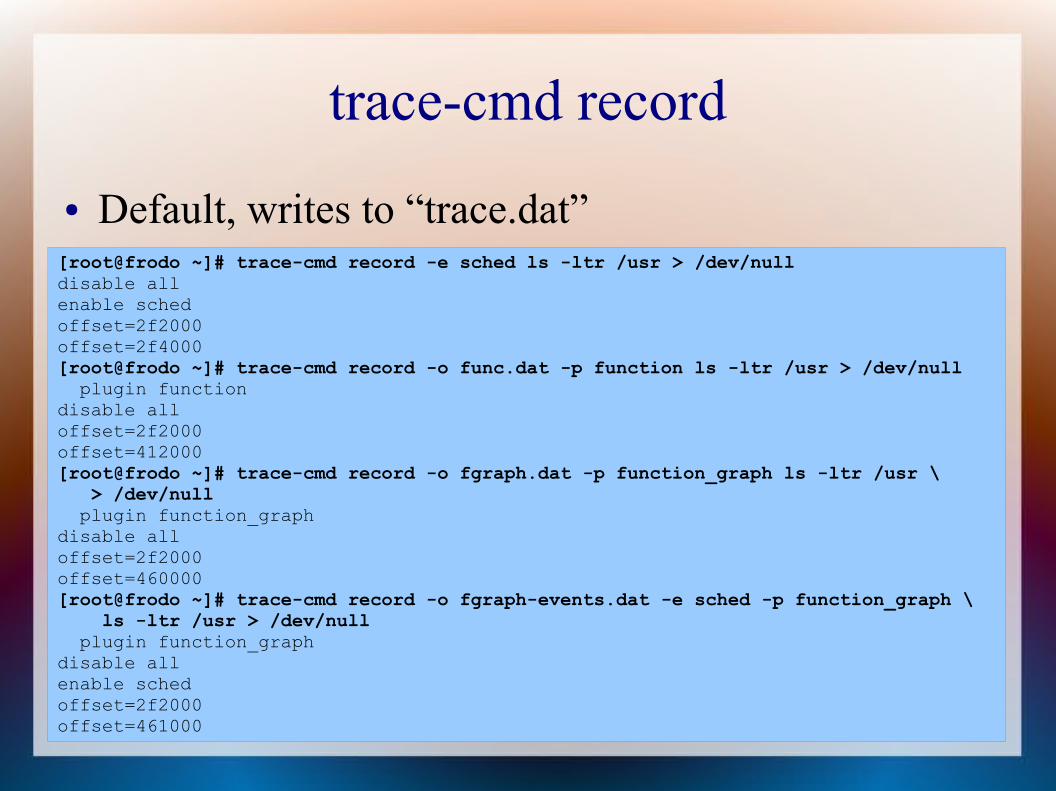
trace-cmd record
[root@frodo ~]# trace-cmd record -e sched ls -ltr /usr > /dev/nulldisable allenable schedoffset=2f2000offset=2f4000[root@frodo ~]# trace-cmd record -o func.dat -p function ls -ltr /usr > /dev/null plugin functiondisable alloffset=2f2000offset=412000[root@frodo ~]# trace-cmd record -o fgraph.dat -p function_graph ls -ltr /usr \ > /dev/null plugin function_graphdisable alloffset=2f2000offset=460000[root@frodo ~]# trace-cmd record -o fgraph-events.dat -e sched -p function_graph \ ls -ltr /usr > /dev/null plugin function_graphdisable allenable schedoffset=2f2000offset=461000
● Default, writes to “trace.dat”
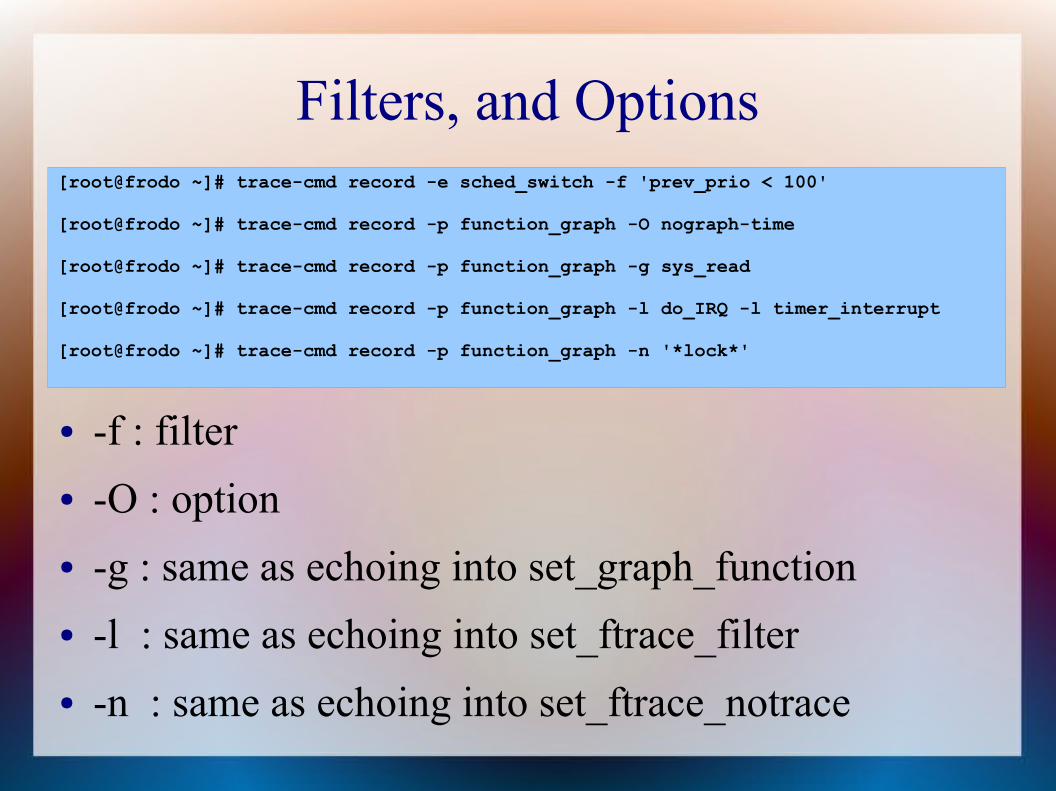
Filters, and Options[root@frodo ~]# trace-cmd record -e sched_switch -f 'prev_prio < 100'
[root@frodo ~]# trace-cmd record -p function_graph -O nograph-time
[root@frodo ~]# trace-cmd record -p function_graph -g sys_read
[root@frodo ~]# trace-cmd record -p function_graph -l do_IRQ -l timer_interrupt
[root@frodo ~]# trace-cmd record -p function_graph -n '*lock*'
● -f : filter● -O : option● -g : same as echoing into set_graph_function● -l : same as echoing into set_ftrace_filter● -n : same as echoing into set_ftrace_notrace

trace-cmd report● Default, reads from “trace.dat”[root@frodo ~]# trace-cmd report | head -15version = 6cpus=2 trace-cmd-6157 [000] 83.713584: sched_stat_runtime: task: trace-cmd:61 trace-cmd-6157 [000] 83.713591: sched_switch: 6157:120:S ==> 0:1 <idle>-0 [000] 83.713646: sched_stat_wait: task: trace-cmd:61 <idle>-0 [000] 83.713648: sched_switch: 0:120:R ==> 6158:1 ls-6158 [001] 83.713934: sched_wakeup: 6158:?:? + 5900: ls-6158 [001] 83.713935: sched_stat_runtime: task: trace-cmd:61 ls-6158 [001] 83.713937: sched_stat_runtime: task: trace-cmd:61 ls-6158 [001] 83.713938: sched_switch: 6158:120:R ==> 590 migration/1-5900 [001] 83.713941: sched_stat_wait: task: trace-cmd:61 migration/1-5900 [001] 83.713942: sched_migrate_task: task trace-cmd:615 migration/1-5900 [001] 83.713947: sched_switch: 5900:0:S ==> 0:120 ls-6158 [000] 83.714067: sched_stat_runtime: task: ls:6158 runt ls-6158 [000] 83.714636: sched_stat_runtime: task: ls:6158 runt
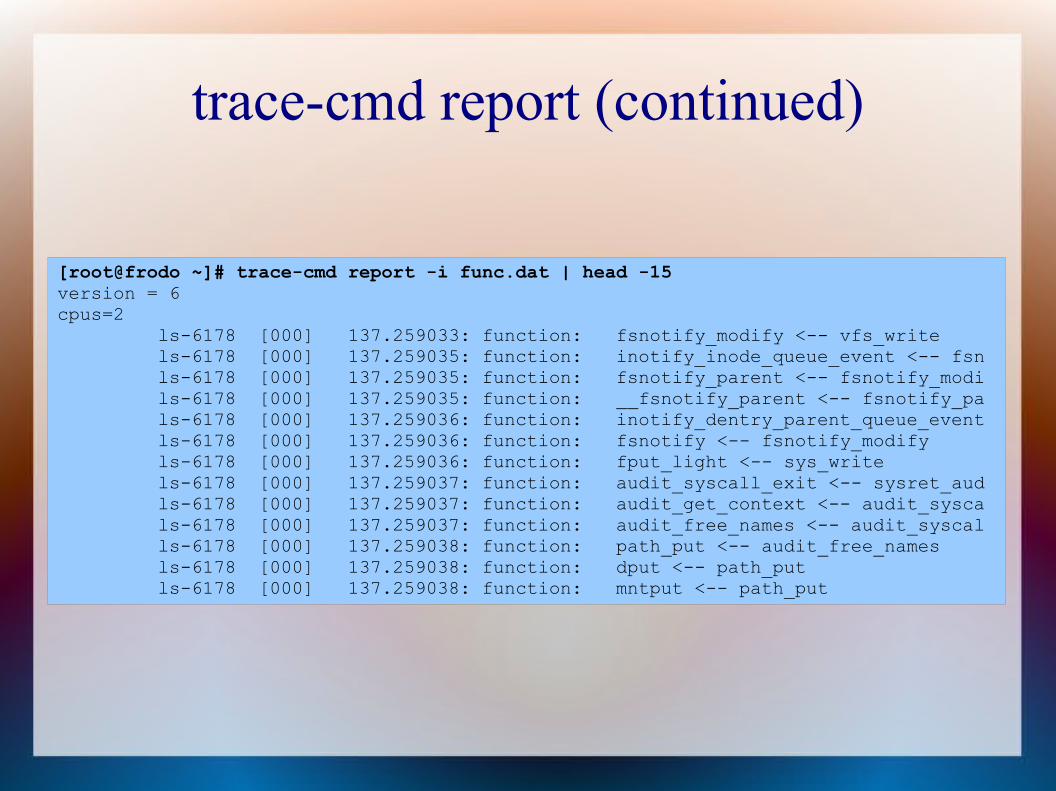
trace-cmd report (continued)
[root@frodo ~]# trace-cmd report -i func.dat | head -15version = 6cpus=2 ls-6178 [000] 137.259033: function: fsnotify_modify <-- vfs_write ls-6178 [000] 137.259035: function: inotify_inode_queue_event <-- fsn ls-6178 [000] 137.259035: function: fsnotify_parent <-- fsnotify_modi ls-6178 [000] 137.259035: function: __fsnotify_parent <-- fsnotify_pa ls-6178 [000] 137.259036: function: inotify_dentry_parent_queue_event ls-6178 [000] 137.259036: function: fsnotify <-- fsnotify_modify ls-6178 [000] 137.259036: function: fput_light <-- sys_write ls-6178 [000] 137.259037: function: audit_syscall_exit <-- sysret_aud ls-6178 [000] 137.259037: function: audit_get_context <-- audit_sysca ls-6178 [000] 137.259037: function: audit_free_names <-- audit_syscal ls-6178 [000] 137.259038: function: path_put <-- audit_free_names ls-6178 [000] 137.259038: function: dput <-- path_put ls-6178 [000] 137.259038: function: mntput <-- path_put
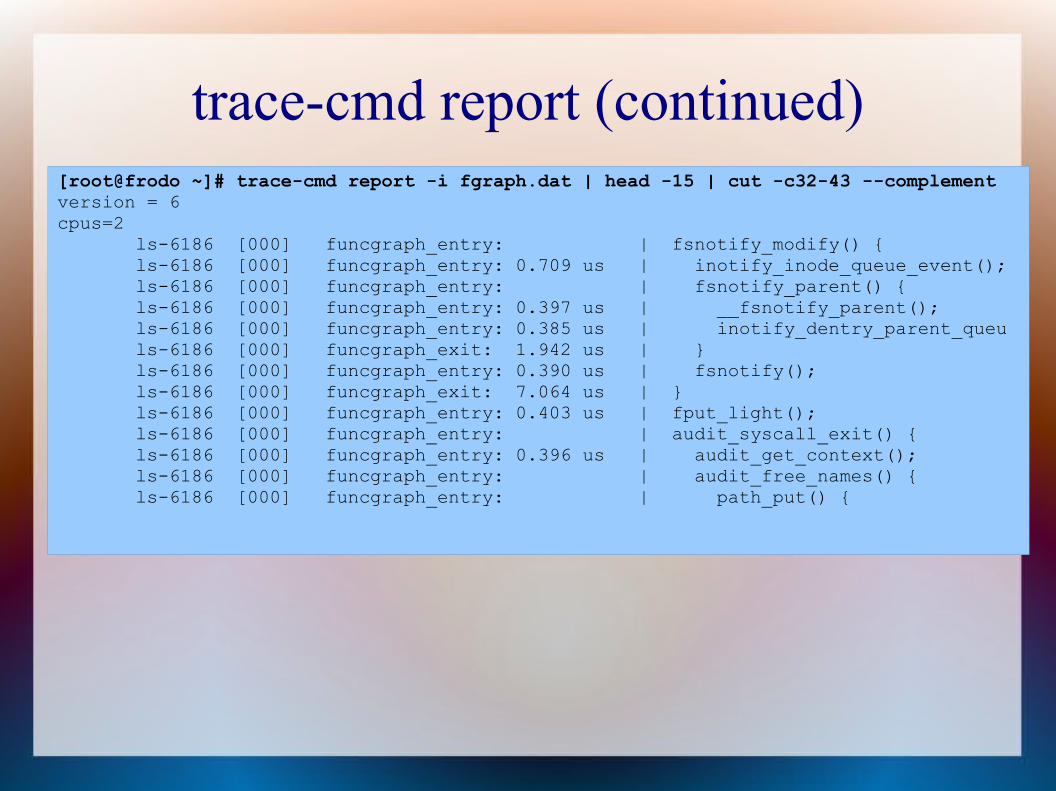
trace-cmd report (continued)[root@frodo ~]# trace-cmd report -i fgraph.dat | head -15 | cut -c32-43 --complementversion = 6cpus=2 ls-6186 [000] funcgraph_entry: | fsnotify_modify() { ls-6186 [000] funcgraph_entry: 0.709 us | inotify_inode_queue_event(); ls-6186 [000] funcgraph_entry: | fsnotify_parent() { ls-6186 [000] funcgraph_entry: 0.397 us | __fsnotify_parent(); ls-6186 [000] funcgraph_entry: 0.385 us | inotify_dentry_parent_queu ls-6186 [000] funcgraph_exit: 1.942 us | } ls-6186 [000] funcgraph_entry: 0.390 us | fsnotify(); ls-6186 [000] funcgraph_exit: 7.064 us | } ls-6186 [000] funcgraph_entry: 0.403 us | fput_light(); ls-6186 [000] funcgraph_entry: | audit_syscall_exit() { ls-6186 [000] funcgraph_entry: 0.396 us | audit_get_context(); ls-6186 [000] funcgraph_entry: | audit_free_names() { ls-6186 [000] funcgraph_entry: | path_put() {
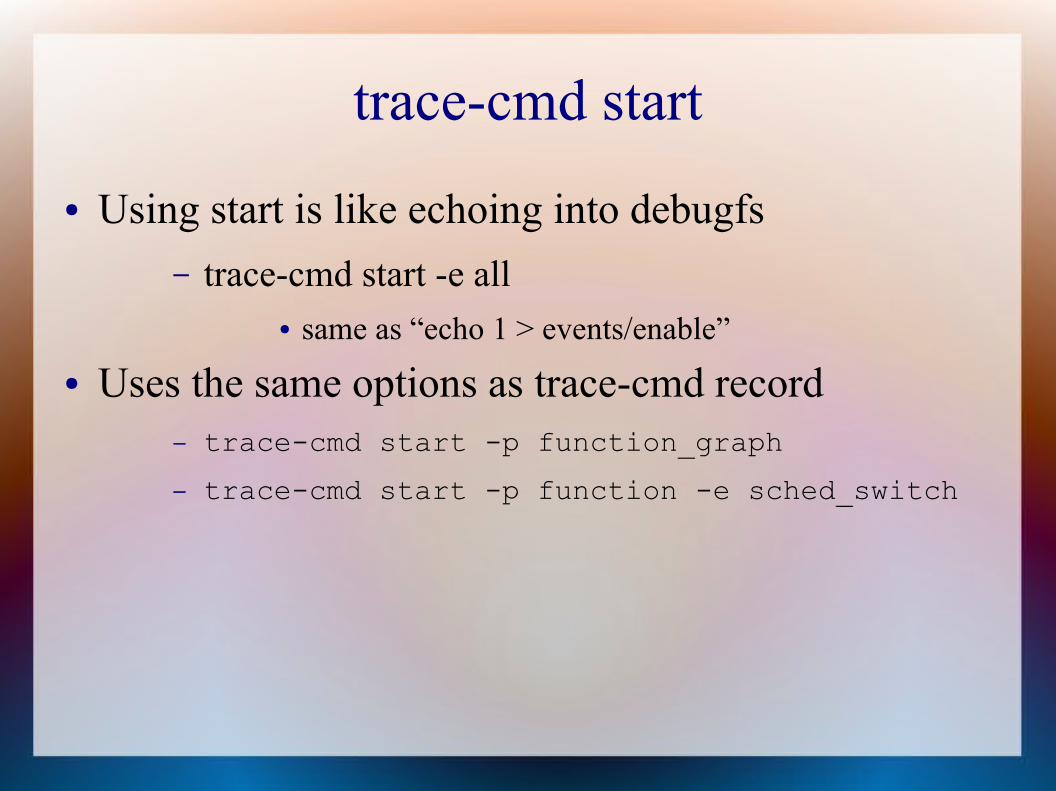
trace-cmd start● Using start is like echoing into debugfs
– trace-cmd start -e all● same as “echo 1 > events/enable”
● Uses the same options as trace-cmd record– trace-cmd start -p function_graph
– trace-cmd start -p function -e sched_switch
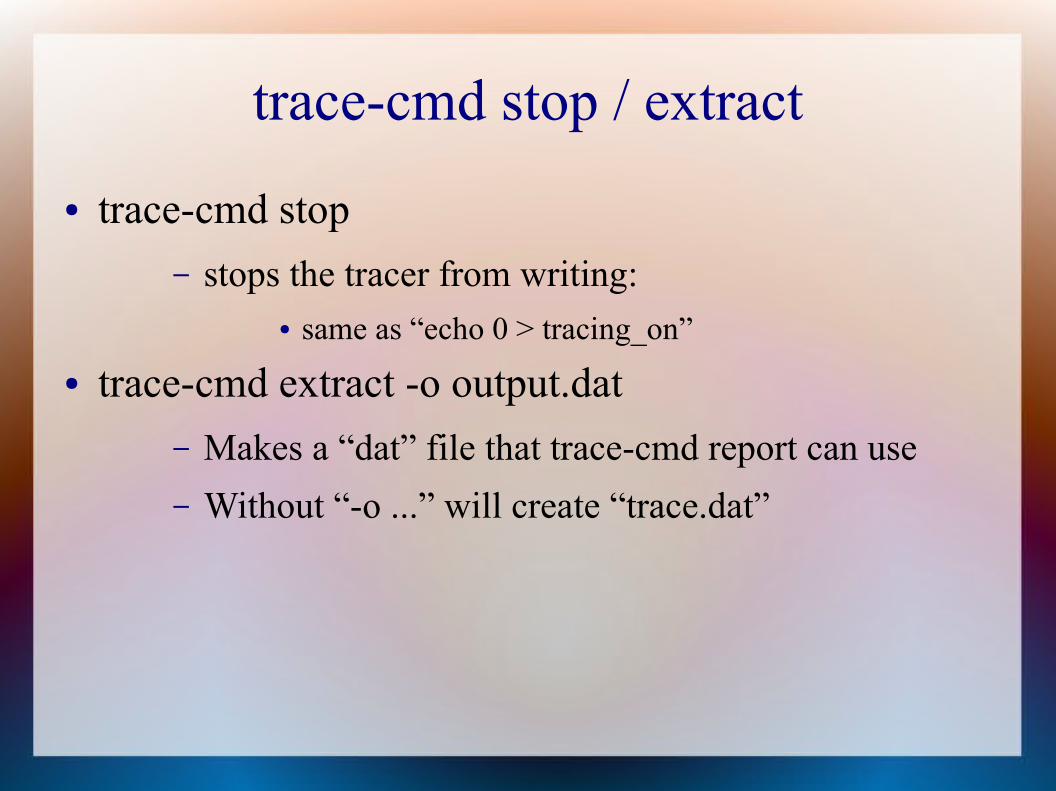
trace-cmd stop / extract● trace-cmd stop
– stops the tracer from writing:● same as “echo 0 > tracing_on”
● trace-cmd extract -o output.dat– Makes a “dat” file that trace-cmd report can use– Without “-o ...” will create “trace.dat”
trace-cmd reset● trace-cmd stop does not stop the overhead of tracing● trace-cmd reset disables all tracing
– trace-cmd reset
● Removes trace data from kernel– Do the extract before doing the reset
trace-cmd list● See the trace options, events or plugins
– trace-cmd list -o● shows list of trace options● these options are used by trace-cmd record -O option
– trace-cmd list -p● available plugins
– trace-cmd list -e● available events
trace-cmd split● Split by time, events, CPU
– trace-cmd split 258.121328● splits from timestamp to end of file
– trace-cmd split -e 1000● splits out the first 1000 events
– trace-cmd split -m 1 -r 258.121328 259.000000● split 1 millisecond starting at first timestamp
to second timestamp repeatedly– trace.dat.1, trace.dat.2, ...
trace-cmd listen● listen for connections from other boxes
– trace-cmd listen -p 5678 -d
● Record can now send to that box– trace-cmd record -N host:5678 -e all
– use “-t” to force TCP otherwise trace data is sent via UDP
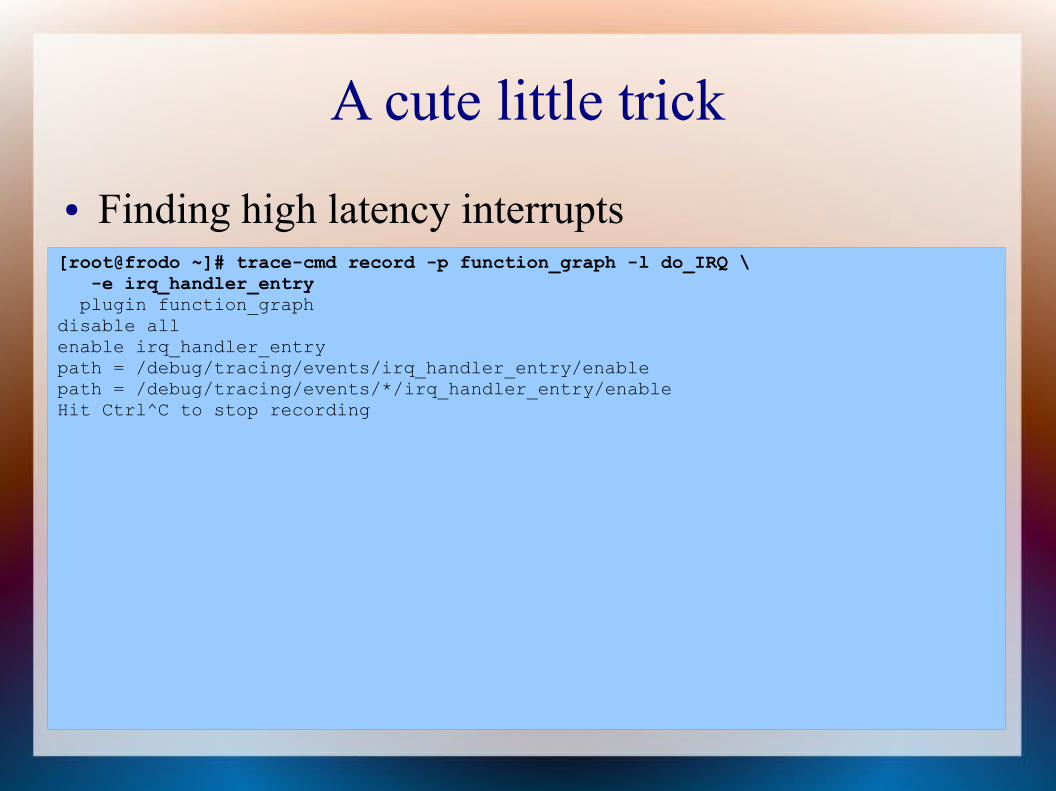
A cute little trick
[root@frodo ~]# trace-cmd record -p function_graph -l do_IRQ \ -e irq_handler_entry plugin function_graphdisable allenable irq_handler_entrypath = /debug/tracing/events/irq_handler_entry/enablepath = /debug/tracing/events/*/irq_handler_entry/enableHit Ctrl^C to stop recording
● Finding high latency interrupts
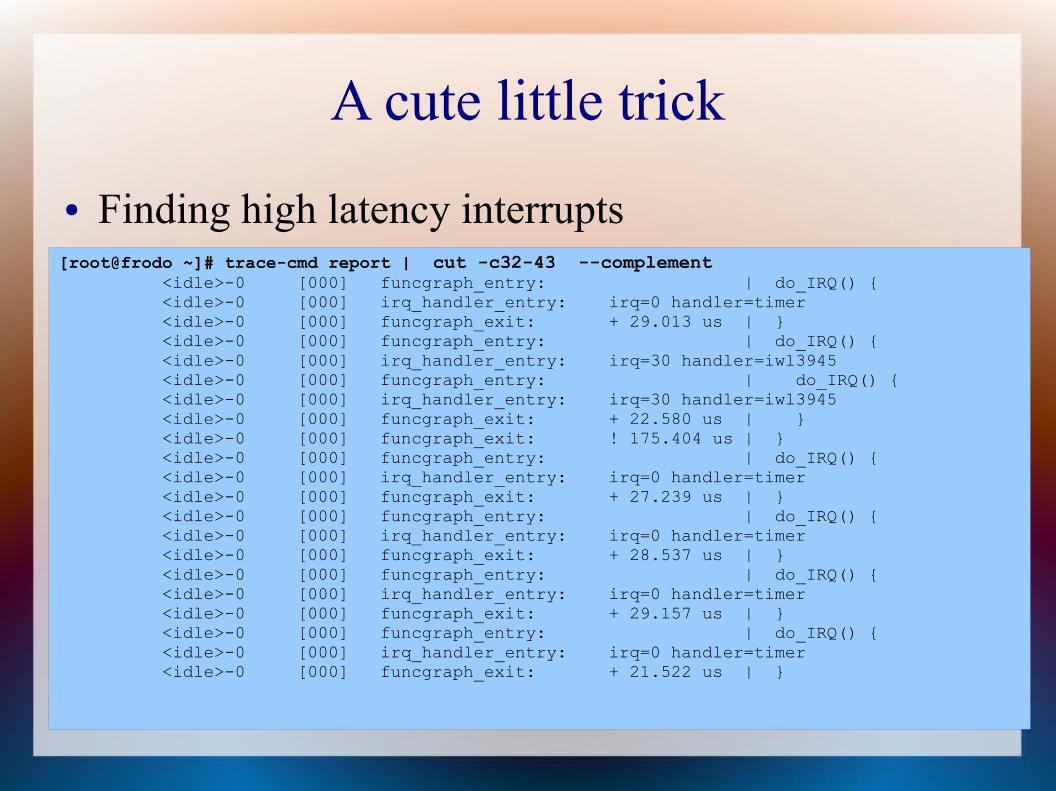
A cute little trick
[root@frodo ~]# trace-cmd report | cut -c32-43 --complement <idle>-0 [000] funcgraph_entry: | do_IRQ() { <idle>-0 [000] irq_handler_entry: irq=0 handler=timer <idle>-0 [000] funcgraph_exit: + 29.013 us | } <idle>-0 [000] funcgraph_entry: | do_IRQ() { <idle>-0 [000] irq_handler_entry: irq=30 handler=iwl3945 <idle>-0 [000] funcgraph_entry: | do_IRQ() { <idle>-0 [000] irq_handler_entry: irq=30 handler=iwl3945 <idle>-0 [000] funcgraph_exit: + 22.580 us | } <idle>-0 [000] funcgraph_exit: ! 175.404 us | } <idle>-0 [000] funcgraph_entry: | do_IRQ() { <idle>-0 [000] irq_handler_entry: irq=0 handler=timer <idle>-0 [000] funcgraph_exit: + 27.239 us | } <idle>-0 [000] funcgraph_entry: | do_IRQ() { <idle>-0 [000] irq_handler_entry: irq=0 handler=timer <idle>-0 [000] funcgraph_exit: + 28.537 us | } <idle>-0 [000] funcgraph_entry: | do_IRQ() { <idle>-0 [000] irq_handler_entry: irq=0 handler=timer <idle>-0 [000] funcgraph_exit: + 29.157 us | } <idle>-0 [000] funcgraph_entry: | do_IRQ() { <idle>-0 [000] irq_handler_entry: irq=0 handler=timer <idle>-0 [000] funcgraph_exit: + 21.522 us | }
● Finding high latency interrupts
KernelShark● A front end reader of the trace-cmd trace.dat file● Graph view● List view● Simple and Advance filtering● Still in Beta (for now)
In trace-cmd git repo (make gui)http://rostedt.homelinux.com/kernelshark [help menu]
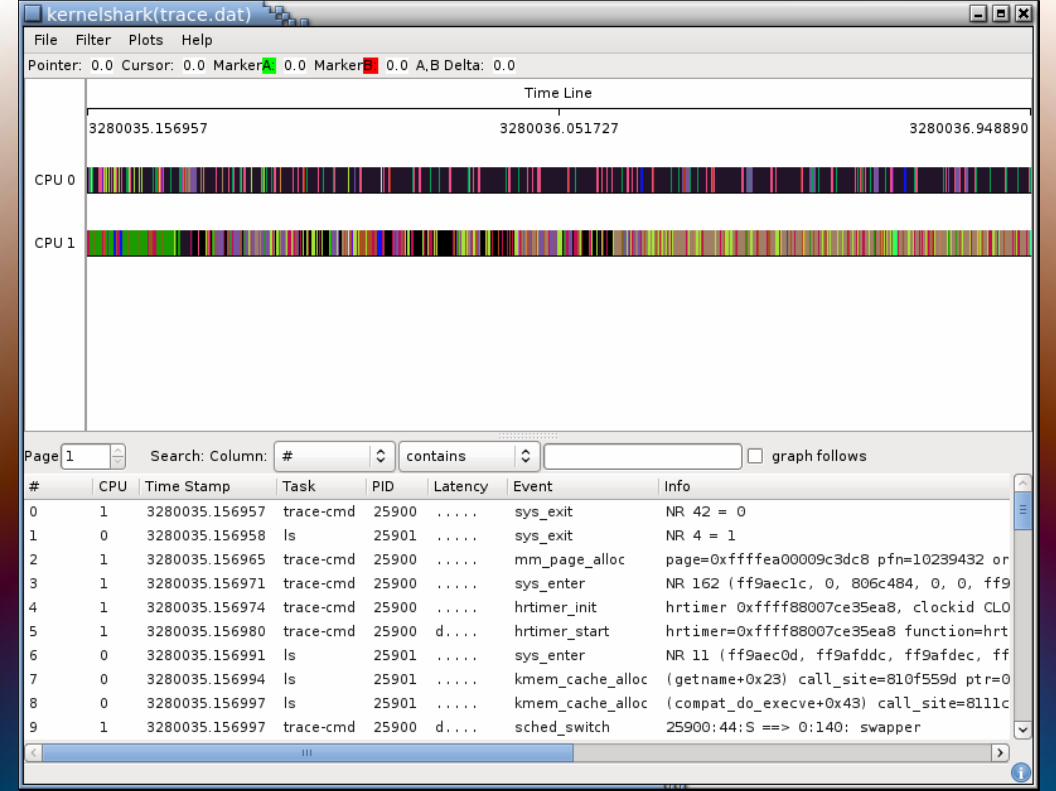

Kernel Shark
Demo!

Questions?

Questions?