documentation of geographic-information-system …documentation of geographic-information-system...
TRANSCRIPT

DOCUMENTATION OF GEOGRAPHIC-INFORMATION-SYSTEM COVERAGES AND
DATA-INPUT FILES USED FOR ANALYSIS OF THE GEOHYDROLOGY OF THE
VIRGINIA COASTAL PLAIN
By Michael J. Focazio and Theodore B. Samsel, in
U.S. GEOLOGICAL SURVEY
Water-Resources Investigations Report 93-4015
Prepared in cooperation with the
HAMPTON ROADS PLANNING DISTRICT COMMISSION and the
VIRGINIA WATER CONTROL BOARD
Richmond, Virginia
1993
U.S. DEPARTMENT OF THE INTERIOR
BRUCE BABBITT, Secretary
U.S. GEOLOGICAL SURVEY
Dallas L. Peck, Director
For additional information write to:
District ChiefU.S. Geological Survey3600 West Broad Street, Room 606Richmond, VA 23230
Copies of this report can be purchased from:
U.S. Geological Survey Books and Open-File Reports Section Box 25425, Denver Federal Center Denver, CO 80225

CONTENTS
Page
Abstract........................................................................ 1Introduction..................................................................... 1
Purpose and scope ............................................................ 1Previous studies .............................................................. 2
Documentation of geographic information system coverages.............................. 3Geohydrologic-framework maps................................................. 3Digital-line graphs............................................................ 6Digital-elevation models ....................................................... 6Water use ................................................................... 7Ground-water-flow model ...................................................... 7
Finite-difference grid ..................................................... 7Input point and polygon coverages........................................... 7Boundary fluxes ......................................................... 9Output polygon coverages ................................................. 9
Documentation of the data-input files................................................. 9Basic-package input........................................................... 9Block-centered flow-package input............................................... 9Well-package input............................................................ 9
Summary....................................................................... 9Selected references............................................................... 11Glossary ....................................................................... 13
ILLUSTRATIONS
Page
Figures 1-6. Maps showing:1. Location of selected previous U.S. Geological Survey studies in the
Coastal Plain physiographic province of Virginia..................... 22. Altitude of top of lower Potomac aquifer-coverage AQ1TOP.UTM......... 43. Limits of lower Potomac aquifer-coverage LIMITAQ1................... 54. Limit of lower Potomac confining unit-coverage LIMITCU1.UTM......... 65. Finite-difference grid for ground-water-flow model of the Virginia
Coastal Plain ................................................. 86. Simulated altitude of water levels in lower Potomac aquifer (1980).......... 10
111

TABLES
Page
Table 1. List of coverage items.................................................... 172. Documentation of BASEMENT.UTM....................................... 183. Documentation of AQ1TOP.UTM .......................................... 184. Documentation of AQ2TOP.UTM .......................................... 195. Documentation of AQ3TOP.UTM .......................................... 196. Documentation of AQ4TOP.UTM .......................................... 207. Documentation of AQ6TOP.UTM .......................................... 208. Documentation of AQ7TOP.UTM .......................................... 219. Documentation of AQ8TOP.UTM .......................................... 21
10. Documentation of AQ9TOP.UTM .......................................... 2211. Triangular-irregular-network descriptions for altitudes of aquifer tops.............. 2212. Documentation of LIMITAQ1 ............................................. 2313. Documentation of LIMITAQ2 ............................................. 2314. Documentation of LIMITAQ3 ............................................. 2415. Documentation of LIMITAQ4 ............................................. 2416. Documentation of LIMITAQ5 ............................................. 2517. Documentation of LIMITAQ6 ............................................. 2518. Documentation of LIMITAQ7 ............................................. 2619. Documentation of LIMITAQ8 ............................................. 2620. Documentation of LIMITAQ9 ............................................. 2721. Documentation of CU1THICK............................................. 2722. Documentation of CU2THICK............................................. 2823. Documentation of CU3THICK............................................. 2824. Documentation of CU4THICK............................................. 2925. Documentation of CU5THICK............................................. 2926. Documentation of CU6THICK............................................. 3027. Documentation of CU7THICK............................................. 3028. Documentation of CU8THICK............................................. 3129. Documentation of CU9THICK............................................. 3130. Triangular-irregular-network descriptions for altitudes of confining-unit tops ........ 3231. Documentation of LIMITCU1 ............................................. 3232. Documentation of LIMITCU2 ............................................. 3333. Documentation of LIMITCU3 ............................................. 3334. Documentation of LIMITCU4 ............................................. 3435. Documentation of LIMITCU5 ............................................. 3436. Documentation of LIMITCU6 ............................................. 3537. Documentation of LIMITCU7 ............................................. 35
IV

TABLES-Continued
Page
Table 38. Documentation of LIMITCU8 ............................................. 3639. Documentation of LIMITCU9 ............................................. 3640. Documentation of FRAMEWORK.PLY ..................................... 3741. Documentation of NCCOUNTY.UTM....................................... 37
42. Documentation of OUTLINE.UTM (NC) .................................... 3843. Documentation of COUNTY.UTM (VA)..................................... 3844. Documentation of OUTLINE. UTM(VA) .................................... 3945. Documentation of CP.OUT................................................ 3946. Documentation of CP .................................................... 4047. Triangular-irregular-network descriptions for digital-elevation models.............. 4048. Documentation of DEMGRID.PNT......................................... 4149. Documentation of PP1.PNT............................................... 4150. Documentation of PP2.PNT ............................................... 4251. Documentation of PP3.PNT ............................................... 4252. Documentation of PP4.PNT............................................... 4353. Documentation of PP5.PNT............................................... 4354. Documentation of PP6.PNT............................................... 4455. Documentation of PP7.PNT............................................... 4456. Documentation of PP8.PNT ............................................... 4557. Documentation of PP9.PNT ............................................... 4558. Documentation of PP10.PNT .............................................. 4659. Documentation of RASAGRID.LNE........................................ 4660. Documentation of RASGIS.PNT ........................................... 4761. Documentation of TEMPGRID2.PLY ....................................... 4762. Documentation of BND1.FLX.PLY......................................... 4863. Documentation of BND2.FLX.PLY......................................... 4864. Documentation of BND3.FLX.PLY......................................... 4965. Documentation of BND4.FLX.PLY......................................... 4966. Documentation of BND5.FLX.PLY......................................... 5067. Documentation of BND6.FLX.PLY......................................... 5068. Documentation of BND7.FLX.PLY......................................... 5169. Documentation of BND8.FLX.PLY......................................... 5170. Documentation of BND9.FLX.PLY......................................... 5271. Documentation of BND10.FLX.PLY........................................ 5272. Documentation of HEADOUT T.PLY....................................... 53

CONVERSION FACTORS, VERTICAL DATUM, ABBREVIATED HYDRAULIC UNITS,AND ACRONYMS
Multiply Bv To obtain
foot (ft) 0.3048 metermile (mi) 1.609 kilometersquare mile (mi2) 2.590 square kilometerfoot per day (ft/d) 0.3048 meter per dayfoot squared per day (ft2/d) 0.0929 cubic meter per secondcubic foot per second (ft^/s) 0.02832 cubic meter per secondmillion gallons per day (Mgal/d) 0.04381 cubic meters per second
Sea level: In this report, "sea level" refers to the National Geodetic Vertical Datum of 1929--a geodetic datum derived from a general adjustment of the first-order level nets of the United States and Canada, formerly called Sea Level Datum of 1929.
Hydraulic conductivity and transmissivitv: In this report, hydraulic conductivity is reported in foot per day (ft/d), a mathematical reduction of the unit cubic foot per day per square foot [(ftVdyft2]. Transmissivity is reported in foot square per day (ft^d), a mathematical reduction of the unit cubic foot per day per square foot times feet of aquifer thickness ([(ftVdyft^ft).
List of acronyms:
AAT: Arc attribute table. A table associated with an arc coverage that stores attribute information forthat coverage.
DEM: Digital-elevation model. A data file that represents a topographic surface denned by regularlyspaced Cartesian coordinates in three dimensions.
DLG: Digital-line graph. A format for digital data. Fortran: Formula translation. GIS: Geographic information system. A computerized system used to manipulate, analyze, and
display geographic data in digital form. PAT: Point (or polygon) attribute table. A table associated with a point (or polygon) coverage that
stores attribute information for that coverage. TIN: Triangular irregular network. A representation of a surface derived from irregularly sampled
points. UTM: Universal Transverse Mercator.
VI

DOCUMENTATION OF GEOGRAPHIC-INFORMATION-SYSTEM COVERAGES AND DATA-INPUT FILES USED FOR ANALYSIS OF THE GEOHYDROLOGY
OF THE VIRGINIA COASTAL PLAIN
By Michael J. Focazio and Theodore B. Samsel, III
ABSTRACT
This report documents geographic-informa tion-system coverages1 and data-input files for a ground-water-flow model, which are used for anal ysis of the ground-water resources of the Coastal Plain physiographic province of Virginia. The cov erages include the altitude of aquifer tops, area! limits of the aquifers, confining-unit thickness and area! extent, geographic and political boundaries, ground-water use, and coverages needed for the regional ground-water-flow model of the Coastal Plain physiographic province of Virginia. Input files for the regional ground-water-flow model also are documented.
INTRODUCTION
The Coastal Plain physiographic province of Virginia is underlain by a seaward-sloping wedge of unconsolidated clastic sediments of Early Creta ceous to Holocene age that lies unconformably on consolidated bedrock. These sediments form a lay ered system of aquifers and confining units that supply ground water to users throughout the area. As demand for these ground-water resources increases, management tools, such as ground- water-flow models, become of crucial importance to help guide ground-water-resource-management decisions. Development and use of these manage ment tools will be more efficient if digital informa-
^erms defined in the glossary are in bold print where first used in this report.
tion from previous studies is retained and updated. The U.S. Geological Survey (USGS), in coopera tion with the Hampton Roads Planning District Commission and the Virginia Water Control Board, developed a geographic information system (GIS) to store and spatially relate information and data from previous studies. This GIS interfaces with a ground-water-flow model of the entire Coastal Plain physiographic province. Focazio (1990) described the GIS and gives examples of its applications.
Purpose and Scope
The purpose of this report is to document the GIS coverages for ground-water resources in the Coastal Plain physiographic province of Virginia. These coverages are based on data and information derived from previous studies. The coverages include point, line, and polygon coverages of basic geohydrologic features, such as altitudes of aquifer tops, as well as complex coverages of input and output files for a regional ground-water-flow model. The documentation describes numerous characteristics of the coverages, including the type, source, original scale, and items contained in the coverage. Many coverages can be, and were, derived from other documented coverages. Many of the derivative coverages are documented in this report; others were temporarily established for short-term use. The documentation can help ground-water resource agencies to determine which coverages are of interest by providing detailed reference information on the coverages and files. Coverage files can be requested from the
78' 77'76
75'
39
78
39
West Virginia
Maryland
North Carolina Coastal Plaii Physiographi Province
Location Map
SOUTHEASTERN VIRGINIA STUDY AREA (Hamilton and Larson, 1988)
YORK-JAMES PENINSULA STUDY AREA (Laczniak and Meng, 1988)
50 MILES
North Carolina
50 KILOMETERS
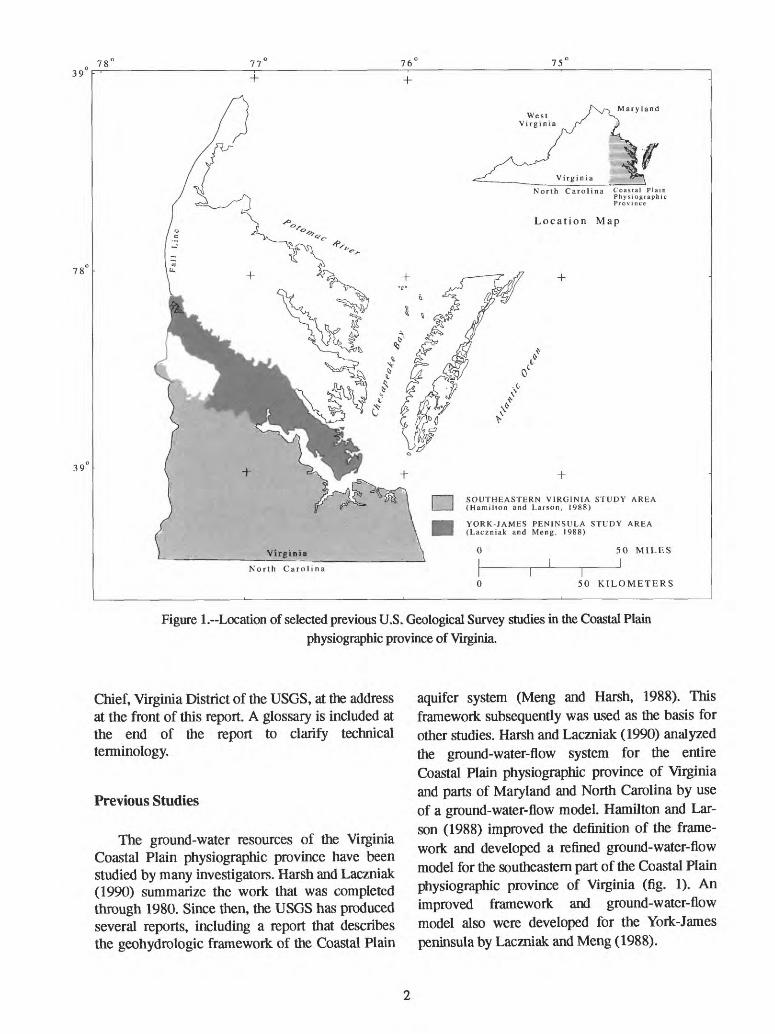
Figure 1. Location of selected previous U.S. Geological Survey studies in the Coastal Plainphysiographic province of Virginia.
Chief, Virginia District of the USGS, at the address at the front of this report. A glossary is included at the end of the report to clarify technical terminology.
Previous Studies
The ground-water resources of the Virginia Coastal Plain physiographic province have been studied by many investigators. Harsh and Laczniak (1990) summarize the work that was completed through 1980. Since then, the USGS has produced several reports, including a report that describes the geohydrologic framework of the Coastal Plain
aquifer system (Meng and Harsh, 1988). This framework subsequently was used as the basis for other studies. Harsh and Laczniak (1990) analyzed the ground-water-flow system for the entire Coastal Plain physiographic province of Virginia and parts of Maryland and North Carolina by use of a ground-water-flow model. Hamilton and Lar son (1988) improved the definition of the frame work and developed a refined ground-water-flow model for the southeastern part of the Coastal Plain physiographic province of Virginia (fig. 1). An unproved framework and ground-water-flow model also were developed for the York-James peninsula by Laczniak and Meng (1988).

DOCUMENTATION OF GEOGRAPHIC INFORMATION SYSTEM COVERAGES
The GIS coverages are stored and manipulated as points, lines, and polygons by use of an ARC/INFO2. Commonly, these different features are stored as separate layers for subsequent map overlays and manipulations. Most coverages were digitized directly from original copies of the source maps. Others were derived from software that combined previously digitized coverages and other sources of information. The point, line, and polygon coverages were assigned unique descrip tive and spatial information during the digitizing and (or) software-manipulation process that became a part of the coverage. After digitizing, all data sets were geometrically transformed into the Universal Transverse Mercator (UTM) map pro jection. The digitized data were then built into a coverage that was stored in the GIS. Data for the coverages came from different sources, including thematic maps and input and output files for the ground-water-flow model.
Point, line, and polygon coverages also can be represented as interpolated surfaces by applying ARC/INFO's triangular-irregular-network (TIN) subsystem. This process was described by Focazio (1990).
Many customized ARC/INFO subsystems, Fortran programs, and other software interfaces were developed for use with the GIS. Among the software are documentation programs that describe the contents and other pertinent information on individual coverages. This information is incorpo rated into the data base for each coverage. The doc umentation programs contain a long and short form; the long form, however, contains information on individual-coverage topology that is not neces sary for the purpose and scope of this report.
The tables at the back of this report are edited versions of the output of the short-form documen tation program. The editing was necessary to create and format concise tables that include only the information needed for this publication; thus, the
The use of trade or product names in this report is for identifica tion purposes only, and does not constitute endorsement by the U.S. Geological Survey.
tables do not contain all of the information from the documentation file for each individual cover age. That information is available with the cover age. Descriptions of items associated with the coverages that were documented for this report are listed in table 1.
Geohydrologic-Framework Maps
The geohydrologic framework of the Coastal Plain aquifer system was described by Meng and Harsh (1988), and revised by Hamilton and Larson (1988) and Laczniak and Meng (1988). This framework defines the aquifers and confining units that constitute the system. Maps of the altitudes of aquifer tops, altitude of the basement, confining- unit thickness, and aquifer and confining-unit lim its were combined to create new maps that incorpo rated the interpretations from all three studies. Each new map was then digitized as a line coverage.
The altitude of the top of the basement map (BASEMENT.UTM) represents the altitude of the base of the Coastal Plain aquifer system. The cov erage is documented in table 2.
The lower Potomac aquifer is the deepest aqui fer in the stratigraphic sequence and, therefore, is denned as aquifer 1 (AQ1). Successive overlying aquifers are numbered sequentially, ending with the uppermost aquifer, AQ10 (the Columbia aqui fer). Coverages of altitudes of aquifer tops are doc umented in tables 3-10. The top of aquifer 10 is the water table and is not documented as a separate coverage, but is part of the TEMPGRID2.PLY cov erage that is described in the "Input Point and Poly gon Coverages" section of this report. The PeeDee aquifer (AQ5) exists in the North Carolina Coastal Plain but not in the Virginia Coastal Plain; there fore, aquifer 5 is not documented separately. The top of aquifer 5 is, however, part of FRAME- WORK.PLY and TEMPGRID2.PLY, because it is an active part of the regional ground-water-flow model where the model extends into North Caro lina. The altitude of the top of the lower Potomac aquifer (AQ1TOPUTM; fig. 2) is an example of the type of coverage stored for aquifer tops. Con tours of altitudes were extended beyond the limit of the study area to establish reasonable values at and

79 78 77 76 75 74
39 -
38 _
37 -
36
35
EXPLANATION
-400 STRUCTURE CONTOUR Shows altitude of top of lower Potomac aquifer. Contour interval, in feet, is variable. Datum is sea level
Note: Structure contours extend beyondthe aquifer limit for subsequent GIS applications 50 MILES
50 KILOMETERS
Figure 2. Altitude of top of lower Potomac aquifer-coverage AQ1TOP.UTM.
near the limit of the unit for subsequent GIS inter polations. Interpolated TIN surfaces of the aquifer tops also were created and are described in table 11.
The aquifer limits (LIMITAQ1 for aquifer 1) are stored as line coverages and are separate from the aquifer-top coverages. This separation is neces sary so that the aquifer limits can be used as a clip coverage, and so other types of applications can be facilitated. The coverages consist of three parts: the updip limit of the aquifer, the flow-model boundary, and the seaward limit of the freshwater system. The aquifer-limit coverages for an individ
ual aquifer are further divided into two different coverages. One of these coverages only represents the areal extent of the aquifer. The other coverage represents a combination of features; including, the areal extent of the aquifer and the limits of the finite-difference grid for the ground-water-flow model (see "Ground-Water-Flow Model" section). These coverages are documented in tables 12-20. The limit of the lower Potomac aquifer (LIMI- TAQ1) is shown as an example of aquifer-limit coverages (fig. 3). Line coverages of the limits without the model boundaries are named LIMI- T#.UTM ("#" represents the aquifer number) and are not documented separately.

79'78 77
76' 75' 74'
39 -
38
37
36'
35
EXPLANATION
INACTIVE PART OF GROUND-WATER-FLOW MODEL
-- ESTIMATED SEAWARD LIMIT OF FRESHWATER FLOW SYSTEM -- Less than 10,000 milligrams per liter chloride.
APPROXIMATE WESTERN LIMIT OF AQUIFER
/ o 50 MILES
50 KILOMETERS
Figure 3.~Limits of lower Potomac aquifer-coverage LIMITAQl.
Coverages of confining-unit thicknesses are documented in tables 21-29 as CU#TH ("#" repre sents the confining-unit number). The confining unit directly overlying the lower Potomac aquifer is the deepest in the stratigraphic sequence and is defined as confining unit 1 (GUI). Successive overlying confining units are numbered sequen tially ending with the uppermost confining unit, CU9 (the Yorktown-Eastover). Coverage of thick ness of confining unit 5 (table 25) was created by digitizing the altitude data of the top of CU5 directly from paper copy and subtracting the alti tude of AQ5 from the top of CU5 with the CIS commands. All other confining-unit thickness cov
erages were digitized directly from the paper cop ies. A model of the altitudes of confining-unit tops (other than CU5) was generated by custom soft ware that added the confining-unit thickness data to altitudes of the appropriate aquifer tops to calculate the altitudes of the confining units. The TIN's of the altitudes of the tops of all confining units are described in table 30.
Confining-unit-limit data also were recorded as line coverages and are separate from the confining- unit-top coverages to facilitate different types of applications. The coverages consist of the updip limit of the confining unit combined with the flow-

79 78 77 76 7574'
39
38
37
36
35
EXPLANATION
INACTIVE PART OF GROUND-WATER-FLOW MODEL
--- APPROXIMATE LIMIT OF CONFINING UNIT TOP 50 MILES
50 KILOMETERS
Figure 4.~Limit of lower Potomac confining unit-coverage LIMITCUI.UTM.
model boundaries. The coverages are documented in tables 31-39. An example of the confining-unit limit for the lower Potomac confining unit (LIM- ITCU1) is shown in figure 4. Line coverages of the limits without the model boundaries are named LIMITCUI.UTM ("#" represents the confining- unit number) and are not documented separately.
Each feature in the geohydrologic framework was incorporated into a polygon coverage (FRAMEWORK.PLY) where an individual poly gon represents one block within the finite-differ ence grid of the flow model (Focazio, 1990). This coverage contains data for the tops of aquifer and confining units for each polygon (or finite-differ
ence block) described below. Focazio (1990) pro vides further discussion of this coverage and possible applications. The documentation of this derivative coverage is listed in table 40.
Digital-Line Graphs
Several digital-line graphs (DLG) of the study area were obtained as preexisting GIS coverages and are recorded in the Coastal Plain physiographic province GIS. Digital-line graphs represent politi cal, geographic, and physiographic features. These coverages are documented in tables 41-46.

Digital-Elevation Models Ground-Water-Flow Model
Digital-elevation-model (DEM) data from four of the 1:250,000 topographic maps in the Coastal Plain physiographic province were manipulated by ARC/INFO subsystems to create TIN's of the land- surface elevation. These TIN's represent a continu ous surface of interpolated elevations and can be used with any point coverage in the Coastal Plain to determine land-surface elevation at the location of the points by the TINSPOT subsystem in ARC/ INFO. The TIN's are documented in table 47. Each of the four topographic maps (one each for Nor folk, Chincoteague, and Richmond, Va., and Wash ington, D.C.) were divided into a western half and an eastern half, and each half was further divided into a left half and a right half; thus, each map was divided into four sections for data-manipulation purposes. The coverages were named to represent this division. For example, the TIN for the left half of the western Chincoteague panel is named CHIN_W.L.TIN. The panels include Norfolk, Chincoteague, and Richmond, Va., and Washing ton, D.C.
Values of elevation from the TIN's were extracted for each node of the ground-water-flow model by the TINSPOT subsystem and used to populate a point coverage. This derivative cover age (DEMGRID.PNT) is documented in table 48 and also contains the geohydrologic framework.
Water Use
Harsh and Laczniak (1990) simulated the ground-water-flow system with ground-water with drawals (including industrial, commercial, and public-supply uses) that were divided into 10 pumping periods of variable time lengths from 1890 through 1980. Focazio (1990) updated these data to include data from 1981 through 1986. Point coverages were created for each of these pumping periods that contain information about the spatial location of each well and the amount of water pumped from each aquifer by each well. The point- coverage data contain the latitude and longitude of each well and pumpage rates (in Mgal/d) from each aquifer and are described in tables 49-58. The cov erages are identified as PP#.PNT ("#" represents the pumping-period number).
Geohydrologic data and interpretive informa tion from the ground-water-flow models (Hamilton and Larson, 1988; Laczniak and Meng, 1988; Harsh and Laczniak, 1990) were incorporated into a refined ground-water-flow model of the entire Coastal Plain physiographic province of Virginia (Focazio, 1990). Several components of this model were stored as coverages for future applications.
Finite-Difference Grid
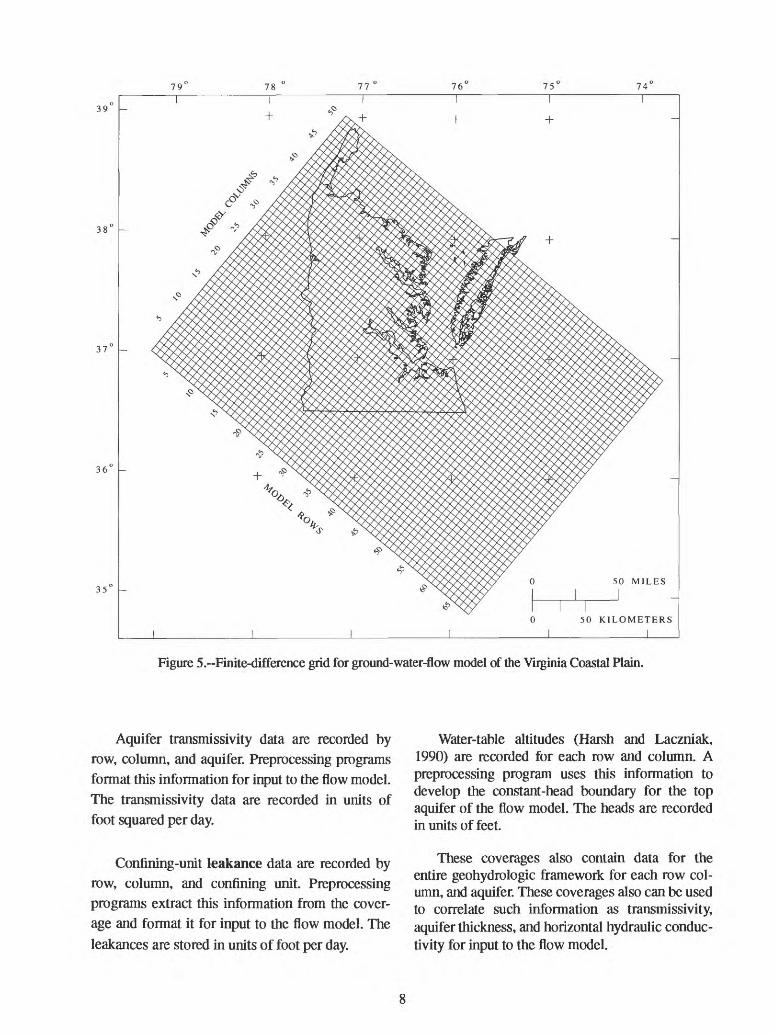
The orientation and geometry of the finite-dif ference grid was obtained from the model devel oped by Harsh and Laczniak (1990). The grid consists of 68 rows and 50 columns. Each grid cell is 3.5 mi on each side. A line coverage was created that represents the finite-difference grid for the entire model domain (fig. 5). The coverage (RASAGRID.LNE) is documented in table 59. There are no features in this coverage other than the lines of the finite-difference grid. Accordingly, this coverage is only used to plot the finite-differ ence grid quickly and efficiently.
Input Point and Polygon Coverages
The finite-difference grid described above also was generated as a point coverage and a polygon coverage. The point coverage (RASGIS.PNT) con tains information describing the spatial location of each of the 3,400 nodes in the finite-difference grid. The polygon coverage (TEMPGRID2.PLY) contains spatial information for each of the 3,400 blocks in the grid, as well as information about the area of each block. The point coverage can be used for certain applications (such as TINSPOT) and the polygon coverage can be used for other types of applications (such as area-weighted averaging). Brief descriptions of these applications are dis cussed in Focazio (1990). Some of the information in these coverages duplicates the information in coverages that were described in previous sections of this report; however, it is preferable to organize the information this way for other applications. These coverages are documented in tables 60-61 and are described as follows:
39 -
38 -
36 -
35 -
Figure 5.-Finite-difference grid for ground-water-flow model of the Virginia Coastal Plain.
Aquifer transmissivity data are recorded by row, column, and aquifer. Preprocessing programs format this information for input to the flow model. The transmissivity data are recorded in units of foot squared per day.
Confining-unit leakance data are recorded by row, column, and confining unit. Preprocessing programs extract this information from the cover age and format it for input to the flow model. The leakances are stored in units of foot per day.
Water-table altitudes (Harsh and Laczniak, 1990) are recorded for each row and column. A preprocessing program uses this information to develop the constant-head boundary for the top aquifer of the flow model. The heads are recorded in units of feet.
These coverages also contain data for the entire geohydrologic framework for each row col umn, and aquifer. These coverages also can be used to correlate such information as transmissivity, aquifer thickness, and horizontal hydraulic conduc tivity for input to the flow model.

Boundary Fluxes Basic-Package Input
The northern and southern boundaries of the flow model are constant-flux boundaries (Harsh and Laczniak, 1990), which are recorded for cover ages for each individual aquifer of the flow model only for the last pumping period. Coverages for the other pumping periods can be created easily through software that already was developed for this purpose. These coverages are documented in tables 62-71. Coverages are identified as BND#.- FLX.PLY ("#" represents the aquifer number).
Output Polygon Coverages
Output from the flow model can be entered into the GIS by software that was developed to populate output coverages of the finite-difference grid. This coverage can be used to record and manipulate the output of the model. Simulated- head output for each row, column, and aquifer of the flow model is recorded as a polygon coverage (HEADOUT_T.PLY) for the end of each pumping period. The documentation of the coverage is listed in table 72. The simulated water levels in the lower Potomac aquifer for 1980 pumping conditions are shown in figure 6 as an example. Shade patterns can be selected to distinguish between different values of head and can be plotted with DLG's and other pertinent coverages.
DOCUMENTATION OF THE DATA-INPUT FILES
The flow-model-input information can be extracted from the previously described coverages by custom-designed software. The software will also format the data sets as required by the model computer code. The most recent version of the input information is stored on the Data General, PRIME, and IBM-PC computers in the Virginia District of the USGS, Richmond, Va. The USGS is not responsible for, and cannot support results of simulations made by outside parties that request this information. The information was developed for a specific application, and any other applica tions are the responsibility of the user.
The file for Basic-Package Input is named BPI_T. The file contains data that were described in McDonald and Harbaugh (1988) for the Basic- Package Input. This file also contains information on input-unit and output-unit numbers that will be specific to individual uses and, therefore, must be edited for application. The starting-head arrays are recorded in units of feet.
Block-Centered Flow-Package Input
The file for Block-Centered Flow-Package Input is named BCFPI_T. This file contains data as described in McDonald and Harbaugh (1988) for Block-Centered Flow-Package Input. The file is set up for transient simulations but can easily be edited for steady-state runs. The transmissivity arrays and their multipliers produce input that is in foot per second and the vertical leakance arrays and their multipliers also produce input in units of foot per second.
Well-Package Input
The file for Well-Package Input is named WELLS_T. This file contains data as described in McDonald and Harbaugh (1988) for the well pack age. The file is set up for 10 pumping periods from 1890 through 1986. The data are recorded in units of cubic foot per second. The fluxes for the con stant-flux boundary cells also are stored in this file.
SUMMARY
This report documents the coverages that were developed to analyze the ground-water resources of the Coastal Plain physiographic province of Vir ginia. Coverages include the altitude of aquifer tops, limits of the aquifers, confining-unit thickness and areal limits, geographic and political bound aries, ground-water use, and coverages needed for the regional ground-water-flow model. The input files for the refined Coastal Plain ground-water- flow-model also are documented.

78 77 76 75
39
38
37
36
50 MILES
50 KILOMETERS___I__________I
EXPLANATION
WATER LEVELS, IN FEET ABOVE OR BELOW SEA LEVEL
> 60 feet
0 - 60 feet
-30 - 0 feet
-60 - -30 feet
-90 - -60 feet
-120 - -90 feet
< -120 feet
Figure 6.~Simulated altitude of water levels in lower Potomac aquifer (1980).
10

SELECTED REFERENCES
Environmental Systems Research Institute, Inc.,1987a, Users guide, ARC/INFO, Volume 1-- The geographic-information system software: Redlands, Calif., various pagination (periodic updates by inserts).
___1989, Users guide, ARC/INFO, Volume 2- Command references: Redlands, Calif, vari ous pagination (periodic updates by inserts).
___1987, Users guide, TIN, ARC/INFO, Sur face modeling and display: Redlands, Calif., various pagination (periodic updates by inserts).
Focazio, M.J., 1990, Application of a geographic- information system to the analysis of ground- water resources in the Coastal Plain of Vir ginia, in International conference on applica tion of geographic-information systems, simulation models, and knowledge-based sys tems for landuse management, November 12- 14, 1990, Proceedings: Blacksburg, Va., Vir ginia Polytechnic Institute and State Univer sity^. 351-359.
Hamilton, P.A., and Larson, J.D., 1988, Hydro- geology and analysis of ground-water-flow system in the Coastal Plain of southeastern Virginia: U.S. Geological Survey Water- Resources Investigations Report 87-4240, 175 p.
Harsh, J.F., and Laczniak, R.J., 1990, Conceptu alization and analysis of ground-water-flow system in the Coastal Plain of Virginia and adjacent parts of Maryland and North Caro lina: U.S. Geological Survey Professional Paper 1404-F, 100 p.
Laczniak, R.J., and Meng, A.A., 1988, Ground- water resources of the York-James Peninsula of Virginia: U.S. Geological Survey Water- Resources Investigations Report 88-4059, 178 p.
McDonald, M.G., and Harbaugh, A.W., 1988, A modular three-dimensional finite-difference ground-water-flow model: U.S. Geological Survey Techniques of Water-Resources Inves tigations, book 6, chap. Al, 578 p.
Meng, A.A, and Harsh, J.F., 1988, Hydrogeo- logic framework of the Virginia Coastal Plain: U.S. Geological Survey Professional Paper 1404-C, 81 p.
Moore, G.K., Batten, L.G., Allord, G.J., and Robinove, C.J., 1983, Application of digital mapping technology to the display of hydro- logic information--A proof-of-concept test in the Fox-Wolf River Basin, Wisconsin: U.S. Geological Survey Water-Resources Investiga tions Report 83-4142,118 p.
Tom, Henry, 1991, Proposed federal information- processing standards for spatial data transfer standard: Federal Register, Thursday, April 11, 1991, v. 56, no. 70, p. 14,686.
11


GLOSSARY
ARC/INFO.-Product name for the geographic- information system used in this report (Environ mental Systems Research Institute, Inc., 1987a).
Arc.-A primary coverage feature that represents linear features, the borders of polygons, or both. The location and shape of an arc are defined as a series of X,Y coordinates.
Arc Attribute Table.-An ARC/INFO data file that contains descriptive data about arcs.
Attribute.-A defined characteristic of an entity type.
Build.-An ARC/INFO command that creates or updates features for a coverage.
Clip.-An ARC/INFO command that extracts fea tures from one coverage that overlap features from another coverage, like a "cookie cutter."
Coverage.-The basic unit of data that can be recorded in ARC/INFO. A coverage is analogous to a single map layer and generally describes one type of map feature, such as streams, roads, or geology. A coverage contains the locational data and the thematic attributes for map features in a given geographic area.
Dangle tolerance.-A digitizing error in which the end (terminal point) of an arc overshoots its target.
Digitize.-To convert continuous analog data to dis crete digital-data values.
Entity instance-A single spatial phenomenon of a defined type that is embedded in one or more phe nomena of a different type, or that has at least one key attribute value that is different from the corre sponding attribute values of the surrounding phe nomena.
Entity type.-A general description and/or defini tion of a group of entity instances with similar characteristics.
Finite-difference grid.-A system of nodal points that is superimposed onto the study area for the ground-water-flow model computations.
Finite-difference block-The smallest subdivi sion of the finite-difference grid.
Flow-model boundary.-The limit of the computa tional borders of the ground-water-flow model.
Fuzzy tolerance.-The minimum distance that sep arates data in a coverage.
Hull.-A polygon defined by the boundaries of a TIN.
Label point.-A primary coverage feature that rep resents a point feature that is used to assign user identifiers to polygons. The location of a label point is described by a single X,Y coordinate. Descriptive data about a label point are stored in a Point or Polygon Attribute Table (PAT), which is an ARC/INFO data file.
Layer.-An integrated, areally distributed set of spatial data, usually representing entity instances with a single theme, or with one common attribute or attribute value in an association of spatial objects.
Leakance.-A characteristic of the ground-water- flow system that controls the vertical flow of ground water through confining units.
Line coverage.-A coverage consisting of spatial objects, which consists of line segments or arcs.
Node.-A primary coverage feature that represents endpoints of an arc and the location where line fea tures connect. Node coordinate data are recorded as the beginning and end points of each arc. Also, the center each finite-difference block within a finite-difference grid.
Point coverage.-A coverage composed of one- dimensional spatial objects, which can be either nodes or points.
Polygon coverage.-A coverage composed of two- dimensional spatial objects.
13

Populate.-To associate a data set with a grid structure.
Projection-An ARC/INFO command that projects coordinates between two projections for a coverage or file.
Thematic-Generalized classes of geographic phe nomena (for example, hydrography or geology).
TINSPOT.-A command in ARC/INFO that com putes surface values for each point of a point cov erage by interpolating from a TIN.
Topology.-A mathematical procedure that explic itly defines spatial relations of map features. Topol ogy is used to define areas and to represent connectivity and contiguity.
Transform.-An ARC/INFO command that changes coverage coordinates, using a mathemati cal function based on control points.
Triangular irregular network (TIN).-A set of adjacent, nonoverlapping triangles developed from irregularly spaced points having x, y coordi nates and z values.
14

TABLES 1 72

16

Table l.--List of coverage items
[The numbers in parenthesis indicate the range of aquifers or confining units that exist for that item; ft, foot; ft3/s, cubic foot per second; ft/d, foot per day; ft2/d, foot squared per day; Mgal/d, million gallons per day]
AQ(l-lO)AQ(1-9)THBASECHECKAQ(l-lO)CHECKHEADCHECKCU(l-9)COLCWLCWRCU(l-9)CU(1-9)THDEMDEMFDIFFDIFF2DIFF3ELEVFIPS: (*)FLOWGWSIALTHEAD(l-lO)HEAD(1-10)LAZICU(l-9)
LAYERLNMAJORMINORNELNERNNODENODENWLPUMPAGERELRERROWRWLRWRT(l-10)TRANSUNCAQVC(l-9)WELWWRXALTXLAZ
Top altitude of aquifers 1-10 (ft)Thickness of aquifers 1-9 (ft)Top altitude of basement (ft)Dummy aquifer item for testingDummy hydraulic head item for testingDummy confining unit item for testingFinite-difference column numberElevation extracted from CHIN_W.L.TIN (ft)Elevation extracted from CHIN_W.L.TIN (ft)Top altitude of confining units (ft)Thickness of confining units (ft)Land-surface elevation from DEM (ft)Land-surface elevation from DEM (ft)Dummy item used for drawdown calculationDummy item used for drawdown calculationDummy item used for drawdown calculationDummy elevation item for testingFederal Information Processing Standards codeVolumetric flow for constant flow boundary (ft3/s)Land-surface elevation from GWSI (ft)Hydraulic head in aquifers 1-10 (ft)Dummy head item for testingDummy integer for vertical leakance plotting purposesHorizontal hydraulic conductivity (ft/d)Aquifer layer number (for example, lower Potomac = 1)Lines of finite-difference grid networkARC/INFO proprietary arc attribute itemARC/INFO proprietary arc attribute itemElevation extracted from NORF_E.L.TIN (ft)Elevation extracted from NORF_E.R.TIN (ft)Finite-difference node numberFinite-difference node numberElevation extracted from NORF_W.L.TIN (ft)Pumpage from water wells (Mgal/d)Elevation extracted from RICH_E.L.TIN (ft)Elevation extracted from RICH_E.R.TIN (ft)Finite-difference row numberElevation extracted from RICH_W.L.TIN (ft)Elevation extracted from RICH_W.R.TIN (ft)Transmissivity (f^/d)Transmissivity (f^/d)The unconfined aquifer numberVertical conductance (ft/d)Elevation extracted from WASH_E.L.TIN (ft)Elevation extracted from WASH_W.R.TIN (ft)Dummy item for land-surface testingDummy item for land-surface testing
17

Table 2.--Documentation of B ASEMENT.UTM
Cover Name: B ASEMENT.UTM Cover Content: Basement (bedrock surface) Source Map Title: N/A Source Map Scale: 1:250,000 Source Map Media: PaperSource Map Accuracy: Interpreted data, therefore no quantitative value of accuracy possible Source Map Projection: Universal transverse mercator (UTM) Projection Parameters: Zone 18 Source Contact Person: Michael J. Focazio Source Contact Phone: (804) 771-2427Source Organization: U.S. Geological Survey, Water Resources Division Source Address: 3600 West Broad Street, Room 606, Richmond, VA 23230 Input Method: Digitized Date Finished: July 1989 Cover Accuracy: Not quantifiable Cover Projection: UTM Projection Parameters: Zone 18Notes: From Hamilton and Larson (1988), Laczniak and Meng (1988), and Harsh and Laczniak (1990). Altitudes
are in feet above sea level.
Table ^--Documentation of AQ1TOP.UTM
Cover Name: AQ1TOP.UTM Cover Content: Top of lower Potomac aquifer Source Map Title: N/A Source Map Scale: 1:250,000 Source Map Media: PaperSource Map Accuracy: Interpreted data, therefore no quantitative value of accuracy possible Source Map Projection: Universal transverse mercator (UTM) Projection Parameters: Zone 18 Source Contact Person: Michael J. Focazio Source Contact Phone: (804) 771-2427Source Organization: U.S. Geological Survey, Water Resources Division Source Address: 3600 West Broad Street, Room 606, Richmond, VA 23230 Input Method: Digitized Date Finished: July 1989 Cover Accuracy: Not quantifiable Cover Projection: UTM Projection Parameters: Zone 18Notes: From Hamilton and Larson (1988), Laczniak and Meng (1988), and Harsh and Laczniak (1990). Altitudes
are in feet above sea level.
18

Table ^--Documentation of AQ2TOP.UTM
Cover Name: AQ2TOP.UTM Cover Content: Top of middle Potomac aquifer Source Map Title: N/A Source Map Scale: 1:250,000 Source Map Media: PaperSource Map Accuracy: Interpreted data, therefore no quantitative value of accuracy possible Source Map Projection: Universal transverse mercator (UTM) Projection Parameters: Zone 18 Source Contact Person: Michael J. Focazio Source Contact Phone: (804) 771-2427Source Organization: U.S. Geological Survey, Water Resources Division Source Address: 3600 West Broad Street, Room 606, Richmond, VA 23230 Input Method: Digitized Date Finished: July 1989 Cover Accuracy: Not quantifiable Cover Projection: UTM Projection Parameters: Zone 18Notes: From Hamilton and Larson (1988), Laczniak and Meng (1988), and Harsh and Laczniak (1990). Altitudes
are in feet above sea level.
Table ^--Documentation of AQ3TOP.UTM
Cover Name: AQ3TOP.UTMCover Content: Top of Brightseat-upper Potomac aquifer Source Map Title: N/A Source Map Scale: 1:250,000 Source Map Media: PaperSource Map Accuracy: Interpreted data, therefore no quantitative value of accuracy possible Source Map Projection: Universal transverse mercator (UTM) Projection Parameters: Zone 18 Source Contact Person: Michael J. Focazio Source Contact Phone: (804) 771-2427Source Organization: U.S. Geological Survey, Water Resources Division Source Address: 3600 West Broad Street, Room 606, Richmond, VA 23230 Input Method: Digitized Date Finished: July 1989 Cover Accuracy: Not quantifiable Cover Projection: UTM Projection Parameters: Zone 18Notes: From Hamilton and Larson (1988), Laczniak and Meng (1988), and Harsh and Laczniak (1990). Altitudes
are in feet above sea level.
19

Table ^.--Documentation of AQ4TOP.UTM
Cover Name: AQ4TOP.UTM Cover Content: Top of Virginia Beach aquifer Source Map Title: N/A Source Map Scale: 1:250,000 Source Map Media: PaperSource Map Accuracy: Interpreted data, therefore no quantitative value of accuracy possible Source Map Projection: Universal transverse mercator (UTM) Projection Parameters: Zone 18 Source Contact Person: Michael J. Focazio Source Contact Phone: (804) 771-2427Source Organization: U.S. Geological Survey, Water Resources Division Source Address: 3600 West Broad Street, Room 606, Richmond, VA 23230 Input Method: Digitized Date Finished: July 1989 Cover Accuracy: Not quantifiable Cover Projection: UTM Projection Parameters: Zone 18Notes: From Hamilton and Larson (1988), Laczniak and Meng (1988), and Harsh and Laczniak (1990). Altitudes
are in feet above sea level.
Table 7.--Documentation of AQ6TOP.UTM
Cover Name: AQ6TOP.UTM Cover Content: Top of Aquia aquifer Source Map Title: N/A Source Map Scale: 1:250,000 Source Map Media: PaperSource Map Accuracy: Interpreted data, therefore no quantitative value of accuracy possible Source Map Projection: Universal transverse mercator (UTM) Projection Parameters: Zone 18 Source Contact Person: Michael J. Focazio Source Contact Phone: (804) 771-2427Source Organization: U.S. Geological Survey, Water Resources Division Source Address: 3600 West Broad Street, Room 606, Richmond, VA 23230 Input Method: Digitized Date Finished: July 1989 Cover Accuracy: Not quantifiable Cover Projection: UTM Projection Parameters: Zone 18Notes: From Hamilton and Larson (1988), Laczniak and Meng (1988), and Harsh and Laczniak (1990). Altitudes
are in feet above sea level.
20

Table 8.--Documentation of AQ7TOP.UTM
Cover Name: AQ7TOP.UTMCover Content: Top of Chickahominy-Piney Point aquifer Source Map Title: N/A Source Map Scale: 1:250,000 Source Map Media: PaperSource Map Accuracy: Interpreted data, therefore no quantitative value of accuracy possible Source Map Projection: Universal transverse mercator (UTM) Projection Parameters: Zone 18 Source Contact Person: Michael J. Focazio Source Contact Phone: (804) 771-2427Source Organization: U.S. Geological Survey, Water Resources Division Source Address: 3600 West Broad Street, Room 606, Richmond, VA 23230 Input Method: Digitized Date Finished: July 1989 Cover Accuracy: Not quantifiable Cover Projection: UTM Projection Parameters: Zone 18Notes: From Hamilton and Larson (1988), Laczniak and Meng (1988), and Harsh and Laczniak (1990). Altitudes
are in feet above sea level.
Table 9.--Documentation of AQ8TOP.UTM
Cover Name: AQ8TOP.UTM Cover Content: Top of St. Mary's-Choptank aquifer Source Map Title: N/A Source Map Scale: 1:250,000 Source Map Media: PaperSource Map Accuracy: Interpreted data, therefore no quantitative value of accuracy possible Source Map Projection: Universal transverse mercator (UTM) Projection Parameters: Zone 18 Source Contact Person: Michael J. Focazio Source Contact Phone: (804) 771-2427Source Organization: U.S. Geological Survey, Water Resources Division Source Address: 3600 West Broad Street, Room 606, Richmond, VA 23230 Input Method: Digitized Date Finished: July 1989 Cover Accuracy: Not quantifiable Cover Projection: UTM Projection Parameters: Zone 18Notes: From Hamilton and Larson (1988), Laczniak and Meng (1988), and Harsh and Laczniak (1990). Altitudes
are in feet above sea level.
21

Table UK-Documentation of AQ9TOP.UTM
Cover Name: AQ9TOP.UTM Cover Content: Top of Yorktown-Eastover aquifer Source Map Title: N/A Source Map Scale: 1:250,000 Source Map Media: PaperSource Map Accuracy: Interpreted data, therefore no quantitative value of accuracy possible Source Map Projection: Universal transverse mercator (UTM) Projection Parameters: Zone 18 Source Contact Person: Michael J. Focazio Source Contact Phone: (804) 771-2427Source Organization: U.S. Geological Survey, Water Resources Division Source Address: 3600 West Broad Street, Room 606, Richmond, VA 23230 Input Method: Digitized Date Finished: July 1989 Cover Accuracy: Not quantifiable Cover Projection: UTM Projection Parameters: Zone 18Notes: From Hamilton and Larson (1988), Laczniak and Meng (1988), and Harsh and Laczniak (1990). Altitudes
are in feet above sea level.
Table ll.~Triangular-irregular-network descriptions for altitudes of aquifer tops
[TIN, triangular irregular network; min, minimum; max, maximum]
TIN description TIN topology Surface value range
AQ1.TIN
AQ2.TIN
AQ3.TIN
AQ4.TIN
AQ5.TIN
AQ6.TIN
AQ7.TIN
AQ8.TIN
AQ9.TIN
NodesTrianglesHull nodesNodesTrianglesHull nodesNodesTrianglesHull nodesNodesTrianglesHull nodesNodesTrianglesHull nodesNodesTrianglesHull nodesNodesTrianglesHull nodesNodesTrianglesHull nodesNodesTrianglesHull nodes
8921,761
211,0252,026
221,0252,026
22333647
1786
158124878
1,57616
1,0812,144
16220422
161,1512,280
20
MinZMaxZ
MinZMaxZ
MinZMaxZ
MinZMaxZ
MinZMaxZ
MinZMaxZ
MinZMaxZ
MinZMaxZ
MinZMaxZ
-2,216.247-47.503
-1,396.273167.070
-1,039.840197.613
.1,447.467-13.383
-1,290.220-290.514
-954.99171.360
-1,029.096161.976
-877.081-193.803
-188.401226.189
22
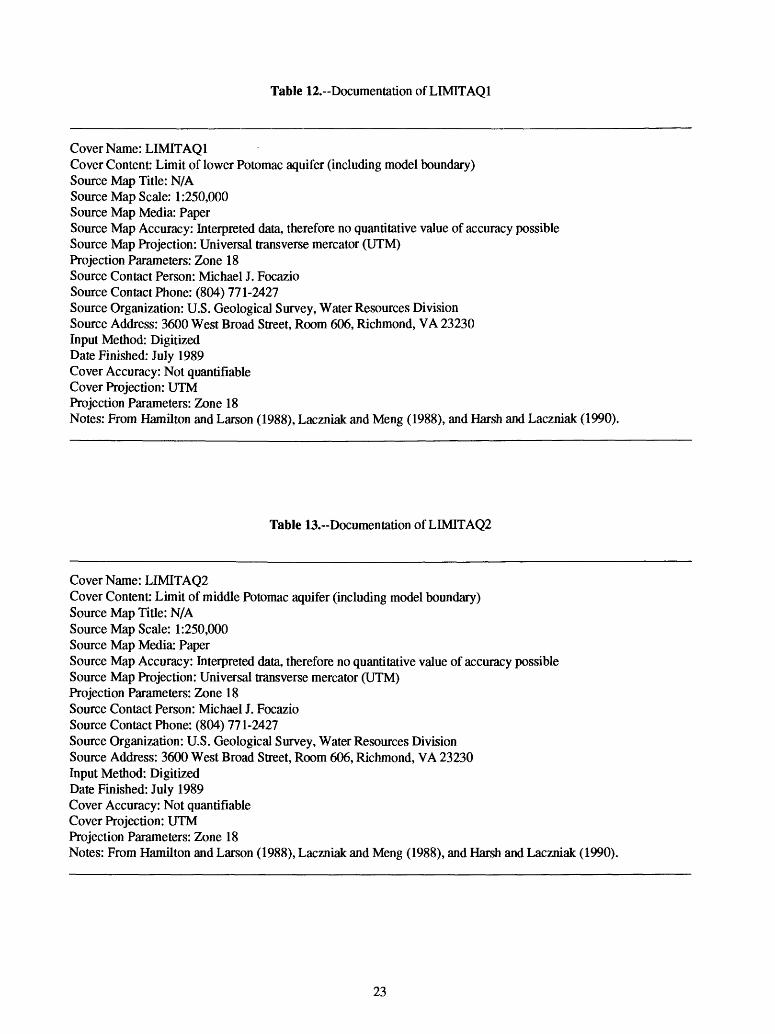
Table 12.--Documentation of LIMITAQ1
Cover Name: LIMITAQ1Cover Content: Limit of lower Potomac aquifer (including model boundary)Source Map Title: N/ASource Map Scale: 1:250,000Source Map Media: PaperSource Map Accuracy: Interpreted data, therefore no quantitative value of accuracy possibleSource Map Projection: Universal transverse mercator (UTM)Projection Parameters: Zone 18Source Contact Person: Michael J. FocazioSource Contact Phone: (804) 771-2427Source Organization: U.S. Geological Survey, Water Resources DivisionSource Address: 3600 West Broad Street, Room 606, Richmond, VA 23230Input Method: DigitizedDate Finished: July 1989Cover Accuracy: Not quantifiableCover Projection: UTMProjection Parameters: Zone 18Notes: From Hamilton and Larson (1988), Laczniak and Meng (1988), and Harsh and Laczniak (1990).
Table 13.-Documentation of LIMITAQ2
Cover Name: LIMITAQ2Cover Content: Limit of middle Potomac aquifer (including model boundary)Source Map Title: N/ASource Map Scale: 1:250,000Source Map Media: PaperSource Map Accuracy: Interpreted data, therefore no quantitative value of accuracy possibleSource Map Projection: Universal transverse mercator (UTM)Projection Parameters: Zone 18Source Contact Person: Michael J. FocazioSource Contact Phone: (804) 771-2427Source Organization: U.S. Geological Survey, Water Resources DivisionSource Address: 3600 West Broad Street, Room 606, Richmond, VA 23230Input Method: DigitizedDate Finished: July 1989Cover Accuracy: Not quantifiableCover Projection: UTMProjection Parameters: Zone 18Notes: From Hamilton and Larson (1988), Laczniak and Meng (1988), and Harsh and Laczniak (1990).
23

Table 14.--Documentation of LIMITAQ3
Cover Name: LIMITAQ3Cover Content: Limit of Brightseat-upper Potomac aquifer (including model boundary)Source Map Title: N/ASource Map Scale: 1:250,000Source Map Media: PaperSource Map Accuracy: Interpreted data, therefore no quantitative value of accuracy possibleSource Map Projection: Universal transverse mercator (UTM)Projection Parameters: Zone 18Source Contact Person: Michael J. FocazioSource Contact Phone: (804) 771-2427Source Organization: U.S. Geological Survey, Water Resources DivisionSource Address: 3600 West Broad Street, Room 606, Richmond, VA 23230Input Method: DigitizedDate Finished: July 1989Cover Accuracy: Not quantifiableCover Projection: UTMProjection Parameters: Zone 18Notes: From Hamilton and Larson (1988), Laczniak and Meng (1988), and Harsh and Laczniak (1990).
Table 15.-Documentation of LIMIT AQ4
Cover Name: LIMITAQ4Cover Content: Limit of the Virginia Beach aquifer (including model boundary)Source Map Title: N/ASource Map Scale: 1:250,000Source Map Media: PaperSource Map Accuracy: Interpreted data, therefore no quantitative value of accuracy possibleSource Map Projection: Universal transverse mercator (UTM)Projection Parameters: Zone 18Source Contact Person: Michael J. FocazioSource Contact Phone: (804) 771-2427Source Organization: U.S. Geological Survey, Water Resources DivisionSource Address: 3600 West Broad Street, Room 606, Richmond, VA 23230Input Method: DigitizedDate Finished: July 1989Cover Accuracy: Not quantifiableCover Projection: UTMProjection Parameters: Zone 18Notes: From Hamilton and Larson (1988), Laczniak and Meng (1988), and Harsh and Laczniak (1990).
24

Table 16.--Documentation of LIMITAQ5
Cover Name: LIMITAQ5Cover Content: Limit of the PeeDee aquifer (including model boundary)Source Map Title: N/ASource Map Scale: 1:250,000Source Map Media: PaperSource Map Accuracy: Interpreted data, therefore no quantitative value of accuracy possibleSource Map Projection: Universal transverse mercator (UTM)Projection Parameters: Zone 18Source Contact Person: Michael J. FocazioSource Contact Phone: (804) 771-2427Source Organization: U.S. Geological Survey, Water Resources DivisionSource Address: 3600 West Broad Street, Room 606, Richmond, VA 23230Input Method: DigitizedDate Finished: July 1989Cover Accuracy: Not quantifiableCover Projection: UTMProjection Parameters: Zone 18Notes: From Hamilton and Larson (1988), Laczniak and Meng (1988), and Harsh and Laczniak (1990).
Table 17.--Documentation of LIMITAQ6
Cover Name: LIMITAQ6Cover Content: Limit of the Aquia aquifer (including model boundary)Source Map Title: N/ASource Map Scale: 1:250,000Source Map Media: PaperSource Map Accuracy: Interpreted data, therefore no quantitative value of accuracy possibleSource Map Projection: Universal transverse mercator (UTM)Projection Parameters: Zone 18Source Contact Person: Michael J. FocazioSource Contact Phone: (804) 771-2427Source Organization: U.S. Geological Survey, Water Resources DivisionSource Address: 3600 West Broad Street, Room 606, Richmond, VA 23230Input Method: DigitizedDate Finished: July 1989Cover Accuracy: Not quantifiableCover Projection: UTMProjection Parameters: Zone 18Notes: From Hamilton and Larson (1988), Laczniak and Meng (1988), and Harsh and Laczniak (1990).
25

Table 18.--Documentation of LIMTAQ7
Cover Name: LIMTAQ7Cover Content: Limit of the Chickahominy-Piney Point aquifer (including model boundary)Source Map Tide: N/ASource Map Scale: 1:250,000Source Map Media: PaperSource Map Accuracy: Interpreted data, therefore no quantitative value of accuracy possibleSource Map Projection: Universal transverse mercator (UTM)Projection Parameters: Zone 18Source Contact Person: Michael J. FocazioSource Contact Phone: (804) 771-2427Source Organization: U.S. Geological Survey, Water Resources DivisionSource Address: 3600 West Broad Street, Room 606, Richmond, VA 23230Input Method: DigitizedDate Finished: July 1989Cover Accuracy: Not quantifiableCover Projection: UTMProjection Parameters: Zone 18Notes: From Hamilton and Larson (1988), Laczniak and Meng (1988), and Harsh and Laczniak (1990).
Table 19.--Documentation of LIMITAQ8
Cover Name: LIMITAQ8Cover Content: Limit of St. Marys-Choptank aquifer (including model boundary)Source Map Title: N/ASource Map Scale: 1:250,000Source Map Media: PaperSource Map Accuracy: Interpreted data, therefore no quantitative value of accuracy possibleSource Map Projection: Universal transverse mercator (UTM)Projection Parameters: Zone 18Source Contact Person: Michael J. FocazioSource Contact Phone: (804) 771-2427Source Organization: U.S. Geological Survey, Water Resources DivisionSource Address: 3600 West Broad Street, Room 606, Richmond, VA 23230Input Method: DigitizedDate Finished: July 1989Cover Accuracy: Not quantifiableCover Projection: UTMProjection Parameters: Zone 18Notes: From Hamilton and Larson (1988), Laczniak and Meng (1988), and Harsh and Laczniak (1990).
26
Table 20.--Documentation of LMITAQ9
Cover Name: LIMITAQ9Cover Content: Limit of Yorktown-Eastover aquifer (including model boundary)Source Map Title: N/ASource Map Scale: 1:250,000Source Map Media: PaperSource Map Accuracy: Interpreted data, therefore no quantitative value of accuracy possibleSource Map Projection: Universal transverse mercator (UTM)Projection Parameters: Zone 18Source Contact Person: Michael J. FocazioSource Contact Phone: (804) 771-2427Source Organization: U.S. Geological Survey, Water Resources DivisionSource Address: 3600 West Broad Street, Room 606, Richmond, VA 23230Input Method: DigitizedDate Finished: July 1989Cover Accuracy: Not quantifiableCover Projection: UTMProjection Parameters: Zone 18Notes: From Hamilton and Larson (1988), Laczniak and Meng (1988), and Harsh and Laczniak (1990).
Table 21.--Documentation of CUlTfflCK.UTM
Cover Name: CUlTfflCK.UTMCover Content: Thickness of lower Potomac confining unit Source Map Title: N/A Source Map Scale: 1:250,000 Source Map Media: PaperSource Map Accuracy: Interpreted data, therefore no quantitative value of accuracy possible Source Map Projection: Universal transverse mercator (UTM) Projection Parameters: Zone 18 Source Contact Person: Michael J. Focazio Source Contact Phone: (804) 771-2427Source Organization: U.S. Geological Survey, Water Resources Division Source Address: 3600 West Broad Street, Room 606, Richmond, VA 23230 Input Method: Digitized Date Finished: July 1988 Cover Accuracy: Not quantifiable Cover Projection: UTM Projection Parameters: Zone 18Notes: From Hamilton and Larson (1988), Laczniak and Meng (1988), and Harsh and Laczniak (1990). Thicknesses
are in feet.
27

Table 22.--Documentation of CU2THICK.UTM
Cover Name: CU2THICK.UTMCover Content: Thickness of middle Potomac confining unit Source Map Title: N/A Source Map Scale: 1:250,000 Source Map Media: PaperSource Map Accuracy: Interpreted data, therefore no quantitative value of accuracy possible Source Map Projection: Universal transverse mercator (UTM) Projection Parameters: Zone 18 Source Contact Person: Michael J. Focazio Source Contact Phone: (804) 771-2427Source Organization: U.S. Geological Survey, Water Resources Division Source Address: 3600 West Broad Street, Room 606, Richmond, VA 23230 Input Method: Digitized Date Finished: July 1988 Cover Accuracy: Not quantifiable Cover Projection: UTM Projection Parameters: Zone 18Notes: From Hamilton and Larson (1988), Laczniak and Meng (1988), and Harsh and Laczniak (1990). Thicknesses
are in feet.
Table 23.--Documentation of CU3TfflCK.UTM
Cover Name: CU3THICK.UTMCover Content: Thickness of Brightseat-upper Potomac confining unit Source Map Title: N/A Source Map Scale: 1:250,000 Source Map Media: PaperSource Map Accuracy: Interpreted data, therefore no quantitative value of accuracy possible Source Map Projection: Universal transverse mercator (UTM) Projection Parameters: Zone 18 Source Contact Person: Michael J. Focazio Source Contact Phone: (804) 771-2427Source Organization: U.S. Geological Survey, Water Resources Division Source Address: 3600 West Broad Street, Room 606, Richmond, VA 23230 Input Method: Digitized Date Finished: August 1988 Cover Accuracy: Not quantifiable Cover Projection: UTM Projection Parameters: Zone 18Notes: From Hamilton and Larson (1988), Laczniak and Meng (1988), and Harsh and Laczniak (1990). Thicknesses
are in feet.
28

Table ^.--Documentation of CU4THICK.UTM
Cover Name: CU4THICK.UTMCover Content: Thickness of Virginia Beach confining unit Source Map Title: N/A Source Map Scale: 1:250,000 Source Map Media: PaperSource Map Accuracy: Interpreted data, therefore no quantitative value of accuracy possible Source Map Projection: Universal transverse mercator (UTM) Projection Parameters: Zone 18 Source Contact Person: Michael J. Focazio Source Contact Phone: (804) 771-2427Source Organization: U.S. Geological Survey, Water Resources Division Source Address: 3600 West Broad Street, Room 606, Richmond, VA 23230 Input Method: Digitized Date Finished: February 1989 Cover Accuracy: Not quantifiable Cover Projection: UTM Projection Parameters: Zone 18Notes: From Hamilton and Larson (1988), Laczniak and Meng (1988), and Harsh and Laczniak (1990). Thicknesses
are in feet.
Table 25.~Documentation of CU5THICK.UTM
Cover Name: CU5THICK.UTM Cover Content: Thickness of PeeDee confining unit Source Map Title: N/A Source Map Scale: 1:250,000 Source Map Media: PaperSource Map Accuracy: Interpreted data, therefore no quantitative value of accuracy possible Source Map Projection: Universal transverse mercator (UTM) Projection Parameters: Zone 18 Source Contact Person: Michael J. Focazio Source Contact Phone: (804) 771-2427Source Organization: U.S. Geological Survey, Water Resources Division Source Address: 3600 West Broad Street, Room 606, Richmond, VA 23230 Input Method: Digitized Date Finished: July 1989 Cover Accuracy: Not quantifiable Cover Projection: UTM Projection Parameters: Zone 18Notes: From Hamilton and Larson (1988), Laczniak and Meng (1988), and Harsh and Laczniak (1990). Thicknesses
are in feet.
29

Table 26.--Documentation of CU6THICK.UTM
Cover Name: CU6THICK.UTMCover Content: Thickness of Nanjemoy-Marlboro confining unit Source Map Title: N/A Source Map Scale: 1:250,000 Source Map Media: PaperSource Map Accuracy: Interpreted data, therefore no quantitative value of accuracy possible Source Map Projection: Universal transverse mercator (UTM) Projection Parameters: Zone 18 Source Contact Person: Michael J. Focazio Source Contact Phone: (804) 771-2427Source Organization: U.S. Geological Survey, Water Resources Division Source Address: 3600 West Broad Street, Room 606, Richmond, VA 23230 Input Method: Digitized Date Finished: February 1989 Cover Accuracy: Not quantifiable Cover Projection: UTM Projection Parameters: Zone 18Notes: From Hamilton and Larson (1988), Laczniak and Meng (1988), and Harsh and Laczniak (1990). Thicknesses
are in feet.
Table 27.«Documentation of CU7THICK.UTM
Cover Name: CU7THICK.UTM Cover Content: Thickness of Calvert confining unit Source Map Title: N/A Source Map Scale: 1:250,000 Source Map Media: PaperSource Map Accuracy: Interpreted data, therefore no quantitative value of accuracy possible Source Map Projection: Universal transverse mercator (UTM) Projection Parameters: Zone 18 Source Contact Person: Michael J. Focazio Source Contact Phone: (804) 771-2427Source Organization: U.S. Geological Survey, Water Resources Division Source Address: 3600 West Broad Street, Room 606, Richmond, VA 23230 Input Method: Digitized Date Finished: March 1989 Cover Accuracy: Not quantifiable Cover Projection: UTM Projection Parameters: Zone 18Notes: From Hamilton and Larson (1988), Laczniak and Meng (1988), and Harsh and Laczniak (1990). Thicknesses
are in feet.
30

Table 28.-Documentation of CU8THICK.UTM
Cover Name: CU8THICK.UTM Cover Content: Thickness of St Marys confining unit Source Map Title: N/A Source Map Scale: 1:250,000 Source Map Media: PaperSource Map Accuracy: Interpreted data, therefore no quantitative value of accuracy possible Source Map Projection: Universal transverse mercator (UTM) Projection Parameters: Zone 18 Source Contact Person: Michael J. Focazio Source Contact Phone: (804) 771-2427Source Organization: U.S. Geological Survey, Water Resources Division Source Address: 3600 West Broad Street, Room 606, Richmond, VA 23230 Input Method: Digitized Date Finished: March 1989 Cover Accuracy: Not quantifiable Cover Projection: UTM Projection Parameters: Zone 18Notes: From Hamilton and Larson (1988), Laczniak and Meng (1988), and Harsh and Laczniak (1990). Thicknesses
are in feet.
Table 29.--Documentation of CU9THICK.UTM
Cover Name: CU9THICK.UTMCover Content: Thickness of Yorktown-Eastover confining unit Source Map Title: N/A Source Map Scale: 1:250,000 Source Map Media: PaperSource Map Accuracy: Interpreted data, therefore no quantitative value of accuracy possible Source Map Projection: Universal transverse mercator (UTM) Projection Parameters: Zone 18 Source Contact Person: Michael J. Focazio Source Contact Phone: (804) 771-2427Source Organization: U.S. Geological Survey, Water Resources Division Source Address: 3600 West Broad Street, Room 606, Richmond, VA 23230 Input Method: Digitized Date Finished: April 1989 Cover Accuracy: Not quantifiable Cover Projection: UTM Projection Parameters: Zone 18Notes: From Hamilton and Larson (1988), Laczniak and Meng (1988), and Harsh and Laczniak (1990). Thicknesses
are in feet.
31

Table 30.--Triangular-irregular-network descriptions for altitudes of confining-unit tops[TIN, triangular irregular network; min, minimum; max, maximum]
TIN description
GUI. TIN
CU2.TIN
CU3.TIN
CU4.TIN
CU5.TIN
CU6.TIN
CU7.TIN
CU8.TIN
CU9.TIN
TIN topology
NodesTriangles Hull nodesNodesTriangles Hull nodesNodesTriangles Hull nodesNodesTriangles Hull nodesNodesTriangles Hull nodesNodesTriangles Hull nodesNodesTriangles Hull nodesNodesTriangles Hull nodesNodesTriangles Hull nodes
1,3582,689
251,3402,657
211,1492,277
19354692
1488
158 16
7851,548
201,1442,267
19563
1,101 23
9731,921
23
Surface value range
MinZMaxZ
MinZMaxZ
MinZMaxZ
MinZMaxZ
MinZMaxZ
MinZMaxZ
MinZMax Z
MinZMaxZ
MinZMaxZ
-9,999.000-29.375
-9,999.00075.769
-9,999.00010.371
-9,999.000-20.290
-9,999.000-272.673
-9,999.000217.074
-9,999.000191.701
-9,999.000153.539
-9,999.000142.716
Table 31.--Documentation of LMITCU1
Cover Name: LIMITCU1Cover Content: Limit of lower Potomac confining unit (including model boundary)Source Map Title: N/ASource Map Scale: 1:250,000Source Map Media: PaperSource Map Accuracy: Interpreted data, therefore no quantitative value of accuracy possibleSource Map Projection: Universal transverse mercator (UTM)Projection Parameters: Zone 18Source Contact Person: Michael J. FocazioSource Contact Phone: (804) 771-2427Source Organization: U.S. Geological Survey, Water Resources DivisionSource Address: 3600 West Broad Street, Room 606, Richmond, VA 23230Input Method: DigitizedDate Finished: July 1989Cover Accuracy: Not quantifiableCover Projection: UTMProjection Parameters: Zone 18Notes: From Hamilton and Larson (1988), Laczniak and Meng (1988), and Harsh and Laczniak (1990).
32

Table 32.--Documentation of LIMITCU2
Cover Name: LIMITCU2Cover Content: Limit of middle Potomac confining unit (including model boundary)Source Map Title: N/ASource Map Scale: 1:250,000Source Map Media: PaperSource Map Accuracy: Interpreted data, therefore no quantitative value of accuracy possibleSource Map Projection: Universal transverse mercator (UTM)Projection Parameters: Zone 18Source Contact Person: Michael J. FocazioSource Contact Phone: (804) 771-2427Source Organization: U.S. Geological Survey, Water Resources DivisionSource Address: 3600 West Broad Street, Room 606, Richmond, VA 23230Input Method: DigitizedDate Finished: July 1989Cover Accuracy: Not quantifiableCover Projection: UTMProjection Parameters: Zone 18Notes: From Hamilton and Larson (1988), Laczniak and Meng (1988), and Harsh and Laczniak (1990).
Table 33.»Documentation of LIMITCU3
Cover Name: LIMITCU3Cover Content: Limit of Brightseat-upper Potomac confining unit (including model boundary)Source Map Title: N/ASource Map Scale: 1:250,000Source Map Media: PaperSource Map Accuracy: Interpreted data, therefore no quantitative value of accuracy possibleSource Map Projection: Universal transverse mercator (UTM)Projection Parameters: Zone 18Source Contact Person: Michael J. FocazioSource Contact Phone: (804) 771-2427Source Organization: U.S. Geological Survey, Water Resources DivisionSource Address: 3600 West Broad Street, Room 606, Richmond, VA 23230Input Method: DigitizedDate Finished: July 1989Cover Accuracy: Not quantifiableCover Projection: UTMProjection Parameters: Zone 18Notes: From Hamilton and Larson (1988), Laczniak and Meng (1988), and Harsh and Laczniak (1990).
33

Table 34.»Documentation of LMITCU4
Cover Name: LIMITCU4Cover Content: Limit of Virginia Beach confining unit (including model boundary)Source Map Title: N/ASource Map Scale: 1:250,000Source Map Media: PaperSource Map Accuracy: Interpreted data, therefore no quantitative value of accuracy possibleSource Map Projection: Universal transverse mercator (UTM)Projection Parameters: Zone 18Source Contact Person: Michael J. FocazioSource Contact Phone: (804) 771-2427Source Organization: U.S. Geological Survey, Water Resources DivisionSource Address: 3600 West Broad Street, Room 606, Richmond, VA 23230Input Method: DigitizedDate Finished: July 1989Cover Accuracy: Not quantifiableCover Projection: UTMProjection Parameters: Zone 18Notes: From Hamilton and Larson (1988), Laczniak and Meng (1988), and Harsh and Laczniak (1990).
Table 35.--Documentation of LMITCU5
Cover Name: LIMITCU5Cover Content: Limit of PeeDee confining unit (including model boundary)Source Map Title: N/ASource Map Scale: 1:250,000Source Map Media: PaperSource Map Accuracy: Interpreted data, therefore no quantitative value of accuracy possibleSource Map Projection: Universal transverse mercator (UTM)Projection Parameters: Zone 18Source Contact Person: Michael J. FocazioSource Contact Phone: (804) 771-2427Source Organization: U.S. Geological Survey, Water Resources DivisionSource Address: 3600 West Broad Street, Room 606, Richmond, VA 23230Input Method: DigitizedDate Finished: July 1989Cover Accuracy: Not quantifiableCover Projection: UTMProjection Parameters: Zone 18Notes: From Hamilton and Larson (1988), Laczniak and Meng (1988), and Harsh and Laczniak (1990).
34

Table 36.--Documentation of LEVHTCU6
Cover Name: LIMITCU6Cover Content: Limit of Nanjemoy-Marlboro confining unit (including model boundary)Source Map Title: N/ASource Map Scale: 1:250,000Source Map Media: PaperSource Map Accuracy: Interpreted data, therefore no quantitative value of accuracy possibleSource Map Projection: Universal transverse mercator (UTM)Projection Parameters: Zone 18Source Contact Person: Michael J. FocazioSource Contact Phone: (804) 771-2427Source Organization: U.S. Geological Survey, Water Resources DivisionSource Address: 3600 West Broad Street, Room 606, Richmond, VA 23230Input Method: DigitizedDate Finished: July 1989Cover Accuracy: Not quantifiableCover Projection: UTMProjection Parameters: Zone 18Notes: From Hamilton and Larson (1988), Laczniak and Meng (1988), and Harsh and Laczniak (1990).
Table 37.--Documentation of LIMITCU7
Cover Name: LIMITCU7Cover Content: Limit of Calvert confining unit (including model boundary)Source Map Title: N/ASource Map Scale: 1:250,000Source Map Media: PaperSource Map Accuracy: Interpreted data, therefore no quantitative value of accuracy possibleSource Map Projection: Universal transverse mercator (UTM)Projection Parameters: Zone 18Source Contact Person: Michael J. FocazioSource Contact Phone: (804) 771-2427Source Organization: U.S. Geological Survey, Water Resources DivisionSource Address: 3600 West Broad Street, Room 606, Richmond, VA 23230Input Method: DigitizedDate Finished: July 1989Cover Accuracy: Not quantifiableCover Projection: UTMProjection Parameters: Zone 18Notes: From Hamilton and Larson (1988), Laczniak and Meng (1988), and Harsh and Laczniak (1990).
35

Table 38.--Documentation of LIMITCU8
Cover Name: LIMITCU8Cover Content: Limit of St. Marys confining unit (including model boundary)Source Map Title: N/ASource Map Scale: 1:250,000Source Map Media: PaperSource Map Accuracy: Interpreted data, therefore no quantitative value of accuracy possibleSource Map Projection: Universal transverse mercator (UTM)Projection Parameters: Zone 18Source Contact Person: Michael J. FocazioSource Contact Phone: (804) 771-2427Source Organization: U.S. Geological Survey, Water Resources DivisionSource Address: 3600 West Broad Street, Room 606, Richmond, VA 23230Input Method: DigitizedDate Finished: July 1989Cover Accuracy: Not quantifiableCover Projection: UTMProjection Parameters: Zone 18Notes: From Hamilton and Larson (1988), Laczniak and Meng (1988), and Harsh and Laczniak (1990).
Table 39.--Documentation of LIMITCU9
Cover Name: LIMITCU9Cover Content: Limit of Yorktown-Eastover confining unit (including model boundary)Source Map Title: N/ASource Map Scale: 1:250,000Source Map Media: PaperSource Map Accuracy: Interpreted data, therefore no quantitative value of accuracy possibleSource Map Projection: Universal transverse mercator (UTM)Projection Parameters: Zone 18Source Contact Person: Michael J. FocazioSource Contact Phone: (804) 771-2427Source Organization: U.S. Geological Survey, Water Resources DivisionSource Address: 3600 West Broad Street, Room 606, Richmond, VA 23230Input Method: DigitizedDate Finished: July 1989Cover Accuracy: Not quantifiableCover Projection: UTMProjection Parameters: Zone 18Notes: From Hamilton and Larson (1988), Laczniak and Meng (1988), and Harsh and Laczniak (1990).
36

Table 40.--Documentation of FRAMEWORK.PLY
Cover Name: FRAMEWORK.PLYCover Content: Geohydrologic frameworkSource Map Title: N/ASource Map Scale: N/ASource Map Media: N/ASource Map Accuracy: N/ASource Map Projection: Universal transverse mercator (UTM)Projection Parameters: Zone 18Source Contact Person: Michael J. FocazioSource Contact Phone: (804) 771-2427Source Organization: U.S. Geological Survey, Water Resources DivisionSource Address: 3600 West Broad Street, Room 606, Richmond, VA 23230Input Method: Software derivedDate Finished: August 1990Cover Accuracy: Not quantifiableCover Projection: UTMProjection Parameters: Zone 18Notes: This is a polygon coverage of the Coastal Plain model finite-difference grid with the aquifer and confining-
unit tops assigned to each grid cell. Units of aquifer and confining-unit tops are in feet above sea level.From Hamilton and Larson (1988), Meng and Harsh (1988), Laczniak and Meng (1988), and Harsh andLaczniak (1990).
Table 41.~Documentation of NCCOUNTY.UTM
Cover Name: COUNTY.UTMCover Content: Digital-line graph of all county boundaries in the State of North CarolinaSource Map Title: N/ASource Map Scale: 1:2,000,000Source Map Media: Digital-line graphSource Map Accuracy: N/ASource Map Projection: Universal transverse mercator (UTM)Projection Parameters: Zone 18Source Contact Person: Michael J. FocazioSource Contact Phone: (804) 771-2427Source Organization: U.S. Geological Survey, Water Resources DivisionSource Address: 3600 West Broad Street, Room 606, Richmond, VA 23230Input Method: Software derivedDate Finished: July 1989Cover Accuracy: Not quantifiableCover Projection: UTMProjection Parameters: Zone 18Notes: From U.S. Geological Survey digital-line graphs.
37

Table 42.--Documentation of OUTLINE.UTM (NC)
Cover Name: OUTLINE.UTMCover Content: Digital-line graph of North Carolina State outlineSource Map Title: N/ASource Map Scale: N/ASource Map Media: N/ASource Map Accuracy: N/ASource Map Projection: Universal transverse mercator (UTM)Projection Parameters: Zone 18Source Contact Person: Michael J. FocazioSource Contact Phone: (804) 771-2427Source Organization: U.S. Geological Survey, Water Resources DivisionSource Address: 3600 West Broad Street, Room 606, Richmond, VA 23230Input Method: Digital line graphDate Finished: July 1989Cover Accuracy: N/ACover Projection: UTMProjection Parameters: Zone 18Notes: From U.S. Geological Survey digital-line graphs.
Table 43.-Documentation of COUNTY .UTM (VA)
Cover Name: COUNTY.UTMCover Content: Digital-line graph of all county boundaries in the State of VirginiaSource Map Title: N/ASource Map Scale: 1:2,000,000Source Map Media: Digital line graphSource Map Accuracy: N/ASource Map Projection: Universal transverse mercator (UTM)Projection Parameters: Zone 18Source Contact Person: Michael J. FocazioSource Contact Phone: (804) 771-2427Source Organization: U.S. Geological Survey, Water Resources DivisionSource Address: 3600 West Broad Street, Room 606, Richmond, VA 23230Input Method: Digital-line graphDate Finished: July 1989Cover Accuracy: N/ACover Projection: UTMProjection Parameters: Zone 18Notes: From U.S. Geological Survey digital-line graphs.
38

Table 44.--Documentation of OUTLINE.UTM (VA)
Cover Name: OUTLINE.UTMCover Content: Digital-line graph of Virginia State outlineSource Map Title: N/ASource Map Scale: 1:2,000,000Source Map Media: Digital-line graphSource Map Accuracy: N/ASource Map Projection: Universal transverse mercator (UTM)Projection Parameters: Zone 18Source Contact Person: Michael J. FocazioSource Contact Phone: (804) 771-2427Source Organization: U.S. Geological Survey, Water Resources DivisionSource Address: 3600 West Broad Street, Room 606, Richmond, VA 23230Input Method: Digital-line graphDate Finished: July 1989Cover Accuracy: N/ACover Projection: UTMProjection Parameters: Zone 18Notes: From U.S. Geological Survey digital-line graphs.
Table 45.~Documentation of CP.OUT
Cover Name: CP.OUTCover Content: Outline of the Coastal Plain physiographic provinceSource Map Title: N/ASource Map Scale: 1:250,000Source Map Media: PaperSource Map Accuracy: N/ASource Map Projection: Universal transverse mercator (UTM)Projection Parameters: Zone 18Source Contact Person: Michael J. FocazioSource Contact Phone: (804) 771-2427Source Organization: U.S. Geological Survey, Water Resources DivisionSource Address: 3600 West Broad Street, Room 606, Richmond, VA 23230Input Method: DigitizedDate Finished: June 1988Cover Accuracy: N/ACover Projection: UTMProjection Parameters: Zone 18Notes:
39

Table 46.--Documentation of CP
Cover Name: CPCover Content: Digital-line graph of county boundaries of the Coastal Plain physiographic provinceSource Map Title:Source Map Scale: 1:250,000Source Map Media: PaperSource Map Accuracy: N/ASource Map Projection: Universal transverse mercator (UTM)Projection Parameters: Zone 18Source Contact Person: Michael J. FocazioSource Contact Phone: (804) 771-2427Source Organization: U.S. Geological Survey, Water Resources DivisionSource Address: 3600 West Broad Street, Room 606, Richmond, VA 23230Input Method: DigitizedDate Finished: July 1989Cover Accuracy: N/ACover Projection: UTMProjection Parameters: Zone 18
Table 47.~Triangular irregular network descriptions for digital-elevation models[TIN, triangular irregular network; min, minimum; max, maximum]
TIN description TIN topology Surface value range
chin_w. I.TIN
chin_w.r.TIN
norf_w.r.TIN
norf_w.l.TIN
norf_e.l.TIN
norf_e.r.TIN
rich_e.r.TIN
rich_e.l.TIN
rich_w.r.TIN
wash_w.r.TIN
wash_e.l.TIN
NodesTrianglesHull nodesNodesTrianglesHull nodesNodesTrianglesHull nodesNodesTrianglesHull nodesNodesTrianglesHull nodesNodesTrianglesHull nodesNodesTrianglesHull nodesNodesTrianglesHull nodesNodesTrianglesHull nodesNodesTrianglesHull nodesNodesTrianglesHull nodes
21,88843,759
158,013
16,0159
40,59181,118
6237,25874,455
5922,54745,026
6620,22940,434
2223,54847,054
4036,07072,049
8931,32662,566
8421,81543,606
2222,60845,190
24
MinZMaxZ
MinZMaxZ
MinZMaxZ
MinZMaxZ
MinZMaxZ
MinZMaxZ
MinZMaxZ
MinZMaxZ
MinZMaxZ
MinZMaxZ
MinZMaxZ
0.00020.000
.00015.000
3.00047.000
10.000137.000
.00035.000
.00015.000
.00030.000
.00046.000
.00074.000
.000152.000
.00091.000
40

Table 48.--Documentation of DEMGRID.PNT
Cover Name: DEMGRID.PNTCover Content: Point coverage used for digital-elevation models (OEM's) Source Map Title: DEM grid Source Map Scale: 1:25,000 Source Map Media: N/A Source Map Accuracy: N/ASource Map Projection: Universal transverse mercator (UTM) Projection Parameters: Zone 18 Source Contact Person: Michael J. Focazio Source Contact Phone: (804) 771-2427Source Organization: U.S. Geological Survey, Water Resources Division Source Address: 3600 West Broad Street, Room 606, Richmond, VA 23230 Input Method: DEM Date Finished: September 1989 Cover Accuracy: N/A Cover Projection: UTM Projection Parameters: Zone 18Notes: This coverage can be used to obtain land-surface elevations for each node in the Coastal Plain physiographic
province ground-water-flow model.
Table 49.~Documentation of PP1.PNT
Cover Name: PP1.PNTCover Content: Point coverage containing pumpage data for pumping period 1 (1891-20)Source Map Title: Pumping period 1Source Map Scale: N/ASource Map Media: Software derivedSource Map Accuracy: N/ASource Map Projection: Universal transverse mercator (UTM)Projection Parameters: Zone 18Source Contact Person: Michael J. FocazioSource Contact Phone: (804) 771-2427Source Organization: U.S. Geological Survey, Water Resources DivisionSource Address: 3600 West Broad Street, Room 606, Richmond, VA 23230Input Method: Software derivedDate Finished: March 1991Cover Accuracy: N/ACover Projection: UTMProjection Parameters: Zone 18Notes: Points represent well locations, pumpage is in million gallons per day.
41

Table 50.~Documentation of PP2.PNT
Cover Name: PP2.PNTCover Content: Point coverage containing pumpage data for pumping period 2 (1921-39)Source Map Title: Pumping period 2Source Map Scale: N/ASource Map Media: N/ASource Map Accuracy: N/ASource Map Projection: Universal transverse mercator (UTM)Projection Parameters: Zone 18Source Contact Person: Michael J. FocazioSource Contact Phone: (804) 771-2427Source Organization: U.S. Geological Survey, Water Resources DivisionSource Address: 3600 West Broad Street, Room 606, Richmond, VA 23230Input Method: Software derivedDate Finished: March 1991Cover Accuracy: N/ACover Projection: UTMProjection Parameters: Zone 18Notes: Points represent well locations, pumpage is in million gallons per day.
Table 51.-Documentation of PP3.PNT
Cover Name: PP3.PNTCover Content: Point coverage containing pumpage data for pumping period 3 (1940-45)Source Map Title: Pumping period 3Source Map Scale: N/ASource Map Media: Software derivedSource Map Accuracy: N/ASource Map Projection: Universal transverse mercator (UTM)Projection Parameters: Zone 18Source Contact Person: Michael J. FocazioSource Contact Phone: (804) 771-2427Source Organization: U.S. Geological Survey, Water Resources DivisionSource Address: 3600 West Broad Street, Room 606, Richmond, VA 23230Input Method: Software derivedDate Finished: March 1991Cover Accuracy: N/ACover Projection: UTMProjection Parameters: Zone 18Notes: Points represent well locations, pumpage is in million gallons per day.
42

Table 52.--Documentation of PP4.PNT
Cover Name: PP4.PNTCover Content: Point coverage containing pumpage data for pumping period 4 (1946-52)Source Map Title: Pumping period 4Source Map Scale: N/ASource Map Media: N/ASource Map Accuracy: N/ASource Map Projection: Universal transverse mercator (UTM)Projection Parameters: Zone 18Source Contact Person: Michael J. FocazioSource Contact Phone: (804) 771-2427Source Organization: U.S. Geological Survey, Water Resources DivisionSource Address: 3600 West Broad Street, Room 606, Richmond, VA 23230Input Method: Software derivedDate Finished: March 1991Cover Accuracy: N/ACover Projection: UTMProjection Parameters: Zone 18Notes: Points represent well locations, pumpage is in million gallons per day.
Table 53.--Documentation of PP5.PNT
Cover Name: PP5.PNTCover Content: Point coverage containing pumpage data for pumping period 5 (1953-57)Source Map Title: Pumping period 5Source Map Scale: N/ASource Map Media: N/ASource Map Accuracy: N/ASource Map Projection: Universal transverse mercator (UTM)Projection Parameters: Zone 18Source Contact Person: Michael J. FocazioSource Contact Phone: (804) 771-2427Source Organization: U.S. Geological Survey, Water Resources DivisionSource Address: 3600 West Broad Street, Room 606, Richmond, VA 23230Input Method: Software derivedDate Finished: March 1991Cover Accuracy: N/ACover Projection: UTMProjection Parameters: Zone 18Notes: Points represent well locations, pumpage is in million gallons per day.
43

Table 54.--Documentation of PP6.PNT
Cover Name: PP6.PNTCover Content: Point coverage containing pumpage data for pumping period 6 (1958-64)Source Map Title: Pumping period 6Source Map Scale: N/ASource Map Media: N/ASource Map Accuracy: N/ASource Map Projection: Universal transverse mercator (UTM)Projection Parameters: Zone 18Source Contact Person: Michael J. FocazioSource Contact Phone: (804) 771-2427Source Organization: U.S. Geological Survey, Water Resources DivisionSource Address: 3600 West Broad Street, Room 606, Richmond, VA 23230Input Method: Software derivedDate Finished: March 1991Cover Accuracy: N/ACover Projection: UTMProjection Parameters: Zone 18Notes: Points represent well locations, pumpage is in million gallons per day.
Table 55.-Documentation of PP7.PNT
Cover Name: PP7.PNTCover Content: Point coverage containing pumpage data for pumping period 7 (1965-67)Source Map Title: Pumping period 7Source Map Scale: N/ASource Map Media: N/ASource Map Accuracy: N/ASource Map Projection: Universal transverse mercator (UTM)Projection Parameters: Zone 18Source Contact Person: Michael J. FocazioSource Contact Phone: (804) 771-2427Source Organization: U.S. Geological Survey, Water Resources DivisionSource Address: 3600 West Broad Street, Room 606, Richmond, VA 23230Input Method: Software derivedDate Finished: March 1991Cover Accuracy: N/ACover Projection: UTMProjection Parameters: Zone 18Notes: Points represent well locations, pumpage is in million gallons per day.
44
Table 56.--Documentation of PP8.PNT
Cover Name: PP8.PNTCover Content: Point coverage containing pumpage data for pumping period 8 (1968-72)Source Map Title: Pumping period 8Source Map Scale: N/ASource Map Media: N/ASource Map Accuracy: N/ASource Map Projection: Universal transverse mercator (UTM)Projection Parameters: Zone 18Source Contact Person: Michael J. FocazioSource Contact Phone: (804) 771-2427Source Organization: U.S. Geological Survey, Water Resources DivisionSource Address: 3600 West Broad Street, Room 606, Richmond, VA 23230Input Method: Software derivedDate Finished: March 1991Cover Accuracy: N/ACover Projection: UTMProjection Parameters: Zone 18Notes: Points represent well locations, pumpage is in million gallons per day.
Table 57.~Documentation of PP9.PNT
Cover Name: PP9.PNTCover Content: Point coverage containing pumpage data for pumping period 9 (1973-77)Source Map Title: Pumping period 9Source Map Scale: N/ASource Map Media: N/ASource Map Accuracy: N/ASource Map Projection: Universal transverse mercator (UTM)Projection Parameters: Zone 18Source Contact Person: Michael J. FocazioSource Contact Phone: (804) 771-2427Source Organization: U.S. Geological Survey, Water Resources DivisionSource Address: 3600 West Broad Street, Room 606, Richmond, VA 23230Input Method: Software derivedDate Finished: March 1991Cover Accuracy: N/ACover Projection: UTMProjection Parameters: Zone 18Notes: Points represent well locations, pumpage is in million gallons per day.
45
Table 58.--Documentation of PP10.PNT
Cover Name: PP10.PNTCover Content: Point coverage containing pumpage data for pumping period 10 (1978-86)Source Map Title: Pumping period 10Source Map Scale: N/ASource Map Media: N/ASource Map Accuracy: N/ASource Map Projection: Universal transverse mercator (UTM)Projection Parameters: Zone 18Source Contact Person: Michael J. FocazioSource Contact Phone: (804) 771-2427Source Organization: U.S. Geological Survey, Water Resources DivisionSource Address: 3600 West Broad Street, Room 606, Richmond, VA 23230Input Method: Software derivedDate Finished: March 1991Cover Accuracy: N/ACover Projection: UTMProjection Parameters: Zone 18Notes: Points represent well locations, pumpage is in million gallons per day.
Table 59.--Documentation of RASAGRID.LNE
Cover Name: RAS AGRID.LNECover Content: Finite-difference grid for the Coastal Plain physiographic province ground-water-flow modelSource Map Title: N/A (software derived)Source Map Scale: 1:250,000Source Map Media: N/A (software derived)Source Map Accuracy: N/ASource Map Projection: Universal transverse mercator (UTM)Projection Parameters: Zone 18Source Contact Person: Michael J. FocazioSource Contact Phone: (804) 771-2427Source Organization: U.S. Geological Survey, Water Resources DivisionSource Address: 3600 West Broad Street, Room 606, Richmond, VA 23230Input Method: Software derivedDate Finished: July 1989Cover Accuracy: N/ACover Projection: UTMProjection Parameters: Zone 18Notes: This is a line coverage that can be used for plotting.
46

Table 60.-Documentation of RASGIS.PNT
Cover Name: RASGIS.PNTCover Content: Input data for Coastal Plain physiographic province flow modelSource Map Title: N/ASource Map Scale: N/ASource Map Media: N/ASource Map Accuracy: N/ASource Map Projection: Universal transverse mercator (UTM)Projection Parameters: Zone 18Source Contact Person: Michael J. FocazioSource Contact Phone: (804) 771-2427Source Organization: U.S. Geological Survey, Water Resources DivisionSource Address: 3600 West Broad Street, Room 606, Richmond, VA 23230Input Method: Software derivedDate Finished: March 1991Cover Accuracy: N/ACover Projection: UTMProjection Parameters: Zone 18Notes: This is a point coverage of the Coastal Plain physiographic province flow-model finite-difference grid. Each
point represents a node in the grid. Model-input parameters, geohydrologic framework, and other different items are assigned to each node. From Hamilton and Larson (1988), Laczniak and Meng (1988), and Harsh and Laczniak (1990).
Table 61.~Documentation of TEMPGRID2.PLY
Cover Name: TEMPGRID2.PLYCover Content: Input data for Coastal Plain physiographic province flow modelSource Map Title: N/ASource Map Scale: N/ASource Map Media: N/ASource Map Accuracy: N/ASource Map Projection: Universal transverse mercator (UTM)Projection Parameters: Zone 18Source Contact Person: Michael J. FocazioSource Contact Phone: (804) 771-2427Source Organization: U.S. Geological Survey, Water Resources DivisionSource Address: 3600 West Broad Street, Room 606, Richmond, VA 23230Input Method: Software derivedDate Finished: April 1990Cover Accuracy: N/ACover Projection: N/AProjection Parameters: N/ANotes: This is a polygon coverage of the Coastal Plain physiographic province flow-model finite-difference grid.
Each polygon represents one-grid cell. Model-input parameters, geohydrologic framework, and other different items are assigned to each grid cell. From Hamilton and Larson (1988), Laczniak and Meng (1988), and Harsh and Laczniak (1990).
47

Table 62.~Documentation of BND1.FLX.PLY
Cover Name: BND1.FLX.PLYCover Content: Constant-flow boundary for Coastal Plain physiographic province low model for pumping period 1Source Map Title: flow boundary for pumping period 1Source Map Scale: N/A (software derived)Source Map Media: N/ASource Map Accuracy: Interpreted data, therefore no quantitative value of accuracy possibleSource Map Projection: Universal transverse mercator (UTM)Projection Parameters: Zone 18Source Contact Person: Michael J. FocazioSource Contact Phone: (804) 771-2427Source Organization: U.S. Geological Survey, Water Resources DivisionSource Address: 3600 West Broad Street, Room 606, Richmond, VA 23230Input Method: Software derivedDate Finished: April 1991Cover Accuracy: Not quantifiableCover Projection: UTMProjection Parameters: Zone 18Notes: From Harsh and Laczniak (1990). Units of flow are cubic foot per second.
Table 63.~Documentation of BND2.FLX.PL Y
Cover Name: BND2.FLX.PLYCover Content: Constant-flow boundary for Coastal Plain physiographic province flow model for pumping period 2Source Map Title: flow boundary for pumping period 2Source Map Scale: N/A (software derived)Source Map Media: N/ASource Map Accuracy: Interpreted data, therefore no quantitative value of accuracy possibleSource Map Projection: Universal transverse mercator (UTM)Projection Parameters: Zone 18Source Contact Person: Michael J. FocazioSource Contact Phone: (804) 771-2427Source Organization: U.S. Geological Survey, Water Resources DivisionSource Address: 3600 West Broad Street, Room 606, Richmond, VA 23230Input Method: Software derivedDate Finished: April 1991Cover Accuracy: Not quantifiableCover Projection: UTMProjection Parameters: ZoneNotes: From Harsh and Laczniak (1990). Units of flow are cubic foot per second.
48
Table 64.-Documentatton of BND3.FLX.PLY
Cover Name: BND3.FLX.PLYCover Content: Constant-flow boundary for Coastal Plain physiographic province flow model for pumping period 3Source Map Title: flow boundary for pumping period 3Source Map Scale: N/A (software derived)Source Map Media: N/ASource Map Accuracy: Interpreted data, therefore no quantitative value of accuracy possibleSource Map Projection: Universal transverse mercator (UTM)Projection Parameters: Zone 18Source Contact Person: Michael J. FocazioSource Contact Phone: (804) 771-2427Source Organization: U.S. Geological Survey, Water Resources DivisionSource Address: 3600 West Broad Street, Room 606, Richmond, VA 23230Input Method: Software derivedDate Finished: April 1991Cover Accuracy: Not quantifiableCover Projection: UTMProjection Parameters: Zone 18Notes: From Harsh and Laczniak (1990). Units of flow are cubic foot per second.
Table 65.--Documentation of BND4.FLX.PLY
Cover Name: BND4.FLX.PLYCover Content: Constant-flow boundary for Coastal Plain physiographic province flow model for pumping period 4Source Map Title: flow boundary for pumping period 4Source Map Scale: N/A (software derived)Source Map Media: N/ASource Map Accuracy: Interpreted data, therefore no quantitative value of accuracy possibleSource Map Projection: Universal transverse mercator (UTM)Projection Parameters: Zone 18Source Contact Person: Michael J. FocazioSource Contact Phone: (804) 771-2427Source Organization: U.S. Geological Survey, Water Resources DivisionSource Address: 3600 West Broad Street, Room 606, Richmond, VA 23230Input Method: Software derivedDate Finished: April 1991Cover Accuracy: Not quantifiableCover Projection: UTMProjection Parameters: Zone 18Notes: From Harsh and Laczniak (1990). Units of flow are cubic foot per second.
49

Table 66.--Documentation of BND5.FLX.PLY
Cover Name: BND5.FLX.PLYCover Content: Constant-flow boundary for Coastal Plain physiographic province flow model for pumping period 5Source Map Title: flow boundary for pumping period 5Source Map Scale: N/A (software derived)Source Map Media: N/ASource Map Accuracy: Interpreted data, therefore no quantitative value of accuracy possibleSource Map Projection: Universal transverse mercator (UTM)Projection Parameters: Zone 18Source Contact Person: Michael J. FocazioSource Contact Phone: (804) 771-2427Source Organization: U.S. Geological Survey, Water Resources DivisionSource Address: 3600 West Broad Street, Room 606, Richmond, VA 23230Input Method: Software derivedDate Finished: April 1991Cover Accuracy: Not quantifiableCover Projection: UTMProjection Parameters: Zone 18Notes: From Harsh and Laczniak (1990). Units of flow are cubic foot per second.
Table 67.--Documentation of BND6.FLX.PLY
Cover Name: BND6.FLX.PLYCover Content: Constant-flow boundary for Coastal Plain physiographic province flow model for pumping period 6Source Map Title: flow boundary for pumping period 6Source Map Scale: N/A (software derived)Source Map Media: N/ASource Map Accuracy: Interpreted data, therefore no quantitative value of accuracy possibleSource Map Projection: Universal transverse mercator (UTM)Projection Parameters: Zone 18Source Contact Person: Michael J. FocazioSource Contact Phone: (804) 771-2427Source Organization: U.S. Geological Survey, Water Resources DivisionSource Address: 3600 West Broad Street, Room 606, Richmond, VA 23230Input Method: Software derivedDate Finished: April 1991Cover Accuracy: Not quantifiableCover Projection: UTMProjection Parameters: Zone 18Notes: From Harsh and Laczniak (1990). Units of flow are cubic foot per second.
50

Table 68.--Documentation of BND7.FLX.PLY
Cover Name: BND7.FLX.PLYCover Content: Constant-flow boundary for Coastal Plain physiographic province flow model for pumping period 7Source Map Title: flow boundary for pumping period 7Source Map Scale: N/A (software derived)Source Map Media: N/ASource Map Accuracy: Interpreted data, therefore no quantitative value of accuracy possibleSource Map Projection: Universal transverse mercator (UTM)Projection Parameters: Zone 18Source Contact Person: Michael J. FocazioSource Contact Phone: (804) 771-2427Source Organization: U.S. Geological Survey, Water Resources DivisionSource Address: 3600 West Broad Street, Room 606, Richmond, VA 23230Input Method: Software derivedDate Finished: April 1991Cover Accuracy: Not quantifiableCover Projection: UTMProjection Parameters: Zone 18Notes: From Harsh and Laczniak (1990). Units of flow are cubic foot per second.
Table 69.~Documentation of BND8.FLX.PLY
Cover Name: BND8.FLX.PLYCover Content: Constant-flow boundary for Coastal Plain physiographic province flow model for pumping period 8Source Map Title: flow boundary for pumping period 8Source Map Scale: N/A (software derived)Source Map Media: N/ASource Map Accuracy: Interpreted data, therefore no quantitative value of accuracy possibleSource Map Projection: Universal transverse mercator (UTM)Projection Parameters: Zone 18Source Contact Person: Michael J. FocazioSource Contact Phone: (804) 771-2427Source Organization: U.S. Geological Survey, Water Resources DivisionSource Address: 3600 West Broad Street, Room 606, Richmond, VA 23230Input Method: Software derivedDate Finished: April 1991Cover Accuracy: Not quantifiableCover Projection: UTMProjection Parameters: Zone 18Notes: From Harsh and Laczniak (1990). Units of flow are cubic foot per second.
51

Table 70.--Documentation of BND9.FLX.PLY
Cover Name: BND9.FLX.PLYCover Content: Constant-flow boundary for Coastal Plain physiographic province flow model for pumping period 9Source Map Title: flow boundary for pumping period 9Source Map Scale: N/A (software derived)Source Map Media: N/ASource Map Accuracy: Interpreted data, therefore no quantitative value of accuracy possibleSource Map Projection: Universal transverse mercator (UTM)Projection Parameters: Zone 18Source Contact Person: Michael J. FocazioSource Contact Phone: (804) 771-2427Source Organization: U.S. Geological Survey, Water Resources DivisionSource Address: 3600 West Broad Street, Room 606, Richmond, VA 23230Input Method: Software derivedDate Finished: April 1991Cover Accuracy: Not quantifiableCover Projection: UTMProjection Parameters: Zone 18Notes: From Harsh and Laczniak (1990). Units of flow are cubic foot per second.
Table 71.~Documentation of BND10.FLX.PLY
Cover Name: BND10.FLX.PLYCover Content: Constant-flow boundary for Coastal Plain physiographic province flow model, pumping period 10Source Map Title: flow boundary for pumping period 10Source Map Scale: N/A (software derived)Source Map Media: N/ASource Map Accuracy: Interpreted data, therefore no quantitative value of accuracy possibleSource Map Projection: Universal transverse mercator (UTM)Projection Parameters: Zone 18Source Contact Person: Michael J. FocazioSource Contact Phone: (804) 771-2427Source Organization: U.S. Geological Survey, Water Resources DivisionSource Address: 3600 West Broad Street, Room 606, Richmond, VA 23230Input Method: Software derivedDate Finished: April 1991Cover Accuracy: Not quantifiableCover Projection: UTMProjection Parameters: Zone 18Notes: From Harsh and Laczniak (1990). Units of flow are cubic foot per second.
52

Table 72,-Documentation of READOUT T.PLY
Cover Name: HEADOUT_T.PLYCover Content: Polygon coverage used to store and manipulate simulated heads from the ground-water-flow model Source Map Title: Head output Source Map Scale: N/A Source Map Media: Software derived Source Map Accuracy: N/ASource Map Projection: Universal transverse mercator (UTM) Projection Parameters: Zone 18 Source Contact Person: Michael J. Focazio Source Contact Phone: (804) 771-2427Source Organization: U.S. Geological Survey, Water Resources Division Source Address: 3600 West Broad Street, Room 606, Richmond, VA 23230 Input Method: Software derived Date Finished: April 1990 Cover Accuracy: N/A Cover Projection: UTM Projection Parameters: Zone 18Notes: This coverage can be populated by software with simulated heads that are originally recorded as unformatted
output from the Coastal Plain physiographic province ground-water-flow model.
53 if U.S. GOVERNMENT PRINTING OFFICE: 1993 351-759