document resume white, pamela joy note 62p.; … · title the effects of teaching techniques and...
TRANSCRIPT
DOCUMENT RESUME
ED 411 151 SE 060 535
AUTHOR White, Pamela JoyTITLE The Effects of Teaching Techniques and Teacher Attitudes on
Math Anxiety in Secondary Level Students.PUB DATE 1997-05-05NOTE 62p.; Master's Thesis, Salem-Teikyo University.PUB TYPE Dissertations/Theses Masters Theses (042)
Tests /Questionnaires (160)EDRS PRICE MF01/PC03 Plus Postage.DESCRIPTORS Cooperative Learning; Group Activities; *High School
Students; High Schools; Learning Activities; MathematicsAchievement; *Mathematics Anxiety; *Mathematics Instruction;*Teacher Attitudes; Teaching Methods
IDENTIFIERS Hands on Mathematics; West Virginia
ABSTRACTThe purpose of this study was to determine if teaching
techniques and teacher attitudes tend to reduce math anxiety insecondary-level students. The research group consisted of 48 secondarystudents enrolled in Algebra I at a rural school in West Virginia, with theexperimental period lasting 12 weeks. The control group was instructed in theteacher's usual manner, whereas the experimental group received treatment oncoping with math anxiety. Treatment involved positive teacher attitudes, aswell as cooperative learning and hands-on group activities. Math anxietylevels were measured using the Math Anxiety Rating Scale (MARS). Math anxietylevels were determined before and after the treatment and comparedstatistically using the t-test. Academic grades were also comparedperiodically. The MARS pretest and posttest comparison indicated that boththe control and experimental groups began and ended the study with the samelevel of math anxiety. Likewise, both the experimental and control groupsstarted the study on the same basic algebra skill level, progressed at nearlythe same rate, and performed on the same level at the end of the study.Contains 48 references. (Author/PVD)
********************************************************************************* Reproductions supplied by EDRS are the best that can be made *
* from the original document. *
********************************************************************************

THE EFFECTS OF TEACHING TECHNIQUES AND TEACHER ATTITUDES
ON MATH ANXIETY IN SECONDARY LEVEL STUDENTS
PERMISSION TO REPRODUCE ANDDISSEMINATE THIS MATERIAL k
HS BE. EN GRAN ED BY
\\,
TO THE EDUCATIONAL RESOURCESINFORMATION CENTER (ERIC)
A Thesis
Presented to
The Faculty of the Master of Arts Degree Program
Salem-Teikyo University
In Partial Fulfillment
of the Requirements for the Degree
Master of Arts in Education
by
Pamela Joy White
May 5, 1997
2
BEST COPY AVAILABLE
U.S. DEPARTMENT OF EDUCATIONOffice of Educational Research and ImprovementDUCATIONAL RESOURCES INFORMATION
CENTER (ERIC)This document has been reproduced asr eived from the person or organizationoriginating it.
Minor changes have been made toimprove reproduction quality. .
Points of view or opinions stated in thisdocument do not necessarily representofficial OERI position or policy.

Salem-Teikyo UniversitySalem, West Virginia
This thesis submitted by Pamela Joy White has been approved meeting the research
requirements for the Master of Arts Degree.
Date
6713
Date
37/12_,_
Date
Professor McAllister
Gaby van der Glessen, Ph. D.
3
Thesis Commimr
ABSTRACT
THE EFFECTS OF TEACHING TECHNIQUES AND TEACHER ATTITUDES
ON MATH ANXIETY IN SECONDARY LEVEL STUDENTS
Pamela Joy White
The purpose of this research project is to determine if teaching techniques and
teacher attitudes tend to reduce math anxiety in secondary level students. The research
was obtained from forty-eight secondary students enrolled in Algebra I at a rural school in
West Virginia. The study was conducted over a twelve week period.
The control group was instructed in the teacher's usual manner while the
experimental group received treatment on coping with math anxiety. The treatment
involved positive teacher attitudes, as well as cooperative learning and hands on group
activities. Math anxiety levels were measured by use of the Math Anxiety Rating Scale
(MARS). Math anxiety levels were determined before and after the treatment and then
were compared statistically using the t-test. Academic grades were also compared
periodically as the study period progressed.
The statistical comparisons indicated no significant differences in levels of math
anxiety or academic achievement after having received the treatment. The MARS pretest
and posttest comparison indicated that both the control and experimental groups began
and ended the study with the same level of math anxiety. Likewise, comparisons indicated
that both the experimental and control groups started the study on the same basic algebra
skill level, progressed at nearly the same rate, and performed on the same level at the end
of the study.
4

TABLE OF CONTENTS
CHAPTER 1 Page
INTRODUCTION 1
The Research Questions 2
The Hypotheses 2
The Delimitations 2
The Assumptions 3
The Definition of Terms 3
The Importance of the Study 3
CHAPTER 2
THE REVIEW OF THE RELATED LITERATURE 5
An Overview 5
The Anxiety 6
The Female Role in Relation to Math Anxiety 8
Methods of Dealing with Math Anxiety on the Post-Secondary Level 10
Methods of Dealing with Math Anxiety on the Secondary and Elementary Levels ..13
Summary 20
CHAPTER 3
METHODS AND PROCEDURES 21
Sources of Data 21
Research Methodology 22
Treatment of the Data 22
Collecting Pretest Data 23
Experimental Procedure 25
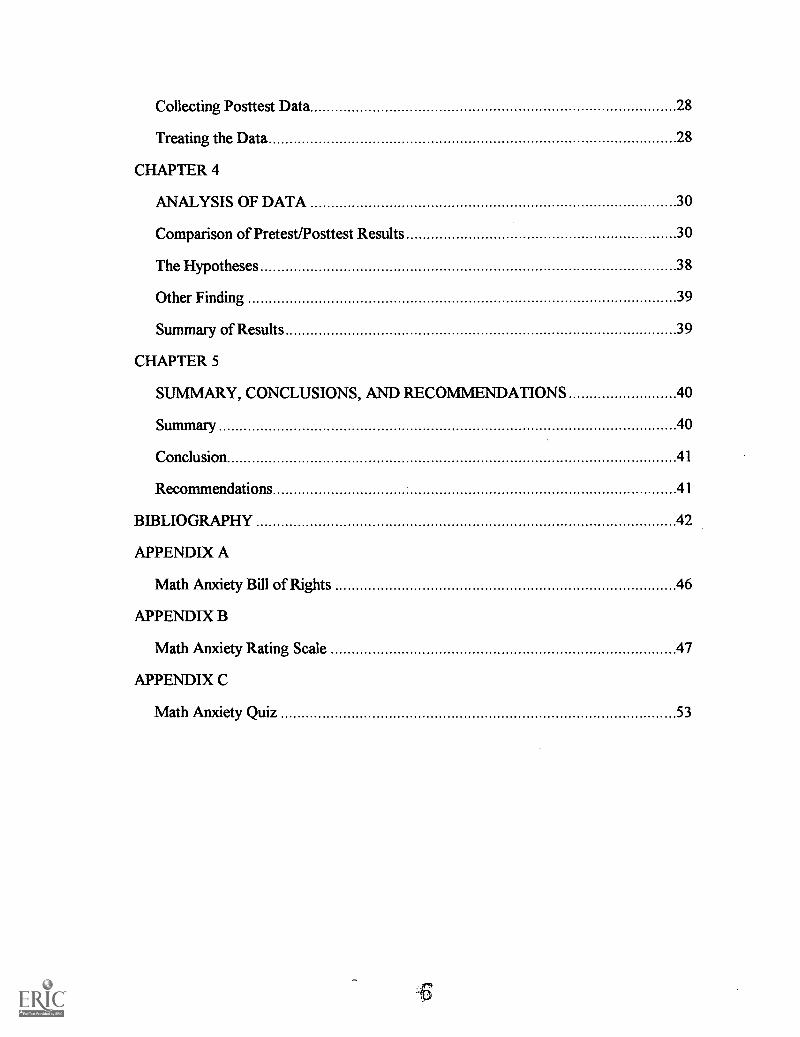
Collecting Posttest Data 28
Treating the Data 28
CHAPTER 4
ANALYSIS OF DATA 30
Comparison of Pretest/Posttest Results 30
The Hypotheses 38
Other Finding 39
Summary of Results 39
CHAPTER 5
SUMMARY, CONCLUSIONS, AND RECOMMENDATIONS 40
Summary 40
Conclusion 41
Recommendations 41
BIBLIOGRAPHY 42
APPENDIX A
Math Anxiety Bill of Rights 46
APPENDIX B
Math Anxiety Rating Scale 47
APPENDIX C
Math Anxiety Quiz 53
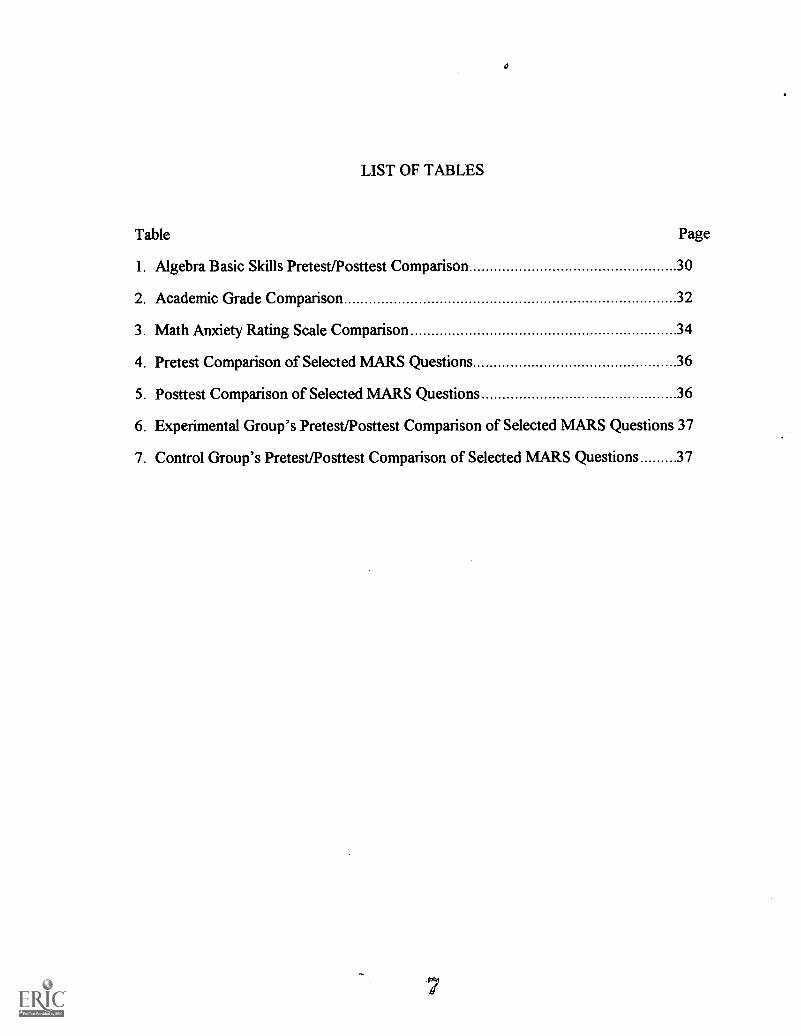
LIST OF TABLES
Table Page
1. Algebra Basic Skills Pretest/Posttest Comparison 30
2. Academic Grade Comparison 32
3. Math Anxiety Rating Scale Comparison 34
4. Pretest Comparison of Selected MARS Questions 36
5. Posttest Comparison of Selected MARS Questions 36
6. Experimental Group's Pretest/Posttest Comparison of Selected MARS Questions 37
7. Control Group's Pretest/Posttest Comparison of Selected MARS Questions 37

LIST OF FIGURES
Figure Page
1. Grade Level Distribution 24
2. Sex Distribution 24
3. Algebra Basic Skills Pretest/Posttest Comparison 31
4. Academic Grade Comparison 32
5. Six Weeks Grading Period Comparison 33
6. MARS Comparison 34
7. MARS Comparison for Each Group 34
CHAPTER ONE
Introduction
Mathophobia as stated by Crypton is the fear of numbers - big ones, little ones,
negative ones, fractions, percents and exponents. It is breaking into a cold, clammy sweat
at the mention of the consumer price index or at the thought of figuring out the tip in a
restaurant (5:121).
Math anxiety is indeed a fear of mathematics and numbers and has a great effect on
the lives of many. In this ever changing society, Thompson with the Associated Press
reported, life has become a jumble of numbers. The use of PIN numbers, the explosion of
cellular phones, fax machines, and computers increases the need for memorizing and using
numbers almost constantly (24:1). Everyone suffers from some level of math anxiety,
although the range of levels is vast. Even competent mathematics professors experience
some level of anxiety. Hackworth reminds us that math anxiety is not limited to
unsuccessful people. Doctors, lawyers, teachers and business executives admit to math
anxiety even though they have survived the educational system and vocations which
impose some mathematical requirements. He mentions an accountant who does not
balance his own personal checking account but relies solely on the bank statement and a
chairperson of a mathematics department who never teaches word problems because she
can not figure them out (46:5). Tobias states, "One of the truths about math anxiety that
the disabled in math never seem to learn is that math anxiety can never be eliminated. The
point is to manage it, as those who work in the field of mathematics learn to do"
(25:40-41).
The level of this anxiety may be influenced by numerous factors, including age,
sex, mathematical achievement and ability, and parental and teacher attitudes. This study
1
will, however, be concerned only with the influence of teaching techniques in the
classroom and teacher attitudes.
The Research Questions
1. Did teaching techniques and teacher attitudes reduce math anxiety in secondary
level students?
2. How did teaching techniques affect the level of math anxiety of the students in
this study?
3. What influence did teacher attitudes have on the math anxiety level of the
students in this study?
The Hypotheses
1. The null hypothesis is that teaching techniques will make no significant
difference in the level of math anxiety of the students in the study.
2. The alternative hypothesis is that teacher attitudes will have no significant
influence on the level of math anxiety of the students in the study.
The Delimitations
There is no intent in this study to rate the instruction of the teacher or to rate
the school. The student population was limited to 48 students from selected sections of
Algebra I, (grade levels ranging from 9-12) at Ritchie County High School, Ellenboro,
West Virginia. This study did not attempt to determine the effect of any factors other than
teaching techniques or teaching attitudes on math anxiety levels. The time frame began in
August 1996 and continued for approximately twelve weeks through November 1996.
Math anxiety levels were measured by the Math Anxiety Rating Scale (MARS). Student
2
academic progress was monitored according to the grades received in Algebra I.
The Assumptions
The first assumption. The first assumption is that the Mathematics Anxiety
Rating Scale will accurately measure the level of math anxiety of each student.
The second assumption The second assumption is that all secondary age
students suffer from some level of math anxiety.
The third assumption. The third assumption is that a sample of 48 students is
adequate in size and reflects a sample typical of secondary students.
The fourth assumption. The fourth assumption is that a time frame of twelve
weeks is adequate for the study.
The Definitions of Terms
Math Anxiety. Math anxiety, according to Tobias, is a fear of mathematics or
an intense, negative emotional reaction to mathematics (25:39).
h4athoiAidia. Mathophobia, as described by Crypton, is another name used for
math anxiety (5:121).
Spatial Visualization. Spatial visualization is referred to by Sherard as the
ability to visualize shapes and mentally move or rotate them (21:108).
The Importance of the Study
Math anxiety affects not only the self esteem of students but also choices in
academic and career pursuits. Increased numbers of students are limiting considerably
their career choices as well as their lives by suffering from math anxiety. While some help
3

is being given, on the college as well as secondary and elementary levels, much is yet to be
accomplished. Only research will yield the solutions.
4

CHAPTER TWO
The Review of the Related Literature
An Overview
Math anxiety may affect students in any number of ways. While some students
experience a fear of mathematics and totally avoid any unnecessary dealings with numbers
or mathematical terms others have actual physical symptoms of trembling, perspiring, and
nausea when forced to deal with mathematical situations as reported by Calvert's studies
(33:9).
Math avoidance, Tobias notes, is not a decision made at a certain age, but rather is
a continuing issue. Some students avoid math to avoid the anxiety; however, this does not
always work as often basic skills are lost along with self-confidence and the student
experiences anxiety again (possibly even at a higher level) when he/she is faced with
mathematical situations (27:64-65).
Several studies including Calvert's have revealed that females have significantly
higher levels of math anxiety than males, and that students who have taken higher level
math courses and those receiving a grade of "C" or higher have lower levels of math
anxiety than those students who have completed only general math courses and those who
received lower grades (33:1).
Although some level of math anxiety is present in everyone, it seems that some are
able to deal with the emotional fear and frustration more readily than others. As Smith
concluded in her report on math anxiety, "certainly one difference between the math
anxious and the math able lies in this reaction to frustration" (43:4).
5

The Anxiety
A college student becomes ill outside the math tutor's door before a help session; a
successful attorney has to carry a "cheat" card to help him calculate a 15 percent tip; a
woman still dreams she is being chased by numbers years after graduating; people refuse
to balance checkbooks; parents break into a sweat when their children need help on
algebra assignments. These are all common math anxiety experiences, as described by
Gibson (13:38).
Math anxiety is learned; the fear is not innate. In fact, according to Tankersley, the
fear of math is learned usually somewhere around fourth grade. In the early years,
children are taught mathematical concepts by associating them with concrete objects or
examples and later by symbolic representation. Then, somewhere around fourth grade, the
teacher leaves the world of concrete and introduces the abstract. This appears to be
where the problems begin (23:12).
If the life experiences of a math anxious person were studied, the circumstances
under which the math anxiety was learned would be discovered. Math anxiety is learned
and there is always some significant other person in the learning situation. Hackworth
states that these teachers of math anxiety fall into the two categories: villains or loved
ones. A third grader learned to be anxious when forced to sit under her desk when she
could not repeat her multiplication facts quickly enough. The teacher, the significant
person in this case, would be classified as a villain. In another situation a first year algebra
student asked for help from her father. When he became quickly exasperated at her
questions she was devastated. The lessons continued to get worse. The significant person
here of course was the father, a loved one (46:34-35).
In attempting to understand exactly how math anxiety and the brain work, Tobias
instructs one to think of the brain as a three part system, a memory bank, an input area and
an understanding/recall pathway connecting the two. Under normal circumstances one
6
14

would look at mathematical information and call up the correct formula or information
from the memory bank to proceed working. However, if one suffers from math anxiety,
emotions come into play, panic develops and the understanding/recall pathway becomes
cluttered by emotions creating a type of static in the brain. This in turn prevents the brain
from functioning properly (48:6-7).
Anxiety is generally described in a dictionary as being uneasy or worried about
what may happen; however, people who fear math will say uneasy or worried is too mild
of a description of their feelings. When faced with mathematical tasks many people
experience extreme discomfort. According to Pierce sixty to eighty percent of the
population suffer to some degree. Some common reactions to math anxiety were listed as
tension, blanking out, panic, paranoia, guilt, physical reactions (headaches, nauseous,
cramps, blurred vision, sleepiness) and of course, avoidance (39:34).
Any physical reaction to math anxiety interferes with one's ability to correctly
perform mathematics. As the anxiety increases so do the physical symptoms, thus
decreasing the individual's math performance. Hackworth suggests using a process call
Benson's Relaxation Response. This is a relaxing technique that reduces the negative
physical reactions (46:76).
One of the first steps in gaining control over the anxiety, according to Pierce, is to
reflect back on one's math history and try to pin point the specific class, experience or
teacher that made him/her lose confidence in his/her math ability. This can be done
individually or it is often helpful to talk with others to realize one is not alone in feeling
anxiety. Once the negative experiences have been identified they can be replaced by
positive thoughts and help can be sought (39:35).
Gibson refers to Arem and Tobias' research to give some tips on conquering math
anxiety, which include keeping calm, stopping any negative self talk, visualizing oneself
succeeding with math problems and breaking difficult math assignments up in to smaller
parts (13:40).
7
The Female Role in Relation to Math Anxiety
"As a rule, girls have a harder time with math than boys, but primarily because
society tells them that's the way it should be" states Fiske (11:65).
The studies showing the levels of math anxiety and contributing factors in females
are quite broad and somewhat controversial. According to Fiske's studies, girls tend to
do better in math than boys through elementary school then they begin to slip at the junior
high level. Here girls are being conditioned by society that only boys pursue fields of
engineering, science, etc. (11:66). According to Human Behavior's "Math Misery" the
problem stems from the fact that from the ninth grade on girls tend to avoid math because
of societal pressures. By the time they are ready for college their mathematical
background is too weak to meet requirements for the entry level science and math courses
(17:67)
Bernstein reported that during a research project in New Jersey gender was found
to be a significant factor as related to math anxiety between fourteen and nineteen years of
age. Prior to age fourteen males and females expressed no significant difference in math
anxiety levels. The importance of females having reinforcing math experiences and
understanding the importance of math in their lives was also expressed (30:5).
Fiske also referred to Tobias' argument that socialization regarding math begins
well before the early teenage years. Girls play "store" or Monopoly and get practice in
basic mathematical calculations while boys may follow their favorite baseball player's
batting average and gain insight into concepts of ratios and percentages (11:66). Tobias
suggests all the skills necessary for understanding mathematics may not be learned at
school. Children who miss out on the experiences of measuring, computing and
manipulating objects while playing may not be as well prepared for math in school. Girls
probably do not learn much about gravity, distance and shapes and sizes by playing with
dolls. While boys are usually taking things apart and putting them back together, building
8
something, or possibly learning a lesson on speed and distance from playing baseball or
football (26:65).
Reilly's research indicates that female and male students' anxiety levels appear to
be similar at the junior high age but as they enter higher levels of math in high school
females begin to exhibit higher levels of math anxiety. It has been suggested that society
does not expect the female student to be good at math so she may choose not to exert
sufficient effort to overcome fears and enroll in higher level math classes. This of course
severely limits career options of females (40:16). Reilly also refers to Flessati and
Jamieson's research which indicates that females report higher levels of math anxiety
because society accepts their admitting to the weakness in math more readily than males.
Males may actually underreport their feelings of math anxiety because of cultural
expectations (40:5).
Donady and Tobias cited mathematician John Ernest's conclusion in his phamplet
"Mathematics and Sex" that boys may not like math any better than girls but they are
made aware that it will be necessary for the kinds of careers they intend to pursue (8:50).
However, Iker reported in his article "A Math Answer for Women" that more girls are
presently signing up for advanced math classes because they plan to pursue careers other
than being homemakers (15:45). Parents need to be informed of the importance of a full
mathematics education for their daughters as well as for their sons Fauth and Jacobs
conclude in "Equity in Mathematics Education" (10:490).
In contrast to the aforementioned studies in a national survey of 1,452 thirteen
year olds and 1,788 high school seniors, Hollifield found no large differences in
mathematics participation. This study was significant because previous studies have found
such differences that it is given as a primary reason for males dominating the field (14:26).
Likewise in her study of "Sex Differences in Achievement Related Affect" Meece found
although there was some tendency for females to feel slightly more math anxiety it was not
terribly significant (37:1).
9
17
Fiske again referred to what John Ernest, professor of mathematics at the
University of California, identifies as the "Pygmalian effect" according to which students
perform in accordance with teacher expectations. In a survey of a group of teachers he
found that almost half of the teachers expect their male students to do better in
mathematics while none of them expect the female students to do better (11:67).
According to Becker's dissertation "A Study of Differential Treatment of Females
and Males in Mathematics Classes" it was found that males tend to receive more
encouragement and that females were in fact in some instances discouraged in their
academic endeavors. It was concluded that classroom and informal interaction were both
predominately with the male students (2:142-43). Likewise Gutbezahl reported from her
work on "Female's Math Confidence" that teachers expect less academically from girls
and treat them differently from boys. Boys are also attended to more, receive more help
than girls from teachers, and are called on more often to give answers in class ( 35:7-8).
Although this research study does not deal with the differences in anxiety levels for
males and females, information involving teacher attitudes and expectations relate to this
study.
Methods of Dealing with Math Anxiety on the Post-Secondary Level
Mathematics clinics or workshops are the major route for reaching post-secondary
students and providing them with assistance in coping with their math anxiety. Time
magazine reported that after much study on why math is avoided especially by women
when it is so vital in almost every field of endeavor, Shelia Tobias of Wesleyan University
headed a math clinic in 1975 initiating a program in psychological counseling for math
students. The program involved finding the students' confidence levels and beginning
work from there. Several approaches are used, some review high school math, others
attend workshops, and others present math in game form so that the theory can be learned
(18:36).
A concept, as studied by Del lens, which appears in all definitions of math anxiety is
that math anxious people are unable to work math problems to the extent of their ability
because of their emotional reaction to mathematics. This reaction must be dealt with if the
individual is to reduce his math anxiety level (34:3).
Dew and Galassi's study on the college level demonstrated that math and test
anxiety are related but not identical and a modest relation between anxiety and math
performance can be identified. They suggest that interventions designed to do more than
reduce anxiety are needed to produce maximal improvements in math performance.
Remedial math skill interventions that are presented in low anxiety settings seem to be in
order (6:582-3). Likewise, Siegel, Galassi and Ware concluded that if researchers and
practitioners want to increase math performance on the college level, the first area of
concentration should be an intervention to increase skills. These interventions should in
turn be expected to increase performance and efficacy expectations and, as a by-product,
reduce math anxiety (22:537).
Lazarus describes another program being initiated as math anxiety reduction for
students preparing to be elementary teachers. "If the teacher is tense and ill at ease with
mathematics, such feelings infect the class with the idea that mathematics is hard or
unpleasant." The program was designed to improve problem solving skills, reduce math
anxiety and increase confidence in mathematics (16 :8). Tittle's research points out that
teacher attitudes and anxiety affect students so it is important especially for elementary
teachers to have positive attitudes about mathematics (45:1). Math anxiety has its roots in
the early years of schooling. Fauth notes that it is here that it is important to develop
positive attitudes toward the study of mathematics and understand its usefulness and
importance (10:489).
Colleges can provide training sessions for future teachers and counselors to
minimize math anxiety. Bernstein recommends that these might include having math
instructors conduct self assessment of gender and ethnicity disparities in the classroom as
related to response opportunities, feedback, etc., offering women considering entrance
into nontraditional careers, a stress free math refresher course, inservice workshop on
nontraditional assessment and counseling skills, and teaching the visualization technique
called "anchoring", that increases relaxation and reduces anxiety when thinking about
math (30:6).
Math clinics are places where adults can bring special problems about learning
math and get help with them. During these group sessions the members discuss their
mental blocks about math and find that they are not alone. Pierce's work shows a math
anxiety bill of rights (see appendix A, page 46) that has been developed to help restore
self-confidence (39:37). After some self-confidence has been restored, the teacher
introduces small bits of mathematics relevant to the student's level of understanding.
Tobias conceded that "feelings about mathematics appear to get in the way of learning
unless the feelings are identified and treated." At the clinics counselors help the individual
remember their negative feelings about mathematics and when they began (25:39-40).
A quote from Barnes describes an all too common occurrence. "She recalled a
feeling of defeat in fourth grade arithmetic when the teacher didn't seem to care whether
she learned her multiplication tables. But it didn't matter because she wanted to be an
actress and math was not important." As a result all through school she took only the
math she needed to graduate, Later when mathematics was required in college (even
though she was going to be an actress) she panicked (1:6).
For most people who suffer from high levels of math anxiety, Tobias explains, the
first thing they remember about failing at math is that it felt like a sudden death. The
incident may have occurred with word problems in the sixth grade, an equation in high
school or with calculus or statistics in college. Regardless of when or where the feeling
came, it came suddenly and in a very frightening way. The new idea was not only difficult
but it was impossible! Instead of seeking help most people have the feeling that they will
never go any further in mathematics (26:63). Tobias continues that at some point in their
12
2 0
math career they failed to some degree to understand what was being explained. Despite
the fact that they may have been quite capable up to this point, they have reached the end
of their capabilities and continue by "faking" math for years without complete
understanding. This sudden death produces feelings of guilt and shame along with
helplessness and results in true math anxiety (25:39).
Methods of Dealing with Math Anxiety on the Secondary and Elementary Levels
Individuals can sometimes cope with math almost by instinct in day to day living
but when they are asked to sit down and compute a similar math problem they panic.
Fiske's work relates such an incident.
One night recently a coed at Wesleyan University went out to thelocal pizza parlor with six friends. At the end of the meal, when the waiterarrived with a check that looked like the formula for nuclear fission, shewas the only one at the table who could figure out how much each personowed including the tip. The following morning the same student wasconfronted with a routine algebra problem in math class. She froze andcould not handle it (11:64).
According to Fiske, this is a classical case of math anxiety. People can perform
math related work in a day to day situation that they are so used to doing that they forget
it involves math. For example some women panic at balancing their bank accounts when
they compare prices and do mental calculations every day at the grocery store (11:64).
Many people have emotional barriers which prevent them from pursuing the study
of math. Negative experiences somewhere, whether at elementary, junior high or high
school discourage further math encounters. Pierce notes that many otherwise confident
and capable people feel they just do not have a "math mind" and will never be able to
understand math. Yet studies show there is no such thing as a "math mind" and almost
everyone is capable of doing math once his/her attitude about math has changed. Failure
to do well in math has much more to do with attitude and lack of study skills than it does
with lack of ability (39:31).
Brush's work indicates that although both counselors and teachers can play a vital
role in helping students overcome high levels of math anxiety it would seem that teachers
"need to convince students that mathematics can be enjoyable (a change in many students'
present attitudes) and increase their participation in mathematics endeavors" (32:36).
Meece, Wigfield and Eccles' study confirms that value perceptions play a critical
role in determining students' intentions to enroll in advanced math classes. Teachers can
help enhance students' valuing of math. Some enhancing methods would be explicitly
relating the value of math to students' everyday lives, making math personally meaningful,
and counseling students about the importance of mathematics and career choices. This
study reported that in 400 hours of classroom observation fewer than a dozen instances of
these behaviors were observed. Greater attention definitely needs to be given to this
aspect of mathematics education (19:69).
Research conducted by Reilly has yielded some interesting ideas. Age was found
to be a significant factor relating to math anxiety. The twelve year olds were the most
anxious, with the fourteen to seventeen year old group having the lowest levels of math
anxiety. Students generally became less anxious as they progressed in grade level. The
grade the student received in the most recently completed math course was directly related
to the level of math anxiety. As academic grades improved confidence levels were
increased. Taking math courses also appeared to be important in reducing math anxiety.
Students who had completed college prep math and algebra classes were more confident
than those who had not taken the courses (40:11-15).
As was pointed out previously when discussing females and teacher expectations
and as Sherard's "Math Anxiety in the Classroom" explains, teachers should avoid sex role
stereotyping in the math classroom. Teachers should not differ in their interaction with
males and females or in performance expectations. Positive models or achievers from both
sexes should be pointed out (21:106).
Teachers should strive to make the students aware of everyday usefulness of
mathematics. "The key to preventing mathophobia is letting mathematics take root in the
student's daily life. Reality based teaching will go a long way toward solving the national
mathematics problem because it will put elementary mathematics into a form that will
make sense to children," reported Lazarus (16:10). Students should be encouraged to
take more math classes. The teacher should point out the importance and use of math in
everyday life regardless of sex or career choices.
Wigfield and Meece conducted research on worry as associated with math anxiety.
Among the conclusions arrived at was the suggestion that students who do poorly in math
but attach little importance to math may not be anxious. However, students who do
poorly but want to do well may report higher levels of math anxiety (28:214).
Sherard's studies reveal that the instructor can help students develop
self-confidence in their ability to do mathematics. It should be stressed again that
everyone can do mathematics once the emotional blocks are removed. Work ought to
begin on a level at which everyone understands and has some confidence. On this level
each student should attain some success before the progression begins. Students should
be encouraged to trust their first impression as many students erase their first answer and
replace it with an incorrect one (21:107)
Dodd writes in her "Insights from a Math Phobic" that math phobics can be
created by teachers placing too much emphasis on memorizing and not taking individual
student approaches to learning into consideration. She suggests giving students a
questionnaire about math feelings the first day of class. This allows the teacher to work
on changing negative feelings even though it is a slow process. Wise use of games and
group activities can restore lost confidence. Another possible solution is collaborative and
cooperative learning activities. Working in groups or pairs may be the solution to
15
2.

overcoming the loneliness part of the anxiety. Often, pairing advanced students with those
whose skills are less developed is a good idea. Sometimes extending the support to
telephone buddies for homework questions is another possibility. Dodd also mentions
considering how long students can sit without moving or talking. For teenagers usually
thirty minutes is a long time, so activities during a class period should be varied
(7:296-7).
Sherard says emphasis should be placed on problem solving, spatial skills and the
language and symbolism of mathematics. Some feel that word problems are at the heart of
math anxiety. Teachers can help students develop methods of solving these word
problems and give them the much needed practice on problem solving by solving one or
two problems in class each day regardless of material being covered that particular day.
Spatial skills are usually difficult for students to develop. The teacher can help here by
relating the use of spatial skills in everyday life, such as objects moving in space in sports.
The mathematical language and symbolism must be explained carefully (21:108). One
suggestion by Smith was to read problems only one phrase at a time and translate it to
math language and symbols for easier understanding. The mathematical language can be
difficult, especially the verbal ambiguities. For instance, in fractional multiplication the
actual operation involves division of the smaller denominator into the larger numerator
and in addition of positive and negative numbers the actual computation involves
subtraction. The teacher must be very explicit and patient in explaining these ambiguities
(42:7).
The instructor should refrain from teaching behaviors that are inflexible or
excessively authoritarian. Some feel that math is not creative. One is not generally asked
to give his/her opinion and the answer is either right or wrong with no in between.
Sherard suggests that interaction among students should be encouraged when responding
to questions so as not to place the teacher in such an authoritative position. He also
points out that it is helpful to give the student partial credit if part of the work is correct
and that students should be taught ways to estimate and approximate answers (21:109).
Barnes notes that getting an answer to a problem and knowing how it was derived are
independent processes, one involves intuition, the other involves logic (1:7). Thus,
according to Fiske, teachers should give credit on a series of logical steps to a solution
rather than strictly a right or wrong answer (11:66-67). Clopton writes in "Tips for
Beginners" that when students ask for assistance in working problems his response is to
ask the student to explain what they do know and how they got to that point. This helps
the teacher focus on what the problem is and builds confidence in the student by allowing
him/her to demonstrate what he/she knows. Many times the student solves the problem or
sees the area of difficulty as he/she talks through the problem without teacher intervention
(4:30).
Teachers are sometimes guilty of stressing one best way to solve a problem and
requiring all students to use that method. Barnes warns that this approach limits the
student's creativity. Perhaps students should be presented the problem and allowed to
discover new challenging ways to solve it on their own (1:7).
It is important that the teacher be aware of the possible negative effects of the
process of testing on math anxiety. A definite relationship between tests and math anxiety
exists. Reilly's research shows a strong relationship between test anxiety and math
anxiety. Students who were anxious about math tests were also anxious about other tests.
Those most confident in math were carefree about non math tests as well (40'16).
Sherard suggests that teachers can ease the pressure by not over emphasizing testing but
using other criteria for grading as well, such as classwork, projects and homework. The
amount of stress and anxiety should not be increased by timing the test. Students should
be able to relax and take the test without being rushed. Retesting should be allowed when
necessary (21:109). Smith further suggests giving unsigned quizzes where the students do
not sign their names but the teacher can quickly determine the level of comprehension.
17
25
Also, having students rate test questions on an anxiety scale of 1-10 can be helpful
(42:11-12).
Leffingwell reports from his "Reduction of Test Anxiety in Students Enrolled in
Mathematics Courses: Practical Solutions for Counselors" that teachers should provide
study guides and break materials down into easy steps so that students can adequately
prepare for tests. He also indicates that a test should progress in difficulty so the student
can experience success early in the test. Realistic goals of achievement should be pointed
out to the student, grades should be based on a number or criteria instead of tests
exclusively, and alternate tests and times should be available for less stressful situations
(36:6-8).
Sherard points out that teachers should abstain from insensitive behaviors in the
teaching situation. Teachers must be supportive and encouraging. Every effort should be
made to avoid making snide remarks, assigning math for punishment or making extremely
long or difficult assignments. A student should never be humiliated by being asked to go
to the blackboard to do a problem he/she obviously cannot do (21:110). It is also often
helpful for students to work in a committee or group as they would in a social studies
class, suggests Fiske (11:67). Another interesting activity, relayed by Smith, is to appoint
a "dummy-of-the-week" each week whose duty is to ask any question anyone else feels is
too stupid to ask. The question is written down and passed to the "dummy" who in turn
asks the teacher (42:11-12).
A relaxed, supportive classroom atmosphere should be provided for the student.
The teacher should be patient and be sure his/her attitude toward math is positive because
it will be reflected in the teaching, reminds Sherard (21:110). Meyer in her study of
"Attitudes of Elementary Teachers Toward Mathematics" found the teacher to have the
most effect on the students' attitude toward mathematics. Of 61 students with positive
feelings toward math, of several choices given, 30 indicated their teachers have the most
18

influence on their attitudes. Of 59 students with negative feelings toward math 37
indicated their teachers have been the major influence (38:3).
Teague set up a methods class for elementary teachers and found that when
attitudes toward math changed or improved so did their teaching ability. In accordance
with his research he cited evidence that the teacher's attitude toward mathematics is
significantly related to the student's attitude and achievement in mathematics (44:2).
Bohuslov's report on dealing with math anxiety refers to both the studies of Aiken and the
research of Cooper and Petrosky that both found evidence of significant influence of the
instructor in the student's attitudes about mathematics (31:9).
Several studies have been conducted to determine if parental attitudes or teacher
attitudes have a stronger influence on the student. The results are somewhat
controversial. For example, Austin-Martin found the teacher's attitude to be the most
influential (29:5-7) while Echols found the parental influence to be the more significant in
her research (9:47-52).
Many students believe the subject of mathematics is boring, difficult, unneeded
and threatening to the ego. Blum-Anderson suggests these beliefs can be altered into
more positive ones if teachers take time to develop mathematical affect along with the
development of mathematical cognition. Her research provides ten strategies to include
affect in mathematics classrooms. These include helping students understand frustration,
the importance of positive teacher vocabulary, cooperative learning decreasing individual
achievement, making connections between mathematics and occupational uses and using
advertising campaigns for mathematics courses (3:433-435).
Gibson's article on "Learning What Counts" includes tips to help parents
incorporate math into the day-to-day lives of their children (13:40). Preschoolers could
use car trips to understand time, distance, and identify shapes. Bath time allows for
19
'2 7
measuring and comparing volumes. Children ages five to eight should use card games to
develop memory skills and pattern recognition as well as learning to estimate and compare
heights, weights, size, etc. Those children nine to twelve years should be included on
family shopping trips to compare prices and discounts, perhaps do scale drawings of a
room to determine furniture arrangements and develop bar graphs of monthly electric bills.
Teenagers should be involved in major purchases (like a new car), encouraged to establish
bank accounts and budgets and perhaps keep records and graphs of miles driven and
gasoline used in family vehicles. Parents who deal in positive ways with math situations
and allow math to be fun will have a great positive influence on how their children view
math.
Summary
As Sherard's research concludes
Many educators are now recognizing math anxiety as a hindrance tolearning mathematics. Math anxiety can be described a fear of mathematicsor an intense, negative emotional reaction to mathematics. Its effects onpeople are quite varied. Some people may have such acute anxiety aboutmathematics that they avoid mathematics at any cost with the ultimateeffect of handicapping themselves both in their everyday lives and in theiremployment opportunities (21:106).
Math anxiety seems to be ever present, and must be dealt with in an effective
manner. Research seems to indicate that this solution is clinics and workshops with
teachers and counselors on the post-secondary level and modification of teacher attitudes
and teaching techniques for the elementary and secondary levels. As Dodd put it, teachers
who limit their teaching to traditional methods will continue to create math phobics, while
those who expand their repertoire of teaching strategies will likely see an increase in the
number of math fans. The first goal of every teacher should be to help students believe
they can learn (7:298).
CHAPTER THREE
Methods and Procedures
Sources of Data
The data for this research were obtained from selected sections of Algebra I (grade
levels 9-12) at Ritchie County High School, Ellenboro, West Virginia. The study was
conducted over a period of twelve weeks.
Ritchie County High School is a rural high school with grades nine through twelve,
with approximately six hundred to six hundred fifty students attending the school. Most
of the students come from low and middle income families.
The research involved forty-eight students, twenty-five of whom acted as a control
group and received no treatment. The classes were randomly selected as towhich acted
as control groups and which were experimental groups. The same instructor taught all
groups so as to eliminate any extra variables. No explanation was made to the students
concerning the research study or testing; however, administrators were familiarized with
the research study.
At the onset of the research study, both the control and experimental groups were
tested to determine the level of math anxiety of the student. The Mathematics Anxiety
Rating Scale (MARS) designed by Richardson and Suinn (20:138-149) was administered
as the test of anxiety level. After the testing was completed the teacher instructed the
students designated as the control group in the usual manner. The remaining students,
henceforth referred to as the experimental group, received a treatment on coping with
math anxiety. The treatment involved positive teacher attitudes and modified teaching
techniques. At the end of the twelve weeks all students were again given the MARS test
to determine any change in math anxiety levels.
21
Research Methodology
The experimental method of research methodology was used for this study. Using
the categorization designed by Campbell and Stanley, the experimental study was of the
general classification of true experimental design. More specifically, it is of the
pretest-posttest control group design. The experimental group and the control group
were randomly selected. The experimental group was evaluated, subjected to the
experimental variable, and reevaluated. The control group was evaluated at the beginning
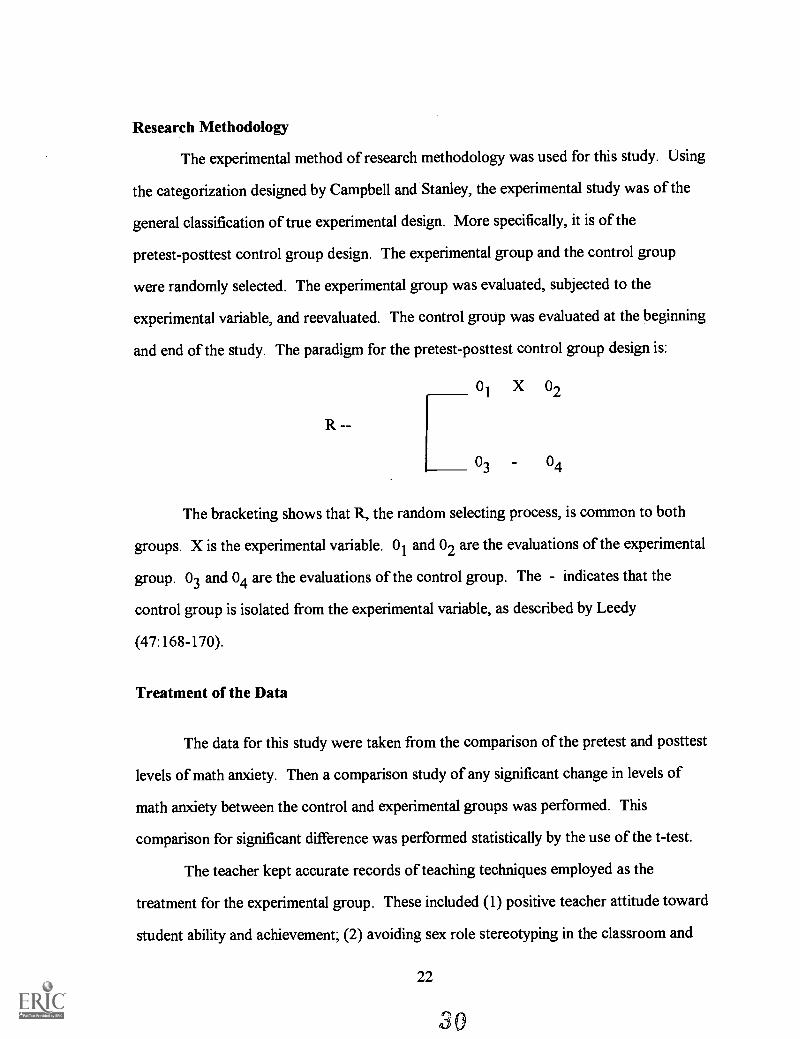
and end of the study. The paradigm for the pretest-posttest control group design is:
01 X 02
R
03 - 04
The bracketing shows that R, the random selecting process, is common to both
groups. X is the experimental variable. 01 and 02 are the evaluations of the experimental
group. 03 and 04 are the evaluations of the control group. The - indicates that the
control group is isolated from the experimental variable, as described by Leedy
(47:168-170).
Treatment of the Data
The data for this study were taken from the comparison of the pretest and posttest
levels of math anxiety. Then a comparison study of any significant change in levels of
math anxiety between the control and experimental groups was performed. This
comparison for significant difference was performed statistically by the use of the t-test.
The teacher kept accurate records of teaching techniques employed as the
treatment for the experimental group. These included (1) positive teacher attitude toward
student ability and achievement; (2) avoiding sex role stereotyping in the classroom and
22
3 0
keeping records of students being called on in class to ensure equalization; (3) making
students aware of the everyday usefulness of mathematics; (4) helping students to develop
self-confidence by using cooperative learning activities; (5) concentrating on problem
solving skills, language and symbolism; (6) avoiding inflexible teaching behaviors and the
authoritarian position; (7) being aware of the possible negative effects of the testing
process; and (8) providing a relaxed, supportive classroom atmosphere by incorporating
games, hands on activities and group work.
The Mathematics Anxiety Rating Scale (MARS) designed by Richardson and
Suinn (1972) was used to determine the level of math anxiety of the students in the pretest
and posttest situations. (See appendix B, page 47, for sample of questions). This
ninety-eight question test according to research seems to be the most valid and most
widely used scale in measuring the level of math anxiety. According to Fulkerson, J.
Galassi, and M. Galassi the MARS is designed to assess math anxiety in a wide variety of
ordinary life and academic situations and has the greatest amount of psychometric,
reliability, and validity data (12:378). The validity was attested to in Rounds' and
Hendel's "Measurement and Dimensionality of Mathematics Anxiety" (20:138-149) and in
their "Factor Structure of the Mathematics Anxiety Rating Scale" (41:1-34). Results of
both the pretest and posttest were recorded for statistical comparison.
Collecting Pretest Data
The sections were designated as either experimental or control groups before the
initial meeting of the classes to eliminate any teacher prejudice. The experimental group
consisted of twenty-three students while the control group had twenty-five students.
Grade level and sex distribution were fairly consistent between the two groups, see
Figures 1 and 2.
23
31

Figure 1
Grade Level Distribution
Figure 2
Sex Distribution
During the first session of class, the MARS (Math Anxiety Rating Scale) test was
administered to both the experimental and control groups to determine the level of math
anxiety in each group. During the second session of each class, a pretest was administered

to each group to test very basic mathematics skills. The results of both the MARS test
and the mathematics pretest were recorded to use for later comparison.
Experimental Procedure
The control group. The control group received no special variable and was taught
using the teacher's usual method. The one exception was that students were asked to
keep a journal of their feelings about mathematics to be recorded on specified dates.
Students were given an introduction and explanation for each section in the textbook,
examples were reviewed, and assignments were made. After four or five sections were
covered, students were tested. Six weeks grades were derived from a combination of
homework assignments, worksheets, and tests.
The experimental group. The experimental group received several extra
assignments outside of the usual textbook problems, were frequently allowed to work in
groups or with partners, and were encouraged and positively reinforced by the teacher.
The six weeks grades for this group were derived not only from homework assignments,
worksheets, and tests but from individual and group projects. The inclusion of the
projects into the six weeks grades decreased the importance of the test grades in figuring
the six weeks grades. Grades are figured on a point system with tests being worth 100
points, homework and worksheets being worth five points, and projects ranging from 10
to 50 points depending upon the specific project. Students were also required to keep a
journal to record how they felt about mathematics on certain specified dates.
The introduction of project type activities was used to spark interest in those
individuals opposed to continual repetitive book work . Some projects were designed to
be fun and others were to relate mathematics to the everyday world. As previously stated,
some were individual projects while others were group projects with everyone in the
group receiving the same grade (number of points) for the project. Questions about the
projects were included on the tests to make sure all members of the group knew how to
complete all group work and calculations. This resulted in higher level students within the
group helping the lower level students to understand all procedures.
The first project concerned surveys. Students were given survey papers and were
asked to survey ten people outside of the classroom concerning how many and what type
of pets they owned. This was an individual project. After bringing the information to
class, survey results were complied using means, modes, medians, and dot frequency
diagrams.
In another individual project, students kept records of television viewing for one
week. Students were to keep records of the times they watched television and the total
number of hours and minutes spent watching television. These records were again
brought to class to be combined and compared. Classroom charts and dot frequency
diagrams were constructed indicating the average number of hours of television watched
nightly and weekly, as well as the hours during the day when television was most
frequently watched.
An additional assignment involving television was to watch television for a
designated hour and to record types of commercials during the hour. Pie charts were then
designed to show the percentages and types of commercials during the viewing time.
One of the major group projects was a travel project. Students were divided into
groups and each group member (because not all groups had an equal number of people)
was given a specified amount of money. Students were then to combine their money and
plan a group trip. Students could travel anywhere in the United States for seven days.
Students were required to submit a budget including transportation, food , lodging, etc.
Map reading was necessary as a description of exact routes and number of miles was
required. Students were given a road atlas and several lodging booklets which included
rates. One group member was required to give an oral description of the trip planned and
basic information about location and cost. Each group was required to complete a travel
graph showing distances and intervals of travel and to complete a pie chart indicating what
percent of their money was spent for food, transportation, lodging, etc. A variety of trips
were planned including fishing expeditions, amusement parks, and beach vacations.
In addition a project was designed to integrate health into the algebra classroom.
Students used literature from cigarette companies offering free merchandise for cigarette
package labels to determine the cost of promotional jackets, T-shirts, etc. in terms of life
expectancy. Multiplication was used to determine the cost of one's life after being given
the number of minutes each cigarette takes from a human life. Students also wanted to
figure the cost in dollars and cents of smoking. Smoking costs for a year, five years, etc.
were figured and other ways of spending that money was discussed.
Other small projects included measuring items in the classroom, finding area of
various rooms and hallways as well as converting recipes to serve different amounts.
These involved the use of fractions, multiplication and division.
The last major project that the students completed was called "Get a Job." It
involved researching different professions as to job outlook, salary, benefits, and
educational requirements. Students then chose a profession they were interested in and
wrote a one page paper about their research. The next step was to write a letter to an
individual or a company related to the profession chosen. Included with the letter was a
prepared survey that asked about types of math and math education necessary for each
job. After the surveys were returned to the students and brought to class, the results
were graphed on large bar graphs in the classroom. Also included as part of the survey
was an example of a math problem used daily on the job. Students were then asked to
copy these problems onto index cards and to share this problem as well as a brief
description of the job with the class in an oral presentation.
Daily the teacher attempted to reflect a positive attitude concerning mathematics.
Every effort was made to make the students feel comfortable in the mathematics
classroom. Students were never required to work on the board unless they volunteered to
do so. Cooperative learning, group work and partner work were incorporated much of
27
the time. Records were kept when calling on students for questions in class so as not to
repeatedly call on the same students. Every attempt was made by the teacher to reduce
math anxiety and create an enjoyable atmosphere while relating mathematics to everyday
world situations.
Collecting Posttest Data
At the end of the twelve week experimental period both the control and the
experimental groups were given the MARS test a second time. At this time both groups
were also administered a posttest on basic algebra skills. This posttest was identical to the
pretest given to both groups at the beginning of the twelve week period.
Treating the Data
After all tests were administered and scores were tabulated, these results were
entered into the computer. A computer spreadsheet program was set up in Microsoft
Works to run the calculations for a basic two sample t-test. The results from running the
t-tests on the data were recorded and stored for comparison.
Pretests from both the control and experiment groups were compared statistically
to determine if both groups were at the same level in basic algebra skills at the beginning
of the study. Pretests and posttests were compared in both the control and experimental
groups to determine achievement in basic algebra skills for each group. Posttests were
again compared from both groups to determine if the average achievement in basic algebra
skills remained the same between the groups.
Academic grades in Algebra I were compared statistically to determine any
significant differences in achievement levels. Comparisons were made for each major test,
as well as for the six weeks grading periods.
The results of the MARS test given to each group at the onset of the study were
compared statically by the t-test to determine if the beginning math anxiety levels between
the groups were similar. The results of the MARS test given at the beginning were
compared with the results of the MARS test given at the end of the study to determine if
the anxiety levels changed due to the treatment administered. The final MARS test results
were again compared between the experimental and control groups to determine if anxiety
levels remained similar at the end of the study. Ten questions from the 98 question MARS
test were also compared individually by the use of the t-test to determine where statistical
differences might occur.
CHAPTER FOUR
Analysis of Data
Comparison of Pretest /Posttest Results
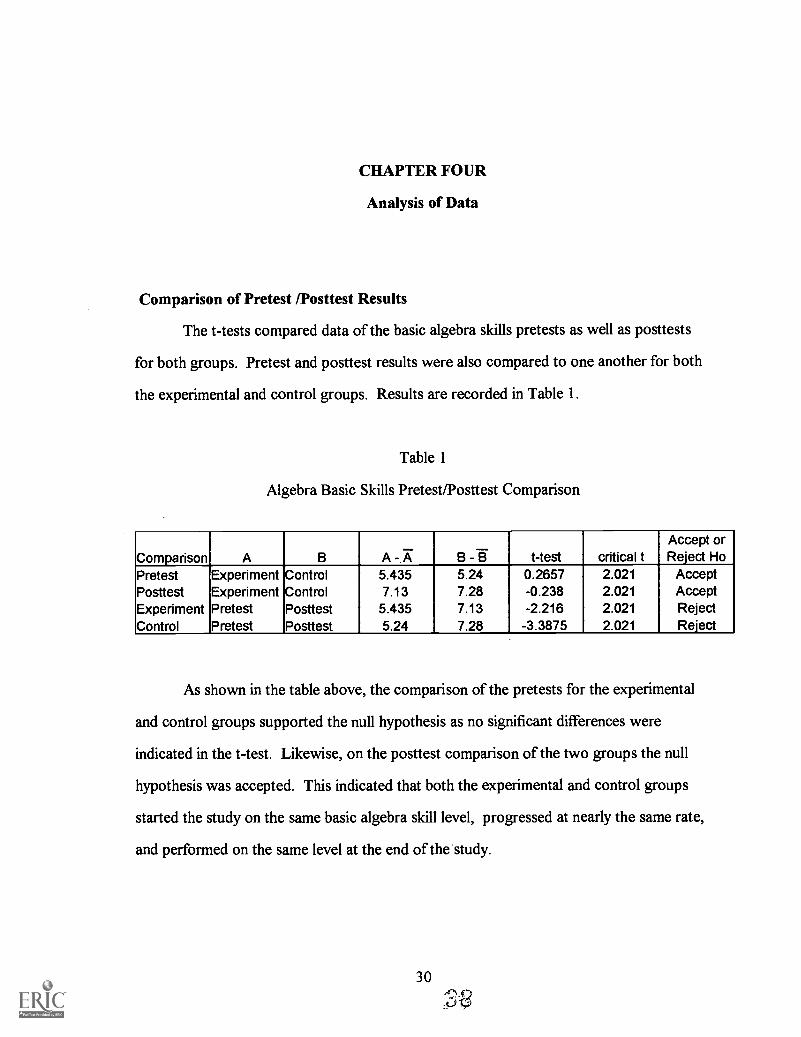
The t-tests compared data of the basic algebra skills pretests as well as posttests
for both groups. Pretest and posttest results were also compared to one another for both
the experimental and control groups. Results are recorded in Table 1.
Table 1
Algebra Basic Skills Pretest/Posttest Comparison
Comparison A B A- 7 B- I t-test critical tAccept orReject Ho
Pretest Experiment Control 5.435 5.24 0.2657 2.021 AcceptPosttest Experiment Control 7.13 7.28 -0.238 2.021 AcceptExperiment Pretest Posttest 5.435 7.13 -2.216 2.021 RejectControl Pretest Posttest 5.24 7.28 -3.3875 2.021 Reject
As shown in the table above, the comparison of the pretests for the experimental
and control groups supported the null hypothesis as no significant differences were
indicated in the t-test. Likewise, on the posttest comparison of the two groups the null
hypothesis was accepted. This indicated that both the experimental and control groups
started the study on the same basic algebra skill level, progressed at nearly the same rate,
and performed on the same level at the end of the study.

When the pretest for each individual group was compared to the posttest for that
particular group the null hypothesis was rejected as statistically a significant difference was
indicated by the t-tests. This difference is demonstrated in the following, Figure 3.
Figure 3
Algebra Basic Skills Pretest/Posttest Comparison
Figure 3 indicates that both the experimental and control groups improved in basic
algebra skills from the pretest to the posttest.
Academic grades for the two groups were also compared for each major test as
well as for each six weeks grading period. As indicated in Table 2 , no significant
differences were evident between the groups in academic performance. (The t-tests
showed Test 3 as the only point where there was any significant difference in academic
performance between the experimental and control groups.)
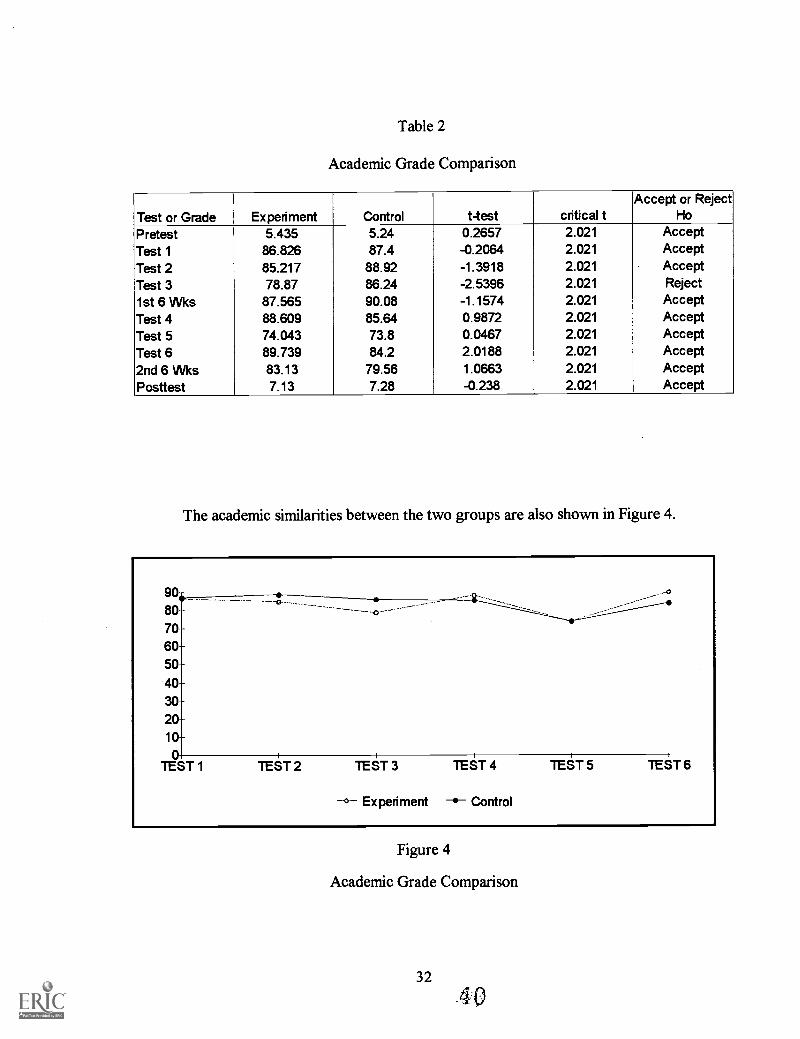
Table 2
Academic Grade Comparison
Test or Grade Experiment Control West critical tAccept or Reject
Ho
Pretest 5.435 5.24 0.2657 2.021 Accept
Test 1 86.826 87.4 -0.2064 2.021 Accept
Test 2 85.217 88.92 -1.3918 2.021 AcceptTest 3 78.87 86.24 -2.5396 2.021 Reject
1st 6 Wks 87.565 90.08 -1.1574 2.021 AcceptTest 4 88.609 85.64 0.9872 2.021 Accept
Test 5 74.043 73.8 0.0467 2.021 Accept
Test 6 89.739 84.2 2.0188 2.021 Accept
2nd 6 Wks 83.13 79.56 1.0663 2.021 Accept
Posttest 7.13 7.28 -0.238 2.021 Accept
The academic similarities between the two groups are also shown in Figure 4.
Figure 4
Academic Grade Comparison
32
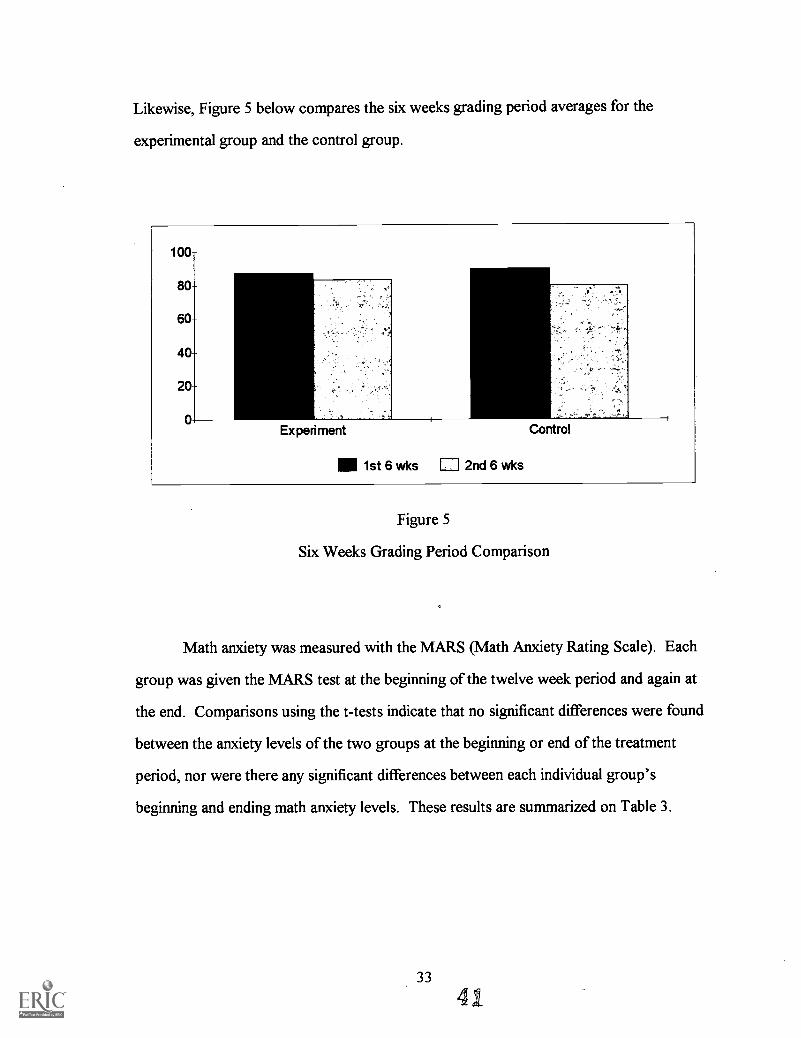
Likewise, Figure 5 below compares the six weeks grading period averages for the
experimental group and the control group.
Figure 5
Six Weeks Grading Period Comparison
Math anxiety was measured with the MARS (Math Anxiety Rating Scale). Each
group was given the MARS test at the beginning of the twelve week period and again at
the end. Comparisons using the t-tests indicate that no significant differences were found
between the anxiety levels of the two groups at the beginning or end of the treatment
period, nor were there any significant differences between each individual group's
beginning and ending math anxiety levels. These results are summarized on Table 3.
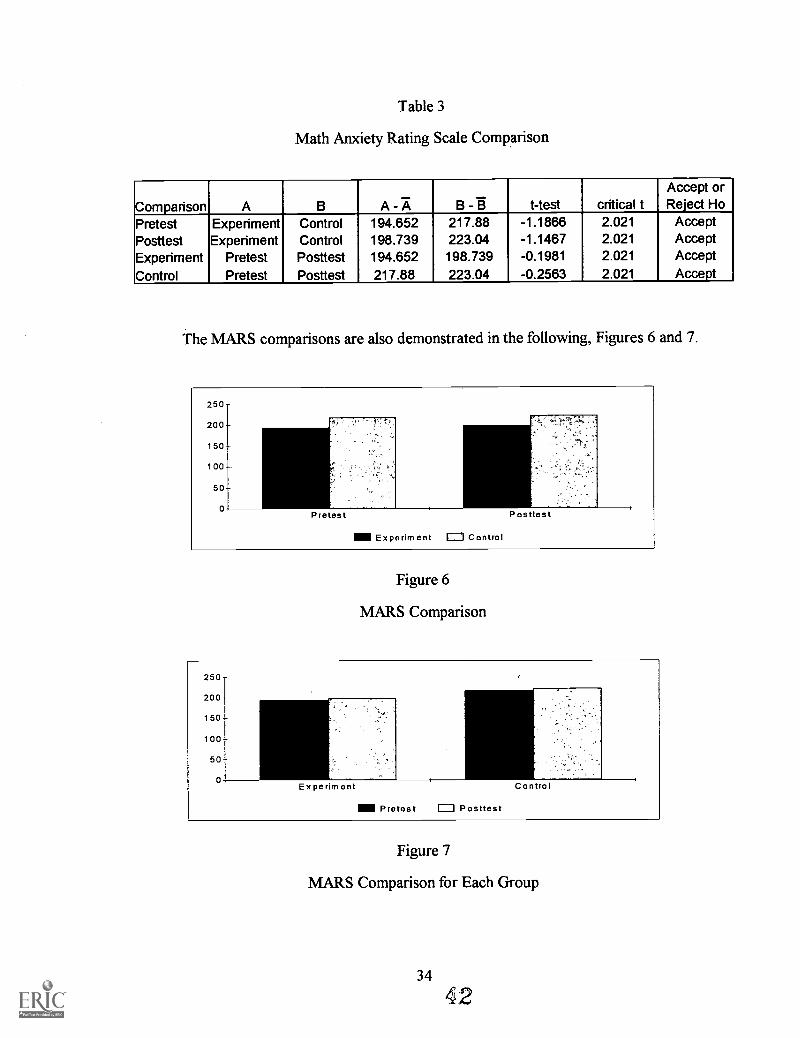
Table 3
Math Anxiety Rating Scale Comparison
Comparison A B A- 71/4 B- B t-test critical tAccept orReject Ho
Pretest Experiment Control 194.652 217.88 -1.1866 2.021 Accept
Posttest Experiment Control 198.739 223.04 -1.1467 2.021 Accept
Experiment Pretest Posttest 194.652 198.739 -0.1981 2.021 Accept
Control Pretest Posttest 217.88 223.04 -0.2563 2.021 Accept
The MARS comparisons are also demonstrated in the following, Figures 6 and 7.
Figure 6
MARS Comparison
Figure 7
MARS Comparison for Each Group
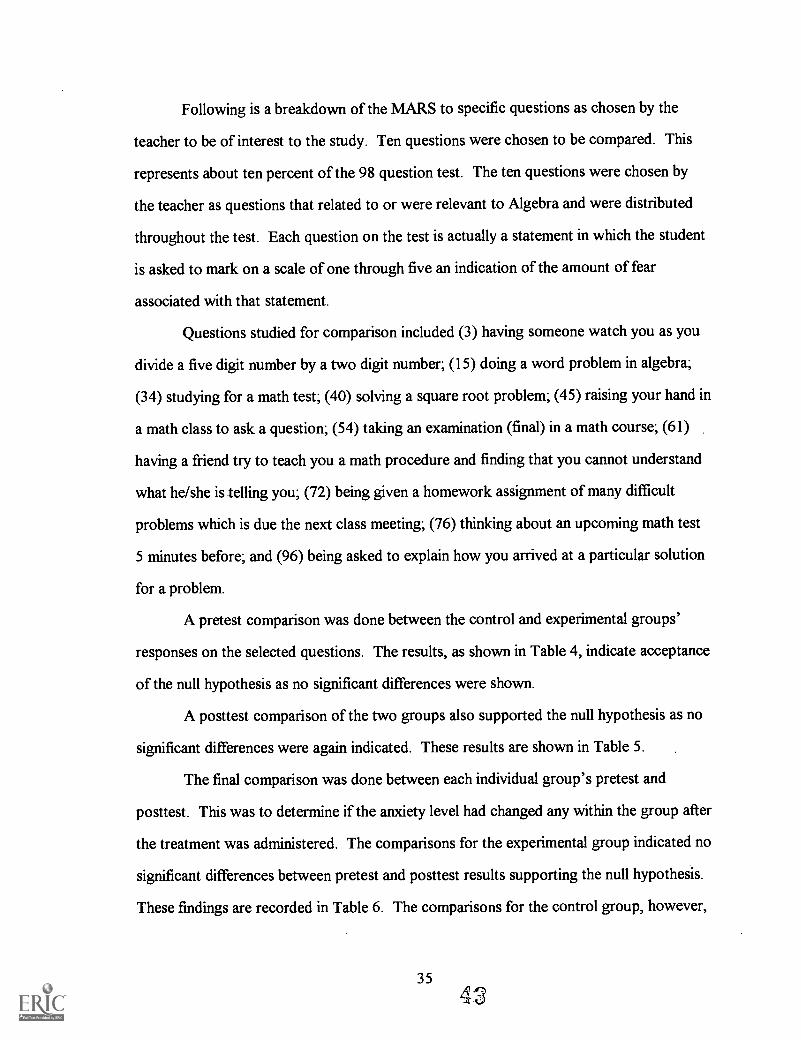
Following is a breakdown of the MARS to specific questions as chosen by the
teacher to be of interest to the study. Ten questions were chosen to be compared. This
represents about ten percent of the 98 question test. The ten questions were chosen by
the teacher as questions that related to or were relevant to Algebra and were distributed
throughout the test. Each question on the test is actually a statement in which the student
is asked to mark on a scale of one through five an indication of the amount of fear
associated with that statement.
Questions studied for comparison included (3) having someone watch you as you
divide a five digit number by a two digit number; (15) doing a word problem in algebra;
(34) studying for a math test; (40) solving a square root problem; (45) raising your hand in
a math class to ask a question; (54) taking an examination (final) in a math course; (61)
having a friend try to teach you a math procedure and finding that you cannot understand
what he/she is telling you; (72) being given a homework assignment of many difficult
problems which is due the next class meeting; (76) thinking about an upcoming math test
5 minutes before; and (96) being asked to explain how you arrived at a particular solution
for a problem.
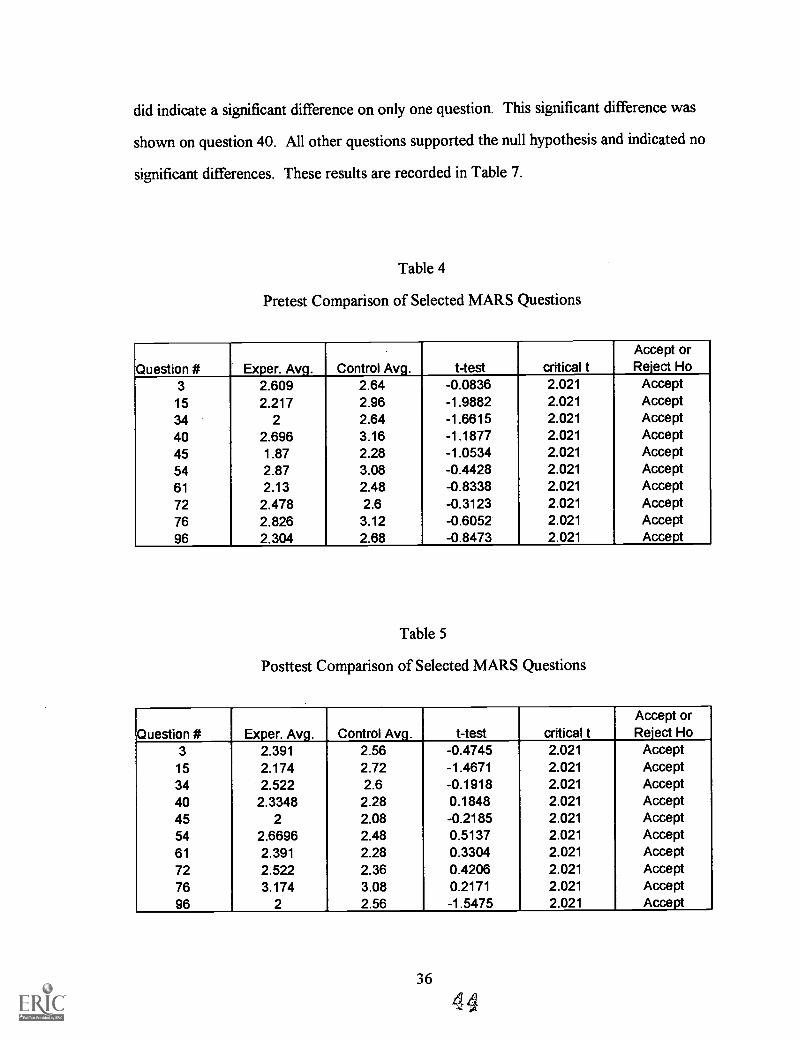
A pretest comparison was done between the control and experimental groups'
responses on the selected questions. The results, as shown in Table 4, indicate acceptance
of the null hypothesis as no significant differences were shown.
A posttest comparison of the two groups also supported the null hypothesis as no
significant differences were again indicated. These results are shown in Table 5.
The final comparison was done between each individual group's pretest and
posttest. This was to determine if the anxiety level had changed any within the group after
the treatment was administered. The comparisons for the experimental group indicated no
significant differences between pretest and posttest results supporting the null hypothesis.
These findings are recorded in Table 6. The comparisons for the control group, however,
did indicate a significant difference on only one question. This significant difference was
shown on question 40. All other questions supported the null hypothesis and indicated no
significant differences. These results are recorded in Table 7.
Table 4
Pretest Comparison of Selected MARS Questions
Question # Exper. Avg. Control Avg. t-test critical tAccept orReject Ho
3 2.609 2.64 -0.0836 2.021 Accept
15 2.217 2.96 -1.9882 2.021 Accept34 2 2.64 -1.6615 2.021 Accept40 2.696 3.16 -1.1877 2.021 Accept45 1.87 2.28 -1.0534 2.021 Accept54 2.87 3.08 -0.4428 2.021 Accept61 2.13 2.48 -0.8338 2.021 Accept72 2.478 2.6 -0.3123 2.021 Accept76 2.826 3.12 -0.6052 2.021 Accept96 2.304 2.68 -0.8473 2.021 Accept
Table 5
Posttest Comparison of Selected MARS Questions
Question # Exper. Avg. Control Avg. t-test critical tAccept orReject Ho
3 2.391 2.56 -0.4745 2.021 Accept15 2.174 2.72 -1.4671 2.021 Accept34 2.522 2.6 -0.1918 2.021 Accept40 2.3348 2.28 0.1848 2.021 Accept45 2 2.08 -0.2185 2.021 Accept54 2.6696 2.48 0.5137 2.021 Accept61 2.391 2.28 0.3304 2.021 Accept72 2.522 2.36 0.4206 2.021 Accept76 3.174 3.08 0.2171 2.021 Accept96 2 2.56 -1.5475 2.021 Accept
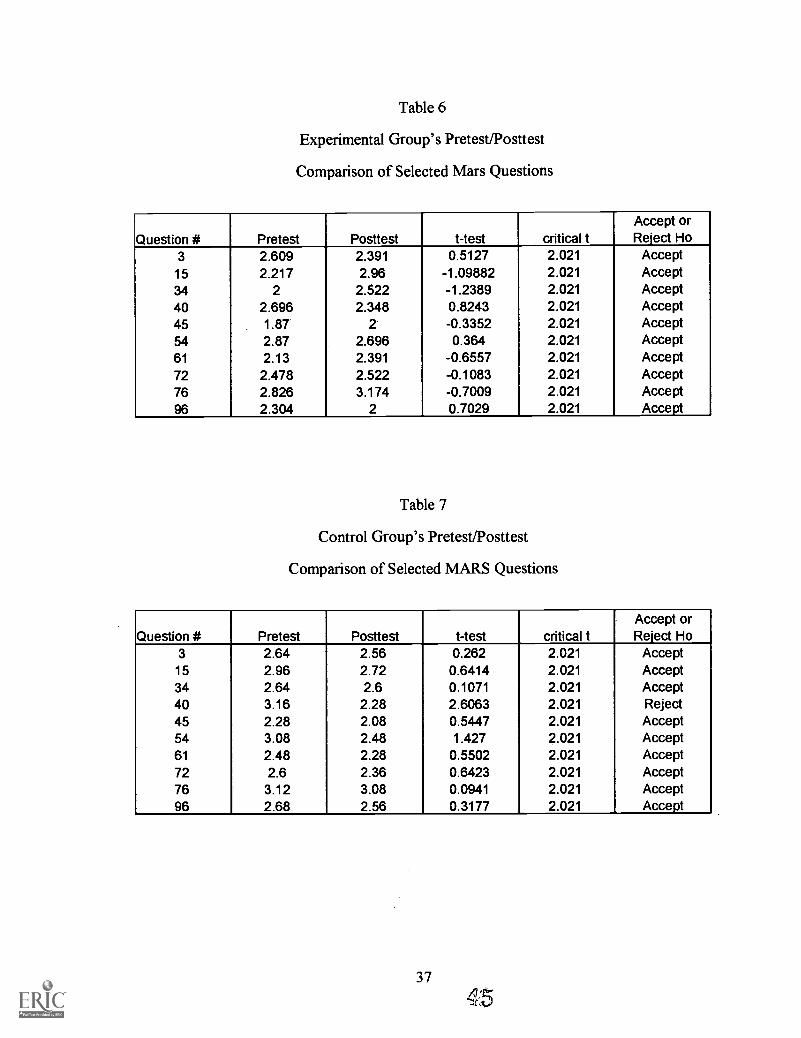
Table 6
Experimental Group's Pretest/Posttest
Comparison of Selected Mars Questions
Question # Pretest Posttest t-test critical tAccept orReject Ho
3 2.609 2.391 0.5127 2.021 Accept15 2.217 2.96 -1.09882 2.021 Accept34 2 2.522 -1.2389 2.021 Accept40 2.696 2.348 0.8243 2.021 Accept45 1.87 2 -0.3352 2.021 Accept54 2.87 2.696 0.364 2.021 Accept61 2.13 2.391 -0.6557 2.021 Accept72 2.478 2.522 -0.1083 2.021 Accept76 2.826 3.174 -0.7009 2.021 Accept96 2.304 2 0.7029 2.021 Accept
Table 7
Control Group's Pretest/Posttest
Comparison of Selected MARS Questions
Question # Pretest Posttest t-test critical tAccept orReject Ho
3 2.64 2.56 0.262 2.021 Accept15 2.96 2.72 0.6414 2.021 Accept34 2.64 2.6 0.1071 2.021 Accept40 3.16 2.28 2.6063 2.021 Reject45 2.28 2.08 0.5447 2.021 Accept54 3.08 2.48 1.427 2.021 Accept61 2.48 2.28 0.5502 2.021 Accept72 2.6 2.36 0.6423 2.021 Accept76 3.12 3.08 0.0941 2.021 Accept96 2.68 2.56 0.3177 2.021 Accept
37
The Hypotheses
The null hypothesis was that teaching techniques would make no significant
difference in the level of math anxiety of the students in the study. The alternate
hypothesis was that teacher attitudes would have no significant influence on the level of
math anxiety of the students in the study.
The data from the MARS was statistically evaluated using the t-test to determine if
there were indeed any significant differences in the math anxiety level of the students in the
study. Each t-test was set up to test: H0: A - B = 0
H1: A-B 0
d =.05
In all t-tests performed on data comparing the experimental group with the control
group both in the pretest (before any experimental variable was introduced) and in the
posttest (after the experimental variable was introduced) the null hypothesis was accepted,
proving there was no significant difference in the level of math anxiety of the students in
the study.
T-tests were also performed on data comparing the pretest to the posttest for the
experimental group. In each case the null hypothesis was accepted, indicating there were
no significant differences in math anxiety levels as a result of the experimental variable.
Likewise, the t-tests were used to compare the pretest to the posttest for the control
group. In most cases the null hypothesis was again accepted showing no significant
difference in math anxiety levels. The only exception, which showed a rejection of the null
hypothesis indicating a significance difference was on question 40. Here the control
group's pretest average was 3.16 while the posttest average was 2.28, indicating that the
anxiety level decreased on this particular question. The question concerned solving a
square root problem.
38
Other Findings
The comparisons of the academic grades for the control and experimental groups
indicated that the academic progress in the algebra classes was similar for the two groups
during the twelve week period of study. The t-tests comparing the academic grades on
major tests and for six weeks grading periods showed no significant differences between
the two groups. There was one exception on Test 3, the average grade for the
experimental group was 78.87% and the average grade for the control group was 86.24%,
which resulted in the rejection of the null hypothesis, thus indicating a significant
difference on that particular test.
The comparison of the basic algebra skills pretest and posttest for each individual
group rejected the null hypothesis. This indicated that the skill level of each group in
algebra changed significantly during the twelve week period. However, the comparison of
the group's pretests and posttests with one another showed that change must be constant
for the two groups. The t-test comparing the experimental group's pretest with the
control group's pretest and the t-test comparing the experimental group's posttest with
control group's posttest both supported the null hypothesis and showed no significant
difference.
Summary of Results
The results of this study indicate that neither teaching techniques or teacher
attitudes had any significant influence on the level of math anxiety of the students in this
study. Furthermore, it appears that neither teaching techniques or teacher attitudes had
any significant effect on academic grades of the students in this study.
39
4.7
CHAPTER FIVE
Summary, Conclusions, and Recommendations
Summary
The purpose of this study was to determine if modifying teaching techniques and
teacher attitudes would affect the math anxiety level in secondary level students. An
experimental group of 23 secondary students and a control group of 25 secondary
students were used for the study's sample. Both groups were sections of Algebra I. The
experimental variable was to change teaching techniques to include group, partner,
cooperative learning, projects, and hands on activities. Teacher attitudes were also
modified to reflect positive useful attitudes toward mathematics and attempt to reduce
math uneasiness. The study continued for a twelve week period.
Math anxiety levels were determined by use of the MARS. The MARS was
administered to both groups at the beginning of the twelve week period of study and again
at the end of the study.
A basic algebra skills pretest and posttest was also administered to both groups. In
addition to these instruments for statistical study, academic grades for major tests and six
weeks grading periods were available for comparison. T-tests were used for statistical
comparisons. Numerous t-tests were performed on the above mentioned data, comparing
both the experimental and control groups to one another and comparing each individual
group's pretests and posttests as to the changes occurring during the period of study.
Almost every t-test performed supported the null hypothesis indicating that there were no
significant differences in the two groups.
Conclusion
The statistical evaluations by t-tests of the MARS results supported one hundred
percent the null hypothesis. This concludes that according to this study neither teaching
techniques or teacher attitudes affected the math anxiety level of the secondary students.
It was also indicated by statistical comparisons that teaching techniques and
teacher attitudes did not affect academic grades of the students in the study.
It is the researcher's opinion that teacher attitudes are difficult to modify and
reflect differently to individual groups. In any research of this type, it should be taken into
consideration that a teacher automatically tries to reduce math anxiety in all classes and
with all groups. It is difficult, if not impossible, for a math teacher to not try to make all
students comfortable with math and math concepts.
Recommendations
It is recommended that further study be completed in the area of reduction of math
anxiety by using a larger sample and a longer period of study. As stated above, it seems
teaching techniques should be concentrated on more than teacher attitudes. A broader
range of teaching techniques and their effectiveness in reducing math anxiety needs to be
researched. Sharing of successful teaching techniques among classroom teachers may be
the vital key in reducing math anxiety.
41

BIBLIOGRAPHY
Periodicals
1. Barnes, Elizabeth. "Demystifying Math." American Education, Aug./Sept. 1980, pp.6-8.
2. Becker, Joanne Rossi. "A Study of Differential Treatment of Females and Males inMathematics Classes." Dissertation Abstracts International 41 (1980),142-43A (University of Maryland).
3. Blum-Anderson, Judy. "Increasing Enrollment in Higher Level Mathematics Classesthrough the Affective Domain." School Science and Mathematics, Dec. 1992,pp. 433-36.
4. Clopton, Edwin L. "Tips for Beginners." The Mathematics Teacher , Jan. 1992, p.30.
5. Crypton, Dr. "Mathophobia - A Disastrous Hang-up." Science Digest, July 1981,pp. 121-123.
6. Dew, K. M. Harriss, John P. Galassi, and Merna Dee Galassi. "Math Anxiety:Relation with Situational Test Anxiety, Performance, Physiological Arousal, andMath Avoidance Behavior." Journal of Counseling Psychology, Oct. 1984, pp.580-3.
7. Dodd, Anne Wescott. "Insights from a Math Phobic." The Mathematics Teacher,April 1992, pp. 296-8.
8. Donady, Bonnie, and Sheila Tobias. "Math Anxiety." The Education Digest, Dec.1977, pp. 49-52.
9. Echols, Patricia. "A Study of the Relationships Among Students' Attitudes TowardMathematics and the Variables of Teacher Attitude, Parental Attitude,Achievement, Ability, Sex of the Student and Grade Level of the Student."Dissertation Abstract International 42 (1982), 47-52A. (University ofHouston).
10. Fauth, Gloria C., and Judith E. Jacobs. "Equity in Mathematics Education: TheEducational Leader's Role." Educational Leadership, March 1980, pp.485-490.
42

11. Fiske, Edward B. "Found! A Cure for Math Anxiety." Parents, Feb. 1980, pp.64-67.
12. Fulkerson, Katherine, John Galassi and Merna Galassi. "Relation BetweenCognitions and Performance of Math Anxious Students." Journal ofCounseling Psychology, July 1984, pp. 376-82.
13. Gibson, Debra Solberg. "Learning What Counts." Better Homes and Gardens, May1994, pp. 38-40.
14. Hollifield, John H. "Research Clues." Today's Education, Sept./Oct. 1980, p. 26.
15. Iker, Sam. "A Math Answer for Women." MOSAIC, May/June 1980, pp. 39-45.
16. Lazarus, Mitchell. "Rx for Mathophobia." The Education Digest, Nov. 1975, pp.7-10.
17. "Math Misery." Human Behavior, Jan. 1979, p 67.
18. "Math Mystique: Fear of Figuring." Time, 14 March 1977, p. 36.
19. Meece, Judith L., Allan Wigfield, and Jacquelynne S. Eccles. "Predictors of MathAnxiety and Its Influence on Young Adolescents' Course Enrollment Intentionsand Performance in Mathematics." Journal of Educational Psychology, March1990, pp. 60-70.
20. Rounds, James B., Jr., and Darwin D. Hendel. "Measurement and Dimensionality ofMathematics Anxiety." Journal of Counseling Psychology, March 1980, pp.138-149.
21. Sherard, Wade H. "Math Anxiety in the Classroom." The Clearing House, Nov.1981, pp. 106-110.
22. Siegel, Ross G., John P. Galassi, and William B. Ware. "A Comparison of TwoModels for Predicting Mathematics Performance: Social Learning Versus MathAptitude - Anxiety." Journal of Counseling Psychology, Oct. 1985, pp. 531-8.
23. Tankersley, Karen. "Teaching Math Their Way." Educational Leadership, May1993, pp. 12-13.
24. Thompson, Carolyn. "Life Has Quickly Become a Jumble of Many Numbers." ThtParkersburg News, 20 March 1996, p. 1, cols. 1-2.
43
51

25. Tobias, Sheila. "Managing Math Anxiety." The Education Digest, Dec. 1978, pp.39-41.
26. . "Who's Afraid of Math and Why?" The Atlantic Monthly, Sept. 1978, pp.63-65.
27. , and Carol Weissbrod. "Anxiety and Mathematics: An Update." 'laniardEducational Review, Feb. 1980, pp. 63-70.
28. Wigfield, Allan, and Judith L. Meece. "Math Anxiety in Elementary and SecondarySchool Students." Journal of Educational Psychology, June 1988, pp. 210-16.
ERIC Documents
29. Austin-Martin, George. Correlates of Math Anxiety in Female College Freshmen.ERIC ED 194 351.
30. Bernstein, Joan D. Barriers to Women Entering the Workforce. Math Anxiety.ERIC ED 359 381.
31. Bohuslov, Ronald L. A Method for Dealing with Attitudes and Anxieties inMathematics ERIC ED 194 158.
32. Brush, Lorelei R. Why Women Avoid the Study of Mathematics: A LongitudinalStudy Final Report. ERIC ED 188 887.
33. Calvert, Elyse L. A Study of the Relationship Between Level of Mathematics Anxietyand Sex, Age, Mathematical Background and Previous Success in Mathematics.ERIC ED 200 265.
34. Dellens, Nfike. Math Anxiety: What Can a Learning Center Do About It? ERIC ED176 963.
35. Gutbezahl, Jennifer. How Negative Expectancies and Attitudes Undermine Females'Math Confidence and Performance: A Review of the Literature. ERIC ED380 279.
36. Leffingwell, R. Jon. Reduction of Test Anxiety in Students Enrolled in MathematicsCourses: Practical Solutions for Counselors. ERIC ED 195 881.
37. Meece, Judith L. Sex Differences in Achievement-Relate. Affect. ERIC ED 204410.
44
38. Meyer, Ruth A. Attitudes of Elementary Teachers Toward Mathematics. ERIC ED190 388.
39. Pierce, Beth Ann. Nontraditional Options Workshop. ERIC ED 339 879.
40. Reilly, Linda B. Study to Examine Math Anxiety for Students Who Are SingleParents and Those Enrolled in Nontraditional Career Preparation ProgramsERIC ED 359 380.
41. Rounds, James B., Jr., and Darwin D. Hendel. Factor Structure of the MathematicsAnxiety Rating Scale ERIC ED 180 771.
42. Smith, Jean Buff. Anxiety Reduction in the Developmental Mathematics Classroom.ERIC ED 174 278.
43. Math Anxiety and the Student of the 80's. ERIC ED 200 296.
44. Teague, P. Terrett, and George G. Austin-Martin. Effects of a Mathematics MethodsCourse on Prospective Elementary School Teachers' Math Attitudes, Math,Anxiety and Teaching. ERIC ED 200 557.
45. Tittle, Carol Kehr, and Elenor Rubin Denker Issues in the Outcome Evaluation of aMath Anxiety Reduction Program for Teacher Education Students ERIC ED202 826.
Books
46. Hackworth, Robert D Math Anxiety Reduction. Clearwater, Fl.: H & H Publishing,1985.
47. Leedy, Paul D. Practical Research Planning and Design. New York: MacMillan,1980.
48. Tobias, Sheila. Succeed with Math. New York: College Board, 1987.

APPENDIX A
MATH ANXIETY BILL OF RIGHTS
I have the right to learn at my own pace and not feel put down or stupid if I'm slower thansomeone else.
I have the right to ask whatever questions I have.
I have the right to need extra help.
I have the right to ask a teacher for help.
I have the right to say I don't understand.
I have the right to feel good about myself regardless of my abilities in math.
I have the right not to base my self-worth on my math skills.
I have the right to view myself as capable of learning math.
I have the right to evaluate my math instructors and how they teach.
I have the right to relax.
I have the right to be treated as a competent adult.
I have the right to dislike math.
I have the right to define success in my own terms.
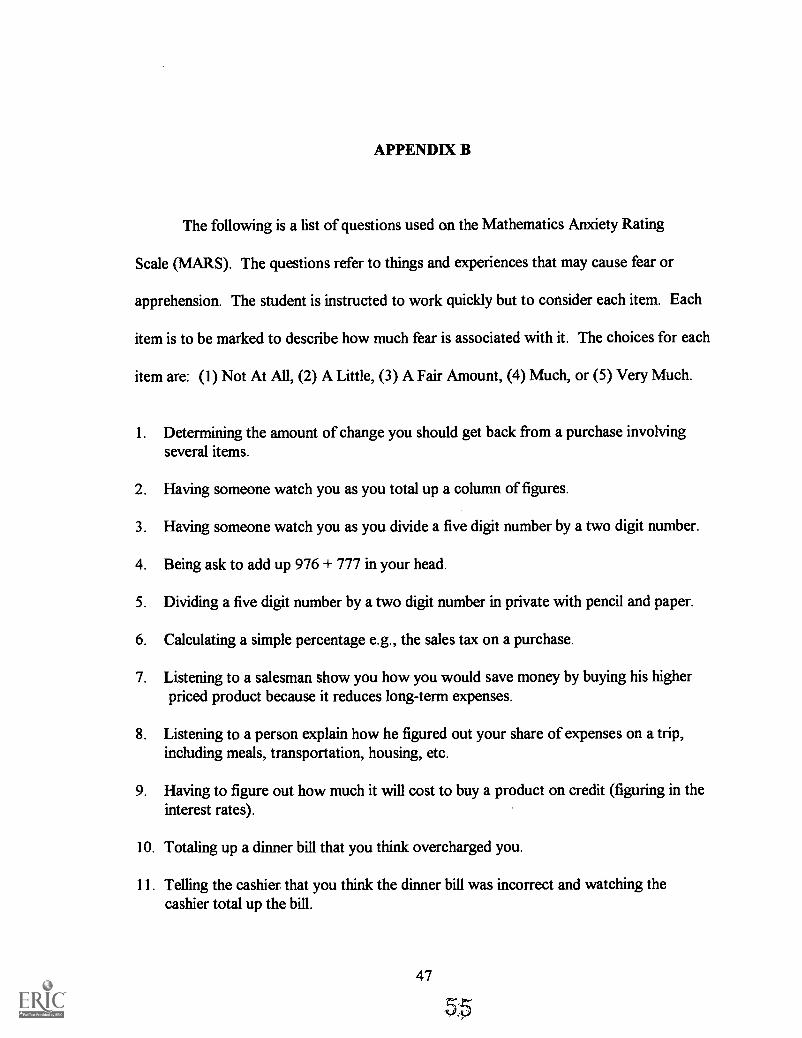
APPENDIX B
The following is a list of questions used on the Mathematics Anxiety Rating
Scale (MARS). The questions refer to things and experiences that may cause fear or
apprehension. The student is instructed to work quickly but to consider each item. Each
item is to be marked to describe how much fear is associated with it. The choices for each
item are: (1) Not At All, (2) A Little, (3) A Fair Amount, (4) Much, or (5) Very Much.
1. Determining the amount of change you should get back from a purchase involvingseveral items.
2. Having someone watch you as you total up a column of figures.
3. Having someone watch you as you divide a five digit number by a two digit number.
4. Being ask to add up 976 + 777 in your head.
5. Dividing a five digit number by a two digit number in private with pencil and paper.
6. Calculating a simple percentage e.g., the sales tax on a purchase.
7. Listening to a salesman show you how you would save money by buying his higherpriced product because it reduces long-term expenses.
8. Listening to a person explain how he figured out your share of expenses on a trip,including meals, transportation, housing, etc.
9. Having to figure out how much it will cost to buy a product on credit (figuring in theinterest rates).
10. Totaling up a dinner bill that you think overcharged you.
11. Telling the cashier that you think the dinner bill was incorrect and watching thecashier total up the bill.

12. Being treasurer of a club.
13. Totaling up the dues received and the expenses of a club you belong to.
14. Adding up 976 + 777 on paper.
15. Doing a word problem in algebra.
16. Solving a problem such as: 11X = 11 and Y = 3 then the results of X/Y is equal to
17. Solving the problem such as 11X = 12 and Y = 4 then the ratio of X to Y is equal to9
18. Determining the grade point average for your last term.
19. Reading an article on the basketball team, showing what percentage of free throwseach player made, the percentage of field goals made, the total number attempted, etc.
20. Reading an historical novel with many dates in it.
21. Counting the number of pages left in a novel you are engrossed in.
22. Guessing at the number of people attending a dance you're at.
23. Buying a math textbook.
24. Watching someone work with a slide rule.
25. Watching a teacher work an algebraic equation.
26. Signing up for a math course.
27. Listening to another student explain a math formula.
28. Walking into a math class.
29. Having to compute the miles/gallon on your car.
30. Watching someone work with a calculator.
31. Looking through the pages of a math text.
32. Working on an income tax form.
48

33. Reading your W-2 form (or other statement showing your annual earning and taxes).
34. Studying for a math test.
35. Starting a new chapter in a math book.
36. Walking on campus and thinking about a math course.
37. Meeting your math teacher while walking on campus.
38. Reading the word "Statistics".
39. Sitting in a math class and waiting for the instructor to arrive.
40. Solving a square root problem.
41. Signing up for a course in statistics.
42. Checking over your monthly bank statement.
43. Taking the math section of a college entrance exam.
44. Having someone explain bank interest rates as you decide on a savings account.
45. Raising your hand in a math class to ask a question.
46. Reading and interpreting graphs or charts.
47. Reading a cash register receipt after you purchase.
48. Figuring the sales tax on a purchase that costs more than $1.00.
49. Having a person illustrate to you the best way to divide your money into a savingsand a checking account.
50. Figuring out which summer job offer is the most lucrative: where one involves alower salary, room and board, and travel, while the other one involves a higher salarybut no other benefits.
51. Reading a formula in chemistry.
52. Hearing a lecture in social science class where the instructor is commenting on somefigures, e.g., the percentage of each socio-economic group who voted Republican.
53. Taking an examination (quiz) in a math course.

54. Taking an examination (final) in a math course.
55. Hearing two of your friends exchanging opinions on the best way to calculate the costof a product.
56. Having someone ask you to recheck his figures in a simple calculation, such asdivision or addition.
57. Being asked by a friend to answer the question: how long will it take to get toDenver if I drive at 30 miles per hour.
58. Studying for a driver's license test and memorizing the figures involved such as thedistances it takes to stop a car going at different speeds.
59. Hearing friends make bets on a game as they quote the odds.
60. Playing cards where numbers are involved, e.g., bridge or poker.
61. Having a friend try to teach you a math procedure and finding that you cannotunderstand what he is telling you.
62. Scheduling my daily routine to allocate set times for classes, for study time, for meals,for recreation, etc.
63. Juggling class times around at registration to determine the best schedule.
64. Deciding which course to take in order to come out with the proper number of credithours for full-time enrollment.
65. Working a concrete, everyday application of mathematics that has meaning to me,e.g., figuring out how much I can spend on recreational purposes after paying otherbills.
66. Working on an abstract mathematical problem, such as: "if X = outstanding bills, andY = total income, calculate how much you have left for recreational expenditures".
67. Being given a set of numerical problems involving addition to solve on paper.
68. Being given a set of subtraction problems to solve.
69. Being given a set of multiplication problems to solve.
70. Being given a set of division problems to solve.

71. Picking up a math textbook to begin working on a homework assignment.
72. Being given a homework assignment of many difficult problems which is due the nextclass meeting.
73. Thinking about an upcoming math test 1 week before.
74. Thinking about an upcoming math test 1 day before.
75. Thinking about an upcoming math test 1 hour before.
76. Thinking about an upcoming math test 5 minutes before.
77. Talking to someone in your class who does well about a problem and not being ableto understand what he is explaining.
78. Waiting to get a math test returned in which you expected to do well.
79. Waiting to get a math test returned in which you expected to do poorly.
80. Walking to math class.
81. Realizing that you have to take a certain number of math classes to fulfill therequirements for graduation.
82. Realizing that you have to take a certain number of math classes to fulfill therequirements in your major.
83. Being called upon to recite in a math class when you are prepared.
84. Not knowing the formula needed to solve a particular problem.
85. Receiving your final math grade in the mail.
86. Opening a math or stat book and seeing a page full of problems.
87. Being responsible for collecting dues for an organization and keeping track of theamount.
88. Getting ready to study for a math test.
89. Listening to a lecture in a math class.
90. Figuring out your monthly budget.
51
59
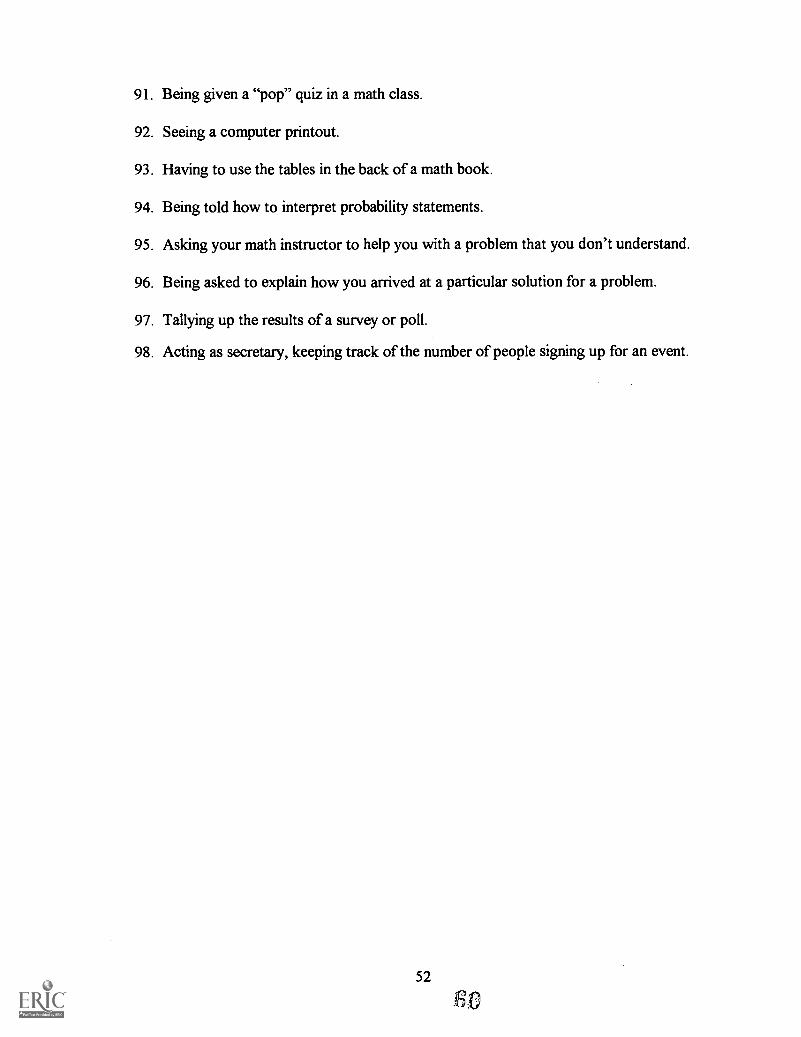
91. Being given a "pop" quiz in a math class.
92. Seeing a computer printout.
93. Having to use the tables in the back of a math book.
94. Being told how to interpret probability statements.
95. Asking your math instructor to help you with a problem that you don't understand.
96. Being asked to explain how you arrived at a particular solution for a problem.
97. Tallying up the results of a survey or poll.
98. Acting as secretary, keeping track of the number of people signing up for an event.
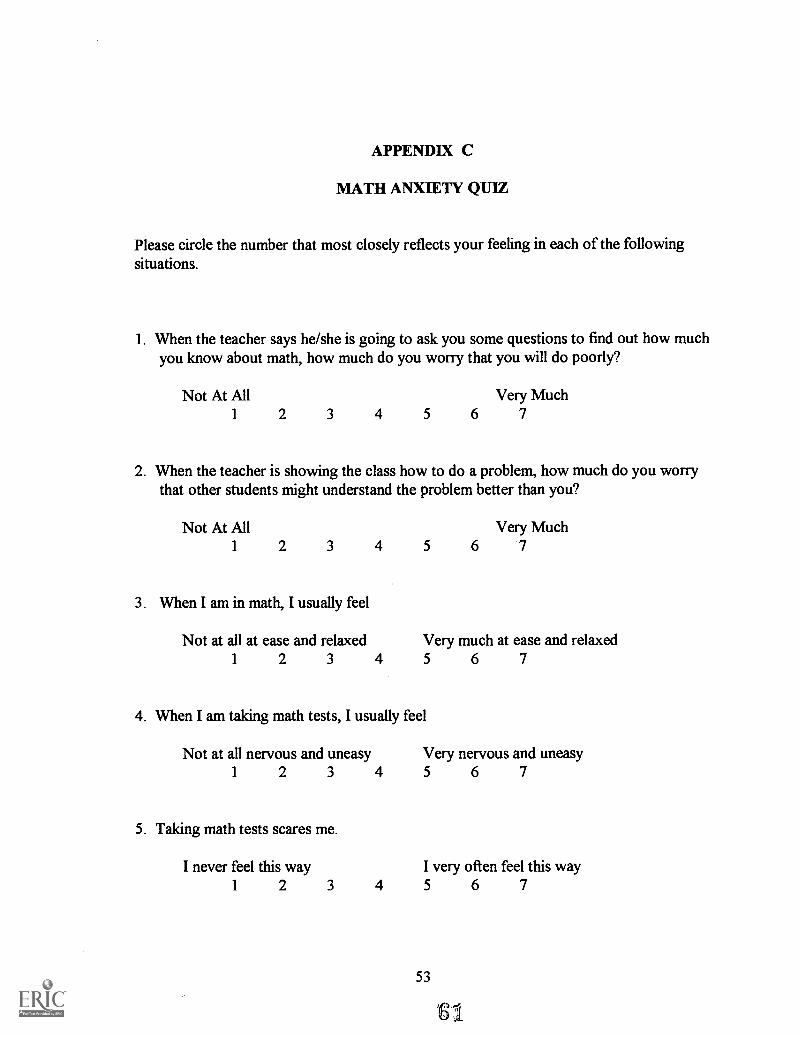
APPENDIX C
MATH ANXIETY QUIZ
Please circle the number that most closely reflects your feeling in each of the followingsituations.
1. When the teacher says he/she is going to ask you some questions to find out how muchyou know about math, how much do you worry that you will do poorly?
Not At All Very Much1 2 3 4 5 6 7
2. When the teacher is showing the class how to do a problem, how much do you worrythat other students might understand the problem better than you?
Not At All Very Much1 2 3 4 5 6 7
3. When I am in math, I usually feel
Not at all at ease and relaxed Very much at ease and relaxed1 2 3 4 5 6 7
4. When I am taking math tests, I usually feel
Not at all nervous and uneasy Very nervous and uneasy1 2 3 4 5 6 7
5. Taking math tests scares me.
I never feel this way I very often feel this way1 2 3 4 5 6 7
53
61
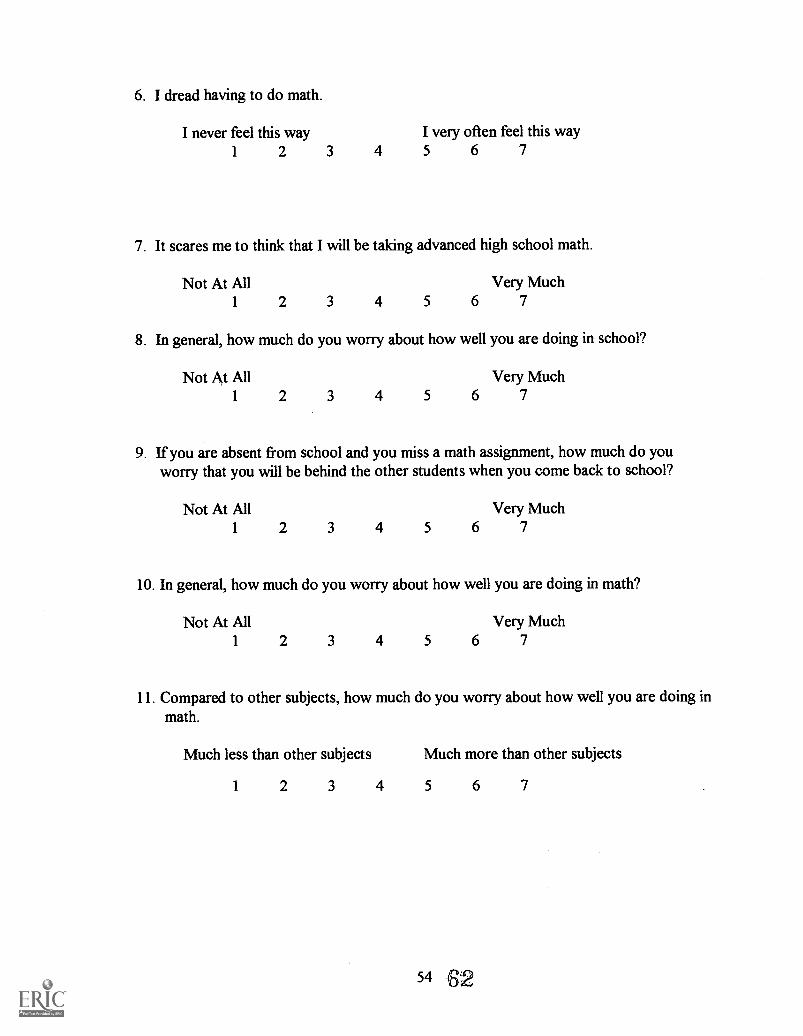
6. I dread having to do math.
I never feel this way I very often feel this way1 2 3 4 5 6 7
7. It scares me to think that I will be taking advanced high school math.
Not At All Very Much1 2 3 4 5 6 7
8. In general, how much do you worry about how well you are doing in school?
Not At All Very Much1 2 3 4 5 6 7
9. If you are absent from school and you miss a math assignment, how much do youworry that you will be behind the other students when you come back to school?
Not At All Very Much1 2 3 4 5 6 7
10. In general, how much do you worry about how well you are doing in math?
Not At All Very Much1 2 3 4 5 6 7
11. Compared to other subjects, how much do you worry about how well you are doing inmath.
Much less than other subjects Much more than other subjects
1 2 3 4 5 6 7
54 62

U.S. Department of EducationOffice of Educational Research and Improvement (OEM
Educational Resources Infonnaflon Center (ERIC)
REPRODUCTION RELEASE(Specific Document)
I. DOCUMENT IDENTIFICATION:
ERIC
Title: The EfTe c its o-f "e ac 1-1 -7e_hr),-..4e 3- a el 7eacher19 744-74 idde s cm/ "9-/--A ze_."--4/ Se zcJn eig y /eve .S'1ucie44$
Author(s): ?Aiy, q kci lz24Corporate Source:
c.C6ile - re ,.k.b 0 s PIG REe-i,s
II. REPRODUCTION RELEASE:M cider to disseminate as widely as possible timely and significant materials of interest to the educational community, documents announced
M the monthly abstract journal of the ERIC system, Resources in Education (RIE), we usually mode wobble to use in microfiche, reprocbcadpaper copy, and electronic/optical mid& and sold through the ERIC Document Reproduction Sanica (EMS) or other ERIC vendors. Credit isgiven to the source of each document, and, if reproduction release Is granted, one of the blotting notices Is Nixed to the document.
H permission Is granted to reproduce and disseminate die identified document, please CHECK ONE of the Mowing two option and sign atthe bottom of the page.
Publication Date:
6-'5- 7
ICheck here
For Level 1 Release:Permitting reproduction inmicrofiche (4' x 6' film) orother ERIC archival media(e.g., electronic or optical)and paper copy.
Signheat-please
The sample sticker shown below wit beaffixed to d Level 1 documents
PERMISSION TO REPRODUCE ANDDISSEMINATE THIS MATERIAL
HAS BEEN GRANTED BY
TO THE EDUCATIONAL RESOURCESINFORMATION CENTER (ERIC)
Level 1
The camplo claw damn below wit bedived to al Level 2 documents
PERMISSION TO REPRODUCE ANDDISSEMINATE THIS
MATERIAL IN OTHER THAN PAPERCOPY HAS BEEN GRANTED BY
TO THE EDUCATIONAL RESOURCESINFORMATION CENTER (ERIC)
Level 2
Documents wit be processed as Indicated provided reproduction quality permits. II permissionto reproduce Is granted, but neither box Is checked, documents wil be processed at Level 1.
ICheck here
For Level 2 Release:Permitting reproduction Inmicrofiche (4' x Om) orother ERIC arthval nude(e.g., electronic or optical),but not In paper copy.
'I hereby granite the Eats:edam, Resources frionnadon Center (ERIC) nonexdUelve permission to reproduce and cassentlnaft
this document as Indicated above. Reproduction from Me ERIC mkrofiche or electrodcloplical mode by poisons otherthanERIC employees and Ns system contractors requires permission from the copytfuld holder. Exception is made for non-pmitreproduction by/brines end °thereon** agencies to sad* idonnetbn needs of *Ammo In response todiscrete ktqukfee.
Si97/,14_, q! e,oic
-Printed Name/PositionfTitle:
-SiMintairress:
3-.),, J. Cet. A se,.Etarc i SI, I tA° 'V c,C
,...) ,.. ck
Telephone: FAX
Tuirmar...: -1).u.
7---/t/q 2--.

284
III. DOCUMENT AVAILABILITY INFORMATION (FROM NON-ERIC SOURCE):
If permission to reproduce Is not granted to ERIC, or, if you wish ERIC to cite the availability of the document from another source,please provide the following Information regarding the availability of the document. (ERIC will not announce a document unless it ispublicly available, and a dependable source can be specified. Contributors should also be aware that ERIC selection criteria atesignificantly more stringent for documents that cannot be made available through EDRS.)
Publisher/Distributor:
Address:
Price:
IV. REFERRAL OF ERIC TO COPYRIGHT/REPRODUCTION RIGHTS HOLDER:
K the right to grant reproduction release is held by someone other than the addressee, please provide the appropriatename and address:
Name:
Address:
V. WHERE TO SEND THIS FORM:
Send this form to the following ERIC Clearinghouse:
However, if solicited by the ERIC Facility, or if making an unsolicited contribution to ERIC, return this form (and the document beingcontributed) to:
ERIC Processing and Reference Facility1100 West Street, 2d Floor
Laurel, Maryland 20707-3598
Telephone: 301-497-4080Toll Free: 800.799-3742
FAX: 301-953-0263e -mail: [email protected]
WWW: http://erictac.plocard.csc.com(Rev. 6/96)