document resume tm 021 653 author streveler, ruth … · 0 minot changes have poen made to improvia...
TRANSCRIPT

DOCUMENT RESUME
ED 371 022 TM 021 653
AUTHOR Streveler, RuthTITLE Using Multidimensional Scaling To Measure Conceptual
Change.PUB DATE Apr 94NOTE 29p.; Paper presented at the Annual Meeting of the
American Educational Research Association (NewOrleans, LA, April 4-8, 1994).
PUB TYPE Reports Research/Technical (143)Speeches/Conference Papers (150)
EDRS PRICE MF01/PCO2 Plus Postage.DESCRIPTORS Academic Achievement; *Cognitive Structures;
Coherence; Educational Psychology; Experience; HigherEducation; Measurement Techniques; *MultidimensionalScaling; Physics; Statistir:al Significance; TeachingMethods; *Undergraduate Students; Womens Studies
IDENTIFIERS *Conceptual Change; Expert Novice Paradigm
ABSTRACTRelations among students' cognitive structures,
instruction, and course achievement were studied for 102undergraduates in three courses. An aim of the study was to integrateexpert-novice research with investigations of cognitive-structurecf.-age. Experienced instructors identified concepts central to the.A._ferent courses. Students were asked to cluster the items early inthe courses and again at the courses' end, and these clusterings werecompared to the groupings arranged by instructors.Multidimensional-scaling analysis was used to measure the cognitivestructures of students in each course. The average difference ofterms in a group from the group centroid, central term, was used as ameasure of coherence. The increase in terms of coherence for onecourse (educational psychology) was close to significart; in anothercourse (physics) the increase was significant, and in a third(women's studies), the increase was not significant. The predictionthat students' cognitive structures become more coherent withinstruction was supported, but the importance of other variablescannot be ignored. The difference in results across the disciplinesis discussed. Eight figures and five tables present study data.(Contains 25 references.) (SLD)
***********************************************************************
Reproductions supplied by IRS are ne best that can be madefrom the original document.
***********************************************************************
U S. DEPARTMENT OF EINICATIONOnce ol Educahonal Research and Improvarnent
EDU ATIONAL RESOURCES INFORMATIONCENTER (ERIC)
This document has Patin reproduced asreceived horn the parson or orgeruzatanoriginahng it
0 Minot changes have Poen made to imprOviareproduction Quality
a Points ol voew or ognions stated amid= u-rnent do not necessardy represent officialOERI position or policy
-PERMISSION TO REPRODUCE THISMATERIAL HAS BEEN GRANTED BY
5146-4ce-g4
TO THE EDUCATIONAL RESOURCESINFORMATION CENTER (ERIC)
USING MULTIDIMENSIONAL SCALiNG TO MEASURE CONCEPTUAL CHANGE
Dr. Ruth Streveler
2
BEST COPY AVAILABLE

Using Multidimensional Scaling to Measure Conceptual ChangeDr. Ruth Strevelerl
Introduction
For over twenty years, researchers in cognitive and
educational psychology have grappled with the problem of
describing how cognitive structures change as an individual
acquires knowledge in a domain. One approach to this question has
compared the cognitive structures of experts and novices in
various domains (McKeithen et al., 1981; Chi & Koeske, 1983; Gobbo
& Chi, 1986; Chi, Hutchinson, & Robin, 1989). A second approach
describes the differences in students' cognitive structures before
and after instruction (Shavelson, 1972; Shavelson, 1974; Shavelson
& Geeslin, 1975; Geeslin & Shavelson, 1975; Shavelson & Stanton,
1975; Champagne et al., 1981; Shavelson, 1985; Naveh-Benjamin, et
al., 1986, 1989). The results from these two approaches should be
complementary and findings of expert-novice studies should predict
how students' cognitive structures will change. An aim of the
present study is to integrate expert-novice research with
investigations of cognitive structure changes in students.
Specifically, this paper will investigate the relationships
between students' cognitive structures, instruction and course
achievement.
MethodsParticipants
Participants in the study were undergraduates at a major
research university who were enrolled in one of three courses:
Educational Psychology (Psychological Foundations), Physics
(College Physics), or Women's Studies (Introduction to Women's
Studies) . These courses were selected because they represented a
range of disciplines, yet were all introductory in nature.
Physics was the largest course by far, with an enrollment of 177
students. By contrast, 23 students were enrolled in Educational
Psychology, and the Women's Studies course had an enrollment of 20
lAuthor's address: Colorado School of Mines, Golden, CO 80401

Using Multidimensional Scaling to Measure Conceptual Change page 2
students. The distribution of course grades was also quite
different for the courses. Very few students received a grade of
C or below in either the Educational Psychology or Women's Studies
courses, however, almost 60% of the students in the Physics course
received a grade of C or below.
Procedure
Prior to start of the semester, three experienced instructors
from three different introductory courses (Physics, Educational
Psychology and Women's Studies) were asked to select 30 terms they
felt were central to their respective courses. Each course was
visited at the beginning and end of the semester. During the
pretest, students were given envelopes containing strips of paper
listing each of the 30 important course terms and were asked to
cluster the thirty terms in any manner they thought appropriate.
About a week later, each instructor was asked to cluster terms and
state why the concept in each group belonged together.
Posttests were administered within the last two weeks of
instruction. Using the same terms from the pretest, students were
asked to cluster terms appropriately. Students were also asked
for permission to use their course grades. Instructors were also
be asked to cluster the terms at the end of the semester. All
three instructors chose to do the final clustering at the same
time the students were clustering terms.
Only data from the students in the courses who completed both
the pretest and posttest were used in this study. Thus the actual
number of participants was 14 Educational Psychology students, 74
Physics students, and 14 Women's Studies students, or a grand
total of 102 student participants.
Data analysis
Multidimensional scaling analysis was used to measure the
cognitive structures of students in each of the three courses
before and after instruction. The overlap of both student pretest
and posttest clusters in each course was determined using the
4

Using Multidimensional Scaling to Measure Conceptual Change page 3
program PEROVER (Dunn-Rankin, 1983). The resultant percent
overlap matrices were then analyzed using the SAS program ALSCAL
(Young & Lewyckyj, 1979) . Levels of stress for 2-dimensional and
3-dimensional solutions were determined for each of the three
classes. It was determined that 3-dimensional solutions were
appropriate.
The multidimensional scaling solutions generated by the
students clusters were next compared to the way in which the
instructor clustered the terms. This comparison waE accomplished
by assigning terms to groups according to the instructors'
clusters and comparing how the students pretest and posttest
groups changed relative to the instructors' groups.
The center or centroid of the set of terms in each of the
instructor's groups was then calculated by determining the average
of the x, y, and z coordinates of terms within that group. The
distance of each term in the group from the group centroid was
determined geometrically using the formula:
Distance of point from centroid =
square root((x1-x2) 2 (y.1172)2+ (z1-z2)2)
where x2, y2, z2 are the coordinates of the centroid of
the group, and xl, yl, zi are the coordinates of the term whose
distance is being determined.
The average distance of each term in a :roup from the group
centroid was determined for all groups. The average distance wias
used as a measire of the coherence of a cluster. The term
coherence refers to the strength of with-in group links versus
between-group links (Chi & Koeske, 1983).
A binomial test was performed to compare the pretest and
posttest distances to see if the posttest groups are significantly
more coherent than the pretest groups. In this sense, the pairs
of pretest and posttest average distances for each of the three
courses are then viewed as being a series of trials (with each
5

Using Multidimensional Scaling to Measure Conceptual Change page 4
cluster being a separate, independent trial) and with the
situation "pretest average distance larger than the posttest
average distance" considered a success and "pretest average
distance smaller than the posttest average distance," a failure.
One assumes that, by chance, the probability of the pretest
average distance being larger than the posttest average distance
is .5.
In order to test the prediction that students with high
course grades would cluster the terms more coherently than
students with low course grades, the grades students received in
the three courses were needed. Instructors agreed to provide both
the overall grade distribution, and the grades of individual
students who had given their permission for their course grade.to
be shared. Only data from students who took both the pretest and
the posttest and who agreed to have their course grade shared
could be used. With those two limitations accounted for, the
actual number of students eligible to participate was eight in
Educational Psychology, sixty-two in physics, and ten in Women's
Studies. Given this situation,the judgment was made only to use
the data from Physics, which was deemed to be the only one of the
three courses with a large enough grade distribution to warrant
analysis.
Subsets of the Physics posttest data were analyzed and
compared. Data for students receiving grades of either A or B
were combined, as were the data for students receiving grades of D
or F. These subsets of data were analyzed using PEROVER (Dunn-
Rankin, 1983) and ALSCAL (Young & Lewyckyj, 1979). The terms were
assigned to groups according to the instructor's groupings.
Results
Since instructors clustered terms at the beginning and end of
the semester, it was necessary to look at both the pretest and
posttest clustering of terms by each instructor to determine which
of the instructor grouping (pretest or posttest) should be used as

Using Multidimensional Scaling to Measure Conceptual Change page 5
a criterion for assigning terms to groups. (For a listing of
instructor groupings see Streveler, 1993) . The number of terms
changed from pretest to posttest by the instructor in each of the
three course was quite varied. The Educational Psychology
instructor made no changes. The Physics instructor changed 7 of
30 terms (or 23.3% of terms) from pretest to posttest while the
Women's Studies instructor changed 13 of 30 terms (43.3%) from
pretest to posttest. Due to the variability in the Physics and
Women's Studies instructors' responses, a judament was made about
which set of instructor clusters (pretest groups or posttest
groups) to use as a criterion for comparison with student
clusters. Because the instructors' posttest clusters were
completed at the end of the semester, it was assumed that the
posttest clusters would be a more valid measure of how the course
terms related at the completion of the course.
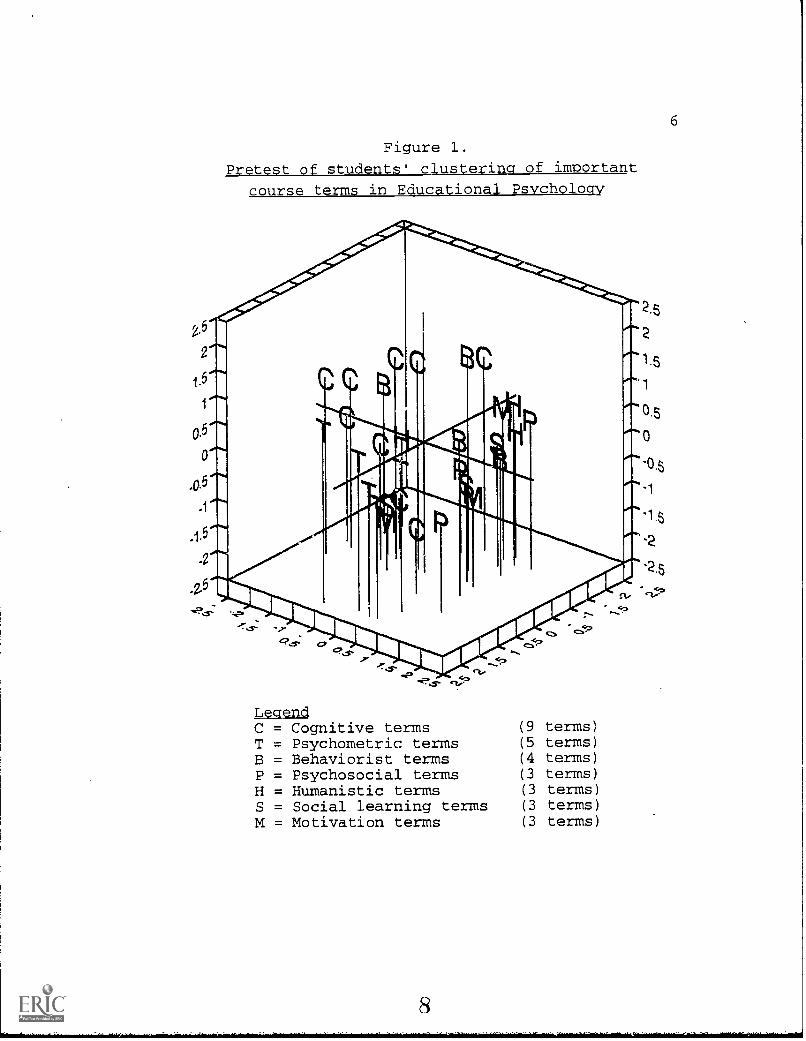
Plots of the pretest and posttest clustering of terms by
students for each course are found in Figures 1 through 6 which
can be used to visually assess the coherence of student clusters
with regards to the instructors' groupings. This can be seen most
dramatically in Figures 1 and 2 where the terms the instructor
categorized as "psychometric terms" become much more closely
clustered from the pretest to the posttest. Since the visual
assessment of plots is much more difficult when a dramatic shift
is not apparent, a quantitative measure of coherence was also
calculated. Coherence of groups was determined by calculating the
average distance of points in a group from the group centroid.
The results are summarized in Tables 1, 2 and 3.
The average distance of terms from the group centroid is
smaller in the posttest than in the pretest for most of the
groups. Because the normality of the measure of coherence could
not be assured, nonparametric tests of significance were judged to
be more appropriate in this case. Thus a binomial test was used
to test the significance of the difference in the average distance
of groups from pretest to posttest.
7
6
Figure 1.
Pretest of students' clusterina of important
course terms in Educational Psychology
LeaendC = Cognitive terms (9 terms)T = Psychometric terms (5 terms)B = Behaviorist terms (4 terms)P = Psychosocial terms (3 terms)H = Humanistic terms (3 terms)S = Social learning terms (3 terms)M = Motivation terms (3 terms)

7
Figure 2.
Posttest of students clusterina of imloortant
course terms in Educational Psychology
LegendC = Cognitive terms (9 terms)T = Psychometric terms (5 terms)B = Behaviorist terms (4 terms)P = Psychosocial terms (3 terms)H = Humanistic terms (3 terms)S = Social learning terms (3 terms)M = Motivation terms (3 terms)
9

8
Figure 3.
Pretest of students' clustering of important
course terms in Physics.
Legenda = Newton's Second Law of Motion (9 terms)1 = Light (3 terms)H = Relates to Momentum (3 terms)F = Energy (3 terms)2 = Second Law of Thermodynamics (5 terms)E = Fluids (3 terms)C = Electromagnetic waves (1 term)A = Angular Momentum (1 term)> = Matter Waves (1 term)A = Ideal Gas Laws (1 term)
i0

Figure 4.
Posttest of students' clustering of importaDt
course terms in Physics.
Legend
a = Newton's Second Law of Motion (9 terms)
1 = Light (3 terms)
H = Relates to Momentum (3 terms)
F = Energy (3 terms)
2 = Second Law of Thermodynamics (5 terms)
E = Fluids (3 terms)
C = Electromagnetic waves (1 term)
A = Angular Momentum (1 term)
> = Matter Waves (1 term)
(1 term)= Ideal Gas Laws
11.
9
10
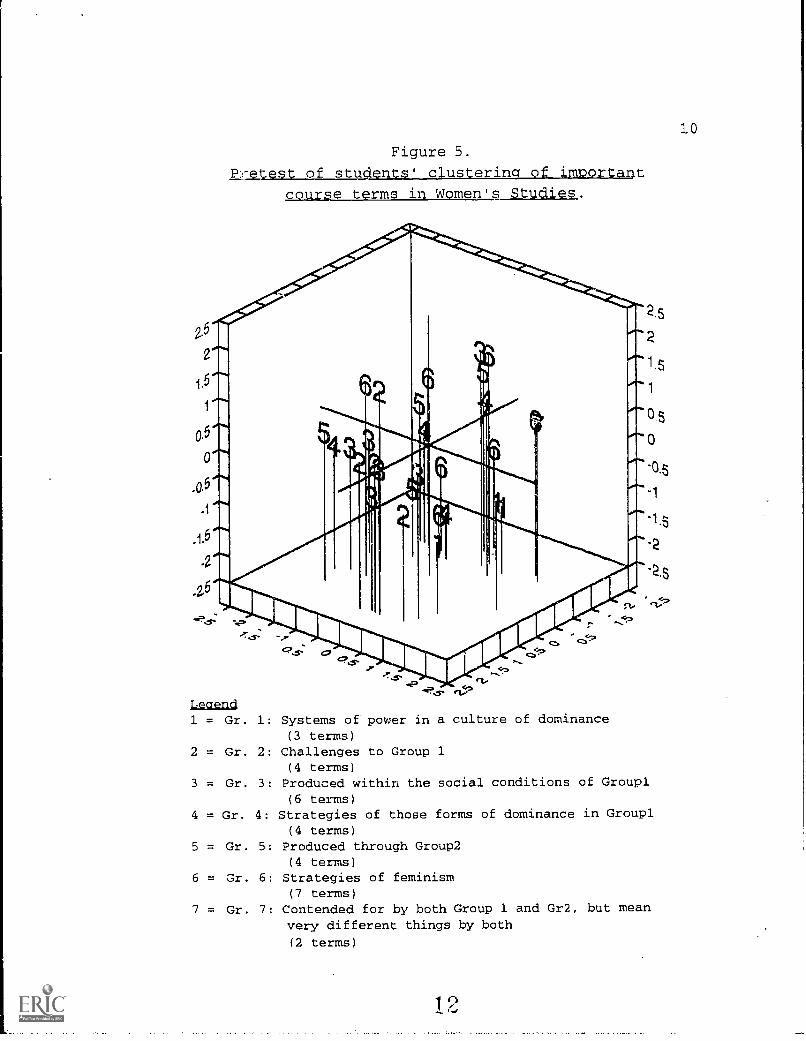
Figure 5.
P-,:ly;.est of students' clusterina of imDortant
course terms in Women's Studies.
Legend1 = Gr. 1: Systems of power in a culture of dominance
(3 terms)2 = Gr. 2: Challenges to Group 1
(4 terms)3 = Gr. 3: Produced within the social conditions of Groupl
(6 terms)4 = Gr. 4: Strategies of those forms of dominance in Groupl
(4 terms)
5 = Gr. 5: Produced through Group2(4 terms)
6 = Gr. 6: Strategies of feminism(7 terms)
7 = Gr. 7: Contended for by both Group 1 and Gr2, but meanvery different things by both
(2 terms)
11
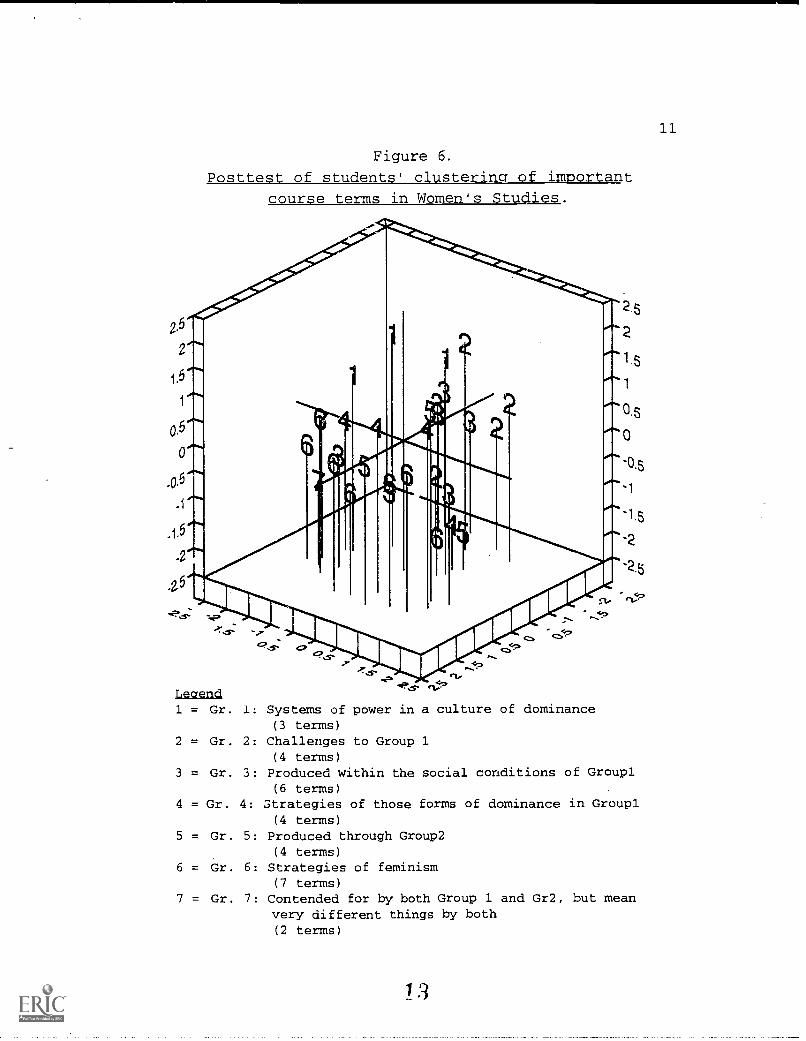
Figure 6.
Posttest of students clustering of important
course terms in Women's Studies.
Leaend1 = Gr. i: Systems of power in a culture of dominance
(3 terms)2 = Gr. 2: Challenges to Group 1
(4 terms)3 = Gr. 3: Produced within the social conditions of Groupl
(6 terms)4 = Gr. 4: Strategies of those forms of dominance in Groupl
(4 terms)5 = Gr. 5: Produced through Group2
(4 terms)
6 = Gr. 6: Strategies of feminism(7 terms)
7 = Gr. 7: Contended for by both Group 1 and Gr2, but meanvery different things by both(2 terms)
3

Using Multidimensional Scaling to Measure Conceptual Change page 12
Table 1Average distances of terrr -,. from the aro= centroid for the Pretest
and posttest in Educational Psvcholoav.
Group 1: Cognitive terms(number of terms in group = 9)
Average distance from centroid of groupPretest 1.387Posttest 1.126
Group 2: Psychometric terms(number of terms in group = 5)
Average distance from centroid of groupPretest 0.586Posttest 0.456
Group 3: Behaviorist terms(number of terms in group = 4)
Average distance from centroid of groupPretest 1.337Posttest 0.936
Group 4: Psychosocial terms(number of terms in group = 3)
Average distance from centroid of groupPretest 1.349Posttest 0.718
Group 5: Humanistic terms(number of terms in group = 3)
Average distance from centroid of groupPretest 1.241Posttest 1.304
Group 6: Social learning terms(number of terms in group = 3)
Average distance from centroid of groupPretest 1.063Posttest 0.676
Group 7: Motivation theory terms(number of terms in group = 3)
Average distance from centroid of groupPretest 1.215Posttest 1.199
Using Multidimensional Scaling to Measure Conceptual Change page 13
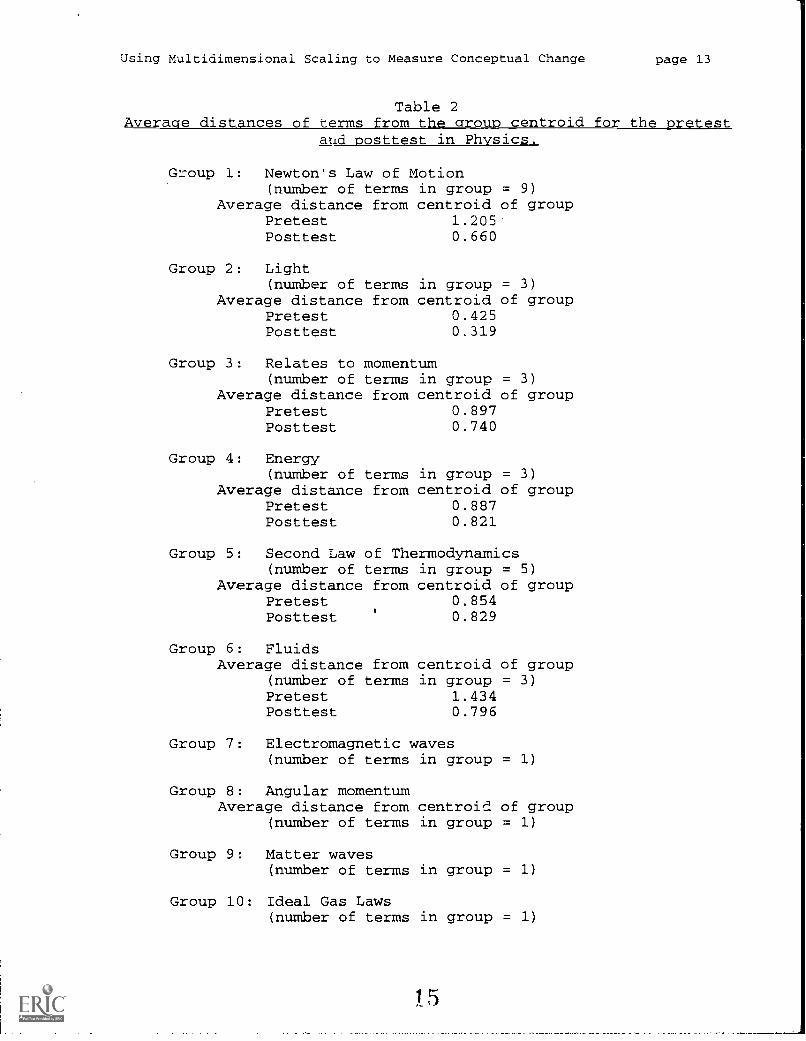
Table 2Average distances of terms from the arcIup centroid for the pretest
arid nosttest in Physics.
Group 1: Newton's Law of Motion(number of terms in group = 9)
Average distance from centroid of groupPretest 1.205Posttest 0.660
Group 2: Light(number of terms in group = 3)
Average distance from centroid of groupPretest 0.425Posttest 0.319
Group 3: Relates to momentum(number of terms in group = 3)
Average distance from centroid of groupPretest 0.897Posttest 0.740
Group 4: Energy(number of terms
Average distance fromPretestPosttest
Group 5: Second Law of Th(number of terms
Average distance fromPretestPosttest
Group 6: FluidsAverage distance from
(number of termsPretestPosttest
in group = 3)centroid of group
0.8870.821
ermodynamicsin group = 5)centroid of group
0.8540.829
centroid of groupin group = 3)
1.4340.796
Group 7: Electromagnetic waves(number of terms in group = 1)
Group 8: Angular momentumAverage distance from centroi,d of group
(number of terms in group = 1)
Group 9: Matter waves(number of terms in group = 1)
Group 10: Ideal Gas Laws(number of terms in group = 1)
15

Using Multidimensional Scaling to Measure Conceptual Change page 14
Table 3Average distances of terms from the group centroid for the pretest
and posttest in Women's Studies.
Group 1: Systems of power in a culture of dominance(number of terms in group = 3)
Average distance from centroid of groupPretest 1.055Posttest 0.927
Group 2: These are challenges to Group 1(number of terml in group = 4)
Average distance froth centroid of groupPretest 0.908Posttest 1.074
Group 3: These are produced within the socialconditions of Group 1
(number of terms in group = 6)Average distance from centroid of group
Pretest 1.450Posttest 1.297
Group 4: These are strategies of those forms ofdominance in Group 1
(number of terms in 'group = 4)Average distance from centroid of group
Pretest 1.389Posttest 1.519
Group 5: These are produced through Group 2(number of terms in group = 4)
Average distance from centroid of groupPretest 1.359Posttest 1.279
Group 6: Strategies of feminism(number of terms in group = 7)
Average distance from centroid of groupPretest 1.476Posttest 1.182
Group 7: The are contended for by both Groups 1and 2, but mean very different things by both.
(number of terms in group = 2)Average distance from centroid of group
Pretest 0.913Posttest 0.547
16

Using Multidimensional Scaling to Measure Conceptual Change page 15
Using the binomial test we can calculate the probability of
the pretest distances being larger than the posttest distance by
chance alone. At the 2 = .05 level of significance, the results
of Physics are considered significant ($ = .016), and the results
of Educational Psychology closely approach significance (B =
.055) . However, the binomial probability for the Women's Studies
course is not significant at the Q = .05 level (B. = .164) . If the
results of all three courses are combined the results are highly
statistically significant
(B = .001).
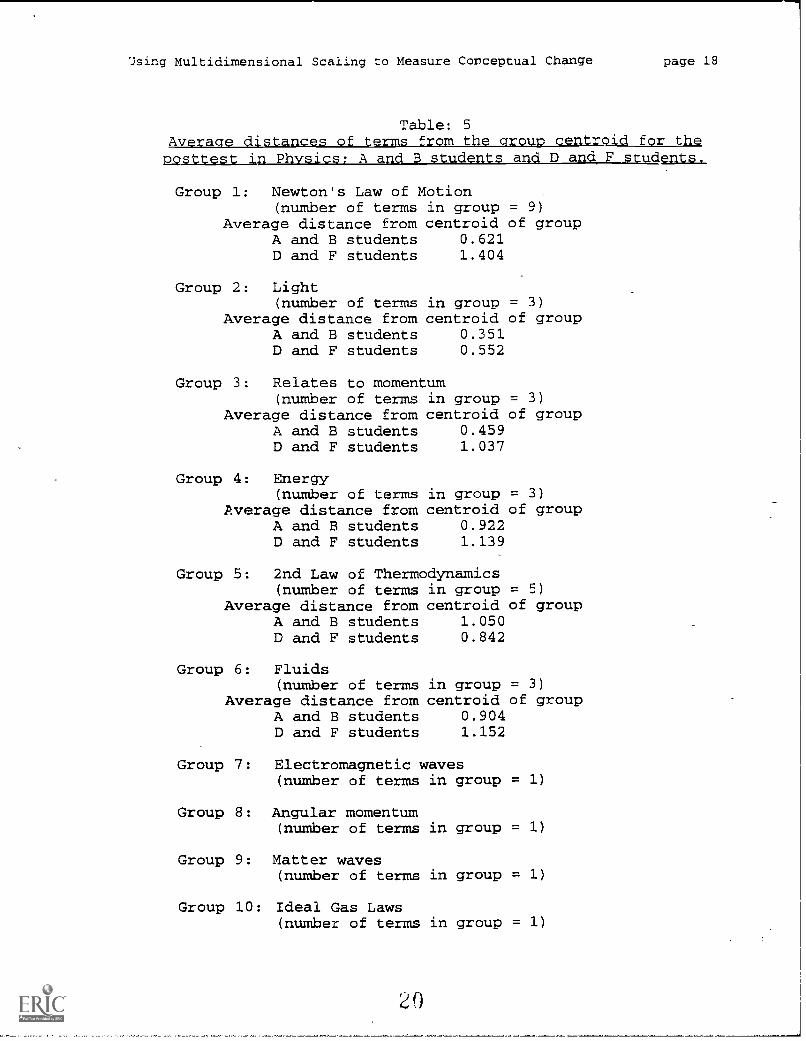
The clustering of a combined group of A and B students and a
combined group of D and F students analyzed using PEROVER and
ALSCAL and are plotted in Figures 7 and 8. The average distance
of terms in each group from the centroid of that group are listed
in Table 5.
One could predict that the better performing students (here
represented by students receiving grades of A and B) would have
more coherent clusters than students who "do not perform well in
the course (represented by students receiving grades of D and F).
The binomial test was again used in this comparison. The results
of the binomial test were in the predicted direction but faildd to
reach statistical significance (D. = .093) . Therefore, the
prediction was not supported.
7

Figure 7.
Posttest of A and B students' clustering of
important course terms in Physics.
Legenda = Newton's Second Law of Motion (9 terms)1 = Light (3 terms)H = Relates to Momentum (3 terms)F = Energy (3 terms)2 = Second Law of Thermodynamics (5 terms)E = Fluids (3 terms)C = Electromagnetic waves (1 term)A = Angular Momentum (1 term)> = Matter Waves (1 term)A = Ideal Gas Laws (1 term)

17
Figure 8.
Posttest of D andjLalaJAgg1/1542 clustering of
imiclortant course terms in Physics.
Legenda = Newton's Second Law of Motion (9 terms)1 = Light (3 terms)H = Relates to Momentum (3 terms)F = Energy (3 terms)2 = Second Law of Thermodynamics (5 terms)E = Fluids (3 terms)C = Electromagnetic waves (1 term)A = Angular Momentum (1 term)> = Matter Waves (1 term)A = Ideal Gas Laws (1 term)
1.9
Using Multidimensional Scaling to Measure Conceptual Change page 18
Table: 5
Average distances of terms from the aro= centroid for theposttest in Physics; A and B students and D and F students.
Group 1: Newton's Law of Motion(number of terms in group = 9)
Average distance from centroid of groupA and B students 0.621D and F students 1.404
Group 2: Light(number of terms in group = 3)
Average distance from centroid of groupA and B students 0.351D and F students 0.552
Group 3: Relates to momentum(number of terms in group = 3)
Average distance from centroid of groupA and B students 0.459D and F students 1.037
Group 4: Energy(number of terms in group = 3)
Average distance from centroid of groupA and B students 0.922D and F students 1.139
Group 5: 2nd Law of Thermodynamics(number of terms in group = 5)
Average distance from centroid of groupA and B students 1.050D and F students 0.842
Group
Group
6: Fluids(number of terms in group = 3)
Average distance from centroid of groupA and B students 0.904D and F students 1.152
7: Electromagnetic waves(number of terms in group = 1)
Group 8: Angular momentum(number of terms in group = 1)
Group 9: Matter waves(number of terms in group = 1)
Group 10: Ideal Gas Laws(number of terms in group = 1)

Using Multidimensional Scaling to Measure Conceptual Change page 19
Discussion
Students' cognitive structures and instruction
If students move closer to being experts after instruction,
then one could expect that the cognitive structures of student:
will be more like the cognitive structures of experts after
instruction. If cognitive structures of experts are more coherent
than the cognitive structures of novices, then one could predict
that the inferred cognitive structures of students after
instruction are more coherent than those inferred before
instruction.
The average distance of terms in a group from the group
centroid was used as a measure of coherence. Using the binomial
probability with a g =.05 level of significance, the increase in
coherence of terms in the Educational Psychology course was very
close to significance, the increase in coherence of terms in the
Physics course was significant, and in the Women's Studies course
results, the the increase in coherence of terms would not be
considered significant.
What accounts for these differences between courses? One
explanation might lay in the structure of the three different
disciplines represented. There is some evidence that the content
of some disciplines is more hierarchically structured than the
content of other disciplines. For example, Donald (1982, 1983,
1986) found that some sciences, like physics, were much more
hierarchically structured than some humanities, for example,
history. Looking at the three domains represented by the courses
in this study, one could argue that Physics is the most
"structured," and Women's Studies the least structured. A
comparison of the individual instructor's variability in
clustering is somewhat compatible with this idea. One would
exnect least variability in the Physics instructor's pre- and
posttest clusterings and the most variability in the Women's
Studies instructor's clusterings. The Women's Studies instructor
21

Using Multidimensional Scaling to Measure Conceptual Change page 20
(with 43% of terms changed) was the most variable, however, the
Educational Psychology instructor (with no terms changed) was the
least variable. It is reasonable to expect that personality
differences also may come into play here and may have accounted
for this result. It should also be noted that the Educational
Psychology instructor was familiar with the clustering method and
therefore may have been more mindful of which terms were placed
into clusters than the other two instructors, who had never used
the technique.
In explaining the results obtained in this study it is also
useful to look more closely at the groups where the posttest
average distance was NOT smaller than the pretest average
distance. (See Streveler, 1993 for specifics.)
In summary, although the prediction that students' cognitive
structures become more coherent after instruction is supported,
other influences such as structural relatedness of terms, student
familiarity with terms, and the variability of the instructors'
cognitive structure may also play a part in determining students'
cognitive structures.
Students' cognitive structures and course achievement
Do students who receive high course grades have more coherent
cognitive structures than students who receive low course grades?
There is prior evidence that students with higher course grades
have cognitive structures closer to that of the instructor than
students with lower course grades (Naveh-Benjamin et al., 1986,
1989).
In Physics, five of six groups of terms did have a smaller
posttest average distance by students who received grades of A or
B, compared with students who received grades of D or F. The
binomial test of these results (E = .094) does not support the
prediction that students with higher final course grades have a
more coherent cognitive structure than students who receive low
22

Using Multidimensional Scaling to Measure Conceptual Change page 21
final course grades. However, because of the low number of
groups, only a result where all six of the groups of terms have a
smaller average distance would be significant according to the
binomial test.
It should also be noted that a subset of students were used
in this study. Thirty-one of a total of sixty-one (or about
50.8%) of students receiving a final course grade of A or B in
Physics were included in this portion of the study, while only
sixteen of seventy-eight (or 20.5%) of student receiving an grade
of D or F were included. Clearly the students with lower grades
are underrepresented in the sample, primarily due to the fact that
many more students who received low final grades were not present
at the posttest compared with those students receiving high
grades. Students who received a low course grade and who stopped
coming to class might be expected to be even more different from A
or B students than the D and F students who diligently kept trying
to do the course work.
Even with these caveats in mind, it is interesting to note
that in only one group was the average distance'of terms from the
group centroid smaller for D and F students, than for A and B
students. This group was labeled "Second Law of Thermodynamics"
by the instructor, and consisted of five terms, two of which were
clustered differently by the Physics instructor in the pretest and
posttest. In no other group of Physics terms was the instructor
variability this high. If, as Nevah-Benjamin et al. (1986, 1989)
suggest, student with higher grades have cognitive structures that
are more similar to the instructor than lower achieving students,
then it is possible that the ambiguity in the instructors'
structure is reflected in the higher achieving students' cognitive
structures. This may have contributed to a more diffuse
clustering of this one group of terms.
In summary, although the within group coherence of groups was
not statistically significantly different at the a = .05 level,
23
Using Multidimensional Scaling to Measure Conceptual Change page 22
the results are encouraging enough to invite further study of
student cognitive structure and course achievement with a larger
sample.
Discussion of results across disciplines
It is interesting to note that the results obtained from the
Women's Studies students were consistently set apart from the
results for Educational Psychology and Physics students. The
Women's Studies students' cognitive structures were in least
agreement with the cognitive structure of their instructor and the
Women's Studies instructor exhibited the most variability of
clustering of terms from pretest to posttest.
Why should the Women's Studies course be so consistently
different from the other courses? An attempt to explain these
differences was made earlier, based on the idea of ill-structured
and well-structured domains. However, a discussion with the
Women's Studies instructor about the aim of her course revealed a
possible explanation which goes beyond the idea of a domain being
ill-structured. The Women's Studies instructor's goal is to
assist her students in becoming unsettled in their thinking and
deconstructing certain ingrained concepts. In this kind of
course, relationships are deliberately broken down by the
instructor in the educational process. The instructor is
deconstructing a students' cognitive structures rather than trying
to impose a organized existing structure. A similar approach
might be likely in disciplines like philosophy (Phenix, 1964).
Thus it is possible that not all disciplines strive to be
solidly structured and hierarchically organized. Some disciplines
may have as a goal to break down students' cognitive structures,
so that they can be rebuilt without the restrictions of old
prejudices and perceptions.
It is intriguing to speculate that the results of this study
may have been documenting the deconstruction of students cognitive
24

Using Multidimensional Scaling to Measure Conceptual Change page 23
structures. If this is the case, then the assumption that
students in a domain are more similar to experts in that domain
after instruction than they are prior to instruction may not hold
in all cases. It is possible that in some domains the intent of
instruction is to disrupt current student thinking about some
topics. Here, the instructor may wish students to vary their
thinking from those of experts. The method of studying students'
cognitive structures outlined in this study may be able to
document cases when students' thinking (i. e., inferred cognitive
structures) become more similar to the instructor's as well as
when, hopefully by the intent of the instructor, they become less
similar.
Implications for Education
Using the method outlined in this study, a plot of how
students view the relationship between important course terms can
be generated and presented to a course instructor. The instructor
can view the plot to determine how closely the students'
perceptions of relationships between terms matches the
instructor's own perception. If students' groups are not
consistent with the instructor's groupings, this may be a sign
that the students are confused about the relationships involved.
The instructor could then adjust the curriculum to reiterate these
topics, perhaps stressing relationships that exist between
concepts.
Close analysis of the plot of terms could also help the
instructor pinpoint student misconceptions. For example,
Streveler and Bail (1992) found that students in a graduate
Educational Psychology course persistently grouped the term
"vicarious reinforcement" with other terms containing the word
"reinforcement" such as "positive reinforcer," "negative
reinforcer," and "intermittent reinforcement".
The student placement of "vicarious reinforcement" differed
from the instructor's clustering of the term. The instructor
?5

Using Multidimensional Scaling to Measure Conceptual Change page 24
grouped "vicarious reinforcement" with other terms related to
observational learning the ry, while "negative reinforcer,"
"positive reinforcer," and "intermittent reinforcement" were
arouped by the instructor with terms relating to behaviorism.
Thus the students' persistent placement, even at the end of the
semester, of the term "vicarious reinforcement" with behaviorism-
related terms could be seen as a misconception on the part of the
students. Students might, for example, believe that because
"vicarious reinforcement" is so structurally similar to other
behaviorism terms that it, too, refers to behaviorism. It should
be noted that students were able to place other semantically
related terms into groups on the basis of meaning. This supports
the idea that "vicarious reinforcement" might be viewed as a
student misconception.
The use of multidimensional scaling plots to help pinpoint
student misconcepticms parallels the use of concept maps to
distinguish student misconceptions (Barenholz & Tamir, 1987;
Feldstine, 1987; Hoz et al., 1987). While concept maps have the
advantage of not needing to be analyzed by the somewhat esoteric
method of multidimensional scaling, the method outlined in this
paPer can be readily used to analyze the data from a group of
students. Multidimensional scaling analysis also lends itself to
quantitative measurement, whereas the measurement of individual
student concept maps is idiosyncratic and problematic (Lay-Dopyera
& Beyerbach, 1983; Stuart, 1985).
28

Using Multidimensional Scaling to Measure Conceptual Change page 25
References
Barenholz, H. & Tamir, P. (1987). The design, implementation andevaluation of a microbiology course with specific referenceto misconception and concept maps. Proceedings of the secondinternational seminar: Misconceptions and educationalstrategies in science and mathematics, 1, 32-44. Itaca, NY:Cornell University.
Champagne, A. B., Klopfer, L. E., DeSena, A. T., & Squires, D. A.(1981) . Structural representations of students' knowledgebefore and after science instruction. Journal of Research inScience Teaching, 18, 97-111.
Chi, M. T. H., Hutchinson, J. E. & Robin, A. F. (1989). Howinferences about novel domain-related concepts can beconstrained by structured knowledge. Merrill-PalmerQuarterly, 35, 27-62.
Chi, M. T. H., & Koeske, R. D. (1983). Network representation ofa child's dinosaur knowledge. Developmental Psychology, 29,29-39.
Donald, J. G. (1982, March). The development of knowledgestructures. Paper presented at the annual meeting of theAmerican Educational Research Association, New York.
Donald, J. G. (1983) . Knowledge structures: Methods forexploring content. Journal of Higher Education, 54, 31-41.
Donald, J. G. (1986). Knowledge and the universitycurriculum. Higher Education, 15, 267-282.
Dunn-Rankin, P. (1983). Scaling methods. Hillsdale, NJ:Erlbaum.
Feldsine, J. (1987). Distinguishing student misconceptions fromalternate conceptual frameworks through the construction ofconcept maps. Proceedings of the second internationalseminar: Misconceptions and educational strategies in scienceand mathematics, /, 176-180. Itaca, NY: Cornell University.
Geeslin, W. E., & Shavelson, R. J. (1975). Comparison of contentstructure and cognitive structure in high school students'learning of probability. journal for Research in MathematicsEducation, March, 109-120.
Gobbo, C., & Chi, M. T. H. (1986) . How knowledge is structuredand used by expert and novice children. CognitiveDevelopment, /, 221-237.

Using Multidimensional Scaling to Measure Conceptual Change page 26
Hoz, R., Tomer, Y., Bowman, D., & Chayoth, R. (1987) . The use ofconcept maps to diagnose misconceptions in biology and earthsciences. Proceedings of the second international seminar:Misconceptions and educational strategies in science andmathematics, /, 244-256. Itaca, NY: Cornell University.
Lay-Dopyera, M. & Beyerbach, B. (1983, April). Concept mappingfor individual assessment. Paper presented at the annualmeeting of the American Educational Research Association,Montreal, Canada.
McKeithen, K. B., Reitman, J. S., Rueter, H. H., & Hirt le, S. C.(1981) . Knowledge organization and skill differences incomputer programmers. Cognitive Psychology, 13, 307-325.
Nevah-Benjamin, M., McKeachie, W. J., Lin, Y. G., & Tucker, D. G.(1986) . Inferring students' cognitive structures and theirdevelopment using the "ordered tree technique". Jburnal ofEducational Psychology, 78, 130-140.
Nevah-Benjamin, M., McKeachie, W. J., & Lin, Y. G. (1989). Useof the ordered-tree technique to assess students' initialknowledge and conceptual learning. Teaching of Psychology,16, 182-187.
Phenix, P. H. (1964). Realms of meaning. New York: McGraw-Hill.
Shavelson, R. J. (1972). Some aspects of the correspondencebetween content structure and cognitive structure in physicsinstruction. Journal of Educational Psychology, 63, 225-234.
Shavelson, R. J. (1974). Methods for examining representationsof a subject-matter structure in a student's memory. Journalof Research in Science Teaching, 11, 231-249.
Shavelson, R. J. (1985, April). The measurement of cognitivestrLoture. Paper presented at the annual meeting of theAmerican Educational Research Association, Chicago.
Shavelson, R. J. & Geeslin, W. E. (1975). A method for examiningthe subject-matter structure in instructional materials.Journal of Structural Learning, 4, 199-218.
Shavelson, R. J. & Stanton, G. C. (1975). Construct validation:Methodology and application to three measures of cognitivestructure. Journal of Educational Measurement, 12, 67-85.
Streveler, R. A. (1993). The development of students' cognitivestructures in three disciplines. Unpublished doctoraldissertation, University of Hawaii at Manoa, HI.
Using Multidimensional Scaling to Measure Conceptual Change page 27
Streveler, R. A. & Bail,'F. T. (1992) . Free clustering of termsin an educational psychology course: A comparison of pre-testand post-test clusters. Proceedings of the 14th AnnualConference of the Hawaii Educational Research Association,Winter 1992, 47-52.
Stuart, H. (1985) . Should concept maps be numerically scored?European Journal of Science Education, 7, 73-81.
Young, F. W., & Lewyckyj, R. (1979). The ALSCAL Procedure. SASTechnical Report S-113. Raleigh, NC: SAS Institute.