document. resume li.-003 818 - ed
TRANSCRIPT
DOCUMENT. RESUME
ED 066 183. LI.-003 818
AUTHOR Vaughn, William J.; Dunn,TITLE The Multidimensional Nature of Job Satisfaction in
On-Going Uyganizations.SPONS AGENCY North Texas State Univ., Denton..PUB DATE 72VOTE 31p.;(0 References); This is the third of a series of
articles reporting results of the North TexasUniversity Research Studies in Job Satisfaction
EDRS PRICE 14F-$0.65 HC -$3.29DESCRIPTORS Employee Attitudes; *Hypothesis Testing; Industrial
Relations; *Job Satisfaction; Librarians; Libraries;Management; *Measurement Techniques; Mlesearch;*University Libraries; Work Envirunment
IDENTIFIERS JDI; Job Descriptive Index; *Null Hypothesis; OnGoing Organizations
ABSTRACTScientific investigation begins with the null
hypothesis which states that there is no relationship between sets ofphenomena or sets of variables..This hypothesis is based on thephilosophical and physical principle that there is a tendency towarddisorder in the universe. This is also commonly referred to as thelaw of entropy. In order to impose system and amier upon the chaoticsequences of events in the managerial universe, methods of analysismust be discovered which accept the null hypothesis but alsorecognize the concomitant existence of the alternate hypothesis whichstates that there is a relationship between sets of phenomena. In thespring of 1972, job satisfaction in a large modern library wassurveyeU. The purpose of the study was to discover, utether regularpetterns of dispersion did exist in the library. The validity of thenmll hypothesis was assumed but the alternate hypotnesis was notexcluded. It was found that certain relationships did exist andstatistical implications of the data appeared to nullify the broadpremises of the null hypothesis. (Related studies are: LI003816,003817 and LI003819 through 003821). (Author/NH)
U.S. DEPARTMENT OF HEALTH.EDUCATION IN WELFAREOFFICE OF EDUCATION
THIS DOCUMENT HAS REEN REPRO-OUCED EXACTLY AS RECEIVEO FROMTHE PERSON OR ORGANIZATION ORIG-INATING IT. POINTS OF VIEW OR OPIN
'IONS STATEO 00 NOT NECESSARILYREPRESENT OFFICIAL OFFICE OF EOUCATION POSITION OR POLICY.
. no, ',"^.1*^It
"PERMISSION TO RBPRODUCE THIS COPY-RIGHTED MATERIAL HAS BEEN GRANTED
BY W Y (I/CIIAL4hII
TvTO ERIC AND ORGANIZATIONS OPERATINGUNDER AGREEMENTS WITH THE U.S. OFFICEOF EDUCATION. FURTHER REPRODUCTIONOUTSIDE THE ERIC SYSTEM REQUIRES PER-MISSION OF THE COPYRIGHT OWNER."
THE MULTIDIMENSIONAL NATURE OF JOB SATISFACTIONIN ON-GOING ORGANIZATIONS
by
William J. Vaughn, BSME, MBA, JD, Ph.D.
and
J. D. Dunn, BA, MBA, Ph.D.
Copyrighted 1972
North Texas State University
Denton, Texas 76201
THE MULTIDIMENSIONAL NATURE OF JOB SATISFACTIONIN ON-GOING ORGANIZATIONS*
Introduction
Much has been written in recent years about the nature of the
relationships obtaining among basic phenomena of organizations. In-
vestigations have been designed which had as their immediate objective
the elucidation of management problems having to do with job satis-
faction and job performance. It was hypothesized that these two basic
work variables were connected in same (unexplained) fashion.
Scientific investigation begins with the null hypothesis. This
basic starting point for all scientific investigation states that there
is no relationship between sets of phenomena or sets of variables. That
is,given phenomenon A and phenomenon B, there is no relationship between
them. The task of the investigator is to disprove the null hypothesis,
i.e., to demonstrate that real relationships do, in fact, exist between
variables. The null hypothesis is based on the philosophical and physi-
cal principle that there is a tendency toward disorder in the universe.
This is also commonly referred to as the law of entropy.
Certain basic principles of interpretation are implied in the law
of entropy. The null hypothesis is always 29.5212U1 until proved false;
it is never proVen true. Thus the null hypothesis involves heuristic
rather than ostensive assumptions about: 1) the identity of phenomena;
2) the relationships characterizing the phenomena. The satisfaction-
*This is the third of a series of articles reporting results of theNorth Texas State University Research Studies in Job Satisfaction. Thisresearch is financed by a North Texas State University Faculty ResearchGrant made to Dr. D. Dunn.

2
performance relationship stated in terms of the null hypothesis is:
There is no relatiohship between phenomenon A (satisfaction) and phe-
nomenon B (performance). Those who believe otherwise must disprove the
null hypothesis, something that has never been done satisfactorily.
Management theorists have used the null hypothesis defensively in the
past, i.e., they have demanded positive proof that a relationship
does exist between satisfaction and performance if anyone outside their
closed circle had the temerity to assert the existence of such a posi-
tive connection.
Demonstration of Relationshi s
How can relationships be demonstrated? This simple query has
haunted investigators for centuries. Although there is no one best
answer to this question, the entrenChment of the null hypothesis in the
thinking of scientific circles demands of the incumbent of the investi-
gator role a careful consideration of alternative answers to the question.
If phenamena other than satisfaction-performcmce are to be considered,
what can be said, in general, about relationships already existing or
in the process of developing among them? There are many variables at
work in the organizational setting. To the casual'iooker orPthe null
hypothesis sometimes appears to be the only possible explanation for
characterizing the multiplicity of factors which seem to be randomly
dstributed over the management landscape. In order to impose system
and order upon the chaotic sequences of events in the managerial universe
we must somehow discover or invent methods of analysis which accept the
truth of the null hypothesis but recognize, at the same time, the con-
comitant existence of the alternate hypothesis. This latter hypothesis
3
3
is the opposite of the null hypothesis. It states that there does'
indeed exist a relationship between phenomenon A and phenomenon B.
To demonstrate the existence of this relationship is redargution of the
null argument.
There is one precaution that should be observed whenever an ex-
planation is sought of complex interlinkages of managerial variables:
multiplicanda necessitatem, which can be roughly
translated as, "assumptions required for purposes of explanation or
argument are to be reduced to the absolute minimum." This principle
of logic is also known as Occam's Razor or the law of parsimony. In
terms of demonstrating the existence of relationships economy should
be observed in hypothesizing more entities than are absolutely required
to account for any observed regularity in sequence of events. In layman's
language the simpler of two explanations is always preferable. The root
essence of this belief is the notion that consistency, in the scientific
sense, can be discovered through the exposure of relationships which
refute the null hypothesis.
In the spring of 1972 the authors surveyed job satisfaction in a
large, (N=67) modern library located in the Southwest. The purpose
of the study was to discover whether regular patterns of dispersion did
exist in the library. Initially the investigation assumed the validity
of the null hypothesis, i.e., that no relationships existed among the
six satisfaction variables and the fifty-five control variables. Of
course this initial assumption mirrored the belief of the principal
investigators that the applicability of the alternate hypothesis could
4
4
not be altogether L.. Auded. In the.sequela this belief was amply
justified. Certain-relationships did exist. Statisti,:al implications
of the data did appear to nullify the broad premises of the null hypothe-
sis.
The'Method
The investigation of job satisfaction was carried on in a univer-
sity library which will be designated "Library A" in order to preserve
anonymity. This is deemed necessary since further analyses of the li-
brary data are currently in process.
Job satisfaction questionnaires were mailed directly to all the
full-time employees (N=107) of Library A. The number of respondents
was considered high enough (N=67) to justify analysis of the data for
puyposes of testing the null hypothesis. In the next section the nature
and ltnitations of the job satisfaction questionnaire will be discussed.
The employees of the library were informed that anonymity would
be assured. Since confidentiality of data was a major concern of both
the managerial and non-managerial personnel of Library A it was necessary
to conduct a series of indoctrination seminars during which the overall
objectives and goals of the satisfaction survey were explained and
questions answered. The employees, in particular, were concerned that
the research data would be seen by management of Library A. The princi-
pal investigators of this study took steps to assure all participants
in the study that anonymity of data would'prevail throughout all stages
of the survey, including preliminary preparation of the study design
and subsequent processing of the returned job satisfaction questionnaires.
One step taken by.the investigators, rather unusual but deemed essential
5

;1
5
because of the high anxiety level of Library A employees, was to show
basic computer worksheets to the employees which illustrated, in real-
istic and direct fashion, the coding methods used to ensure anonymity of
participants. The investigators feel that this extra effort was well
worth the trouble since subsequent interviews verified the wisdom of
this procedure.*
The Job Satisfaction Instrument
The instrument used to survey job satisfaction in Library A was
the Job Descriptive Index (JDI) developed by Patricia Cain Smith and
colleagues at Cornell University during the decqde of the sixties.
The study by Smith, et al, is known as The Cornell Studies of Satis-
faction. The book published in 1969, Patricia Cain Smith, Lorne M.
Ker.dall, Charles L. Ilu lin, The Measurement of Satisfaction in Work and
Retirement: A Strategy for the Study of Attitudes, Chicago: Rand
McNally & Company, gives a full account of the activities of the'Smith
group which commenced in 1959.
The JDI is an eminently usable and practical instrument for measur-
ing satisfaction. It is an instrument that can be used with TAdely
varying groups of individuals working under quite different kinds of
employment situations. The Job Descriptive Index is a tangible, tested
instrument that can be taken into the field and applied in any organiza-
tion tomorrow.
In addition stratified norms are available. For comparison purposes
it is essential to have normative data available which configures the data
11M111
*The procedure used in measuring job satisfaction in Library Awas repeated, in essentials in five other libraries of the Interuni-versity Council consortium. For purposes of anonymity these librarieswill be referred to as B, C, D, E, and F.
6
along various demographic dimensions. For it is true that the norms
for female employees, for example, differ from those for male erployees.
And other normative differences appear based on income, age, level of
education, which are based upon a common framework of reference but whose
only common link appear to be their co-existence as specific attitudes
in a given work setting.
DemonaSzatiz_a_Relationshits_Throu h the Use of Density Functions
The Job Descriptive Index (JDI) gives the investigator of job satis-
faction in a specific work setting a powerful tool for analyzing psy-
chological states-of-mind of workers. By focusing the attention of
employees upon differentiable aspects of the work environment it is
possible to piece together the fragmented notions of a great many eat
ployees into an overall mosaic or pattern which submerges individual
psychological impressions into a unified group consensus of opinion.
It is this common (group) consensus of employee attitudes that
defines the organizational climate of opinion. Is it important that
management know this climate? It is the purpose, in the remainder of
this paper, of the investigators to demonstrate that the answer to this
question is an emphatic aff:rmative.
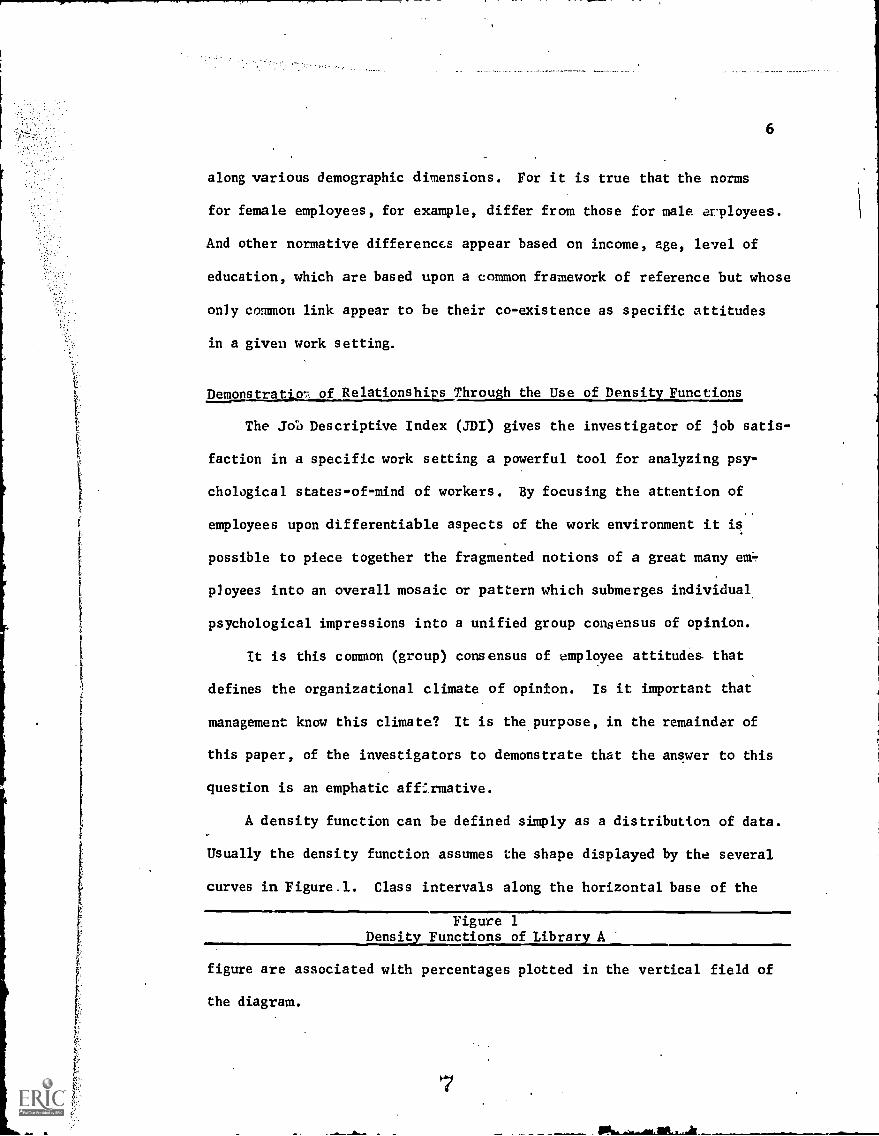
A density function can be defined simply as a distribution of data.
Usually the density function assumes the shape displayed by the several
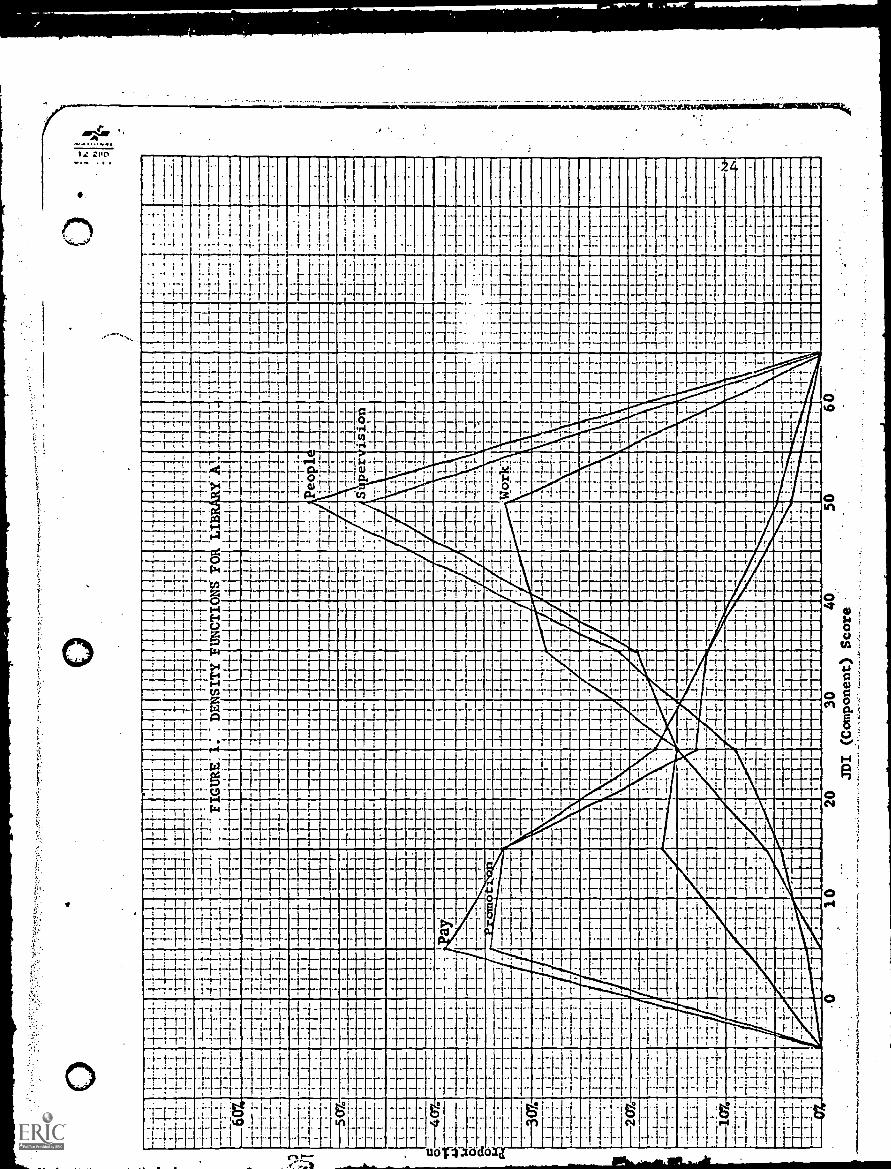
curves in Figure.l. Class intervals along the horizontal base of the
Figure 1Dens itjr Functions of Library A
figure are associated with percentages plotted in the vertical field of
the diagram.
7
The significance of a density function is that it captures the essence
of data in capsule fshion. The science of statistics has as its capstone
the principle known as the law of limited variety. Stated briefly, and
ignoring complications due to such encapsulation; the law of limited variety
states that there are very definite limits to the numerical magnitudes
defining most scientific and physical phenomena. If this is so, then it
is theoretically possible to reduce whole mountains of data to a very
small compass.
In Figure 1 the investigators have reduced ihe job satisfaction data
of Library A to a series of curves which define the specific attitudes of
the employees in Library A. A computer program was used to obtain per-
centiles of the data. Class intervals were constructed to treat the data
in such a way that iLs essential shapes and nature were emphasized.
What emerges in Fure 1 is a clear snapshot of employee (specific)
attitudes. This, it must be remembered, is a cross-sectional view of
group attitudes. As such it is impossible to predict an individual employee's
attitude about any concrete condition existing in Library A. The extreme
generality of Figure 1 constitutes its chief strength, for it is the group
or consensus feature of the data which must be highlighted if understanding
of aggregative attitudes is to be advanced. By examining closely the peaks
and valleys of Figure 1 global assessment of the state of morale in Library
A suddenly comes into sharp focus.
In Figure 1 it is evident that the employees in Library A possess
a great deal of ambivalency in their feelings about the five dimensions
of their work, as measured by the five Job Descriptive Index (JDI) atti-
tude scales. Pay and promotion constitute one universe of values. The
group consensus of the employees in Library A is that the policies and
8
practices of management in Library A in the areas of pay and promotion
are not to their liking. Many of the library employees in Library A
feel that the pay is too low and that promotional opportunities are below
par. .
However, Figure 1 also shows that Libray A employees are, by and large,
satisfied with the work areas of people (coworkers) and supervision. Note
too that the peaks for people and supervision areas of job satisfaction
are "taller" than the corresponding peaks for pay and promotion.
The curve defining satisfaction with work (itself) (see Figure 1)
is very interesting, especially in the way it interrelates with the other
four job satisfaction curves defining areas of group consensus visA-vis
specific attitudes toward discriminable areas of the job situation. There
appears to be.more ambivalency in the work category of job satisfaction than
in any of the other classifications established for the study and analysis
of job satisfaction. This diversity of opinion indicates that the employees
in Library A are sharply divided in their notions of what constitutes
interesting and worthwhile work.
It is possible to identify at least three separateliniverses" or
"climates" of opinion of employees in Library A (see Figure 1): 1) the
universe of values defined by pay and promotion; 2) the universe of values
'defined by people and supervision; 3) the universe of values defined by
work (itself).
Obviously the feelings of the employees in Library A are very ambiva-
lent. This ambivalency in attitudes shows up in two ways in Figure 1:
1) differential feelings in regard to the five discriminable dimensions
as assessed by the .3DI; 2) differential feelings among individual employees
in Library A with respect to a single dimension of the work situation,
9
for example, the work category of job satisfaction. The two-fold nature
of ambivalency in job satisfaction is the causal agent in accounting for
the horizontal separation of specific job satisfaction means (in Figure 1),
as well as the individual dispersion of values for a given job satisfaction
curve. Any explanation o.c." these curves should include assumptions taking
into full consideration the deep impact of ambivalency in job attitudes.
A partial theory of job satisfaction could be erected upon the
preniises implicit in Figure 1. Phrased in the familiar jargon of job
satisfaction literature, it is the ambivalency in feelings which an employee
possesses about his job that motivate him in his job. This motivation
exhibits a Janus character, of equivocacy. This equivocality shows up as
a two-vectored psychological set of forces which tug at the employee.
One set of forces (positive) tends to keep the employee on the job. These
positive psychological forces are implicit in the favorable feelings
which an employee has about the dimensions of his job. In Figure 1
these positive psychological forces can be identified unequivocally as
people and supervision. An employee will tend to stay on the job because
he likes his supervisors and because he enjoys working with his coworkers.
Another set of forces (negative) tends to drive the employee away
from his job. These negative psychological forces are mirrored in the
unfavorable feelings which an employee has about the differentiable aspects
of his job. In Figure 1 these negative psychological forces can be identi-
fled with the pay and promotion curves . An employee will tend to leave
his job because he dislikes various features of the pay and promotion
policies of the management of Library A.
The universe of psychological forces represented by the work curve
of Figure 1 is the most difficult to interpret and explain, by far. The
10
10
distribution of this (work) curve is almost rectangular in appearance.
Ambivalency in feelings is so rampant in this category of job satisfaction
that it is extremely difficult to make general assertations about the
basic nature of the psychological forces motivating the Library A employees
in this specific attitude. The mean for the work curve (Figure 1) becomes
virtually worthless, as a meaningful statistic. Why is this? Because
there ate so many exceptions to the mean value that the exception becomes
the rule! Such a situation approaches statistical anarchy. Such a situa
tion presents many, many problems in interpretation. It would be better,
for purposes of meaningful analysis, to enumerate the data, on an employee
byemployee basis rather than to cite group statistics, at least for this
(work) category of job satisfaction.
Ambivalency in feelings indicates a diversity of attitudes in the
group at large. Can anything meaningful be said about data which exhibits
such extremes in feeling? The answer to this question will depend, in the
final analysis, upon the uses for which the answer is to serve. In our
case the research data answers not only tbis question but several other
questions tangential to it. First of all, Figure 1 shows , in striking
fashion, the relativity of attitudes prevailing among the Library A employees.
The attitudes expressive of the feelings of these employees about their
coworkers and their supervision are meaningful and significant only because
they exist coetaneously with the set of attitudes defining the feelings
of the employees about their pay and promotional opportunities. Thus, any
meaning lurking in the data is ultimately traceable to the relativistic
bias of the basic data from which the curves (Figure 1) were constructed.
In practical terms this merely means that there is no such thing as ab-
solute job satisfaction. The sooner that investigators abandon the search
11
for this mythical creature the better. It is only in examination and
investigation of relativistic patterns of job satisfaction dispersions
la Figure 1 that any meaningful progress can be made in discovering the
reasons behind .1uch patterns.
Can the employee satisfaction patterns existing in one library be
compared with satisfaction patterns in another library? This subject will
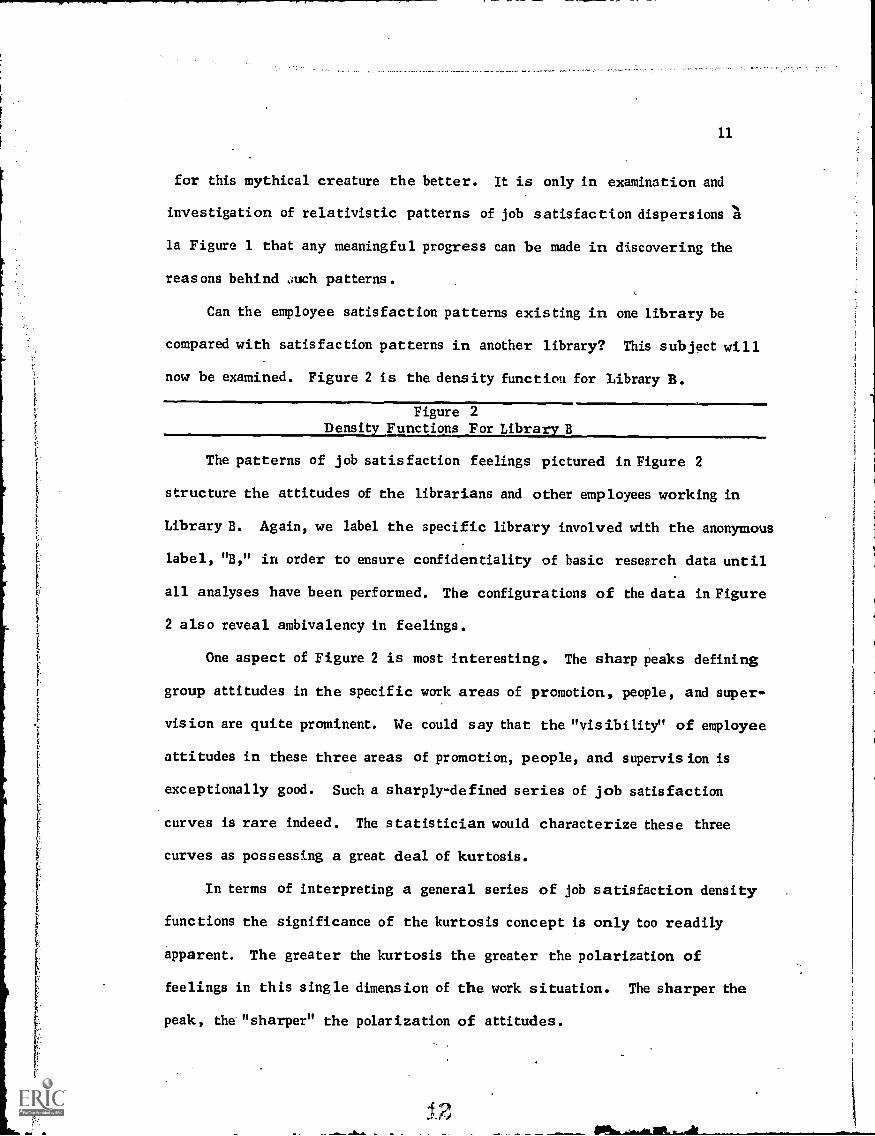
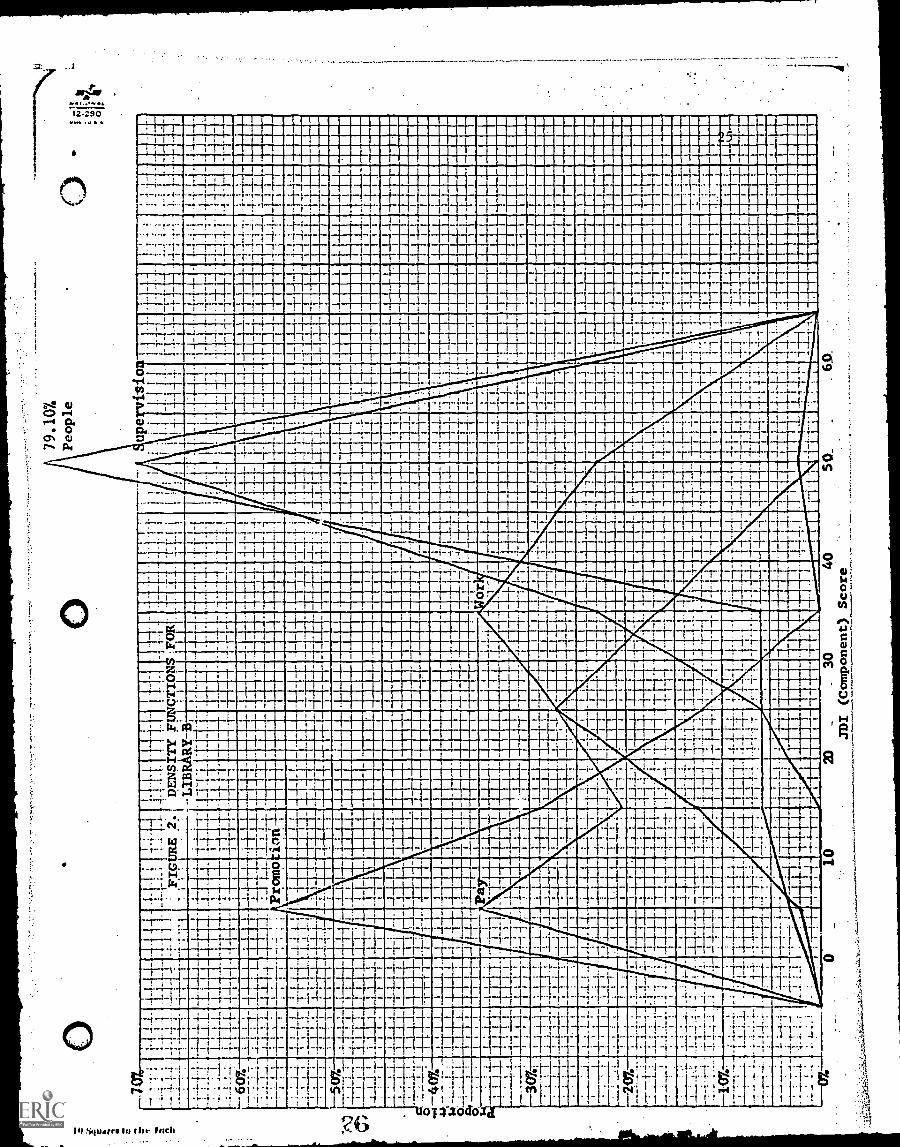
now be examined. Figure 2 is the density function for Library B.
Figure 2Density Functions For Library B
The patterns of job satisfaction feelings pictured in Figure 2
structure the attitudes of the librarians and other employees working in
Library B. Again, we label the specific library involved with the anonymous
label, "B," in order to ensure confidentiality of basic research data until
all analyses have been performed. The configurations of the data in Figure
2 also reveal ambivalency in feelings.
One aspect of Figure 2 is most interesting. The sharp peaks defining
group attitudes in the specific work areas of promotion, people, and super-
vision are quite prominent. We could say that the "visibility" of employee
attitudes in these three areas of promotion, people, and supervis ion is
exceptionally good. Such a sharply-defined series of job satisfaction
curves is rare indeed. The statistician would characterize these three
curves as possessing a great deal of kurtosis.
In terms of interpreting a general series of job satisfaction density
functions the significance of the kurtosis concept is only too readily
apparent. The greater the kurtosis the greater the polarization of
feelings in this single dimension of the work situation. The sharper the
peak, the "sharper" the polarization of attitudes.

/2
What are the consequences of inordinate amounts of kurtosis showing
up on the density function charts of organizations? It depends upon
whether the kurtosis appears at the upper or lower scale of the horizontal
axis. In Figure 2 the "lower" we get on the abscissa (go to the left)
the "lower" the feelings this positioning represents. Conversely the
"higher" we get on the abscissa (goto the right) the "higher" the feelings
expressed. If any peaking is to occur, we would much rather have it occur-
ring as far to the right on the abscissa as possible since this reflects
very favorable attitudes. Conversely, any kurtosis occurring "low" on
the abscissa is disconcerting to the investigator since this positioning
is a clear indication of a low state of morale among employees.
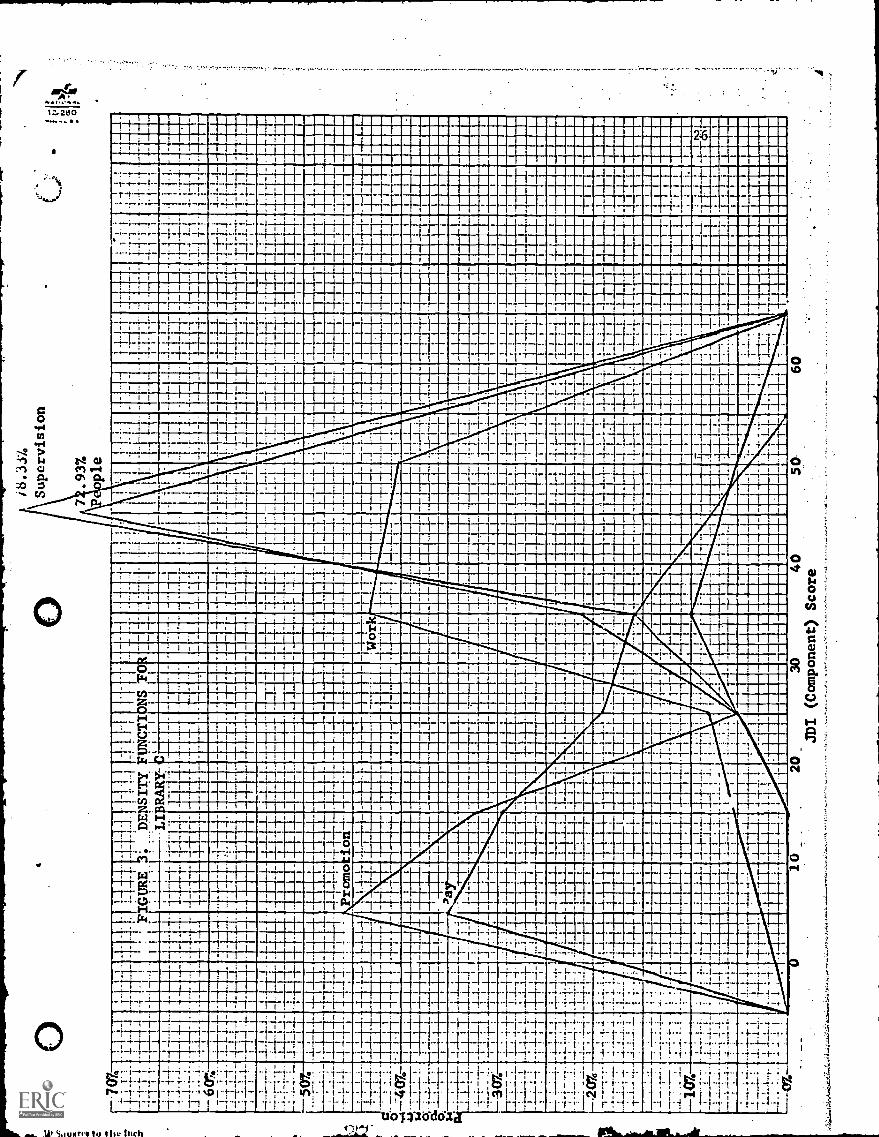
The density function for Library C is shown in Figure 3. Figure 3
Figure 3Density Functions For Library C
shows a sharp polarization of feelings in the areas of supervision and
people. The extreme_ly sharp peaks imply a unanimity of emplqee opinion
that contrasts sharply with the opposite concept of ambivalency. Pay
and promotion show lesser kurtosis, implying that forces of ambivalency are
at work in this population of university library employees tending to
produce more "box-like" or rectangular dispersions of job oatisfaction
patterns. The latter configurations are perpetually in conflict with
the former. Which set of forces will triumph depends upon the impact of
individual personalities in the organization. At stake is the polarization
of attitudes along the abscissa which defines the degree of diversity
existing in the organizatIon as a whole.
The Library C satisfaction II snapshot" (Figure 3) discloses the typical
pattern of group feelings about the work category of job satisfaction.
L
13
The work density function is rectangular in shape. This characteristic
shape is reminiscent of a family of frequency curves (density fuactions)
to which it undoubtedly belongs. This family of curves is dis tinguished
by the relatively greater degree of flatness (platykurtosis) in the region
about the mode of the frequency curve. It contrasts sharply with the typical
frequency curve found in the opposite family of curves defined by relatively
greater peakedness (leptokurtosis) in the mode region. Lying midway be-'
tween these two families of frequency curves is yet another conceptual
family of curves represented by the normal frequency curve which is its
best-known member. The normal curve reflects a point approximately midway
between too much peakedness and too little peakedneas. The family name
applied to this configuration of density functions is mesokurtosis:
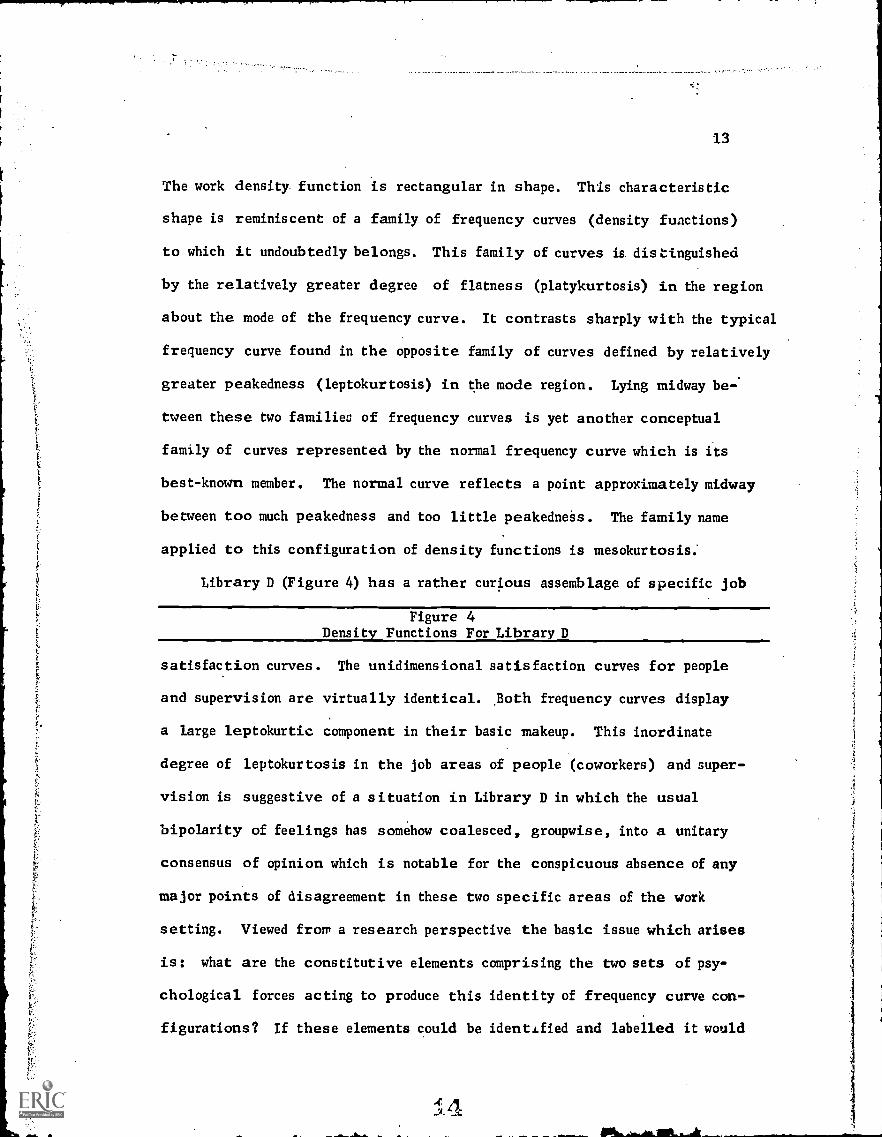
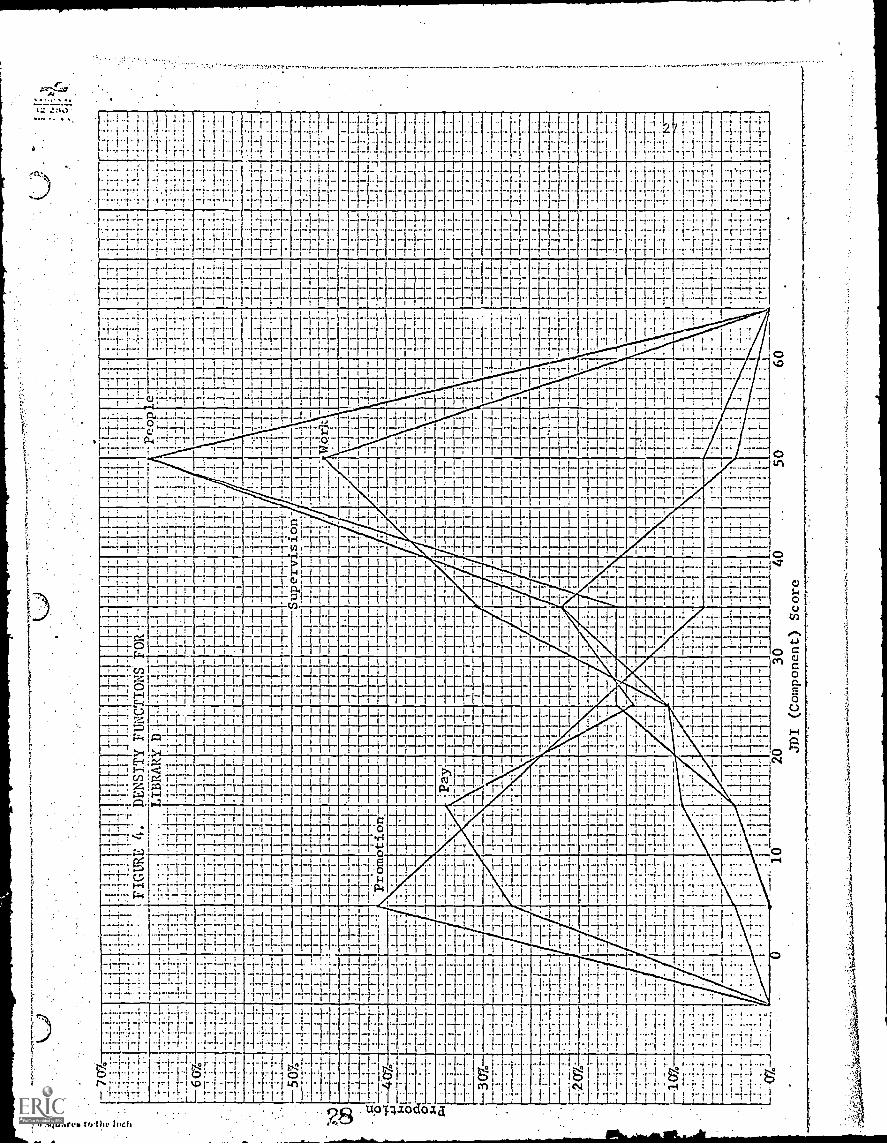
Library D (Figure 4) has a rather curious assemblage of specific job
Figure 4Density Functions For Library D
satisfaction curves. The unidimensional satisfaction curves for people
and supervision are virtually identical. .Both frequency curves display
a large leptokurtic component in their basic makeup. This inordinate
degree of leptokurtosis in the job areas of people (coworkers) and super-
vision is suggestive of a situation in Library D in which the usual
bipolarity of feelings has somehow coalesced, groupwise, into a unitary
consensus of opinion which is notable for the conspicuous absence of any
major points of disagreement in these two specific areas of the work
setting. Viewed from a research perspective the basic issue which arises
is: what are the constitutive elements comprising the two sets of psy-
chological forces acting to produce this identity of frequency curve con-
figurations? If these elements could be identified and labelled it would

14
make incomparably easier the task of explaining the dynamics of group
feelings which tend to assume varying shapes, not only in an organization
at large, but from departmental unit to departmental unit within the organi-
zation.
The most notable feature of Figure 4, and the one which catches the
managerial eye moot forcefully, is the density function defining group
feelings about work. This curve is not platykurtic. It differs, in shape,
so drastically from the corresponding frequency curves in the other five
IUC libraries that one is compelled to ask: What is it in Library D that
would tend to produce a leptokurtic "X-ray" photograph of the work area?
This question assumes especial significance in view of the fact that all
the other work density functions are markedly platykurtic in shape and
overall appearance.
In attempting to answer this question the investigators of this study
considered several alternative theories of explanation. First, the shape
of the work curve, in relation to the other four specific curves in
Figure 4 was examined. Inspection of Figure 4 reveals a curious fact.
The work curve is straining upward, as it were, towards the peak of the
supervision and people curves. This is a clear indication that the work
curve would like to attain the identity, if not the primary characteristics
of, the leptokurtic members of this family of curves. The point to be
emphasized here is that, from a comparative analysis of the density functions
of all five libraries of the IUC consortium, it is evident that a lepto
kurtic work curve is something of an anomaly, comparable to the discovery
of a unicorn among herd of horses.
This discovery marks Figure 4 as a very unique document. For the
first time there exists proof that there may be a tendency for employee
15
feelings about work (itself) to polarize in one direction. More research
needs to be accomplished to ascertain if the basic thesis is tenable.
The thesis could be stated as: Is there a definite tendency for the
work density function to assume leptokurti.c proportions? If this thesis
is proved tenable, then other theses itranediately suggest themselves:
1) Is the polarization of feelings implicit in the concept of leptokursis
in a positive or negative direction? That is, what position along the
abscissa is assumed by the center-of-gravity of the work data? 2) Is
the polarization of feelings an ad hoc phenomenon or does it represent
a more enduring or permanent state of affairs in the organization? 3)
Can the causal forces at work in the organizational environment be ideuid-
fied, labelled, and comparatively assessed?
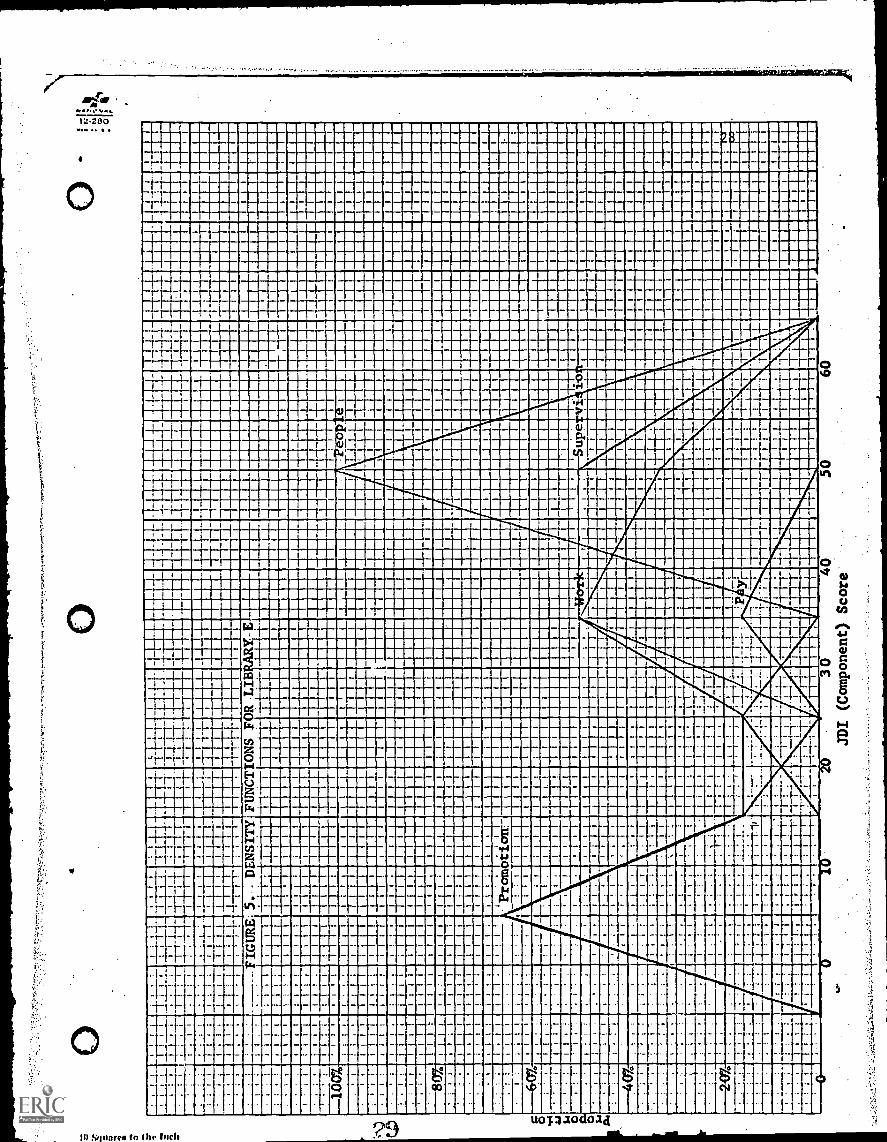
The frequency distributions in .Figure 5 reveal sharp polarization
Figure 5Density Functions For Library E
of employee feelings in the three specific work areas of promotion, pay,
and people. The feelings of the employees in Library E about the pay
policies and practices of Library E are decidedly unfavorable. Likewise,
the peaked coincidence of the promotion curve with the pay curve suggests
a degree of leptokurtosis in the underlying distribution of data which
can be interpreted by the satisfactions investigator as a group con-
sensus that promotional opportunities in Library E are pretty slim indeed.
Supervision and work (Figure 5) curves are rather atypiCal. The
supervision curve assumes a platykurtic shape or outline which has major
implications for the management of Library E. Note, first of all, that
only in Library E does the supervision curve assume anywhere near the
degree of flatness (absence of peakedness) that it does, in fact, assume
16
in Library E. This is a clear indication that employee feelillgs in Library
E have not, as yet, polarized. There is evidently some doubt i the minds
of employees in Library E about the quality (perhaps the quantity).
supervision in Library E. Stated in other words, there does exist a great
deal of ambivalency in feelings of employees in Library E about their
supervision. It would naturally occur to the management of Library E
that some research is indicated, in order to pin down more specifically
the reasons contributing to this curious platykurtic dispersion of data
in the specific job satisfaction area of supervision. This may be only
a temporary aberration in job satisfaction patterns, or it could possibly
be indicative of larger, perhaps more deep-settled problems. In order to
. influence the supervision density function to assume a more desirable,
i.e., more leptokurtic shape, it will be necessary for the management of
Library E to consult with the managements of the other five IUC libraries
comprising the IUC consortium of libraries in the North Texas region.
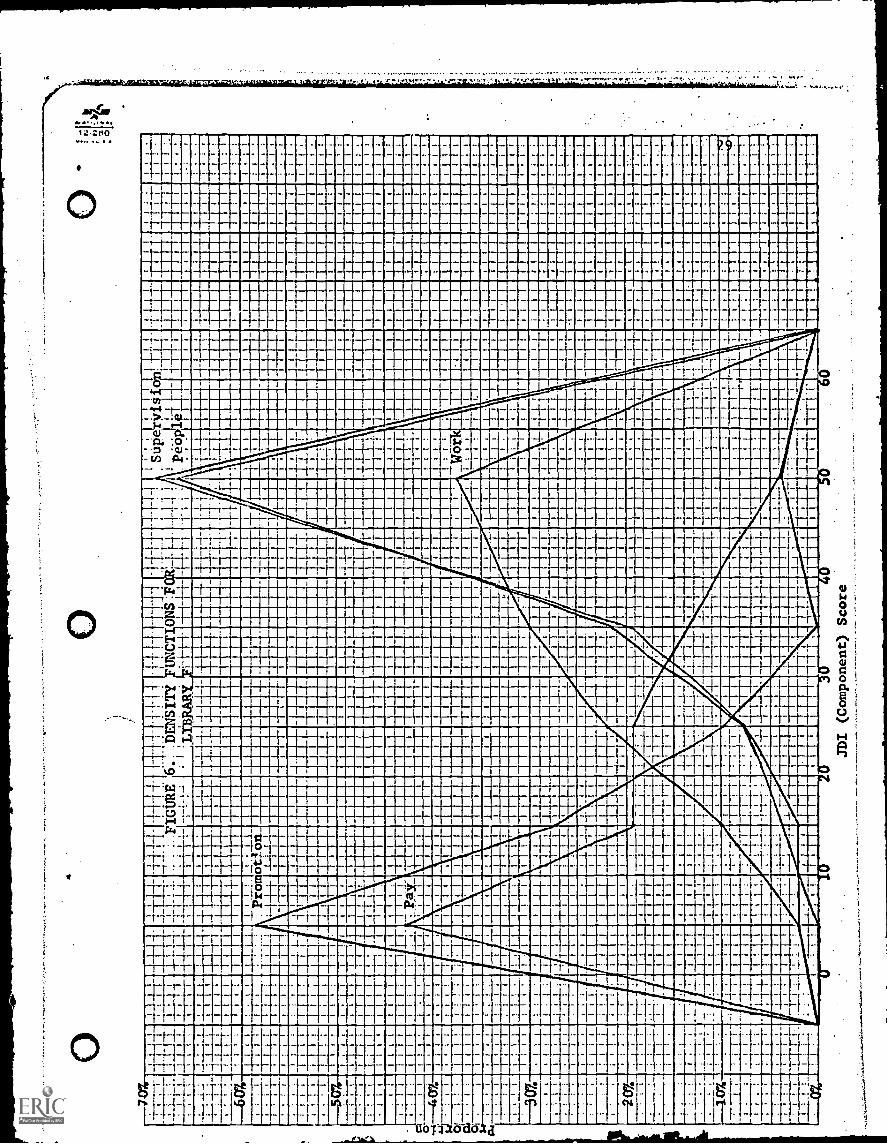
The density functions (frequency curves) for Library F (Figure 6)
Figure 6Density Functions for Library F
come into focus quite sharply. This is one of the best "snapshots" of
job satisfactions data that the investigators discovered during the course
of this study. Feelings about supervision and people polarized lepto-
kurtically at a position which is high enough on the abscissa to preclude
ahy mistaking of the overall or global feelings which the emPloyees of
Library F possess in regard to these two categories of job satisfaction.
If nothing more were known about the situation in Library F we could
conclude that the management of Library F has been extraordinarily success-
ful in conceiving.and implementing its policies in the two specific work
17
areas of supervision and people. The management of Library 1/ evidently
\has a situation closely akin to that which exists in Libraries
\B and C
since all three people and supervision density functions are remIà1y
similar (see and compare Figures 2, 3, and 6). The managements of Li-
braries A, D, and E will probably want to consult with the managements
of libTaries B, C, and F in order to discover the reasons for the degree
of sucess enjoyed by the latter managements in these two areas of managerial
concern (supervision and people).
The work density curve (Figure 6) is fairly typical, considering the
overall patterns of dispersion for this specific category of job satis-
faction for the six IUC libraries as a whole. The work curve is tending
to a pronounced rectangular configuration which is indicative of a bias to
platykurtosis. As a general rule we can say that the more platykurtosis
in a frequency distribution, the greater the degree of ambivalency in
feelings which this pattern of dispersion denotes. Stated otherwise the
attitudes of employees about their work (itself) displays an absence of
consensus which is notable chiefly'for its sharp contrast with the other
specific work areas of interest. These latter categories almost invariably
display density functions which are sharply polarized in nature. AS a
general rule we can say that the greater the leptokurtosis in a frequency
diagram picturing job satisfactions the lesser the degree of ambivalency
in feelings of employees about the respective specific dimension of the job
which this density function mirrors.
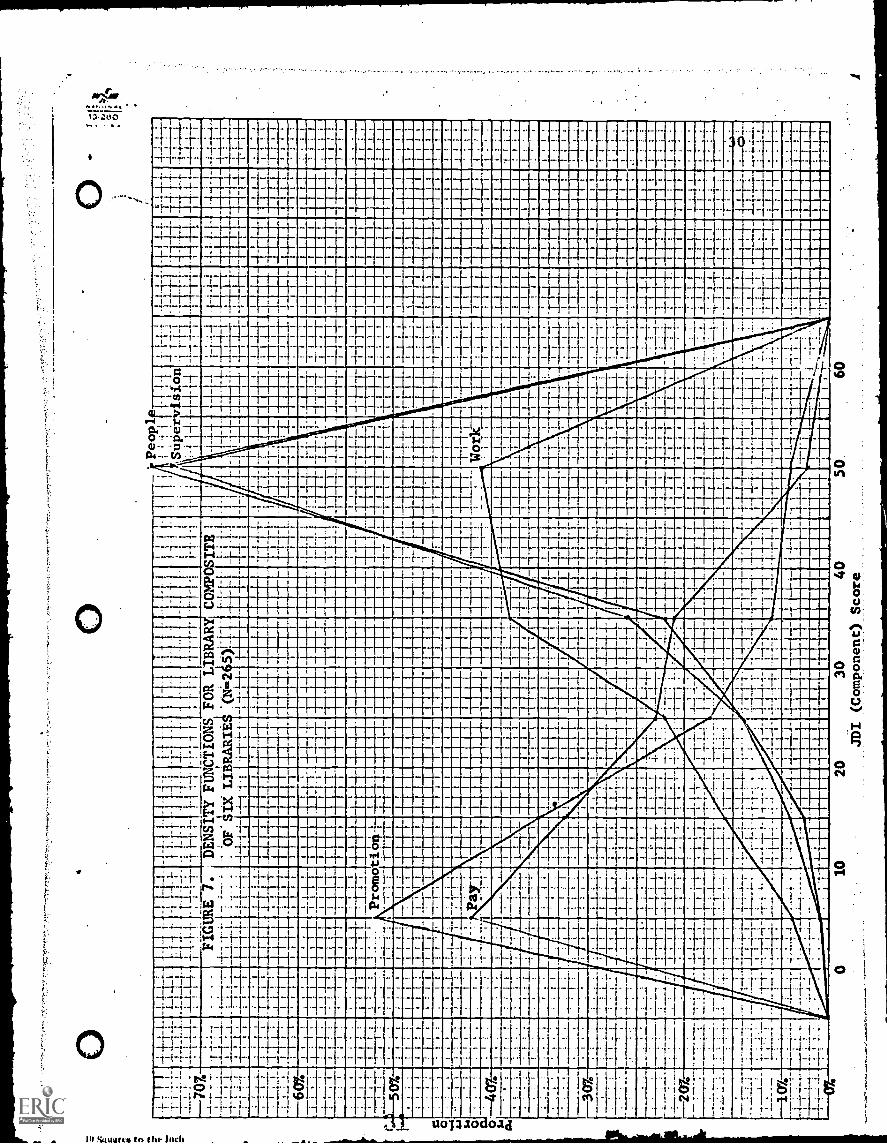
Figure 7 shows the composite density functions for all six Inter-
Figure 7Densit Functions For Librar Com osite of Six Libraries N=265
university Council (IUC) libraries which participated in this study of job
18
18
satisfactions. The diagram is interesting because it captures, in cap-
sule-fashion, the attitudes of 265 employees working in six TUC libraries.
It is also significant, the investigators feel, because it provides the
library study with a center-of-gravity for its data. Of necessity com-
parative analyses must resort to a common benchwork (center-of-gravity)
in order to properly assess the implications for departures of individual
data from the common data benchwork. In more practical terms this means
that, in the ultimate analysis, group means and averages must stand in and
represent, as it were, the multitudinous diversity of individual attitudes
comprising the total library consortium.
The composite shapes of the frequency curves in Figure 7 are important
too, in the sense that generalizations which emerge from a consideration
of their ')asic configurations hold much more weight, in the final balance,
than the individual library prototypes to which they owe their genesis.
Irregularities in the data which figure prominently in the analysis of
individual IUC libraries tend to smooth out in the Composite Density
Function (see Figure.7). As a natural consequence a greater degree of
cl:edence and confidence can be placed in any generalizations which emerge
from an analysis of the Composite Density Function. In short, a policy of
diffidence must be followed by investigators when interpreting the individual
density functions appertaining to the separate libraries of the IUC con-
sortium. Similarly, a policy of confidence is in order when investigators
are exploring the implications of the Composite Density Functions. The
difference in investigatory policies proceeds from a consideration of the
essential difference in the constitutive nature of the contrasting species
of individual versus composite density functions.
19
'19
Discussicn of The Com osite Density Functions For The Six TUC Libraries
Sharp polarization of feelings are quite evident in the areas of paople
and supervision. The leptokurtic frequency curves defining the thinking
of employees in the IUC library consortium vis-'a-vis their coworkers and
supervision are placed well to the right on the abscissa. This indicates
a favorable consensus of employee opinion. As a whole we can say that the
policies of management are apparently working, at least in these two specific
areas of ene work situation. A pragmatic test of the theories and policies
of management is: How are these theories and policies translated into
action, in terms of the placement of the appropriate specific density function
along the abscissa? The placement of the people and supervision density
functions (Composite) is far enough to the right on the abscissa in Figure
7 to dispel any lingering doubts about the efficacy of management policy
in these two areas. It should be remembered, in these generalizations,
that the investigators are speaking of a hypothetical or Composite Li-
brary Management which has no true counterpart in reality. Only individual
IUC libraries exist. The theoretical Composite Library Management which is
treated of here is of heuristic value solely.
The feelings of IUC libraiy employees about promotion and pay is con-
sistently and uniformly unfavorable. This is shawn by the placement of the
pay and promotion frequency curves far to the left on the abscissa of the
density diagram (see Figure 7). Such a sharp polarization is one indication
that the attitudes of employees vis=a-vis differentiable areas of their
work environment are sharply opposod to the trend of feelings which they
possess in other discriminable aspects of their work. The Composite Li-
brary Management will want to study and research the reasons for this
split in global feelings about the specific work areas involved.
20
Work (Figure 7) displays a platykurtic disposition, indicative of much
ambivalency in the composite work force. The configuration of the work
density function is a clear indication that no polarization of employee
attitudes and feelings has occurred. The situation in this area of the job
situation is very fluid indeed. It would appear that the thinking of the
employees in the library complex defined by membership in the IUC consortium.
is loose, unstructured, and not too well-defined in this area, There does
appear to be a definite tendency for the work curve to drift upwards and
to the right. If this is a correct interpretation of what is actually
happening, the news is good. But no such hypothesis is supportable at
this time, since the evidence is much too thin to support such an assump-
tion.
What is certain though is that the shape of the work frequency curve
(density function) needs to be auditcd in future satisfactions surveys.
Enumerative statistics can be used to delineate the broad outlines of the
density pattern of forces. Descriptive statistics can then be applied to
determine the positioning of the work curve along the abscissa. Once these
two vital tasks of analysis have been achieved, the even more important task
cf deriving managerial implications from the established patterns can be
commenced.
What should and must be stressed is the necessity of longitudinal
studies of job satisfactions in the IUC consortium of libraries. This
brief cross-sectional view of library satisfactions has only scratched the
surface of potential findings. The obvious course of action for the future
is to supplement these initial, tentative conclusions by more detailed
hypotheses, supported by the great weight of longitudinal research studies.
The results so far look extremely promising.
21
21
Summary and Conc lusion
The discussion' of the null hypothesis was essential for two reasons:
1) The universal nature of relationships requires a correspondingly large
hypothesis which ignoles the minutiae of detail to zero in on major impli-
cations for managerial policy and.action. The statement of the null
hypothesis does this admirably. 2) Managerial insight requires a broad
vision of what constitutes the ultimate limits of its area of concern.
The implications of the null hypothesis reach far beyond the boundaries
of its mere assertation. These two parameters of delimiting significance
can be taken to signify the deep concern of the management theorist in
searching for sweeping generalizations which yet can be harnessed for
practical managerial applications with minimum of fuss and bother.
Again, the null hypothesis fits the.bill nicely when measured against
this expectation.
It is all-important to determine the nature of relationships existing
in any management situation. The scientific method presumes that by
thorough investigation into the situation and conditions constituting i:he
work environment that such relationships as exist can be brought to the
surface and analyzed for content. What is important and what should be
stressed is not the method by which such relationships are established,
but the universality of the content of such relationships. The conclusions
which emerge from examination of density functions must be verfiable
through the application and use of methods totally dissimilar to the one
originally used. If it turns out, on consideration of the alternative
options possible in treatment of the data, that mathematical functions can
best (optimally) be utilized in the search for relationships, then this
method should be used, to the exclusion of other methods. If it appears
2
22
on the other hand, that statistical graphs can be utilized more efficiently
in the search for relationships then the management analyst may want to
supplement the mathematical functions approach with such statistical tools
as density functions, histograms , correlation coefficients, and frequency
diagrams. The items mentioned are merely illustrative and are not meant
to be an exhaustive enumeration of the currently accepted means by which
relationships can be established.
When such relationships, by whatever means, are finally established,
the management analyst has only started. The results of his findings must
now be communicated to all managers and employees having an interest in the
research study. This will normally be accomplished informally through
the process of meetings arranged with the concerned managers and employees.
To disseminate research findings on a larger scale it is essential to
publish the findings widely through the available media. It is suggested
that serious consideration be given to publishing the research findings
in the Educational Resources Information Center (ERIC) official journal.
The microfiche developed by this institution is lightweight and can be
transported relatively cheaply and quickly throughout the country. Other
sources of information dissemination should also be considered, in connection
with the EME vehicle. By making the research findings widely available
feedback sources can be expected to develop which will be efficacious in
generating a reverse flow of information which is extremely useful in
either confirmation or redargution of the original research theses. By
stimulating these currents of information flow the management process can
be considerably strengthened and improved through ecletic adoption of those
research hypotheses which appear to be dl.rectly in line with intuitive
conclusions reached independently, using other methods, by front-line
manager ia 1
tenanc e of
precedence
The payoff
proces s es .
achieved.
-23
personnel. The ultimate goal is the establishmerkt and main
organizational effectiveness. This overriding philosophy takes
over the myriad details implicit in the research process itself.
comes in the increasing of understanding of basic management
Basic research is only one means through which this goal can be
24
!
l 11
II11
Iania
4,
Wu
III
III
MN 1111111ril
IIIM
aI
mam
a a
MaI
LB
ill"
i.
MIBIlmiliiiilITIERIFur--17
011-
ril"
-Aliu 'LIM
....
UNE
Milraill
MO
IMMS SUME
lignalil
II
lM
a.Imim
ME
MI
WM
NN
WM
EM
INO
MM
MU
MI,
MU
MM
A
1111
1111
1
IIIM
UM
OH
nia!
'
ERE
mill
Ism
ILA
11mu
112
manstm
wor
mrA
A
mom
MS
Fil
Bil mi
lA
NUMMIUMM
MEN
nAil
AtA
911II
IMIN
1111
1111
1111
451
S.
mum
sm
AU
mmummunim
Ru
mum
11
eFr
III liii
IMU
Mrig
niNUMilla
1...
emru
neE
mu
Am
mo
mmmi
Ak
I -
1111
1111
1111
1=
MIS
Min
..1111
ill1111111
11:2--mmms
mam
a.
urn um
mm
mm
sal
am
emuu
11111111111m
gm mom mi
.........pl
EMI=
I
am
:L
.iai
a-mmummoral
am IIIIiiiii
nammumma lumn....................a....................m...summum mum ....iimimmai....1.. ....mourimm. nix . I==11111111111111111=iwmuw____Mill I INS InWM 11111.11sIIIINIMMUM111 11110111_4NI
la OM IN b tillUMW BMW NU 111 OMIllumIll
a 111 =minWM RI NNW
1MI
ri MO 111111111111Zwila Er .91 me..... ma:
. .. Ma 91111.11111111 .....MI 11111111111 ip
nom.1as .. iir 'IL_
IIMR 1111
III
111111111_.-..[ISLgi
---.41 Uri la Alopas A _!! .. 1
- si a
h._ a. rillI;
INM 4161 i/ ma
Mil mild ......rm....... ..... ___
...., .. .... -th.. . . .74V..., tus
1.._ ma..._ aa . A111111111 1
. AMMO UM V" I _ 1..... 1
um 11 11111 ullin =IIsinall2= ma A I A .1
...LAINEIPUM SWUMMS= 1-ILI 9 . P. .. ... .1. 1
_ Nir
Adam -
Hal I'maws_a. adril PrNW
perm-11
alit mil oi unn , 4
Eli
PPP- li $ 1 O MENEM
lig 0 . W Mu Ell SIMEMM MOM
inomom MMEMEMEMENUM EOM WM \ mOMII IWO% NM IMPUM
MOM MU MU EMVESINEEMNI MUM MOE=
MU. Adg 1118
10111
-%4"- Mans 1010--MUMMU II
MMI-Ellmi 1:11
MINE .
MU UMMUMWM.g=._ RILIRTEIPI
RIM MON MN MWV
VP
MENEM itto :UNE num no sunsmm
.. mssimmli. MEMO min
WERE imp s 1 1
MEM EMS MEM r ---2.71112.4141419.
Agi MEM RENEEMMEMEE
MI nsummniiiiiiiiii MINN am
fir ruNE11111111111:1 NMI MN m III
/MEM= on
AT
se.1. lUll
111 111
UMW KM -Al low- OE L. OmION REM IMMI-MO
WIMIE 111=1011EWIENNE MUNI MOM II NUM= 11MMUMENES
soiogrosTs-- .41101111
POE
MU MO OM VIE
311 UM
MIMI I MO
:11
UM nal IOU ilillumnInsm
BM ITPUENSTI
U MW ESE nul n Imn mrs
ims nom
now-- MO
1101 MIMI!
moms
mil jam II U W WILMSEM
O NE
EV
mmilsommmumm 'AI " num f MOM M 111102010ME ROMEMWOMEMN O RMENIMM, MIME MIME MEMMIMMUMMOM MUMmERE NEER smug
IUIIUIII .10 1011100011.1001100111110111110..... 011,71.71
NilIN
Min
1.
IRN M
aa
pa. ESLinn sur-.40AW1
9-151,Lar °HQ 3 1 4mond! .... - _...ed!MP1111 Ede P111:111.1"...:mmrs .itemAN II E_nl asEMILLIP___ IIEFALM
mu
MI "LW11111 MN EN Ism. mis_ all Wes um urn se
11S-
ER MIESNEElir NM NM ON
Ilia
II........21. ..Ir Ira 6.4.-
.1,151900Nor =momnem an liplEEME1
V/ S oare. to the Inch ?9 1.11:43.10 old
%NO
IIIIIIIIIIIIIIIIIII 11111111111IIIIIIIIIIIII 11111111111111
HIIIIIIIIIIMIIIIIIIII. IIIIMIIIIIIIIMINPILILIII.' !ILA III 11111111' iii° 1E1_ MI
1 11:41 7-lumir roil 11.11 ing7 ii.mhoilti..!.21111.,iiiii.:-.:--.:---=:,i,.. .
Eggil- n. iii .1 ,
urlirNur x MI" 'A "'. ...._.. Sham IIII
'441111 1 ri 1 UM" . I
-ET--,-'. 111:151144;111111111_1: 1:7101911111 inirmildils 't14-
' UT la% hi: VI ' "1 r .11 1-f: makiLliabier. a 11,_ 1
'ascii williiiiirriiiiiiii.NI a\
'ill RTIPINIMPE Jim 'ilk44- I IL1 R.:: Vaiiradill fla II I
: i 1311111 1 IPION11111 1mm I -
: glagigli ididdillIMMIL I ik
111 -;"71411ERRIP I' Mr I' 11
11 JIM II IIP 1111 1 111111111111 11
-1111111- 111111 III
Ii111111111111111111111111 111 1110
I IC is ii""rEIVITEMI1
16 :I .111 .1"111111111
1".1 II 1111111 " I
1111111111111
. .
41.
AID
. .
al I MN 3wpm--
.....011111111111 RPTPPP"
NEN MImgal 1
1 11111
-1-i&r,,__111 1111
IOMMUMMOMUMIIMMEERMIAN NM
MIiniurnaJIM 111 IMP= m MomUman
N ImIN liEarn ift.4"441ta mill11.- A
MIllii NIS 14 III114 is 1mri 12:: .1
Etirlim :ly-
nx _ i .6 ..a-4,
I. ' III..
. a. 11111 II11111 Li 11 440,- ik
IF IIP"
Palo "
dB.
U.SIMISI11111 "I Ill Ati
I=mule I . .%,..AFF
: r
I
1'
11,111
11
1 I
lialltarAhasso-.."11111111111MILI
II