document resume jc 730 148 trent, james w.; and cthers
TRANSCRIPT
DOCUMENT RESUME
ED 077 509 JC 730 148
AUTHOR Trent, James W.; And CthersTITLE The Study of Junior Colleges. Volume IIA, Technical
Appendixes to Volume II, Civerse Dimensions ofCommunity Colleges: Case Ftudies of 15Institutions.
INSTITUTION California Univ., Los Angeles. Center for the Studyof Evaluation.
SPONS AGENCY National Center for Educational Statistics (CHEW/CE),Washington, D.C.
PUB DATE Dec 72CONTPACT OEC-0-70-4795NOTE 383p.
EDRS PRICE MF-$0.65 HC- $13.16DESCRIPTORS Administrator Characteristics; *Case Studies;
*Community Colleges; Counselor Characteristics;*Junior Colleges; Student Characteristics; *Surveys;*Tables (Data); Teacher Characteristics; TechnicalReports
ABSTPACTVolume HA of The Study of Junior Colleges ccntains
the technical appendixes to Volume II. The appendixes contain: (A)tables to Chapter 3 (Institutional Profiles) and the institutionalprofiles; (B) interview schedules for key administrators and tablesto Chapter 4 (Administrative Profiles); (C) student marginal data andtables to Charter 5 (Student Profiles); (D) faculty marginal data andtables to Chapter 6 (Faculty Profiles); (E) counselor marginal dataand table to Chapter 7 (Counselor Profiles); (F) tables to Chapter 8(Staff and Students: Comparative Perspectives); and (G) form letterssent to survey subjects. (For related documents, see JC 730 146-147,149.) (KM)
THE STUDY OF JUNIOR COLLEGES
Contract No. OEC-0-70-4795
U S DEPARTMENT OF HEALTHEDUCATION WELFARENATIONAL INSTITUTE OF
e010,TIONS DOC % PEE% WEPkC
D.;FD EXAC,, QECEPE N.0% OW OW 0% CW OWN
Y. PC. v' 0, E h CQ C`P-E %C' of I ,sAv v QFP4E
,f , I AL %A 0.. L `, L'
ED C.. '7,% PO. ' 0% PO ( v
VOLUME IIA: TECHNICAL APPENDIXES TO
VOLUME II
DIVERSE DIMENSIONS OF COMTNITY COLLEGES
CASE STUDIES OF 15 INSTITUTIONS
ByJames W. Trent, Principal Inrestigator
Barbara DorfRonald HartFelice Kaman
Roberta Malmgren
withGlenn F. Nyre
December 1972
CENTER FOR THE STUDY OF EVALUATIONUCLAGraduate School of EducationLos Angeles, California
Educational Research and Development
Department of Health, Education, and WelfareU.S. Office of Education
National Center for Educational Statistics
FILMED FROM BEST AVAILABLE COPY
UNIVERSITY OF CALIF.
LOS ANGELES
JUL 1 3 1973
CLEARINGHOUSE FORJUNIOR COLLEGEINFORMATION
Preface
The present volume is part of the second of three reporting on The
Study of Junior Colleges undertaken in conjunction with the UCLA Center
for the Study of Evaluation for the U.S. Office of Education. The pro-
ject was initiated under the auspices of the Office of Education's National
Center for Educational Statistics. It was designed to help close the gap
that exists between data needs of policy-makers and available bodies of
statistics on junior colleges. The primary purposes of the project were:
(1) to ascertain major problems and needs articulated by leaders in the
junior college, (2) to determine the availability and quality of data
existing in the central records of junior colleges, (3) to identify
other important descriptions that can only be obtained directly from stu-
dents and staff, (4) to assist the Office of Education in determining
what criteria should be used to measure and analyze the special needs and
performances of junior colleges, and (5) to serve as a first step in the
development of a national data bank on junior colleges.
The purpose of the data bank will be twofold: (1) to supply the
information neede :?),' administrators, educators, and researchers who are
concerned with the evaluation and suture development of the community
junior college; (2) to provide data for the vlrious federal, regional,
and state agencies which are concerned with the problems of policy forma-
tion and program development in the junior colleges.
In order to meet its objectives, the project included the following
activities:
(1) Interviews with leaders and experts in the juniorcollege field to obtain their assessment of the objec-tives, problems, needs, and processes important to thecontinued development of the junior college and to ob-tain their perceptions of the quantitative informationneeded to clarify and assist in dealing with these
issues.
(2) An analytical review of the literature on juniorcolleges to determine further the issues and variablesrelevant to the development and evaluation of junior
colleges.
(3) In-depth case studies of 15 different types ofjunior colleges to assess the dynamics of junior col-leges and to determine those variables important tothe understanding of these dynamics.

(4) The development, pretesting, and justification ofa prototypic Junior College Supplement to the HigherEducation General Information Survey (HMIS) system.
(5) The development of a series of measurements anditems contained in comprehensive prototypic surveyinstruments for use of future evaluation research onjunior colleges.
Volume I contains the analytic review of the literature on junior
colleges. Volume II contains the results of the case studies and con-
comitant s nveys, and the administrative interviews; tables and other
appendix materials related to Volume II are bound separately in the
present Volume ILA: Technical Appendixes. The measurements and instru-
mentation derived fnan the project for future evaluation surveys comprise
Volume III. The HEGIS Junior College Supplement has been submitted to
the Office of Education separately.
The following staff members at UCLA were on the Advisory Committee
for The Study of Junior Colleges and contributed to the initial implementa-
tion of the project: Arthur M. Cohen, Associate Professor of Higher Edu-
cation; Principal Investigator and Director, ERIC Clearinghouse for Junior
Colleges; Richard D. Howe, Assistant Executive Director, League for Inno-
vation in the Community College; Director, UCLA Junior College Leadership
Program; and C. Robert Pace, Professor of Higher Education; Director, Higher
Education Evaluation Program, Center for the Study of Evaluation.
Dr. John Lombardi of UCLA's ERIC Clearinghouse for Junior Colleges
graciously contributed to the development of the project's interview sched-
ule for administrators. He also chaired the "Santa Fe Revisited" conference
which was sponsored by the project to obtain inputs from major leaders of
the junior college movement who originally presented their ideas in a series
of discussions at Santa Fe College under the coordination of Joseph Fordyce.
The participants of this conference are also gratefully acknowledged.
William Keim, former Assistant Superintendent of Cormunity Services,
Cerritos College, and current Chairman of the Community Services Committee
of the American Association of Junior Colleges, helped in the preparation of
instrument items relating to community services. Jane Matson, Professor of
Guidance and Counseling, California State University, Los Angeles, assisted
The Study of Junior Colleges staff in the development of the counselor ques-
tionnaire as well as with the selection of case-study sites. In addition,
iv
two project staff members visited the National Laboratory for Higher Educa-
tion to discuss matters of sampling and survey techniques and selection of
case-study schools with various NLHE staff, and in particular with John
Roueche, who was at that time Director of the Junior and Community College
Division.
A number of other agencies were likewise consulted, such as the ERIC
Clearinghouse for Junior Colleges, UCLA, whose files were ufed extensively
in preparing the literature review (a major determinant of items included
in the survey forms) and the UCLA Survey Research Center which offered sug-
gestions regarding sampling techniques, questionnaire construction, and
survey prccedures.
A number of experts in the field were most helpful in their review of
the HEGIS supplement. These included Dorothy Knoell, Dennis J. Jones,
Charles R. Walker, William Mbrsch, and Edmund Gleazer.
Outstanding supporting staff members included Barbara Vizents, Jan
Newmark, Lenois Stovall, Vera Law ley, Janet Katano, Irene Chow, and, most
particularly, Lenore Korchek. Jane C. Beer was most helpful in preparing
the project's volumes for publication. Winston Doby and Robert Collins
graciously assisted with the site vif'ts. Richard Seligman, Associate
Director of the UCLA Center for the Study of Evaluation, was most helpful
in directing the Center's resources towards the successful completion of
the project.
The extensive project could not have been completed without the excep-
tional talent and roanitment of the research staff. These included Patrick
Breslin, Barbara Dorf, Robert Fitch (who initiated the early coordination
of the project), Ronald Hart, Janet Hoel, Roberta Malmgren, Ann Morey, and
Clare Rose. Clarence Bradford and Ricardo Klorman were indispensable in
their overseeing the data analyses. Ernest Scalberg was equally indispen-
sable in his direction of the sub-project focussed on the development and
pretesting of the HEGIS supplement. Above all, appreciation is extended
to Michael Gaffney and Felice Kaman who directed the project during its
inevitably difficult and complex stages.
James W. TrentPrincipal Investigator
v
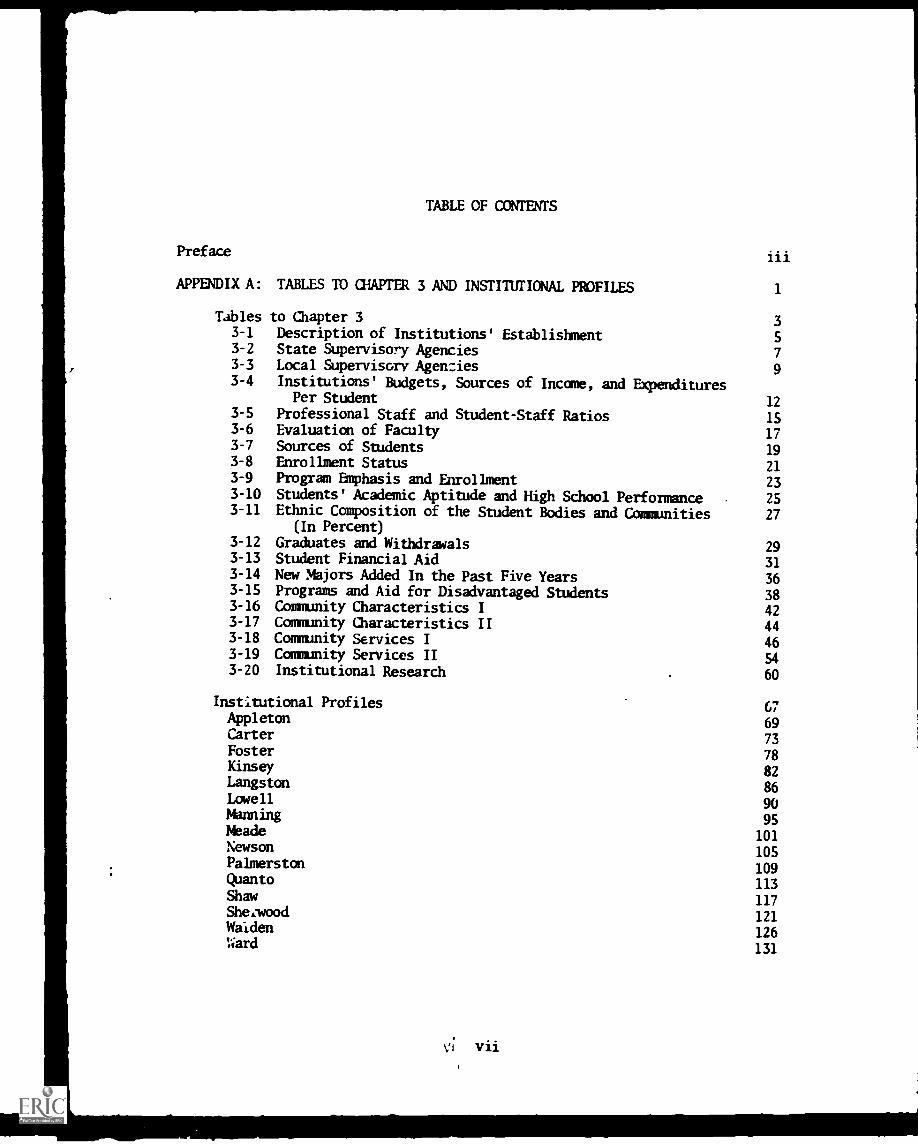
TABLE OF CONTENTS
Preface
APPENDIX A: TABLES TO CHAPTER 3 AND INSTITUTIONAL PROFILES
i i i
1
Tables to Chapter 3 33-1 Description of Institutions' Establishment S3-2 State Supervisory Agencies 73-3 Local Supervisory Agenzies 93-4 Institutions' Budgets, Sources of Income, and Expenditures
Per Student 123-5 Professional Staff and Student-Staff Ratios 153-6 Evaluation of Faculty 173-7 Sources of Students 193-8 Enrollment Status 213-9 Program Emphasis and Enrollment 233-10 Students' Academic Aptitude and High School Performance 253-11 Ethnic Composition of the Student Bodies and Communities 27
(In Percent)3-12 Graduates and Withdrawals 293-13 Student Financial Aid 313-14 New Majors Added In the Past Five Years 363-15 Programs and Aid for Disadvantaged Students 383-16 Community Characteristics I 423-17 Community Characteristics II 443-18 Community Services I 463-19 Community Services II 543-20 Institutional Research 60
Institutional Profiles 67Appleton 69Carter 73Foster 78Kinsey 82Langston 86Lowell 90ginning 95Meade 101Newson 105Palmerston 109Quanto 113Shaw 117She:wood 121Walden 126Ward 131
v; vii
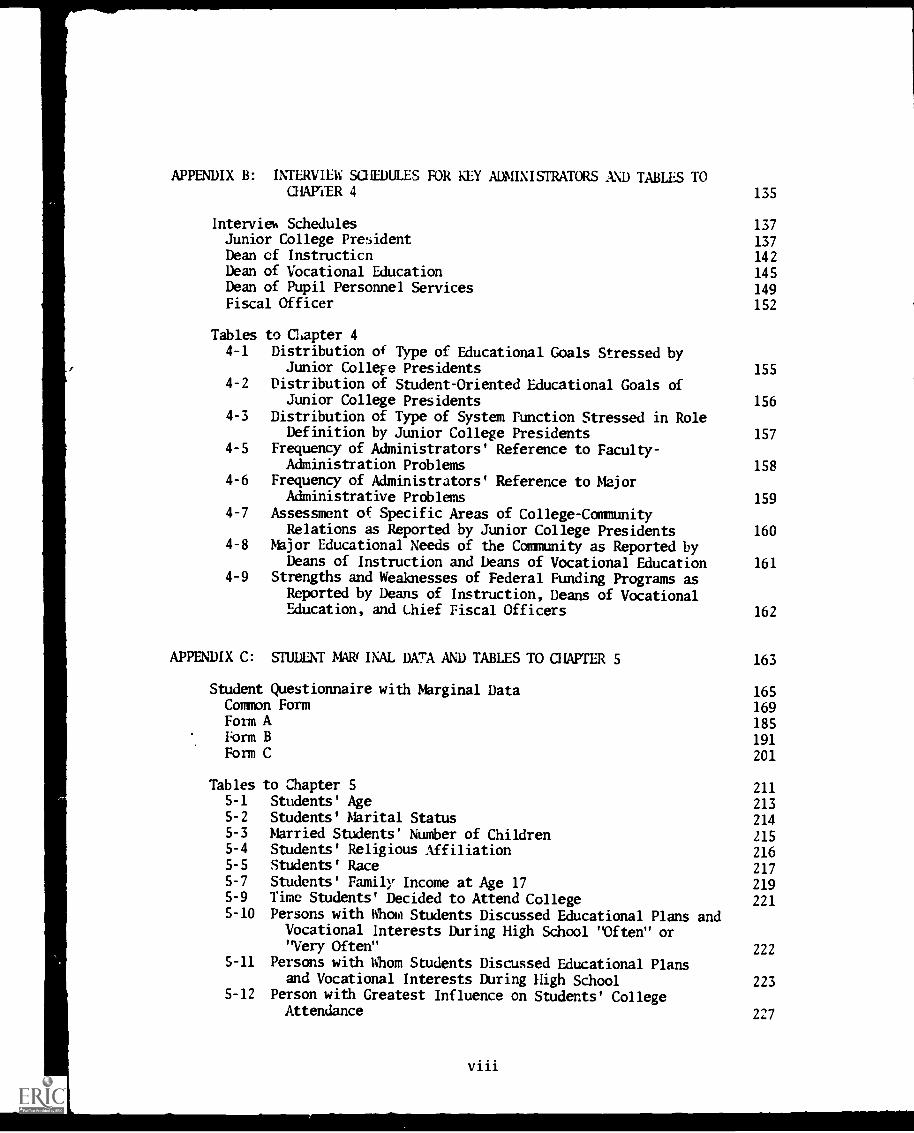
APPENDIX B: INTERVIEWaREDULES FOR KEY ADMINISTRATORS AND TABLES TOCHAPTER 4 135
Intervieu Schedules 137Junior College President 137Dean of Instructicn 142Dean of Vocational Education 145Dean of Pupil Personnel Services 149Fiscal Officer 152
Tables to Clapter 44-1 Distribution of Type of Educational Goals Stressed by
Junior College Presidents 1554-2 Distribution of Student-Oriented Educational Goals of
Junior College Presidents 1564-3 Distribution of Type of System Function Stressed in Role
Definition by Junior College Presidents 1574-5 Frequency of Administrators' Reference to Faculty-
Administration Problems 1584-6 Frequency of Administrators' Reference to Major
Administrative Problems 1594-7 Assessment of Specific Areas of College-Community
Relations as Reported by Junior College Presidents 1604-8 Major Educational Needs of the Community as Reported by
Deans of Instruction and Deans of Vocational Education 1614-9 Strengths and Weaknesses of Federal Funding Programs as
Reported by Deans of Instruction, Deans of VocationalEducation, and Chief Fiscal Officers 162
APPENDIX C: STUDENT MARGINAL DATA AND TABLES TO CHAPTER 5 163
Student Questionnaire with Marginal Data 165Common Form 169Form A 185Form B 191Form C 201
Tables to Chapter 5 2115-1 Students' Age 2135-2 Students' Marital Status 2145-3 Married Students' Number of Children 2155-4 Students' Religious Affiliation 2165-5 Students' Race 2175-7 Students' Family Income at Age 17 2195-9 Time Students' Decided to Attend College 2215-10 Persons with Whom Students Discussed Educational Plans and
Vocational Interests During High School "Often" or"Very Often" 222
5-11 Persons with Whom Students Discussed Educational Plansand Vocational Interests During High School 223
5-12 Person with Greatest Influence on Students' CollegeAttendance 227
viii
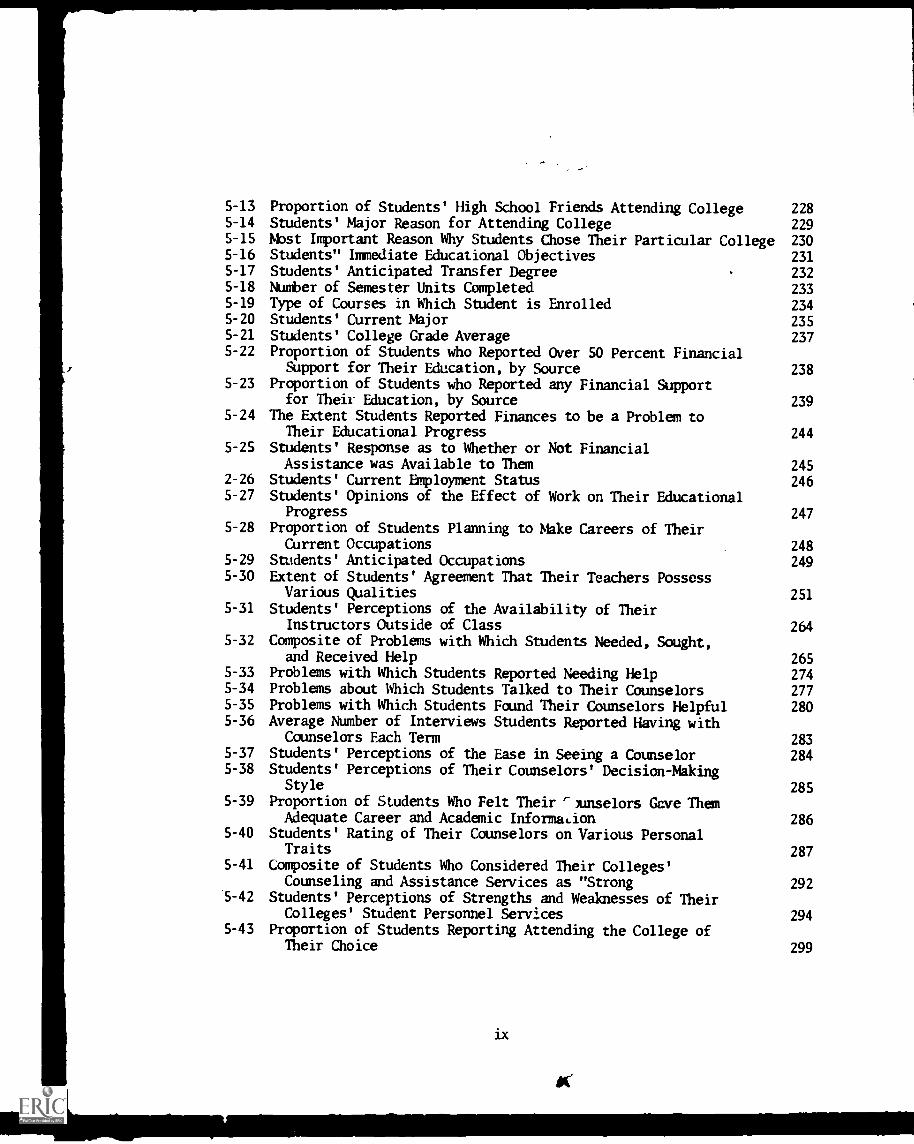
5-13 Proportion of Students' High School Friends Attending College 2285-14 Students' Major Reason for Attending College 2295-15 lbst Important Reason Why Students Chose Their Particular College 2305-16 Students" Immediate Educational Objectives 2315-17 Students' Anticipated Transfer Degree 2325-18 Number of Semester Units Completed 2335-19 Type of Courses in Which Student is Enrolled 2345-20 Students' Current Major 2355-21 Students' College Grade Average 2375-22 Proportion of Students who Reported Over 50 Percent Financial
Support for Their Education, by Source 2385-23 Proportion of Students who Reported any Financial Support
for Their Education, by Source 2395-24 The Extent Students Reported Finances to be a Problem to
Their Educational Progress 2445-25 Students' Response as to Whether or Not Financial
Assistance was Available to Them 2452-26 Students' Current Employment Status 2465-27 Students' Opinions of the Effect of Work on Their Educational
Progress 2475-28 Proportion of Students Planning to Make Careers of Their
Current Occupations 2485-29 Students' Anticipated Occupations 2495-30 Extent of Students' Agreement That Their Teachers Possess
Various Qualities 2515-31 Students' Perceptions of the Availability of Their
Instructors Outside of Class 2645-32 Composite of Problems with Which Students Needed, Sought,
and Received Help 2655-33 Problems with Which Students Reported Needing Help 2745-34 Problems about Which Students Talked to Their Counselors 2775-35 Problems with Which Students Found Their Counselors Helpful 2805-36 Average Number of Interviews Students Reported Having with
Counselors Each Term 2835-37 Students' Perceptions of the Ease in Seeing a Counselor 2845-38 Students' Perceptions of Their Counselors' Decision- Making
Style 2855-39 Proportion of Students Who Felt Their r)unselors Gave Them
Adequate Career and Academic Information 2865-40 Students' Rating of Their Counselors on Various Personal
Traits 2875-41 Composite of Students Who Considered Their Colleges'
Counseling and Assistance Services as "Strong 292'5-42 Students' Perceptions of Strengths and Weaknesses of Their
Colleges' Student Personnel Services 2945-43 Proportion of Students Reporting Attending the College of
Their Choice 299
ix
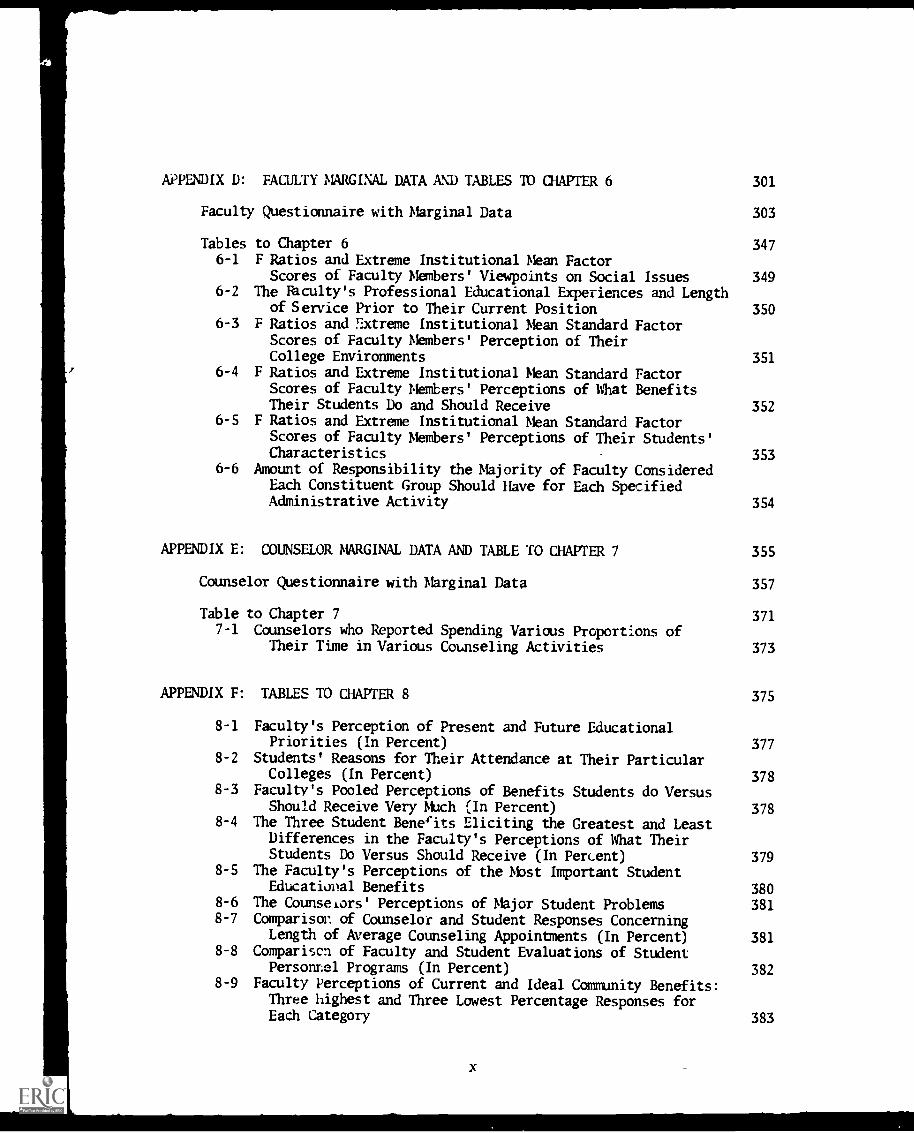
APPENDIX D: FACULTY MARGINAL DATA AND TABLES TO CHAPTER 6 301
Faculty Questionnaire with Marginal Data 303
Tables to Chapter 6 3476-1 F Ratios and Extreme Institutional Mean Factor
Scores of Faculty Members' Viewpoints on Social Issues 3496-2 The Faculty's Professional Educational Experiences and Length
of Service Prior to Their Current Position 3506-3 F Ratios and atreme Institutional Mean Standard Factor
Scores of Faculty Members' Perception of TheirCollege Environments 351
6-4 F Ratios and Extreme Institutional Mean Standard FactorScores of Faculty Members' Perceptions of What BenefitsTheir Students Do and Should Receive 352
6-5 F Ratios and Extreme Institutional Mean Standard FactorScores of Faculty Members' Perceptions of Their Students'Characteristics 353
6-6 Amount of Responsibility the Majority of Faculty ConsideredEach Constituent Group Should Have for Each SpecifiedAdministrative Activity 354
APPENDIX E: COUNSELOR MARGINAL DATA AND TABLE TO CHAPTER 7 355
Counselor Questionnaire with Marginal Data 357
Table to Chapter 7 3717-1 Counselors who Reported Spending Various Proportions of
Their Time in Various Counseling Activities 373
APPENDIX F: TABLES TO CHAPTER 8 375
8-1 Faculty's Perception of Present and Future EducationalPriorities (In Percent) 377
8-2 Students' Reasons for Their Attendance at Their ParticularColleges (In Percent) 378
8-3 Faculty's Pooled Perceptions of Benefits Students do VersusShould Receive Very Much (In Percent) 378
8-4 The Three Student Benerits Eliciting the Greatest and LeastDifferences in the Faculty's Perceptions of What TheirStudents Do Versus Should Receive (In Percent) 379
8-5 The Faculty's Perceptions of the Nbst Important StudentEducational Benefits 380
8-6 The CounseLors' Perceptions of Major Student Problems 3818-7 Comparison of Counselor and Student Responses Concerning
Length of Average Counseling Appointments (In Percent) 3818-8 Comparison of Faculty and Student Evaluations of Student
Personnel Programs (In Percent) 3828-9 Faculty Perceptions of Current and Ideal Community Benefits:
Three highest and Three Lowest Percentage Responses forEach Category 383
8-11 Faculty Ratings of Instructor Qualifications (In Percent) 385
APPENDIX G: FORM LETTERS SENT TO SURVEY SUBJECTS 387
Letter to Students from College President 389Letter to Students from Project Director 390Letter to Faculty from College President 391Letter to Faculty from Project Director 392Letter to Counselors from College President 393Letter to College Staff Members Supervising Follow-Up of
Student Non-Respondents 394
xi

'APPENDIX A
TABLES TO CHAPTER 3
AND
INSTIMTIONAL PROFILES
-3-
TABLES TX) CHAPTER 3
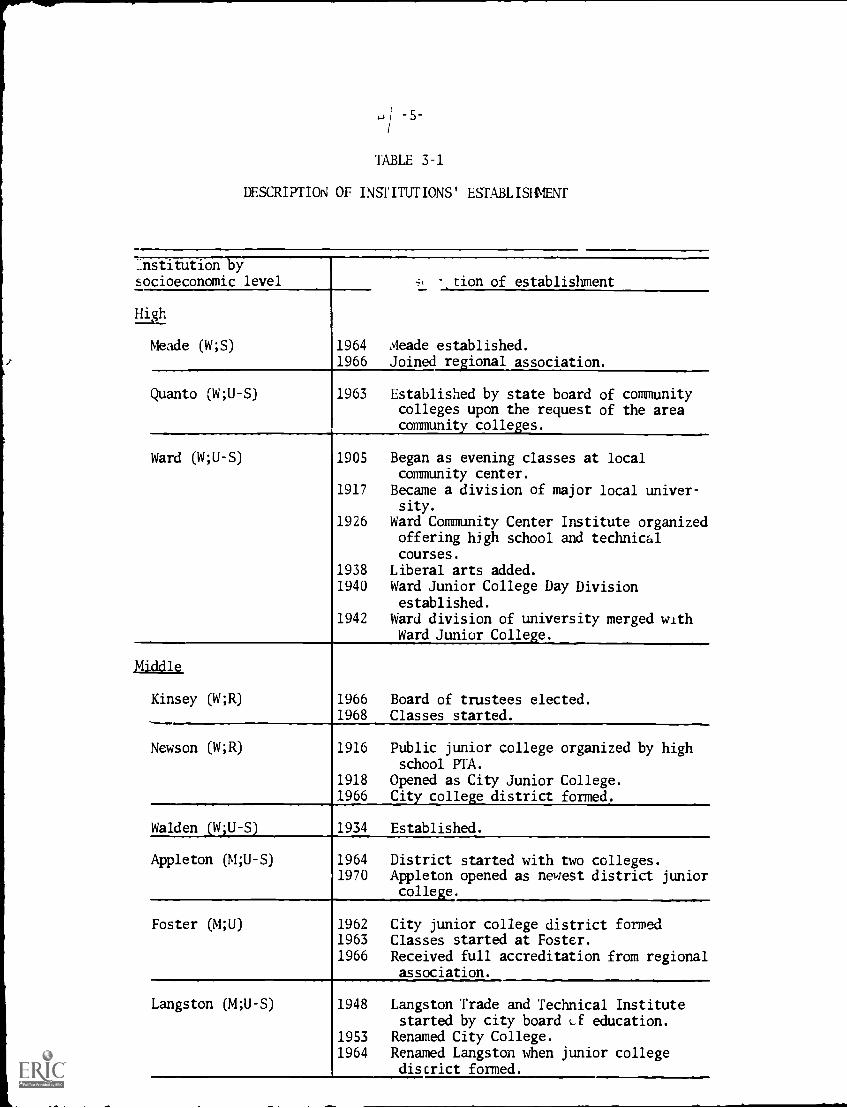
TABLE 3-1
DESCRIPTION OF INSTITUTIONS' ESTABLISHMENT
:nstitution .ysocioeconomic level
High
Meade (W;S)
-tion of establishment
1964 Meade established.1966 Joined regional association.
Quanto (W;U-S) 1963 Established by state board of communitycolleges upon the request of the areacommunity colleges.
Ward (W;U-S) 1905 Began as evening classes at localcommunity center.
1917 Became a division of major local univer-sity.
1926 Ward Community Center Institute organizedoffering high school and technicalcourses.
1938 Liberal arts added.1940 Ward Junior College Day Division
established.1942 Ward division of university merged with
Ward Junior College.
Middle
Kinsey (W;R)
Newson (W;R)
1966 Board of trustees elected.1968 Classes started.
1916 Public junior college organized by highschool PTA.
1918 Opened as City Junior College.1966 City college district formed.
Walden (W;U-S)
Appleton (M;U-S)
1934 Established.
1964 District started with two colleges.1970 Appleton opened as newest district junior
college.
Foster (M;U) 1962 City junior college district formed1963 Classes started at Foster.1966 Received full accreditation from regional
association.
Langston (M;U-S) 1948 Langston Trade and Technical Institutestarted by city board LE education.
1953 Renamed City College.1964 Renamed Langston when junior college
district formed.
-6-
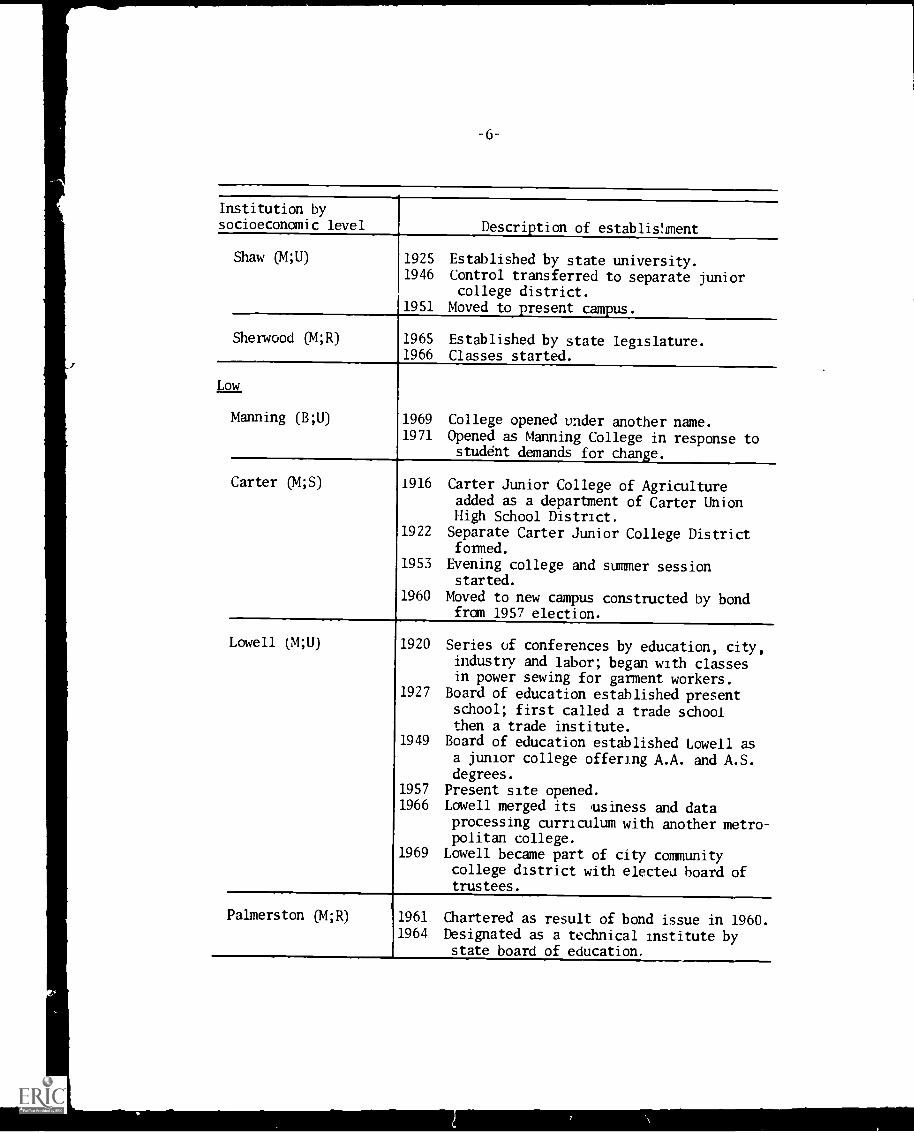
Institution bysocioeconomic level Description of establishment
Shaw (M;U) 1925 Established by state university.1946 Control transferred to separate junior
college district.1951 Moved to present campus.
Sherwood (M;R) 1965 Established by state legislature.1966 Classes started.
Low
Manning (B;U) 1969 College opened under another name.1971 Opened as Manning College in response to
student demands for change.
Carter (M;S) 1916 Carter Junior College of Agricultureadded as a department of Carter UnionHigh School District.
1922 Separate Carter Junior College Districtformed.
1953 Evening college and summer sessionstarted.
1960 Moved to new campus constructed by bondfrom 1957 election.
Lowell (M;U) 1920 Series of conferences by education, city,industry and labor; began with classesin power sewing for garment workers.
1927 Board of education established presentschool; first called a trade schoolthen a trade institute.
1949 Board of education established Lowell as
a junior college offering A.A. and A.S.degrees.
1957 Present site opened.1966 Lowell merged its usiness and data
processing curriculum with another metro-politan college.
1969 Lowell became part of city community
college district with elected board oftrustees.
Palmerston (M;R) 1961 Chartered as result of bond issue in 1960.1964 Designated as a technical institute by
state board of education.
-7-
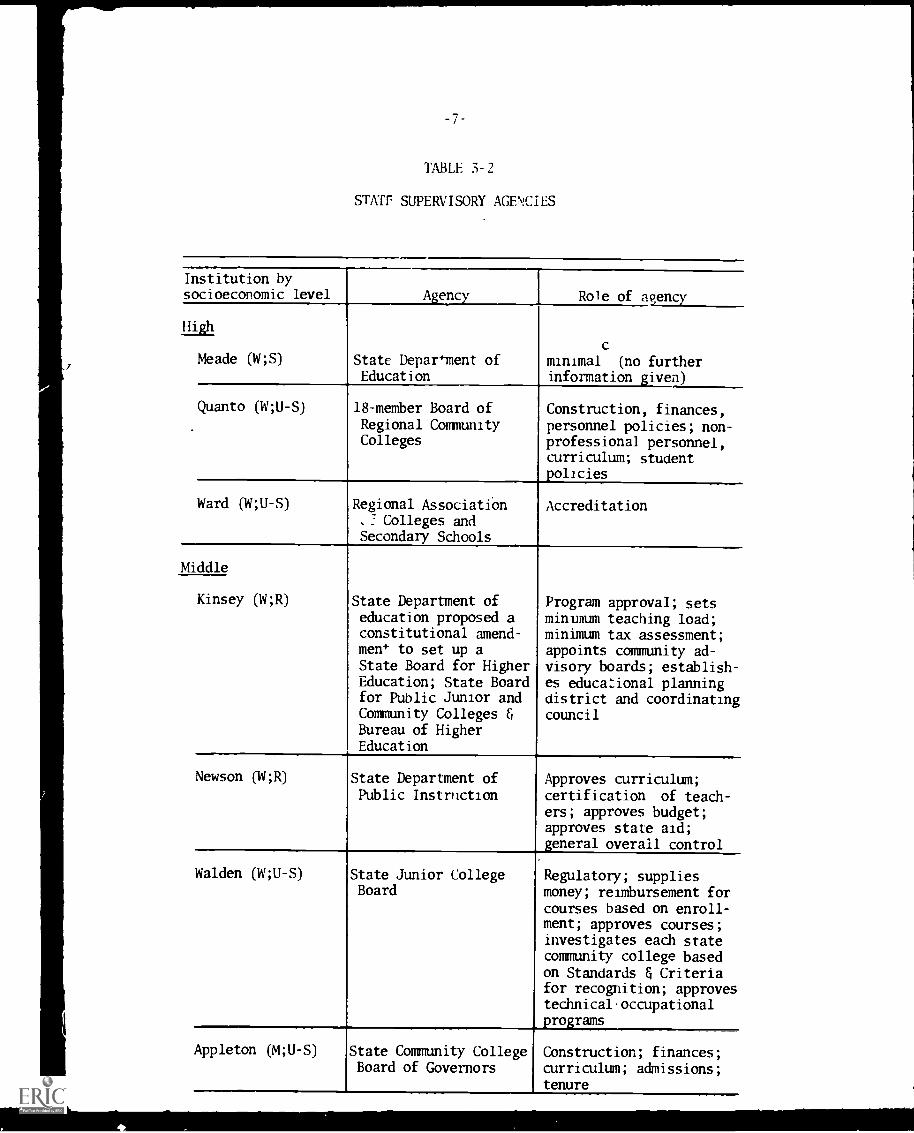
TABLE 3-2
STATE: SUPERVISORY AGENCIES
Institution bysocioeconomic level Agency Role of agency
High
Meade (4;S) State Department ofEducation
c
minimal (no furtherinformation given)
Quanto (W;U-S) 18-member Board of
Regional CommunityColleges
Construction, finances,personnel policies; non-professional personnel,curriculum; studentpolicies
Ward (W;U-S) Regional AssociationColleges and
Secondary Schools
Accreditation
Middle
Kinsey (W;R) State Department ofeducation proposed aconstitutional amend-ment to set up aState Board for HigherEducation; State Boardfor Public Junior andCommunity Colleges &Bureau of HigherEducation
Newson (W;R) State Department of
Public Instruction
Program approval; setsminimum teaching load;minimum tax assessment;appoints community ad-visory boards; establish-es educational planningdistrict and coordinatingcouncil
Approves curriculum;certification of teach-ers; approves budget;approves state aid;general overall control
Walden (W;U-S) State Junior CollegeBoard
Regulatory; suppliesmoney; reimbursement forcourses based on enroll-ment; approves courses;investigates each statecommunity college basedon Standards & Criteriafor recognition; approvestechnical-occupationalprograms
Appleton (M;U-S) State Community CollegeBoard of Governors
Construction; finances;curriculum; admissions;tenure
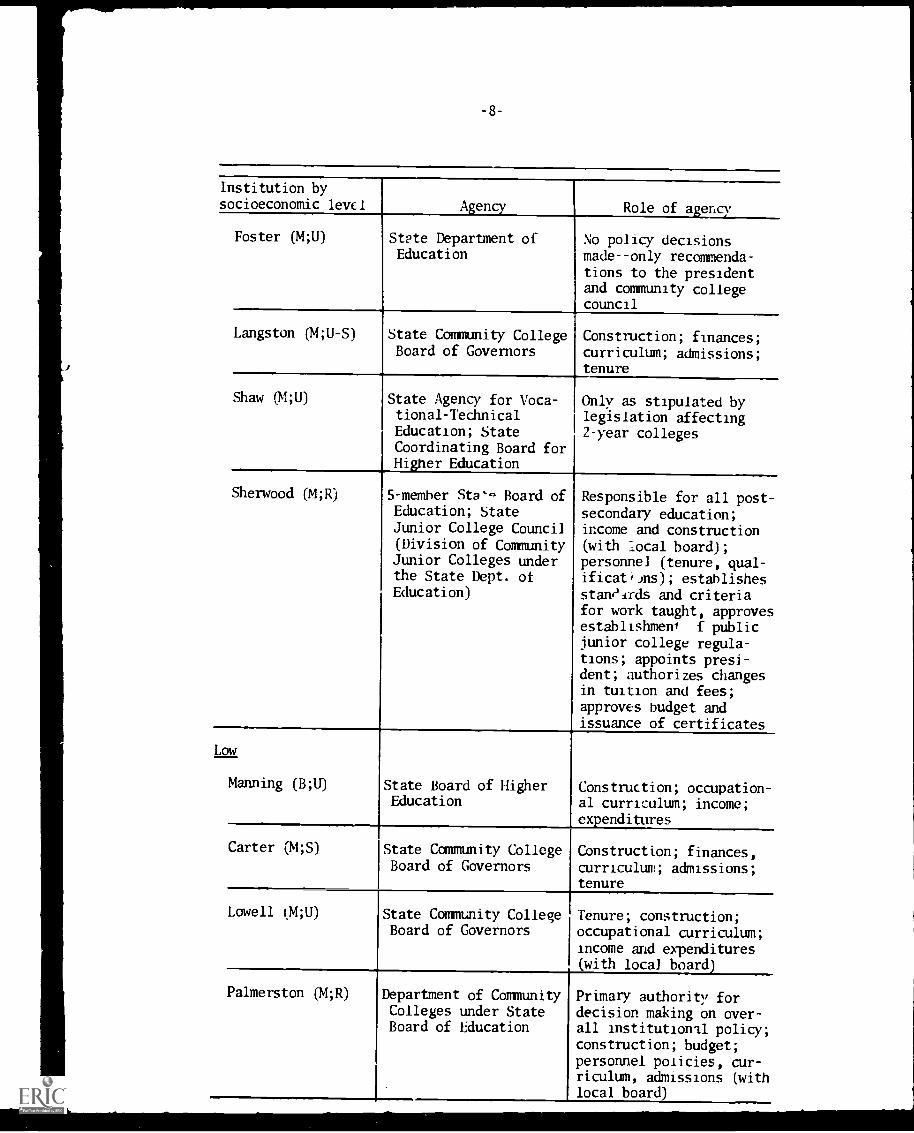
-8-
Institution bysocioeconomic level Agency
Foster (M;U) State Department ofEducation
Role of agency
No policy decisions
made--only recommenda-tions to the presidentand community collegecouncil
Langston (M;U-S) State Community CollegeBoard of Governors
Construction; finances;curriculum; admissions;tenure
Shaw (M;U) State Agency for Voca- Only as stipulated bytional-Technical legislation affectingEducation; State 2-year collegesCoordinating Board forHigher Education
Sherwood (M;R) 5-member Sta-- Board ofEducation; StateJunior College Council(Division of CommunityJunior Colleges underthe State Dept. ofEducation)
Responsible for all post-secondary education;income and construction(with local board);personnel (tenure, qual-ificatiins); establishesstandArds and criteriafor work taught, approvesestablishmew f publicjunior college regula-
tions; appoints presi-dent; authorizes changesin tuition and fees;approves budget andissuance of certificates
Low
Manning (B;U) State Board of HigherEducation
Construction; occupation-al curriculum; income;expenditures
Carter (M;S) State Community CollegeBoard of Governors
Construction; finances,curriculum; admissions;tenure
Lowell 04;U) State Community CollegeBoard of Governors
Tenure; construction;
occupational curriculum;income and expenditures(with local board)
Palmerston (M;R) Department of CommunityColleges under StateBoard of Education
Primary authority fordecision making on over-all institutional policy;construction; budget;personnel policies, cur-riculum, admissions (withlocal board)
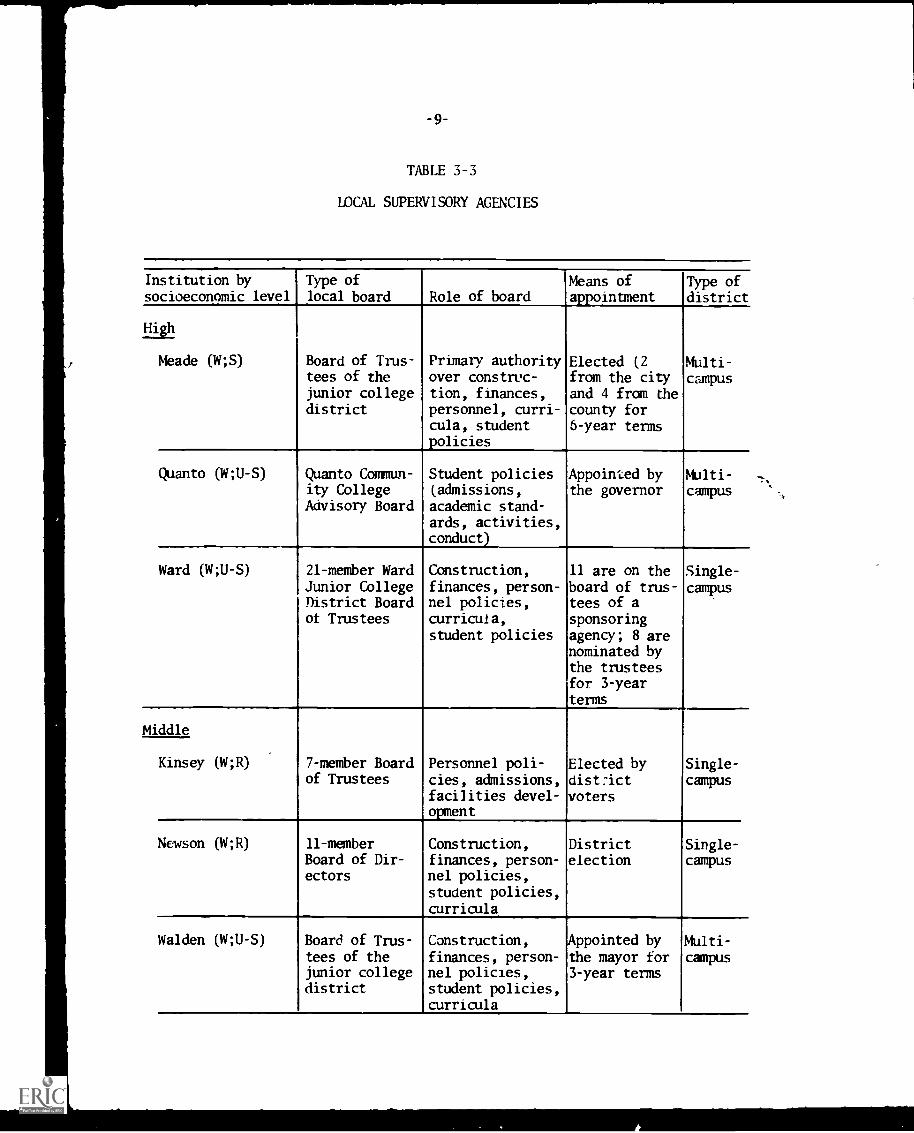
-9-
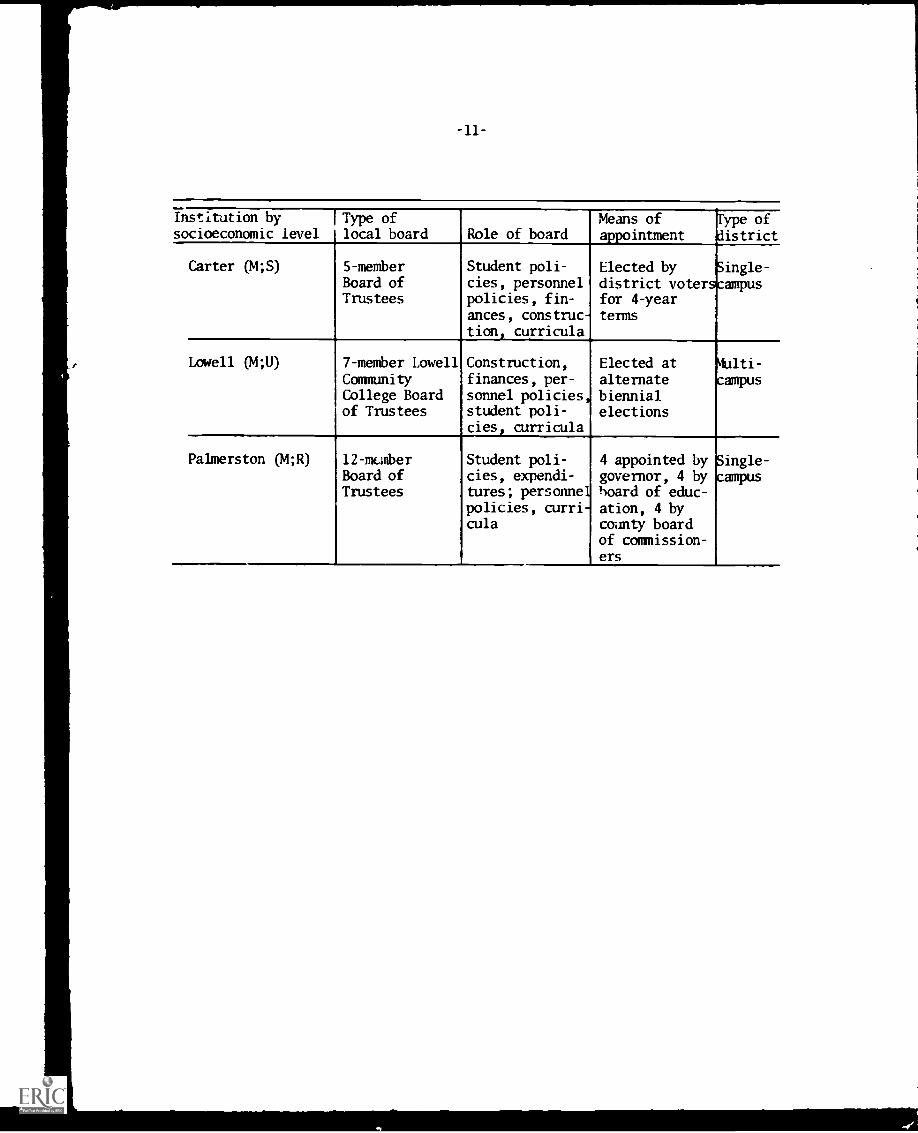
TABLE 3-3
LOCAL SUPERVISORY AGENCIES
Institution by I
socioeconomic levelType oflocal board Role of board
Means ofappointment
Type ofdistrict
High
Meade (W;S) Board of Trus-tees of thejunior collegedistrict
Primary authorityover constn'c-tion, finances,personnel, curri-cula, studentpolicies
Elected (2from the cityand 4 from thecounty for6-year terms
Multi-campus
Quanto (W;U-S) Quanto Commun-ity CollegeAdvisory Board
Student policies(admissions,
academic stand-ards, activities,conduct)
Appointed bythe governor
MUlti-campus
Ward (W;U-S) 21-member WardJunior CollegeDistrict Boardof Trustees
Construction,finances, person-nel policies,curricula,student policies
11 are on theboard of trus-tees of asponsoringagency; 8 arenominated bythe trusteesfor 3-yearterms
Single-
campus
Middle
7-member Boardof Trustees
Personnel poli-cies, admissions,facilities devel-o ent
Elected bydistrictvoters
Single-campus
Kinsey (W;R)
Newson (W;R) 11-memberBoard of Dir-ectors
Construction,finances, person-nel policies,student policies,curricula
Districtelection
Single-campus
Walden (W;U-S) Board of Trus-tees of thejunior collegedistrict
Construction,finances, person-nel policies,student policies,curricula
Appointed bythe mayor for3-year terms
Multicampus
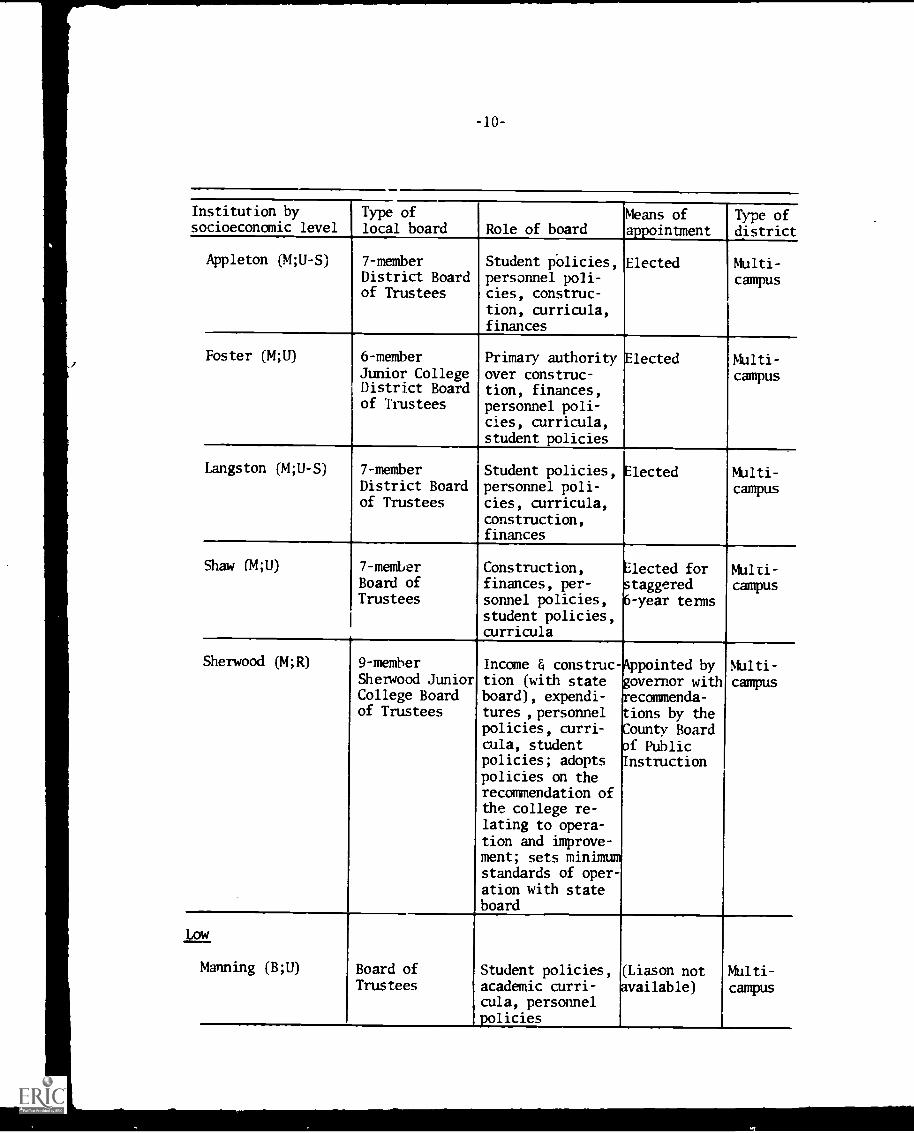
-10-
Institution bysocioeconomic level
Type oflocal board Role of board
Appleton (M;U-S) 7-memberDistrict Boardof Trustees
Student Policiespersonnel poli-cies, construc-tion, curricula,finances
Means ofappointment
Elected
Type ofdistrict
Multi-campus
Foster (M;U) 6-memberJunior CollegeDistrict Boardof Trustees
Primary authorityover construc-tion, finances,personnel poli-cies, curricula,student policies
Elected
Langston (M;U-S) 7-memberDistrict Boardof Trustees
Student policies,personnel poli-cies, curricula,construction,finances
Elected
Shaw (4;U) 7-memberBoard ofTrustees
Construction,finances, per-sonnel policies,student policies,curricula
Elected forstaggered6-year terms
Multi-campus
Multi-campus
4-
Multicampus
Sherwood (M;R) 9-memberSherwood JuniorCollege Boardof Trustees
Income construc-tion (with stateboard), expendi-tures ,personnelpolicies, curri-cula, studentpolicies; adoptspolicies on therecommendation ofthe college re-lating to opera-tion and improve-ment; sets minimumstandards of oper-ation with stateboard
Appointed by Multigovernor with campusrecommenda-tions by theCounty Boardof PublicInstruction
Manning (B;U) Board ofTrustees
Student policies,academic curri-cula, personnelpolicies
(Liason not
available)
Multi-
campus
Institution bysocioeconomic level
Type oflocal board Role of board
Means ofappointment
Elected bydistrict voterscampusfor 4-yearterms
Type of/district
Single-Carter (4;S) S-memberBoard ofTrustees
Student poli-cies, personnelpolicies, fin-antes, construc-tion, curricula
Lowell (4;U) 7-member LowellCommunityCollege Boardof Trustees
Construction,finances, per-sonnel policies,student poli-cies, curricula
Elected atalternatebiennialelections
klulti-
campus
Palmerston (4;R) 12-memberBoard ofTrustees
Student poli-cies, expendi-tures; personnelpolicies, curri-cula
4 appointed bygovernor, 4 byhoard of educ-ation, 4 bycounty boardof commission-ers
Single-
campus
-12-
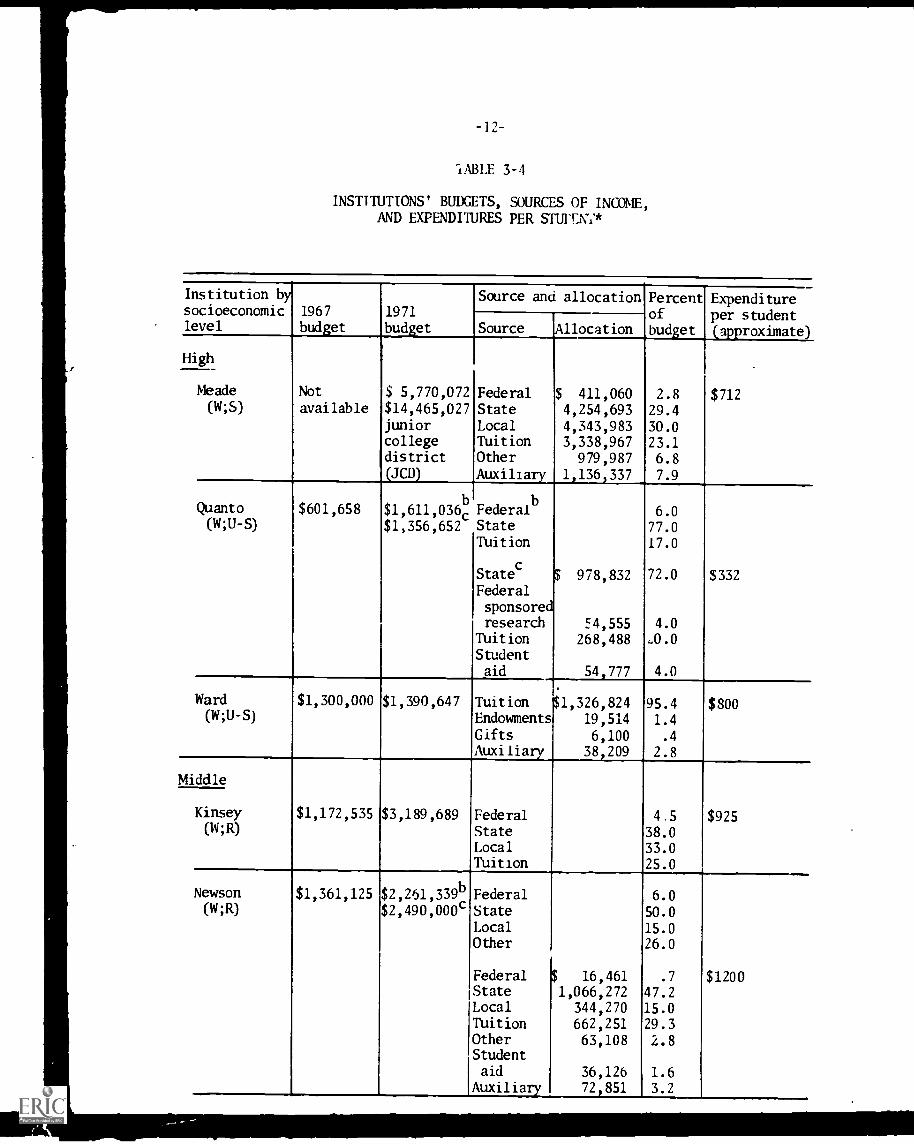
TABLE 3-4
INSTITUTIONS' BUDGETS, SOURCES OF INCOME,AND EXPENDITURES PER STUFEN'I'*
Institution bysocioeconomiclevel
1967
budget1971
budget
Source and allocation Percentofbudget
Expenditureper student(approximate)Source Allocation
High
Not $ 5,770,072 Federal $ 411,060 2.8 $712Meade(W;S) available $14,465,027 State 4,254,693 29.4
junior Local 4,343,983 30.0college Tuition 3,338,967 23.1district Other 979,987 6.8(JCD) Auxiliary 1,136,337 7.9
Quanto $601,658 $1,611,036cbFederal
b6.0
(W;U-S) $1,356,652 State 77.0Tuition 17.0
Statec
$ 978,832 72.0 $332Federal
sponsoredresearch E4,555 4.0
Tuition 268,488 .0.0Studentaid 54,777 4.0
Ward $1,300,000 $1,390,647 Tuition $1,326,824 95.4 $800(W;U-S) Endowments 19,514 1.4
Gifts 6,100 .4
Auxiliary 38,209 2.8
Middle
$1,172,535 $3,189,689 Federal 4.5 $925Kinsey(W;R) State 38.0
Local 33.0Tuition 25.0
Newson $1,361,125 $2,261,339b Federal 6.0(W;R) $2,490,000c State 50.0
Local 15.0Other 26.0
Federal 16,461 .7 $1200State 1,066,272 47.2Local 344,270 15.0Tuition 662,251 29.3Other 63,108 2.8Studentaid 36,126 1.6
Auxiliary 72,851 3.2
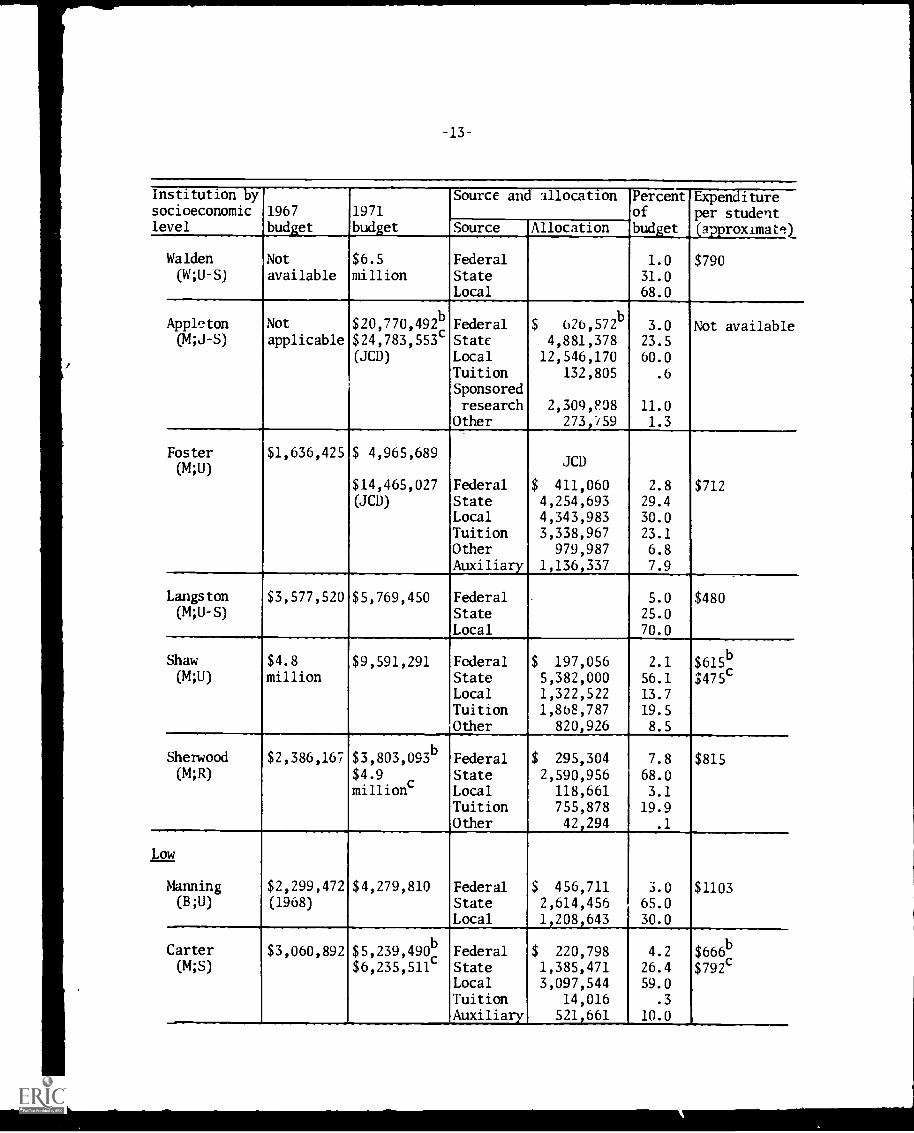
-13-
Institution by Source and allocation Percent Expendituresocioeconomic 1967 1971 of per studentlevel budget budget Source Allocation budget (approximate)
Walden Not $6.5 Federal 1.0 $790(W;U-S) available million State 31.0
Local 68.0
Appleton Not $20,770,492b Federal $ 626,572b 3.0 Not available(4;J-S) applicable $24,783,553c State 4,881,378 23.5
(JCD) Local 12,546,170 60.0Tuition 132,805 .6
Sponsoredresearch 2,309,808 11.0
Other 273,159 1.3
Foster(M;U)
$1,636,425 $ 4,965,689JCD
$14,465,027 Federal $ 411,060 2.8 $712(JCD) State 4,254,693 29.4
Local 4,343,983 30.0Tuition 3,338,967 23.1
Other 979,987 6.8Auxiliary 1,136,337 7.9
Langston $3,577,520 $5,769,450 Federal 5.0 $480(M;U-S) State 25.0
Local 70.0
Shaw $4.8 $9,591,291 Federal $ 197,056 2.1 $615b
(M;U) million State 5,382,000 56.1 $475cLocal 1,322,522 13.7Tuition 1,868,787 19.5Other 820,926 8.5
Sherwood $2,386,167 $3,803,093b Federal $ 295,304 7.8 $815(M;R) $4.9 State 2,590,956 68.0
millionc Local 118,661 3.1Tuition 755,878 19.9Other 42,294 .1
Low
Manning $2,299,472 $4,279,810 Federal $ 456,711 3.0 $1103(B;U) (1968) State 2,614,456 65.0
- Local 1,208,643 30.0
Carter $3,060,892 $5,239,490b Federal $ 220,798 4.2
_
$666b(M;S) $6,235,511c State 1,385,471 26.4 $792c
Local 3,097,544 59.0
Tuition 14,016 .3
Auxiliary 521,661 10.0
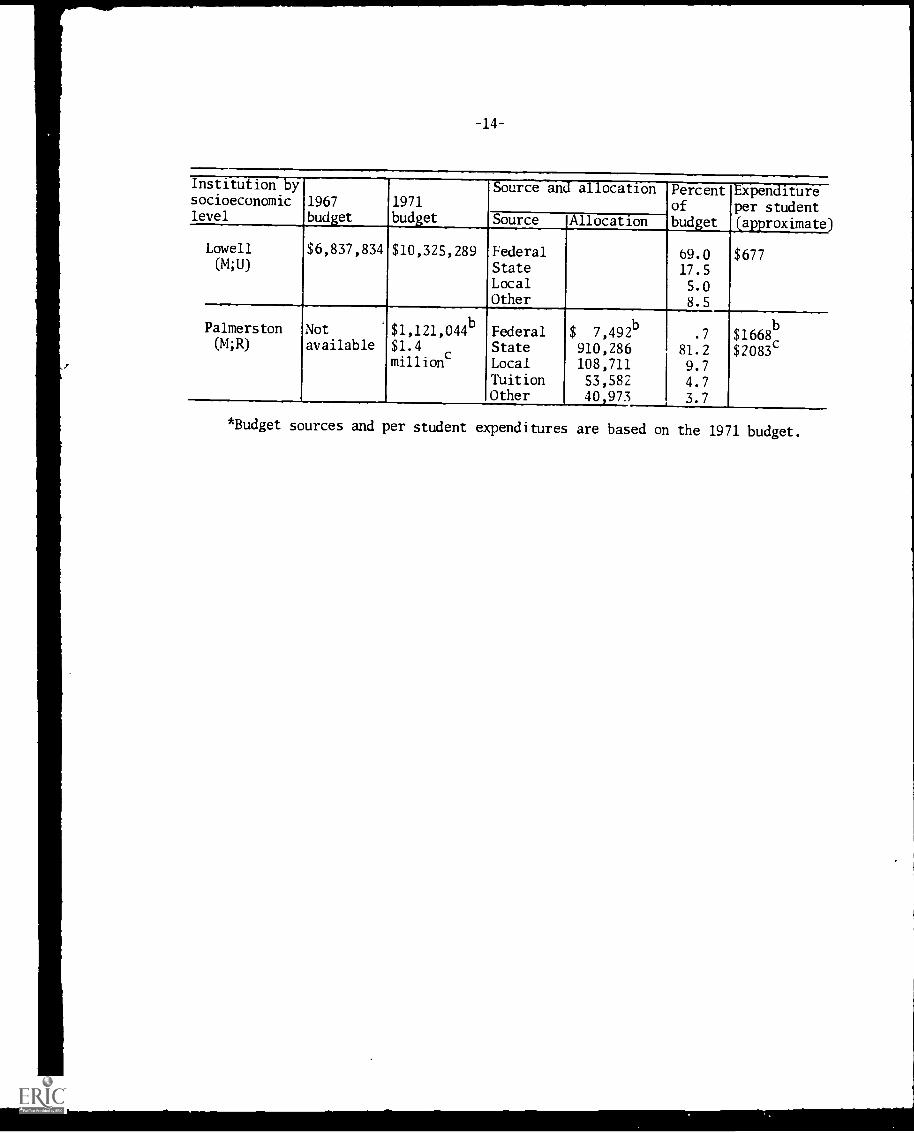
-14-
Institution bysocioeconomiclevel
1967bud &et
1971
budget
Source and allocation Percentofbudget
Expenditureper student(approximateSource Allocation
Lowell $6,837,834 $10,325,289 Federal 69.0 $677(4;U) State 17.5
Local 5.0Other 8.5
Palmerston Not $1,121,044b
Federal $ 7,492b
.7 $1668b
04;R) available $1.4 State 910,286 81.2 $2083cmillion Local 108,711 9.7
Tuition 53,582 4.7Other 40,973 3.7
*Budget sources and per student expenditures are based on the 1971 budget.
1
-15-
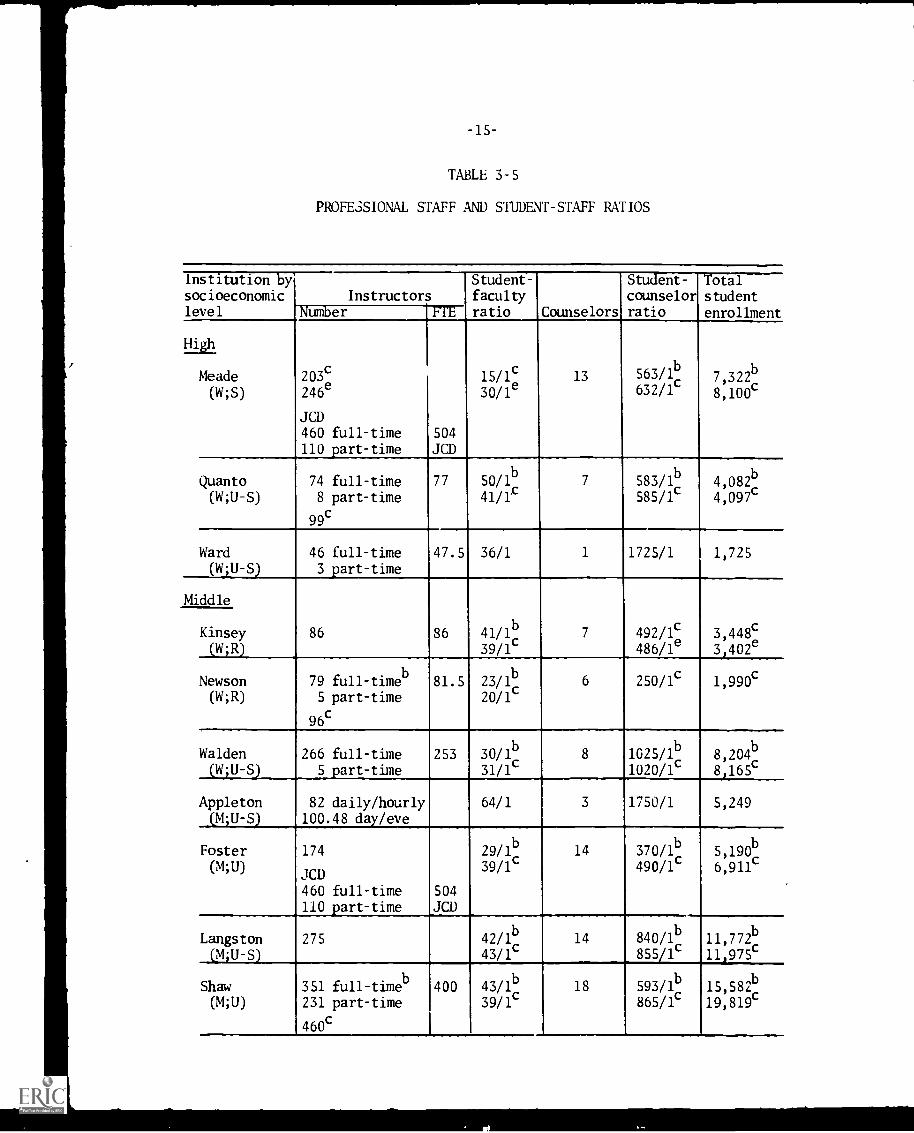
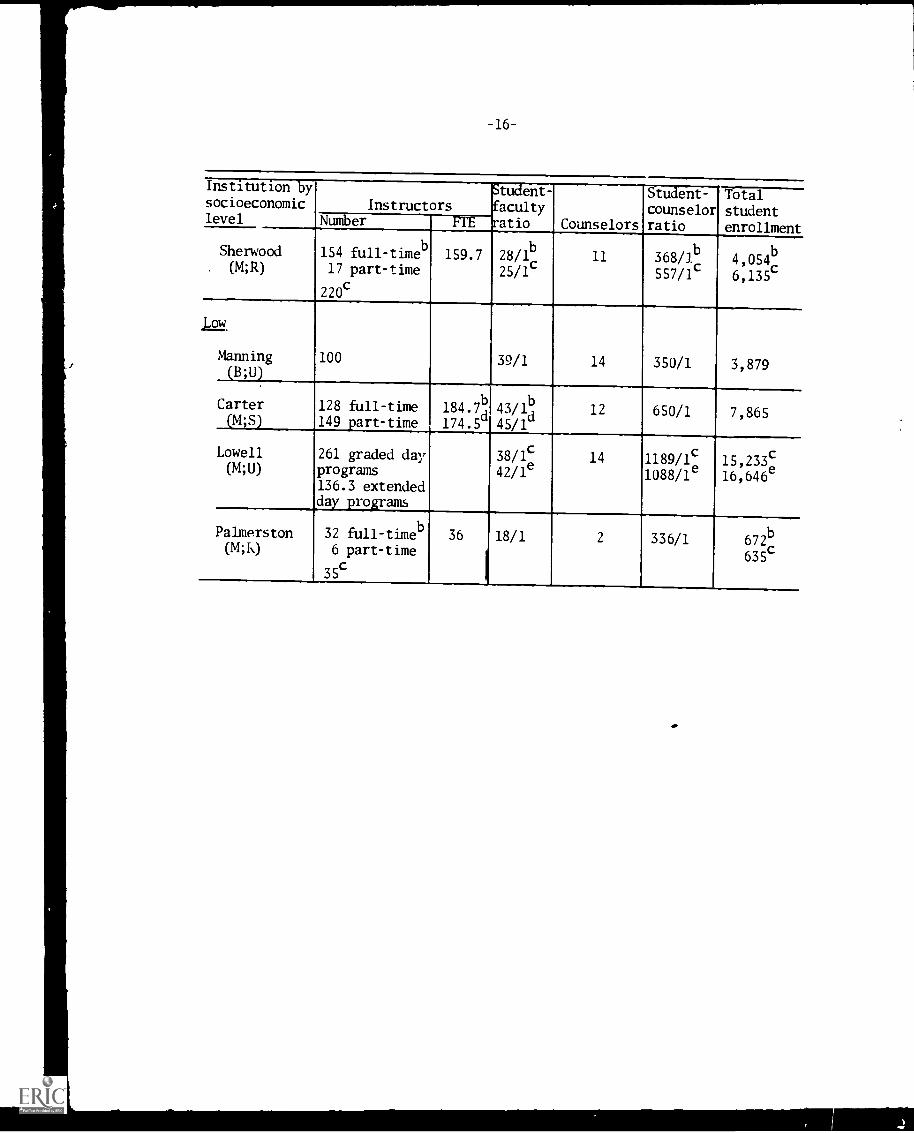
TABLE 3-5
PROFESSIONAL STAFF AND STUDENT-STAFF RATIOS
Institution bysocioeconomiclevel
InstructorsStudent-facultyratio Counselors
Student-counselorratio
TotalstudentenrollmentNumber FIE
High
203c
15/1c 13 563/1b
7322bMeade(W;S) 246
e
JCD
30/le 632/1- 8,100c
460 full-time 504
110 part -time JCD
Quanto 74 full-time 77 50/1b
7 583/1b
4,082b
(W;U-S) 8 part-time 41/1z 585/1c 4,097c99c
Ward 46 full-time 47.5 36/1 1 1725/1 1,725(W;U-S) 3 part-time
Middle
86 86 41/1b
7 492/1c 3,448cKinsey(W;R) 39/1c 486/le 3,402e
r
Newson 79 full-timeb
81.5 23/1b
6 250/1c 1,990c
(W;R) 5 part-time 20/1c
96c
Walden 266 full-time 253 30/1b
8 1025/1b
8,204b
(W;U-S.) 5 part-time 31/1c 1020/lc 8,165c
Appleton 82 daily/hourly 64/1 3 1750/1 5,249(M;U-S) 100.48 day/eve
Foster 174 29/1b 14 370/1b
5,190b
(M;U)JCD
39/1' 490/1c 6,911c
460 full-time 504110 part-time JCD
Langston 275 42/1b
14 840/1b
11,772b
(4;U-S) 43/1c 855/1c
Shaw 351 full-timeb
400 43/1b
18
,11,975c
593/1b
15,582b
(M;U) 231 part-time 39/1c 865/1c 19,819c
460c
-16-
Institution bysocioeconomiclevel
InstructorsStudent-
facultyratio Counselors
Student-counselorratio
Totalstudent
enrollmentNumber FTE
Sherwood 154 full-timeb
159.7 28/1b
11 368/1b
4,054b
. (M;R) 17 part-time 25/lc 557/1c 6,135c
220c
Low
100 39/1 14 350/1 3,879Manning(B ;U)
Carter 128 full-time 184.7 4 43/14 12 650/1 7,865(4;S) 149 part-time 174.5 45/1
Lowell 261 graded day 38/1c 14 1189/1c 15,233c(14;U) programs 42/le 1088/le 16,646e
136.3 extendedday programs
Palmerston 32 full-time 36 18/1 2 336/1 672b
MK) 6 part-time635
c
35c I
-17-
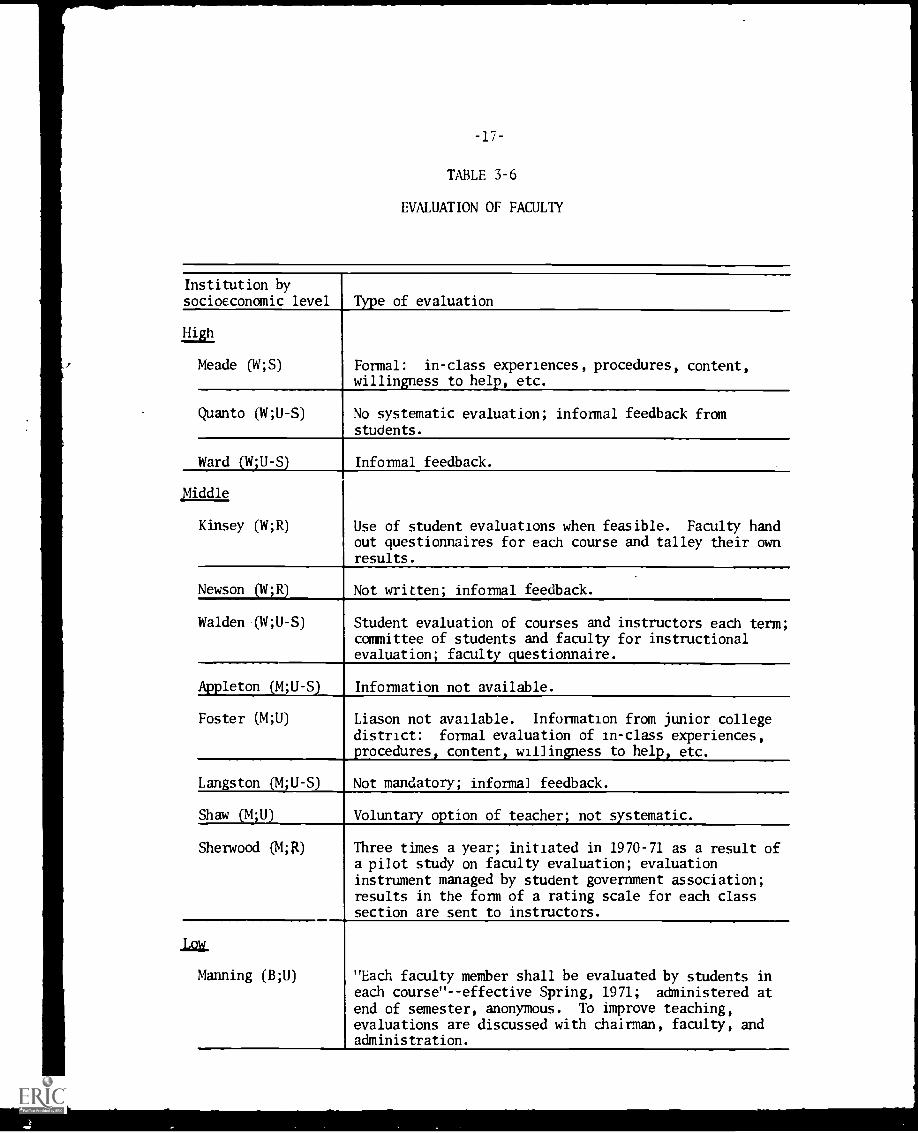
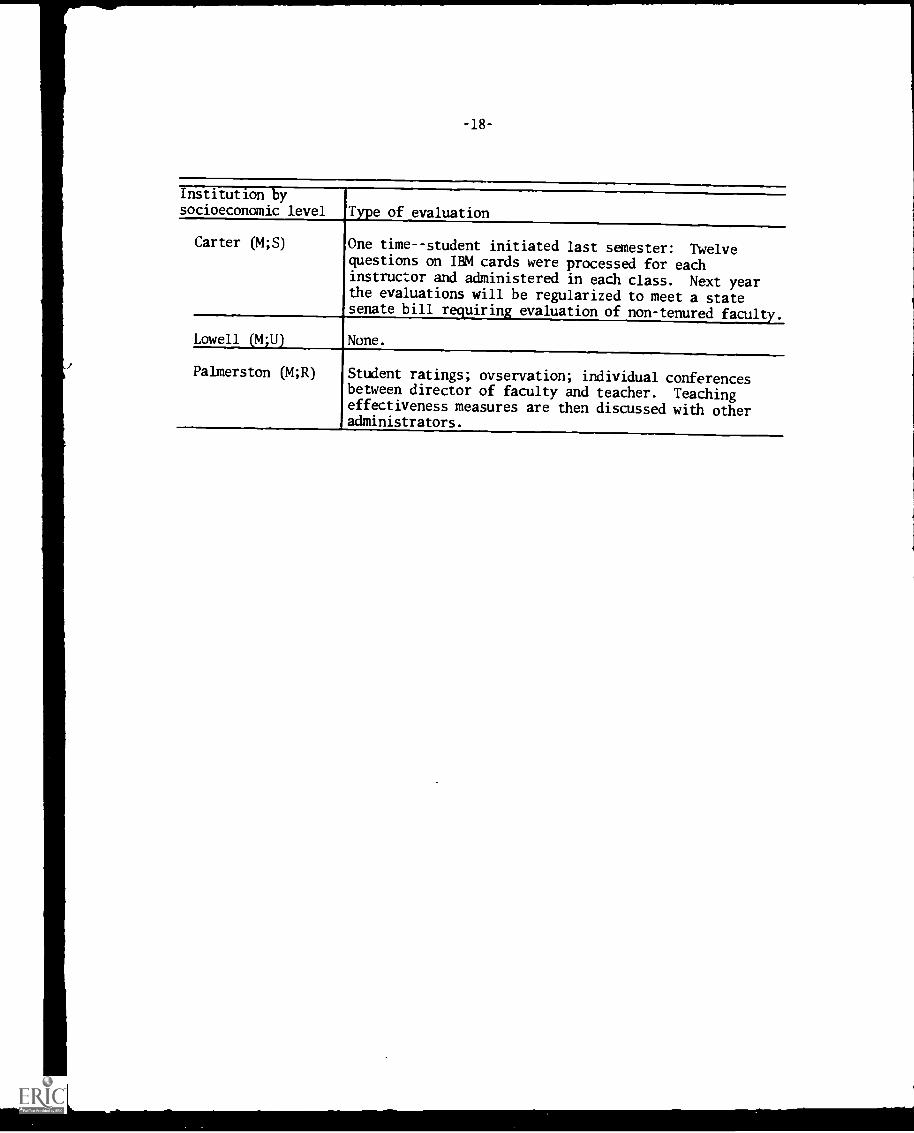
TABLE 3-6
EVALUATION OF FACULTY
Institution bysocioeconomic level Type of evaluation
High
Meade (W;S) Formal: in-class experiences, procedures, content,willingness to help, etc.
Quanto (W;U -S) No systematic evaluation; informal feedback fromstudents.
Ward (W;U-S) Informal feedback.
Middle
Kinsey (W;R) Use of student evaluations when feasible. Faculty handout questionnaires for each course and talley their ownresults.
Newson (W;R) Not written; informal feedback.
Walden (N;U-S) Student evaluation of courses and instructors each term;committee of students and faculty for instructionalevaluation; faculty questionnaire.
Appleton (M;U-S) Information not available.
Foster (14;U) Liason not available. Information from junior collegedistrict: formal evaluation of in-class experiences,procedures, content, willingness to help, etc.
Langston (M;U-S) Not mandatory; informal feedback.
Shaw (M;U)
Sherwood (4;R)
Voluntary option of teacher; not systematic.
Three times a year; initiated in 1970-71 as a result ofa pilot study on faculty evaluation; evaluationinstrument managed by student government association;results in the form of a rating scale for each classsection are sent to instructors.
Manning (B;U) "Each faculty member shall be evaluated by students ineach course"--effective Spring, 1971; administered atend of semester, anonymous. To improve teaching,evaluations are discussed with chairman, faculty, andadministration.
Institution bysocioeconomic level
Carter (4;S)
Lowell (M;U)
-18-
Type of evaluation
One time--student initiated last semester: Twelvequestions on IBM cards were processed for eachinstructor and administered in each class. Next yearthe evaluations will be regularized to meet a statesenate bill requiring evaluation of non-tenured faculty.
None.
Palmerston (M;R) Student ratings; ovservation; individual conferencesbetween director of faculty and teacher. Teachingeffectiveness measures are then discussed with otheradministrators.
-19-
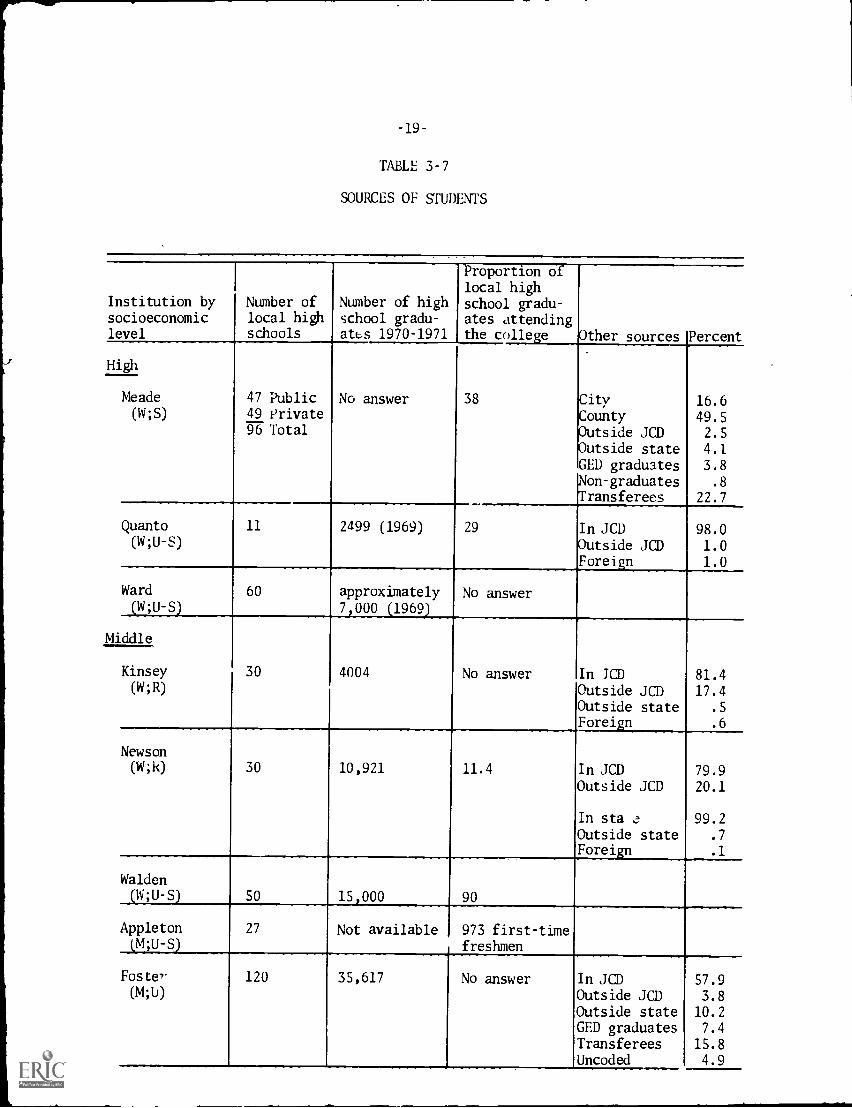
TABLE 3-7
SOURCES OF STUDENTS
Institution by Number ofsocioeconomic local highlevel schools
Number of highschool gradu-ates 1970-1971
Proportion oflocal highschool gradu-ates attendingthe college Other sources Percent
High
Meade
(W;S)
47 Public49 Private96 Total
No answer 38
Quanto(4;U-S)
Ward(W;U-S)
Middle
Kinsey(W; R)
11 2499 (1969) 29
CityCountyOutside JCDOutside stateGED graduatesNon-graduatesTransferees
16.649.5
2.54.1
3.8.8
22.7
60
30
approximately
7,000 (19691
4004
No answer
In JCD
Outside JCDForeign
98.01.01.0
No answer In JCD 81.4Outside JCD 17.4Outside state .5
Foreign .6
Newson
(k;k) 30 10,921 11.4 In JCDOutside JCD
In sta
Outside stateForeign
79.920.1
99.2.7
.1
Walden(N;U-S)
Appleton(M;U-S)
Foste-r
(M,U)
50 15,000 90
27 Not available 973 first-timefreshmen
120 35,617 No answer In JCD 57.9Outside JCD 3.8Outside state 10.2GED graduates 7.4
Transferees 15.8Uncoded 4.9
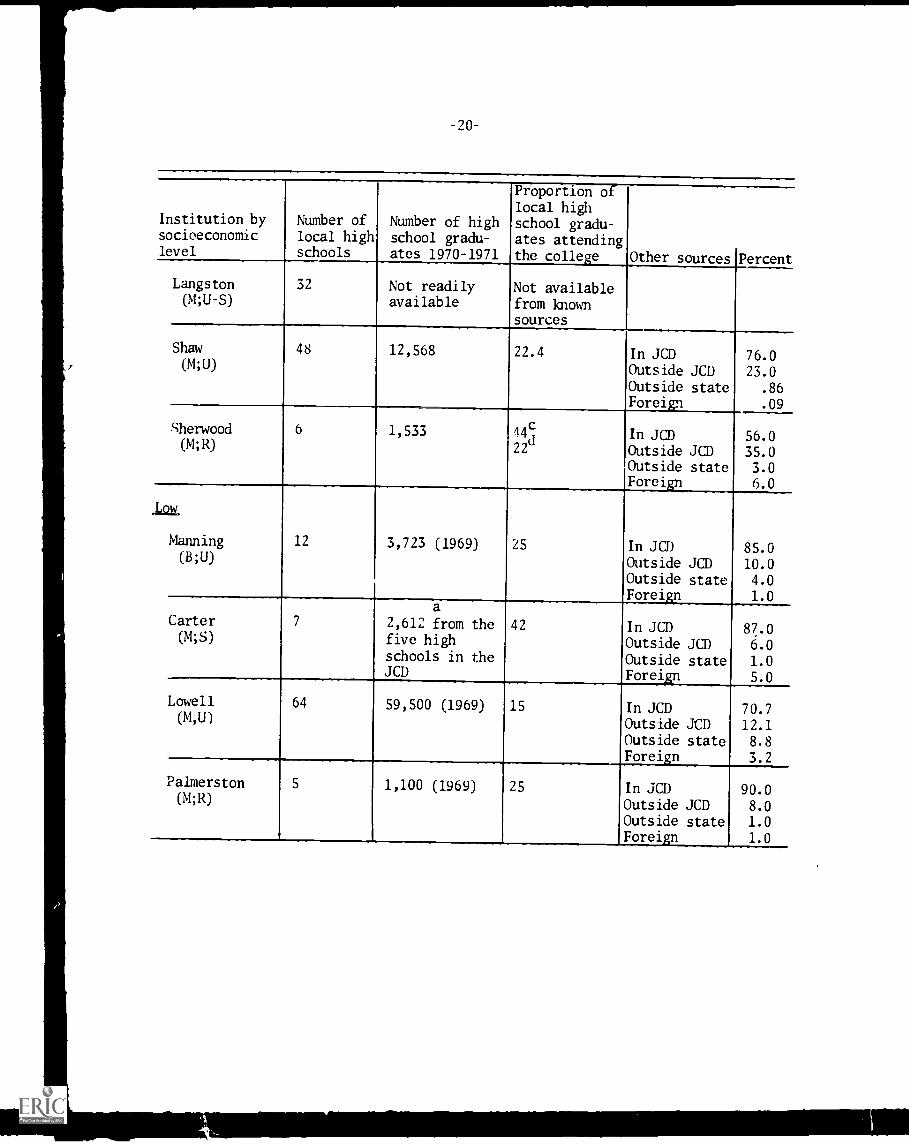
-20-
Proportion oflocal high
Institution by Number of Number of high school gradu-socioeconomic local high school gradu- ates attendinglevel schools ates 1970-1971 the college Other sources Percent
Langston(M;U-S)
32 Not readilyavailable
Not availablefrom knownsources
Shaw 48 12,568 22.4 In JCD 76.0(M;U) Outside JCD 23.0
Outside state .86Foreign .09
Sherwood 6 1,533 44c In JCD 56.0(M;R) 22
(1
Outside JCD 35.0Outside state 3.0Foreign 6.0
la.
Manning 12 3,723 (1969) 25 In JCD 85.0(B;U) Outside JCD 10.0
Outside state 4.0Foreign 1.0
aCarter 7 2,612 from the 42 In JCD 87.0(M;S) five high Outside JCD 6.0
schools in the Outside state 1.0JCD Foreign 5.0
Lowell 64 59,500 (1969) 15 In JCD 70.7(14;11)
Outside JCD 12.1Outside state 8.8Foreign 3.2
Palmerston 5 1,100 (1969) 25 In JCD 90.0(M;R)
Outside JCD 8.0Outside state 1.0Foreign 1.0
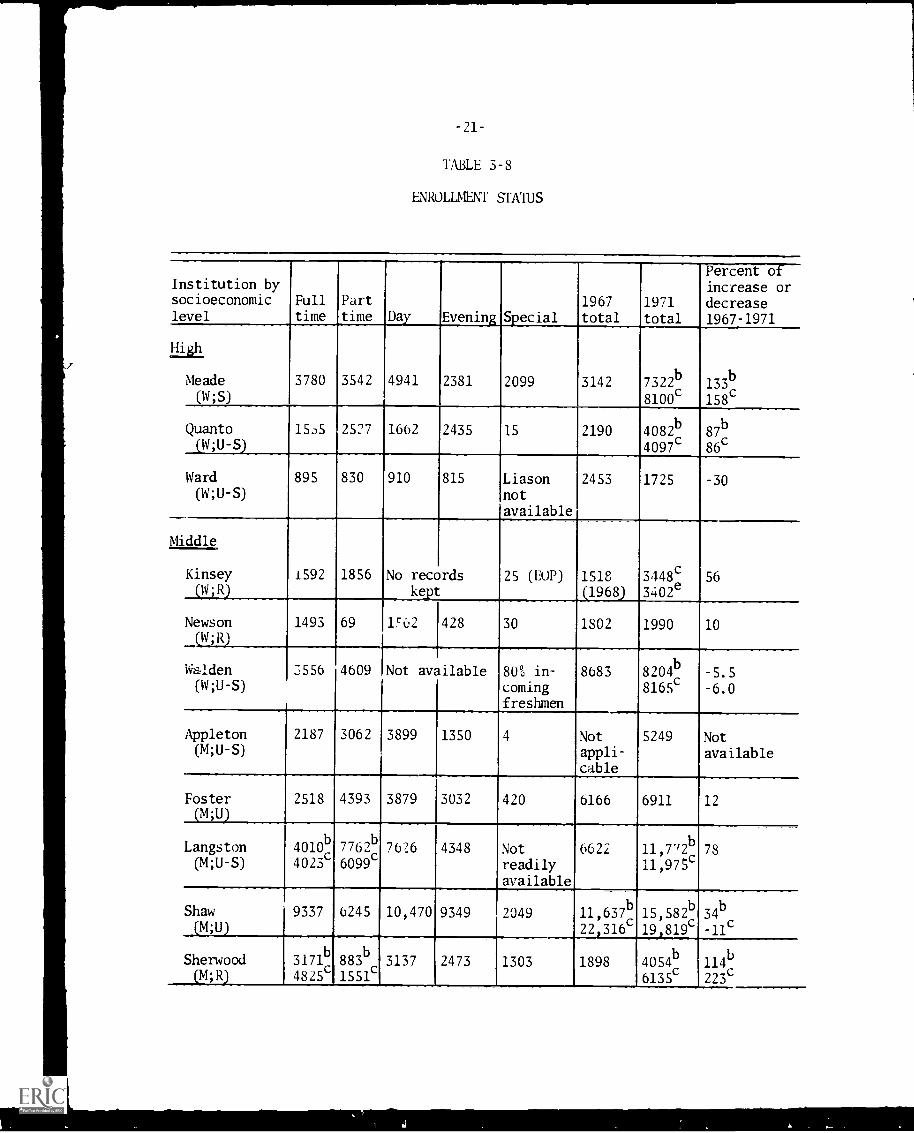
-21-
TABLE 3- 8
ENROLLMENT STATUS
Institution bysocioeconomiclevel
Fulltime
Parttime Day Evening Special
1967total
1971
total
Percent ofincrease ordecrease1967-1971
High
3780 3542 4941 2381 2099 3142 7322b 133bMeade
(W;S) 8100c
158c
Quanto 1505 2527 1662 2435 15 2190 4082b
87b
(W;U-S) 4097c 86c
Ward(W;U-S)
895 830 910 815 Liasonnotavailable
2453 1725 -30
Middle
Kinsey 1592 1856 No records 25 (EOP) 1518 3448c
56(W;R) kept (1968) 3402e
Newson 1493 69 1F02 428 30 1802 1990 10(W;R)
W&lden 3556 4609 Not available 80% in- 8683 8204b
-5.5(W;U-S) coming
freshmen8165
c-6.0
Appleton(M;U-S)
2187 3062 3899 1350 4 Notappli-cable
5249 Not
available
Foster 2518 4393 3879 3032 420 6166 6911 12
(M; _
LangstonMU-S)
4010b
.,c4020
7762b
6099c
7626 4348 Notreadilyavailable
6622 11,772b
11,975c78
Shaw 9337 6245 10,470 9349 2049 11,637b
15,582b
34b
(M;U) 22,316c
19,819c -11c
Sherwood 3171b
883b
3137 2473 1303 1898 4054b
114b
MR) 4825c 1551c 6135c
223c
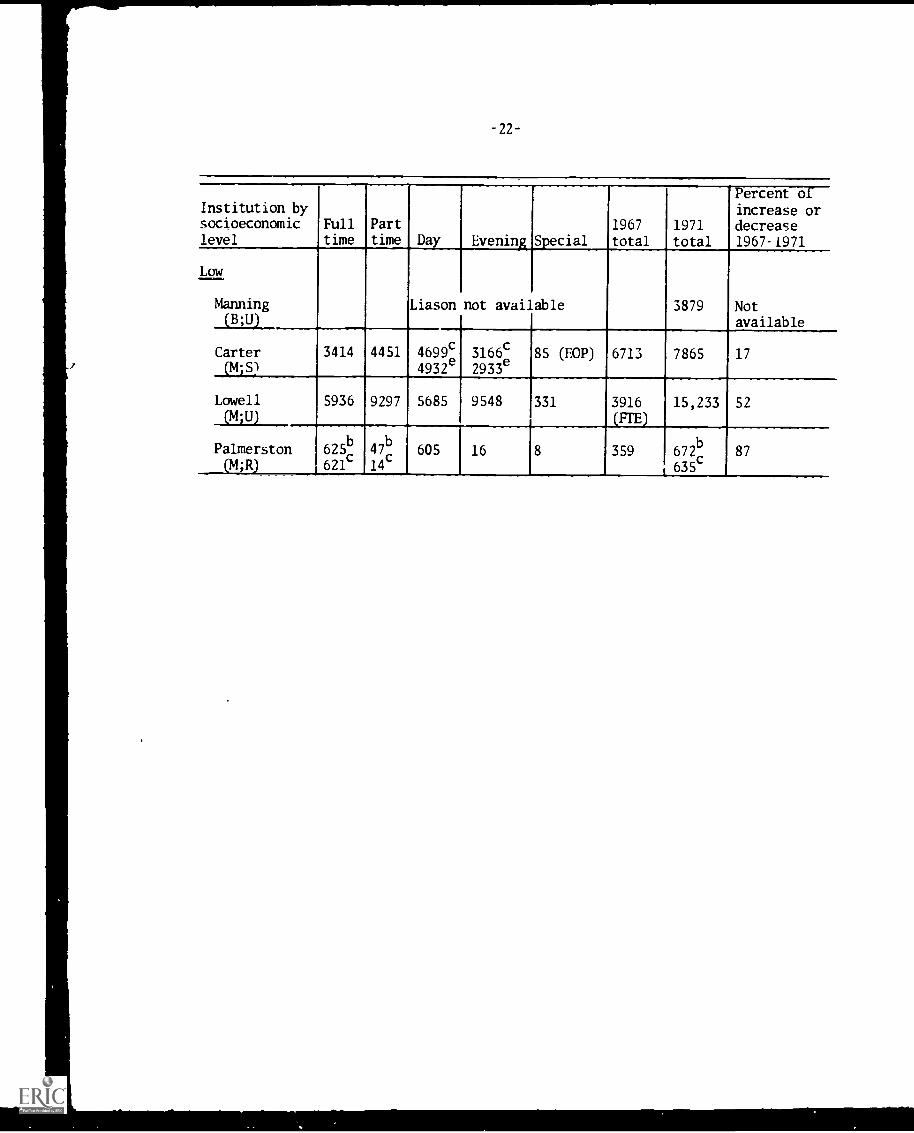
Institution bysocioeconomiclevel
Fulltime
Parttime Day Evening Special
1967
total1971total
Percent ofincrease ordecrease1967-1971
Low
Manning(B;q)
Liason not available 3879 Notavailable
Carter 3414 4451 4699c 3166c 85 (EOP) 6713 7865 17SM;S) 4932
e2933e
Lowell 5936 9297 5685 9548 331 3916 15,233 52
(4;q) (rE)
Palmerston 625b 47b 605 16 8 359 672b
87MR) 621c 14c

-23-
TABLE 3-9
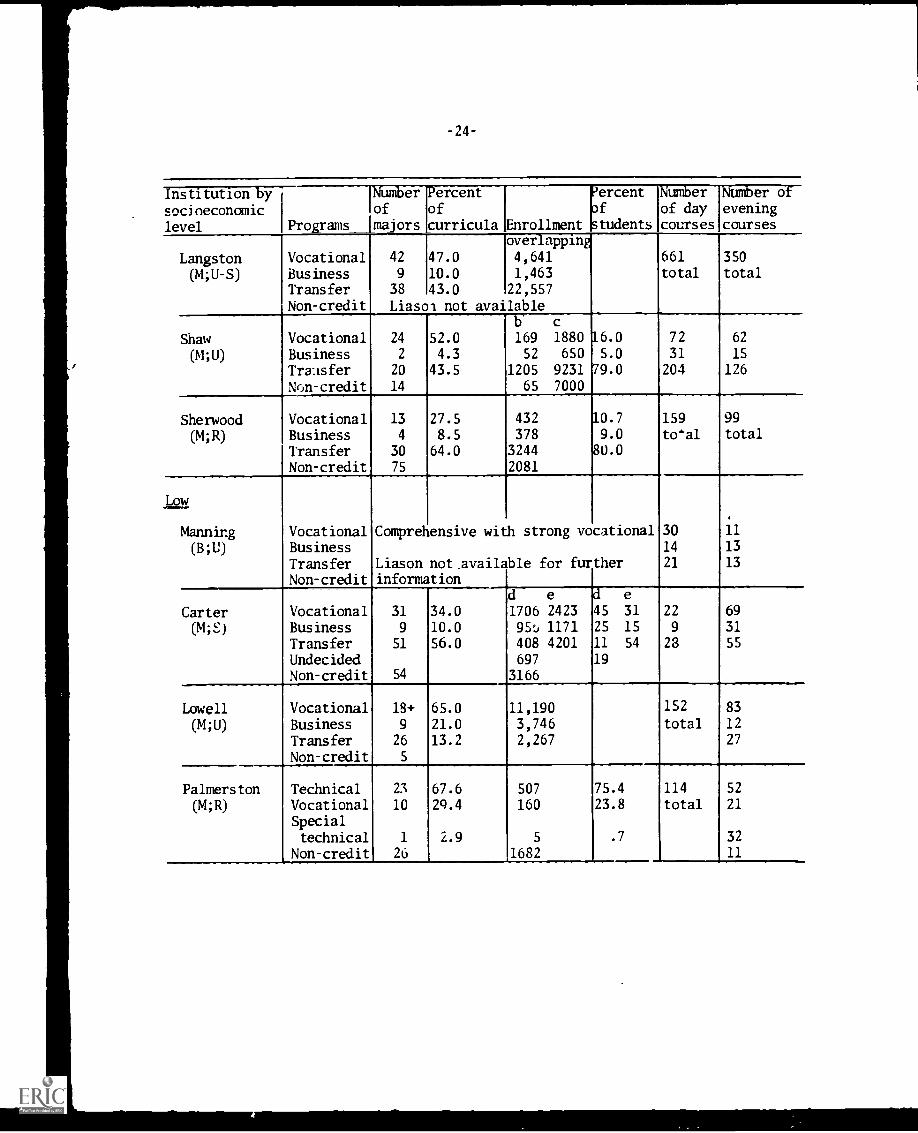
PROGRAM EMPHASIS AND ENROLLMENT
Institution bysocioeconomiclevel
High
Meade
(1V,S)
Programs
VocationalBusinessTransferNon-creditUndecided
Numberof
ma'ors
Percentof
curricula
14 34.04 9.823 56.0
Enrollment
Percentof
students
b c
895'211
17.0300 c
3055 1922 "172
42.53072
NuMberet daycourses
Number ofevening
courses
281 25
total 29
86
Quanto(W,U-S)
Vocational 13
Business 4
Transfer 4
Non-credit
62.0
19.019.0
1215867
201515
29.7
21.2
49.1
123 122
total total
Ward(W;U-S)
&dila
Kinsey
(W; R)
VocationalTransferNon-credit
NoneMost Liason not available
98 135total total
Vocational 16
Business 3
Transfer 24
Non-credit 3
28.6
12.958.0
851
535
2062
26.0
16.0
58.0
c e c e
62 76
20 47
119 283
20 15
17 31
48 57
Newson(W;R)
Vocational 9
Business 5
Transfer 20
Non-creditUndecided
26.5
14.758.8
b c
412 363
1150 12761147 1304
428
26.0
73.0
282 144
total total
Walden(W;U-S)
VocationalBusinessTransferNon-credit
c e
11 20
3 8
29
67
c e
25.6 35
7.0 14
67.4 51
1207
69582081
14.8
85.0
23
23
179
13
32
97
Appleton(4,U-S)
VocationalBusinessTransfer
Non-credit
14 29.0 1754 33.0 726 12.5 849 16.0 27
28 58.3 2646 50.0 156Not available--all courses involve credit
23
6
29
Foster(14;U)
VocationalBusinessTransfer
21 37.0I
11 19.6 Liason not available24 42.9
Non-credit Liason not available
610 212
total total
Institution by
socioeconomiclevel
Numberof
Programs 'majors
ercentofcurricula Enrollment
Percentof
students
Numberof daycourses
Number ofeveningcourses
overlapping
Langston Vocational 42 47.0 4,641 661 350
(M;U-S) Business 9 10.0 1,463 total total
Transfer 38 43.0 22,557
Non-credit Liasol not availableb c
Shaw Vocational 24 52.0 169 1880 6.0 72 62
(M;U) Business 2 4.3 52 650 r5.0 31 15
Tra:isfer 20 43.5 1205 9231 9.0 204 126
Non-credit 14 65 7000
Sherwood Vocational 13 27.5 432 A.0.7 159 99
(M;R) Business 4 8.5 378 9.0 teal total
Transfer 30 64.0 3244 80.0
Non-credit 75 2081
Low
Manning Vocational Comprehensive with strong vocational 30 11
(B;U) Business 14 13
Transfer Liason not.available for further 21 13
Non-credit informationd e la e
Carter Vocational 31 34.0 1706 2423 45 31 22 69
(M;E) Business 9 10.0 95:J 1171 25 15 9 31
Transfer 51 56.0 408 4201 11 54 23 55
Undecided 697 19
Non-credit 54 3166
Lowell Vocational 18+ 65.0 11,190 152 83
(M;U) Business 9 21.0 3,746 total 12
Transfer 26 13.2 2,267 27
Non-credit 5
Palmerston Technical 23 67.6 507 75.4 114 52
(M;R) Vocational 10 29.4 160 23.8 total 21
Specialtechnical 1 2.9 5 .7 32
Non-credit 26 1682 11
-25-
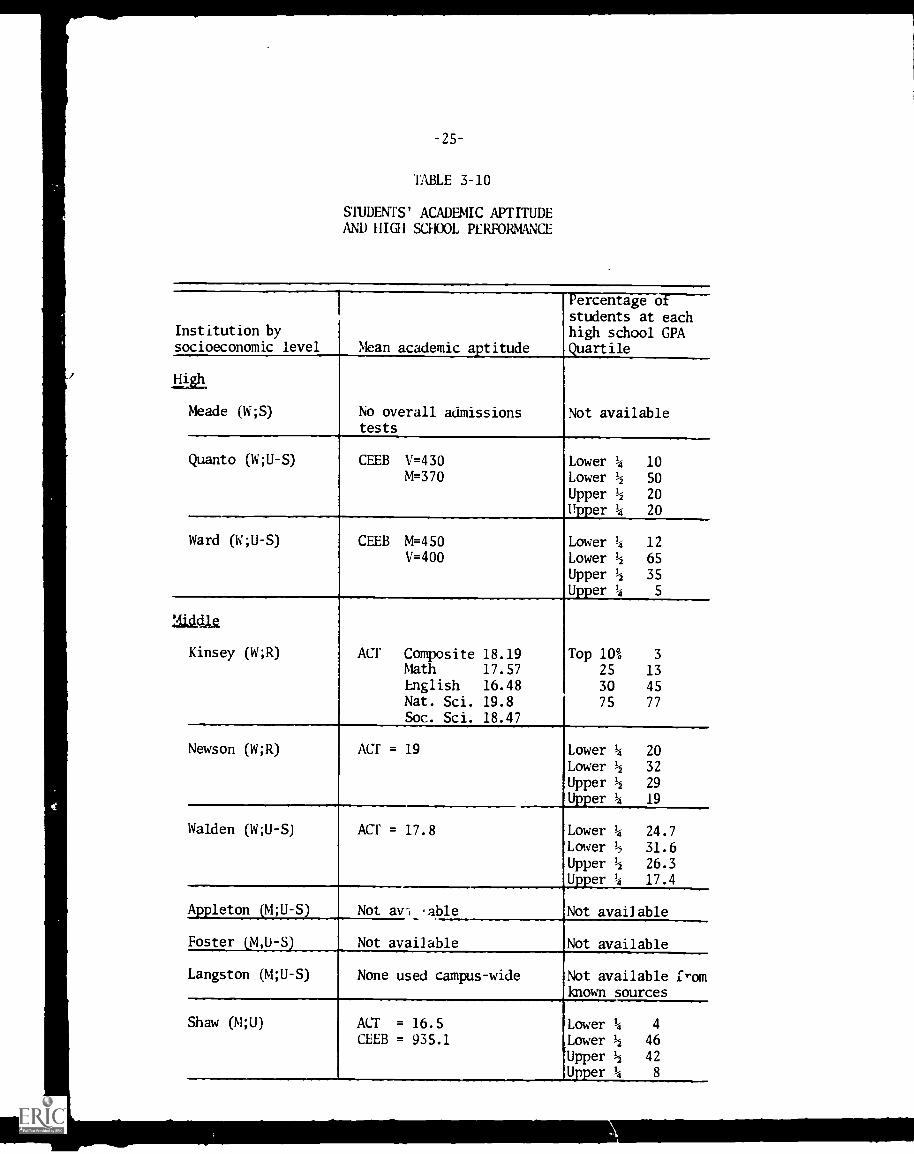
TABLE 3-10
STUDENTS' ACADEMIC APTITUDEAND HIGH SCHOOL PERFORMANCE
Institution bysocioeconomic level Mean academic aptitude
Percentage sr-----students at eachhigh school GPAQuartile
Hi
Meade (1%';S) No overall admissionstests
Not available
Quanto (W;U-S) CEEB V=430M=370
Ward (W;U-S) CEEB M=450V=400
Lower 4 10Lower 4 50
Upper 4 20
Upper 4 20
Lower 4 12
Lower 4 65Upper 4 35Upper 4 5
Kinsey (W;R) ACT Composite 18.19Math 17.57English 16.48Nat. Sci. 19.8Soc. Sci. 18.47
Top 10% 3
25 13
30 45
75 77
Newson (W;R) ACT = 19 Lower 4 20
Lower 4 32
Upper 4 29
Upper 4 19
Walden (W;U-S) ACT = 17.8
Appleton (M;U-S)
Foster (M,U-S)
Langston (M;U-S)
Shaw (M;U)
Not axn ,able
Not available
Lower 4 24.7Lower 1/2 31.6Upper 4 26.3
Upper 4 17.4
Not available
Not available
None used campus-wide Not available fromknown sources
ACT = 16.5CEEB = 935.1
Lower 4LowerUpperU er
4
46
42
8
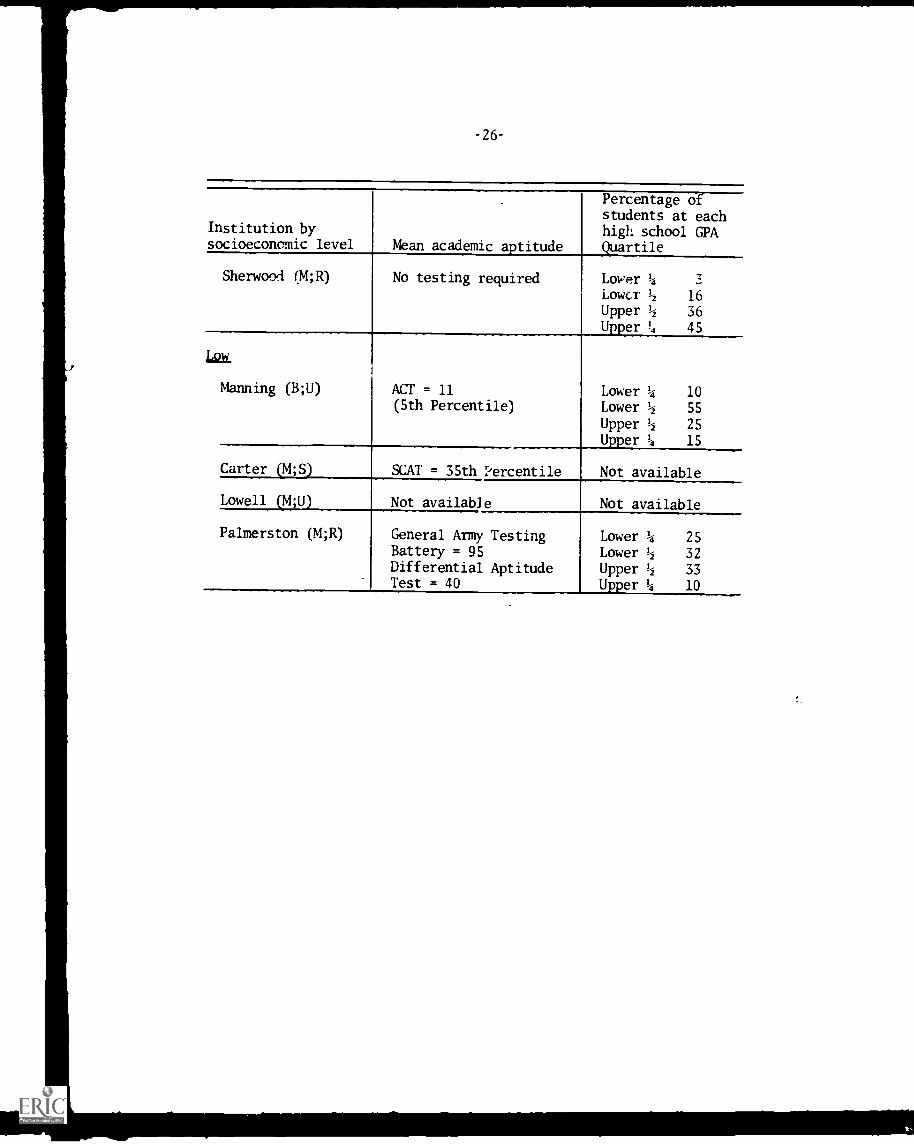
-26-
Institution bysocioeconomic level *an academic aptitude
Percentage ofstudents at eachhigh school GPAQuartile
Sherwood 14;R) No testing required
LI21L
Manning (B;U) ACT = 11(5th Percentile)
Carter (14;S)
Lowell 1M;U)
Palmerston (M;R)
SCAT = 35th Percentile
Lower 4 z-
Lowcr 1/2 16Upper 1/2 36Upper 45
Lower 4 10Lower 1/2 55
Upper 1/2 25
Upper 15
Not available
Not available Not available
General Army TestingBattery = 95Differential AptitudeTest = 40
Lower 25Lower 1/2 32Upper 1/2 33Upper 10

-27-
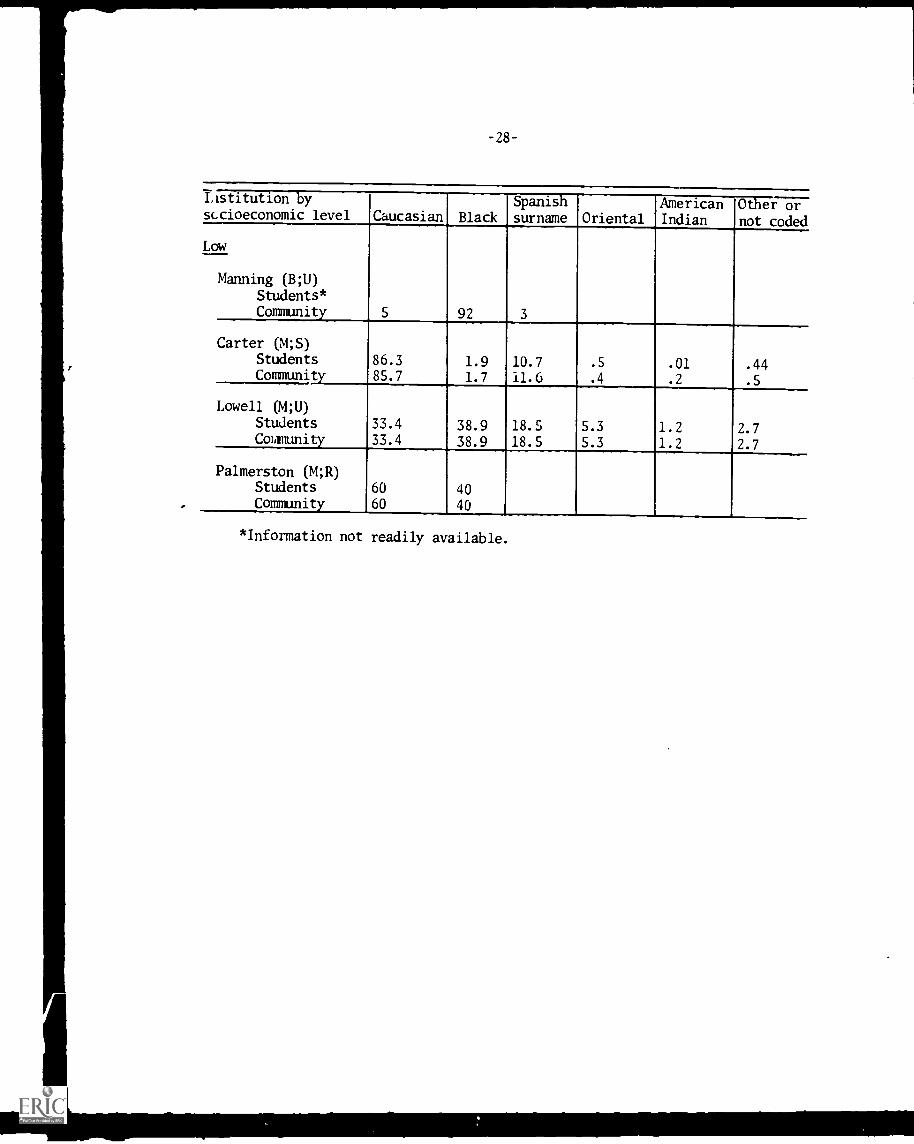
TABLE 3-11
ETHNIC COMPOSITION OF THE STUDENT BODIESAND COMMUNITIES (IN PERCENT)
Institution bysocioeconomic level Caucasian Black
Spanishsurname Oriental
AmericanIndian
Other ornot coded
Ilih
Meade (W;S)Students 98 1.5 .5Community 98 1. 5 .5
Quanto (W;U-S)Students* NotCommunity 95.3 2.1. 1.9 .7 available
Ward (W;U-S)
Students 91 7 .5 1.0 .5Community 96 2 1.0 1.0
Middle
Kinsey (W;R)Students* NotCommunity 90 10 available
Newson (W;R)Students 97 .9 1.0 .1 .02 .08Community 98 .8 .7 .5
Walden (W;U-S)
Students 90 5.0 4.0 1.0Community 88 3.4 3.2 2.0 .2 1.5
Appleton (M;U-S)Students 50.89 35.06 3.85 6.67 1.56 1.97Community*
Foster (4;U)Students 47.5 47.5 5.0Community 98.0 1.5 .5
Langston (M;U-S)Students 39 41.1 6.5 6.6 1.1 5
Community*
Shaw (M;U) e e c e c cStudents 48 11 13 40 56 31Connunity 55.7 6.6 37.4 .15 .15
Sherwood (M;R)Students 59.1 9.8 7,1.1
Community 78.5 20.9 .6
-28-
IAstitution by
socioeconomic level Caucasian BlackSpanishsurname Oriental
AmericanIndian
Other ornot coded
Low
Manning (B;U)Students*Community 5 92 3
Carter (4;S)Students 86.3 1.9 10.7 .5 .01 .44Community 85.7 1.7 11.6 .4 .2 .5
Lowell (M;U)Students 33.4 38.9 18.5 5.3 1.2 2.7Community 33.4 38.9 18.5 5.3 1.2 2.7
Palmerston (M;R)Students 60 40Community 60 40
*Information not readily available.
Institution bysocioeconomiclevel
High
Meade
(4;S)
Quanto_04;11-S)
Ward(4;11-S)
Middle
Kinsey(4;R.)
Newson21;R)
Walden04;11-SD
Appleton(4;11-S)
Foster
(4;11)
Langston(4;11-S)
Shaw(M; U)
Sherwood(4;R)
Manning(B;D)
-29-
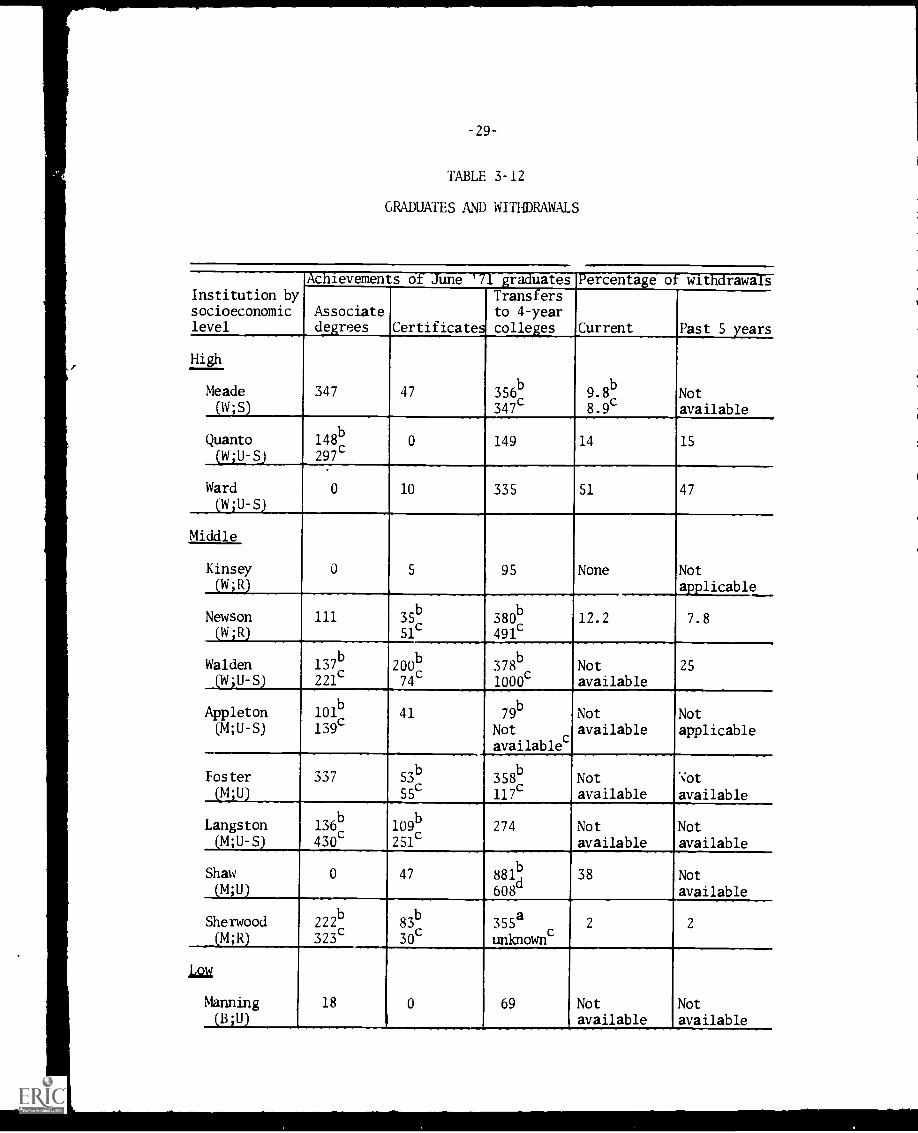
TABLE 3-12
GRADUATES AND WITHDRAWALS
Achievement s of June '71 graduates Percentage of withdrawals
Associatedegrees Certificate
Transfersto 4-yearcolleges Current Past 5 years
347 47 356b
347c9.8
b
8.9cNotavailable
148297
c0 149 14 15
0 10 335 51 47
0 5 95 None Notapplicable
7.8111 35b
51c380
b
491c12.2
137b
221c20074c
378b
1000c
Notavailable
25
101b
139c41 79
b
Notavailablec
Notavailable
Notapplicable
337 53b
55c
358b
117c
Notavailable
'Jot
available
136b
430c109
b
251c274 Not
availableNotavailable
0 47 881b
608d
38 Notavailable
222b
323c83
b
30c355aunknownc
2 2
18 0 69 Notavailable
Notavailable
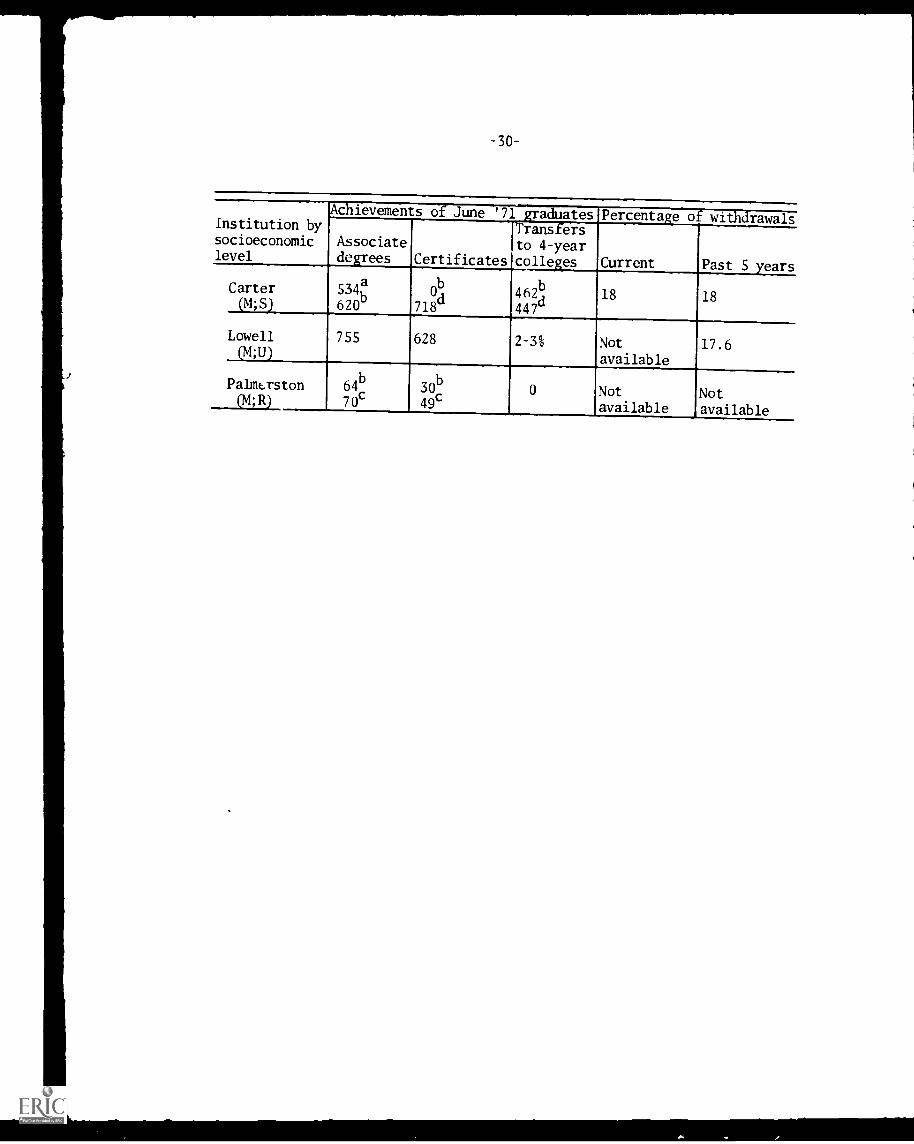
-30-
Institution bysocioeconomiclevel
Achievements o June '71 gra uates Percentage o wi rawals
Associatedegrees Certificates
Transfersto 4-yearcolleges Current Past 5 years
Carter
MS)
a534
b620
0b
d718
462bd
44718 18
Lowell(tq)
755 628 2-3% Not
available17.6
Palmerston(M;RJ
64b
70c7030b
49c
0 Not
availableNot
available
-31-
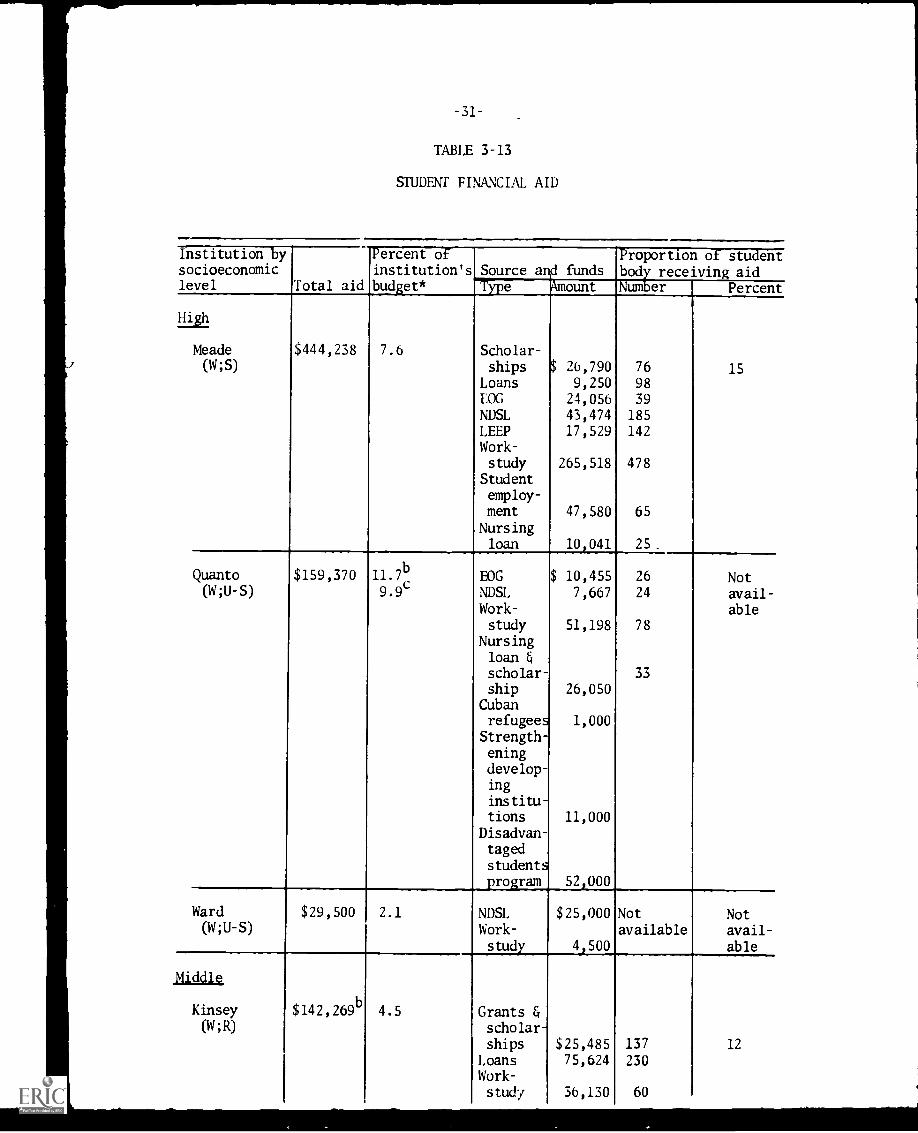
TABLE 3-13
STUDENT FINANCIAL AID
Institution bysocioeconomiclevel Total aid
Percent ofinstitution'sbudget*
Source arl fundsProportion of studentbody receiving aid
Type Amount Number Percent
Hi
Meade $444,238 7.6 Scholar-(W;S) ships 26,790 76 15
Loans 9,250 98EOG 24,056 39NDSL 43,474 185
LEEP 17,529 142
Work-study 265,518 478
Studentemploy-ment 47,580 65
Nursingloan 10,041 25_
Quanto $159,370 11.7b
EOG $ 10,455 26 Not(W ;U-S) 9.9c NDSL
Work-7,667 24 avail-
ablestudy 51,198 78
Nursingloan &
scholar- 33
ship 26,050Cubanrefugees 1,000
Strength-eningdevelop-ing
institu-tions 11,000
Disadvan-tagedstudentsprogram 52,000
Ward $29,500 2.1 NDSL $25,000 Not Not(W ;U-S) Work- available avail-
study 4,500 able
Middle
$142,269 4.5 Grants EKinsey
(W ; R) scholar-ships $25,485 137 12
Loans 75,624 230Work-
study 36,130 60
-32-
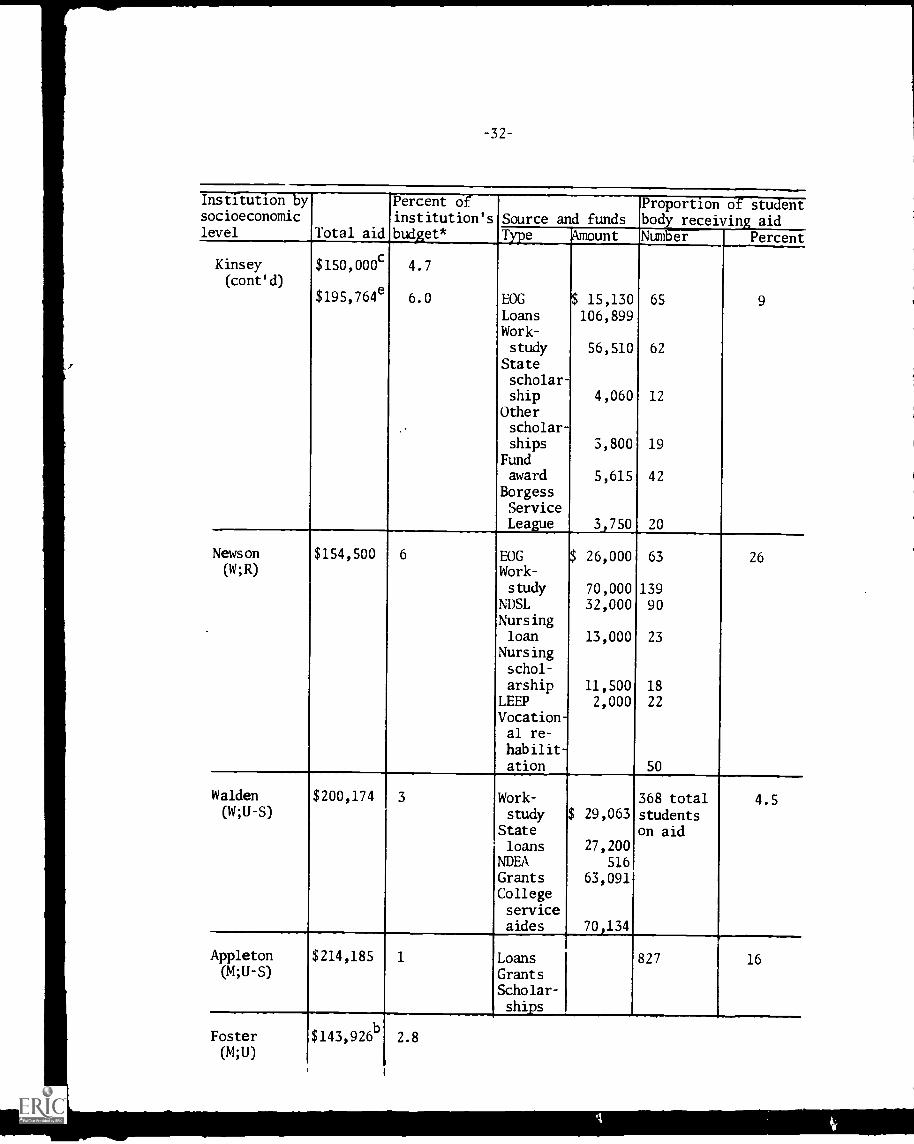
Institution bysocioeconomiclevel Total aid
Percent ofinstitution'sbudget*
Kinsey(cont'd)
$150,000c
$195,764e
4.7
6.0
Proportion of studentSource and funds body receiving aidType Amount Number Percent
EOG $ 15,130 65
Loans 106,899Work-
study 56,510 62
Statescholar-ship 4,060 12
Otherscholar-ships 3,800 19
Fundaward 5,615 42
BorgessServiceLeague 3,750 20
9
News on
(W; R)
$154,500 6 EOGWork-study
NDSLNursingloan
Nursingschol-arship
LEEPVocation-al re-
habilit-ation
$ 26,000
70,00032,000
13,000
11,5002,000
63
139
90
23
18
22
50
26
Walden(W;U-S)
$200,174 3 Work-study
Stateloans
NDEAGrantsCollegeserviceaides
368 total$ 29,063 students
on aid27,200
516
63,091
70,134
4.5
Appleton(M ;U-S)
$214,185 1 LoansGrantsScholar-ships
827 16
Foster(M;U)
$143,926b 2.8
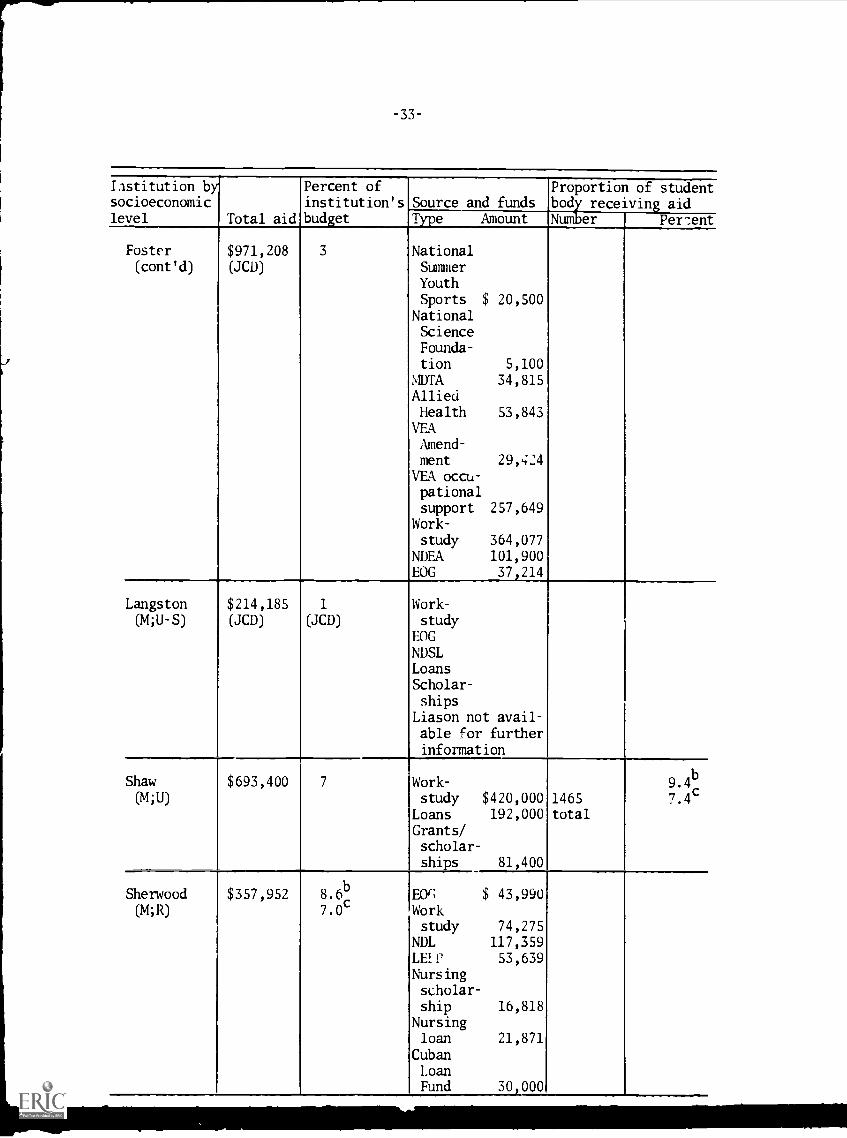
-33-
Institution bysocioeconomiclevel Total aid
Percent ofinstitution'sbudget
Source and fundsProportionbody receivingNumber
of studentaid
Type Amount Percent
Foster $971,208 3 National(cont'd) (JCD) Summer
YouthSports $ 20,500
NationalScienceFounda-
tion 5,100MDTA 34,815AlliedHealth 53,843
VEAAmend-ment 29,424
VEA occu-pationalsupport 257,649
Work-
study 364,077
NDEA 101,900
EOG 37,214
Langston $214,185 1 Work-(M;U-S) (JCD) (JCD) study
EOGNDSLLoansScholar-ships
Liason not avail-able for furtherinformation
Shaw $693,400 7 Work- 9.4b
(M;U) study $420,000Loans 192,000
1465total
7.4c
Grants/scholar-
ships 81,400
Sherwood $357,952 8.6b E0f; $ 43,99U(M;R) 7.0c Work
study 74,275NDL 117,359LEII' 53,639
Nursingscholar-ship 16,818
Nursingloan 21,871
CubanLoanFund 30,000
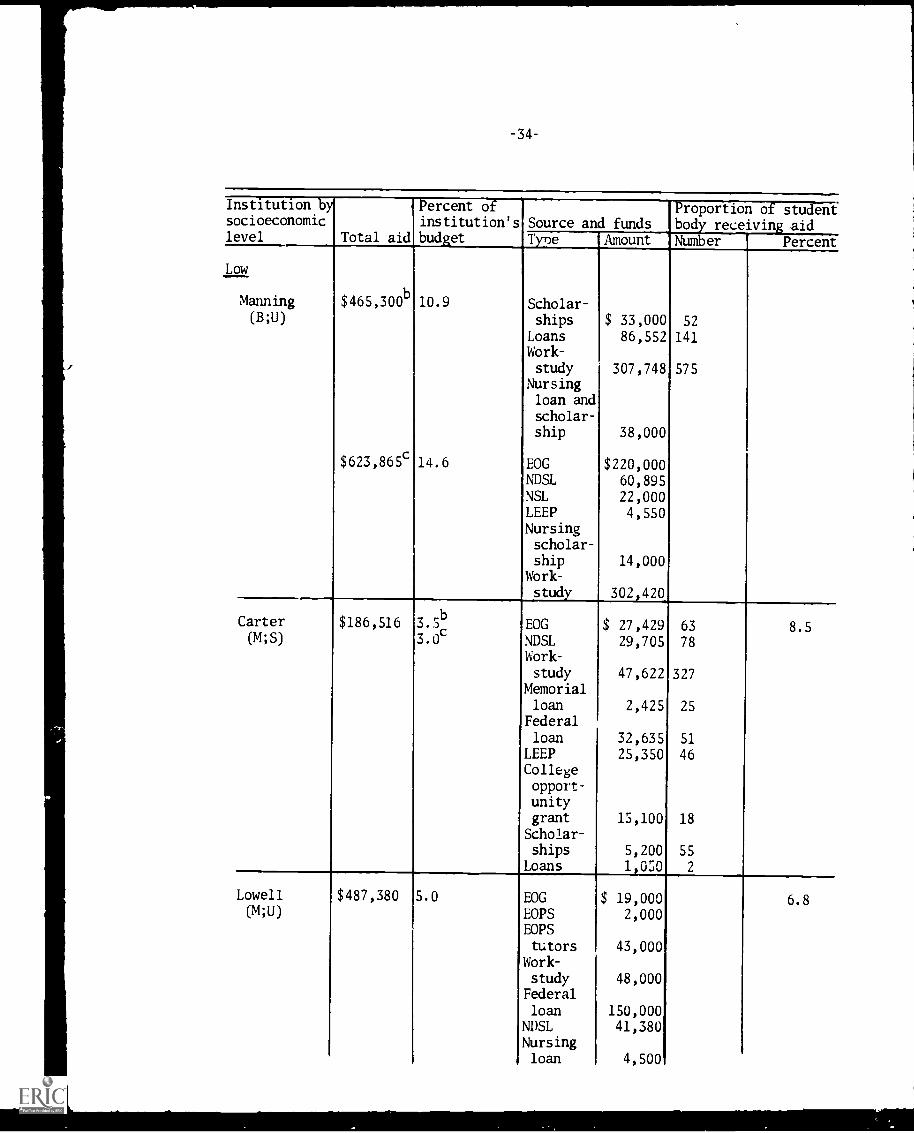
-34-
Institution bysocioeconomiclevel Total aid
Percent ofinstitution'sbudget
Source and fundsProportionbody receivingNumber
of studentaidPercentTyne Amount
Low
$465,300b 10.9 Scholar-Manning(B;U) ships $ 33,000 52
Loans 86,552 141Work-
study 307,748 575Nursingloan and
scholar-ship 38,000
$623,865c 14.6 EOG $220,000NDSL 60,895NSL 22,000LEEP 4,550Nursingscholar-ship 14,000
Work-
study 302,420
Carter $186,516 3. rib EOG $ 27,429 63 8.5(M;S)
3.0CNDSL 29,705 78Work-
study 47,622 327Memorialloan 2,425 25
Federalloan 32,635 51
LEEP 25,350 46Collegeopport-unitygrant 15,100 18
Scholar-ships 5,200 55
Loans 1,050 2
Lowell $487,380 5.0 EOG $ 19,000 6.8(14;U) EOPS 2,000
BOPStutors 43,000
Work-study 48,000Federalloan 150,000
NDSL 41,380Nursingloan 4,500
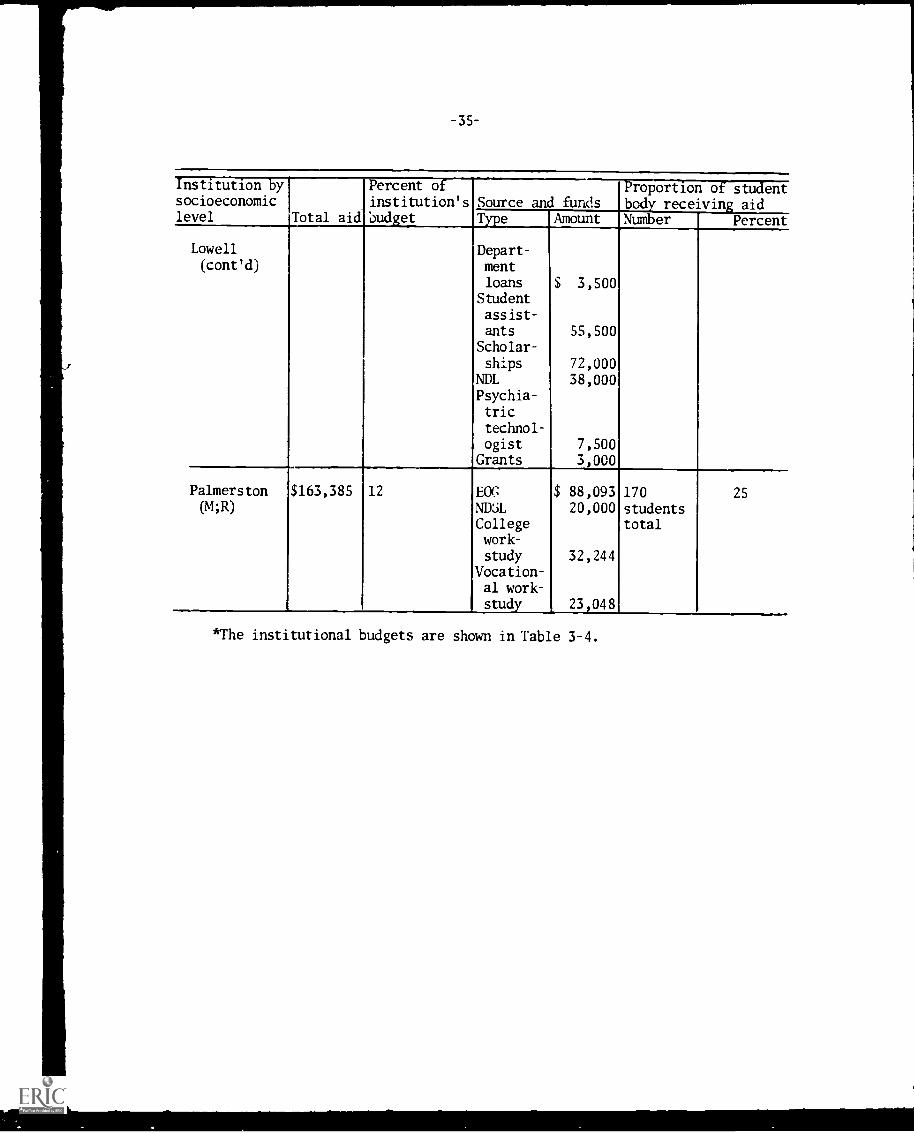
-35-
Institution bysocioeconomiclevel
_institution'sTotal aid
Percent of
budget
ProportionSource and funds body receiving
Number
of studentaid
PercentType Amount
Lowell
(cont'd)Depart-mentloans $ 3,500
Studentass ist-
ants 55,500Scholar-ships 72,000
NDL 38,000Psychia-tric
technol-ogist 7,500
Grants 3,000
Palmerston $163,385 12 EOC $ 88,093 170 25(M;R) NDL
Collegework-
20,000 studentstotal
study 32,244Vocation-al work-
_ 23,048
*The institutional budgets are shown in Table 3-4.
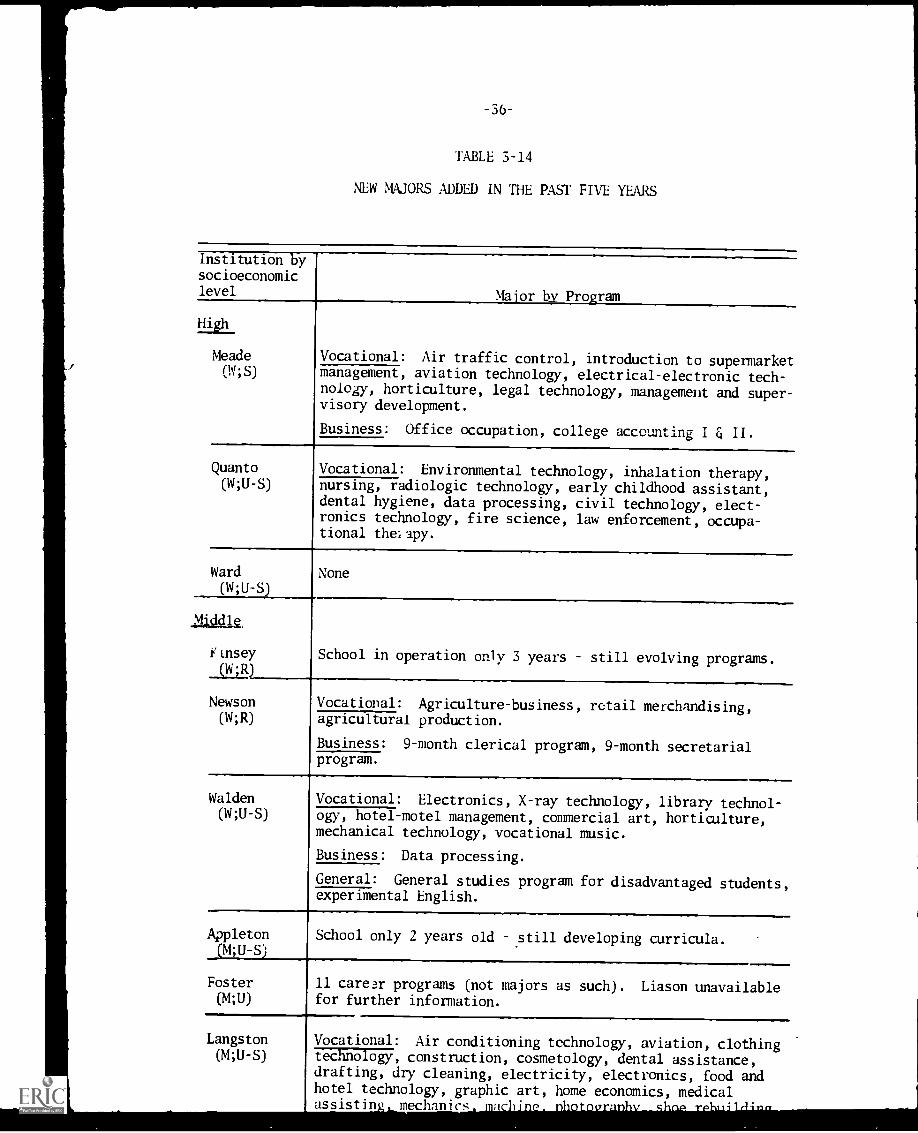
-36-
TABLE 3-14
NEW MAJORS ADDED IN THE PAST FIVE YEARS
Institution bysocioeconomiclevel Maior:bi Program
High,
Meade Vocational: Air traffic control, introduction to supermarket(W;S) management, aviation technology, electrical-electronic tech-
nology, horticulture, legal technology, management and super-visory development.
Business: Office occupation, college accounting I Ei II.
Quanto Vocational: Environmental technology, inhalation therapy,(W;U-S) nursing, radiologic technology, early childhood assistant,
dental hygiene, data processing, civil technology, elect-ronics technology, fire science, law enforcement, occupa-tional theiapy.
Ward None(W;U -S)
1111.411
Yaisey School in operation only 3 years still evolving programs.(W;R)
Newson Vocational: Agriculture-business, retail merchandising,(W;R) agricultural production.
Business: 9-month clerical program, 9-month secretarialprogram.
Walden Vocational: Electronics, X-ray technology, library technol-(W;U-S) ogy, hotel-motel management, commercial art, horticulture,
mechanical technology, vocational music.
Business: Data processing.
General: General studies program for disadvantaged students,experimental English.
Appleton School only 2 years old still developing curricula.(14;U-S)
Foster 11 career programs (not majors as such). Liason unavailable(14;U) for further information.
Langston Vocational: Air conditioning technology, aviation, clothing(4;U-S) technology, construction, cosmetology, dental assistance,
drafting, dry cleaning, electricity, electronics, food andhotel technology, graphic art, home economics, medicalassistin, mechanics m
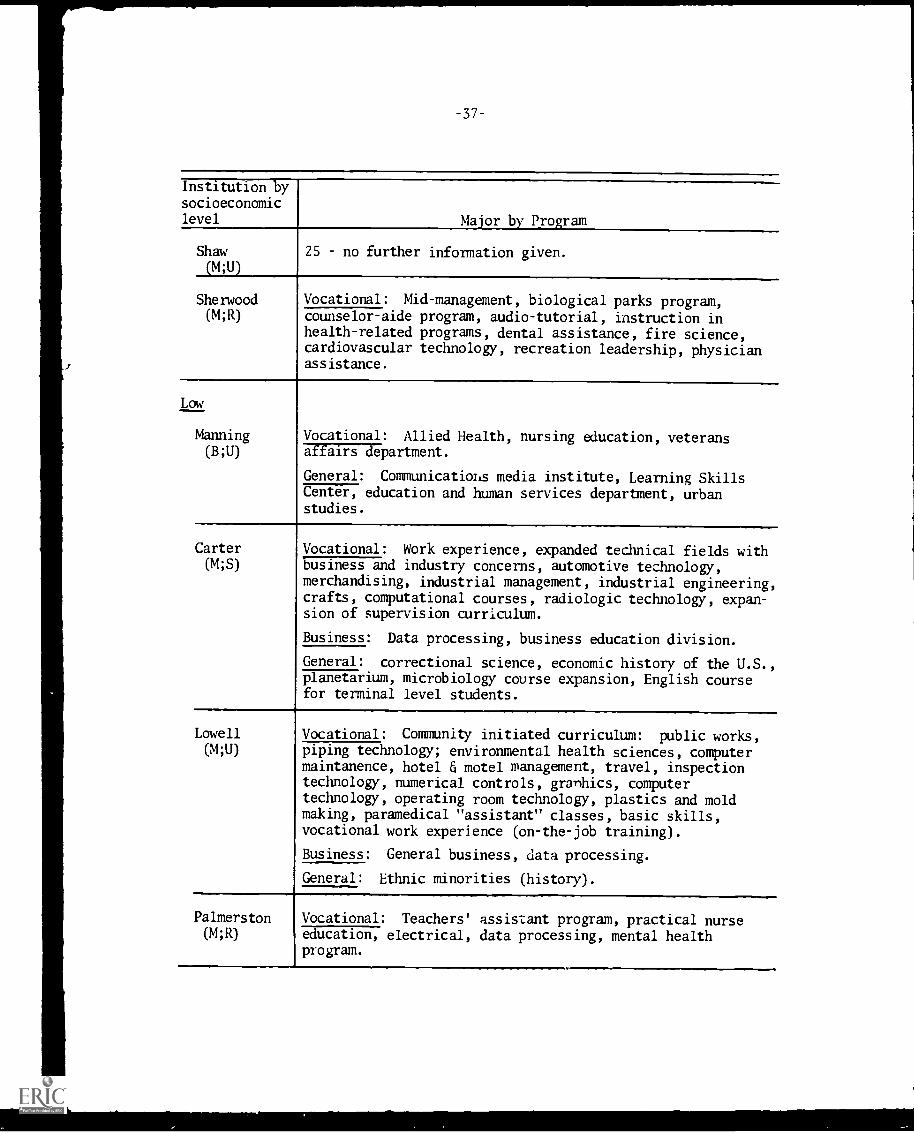
-37-
Institution bysocioeconomiclevel Major by Program
Shaw(4;U)
Sherwood(M;R)
25 no further information given.
Vocational: Mid-management, biological parks program,counselor-aide program, audio-tutorial, instruction inhealth-related programs, dental assistance, fire science,cardiovascular technology, recreation leadership, physicianassistance.
Low
Manning(B;U)
Vocational: Allied Health, nursing education, veteransaffairs department.
General: Communicatiohs media institute, Learning SkillsCenter, education and human services department, urbanstudies.
Carter(M;S)
Vocational: Work experience, expanded technical fields withbusiness and industry concerns, automotive technology,merchandising, industrial management, industrial engineering,crafts, computational courses, radiologic technology, expan-sion of supervision curriculum.
Business: Data processing, business education division.
General: correctional science, economic history of the U.S.,planetarium, microbiology course expansion, English coursefor terminal level students.
Lowell(M;U)
Vocational: Community initiated curriculum: public works,piping technology; environmental health sciences, computermaintanence, hotel motel management, travel, inspectiontechnology, numerical controls, graphics, computertechnology, operating room technology, plastics and moldmaking, paramedical "assistant" classes, basic skills,vocational work experience (on-the-job training).
Business: General business, data processing.
General: Ethnic minorities (history).
Palmerston(M; R)
Vocational: Teachers' assistant program, practical nurseeducation, electrical, data processing, mental healthprogram.
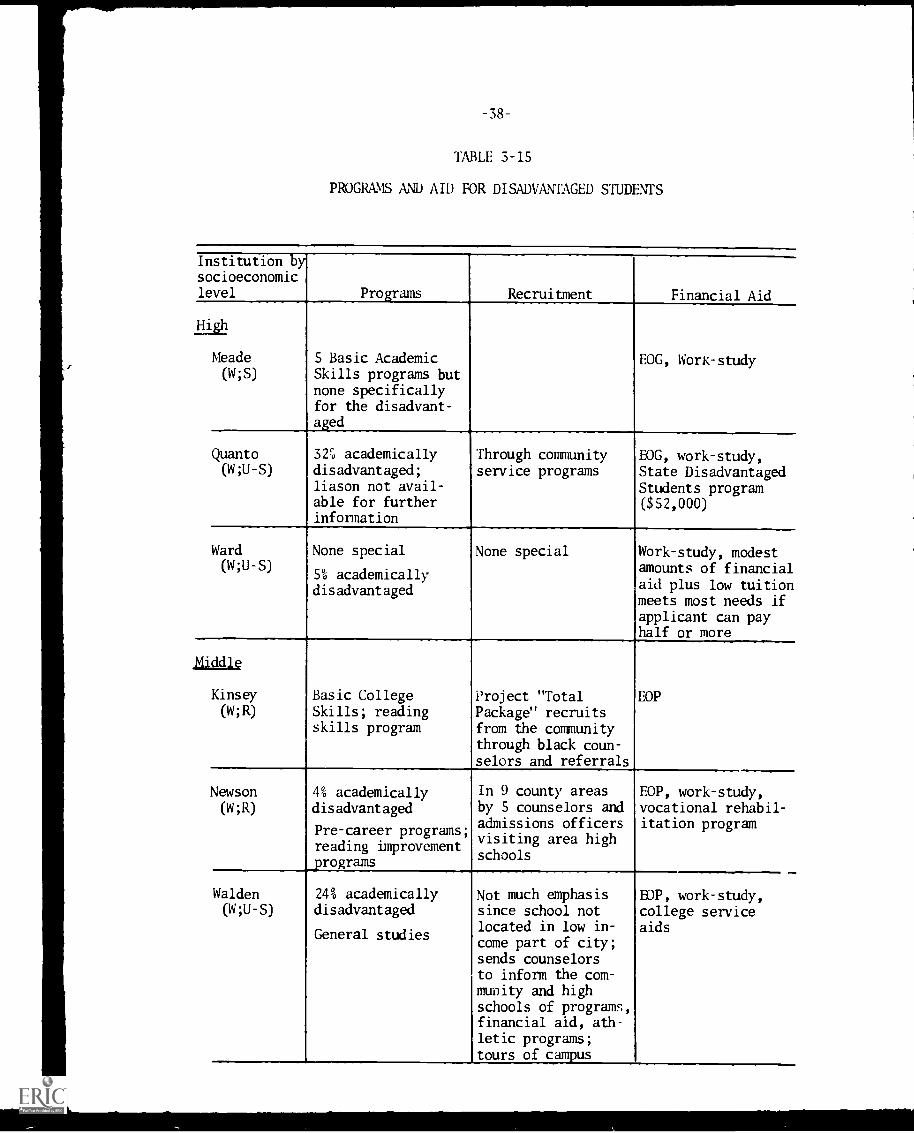
-38-
TABLE 3-15
PROGRAMS AND AID FOR DISADVANTAGED STUDENTS
Institution bysocioeconomiclevel Programs Recruitment Financial Aid
ili.,
5 Basic AcademicSkills programs butnone specificallyfor the disadvant-aged
EOG, Work-studyMeade(W;S)
Quanta(W;U-S)
325; academicallydisadvantaged;liason not avail-able for furtherinformation
Through communityservice programs
EOG, work-study,State DisadvantagedStudents program($52,000)
Ward(W;U-S)
None special
5% academicallydisadvantaged
None special Work-study, modestamounts of financialaid plus low tuitionmeets most needs ifapplicant can payhalf or more
Middle
Basic CollegeSkills; readingskills program
Project "TotalPackage" recruitsfrom the communitythrough black coun-selors and referrals
EOPKinsey(W;R)
Newson(W;R)
4% academicallydisadvantaged
Pre-career programs;reading improvementprograms
In 9 county areasby 5 counselors andadmissions officersvisiting area highschools
EOP, work-study,vocational rehabil-itation program
Walden(W;U-S)
24% academicallydisadvantaged
General studies
Not much emphasissince school notlocated in low in-come part of city;sends counselorsto inform the com-munity and highschools of programs,financial aid, ath-letic programs;tours of campus
BOP, work-study,college serviceaids
-39-
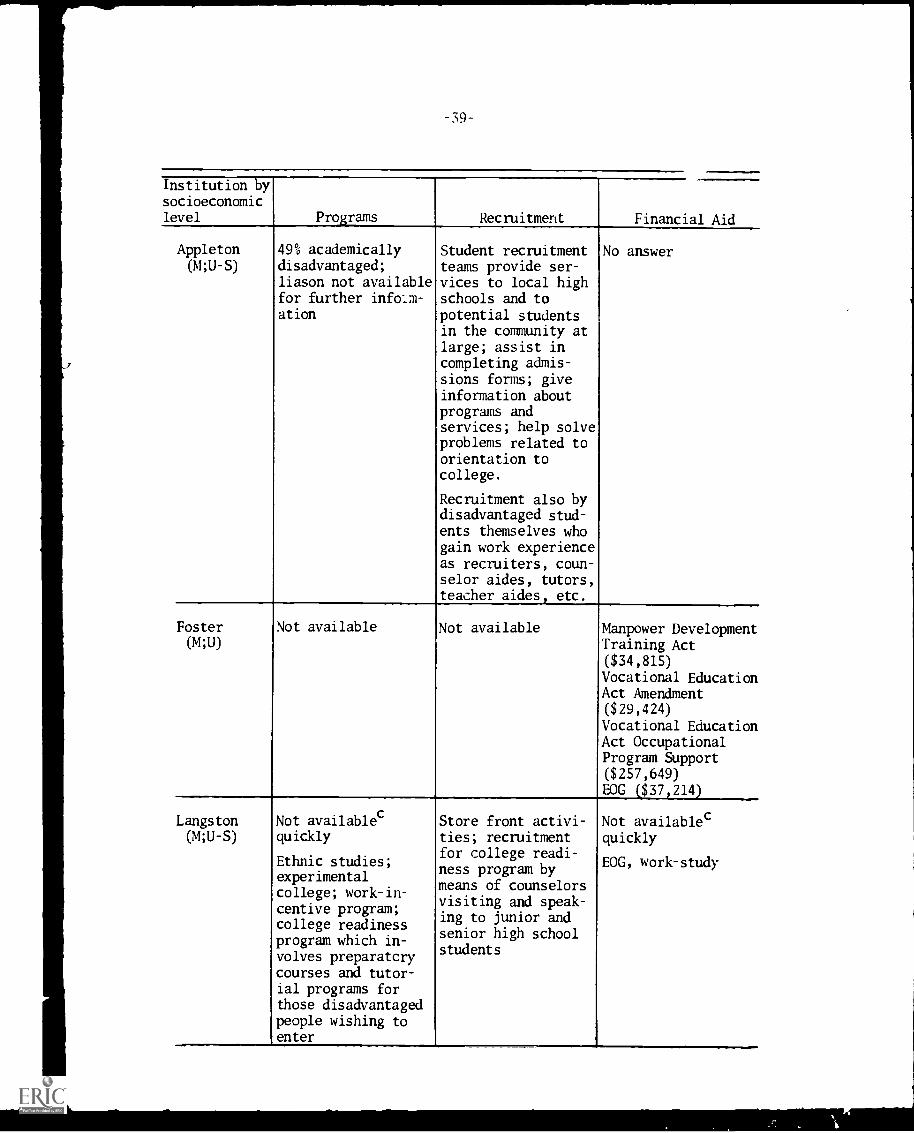
Institution bysocioeconomiclevel Programs Recruitment Financial Aid
Appleton(M;U-S)
49% academicallydisadvantaged;liason not availablefor further infolm-ation
Student recruitmentteams provide ser-vices to local highschools and topotential studentsin the community atlarge; assist incompleting admis-sions forms; giveinformation aboutprograms andservices; help solveproblems related toorientation tocollege.
Recruitment also bydisadvantaged stud-ents themselves whogain work experienceas recruiters, coun-selor aides, tutors,teacher aides, etc.
No answer
Foster(4;U)
Not available Not available
Langston(M;U-S)
Not availablecquickly
Ethnic studies;experimentalcollege; work-in-centive program;college readinessprogram which in-volves preparatcrycourses and tutor-ial programs forthose disadvantagedpeople wishing toenter
Store front activi-ties; recruitmentfor college readi-ness program bymeans of counselorsvisiting and speak-ing to junior andsenior high schoolstudents
Manpower DevelopmentTraining Act($34,815)
Vocational EducationAct Amendment($29,424)
Vocational EducationAct OccupationalProgram Support($257,649)
BOG ($37,214)
Not availablecquickly
EOG, work-study
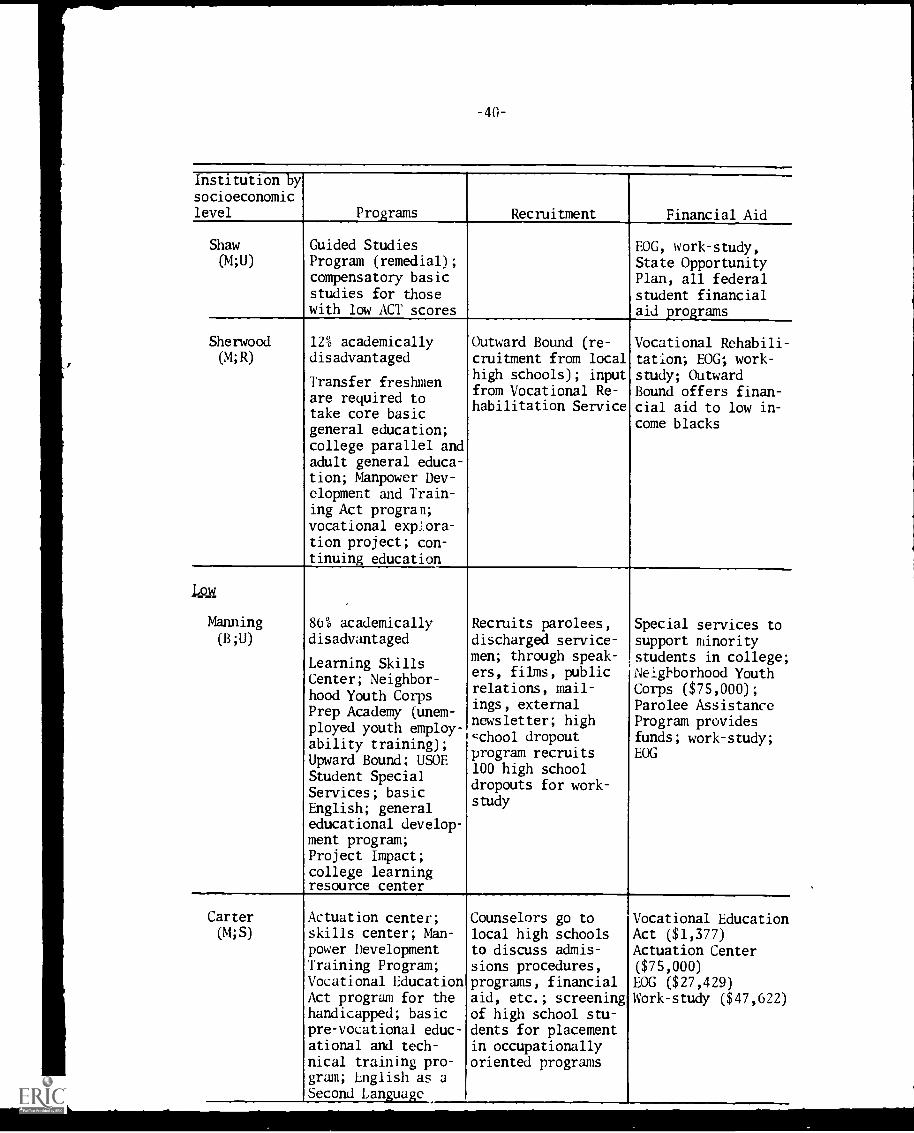
-40-
Institution bysocioeconomiclevel Programs Recruitment Financial Aid
Shaw(M;U)
Guided StudiesProgram (remedial);compensatory basicstudies for thosewith low ACT scores
Sherwood
(M; R)
Low
Manning(B;U)
12% academicallydisadvantaged
Transfer freshmenare required totake core basicgeneral education;college parallel andadult general educa-tion; Manpower Dev-elopment and Train-ing Act progran;vocational explora-tion project; con-
tinuing education
86% academicallydisadvantaged
Learning SkillsCenter; Neighbor-hood Youth CorpsPrep Academy (unem-ployed youth employ-ability training);Upward Bound; USOEStudent SpecialServices; basicEnglish; generaleducational develop-ment program;Project Impact;college learningresource center
Outward Bound (re-cruitment from localhigh schools); inputfrom Vocational Re-habilitation Service
EOG, work-study,State OpportunityPlan, all federalstudent financialaid programs
Vocational Rehabili-tation; EOG; work-study; OutwardBound offers finan-cial aid to low in-come blacks
Recruits parolees,
discharged service-men; through speak-ers, films, publicrelations, mail-ings, externalnewsletter; highzchool dropoutprogram recruits100 high schooldropouts for work-study
Special services tosupport minoritystudents in college;Neighborhood YouthCorps ($75,000);Parolee AssistanceProgram providesfunds; work-study;EOG
Carter(M;S)
Actuation center;skills center; Man-power DevelopmentTraining Program;Vocational EducationAct program for thehandicapped; basicpre-vocational educ-ational and tech-nical training pro-gram; English as aSecond Language
Counselors go tolocal high schoolsto discuss admis-sions procedures,programs, financialaid, etc.; screeningof high school stu-dents for placementin occupationallyoriented programs
Vocational EducationAct ($1,377)Actuation Center($75,000)
EOG ($27,429)Work-study ($47,622)
-41-
Institution bysocioeconomiclevel Programs Recruitment Financial Aid
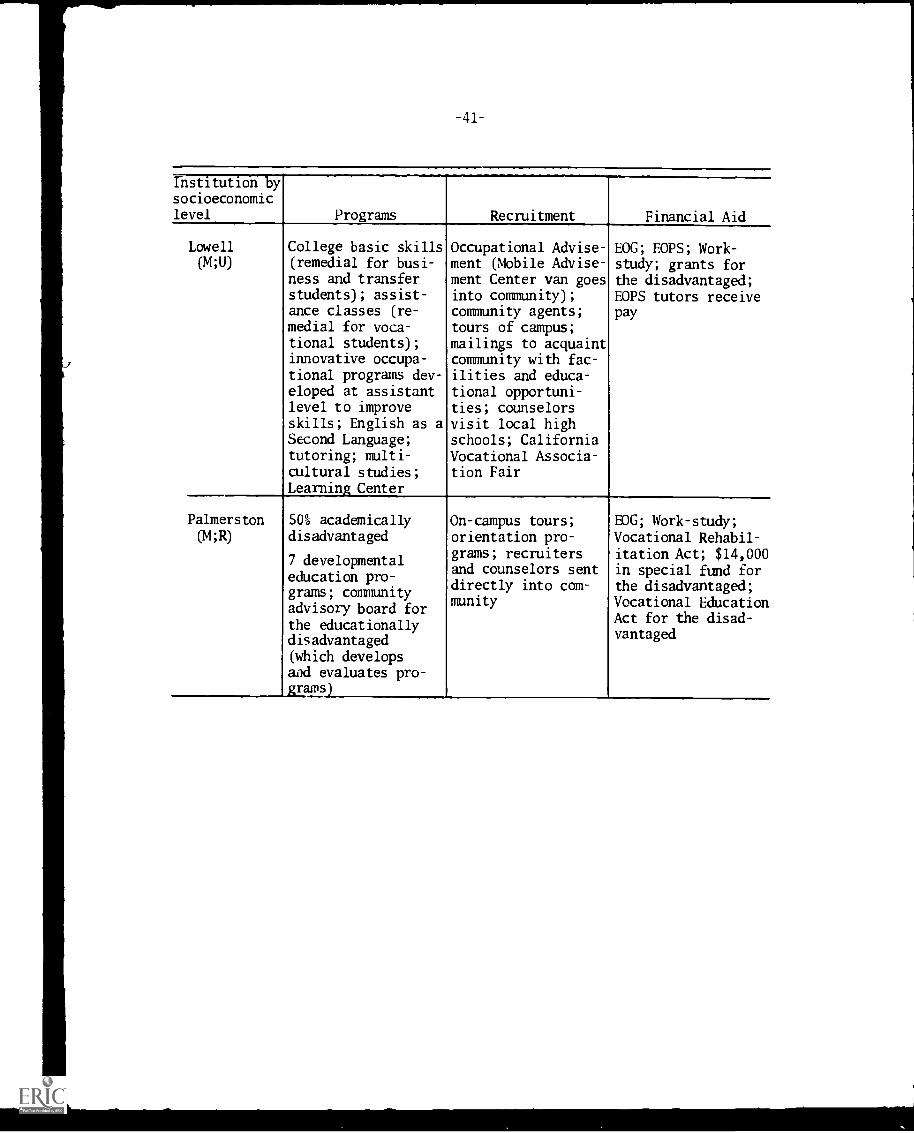
Lowell(4;U)
College basic skills(remedial for busi-ness and transferstudents); assist-ance classes (re-medial for voca-tional students);innovative occupa-tional programs dev-eloped at assistantlevel to improveskills; English as aSecond Language;tutoring; multi-
cultural studies;Learning Center
Occupational Advise-ment (Mobile Advise-ment Center van goesinto community);community agents;tours of campus;mailings to acquaintcommunity with fac-ilities and educa-tional opportuni-ties; counselorsvisit local highschools; CaliforniaVocational Associa-tion Fair
EOG; EOPS; Work-study; grants forthe disadvantaged;EOPS tutors receivepay
Palmerston(CR)
50% academicallydisadvantaged
7 developmentaleducation pro-grams; communityadvisory board forthe educationallydisadvantaged(which developsand evaluates pro-grams)
On-campus tours;orientation pro-grams; recruitersand counselors sentdirectly into com-munity
BOG; Work-study;
Vocational Rehabil-itation Act; $14,000in special fund forthe disadvantaged;Vocational EducationAct for the disad-vantaged
-42-
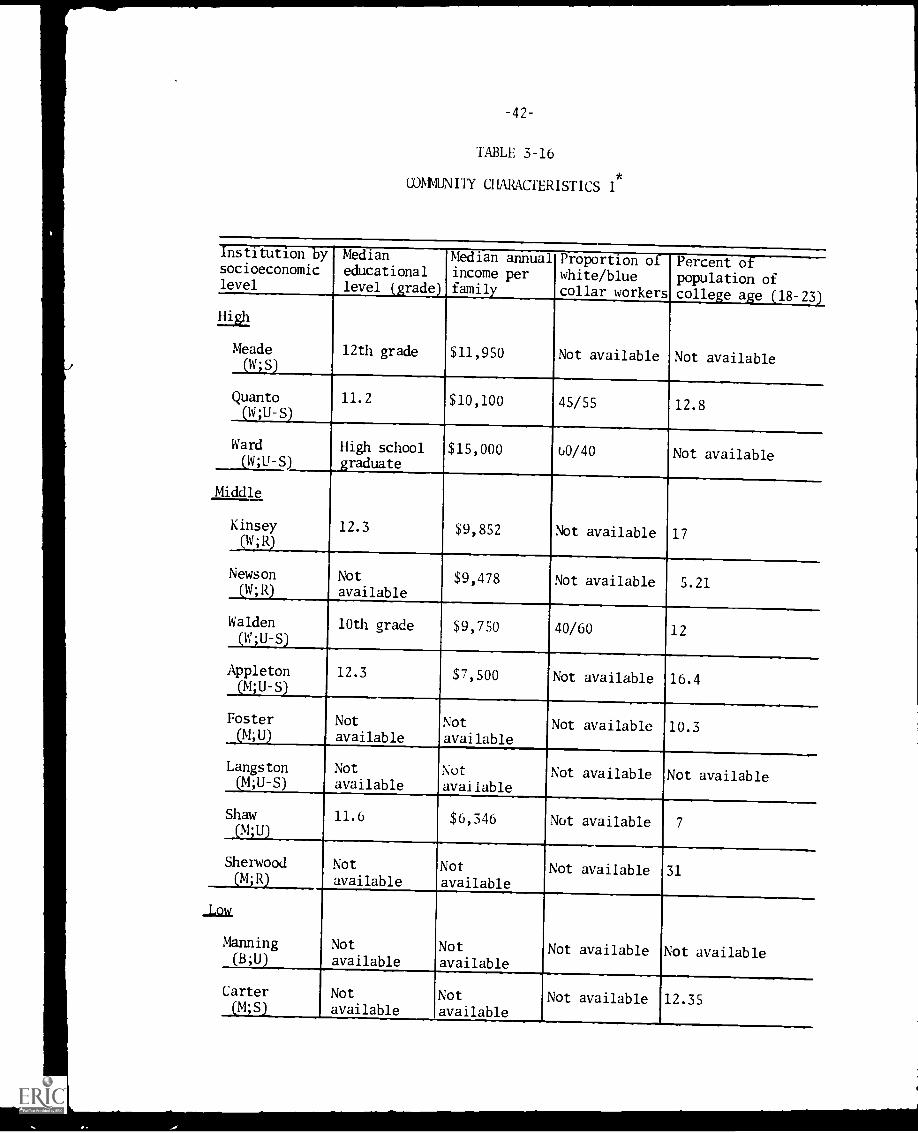
TABLE 3-16
WN1MUNI1Y CHARACTERISTICS I
Institution bysocioeconomiclevel
Medianeducationallevel (grade)
Median annualincome perfamily
Proportion ofwhite/bluecollar workers
Percent ofpopulation ofcollege age (18-23)
High
12th grade $11,950 Not available Not availableMeade(W;S)
Quanto(W;U-S)
11.2 $10,100 45/55 12.8
Ward(K;U-S)
High schoolgraduate
$15,000 60/40 Not available
Middle
12.3 $9,852 Not available 17Kinsey
(W ; R)
Newson(W;R)
Not
available$9,478 Not available 5.21
Walden(W;U-S)
10th grade $9,750 40/60 12
Appleton(M;U-S)
12.3 $7,500 Not available 16.4
Foster(M;U)
Not
availableNot
availableNot available 10.3
Langston(4;U-S)
Notavailable
Not
availableNot available Not available
Shaw(M;U)
11.6 $6,346 Not available 7
Sherwood(M;R)
Not
availableNot
availableNot available 31
lai
Manning(B;U)
Not
availableNot
availableNot available Not available
Carter(M;S1
Not
availableNotavailable
Not available 12.35
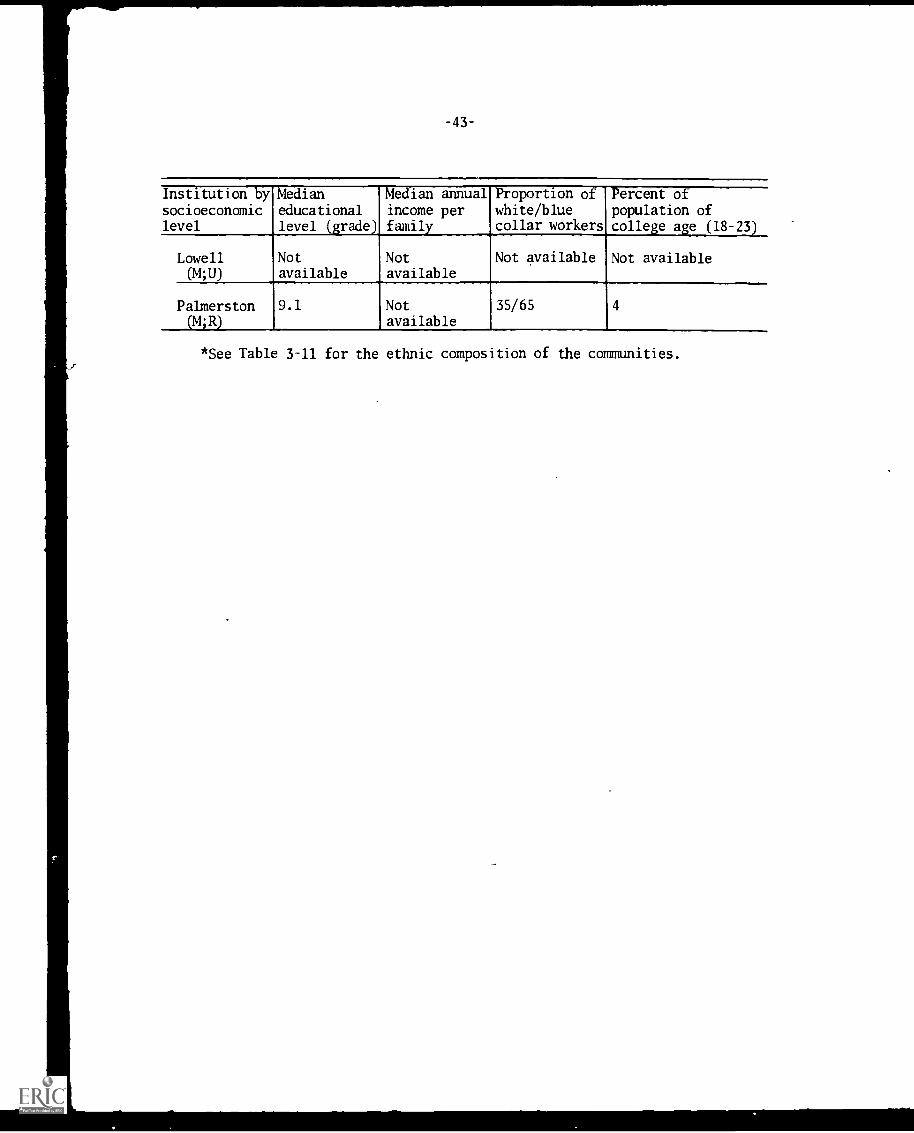
-43-
Institution bysocioeconomiclevel
Medianeducationallevel (grade)
Median annualincome perfamily
Proportion ofwhite/bluecollar workers
Percent ofpopulation ofcollege age (18-23)
Lowell(14;U)
Notavailable
Notavailable
Not available Not available
Palmerston(M;R)
9.1 Not_available
35/65 4
*See Table 3-11 for the ethnic composition of the communities.
-44-
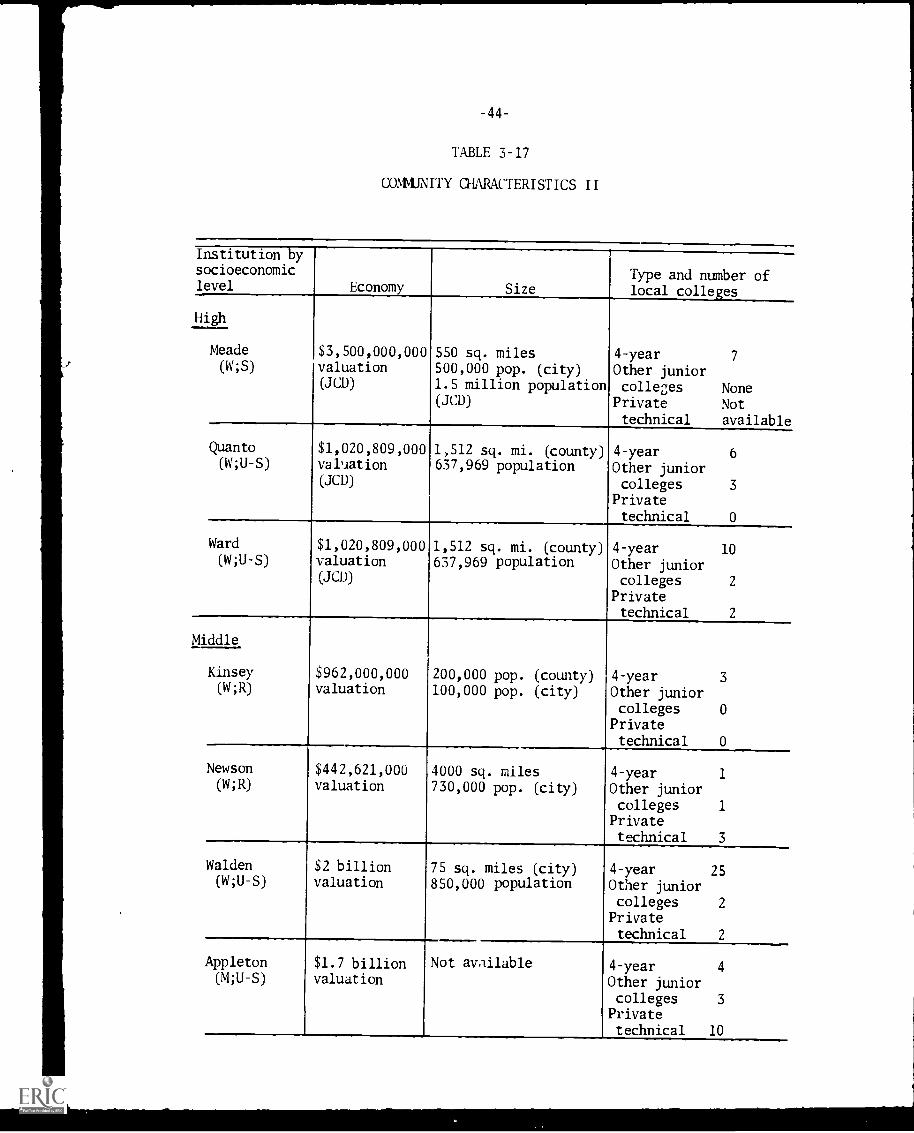
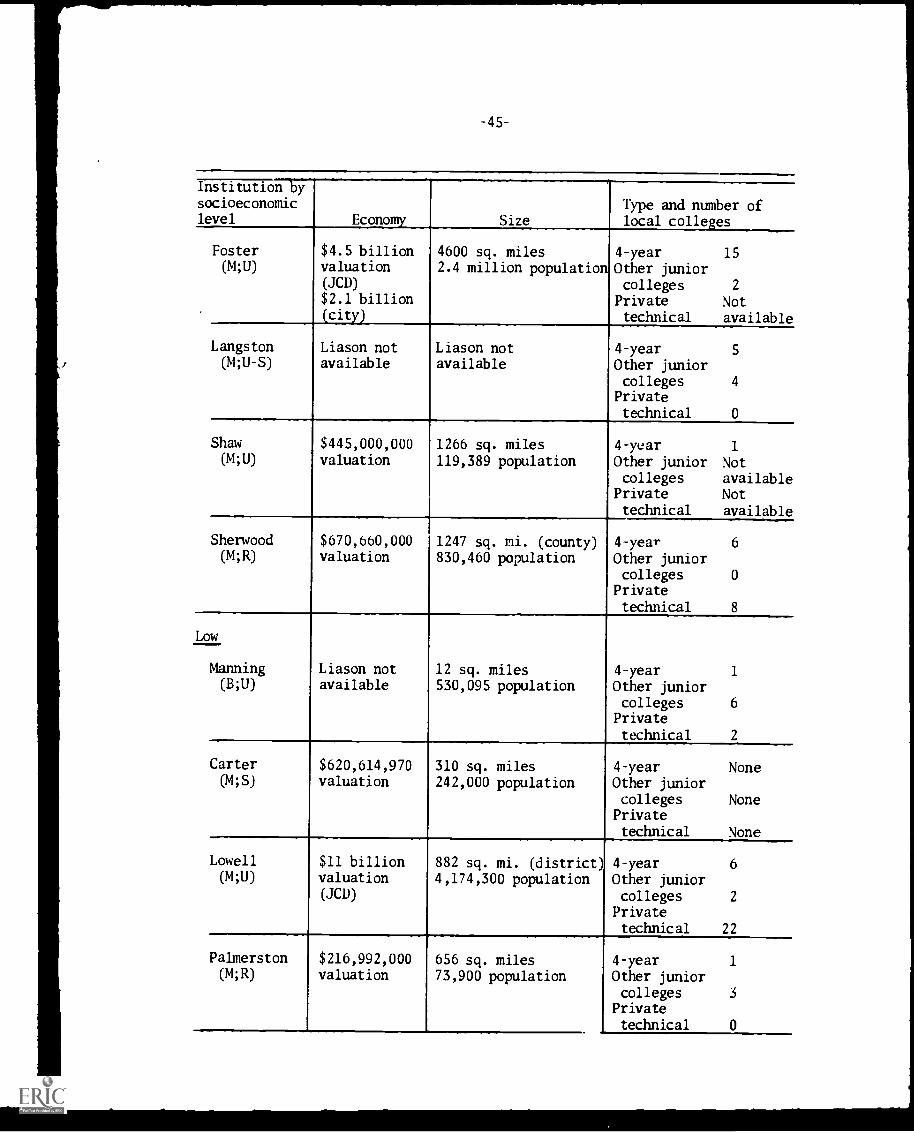
TABLE 3-17
COMMUNITY CHARACTERISTICS II
Institution bysocioeconomiclevel Economy
_.Size
Type and number oflocal colleges
High
$3,500,000,000valuation(JCD)
550 sq. miles
500,000 pop. (city)1.5 million population(JCD)
4-year 7
Other juniorcolleges None
Private Nottechnical available
Meade(W;S)
Quanto(W;U-S)
$1,020,809,000valuation(JCD)
1,512 sq. mi. (county)637,969 population
4-year 6
Other juniorcolleges 3
Private
technical 0
Ward
(W;U-S)$1,020,809,000valuation(JCD)
1,512 sq. mi. (county)637,969 population
4-year 10
Other juniorcolleges 2
Privatetechnical 2
Middle
$962,000,000valuation
200,000 pop. (county)100,000 pop. (city)
4-year 3
Other juniorcolleges 0
Private
technical 0
Kinsey(W;R)
Newson(W;R)
$442,621,000valuation
4000 sq. miles730,000 pop. (city)
4-year 1
Other juniorcolleges 1
Privatetechnical 3
Walden(W;U-S)
$2 billionvaluation
75 sq. miles (city)850,000 population
4-year 25
Other juniorcolleges 2
Privatetechnical 2
Appleton(M;U-S)
$1.7 billionvaluation
Not available 4-year 4
Other juniorcolleges 3
Privatetechnical 10
Institution bysocioeconomiclevel Economy Size
Type and number oflocal colleges
Foster(M;U)
$4.5 billionvaluation(JCD)
$2.1 billion(city)
4600 sq. miles2.4 million population
4-year 15
Other juniorcolleges 2
Private Nottechnical available
Langston(4;U-S)
Liason notavailable
Liason notavailable
4-year 5
Other juniorcolleges 4
Privatetechnical 0
Shaw(M;U)
$445,000,000valuation
1266 sq. miles
119,389 population4-year 1
Other junior Notcolleges available
Private Nottechnical available
Sherwood(M;R)
$670,660,000valuation
1247 sq. mi. (county)830,460 population
4-year 6
Other juniorcolleges 0
Privatetechnical 8
Low
Liason notavailable
12 sq. miles530,095 population
4-year 1
Other juniorcolleges 6
Privatetechnical 2
Manning(B;U)
Carter(M;S)
$620,614,970valuation
310 sq. miles242,000 population
4-year NoneOther juniorcolleges None
Privatetechnical None
Lowell(M;U)
$11 billionvaluation(JCD)
882 sq. mi. (district)4,174,300 population
4-year 6
Other juniorcolleges 2
Privatetechnical 22
Palmerston(4;R)
$216,992,000valuation
656 sq. miles73,900 population
4-year 1
Other juniorcolleges 3
Privatetechnical 0
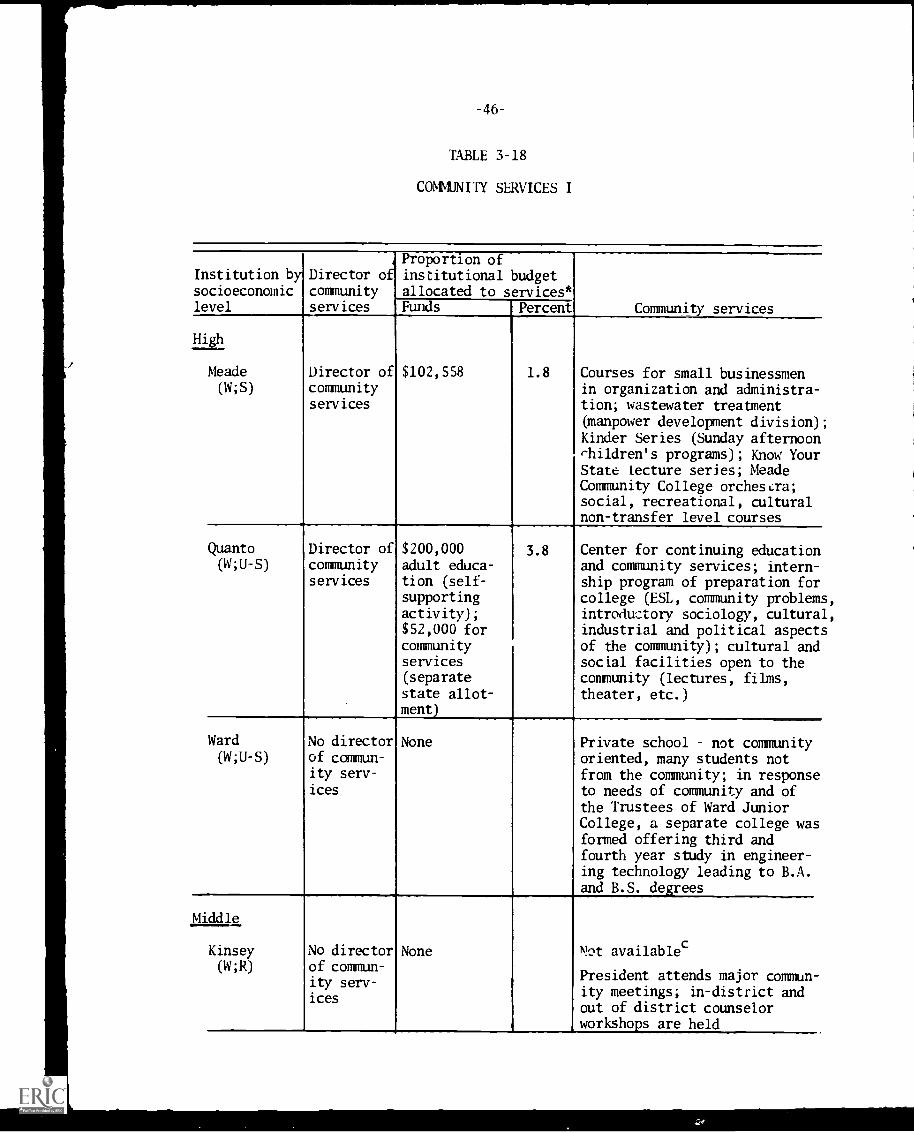
-46-
TABLE 3-18
COMMUNITY SERVICES I
Institution bysocioeconomiclevel
Director ofcommunityservices
Proportion ofinstitutional budgetallocated to services*Funds Percent
Hi
Meade(W;S)
Director ofcommunityservices
$102,558 1.8
Community services
Courses for small businessmenin organization and administra-tion; wastewater treatment(manpower development division);Kinder Series (Sunday afternoonchildren's programs); Know YourState lecture series; MeadeCommunity College orchestra;social, recreational, culturalnon-transfer level courses
Quanto(W;U-S)
Director ofcommunityservices
$200,000adult educa-tion (self-supportingactivity);$52,000 forcommunityservices(separatestate allot-ment)
3.8 Center for continuing educationand community services; intern-ship program of preparation forcollege (ESL, community problems,introductory sociology, cultural,industrial and political aspectsof the community); cultural andsocial facilities open to thecommunity (lectures, films,theater, etc.)
Ward(4;U-S)
No directorof commun-ity serv-
ices
None Private school not communityoriented, many students notfrom the community; in responseto needs of community and ofthe Trustees of Ward JuniorCollege, a separate college wasformed offering third andfourth year study in engineer-ing technology leading to B.A.and B.S. degrees
Middle
Kinsey(W;R)
No directorof commun-ity serv-ices
None Mot availablec
President attends major commun-ity meetings; in-district andout of district counselorworkshops are held
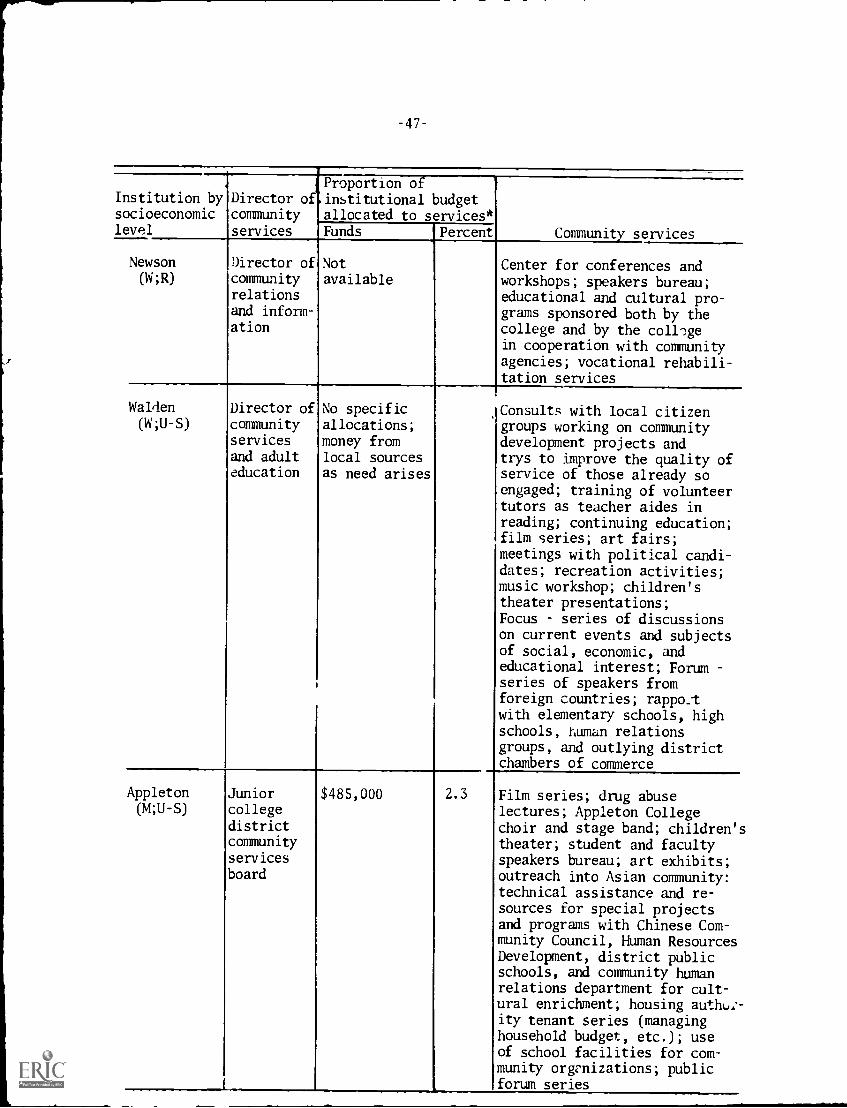
-47-
1Institution bysocioeconomiclevel
Director ofcommunity
services
Proportion ofinstitutional budgetallocated to services*
PercentFunds
Newson(W;R)
Director ofcommunityrelationsand inform-ation
Notavailable
Community services
Center for conferences andworkshops; speakers bureau;educational and cultural pro-grams sponsored both by thecollege and by the collegein cooperation with communityagencies; vocational rehabili-tation services
Walden(W;U-S)
Director of No specificcommunity allocations;services money fromand adult local sourceseducation as need arises
Consults with local citizengroups working on communitydevelopment projects andtrys to improve the quality ofservice of those already soengaged; training of volunteertutors as teacher aides inreading; continuing education;film series; art fairs;meetings with political candi-dates; recreation activities;music workshop; children'stheater presentations;Focus series of discussionson current events and subjectsof social, economic, andeducational interest; Forumseries of speakers fromforeign countries; rappotwith elementary schools, highschools, human relationsgroups, and outlying districtchambers of commerce
Appleton(M;U -S)
Juniorcollegedistrictcommunityservicesboard
$485,000 2.3 Film series; drug abuselectures; Appleton Collegechoir and stage band; children'stheater; student and facultyspeakers bureau; art exhibits;outreach into Asian community:technical assistance and re-sources for special projectsand programs with Chinese Com-munity Council, Human ResourcesDevelopment, district publicschools, and community humanrelations department for cult-ural enrichment; housing authu,--ity tenant series (managinghousehold budget, etc.); useof school facilities for com-munity org'nizations; publicforum series
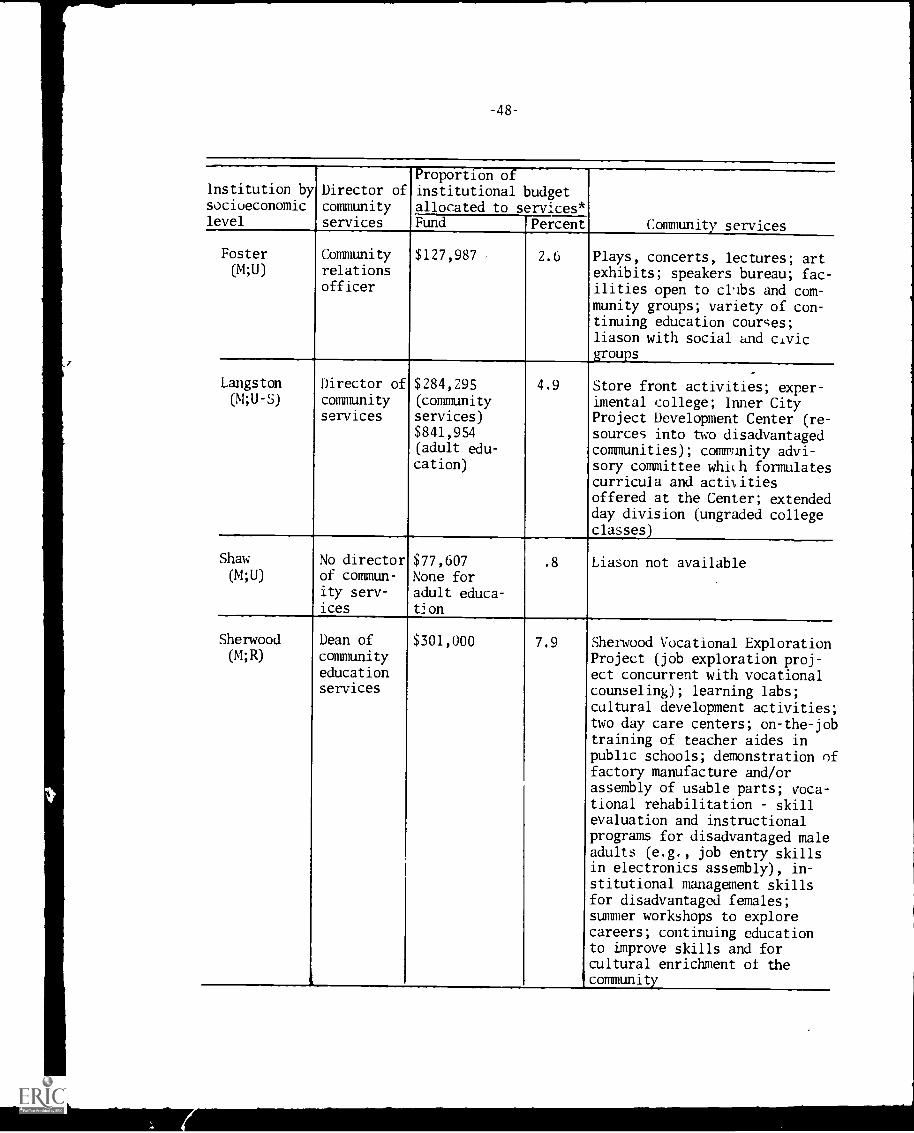
-48-
Institution bysocioeconomiclevel
Director ofcommunity
I
services
Proportion ofinstitutional budgetallocated to services*
Community servicesFund Percent
Foster(M;U)
Communityrelationsofficer
$127,987 2.6 Plays, concerts, lectures; artexhibits; speakers bureau; fac-ilities open to clubs and com-munity groups; variety of con-tinuing education courses;liason with social and civicgroups
Langston(M;U-S)
Director ofcommunityservices
$284,295(communityservices)
$841,954(adult edu-cation)
4.9 Store front activities; exper-imental college; Inner CityProject Development Center (re-sources into two disadvantagedcommunities); community advi-sory committee whit.h formulatescurricula and activitiesoffered at the Center; extendedday division (ungraded collegeclasses)
Shaw(M;U)
No directorof commun-
ity sere-
ices
$77,607None foradult educa-tjon
.8 Liason not available.
Sherwood(M;R)
Dean ofcommunityeducationservices
.
$301,000 7.9 Sherwood Vocational ExplorationProject (job exploration proj-ect concurrent with vocationalcounseling); learning labs;cultural development activitiestwo day care centers; on-the-jotraining of teacher aides inpublic schools; demonstration ofactory manufacture and/orassembly of usable parts; voca-tional rehabilitation skillevaluation and instructionalprograms for disadvantaged maleadults (e.g., job entry skillsin electronics assembly), in-stitutional management skillsfor disadvantaged females;summer workshops to explorecareers; continuing educationto improve skills and forcultural enrichment of thecommunity
f
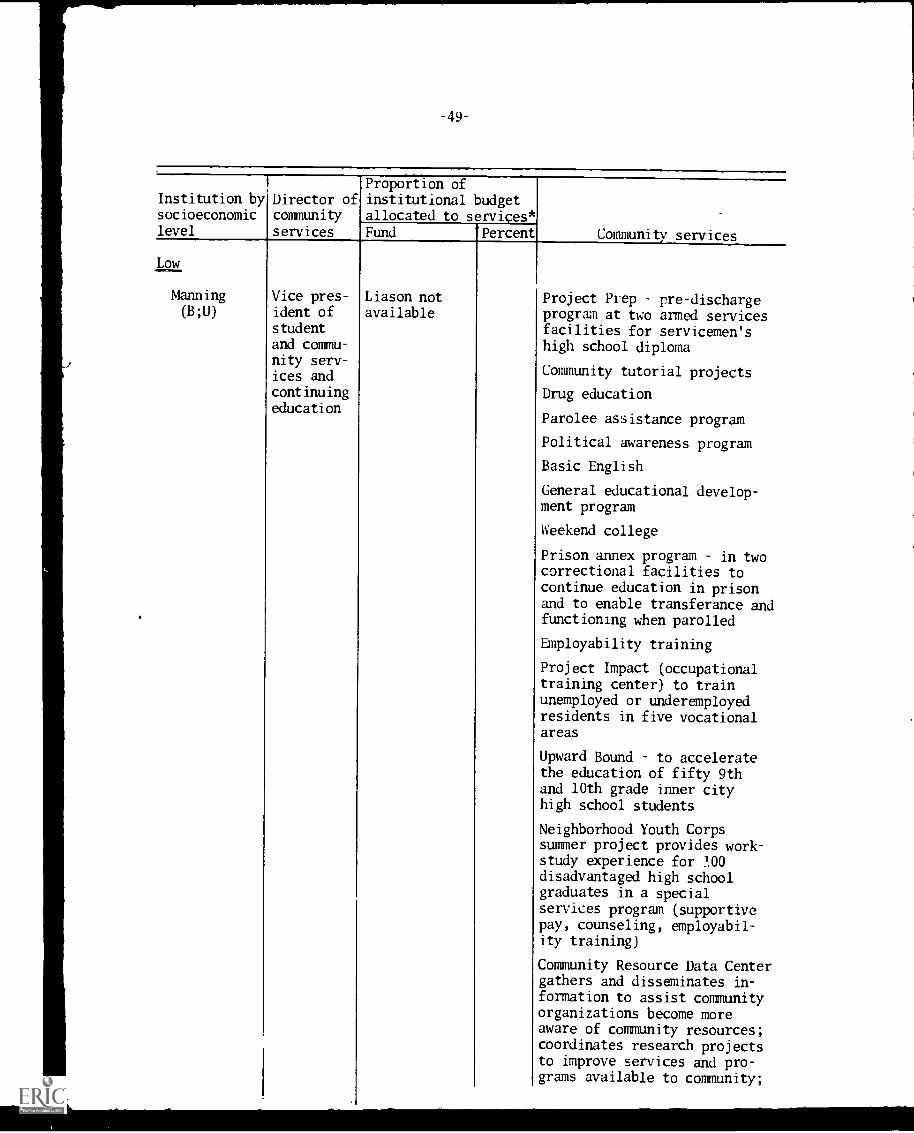
-49-
Institution by Director ofsocioeconomic communitylevel services
Proportion ofinstitutional budgetallocated to services*Fund 'Percent Community services
Low
Manning(B;U)
Vice pres-ident ofstudentand commu-nity serv-ices andcontinuingeducation
Liason notavailable
Project Prep pre-dischargeprogram at two armed servicesfacilities for servicemen'shigh school diploma
Community tutorial projects
Drug education
Parolee assistance program
Political awareness program
Basic English
General educational develop-ment program
Weekend college
Prison annex program in twocorrectional facilities tocontinue education in prisonand to enable transferance andfunctioning when parolled
Employability training
Project Impact (occupationaltraining center) to trainunemployed or underemployedresidents in five vocationalareas
Upward Bound to acceleratethe education of fifty 9thand 10th grade inner cityhigh school students
Neighborhood Youth Corpssummer project provides work-study experience for MOdisadvantaged high schoolgraduates in a specialservices program (supportivepay, counseling, employabil-ity training)
Community Resource Data Centergathers and disseminates in-formation to assist communityorganizations become moreaware of community resources;coordinates research projectsto improve services and pro-grams available to community;
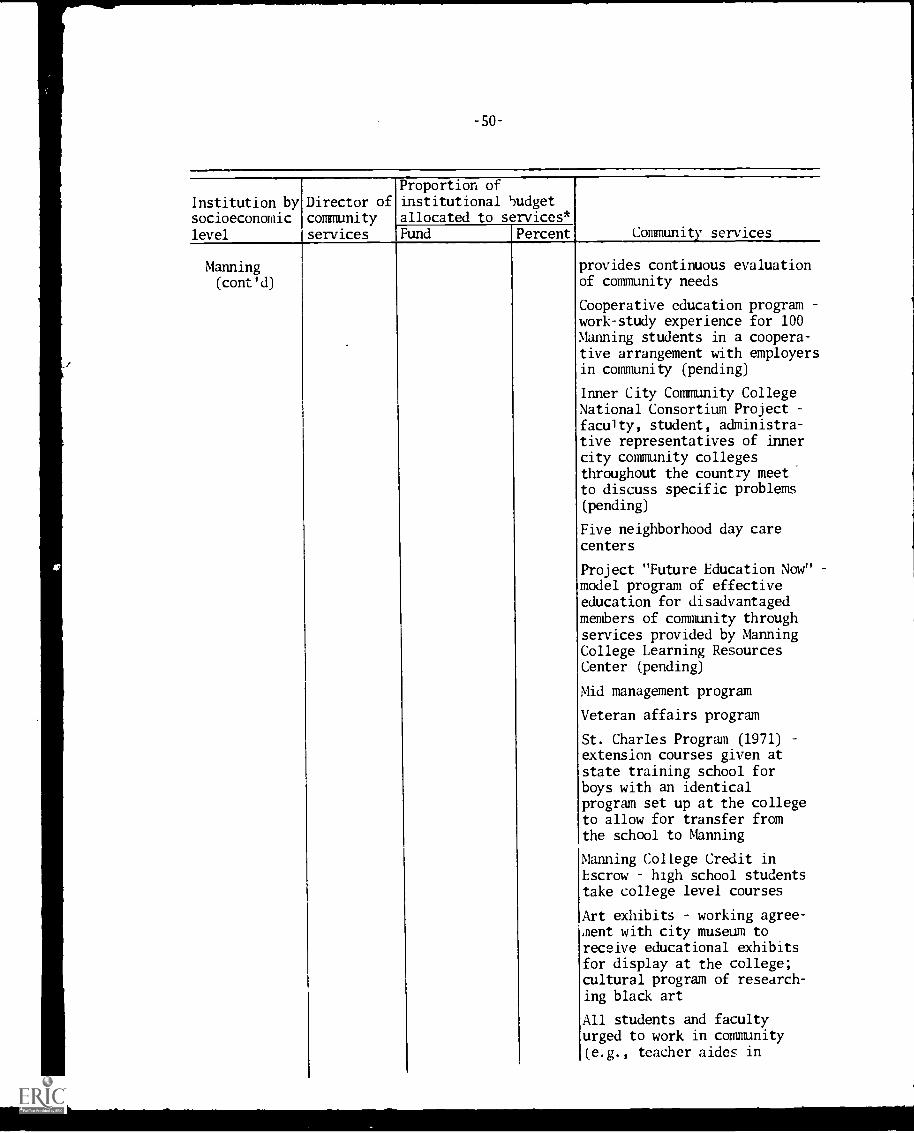
-50-
Institution bysocioeconomiclevel
Director ofcommunityservices
Proportion ofinstitutional budgetallocated to services*Fund Percent Community services
Manning(cont'd)
provides continuous evaluationof community needs
Cooperative education programwork -study experience for 100Manning students in a coopera-tive arrangement with employersin community (pending)
Inner City Community CollegeNational Consortium Projectfaculty, student, administra-tive representatives of innercity community collegesthroughout the country meetto discuss specific problems(pending)
Five neighborhood day carecenters
Project "Future Education Now"model program of effectiveeducation for disadvantagedmembers of community throughservices provided by ManningCollege Learning ResourcesCenter (pending)
Mid management program
Veteran affairs program
St. Charles Program (1971)extension courses given atstate training school forboys with an identicalprogram set up at the collegeto allow for transfer fromthe school to Manning
Manning College Credit inEscrow high school studentstake college level courses
Art exhibits working agree.nent with city museum toreceive educational exhibitsfor display at the college;cultural program of research-ing black art
All students and facultyurged to work in community(e.g., teacher aides in
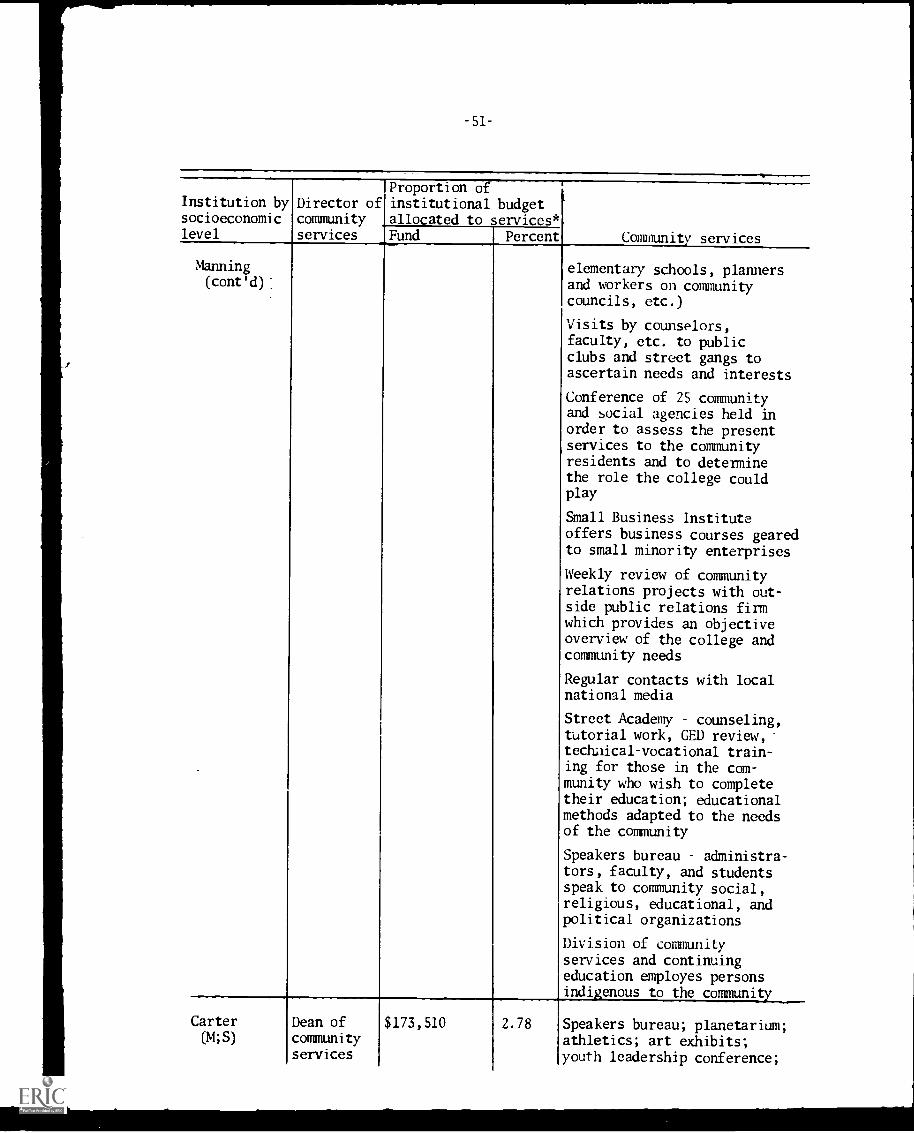
-51-
Institution bysocioeconomiclevel
Director ofcommunityservices
Proportion ofinstitutional budgetallocated to services*Fund Percent Community services
Manning(cont'd
Carter(4;S)
Dean ofcommunityservices
$173,510 2.78
elementary schools, plannersand workers on communitycouncils, etc.)
Visits by counselors,faculty, etc. to publicclubs and street gangs toascertain needs and interests
Conference of 25 communityand social agencies held inorder to assess the presentservices to the communityresidents and to determinethe role the college couldplay
Small Business Institute
offers business courses gearedto small minority enterprises
Weekly review of communityrelations projects with out-side public relations firmwhich provides an objectiveoverview of the college andcommunity needs
Regular contacts with localnational media
Street Academy counseling,tutorial work, GED review,techaical-vocational train-ing for those in the com-munity who wish to completetheir education; educationalmethods adapted to the needsof the community
Speakers bureau administra-tors, faculty, and studentsspeak to community social,religious, educational, andpolitical organizations
Division of communityservices and continuingeducation employes personsindigenous to the community
Speakers bureau; planetarium;athletics; art exhibits;youth leadership conference;
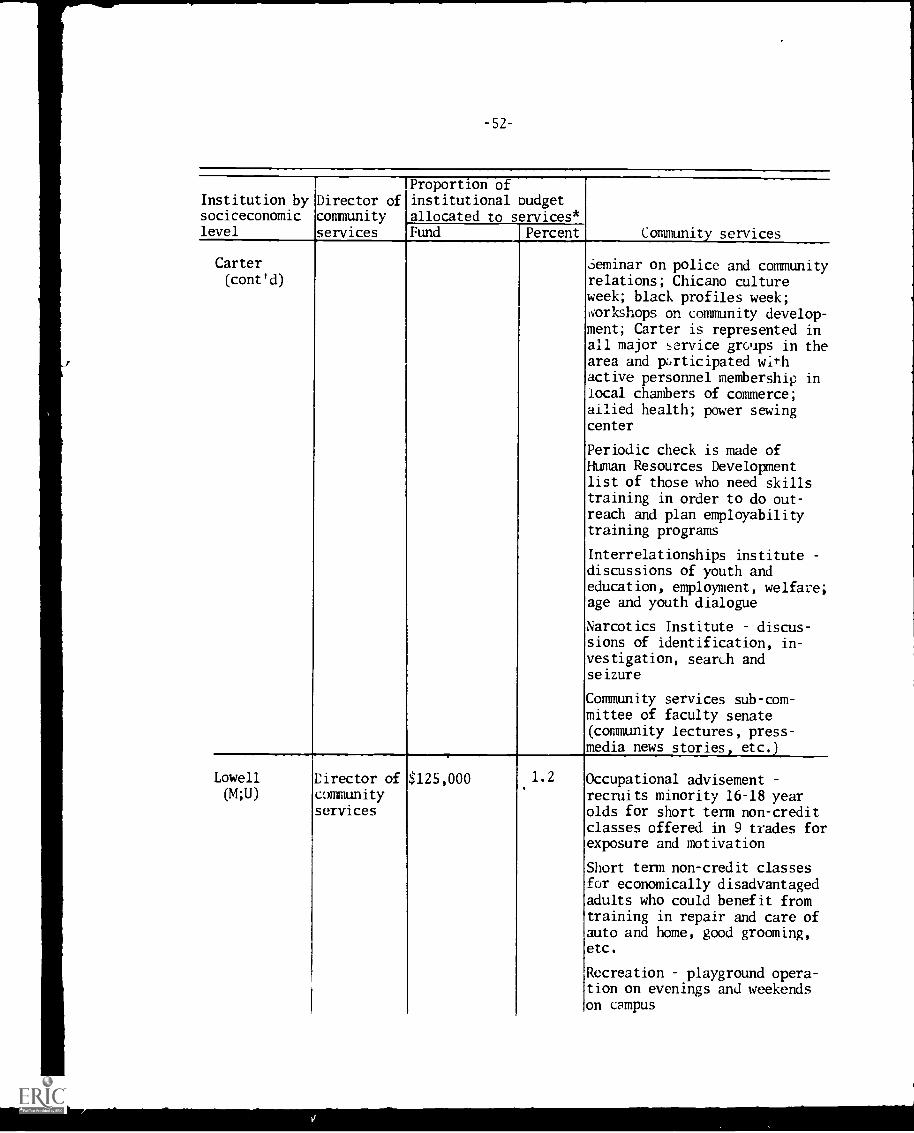
-52-
Institution bysociceconomiclevel
Director ofcommunity
Proportion ofinstitutional budgetallocated to services*
services Fund Percent
Carter(cont'd)
Lowell(A;U)
Lirector ofcommunityservices
$125,000 1.2
Community services
Seminar on police and communityrelations; Chicano cultureweek; black profiles week;workshops on community develop-ment; Carter is represented inall major service groups in thearea and participated withactive personnel membership inlocal chambers of commerce;allied health; power sewingcenter
Periodic check is made ofHuman Resources Developmentlist of those who need skillstraining in order to do out-reach and plan employabilitytraining programs
Interrelationships institutediscussions of youth andeducation, employment, welfare;age and youth dialogue
Narcotics Institute discus-sions of identification, in-vestigation, search andseizure
Community services sub-com-mittee of faculty senate(community lectures, press-media news stories, etc.
Occupational advisementrecruits minority 16-18 yearolds for short term non-creditclasses offered in 9 trades forexposure and motivation
Short term non-credit classesfor economically disadvantagedadults who could benefit fromtraining in repair and care ofauto and home, good grooming,etc.
Recreation playground opera-tion on evenings and weekendson campus
-53-
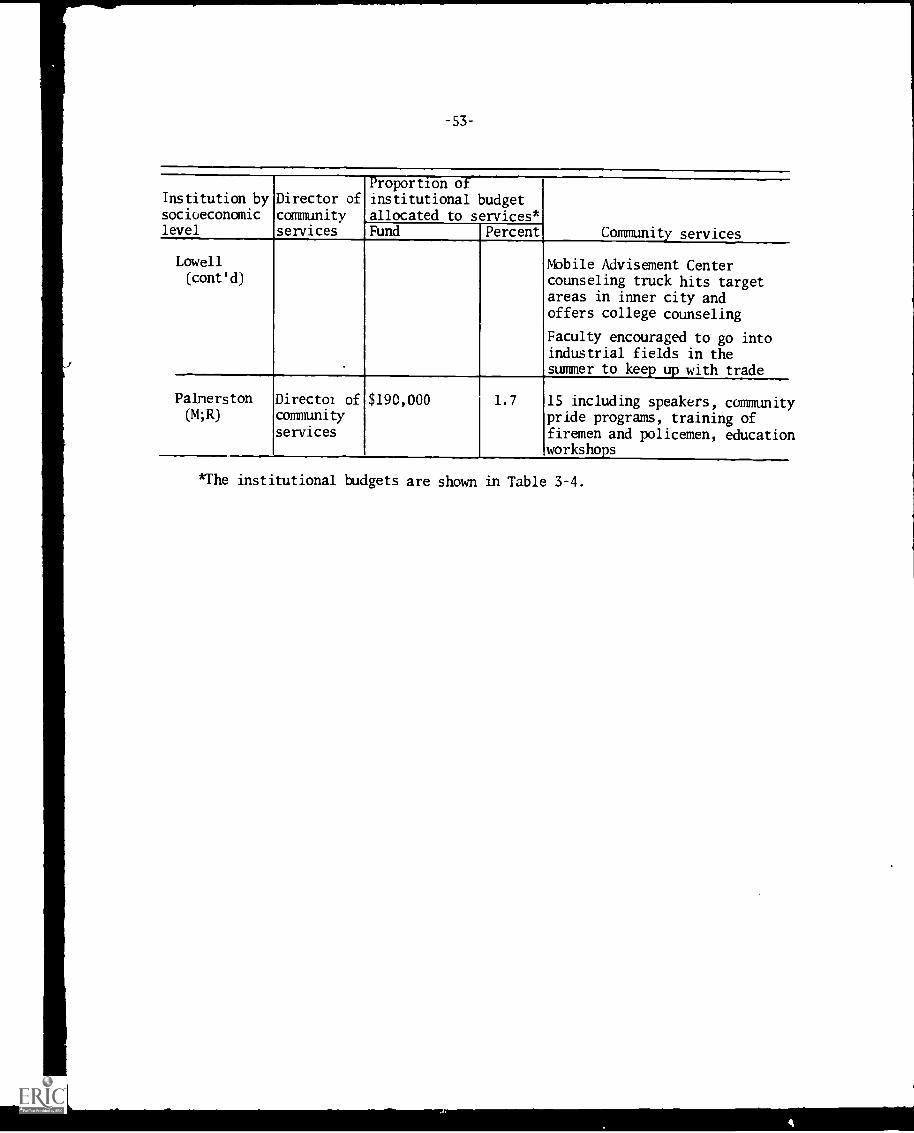
Proportion ofInstitution by Director of institutional budgetsocioeconomic community allocated to services*level services Fund Percent Community services
Lowell Mobile Advisement Center(cont'd) counseling truck hits target
areas in inner city andoffers college counseling
Faculty encouraged to go intoindustrial fields in thesummer to keep up with trade
Palnerston Directoi of $190,000 1.7 15 including speakers, communit:(4;R) community pride programs, training of
services firemen and policemen, educatio nworkshops
*The institutional budgets are shown in Table 3-4.
-54-
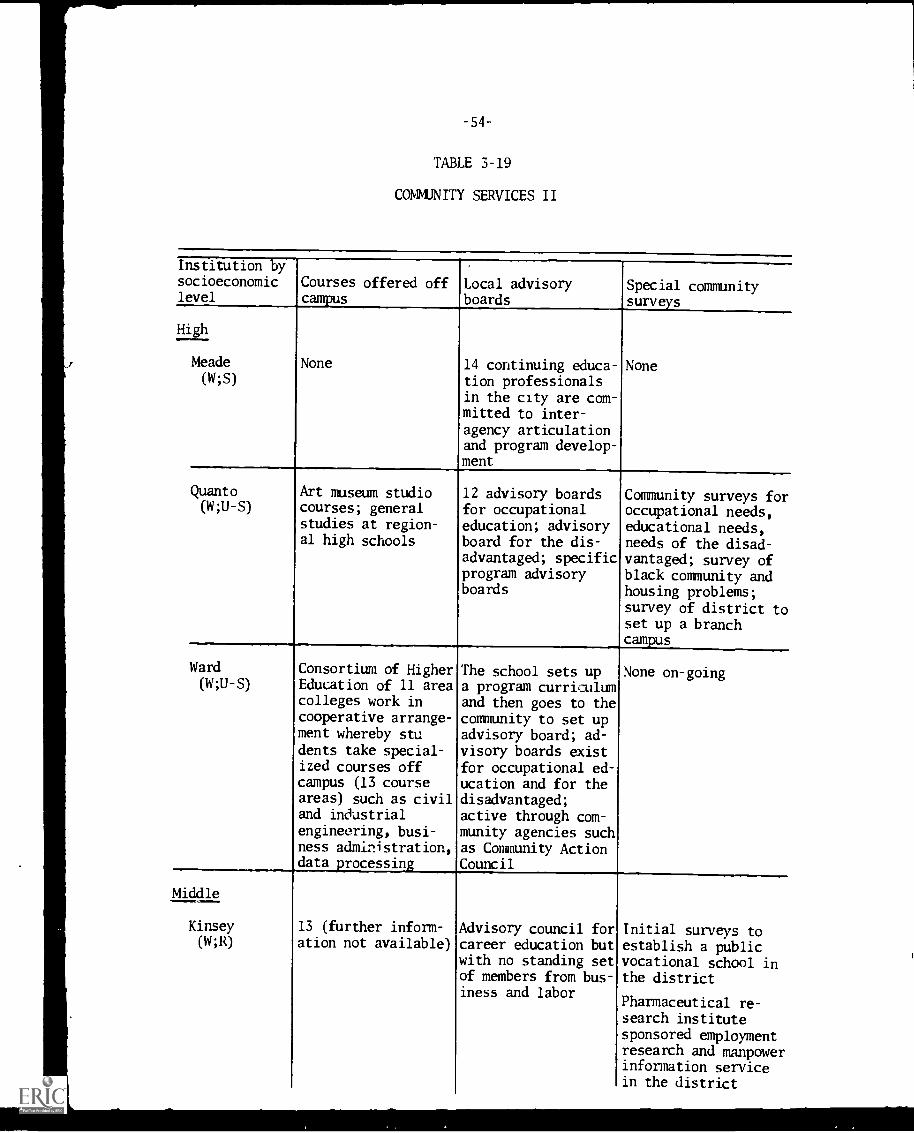
TABLE 3-19
COMMUNITY SERVICES II
Institution bysocioeconomiclevel
Courses offered offcampus
Local advisoryboards
Special communitysurveys
High
Meade(W;S)
None 14 continuing educa-tion professionalsin the city are com-mitted to inter-agency articulationand program develop-ment
None
Quanta(W;U-S)
Art museum studiocourses; generalstudies at region-al high schools
12 advisory boardsfor occupationaleducation; advisoryboard for the dis-advantaged; specificprogram advisoryboards
Community surveys foroccupational needs,educational needs,needs of the disad-vantaged; survey ofblack community andhousing problems;survey of district toset up a branchcampus
Ward(W;U-S)
Consortium of HigherEducation of 11 areacolleges work incooperative arrange-ment whereby students take special-ized courses offcampus (13 courseareas) such as civiland industrialengineering, busi-ness administration,data .rocessin'
The school sets upa program curriculumand then goes to thecommunity to set upadvisory board; ad-visory boards existfor occupational ed-ucation and for thedisadvantaged;active through com-munity agencies suchas Community ActionCouncil
None on-going
Middle
Kinsey
(W; R)
13 (further inform- Advisory council foration not available) career education but
with no standing setof members from bus-iness and labor
Initial surveys toestablish a publicvocational school inthe district
Pharmaceutical re-search institutesponsored employmentresearch and manpowerinformation servicein the district
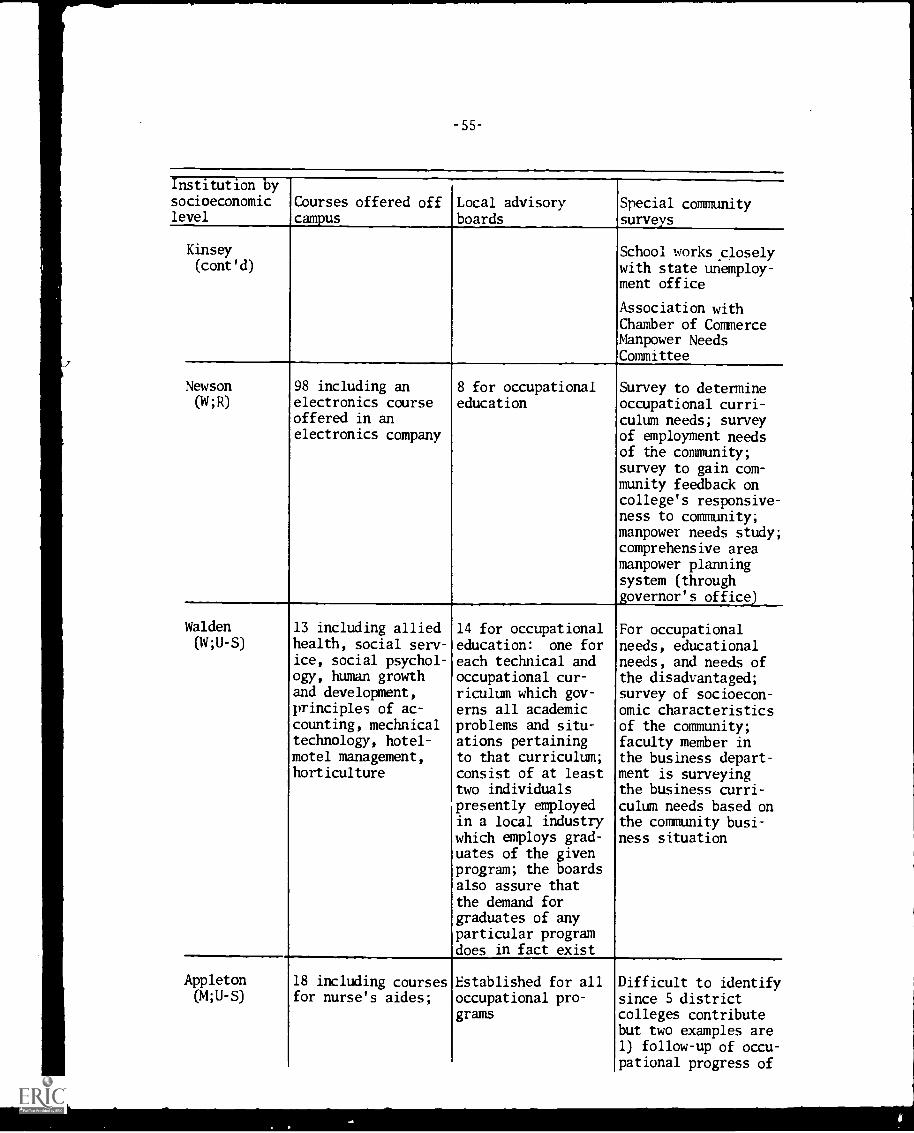
-55-
Institution by
socioeconomiclevel
Courses offered offcampus
Local advisoryboards
Special communitysurveys
Kinsey(cont'd)
School works _closely
with state unemploy-ment office
Association withChamber of CommerceManpower NeedsCommittee
Newson(N;R)
98 including anelectronics courseoffered in anelectronics company
8 for occupationaleducation
Survey to determineoccupational curri-culum needs; surveyof employment needsof the community;survey to gain com-munity feedback oncollege's responsive-ness to community;manpower needs study;comprehensive areamanpower planningsystem (throughgovernor's office
Walden(N;U-S)
13 including alliedhealth, social serv-ice, social psychol-ogy, human growthand development,principles of ac-counting, mechnicaltechnology, hotel-motel management,horticulture
14 for occupational
education: one foreach technical andoccupational cur-riculum which gov-erns all academicproblems and situ-ations pertainingto that curriculum;consist of at leasttwo individualspresently employedin a local industrywhich employs grad-uates of the givenprogram; the boardsalso assure thatthe demand forgraduates of anyparticular programdoes in fact exist
For occupationalneeds, educationalneeds, and needs ofthe disadvantaged;survey of socioecon-
omic characteristicsof the community;faculty member inthe business depart-ment is surveyingthe business curri-culum needs based onthe community busi-ness situation
Appleton(M;U-S)
18 including courses Established for all Difficult to identifyfor nurse's aides; occupational pro- since 5 district
grains colleges contributebut two examples are1) follow-up of occu-pational progress of
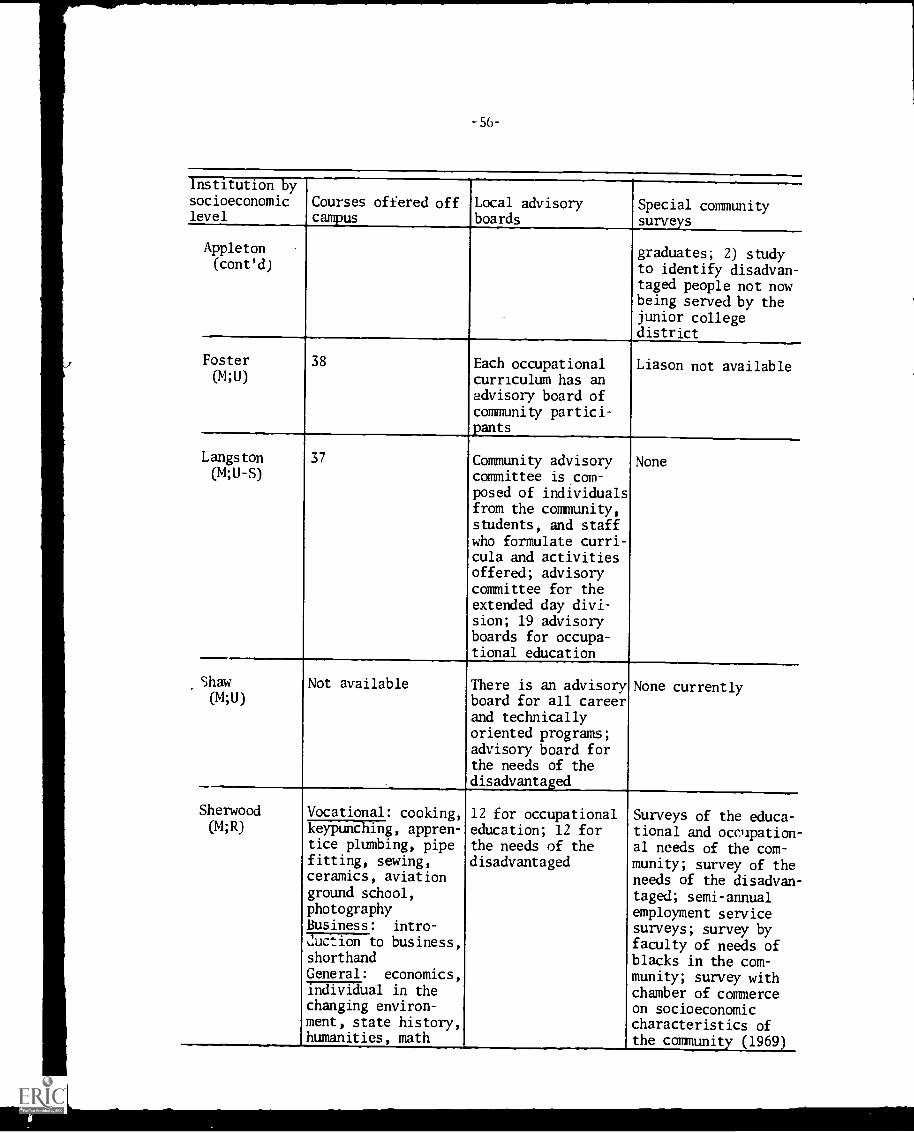
Institution bysocioeconomiclevel
Courses offered offcampus
Local advisoryboards
Special communitysurveys
Appleton(cont'd)
graduates; 2) studyto identify disadvan-taged people not nowbeing served by thejunior collegedistrict
Foster(M;U)
38 Each occupationalcurriculum has anadvisory board ofcommunity partici-pants
Liason not available
Langston(M;U -S)
37 Community advisorycommittee is com-posed of individualsfrom the community,students, and staffwho formulate curri-cula and activitiesoffered; advisorycommittee for theextended day divi-sion; 19 advisoryboards for occupa-tional education
None
Shaw(M;U)
Not available There is an advisoryboard for all careerand technicallyoriented programs;advisory board forthe needs of thedisadvantaged
None currently
Sherwood(M;R)
_
Vocational: cooking, 12 for occupationaleducation; 12 forthe needs of thedisadvantaged
Surveys of the educa-tional and occupational needs of the com-munity; survey of theneeds of the disadvantaged; semi-annualemployment servicesurveys; survey byfaculty of needs ofblacks in the com-munity; survey withchamber of commerceon socioeconomiccharacteristics ofthe community (1969)
keypunching, appren-tice plumbing, pipefitting, sewing,ceramics, aviationground school,photographyBusiness: intro-
auction to business,shorthandGeneral: economics,individual in thechanging environ-ment, state history,humanities, math
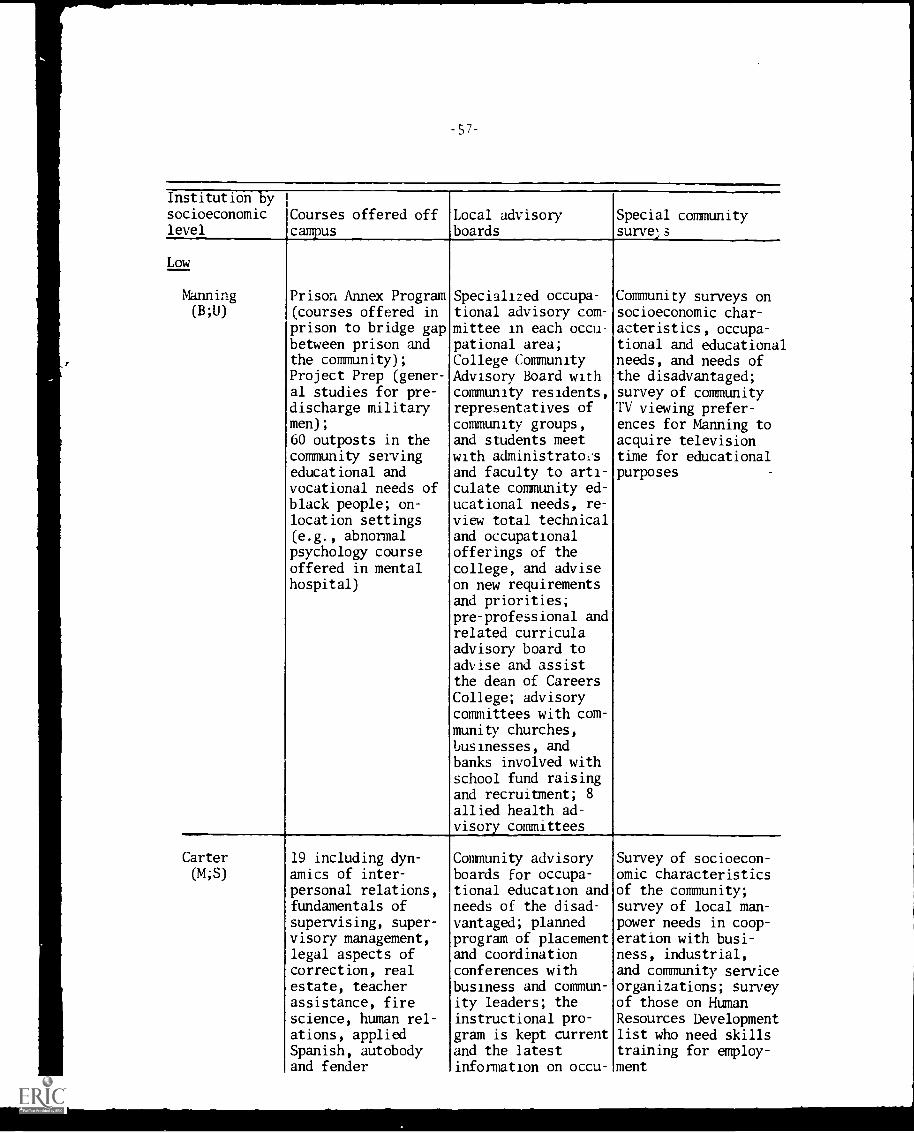
-57-
Institution bysocioeconomiclevel
Courses offered offcampus
Local advisoryboards
Special communitysurve,,s
Low
Manning(B;U)
Prison Annex Program(courses offered inprison to bridge gapbetween prison andthe community);Project Prep (gener-al studies for pre-discharge militarymen);60 outposts in thecommunity servingeducational andvocational needs ofblack people; on-location settings(e.g., abnormalpsychology courseoffered in mentalhospital)
Carter
(M;S)
19 including dyn-amics of inter-personal relations,fundamentals ofsupervising, super-visory management,legal aspects ofcorrection, realestate, teacherassistance, firescience, human rel-ations, appliedSpanish, autobodyand fender
Specialized occupa-tional advisory com-mittee in each occu-pational area;College CommunityAdvisory Board withcommunity residents,representatives ofcommunity groups,and students meetwith administratofsand faculty to arti-culate community ed-ucational needs, re-view total technicaland occupationalofferings of thecollege, and adviseon new requirementsand priorities;pre-professional andrelated curriculaadvisory board toadvise and assistthe dean of CareersCollege; advisorycommittees with com-munity churches,businesses, andbanks involved withschool fund raisingand recruitment; 8allied health ad-visory committees
Community advisoryboards for occupa-tional education andneeds of the disad-vantaged; plannedprogram of placementand coordinationconferences withbusiness and commun-ity leaders; theinstructional pro-gram is kept currentand the latestinformation on occu-
Community surveys onsocioeconomic char-acteristics, occupa-tional and educationalneeds, and needs ofthe disadvantaged;survey of communityTV viewing prefer-ences for Manning toacquire televisiontime for educationalpurposes
Survey of socioecon-omic characteristicsof the community;survey of local man-power needs in coop-eration with busi-ness, industrial,and community serviceorganizations; surveyof those on HumanResources Developmentlist who need skillstraining for employ-ment
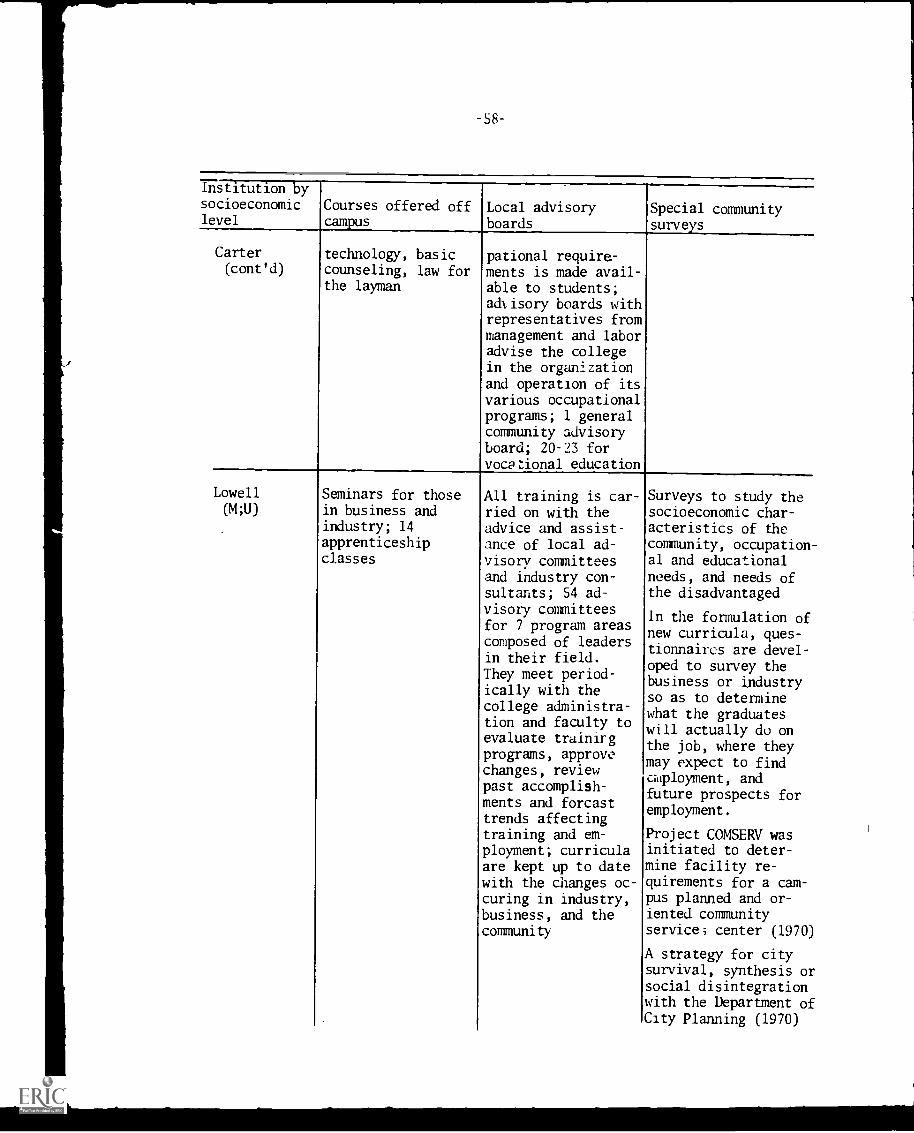
-58-
Institution bysocioeconomiclevel
Courses offered offcampus
Local advisoryboards
Carter(cont'd)
technology, basiccounseling, law forthe layman
pational require-ments is made avail-able to students;advisory boards withrepresentatives frommanagement and laboradvise the collegein the organizationand operation of itsvarious occupationalprograms; 1 generalcommunity advisoryboard; 20-23 forvocational education
Special communitysurveys
Lowell
(M;U)Seminars for thosein business andindustry; 14apprenticeshipclasses
All training is car-ried on with theadvice and assist-ance of local ad-visory committeesand industry con-sultants; 54 ad-visory committeesfor 7 program areascomposed of leadersin their field.They meet period-ically with thecollege administra-tion and faculty toevaluate trainirgprograms, approvechanges, reviewpast accomplish-ments and forcasttrends affectingtraining and em-ployment; curriculaare kept up to datewith the changes oc-curing in industry,business, and thecommunity
Surveys to study thesocioeconomic char-
acteristics of thecommunity, occupation-al and educational
needs, and needs ofthe disadvantaged
In the formulation ofnew curricula, ques-
tionnaires are devel-oped to survey thebusiness or industryso as to determinewhat the graduateswill actually de onthe job, where theymay expect to findaployment, andfuture prospects foremployment.
Project COMSERV wasinitiated to deter-mine facility re-
quirements for a cam-pus planned and or-iented communityservice; center (1970)
A strategy for citysurvival, synthesis orsocial disintegrationwith the Department ofCity Planning (1970)
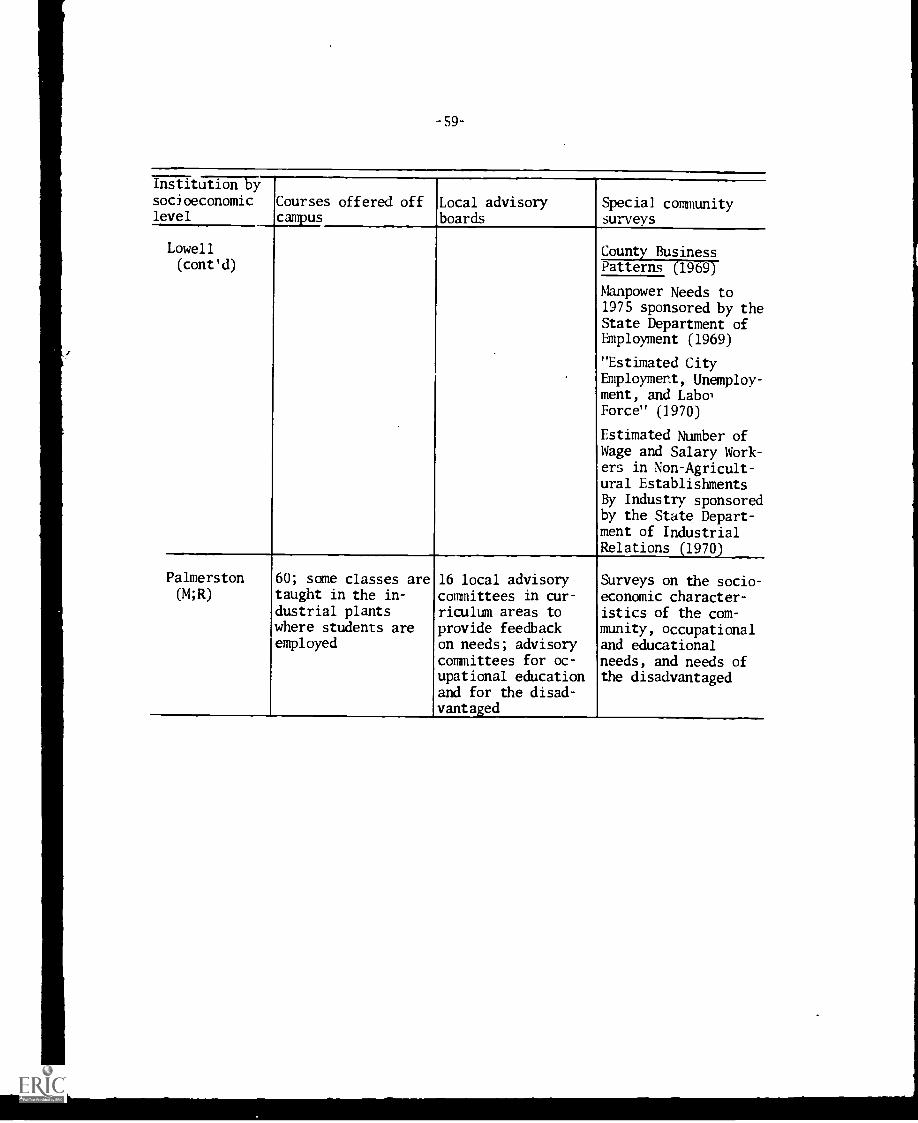
-S9-
Institutionsocioeconomiclevel
Courses offered offcampus
Local advisoryboards
Special communitysurveys
Lowell(cont'd)
County BusinessPatterns (1969)
Manpower Needs to1975 sponsored by theState Department ofEmployment (1969)
"Estimated CityEmployment, Unemploy-ment, and 'Apo)Force" (1970)
Estimated Number ofWage and Salary Work-ers in Non-Agricult-ural EstablishmentsBy Industry sponsoredby the State Depart-ment of IndustrialRelations (1970
Palmerston(M;R)
60; some classes aretaught in the in-dustrial plantswhere students areemployed
16 local advisorycommittees in cur-riculum areas toprovide feedbackon needs; advisorycommittees for oc-upational educationand for the disad-vantaged
Surveys on the socio-economic character-istics of the com-munity, occupationaland educationalneeds, and needs ofthe disadvantaged
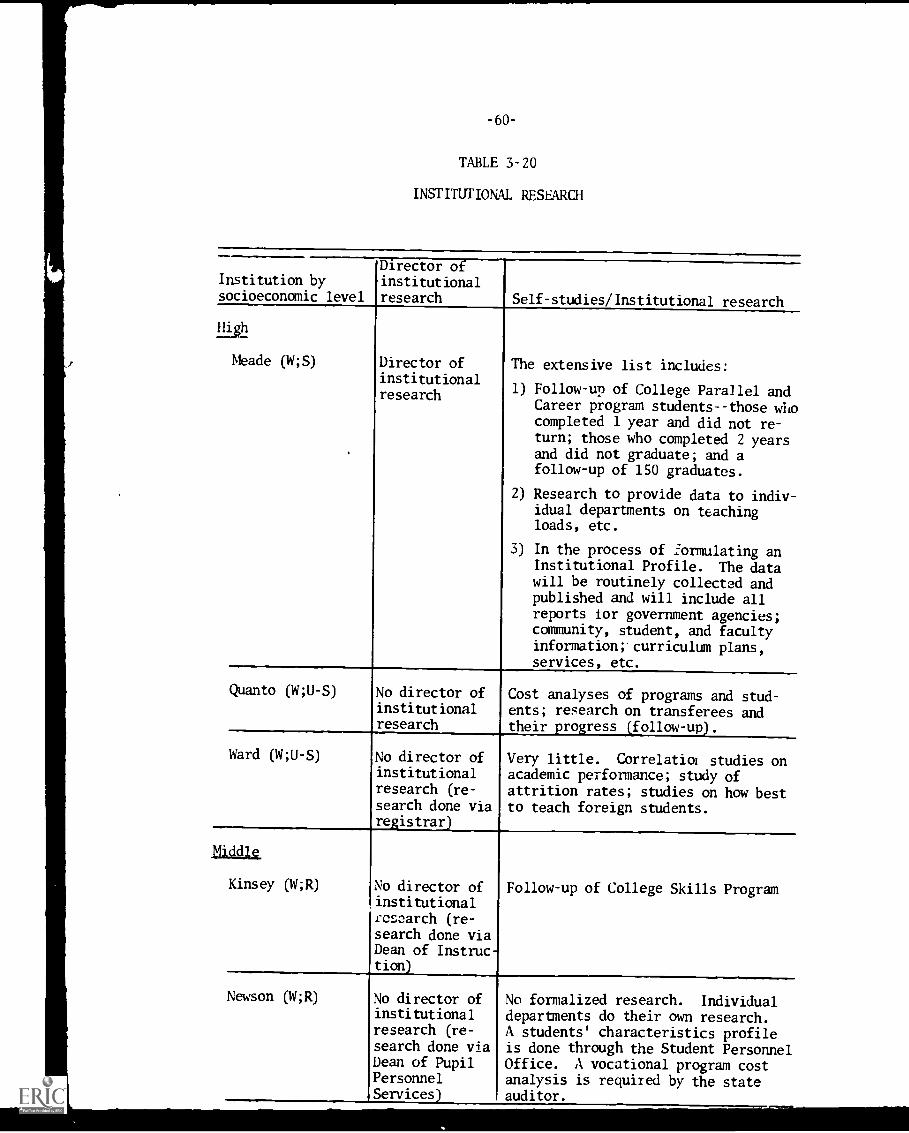
-60-
TABLE 3-20
INSTITUTIONAL RESEARCH
Institution bysocioeconomic level
Director ofinstitutionalresearch Self-studies/Institutional research
Meade (W;S) Director ofinstitutionalresearch
The extensive list includes:
1) Follow-up of College Parallel andCareer program students--those whocompleted 1 year and did not re-turn; those who completed 2 yearsand did not graduate; and afollow-up of 150 graduates.
2) Research to provide data to indiv-idual departments on teachingloads, etc.
3) In the process of .formulating anInstitutional Profile. The datawill be routinely collected andpublished and will include allreports for government agencies;community, student, and facultyinformation;-curriculum plans,services, etc.
Quanto (W;U-S) No director ofinstitutionalresearch
Cost analyses of programs and stud-ents; research on transferees andtheir progress (follow-up).
Ward (W;U-S) No director ofinstitutionalresearch (re-search done viaregistrar)
Very little. Correlatiol studies onacademic performance; study ofattrition rates; studies on how bestto teach foreign students.
Middle
Kinsey (W;R) No director of Follow-up of College Skills Programinstitutionalresearch (re-search done viaDean of Instruc-tion)
Newson (W;R) No director ofinstitutionalresearch (re-search done viaDean of PupilPersonnelServices)
No formalized research. Individualdepartments do their own research.A students' characteristics profileis done through the Student PersonnelOffice. A vocational program costanalysis is required by the stateauditor.
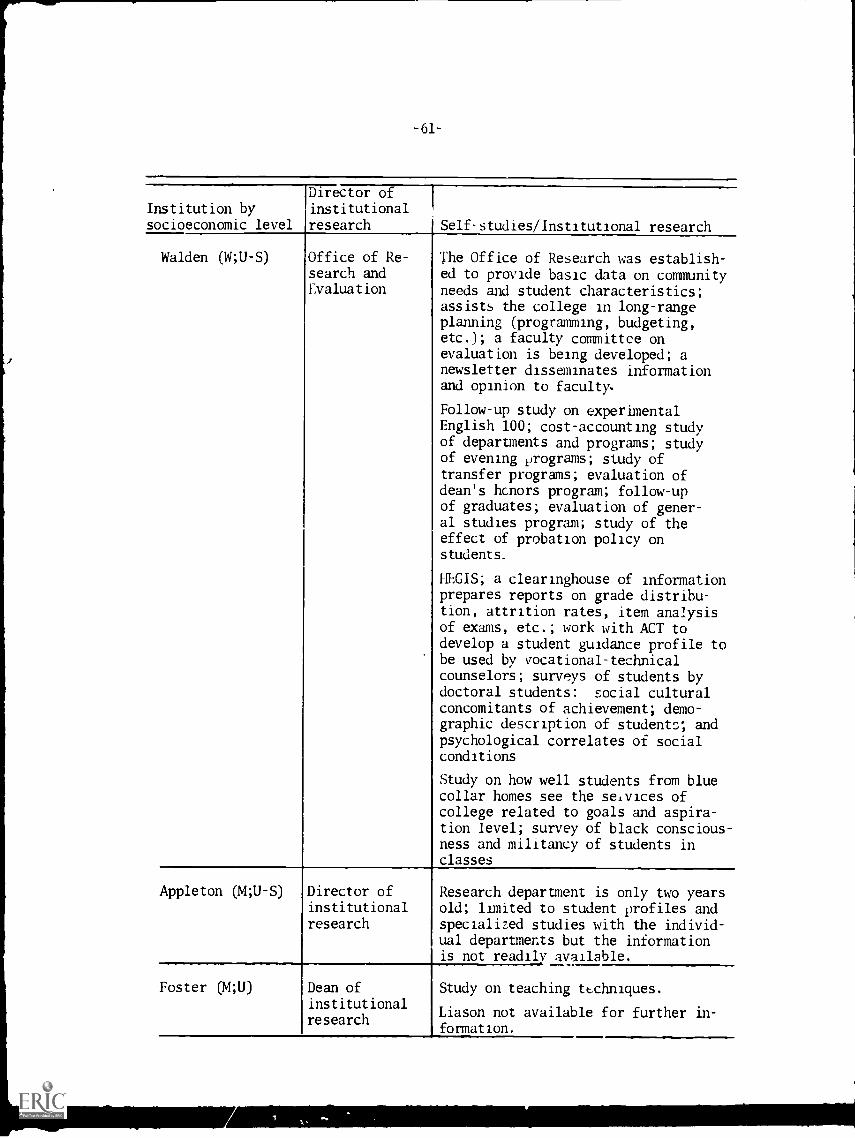
-6l-
Institution bysocioeconomic level
Director ofinstitutionalresearch Self-studies/Institutional research
Walden (W;U-S) Office of Re-search andEvaluation
The Office of Research was establish-ed to provide basic data on communityneeds and student characteristics;assists the college in long-rangeplanning (programming, budgeting,etc.); a faculty committee onevaluation is being developed; anewsletter disseminates informationand opinion to faculty.
Follow-up study on experimentalEnglish 100; cost-accounting studyof departments and programs; studyof evening programs; study oftransfer programs; evaluation ofdean's hcnors program; follow-upof graduates; evaluation of gener-al studies program; study of theeffect of probation policy onstudents.
FIEGIS; a clearinghouse of informationprepares reports on grade distribu-tion, attrition rates, item analysisof exams, etc.; work with ACT to
develop a student guidance profile tobe used by vocational-technicalcounselors; surveys of students bydoctoral students: social culturalconcomitants of achievement; demo-graphic description of students; andpsychological correlates of socialconditions
Study on how well students from bluecollar homes see the services ofcollege related to goals and aspira-tion level; survey of black conscious-ness and militancy of students inclasses
Appleton (M;U -S) Director ofinstitutionalresearch
Research department is only two yearsold; limited to student profiles andspecialized studies with the individ-ual departments but the informationis not readily available.
Foster (4;U) Dean ofinstitutionalresearch
Study on teaching techniques.
Liason not available for further in-formation.
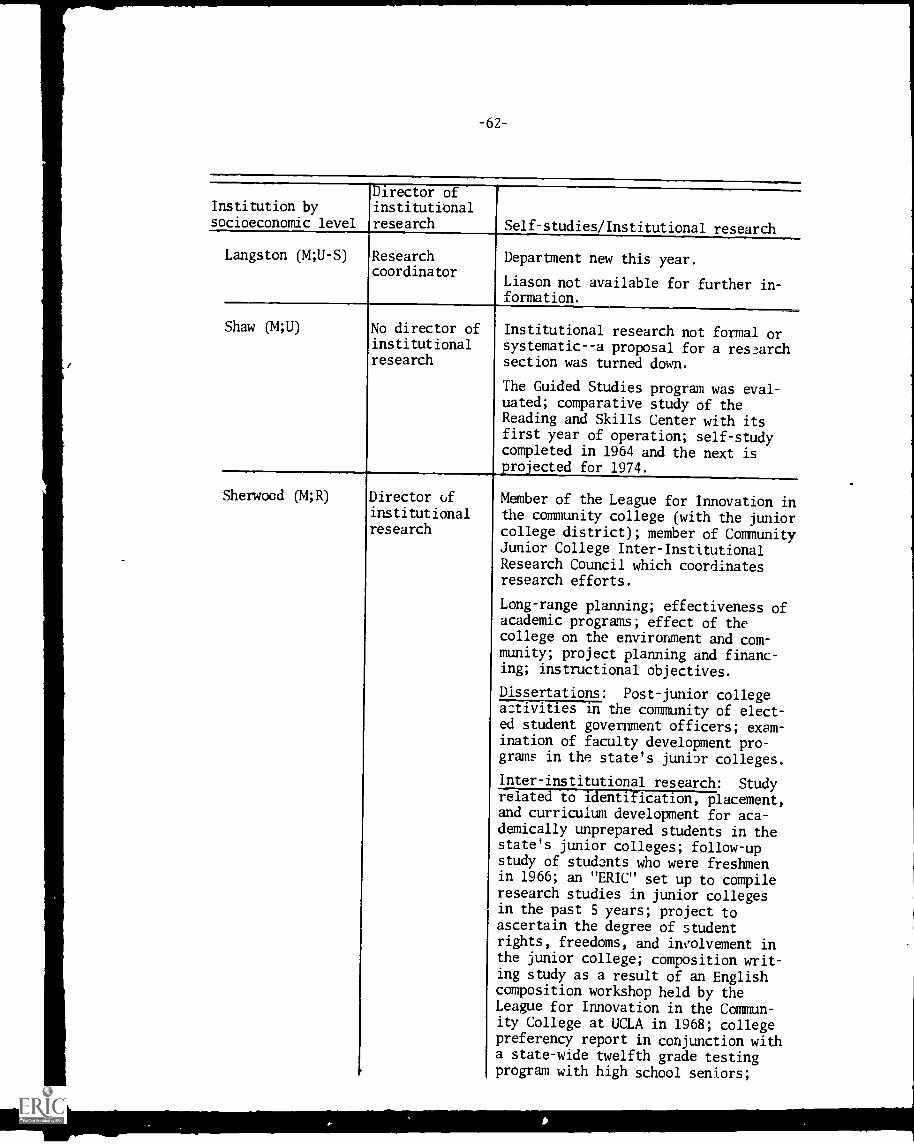
-62-
Institution bysocioeconomic level
Director ofinstitutionalresearch Self-studies/Institutional research
Langston (M;U-S) Researchcoordinator
Department new this year.
Liason not available for further in-formation.
Shaw (14;U) No director ofinstitutionalresearch
Institutional research not formal orsystematic--a proposal for a researchsection was turned down.
The Guided Studies program was eval-uated; comparative study of theReading and Skills Center with itsfirst year of operation; self-study
completed in 1964 and the next isprojected for 1974.
Sherwood (M;R) Director ofinstitutionalresearch
Member of the League for Innovation inthe community college (with the juniorcollege district); member of CommunityJunior College Inter-InstitutionalResearch Council which coordinatesresearch efforts.
Long-range planning; effectiveness ofacademic programs; effect of thecollege on the environment and com-munity; project planning and financ-ing; instructional objectives.
Dissertations: Post-junior collegea :tivities in the community of elect-ed student government officers; exam-ination of faculty development pro-grams in the state's junior colleges.
Inter-institutional research: Studyrelated to identification, placement,and curriculum development for aca-
demically unprepared students in thestate's junior colleges; follow-upstudy of students who were freshmenin 1966; an "ERIC" set up to compileresearch studies in junior collegesin the past 5 years; project toascertain the degree of studentrights, freedoms, and involvement inthe junior college; composition writ-ing study as a result of an Englishcomposition workshop held by theLeague for Innovation in the Commun-ity College at UCLA in 1968; collegepreferency report in conjunction witha state-wide twelfth grade testingprogram with high school seniors;
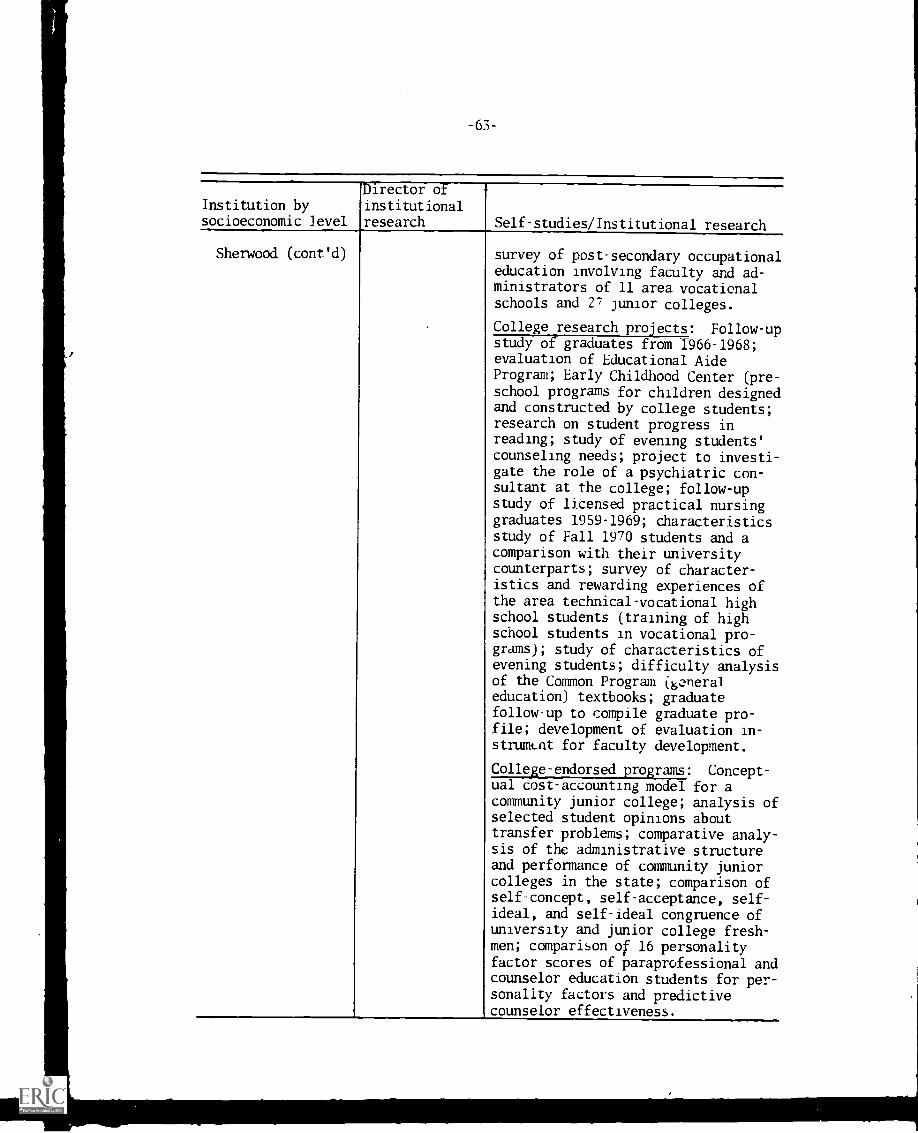
-63-
Institution bysocioeconomic level
Director ofinstitutionalresearch Self-studies/Institutional research
Sherwood (canted) survey of post-secondary occupationaleducation involving faculty and ad-ministrators of 11 area vocationalschools and 27 junior colleges.
College research projects: Follow-upstudy of graduates from 1966-1968;evaluation of Educational AideProgram; Early Childhood Center (pre-school programs for children designedand constructed by college students;research on student progress inreading; study of evening students'counseling needs; project to investi-gate the role of a psychiatric con-sultant at the college; follow-upstudy of licensed practical nursinggraduates 1959-1969; characteristicsstudy of Fall 1970 students and acomparison with their universitycounterparts; survey of character-istics and rewarding experiences ofthe area technical-vocational highschool students (training of highschool students in vocational pro-grams); study of characteristics ofevening students; difficulty analysisof the Common Program (gcmeraleducation) textbooks; graduatefollow-up to compile graduate pro-file; development of evaluation in-strument for faculty development.
College-endorsed programs: Concept-ual cost-accounting model for acommunity junior college; analysis ofselected student opinions abouttransfer problems; comparative analy-sis of the administrative structureand performance of community juniorcolleges in the state; comparison of
self-concept, self-acceptance, self-ideal, and self-ideal congruence ofuniversity and junior college fresh-men; comparison of 16 personalityfactor scores of paraprofessional andcounselor education students for per-sonality factors and predictivecounselor effectiveness.
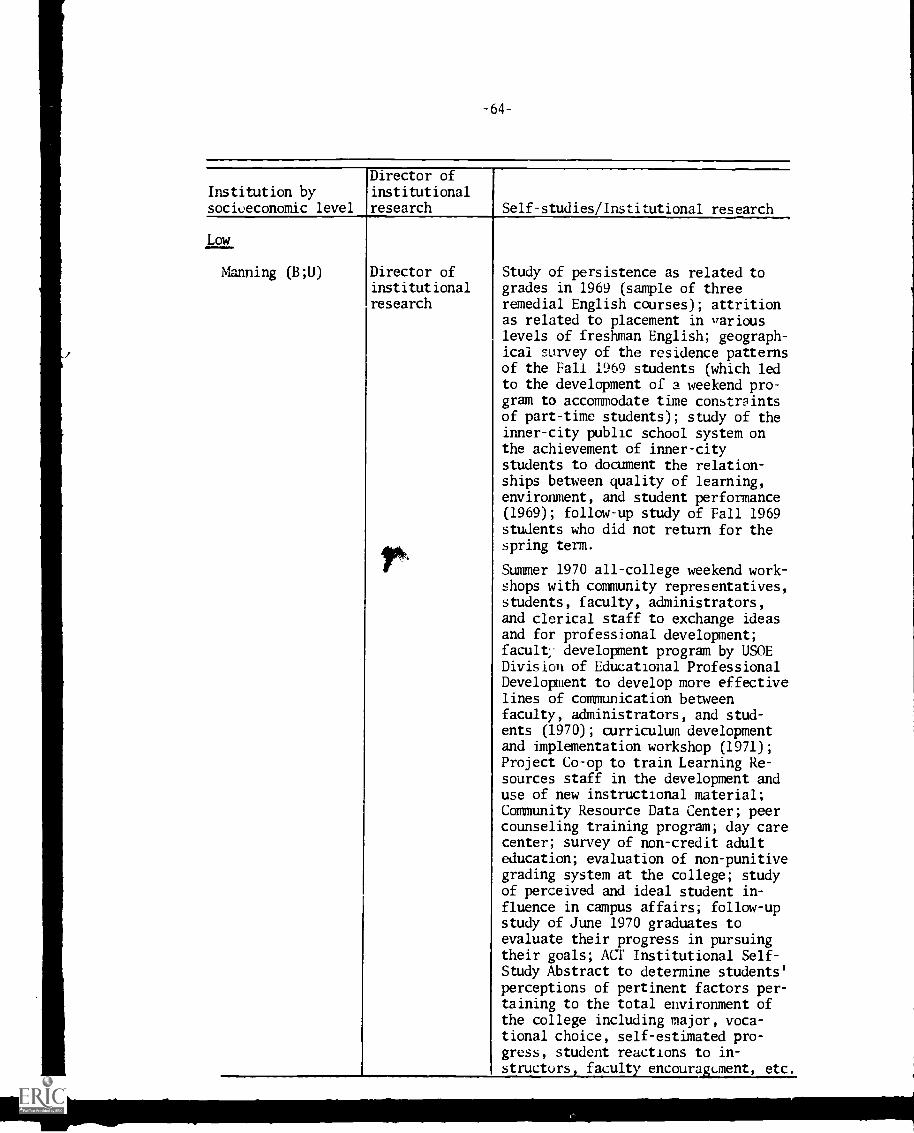
-64-
Institution bysocioeconomic level
Director ofinstitutionalresearch Self-studies/Institutional research
Low
Manning (B;U) Director ofinstitutionalresearch
Study of persistence as related togrades in 1969 (sample of threeremedial English courses); attritionas related to placement in variouslevels of freshman English; geograph-ical survey of the residence patternsof the Fall 1969 students (which ledto the development of a weekend pro-gram to accommodate time constraintsof part-time students); study of theinner-city public school system onthe achievement of inner-citystudents to document the relation-ships between quality of learning,environment, and student performance(1969); follow-up study of Fall 1969students who did not return for thespring term.
Summer 1970 all-college weekend work-shops with community representatives,students, faculty, administrators,and clerical staff to exchange ideasand for professional development;facult: development program by USOEDivision of Educational ProfessionalDevelopment to develop more effectivelines of communication betweenfaculty, administrators, and stud-ents (1970); curriculum developmentand implementation workshop (1971);Project Co-op to train Learning Re-sources staff in the development anduse of new instructional material;Community Resource Data Center; peercounseling training program; day carecenter; survey of non-credit adulteducation; evaluation of non-punitivegrading system at the college; studyof perceived and ideal student in-fluence in campus affairs; follow-upstudy of June 1970 graduates toevaluate their progress in pursuingtheir goals; ACT Institutional Self-Study Abstract to determine students'perceptions of pertinent factors per-taining to the total environment ofthe college including major, voca-tional choice, self-estimated pro-gress, student reactions to in-structors, faculty encouragement, etc.
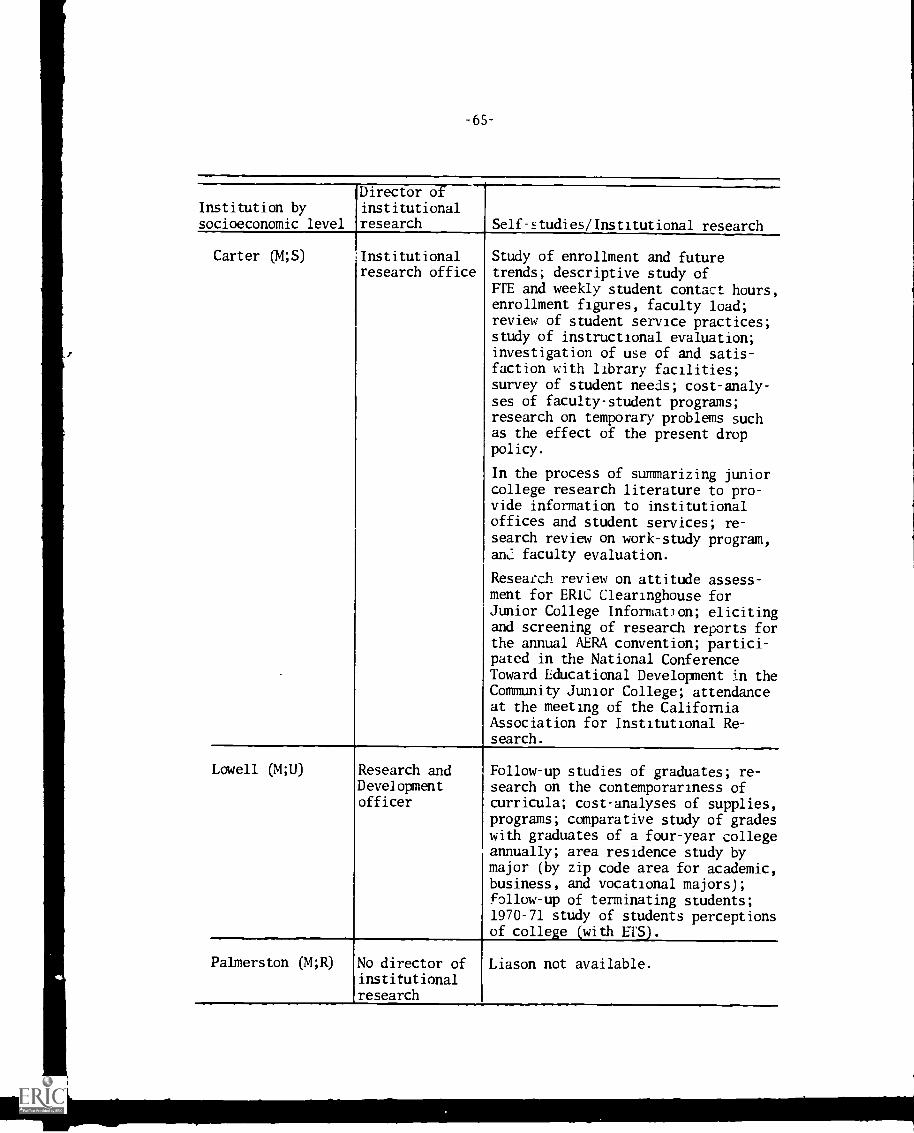
-65-
Institution bysocioeconomic level
Director ofinstitutionalresearch Self-studies/Institutional research
Carter (4;S) Institutionalresearch office
Study of enrollment and futuretrends; descriptive study ofFTE and weekly student contact hours,enrollment figures, faculty load;review of student service practices;study of instructional evaluation;investigation of use of and satis-faction with library facilities;survey of student needs; cost-analy-ses of faculty-student programs;research on temporary problems suchas the effect of the present droppolicy.
In the process of summarizing juniorcollege research literature to pro-vide information to institutionaloffices and student services; re-
search review on work-study program,an faculty evaluation.
Research review on attitude assess-ment for ERIC Clearinghouse forJunior College Information; elicitingand screening of research reports forthe annual AERA convention; partici-pated in the National ConferenceToward Educational Development in theCommunity Junior College; attendanceat the meeting of the CaliforniaAssociation for Institutional Re-search.
Lowell (14;U) Research andDevelopmentofficer
Follow-up studies of graduates; re-search on the contemporariness ofcurricula; cost-analyses of supplies,programs; comparative study of gradeswith graduates of a four-year collegeannually; area residence study bymajor (by zip code area for academic,business, and vocational majors);follow-up of terminating students;1970-71 study of students perceptionsof college (with ETS).
Palmerston (14;R) No director of Liason not available.institutionalresearch
-67-
INSTITUTIONAL PROFILES
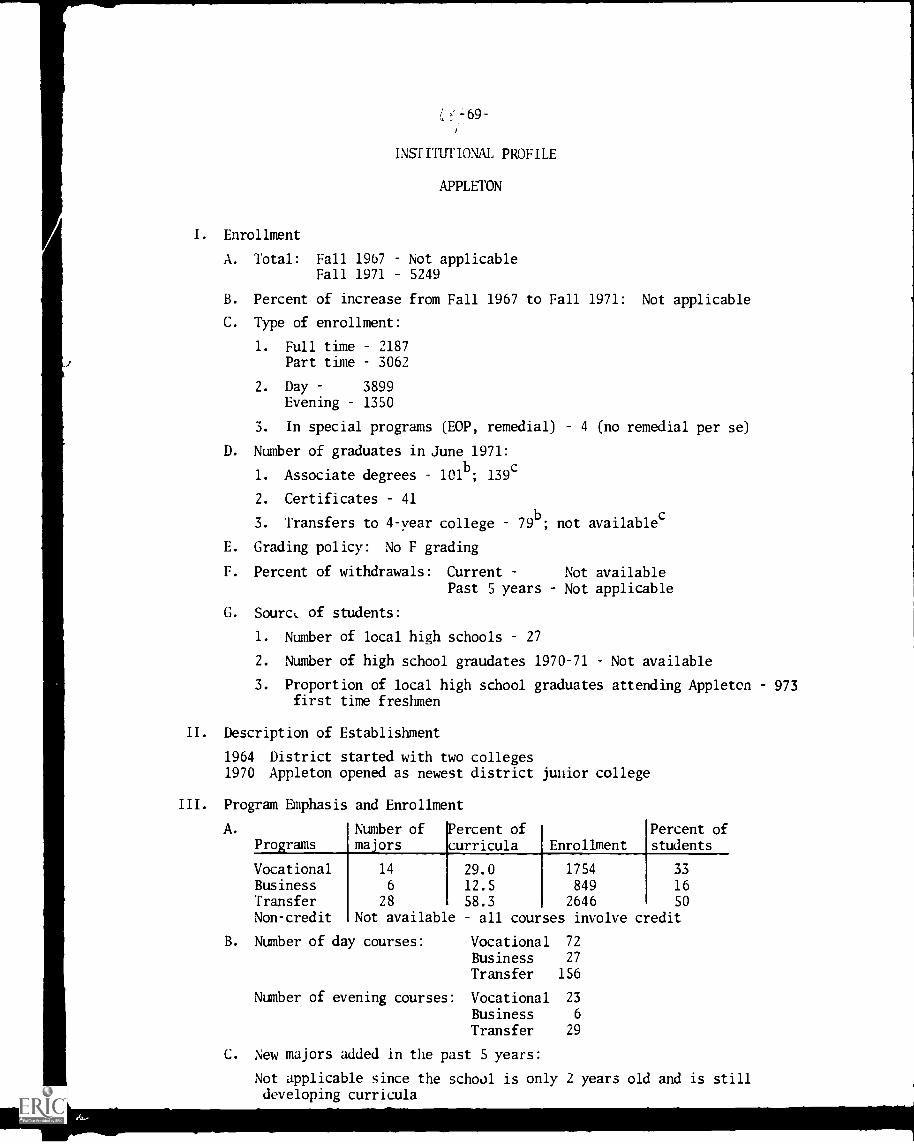
-69-
INSTITUTIONAL PROFILE
APPLETON
I. Enrollment
A. Total: Fall 1967 Not applicableFall 1971 5249
B. Percent of increase from Fall 1967 to Fall 1971: Not applicable
C. Type of enrollment:
1. Full time 2187
Part time 3062
2. Day 3899Evening 1350
3. In special programs (EOP, remedial) 4 (no remedial per se)
D. Number of graduates in June 1971:
1. Associate degrees 101b; 139c
2. Certificates 41
3. Transfers to 4-year college 79b; not available
c
E. Grading policy: No F grading
F. Percent of withdrawals: Current Not availablePast 5 years Not applicable
G. Sourct, of students:
1. Number of local high schools 27
2. Number of high school graudates 1970-71 Not available
3. Proportion of local high school graduates attending Appleton 973first time freshmen
II. Description of Establishment
1964 District started with two colleges1970 Appleton opened as newest district junior college
III. Program Emphasis and Enrollment
A. Number of 'Percent ofPrograms majors curricula Enrollment
Percent ofstudents
VocationalBusiness
14
6
29.0 1754 33
12.5 849 16Transfer 28 58.3 2646 50
Non-credit Not available all courses involve credit
B. Number of day courses: Vocational 72
Business 27
Transfer 156
Number of evening courses: Vocational 23
Business 6
Transfer 29
C. New majors added in the past 5 years:
Not applicable since the school is only 2 years old and is stilldeveloping curricula
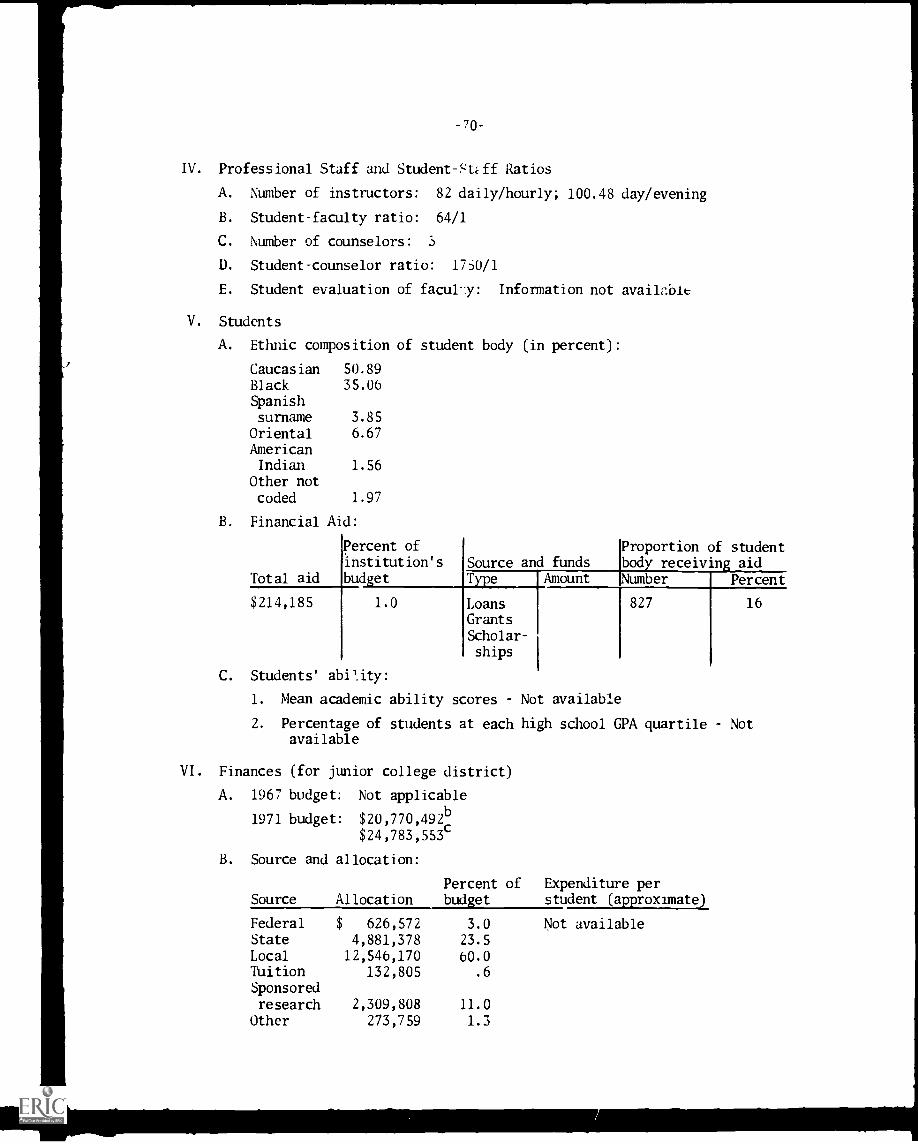
-70-
IV. Professional Staff and Student-F:Uff Ratios
A. Number of instructors: 82 daily/hourly; 100.48 day/evening
B. Student-faculty ratio: 64/1
C. Number of counselors: 3
D. Student-counselor ratio: 17S0/1
E. Student evaluation of facul-:y: Information not availr.bit
V. Students
A. Ethnic composition of student body (in percent):
Caucasian 50.89Black 35.06Spanishsurname 3.85
Oriental 6.67
AmericanIndian 1.56
Other notcoded 1.97
B. Financial Aid:
Percent ofinstitution's Source and funds
Total aid budget ape Amount
$214,185 1.0 LoansGrantsScholar-ships
Proportion of studentbody receiving aidNumber
827
Percent
16
C. Students' ability:
1. Mean academic ability scores Not available
2. Percentage of students at each high school GPA quartile Notavailable
VI. Finances (for junior college district)
A. 1967 budget: Not applicable
1971 budget: $20,770,492b$24,783,553c
B. Source and allocation:
Percent of Expenditure perSource Allocation budget student (approximate)
Federal $ 626,572 3.0State 4,881,378 23.5Local 12,546,170 60.0Tuition 132,805 .6
Sponsoredresearch 2,309,808 11.0
Other 273,759 1.3
Not available
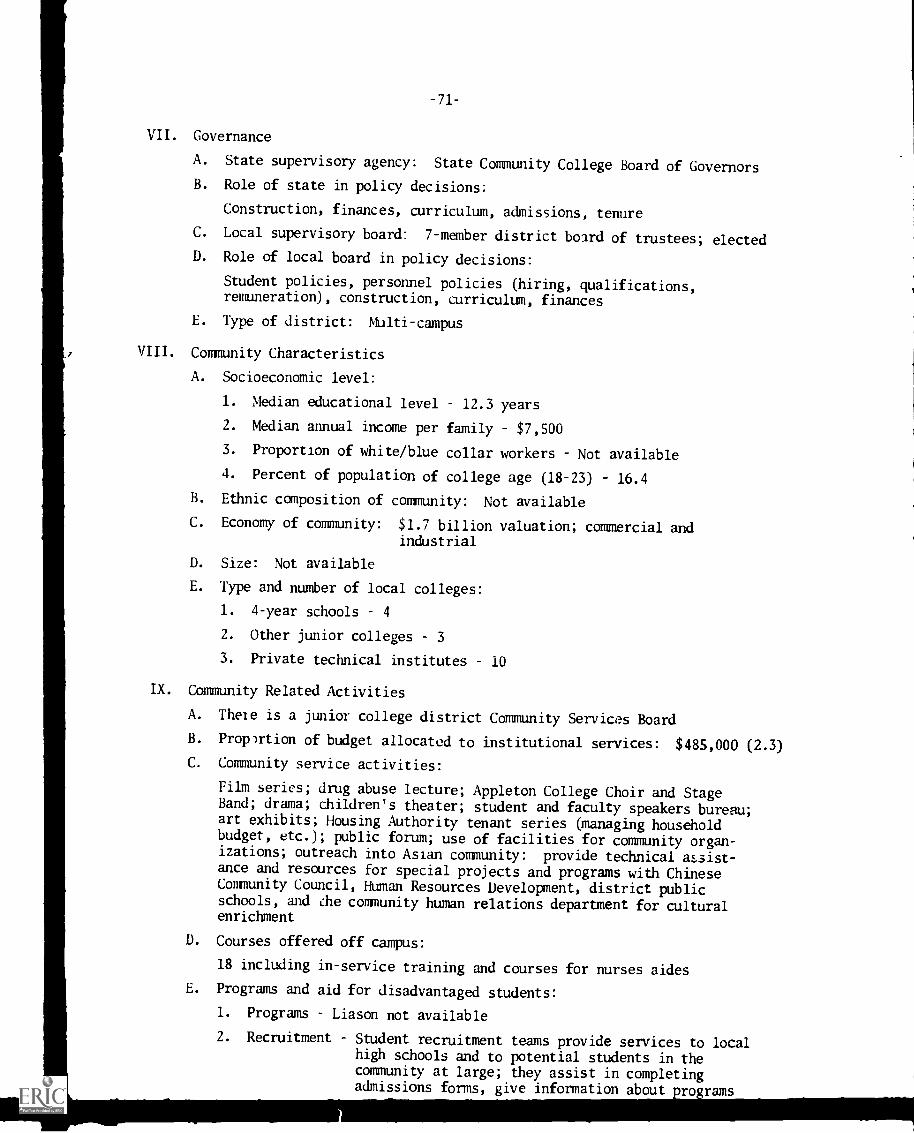
-71-
VII. Governance
A. State supervisory agency: State Community College Board of Governors
B. Role of state in policy decisions:
Construction, finances, curriculum, admissions, tenure
C. Local supervisory board: 7-member district board of trustees; electedD. Role of local board in policy decisions:
Student policies, personnel policies (hiring, qualifications,remuneration), construction, curriculum, finances
E. Type of district: Multi-campus
VIII. Community Characteristics
A. Socioeconomic level:
1. Median educational level 12.3 years
2. Median annual income per family $7,500
3. Proportion of white/blue collar workers Not available
4. Percent of population of college age (18-23) 16.4
B. Ethnic composition of community: Not available
C. Economy of community: $1.7 billion valuation; commercial andindustrial
D. Size: Not available
E. Type and number of local colleges:
1. 4-year schools 4
2. Other junior colleges 3
3. Private technical institutes 10
IX. Community Related Activities
A. Theie is a junior college district Community Services Board
B. Proportion of budget allocated to institutional services: $485,000 (2.3)
C. Community service activities:
Film series; drug abuse lecture; Appleton College Choir and StageBand; drama; children's theater; student and faculty speakers bureau;art exhibits; Housing Authority tenant series (managing householdbudget, etc.); public forum; use of facilities for community organ-izations; outreach into Asian community: provide technical assist-ance and resources for special projects and programs with ChineseCommunity Council, Human Resources Development, district publicschools, and the community human relations department for culturalenrichment
D. Courses offered off campus:
18 including in-service training and courses for nurses aides
E. Programs and aid for disadvantaged students:
1. Programs Liason not available
2. Recruitment Student recruitment teams provide services to localhigh schools and to potential students in thecommunity at large; they assist in completingadmissions forms, give information about rorams
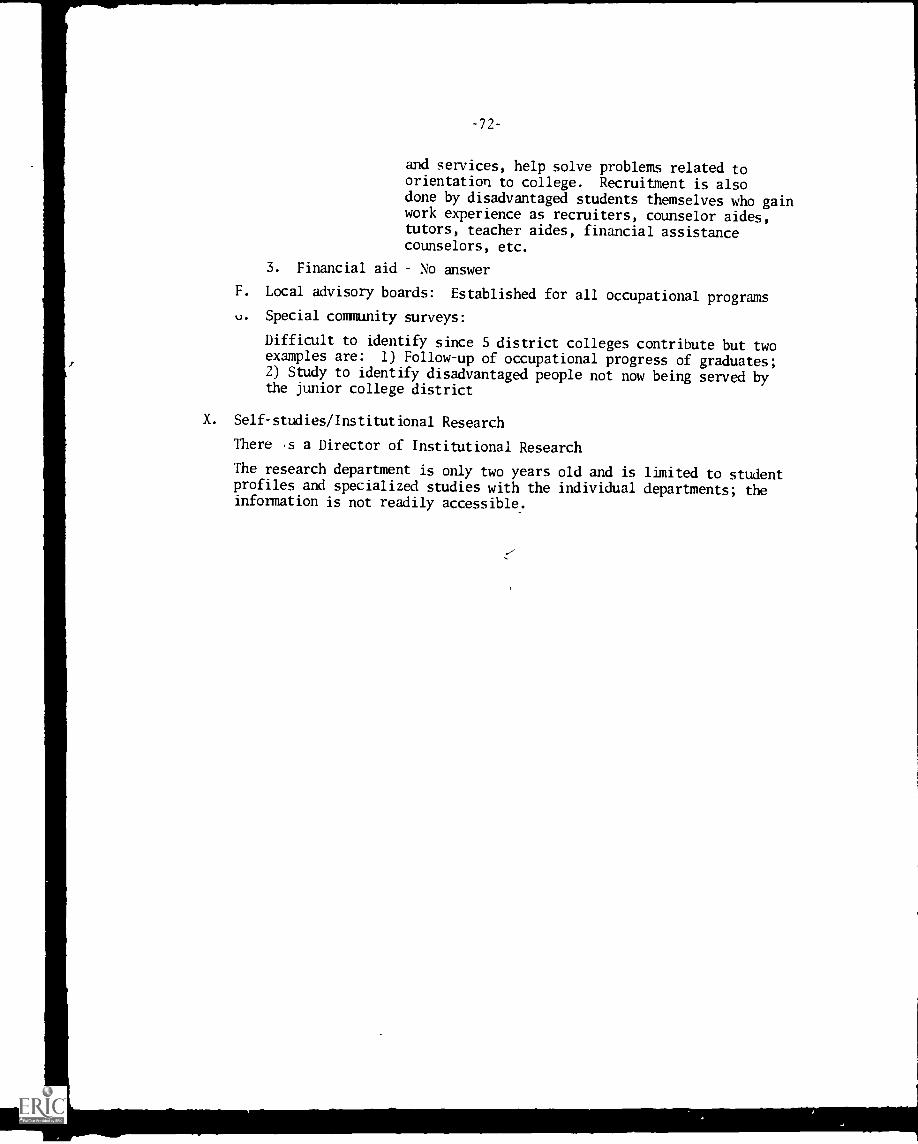
-72-
and services, help solve problems related toorientation to college. Recruitment is alsodone by disadvantaged students themselves who gainwork experience as recruiters, counselor aides,tutors, teacher aides, financial assistancecounselors, etc.
3. Financial aid No answer
F. Local advisory boards: Established for all occupational programs
u. Special community surveys:
Difficult to identify since 5 district colleges contribute but twoexamples are: 1) Follow-up of occupational progress of graduates;2) Study to identify disadvantaged people not now being served bythe junior college district
X. Self-studies/Institutional Research
There .s a Director of Institutional Research
The research department is only two years old and is limited to studentprofiles and specialized studies with the individual departments; theinformation is not readily accessible.
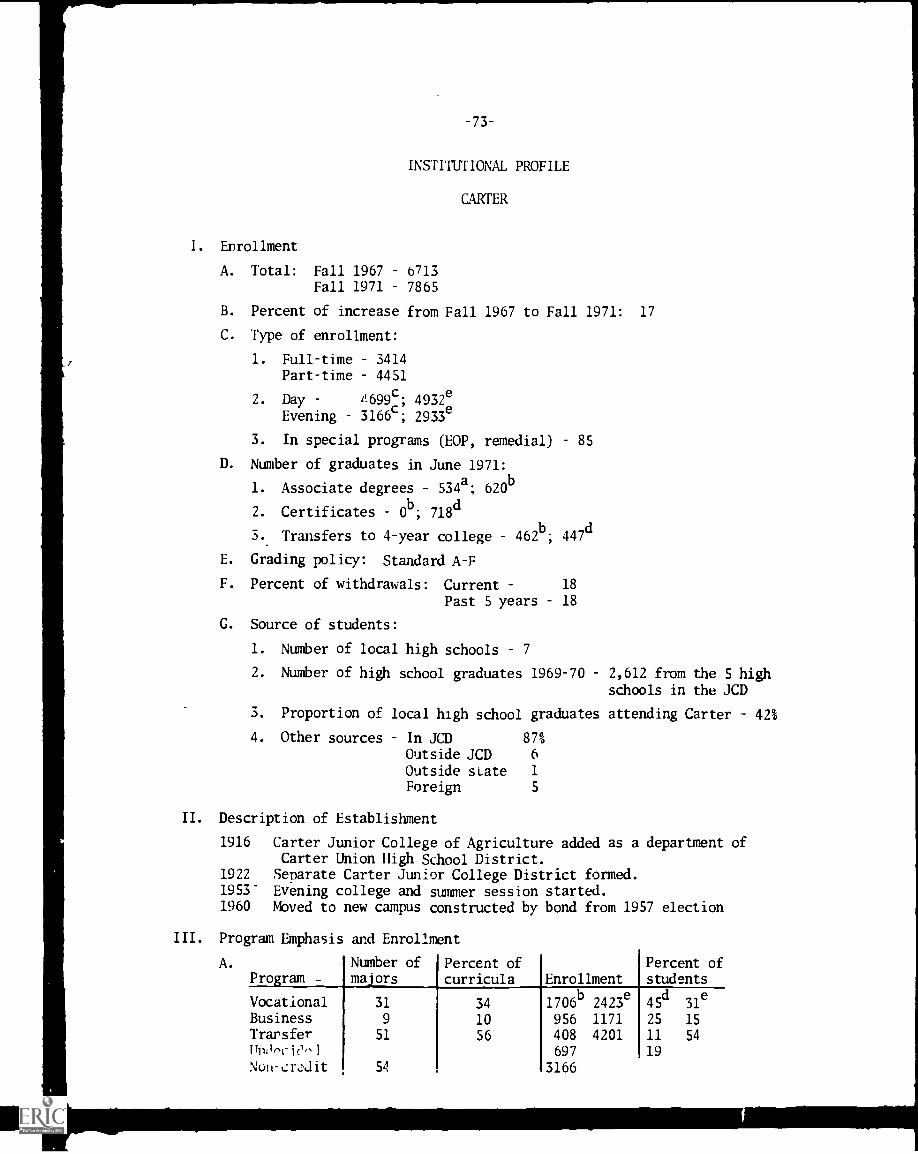
-73-
INSTITUTIONAL PROFILE
CARTER
I. Enrollment
A. Total: Fall 1967 6713Fall 1971 7865
B. Percent of increase from Fall 1967 to Fall 1971: 17
C. Type of enrollment:
1. Full-time 3414Part-time 4451
2. Day 1699c
4932e
Evening 3166c; 2933e
3. In special programs (BOP, remedial) 85
D. Number of graduates in June 1971:
1. Associate degrees 534a; 620b
2. Certificates 0b
; 718d
3. Transfers to 4-year college 462b
; 447d
E. Grading policy: Standard A-F
F. Percent of withdrawals: Current 18
Past 5 years 18
G. Source of students:
1. Number of local high schools 7
2. Number of high school graduates 1969-70 2,612 from the 5 highschools in the JCD
3. Proportion of local high school graduates attending Carter 42%
4. Other sources In JCD 87%
Outside JCD 6
Outside sate 1
Foreign 5
II. Description of Establishment
1916 Carter Junior College of Agriculture added as a department ofCarter Union High School District.
1922 Separate Carter Junior College District formed.1953- Evening college and summer session started.1960 Moved to new campus constructed by bond from 1957 election
III. Program Emphasis and Enrollment
A.
ProgramNumber ofmajors
Percent ofcurricula Enrollment
Percent ofstudents
Vocational 31 34 1706b
2423e
45d
31e
Business 9 10 956 1171 25 15Transfer 51 56 408 4201 11 54ifilflocie-I 697 19Non-crzJit 54 3166
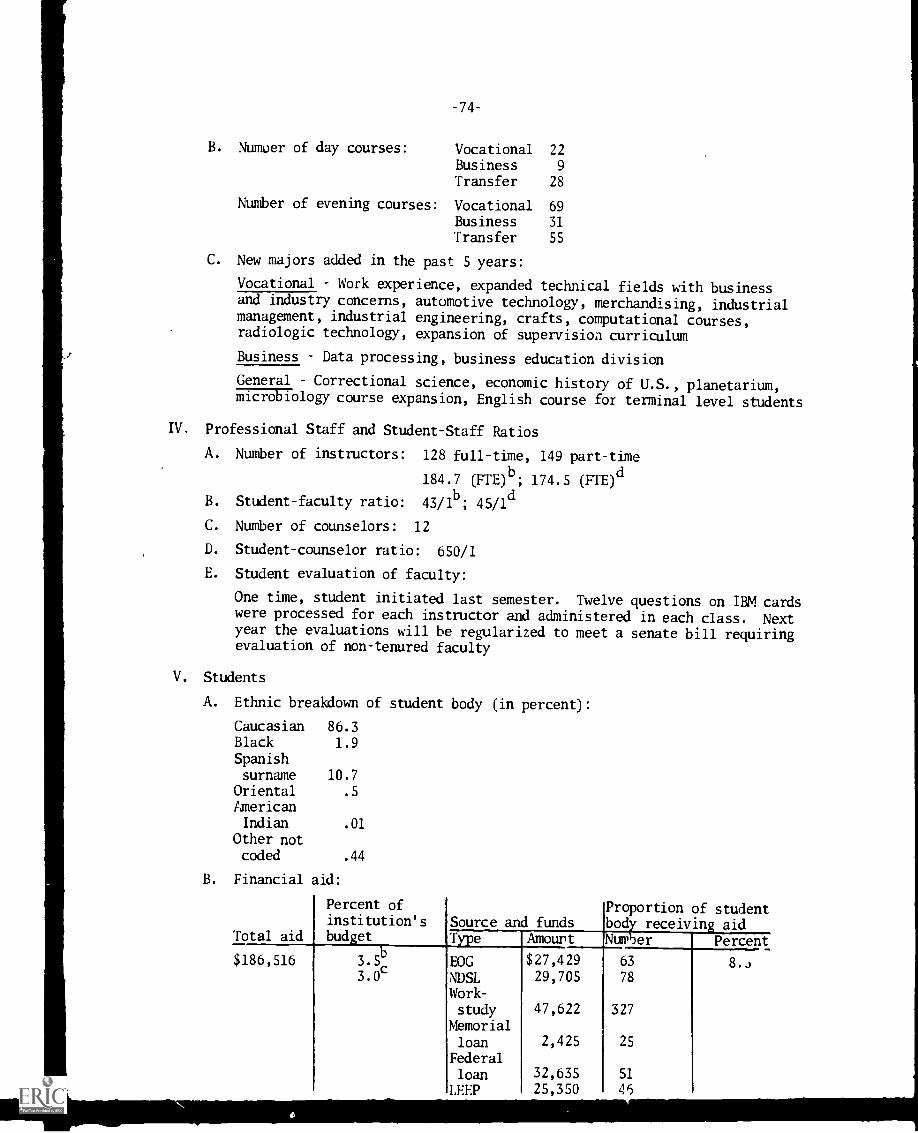
B. Numuer of day courses:
-74-
Vocational 22
Business 9
Transfer 28
Number of evening courses: Vocational 69
Business 31
Transfer 55
C. New majors added in the past 5 years:
Vocational Work experience, expanded technical fields with businessand industry concerns, automotive technology, merchandising, industrialmanagement, industrial engineering, crafts, computational courses,radiologic technology, expansion of supervision curriculum
Business Data processing, business education division
General Correctional science, economic history of U.S., planetarium,microbiology course expansion, English course for terminal level students
IV. Professional Staff and Student-Staff Ratios
A. Number of instructors:
B. Student-faculty ratio:
128 full-time, 149 part-time
184.7 (FTE)b; 174.5 (FTE)
d
43/1b
; 45/1d
C. Number of counselors: 12
D. Student-counselor ratio: 650/1
E. Student evaluation of faculty:
One time, student initiated last semester. Twelve questions on IBM cardswere processed for each instructor and administered in each class. Nextyear the evaluations will be regularized to meet a senate bill requiringevaluation of non-tenured faculty
V. Students
A. Ethnic breakdown of student body (in percent):
Caucasian 86.3Black 1.9Spanishsurname 10.7
Oriental .5
AmericanIndian .01
Other notcoded .44
B. Financial
Total aid
aid:
Percent ofinstitution'sbudget
3.5b
3.0c
Source and fundsProportionbody receivingNumber
63
78
327
25
51
45
of studentaid
Percent
8.J
aPeEOGNDSLWork-
studyMemorialloanFederal
loanLEEP
Amount
$27,42929,705
47,622
2,425
32,63525,350
$186,516
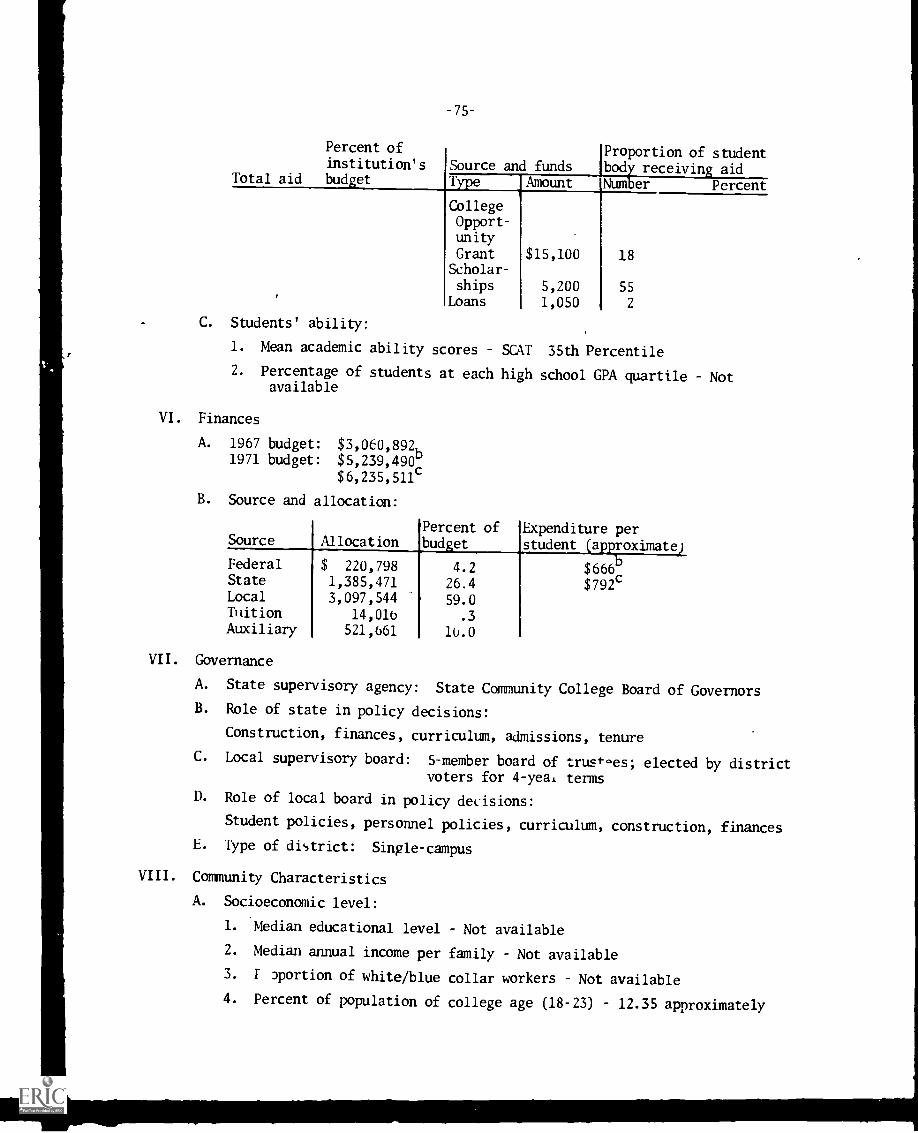
-75-
Percent ofinstitution's
Total aid budgetSource and funds
Proportion of studentbody receiving aid
Type Amount Number Percent
CollegeOpport-unityGrant $15,100 18Scholar-ships 5,200 55
Loans 1,050 2
C. Students' ability:
1. Mean academic ability scores SCAT 35th Percentile
2. Percentage of students at each high school GPA quartile Notavailable
VI. Finances
A. 1967 budget: $3,060,892b1971 budget: $5,239,490
$6,235,511c
B. Source and allocation:
Source AllocationPercent ofbudget
Expenditure perstudent (approximate)
Federal $ 220,798 4.2 $666State 1,385,471 26.4 $792
c
Local 3,097,544 59.0Tuition 14,016 .3Auxiliary 521,661 10.0
VII. Governance
A. State supervisory agency: State Community College Board of Governors
B. Role of state in policy decisions:
Construction, finances, curriculum, admissions, tenure
C. Local supervisory board: 5-member board of trust0es; elected by districtvoters for 4 -yeas terms
D. Role of local board in policy decisions:
Student policies, personnel policies, curriculum, construction, finances
E. Type of district: Single-campus
VIII. Community Characteristics
A. Socioeconomic level:
1. Median educational level Not available
2. Median annual income per family Not available
3. F Dportion of white/blue collar workers Not available
4. Percent of population of college age (18-23) 12.35 approximately
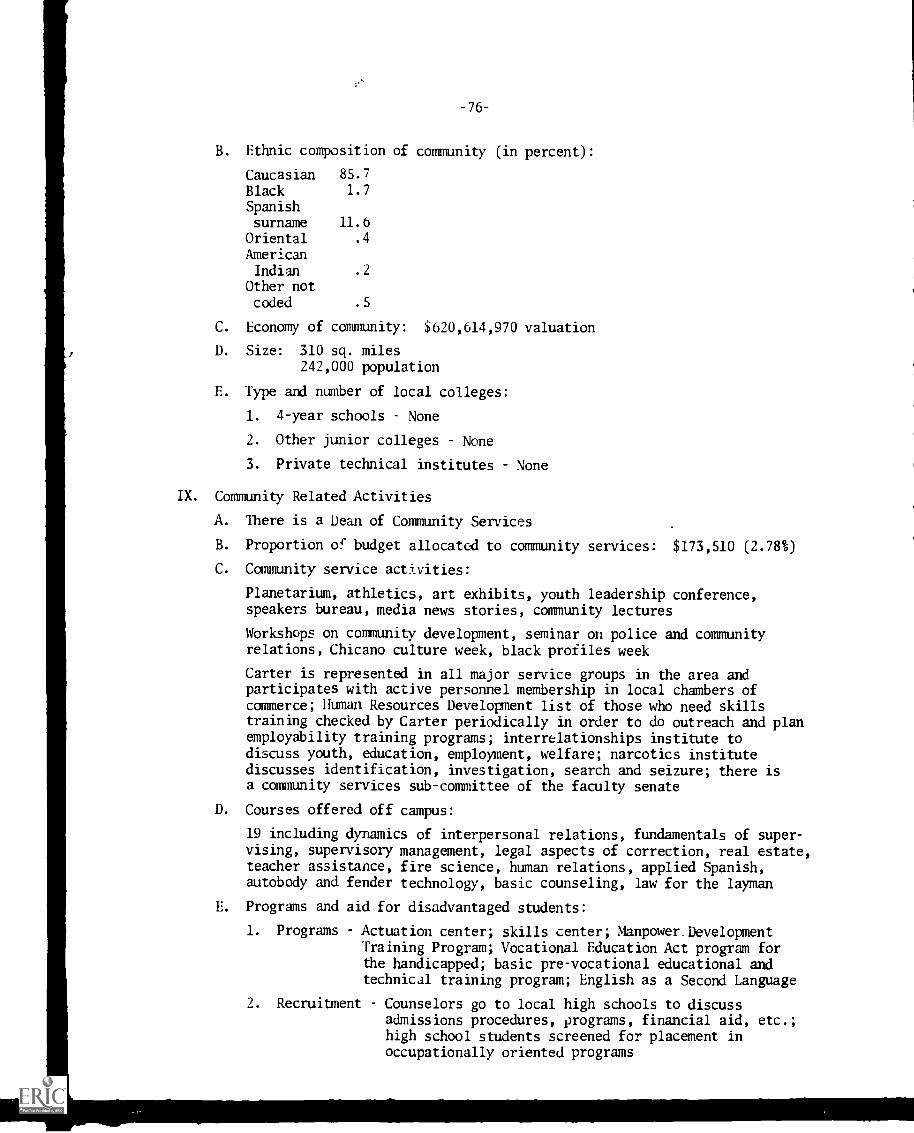
-76-
B. Ethnic composition of community (in percent):
Caucasian 85.7
Black 1.7
Spanishsurname 11.6
Oriental .4
AmericanIndian .2
Other notcoded .5
C. Economy of community: $620,614,970 valuation
D. Size: 310 sq. miles242,000 population
E. Type and number of local colleges:
1. 4-year schools None
2. Other junior colleges None
3. Private technical institutes None
IX. Community Related Activities
A. There is a Dean of Community Services
B. Proportion of budget allocated to community services: $173,510 (2.78%)
C. Community service activities:
Planetarium, athletics, art exhibits, youth leadership conference,speakers bureau, media news stories, community lectures
Workshops on community development, seminar on police and communityrelations, Chicano culture week, black profiles week
Carter is represented in all major service groups in the area andparticipates with active personnel membership in local chambers ofcommerce; Human Resources Development list of those who need skillstraining checked by Carter periodically in order to do outreach and planemployability training programs; interrelationships institute todiscuss youth, education, employment, welfare; narcotics institutediscusses identification, investigation, search and seizure; there isa community services sub-committee of the faculty senate
D. Courses offered off campus:
19 including dynamics of interpersonal relations, fundamentals of super-vising, supervisory management, legal aspects of correction, real estate,teacher assistance, fire science, human relations, applied Spanish,autobody and fender technology, basic counseling, law for the layman
E. Programs and aid for disadvantaged students:
1. Programs Actuation center; skills center; Manpower_ DevelopmentTraining Program; Vocational Education Act program forthe handicapped; basic pre-vocational educational andtechnical training program; English as a Second Language
2. Recruitment Counselors go to local high schools to discussadmissions procedures, programs, financial aid, etc.;high school students screened for placement inoccupationally oriented programs
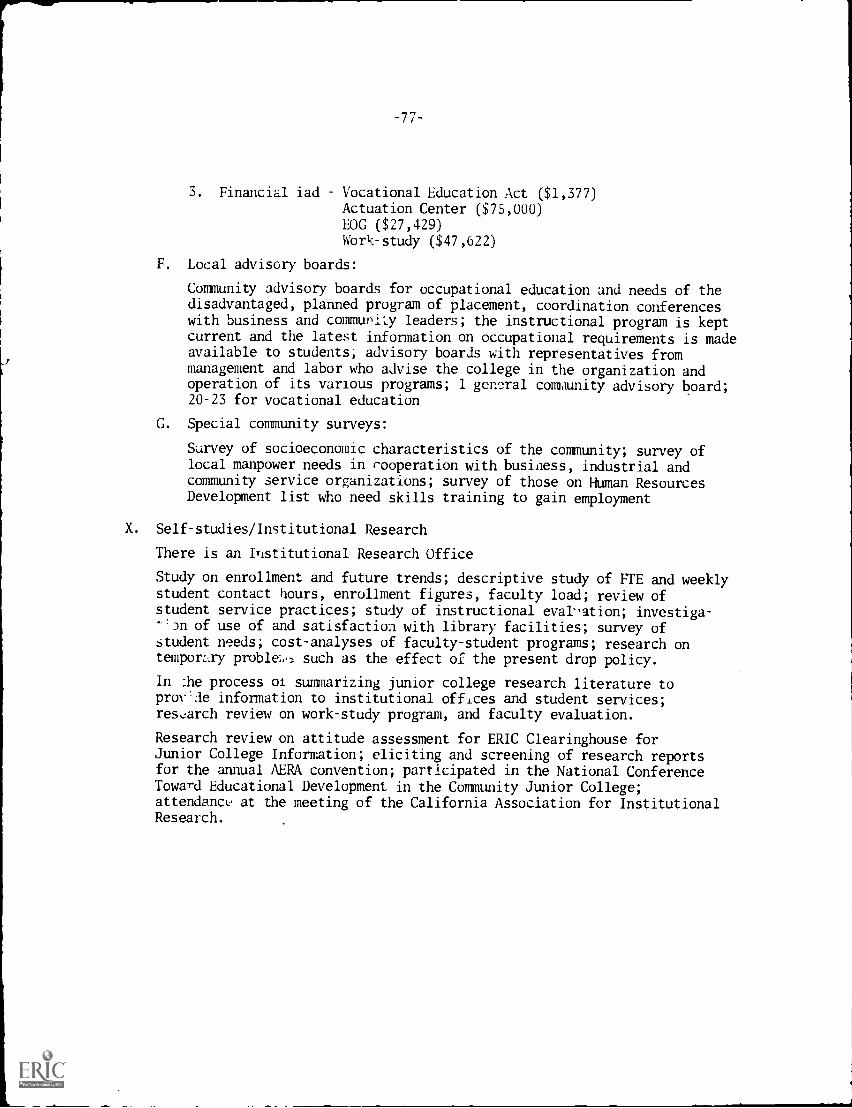
-77-
3. Financial iad Vocational Education Act ($1,377)Actuation Center ($75,000)EOG ($27,429)Work-study ($47,622)
F. Local advisory boards:
Community advisory boards for occupational education and needs of thedisadvantaged, planned program of placement, coordination conferenceswith business and communi',y leaders; the instructional program is keptcurrent and the latest information on occupational requirements is madeavailable to students; advisory boards with representatives frommanagement and labor who advise the college in the organization andoperation of its various programs; 1 general community advisory board;20-23 for vocational education
G. Special community surveys:
Survey of socioeconomic characteristics of the community; survey oflocal manpower needs in cooperation with business, industrial andcommunity service organizations; survey of those on Human ResourcesDevelopment list who need skills training to gain employment
X. Self-studies/Institutional Research
There is an Institutional Research Office
Study on enrollment and future trends; descriptive study of FTE and weeklystudent contact hours, enrollment figures, faculty load; review ofstudent service practices; study of instructional eval-ation; investiga--:Dn of use of and satisfaction with library facilities; survey ofstudent needs; cost-analyses of faculty-student programs; research ontemporzry proble:,1, such as the effect of the present drop policy.
In ;he process or summarizing junior college research literature topro :de information to institutional offices and student services;research review on work-study program, and faculty evaluation.
Research review on attitude assessment for ERIC Clearinghouse forJunior College Information; eliciting and screening of research reportsfor the annual ABM convention; participated in the National ConferenceToward Educational Development in the Community Junior College;attendance at the meeting of the California Association for InstitutionalResearch.
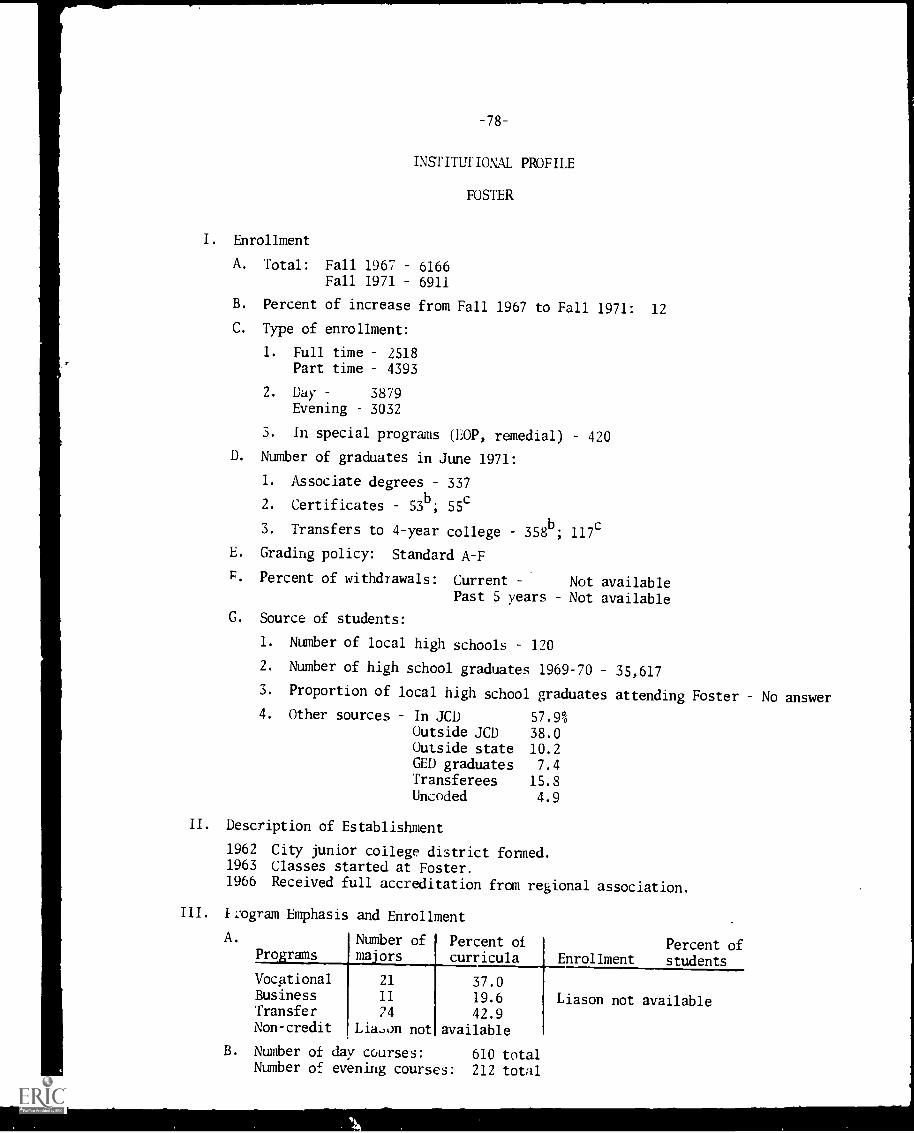
-78-
INSTITUTIONAL PROFILE
FOSTER
I. Enrollment
A. Total: Fall 1967 6166Fall 1971 6911
B. Percent of increase from Fall 1967 to Fall 1971: 12
C. Type of enrollment:
1. Full time 2518Part time 4393
2. flay 3879Evening 3032
3. In special programs (EOP, remedial) 420
D. Number of graduates in June 1971:
1. Associate degrees 337
2. Certificates 53b; ssc
3. Transfers to 4-year college 358b
; 117c
E. Grading policy: Standard A-F
F. Percent of withdrawals: Current Not availablePast 5 years Not available
G. Source of students:
1. Number of local high schools 120
2. Number of high school graduates 1969-70 35,617
3. Proportion of local high school graduates attending Foster No answer
4. Other sources In JCD 57.9%Outside JCD 38.0Outside state 10.2GED graduates 7.4Transferees 15.8Uncoded 4.9
II. Description of Establishment
1962 City junior college district formed.1963 Classes started at Foster.1966 Received full accreditation from regional association.
III. Iipgram Emphasis and Enrollment
A.
ProtramsNumber ofma ors
Percent ofcurricula
Percent ofEnrollment students
VocationalBusinessTransferNon-credit
21
11
74
Lia,on not
37.019.642.9
available
Liason not available
B. Number of day courses: 610 totalNumber of evening courses: 212 total
1
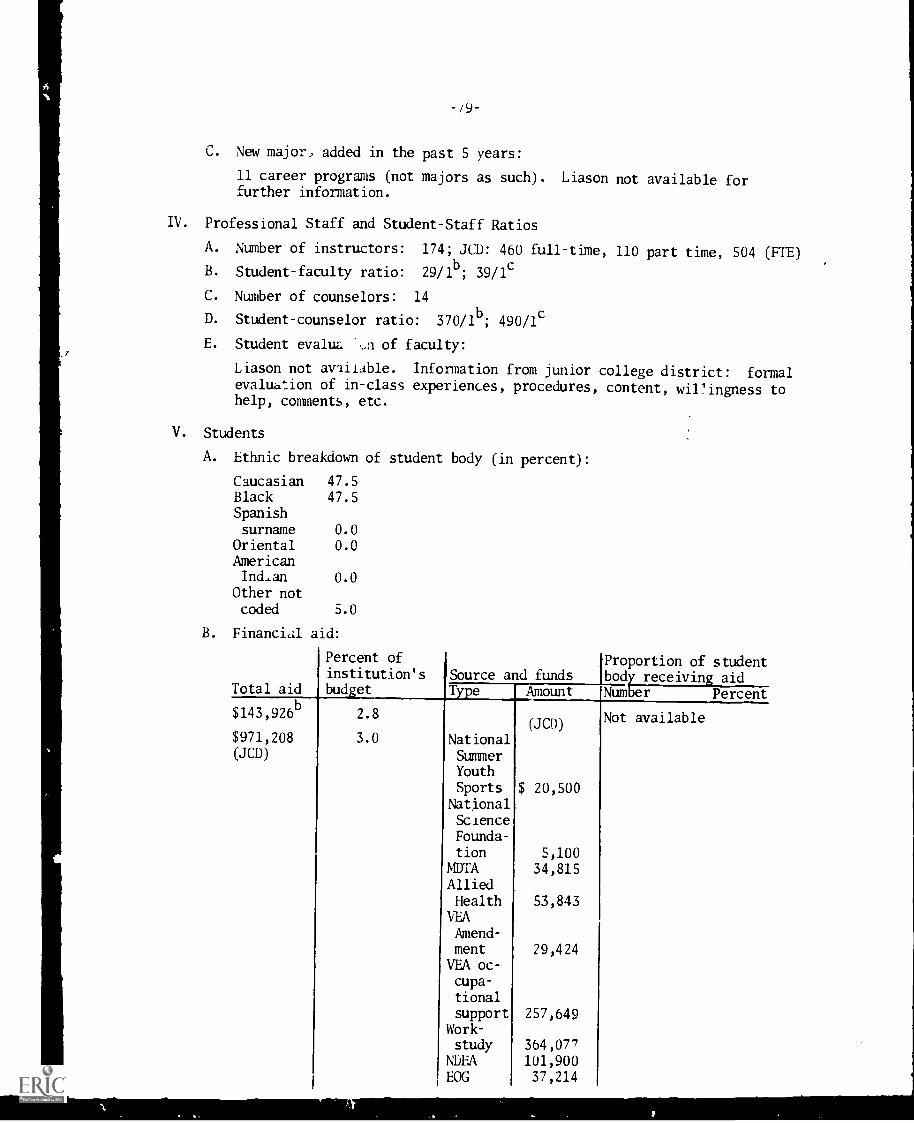
-/9-
C. New major.; added in the past 5 years:
11 career programs (not majors as such). Liason not available forfurther information.
IV. Professional Staff and Student-Staff Ratios
A. Number of instructors: 174; JCD: 460 full-time, 110 part time, 504 (FTE)
B. Student-faculty ratio: 29/1b; 39/1c
C. Number of counselors: 14
D. Student-counselor ratio: 370/1b; 490/1c
E. Student evalua .,n of faculty:
Liason not available. Information from junior college district: formalevaluation of in-class experiences, procedures, content, wiPingness tohelp, comments, etc.
V. Students
A. Ethnic breakdown of student body (in percent):
Caucasian 47.5Black 47.5Spanishsurname 0.0
Oriental 0.0AmericanInd,an 0.0
Other notcoded 5.0
B. Financial aid:
Total aid
Percent ofinstitution'sbudget
Source and fundsProportion of studentbody receiving aid
Type Amount Number Percent
$143,926b 2.8(JCD)
Not available
$971,208 3.0 National(JCD) Summer
YouthSports $ 20,500
NationalScienceFounda-
tion 5,100MDTA 34,815AlliedHealth 53,843
VEAAmend-ment 29,424
VEA oc-cupa-tionalsupport 257,649
Work-study 364,077
NDEA 101,900EOG 37,214
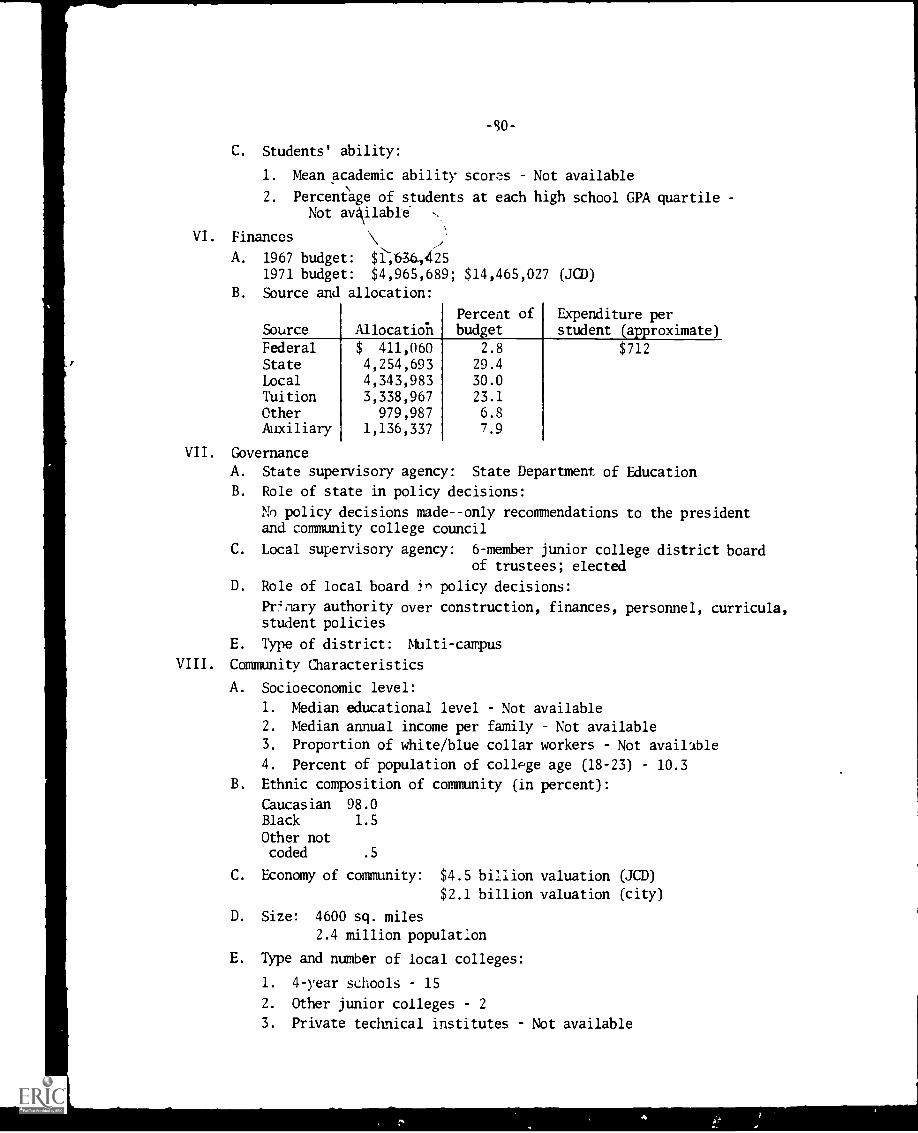
C. Students' ability:
1. Mean academic ability scores Not available
2. Percentage of students at each high school GPA quartileNot available
VI. Finances
A. 1967 budget: $4636,4251971 budget: $4,965,689; $14,465,027 (JCD)
B. Source and allocation:
Source AllocationPercent ofbudget
Expenditure perstudent (approximate)
Federal $ 411,060 2.8 $712State 4,254,693 29.4
Local 4,343,983 30.0Tuition 3,338,967 23.1
Other 979,987 6.8
Auxiliary 1,136,337 7.9
VII. Governance
A. State supervisory agency: State Department of Education
B. Role of state in policy decisions:
No policy decisions made--only recommendations to the presidentand community college council
C. Local supervisory agency: 6-member junior college district boardof trustees; elected
D. Role of local board in policy decisions:
Pr:;nary authority over construction, finances, personnel, curricula,student policies
E. Type of district: Multi campus
VIII. Community Characteristics
A. Socioeconomic level:
1. Median educational level - Not available
2. Median annual income per family Not available
3. Proportion of white/blue collar workers Not available
4. Percent of population of college age (18-23) 10.3
B. Ethnic composition of community (in percent):
Caucasian 98.0Black 1.5
Other notcoded .5
C. Economy of community: $4.5 billion valuation (JCD)
$2.1 billion valuation (city)
D. Size: 4600 sq. miles
2.4 million population
E. Type and number of local colleges:
1. 4-year schools 15
2. Other junior colleges 2
3. Private technical institutes Not available

-81-
IX. Community Related Activities
A. There is a Community Relations Officer
B. Proportion of budget allocated to community services: $127,987 (2.6%)
C. Community service activities:
Plays, concerts, lectures, art exhibits, speakers bureau, facilities opento clubs, etc.; variety of continuing education courses; liason withsocial and civic groups
D. Courses offered off campus: 38
E. Programs and aid for disadvantaged students:
1. Programs Not available
2. Recruitment Not available
3. Financial aid Manpower Development Training Act ($34,815)Vocational Education Act Amendment ($29,424)Vocational Education Act for Occupational ProgramSupport ($257,649)
EOG ($37,214)
F. Local advisory boards:
Each occupational curriculum has an advisory board of community particip-ants
G. Special community surveys: Liason not available
X. Self-studies/Institutional Research
There is a Dean of Institutional Research
Study on teaching techniques. Liason not available for further information.
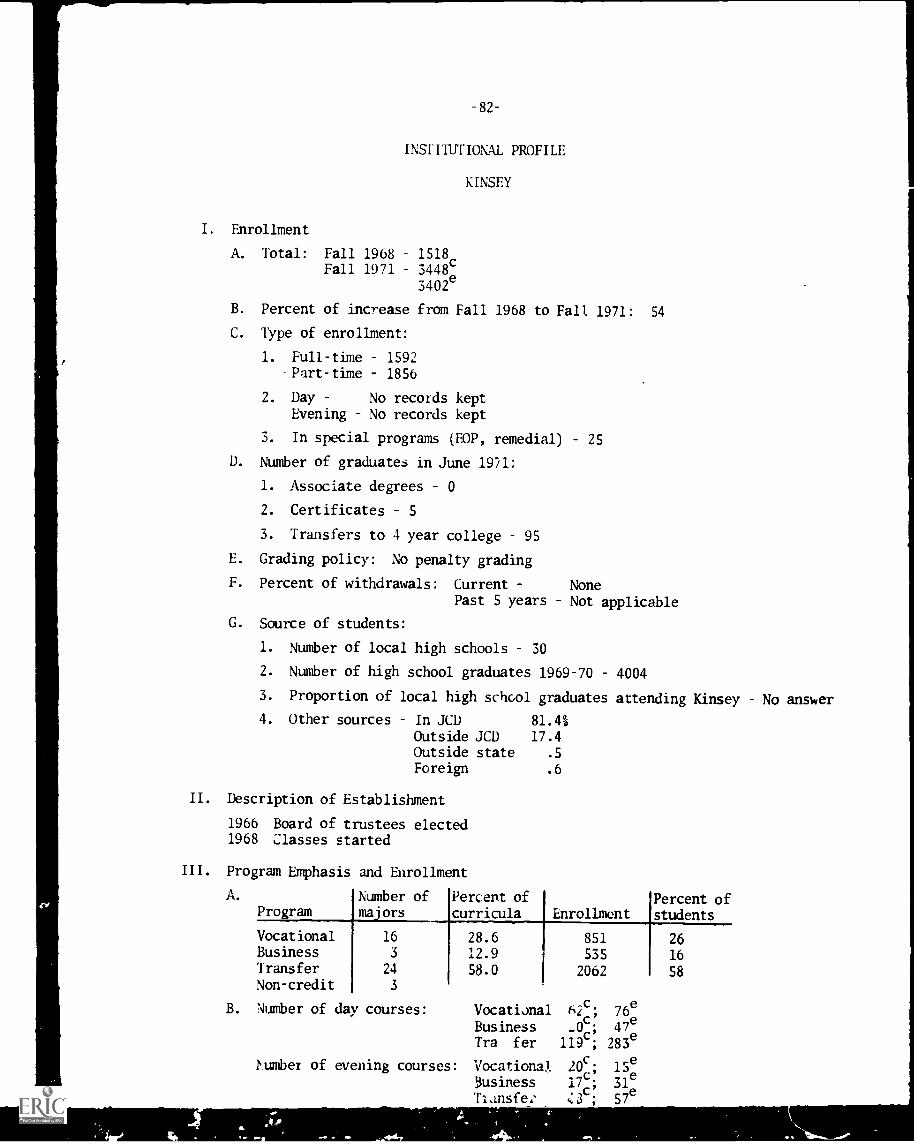
-82-
INSfITUTIONAL PROFILE
KINSEY
I. Enrollment
A. Total: Fall 1968 1518Fall 1971 3448c
3402e
B. Percent of increase from Fall 1968 to Fall 1971: 54
C. Type of enrollment:
1. Full-time 1592Part -time 1856
2. Day No records keptEvening No records kept
3. In special programs (EOP, remedial) 25
D. Number of graduates in June 1921:
1. Associate degrees 0
2. Certificates 5
3. Transfers to 4 year college 95
E. Grading policy: No penalty grading
F. Percent of withdrawals: Current NonePast 5 years Not applicable
G. Source of students:
1. Number of local high schools 30
2. Number of high school graduates 1969-70 4004
3. Proportion of local high school graduates attending Kinsey No answer
4. Other sources In JCD 81.4%Outside JCD 17.4Outside state .5
Foreign .6
II. Description of Establishment
1966 Board of trustees elected1968 Classes started
III. Program Emphasis and Enrollment
A.
Pro! amNumber ofma ors
Percent of
curricula EnrollmentPercent ofstudents
Vocational 16 28.6 851 26Business 3 12.9 535 16Transfer 24 58.0 2062 58Non-credit 3
B. Number of day courses: Vocational 62c* 76e
Business -0c: 47eTra fer 119c; 283e
lumber of evening courses: Vocationa). 20c' 15e3usiness 17(j 31
e
Tlansfe: 43 ; 57e
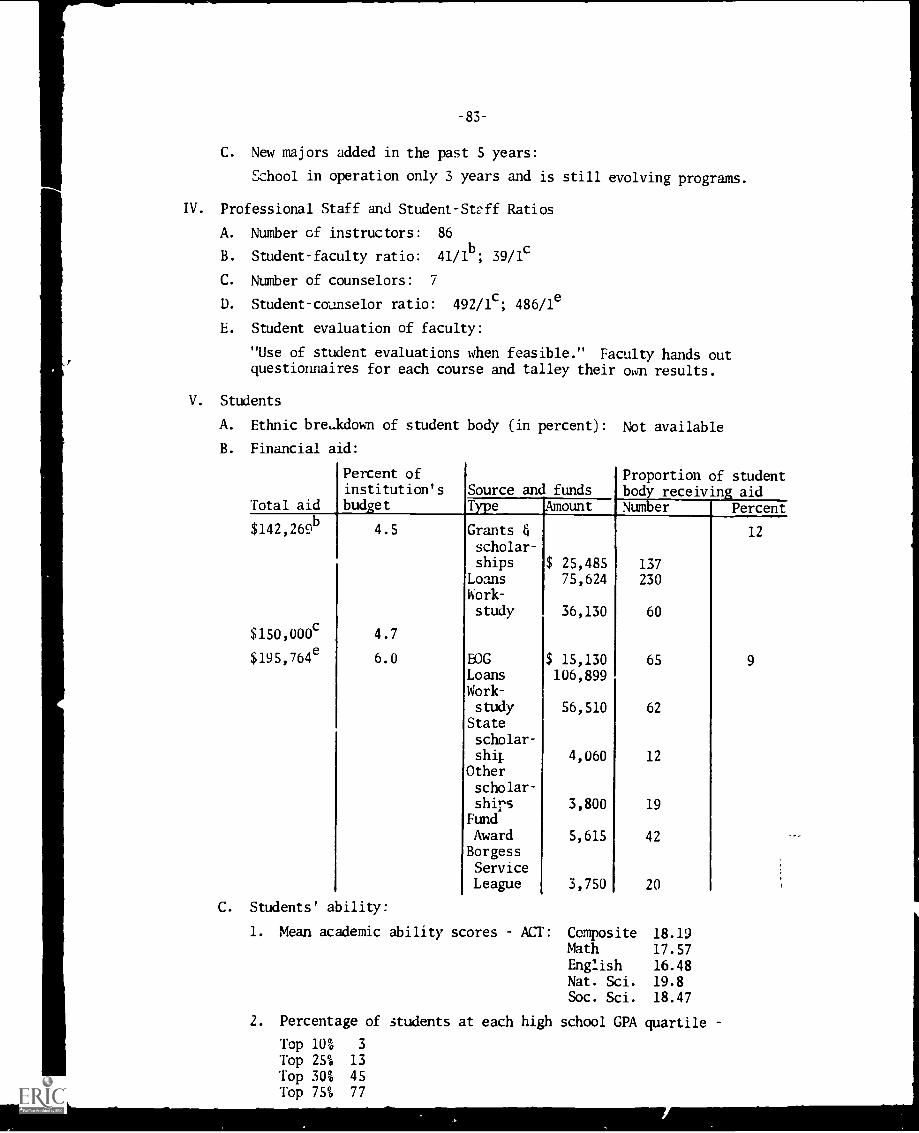
-83-
C. New majors added in the past 5 years:
School in operation only 3 years and is still evolving programs.
IV. Professional Staff and Student-Staff Ratios
A. Number cf instructors: 86
B. Student-faculty ratio: 41/1b; 39/1 c
C. Number of counselors: 7
D. Student-counselor ratio: 492/1c; 486/le
E. Student evaluation of faculty:
"Use of student evaluations when feasible." Faculty hands outquestionnaires for each course and talley their own results.
V. Students
A.
B.
Ethnic bre -kdown
Financial aid:
Total aid
of student
Percent ofinstitution'sbudget
body (in percent):
Source and funds
Not available
Proportionbody receivingNumber
of studentaidPercentType Amount
$142,269b
$150,000c
$195,764e
4.5
4.7
6.0
Grants &scholar-ships
LoansWork-
study
BOGLoansWork-
25,48575,624
36,130
$ 15,130106,899
137230
60
65
12
9
study 56,510 62State
scholar-ship 4,060 12
Otherscholar-ships 3,800 19
FundAward 5,615 42BorgessServiceLeague 3,750 20
C. Students' ability:
1. Mean academic ability scores ACT: Composite 18.19Math 17.57English 16.48Nat. Sci. 19.8Soc. Sci. 18.47
2. Percentage of students at each high school GPA quartile
Top 10% 3
Top 25% 13
Top 30% 45Top 75% 77
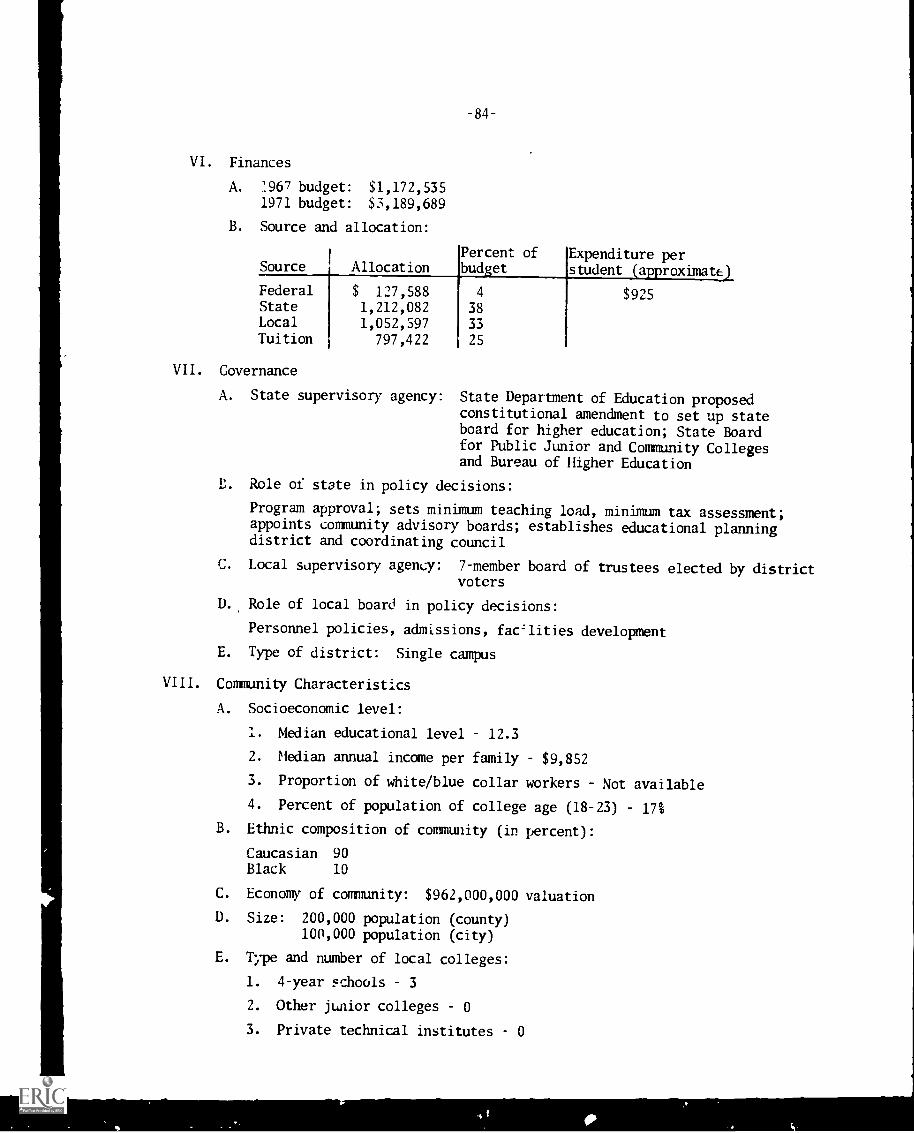
-84-
VI. Finances
A. :967 budget:
1971 budget:
B. Source and
Source
$1,172,535$3,189,689
allocation:
AllocationPercent ofbudget
Expenditure perstudent (approximate)
Federal $ 127,588 4 $925State 1,212,082 38Local 1,052,597 33Tuition 797,422 25
VII. Governance
A. State supervisory agency: State Department of Education proposed
constitutional amendment to set up stateboard for higher education; State Boardfor Public Junior and Community Collegesand Bureau of Higher Education
L. Role of state in policy decisions:
Program approval; sets minimum teaching load, minimum tax assessment;appoints community advisory boards; establishes educational planningdistrict and coordinating council
C. Local supervisory agency: 7-member board of trustees elected by districtvoters
D., Role of local board in policy decisions:
Personnel policies, admissions, facilities development
E. Type of district: Single campus
VIII. Community Characteristics
A. Socioeconomic level:
1. Median educational level 12.3
2. Median annual income per family $9,852
3. Proportion of white/blue collar workers Not available
4. Percent of population of college age (18-23) 17%
B. Ethnic composition of community (in percent):
Caucasian 90
Black 10
C. Economy of community: $962,000,000 valuation
D. Size: 200,000 population (county)100,000 population (city)
E. Type and number of local colleges:
1. 4-year Fchools 3
2. Other junior colleges 0
3. Private technical institutes 0
-85-
IX. Community Related Activities
A. There is no Director of Community Services
B. Proportion of budget allocated to community services: None
C. Community service activities: Not available; president attends majorcommunity meetings; in-district and out-of-district counselor workshois are held
D. Courses offered off campus: 13 (further information not available)
E. Programs and aid for disadvantaged students:
1. Programs basic college skills; reading skills program
2. Recruitment project "Total Package" recruits from the communitythrough black counselors and referrals
3. Financial aid EOP
F. Local advisory boards:
Advisory council for career education; o standing set of members fromb- siness and labor
G. Special community surveys:
Initial surveys to establish a public vocational school in the district;Pharmaceutical research institute sponsored employment research andmanpower information service in the district; Kinsey works closely withthe state unemployment office; work with chamber of commerce manpowerneeds committee
X. Self-studies/Institutional Research
No Director of Institutional Research (research done via Dean of Instruction)
Follow-up of College Skills Program
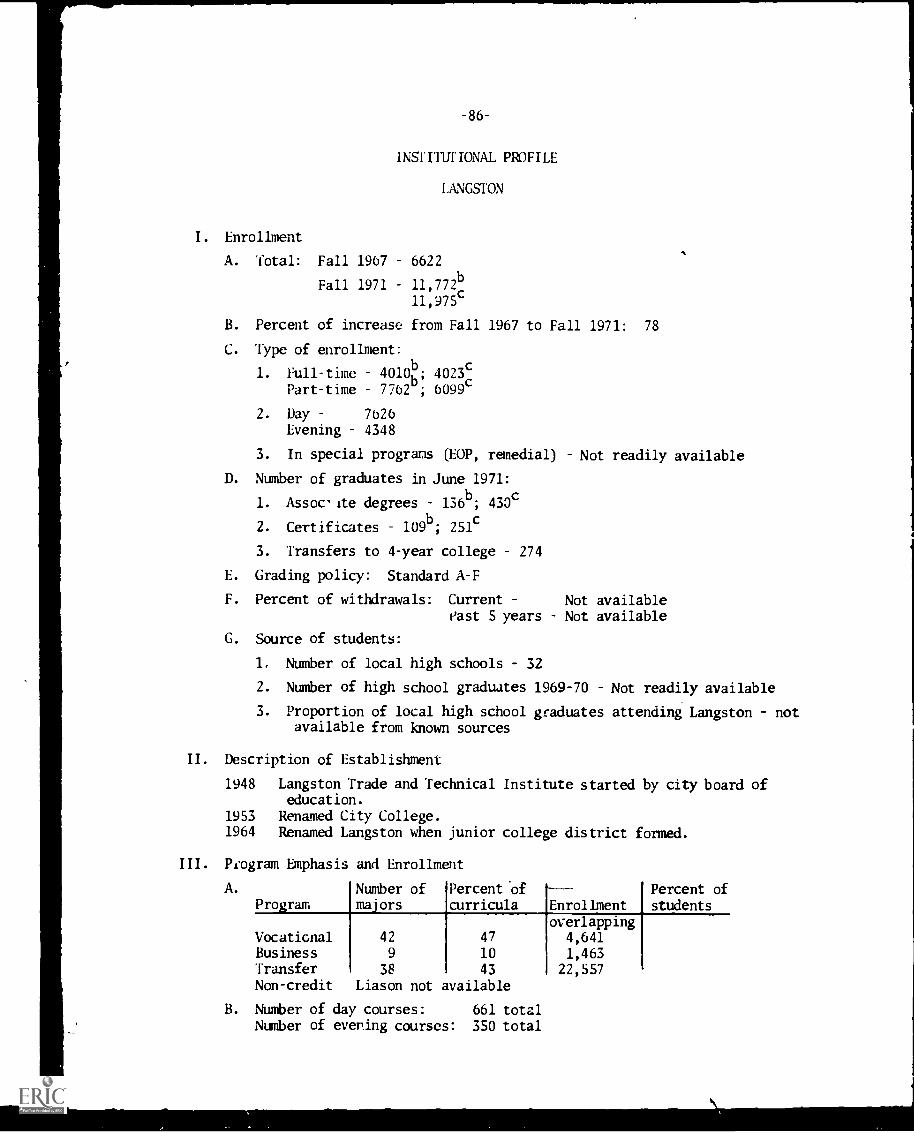
-86-
INSTITUFIONAL PROFILE
LANGSTON
I. Enrollment
A. Total: Fall 1967 6622
Fall 1971 11,772b11,975c
B. Percent of increase from Fall 1967 to Fall 1971: 78
C. Type of enrollment:
1. Full-time'
4010- 4023b
Part-time 7762 ; 6099
2. Day 7626Evening 4348
3. In special prograns (EOP, remedial) Not readily available
D. Number of graduates in June 1971:
1. Assoc'ite degrees 136b; 430c
2. Certificates 109b
; 251c
3. Transfers to 4-year college 274
E. Grading policy: Standard A-F
F. Percent of withdrawals: Current Not availableMast 5 years Not available
G. Source of students:
1. Number of local high schools 32
2. Number of high school graduates 1969-70 Not readily available
3. Proportion of local high school graduates attending Langston - notavailable from known sources
II. Description of Establishment
1948 Langston Trade and Technical Institute started by city board ofeducation.
1953 Renamed City College.1964 Renamed Langston when junior college district formed.
III. Program Emphasis and Enrollment
A.
ProgramNumber ofmajors
Percent Ofcurricula Enrollment
Percent ofstudents
VocationalBusinessTransfer
42
9
38
47
10
43
overlapping4,641
1,46322.557
Non-credit Liason not available
B. Number of day courses: 661 totalNumber of evening courses: 350 total
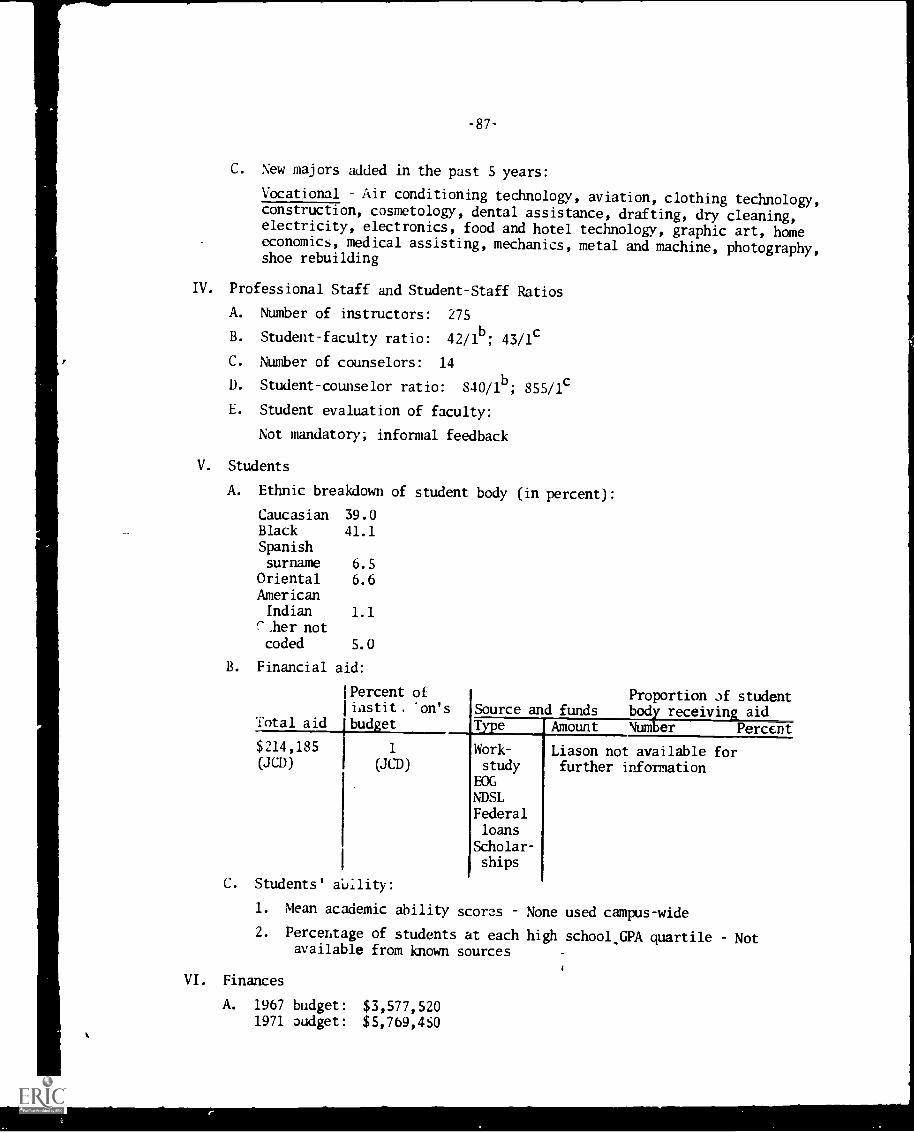
-87-
C. New majors added in the past 5 years:
Vocational Air conditioning technology, aviation, clothing technology,construction, cosmetology, dental assistance, drafting, dry cleaning,electricity, electronics, food and hotel technology, graphic art, homeeconomics, medical assisting, mechanics, metal and machine, photography,shoe rebuilding
IV. Professional Staff and Student-Staff Ratios
A. Number of instructors: 275
B. Student-faculty ratio: 42/1b; 43/1c
C. Number of counselors: 14
D. Student-counselor ratio: 840/1b; 855/1c
E. Student evaluation of faculty:
Not mandatory; informal feedback
V. Students
A. Ethnic breakdown of student body (in percent):
Caucasian 39.0Black 41.1Spanishsurname 6.5
Oriental 6.6AmericanIndian 1.1
r_her notcoded 5.0
B. Financial aid:
Percent of Proportion of studentiastit, "on's Source and funds bod receiving aidbud et Tile Amount Num er PercentTotal aid
$214,185(JCD)
1 Work- Liason not available for(JCD) study further information
EOG
NDSLFederalloans
Scholar-ships
C. Students' ability:
1. Mean academic ability scores None used campus-wide
2. Percentage of students at each high school,GPA quartile Notavailable from known sources
VI. Finances
A. 1967 budget: $3,577,5201971 audget: $5,769,450
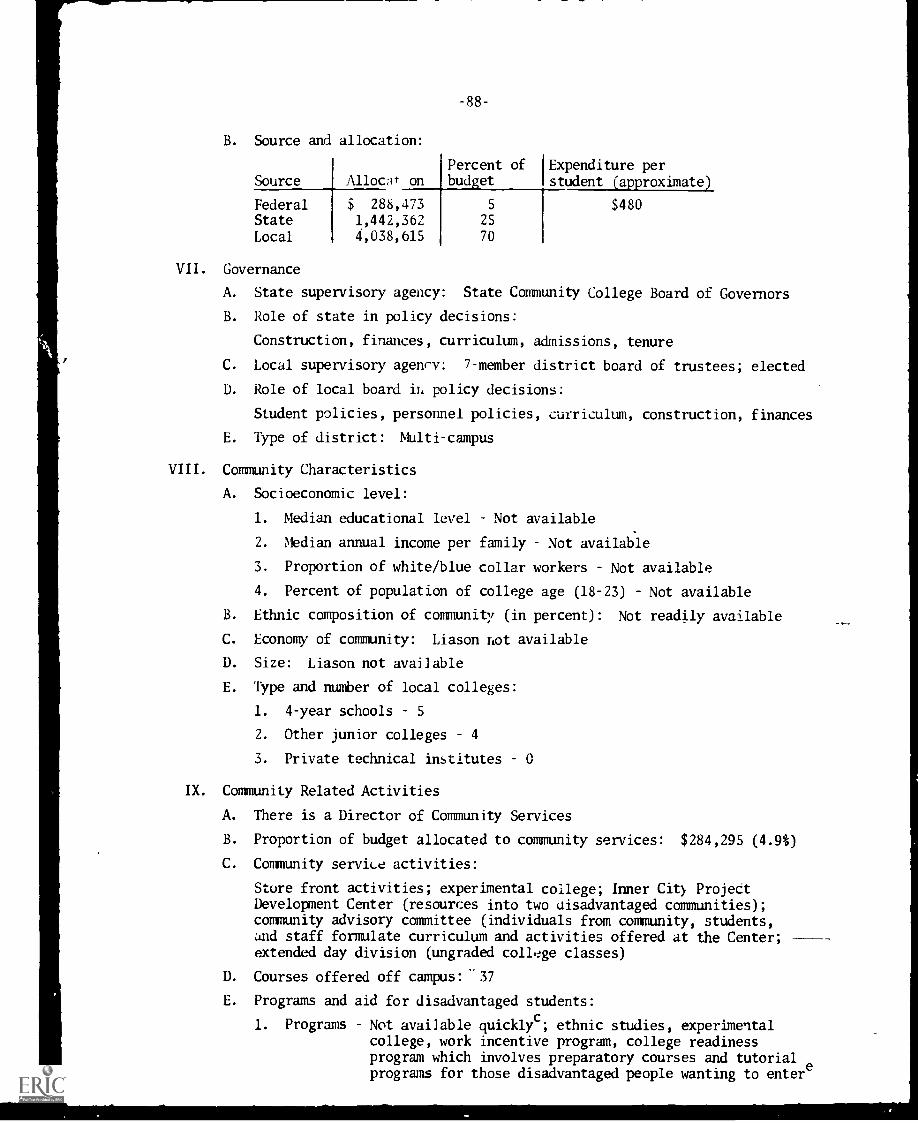
B. Source and
Source
FederalStateLocal
allocation:
Allocat on
$ 288,4731,442,3624,038,615
-88-
Percent of Expenditure perbud et student (approximate)
5 $48025
70
VII. Governance
A. State supervisory agency: State Community College Board of Governors
B. Role of state in policy decisions:
Construction, finances, curriculum, admissions, tenure
C. Local supervisory agency: 7-member district board of trustees; elected
D. Role of local board in policy decisions:
Student policies, personnel policies, curriculum, construction, finances
E. Type of district: Multi-campus
VIII. Community Characteristics
A. Socioeconomic level:
1. Median educational level Not available
2. Median annual income per family Not available
3. Proportion of white/blue collar workers Not available
4. Percent of population of college age (18-23) Not available
B. Ethnic composition of community (in percent): Not readily available
C. Economy of community: Liason riot available
D. Size: Liason not available
E. Type and number of local colleges:
1. 4-year schools 5
2. Other junior colleges 4
3. Private technical institutes 0
IX. Community Related Activities
A. There is a Director of Community Services
B. Proportion of budget allocated to community services: $284,295 (4.9%)
C. Community service activities:
Store front activities; experimental college; Inner City ProjectDevelopment Center (resources into two disadvantaged communities);community advisory committee (individuals from community, students,and staff formulate curriculum and activities offered at the Center;extended day division (ungraded college classes)
D. Courses offered off campus: 37
E. Programs and aid for disadvantaged students:
1. Programs Not available quicklyc; ethnic studies, experimentalcollege, work incentive program, college readinessprogram which involves preparatory courses and tutorialprograms for those disadvantaged people wanting to enter
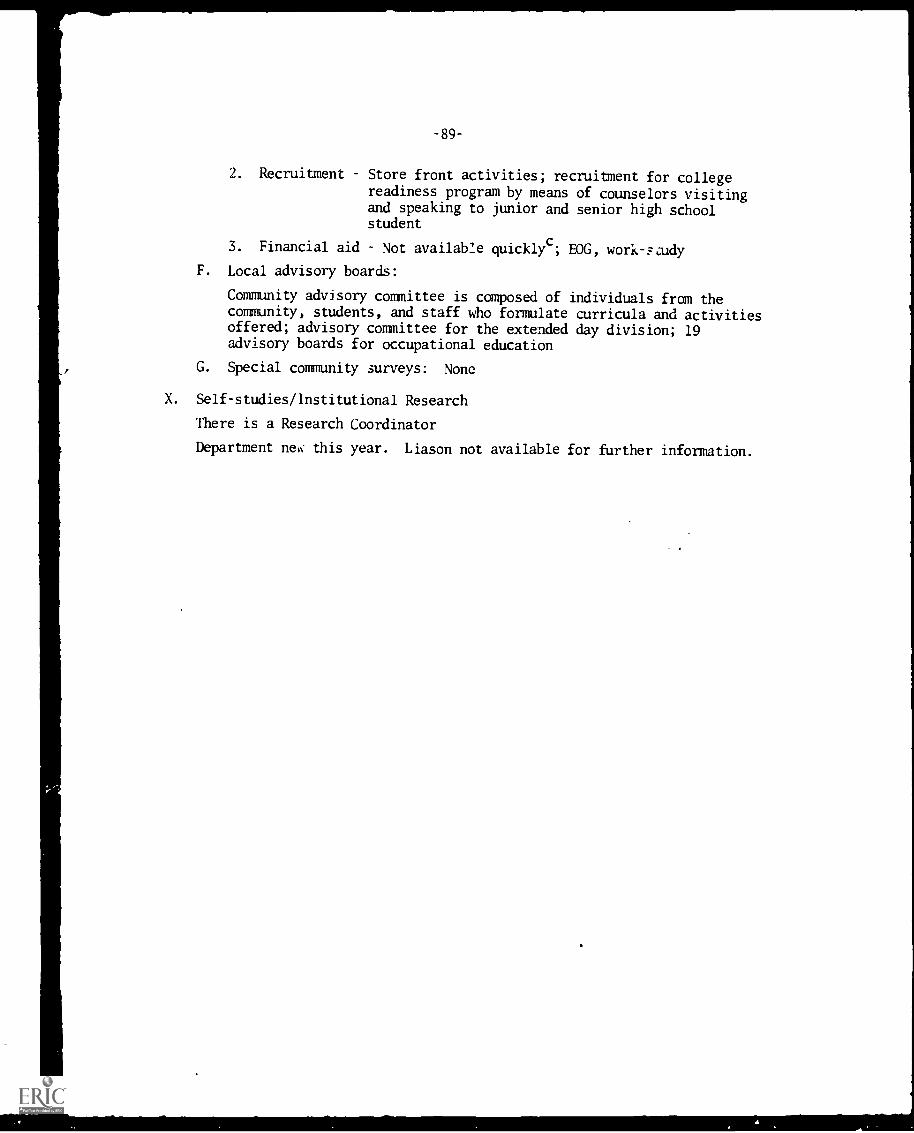
-89-
2. Recruitment Store front activities; recruitment for collegereadiness program by means of counselors visitingand speaking to junior and senior high schoolstudent
3. Financial aid Not available quicklyc; EOG, work-Fzudy
F. Local advisory boards:
Community advisory committee is composed of individuals from thecommunity, students, and staff who formulate curricula and activitiesoffered; advisory committee for the extended day division; 19advisory boards for occupational education
G. Special community surveys: None
X. Self-studies/Institutional Research
There is a Research Coordinator
Department new this year. Liason not available for further information.
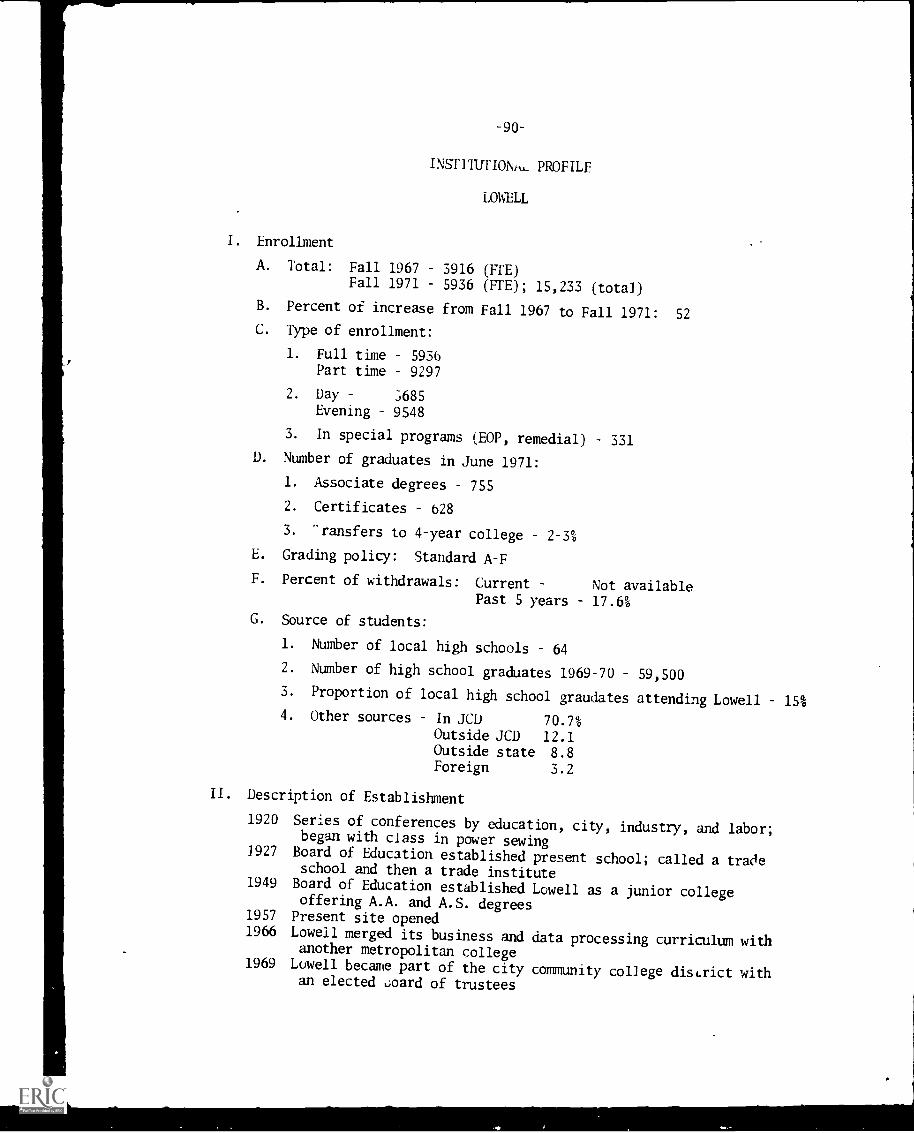
-90-
INST1TUTIONpt, PROFILE
LOWELL
I. Enrollment
A. Total: Fall 1967 3916 (FfE)Fall 1971 5936 (FTE); 15,233 (total)
B. Percent of increase from Fall 1967 to Fall 1971: 52
C. Type of enrollment:
1. Full time 5936Part time 9297
2. Day 3685Evening 9548
3. In special programs (EOP, remedial) 331
D. Number of graduates in June 1971:
1. Associate degrees 755
2. Certificates b28
3. "ransfers to 4-year college 2-3%
E. Grading policy: Standard A-F
F. Percent of withdrawals: Current Not availablePast 5 years 17.6%
G. Source of students:
1. Number of local high schools 64
2. Number of high school graduates 1969-70 59,5003. Proportion of local high school graudates attending Lowell 15%4. Other sources In JCD 70.7%
Outside JCD 12.1Outside state 8.8Foreign 3.2
II. Description of Establishment
1920 Series of conferences by education, city, industry, and labor;began with class in power sewing
1927 Board of Education establishedpresent school; called a trade
school and then a trade institute1949 Board of Education established Lowell as a junior college
offering A.A. and A.S. degrees1957 Present site opened1966 Lowell merged its business and data processing curriculum with
another metropolitan college1969 Lowell became part of the city community college dist.rict with
an elected board of trustees
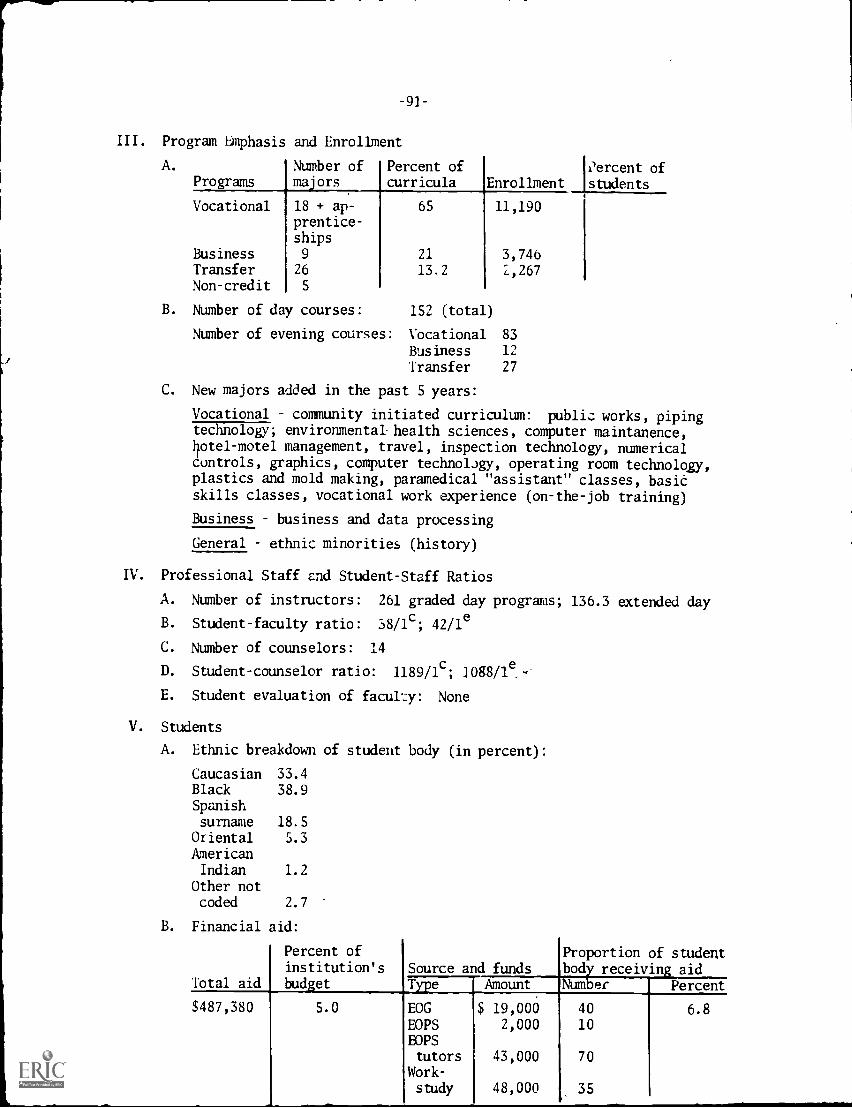
-91-
III. Program Emphasis and Enrollment
A.
ProgramsNumber ofmajors
Percent ofcurricula Enrollment
percent ofstudents
Vocational 18 + ap-prentice-ships
65 11,190
Business 9 21 3,746Transfer 26 13.2 i,267Non-credit 5
B. Number of day courses: 152 (total)
Number of evening courses: Vocational 83
Business 12
Transfer 27
C. New majors added in the past 5 years:
Vocational community initiated curriculum: public works, pipingtechnology; environmental health sciences, computer maintanence,}hotel -motel management, travel, inspection technology, numerical
controls, graphics, computer technology, operating room technology,plastics and mold making, paramedical "assistant" classes, baskskills classes, vocational work experience (on-the-job training)
Business business and data processing
General ethnic minorities (history)
IV. Professional Staff and Student-Staff Ratios
A. Number of instructors: 261 graded day programs; 136.3 extended day
B. Student-faculty ratio: 38/1c; 42/le
C. Number of counselors: 14
D. Student-counselor ratio: 1189/1c; 1088/1e.--'
E. Student evaluation of facul.:y: None
V. Students
A. Ethnic breakdown of student body (in percent):
Caucasian 33.4Black 38.9Spanishsurname 18.5
Oriental 5.3
AmericanIndian 1.2
Other notcoded 2.7
B. Financial
Total aid
aid:
Percent ofinstitution'sbudget
Source and fundsProportionboy receiving_aidNumber
40
10
70
35
of student
Toe
EOGBOPSBOPStutors
Work-
study
Amount.
$ 19,0002,000
43,000
48,000
[Percent
6.8$487,380 5.0

-92-
B. Financi 11 aid (cont'd):
Percent ofinstitution's
Total aid budgetSource and funds
Proportion of studentbody receiving aid
Type Amount Number Percent
Federal
loans $150,000 278NDSL 41,380Nursingloan 4,500 6
Depart-mentloans 3,500 72
Studentassist-ants 55,500 53
Scholar-ships 72,000 200
NDL 38,000 90Psychiat-ric
technol-ogist 7,500 12
Grants 3,000 166
C. Students' ability:
1. Mean academic ability scores Not available
2. Percentage of students at each high school GPA quartile Notavailable
VI. Finances
A. 1967 budget: $6,837,8341971 budget: $10,325,289
B. Source and allocation:
Source AllocationPercent ofbudget
Expenditure perstudent (approximate)
Federal $7,124,449 69.0 $677State 1,806,926 17.5Local 516,264 5.0Other 877,650 8.5
VII. Governance
A. State supervisory agency: State Community College Board of Governors
B. Role of state in policy decisions:
Tenure, construction; occupational curriculum, income, andexpenditures (with local board)
C. Local supervisory agency: 7-member community college board of trustees;elected at alternate biennial elections
D. Role of local board in policy decisions:
Construction, finances, personnel policies, curriculum, studentpolicies
E. Type of district: Multi-campus
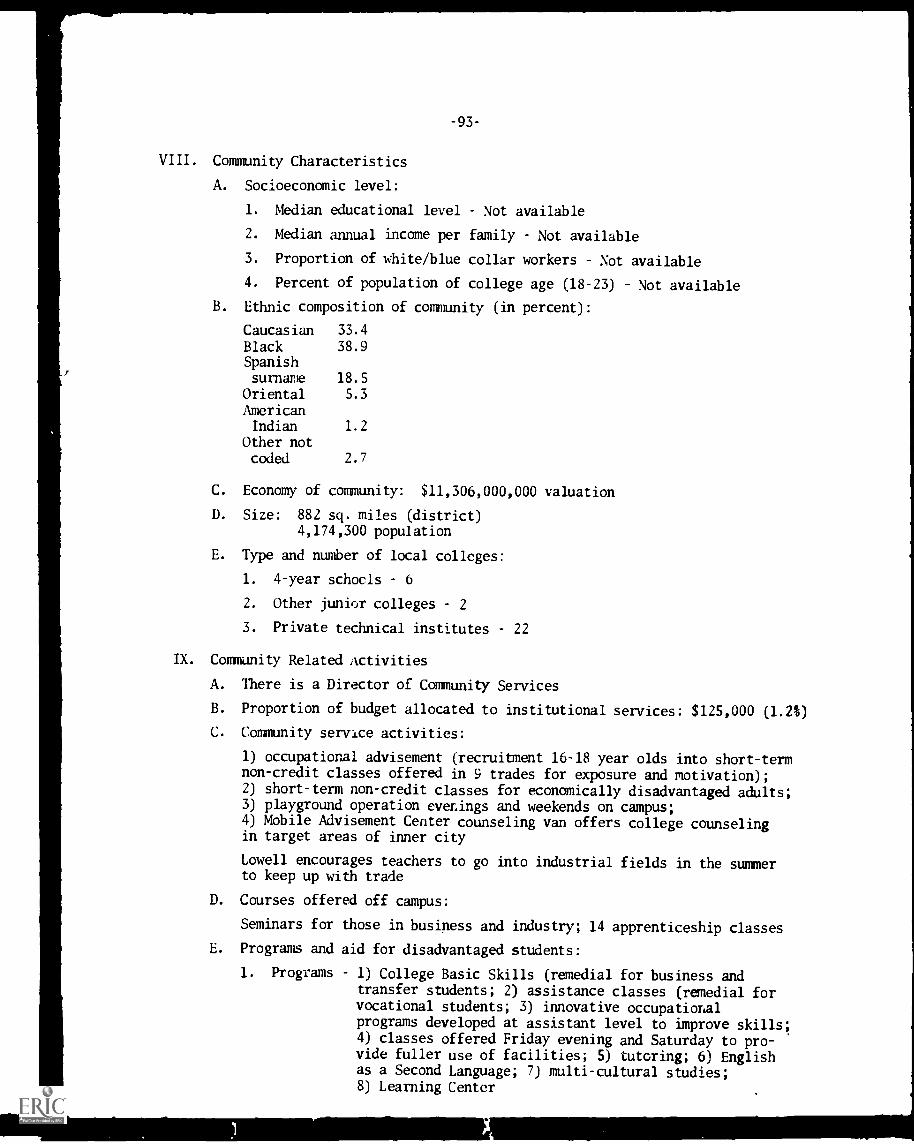
VIII. Community Characteristics
A. Socioeconomic level:
1. Median educational level Not available
2. Median annual income per family Not available
3. Proportion of white/blue collar workers Not available
4. Percent of population of college age (18-23) Not available
B. Ethnic composition of community (in percent):
Caucasian 33.4
Black 38.9Spanishsurnarie 18.5
Oriental 5.3
AmericanIndian 1.2
Other notcoded 2.7
C. Economy of community: $11,306,000,000 valuation
D. Size: 882 sq. miles (district)4,174,300 population
E. Type and number of local colleges:
1. 4-year schools 6
2. Other junior colleges 2
3. Private technical institutes 22
IX. Community Related Activities
A. There is a Director of Community Services
B. Proportion of budget allocated to institutional services: $125,000 (1.2%)
C. Community service activities:
1) occupational advisement (recruitment 16-18 year olds into short-termnon-credit classes offered in 9 trades for exposure and motivation);2) short-term non-credit classes for economically disadvantaged adults;3) playground operation evenings and weekends on campus;4) Mobile Advisement Center counseling van offers college counselingin target areas of inner city
Lowell encourages teachers to go into industrial fields in the summerto keep up with trade
D. Courses offered off campus:
Seminars for those in business and industry; 14 apprenticeship classes
E. Programs and aid for disadvantaged students:
1. Programs 1) College Basic Skills (remedial for business andtransfer students; 2) assistance classes (remedial forvocational students; 3) innovative occupationalprograms developed at assistant level to improve skills;4) classes offered Friday evening and Saturday to pro-vide fuller use of facilities; 5) tutoring; 6) Englishas a Second Language; 7) multi-cultural studies;8) Learning Center
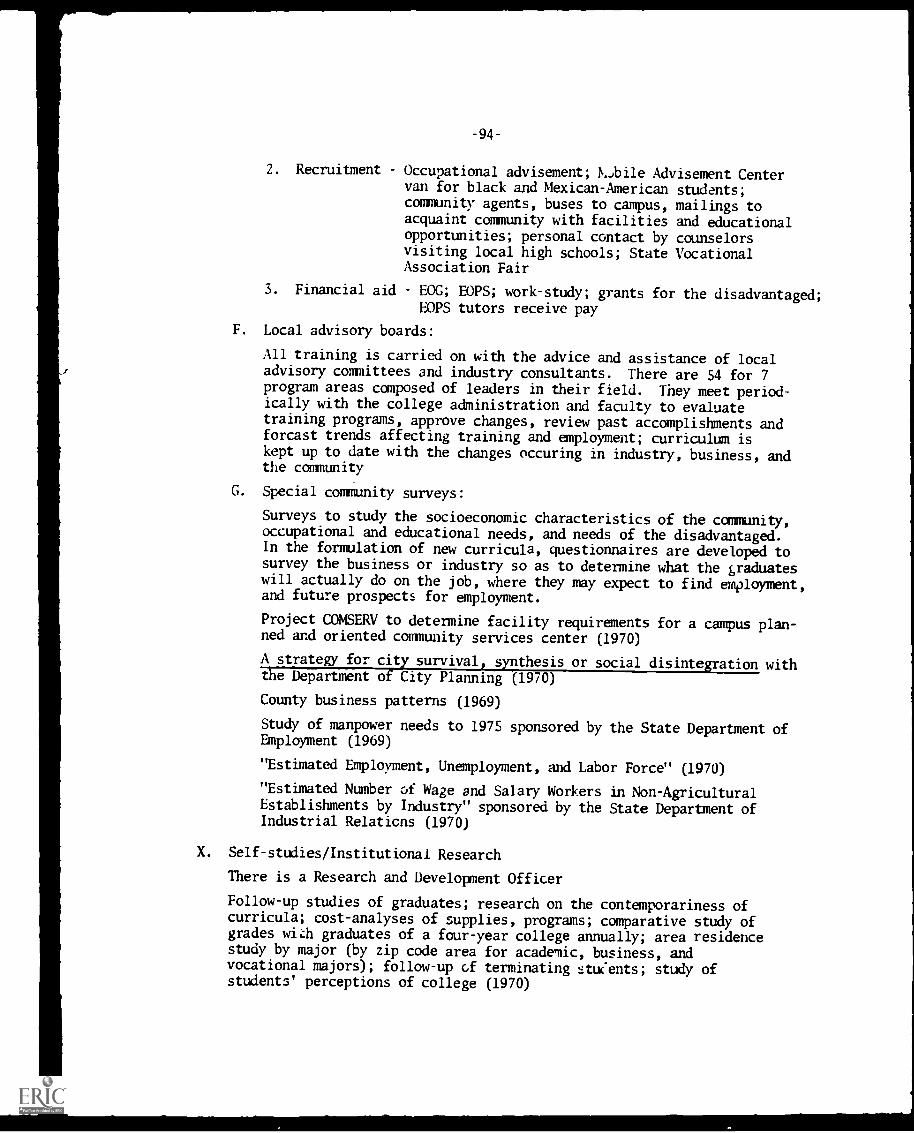
2. Recruitment Occupational advisement; 11/4-,bile Advisement Centervan for black and Mexican-American students;
community agents, buses to campus, mailings toacquaint community with facilities and educationalopportunities; personal contact by counselorsvisiting local high schools; State VocationalAssociation Fair
3. Financial aid EOG; EOPS; work-study; grants for the disadvantaged;FOPS tutors receive pay
F. Local advisory boards:
All training is carried on with the advice and assistance of localadvisory committees and industry consultants. There are 54 for 7program areas composed of leaders in their field. They meet period-ically with the college administration and faculty to evaluatetraining programs, approve changes, review past accomplishments andforcast trends affecting training and employment; curriculum iskept up to date with the changes occuring in industry, business, andthe community
G. Special community surveys:
Surveys to study the socioeconomic characteristics of the community,occupational and educational needs, and needs of the disadvantaged.In the formulation of new curricula, questionnaires are developed tosurvey the business or industry so as to determine what the graduateswill actually do on the job, where they may expect to find employmentand future prospects for employment.
Project CONSERV to determine facility requirements for a campus plan-ned and oriented community services center (1970)
A strategy for city survival, synthesis or social disintegration withthe Department of City Planning (1970)
County business patterns (1969)
Study of manpower needs to 1975 sponsored by the State Department ofEmployment (1969)
"Estimated Employment, Unemployment, and Labor Force" (1970)
"Estimated Number of Wage and Salary Workers in Non-AgriculturalEstablishments by Industry" sponsored by the State Department ofIndustrial Relations (1970)
X. Self-studies/Institutional Research
There is a Research and Development Officer
Follow-up studies of graduates; research on the contemporariness ofcurricula; cost-analyses of supplies, programs; comparative study ofgrades wish graduates of a four-year college annually; area residencestudy by major (by zip code area for academic, business, andvocational majors); follow-up of terminating t.:tuCents; study ofstudents' perceptions of college (1970)
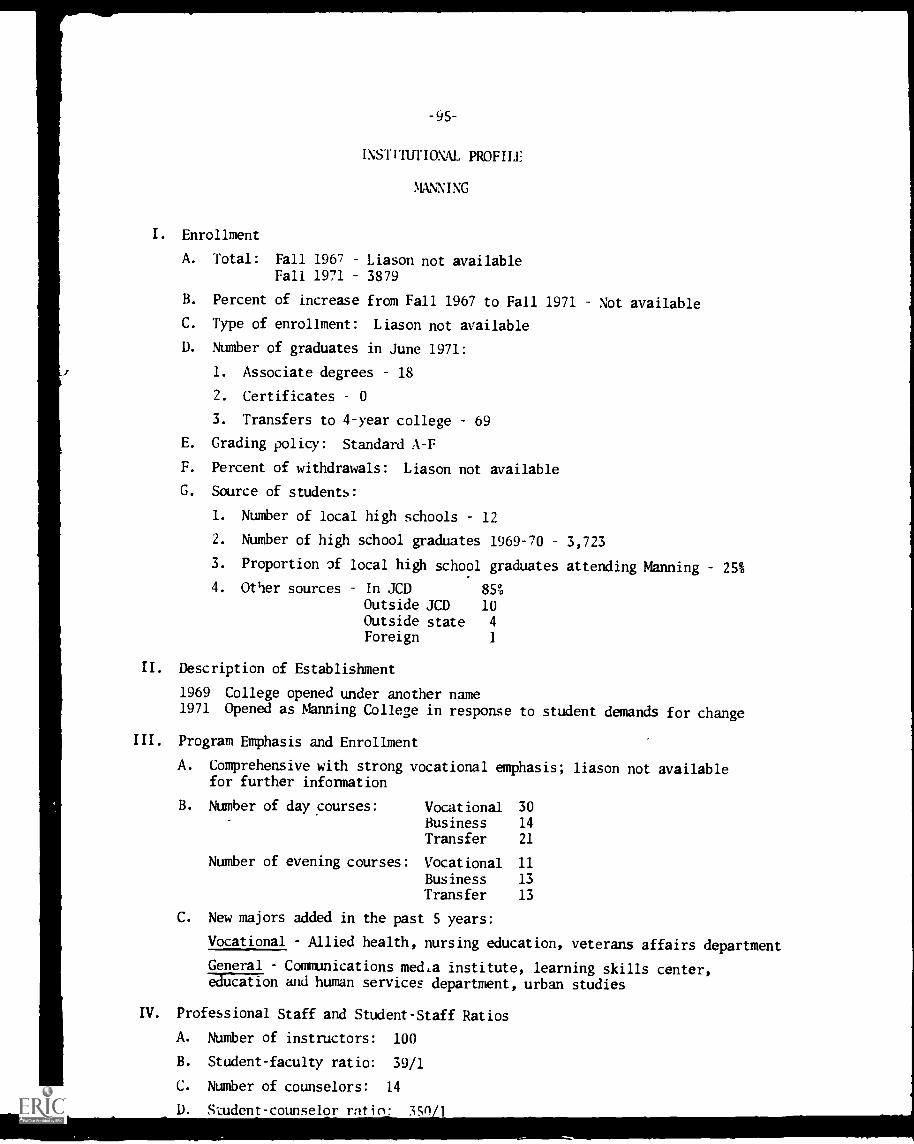
-95-
INST IOXAL PROFILE
MANNING
I. Enrollment
A. Total: Fall 1967 Liason not availableFall 1971 3879
B. Percent of increase from Fall 1967 to Fall 1971 Not available
C. Type of enrollment: Liason not available
D. Number of graduates in June 1971:
1. Associate degrees 18
2. Certificates 0
3. Transfers to 4-year college 69
E. Grading policy: Standard A-F
F. Percent of withdrawals: Liason not available
G. Source of students:
1. Number of local high schools 12
2. Number of high school graduates 1969-70 3,723
3. Proportion of local high school graduates attending Manning 25%
4. Other sources In JCD 85%Outside JCD 10Outside state 4
Foreign
II. Description of Establishment
1969 College opened under another name1971 Opened as Manning College in response to student demands for change
III. Program Emphasis and Enrollment
A. Comprehensive with strong vocational emphasis; liason not availablefor further information
B. Number of day courses: Vocational 30
Business 14
Transfer 21
Number of evening courses: Vocational 11
Business 13
Transfer 13
C. New majors added in the past 5 years:
Vocational Allied health, nursing education, veterans affairs department
General Communications media institute, learning skills center,education and human services department, urban studies
IV. Professional Staff and Student-Staff Ratios
A. Number of instructors: 100
B. Student-faculty ratio: 39/1
C. Number of counselors: 14
. Student-counselor ratio: 35n
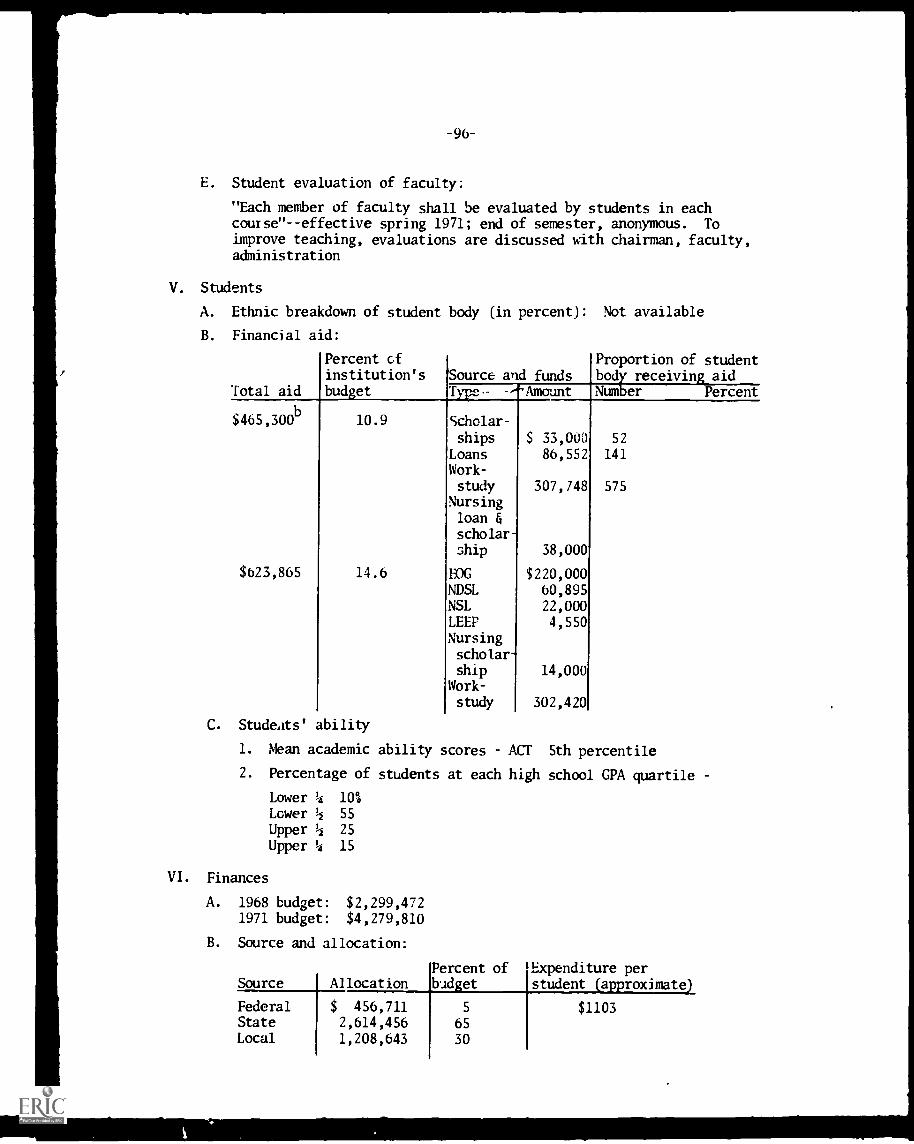
-96-
E. Student evaluation of faculty:
"Each member of faculty shall be evaluated by students in eachcourse"--effective spring 1971; end of semester, anonymous. Toimprove teaching, evaluations are discussed with chairman, faculty,administration
V. Students
A. Ethnic breakdown of student
B. Financial aid:
body (in percent): Not available
Total aid
Percent cfinstitution'sbudget
10.9
Source and fundsProportion of studentbody receiving aidNumber PercentType- -/-Amount
Scholar-$465,300b
ships $ 33,000 52
Loans 86,552 141Work-study 307,748 575
Nursingloan &scholar-ship 38,000
$623,865 14.6 EDG $220,000NDSL 60,895NSL 22,000LEEP 4,550Nursingscholar-ship 14,000
Work-
study 302,420
C. Students' ability
1. Mean academic ability scores ACT 5th percentile
2. Percentage of students at each high school GPA quartile
Lower 1/4 100
Lower !I 55
Upper h. 25
Upper 1/4 15
VI. Finances
A. 1968 budget: $2,299,4721971 budget: $4,279,810
B. Source and allocation:
Percent of Expenditure perSource Allocation budget student (approximate)
Federal $ 456,711 5 $1103State 2,614,456 65Local 1,208,643 30
-97-
VII. Governance
A. State supervisory agency: State Board of Higher Education
B. Role of state in policy decisions:
Construction, finances, occupational curriculum
C. Local supervisory agency: Board of trustees
D. Role of Local board in policy decisions:
Personnel policies, academic curriculum, student policies
E. Type of district: Multi-campus
VIII. Community Characteristics
A. Socioeconomic level:
1. Median educational level Not available
2. Median annual income per family Not available
3. Proportion of white/blue collar workers Not available
4. Percent of population of college age (18-23) Not available
B. Ethnic composition of community (in percent):
Caucasian 5
Black 92
Spanish. surname 3
C. Economy of community: Liason not available
D. Size: 12 sq. miles (city)530,095 population
E. Type and number of local colleges:
1. 4-year schools 1
2. Other junior colleges 6
3. Private technical institutes 2
IX. Community Related Activities
A. There is a Vice President of Student and Community Services anda Dean of Community Services and Continuing Education
B. Proportion of budget allocated to community services: Liason not available
Community service activities:
Project Prep pre-discharge program at two armed services facilitiesfor servicemen's high school diploma
Community tutorial projects; drug education; parolee assistahce program;political awareness program; basic English; general educationaldevelopment program; weekend college; employability training
Prison annex program in two correctional facilities to continueeducation in prison and to enable transferance and functioning whenparolled
Project Impact occupational training center to train unemployed andunderemployed residents in five vocational areas
Upward Bound to accelerate the education of fifty 9th and 10th gradeinner city high school students
-98-
C. Community service activities (cont'd):
Neighborhood Youth Corps summer project provides work-study experiencefor 100 disadvantaged high school graduates in a special servicesprogram (supportive pay, counseling, employability training)
Community Resources Data Center gathers and disseminates information toassist community organizations become more aware of community resources;coordinates research projects to improve services and programs availableto community; provides continuous evaluation of community needs
Cooperative education program work-study experience for 100 Mailingstudents in a cooperative arrangement with employers in community(pending)
Inner City Community College National Consortium Project faculty,student, administrative representatives of inner city communitycolleges throughout the country meet to discuss specific problems(pending)
Five neighborhood day care centers
Project "Future Education Now" model program of effective educationfor disadvantaged members of community through services provided byManning College Learning Resources Center (pending)
Mid-management program; veterans affairs program
St. Charles Program (1971) extension courses given a state trainingschool for boys with an identical program set up at the college toallow for transfer from the school to Manning
Manning College Credit in Escrow high school students take collegelevel courses
Art exhibits working agreement with city museum to receiveeducational exhibits for display at the college; cultural programof researching black art
All students and faculty urged to work in community (e.g., teacheraides in elementary schools, planners and workers on communitycouncils, etc.)
Visits by counselors, faculty, etc. to public clubs and street gangsto ascertain needs and interests
Conference of 25 community and social agencies iseld in order toassess the present services to the community residents and todetermine the role the college could pla,
Small Business Institute offers business courses geared to smallminority enterprises
Weekly review of community relations projects with outside publicrelations firm which provides an objective overview of the collegeand community needs
Regular contacts with local national media
Street Academy counseling, tutorial work, GED review, technical-vocational training for those in the community who wish to completetheir education; educational methods adapted to the needs of thecommunity
Speakers bureau administrators, faculty, and students speak tocommunity social, religious, educational, and political organizations
Division of community services and continuing education employspersons indigenous to the community
-99-D. Cour,es fered off campus-
Prison Annex Program coursesprison and the community)
Project Prep (general studies
60 outposts in the connunityof black people; on-locationoffend at a mental hospital
E. Progr,ms and aid for he disadvantaged students:
1. Programs Learning Skills Center; Neighborhood Youth CorpsPrep Academy (unemployed youth employability training);Upward Bound; USOE student special services; basicEnglish; general educational development program;Project Impact; College Learning Resources Center
2. Recruitment Recruits parolees, discharged servicemen; throughspeakers, films, public relations, mailings,external newsletter; high school dropout programrecruits 100 high school dropouts for work-study
3. Financial aid Special services to support minority students incollege; Neighborhood Youth Corps ($75,000);Parolee Assistance Program provides funds; work-study; EOC
F. Local advisory boards:
Specialized occupational advisory committee in each occupational area;College Community Advisory Board with community residents, represent-atives of community groups and students meet with administrators andfaculty to articulate conmuniti educational needs, review totaltechnical and occupational offerings of the college and advise onnew requirements and priorities; pre-professional and relatedcurricula advisory board to advise and assist the dean of CareersCollege; advisory committees with community churches, businesses,and banks involved with school fund raising and recruitment; 8Allied Health advisory committees
G. Special community surveys:
Community surveys on socioeconomic characteristics, occupationaland educational needs and needs of the disadvantaged; survey ofcommunity television viewing preferences for Manning to acquiretelevision time for educational purposes
offered in prison to bridge gap between
0110,-for pre-discharge military men)
serving educational and vocational needssettings, e.g., abnormal psychology
X. Self-studies/Institutional Research
There is a Director of Institutional Research
Study of persistence as related to grades in 1969 (sample of threeremedial English courses); attrition as related to placement in variouslevels of freshman English; geographical survey of the residence patternsof the Fall 1969 students (which led to the development of a weekendprogram to accommodate time constraints of part-time students); studyof the inner-city public school system on the achievement of inner-citystudents to document the relationships between quality of learning,environment, and student performance (1969); follow-up study of Fall1969 students who did not return for the spring term.
Summer 1970 all-college weekend workshops with community representatives,
students, faculty, administrators, and clerical staff to exchange ideasand for professional development; faculty development program by USOEDivision of Educational Professional Development to develop moreeffective commmication between faculty, administrators, and students (1970);
-100-
X. Self-studies/Institutional Research (cont'd)
Curriculum development and implementation workshop (1971); ProjectCo-op to train Learning Resources staff in the development and use ofnew instructional material; Community Resources Data Center; peercounseling training program; day care center; survey of non-creditadult education; evaluation of non-punitive grading system at thecollege; study of perceived and ideal student influence in campusaffairs; follow-up study of June 1970 graduates to evaluate theirprogress in pursuing their goals; ACT Institutional Self-Study Abstractto determine students' perceptions of pertinent factors pertaining tothe total environment of the college including major, vocationalchoice, self-estimated progress, student reactions to instructors,faculty encouragement, etc.
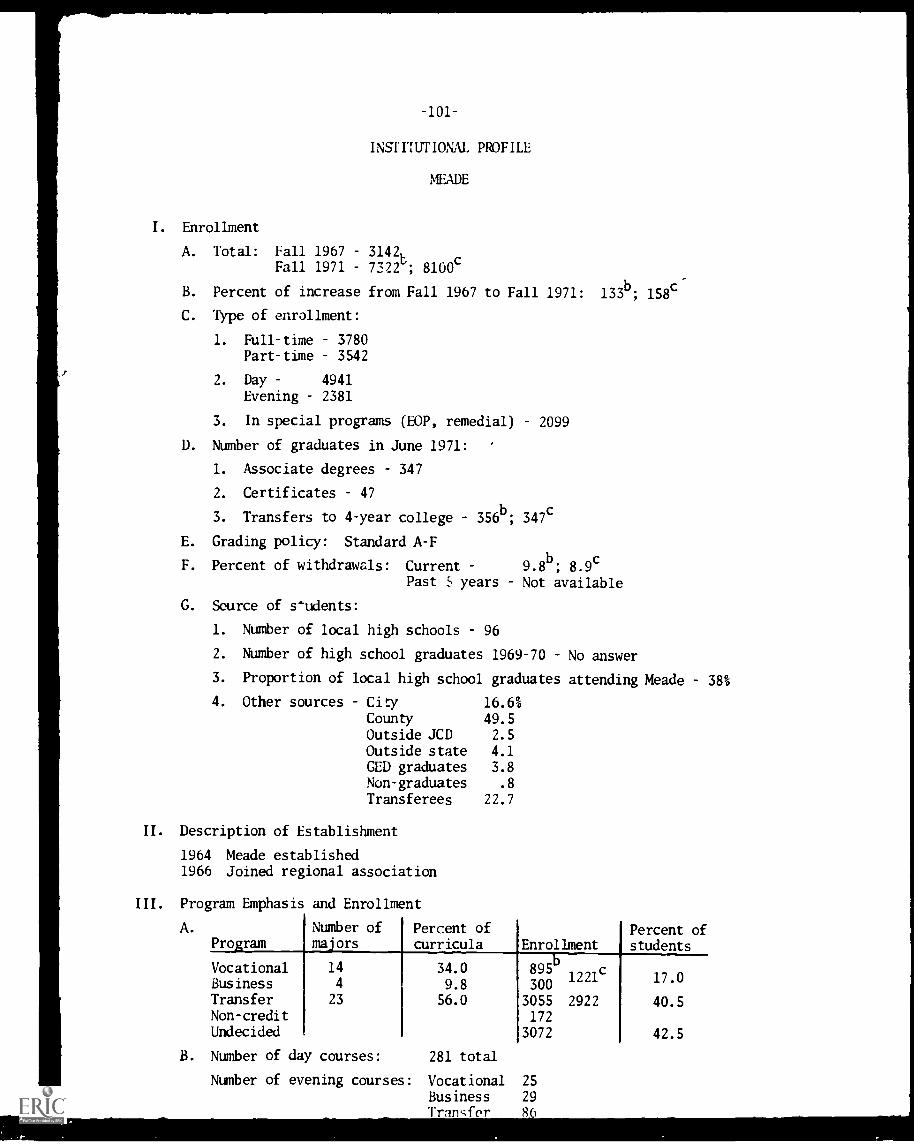
-101-
INSFFIUTIONAL PROFILE
MEADE
I. Enrollment
A. Total: Fall 1967 3142b
Fall 1971 73221; 8100c
B. Percent of increase from Fall 1967 to Fall 1971: 133b
; 158c
C. Type of enrollment:
1. Full-time 3780Part-time 3542
2. Day 4941
Evening 2381
3. In special programs (FOP, remedial) 2099
D. Number of graduates in June 1971:
1. Associate degrees 347
2. Certificates 47
3. Transfers to 4-year college 356b; 347
c
E. Grading policy: Standard A-F
F. Percent of withdrawals: Current 9.8b
; 8.9c
Past 5 years Not available
G. Source of s-udents:
1. Number of local high schools 96
2. Number of high school graduates 1969-70 No answer
3. Proportion of local high school graduates attending Meade 38%
4. Other sources City 16.6%County 49.5Outside JCD 2.5
Outside state 4.1
GED graduates 3.8Non-graduates .8
Transferees 22.7
II. Description of Establishment
1964 Meade established1966 Joined regional association
III. Program Emphasis and Enrollment
A.
ProgramNumber ofmajors
Percent ofcurricula Enrollment
Percent ofstudents
VocationalBusinessTransferNon-creditUndecided
14
4
23
34.09.8
56.0
895b
1221c
3003055 2922172
3072
17.0
40.5
42.5
B. Number of day courses: 281 total
Number of evening courses: Vocational 25
Business 29
Tranc;fer 8
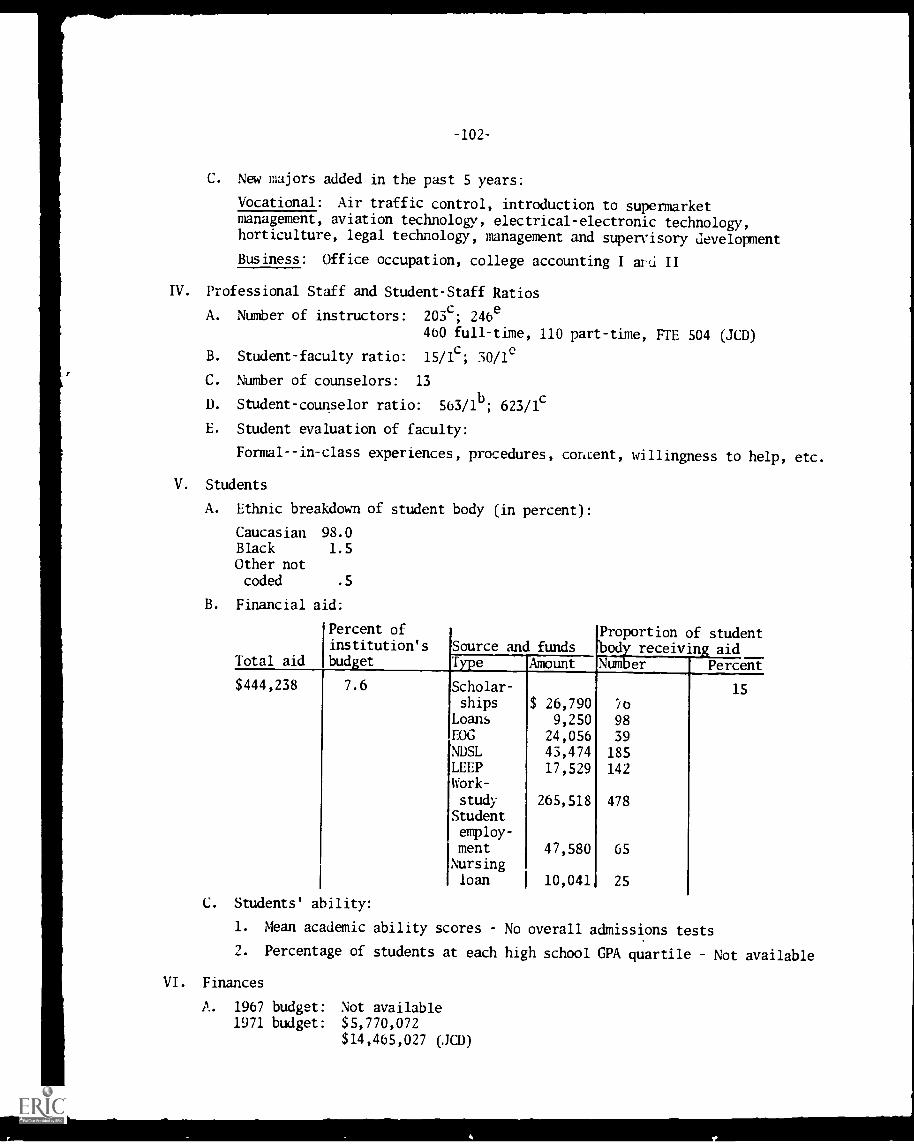
-102-
C. New majors added in the past 5 years:
Vocational: Air traffic control, introduction to supermarketmanagement, aviation technology, electrical-electronic technology,horticulture, legal technology, management and supervisory development
Business: Office occupation, college accounting I aru II
IV. Professional Staff and Student-Staff Ratios
A. Number of instructors: 203c; 246e
460 full-time, 110 part-time, FTE 504 (JCD)
B. Student-faculty ratio: 15/1c; 30/1c
C. Number of counselors: 13
D. Student-counselor ratio: 563/1b
; 623/1c
E. Student evaluation of faculty:
Formal--in-class experiences, procedures, content, willingness to help, etc.
V. Students
A. Ethnic breakdown of student body (in percent):
CaucasianBlackOther notcoded
B. Financial aid:
Total aid
98.01.5
.5
Percent ofinstitution'sbudget
Source and fundsProportion ofbody receivingNumber
studentaid
PercentType Amount
$444,238 7.6 Scholar- 15ships $ 26,790
Loans 9,250 98EOG 24,056 39NDSL 43,474 185LEEP 17,529 142Work-
study 265,518 478Studentemploy-ment 47,580 65Nursingloan 10,041 25
C. Students' ability:
1. Mean academic ability scores No overall admissions tests
2. Percentage of students at each high school GPA quartile Not available
VI. Finances
A. 1967 budget: Not available1971 budget: $5,770,072
$14,465,027 (JCD)
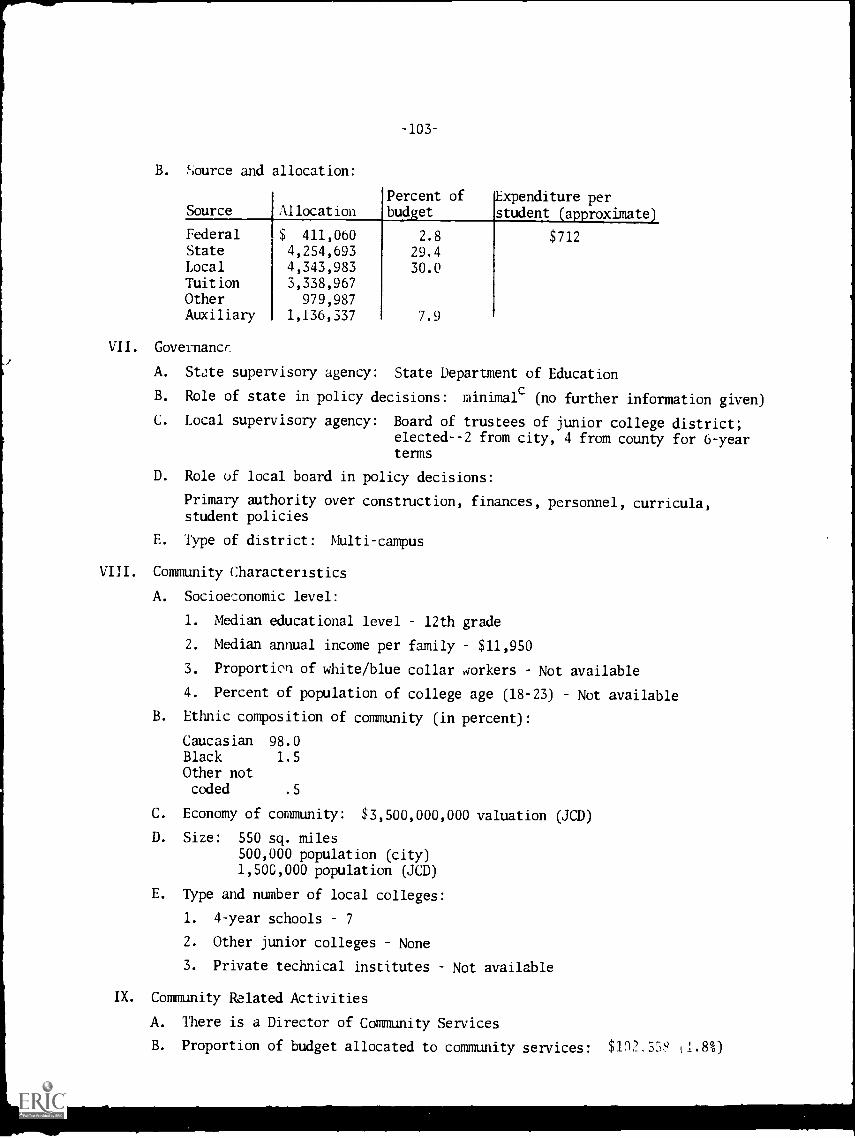
-103-
B. Source and allocation:
Source AllocationPercent ofbudget
Expenditure perstudent (approximate)
Federal $ 411,060 2.8 $712State 4,254,693 29.4Local 4,343,983 30.0Tuition 3,338,967Other 979,987Auxiliary 1,136,337 7.9
VII. Governance.
A. State supervisory agency: State Department of Education
B. Role of state in policy decisions: minimalc (no further information given)
C. Local supervisory agency: Board of trustees of junior college district;elected--2 from city, 4 from county for 6-yearterms
D. Role of local board in policy decisions:
Primary authority over construction, finances, personnel, curricula,student policies
E. Type of district: Multi-campus
VIII. Community Characteristics
A. Socioeconomic level:
1. Median educational level 12th grade
2. Median annual income per family $11,950
3. Proportion of white/blue collar ororkers Not available
4. Percent of population of college age (18-23) Not available
B. Ethnic composition of community (in percent):
Caucasian 98.0Black 1.5Other notcoded .5
C. Economy of community: $3,500,000,000 valuation (JCD)
D. Size: 550 sq. miles
500,000 population (city)1,500,000 population (JCD)
E. Type and number of local colleges:
1. 4-year schools 7
2. Other junior colleges None
3. Private technical institutes Not available
IX. Community Related Activities
A. There is a Director of Community Services
B. Proportion of budget allocated to community services: $1n2.5 s (1.8%)
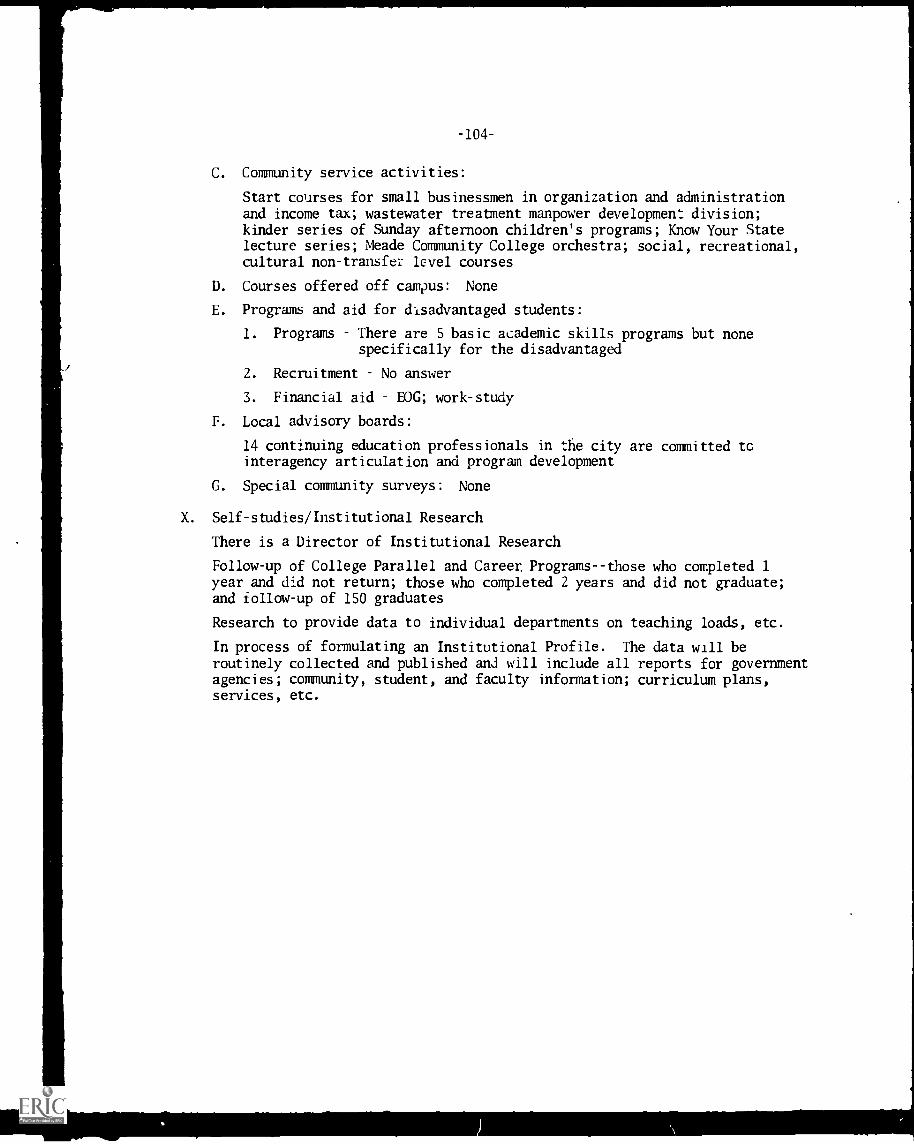
-104-
C. Community service activities:
Start courses for small businessmen in organization and administrationand income tax; wastewater treatment manpower development division;kinder series of Sunday afternoon children's programs; Know Your Statelecture series; Meade Community College orchestra; social, recreational,cultural non-transfer level courses
D. Courses offered off campus: None
E. Programs and aid for disadvantaged students:
1. Programs There are 5 basic academic skills programs but nonespecifically for the disadvantaged
2. Recruitment No answer
3. Financial aid BOG; work-study
F. Local advisory boards:
14 continuing education professionals in the city are committed tcinteragency articulation and program development
G. Special community surveys: None
X. Self-studies/Institutional Research
There is a Director of Institutional Research
Follow-up of College Parallel and Career. Programs--those who completed 1year and did not return; those who completed 2 years and did not graduate;and follow-up of 150 graduates
Research to provide data to individual departments on teaching loads, etc.
In process of formulating an Institutional Profile. The data will beroutinely collected and published and will include all reports for governmentagencies; community, student, and faculty information; curriculum plans,services, etc.
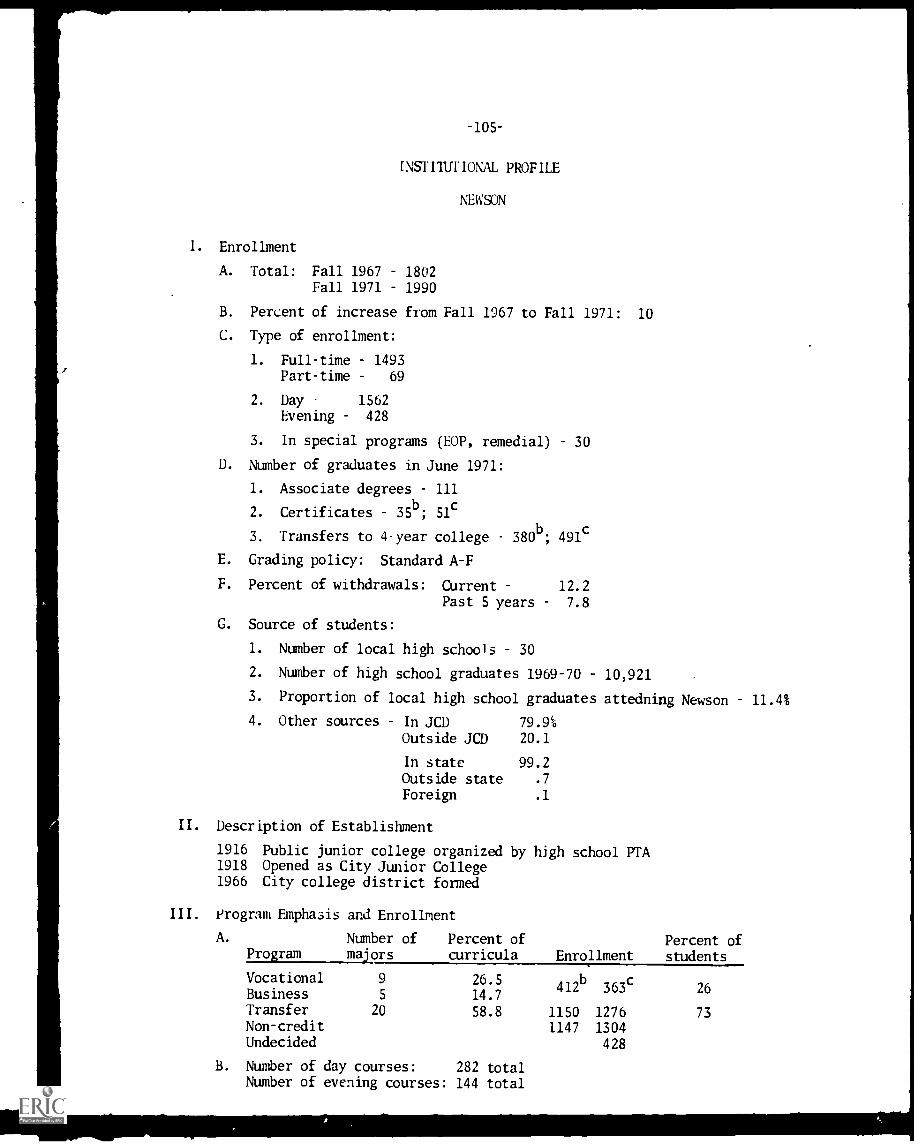
INSTITUTIONAL PROFILE
NEWSON
I. Enrollment
A. Total: Fall 1967 1802Fall 1971 1990
B. Percent of increase from Fall 1967 to Fall 1971: 10
C. Type of enrollment:
1. Full-time 1493Part-time 69
2. Day 1562Evening 428
3. In special programs (EOP, remedial) 30
D. Number of graduates in June 1971:
1. Associate degrees 111
2. Certificates 35b; 51c
3. Transfers to 4-year college 380b
; 491c
E. Grading policy: Standard A-F
F. Percent of withdrawals: Current 12.2Past 5 years 7.8
G. Source of students:
1. Number of local high schools 30
2. Number of high school graduates 1969-70 10,921
3. Proportion of local high school graduates attedning Newson 11.4%
4. Other sources In JCD 79.9%
Outside JCD 20.1
In state 99.2
Outside state .7
Foreign .1
II. Description of Establishment
1916 Public junior college organized by high school PTA1918 Opened as City Junior College1966 City college district formed
III. Program Emphasis and Enrollment
A. Number of Percent ofProgram majors curricula Enrollment
Percent ofstudents
VocationalBusinessTransferNon-creditUndecided
9
5
20
26.514.7
58.8
412b
363c
1150 12761147 1304
428
26
73
B. Number of day courses: 282 totalNumber of evening courses: 144 total
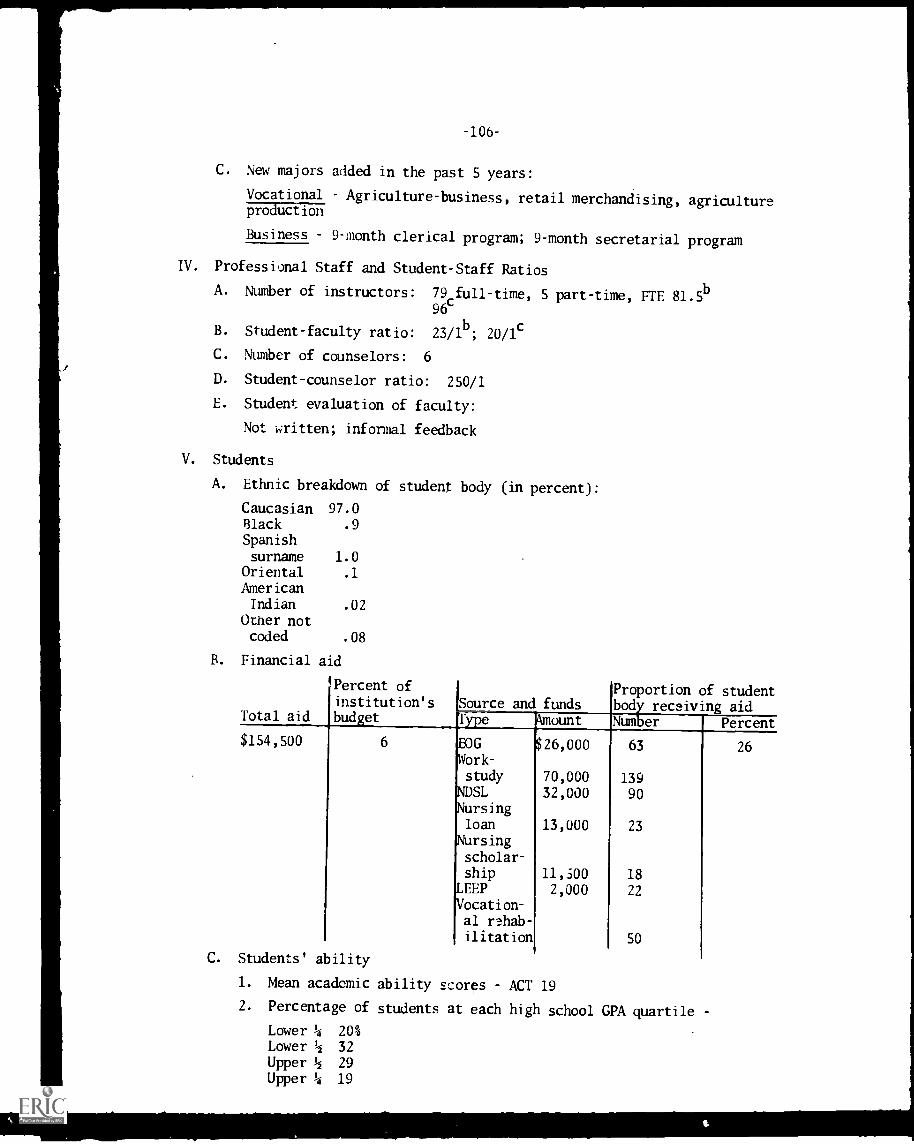
-106-
C. New majors added in the past 5 years:
Vocational Agriculture-business, retail merchandising, agricultureFOOLETtion
Business 9-month clerical program; 9-month secretarial program
IV. Professional Staff and Student-Staff Ratios
A. Number of instructors: 79 full-time, 5 part-time, FTE 81.5 b96c
B. Student-faculty ratio: 23/1b; 20/1c
C. Number of counselors: 6
D. Student-counselor ratio: 250/1
E. Student evaluation of faculty:
Not written; informal feedback
V. Students
A. Ethnic breakdown of student body (in percent):
Caucasian 97.0Black .9
Spanishsurname 1.0
Oriental .1
AmericanIndian .02
Other notcoded .08
B. Financial aid
Total aid
Percent of
institution'sbudget
Source and fundsProportion of studentbody receiving aid
`Type Mount Number Percent
$154,500 6 BOG $26,000 63 26Work-
study 70,000 139NDSL 32,000 90Nursingloan 13,000 23
Nursingscholar-ship 11,300 18
LEEP 2,000 22Vocation-al rehab-
ilitation 50
C. Students' ability
1. Mean academic ability scores ACT 19
2. Percentage of students at each high school GPA quartile
Lower 4 20%Lower 1/2 32
Upper 1/2 29
Upper 4 19
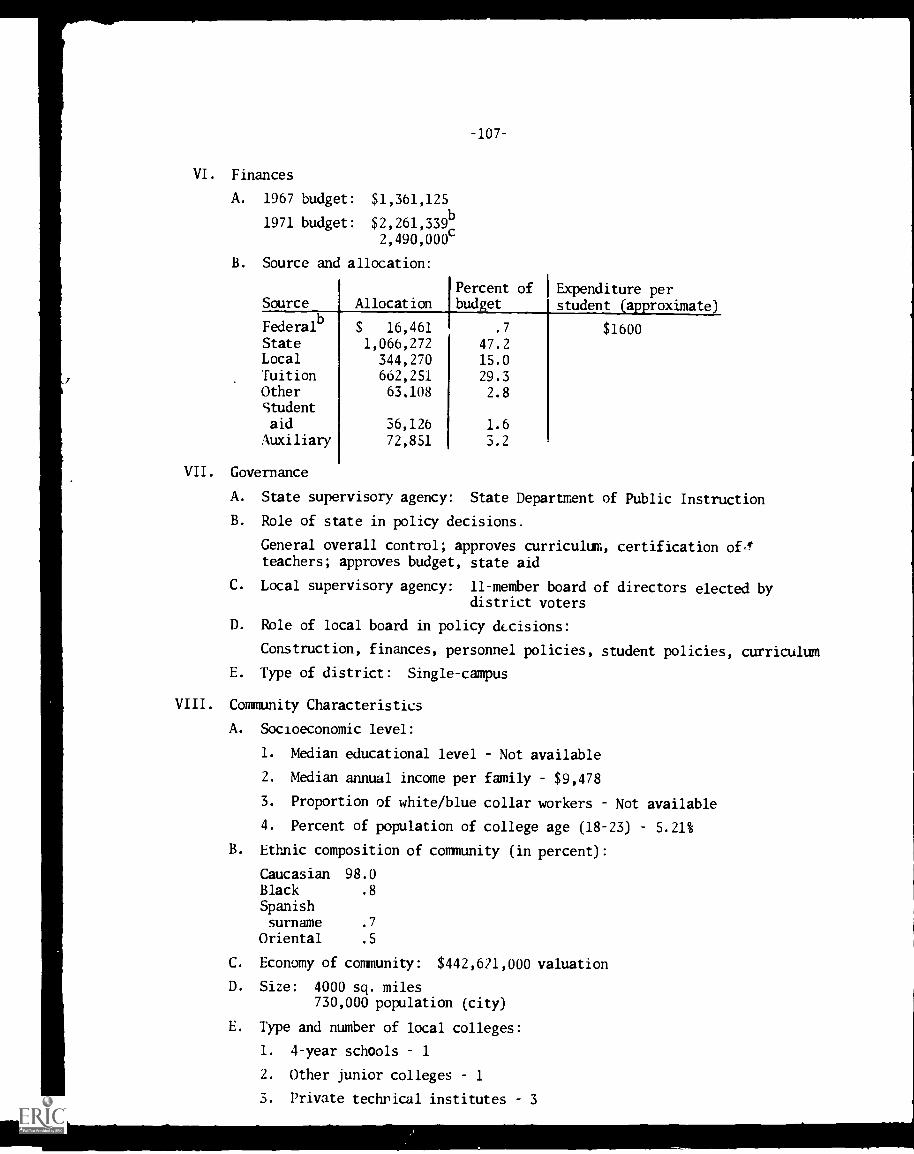
VI. Finances
A. 1967 budget: $1,361,125
1971 budget: $2,261,339b2,490,000c
B. Source and allocation:
Source
FederalStateLocalTuitionOtherStudentaid
Auxiliary
Allocation
$ 16,4611,066,272
344,270662,25163.108
36,126
72,851
-107-
Percent of Expenditure perbudget student a roximate)
.7 $160047.215.0
29.3
2.8
1.6
3.2
VII. Governance
A. State supervisory agency: State Department of Public Instruction
B. Role of state in policy decisions.
General overall control; approves curriculum, certification of.1teachers; approves budget, state aid
C. Local supervisory agency: 11-member board of directors elected bydistrict voters
D. Role of local board in policy decisions:
Construction, finances, personnel policies, student policies, curriculum
E. Type of district: Single-campus
VIII. Community Characteristics
A. Socioeconomic level:
1. Median educational level Not available
2. Median annual income per family $9,478
3. Proportion of white/blue collar workers Not available
4. Percent of population of college age (18-23) 5.21%
B. Ethnic composition of community (in percent):
Caucasian 98.0Black .8
Spanishsurname .7
Oriental .5
C. Economy of community: $442,671,000 valuation
D. Size: 4000 sq. miles730,000 population (city)
E. Type and number of local colleges:
1. 4-year schools 1
2. Other junior colleges 1
3. Private technical institutes 3
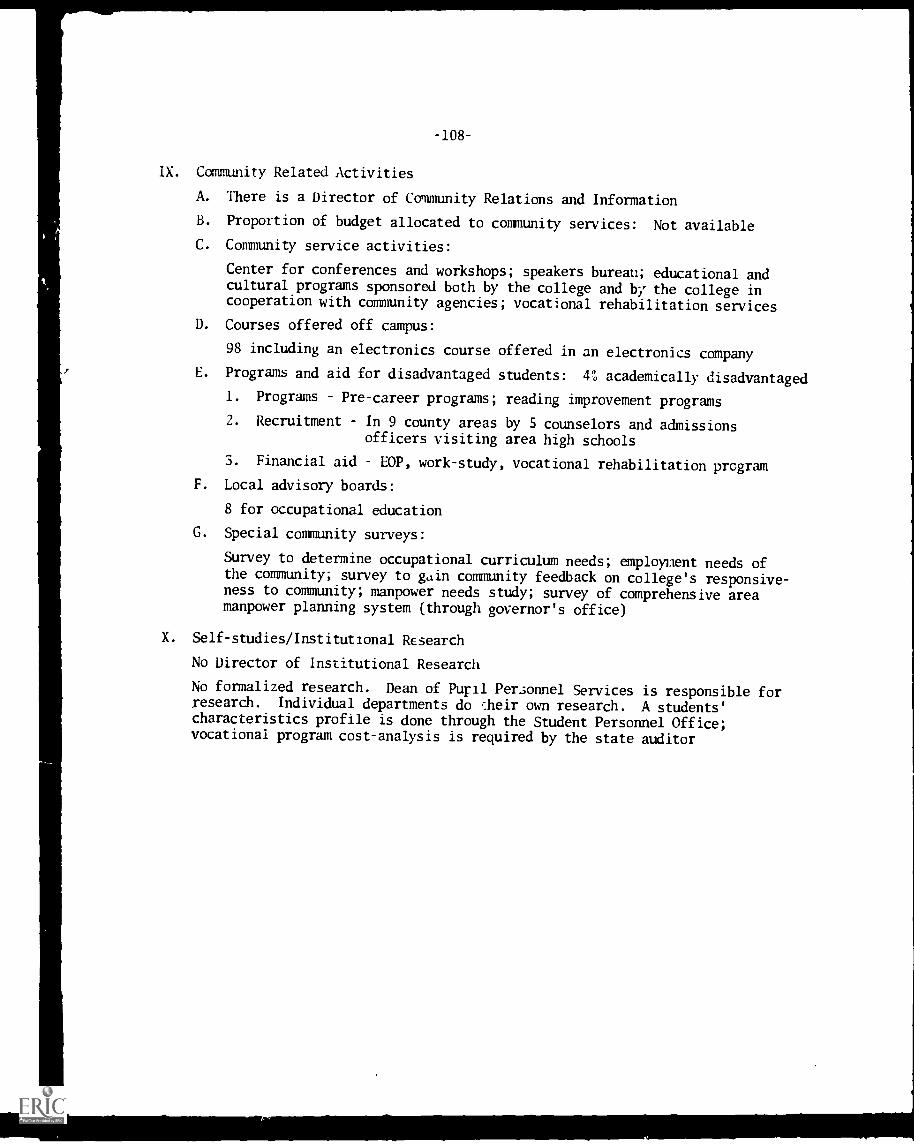
-108-
IX. Community Related Activities
A. There is a Director of Community Relations and Information
B. Proportion of budget allocated to community services: Not available
C. Community service activities:
Center for conferences and workshops; speakers bureau; educational andcultural programs sponsored both by the college and by the college incooperation with community agencies; vocational rehabilitation services
D. Courses offered off campus:
98 including an electronics course offered in an electronics company
E. Programs and aid for disadvantaged students: 4% academically disadvantaged
1. Programs Pre-career programs; reading improvement programs
2. Recruitment In 9 county areas by S counselors and admissionsofficers visiting area high schools
3. Financial aid EOP, work-study, vocational rehabilitation program
F. Local advisory boards:
8 for occupational education
G. Special community surveys:
Survey to determine occupational curriculum needs; employment needs ofthe community; survey to gain community feedback on college's responsive-ness to community; manpower needs study; survey of comprehensive areamanpower planning system (through governor's office)
X. Self-studies/Institutional Research
No Director of Institutional Research
No formalized research. Dean of Pupil Personnel Services is responsible forresearch. Individual departments do ieir own research. A students'characteristics profile is done through the Student Personnel Office;vocational program cost-analysis is required by the state auditor
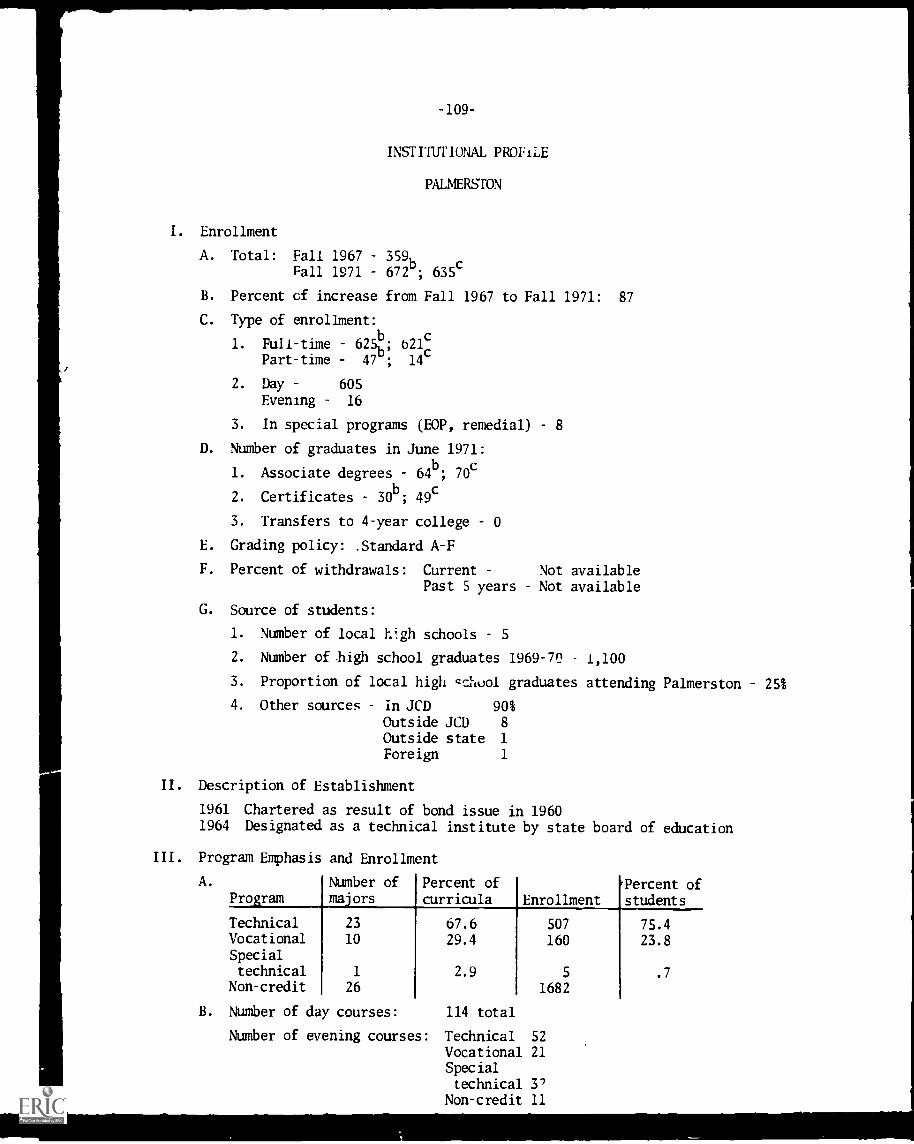
-109-
INSTITUTIONAL PROFILE
PALMERSTON
I. Enrollment
A. Total: Fall 1967 359b
635cFall 1971 672 ; 635
B. Percent of increase from Fall 1967 to Fall 1971: 87
C. Type of enrollment:b
1. Full-time 625; 621cPart-time 47 ; 14
2. Day 605Evening 16
3. In special programs (EOP, remedial) 8
D. Number of graduates in June 1971:
1. Associate degrees 64b
; 70c
2. Certificates3013; 49c
3. Transfers to 4-year college 0
E. Grading policy: .Standard A-F
F. Percent of withdrawals: Current Not availablePast 5 years Not available
G. Source of students:
1. Number of local high schools S
2. Number of -high school graduates 1969-70 1,100
3. Proportion of local high cchuol graduates attending Palmerston 25%
4. Other sources in JCD 90%Outside JCD 8
Outside state 1
Foreign 1
II. Description of Establishment
1961 Chartered as result of bond issue in 19601964 Designated as a technical institute by state board of education
III. Program Emphasis and Enrollment
A.
ProgramNumber ofmajors
Percent ofcurricula Enrollment
Percent ofstudents
Technical 23 67.6 507 75.4Vocational 10 29.4 160 23.8Specialtechnical 1 2.9 5 .7
Non-credit 26 1682
B. Number of day courses: 114 total
Number of evening courses: Technical 52
Vocational 21Specialtechnical 3'
Non-credit 11
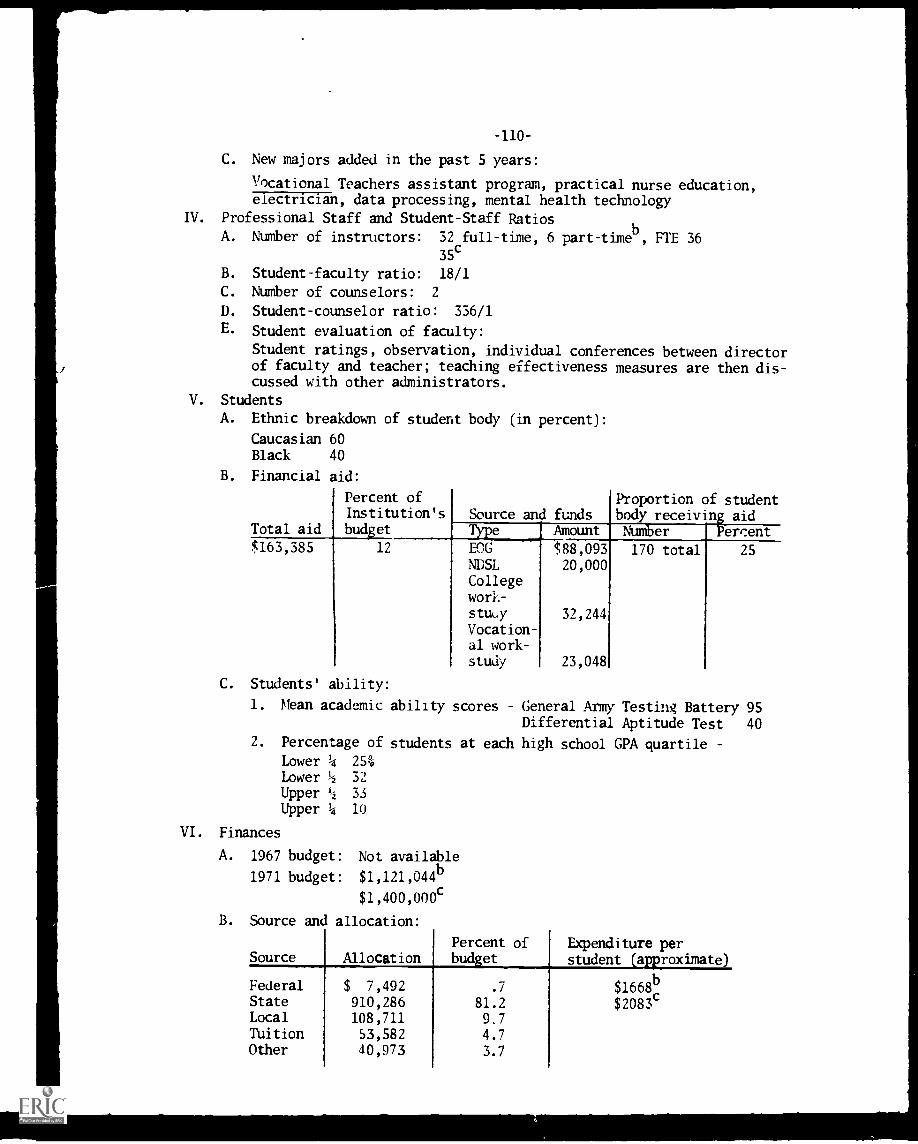
-110 -
C. New majors added in the past 5 years:
Vocational Teachers assistant program, practical nurse education,electrician, data processing, mental health technology
IV. Professional Staff and Student-Staff Ratios
A. Number of instructors: 32 full-time, 6 part-timeb, FTE 36
35c
B. Student-faculty ratio: 18/1
C. Number of counselors: 2
D. Student-counselor ratio: 336/1
E. Student evaluation of faculty:
Student ratings, observation, individual conferences between directorof faculty and teacher; teaching effectiveness measures are then dis-cussed with other administrators.
V. Students
A. Ethnic breakdown of student body (in percent):
Caucasian 60Black 40
B. Financial aid:
Percent of Proportion of studentInstitution's Source and funds body receivin aid
Total aid budget Percent$163,385 12 EUG $88,093 170 total 25
NDSL 20,000Collegework-stut.y 32,244Vocation-al work-
study 23,048
C. Students' ability:
1. Mean academic ability scores General Army Testing Battery 95Differential Aptitude Test 40
2. Percentage of students at each high school GPA quartile
Lower 4 25%Lower -? 32
Upper 1/2 33
Upper 10
VI. Finances
A. 1967 budget: Not available
1971 budget: $1,121,044b
$1,400,000c
Source and allocation:
Percent of Expenditure perSource Allocation budget student (approximate)
Federal $ 7,492 .7 $1668b
State 910,286 81.2 $2083cLocal 108,711 9.7Tuition 53,582 4.7Other 40,973 3.7
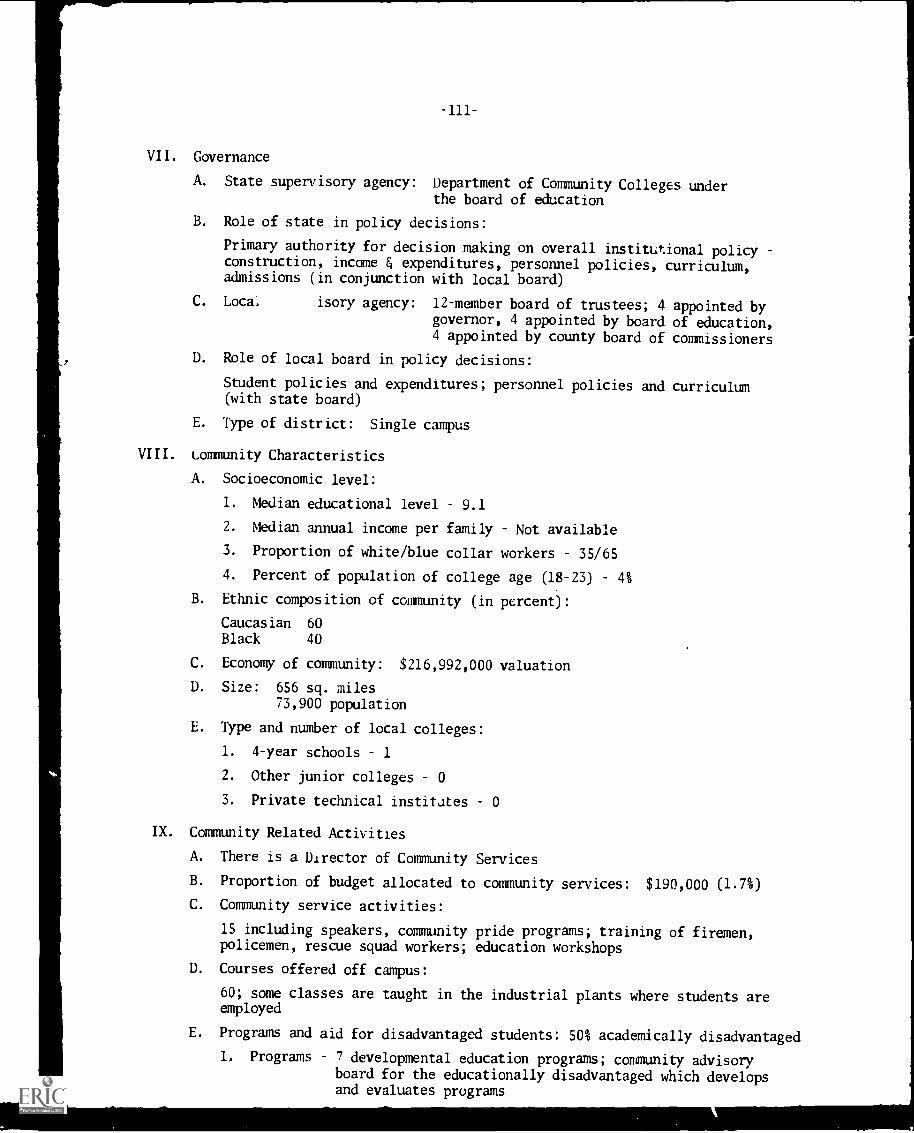
VII. Governance
A. State supervisory agency: Department of Community Colleges underthe board of education
B. Role of state in policy decisions:
Primary authority for decision making on overall institutional policyconstruction, income E4 expenditures, personnel policies, curriculum,admissions (in conjunction with local board)
C. Loca isory agency: 12-member board of trustees; 4 appointed bygovernor, 4 appointed by board of education,4 appointed by county board of commissioners
D. Role of local board in policy decisions:
Student policies and expenditures; personnel policies and curriculum(with state board)
E. Type of district: Single campus
VIII. community Characteristics
A. Socioeconomic level:
1. Median educational level 9.1
2. Median annual income per family Not available
3. Proportion of white/blue collar workers 35/65
4. Percent of population of college age (18-23) 4%
B. Ethnic composition of community (in percent):
Caucasian 60Black 40
C. Economy of community: $216,992,000 valuation
D. Size: 656 sq. miles73,900 population
E. Type and number of local colleges:
1. 4-year schools 1
2. Other junior colleges 0
3. Private technical institutes 0
IX. Community Related Activities
A. There is a Director of Community Services
B. Proportion of budget allocated to community services: $190,000 (1.7%)
C. Community service activities:
15 including speakers, community pride programs; training of firemen,policemen, rescue squad workers; education workshops
D. Courses offered off campus:
60; some classes are taught in the industrial plants where students areemployed
E. Programs and aid for disadvantaged students: 50% academically disadvantaged
1, Programs 7 developmental education programs; community advisoryboard for the educationally disadvantaged which developsand evaluates programs
-112-
2. Recruitment On-campus tours, orientation programs; sendrecruiters and counselors directly into thecommunity to locate the disadvantaged
3. Financial aid EOG; work-study; Vocational Rehabilitation Act;$14,000 in special fund for the disadvantaged;Vocational Education Act for the Disadvantaged
F. Local advisory boards:
16 local advisory committees in curriculum areas to provide feedback onneeds; advisory committees for occupational education and for thedisadvantaged
G. Special community surveys:
Surveys on the socioeconomic characteristics of the community; onoccupational and educational needs, and on the needs of the disadvantaged
X. Self-studies/Institutional Research
There is no Director of Institutional Research
Liason not available
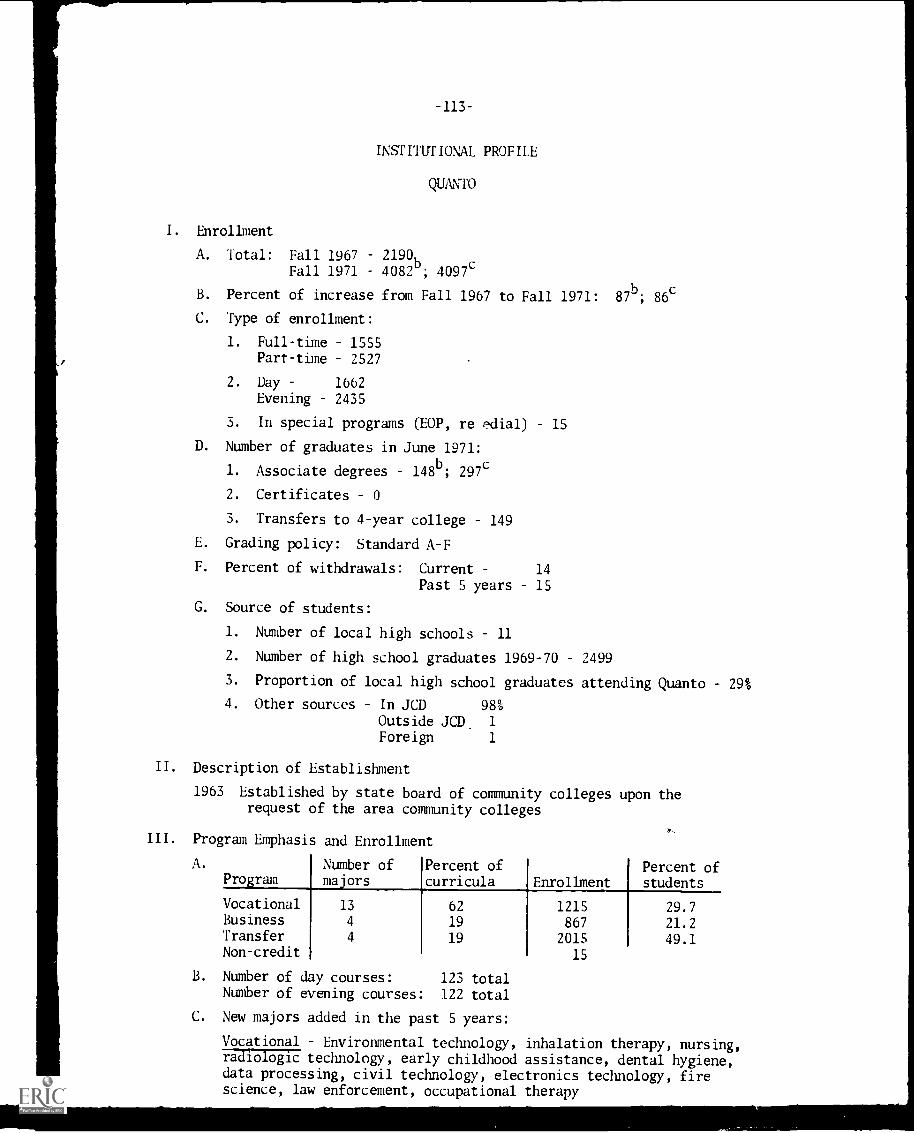
-113-
INSTITUTIONAL PROFILE
QUANTO
I. Enrollment
A. Total: Fall 1967 2190b
Fall 1971 4082 ; 4097c
B. Percent of increase from Fall 1967 to Fall 1971: 87b
; 86c
C. Type of enrollment:
1. Full-time 1555Part-time 2527
2. Day 1662Evening 2435
3. In special programs (EOP, re edial) 15
D. Number of graduates in June 1971:
1. Associate degrees 148b; 297c
2. Certificates 0
3. Transfers to 4-year college 149
E. Grading policy: Standard A-F
F. Percent of withdrawals: Current 14
Past 5 years 15
G. Source of students:
1. Number of local high schools 11
2. Number of high school graduates 1969-70 2499
3. Proportion of local high school graduates attending Quanto 29%
4. Other sources In JCD 98%
Outside JCD 1
Foreign 1
II. Description of Establishment
1963 Established by state board of community colleges upon therequest of the area community colleges
III. Program Emphasis and Enrollment
A.
ProgramNumber ofmajors
Percent ofcurricula Enrollment
Percent ofstudents
VocationalBusinessTransfer
Non-credit
13
4
4
62
19
19
1215867
2015
15
29.7
21.249.1
B. Number of day courses: 123 totalNumber of evening courses: 122 total
C. New majors added in the past 5 years:
Vocational Environmental technology, inhalation therapy, nursing,radiologic technology, early childhood assistance, dental hygiene,data processing, civil technology, electronics technology, firescience, law enforcement, occupational therapy
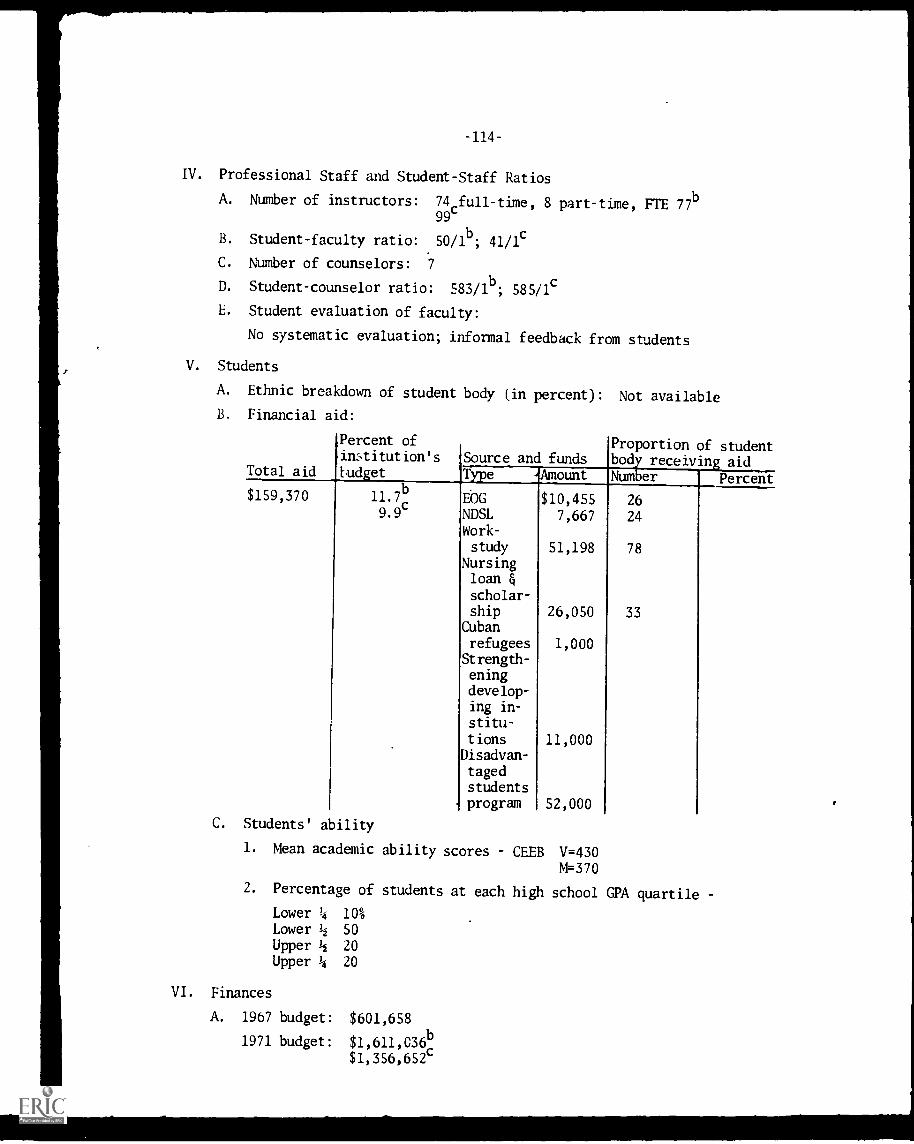
IV. Professional Staff and Student-Staff Ratios
A. Number of instructors: 74,full-time, 8 part-time, FTE 77b
99'
B. Student-faculty ratio: 50/1b
; 41/1c
C. Number of counselors: 7
D. Student-counselor ratio: 583/113; 585/1c
E. Student evaluation of faculty:
No systematic evaluation; informal feedback from students
V. Students
A. Ethnic breakdown of student body
B. Financial aid:
(in percent): Not available
Total aid
Percent of
institution's Source and fundsProportion of studentbody receiving aid
tudget Type Amount Number Percent
$159,370b
11.7 EOG $10,455 269.9' NDSL 7,667 24
Work-
study 51,198 78Nursingloan &
scholar-ship 26,050 33
Cubanrefugees 1,000
Strength-eningdevelop-ing in-
stitu-
tions 11,000Disadvan-tagedstudentsprogram 52,000
C. Students' ability
1. Mean academic ability scores CEEB V=430M=370
2. Percentage of students at each high school GPA quartile
Lower 4 10%Lower 1/2 50
Upper 11 20
Upper 1/4 20
VI. Finances
A. 1967 budget: $601,658
1971 budget: $1,611,03613.
$1,356,652'
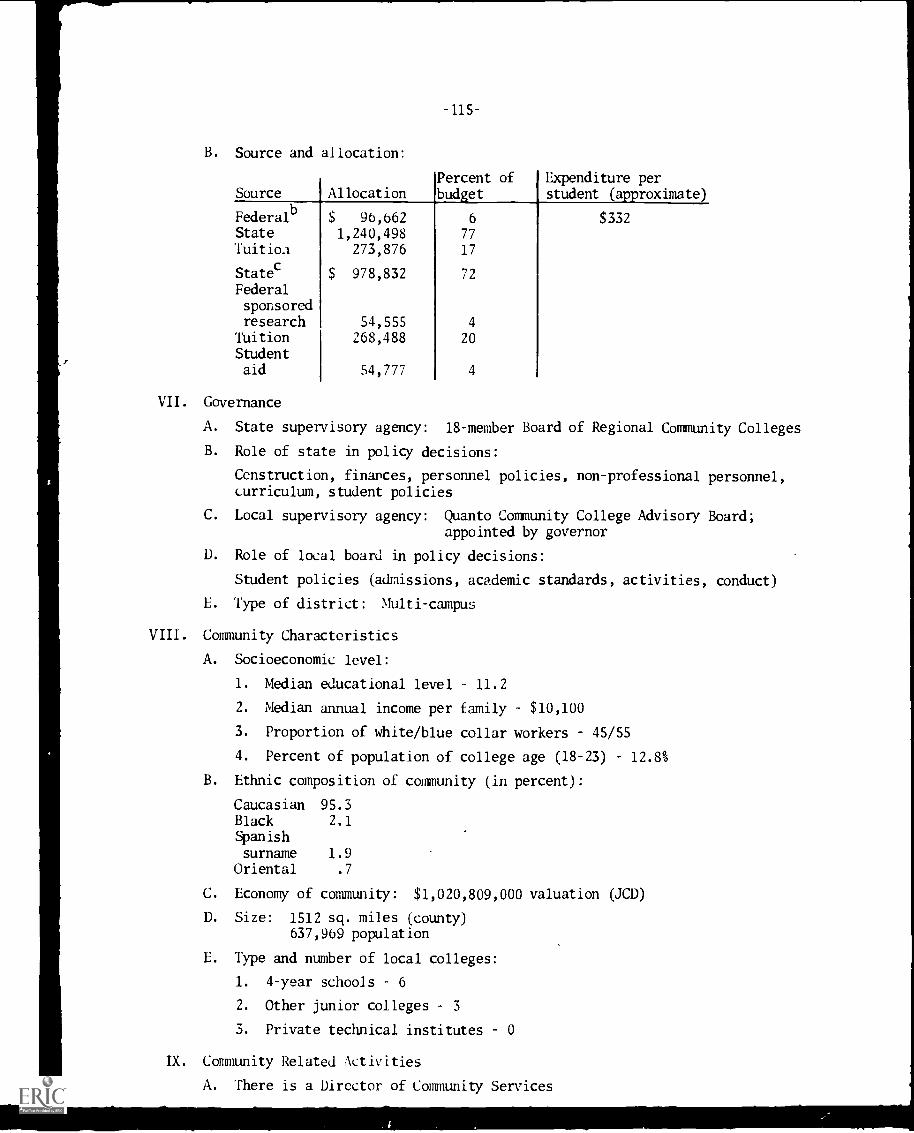
-115-
B. Source and allocation:
Source AllocationPercent ofbud!et
Expenditure perstudent (aDroximate)
Federalb
$ 96,662 6 $332State 1,240,498 77
TuitioA 273,876 17
Statec
978,832 72
Federalsponsoredresearch 54,555 4
Tuition 268,488 20Studentaid 54,777 4
VII. Governance
A. State supervisory agency: 18-member Board of Regional Community Colleges
B. Role of state in policy decisions:
Ccnstruction, finances, personnel policies, non-professional personnel,curriculum, student policies
C. Local supervisory agency: Quanto Community College Advisory Board;appointed by governor
D. Role of local board in policy decisions:
Student policies (admissions, academic standards, activities, conduct)
E. Type of district: Multi-campus
VIII. Conimunity Characteristics
A. Socioeconomic level:
1. Median educational level 11.2
2. Median annual income per family $10,100
3. Proportion of white/blue collar workers 45/55
4. Percent of population of college age (18-23) 12.8%
B. Ethnic composition of community (in percent):
Caucasian 95.3Black 2.1Spanishsurname 1.9
Oriental .7
C. Economy of community: $1,020,809,000 valuation (JCD)
D. Size: 1512 sq. miles (county)637,969 population
E. Type and number of local colleges:
1. 4-year schools 6
2. Other junior colleges 3
3. Private technical institutes 0
IX. Community Related Activities
A. There is a Director of Community Services
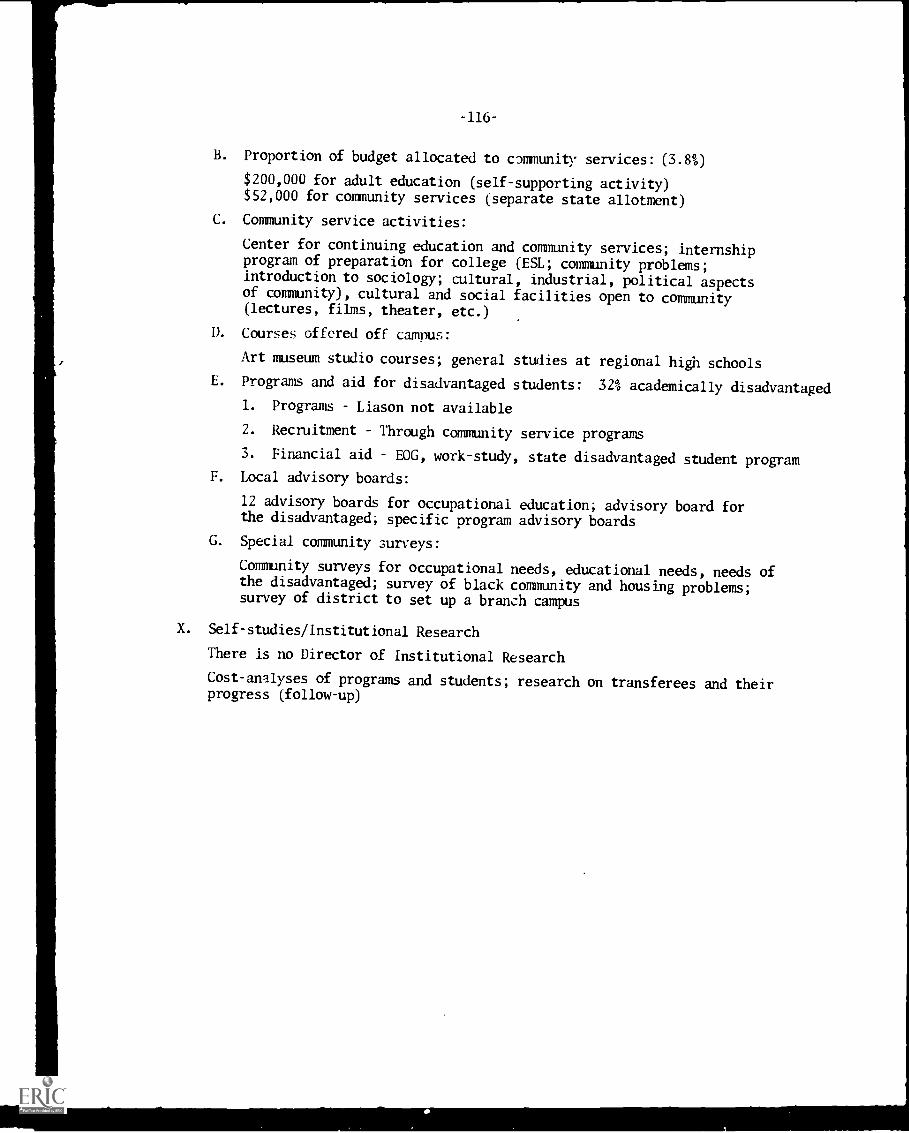
-116-
B. Proportion of budget allocated to community services: (3.8%)
$200,000 for adult education (self-supporting activity)$52,000 for community services (separate state allotment)
C. Community service activities:
Center for continuing education and community services; internshipprogram of preparation for college (ESL; community problems;introduction to sociology; cultural, industrial, political aspectsof community), cultural and social facilities open to community(lectures, films, theater, etc.)
D. Courses offered off campus:
Art museum studio courses; general studies at regional high schools
E. Programs and aid for disadvantaged students: 32% academically disadvantaged
1. Programs Liason not available
2. Recruitment Through community service programs
3. Financial aid EOG, work-study, state disadvantaged student programF. Local advisory boards:
12 advisory boards for occupational education; advisory board forthe disadvantaged; specific program advisory boards
G. Special community 3urveys:
Community surveys for occupational needs, educational needs, needs ofthe disadvantaged; survey of black community and housing problems;survey of district to set up a branch campus
X. Self-studies/Institutional Research
There is no Director of Institutional Research
Cost-analyses of programs and students; research on transferees and theirprogress (follow-up)
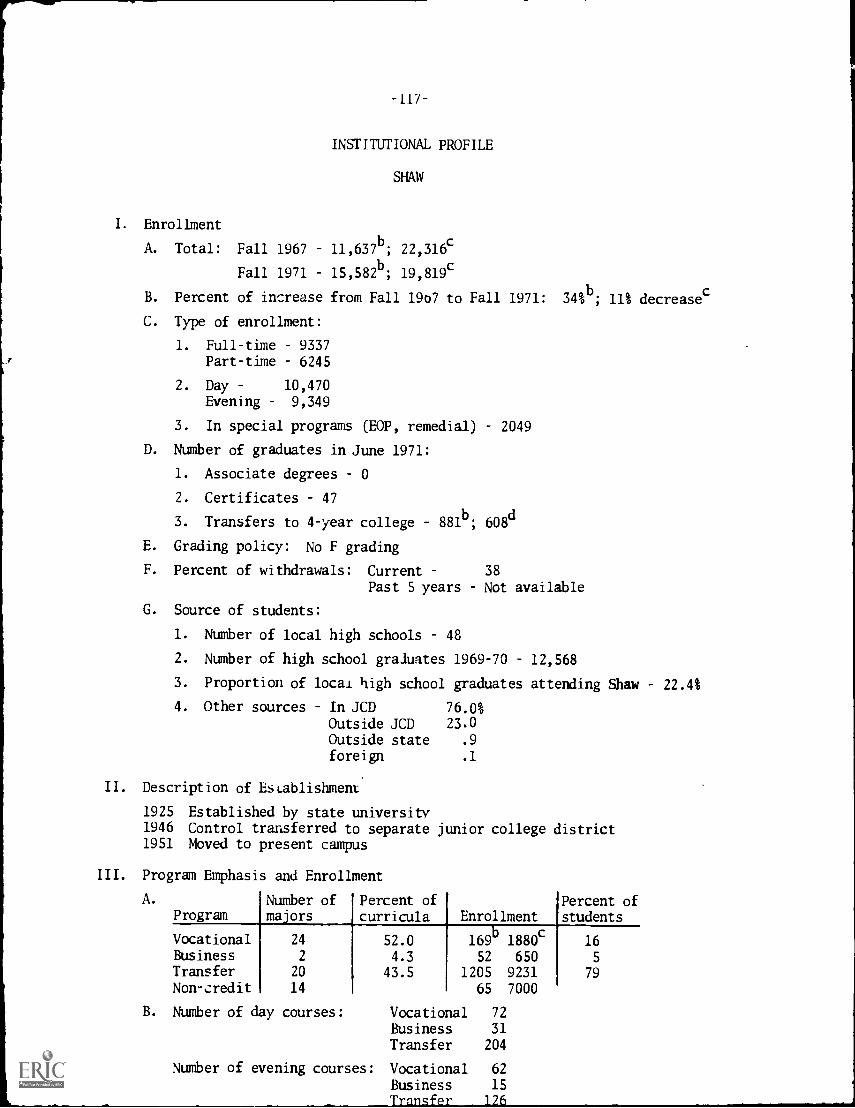
-117-
INSTITUTIONAL PROFILE
SHAW
I. Enrollment
A. Total: Fall 1967 11,637b; 22,316c
Fall 1971 15,582b; 19,819c
B. Percent of increase from Fall 19o7 to Fall 1971: 34%b; 11% decreasec
C. Type of enrollment:
1. Full-time 9337
Part-time 6245
2. Day 10,470
Evening 9,349
3. In special programs (EOP, remedial) 2049
D. Number of graduates in June 1971:
1. Associate degrees 0
2. Certificates 47
3. Transfers to 4-year college 881b; 608d
E. Grading policy: No F grading
F. Percent of withdrawals: Current 38
Past 5 years Not available
G. Source of students:
1. Number of local high schools 48
2. Number of high school graduates 1969-70 12,568
3. Proportion of local high school graduates attending Shaw 22.4%
4. Other sources In JCD 76.0%
Outside JCD 23.0
Outside state .9
foreign .1
II. Description of Establishment
1925 Established by state university1946 Control transferred to separate junior college district1951 Moved to present campus
III. Program Emphasis and Enrollment
A.
ProgramNumber ofmajors
Percent ofcurricula Enrollment
Percent ofstudents
Vocational 24 52.0 169b 1880c
169 16Business 2 4.3 52 650 5
Transfer 20 43.5 1205 9231 79Non-credit 14 65 7000
B. Number of day courses: Vocational 72
Business 31
Transfer 204
Number of evening courses: Vocational 62
Business 15
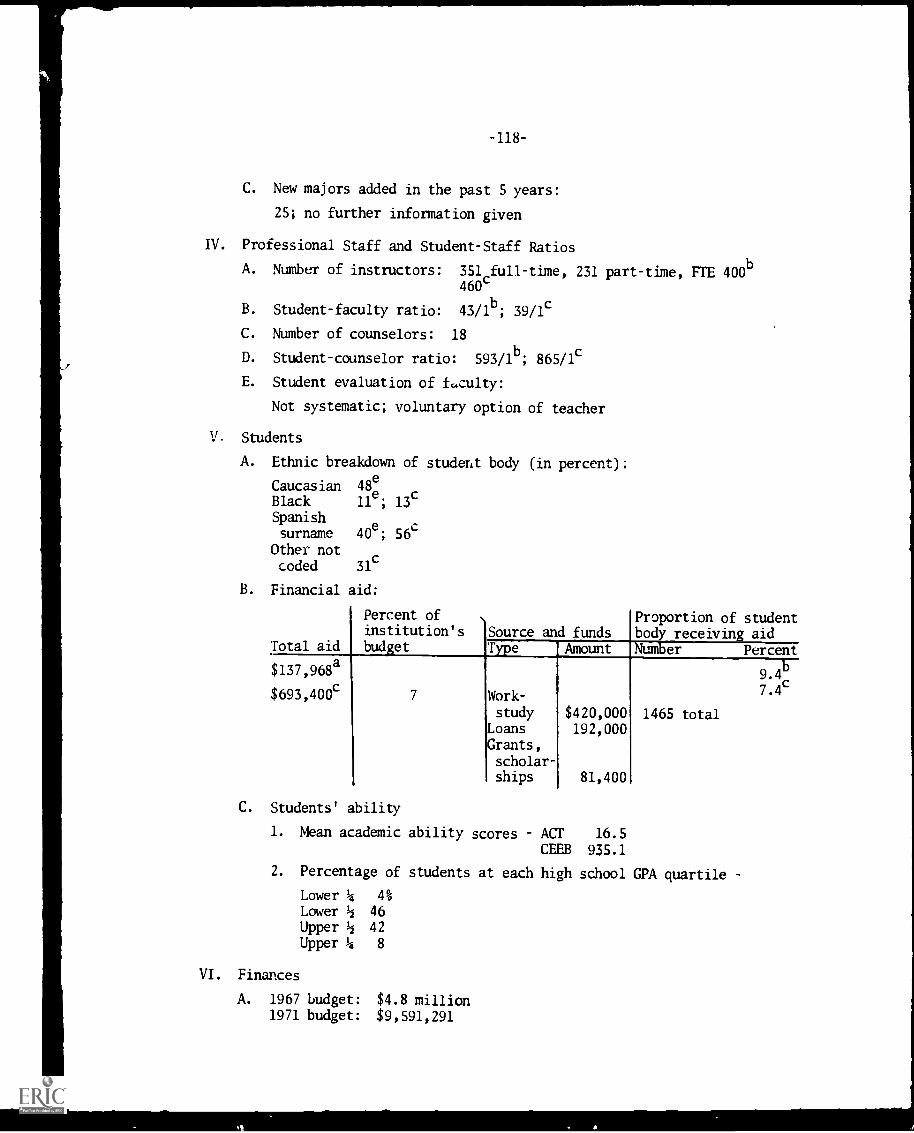
-118-
C. New majors added in the past 5 years:
25; no further information given
IV. Professional Staff and Student-Staff Ratios
A. Number of instructors: 351 full-time, 231 part-time, FTE 400b
460c
B. Student-faculty ratio: 43/113; 39/1c
C. Number of counselors: 18
D. Student-counselor ratio: 593/1b; 865/1c
E. Student evaluation of faculty:
Not systematic; voluntary option of teacher
,[ Students
A. Ethnic breakdown of student body (in percent):
Caucasian 48e
Black lle; 13cSpanishsurname 40
e; 56`
Other notcoded 31
c
B. Financial aid:
Percent of Proportion of studentinstitution's Source and funds body receiving aid
Total aid budget Type Amount :tuber Percent
$137,968a 9.4b
$693,400c 7 Work- 7.4c
study $420,000 1465 totalLoans 192,000Grants,scholar-ships 81,400
C. Students' ability
1. Mean academic ability scores ACT 16.5CEEB 935.1
2. Percentage of students at each high school GPA quartile -
Lower 4 4%
Lower 11 46
Upper 11 42
Upper 4 8
VI. Finances
A. 1967 budget: $4.8 million1971 budget: $9,591,291
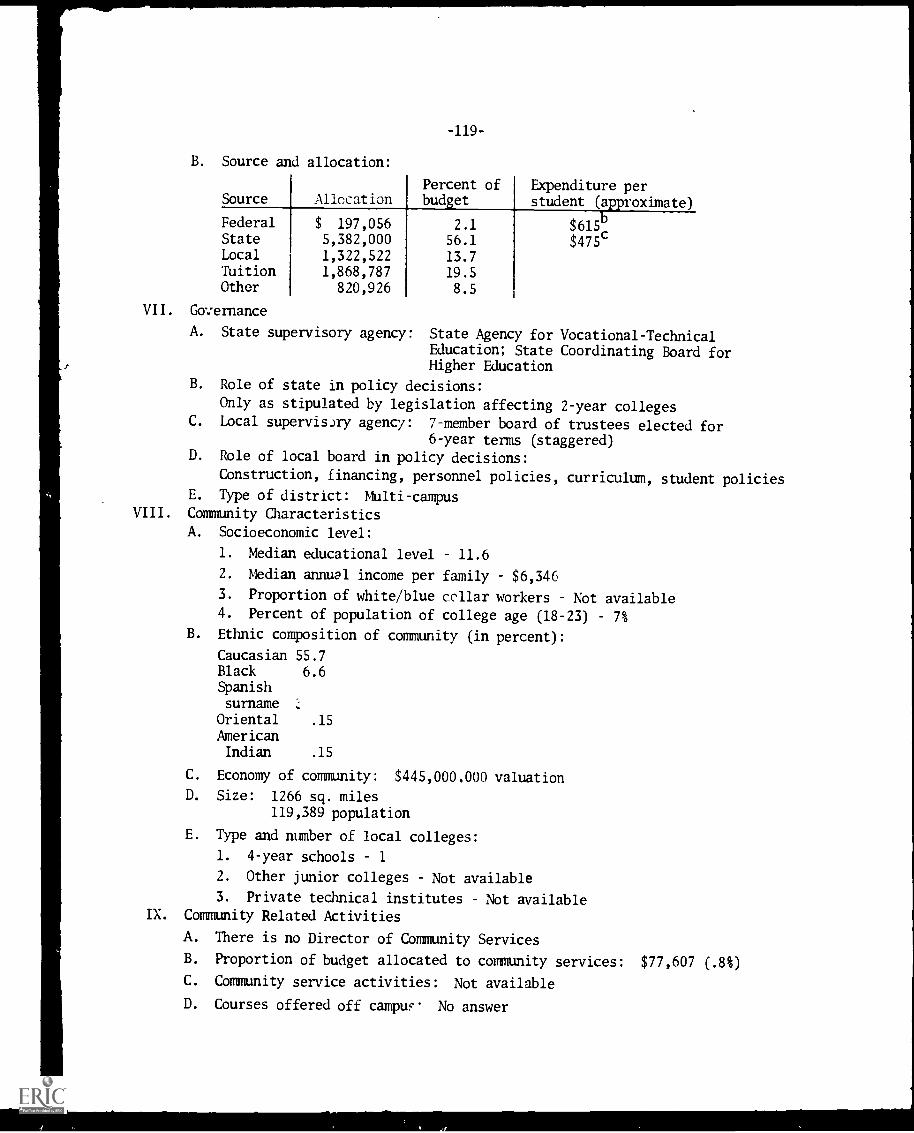
7
-119-
B. Source and allocation:
Source AllocationPercent ofbudget
Expenditure perstudent (approximate)
FederalStateLocalTuitionOther
$ 197,0565,382,0001,322,522
1,868,787820,926
2.1
56.1
13.7
19.5
8.5
$615b$475c
VII. Governance
A. State supervisory agency: State Agency for Vocational-TechnicalEducation; State Coordinating Board forHigher Education
B. Role of state in policy decisions:
Only as stipulated by legislation affecting 2-year collegesC. Local supervis.xy agency: 7-member board of trustees elected for
6-year terms (staggered)D. Role of local board in policy decisions:
Construction, financing, personnel policies, curriculum, student policiesE. Type of district: Multi- campus
VIII. Community Characteristics
A. Socioeconomic level:
1. Median educational level 11.6
2. Median annual income per family $6,346
3. Proportion of white/blue collar workers Not available4. Percent of population of college age (18-23) 7%
B. Ethnic composition of community (in percent):
Caucasian 55.7Black 6.6Spanishsurname
Oriental .15
AmericanIndian .15
C. Economy of community: $445,000.000 valuation
D. Size: 1266 sq. miles119,389 population
E. Type and number of local colleges:
1. 4-year schools 1
2. Other junior colleges Not available
3. Private technical institutes Not availableIX. Community Related Activities
A. There is no Director of Community Services
B. Proportion of budget allocated to community services: $77,607 (.8%)
C. Community service activities: Not available
D. Courses offered off campus No answer
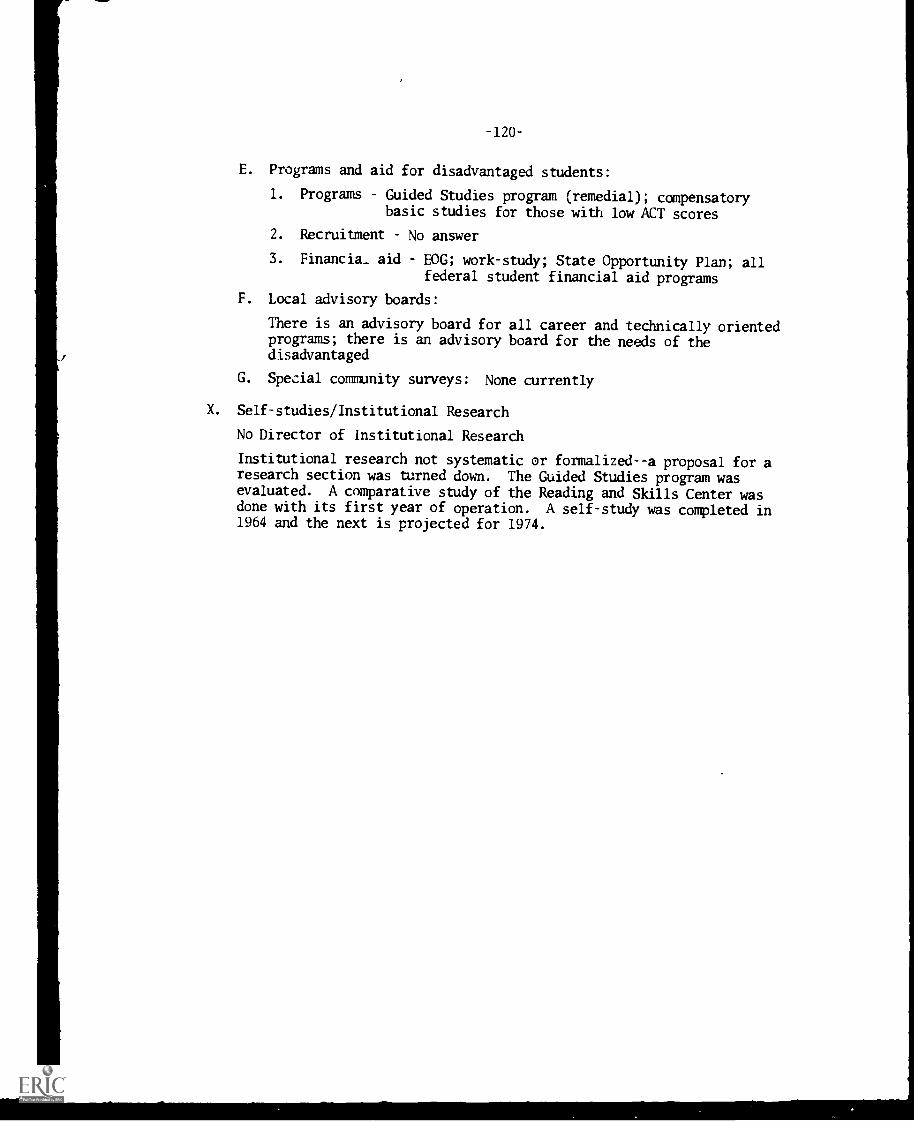
E. Programs and aid for disadvantaged students:
1. Programs Guided Studies program (remedial); compensatorybasic studies for those with low ACT scores
2. Recruitment No answer
3. Financia_ aid EOG; work-study; State Opportunity Plan; allfederal student financial aid programs
F. Local advisory boards:
There is an advisory board for all career and technically orientedprograms; there is an advisory board for the needs of thedisadvantaged
G. Special community surveys: None currently
X. Self-studies/Institutional Research
No Director of Institutional Research
Institutional research not systematic or formalized--a proposal for aresearch section was turned down. The Guided Studies program wasevaluated. A comparative study of the Reading and Skills Center wasdone with its first year of operation. A self-study was completed in1964 and the next is projected for 1974.
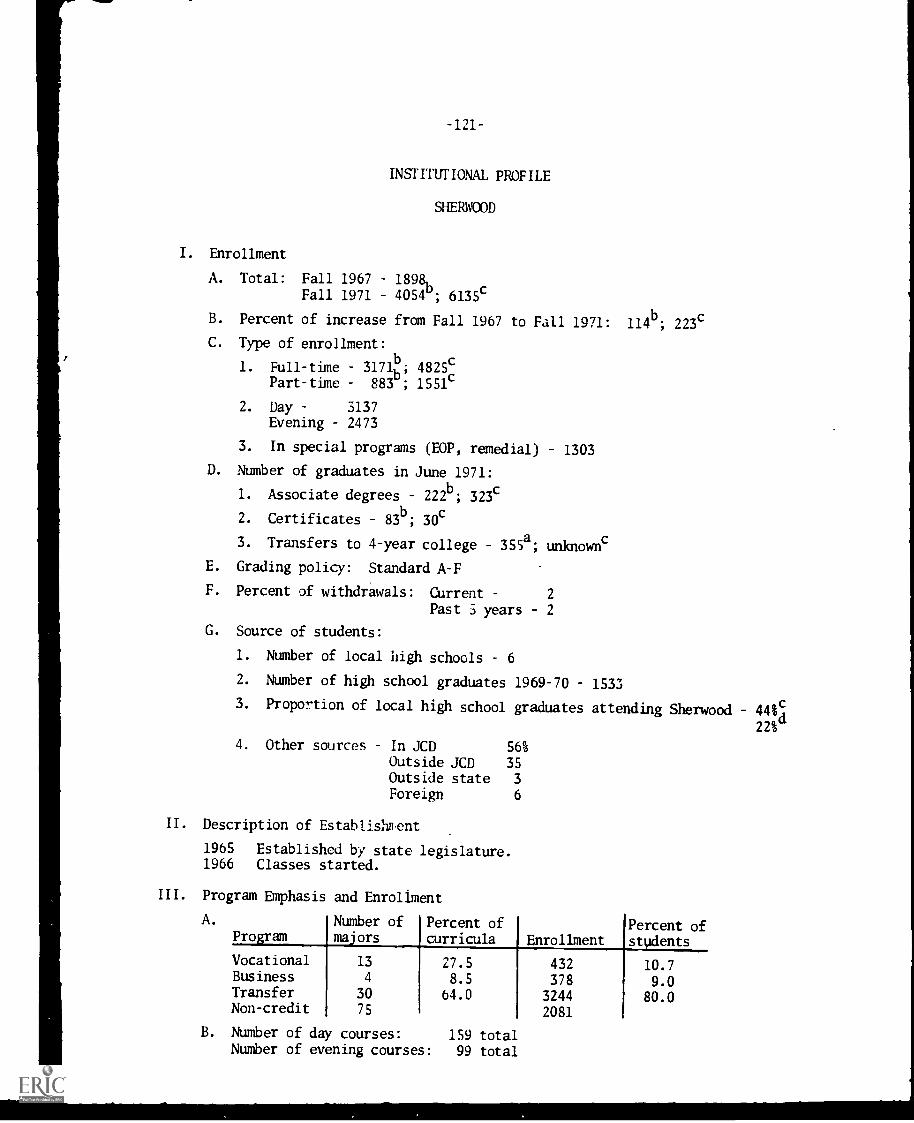
-121-
INSTITUTIONAL PROFILE
SHERWOOD
I. Enrollment
A. Total: Fall 1967 1898bFall 1971 4054 ; 6135c
B. Percent of increase from Fall 1967 to Fall 1971: 114b
; 223c
C. Type of enrollment:
1. Full-time 3171b
b'4825
c
Part-time 883 ; 1551c
2. Day 3137Evening 2473
3. In special programs (EOP, remedial) 1303
D. Number of graduates in June 1971:
1. Associate degrees 222b; 323c
83b;2. Certificates 83b,
30c
3. Transfers to 4-year college 355a; unknownc
E. Grading policy: Standard A-F
F. Percent of withdrawals: Current 2
Past 5 years 2
G. Source of students:
1. Number of local high schools 6
2. Number of high school graduates 1969-70 1533
3. Proportion of local high school graduates attending Sherwood 44%
22%
4. Other sources In JCD 56%
Outside JCD 35
Outside state 3
Foreign 6
II. Description of Establishment
1965 Established by state legislature.1966 Classes started.
III. Program Emphasis and Enrollment
A.
ProgramNumber ofmajors
Percent ofcurricula Enrollment
Percent ofstudents
VocationalBusinessTransferNon-credit
13
4
3075
27.58.5
b4.0
432378
3244
2081
10.79.0
80.0
B. Number of day courses: 159 totalNumber of evening courses: 99 total
1
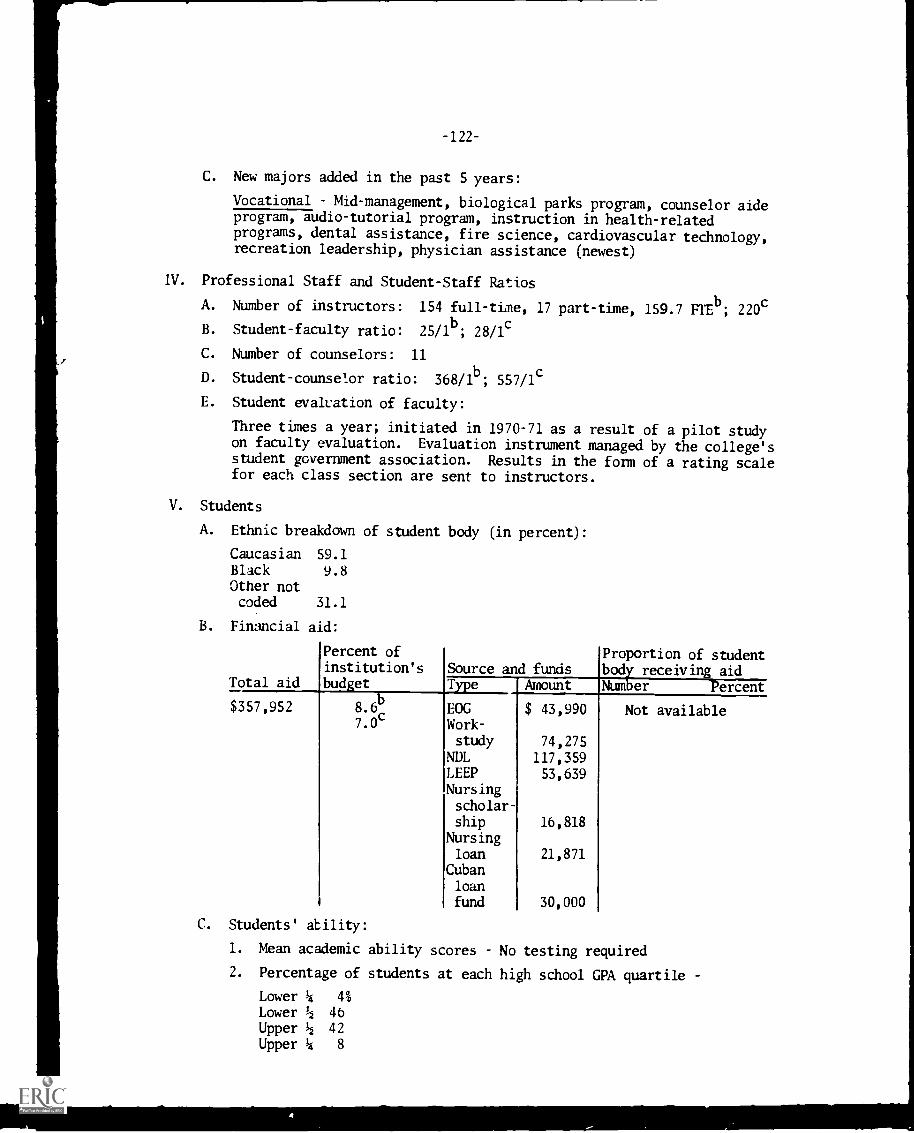
C. New majors added in the past 5 years:
Vocational Mid-management, biological parks program, counselor aideprogram, audio-tutorial program, instruction in health-relatedprograms, dental assistance, fire science, cardiovascular technology,recreation leadership, physician assistance (newest)
IV. Professional Staff and Student-Staff Ratios
A. Number of instructors: 154 full-tine, 17 part-time, 159.7 FTEb ; 220c
B. Student-faculty ratio: 25/1b
; 28/1c
C. Number of counselors: 11
D. Student-counselor ratio: 368/1b; 557/1c
E. Student evaluation of faculty:
Three times a year; initiated in 1970-71 as a result of a pilot studyon faculty evaluation. Evaluation instrument managed by the college'sstudent government association. Results in the form of a rating scalefor each class section are sent to instructors.
V. Students
A. Ethnic breakdown of student body (in percent):
Caucasian 59.1
Black 9.8Other notcoded 31.1
B. Financial aid:
Total aid
$357,952
Percent ofinstitution'sbud et
Proportion of studentSource and funds bod receiving aidT e
8.6b
7.0c
Number Percent
EOG $ 43,990 Not availableWork-
study 74,275NDL 117,359LEEP 53,639Nursingscholar-ship 16,818
Nursingloan 21,871
Cubanloanfund 30,000
C. Students' ability:
1. Mean academic ability scores No testing required
2. Percentage of students at each high school GPA quartile
Lower 4 4%
Lower 1/2 46Upper 1/2 42Upper 4 8
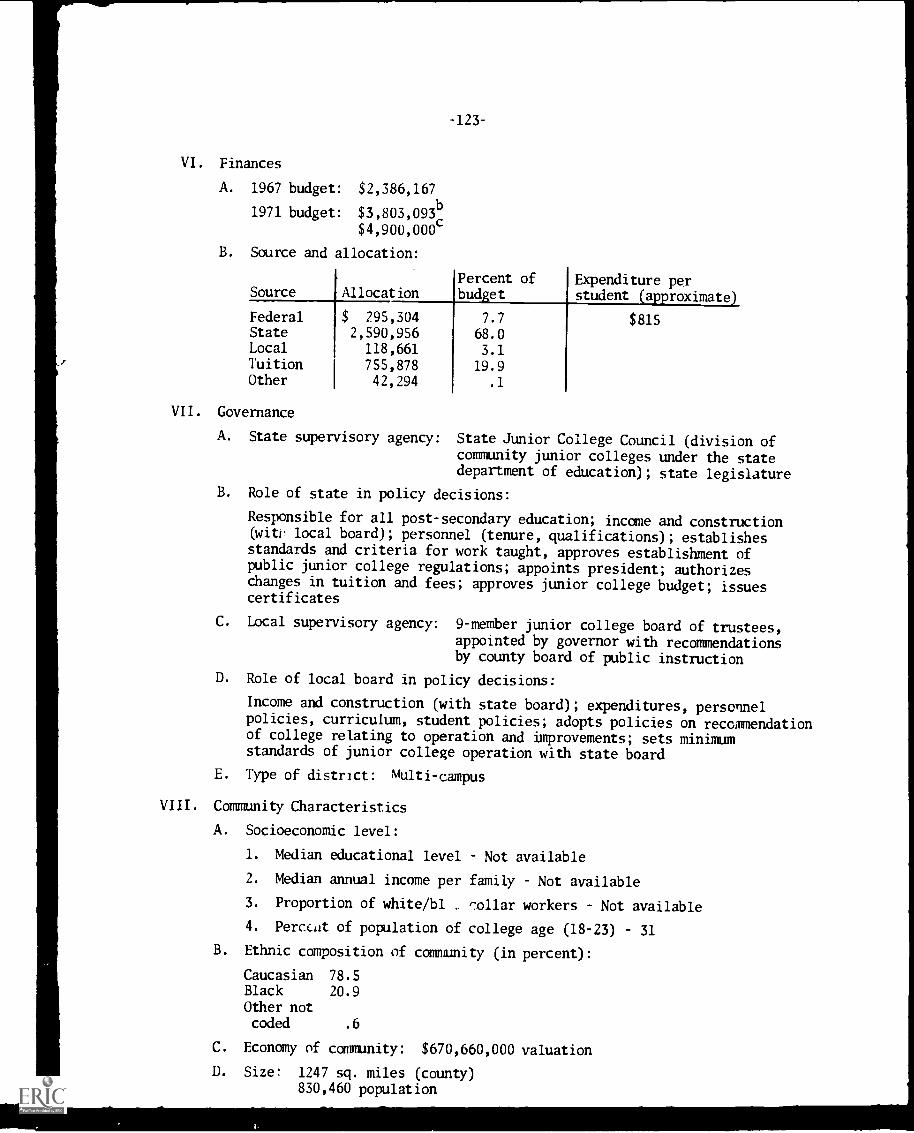
-123-
VI. Finances
A. 1967 budget: $2,386,167
1971 budget: $3,803,093b$4,900,000c
B. Source and allocation:
Source AllocationPercent ofbud:et
Expenditure perstudent a..roximate
Federal $ 295,304 7.7 $815State 2,590,956 68.0Local 118,661 3.1Tuition 755,878 19.9Other 42,294 .1
VII. Governance
A. State supervisory agency: State Junior College Council (division ofcommunity junior colleges under the statedepartment of education); state legislature
B. Role of state in policy decisions:
Responsible for all post-secondary education; income and construction(witil local board); personnel (tenure, qualifications); establishesstandards and criteria for work taught, approves establishment ofpublic junior college regulations; appoints president; authorizeschanges in tuition and fees; approves junior college budget; issuescertificates
C. Local supervisory agency: 9-member junior college board of trustees,appointed by governor with recommendationsby county board of public instruction
D. Role of local board in policy decisions:
Income and construction (with state board); expenditures, personnelpolicies, curriculum, student policies; adopts policies on recommendationof college relating to operation and improvements; sets minimumstandards of junior college operation with state board
E. Type of district: Multi- campus
VIII. Community Characteristics
A. Socioeconomic level:
1. Median educational level Not available
2. Median annual income per family Not available
3. Proportion of white/b1 'ollar workers Not available
4. Perccilt of population of college age (18-23) 31
B. Ethnic composition of community (in percent):
Caucasian 78.5Black 20.9Other notcoded .6
C. Economy of community: $670,660,000 valuation
D. Size: 1247 sq. miles (county)830,460 population
4
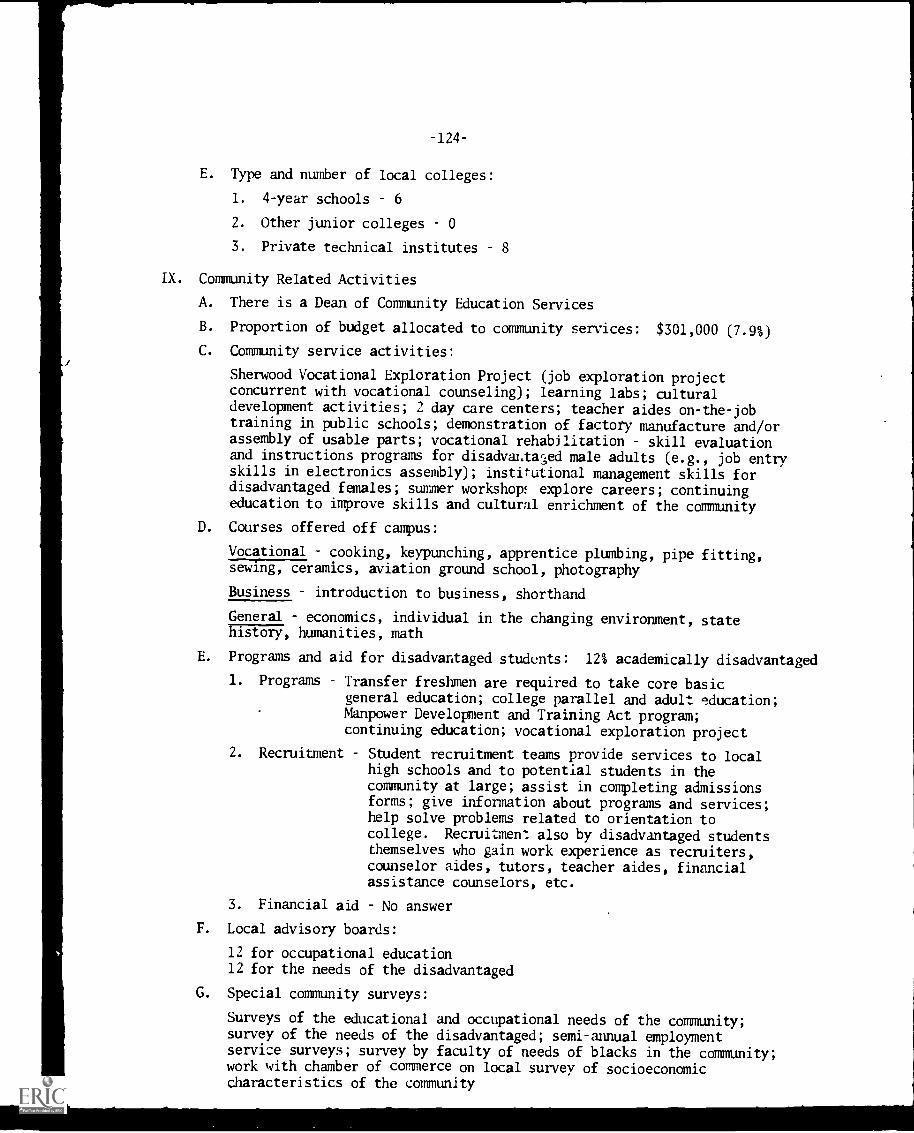
-124-
E. Type and number of local colleges:
1. 4-year schools 6
2. Other junior colleges 0
3. Private technical institutes 8
IX. Community Related Activities
A. There is a Dean of Community Education Services
B. Proportion of budget allocated to community services: $301,000 (7.9%)
C. Community service activities:
Sherwood Vocational Exploration Project (job exploration projectconcurrent with vocational counseling); learning labs; culturaldevelopment activities; 2 day care centers; teacher aides on-the-jobtraining in public schools; demonstration of factory manufacture and/orassembly of usable parts; vocational rehabilitation skill evaluationand instructions programs for disadvalita;ed male adults (e.g., job entryskills in electronics assembly); institutional management skills fordisadvantaged females; summer workshop: explore careers; continuingeducation to improve skills and cultural enrichment of the community
D. Courses offered off campus:
Vocational cooking, keypunching, apprentice plumbing, pipe fitting,sewing, ceramics, aviation ground school, photography
Business introduction to business, shorthand
General economics, individual in the changing environment, stateMtcFy, humanities, math
E. Programs and aid for disadvantaged students: 12% academically disadvantaged
1. Programs Transfer freshmen are required to take core basicgeneral education; college parallel and adult education;Manpower Development and Training Act program;continuing education; vocational exploration project
2. Recruitment Student recruitment teams provide services to localhigh schools and to potential students in thecommunity at large; assist in completing admissionsforms; give information about programs and services;help solve problems related to orientation tocollege. Recruitmen: also by disadvantaged studentsthemselves who gain work experience as recruiters,counselor aides, tutors, teacher aides, financialassistance counselors, etc.
3. Financial aid No answer
F. Local advisory boards:
12 for occupational education12 for the needs of the disadvantaged
G. Special community surveys:
Surveys of the educational and occupational needs of the community;survey of the needs of the disadvantaged; semi-annual employment
service surveys; survey by faculty of needs of blacks in the community;work with chamber of commerce on local survey of socioeconomiccharacteristics of the community
-125-
X. Self-studies/Institutional Research
There is a Director of Institutional Research
Member of the League for Innovation in the Community College (with thejunior college district); member of Community Junior College Inter-Institutional Research Council which coordinated research efforts.
Long-range planning; effectiveness of academic programs; effect of thecollege on the environment and community; project planning and financing;instructional objectives.
Dissertations: Post-junior college activities in the community of electedstudent government officers; examination of faculty development programsin the state's junior colleges.
Inter-institutional Research: Study related to identification, placement,and curriculum development for academically unprepared students in thestate's junior colleges; follow-up study of students who were freshmen in1966; an "ERIC" set up to compile research studies in junior colleges inthe past 5 years; project to ascertain the degree of student rights,freedoms, and involvement in the junior college; composition writing studyas a result of an English composition workshop held by the League forInnovation in the Community College at UCLA in 1968; college preferencyreport in conjunction with a state-wide twelfth grade testing program withhigh school seniors; survey of post-secondary occupational education in-volving faculty and administrators of 11 area vocational schools and 27junior colleges.
College Research Projects: Follow-up study of graduates from 1966-1968;evaluation of Educational Aide Program; early childhood center (pre-schoolprograms for children designed and constructed by college students; researchof student progress in reading; study of evening students' counseling needs;project to investigate the role of a psychiatric consultant and the college;follow-up study of licensed practical nursing graduates 1959-1969;characteristics study of Fall 1970 students and comparison with theiruniversity counterparts; survey of characteristics and rewarding experiencesof the area technical-vocational high school students (training of highschool students in vocational programs); study of characteristics ofevening students; difficulty analysis of the Common Program (generaleducation) textbooks; graduate follow-up to compile graduate profile;development of evaluation instrument for faculty development.
College-endorsed programs: Conceptual cost-accounting model for acommunity junior college; selected student opinions about transfer problems;comparative analysis of the administrative structure and performance ofcommunity junior colleges in the state; comparison of self-concept,self-ideal, self-acceptance, and self-ideal congruence of university andjunior college freshmen.

-126-
INSTITUTIONAL PROFILE
WALDEN
I. Enrollment
A. Total: Fall 1967 8683Fall 1971 8204 6; 8165
c
B. Percent of decrease from Fall 1967 to Fall 1971: 5.5b; 6
c
C. Type of enrollment:
1. Full-time 3556Part-time 4609
2. Day Not availableEvening Not available
3. In special programs (EOP, remedial) 80% incoming freshmen
D. Number of graduates in June 1971:
1. Associate degrees 137b; 221c
2. Certificates 200b; 74c
3. Transfers to 4-year college 3786; 1000c
E. Grading policy: Standard A-F
F. Percent of withdrawals: Current Not availablePast 5 years 25
G. Source of students:
1. Number of local high schools 50
2. Number of high school graduates 1969-70 15,000
3. Proportion of local high school graduates attending Walden 90%
II. Description of Establishment
1934 Established
III. Program Emphasis and Enrollment
A.
ProgramNumber ofmajors
Percent ofcurricula Enrollment
Percent ofstudents
VocationalBusinessTransferNon-credit
11c 20e
3 8
29
67
25.6c 35e7.0 14
67.4 51
1207c
69582081
14.8
85.0
B. Number of day courses: Vocational 23
Business 23
Transfer 179
Number of evening courses: Vocational 13
Business 32
Transfer 97
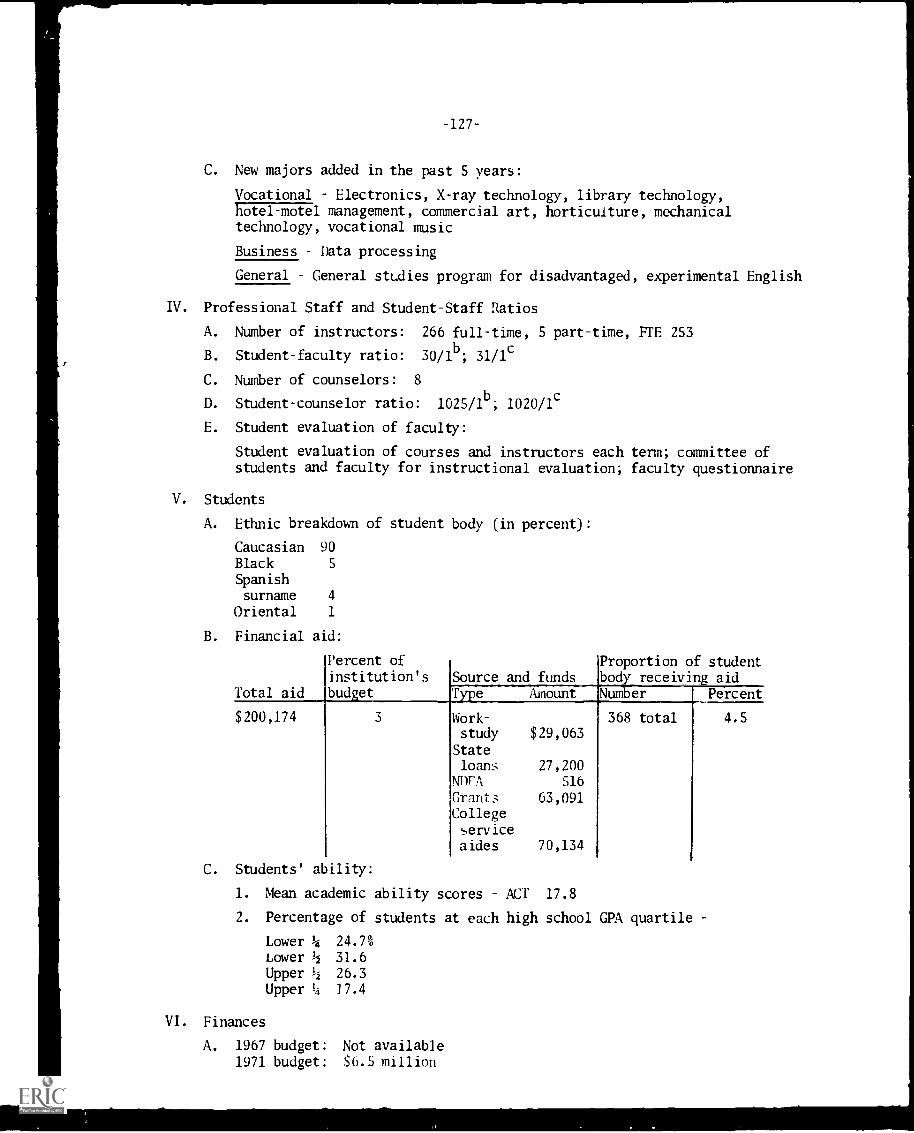
-127-
C. New majors added in the past 5 years:
Vocational Electronics, X-ray technology, library technology,hotel-motel management, commercial art, horticulture, mechanicaltechnology, vocational music
Business Data processing
General General studies program for disadvantaged, experimental English
IV. Professional Staff and Student-Staff Ratios
A. Number of instructors: 266 full-time, 5 part-time, FTE 253
B. Student-faculty ratio: 30/1b; 31/1c
C. Number of counselors: 8
D. Student-counselor ratio: 1025/1b; 1020/1c
E. Student evaluation of faculty:
Student evaluation of courses and instructors each term; committee ofstudents and faculty for instructional evaluation; faculty questionnaire
V. Students
A. Ethnic breakdown of student body (in percent):
Caucasian 90
Black 5
Spanishsurname 4
Oriental 1
B. Financial aid:
Total aid
$200,174
Percent ofinstitution'sbudget
Source andProportion of student
funds body receiving aid
3 Work-study $29,063
Stateloans 27,200
NIT A 516
Grants 63,091College
aides 70,134
Percent
368 total 4.5
Number
C. Students' ability:
1. Mean academic ability scores ACT 17.8
2. Percentage of students at each high school GPA quartile
Lower 4 24.7%Lower 1/2 31.6Upper 1/2 26.3
Upper 4 l7.4
VI. Finances
A. 1967 budget: Not available1971 budget: $6.5 million
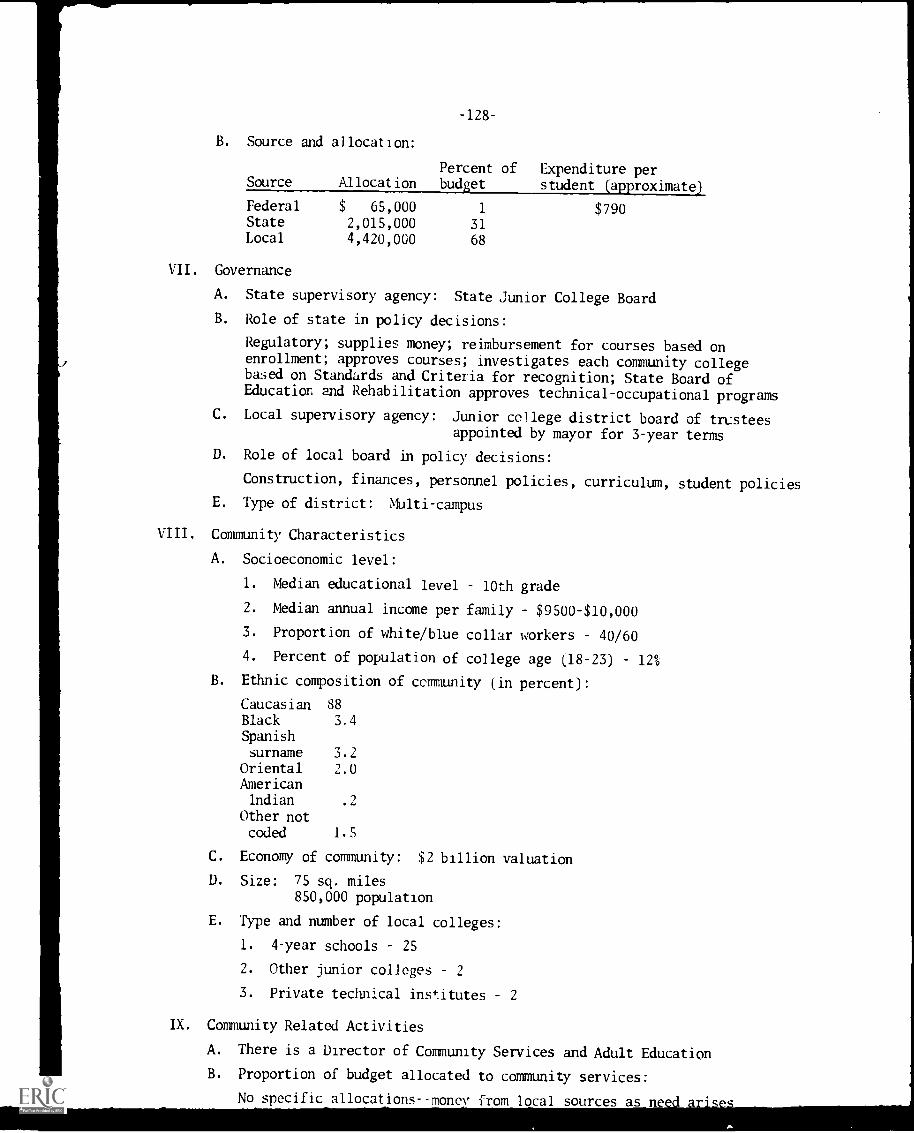
-128-
B. Source and allocation:
Percent of Expenditure perSource Allocation budget student (approximate)
Federal $ 65,000 1 $790State 2,015,000 31Local 4,420,000 68
VII. Governance
A. State supervisory agency: State Junior College Board
B. Role of state in policy decisions:
Regulatory; supplies money; reimbursement for courses based onenrollment; approves courses; investigates each community collegebased on Standards and Criteria for recognition; State Board ofEducation and Rehabilitation approves technical-occupational programs
C. Local supervisory agency: Junior college district board of trLsteesappointed by mayor for 3-year terms
D. Role of local board in policy decisions:
Construction, finances, personnel policies, curriculum, student policies
E. Type of district: Multi- campus
VIII. Community Characteristics
A. Socioeconomic level:
1. Median educational level 10th grade
2. Median annual income per family $9500-$10,000
3. Proportion of white/blue collar workers 40/60
4. Percent of population of college age (18-23) 120
B. Ethnic composition of community (in percent):
Caucasian 88
Black 3.4
Spanishsurname 3.2
Oriental 2.0AmericanIndian .2
Other notcoded 1.5
C. Economy of community: $2 billion valuation
D. Size: 75 sq. miles
850,000 population
E. Type and number of local colleges:
1. 4-year schools 25
2. Other junior colleges 2
3. Private technical institutes 2
IX. Community Related Activities
A. There is a Director of Community Services and Adult Education
B. Proportion of budget allocated to community services:
No specific allocations -money from local sources as n
1-129-
C. Community service activities:
Serves as consultant to local citizen groups working on communitydevelopment projects and to improve the quality of service of thosealready so engaged.
Training of volunteer tutors as teacher aides in reading; continuingeducation; film series; art fairs; meetings with political candidates;music workshop; childven's theater presentations.
Focus series series of discussions on current events and subjectsof social, economic, and educational interest; Forum series seriesof speakers of foreign countries; rapport with elementary schools,high schools, and human relations groups.
D. Courses offered off campus:
13 including Allied Health, social service, social psychology,human growth and development, principles of accounting, mechanicaltechnology, hotel-motel management, horticulture
E. Programs and aid for disadvantaged students: 24% academically disadvantaged
1. Programs General studies
2. Recruitment Walden is not located in low income part of the city;send counselors to inform the community and highschools of programs, financial aid, athletic programs;conduct tours of campus
3. Financial aid EOP, work-study, college service aides
F. Local advisory boards:
14 for occupational education: one for each technical and occupationalcurriculum which governs all aLidemic problems and situationspertaining to that curriculum; consist of at least 2 individualspresently employed in a local industry which employs graduates of thegiven program; the boards also assure that the demand for graduatesof any particular program does in fact exist
G. Special community surveys:
Surveys for occupational needs, educational needs, and needs of thedisadvantaged; survey of socioeconomic characteristics of the community(1969); faculty member in business department currently surveying thebusiness curriculum needs based on the community business situation
X. Self-studies/Institutional Research
There is an Office of Research and Evaluation
The Office of Research was established to provide basic data on communityneeds and student characteristics; assists the college in long-rangeplanning (programs, budget, etc.); a faculty committee on evaluation isbeing developed; a newsletter disseminates information and opinion tofaculty.
Follow-up study on experimental English 100; cost-accounting study ofdepartments and programs; study of evening programs; study of transferprograms; evaluation of dean's honors program; follow-up of graduates;evaluation of general studies program; study of the effect of probationpolicy on students.
HEGIS; a clearinghouse of information prepares reports on grade distribution,attrition rates, item analysis of exams, etc.; work with ACT to develop astudent guidance profile to be used by vocational-technical counselors;surveys of students by doctoral ztudents: social cultural concomitants ofachievement; demographic description of students; and psychologicalcorrelates of social conditions.
-130-
X. Self-studies/Institutional Research (cont'd)
Study on how well students from blue collar homes see the services ofcollege related to goals and aspiration level; survey of blackconsciousness and militancy of students in classes
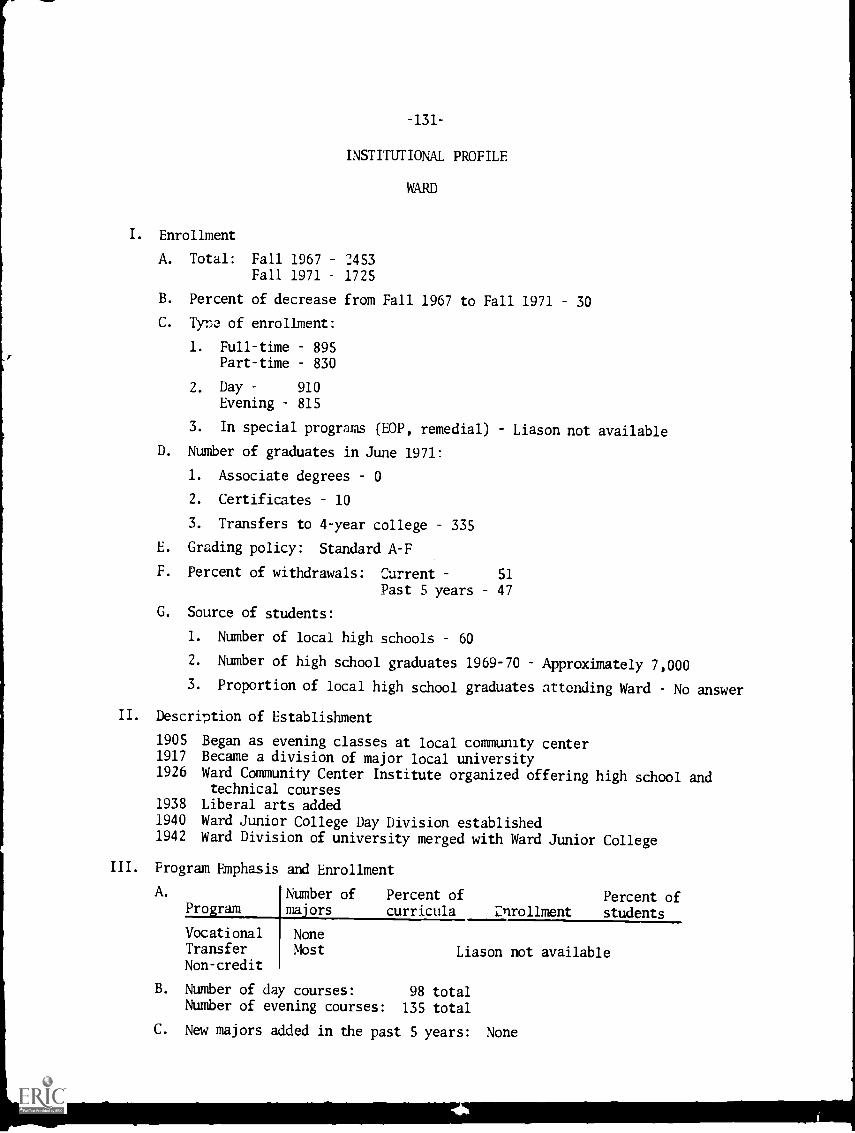
-131
INSTITUTIONAL PROFILE
WARD
I. Enrollment
A. Total: Fall 1967 2453Fall 1971 1725
B. Percent of decrease from Fall 1967 to Fall 1971 30
C. Tyra of enrollment:
1. Full-time 895Part-time 830
2. Day 910Evening 815
3. In special programs (EOP, remedial) Liason not available
D. Number of graduates in June 1971:
1. Associate degrees 0
2. Certificates 10
3. Transfers to 4-year college 335
E. Grading policy: Standard A-F
F. Percent of withdrawals: Current 51
Past 5 years 47
G. Source of students:
1. Number of local high schools 60
2. Number of high school graduates 1969-70 Approximately 7,000
3. Proportion of local high school graduates attending Ward No answer
II. Description of Establishment
1905 Began as evening classes at local community center1917 Became a division of major local university1926 Ward Community Center Institute organized offering high school and
technical courses1938 Liberal arts added1940 Ward Junior College Day Division established1942 Ward Division of university merged with Ward Junior College
III. Program Emphasis and Enrollment
A. Number of Percent of Percent ofProgram majors curricula enrollment students
Vocational NoneTransfer Most Liason not availableNon-credit
B. Number of day courses: 98 totalNumber of evening courses: 135 total
C. New majors added in the past 5 years: None
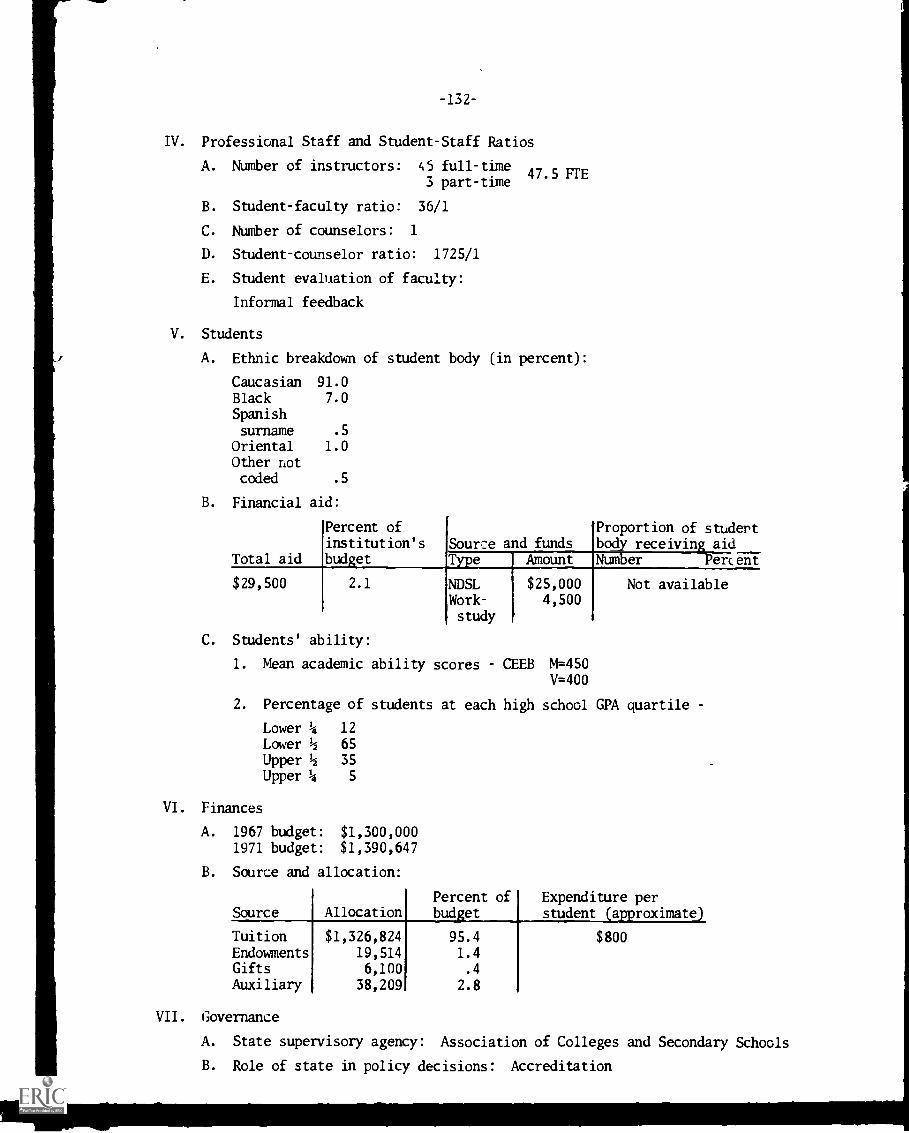
-132-
IV. Professional Staff and Student-Staff Ratios
A. Number of instructors: 45 full-time47.5 FTE
3 part-time
B. Student-faculty ratio: 36/1
C. Number of counselors: 1
D. Student-counselor ratio: 1725/1
E. Student evaluation of faculty:
Informal feedback
V. Students
A. Ethnic breakdown of student body (in percent):
Caucasian 91.0Black 7.0
Spanishsurname .5
Oriental 1.0Other notcoded .5
B. Financial aid:
Percent ofinstitution's
Total aid budget
$29,500 2.1
Source and fundsType Amount
NDSL $25,000Work- 4,500study
Proportion of studentbody receiving aidNumber 'Percent
Not available
C. Students' ability:
1. Mean academic ability scores CEEB M=450V=400
2. Percentage of students at each high school GPA quartile
Lower 4 12
Lower 11 65
Upper 11 35
Upper 4 5
VI. Finances
A. 1967 budget: $1,300,0001971 budget: $1,390,647
B. Source and allocation:
Source AllocationPercent ofbudget
Expenditure perstudent (approximate)
Tuition $1,326,824 95.4 $800Endowments 19,514 1.4Gifts 6,100 .4
Auxiliary 38,209 2.8
VII. Governance
A. State supervisory agency: Association of Colleges and Secondary Schools
B. Role of state in policy decisions: Accreditation
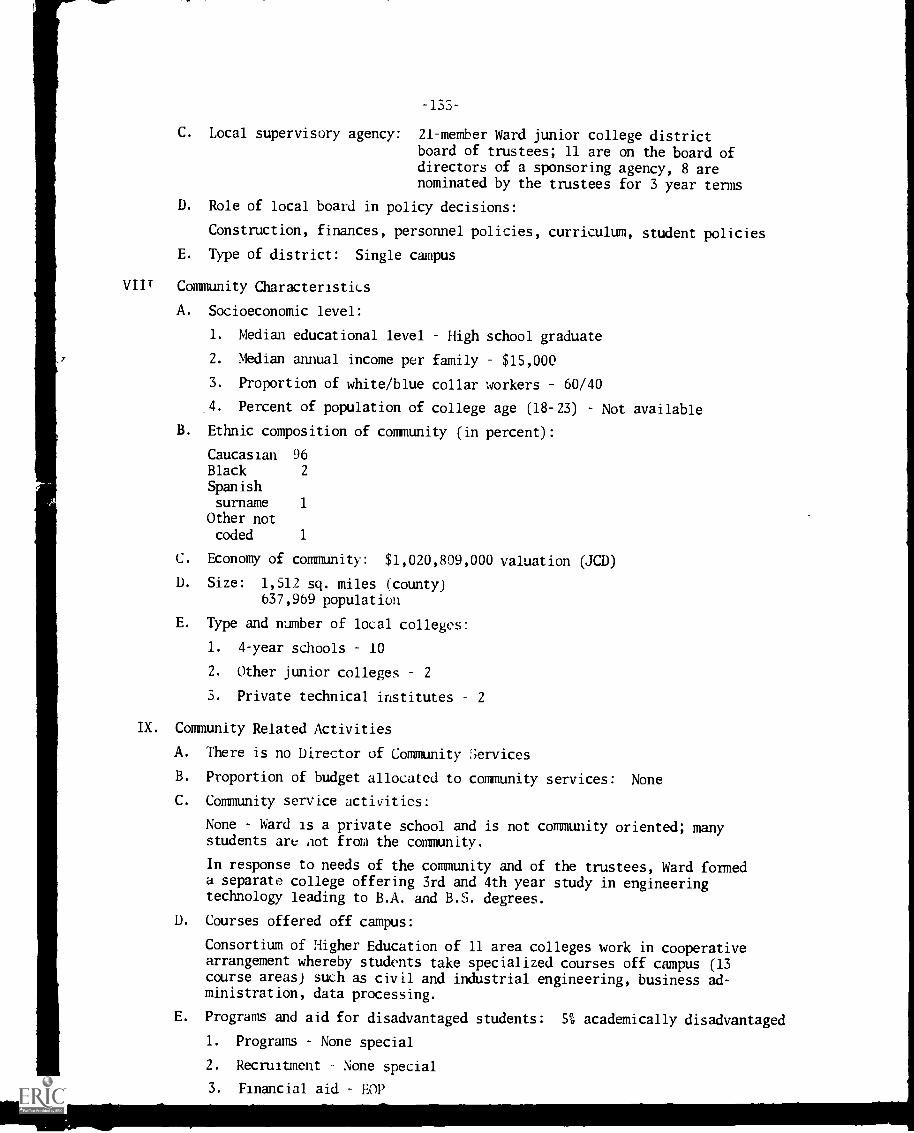
-133-
C. Local supervisory agency: 21-member Ward junior college district
board of trustees; 11 are on the board ofdirectors of a sponsoring agency, 8 arenominated by the trustees for 3 year terms
D. Role of local board in policy decisions:
Construction, finances, personnel policies, curriculum, student policies
E. Type of district: Single campus
VIII Community Characteristics
A. Socioeconomic level:
1. Median educational level High school graduate
2. Median annual income per family $15,000
3. Proportion of white/blue collar workers 60/40
_4. Percent of population of college age (18-23) Not available
B. Ethnic composition of community (in percent):
Caucasian 96Black 2
Spanishsurname 1
Other notcoded 1
C. Economy of community: $1,020,809,000 valuation (JCD)
D. Size: 1,512 sq. miles (county)637,969 population
E. Type and number of local colleges:
1. 4-year schools 10
2. Other junior colleges 2
3. Private technical institutes 2
IX. Community Related Activities
A. There is no Director of Community Services
B. Proportion of budget allocated to community services: None
C. Community service activities:
None Ward is a private school and is not community oriented; manystudents are cot from the community.
In response to needs of the community and of the trustees, Ward formeda separate college offering 3rd and 4th year study in engineeringtechnology leading to B.A. and B.S. degrees.
D. Courses offered off campus:
Consortium of Higher Education of 11 area colleges work in cooperativearrangement whereby students take specialized courses off campus (13course areas) such as civil and industrial engineering, business ad-ministration, data processing.
E. Programs and aid for disadvantaged students: 5% academically disadvantaged
1. Programs None special
2. Recruitment None special
3. Financial aid EOP
-134-
F. Local advisory boards:
The school sets up a program curriculum and then goes to thecommunity to set up advisory board; advisory boards exist foroccupational education and for the disadvantaged; activities throughcommunity agencies such as Community Action Council
G. Special community surveys: None on-going
X. Self-studies/Institutional Research
No Director of Institutional Research (research done via Registrar)
Very little. Correlation studies on academic performance; study ofattrition rates; studies on how best to teach foreign students
1
APPENDIX B
INTERVIEW SCHEDULES FOR KEY ADMINISTRATORS
AND
TABLES TO CHAPTER 4
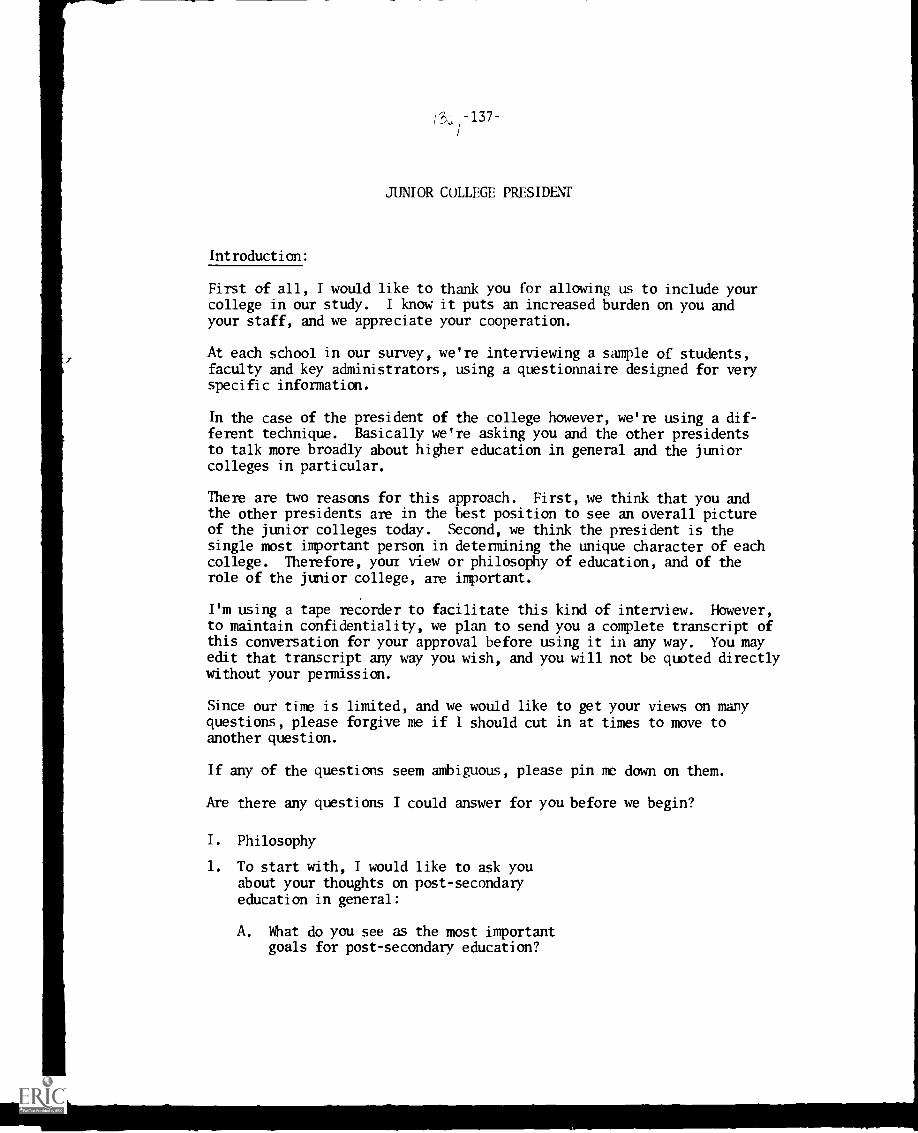
/3,;-137-
JUNIOR COLLEGE PRESIDENT
Introduction:
First of all, I would like to thank you for allowing us to include yourcollege in our study. I know it puts an increased burden on you andyour staff, and we appreciate your cooperation.
At each school in our survey, we're interviewing a sample of students,faculty and key administrators, using a questionnaire designed for veryspecific information.
In the case of the president of the college however, we're using a dif-ferent technique. Basically we're asking you and the other presidentsto talk more broadly about higher education in general and the juniorcolleges in particular.
There are two reasons for this approach. First, we think that you andthe other presidents are in the best position to see an overall pictureof the junior colleges today. Second, we think the president is thesingle most important person in determining the unique character of eachcollege. Therefore, your view or philosophy of education, and of therole of the junior college, are important.
I'm using a tape recorder to facilitate this kind of interview. However,to maintain confidentiality, we plan to send you a complete transcript ofthis conversation for your approval before using it in any way. You mayedit that transcript any way you wish, and you will not be quoted directlywithout your permission.
Since our time is limited, and we would like to get your views on manyquestions, please forgive me if I should cut in at times to move toanother question.
If any of the questions seem ambiguous, please pin me down on them.
Are there any questions I could answer for you before we begin?
I. Philosophy
1. To start with, I would like to ask youabout your thoughts on post-secondaryeducation in general:
A. What do you see as the most importantgoals for post-secondary education?

-138-
B. How should those goals be established? Are they basically unchang-ing, or do they change withconditions?
Do they come from the com-munity or the institution?
C. Are these goals currently being met?
D. If they are not currently being met, Would drastic changes bewhat changes would have to be made in required?education to realize these goals?
E. Now, moving specifically to the juniorcollege:
What do you, see as unique about juniorcolleges? Where do they fit in yourconcept of education?
F. What do you think is the main purpose Transfer education, occupa-of the junior college; the main tional education, generalpriority? education, community services?
G. Which is most important? Why?
H. How would you describe your own rolein carrying out the unique functionsof the junior college?
I. Are you comfortable with that role? Would you prefer a differentone?
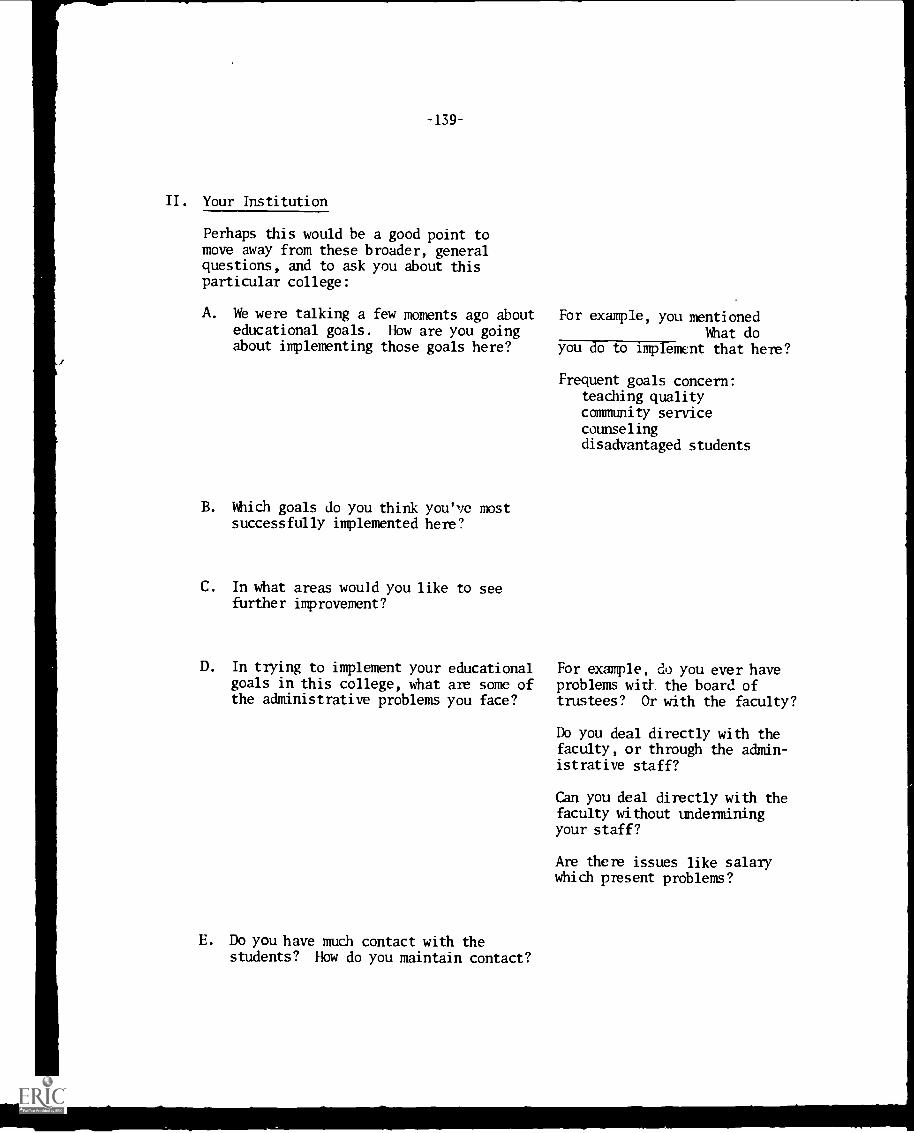
-139-
II. Your Institution
Perhaps this would be a good point tomove away from these broader, generalquestions, and to ask you about thisparticular college:
A. We were talking a few moments ago about For example, you mentionededucational goals. How are you going Mat doabout implementing those goals here? you do to implement that here?
Frequent goals concern:teaching qualitycommunity servicecounselingdisadvantaged students
B. Mich goals do you think you've mostsuccessfully implemented here?
C. In what areas would you like to seefurther improvement?
D. In trying to implement your educational For example, do you ever havegoals in this college, what are some of problems with the board ofthe administrative problems you face? trustees? Or with the faculty?
E. Do you have much contact with thestudents? How do you maintain contact?
Do you deal directly with thefaculty, or through the admin-istrative staff?
Can you deal directly with thefaculty without underminingyour staff?
Are there issues like salarywhich present problems?
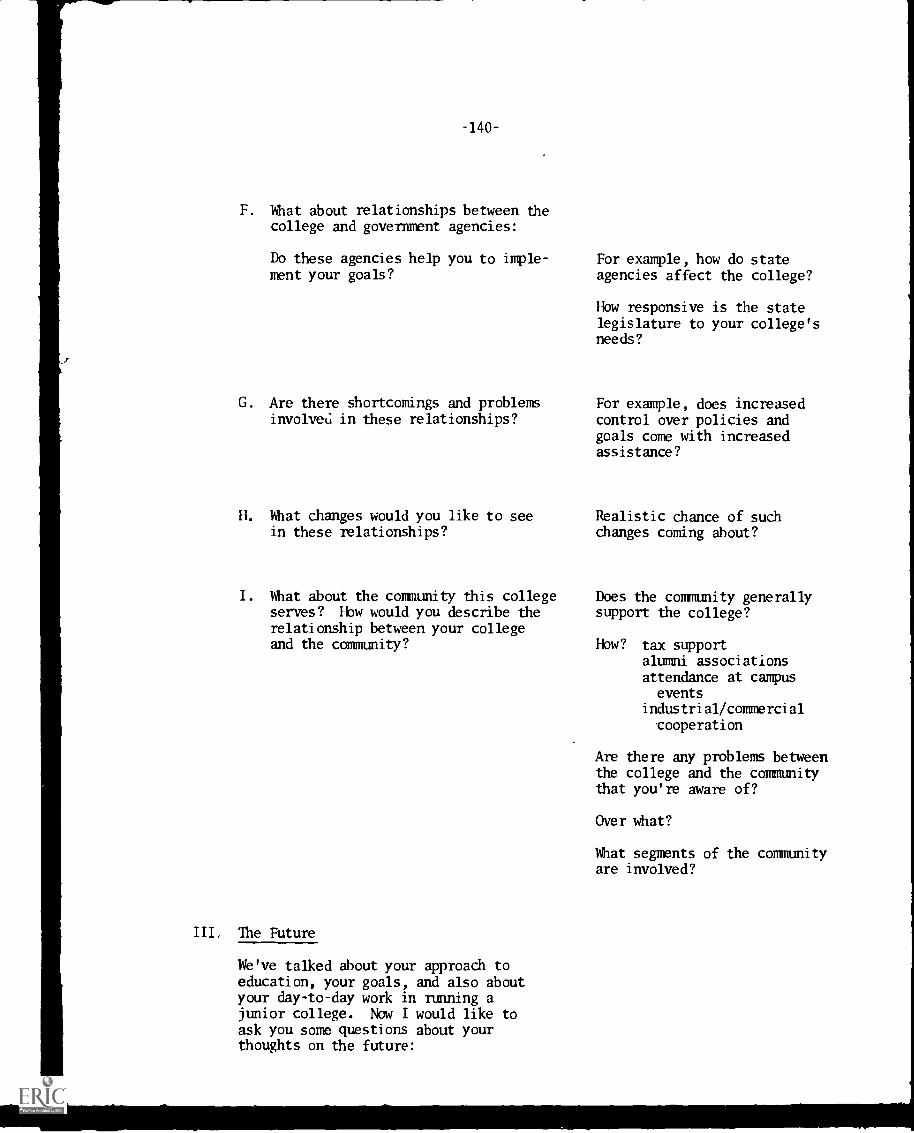
-140-
F. What about relationships between thecollege and government agencies:
Do these agencies help you to imple-ment your goals?
G. Are there shortcomings and problemsinvolved in these relationships?
H. What changes would you like to seein these relationships?
I. What about the community this collegeserves? How would you describe therelationship between your collegeand the community?
III. The Future
We've talked about your approach toeducation, your goals, and also aboutyour day-to-day work in running ajunior college. Now I would like toask you some questions about yourthoughts on the future:
For example, how do stateagencies affect the college?
How responsive is the statelegislature to your college'sneeds?
For example, does increasedcontrol over policies andgoals come with increasedassistance?
Realistic chance of suchchanges coming about?
Does the community generallysupport the college?
How? tax supportalumni associationsattendance at campusevents
industrial/commercialcooperation
Are there any problems betweenthe college and the communitythat you're aware of?
Over what?
What segments of the communityare involved?
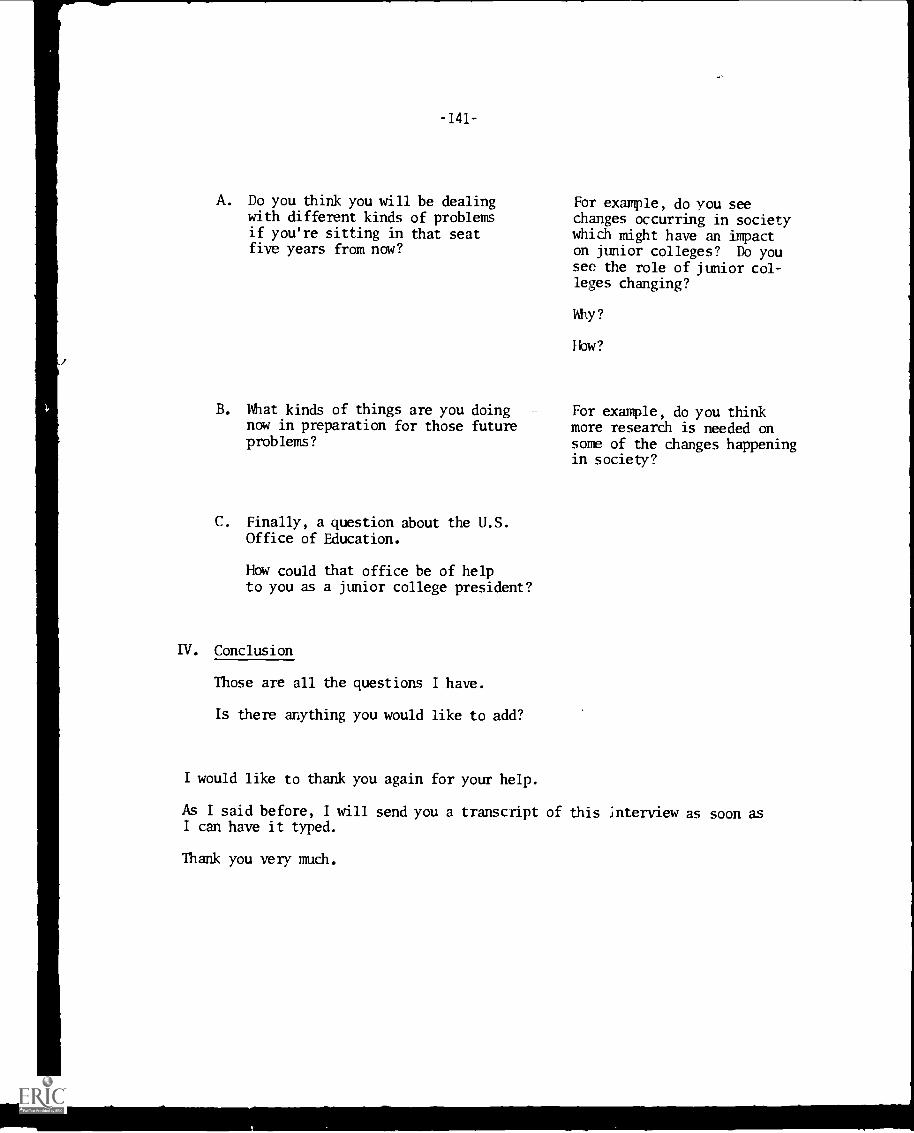
-141-
A. Do you think you will be dealingwith different kinds of problemsif you're sitting in that seatfive years from now?
B. What kinds of things are you doingnow in preparation for those futureproblems?
C. Finally, a question about the U.S.Office of Education.
How could that office be of helpto you as a junior college president?
IV. Conclusion
Those are all the questions I have.
Is there anything you would like to add?
I would like to thank you again for your help.
For example, do you seeChanges occurring in societywhich might have an impacton junior colleges? Do yousee the role of junior col-leges changing?
Why?
How?
For example, do you thinkmore research is needed onsome of the changes happeningin society?
As I said before, I will send you a transcript of this .nterview as soon asI can have it typed.
Thank you very much.
1
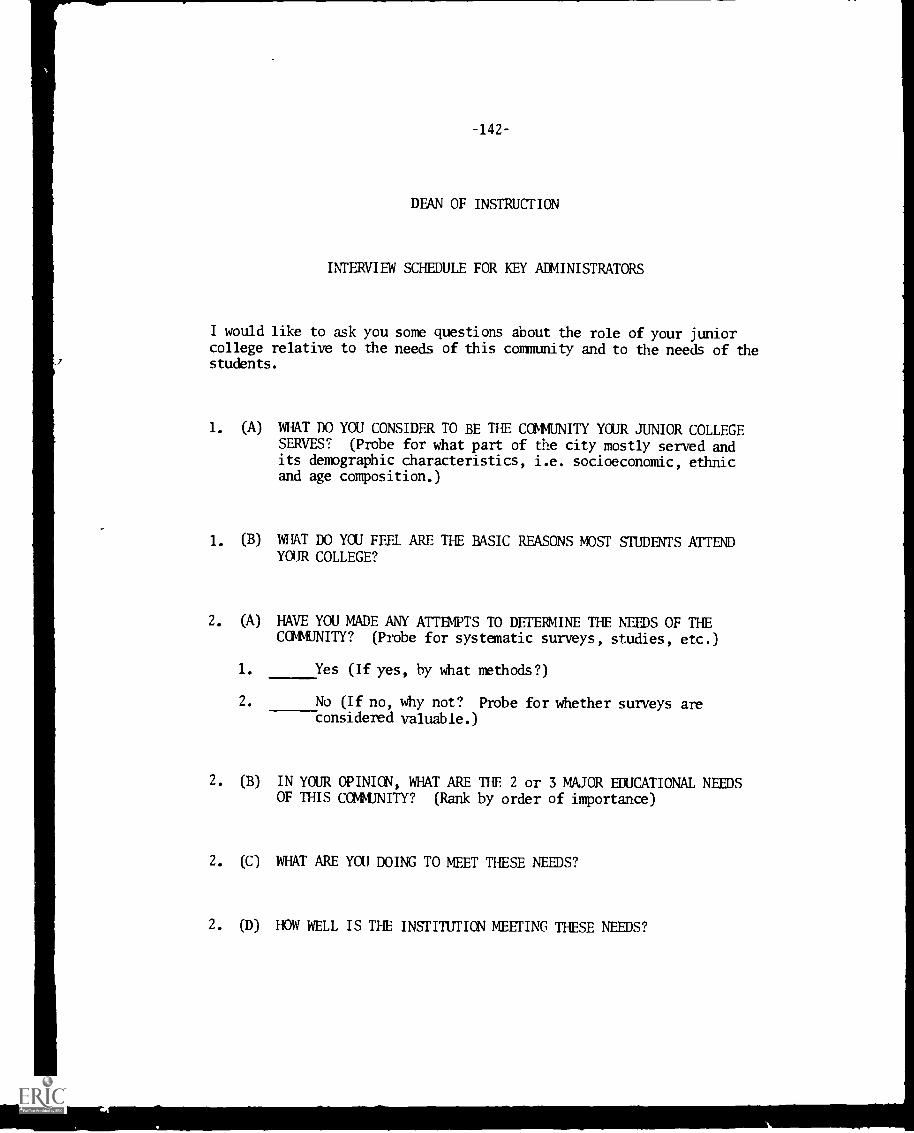
-142
DEAN OF INSTRUCTION
INTERVIEW SCHEDULE FOR KEY ADMINISTRATORS
I would like to ask you some questions about the role of your juniorcollege relative to the needs of this community and to the needs of thestudents.
1. (A) WHAT DO YOU CONSIDER TO BE THE COMMUNITY YOUR JUNIOR COLLEGESERVES? (Probe for what part of the city mostly served andits demographic characteristics, i.e. socioeconomic, ethnicand age composition.)
1. (B) WHAT DO YCU FEEL ARE THE BASIC REASONS MOST STUDENTS ATTENDYOUR COLLEGE?
2. (A) HAVE YOU MADE ANY ATTEMPTS TO DETERMINE THE NEEDS OF THECOMMUNITY? (Probe for systematic surveys, studies, etc.)
1. Yes (If yes, by what methods?)
2. No (If no, why not? Probe for whether surveys areconsidered valuable.)
2. (B) IN YOUR OPINION, WHAT ARE TUE 2 or 3 MAJOR EDUCATIONAL NEEDSOF THIS COMMUNITY? (Rank by order of importance)
2. (C) WHAT ARE YOU DOING TO MEET THESE NEEDS?
2. (D) HOW WELL IS THE INSTITUTION MEETING THESE NEEDS?
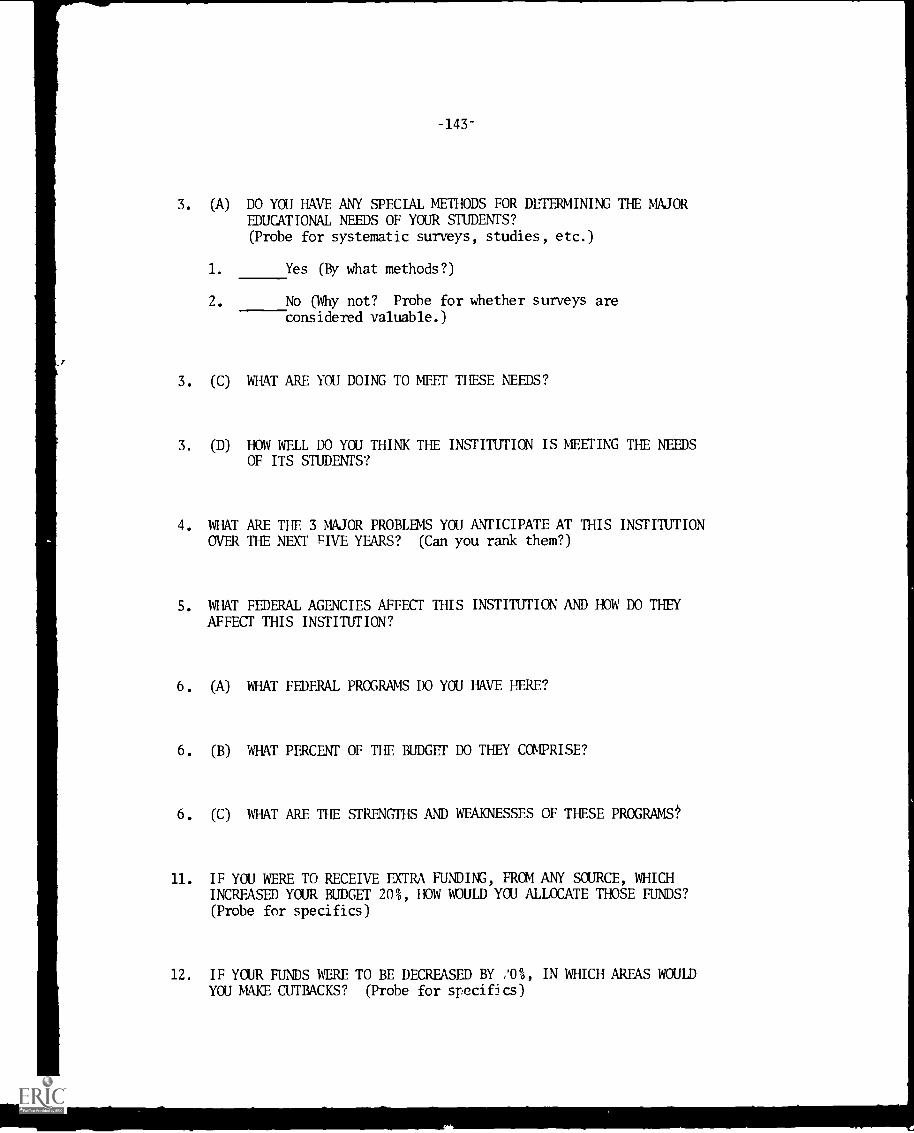
-143-
3. (A) DO YOU HAVE ANY SPECIAL METHODS FOR DETERMINING THE MAJOREDUCATIONAL NEEDS OF YOUR STUDENTS?(Probe for systematic surveys, studies, etc.)
1. Yes (By what methods?)
2. No (Why not? Probe for whether surveys areconsidered valuable.)
3. (C) WHAT ARE YOU DOING TO MEET THESE NEEDS?
3. (D) HOW WELL DO YOU THINK THE INSTITUTION IS MEETING THE NEEDSOF ITS STUDENTS?
4. WHAT ARE THE 3 MAJOR PROBLEMS YOU ANTICIPATE AT THIS INSTITUTIONOVER THE NEXT FIVE YEARS? (Can you rank them?)
5. WHAT FEDERAL AGENCIES AFFECT THIS INSTITUTION AND HOW DO THEYAFFECT THIS INSTITUTION?
6. (A) WHAT FEDERAL PROGRAMS DO YOU HAVE HERE?
6. (B) WHAT PERCENT OF THE BUDGET DO THEY COMPRISE?
6. (C) WHAT ARE THE STRENGTHS AND WEAKNESSES OF THESE PROGRAMS'?
11. IF YOU WERE TO RECEIVE EXTRA FUNDING, FROM ANY SOURCE, WHICHINCREASED YOUR BUDGET 20%, HOW WOULD YOU ALLOCATE THOSE FUNDS?(Probe for specifics)
12. IF YOUR FUNDS WERE TO BE DECREASED BY ;0%, IN WHICH AREAS WOULDYOU MAKE CUTBACKS? (Probe for specifics)
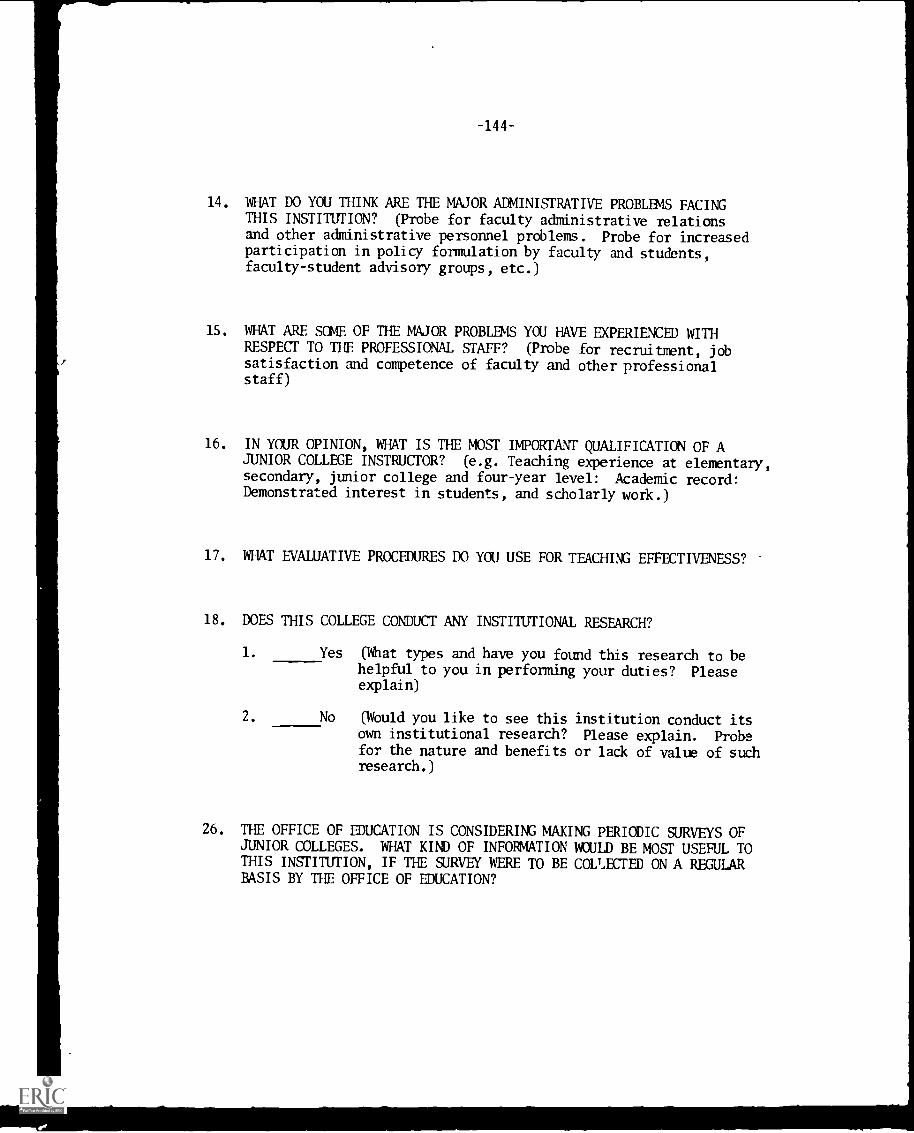
-144-
14. WHAT DO YOU THINK ARE THE MAJOR ADMINISTRATIVE PROBLEMS FACINGTHIS INSTITUTION? (Probe for faculty administrative relationsand other administrative personnel problems. Probe for increasedparticipation in policy formulation by faculty and students,faculty-student advisory groups, etc.)
15. WHAT ARE SOME OF THE MAJOR PROBLEMS YOU HAVE EXPERIENCED WITHRESPECT TO THE PROFESSIONAL STAFF? (Probe for recruitment, jobsatisfaction and competence of faculty and other professionalstaff)
16. IN YOUR OPINION, WHAT IS THE MOST IMPORTANT QUALIFICATION OF AJUNIOR COLLEGE INSTRUCTOR? (e.g. Teaching experience at elementary,secondary, junior college and four-year level: Academic record:Demonstrated interest in students, and scholarly work.)
17. WHAT EVALUATIVE PROCEDURES DO YOU USE FOR TEACHING EFFECTIVENESS?
18. DOES THIS COLLEGE CONDUCT ANY INSTITUTIONAL RESEARCH?
1. Yes (That types and have you found this research to behelpful to you in performing your duties? Pleaseexplain)
2. No (Would you like to see this institution conduct itsown institutional research? Please explain. Probefor the nature and benefits or lack of value of suchresearch.)
26. THE OFFICE OF EDUCATION IS CONSIDERING MAKING PERIODIC SURVEYS OFJUNIOR COLLEGES. WHAT KIND OF INFORMATION WOULD BE MOST USEFUL TOTHIS INSTITUTION, IF THE SURVEY WERE TO BE COLUCTED ON A REGULARBASIS BY THE OFFICE OF EDUCATION?
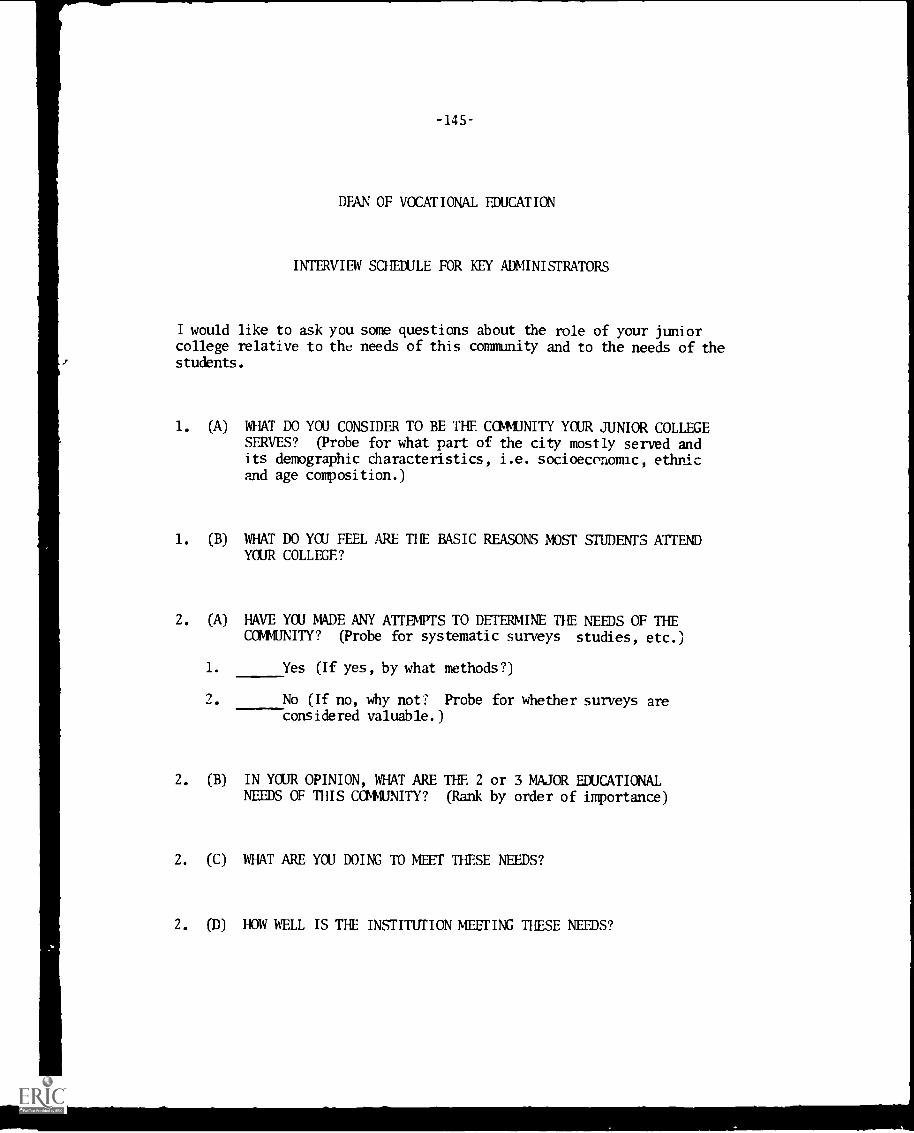
-145-
DEAN OF VOCATIONAL EDUCATION
INTERVIEW SCHEDULE FOR KEY ADMINISTRATORS
I would like to ask you some questions about the role of your juniorcollege relative to the needs of this community and to the needs of thestudents.
1. (A) WHAT DO YOU CONSIDER TO BE THE CCMMUNITY YOUR JUNIOR COLLEGESERVES? (Probe for what part of the city mostly served andits demographic characteristics, i.e. socioeconomic, ethnicand age composition.)
1. (B) WHAT DO YCU FEEL ARE THE BASIC REASONS MOST STUDENTS ATTENDYOUR COLLEGE?
2. (A) HAVE YOU MADE ANY ATTFITTS TO DETERMINE THE NEEDS OF THECOMMUNITY? (Probe for systematic surveys studies, etc.)
1. Yes (If yes, by what methods?)
2. No (If no, why not: Probe for whether surveys areconsidered valuable.)
2. (B) IN YOUR OPINION, WHAT ARE THE 2 or 3 MAJOR EDUCATIONALNEEDS OF THIS COMMUNITY? (Rank by order of importance)
2. (C) WHAT ARE YOU DOING TO MEET THESE NEEDS?
2. (D) HOW WELL IS THE INSTITUTION MEETING THESE NEEDS9
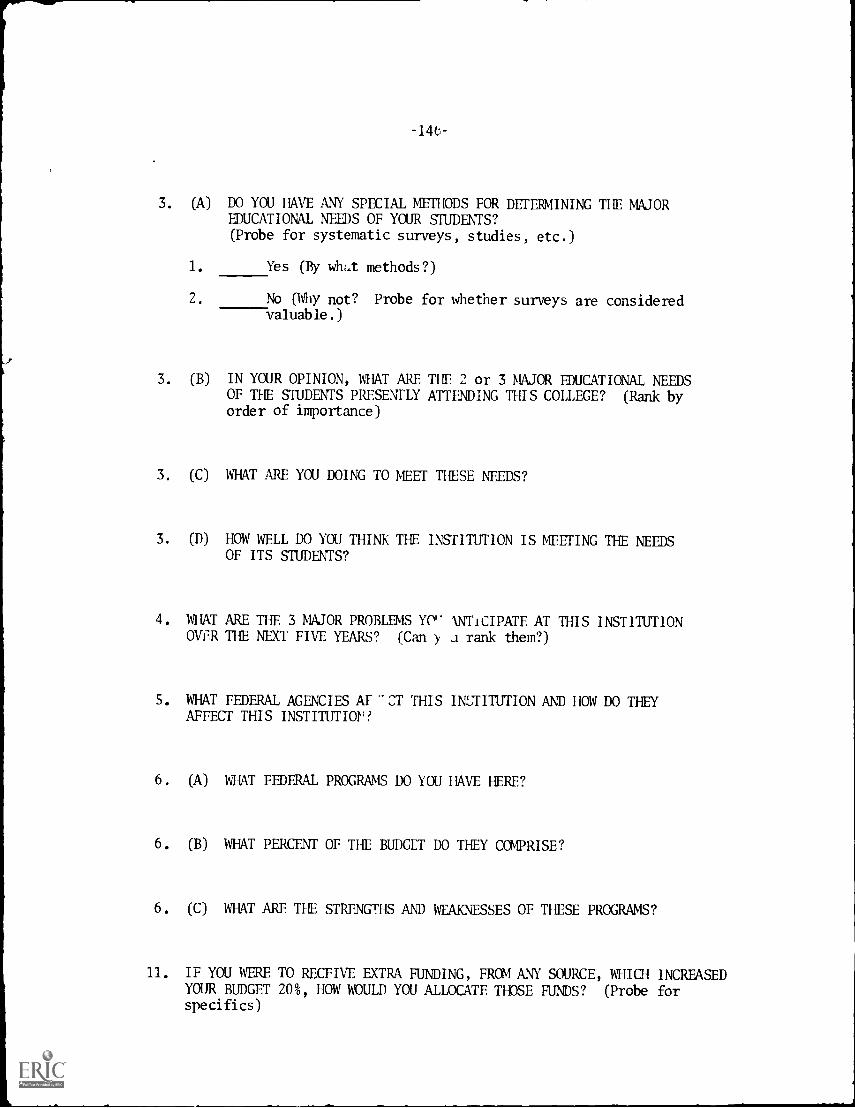
-14t-
3. (A) DO YOU HAVE ANY SPECIAL METHODS FOR DETERMINING THE MAJOREDUCATIONAL NEEDS OF YOUR STUDENTS?(Probe for systematic surveys, studies, etc.)
1. Yes (By what methods?)
2. No (Why not? Probe for whether surveys are consideredvaluable.)
3. (B) IN YOUR OPINION, WHAT ARE THE 2 or 3 MAJOR EDUCATIONAL NEEDSOF THE STUDENTS PRESENTLY ATTENDING THIS COLLEGE? (Rank byorder of importance)
3. (C) WHAT ARE YOU DOING TO MEET THESE NEEDS?
3. (D) HOW WELL DO YOU THINK THE INSTITUTION IS MEETING THE NEEDSOF ITS STUDENTS?
4. WHAT ARE THE 3 MAJOR PROBLEMS YO" WICIPATE AT THIS INSTITUTIONOVER THE NEXT FIVE YEARS? (Can y a rank them?)
S. WHAT FEDERAL AGENCIES AF CT THIS INSTITUTION AND HOW DO THEYAFFECT THIS INSTITUTITY
6. (A) WHAT FEDERAL PROGRAMS DO YOU HAVE HERE?
6. (B) WHAT PERCENT OF THE BUDGET DO THEY COMPRISE?
6. (C) WHAT ARE THE STRENGTHS AND WEAKNESSES OF THESE PROGRAMS?
11. IF YOU WERE TO RECEIVE EXTRA FUNDING, FROM ANY SOURCE, WHICH INCREASEDYOUR BUDGET 20%, HOW WOULD YOU ALLOCATE THOSE FUNDS? (Probe forspecifics)
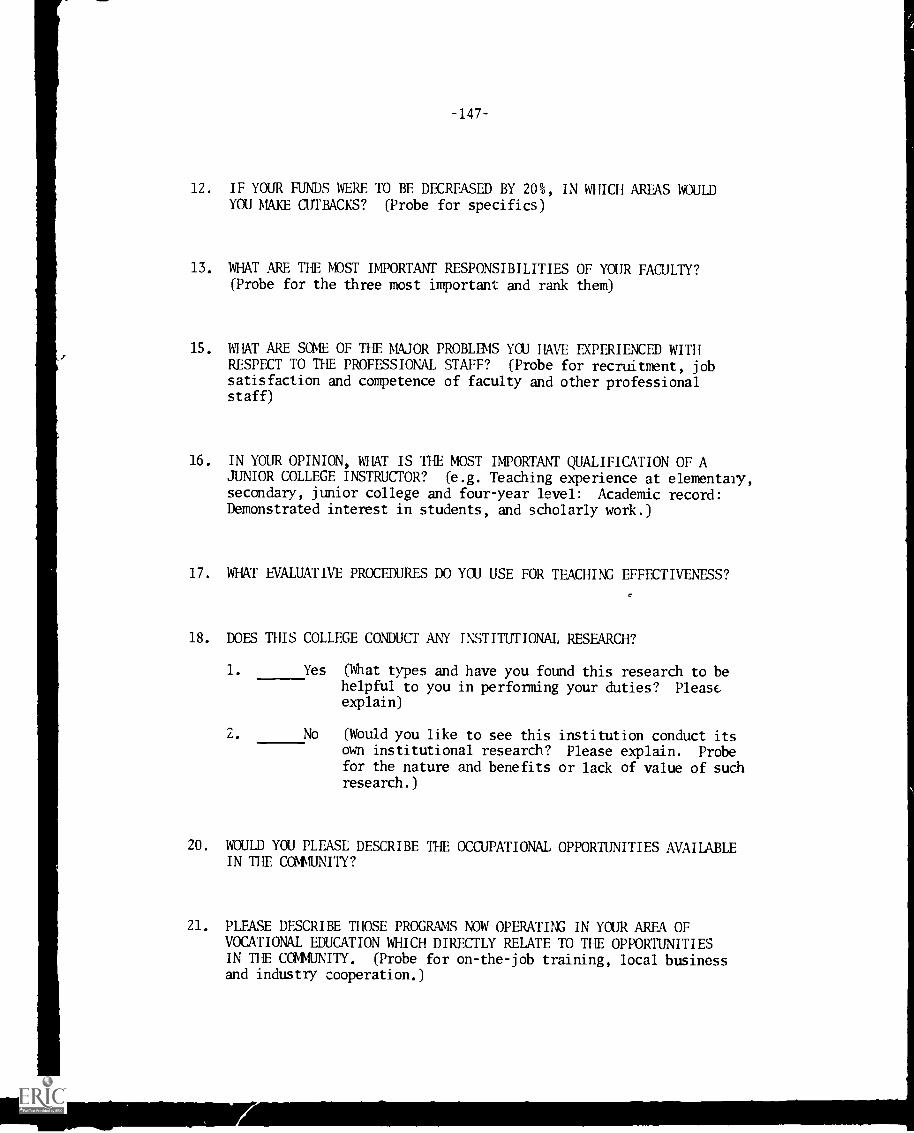
-147-
12. IF YOUR FUNDS WERE TO BE DECREASED BY 20%, IN WHICH AREAS WOULDYOU MAKE CUTBACKS? (Probe for specifics)
13. WHAT ARE THE MOST IMPORTANT RESPONSIBILITIES OF YOUR FACULTY?(Probe for the three most important and rank them)
15. WHAT ARE SOME OF THE MAJOR PROBLEMS YOU HAVE EXPERIENCED WITH7
RESPECT TO THE PROFESSIONAL STAFF? (Probe for recruitment, jobsatisfaction and competence of faculty and other professionalstaff)
16. IN YOUR OPINION, WHAT IS THE MOST IMPORTANT QUALIFICATION OF AJUNIOR COLLEGE INSTRUCTOR? (e.g. Teaching experience at elementary,secondary, junior college and four-year level: Academic record:Demonstrated interest in students, and scholarly work.)
17. WHAT EVALUATIVE PROCEDURES DO YOU USE FOR TEACHING EFFECTIVENESS?
18. DOES THIS COLLEGE CONDUCT ANY INSTITUTIONAL RESEARCH?
1. Yes (What types and have you found this research to behelpful to you in performing your duties? Pleaseexplain)
2. No (Would you like to see this institution conduct itsown institutional research? Please explain. Probefor the nature and benefits or lack of value of suchresearch.)
20. WOULD YOU PLEASE DESCRIBE THE OCCUPATIONAL OPPORTUNITIES AVAILABLEIN THE COMMUNITY?
21. PLEASE DESCRIBE THOSE PROGRAMS NOW OPERATING IN YOUR AREA OFVOCATIONAL EDUCATION WHICH DIRECTLY RELATE TO THE OPPORTUNITIESIN THE COMMUNITY. (Probe for on-the-job training, local businessand industry cooperation.)
-148-
26. THE OFFICE OF EDUCATION IS CONSIDERING MAKING PERIODIC SURVE OFJUNIOR COLLEGES. WHAT KIND OF INFORMATION WOULD BE MOST USEFUL TOTHIS INSTITUTION, IF THE SURVEY WERE TO BE COLLECTED ON A REGULARBASIS BY THE OFFICE OF EDUCATION?
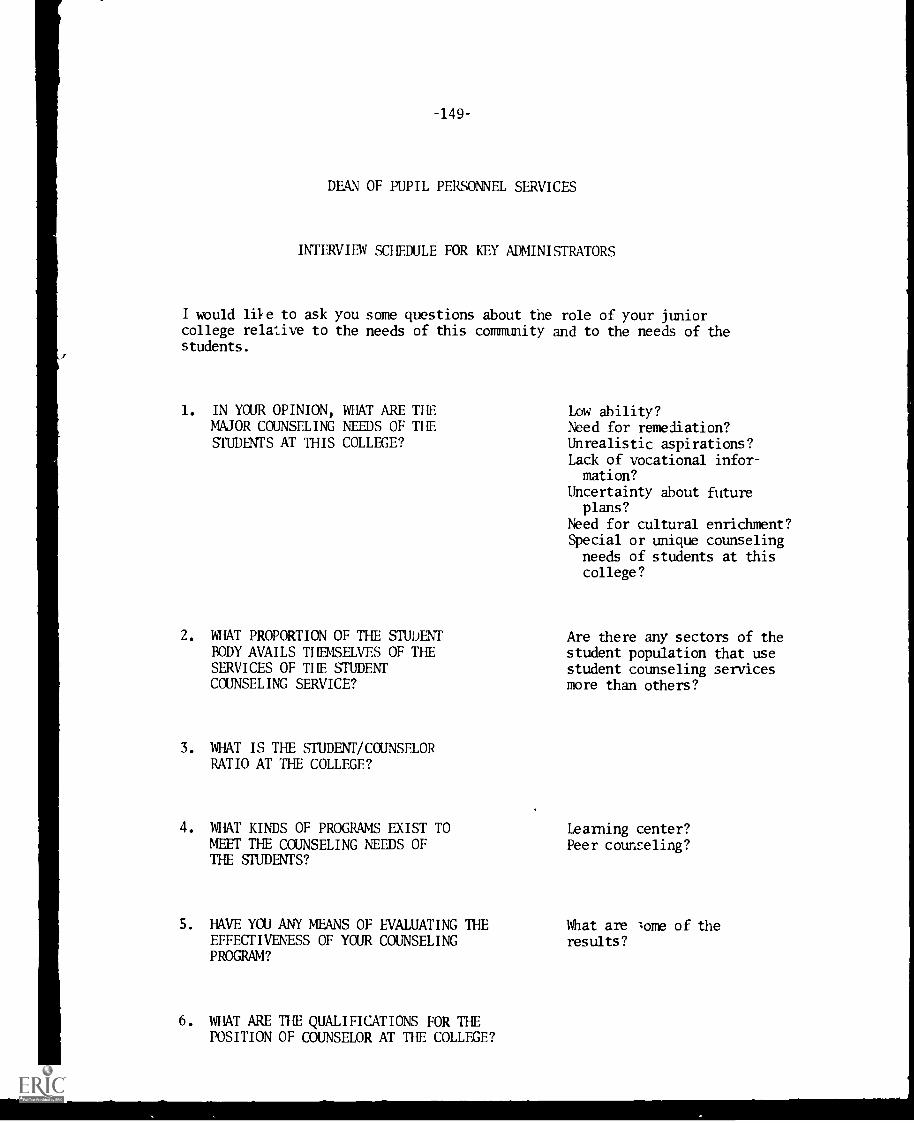
-149
DEAN OF PUPIL PERSONNEL SERVICES
INTERVIEW SCHEDULE FOR KEY ADMINISTRATORS
I would liie to ask you some questions about the role of your juniorcollege relative to the needs of this community and to the needs of thestudents.
1. IN YOUR OPINION, WHAT ARE THEMAJOR COUNSELING NEEDS OF THESTUDENTS AT THIS COLLEGE?
2. WHAT PROPORTION OF THE STUDENTBODY AVAILS THENSELVES OF THESERVICES OF THE STUDENTCOUNSELING SERVICE?
3. WHAT IS THE STUDENT/COUNSELORRATIO AT THE COLLEGE?
4. WHAT KINDS OF PROGRAMS EXIST TOMEET THE COUNSELING NEEDS OFTHE STUDENTS?
5. HAVE YOU ANY MEANS OF EVALUATING THEEFFECTIVENESS OF YOUR COUNSELINGPROGRAM?
6. WHAT ARE THE QUALIFICATIONS FOR THEPOSITION OF COUNSELOR AT THE COLLEGE?
Low ability?Need for remediation?Unrealistic aspirations?Lack of vocational infor-mation?
Uncertainty about futureplans?
Need for cultural enrichment?Special or unique counselingneeds of students at thiscollege?
Are there any sectors of thestudent population that usestudent counseling servicesmore than others?
Learning center?Peer counseling?
What are lome of theresults?
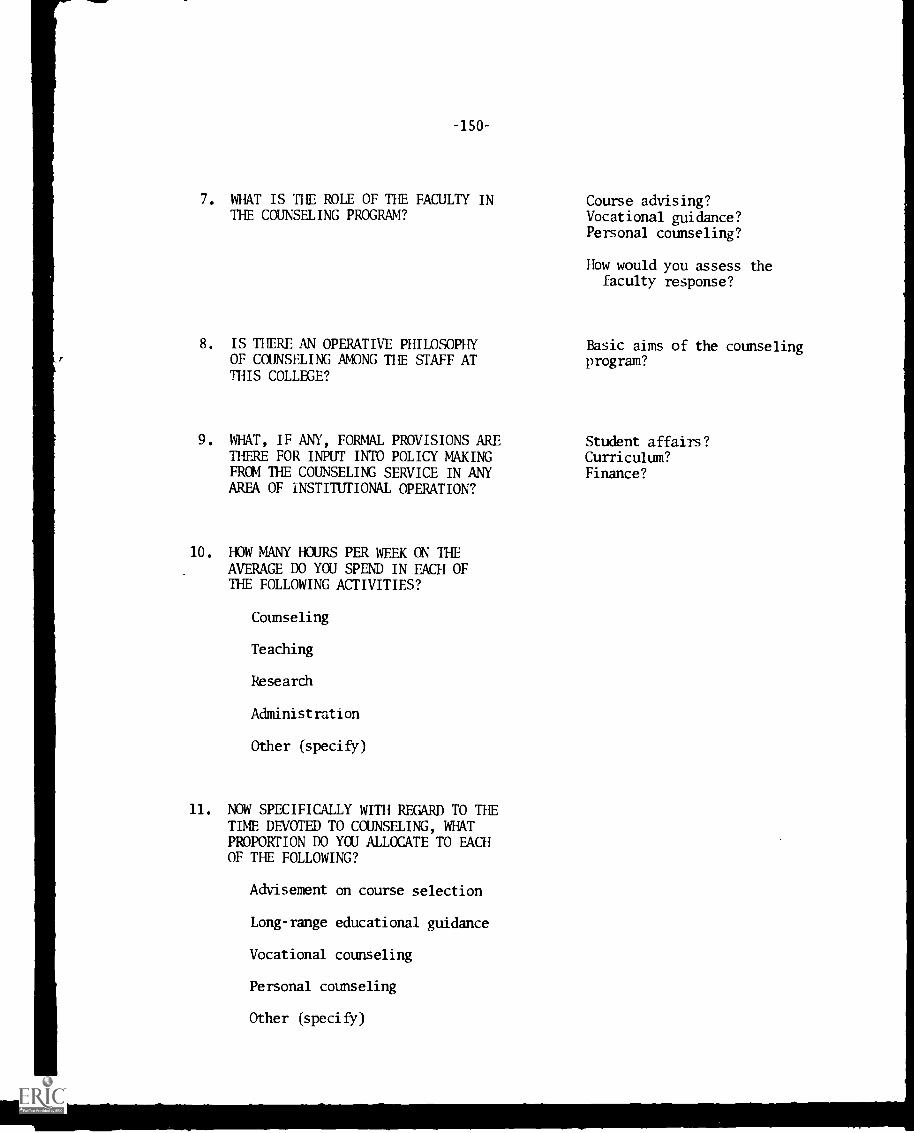
-150-
7. WHAT IS THE ROLE OF THE FACULTY INTHE COUNSELING PROGRAM?
8. IS THERE AN OPERATIVE PHILOSOPHYOF COUNSELING AMONG THE STAFF ATTHIS COLLEGE?
Course advising?Vocational guidance?Personal counseling?
How would you assess thefaculty response?
Basic aims of the counselingprogram?
9. WHAT, IF ANY, FORMAL PROVISIONS ARE Student affairs?TITRE FOR INPUT INTO POLICY MAKING Curriculum?FROM THE COUNSELING SERVICE IN ANY Finance?AREA OF INSTITUTIONAL OPERATION?
10. HOW MANY HOURS PER WEEK ON THEAVERAGE DO YOU SPEND IN EACH OFTHE FOLLOWING ACTIVITIES?
Counseling
Teaching
Research
Administration
Other (specify)
11. NOW SPECIFICALLY WITH REGARD TO THETIME DEVOTED TO COUNSELING, WHATPROPORTION DO YOU ALLOCATE TO EACHOF THE FOLLOWING?
Advisement on course selection
Long-range educational guidance
Vocational counseling
Personal counseling
Other (specify)
-151-
12. (If time permits)WHAT DO YOU SEE AS THE MAJOR TRENDSIN STUDENT COUNSELING? ARE THEREDISCERNIBLE SHIFTS IN COUNSELINGNEEDS OVER THE PAST FEW YEARS?WHAT CHANGES DO YOU FORESEE IN THEYEARS AHEAD?
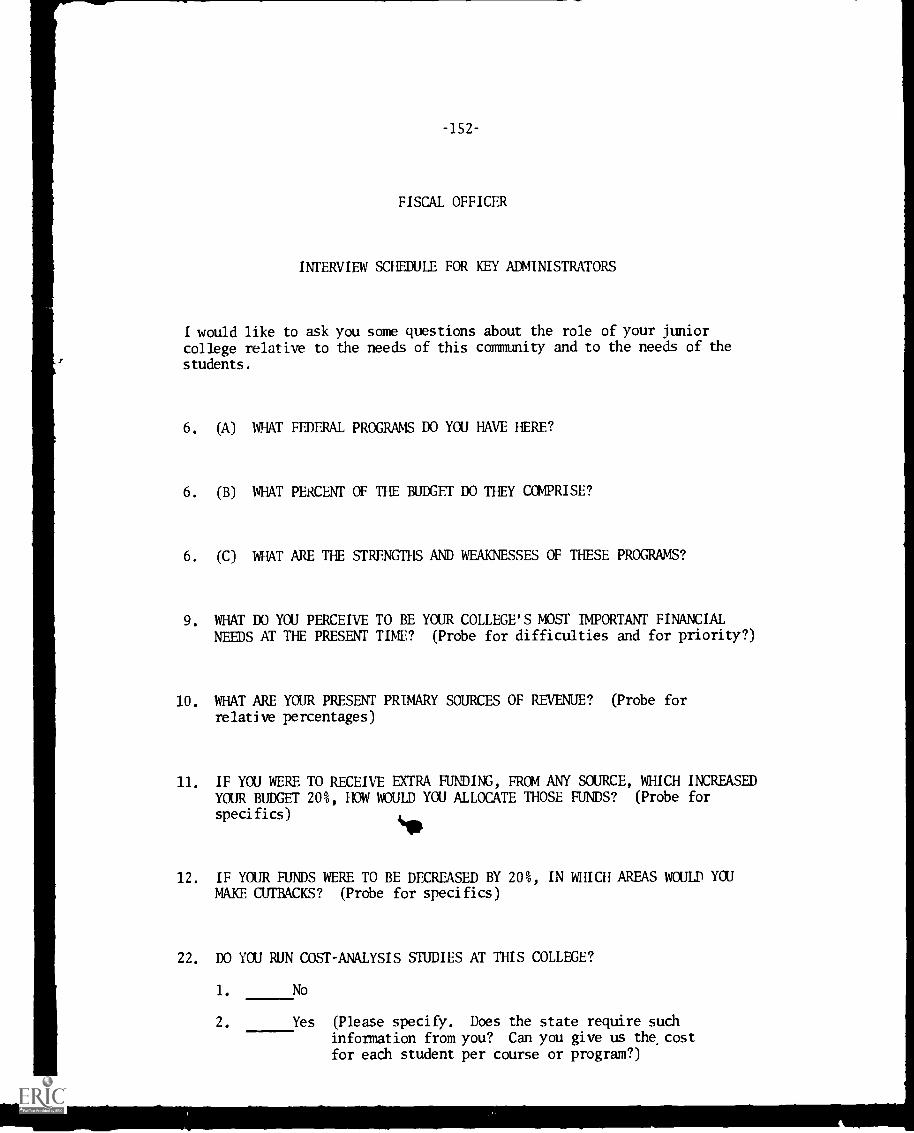
-152
FISCAL OFFICER
INTERVIEW SCHEDULE FOR KEY ADMINISTRATORS
I would like to ask you some questions about the role of your juniorcollege relative to the needs of this community and to the needs of thestudents.
6. (A) WHAT FEDERAL PROGRAMS DO YOU HAVE HERE?
6. (B) WHAT PERCENT OF THE BUDGET DO THEY COMPRISE?
6. (C) MAT ARE THE STRENGTHS AND WEAKNESSES OF THESE PROGRAMS?
9. WHAT DO YOU PERCEIVE TO BE YOUR COLLEGE'S MOST IMPORTANT FINANCIALNEEDS AT THE PRESENT TIME? (Probe for difficulties and for priority?)
10. WHAT ARE YOUR PRESENT PRIMARY SOURCES OF REVENUE? (Probe for
relative percentages)
11. IF YOU WERE TO RECEIVE EXTRA FUNDING, FROM ANY SOURCE, WHICH INCREASEDYOUR BUDGET 20%, HOW WOULD YOU ALLOCATE THOSE FUNDS? (Probe for
specifics)
12. IF YOUR FUNDS WERE TO BE DECREASED BY 20%, IN WHICH AREAS WOULD YOUMAKE CUTBACKS? (Probe for specifics)
22. DO YOU RUN COST-ANALYSIS STUDIES AT THIS COLLEGE?
1. No
2. Yes (Please specify. Does the state require such
information from you? Can you give us the costfor each student per course or program?)
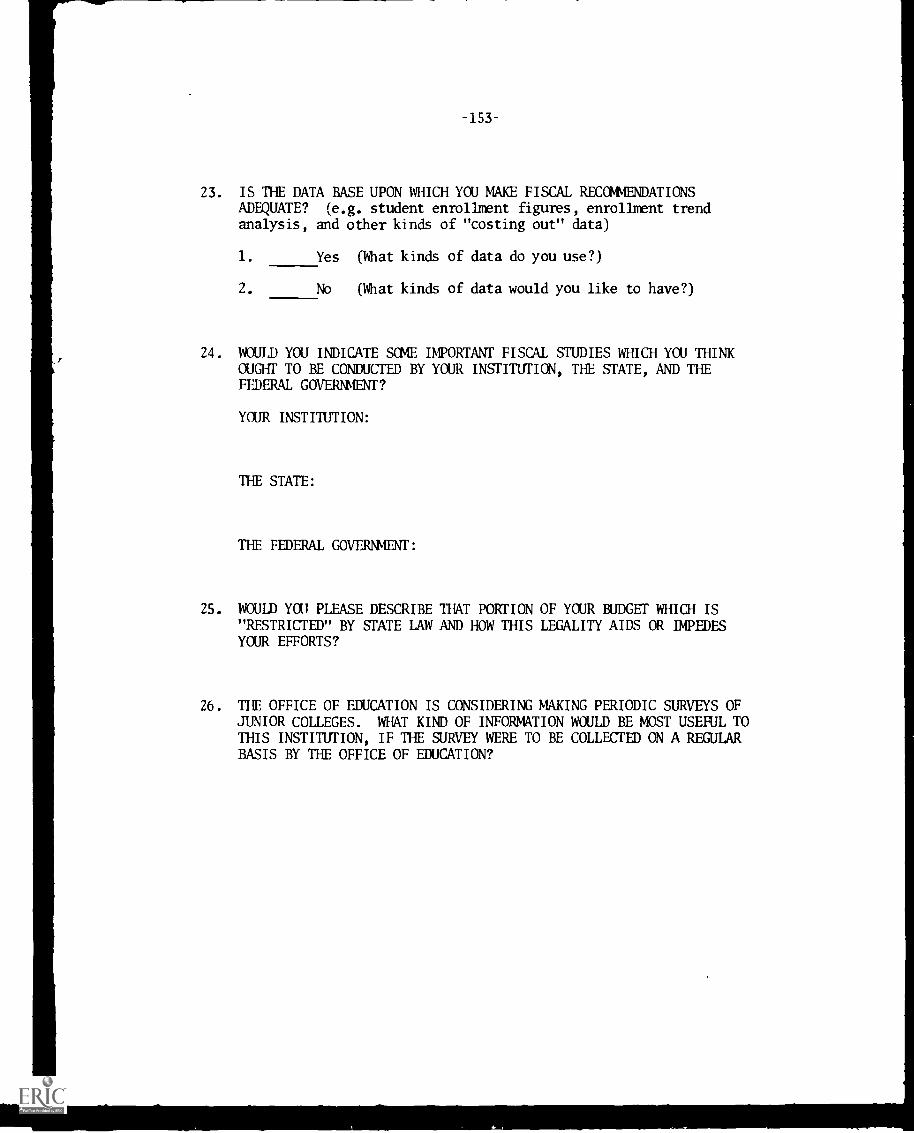
23. IS THE DATA BASE UPON WHICH YOU MAKE FISCAL RECOMMENDATIONSADEQUATE? (e.g. student enrollment figures, enrollment trendanalysis, and other kinds of "costing out" data)
1. Yes (What kinds of data do you use?)
2. No (What kinds of data would you like to have?)
24. WOULD YOU INDICATE SUE IMPORTANT FISCAL STUDIES WHICH YOU THINKOUGHT TO BE CONDUCTED BY YOUR INSTITUTION, THE STATE, AND THEFEDERAL GOVERNMENT?
YOUR INSTITUTION:
THE STATE:
THE FEDERAL GOVERMENT:
2S. WOULD WIT PLEASE DESCRIBE THAT PORTION OF YOUR BUDGET WHICH IS"RESTRICTED" BY STATE LAW AND HOW THIS LEGALITY AIDS OR IMPEDESYOUR EFFORTS?
26. THE OFFICE OF EDUCATION IS CONSIDERING MAKING PERIODIC SURVEYS OFJUNIOR COLLEGES. WHAT KIND OF INFORMATION WOULD BE MOST USEFUL TOTHIS INSTITUTION, IF THE SURVEY WERE TO BE COLLECTED ON A REGULARBASIS BY THE OFFICE OF EDUCATION?
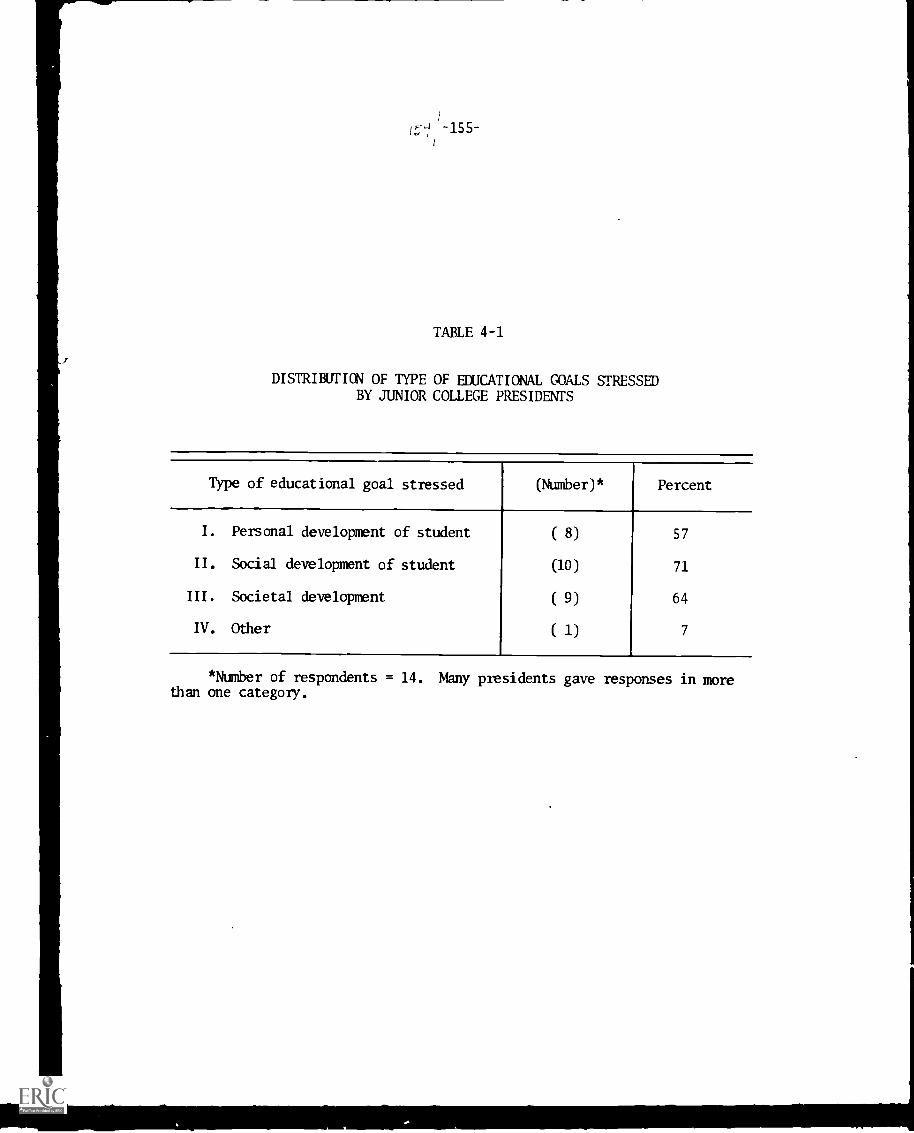
-155-
TABLE 4-1
DISTRIBUTION OF TYPE OF EDUCATIONAL GOALS STRESSEDBY JUNIOR COLLEGE PRESIDENTS
Type of educational goal stressed (Number)* Percent
I. Personal development of student ( 8) 57
II. Social development of student (10) 71
III. Societal development ( 9) 64
IV. Other ( 1) 7
*Number of respondents = 14. Many presidents gave responses in morethan one category.
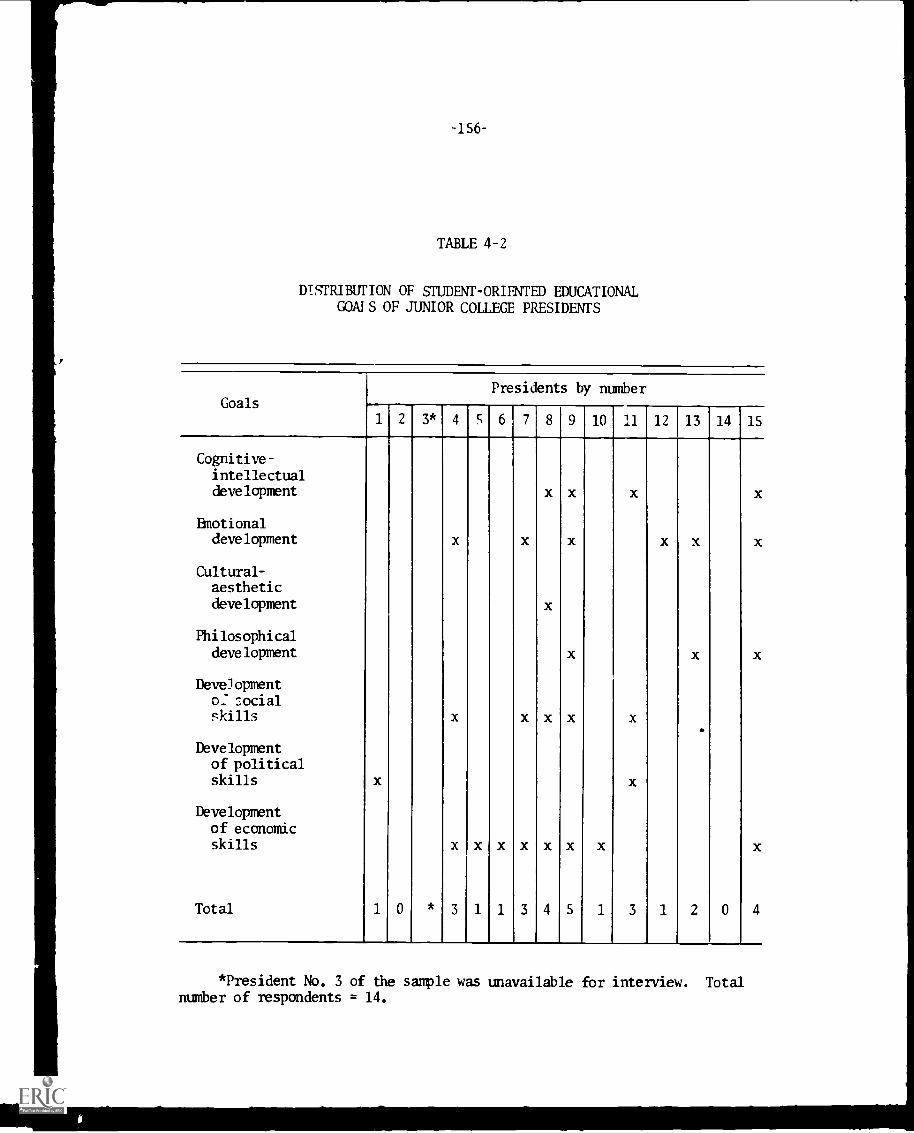
-156-
TABLE 4-2
DISTRIBUTION OF STUDENT - ORIENTED EDUCATIONALGOATS OF JUNIOR COLLEGE PRESIDENTS
GoalsPresidents by number
1 2 3* 4 6 7 8 9 10 11 12 13 14 15
Cognitive-intellectualdevelopment
Emotionaldevelopment
Cultural-aestheticdevelopment
Philosophical
development
Developmento: socialskills
Developmentof politicalskills
Developmentof economicskills
Total
x
1 0
x
x
x
3
x
1
x
1
x
x
x
3
x
x
x
x
4
x
x
x
x
x
5
x
1
x
x
x
3
x
1
x
x
2 0
x
x
4
*President No. 3 of the sample was unavailable for interview. Totalnumber of respondents = 14.
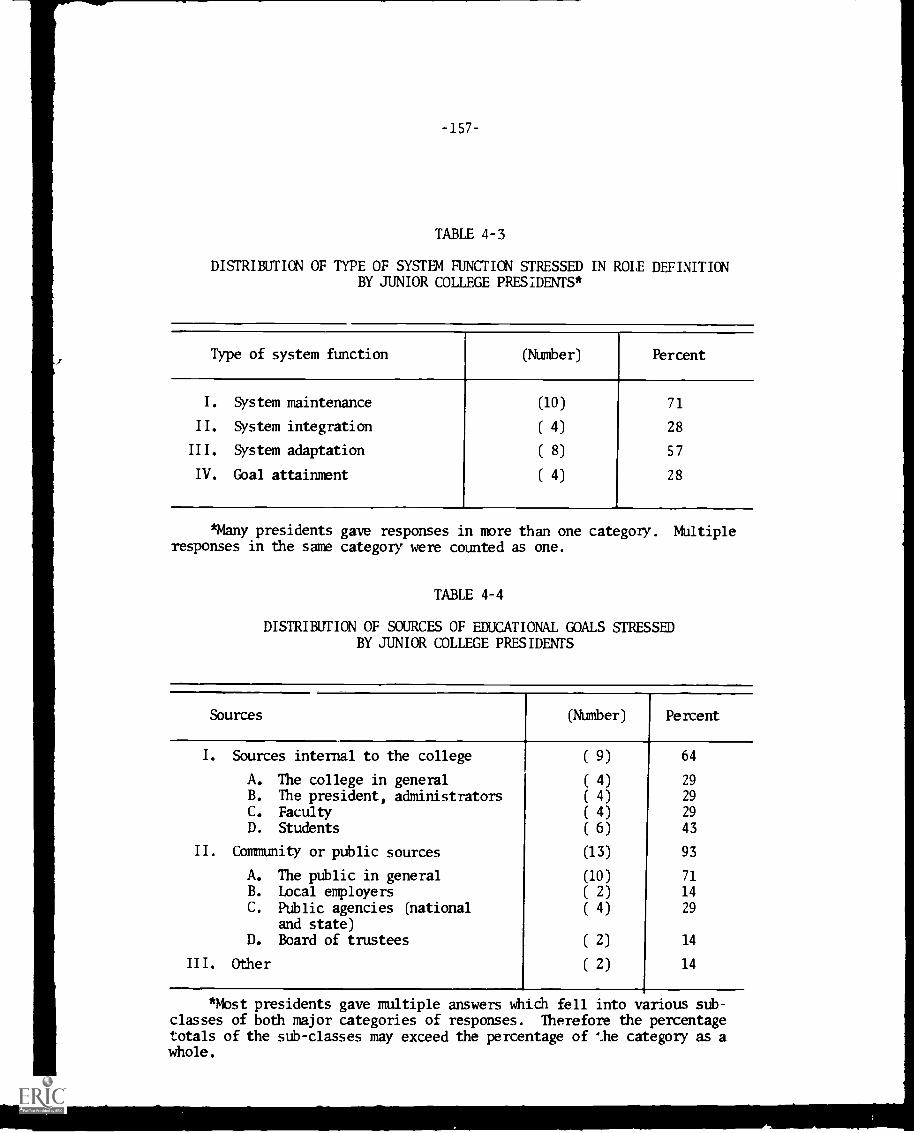
-157-
TABLE 4-3
DISTRIBUTION OF TYPE OF SYSTEM FUNCTION STRESSED IN ROLE DEFINITIONBY JUNIOR COLLEGE PRESIDENTS*
Type of system function (Number) Percent
I. System maintenance (10) 71
II. System integration ( 4) 28
III. System adaptation ( 8) 57
IV. Goal attainment ( 4) 28
*Many presidents gave responses in more than one category. Multipleresponses in the same category were counted as one.
TABLE 4-4
DISTRIBUTION OF SOURCES OF EDUCATIONAL GOALS STRESSEDBY JUNIOR COLLEGE PRESIDENTS
Sources (Number) Percent
I. Sources internal to the college
A. The college in generalB. The president, administratorsC. FacultyD. Students
( 9)
( 4)
( 4)
( 4)
( 6)
64
29
29
29
43
II. Community or public sources (13) 93
A. The public in general (10) 71
B. Local employers ( 2) 14
C. Public agencies (nationaland state)
( 4) 29
D. Board of trustees ( 2) 14
III. Other ( 2) 14
*Most presidents gave multiple answers which fell into various sub-classes of both major categories of responses. Therefore the percentagetotals of the sub-classes may exceed the percentage of the category as awhole.
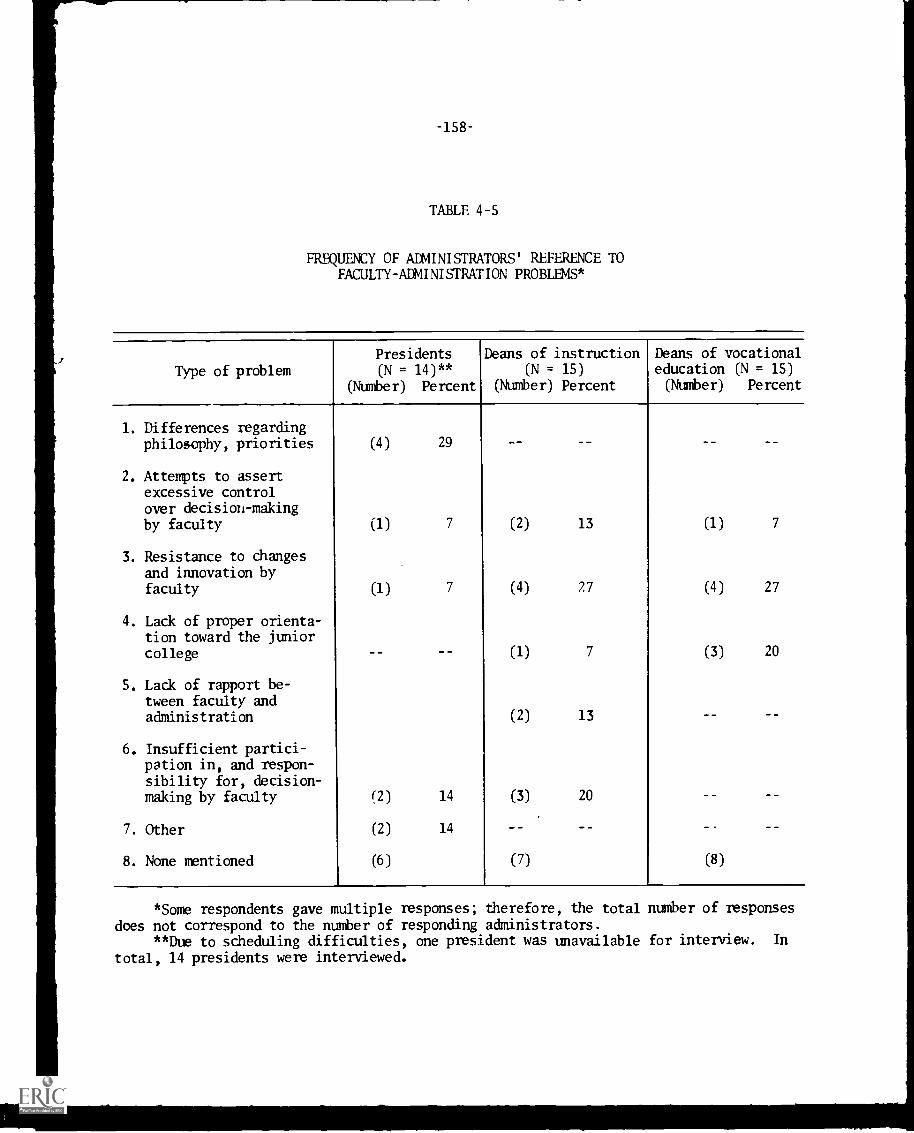
TABLE 4-5
FREQUENCY OF ADMINISTRATORS' REFERENCE TOFACULTY-ADMINISTRATION PROBLEMS*
Type of problem
Presidents(N = 14)**
(Number) Percent
Deans of instruction(N = 15)
(Number) Percent
Deans of vocationaleducation (N = 15)(Number) Percent
1. Differences regardingphilosophy, priorities (4) 29 -- --
2. Attempts to assertexcessive controlover decision-makingby faculty (1) 7 (2) 13 (1) 7
3. Resistance to changesand innovation byfaculty (1) 7 (4) 27 (4) 27
4. Lack of proper orienta-tion toward the juniorcollege -- (1) 7 (3) 20
S. Lack of rapport be-tween faculty andadministration (2) 13 --
6. Insufficient partici-pation in, and respon-sibility for, decision-making by faculty (2) 14 (3) 20
7. Other (2) 14
8. None mentioned (6) (7) (8)
*Some respondents gave multiple responses; therefore, the total number of responsesdoes not correspond to the number of responding administrators.
**Due to scheduling difficulties, one president was unavailable for interview. In
total, 14 presidents were interviewed.
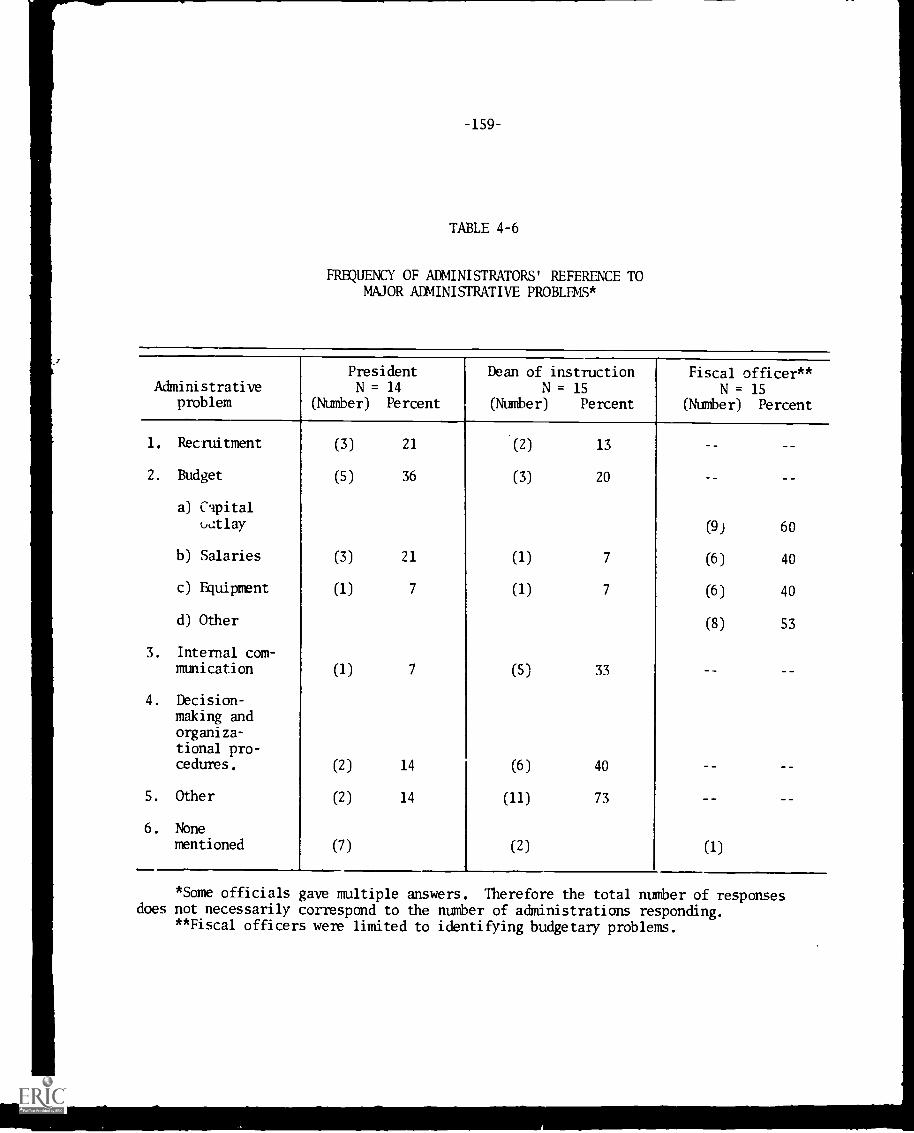
-159-
TABLE 4-6
FREQUENCY OF ADMINISTRATORS' REFERENCE TOMAJOR ADMINISTRATIVE PROBLEMS*
Administrativeproblem
PresidentN = 14
(Number) Percent
Dean of instructionN = 15
(Number) Percent
Fiscal officer**N = 15
(Number) Percent
1. Recruitment (3) 21 (2) 13
2. Budget
a) Capital
(5) 36 (3) 20
outlay (9) 60
b) Salaries (3) 21 (1) 7 (6) 40
c) Equipment (1) 7 (1) 7 (6) 40
d) Other(8) 53
3. Internal com-munication (1) 7 (5) 33
4. Decision-making andorganiza-tional pro-cedures. (2) 14 (6) 40 --
S. Other (2) 14 (11) 73 --
6. Nonementioned (7) (2) (1)
*Some officials gave multiple answers. Therefore the total number of responsesdoes not necessarily correspond to the number of administrations responding.
**Fiscal officers were limited to identifying budgetary problems.
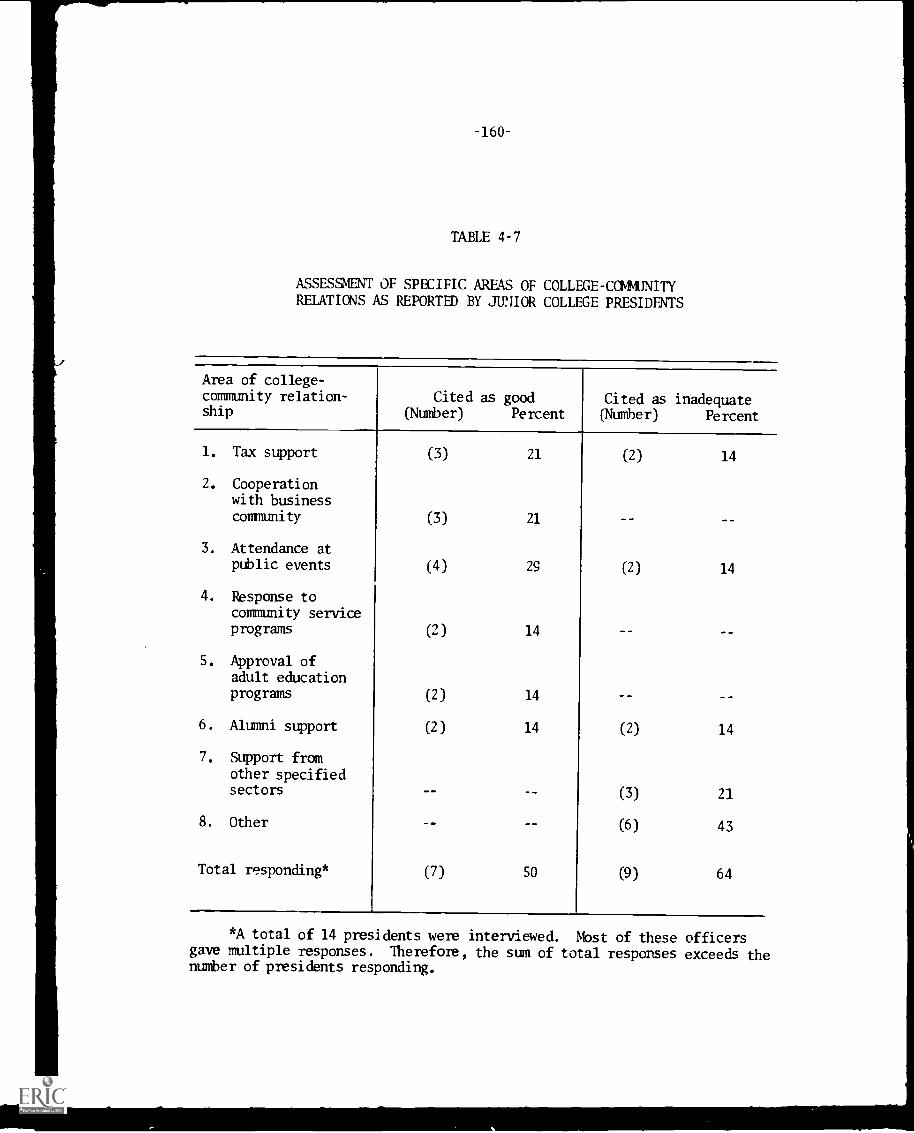
-160-
TABLE 4-7
ASSESSMENT OF SPECIFIC AREAS OF COLLEGE-COMMUNITYRELATIONS AS REPORTED BY JUNIOR COLLEGE PRESIDENTS
Area of college-community relation-ship
Cited as good(Number) Percent
Cited as inadequate(Number) Percent
1. Tax support (3) 21 (2) 14
2. Cooperationwith businesscommunity (3) 21
3. Attendance atpublic events (4) 29 (2) 14
4. Response tocommunity serviceprograms (2) 14
5. Approval ofadult educationprograms (2) 14
6. Alumni support (2) 14 (2) 14
7. Support fromother specifiedsectors (3) 21
8. Other (6) 43
Total responding* (7) 50 (9) 64
*A total of 14 presidents were interviewed. Most of these officersgave multiple responses. Therefore, the sum of total responses exceeds thenumber of presidents responding.
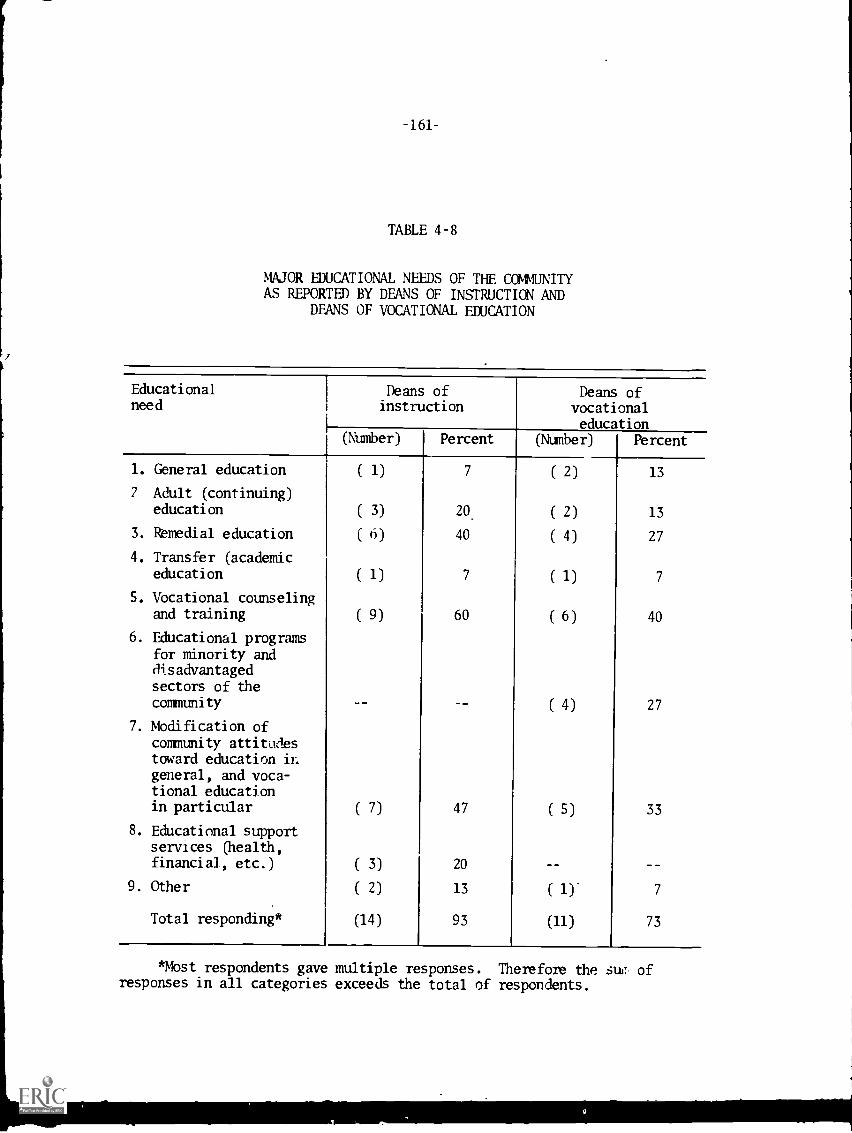
-161-
TABLE 4-8
MAJOR EDUCATIONAL NEEDS OF THE COMMUNITYAS REPORTED BY DEANS OF INSTRUCTION AND
DEANS OF VOCATIONAL EDUCATION
Educationalneed
1. General education
7 Adult (continuing)education
3. Remedial education
4. Transfer (academiceducation
5. Vocational counselingand training
6. Educational programsfor minority anddisadvantaged
sectors of thecommunity
7. Modification ofcommunity attitudestoward education ingeneral, and voca-tional educationin particular
8. Educational supportservices (health,financial, etc.)
9. Other
Total responding*
Deans ofinstruction
L
Deans ofvocationaleducation
(Number) Percent (Number) Percent
( 1) 7 (2) 13
( 3) 20. ( 2) 13
( 6) 40 ( 4) 27
( 1) 7 ( 1) 7
( 9) 60 ( 6) 40
( 4) 27
( 7) 47 (5) 33
( 3) 20
( 2) 13 ( 1 )- 7
(14) 93 (11) 73
*Most respondents gave multiple responses. Therefore the sw: ofresponses in all categories exceeds the total of respondents.
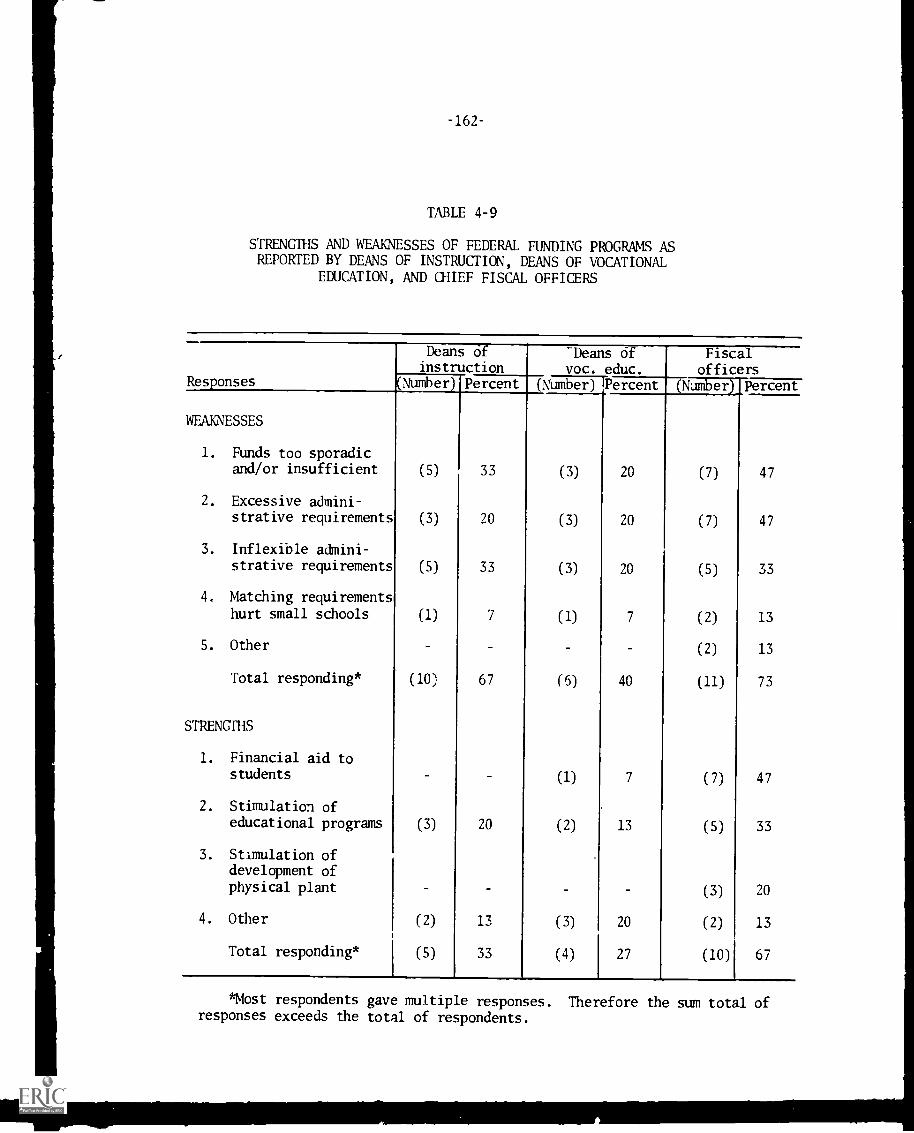
TABLE 4-9
STRENGTHS AND WEAKNESSES OF FEDERAL FUNDING PROGRAMS ASREPORTED BY DEANS OF INSTRUCTION, DEANS OF VOCATIONAL
EDUCATION, AND CHIEF FISCAL OFFICERS
Responses
Deans Ofinstruction
Deans 6fvoc. educ.
Fiscalofficers
(Number) Percent ('umber) Percent (Numberl_Percent
WEAKNESSES
1. Funds too sporadicand/or insufficient (5) 33 (3) 20 (7) 47
2. Excessive admini-strative requirements (3) 20 (3) 20 (7) 47
3. Inflexible admini-strative requirements (5) 33 (3) 20 (5) 33
4. Matching requirementshurt small schools (1) 7 (1) 7 (2) 13
5. Other (2) 13
Total responding* (10) 67 (6) 40 (11) 73
STRENGMS
1. Financial aid tostudents - (1) 7 (7) 47
2. Stimulation ofeducational programs (3) 20 (2) 13 (5) 33
3. Stimulation ofdevelopment ofphysical plant - (3) 20
4. Other (2) 13 (3) 20 (2) 13
Total responding* (5) 33 (4) 27 (10) 67
*Most respondents gave multiple responses. Therefore the sum total ofresponses exceeds the total of respondents.
APPENDIX C
STUDENT MARGINAL DATA
AND
TABLES ID CHAPTER 5
O.M.A. No. 51S71038EAPPROVAL EXPIRES 6-30-72
THE STUDY OF
JUNIOR COLLEGES
STUDENT QUESTIONNAIRE
MARGINALS
and
% Missing Observations (in Parentheses)
Center for the Study of Fvaluation
Graduate School of Education
University of California, Los Angeles
Office of Education Contract No. 0-70-4795OF FORM 2337-3, 11/71
I).
,I4 -167-
i n 7.11 n, , 1;1 l 11 1 11111011V 1 1, '1 1
1 1 1 , 2 1 n r I n . T . l ' r . , , I .1 Itl t h`r 1 ,11.OW rat t It III 11 t 11 t r 1 11 ' V It III 1 Itti, 1 III..
'II. I \ 1 I 4, tI,,; ()III I '1..1 .10f t II,
1 '1111 17 I1I T. t
1-,
I. I)
r.
Lir
,` chi , I It 711.1
TI t1 It ro. t i7 n t4, utt t, .1 t .
, ,' 1, irn I ,rn fin tv,cave
e a g
5 .
.1 1
late t esi-le, a 'e, /, 1 1't V
,1 ,I11
e
I s 'f/ 1-e.,Ponci pal Invest gat or

-168-
PostageWill Be Paid
byAddressee
NoPostage Stamp
NecessaryIf Nailed In the
United States
[BUSINESS REPLY CARDFirst Clou Permit No. 16046, Los Angelis, California
UNIVERSITY OF CALIFORNIATHE STUDY OF JUNIOR COLLEGESMOORE HALL 145
LOS ANGELES, CALIFORNIA 90024
When you have Lompleted and returned chi, questionnaire . pleaNe returnthi', poNrcard in a Neparate ma.lin,:. PleaNt also write your name andschool in the '.pace below.
liv so doing. %tit, allow bs to kni,w who haN returned que%tionnaireN w hilepreserving the Num anum miry of the que%tionnages themselves.
Name
school
7 hank you

"...M.,-
-109-
YOUR GENERAL BACKGROUND
' II ", I I - III, 's 1 ' I 1 ,,I I ill II .1()I , ,1 I i I 'kill I 1 ,,,i: N1,1 i N._
I()I I I I,
I,. --- I I ',
16-19=39% 24-29=19%,, ,, !
, ar23=27)%_ 30-38=12%
58 2 _42; ', (1) *
39-66=7%
I I I 'C 6, "
----- \I. \ IIi \" ,1 I,
I I I .1 . 11 I ! ' t ' I I , , I' , ; s I I I : - i I' t III i'''''' ' !I', 1, I'( n\-11"i I, I'' ,i1 1,11 I' 111)',11 kiill ' 1 ' t bt I' III, II ,, liCHII\\I' k I I ,', ,I \ I I
, . I \ I t ,I r I 1
I. '1;
. ''.1 \ I I i I l l 1 , 1 I )\t \ , ,I ill
/ \ IC\I ( d ( ,I 'I ., di 's I I: \
(al 40,,le in IL) At PresentNigh Schoo!
25
*Parentheses indicate missing data.
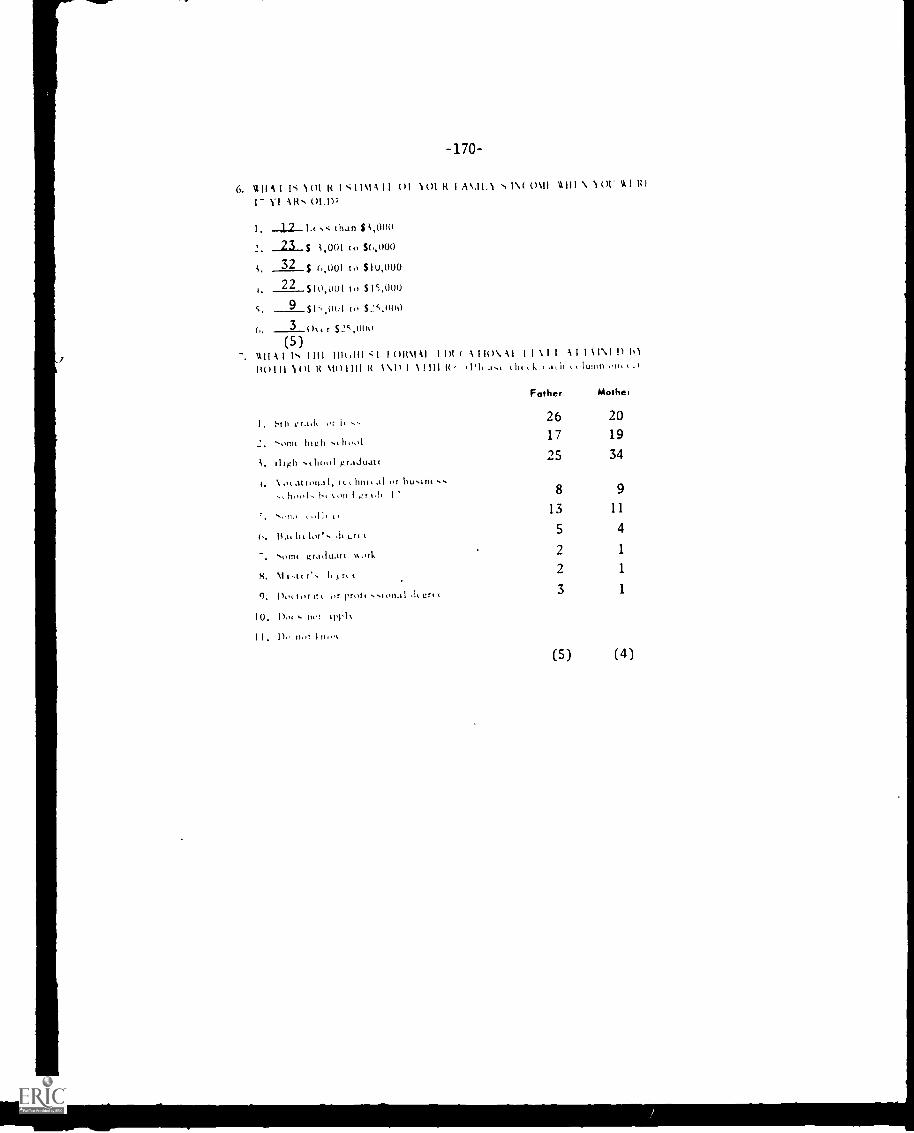
6. 11111 IS K I IIMA II ()I NMI- VI 112 01.1),
1. _12_1 c,.: than Si,(100
' 23s i,001 t., $6,00032 s 6,001 siu,000
22 sio,utH to SIS,000
9 sl-,,t)01 to s.:c,otio
(, 3 ()\, r(5)
-170-
K I A \.11.1 0111 1l III \ ()1' 11I III
IN 1111 111(111:1 11)1(\l11 11)1( -1 110\ -11 II \I I 11 I11\1 I) IllKM II 101 It \WI III It \\I) I 11111 its ILttl
Father Mothei
I. titn er.t.i. ,1-26 20
2. wx high ool 17 19
i.
;.
11101 g r.tduat
oc at I on. I, tt Imi. al or
25 34
%,,/) I 4.!1'1,1(8 9
,11,, )/J, 13 11
6. JIM /It /or', ,It },r, 5 4
Norm g ra .1 u. tt %ork 2 1
S. 111.1/ it e, ft 2 1
Q. Doi for It. or ',rot( ,s1011,11 414. grt 3 1
10. Doc ffo:
I I. fl.Jf
(5) (4)
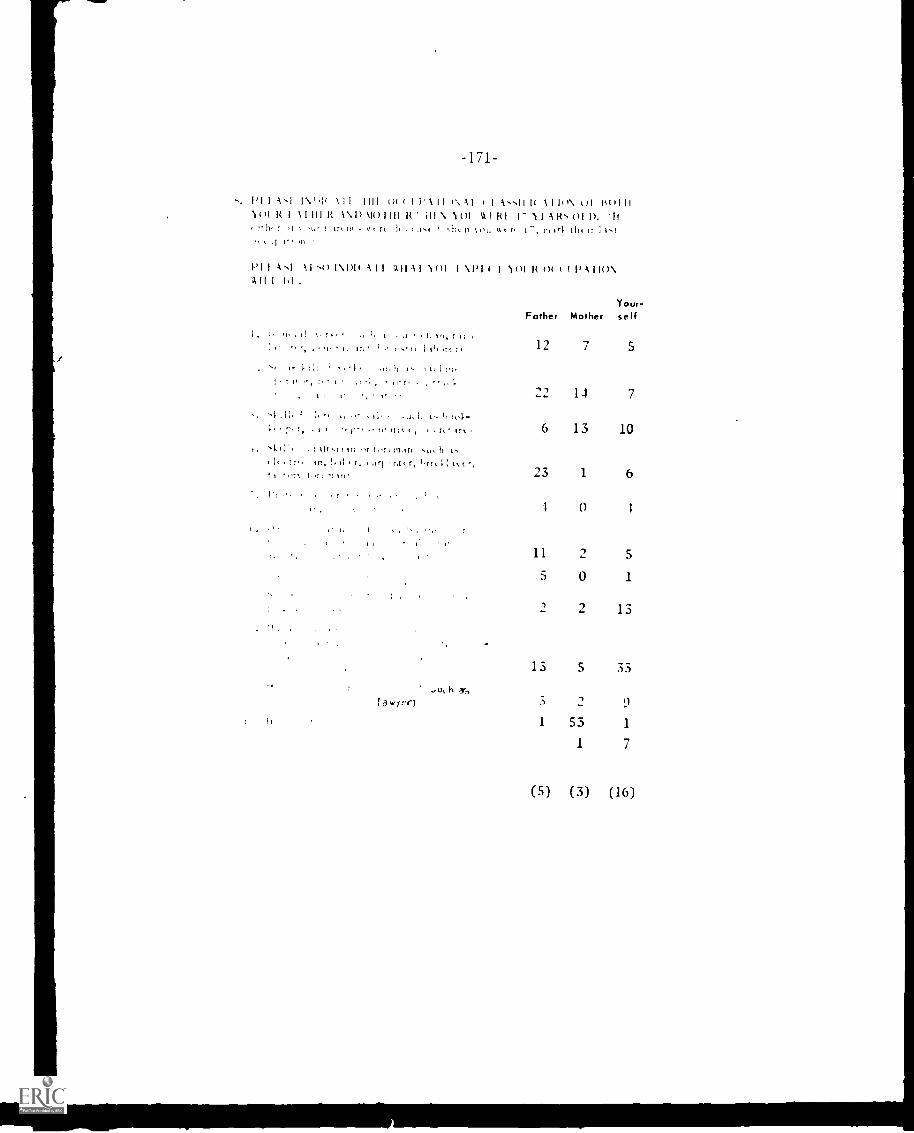
-171-
1 A'1 ,14 111 1111 1.)( j, )'.Al (1 A.-,11 It \ I It 1N, ()I It( CI ll
H 1 1 1 1 1 1 II V \ I ) \ 1 0 1 1 1 1 H i l l N . 1( ) I 1 1 1 1 ( 1 l I A1-t' 1), 'Itr I Jr( t ft it Ast I ',lit fl SOLI Alp 1 01, tilt lf i I...I
A -,I ,1) 1\1)1( AI I Ali Al \ (It I \PI( 1 1(1I 1.1, (CC 1 13 A 110\all 1 1+1.
.
.1 t. 1 ' 1 I 1 ;
Father MotherYour-self
,
It1. 12 7
1;,;1 l I-11 14 7
; 1g -
1
r tit ...TIM of
I ' 11,11 1,n I t i t t
1111f1 It
Ift 1
Is
6 13 10
c IC t I r. In, r, nrl m r, 1r!L : t,(23 1
1 (1
6
11
S 0 1
2 13
h 4';
13 5 33
3 er) 9
1 53 1
1 7
(5) (3) (16)
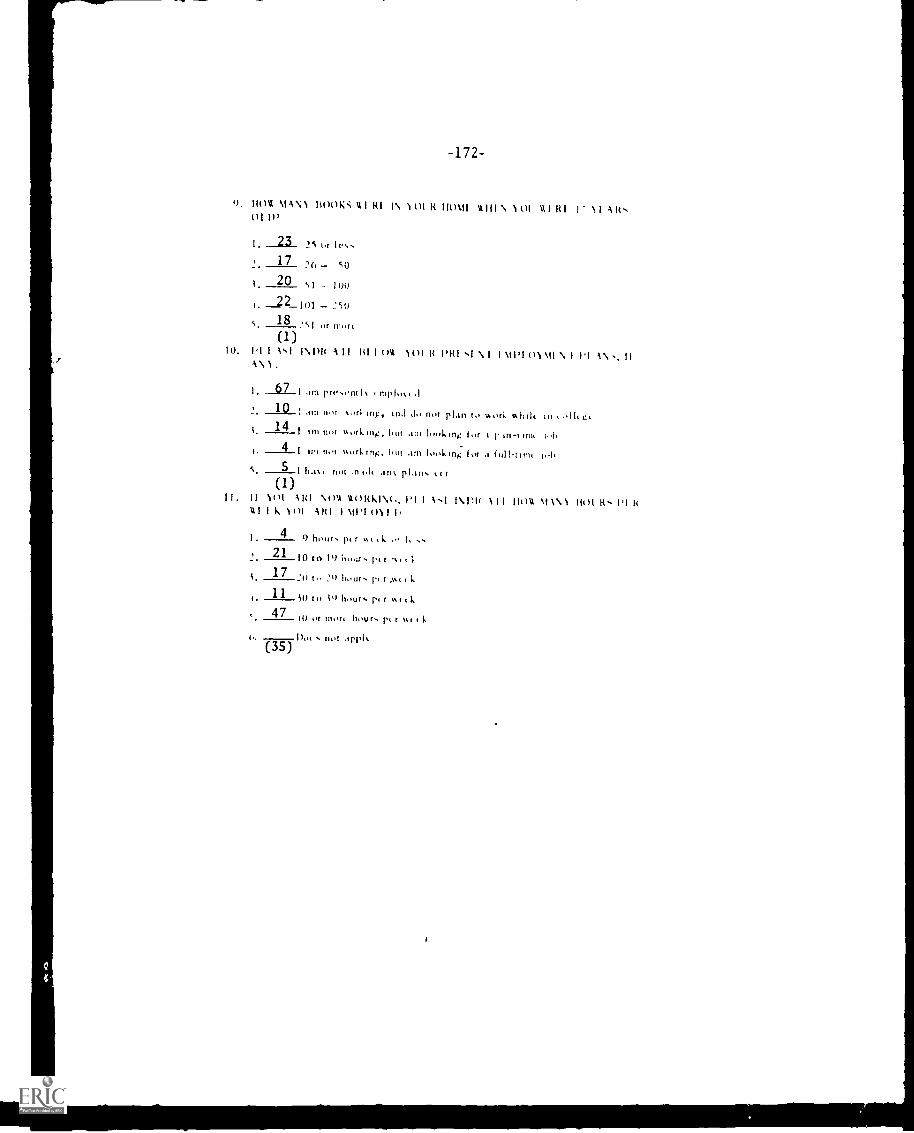
-172-
1111V \IAN lit)()K I\ 101 It 11011 AIII \ 101 Al RI 11 A It
21 25 or les.17 26 co
), 20 too
2`,()
18 I or Mort(1)
to. Ii I A`,1 1\1)1( A II RI I ()% 101 It PRI 1 \ I I t)) \\ , liA \ 1.
I. -10-7-1 urn preent mph°. t
10 I111 ii %orl trty, in,' not plan to ,...ork %hilt. ini. 14 I tin not %ork but ant Iooktng for t
t. 41 WI not %%olio ng, Out Looking 111 .1 i,ts. 5 1 It rt trot .n I.tt ant, plans
(1)II. II WI AI:1 \WA A1)1(11\lt, 1'1 I A.-4 I\ PP AI I 110A Nt 1111
Al 1 K 11)1 Alt1 I AIN ()11 it
I. 4 0 hour, pit 0. It
21 to to It) itour. pt r.ut t 1.
17 T.. 29 hour.. ,tAt t 1.
11 io to 10 hour% pt r at t
10 or 111Ort hour, pi r tit t
Dot 110I Aritit(35)
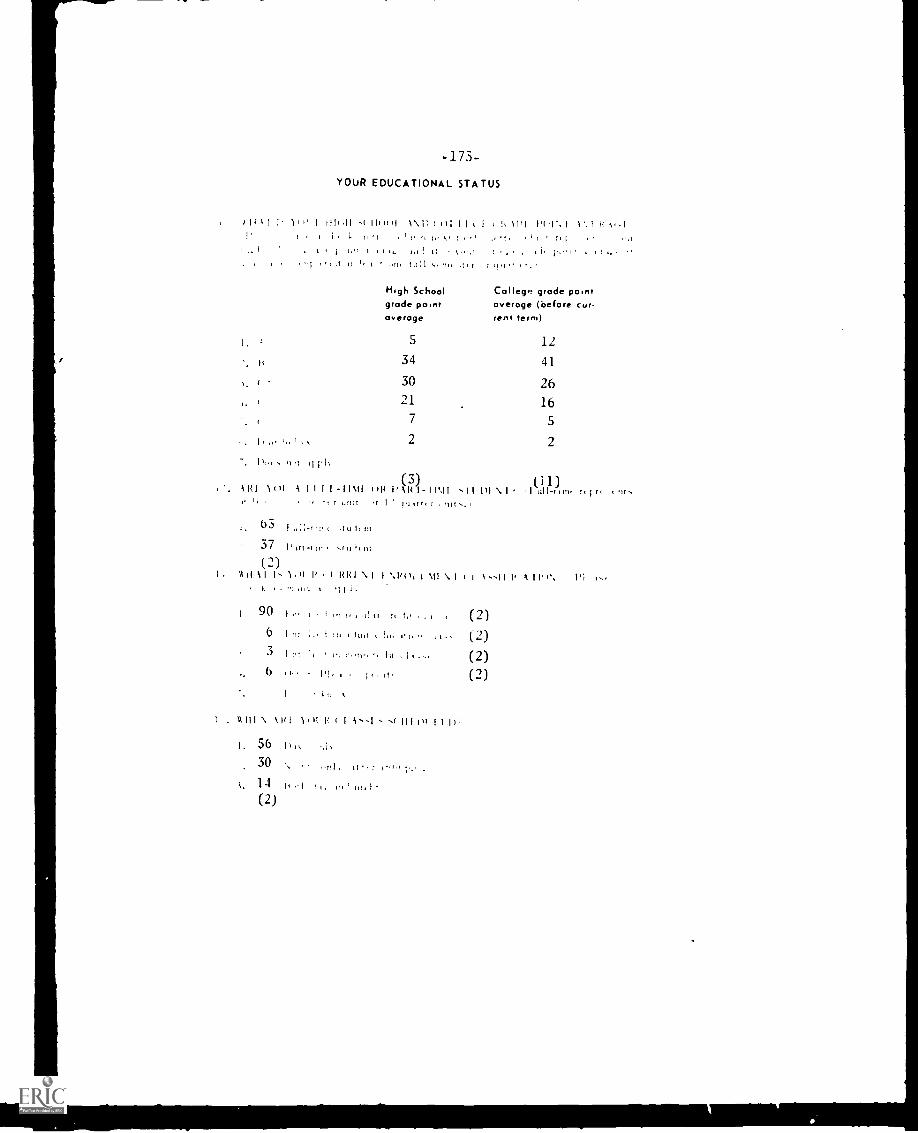
-173YOUR EDUCATIONAL STATUS
4..
II \ I
I
Is
( '
,.
,
ARI
I
(/1
l
A
I ills
'II 1 a I,
I \
IIII
II( )1 ( ()I I I ( I
t .1), 1.111 ,,r
High Schoolgrade pointaverage
5
34
30
21
7
2
(3)tilt I. Alt -II
i L \ I I I II% I \ I. I I
.11
r .College grade pointaverage (before cur-rent term)
12
41
26
16
5
2
(11)\ I
63
I I r<r i.nu If I 1,1 Ott I 'III,.
-Ill I, III
37 irt,:r I II
(2)kit I I )4 14 1 RR! N.1 %it \ I 44 A I I' 1`.. I'i
I. .11 I
90 1 t, , .111r r, (2)6 in: I., i III i 1/1I I. i - (2)3 . (2)6 ' I,1,
I I It` (2)I 1.11
I IA III N. API I i-.1 III 01 I I IF
I. 56 14,, 44,
. 30 %, it, ri. 14 Is , I 1. u, ' nu I
(2)
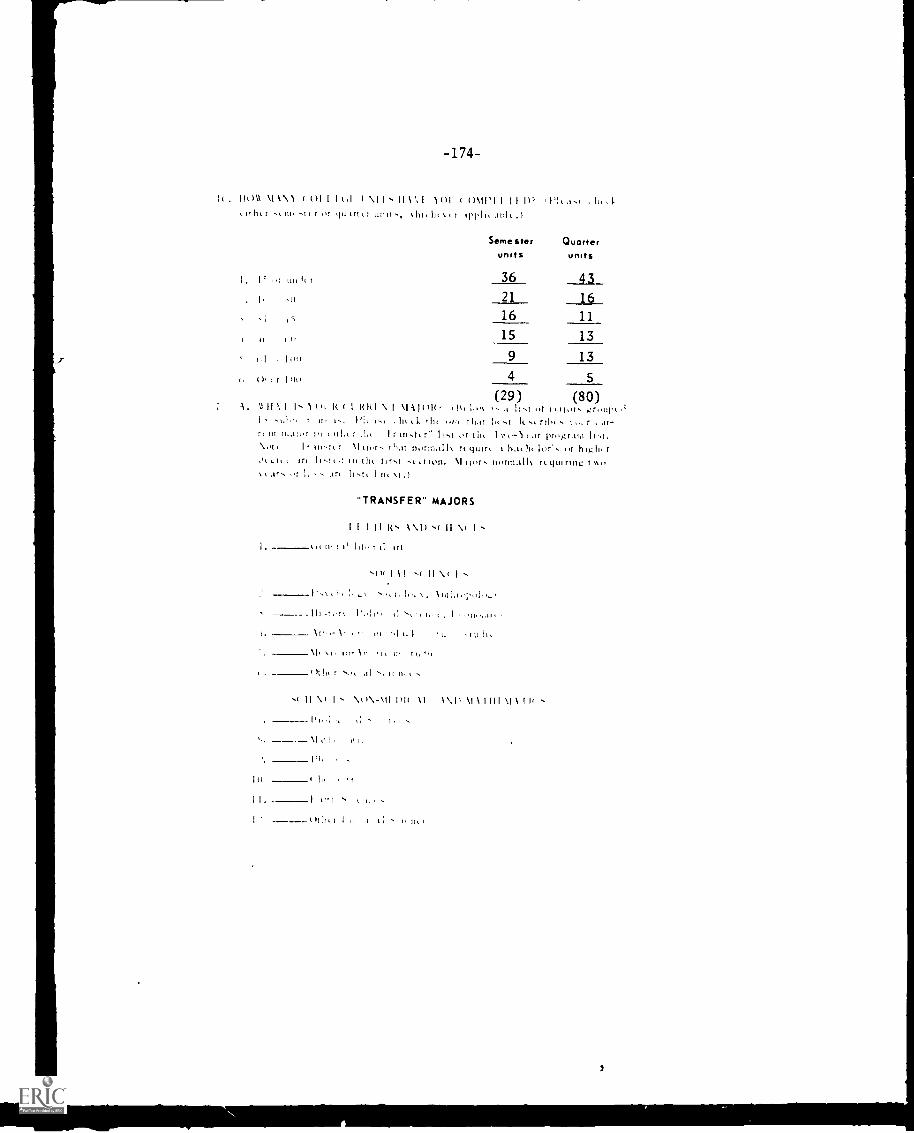
-.174-
I( . 111)\\ At \\,) I ()I I 1 (,1 1 \ 11, 111 `, I AM I ()\11'1 1 11 1); 'Ph ,t.t ,11,Irh,r ni, r or ,1,1 trtk r ,11111,, 111.11,, r
I 1111 It r
, i
1 II,
-
lt r
1 A.
Semester Quarterunits units
36 4321 1616 11
15 13
9 13
4 5
(29) (80)I- (.% I', I I I<1<I \ 1 AIA1M(' ,1i, 11,1)0r. gl411:1l .1
If I'i, I, k.1., 't 1( NI rib, r , ka-rt iit 1,) 111,1 t10 I r r" IINt or tilt I prt9zr.itil\ tit t 1r %111,,r. ttt.it normalk ri quirt i 11.1,dit. ,r high, r
t to 11-itti,i in th, tirst (,.I1011. ilor nortn.ilk r(4111rIng t.,t AT, or I. 'it art 11-.1, III, M.t
"TRANSFER" MAJORS
1 1 1 11 10, \ \I) .1 11 \I 1 -
10 T f! 4rt
,i)( 111 '-I II \I 1
t: t,, I ,
\Pitt- 1, a.
. ii' , ,I h h, r Not .11 -, it lit
I 11 \I 1, \()\-\11 ItII
141-; ,;
11 \\II A111111 A11111
lit
I 1 t it 1,
I 1 I i p It 11,
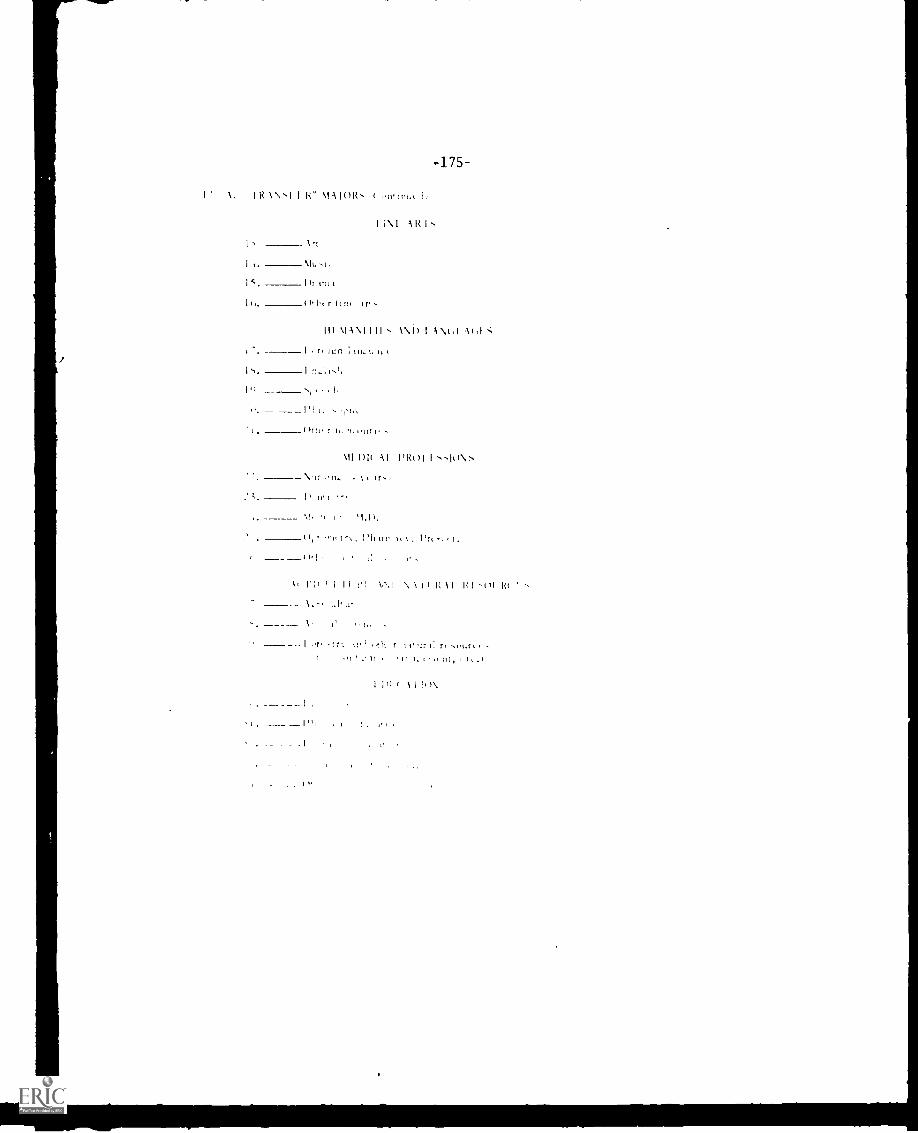
I \. I It \ "-I I I<" \I it 1(11t, ,( I,
I
Dr in:
(,. r 1111,
475-
AR!,
III \I 1\ I III 1\ I) I -;
I n.,11,1,
It IliiIlt I
1)11 .11 ITOI I -10\
I -\I I '1.1).
( ) ,1 , 1 r\, l'h , l'rt .,
1, I' I, I I, \ilk \I
1 ,,I
_ I -t r.. ,,th r v r,
I VIIII )\
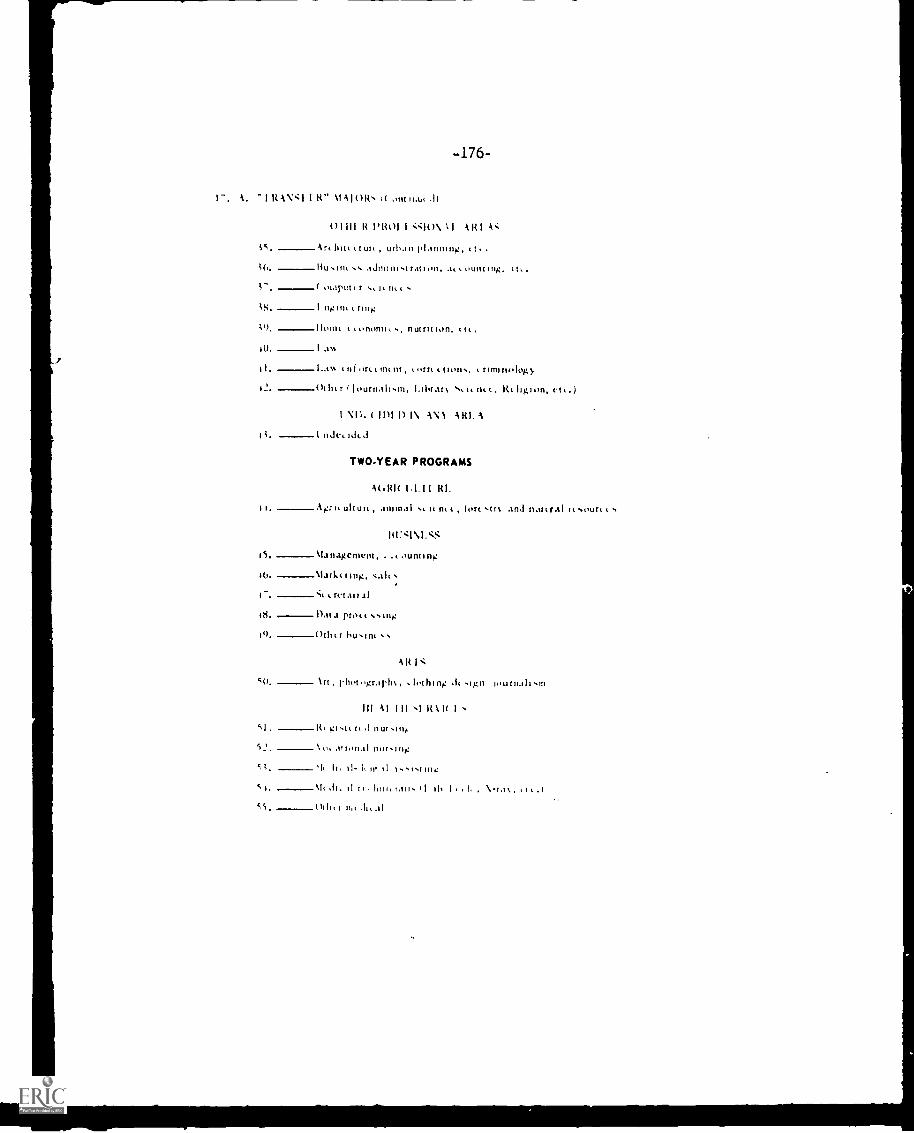
-176-
I-. A. I It ANSI I R" A 10R. .( .11
01 III It l'1201 1 4..:)0\ \I
i5. At, hitt ur, , urban planning, Et..
admim (MI on, a.. oUllf ifig. (t..( r
;/.; I of lin I tilit
lint tononlik nutrition, t t,,
10. I tic
I. I in t tif inc.( int nt im"ft (ions, tnmtnology
12. Otht r owl-1.111in, 1.11-11".11" **,1, JUL, ligion,
I \ !DI I) I\ AN1 x121.4
nJeL idcd
TWO-YEAR PROGRAMS
Atiltlt 1,1.11 RI.
Ag-iL ult UR , , lot( strt and natl. ral r..oun t s
\I.SS
IS. Management, ..o.ounting
Mark( ling, salt
ctetaitil
#8. I) Ica proi,t %sing
(Wit
50.
AR IS
In rho( ''gral'11% lothing ,it
III 41 III R \ 1
SI . nur,111).
52. .1th,(1.11 11111,1I1S
`I, 11, 11-i,
5 t, Al, It tan, II tb I , I, . \55, Ot11,1 n,,,h.al
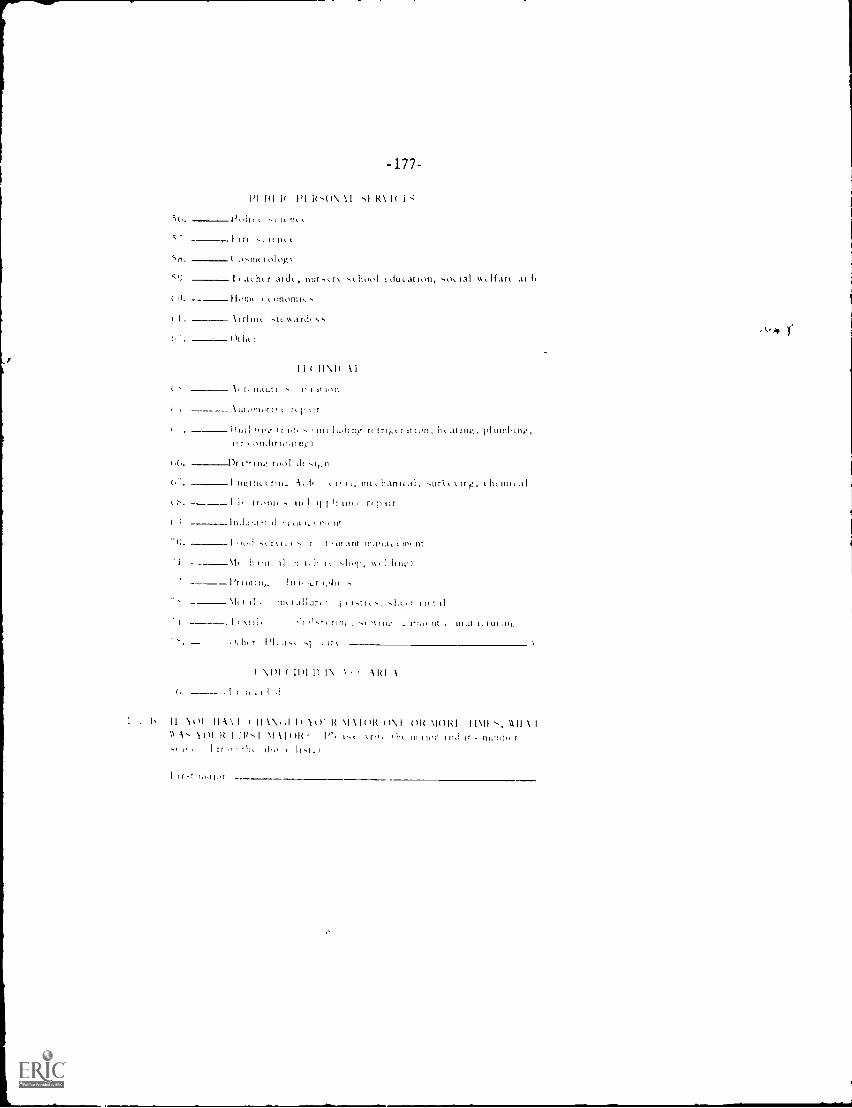
Sm.
tc
t I
'
-177-
1,1 I t i lc R.0\ I .1 R\ I( 1
1)011/.
I trr .( /.tnt t olow
1, tthtr atilt, nur,IN ,11001 t du,. at ton,
I OWL t ,(100111
Itilllt
(It ht.!
II ( 11\1( \I\t r. 11,1 o r I I' I tt 1,,t1
-.001. 1 AI
\ut,,n//11, 1 11 ttr
1( utl nne or ti/ intIutitn r tr1,, n ton. it( utnInne,or 0011.11tiolno
I)r 0,11)4 t.wl 011 it,n
I twin,. o rn_ 4 1t , r 1,, int ,11.1r11..t1, ho on, 31
( 1 1 , t r / 1 1 : , . u. I /pi It Ink rt tir
( t In in, tI tr t, nt
I ,,,,1 .t r t. It t r 'III tt 111 Ilt nt
\it II 1,11, tl It, It I, t o vo
l'r int In, 1 tt t,,111
\11 t tl not I.; .11o, 1x111
I
________ I / \t11/ .11 /I./ t `0 IIt 1111111,1101 11,1.
. htI 111. ttl tttt
\ ( 1111 I) 1\ \ 1111 \
1 . IN. II 1(11 111 \ 1 ( 111\.,111101 It \1111)1t (1\1 ()It \l()Itl 11\11,, 1111\1\\ As 1()1 H I IP`, 1 \I 11( I'l 1. 111,, tIl in ii//r miki it monl, r
1 tr 1110 1p.t.1
1(-;
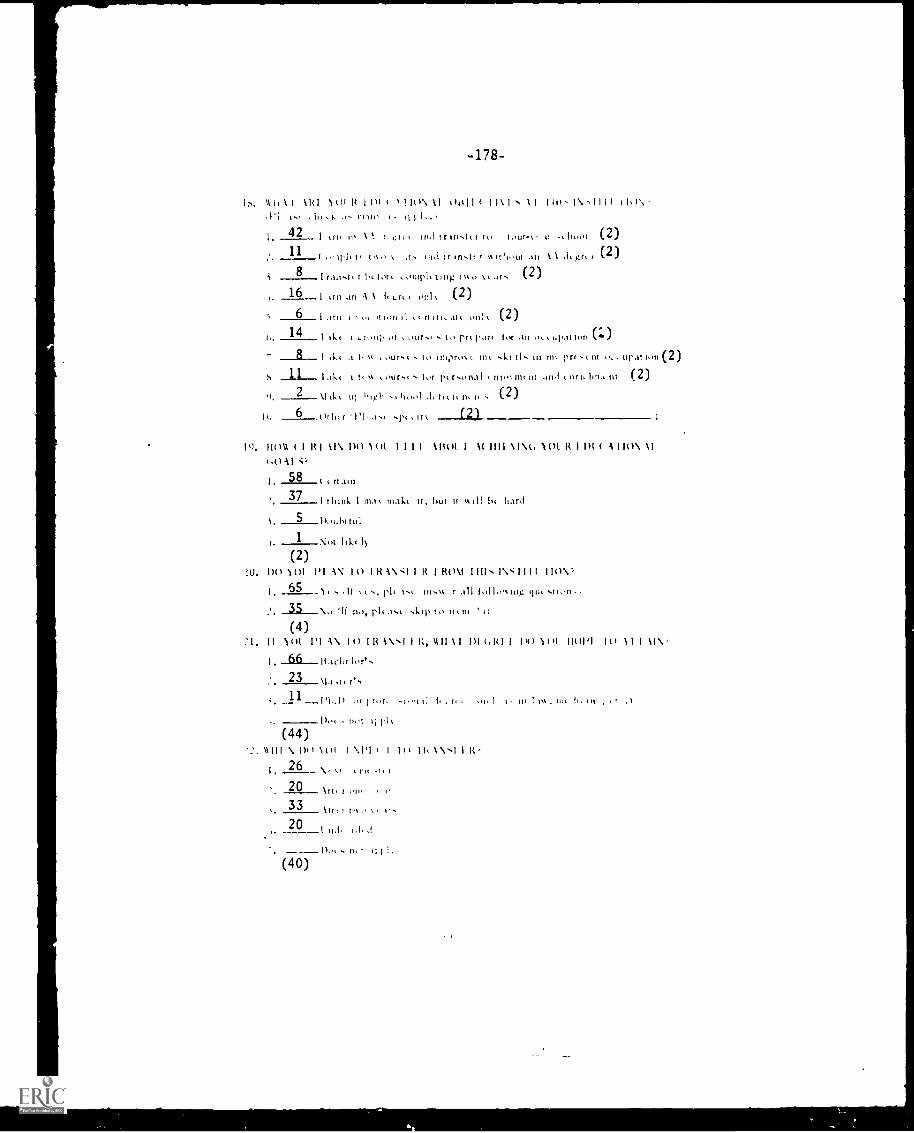
-178-
'III \I \RI WI It 11111 MO\ \I 'Hill 11\1..11,IN iii I"
1. 42 I tril to \ oil tr 10,1(1 to toms -u V bout (2)11
,:t,
1 " tn.tt , (2)
8 Irui.tirh tot( tonthlttini.;Iwottat (2)16 , ,r -\ It L \ (2)
6
.iii
I WI o, illoti ft III, t on (2)14 I tkt t Li,,up ut , our., . t,, prt pant for an ut t 111,M Ion (Z)
in (2)I oUr,t to tn,t ru. t 111 ll ill tiu rrt t tit oft Ural
11 I Ikl t tt ,4.1r. Ion r.onal nit :It .tt),1 t nn, hmt tit (2)s
2 \Ilk( u; high 111,01 nt (2)n, 6 Orli, .pt 'It (2)
!O. 11()%1 ( I RI \I\ IR) 1111 1111 \Hot I \( fill 1\(, '101. R 1 111 A I IU\(,(1A1
I. 58 ( t rtain
37I !OM., I MA malt it, but it will It( h.trf
i 5 Doubtful
1 Not lily ty
(2)w. no M A\ I CI I R V; II R Rom Iv; lilt
I. ..., ph t.t ut.tt rill f,,11,,,t Int: gut
2. 35--V) i i nit PI( hL .kilt t,. m "(4)
II 1011 A\ 111 IR \I
1)1 ,11(1
I, 41:L-- It lib( lot'.
2 23 \I t
,,r , r, I t
) 1411 It) \I I \ IV
IR \\NI I R
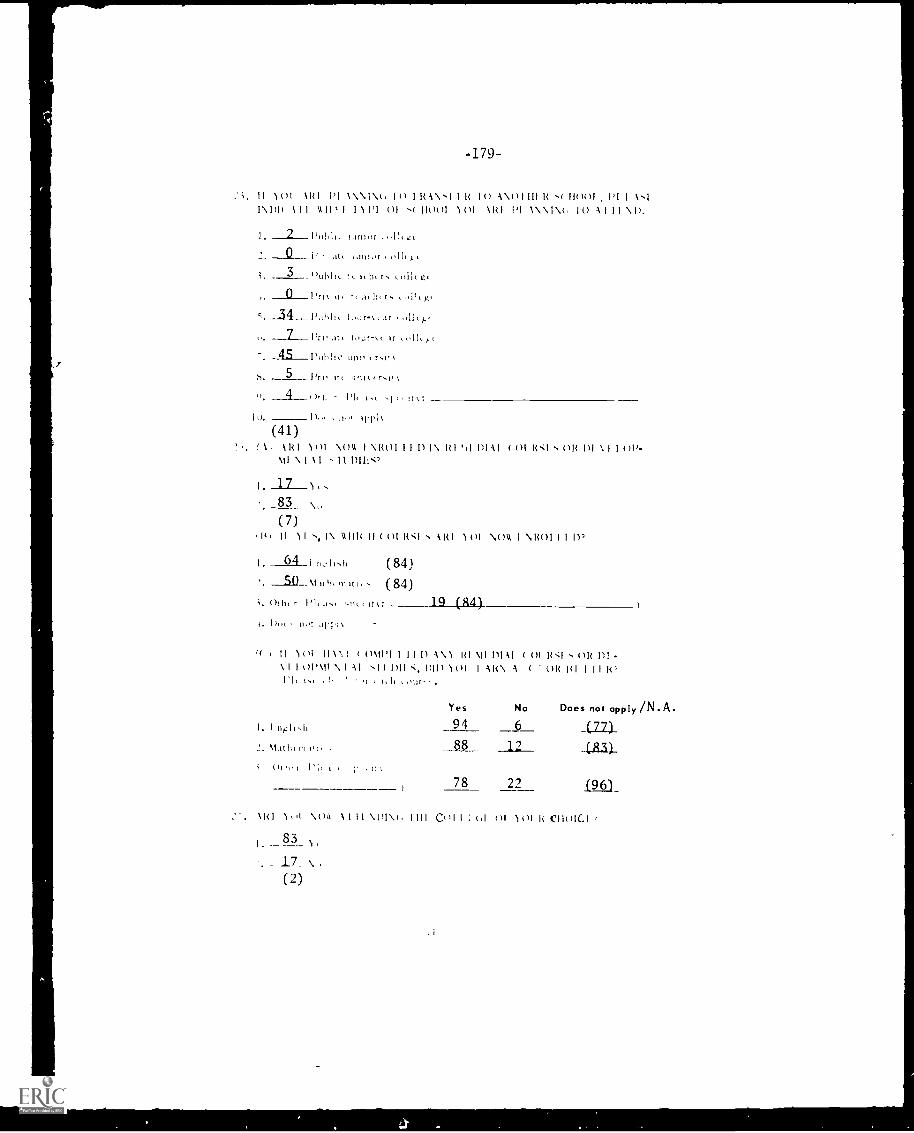
-179-
A ot \RI 1,1 \\\ Iv, I o I RAN....1 1 R I() A \oi 11001 1)I I \...1
1\1)I( 111 1111)1 111'1 01 ( 1101)1 101 1R1 1'1 1\ \1\t, 10 -1111 NI).
1. tuns r .11 ce
0 ,kt,
;. 3 "um,: t, a ht rs toll( ge
Pm. t,
c. _3_4 1)11,1it lour-%c 011,44
t.. l'rt .it( It 011,
45 Public 11111 r.t.s
ti 5 Pri u, ,111%,
4
I 11. I) 4 11111
(41)( 1 , \k l \()%1 1 \ROI I I I) I \ I<I 'II DI AI
\II NI I 1)11..:7
83 \(7)
( ()11(IN OH DI
le II 11 , I\ 11.111( II ( (ti RBI .11(I 101 \()11, I \ROI 11D)
n11.11 (84)SO mith, (84)
1t1:
is I ht ii t
19 (R4)
« t 11 101 HA), ( om1,1 1 I i I) ANA RI \II DIA! ( (II p.:1 OR In -\ I 1 ( ) 1 , \ 1 1 \ 1 A I .11 im nii) ot 11I <\ A ( ()R 1 I I R,l'1, I I our
1. I ri,:,11-.11
\ittl.()11),r
1R1 1 11 \ \I 1 I \ 111\( ,
83
. _
(2)
Yes No Does not apply /N.A.94 6 (77)88_ ULU
78 22 (96)_
1111 C011 : 1)1 101 I< 011)1C!
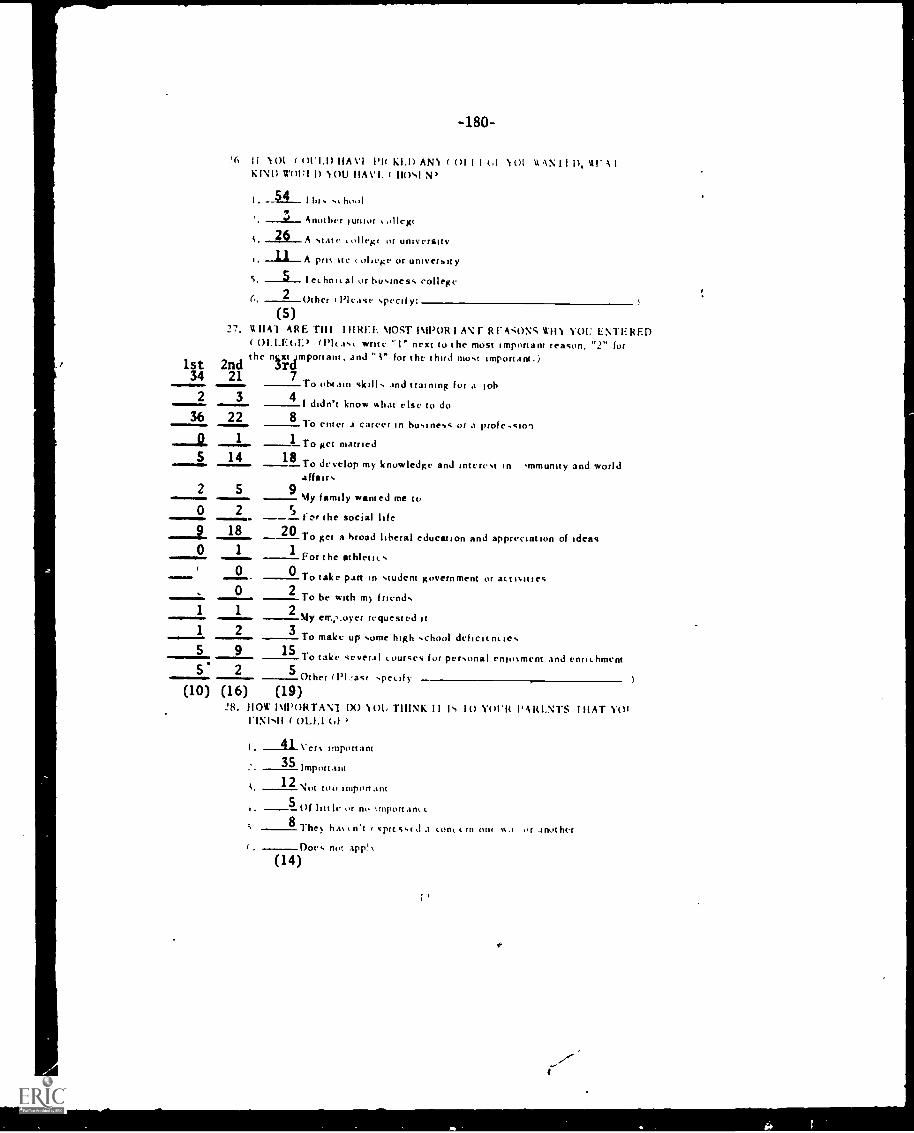
I
.'6
-180
II Not I O(1.1) 11AVI PI( KED ANN ( UI 1 1 of 101 a N I I I), 11KIND 110/1:1 I) NOD HAVE ( 110sIN,
54I ill, s, h001
Another junior ollebn
i. 26 A state ,ollegt or university
t. A pits ate ,011,ege or university
s. S lethntcal or business college
6. 2 Other t Please specify
(5)27. V1111 ARE TIII HIRE!: 110ST 111POR I 1N RIA`;ONS Will YOU ENTERED
( 01.LEGE, (Please write "1" next to the most important reason, "2" for
1st 2ndthe important, and "i" for the third most important.)rd
34 21 7 To obtain skills and training for a job2 3 4
I didn't know what else to do36 22 8 To enter a career in business or a profe,sion
1 1 To get married14 18 To develop my knowledge and interest in mmunity and world
affairs2 5
11y family wanted me to0 2 for the social life9 18 20-To get a broad liberal education and appreciation of ideas0 1 1 For the athletics
0 0 To take part in student government or activities0 2 To be with my friends
1 1 2 My err.,,.oyer requested it1 2 3 To make up some high school deficiencies5 9 15 To take several courses for personal enimment and enrichment5 2 5 Other (PlJast specify
(10) (16) (19)28. 11011' IMPORTAN1 IX) 101., TillNK 11 I`, 10 Y01.11. l' A I.NTS I HAT YU!
1-1N1'11 ( °LI.' (,1
I. __41Ver% important
35 lmportant
;. 12 VIOI WO Import ant
5 rIr--,1 little no importance
8 They has n't r *Tress( d come Ill 0111
( , Does not apply(14)
1
N .1 ,,r anot her
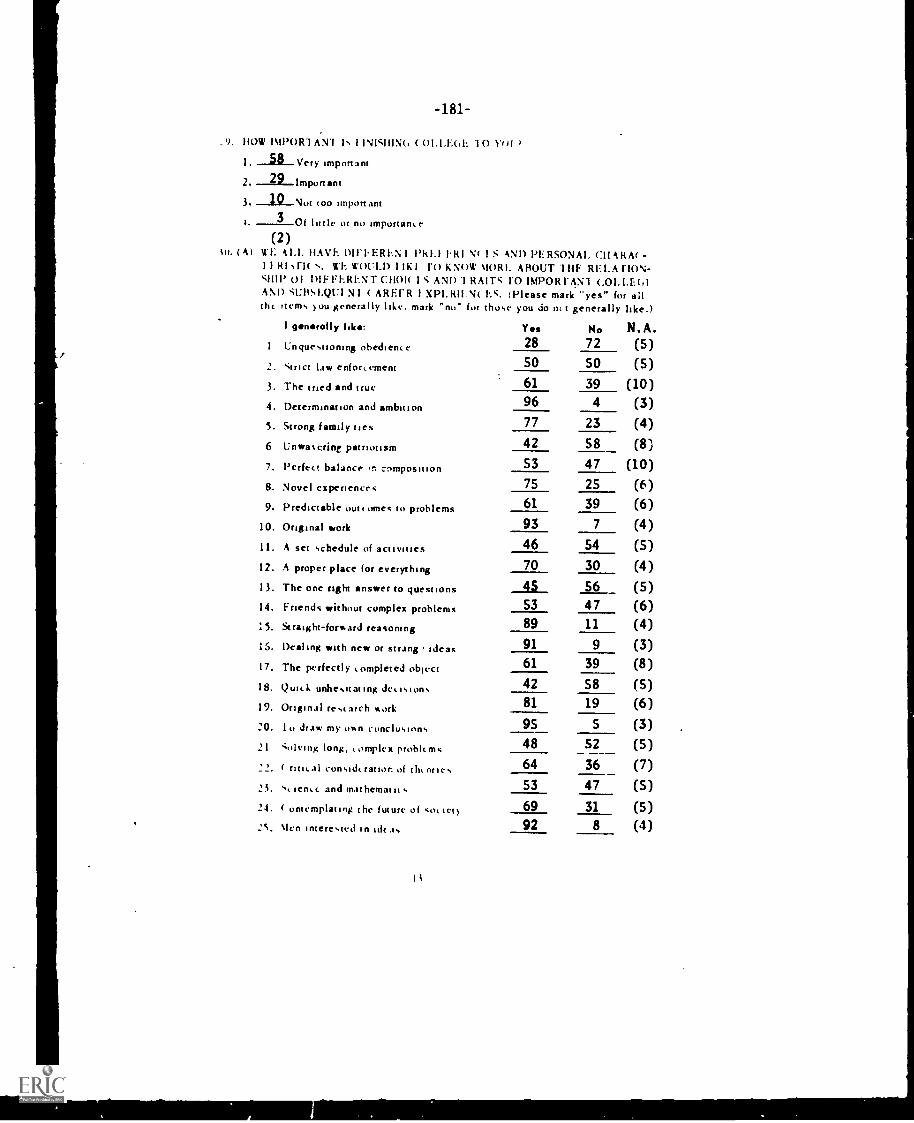
-181-
_9. DOW 151130R1AN1 Is ( 01.1.E0b. 10 pert
1. 18-- Very important
2. 22--Important3 10 Not too important
3 Of little or no importance
(2)(A) WI: ALI. DAVE DIFEREN I Pk1.1 RI N( I S AND PERSONAL CD ARA( -
I I RI ,[l( WE WOULD I IK I f0 KNOW ktORI. ABOUT-114F RELA [ION-01 DIFFERENT C1101( 1 S AND 1 HALT'S FO IMPORFAN1 coLLE(,1
AM) SUBSI.QUI NI ( AREIR I XPERII.N( E.S. (Please mark "yes" for allthe items ou generally like. mark "no" for those you do net generally like.)
I generally like: Yes No N.A.I Unquestioning obedience 28 72 (5)2. Strict law enforcement 50 50 (5)3. The tried and true 61 39 (10)4. Determination and ambition 96 4 (3)5. Strong family ties 77 23 (4)6 Unwaterine patriotism 42 58 (8)7. Perfect balance composition 53 47 (10)8. Novel experiences 75 25 (6)9. Predictable outcomes to 61 39 (6)problems
10. Original work 93 7 (4)II. A set schedule of activities 46 54 (5)12. A proper place for everything 70 30 (4)13. The one right answer to questions 56 (5)14. Friends without complex problems
_AI_53 47 (6)
5. Straight-forward reasoning 89 11 (4)
16. Dealing with new or strang ideas 91 9 (3)17. The perfectly completed object 61 39 (8)
18. Quick unhesitating decisions 42 58 (5)
19. Original research work 81 19 (6)
20. 1 o draw my on conclusions 95 5 (3)21 Solving long, complex problems 48 S2 (5)
:2. ( fitit.41 conside ration of thi ones 64 36 (7)
23. se icricc and mathcmaties 53 47 (5)24. ( ontcmplating the future of societ 69 31 (5)25. Men interested in ideas 92 8 (4)
It
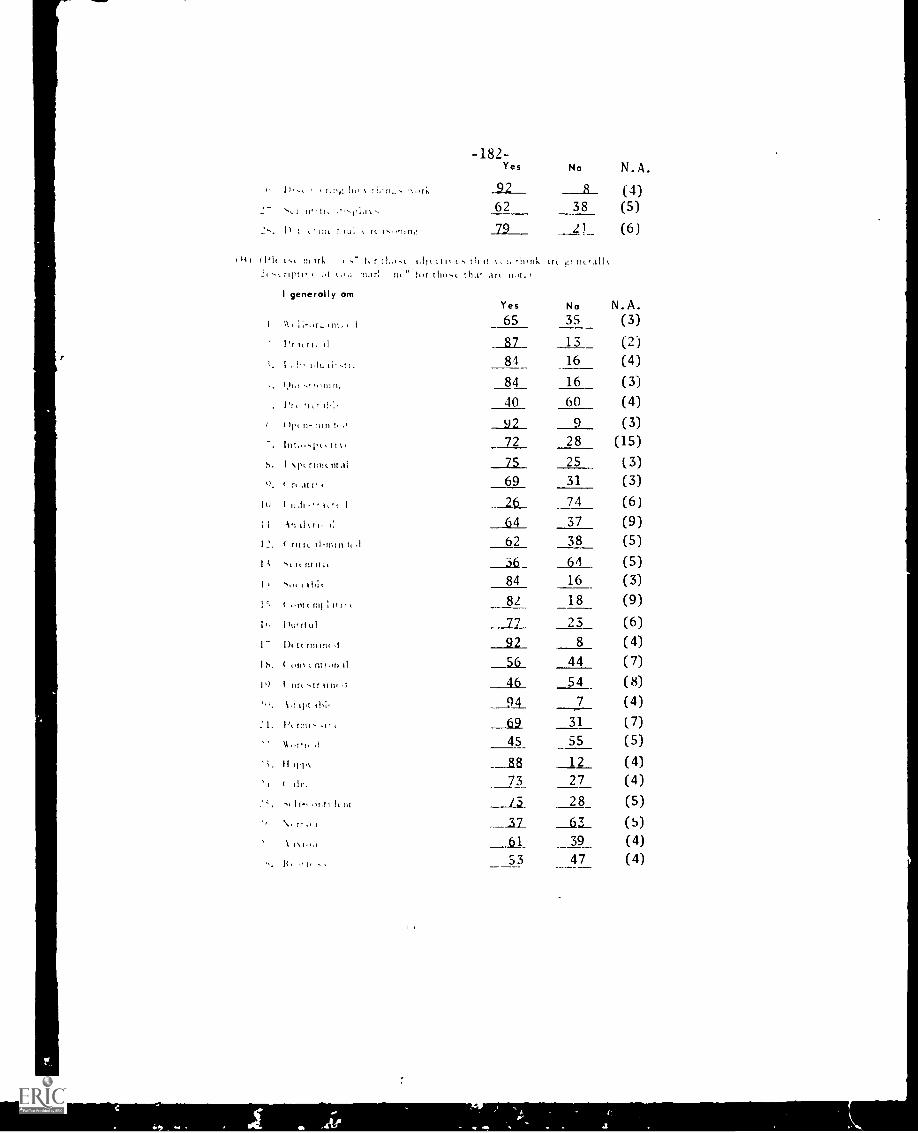
r.!,..; 11c,
2-
. t t nil rc.
-182 -Yes
92
62
79
No N.A.
R (4)
38 (5)
21_ (6)
I Int ;II Irk ' t 11.67`, 1,11t (II, s til 11 1. 1, '11111k IN. nta11,.
I
f
%oti
I generally am
lit 1,11, 11
1.11.11' -11t
lilt '1%.1
1)1, 11- 111111,
marl n," tc,r thus tha, in n,,t.
Yes
i 65
No
35
N.A.
(3)
(2)
(4)
(3)
(4)
(3)
87 13
84
84
40
16
16
60
Y2 9
illIo.s1(i1111 72 28 (15)
S. 1 '1.111 nt al 75 25 (3)
( rt 69 31 (3)
1() I n 1,,, i 26 74 (6)
I I An do!, 1: 64 37 (9)
tl-mm tt 62 38 (5)
s',f. It flf II It 36 64 (5)
1 'Not 1 ll.lt 84 16 (3)
f. 1 it I , 82 18 (9)
14. ihrttul 77 23 (6)
1- I)( tc min( ,1 92 8 (4)
1 Mit L1111,1111 56 44 (7)
nrc qtr 1,t1, .1 46 54 (8)
1H tiNt __N_ 7 (4)
-1' t ___62 31 (7)
k.i11, 45 55 (5)
II 1;1'1 ___88 12 (4)
111`. 73 27 (4)
11- 11,11 it 111 /3 28 (5)
f' ti _XII_ (5)11\ I,1 39 (4)
53 47 (4)
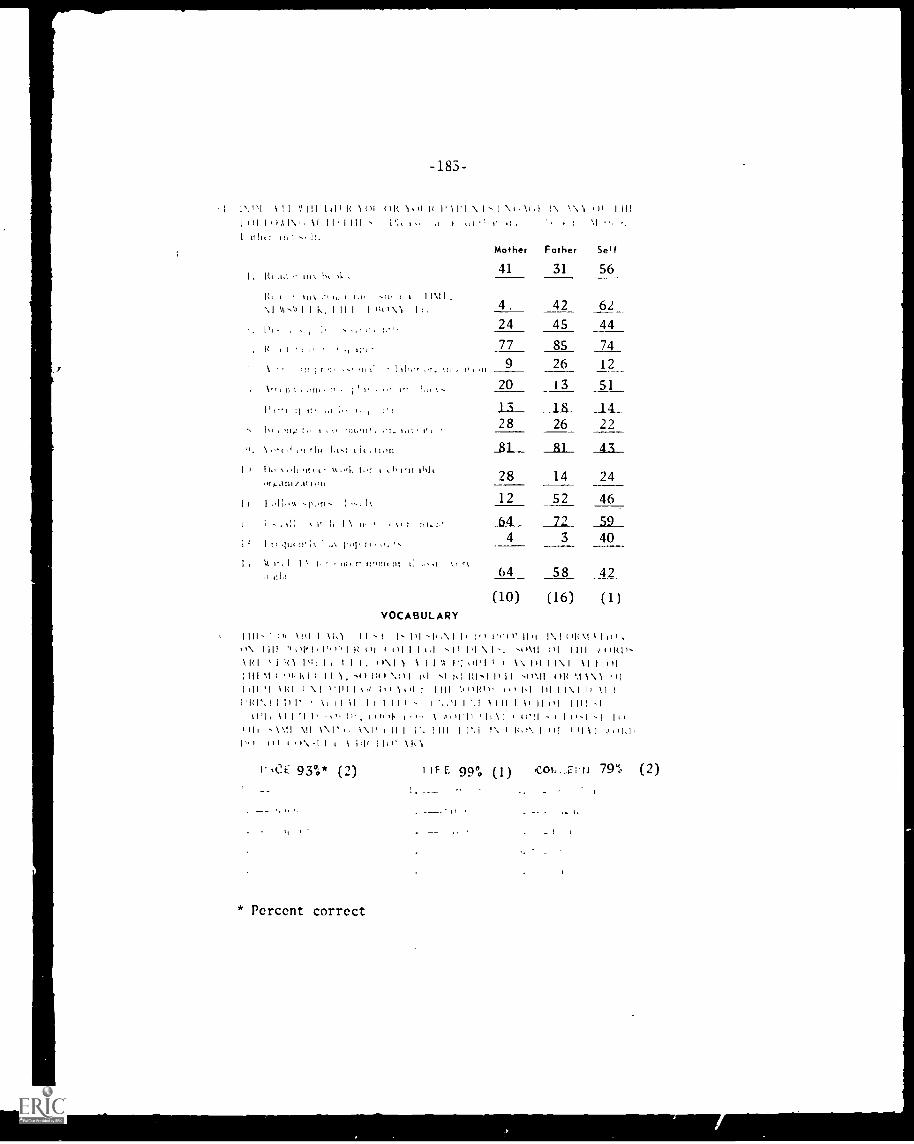
-183
I Is.n1 II \ill! 1111 l )(1()I I 101%, 7 1( 11'1111 PI, 7., .1
I ttll,.r It.
I . \ 1,, 71..
R. t u.\ 7.17 7, I I I\1I
I I h., I II II )V1 k
, , I. y
,7 t:77
1 , 77.1 r ..7 7t7
1.,
II
1%. 7ng 77
1,7-, .1 71 I.t.t .tion
i 11,7 ,711.nt(., - tor t .17 viz 1111,
I kIrlt.11 -port I I
I I , I . I 1 n, ' 1t
II 1 . 17 qt77. 17, I vlq. it .0,
I I Ilk f I \ 7g. r, 11.111, n; tl ,,7.I
vI \ 1.7 \t,7 71 '
Mother
41
77, \\,
Father
31
1)1 I777
Self
56
61_44
4. 4224 45
77 85 741?
51
911, 26
20 13
2614_22
24
28
98
12
14
52
1246
64 594 3 40
64 58 42
(10) (16) (1)VOCABULARY
!III- tIl 110 1 11,1 11 -1 I- III -1,A1 II .,1) 111 I (IR1\ 1 II! '1 I', 1 V (II IIIIIII,I \ III I III I
\VI 1110 111, I i I I I. 11\1 \ I LA 1)1 11\1 \I I III' 1 1 ' 1 1 1 I i 1, -,4) 1) 1 11 R1,1 II ,(14.11 I N) )1
1111'1 VI I NI "III I %,t 1) : 1111 ., 1,1 III 11\11, 11 1
1, ;1 11 It 1 II I - 1 ,1 1I II 1 1( 11 III !III -I
11'1 \I 1 '1 1, .1'. (114 t ,ItIrr \ I (144.1
1111 \I11 \\ \\II 111 I 1%1 16I\ I III ")1,I111 1.1% I 1I1 1 /IC 1 1S1
,CE 930* (2) 1 IF E. 990 (1) 79"z, (2)1.
* Percent correct

I4!toA ws; =98'1(2)
I. _cft.tc(2. -make IL-3cl
-elap..L--( mbroi de r
5. --Aid(
-184-
131.1:N 1=90 %(3)
I _dull2. _ drew4. -.deafi. - doubtfulS. --ugl)
( u1HI4l =30% (20) I DIM I =95% (5)1.
2. -loriul14. -chirpC. -Hit It(
1. -.usple Jou,2. - -t Its thlc1. -HI to ("If
S. _able to .pLal,
acct;': I om=62% (3)
I. -di...Appoint-L u.tnntare
1. -( iiiounter1. _get u.eJ4. -btltint...s
PA( r =92 %(7)
1. -puis..anee2. --« ntorea nine(3. _igre(mc nt
-.lei ::( tS. _pr(
1101( = 57 %(13) A" 1 `ION: = 360(11) ( A1)1th 1 =45%(17)I. r 1. - art a 1. -value2. _L Ifleft tin `. 2. -a star4. _s at L hinan i. - cuing) 1. __grimacet. _inagwt dream I. --et himC. Ilk _r, 1, rem( S. Ill
AN1.310' -74%(11) I MA\ A I I =37% (17) \HUM Al -66% (25)
1. -h t re (I2. - mat1. _di soh( di( nerI. c.r.itS. _friend...111p
I. -popu I at e I. -song.2. ( `. -mountebank4. --prominentI. -maiS. -toms
4. _lunat icI. -ribald5. --se cophant
( 1.01Si I-1411)=45%(14) I x«)mit = 30% (35) 13141411 =47%(26)- mtnt.tturt
2. -bunched4. - Irt In- I
1. _111.11.11%
C. - ClUtit
I. -rcp( tit ion- friend
1. -pain t,, fitI. -A1,1.1,1011
4. --t Xistlioit
I ti III !I t =16% (17) -.I 1)1 1 =25% (27)
l. ang bii it I. Id
2. L
1. -stlhf I. t, --Ntup1.1xt(11,1!,:lit
igraIdese ( ,rung
1. --1I t.hing2. -L :0'11(4. _prim( eI. -nound_g
ADDITIONAL INFORMATION
STUDENT FORM A
1
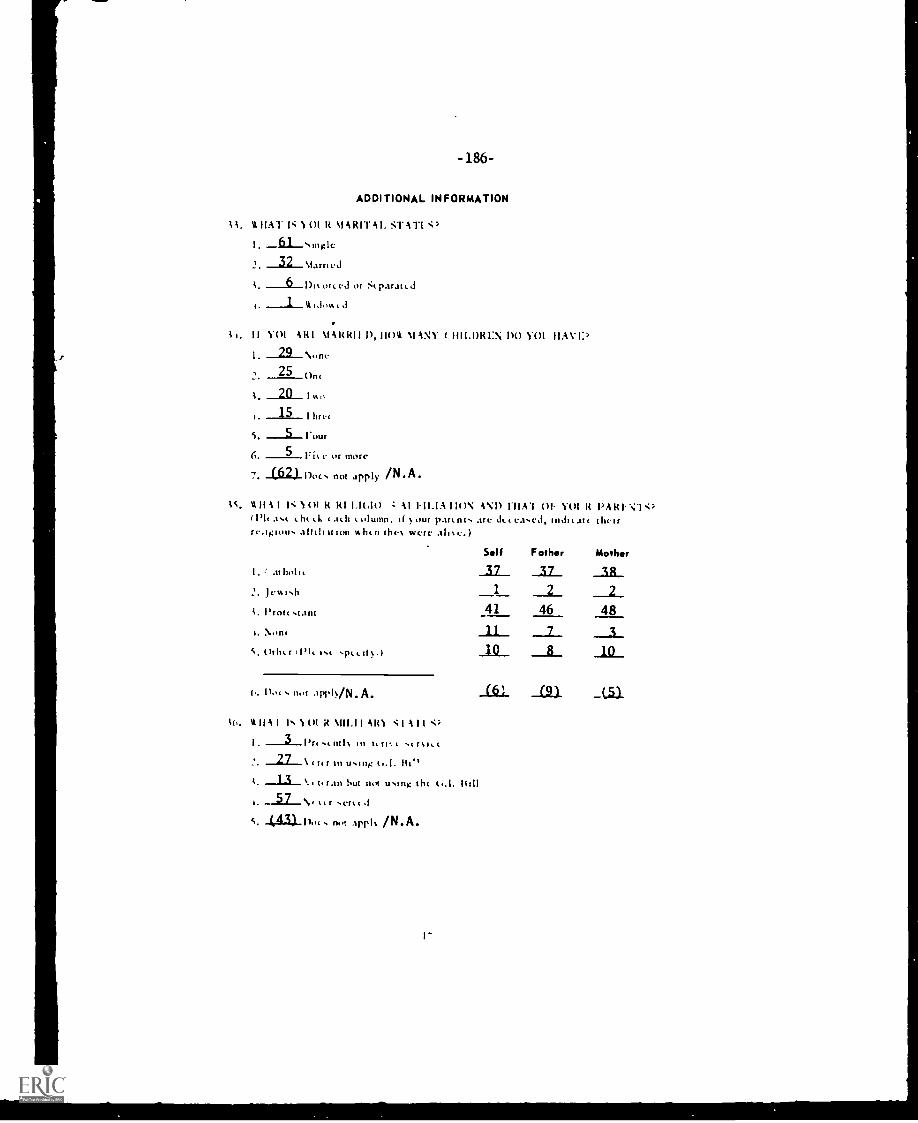
- 186 -
ADDITIONAL INFORMATION
11. uIIAT I: 11 R RIT Al. ST All
I. fa_szngle
2. 32"arriedI. --11-1)11. °Red or Sparatc. d
yot SRI %mow I), t ANY ( ini.oREN no yot
_22_ \wile25 on,
I hurt
5 --5--rour6 5 Ei, c. or more
(62) Doc. not apply /N.A.
Is. u II I I: 11 01 R RI 1.100 AI I11.1A I ION AND rnA1 01. 1'01 R PARI- :(1'1, .1./ c ac.11 tolunul. If our parents are eke eased, iodic att theirrraguou. mon when the% were allee.)
I. Athol'
2. Jevccsil
i. Prot' slant
Nonc
S, pc.t st.)
f.. Dot 1101 APIVN. A.
kt, %%HA I Is 1101 ARN :1 All
I. ---3--Preentl% in le to.e ar%t.t
r to u.siy tc.I. RI"
; it r.111 but not (..1.
I. tt r sere( .1
S. s not Aryl, /N.A.
Self Father Mother
3.2_ _37_ I&_141 46
___2_
48
IQ_ __a_
Aki _LS.1_
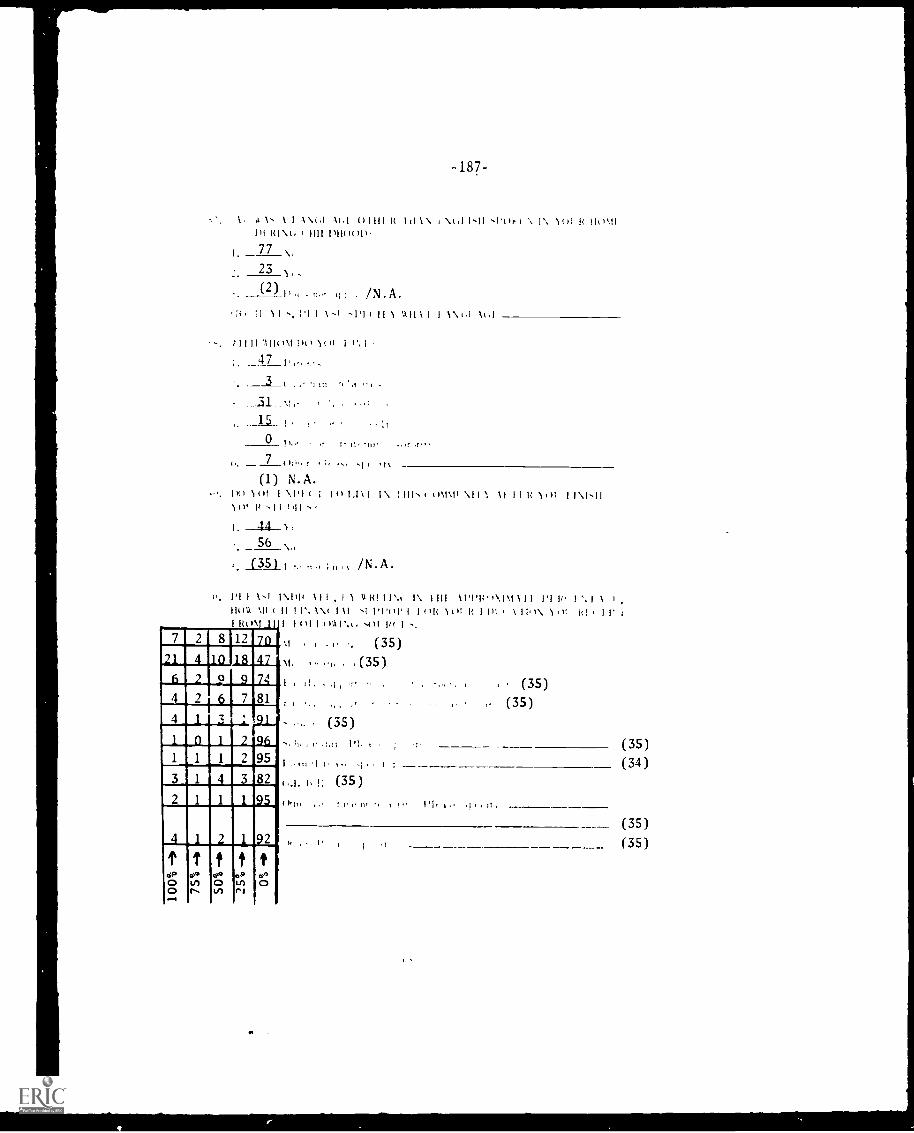
-187-
1. A \' I 1 A \(,1 A(,1 01111 It I TI I \ i \I,1 1,11 ,l'tq I \ I\ 11,1 It 110%11
111 RI \k, ( 1111 1)1ITI1 To,
1 77 \,23 1,.(2) il I I) I . /N.A.
,li ,I 11 .... 1,1 1 1-.1.1,11 i1 ) 'A II 1 I I 1 \ I . 1k I
)1111 'A 11TIM !)IT )(TT 1 T., i
i. ___47 1),., T,.,
______3_ I 'I itt "( ' .1 , ' 1 ,
__IL_ v, ,,
I. _15 _i .
0 II : 0,, -21,. ..!:- ,f,,
(1) N.A.Ill) WI I \I'l I 1 II)1.1N1 1\ 1111',()(I, 1/ ,1l IP11 -
44 1,
56 \,(35) 1 ,. ,,, ;T,,, /N.A.
011\11 \I 11 II I I R )t)I / I \NH
1 ' 1 I I - 1 1 1 1 ) 1 ( 1 1 1 , 1 1 I I I t ! I 1`. 1 \ 1 1 1 1 111'It 1\ 1 \I III 1'I 1 I '. 1 I ' .110%1 %II ( I I II% IV I 11 'I l'1'()1' I I (Ilt 1()I It I III i I I I.)\ 1.v. RI ( 11' I
I Rom ii i I I TI I T)\.11',.t. 01 RI I
7
-1.
6
4
2
4
2
8 12 7010 18 47
2
QI 9 74
1 6 7
4....1Z___;,.
0 1 21
81
96
1 1
3
1 2 951 4 3 82,1 1 1 95
4 1 2 1.. 92
t t fe. e. e.o to oo r- LntI
f to p .0to 0,-,
.
(35)%I. ,,, - (35)1 . , , (35)
(35)(35)
:1I. 1 1 PI, I
I , ttt 'I I, I i , . t : - -( I I, ! : (35)
(35)(34)
1. , 11 , 1 t" 1'1, . "1 " "(35)(35)
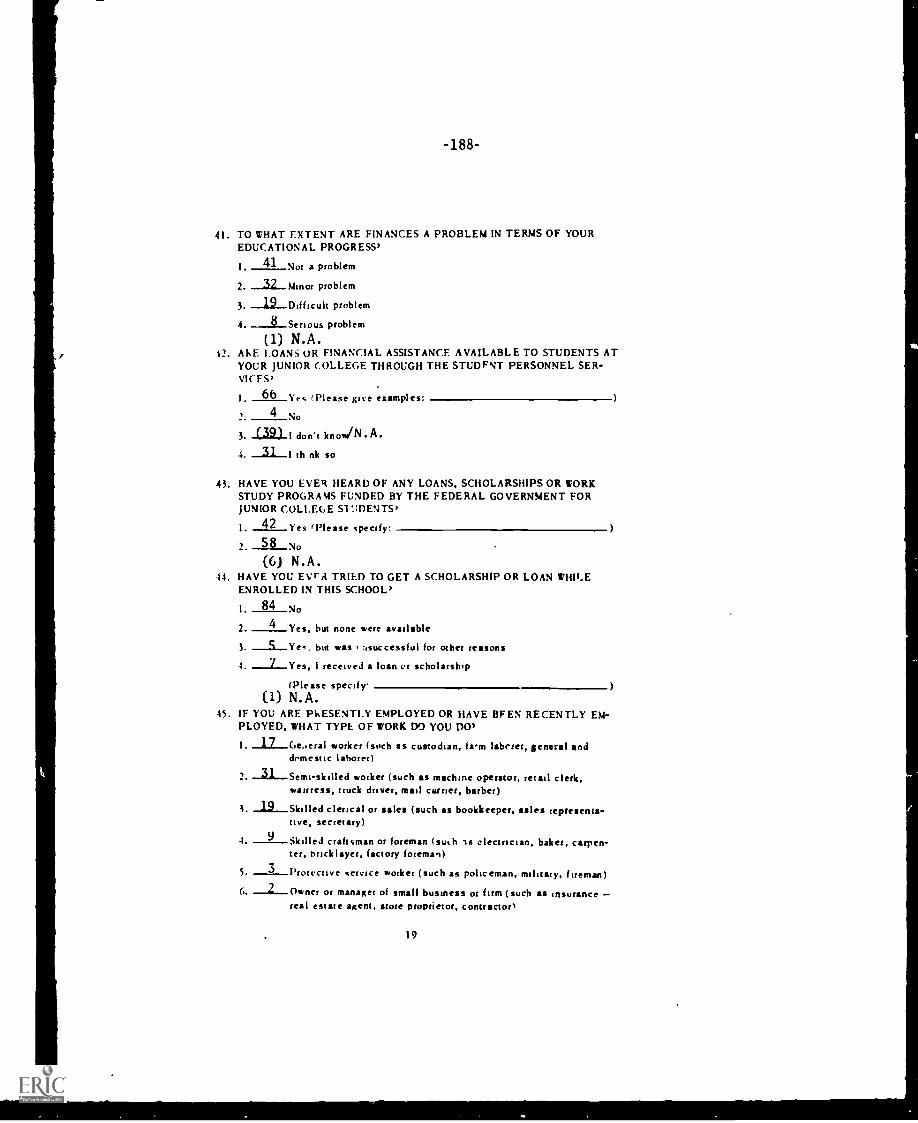
-188-
41. TO WHAT EXTENT ARE FINANCES A PROBLEM IN TERMS OF YOUREDUCATIONAL PROGRESS'
I. 41 Not a problem
2 32 Minor problem
3 12Difficult problem4 8 Serious problem
(1) N.A.12. AKE LOANS OR FINANCIAL ASSISTANCE AVAILABLE TO STUDENTS AT
YOUR JUNIOR COLLEGE THROUGH THE STUDFNT PERSONNEL SER-VICTS,
1. 66 Yrs (Please give examples
2. 4 No3 (39) I don't knowN.A.4 th nk so
43. HAVE YOU EVER HEARD OF ANY LOANS, SCHOLARSHIPS OR WORKSTUDY PROGRAMS FUNDED BY THE FEDERAL GOVERNMENT FORJUNIOR COLLEGE Si '..IDENTS,
1. 42 Yes 'Please specify
2. 58 No
(6) N.A.44. HAVE YOU EVrrt TRIED TO GET A SCHOLARSHIP OR LOAN WHII-E
ENROLLED IN THIS SCHOOL'
I. 84 No
2 4 --Yes, but none were available
3. --.5 --Yet but was ;,successful for other reasons
4. I received a loan or scholarship
(Please specify-(1) N.A.
45. IF YOU ARE PRESENTLY EMPLOYED OR HAVE BEEN RECENTLY EM-PLOYED, WHAT TYPE OF WORK DO YOU DO'
1. 17 C,e feral worker (such as custodian, fam laborer, general anddemestic laborer)
2. 13-1Semi-sk ailed worker (such as machine operator, retail clerk,wairress, truck driver, mail carrier, barber)
3 19 Skilled clerical or sales (such as bookkeeper, sales representa-tive, secretary)
4. 9 Skilled craftsman or foreman (such is electrician, baker, carpen-ter, bricklayer, factory foreman)
5. 3 protective service worker (such as policeman, military, fireman)
6 --2Owner or manager of small business Of firm (such as insurancereal estate agent, store proprietor, contractor'
19
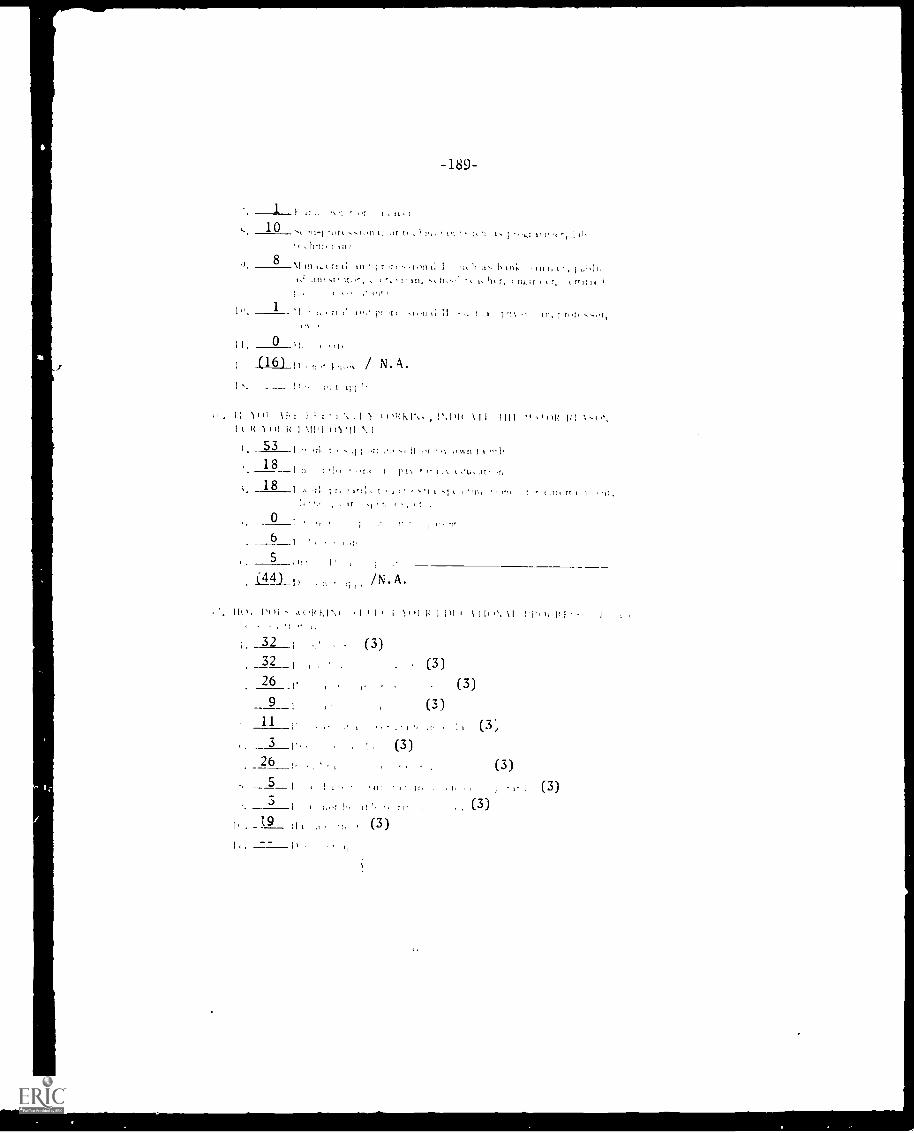
111
-189-
;;; 1,11
'1,11
I, ;,.; ir
I,
"; 1 ;;,
,.H!,
10 I11 I, Jr ,
t II;11; I III)
8 .111;11,t r; li III 1r ,t, 11
I;) rein. t t
,1 '1 ifl, 11 ; -I ;
1 10
(16) 1, ,1 / N. A._ t t'
. sti \ 1, t I 1 , 1 1`.111( \ 1 1 1111 ; 1 114 it;I R '1 AR It f %WI +1.11
18_t ,,
181 71 t , sr
/N. A.
/t ,It, rt
1".1;,l ,t If 4 \(.[ 1t I 111 I \ 111 \1 t'1'.1i
1 32 (3)_32 1 (3)
26 _i (3)(3)
11 i (3;3 1 (3)20_ I. (3)
51 , , , (3)
, .., (3). _19 ;I (3)
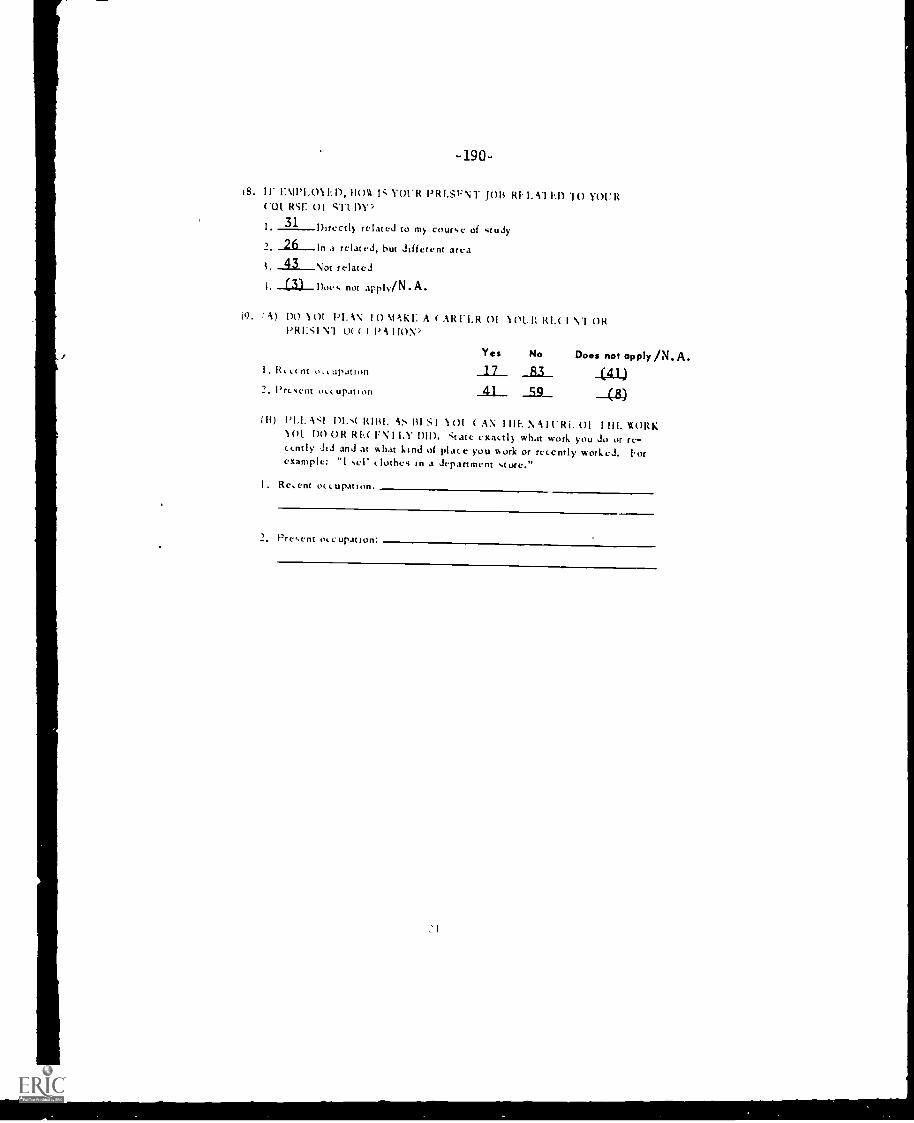
18. IF 1:\11'1.01 11), DOA I' YOUR PRESVNT )011 R1. 1. All..1.) 10 YOURC01..RSE 01 STUDY,
1 31 Directly related to my course of study
2. 16-- In i related, but different area
i 43 Not related
1. -4.3..1-- Does not apply/N. A.
19. (A) DO 101 PLAN 10 MAKI: A ( AR1-1.R 01 101.11 RE( I Ni ORPRESIN1 0( t 1 PA HON.'
1. I( c it nt 0, c opal i on
2. Present occupation
Yes No Does not apply/N.A.ai.._ _ii.i._ (41)AL ...a.9 (8)
(II) 11.1.A*41 01N R1141. AS DI S1 101 ( AN 111h. N Al Ulii. 01 1111.10RK101 DO OR Rh.( FN 1 EY DM. State exactly what work you do or re-cently did and at what kind of place you work or recently worked. Iorexample: "1 sell clothes in a department store."
1. Recent occupation
2. Present occupation'
2_i
491-
ADDITIONAL INFORMATION
STUDENT FORM B
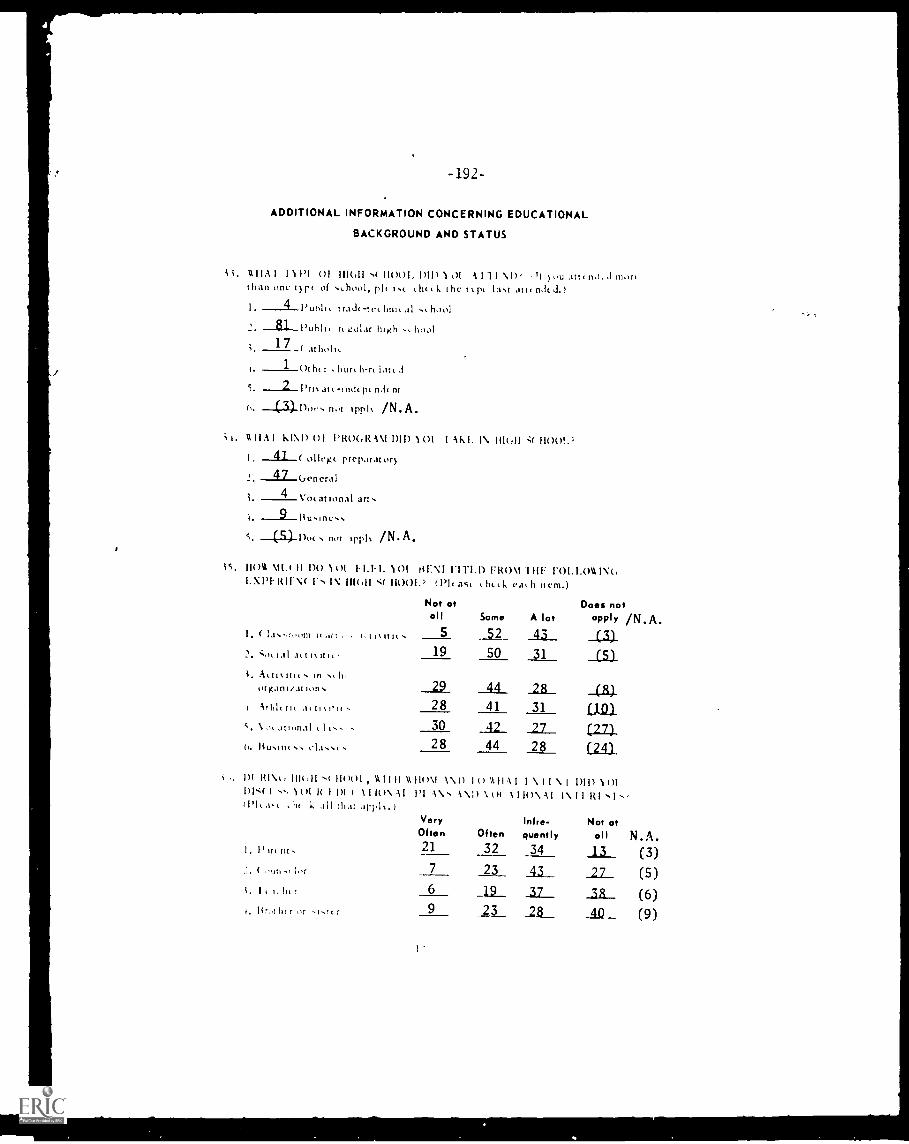
-192-
ADDITIONAL INFORMATION CONCERNING EDUCATIONAL
BACKGROUND AND STATUS
t HAI 111'1 01 11101 ( 11001. 1)11) 1,)1 -1111 Nh' It you ..ittr Dd..' mot,than one type of 4chool, plc 14c hcct, the typt la.t attt ndc..1.1
1. --4huhli, trade -te, hnic al 4, hoc,'
2. 31huhli, n uular high 4chodl17 ( Riwltc
a. 1 (Jr hr r hurt h-rr Litt d
--Z.Prix -Indcp, rhicnt
(I) Doe, not ipplx /N.A.
; t. t 11A I KIND 01 PR0(,R -1 1)11)101 I Aid. I\ 111011 ;( HOW.'
1. 4-.1( ollegc preparatory41Crencral
i. 4 Vocational arts
i
s. (c) Doc not ipply /N A.
;S. 1101% H 1)0 101 1-1.1-1. 101 141-.N1 1.111.1) FRO 1111: 1'01.1.01%1M,Riry F. :( 11001.) (Pk ast Lfica each item.)
1. f' . r c int .1.11 act It
i Actty 4.11.
orp,anilat ion,
a,ttcl'i,c. ational
Not at Does notall Some A to oPOY /N.A.
5 _52_ _II_19 50 31 (5)
_Al_ _a_ _al28 41 31 UQ130 AL _a_ (27)28 44 28 (24)
c 1)1 Hirai '( 11001 W1111 11110\1 \ 10\111A1 1\ 11 \ I DID 1011)1'4 I '0. 101 k 1 1)1 ( 11()N. 1'1 AV-. AV) \ tit 1110\ \I Rif RI Nis.,(111ca. h., 1, all that applc.)
lint he r or i.r t r
Very Infre- Not ofOften Often quently all N.A.21 32 34 _LI_ (3)
7 23 43 2Z_ (5)
6 IL_ 2& (6)
9 23 21. _11.0_ (9)
1
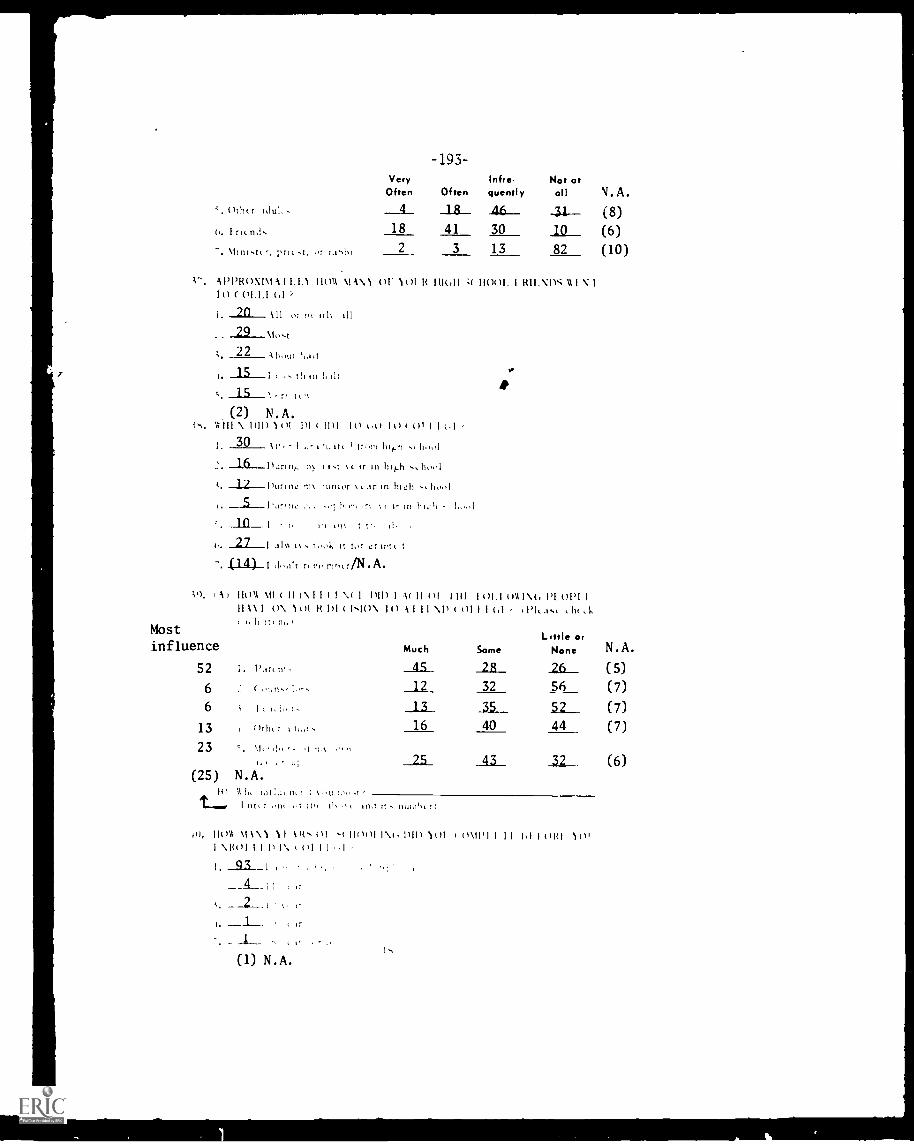
°tilt r 'huh.
I rit
prit rniklu
-193-Very lnfre- Not at
Often Often quently all N.A.__4_ -18 46 31-- (8)
18 41 30 ID__ (6)2 3 13 82 (10)
APPROXIM I 1.1.1 11011 )IA\1 OF lot It Moll ( 11001. I RII.NDsI o Oil.! (,1
I. 20 All or tii chi\
29
22Mo.t
Al-
15 .. thin hiltc, 15 tr'
(2) N.A.t. VIII \ 'it ti PI I 1111 It) thi I ti WI 1 ii
1. 30 1 t troni 11101 11..01
2. _..111.-.-1)urtt4, n!. i.t in iii WI skhool1) )1niit uj in in hiLth ,hool
I ' ir'ne 1, .ri tr ii hi
II) . In,
0. _27_1 liN, IN tools it irr
(14) I h r, tn, ristriNA
1 A ) 11011 (II 1\1111 N., I OW I Ar II ill 1111 1011 oaim, oil)) I ON. )01 it Di NA() \ It) )1 i o I 01 (,1 Itl,isi ,h(kk it
Mostinfluence
52
6
6
13
23
(25) N.A.
ith
Little orMuch Some None N.A.
_a_ 211__ (5)12_ 32 5L (7)
52 (7)16 40 44 (7)
%), ilk Iklk Ilk N ,t, k '1 III( r tI r
1ft )'k \ \ ) )1 Ijs tit huh! INA, minI mon II 01\ ill 1 I
(1) N.A.I s
\ 11 '1 I 11 1,1 1 t MI 1 iH
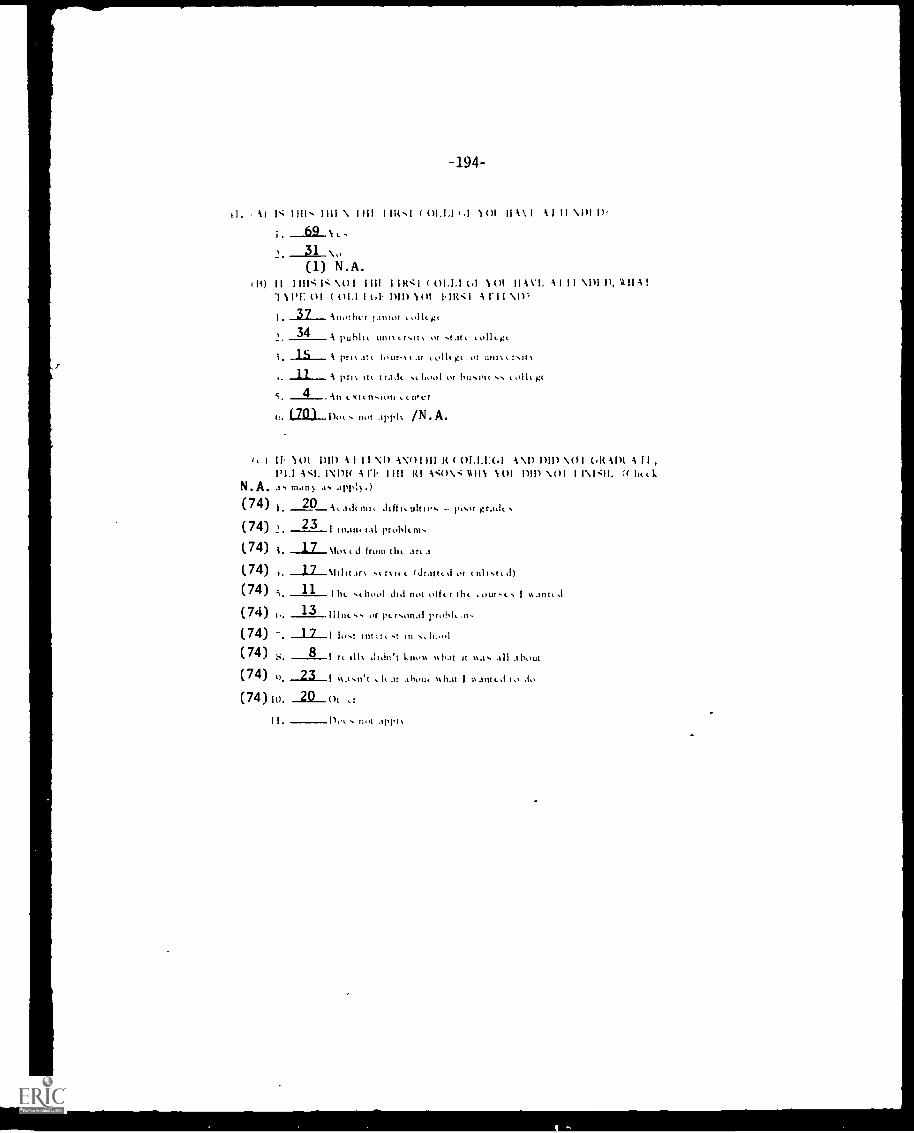
-194-
0. I HIP-. 1111 \ 1111 I t 01.1.1 id 101 I1A11 1111 \I)I D-
I. 62-1c.2
(1) N.A.
114) II HIP: \ol i III i I Its I t um (.1 5 01 DAVI. 1 111 \DI I), 1),IIA!15 IT 01 ( 01.1 I (,1- 11111101 111t:1 A 1-11 \ 1)%
I 37 Another tumor
34 A publIk utmlfIt1 Of -.Litt tollt.gt
;. pri tour-t gc or unit r..11
A NI% uc tf.13t pool or bt.11.1C gc
S. _1" xtt n-oon t wer
n. (70) no,. not .111.1% /N. A.
t, 1 11 NM 1)11) A I 11 \I) 1 N01111 It ( 01.1.1:61 1 \11 1)11) \01 (,1( ADI A II1'1.1 1:1, 1N1111 11'1 HU RI A:()\: 11I5 Not 0111 01 11\1:11. ((
N.A. as mar
(74) I. 20_Ae Ad( nut daft.. root gradi.
(74) 2. 23 I min, tat prohltni.
(74) \to% c d from tht art .1
(74) e. fdrmtt d or 1 till.tc
(74) s. 11
(74) 0. 13
I ht ahool dtd not olft r tht .ourc. I %sant, d
or pi r011.11 prohlc
(74) -. _17_1 10.0. ititcrt ....11,,o1
(74) s. 8 I rt didn't knot% %that it .d1
(74) 9. _23_1 t.1.11'1 e. It ar hoc', t hat I 'A MI( d 10 do
(74)10. 20 t
Do, . n..t avph
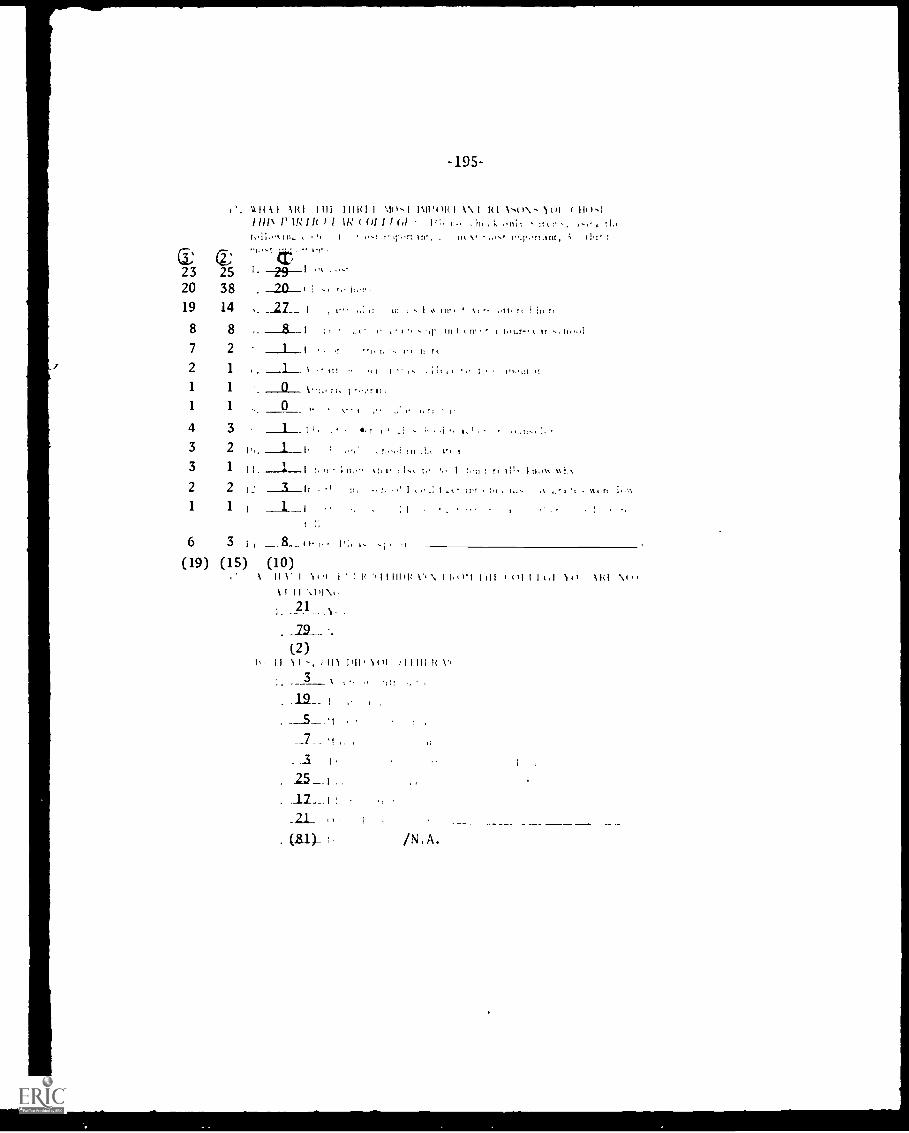
CS2
2320
19
8
7
2
1
1
4
3
3
2
1
6
-195-
e'. 111111 11{1 1111 11110 1 4,10,1 1111.(W1 1\1 HI 1()\ Nt.1 c 100-1I II: I I( I I 11: ( 01 I 1 (,I 1,:
,
2538 20__I14
.
27 I
8
2
,.
1
1
.
1
.
0 I..
3 ,
2
1
2 1_ _
3
(19) (15) (10)
I h, , L,111% , . I.,
11, ; 1
II 11 1 11,41 MI (.1 1 1 t,1 1,. 110 V.,1111 %IV,
I. 21
(2)11 11-, :1111,11,11)1 L'11111,1,: 1'
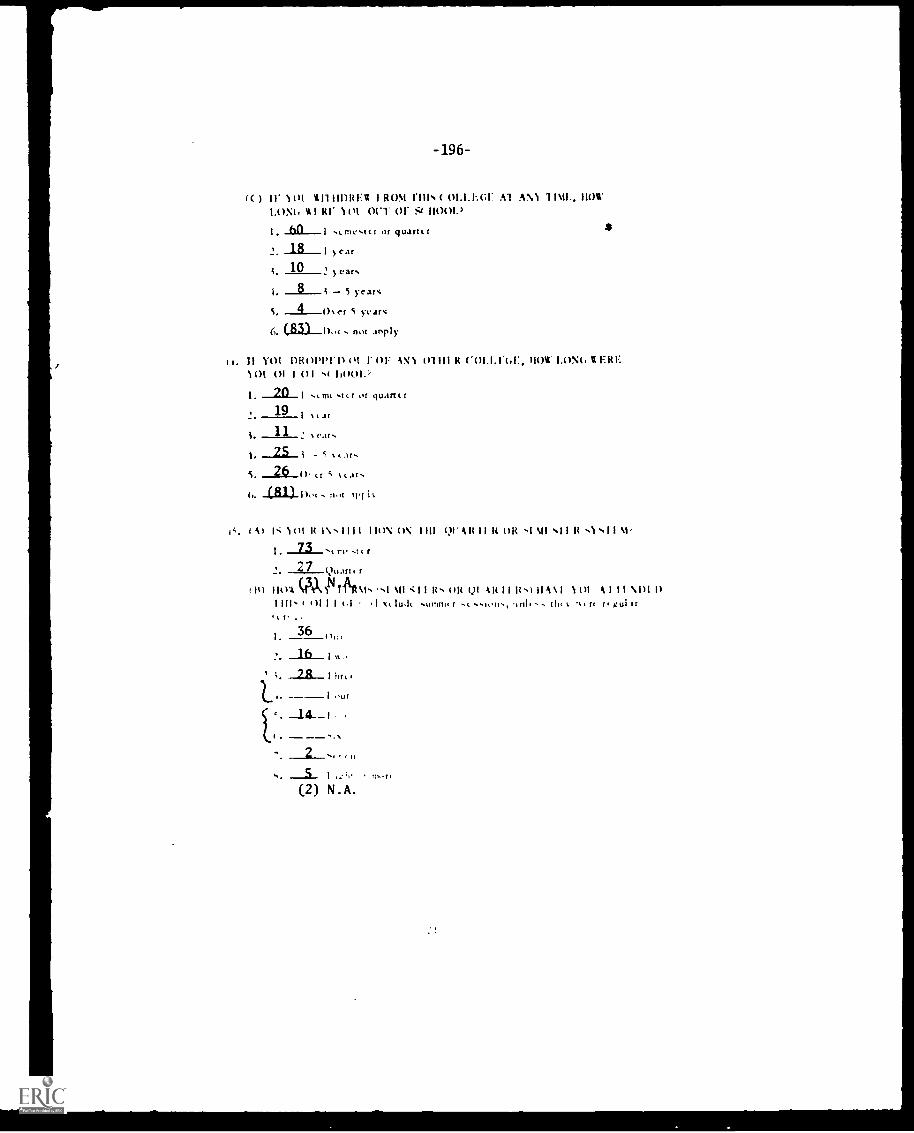
196
l( ) II' NM 11111111a:I 1 ROM FIlls ( 01.1.1%(;11: Al ANN1.0NI, NI RI NM OUT OF Si 11001.)
I. -h0-1 .c.rne.tcr or quartcr
2. aa_ I > ear
1. 10 ' 1 ears
5 year%
5 4ther S years6. (83) 00( not arply
111-. HOW
11 Vol DROPPI'D 01 F OF ANN 01111 R 110 LOX(. tE111-:NOE ()I I (II sc 1i001.%
1. 201 .trn..ttr or guano19 I tsar
11 %ear.
I. 25i5. 2120 tr6. 481,11 ilot tI 11t
S. t Si oi It iv. i l l I Ho\ ts; J i l l yr Alt II It OR MJ SI I it -.1 I m
I. ar
27 Quart, r
141 110'a VAk 4SITAIII \I" 'NI s; I 1 R till VI Alt I I ItI IIAN I 10I AI II \ 1)1 I)I I I I , I 4)1 I 1 t,1 1 ,1thitr .
2___;
6, ____,5_... I , . '1. litt re
(2) N . A.
4111, th, t tiff figul sr
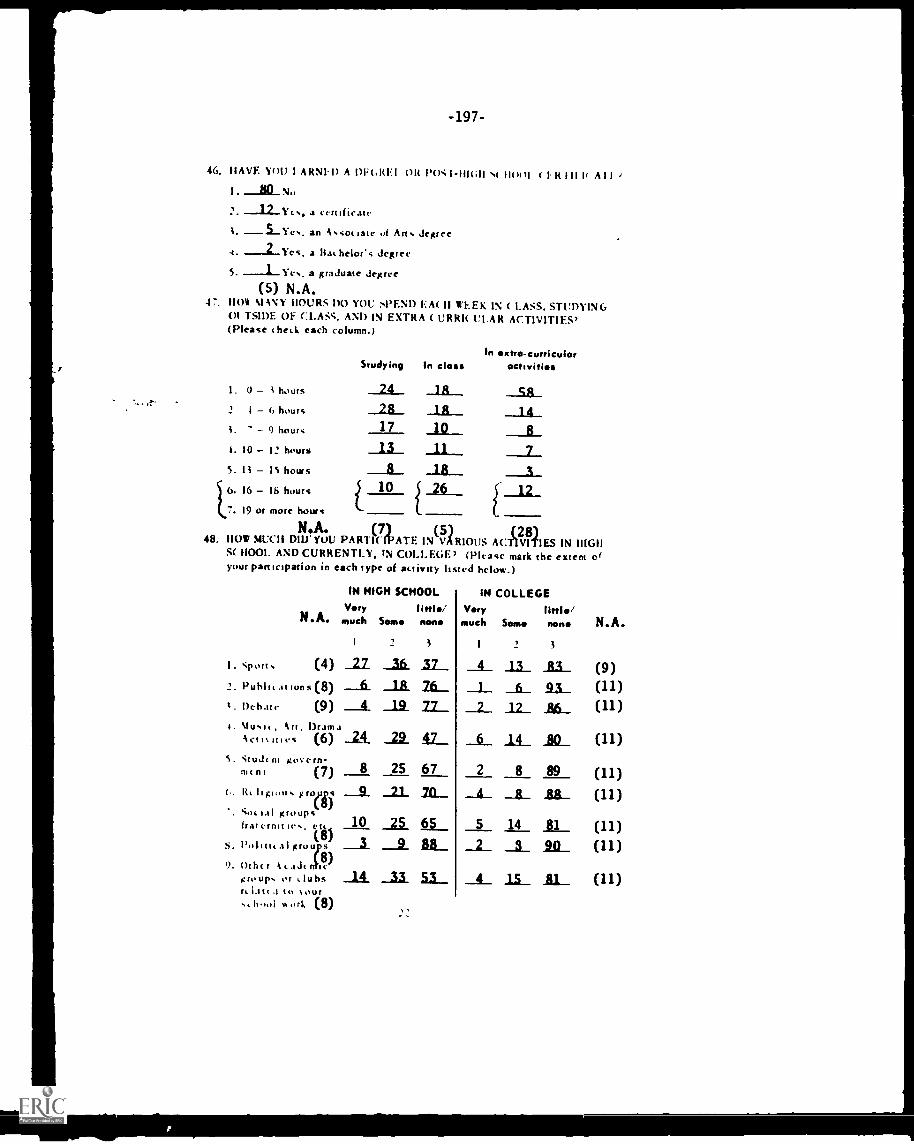
-197-
46. DAVE YOU I ARNI-O A 1)1:6141:1 OR POSI-111G11 11001 4R 1 1 1 I f A l l
1. 811...No
certificate
an Asoctate of Art degree
--1.Yes, a li.thelors degree
5 --1__Ye, a graduate degree(5) N.A.
47. 110% NAVY HOURS I)() you WEND EACH WEEK. IN ( LASS, STUDYING01 TSII)E OF CLASS, AND IN EXTRA ( URRIC ULAR ACTIVITIES'(Please shed. each column.)
Studying In classIn extra-curricular
activities
I. 0 i hours _18__ _58_2 f 6 hours
A. 9 hours 17-
10_14_
8
i. 10 12 hours _Li_ 11 75. 1i IS hours __IL_ _18_6 10t7. 16 IS hours
19 or more hours
S__.A. (7)
48. 110W MUCH DIDN' YOU PARTICIPATE IN(VARIOUS AClcinIES IN MG!!
S( 11001. AND CURRENTLY, IN COLLEGE) (Please mark the extent ofyour participation in each type of activity listed below.)
N A.
. sport (4)2. Publit.itions(8)A - ()chair (9)t. Mutt, Art, Drama
Act it sties (6)5. Student govern-
sit n (7)Rthg..utt.tl groups(rat cunt ie., cut
S. Politi, gro8
9. Othtr AL.tdc. ic)
group. or dubsft Litt 4 to 111./f
IN HIGH
Verymuch
I
_2.7_
SCHOOL
Some none
2 3
.1Z_
_18_ 26_
IN
Verymuch
__4_
_1__2_
COLLEGE
Somelittle/none
3
11.3_
g
N.A.
(9)(11)(11)
(11)
(11)
(11)
(11)(11)
(11)
_11._
12_A.
..EL
898
42._
6725 2 8
__9_
10 65
A_5
_8_
14
.88_
IL911_
IL
25
__33._
EL.
13_
_2_4_ 11_
Nork (8)
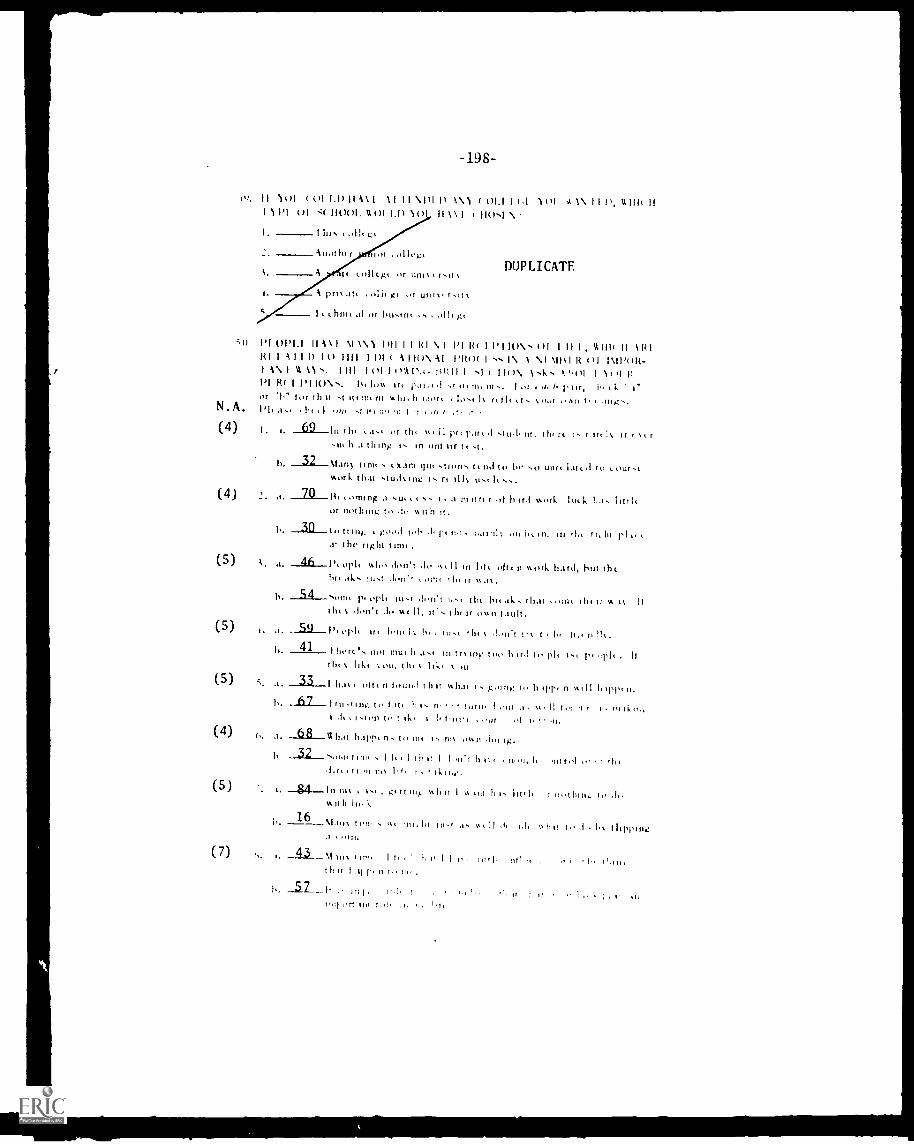
-198-
19, 11 )(it ( (5t 1,1)11A\ 1 1l II \PI It 1 \1 ( 01.1 I (,1 1(I1 a 1\ I I
I 1'1 (II "( 110551. (11 1.1) )(5 \ 1 I 110.1
N.A.(4)
1111, t Oft Kt
lout r or ilegt(.111(g. or unit,r.ti
i. A pm att #4, or unlit r,ltt hIllt AI or blltIllt
DUPLICATE
pi (114,1 11 A%1 \11 \1 1111 1 1 141 \l 1'1 It( 1 PI 1()\'' 5)1 1 11 1 . WM' 11 1151H I 1 A 1 1 I ) I(1 1 1 1 1 I I I I I A I 1 5 ) \ A I 1' 1 0 55 I \I 1114 1 It ( ) I 1 \IP(IN-1 A\ I 11 N. 1 1 1 1 I t ) I I /A I \k, IiI11 !p i\ 1.k., 1 lift
1 15,1 ItPI I(( I 1'1 IO \s. If Ines Ir. it e in. ht , d, I, I'm,of 'It" for th It ,t tt( au nit %hit h ,,lent Io.tt It rt ti, t.t t/tst All t, ling,.
a., he 'It I `: 11 t' ttO
69 in Ot tilt it, it nt, t he rt r Irt It It \t r11,11 3 thing t in nin tor t..t.
\I tny ttnn tillt,strons t to h. .o unr. lit, .1 lo our'work that ,tuding r. I."
(4) 2. ,m. 1i. i omit-1g a r r h vkork luck ha. littkor nothing to do %%It h
to tong 141,, III iL, n. lit pi.1 the right tun..
70
30
(5) ;. `AL" tlItIlZ Itt et, II III Iltt ouro(ttn work hard, but th
(7)
hr, lut don't orie !h. it tt.n.54 Nom( pi oph ni.r don't tilt hr. ak that t onit tilt it IA it It
thtt don't do wt II, it'. their nun I Ault.
.1. orlt u, tont It ihl nit if I/ II% ,
b, 41
s. 33
67
68
1 hors'. not 'nut h tr mg too h trd to pl. IIth,t Ink, 1, on, thit Ilk.
I,n, ofttnloundiliu m.11.1t 1. going toltctrinwiII lirpptII.I ru.eing to late It r t Itite I out a , tg,r l r't
1 d. t 11011 It, I ik, I It t'111' 1 n ''-nt.fiat 11.11Ipt II, to tilt I. nit tflifl i i lg.
i. 32 on. I f, ( l I in It I 1011.1 it I% II `III ft,''Li., 'non iii lit, t 'king.
t. in% i1 g. it 111,, iii u I St nit hill, r 111.1,111U, to dowith
h. 16 _Ni,, ,, n w, nn,hi Iti-d ut II 5, id, ohit to hi Slipping
43 in,I f I. 1 I i 101
t h it 11.11 III n ,
I.. 57 it.1.
II. II it 1. III
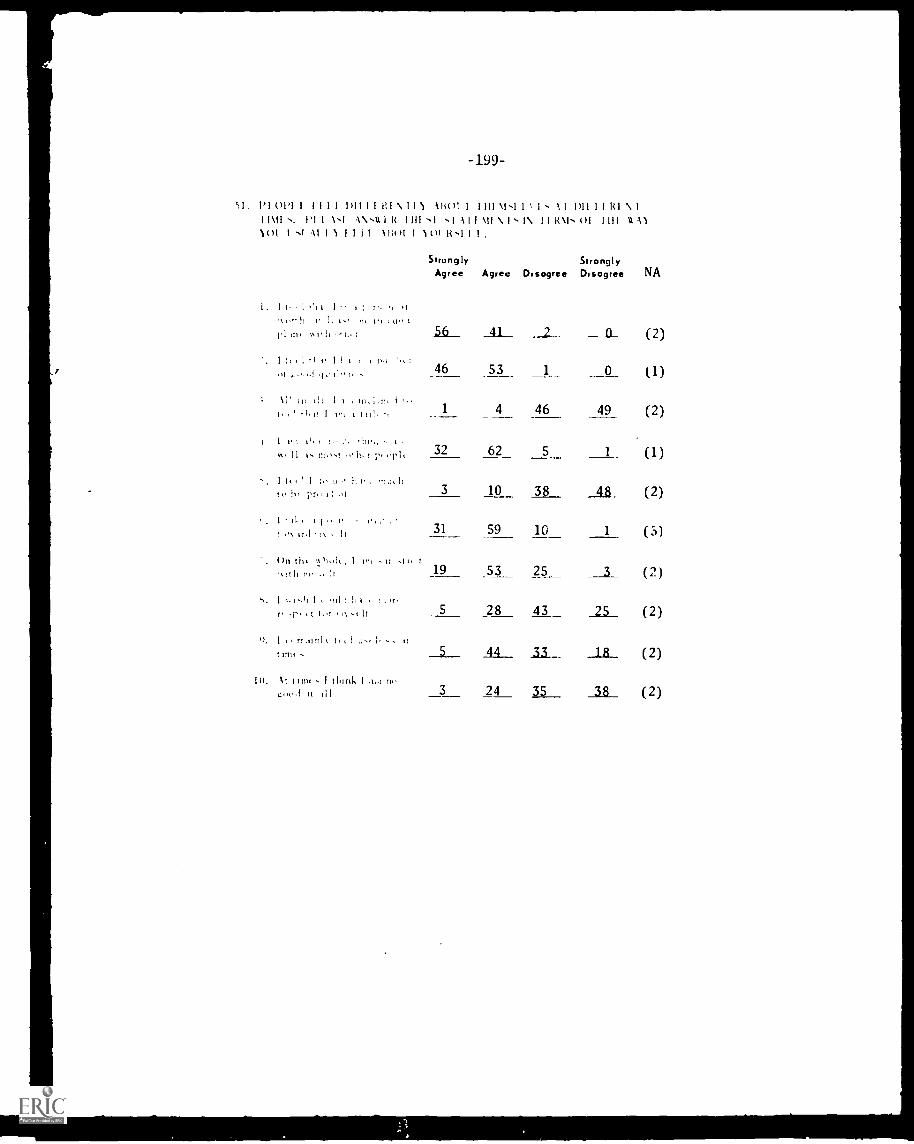
-199
5 1 . I ' l UPI 1 11 1 1 nil 1 1 RI \ 111 11t0I I 1111\1,1 I 1 s 11 1)11 1 1 RI \11\11 s. 1'1 I 1s1 -1\ s11 R 1111 s1 'I 111 111 \ I' I\ I 1101s ()I 1111 u 11101 1 si -11 1 1 1 1 11 list/( I 101 Rs1 1 1 .
Strongly StronglyAgree Agree Disagree Disagree NA
I. 1 1 ; r-'1, I .11 I/ t At,
pl Int t,I ,11. 56 _41_ _ CL (2)
46 53 0 (1)
11' in III 1 in,4 46 49 (2)
I t I tit., o
\tt 11 I, IttI`t ht r 1" "PI' 32 62 5 1 (1)
1 ft 1 It 1,
1: ,0 3 10 38 (2)
31 59 10 1 (3)
. On tilt 'A 11°1, , 1 1- -, it .t t, t
,. ;tit ri, !t _19 53 25 ___3_ (2)
s,. I ..,.1, I ,,,I I ),, , , , ,I,
r, ,r, kt tor , o. -., It 28 43_ 25 (2)
I n attil tt- it5 4 4 _31._ ( 2 )
(1. it I I Mt I thud. I .1,0 II,44,0.1 It 3 24 35 38 (2)
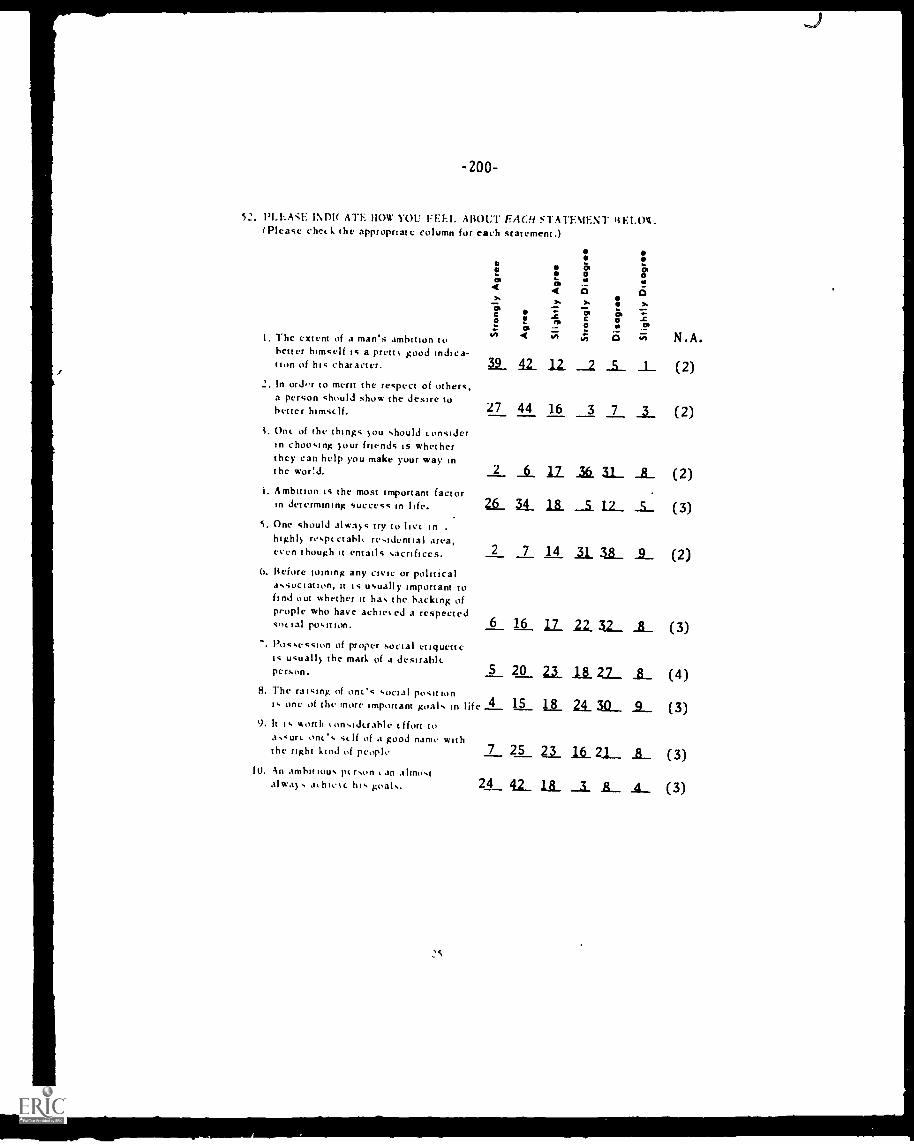
-200
52. PLEASE INDY ATE HOW YOU FEEL ABOUT EACH STATEMENT BE1,01.(Please cheek the appropriate column for each statement.)
1. The extent of a man's ambition tobetter himself is a prett% good indica-tion of his character.
2. In ord,r to merit the respect of others,a person should show the desire tobetter himself.
I. One of the things you should concederin choosing your friends is whetherthey can help you make your way inthe word.
i. Ambition is the most important factorin determining success in life.
S. One should always try to live in .
highly respectabli residential area,even though it entails sacrifices.
(i. Before wining any civic or politicalassociation, it is usually important tofind out whether it has the backing ofpeople who have achieeed a respectedsm. tat posit ton. 6 16 1/ 22_ 32_ _fi_ (3)
-. Possession of proper social etiquetteis usually the mark of a desirableperson. $ 20 a A21_ IL (4)
8. The raising of one's social positionone of the more important goals in life 4___ 15 ais 21 312_ _9_ (3)
a
enst
32_ AL 12.
27 44 16
2 _6_
26 3_4_
2 7
a
iii0
ili N.A.
__2 _5_ _1_ (2)
3 7 3 (2)
12_ lb. 3L IL (2)
II _5_ 12_ _5_ (3)
14 31_ Iii_ 2_ (2)
9. It is worth i.onsiderable effort toassure one's self of a good name withthe right kind of people
10. An ambitious person e an almostalways aihieec his goals.
IS
7 25 21 1.(2._ 2.1_,_ 1_ (3)
24_ 42_ 1.8_ _1 it__ A__ (3)
J
ADDITIONAL INFORMATION
STUDENT FORM C
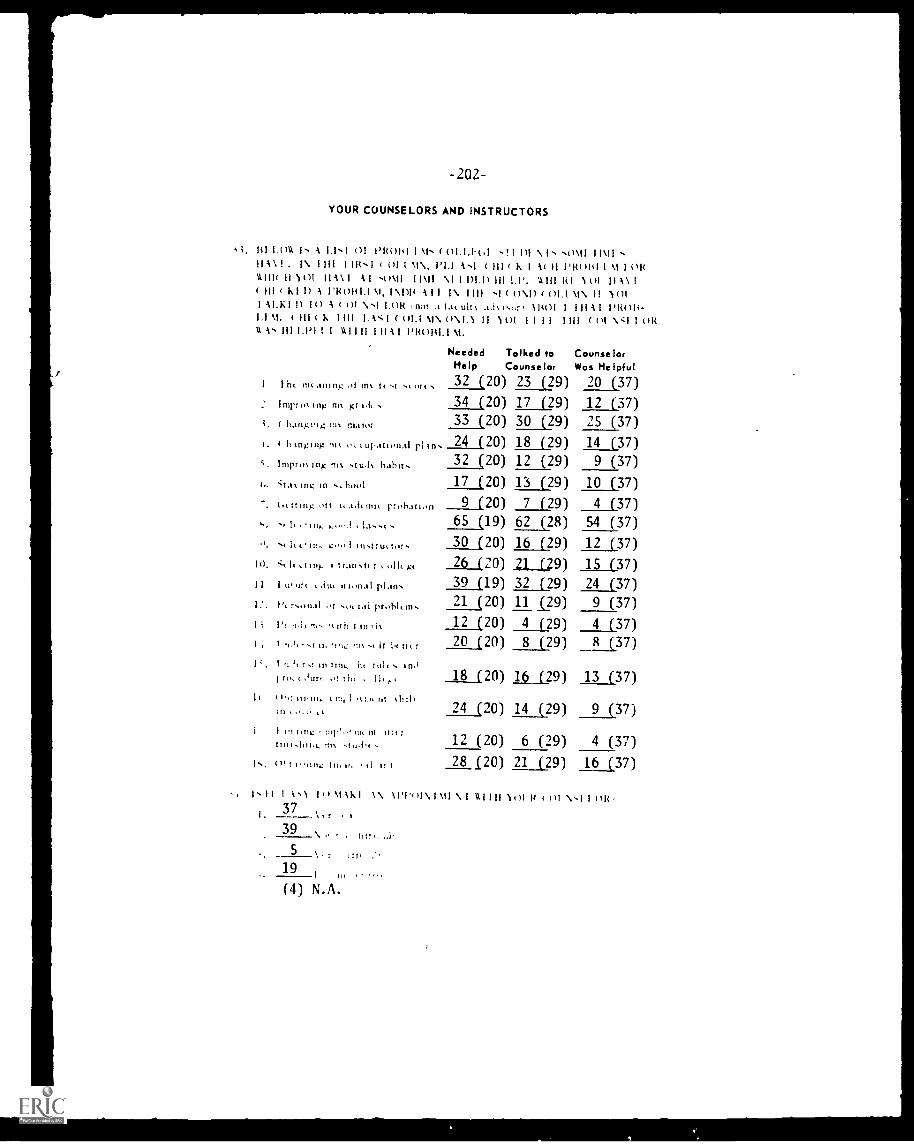
YOUR COUNSELORS AND INSTRUCTORS
1.011 1, A 1.1s 10! 1140141 I 01.1.1-(,1 \ I .0111 11\11111\ 1 1\ 1111 I IF`l 10! I 1%. PIA Ill k I 1( II IT( 4141 I i I OH\ Ill( II No! HA% I 1I -4) \11 11\11 \I 11)1.0 III LI'. '. In l01 II 1\ 1
III 11,1 I) A PROW] 11, 1 \DI( 1I I I III ',I 0\1) 01.111\ II NOII 11.1:1 I) 10 A ()I N.s1 LOH not .1 fa( tilt% 11401 I 1 111 I 1'1101+-
1.1 11. III (F 1111 I.1' I ( 01.1 11\ 0\1.1 II 101 I 1 11 1111 ( 01 V;I I OltU As III 1.1)1 I 1 111111 1 1111 PHOBIA \I.
Needed Tallied to CounselorHelp Counselor Was Helpful
I I hi mianing Mx It NI 32 (20) 23 (29) (37)
Improxilig rg 34 (20) 17 (29)
_20
12 (37)
;. hatigitig inx mato: 33 (20) 30 (29) 25 (37)
t. I hanging 11% iupational r1 In 24 (20) 18 (29) 14 (37)
s. Irnprox ing rn u.1% habit - 32 (20) 12 (29) 9 (37)
(,. nig ..hool 17 (20) 13 (29) 10 (37)
(,t thug of 1 ua.l, tint probation 9 (20) 7 (29) 4 (37)
.65 (19) 62 (28) 54 (37)
instructors 30 (20) 16 (29) 12 (37)
"'tit 'Ain}, tr.inst( r on, gt 26 (20) 21 (29) 15 (37)
I ut us, plan. 39 (19) 32 (29) 24 (37)
r.,11.11 or IA Nob!, in. 21 (20) 11 129) 9 (37)
I I': t. oh t 12 (20) 4 (29) 4 (37)
1,
I'.ful,
i II
.11%
tin,.
kit .,hi
20 (20) 8 (29) R (37)
I ft, ,!111, ilt 18 (20) 16 (29) 13 (37)
(). 111, If,
r,
m,
II II I
24 (20) 14 (29) 9 (37)
12 (20) 6 (29) 4 (37)
28 120) 21 (29) 16 (37)
1%11 I \1 14) \MI \l'I'01\1\11 aiin WI 14 VI I tilt-73I. -- T I
39N. ,J
5 itt,19
(4) N.A.
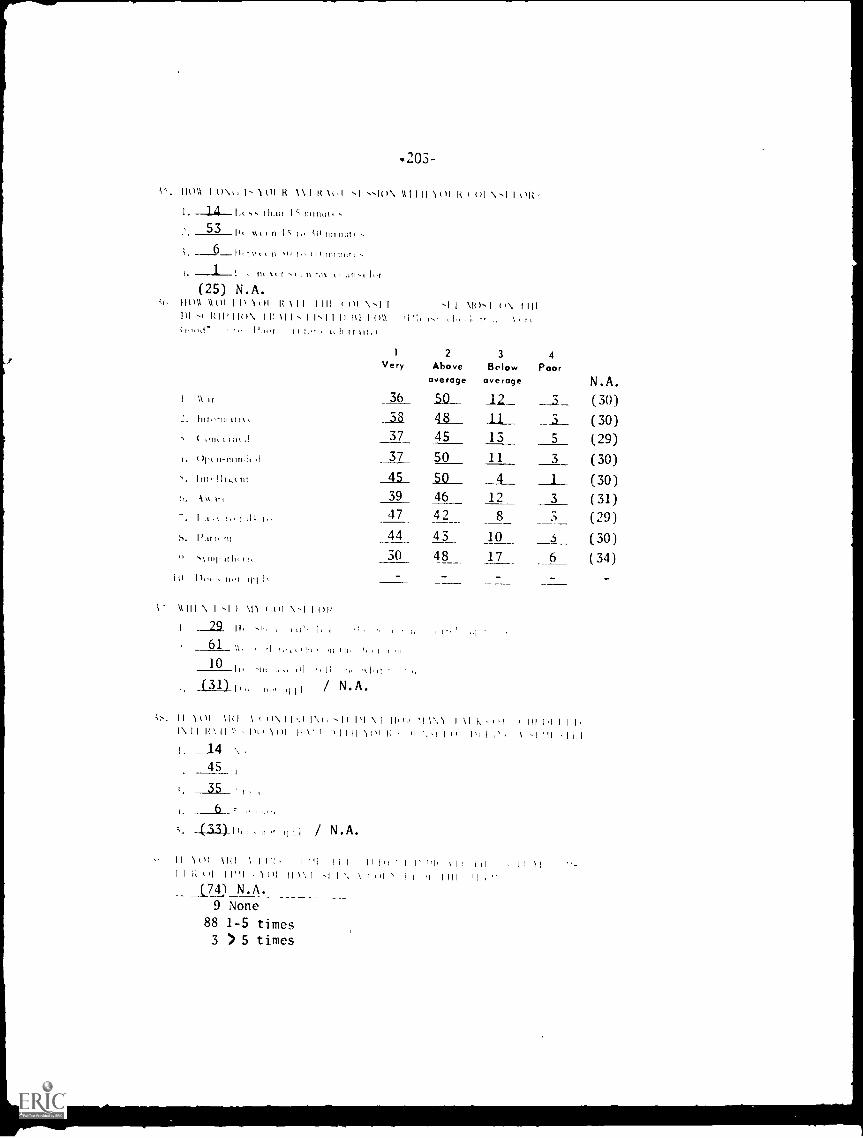
.203-
. )%k I ( \ t till It 111 H kk,I \kiln 1()1 H t t,l v..1 I t)H..
than I InInnt..-.
53 1,, ,,, w44444,44,, .
ss44,4, It IIJ It. 1111111.1tt
I. t !It 1t r 11 Int t 1111 t h.(
(25) N.A.ism \kw 11))01 \is I III «),1)1 - P11'11()N. 11' \IN 1 1,11 111s1 1 ()1,),
.,. tr tit.'
-.1 I \it j ()N. 1111
1 2 3 4Very Above Below Poor
overage overage N.A.
s
t.
I.
S.
t\
1111,rd. It
t.11 , ti
( 11,t 11-mindt
Int, Ilia_tit
At, Irt
PAH.
1111, 111
_36
38
50 AI__
fl_13
__3__
__I_
5
(30)
(30)
(29)
(30)
(30)
(31)
(29)
(30)
(34)
48
37
37
45
50 11 3
__.L_
3
3
3
45 50 _A__
1239 46
47 42
43
48
8
10
17
44
30 6
" ant trt
plll \ 1,11 \11 ( ttl \-11 lit
I 29 is,
61 ,,,,i,44 44,4;4, ,4
10 11, 't
C31) 11 ,111 / N.A.
rtt
II lilt CPI «)\11\11.t. ,11 \1 Ili:: '1\ \1 1 11 K 11\111C.11\' I)() WI III: ',MI NIll 1'1
I. _14
45
35 H
4. 6_
s 4444 / N.A.
11 1()1 \ I 11:-I 1'11 11 1 111,1'1.1 IC (11 11'11 1()1 11 \`, I -I 1 \ tt1
741 N . A
9 None
88 1-5 times
3 5 times
III Id 1 11.11 1
I iIi 1111 1! 11
I 1111
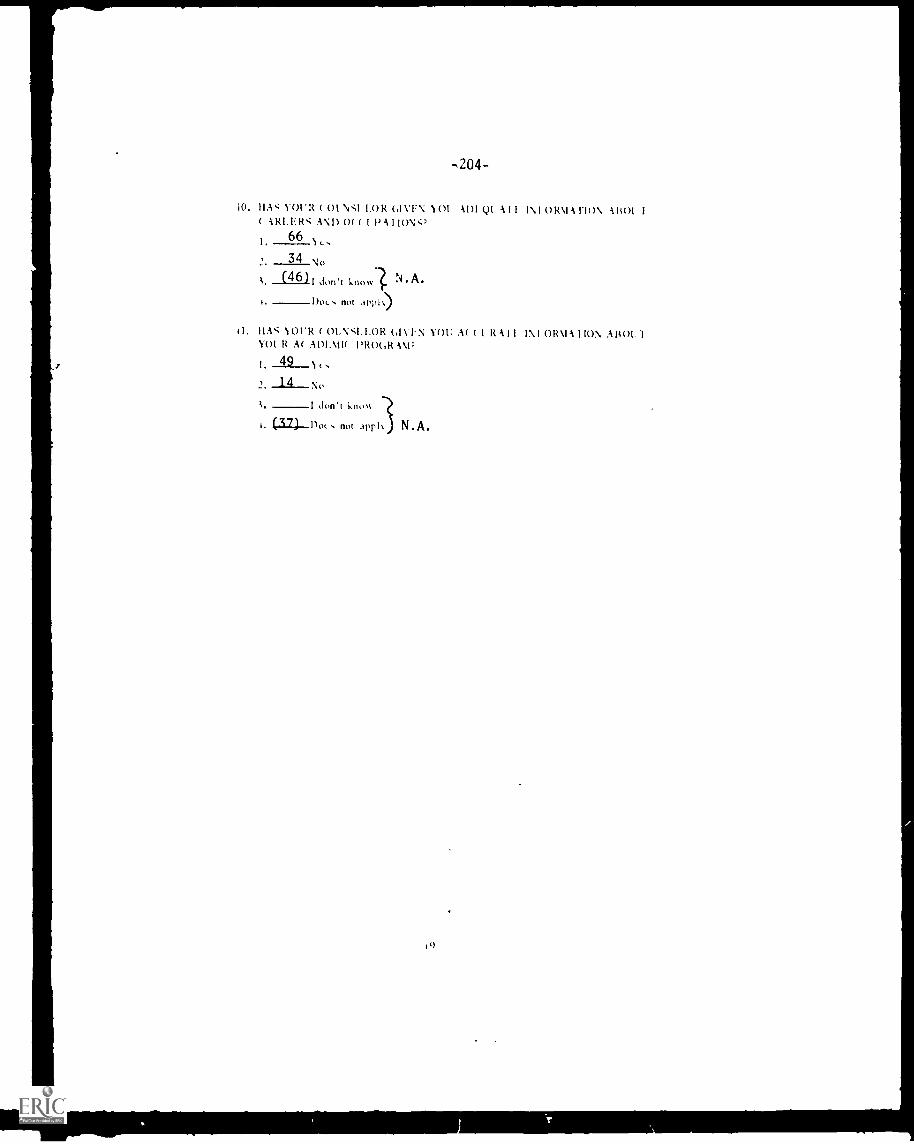
-2.04-
O. II.l \OUR ( Ng 1.0 R \'F\ 101 AIM Ql Al I I \I ORM A FION 1401 I
( ARLLRti ANO O( ( A 1 IOW61. 66
34 N1115.11 Isn'k 1
Doc... not drink)
I . BA' , 1 OUR ( OLN`z1.1.0R (ANA' N YOU A( ( I It A I IM ORM A 110:\ A} OL1YOl R A( A DI:111( l'RO(IR
I. 42-1No
I don't knov
I. (17) 1)0(... not .,ph, N.A.
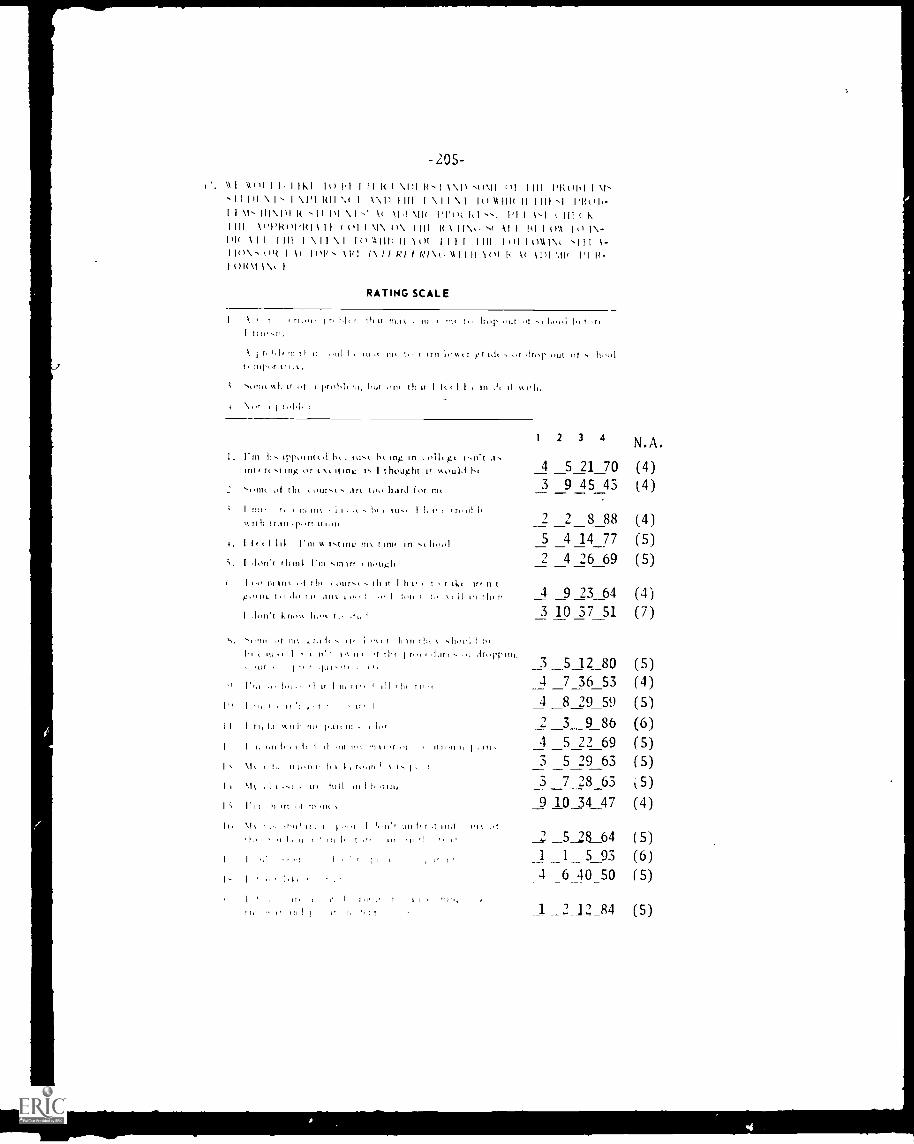
-205-
\11 \\I'M' 111\1 Ii) Id I 11 It I \DI \ \It Ill! Milli,'\ 1, \pi RH Noi 1 \It I III I \II \I I() Aim Ii
I III .1 lok01,-I Hi\ i( .11 Ill \I At kid Alit pro( 1,1 1,1 1 ( III (
1111 \ 11 t (Ill \I\ II\ 1111 R1 11\,..-a Al I Ill I 01 lit 1 \-1,11 All 1111 1 \11 \1 11) A1111 1111)1 1111 IIII Itit I ()Aki\(, 1-1 l()\ ()It 1 ( ki,'; R/ I R/\(, \kill! Atli R k( kill ',Ill I'l ft-()1 \ 'N.,
RATING SCALE
N.A.
(4)(4)
(4)(5)(5)
(4)(7)
(5)(4)(5)(6)(5)(5)(5)(4)
(5)(6)(5)
(5)
1 \ r.tt 1 n IJ, t Ih it t4,
1 tln,,t.\ ILI, III 0111
L ,LIII I L u1 .1 nit t,, ifll Intttr fn.1.t ,r11%.
4q I Nob!, m, 1)11t tll It I ft 111 II
1...,1 h. t
r Ifiq' 1.11( t)1
I.
1.
"
I I
1N
t.
I'm trpoint,,I h., tint 4,1 Ing 10 tolkgt t,tt t .11
11111 rt tug or 1. I thought it N.ould 1-u
of th, ,0111,t art too hard for nit
I nu, t, n, nn L 11, .1 ILI ILA., 1 t It
M. 1111 f111.r,rt
I 114 I'll) Y. 1..41111' int t It111 Irl Ilt)41
I .11,11'1 I hlf14 ...111I(1 t ti ii
I t t, to ill% ,t tits t our,, - th It I It t t4,t ir n t}, its t ,..ht. 111 1.1,t` t t, 11 1'1 !Ili Pi
I t,Lit 111 ,I.1 it 111 1.,, t 11 to tilt 1 IL.
ill., I I r/' I, It III, I r,n, l,t.
l', I,n ,1 it I tt, t, 111 I1,0 tt,u
III I. 111.1 1'1
I It i,t m. to -
1, 1,11l l I LLI Ii Iiii11111-
I.,
VIt 1r I hill ti 1111/
h ,rt ,.t
\t, , 11,111 1t. I r,t,ti I 1,.itt uft tt r ,t iii nit ,,fLi IL I L" II
1 I L
lit I I I' t
i it ; t
1 2 3 4
4 _5 21 703 9 45 43
2 2_8885 4 14 772 4 26 69
4 9 23 643 10 37 51
3 5 12 804 _7 36 53
_4 _8 29 592_3_9 864 5 22_693 _5 29_633 _7;8_639 10 34 47
_5_28_641_ 5 936_40_50
_2_12_84
4
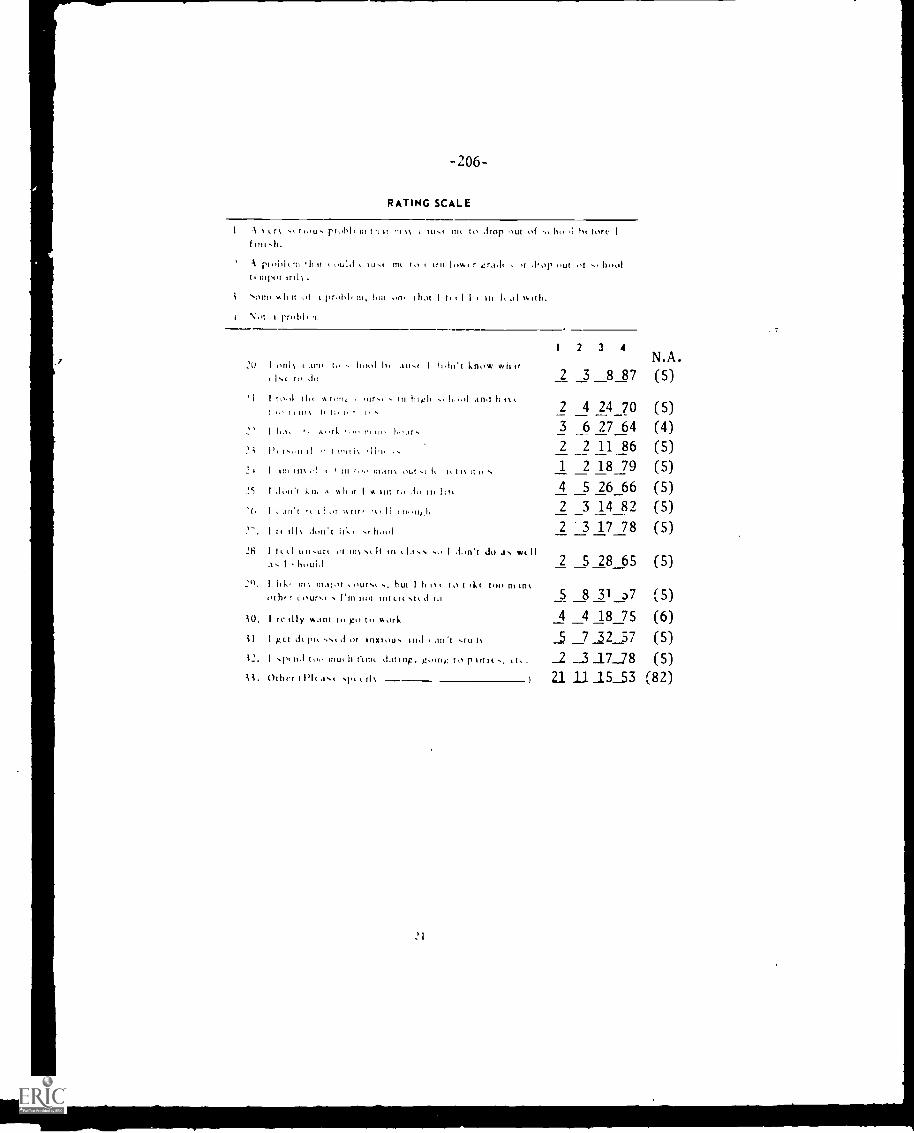
RATING SCALE
I A t t prohl t m t ti it 11 n t w., Mt to drop out of ,1 115 fore I
A plohla h ould Mt It 10%4 r grads , tr dop out bawlt Illpt.r urli
N55111 V.II It of ris, or on. that I f. ill, in It AI %%III,.
Not 1 prohl
N.A.(5)
(5)(4)(5)(5)(5)
20
'1
2;
2#
'S
I situ -. hiss! he .1INtIts JO
I to,,I it
t i., I ill! I, II, 1, t
I LI, 1,1
r,.#111 t 1-,11%
I ISIS III% Is,' utt
A 551111 I V. ant
I ii,In't know wit it
high and h tx
.5.11 it a. t IS I 14
ISIS
1
2
2
3
2
1
4
2
3
4
6
2
2
5
3 4
8 87
247027 6411 8618 7926 66
5 I ,,1 55fIt, t2 _3 _14_82 (5)
I ra all% .lon't Ilk, hiss! 2 3 17 78 (5)26 I i t s ) lloNLIrs ( If 111 Itn't do wt 11
AN I `11,Uld 2 5 28 65 (5)20. !I L ' .a.MAI,r ,aura but I h t., tot al ni.( too In!
oth, r I'm not utttrt.ttd III 5 8 31 D7 (5)I re ally want to go to work 4 4 18 75 (6)
it 1 g it ale pti d or inziou. Ind an t It _5 7 32 57 (5)I ,pt LIM going to p art at it, _2 _3 _17_78 (5)
ii. Other I a., .its 21 11 15_53 (82)
21

-207-
0. IN 101 R OPINION, I( A`,1.1) ON 1t IIA OF HUNK IS DI Ii.1 AMA , 111-111- S1 RI.N(0 AND AKNI.SSI'S 01 YOUR ( 'S I I -
DF.N F PIRSONNI I. SI RI( 1 ...;% (Plea.s check caih ippropriat 'Rm.)
NoStrong Averr ge Weak Opinion N.A.
I. Adintk,,Ion, rt. gist rat ion 23 50__ 18 10_ (6)
11 16 (7)'. lit Lord, and int iirin.t1011 19 55__
i. t Ind .I.1( Min t tIL1n, I in, 26 45 16 (7)
0.
I. (,uidank, antl 0, mond!
ounst ling 23 38 15 23 (7)
11 32 18 40 (8)S. t nient for virorl,
16 .7,3 14 37 (8)I. III Int IA
tit attr,t . , 18 57 23 22 (8),
8. 1t t tuI t 01111', 11111: f or
,Intagi.d 17 '2 12 49 (8)
,,al 1 run- lIng for utit nt.18 28 12 43 (8)wit 1, tit atit nu.
9.
11.1\1 1()I 1111.11) I() \\ -.110 l im (II I. I)) (1101.1( A( 11)1 MI( I \ \1 I IN 1111 1 \ 1 111() \t1 I
1 63 . I didn't ir
2. ___2_ NOM. I frit b, but t *. t 111 IIlt
5 t
9 ,.te,
5 6_ I hr 11111,
() --5 IOLIft MitI 11) n
(4) N.A.
\ I Ol I
11011 \\ 111 ' 1 \ RI 1 I( IV, I RII 11M It) 1-(11 I i/l< 11,\I I I \ \OI I IM (II ( I \
. R t n, 111r.WtII It III ti1 .11111 IIIti t th1 III
.56 Art );t Tin r Ill, n 111,11,il
5. ---3 I' t c1 111 I ill, 1101 I` 111,11,11
I. \11u0.1 Ilt \ t r 3\ !kitS. 1101 1111 ,1 t,, IIIIt1 0111
(3) N.A.
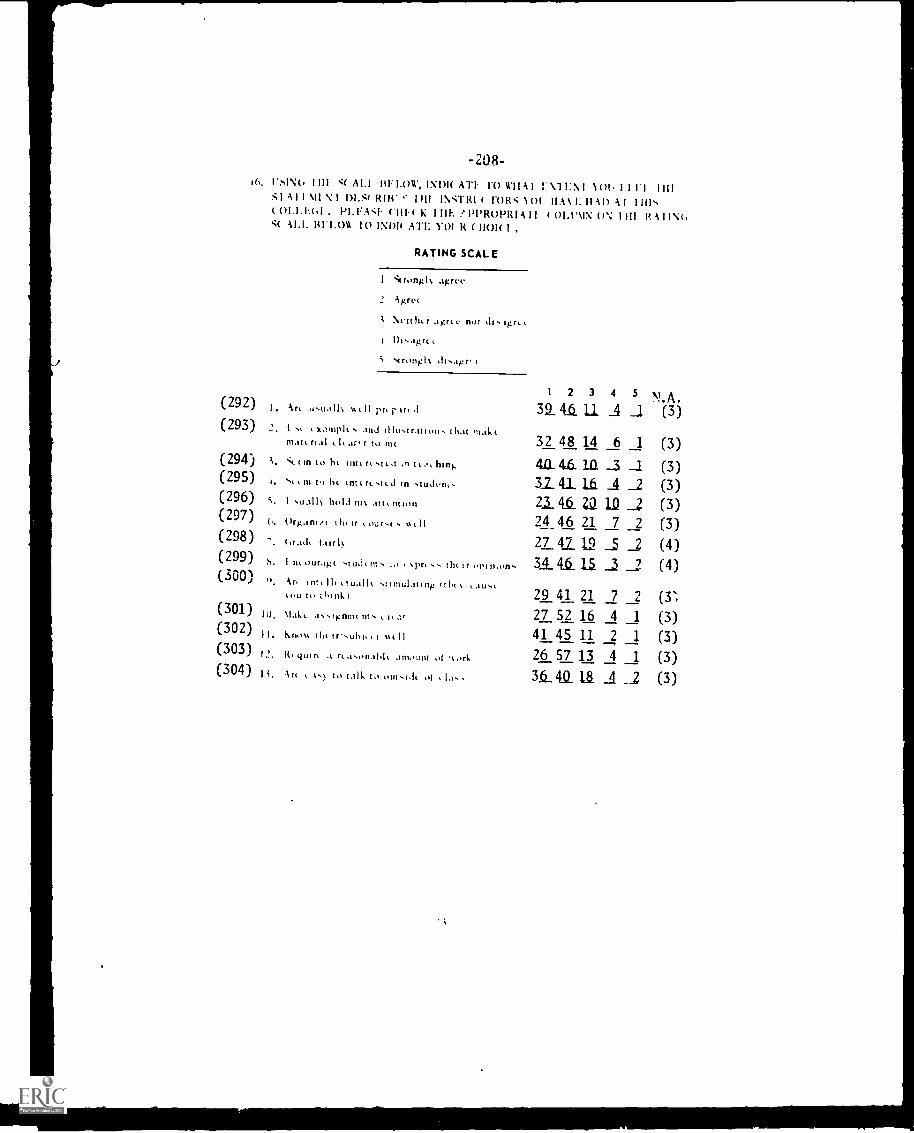
-208-16. ('s1\(. 1 III `4( AI.1 141,1.0W, INN( AT CO 1::\ 1 101. l I I I 1111
SI A I 1 \11 N 1 DI.S( 1(114. I III INCTRI ( MRC ID( HA \ 1: II AD A I I01.1.1".(11 . PI.FA'I CHI( K I 111-..-'1)PROPRIA II ( 01.I' \IN UN I III R A I IN;(,
AI.1. 1111.M 10 INN( ATI: 1'01 R ( NOR I .
RATING SCALE
Strong Is agree
2 Agret
Nett ht r agrt e nor tits tgrit
1)1..igrt
strong) t thsagr.
1 2 3 4 5 N.A.(292) 1. UUArk ut Il pr.. p if t 32 4_6_ 11 4 _1 (3)(293) 2. 1 st xamplt s and Illustrations that malt
matt. nal Lit r to nit 32 48 14 6 1 (3)(294) I. *._ in to ht tint It.rt.t ,tt tt hung 4114.6. Da _3 _1 (3)(295) t. stun rt ht tnttItsttd to students 3_7_ 4116. _4 _2 (3)(296) S. I suallt, hold tat aft( ntton 23 41/ za 10 _2 (3)(297) Organtit Ott tr t ourst st 11 24_46 21 7 2 (3)(298) (aadt Inrlt 27 47 19 _Z (4)(299) S. I In. ouragt stud.. nt . .o s .. Ott tr ontnom 34 4115. (4)(300) Art Int.. lit ktuaIlt Imulatt ng tthtt taunt
ou to tImik 29 41 21 7 2 (3',(301) It). \Laa assignmc nts t it a, 27 52 16 4 1 (3)(302) I I. knot. Ilit t .%t II 41 45 11 2 1 (3)(303) 12. IIt quirt a ra asonahlt amount ot aorl, 26 57 13 4 1 (3)(304) Ii. Art .) to tan, to ouNI,It of t1.t. 3Si 4Q 1$ _4 __2 (3)
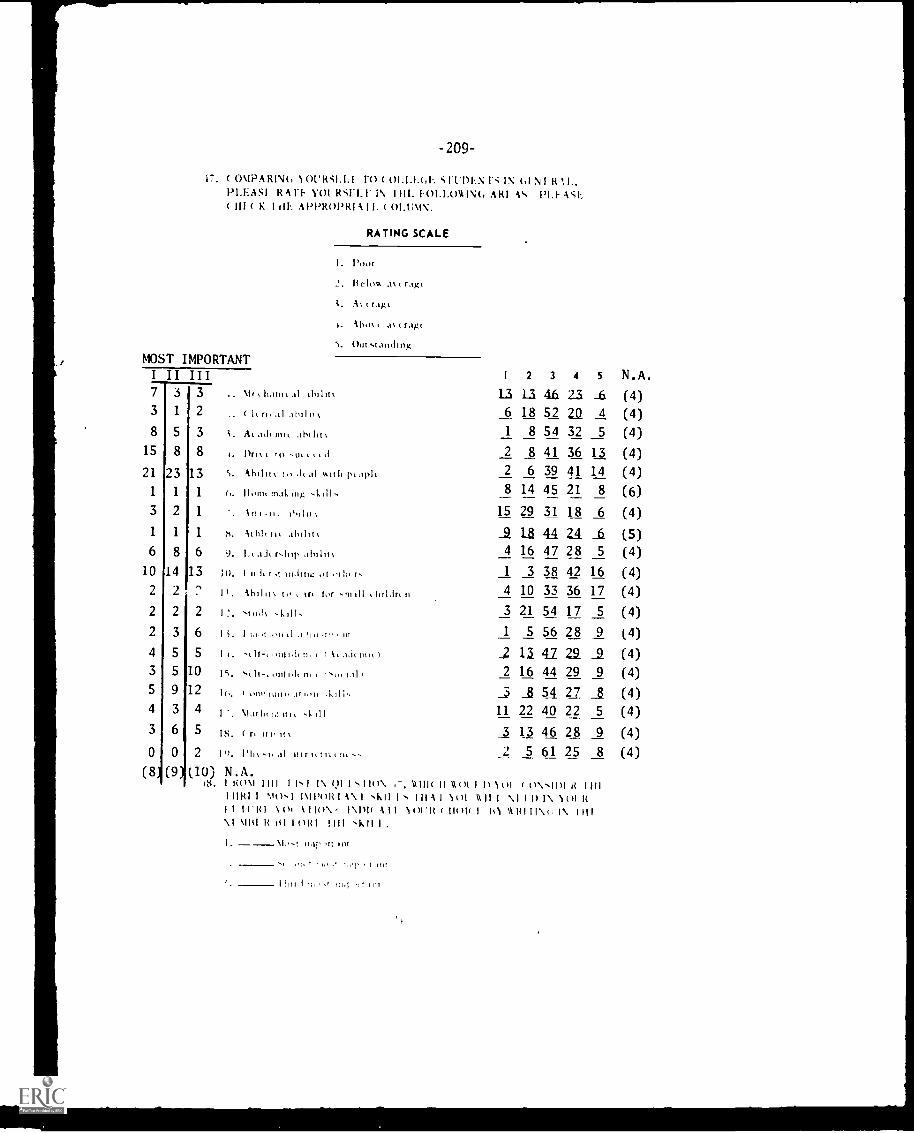
-209-
i7. ( OMPA RING 1OP RSI.1.1 1.0 ( 01.1.1.GE ,,,ruDEN N IN GI NI RPLEAS! R A Y01. RS1.1,1' IN I III. 1-01.1.01AING ARI Atil:( HI ( K I 11F. APPROPRI A I I. ( OLUAIN.
RATING SCALE
I. Poor
2. liclow at t rap
3. .At 1r.,F1(
MOST IMPORTANT
4. '1b'" rig(5. Out ',landing
1 2 3 4 5
13 13 46 2.3 1i6, 18 52 20 4
1 8 54 32 5
N.A.(4)(4)(4)
I II III.1/41,, ham,. tbil it\
iin,.,1 abllnt
adt rut. aim lit .
7
3
8
3
1
S
3
2
15 8 8 t. Orly( 1(1'-Ull lid 2 8 41 36 13 (4)21 23 13 5. Ability to .4 al with pt oply 2 6 39 41 14 (4)
1 1 1 (,. nom, nalsIng ..1.1 II 8 14 45 21 8 (6)3 2 1 ibilit 15 29 31 18 6 (4)1 1 1 h. \thlttlt .1bIllil 9. 111 44 24 .. (5)6 8 6 9. 1.t r-.1111, 4 16 47 28 5 (4)
10 14 13 10. I 1 3 38 42 16 (4)2 2 11. A bilit to to tor hildrt 4 10 33 36 17 (4)2 2 2 3 21 54 17 5 (4)2 3 6 1 i. i mI in t l .1 11t1 ,Irlt in 1 5 56 28 9 (4)4 5 5 I t. 't II ,1111,1( n. t t 1, ,1,1( mit 13 41 2-9 0 ( 4 )3 5 10 offildt t IA 1 2 16 44 29 9 (4)5 9 12 ,(.. t oiwou171, 1,1% 3 It 5A 27 __a (4)4 3 4 htiaui, ,11 11 22 40 22 5 (4)3 6 5 r14, N ltt 3 13 46 28 9 (4)0 0 2 .11 2 5 61 25 8 (4)
(8 (9 (10) N.A.is.
I 1"1 1111 I IN I i I I-, "II( \1t,1 1 1) (0 \'11)1 i41 1 1 14 1 1 MO', I I 11 1'014 1 A \ 1 'k 1 1 1 1 1 1 A 1 101 4111 1 \1 1 0 1 \ 1 01 14
I i()\' \I 1" All "11( 11011 N i\1 41111 14 01 1 014 1 !II1 smi
41 11.11'''1I tot--oIt I
I I11 i In -1 11111 11 till

-210-
0, ( ( ) 1 1 1 ' 1 1 1 1 I ) I ( ) ( ( ) I I I ( . 1 , I 1 1 1 1 \ 1 - I \ (.I \ I k 11 l'I I 1,1 R11 INM It 1111011 II 1)1 \ 1, 11 1111, II N. I()R i MI 1(,I I\ 1111 101.-1 (1111\0 11(1 1- 1'11 '1,1 ( III ( IN I III 1l'1,1(t)1'1(1,1 II ( 01111%,
RATING SCALE
I .
1.
1.
S.
S.
ii
III
I I.
I .
11.
I I.
I .
i .
I -.
I",
l'..
--,. ()tat, In 1111.
2 3 4
5 75 169 74 169 64 23
13 58 228 64 22
10 75 119 61 20
10 58 2511 64 2011 61 218 74 12
15 64 1610 72 1310 hiS 1.8
6 65 ,..)10 64 2112 70 14_8 63 23
5 71 17
5
3
1
2
5
5
2
5
64
5
4
2
3
_45
3
2
5
5
N.A.(16)(16)(15)(15)(15)(19)(17)(17)(16)(16)(20)(16)(17)
(16)(17)(17)(17)(17)(16)
\I. 111iti. il thiltt,
( I, rt, :I thilits
AL .Iii, nil , ibIllt%
11m ( t., ',LI« t. t ii
1,11II% (if kit 11 ,i ,C,, 1,, ,iiiii
H. 1,1 I II- Iii, ' 1 :Ill
'frit sfli thin
1fIllt'1i Ihdli .
I id, r liii doll' .
I it.t, I's( ill IIIIC of ,,(ht r.
111111IN I., , 11" t 'fit sill III l illl,iti fl'',1 ki i. .1.111,
I' illo(111.11 1,11t1,11,1, Ill
'l. It-,,lilt 1,1i il. I 'ii 'kit fIlli f
s 11- fillf 1.1f II. , , \,., 1 ,I ,
( olflItliilll 11..11 .1 ,11.
'1.1f Ili Ill if I. sl. Ills
i f f if ,. If l.
Ph% I l II'l li II% f 'If
I
1
1
2
_2
2
2
1
2
3
3
_32
_.1
1
2
2
2
3
-211-
7 TABLES TO CHAPTER S
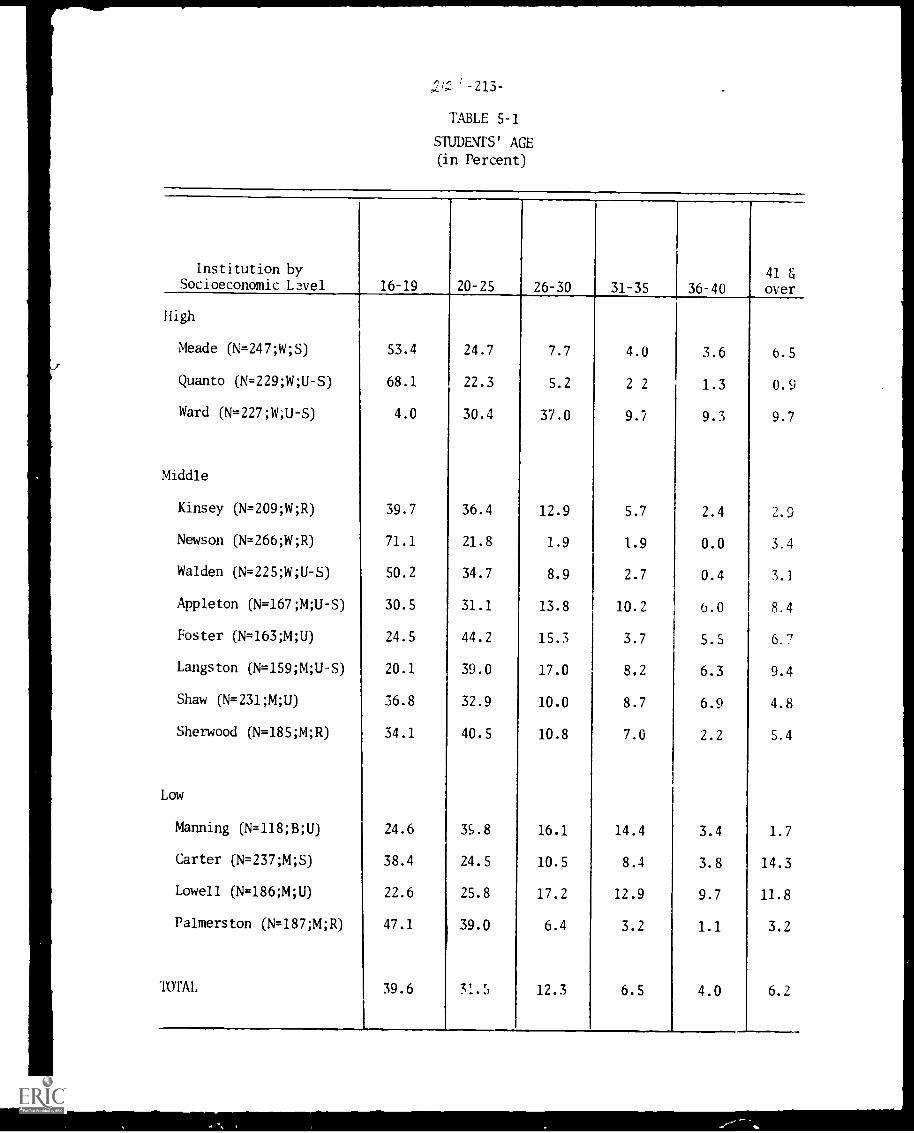
TABLE 5-1
STUDENTS' AGE
(in Percent)
Institution by 41 ti
Socioeconomic L..vel 16-19 20-25 26-30 31-35 36-40 over
High
Meade (N=247;W;S) 53.4 24.7 7.7 4.0 3.6 6.5
Quanto (N=229;W;U-S) 68.1 22.3 5.2 2 2 1.3 0.9
Ward (N=227XU-S) 4.0 30.4 37.0 9.? 9.3 9.7
Middle
Kinsey (N=209;W;R) 39.7 36.4 12.9 5.7 2.4 2.9
Newson (N=266;W;R) 71.1 21.8 1.9 1.9 0.0 3.4
Walden (N=225;W;U-S) 50.2 34.7 8.9 2.7 0.4 3.1
Appleton (N=167;M;U-S) 30.5 31.1 13.8 10.2 6.0 8.4
Foster (N=163;M;U) 24.5 44.2 15.3 3.7 5.5 6.7
Langston (N=159;M;U-S) 20.1 39.0 17.0 8.2 6.3 9.4
Shaw (N=231;M;U) 36.8 32.9 10.0 8.7 6.9 4.8
Sherwood (N=185;M;R) 34.1 40.5 10.8 7.0 2.2 5.4
Low
Manning (N=118;B;U) 24.6 35.8 16.1 14.4 3.4 1.7
Carter (N=237;M;S) 38.4 24.5 10.5 8.4 3.8 14.3
Lowell (N=186;M;U) 22.6 25.8 17.2 12.9 9.7 11.8
Palmerston (N= 187;M;R) 47.1 39.0 6.4 3.2 1.1 3.2
'IOTA!. 39.6 31.5 12.3 6.5 4.0 6.2
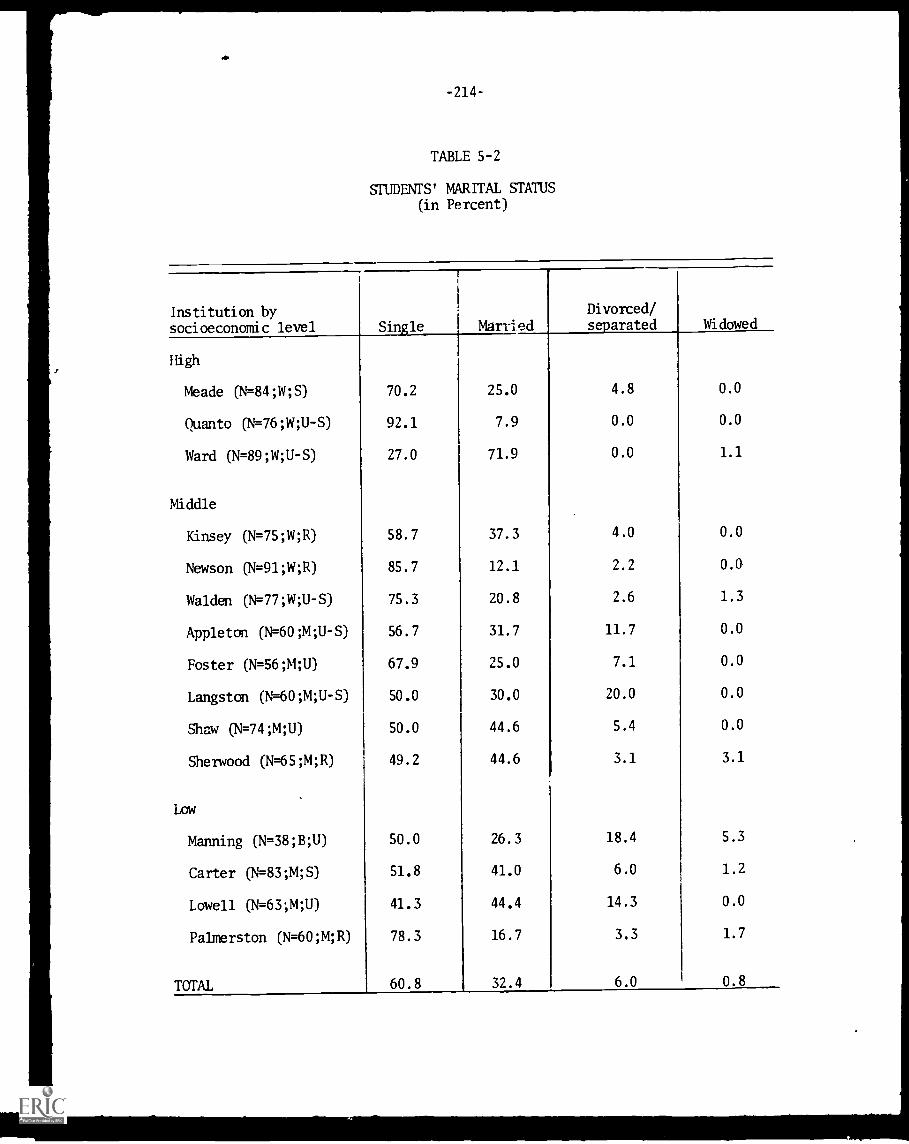
TABLE 5-2
STUDENTS' MARITAL STATUS(in Percent)
Institution bysocioeconomic level Single Married
Divorced/separated Widowed
High
Meade (N=84;W;S) 70.2 25.0 4.8 0.0
Quanto (N= 76;W;U -S) 92.1 7.9 0.0 0.0
Ward (N= 89;W;U -S) 27.0 71.9 0.0 1.1
Middle
Kinsey (N=75;W;R) 58.7 37.3 4.0 0.0
Newson (N=91;W;R) 85.7 12.1 2.2 0.0
Walden (N=77;W;U-S) 75.3 20.8 2.6 1.3
Appleton (N=60;M;U-S) 56.7 31.7 11.7 0.0
Foster (N=56;M;U) 67.9 25.0 7.1 0.0
Langston (N=60;M;U-S) 50.0 30.0 20.0 0.0
Shaw (N= 74;M;U) 50.0 44.6 5.4 0.0
Sherwood (N= 65;M;R) 49.2 44.6 3.1 3.1
Low
Manning (N=38;B;U) 50.0 26.3 18.4 5.3
Carter (N=83;M;S) 51.8 41.0 6.0 1.2
Lowell (N=63;M;U) 41.3 44.4 14.3 0.0
Palmerston (N=60;M;R) 78.3 16.7 3.3 1.7
TOTAL 60.8 32.4 6.0 0.8
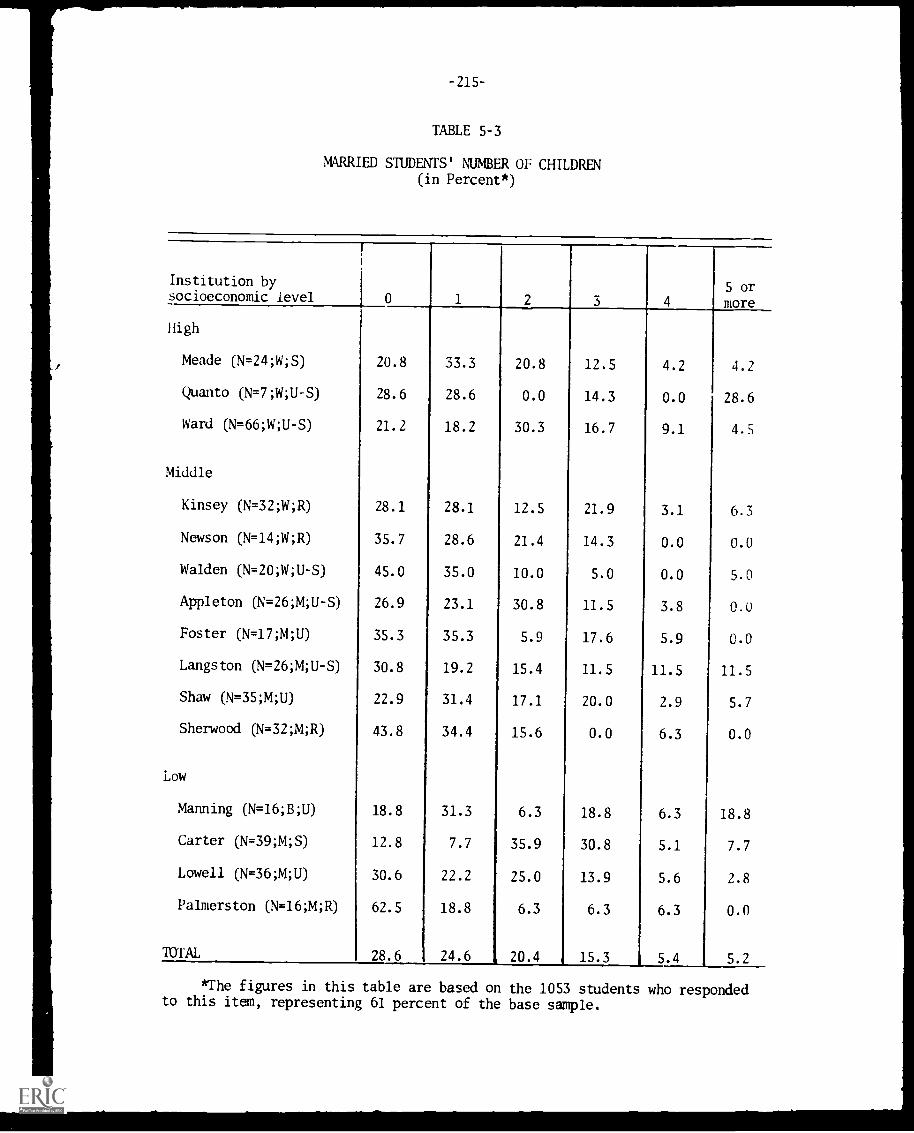
TABLE 5-3
MARRIED STUDENTS' NUMBER OF CHILDREN(in Percent*)
Institution bysocioeconomic level 0 1 2 3 4
5 or
more
High
Meade (N=24;W;S) 20.8 33.3 20.8 12.5 4.2 4.2
Quanto (N=7;W;U-S) 28.6 28.6 0.0 14.3 0.0 28.6
Ward (N=66;W;U-S) 21.2 18.2 30.3 16.7 9.1 4.5
Middle
Kinsey (N=32;W;R) 28.1 28.1 12.5 21.9 3.1 6.3
Newson (N=14;W;R) 35.7 28.6 21.4 14.3 0.0 0.0
Walden (N=20;W;U-S) 45.0 35.0 10.0 5.0 0.0 5.0
Appleton (N=26;M;U-S) 26.9 23.1 30.8 11.5 3.8 0.0
Foster (N=17;M;U) 35.3 35.3 5.9 17.6 5.9 0.0
Langston (N=26;M;U-S) 30.8 19.2 15.4 11.5 11.5 11.5
Shaw (N=35;M;U) 22.9 31.4 17.1 20.0 2.9 5.7
Sherwood (N= 32;M;R) 43.8 34.4 15.6 0.0 6.3 0.0
Low
Manning (N=16;B;U) 18.8 31.3 6.3 18.8 6.3 18.8
Carter (N=39;M;S) 12.8 7.7 35.9 30.8 5.1 7.7
Lowell (N=36;M;U) 30.6 22.2 25.0 13.9 5.6 2.8
Palmerston (N=16;M;R) 62.5 18.8 6.3 6.3 6.3 0.0
TOTAL 28.6 24.6 , 20.4 15.3 5.4 5.2
*The figures in this table are based on the 1053 students who respondedto this item, representing 61 percent of the base sample.
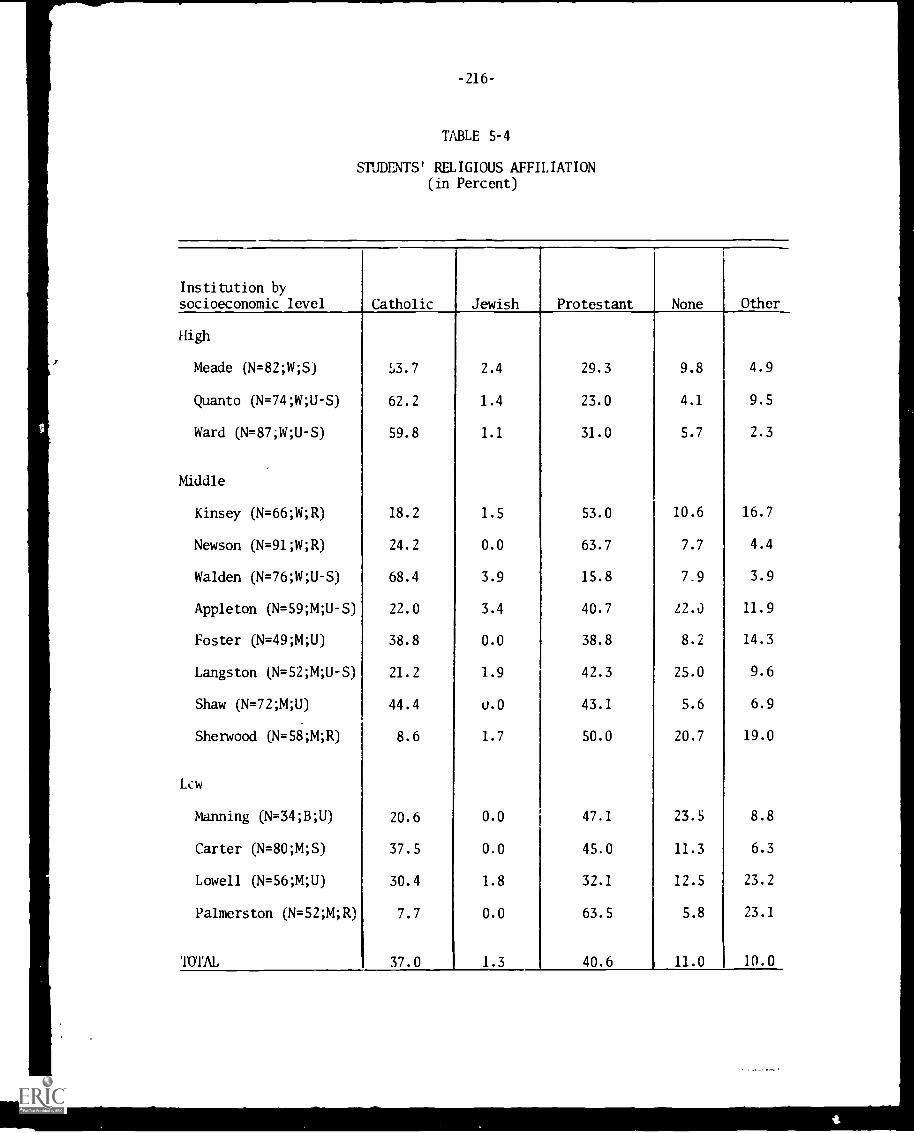
TABLE 5-4
STUDENTS' RELIGIOUS AFFILIATION(in Percent)
Institution bysocioeconomic level Catholic Jewish Protestant None Other
High
Meade (N=82;W;S) L3.7 2.4 29.3 9.8 4.9
Quanto (N= 74;W;U -S) 62.2 1.4 23.0 4.1 9.5
Ward (N=87;W;U-S) 59.8 1.1 31.0 5.7 2.3
Middle
Kinsey (N=66;W;R) 18.2 1.5 53.0 10.6 16.7
Newson (N=91;W;R) 24.2 0.0 63.7 7.7 4.4
Walden (N=76;W;U-S) 68.4 3.9 15.8 7.9 3.9
Appleton (N=59;WU-S) 22.0 3.4 40.7 12.) 11.9
Foster (N=49;M;U) 38.8 0.0 38.8 8.2 14.3
Langston (N= 52;M;U -S) 21.2 1.9 42.3 25.0 9.6
Shaw (N=72;M;U) 44.4 U.0 43.1 5.6 6.9
Sherwood (N=58;M;R) 8.6 1.7 50.0 20.7 19.0
Lcw
Manning (N=34;B;U) 20.6 0.0 47.1 23.5 8.8
Carter (N=80;M;S) 37.5 0.0 45.0 11.3 6.3
Lowell (N= 56;M;U) 30.4 1.8 32.1 12.5 23.2
Palmerston (N=52;M;R) 7.7 0.0 63.5 5.8 23.1
TOTAL 37.0 1.3 40.6 11.0 10.0
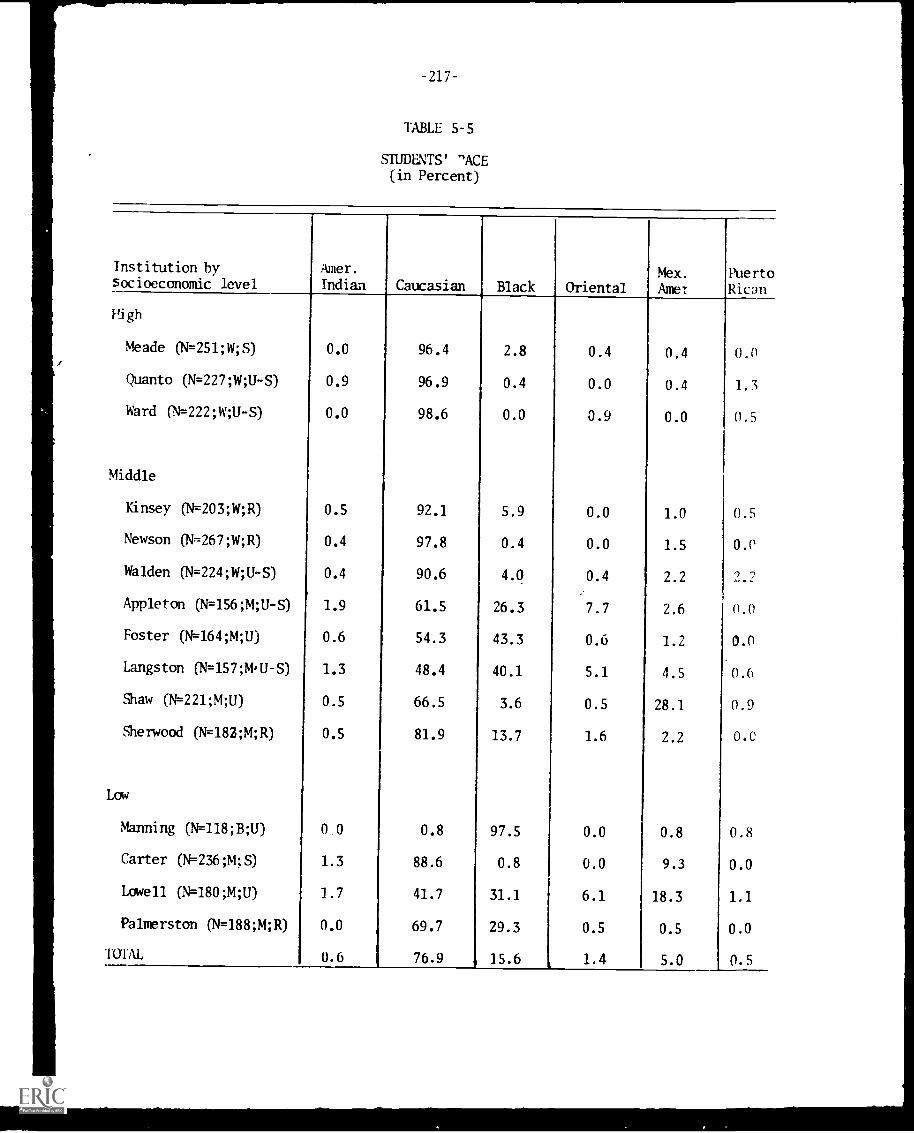
-217-
TABLE 5-5
STUDENTS' 'ACE(in Percent)
Institution bysocioeconomic level
Amer.
Indian Caucasian Black OrientalMex.
AmetPuertoRican
Nigh
Meade (N= 251;W;S) 0.0 96.4 2.8 0.4 0.4 0.0
Quanto (N=227;144U-S) 0.9 96.9 0.4 0.0 0.4 1.3
Ward (N= 222;W;U -S) 0.0 98.6 0.0 0.9 0.0 0.5
Middle
Kinsey (N= 203;W;R) 0.5 92.1 5.9 0.0 1.0 0.5
Newson (W-.267;W;R) 0.4 97.8 0.4 0.0 1.5 0.0
Walden (N=224;W;U-S) 0.4 90.6 4.0 0.4 2.2 2.?
Appleton (N=156;M;U-S) 1.9 61.5 26.3 7.7 2.6 0.0
Foster (N=164;M;U) 0.6 54.3 43.3 0.6 1.2 0.0
Langston (N=157;MU-S) 1.3 48.4 40.1 5.1 4.5 0.6
Shaw (N=221;M;U) 0.5 66.5 3.6 0.5 28.1 0.9
Sherwood (N= 183;M;R) 0.5 81.9 13.7 1.6 2.2 0.0
Low
Manning (N= 118;B;U) 0,0 0.8 97.5 0.0 0.8 0.8
Carter (N=236;M;S) 1.3 88.6 0.8 0.0 9.3 0.0
Lowell (N=180;M;U) 1.7 41.7 31.1 6.1 18.3 1.1
Palmerston (N=188;M;R) 0.0 69.7 29.3 0.5 0.5 0.0
TOTAL 0.6 76.9 15.6 1.4 5.0 0.5
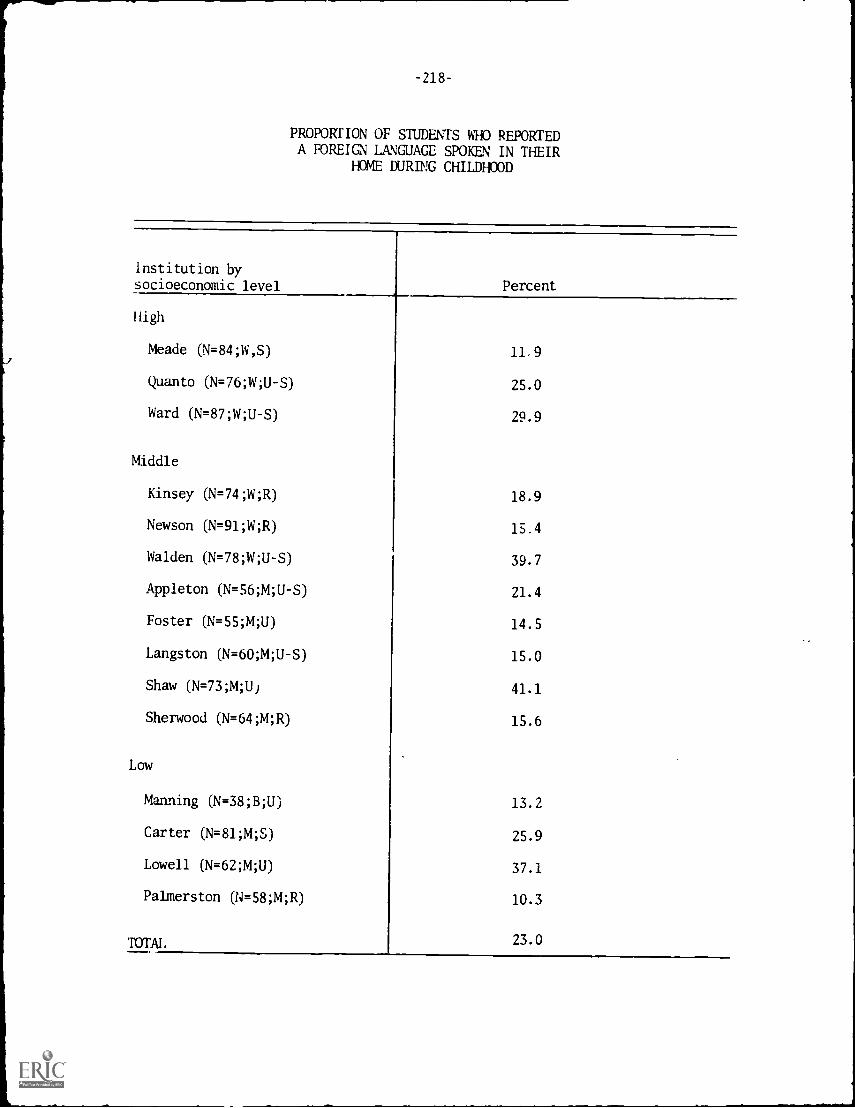
-218-
PROPORTION OF STUDENTS WHO REPORTEDA FOREIGN LANGUAGE SPOKEN IN THEIR
HOME DURING CHILDHOOD
institution bysocioeconomic level Percent
High
Meade (N=84;W,S) 11.9
Quanta (N=76;W;U-S) 25.0
Ward (N=87;W;U-S) 29.9
Middle
Kinsey (N=74;W;R) 18.9
Newson (N=91;W;R) 15.4
Walden (N=78;W;U-S) 39.7
Appleton (N=56;M;U-S) 21.4
Foster (N=55;M;U) 14.5
Langston (N=60;M;U-S) 15.0
Shaw (N=73;M;U) 41.1
Sherwood (N=64;M;R) 15.6
Low
Manning (N=38;B;U) 13.2
Carter (N=8104;S) 25.9
Lowell (N=62;M;U) 37.1
Palmerston (N=58;M;R) 10.3
TOTAI. 23.0
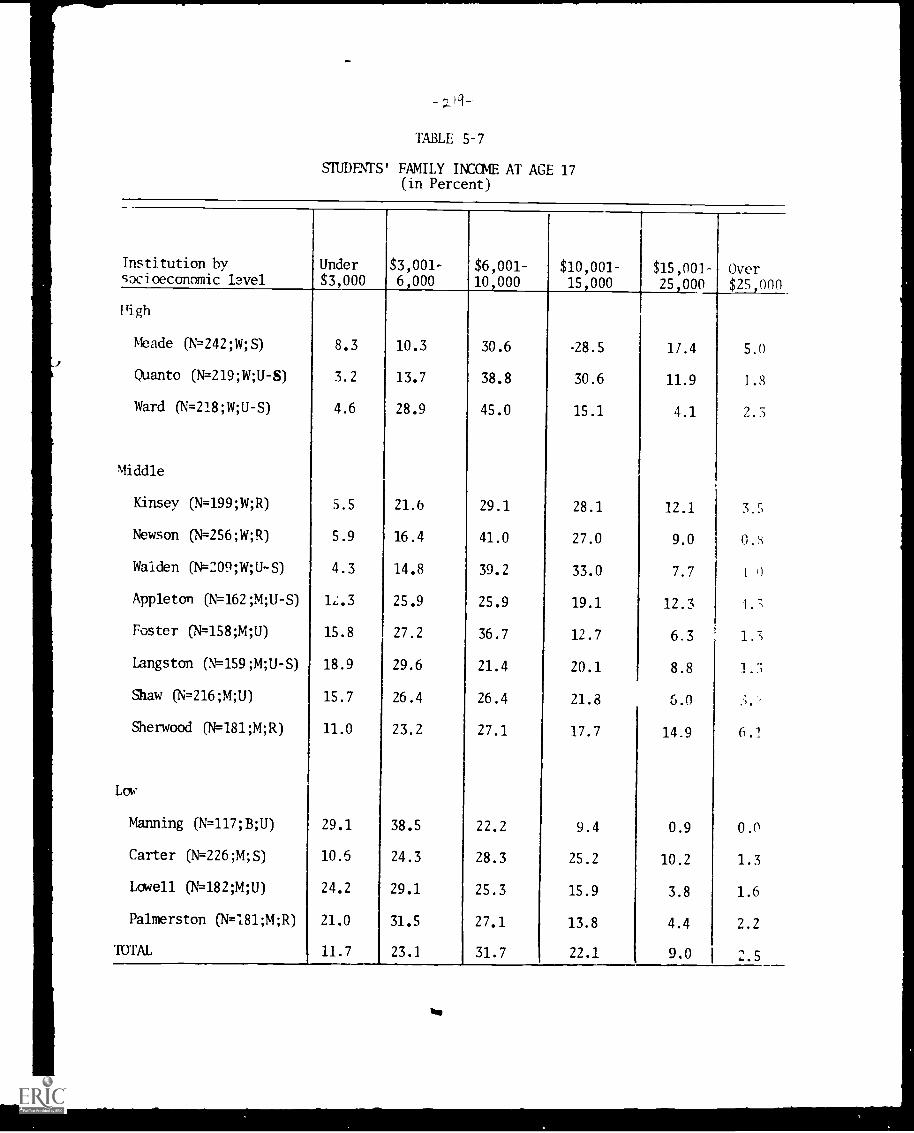
_ iq-
TABLE 5-7
STUDFNTS' FAMILY INCOME AT AGE 17(in Percent)
Institution bysocioeconomic lavel
Under$3,000
$3,001-6,000
$6,001-10,000
$10,001-15,000
$15,001-25,000
Over$25,000
High
Meade (N=242;W;S) 8.3 10.3 30.6 -28.5 11.4 5.0
Quanto (N=219;W;U-S) 3.2 13.7 38.8 30.6 11.9 1.8
Ward (N=218;W;U-S) 4.6 28.9 45.0 15.1 4.1 2.3
Middle
Kinsey (N= 199;W;R) 5.5 21.6 29.1 28.1 12.1 3.5
Newson (N= 256;W;R) 5.9 16.4 41.0 27.0 9.0 0.8
Walden (N=209;W;U-S) 4.3 14.8 39.2 33.0 7.7 i il
Appleton (N=162;M;U-S) 1,:.3 25.9 25.9 19.1 12.3 J.";
Foster (N= 158;M;U) 15.8 27.2 36.7 12.7 6.3 1.6
Langston (N=159;M;U-S) 18.9 29.6 21.4 20.1 8.8 1.".;
Shaw (N=216;M;U) 15.7 26.4 26.4 21.8 6.0
Sherwood (N=181;M;R) 11.0 23.2 27.1 17.7 14.9 6.1
Low
Manning (N=117;B;U) 29.1 38.5 22.2 9.4 0.9 0.0
Carter (N=226;M;S) 10.5 24.3 28.3 25.2 10.2 1.3
Lowell (N= 182;M;U) 24.2 29.1 25.3 15.9 3.8 1.6
Palmerston (N= 181;M;R) 21.0 31.5 27.1 13.8 4.4 2.2
TOTAL 11.7 23.1 31.7 22.1 9.0 2,5
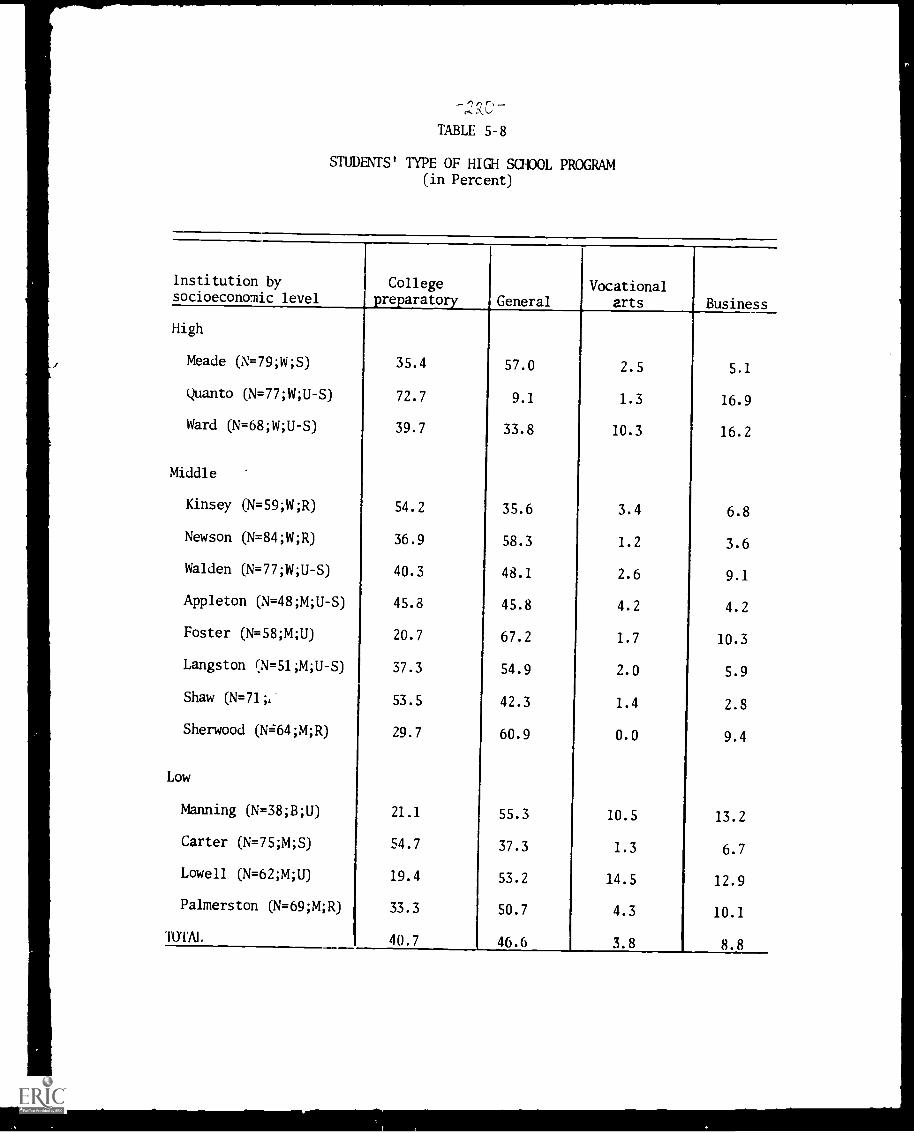
TABLE 5-8
STUDENTS' TYPE OF HIGH SCHOOL PROGRAM(in Percent)
Institution bysocioeconomic level
Collegepreparatory General
Vocationalarts Business
High
Meade (N=79;W;S) 35.4 57.0 2.5 5.1
Quanto (N=77;W;U-S) 72.7 9.1 1.3 16.9
Ward (N=68;W;U-S) 39.7 33.8 10.3 16.2
Middle
Kinsey (N= 59;W;R) 54.2 35.6 3.4 6.8
Newson (N= 84;W;R) 36.9 58.3 1.2 3.6
Walden (N=77;W;U-S) 40.3 48.1 2.6 9.1
Appleton (N=48;M;U-S) 45.8 45.8 4.2 4.2
Foster (N=58;M;U) 20.7 67.2 1.7 10.3
Langston (N= 51;M;U -S) 37.3 54.9 2.0 5.9
Shaw ON=71;,- 53.5 42.3 1.4 2.8
Sherwood (N=64;M;R) 29.7 60.9 0.0 9.4
Low
Manning (N=38;B;U) 21.1 55.3 10.5 13.2
Carter (N=75;M;S) 54.7 37.3 1.3 6.7
Lowell (N=62;M;U) 19.4 53.2 14.5 12.9
Palmerston (N=69;M;R) 33.3 50.7 4.3 10.1
THAL 40.7 46.6 3.8 8.8
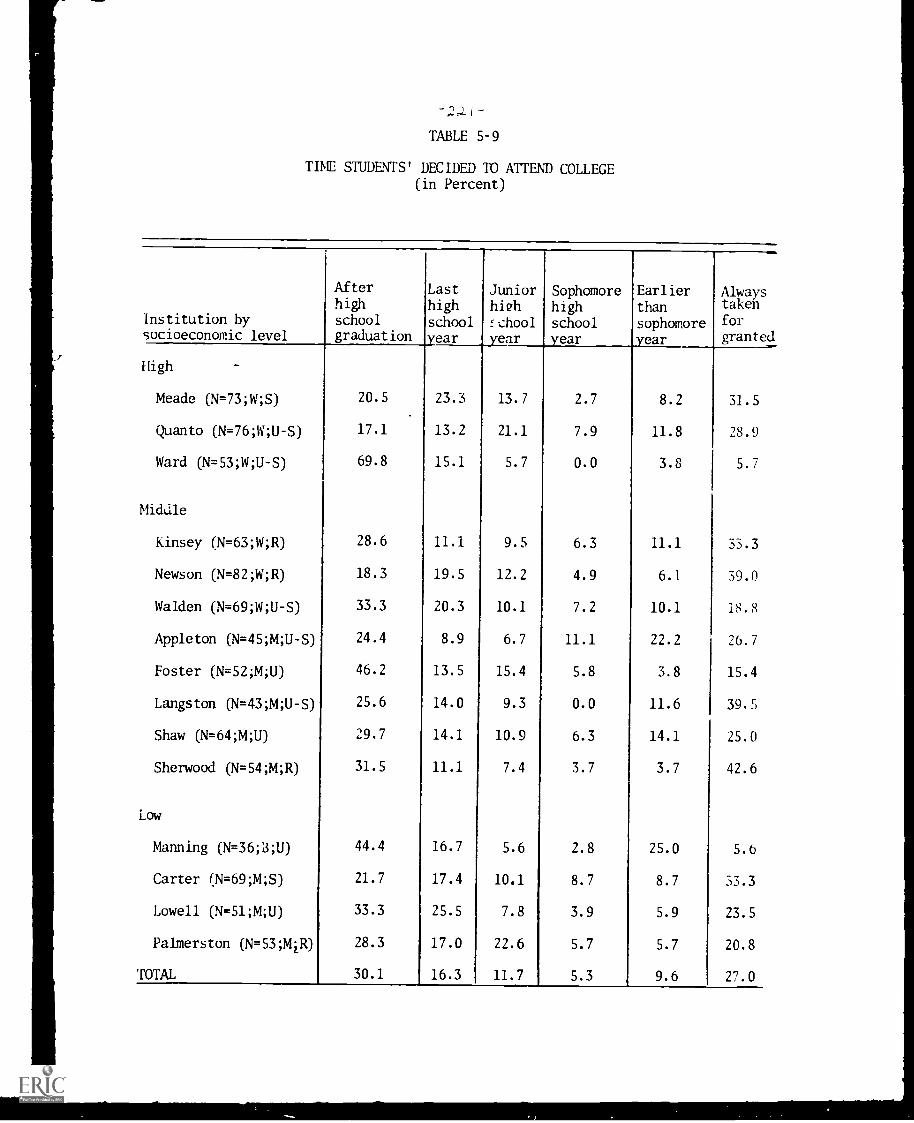
TABLE 5-9
TIME STUDENTS' DECIDED TO ATTEND COLLEGE(in Percent)
Institution bysocioeconomic level
Afterhighschoolgraduation
Last
highschoolyear
Juniorhighfchoolyear
Sophomorehighschoolyear
Earlierthan
sophomoreyear
Alwaystaken
forgranted
High
Meade (N=73;W;S) 20.5 23.3 13.7 2.7 8.2 31.5
Quanto (N=76;W;U-S) 17.1 13.2 21.1 7.9 11.8 28.9
Ward (N=53;W;U-S) 69.8 15.1 5.7 0.0 3.8 5.7
Middle
Kinsey (N=63;W;R) 28.6 11.1 9.5 6.3 11.1 33.3
Newson (N=82;W;R) 18.3 19.5 12.2 4.9 6.1 39.0
Walden (N=69;W;U-S) 33.3 20.3 10.1 7.2 10.1 18.8
Appleton (N=45;M;U-S) 24.4 8.9 6.7 11.1 22.2 26.7
Foster (N=52;M;U) 46.2 13.5 15.4 5.8 3.8 15.4
Langston (N=43;M;U-S) 25.6 14.0 9.3 0.0 11.6 39.5
Shaw (N=64;M;U) 29.7 14.1 10.9 6.3 14.1 25.0
Sherwood (N=54;M;R) 31.5 11.1 7.4 3.7 3.7 42.6
Low
Manning (N= 36;B;U) 44.4 16.7 5.6 2.8 25.0 5.6
Carter (N=69;M;S) 21.7 17.4 10.1 8.7 8.7 33.3
Lowell (N=51;M;U) 33.3 25.5 7.8 3.9 5.9 23.5
Palmerston (N=53;MiR) 28.3 17.0 22.6 5.7 5.7 20.8
TOTAL 30.1 16.3 11.7 5.3 9.6 27.0
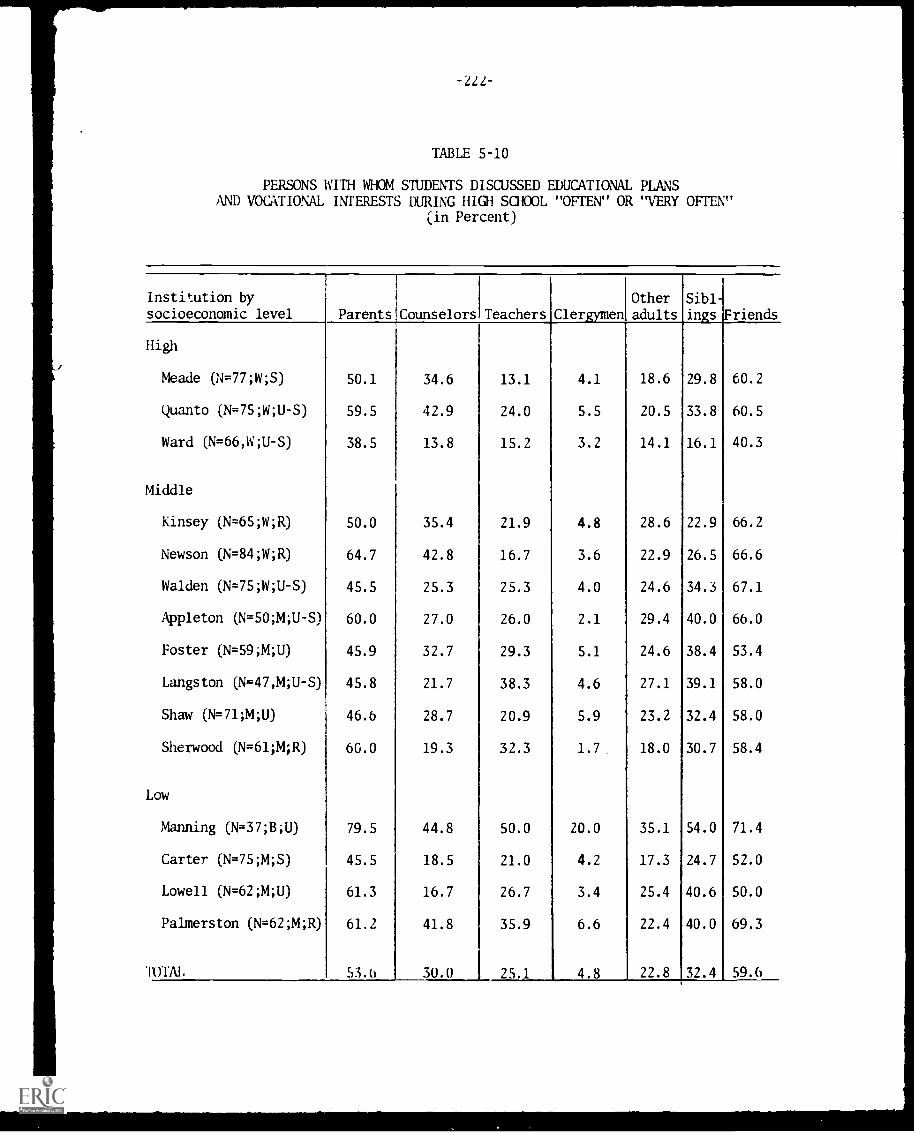
I
-222-
TABLE 5-10
PERSONS WITH WHOM STUDENTS DISCUSSED EDUCATIONAL PLANSAND VOCATIONAL INTERESTS DURING HIGH SCHOOL "OFTEN" OR "VERY MEN"
(in Percent)
Institution bysocioeconomic level Parents Counselors Teachers Clergymen
Other
adultsSibl-
ings Friends
High
Meade (N=77;W;S) 50.1 34.6 13.1 4.1 18.6 29.8 60.2
Quanto (N= 75;W;U -S) 59.5 42.9 24.0 5.5 20.5 33.8 60.5
Ward (N=66,W;U-S) 38.5 13.8 15.2 3.2 14.1 16.1 40.3
Middle
Kinsey (N=65;W;R) 50.0 35.4 21.9 4.8 28.6 22.9 66.2
Newson (N= 84;W;R) 64.7 42.8 16.7 3.6 22.9 26.5 66.6
Walden (N=75;W;U-S) 45.5 25.3 25.3 4.0 24.6 34.3 67.1
Appleton (N= 50;M;U -S) 60.0 27.0 26.0 2.1 29.4 40.0 66.0
Foster (N=59;M;U) 45.9 32.7 29.3 5.1 24.6 38.4 53.4
Langston (N=47,M;U-S) 45.8 21.7 38.3 4.6 27.1 39.1 58.0
Shaw (N=71;M;U) 46.6 28.7 20.9 5.9 23.2 32.4 58.0
Sherwood (N= 61;M;R) 60.0 19.3 32.3 1.7_ 18.0 30.7 58.4
Low
Manning (N=37;B;U) 79.5 44.8 50.0 20.0 35.1 54.0 71.4
Carter (N=75;M;S) 45.5 18.5 21.0 4.2 17.3 24.7 52.0
Lowell (N=62;M;U) 61.3 16.7 26.7 3.4 25.4 40.6 50.0
Palmerston (N=62;M;R) 61.2 41.8 35.9 6.6 22.4 40.0 69.3
TODI 53.6 30.0 25.1 4.8 22.8 32.4 59.6
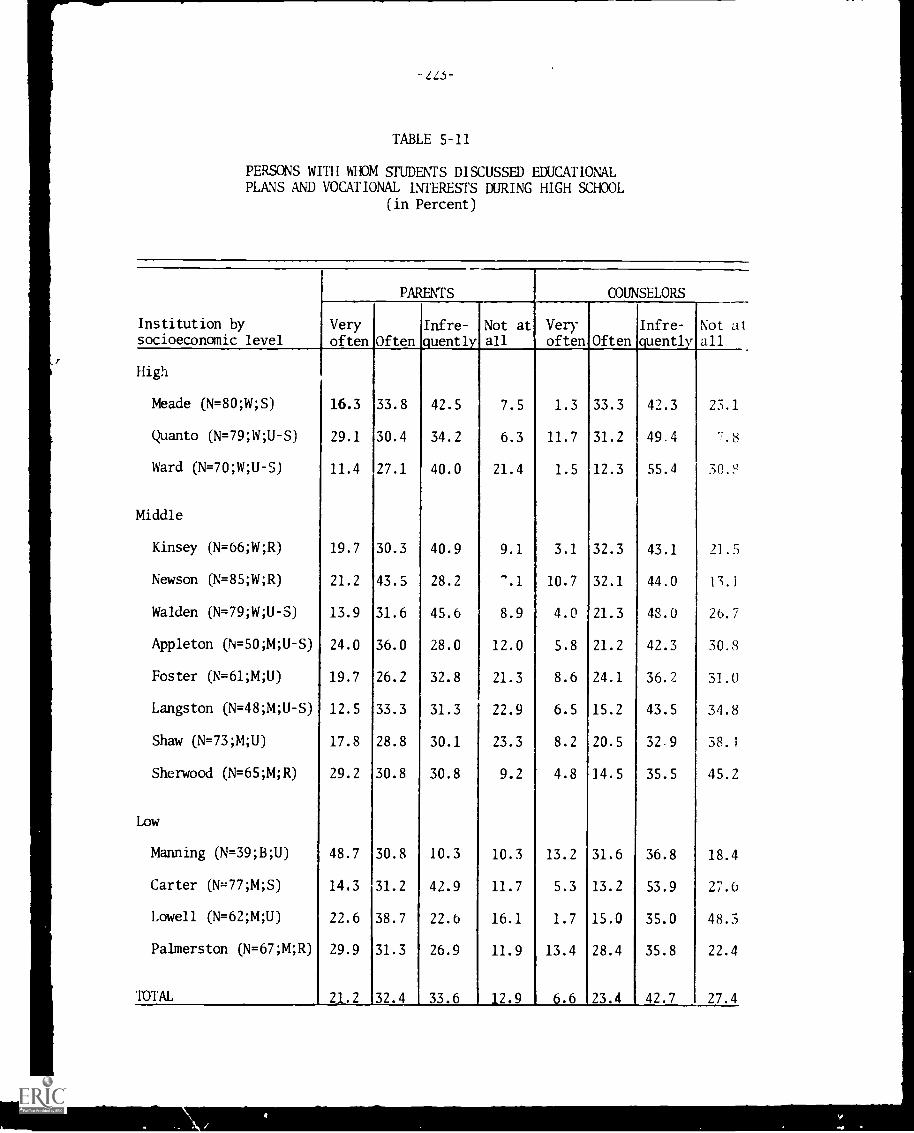
TABLE 5-11
PERSONS WITH WHOM STUDENTS DISCUSSED EDUCATIONALPLANS AND VOCATIONAL INTERESTS DURING HIGH SCHOOL
(in Percent)
Institution bysocioeconomic level
PARENTS COUNSELORS
Veryoften Often
Infre-
quentlyNot atall
Veryoften Often
Infre-
quentlyNot atall
High
Meade (N=80;W;S) 16.3 33.8 42.5 7.5 1.3 33.3 42.3 23.1
Quanto (N=79;W;U-S) 29.1 30.4 34.2 6.3 11.7 31.2 49.4 -.8
Ward (N=70;W;U-S) 11.4 27.1 40.0 21.4 1.5 12.3 55.4 30.S
Middle
Kinsey (N=66;W;R) 19.7 30.3 40.9 9.1 3.1 32.3 43.1 21.5
Newson (N=85;W;R) 21.2 43.5 28.2 -.1 10.7 32.1 44.0
Walden (N=79;W;U-S) 13.9 31.6 45.6 8.9 4.0 21.3 48.0 26.7
Appleton (N=50;M;U-S) 24.0 36.0 28.0 12.0 5.8 21.2 42.3 30.S
Foster (N= 61;M;U) 19.7 26.2 32.8 21.3 8.6 24.1 36.2 31.0
Langston (N= 48;M;U -S) 12.5 33.3 31.3 22.9 6.5 15.2 43.5 34.8
Shaw (N=73;M;U) 17.8 28.8 30.1 23.3 8.2 20.5 32 -9 38.1
Sherwood (N=65;M;R) 29.2 30.8 30.8 9.2 4.8 14.5 35.5 45.2
Low
Manning (N= 39;B;U) 48.7 30.8 10.3 10.3 13.2 31.6 36.8 18.4
Carter (N= 77;M;S) 14.3 31.2 42.9 11.7 5.3 13.2 53.9 27.0
Lowell (N=62;M;U) 22.6 38.7 22.b 16.1 1.7 15.0 35.0 48.3
Palmerston (N=67;M;R) 29.9 31.3 26.9 11.9 13.4 28.4 35.8 22.4
TOTAL 21.2 32.4 33.6 12.9 6.6 23.4 42.7 27.4
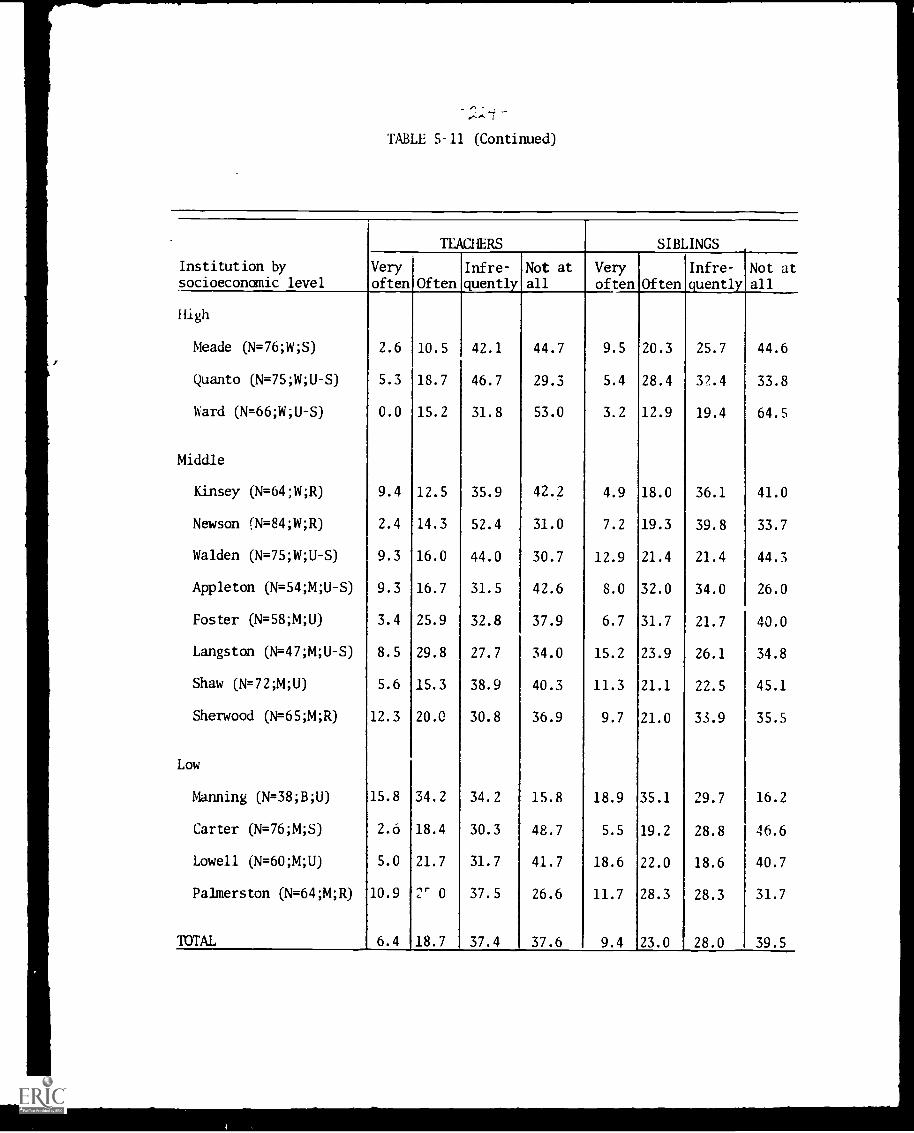
TABLE 5-11 (Continued)
Institution bysocioeconomic level
TEACHERS SIBLINGS
Veryoften Often
Infre-
qmentlyNot atall
Veryoften Often
Infre-
quentlyNot atall
High
Meade (N= 76;W;S) 2.6 10.5 42.1 44.7 9.5 20.3 25.7 44.6
Quanto (N=75;W;U-S) 5.3 18.7 46.7 29.3 5.4 28.4 32.4 33.8
Ward (N=66;W;U-S) 0.0 15.2 31.8 53.0 3.2 12.9 19.4 64.5
Middle
Kinsey (N= 64;W;R) 9.4 12.5 35.9 42.2 4.9 18.0 36.1 41.0
Newson (N=84;W;R) 2.4 14.3 52.4 31.0 7.2 19.3 39.8 33.7
Walden (N=75;W;U-S) 9.3 16.0 44.0 30.7 12.9 21.4 21.4 44.3
Appleton (N=54;M;U-S) 9.3 16.7 31.5 42.6 8.0 32.0 34.0 26.0
Foster (N= 58;M;U) 3.4 25.9 32.8 37.9 6.7 31.7 21.7 40.0
Langston (N= 47;M;U -S) 8.5 29.8 27.7 34.0 15.2 23.9 26.1 34.8
Shaw (N=72;M;U) 5.6 15.3 38.9 40.3 11.3 21.1 22.5 45.1
Sherwood (N=65;M;R) 12.3 20.0 30.8 36.9 9.7 21.0 33.9 35.5
Low
Manning (N=38;B;U) 15.8 34.2 34.2 15.8 18.9 35.1 29.7 16.2
Carter (N= 76;M;S) 2.6 18.4 30.3 48.7 5.5 19.2 28.8 46.6
Lowell (N=60;M;U) 5.0 21.7 31.7 41.7 18.6 22.0 18.6 40.7
Palmerston (N=64;M;R) 10.9 2' 0 37.5 26.6 11.7 28.3 28.3 31.7
TOTAL 6.4 18.7 37.4 37.6 9.4 23.0 28.0 39.5
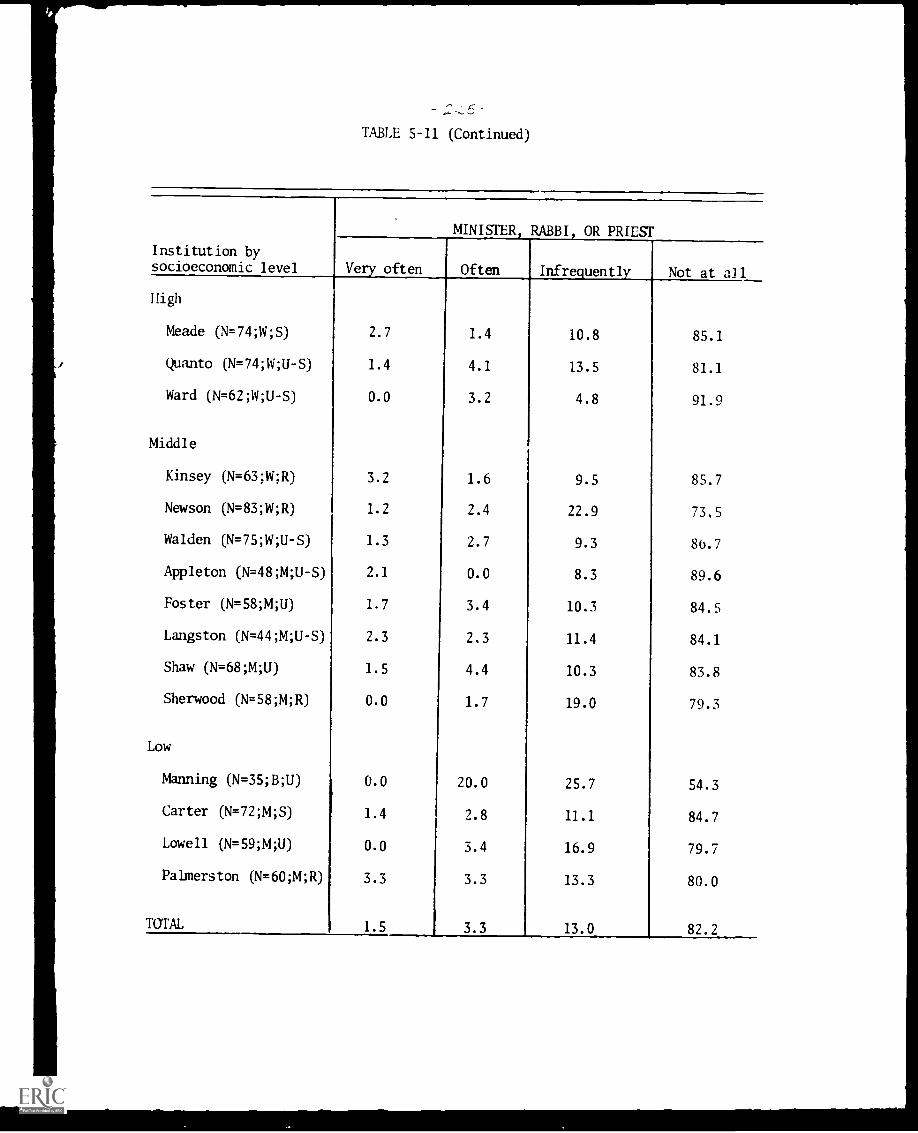
TABLE 5-11 (Continued)
Institution bysocioeconomic level
High
Meade (N=74;W;S)
Quanto (N=74;W;U-S)
Ward (N=62;W;U-S)
Middle
Kinsey (N=6304411)
Newson (N=83;W;R)
Walden (N=75;W;U-S)
Appleton (N=48AU-S)
Foster (N=58;M;U)
Langston (N=44;M;U-S)
Shaw (N= 68;M;U)
Sherwood (N=58;M;R)
Low
Manning (N=35;B;U)
Carter (N=72;M;S)
Lowell (N=59;M;U)
Palmerston (N=60;14;R)
TOTALI
MINISTER, RABBI, OR PRIEST
Very often Often Infrequently Not at all
2.7 1.4 10.8 85.1
1.4 4.1 13.5 81.1
0.0 3.2 4.8 91.9
3.2 1.6 9.5 85.7
1.2 2.4 22.9 73.5
1.3 2.7 9.3 86.7
2.1 0.0 8.3 89.6
1.7 3.4 10.3 84.5
2.3 2.3 11.4 84.1
1.5 4.4 10.3 83.8
0.0 1.7 19.0 79.3
0.0 20.0 25.7 54.3
1.4 2.8 11.1 84.7
0.0 3.4 16.9 79.7
3.3 3.3 13.3 80.0
1.5 3.3 13.0 82.2
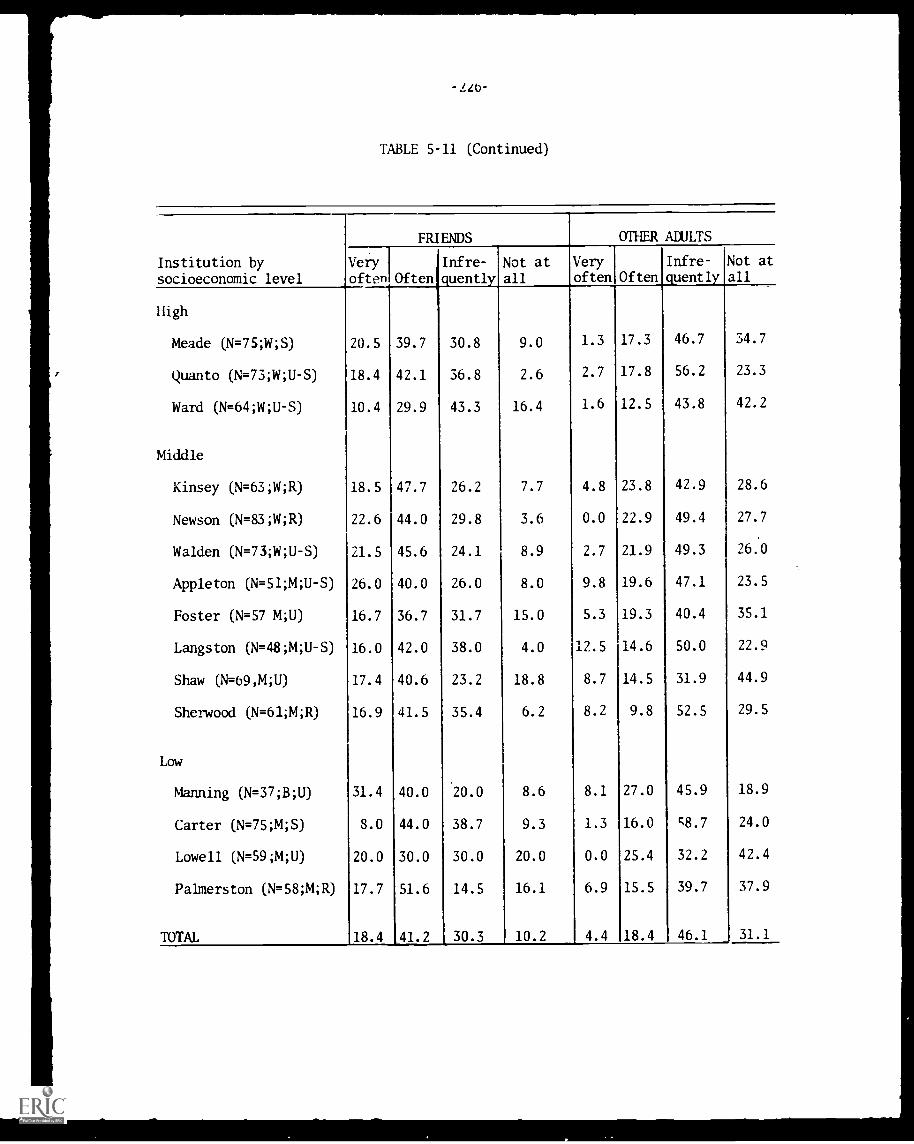
TABLE 5-11 (Continued)
Institution bysocioeconomic level
FRIENDS OTHER ADULTS
Veryoften Often
Infre-
quentlyNot atall
Veryoften Often
Infre-
quently
Not atall
High
Meade (N=75;W;S) 20.5 39.7 30.8 9.0 1.3 17.3 46.7 34.7
Quanto (N=73;W;U-S) 18.4 42.1 36.8 2.6 2.7 17.8 56.2 23.3
Ward (N=64;W;U-S) 10.4 29.9 43.3 16.4 1.6 12.5 43.8 42.2
Middle
Kinsey (N=63;W;R) 18.5 47.7 26.2 7.7 4.8 23.8 42.9 28.6
Newson (N=83;W;R) 22.6 44.0 29.8 3.6 0.0 22.9 49.4 27.7
Walden (N=73;W;U-S) 21.5 45.6 24.1 8.9 2.7 21.9 49.3 26.0
Appleton (N=51;14;U-S) 26.0 40.0 26.0 8.0 9.8 19.6 47.1 23.5
Foster (N=57 M;U) 16.7 36.7 31.7 15.0 5.3 19.3 40.4 35.1
Langston (N=48AU-S) 16.0 42.0 38.0 4.0 12.5 14.6 50.0 22.9
Shaw (N=69,M;U) 17.4 40.6 23.2 18.8 8.7 14.5 31.9 44.9
Sherwood (N=61;M;R) 16.9 41.5 35.4 6.2 8.2 9.8 52.5 29.5
Low
Manning (N=37;B;U) 31.4 40.0 20.0 8.6 8.1 27.0 45.9 18.9
Carter (N=75;M;S) 8.0 44.0 38.7 9.3 1.3 16.0 c8.7 24.0
Lowell (N=59;M;U) 20.0 30.0 30.0 20.0 0.0 25.4 32.2 42.4
Palmerston (N=58;M;R) 17.7 51.6 14.5 16.1 6.9 15.5 39.7 37.9
TOTAL 18.4 41.2 30.3 10.2 4.4 18.4 46.1 31.1
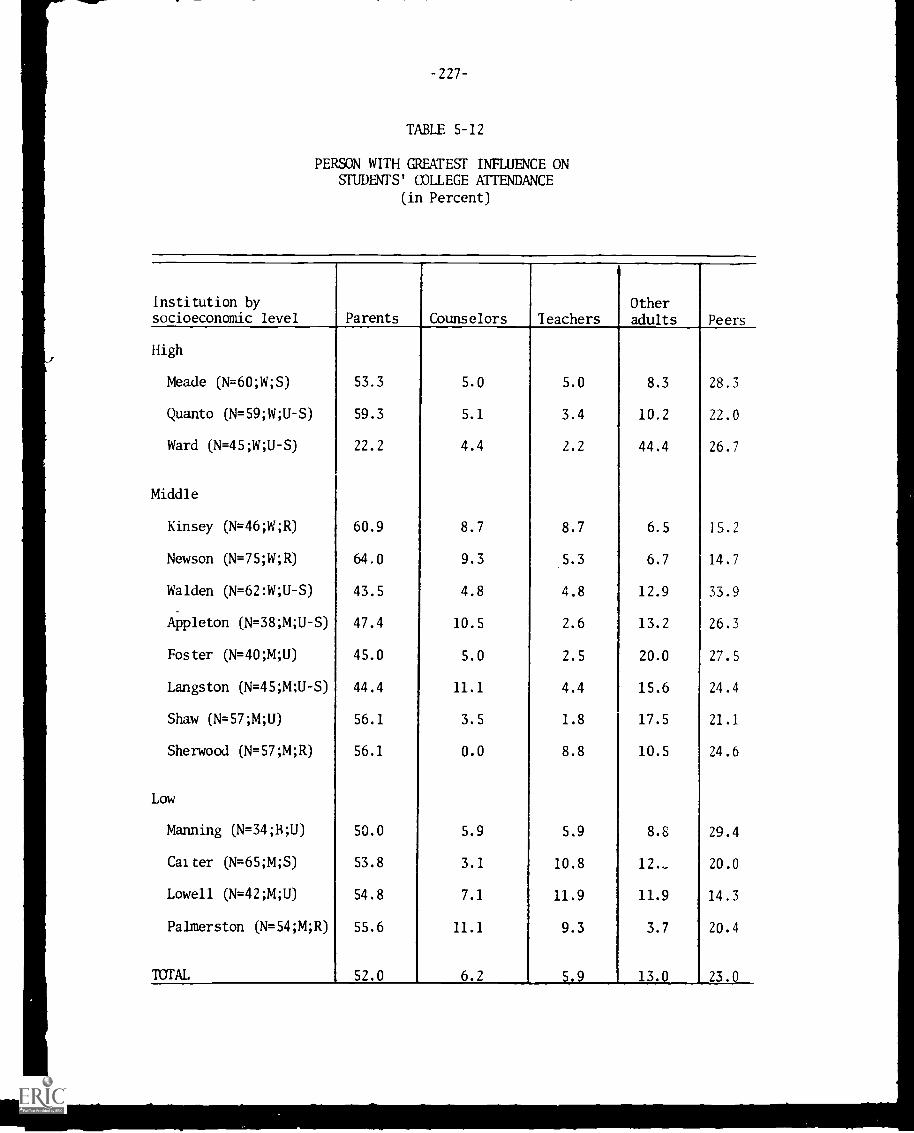
TABLE 5-12
PERSON WITH GREATEST INFLUENCE ONSTUDENTS' COLLEGE ATTENDANCE
(in Percent)
Institution bysocioeconomic level Parents Counselors Teachers
Otheradults Peers
High
Meade (N=60;W;S) 53.3 5.0 5.0 8.3 28.3
Quanto (N=59;W;U-S) 59.3 5.1 3.4 10.2 22.0
Ward (N=45;W;U-S) 22.2 4.4 2.2 44.4 26.7
Middle
Kinsey (N=46;W;R) 60.9 8.7 8.7 6.5 15.2
Newson (N=75;W;R) 64.0 9.3 5.3 6.7 14.7
Walden (N=62:W;U-S) 43.5 4.8 4.8 12.9 33.9
Appleton (N=38;M;U-S) 47.4 10.5 2.6 13.2 26.3
Foster (N=40;M;U) 45.0 5.0 2.5 20.0 27.5
Langston (N=45;M;U-S) 44.4 11.1 4.4 15.6 24.4
Shaw (N=57;M;U) 56.1 3.5 1.8 17.5 21.1
Sherwood (N=57;M;R) 56.1 0.0 8.8 10.5 24.6
Low
Manning (N=34;B;U) 50.0 5.9 5.9 8.8 29.4
Cal ter (N=65;M;S) 53.8 3.1 10.8 12._ 20.0
Lowell (N=42;M;U) 54.8 7.1 11.9 11.9 14.3
Palmerston (N= 54;M;R) 55.6 11.1 9.3 3.7 20.4
TOTAL 52.0 6.2 5.9 13.0 23.0
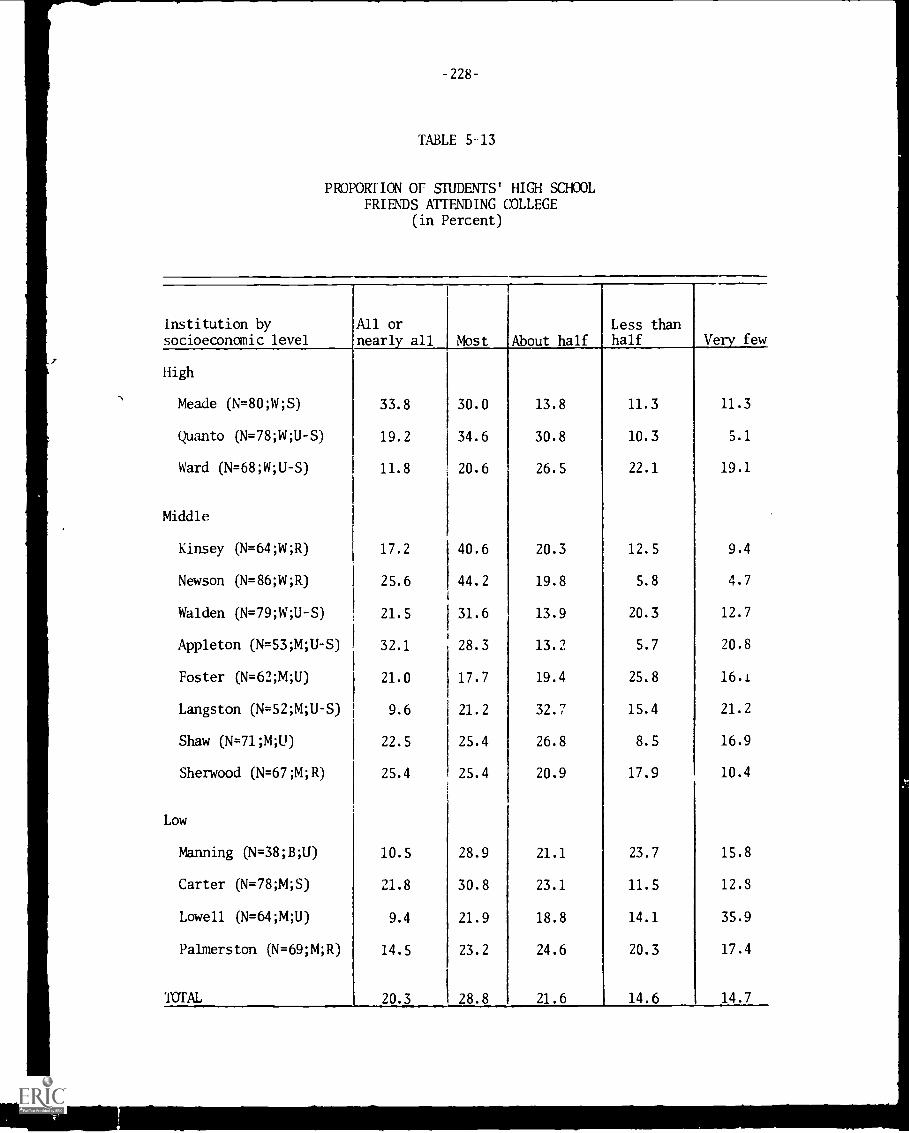
TABLE 5-13
PROPORTION OF STUDENTS' HIGH SCHOOLFRIENDS ATTENDING COLLEGE
(in Percent)
Institution bysocioeconomic level
All ornearly all Most About half
Less thanhalf Very few
High
Meade (N=80;W;S) 33.8 30.0 13.8 11.3 11.3
Quanto (N=78;W;U-S) 19.2 34.6 30.8 10.3 5.1
Ward (N=68;W;U-S) 11.8 20.6 26.5 22.1 19.1
Middle
Kinsey (N= 64;W;R) 17.2 40.6 20.3 12.5 9.4
Newson (N=86;W;R) 25.6 44.2 19.8 5.8 4.7
Walden (N=79;W;U-S) 21.5 31.6 13.9 20.3 12.7
Appleton (N=53;M;U-S) 32.1 28.3 13.2 5.7 20.8
Foster (N=62;M;U) 21.0 17.7 19.4 25.8 16.1
Langston (N=52;M;U-S) 9.6 21.2 32.7 15.4 21.2
Shaw (N=71;M;U) 22.5 25.4 26.8 8.5 16.9
Sherwood (N=67;M;R) 25.4 25.4 20.9 17.9 10.4
Low
Manning (N=38;B;U) 10.5 28.9 21.1 23.7 15.8
Carter (N= 78;M;S) 21.8 30.8 23.1 11.5 12.3
Lowell (N=64;M;U) 9.4 21.9 18.8 14.1 35.9
Palmerston (N= 69;M;R) 14.5 23.2 24.6 20.3 17.4
TOTAL 20.3 28.8 21.6 14.6 14.7
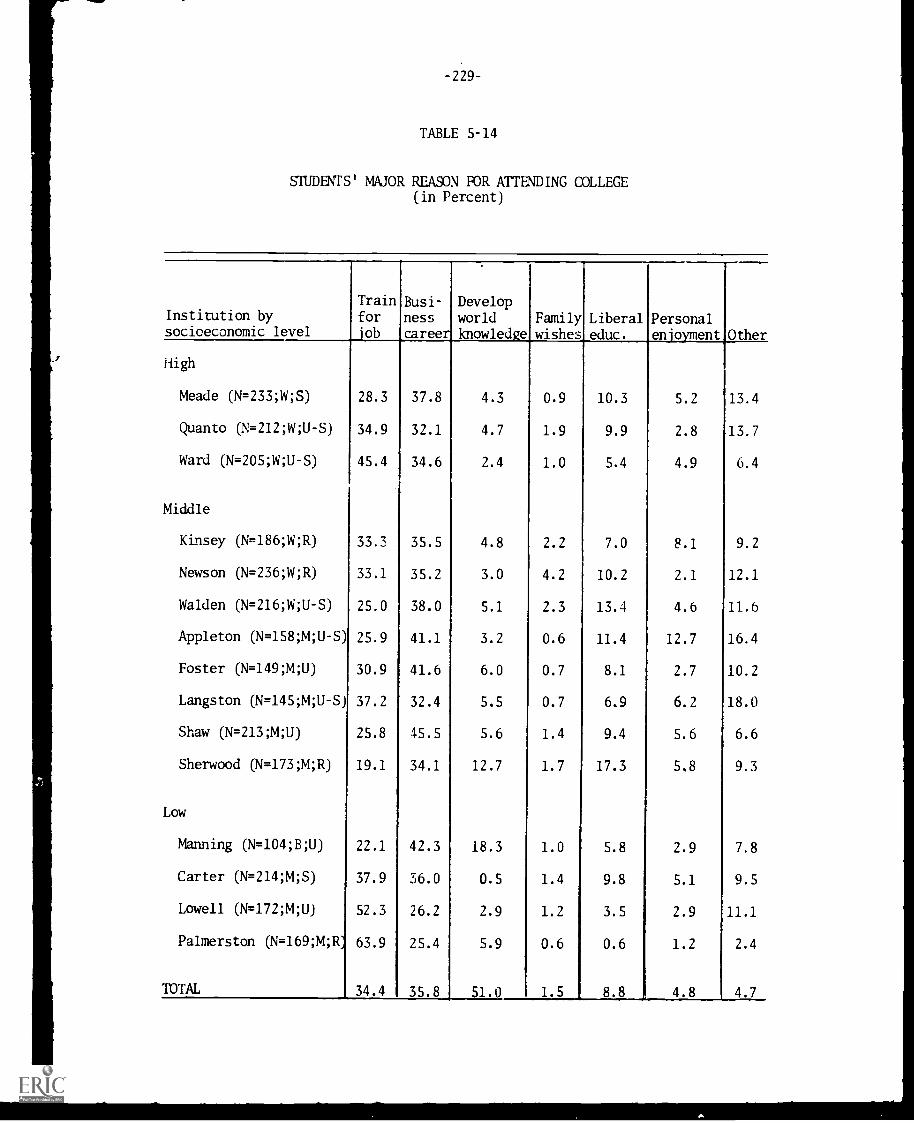
-229
TABLE 5-14
STUDENTS' MAJOR REASON FOR ATTENDING COLLEGE(in Percent)
Institution bysocioeconomic level
Trainfor
job
Busi-nesscareer
Developworldknowledge
Familywishes
Liberaleduc.
Personalenjoyment Other
High
Meade (N=233;W;S) 28.3 37.8 4.3 0.9 10.3 5.2 13.4
Quanto (N= 212;W;U -S) 34.9 32.1 4.7 1.9 9.9 2.8 13.7
Ward (N=205;W;U-S) 45.4 34.6 2.4 1.0 5.4 4.9 6.4
Middle
Kinsey (N=186;W;R) 33.3 35.5 4.8 2.2 7.0 S.1 9.2
Newson (N= 236;W;R) 33.1 35.2 3.0 4.2 10.2 2.1 12.1
Walden (N=216;W;U-S) 25.0 38.0 5.1 2.3 13.4 4.6 11.6
Appleton (N=158;M;U-S) 25.9 41.1 3.2 0.6 11.4 12.7 16.4
Foster (N=149;M;U) 30.9 41.6 6.0 0.7 8.1 2.7 10.2
Langston (N= 145;M;U -S) 37.2 32.4 5.5 0.7 6.9 6.2 18.0
Shaw (N=213;M;U) 25.8 45.5 5.6 1.4 9.4 5.6 6.6
Sherwood (N=173;M;R) 19.1 34.1 12.7 1.7 17.3 5.8 9.3
Low
Manning (N=104;B;U) 22.1 42.3 18.3 1.0 5.8 2.9 7.8
Carter (N=214;M;S) 37.9 36.0 0.5 1.4 9.8 5.1 9.5
Lowell (N=172;M;U) 52.3 26.2 2.9 1.2 3.5 2.9 11.1
Palmerston (N= 169;M;R 63.9 25.4 5.9 0.6 0.6 1.2 2.4
TOTAL 34.4 35.8 51.0 1.5 8.8 4.8 4.7

TABLE 5-15
MOST IMPORTANT REASON WHY STUDENTSCHOSE THEIR PARTICULAR COLLEGE
(in Percent)
Institution bysocioeconomic level
Lowcost
Closeto home
Parti-
cularcourses
Improvegrades &transfer
School
acceptedlow grades
Otherschoolsfull Other
High
Meade (N=76;W,S) 39.5 18.4 19.7 7.9 1.3 0.0 3.9
Quanto (N=69,W;U-S) 39.1 13.0 27.5 10.1 2.9 2.9 1.4
Ward (N=61;W;U-S) 13.1 21.3 50.8 1.6 0.0 0.0 11.5
Middle
Kinsey (N=62;W;R) 30.6 16.1 21.0 11.3 6.5 0.0 8.1
Newson (N=79;W;R) 44.3 17.7 17.7 6.3 0.0 1.3 5.1
Walden (N=79;W;U-S) 34.2 16.5 13.9 15.2 11.4 0.0 7.6
Appleton (N=51;M;U-S) 7.8 27.5 33.3 11.8 2.0 0.0 5.9
Foster (N= 54;M;U) 38.9 14.8 22.2 11.1 3.7 0.0 9.3
Langston (N=46;M;U-S) 21.7 28.3 26.1 8.7 2.2 2.2 8.7
Shaw (N=68;M;U) 45.6 23.5 13.2 4.4 1.5 0.0 10.3
Sherwood (N= 60;M;R) 13.3 35.0 15.0 11.7 1.7 0.0 16.7
Low
Manning (N=37;B;U) 45.9 16.2 16.2 8.1 0.0 8.1 5.4
Carter (N=73;M;S) 27.4 32.9 17.8 2.7 1.4 1.4 6.8
Lowell (N=55;M;U) 9.1 5.5 63.6 1.8 0.0 0.0 10.9
Palmerston (N=62;M;R) 14.5 17.7 58.1 0,0 1.6 0.0 3.2
TOTAL 29.1 20.3 27.0 7.5 2.6 0.9 7.5
*Seven reasons on the original item are eliminated from this table becauseof negligible responses. They arc: Friends attend this college; Referred toby staff; Athletic Program; Other extra curricular activities; Advice of highschool teacher or counselor; Only school in area; Don't know what else to do.
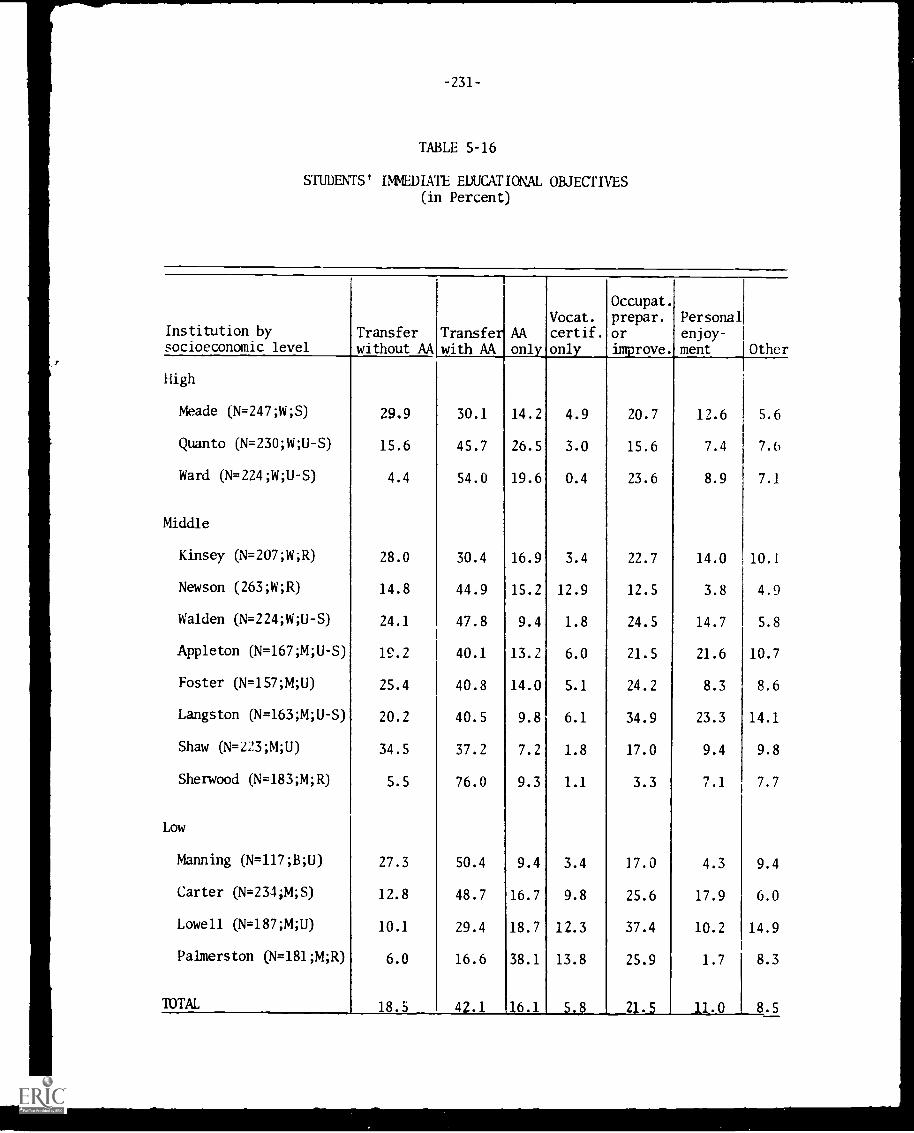
TABLE 5-16
STUDENTS' IMMEDIATE EDUCATIONAL OBJECTIVES(in Percent)
Institution bysocioeconomic level
Transferwithout AA
Transferwith AA
AAonly
Vocat.certif.only
Occupat.prepar.orimprove.
Personalenjoy-ment Other
High
Meade (N=247;W;S) 29.9 30.1 14.2 4.9 20.7 12.6 5.6
Quanto (N=230;W;U-S) 15.6 45.7 26.5 3.0 15.6 7.4 7.t
Ward (N=224;W;U-S) 4.4 54.0 19.6 0.4 23.6 8.9 7.1
Middle
Kinsey (N= 207;W;R) 28.0 30.4 16.9 3.4 22.7 14.0 10.1
Newson (263;W;R) 14.8 44.9 15.2 12.9 12.5 3.8 4.9
Walden (N=224,W;U-S) 24.1 47.8 9.4 1.8 24.5 14.7 5.8
Appleton (N=167;M;U-S) 15.2 40.1 13.2 6.0 21.5 21.6 10.7
Foster (N= 157;M;U) 25.4 40.8 14.0 5.1 24.2 8.3 8.6
Langston (N=163;M;U-S) 20.2 40.5 9.8 6.1 34.9 23.3 14.1
Shaw (N=223;M;U) 34.5 37.2 7.2 1.8 17.0 9.4 9.8
Sherwood (N=183;M;R) 5.5 76.0 9.3 1.1 3.3 7.1 7.7
Low
Manning (N=117;B;U) 27.3 50.4 9.4 3.4 17.0 4.3 9.4
Carter (N=234;M;S) 12.8 48.7 16.7 9.8 25.6 17.9 6.0
Lowell (N=187;M;U) 10.1 29.4 18.7 12.3 37.4 10.2 14.9
Palmerston (N=181;M;R) 6.0 16.6 38.1 13.8 25.9 1.7 8.3
TOTAL 18.5 4 ._ 6.1 5.8 2 . 1.0 8.5
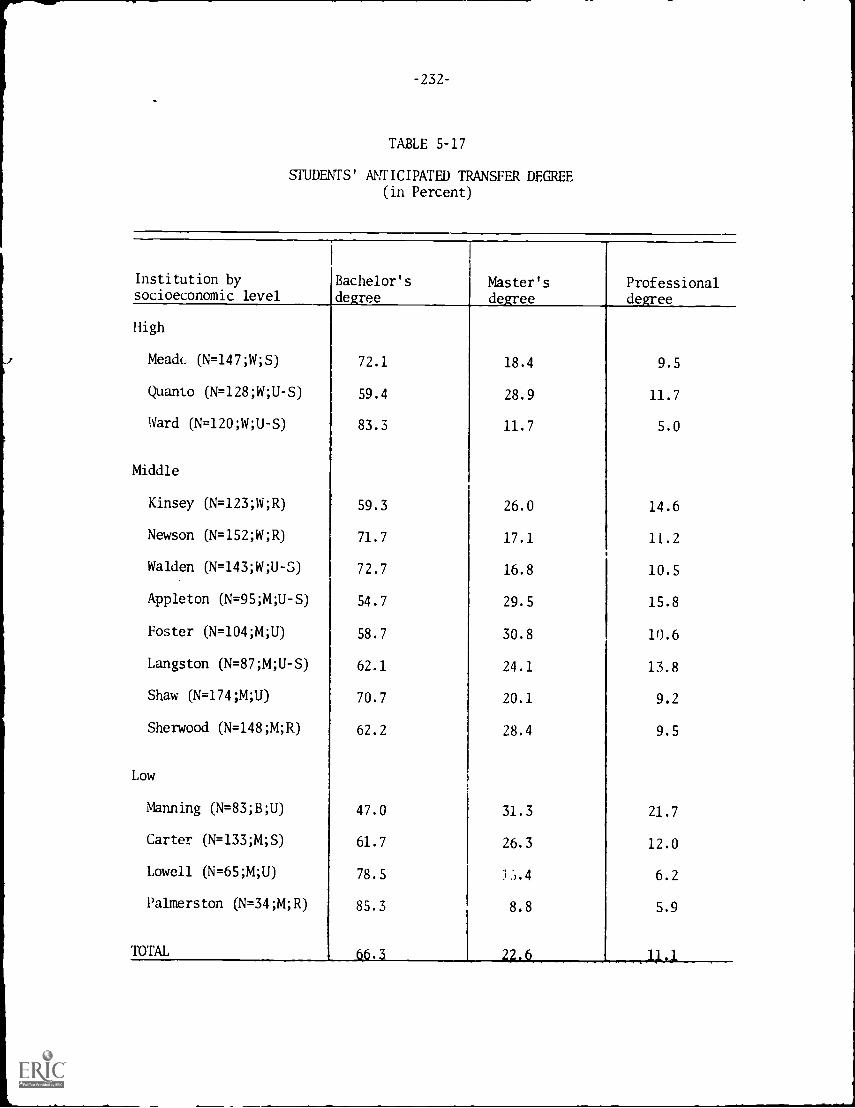
-232-
TABLE 5-17
STUDENTS' ANTICIPATED TRANSFER DEGREE(in Percent)
Institution bysocioeconomic level
Bachelor'sdegree
Master'sdegree
Professionaldegree
High
Meath; (N=147;W;S) 72.1 18.4 9.5
Quanto (N=128;W;U-S) 59.4 28.9 11.7
Ward (N=120;W;U-S) 83.3 11.7 5.0
Middle
Kinsey (N=123;W;R) 59.3 26.0 14.6
Newson (N=152;W;R) 71.7 17.1 11.2
Walden (N=143;W;U-S) 72.7 16.8 10.5
Appleton (N=95;M;U-S) 54.7 29.5 15.8
Foster (N=104;M;U) 58.7 30.8 10.6
Langston (N=87;M;U-S) 62.1 24.1 13.8
Shaw (N=174;M;U) 70.7 20.1 9.2
Sherwood (N=148;M;R) 62.2 28.4 9.5
Low
Manning (N=83;B;U) 47.0 31.3 21.7
Carter (N=133;M;S) 61.7 26.3 12.0
Lowell (N=65;M;U) 78.5 J.").4 6.2
Palmerston (N=34;M;R) 85.3 8.8 5.9
TOTAL 66.3 22.. (). . - . 1.1,k
1
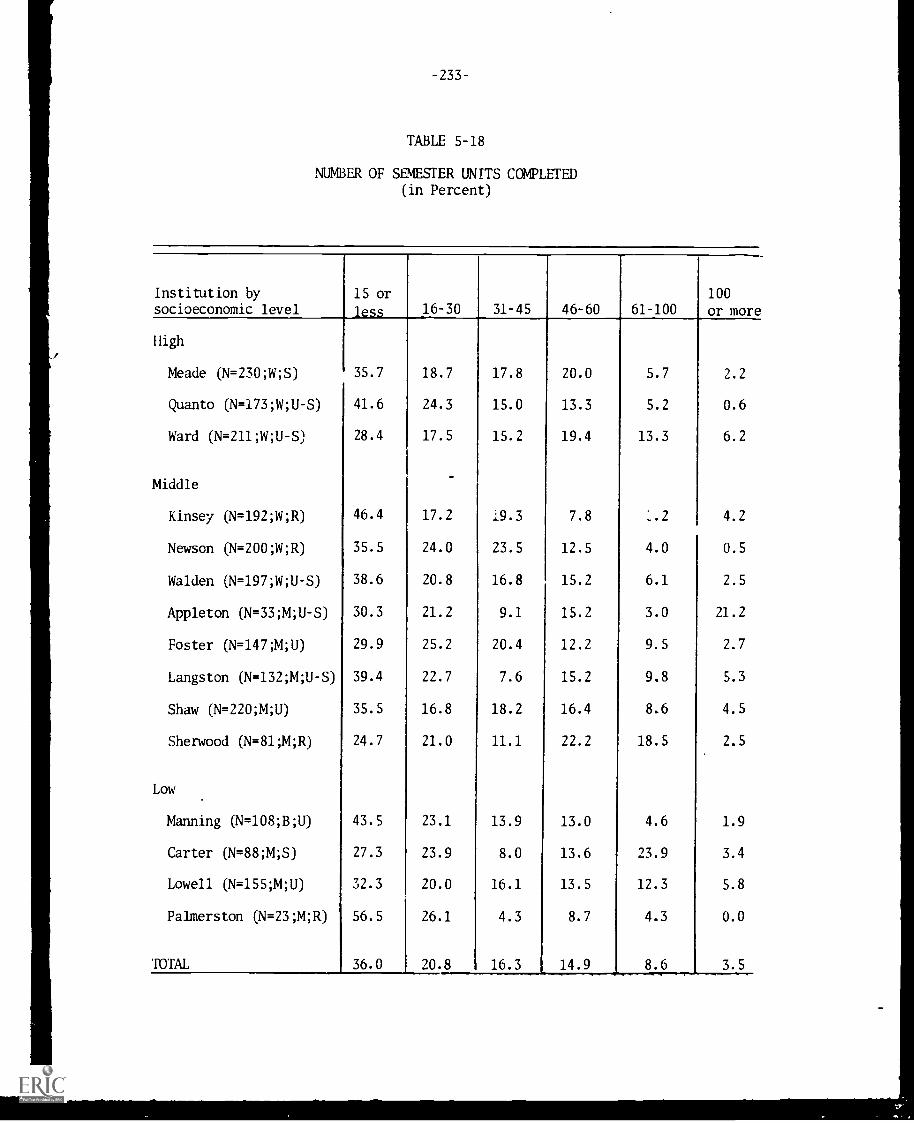
TABLE 5-18
NUMBER OF SEMESTER UNITS COMPLETED(in Percent)
Institution bysocioeconomic level
15 orless 16-30 31-45 46-60 61-100
100
or more
High
Meade (N=230;W;S) 35.7 18.7 17.8 20.0 5.7 2.2
Quanto (N= 173;W;U -S) 41.6 24.3 15.0 13.3 5.2 0.6
Ward (N=211;W;U-S) 28.4 17.5 15.2 19.4 13.3 6.2
_
Middle
Kinsey (N=192;W;R) 46.4 17.2 i9.3 7.8 :.2 4.2
Newson (N=200;W;R) 35.5 24.0 23.5 12.5 4.0 0.5
Walden (N= 197;W;U -S) 38.6 20.8 16.8 15.2 6.1 2.5
Appleton (N=33;M;U-S) 30.3 21.2 9.1 15.2 3.0 21.2
Foster (N=147;M;U) 29.9 25.2 20.4 12.2 9.5 2.7
Langston (N= 132;M;U -S) 39.4 22.7 7.6 15.2 9.8 5.3
Shaw (N=220;M;U) 35.5 16.8 18.2 16.4 8.6 4.5
Sherwood (N=81;M;R) 24.7 21.0 11.1 22.2 18.5 2.5
Low
Manning (N=108;B;U) 43.5 23.1 13.9 13.0 4.6 1.9
Carter (N=88;M;S) 27.3 23.9 8.0 13.6 23.9 3.4
Lowell (N=155;M;U) 32.3 20.0 16.1 13.5 12.3 5.8
Palmerston (N= 23;M;R) 56.5 26.1 4.3 8.7 4.3 0.0
TOTAL 36.0 20.8 16.3 14.9 8.6 3.5
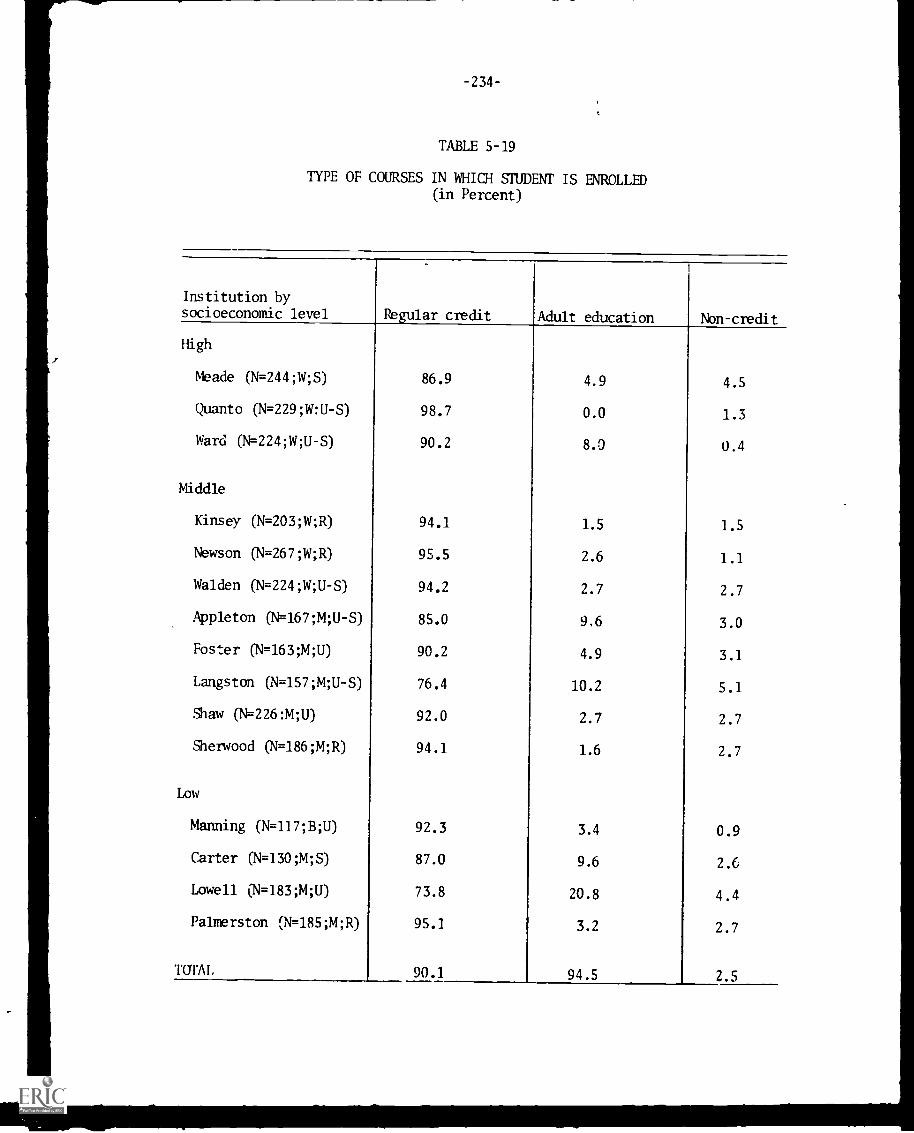
-234-
TABLE 5-19
TYPE OF COURSES IN WHICH STUDENT IS ENROLLED(in Percent)
Institution bysocioeconomic level Regular credit Adult education Non -credit
High
Meade (N=244;W;S) 86.9 4.9 4.5
Quanto (N=229;W:U-S) 98.7 0.0 1.3
Ward (N=224;W;U-S) 90.2 8.0 0.4
Middle
Kinsey (N=203;W;R) 94.1 1.5 1.5
Newson (N= 267;W;R) 95.5 2.6 1.1
Walden (N= 224;W;U -S) 94.2 2.7 2.7
Appleton (N=167;M;U-S) 85.0 9,6 3.0
Foster (N= 163;M;U) 90.2 4.9 3.1
Langston (N= 157;M;U -S) 76.4 10.2 5.1
Shaw (N=226:M;U) 92.0 2.7 2.7
Sherwood (N= 186;M;R) 94.1 1.6 2.7
Low
Manning (N=117;B;U) 92.3 3.4 0.9
Carter (N= 130;M;S) 87.0 9.6 2.6
Lowell ('N=183;M;U) 73.8 20.8 4.4
Palmerston (N=185;M;R) 95.1 3.2 2.7
Torn 90.1 94.5 2.5
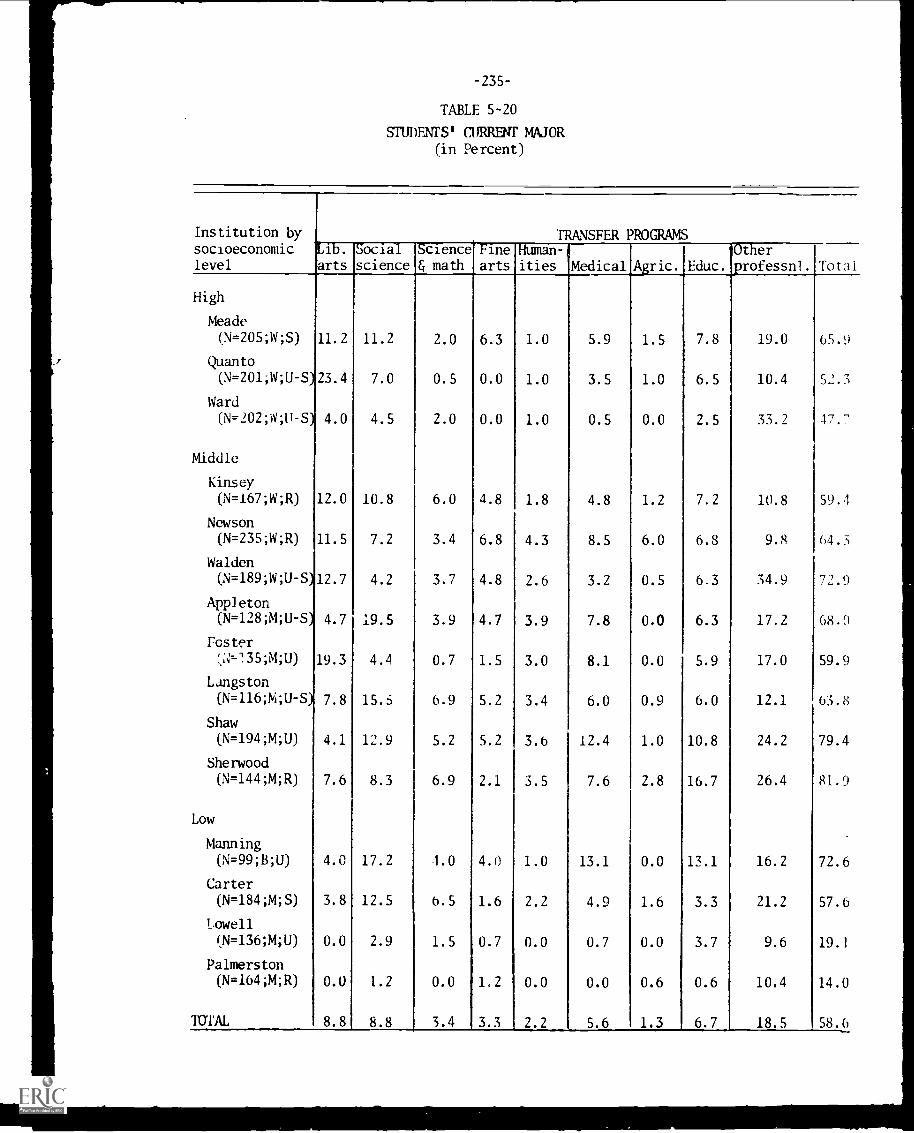
-235-
TABLE 5-20
STUDENTS' CURRENT MAJOR(in Percent)
Institution by
socioeconomiclevel
TRANSFER PROGRAMSLib.
arts
Socialscience
Science& math
Tine-HUman-1arts ities 'Medical Agric. Educ.
Otherrofessnl. Total
High
Meade(N=205;W;S) 11.2 11.2 2.0 6.3 1.0 5.9 1.5 7.8 19.0 65.9
Quanto(N=201;W;U-S) 23.4 7.0 0.5 0.0 1.0 3.5 1.0 6.5 10.4 52.3
Ward(N=202;W;11 -S) 4.0 4.5 2.0 0.0 1.0 0.5 0.0 2.5 33.2 17."
Middle
Kinsey(N=167;W;R) 12.0 10.8 6.0 4.8 1.8 4.8 1.2 7.2 10.8 59.1
Newson(N=235;W;R) 11.5 7.2 3.4 6.8 4.3 8.5 6.0 6.8 9.8 64.3
Walden(N=189;W;U-S) 12.7 4.2 3.7 4.8 2.6 3.2 0.5 6.3 34.9 72.9
Appleton(N=128AU-S) 4.7 19.5 3.9 4.7 3.9 7.8 0.0 6.3 17.2 08.0
Foster;4-35;M;U) 19.3 4.4 0.7 1.5 3.0 8.1 0.0 5.9 17.0 59.9
Langston
(N=116;M;U-S) 7.8 15.5 6.9 5.2 3.4 6.0 0.9 6.0 12.1 63.8
Shaw(N=194;M;U) 4.1 12.9 5.2 5.2 3.6 12.4 1.0 10.8 24.2 79.4
Sherwood(N=144AR) 7.6 8.3 6.9 2.1 3.5 7.6 2.8 16.7 26.4 81.9
Low
Manning(N=99;B;U) 4.0 17.2 1.0 4.0 1.0 13.1 0.0 13.1 16.2 72.6
Carter(N=184AS) 3.8 12.5 6.5 1.6 2.2 4.9 1.6 3.3 21.2 57.6
Lowell(N=136;M;U) 0.0 2.9 1.5 0.7 0.0 0.7 0.0 3.7 9.6 19.1
Palmerston(N=164AR) 0.0 1.2 0.0 1.2 0.0 0.0 0.6 0.6 10.4 14.0
TOTAL 8.8 8.8 3.4 3.3 2.2 5.6 1.3 6.7 18.5 58.6
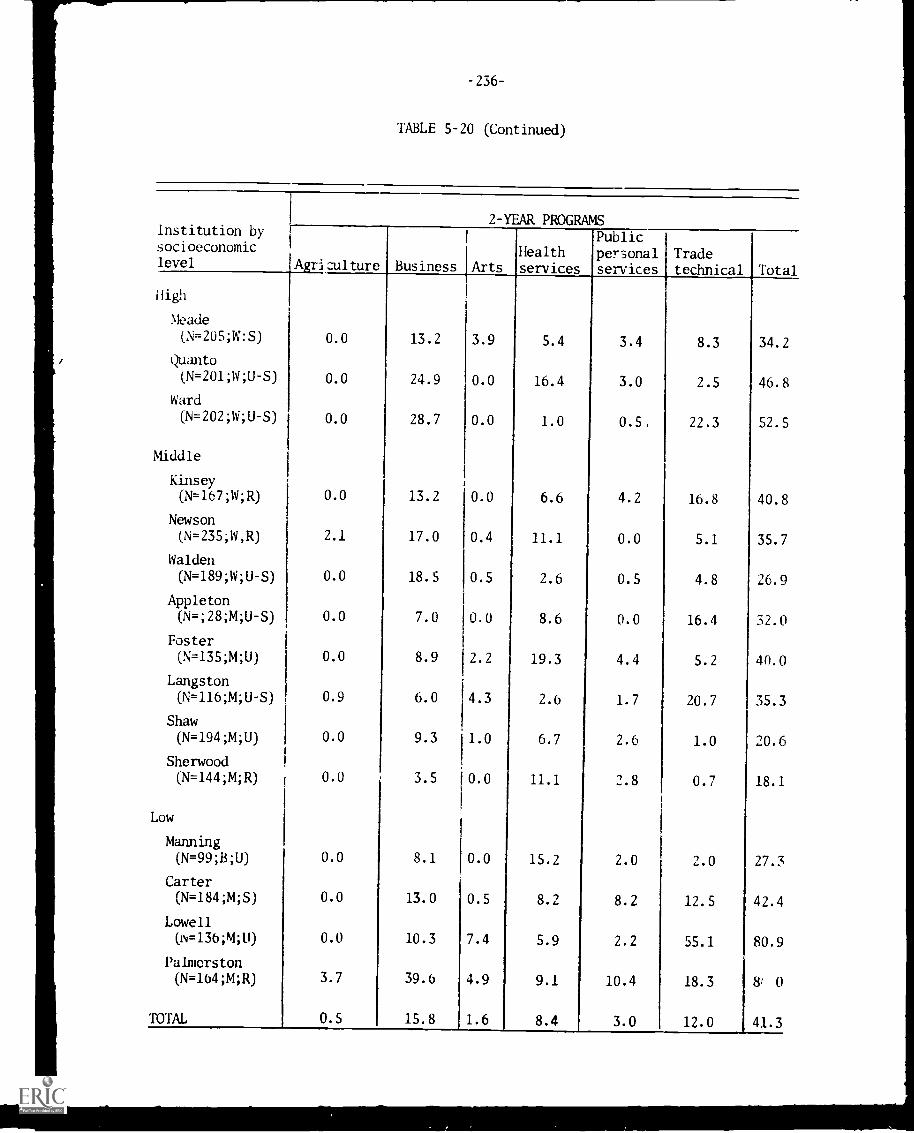
-236-
TABLE 5-20 (Continued)
Institution by
socioeconomiclevel
2-YEAR PROGRAMS
Agri zulture Business ArtsHealthservices
Publicpersonalservices
Tradetechnical Total
High
Meade
(N=205;W:S) 0.0 13.2 3.9 5.4 3.4 8.3 34.2
Quanto
(N=201;W;U-S) 0.0 24.9 0.0 16.4 3.0 2.5 46.8
Ward
(N=202;W;U-S) 0.0 28.7 0.0 1.0 0.5. 22.3 52.5
Middle
Kinsey(N=167;W;R) 0.0 13.2 0.0 6.6 4.2 16.8 40.8
Newson(N= 235;W,R) 2.1 17.0 0.4 11.1 0.0 5.1 35.7
Walden(N=189;W;U-S) 0.0 18.5 0.5 2.6 0.5 4.8 26.9
Appleton(N=;28;M;U-S) 0.0 7.0 0.0 8.6 0.0 16.4 32.0
Foster
(N=135;M;U) 0.0 8.9 2.2 19.3 4.4 5.2 40.0
Langston
(N=116AU-S) 0.9 6.0 4.3 2.6 1.7 20.7 35.3
Shaw(N=194;M;U) 0.0 9.3 1.0 6.7 2.6 1.0 20.6
Sherwood(N= 144;M;R) 0.0 3.5 0.0 11.1 2.8 0.7 18.1
Low
Manning(N=99;B;U) 0.0 8.1 0.0 15.2 2.0 2.0 27.3
Carter(M=184;M;S) 0.0 13.0 0.5 8.2 8.2 12.5 42.4
Lowell(iv=136;M;U) 0.0 10.3 7.4 5.9 2.2 55.1 80.9
Palmerston(N=104;M;R) 3.7 39.6 4.9 9.1 10.4 18.3 8( 0
TOTAL 0.5 15.8 1.6 8.4 3.0 12.0 41.3
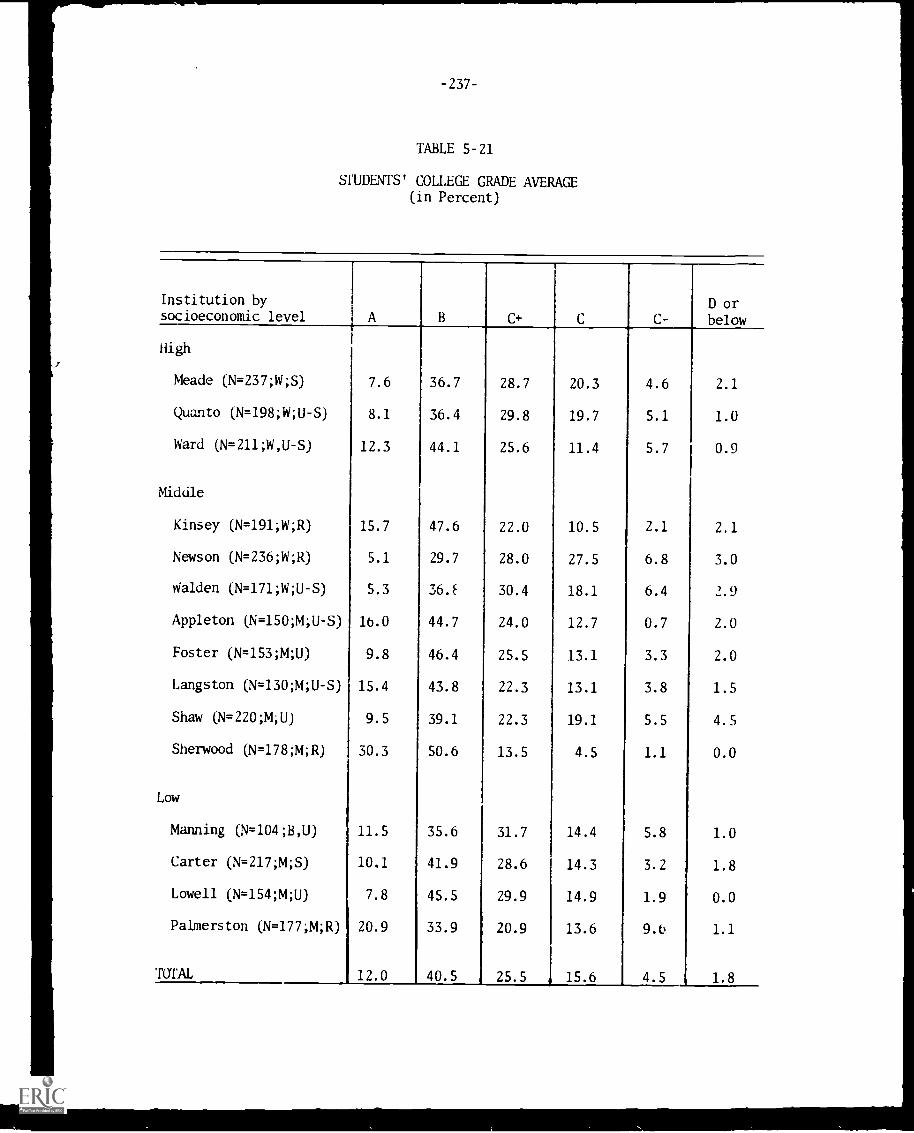
TABLE 5-21
STUDENTS' COLLEGE GRADE AVERAGE(in Percent)
Institution bysocioeconomic level A B C+ C C-
D orbelow
High
Meade (N=237;W;S) 7.6 36.7 28.7 20.3 4.6 2.1
Quanto (N=198;W;U-S) 8.1 36.4 29.8 19.7 5.1 1.0
Ward (N=211;W,U-S) 12.3 44.1 25.6 11.4 5.7 0.9
Middle
Kinsey (N=191;W;R) 15.7 47.6 22.0 10.5 2.1 2.1
Newson (N=236;W;R) 5.1 29.7 28.0 27.5 6.8 3.0
Walden (N=171;W;U-S) 5.3 36.E 30.4 18.1 6.4 2.9
Appleton (N=150;M;U-S) 16.0 44.7 24.0 12.7 0.7 2.0
Foster (N=153;M;U) 9.8 46.4 25.5 13.1 3.3 2.0
Langston (N=130;M;U-S) 15.4 43.8 22.3 13.1 3.8 1.5
Shaw (N=220;M;U) 9.5 39.1 22.3 19.1 5.5 4.5
Sherwood (N=178;M;R) 30.3 50.6 13.5 4.5 1.1 0.0
Low
Manning (N=104;B,U) 11.5 35.6 31.7 14.4 5.8 1.0
Carter (N=217;M;S) 10.1 41.9 28.6 14.3 3.2 1.8
Lowell (N=154;M;U) 7.8 45.5 29.9 14.9 1.9 0.0
Palmerston (N=177;M;R) 20.9 33.9 20.9 13.6 9.6 1.1
TOTAL 12.0 40.5 25.5 15.6 4.5 1.8
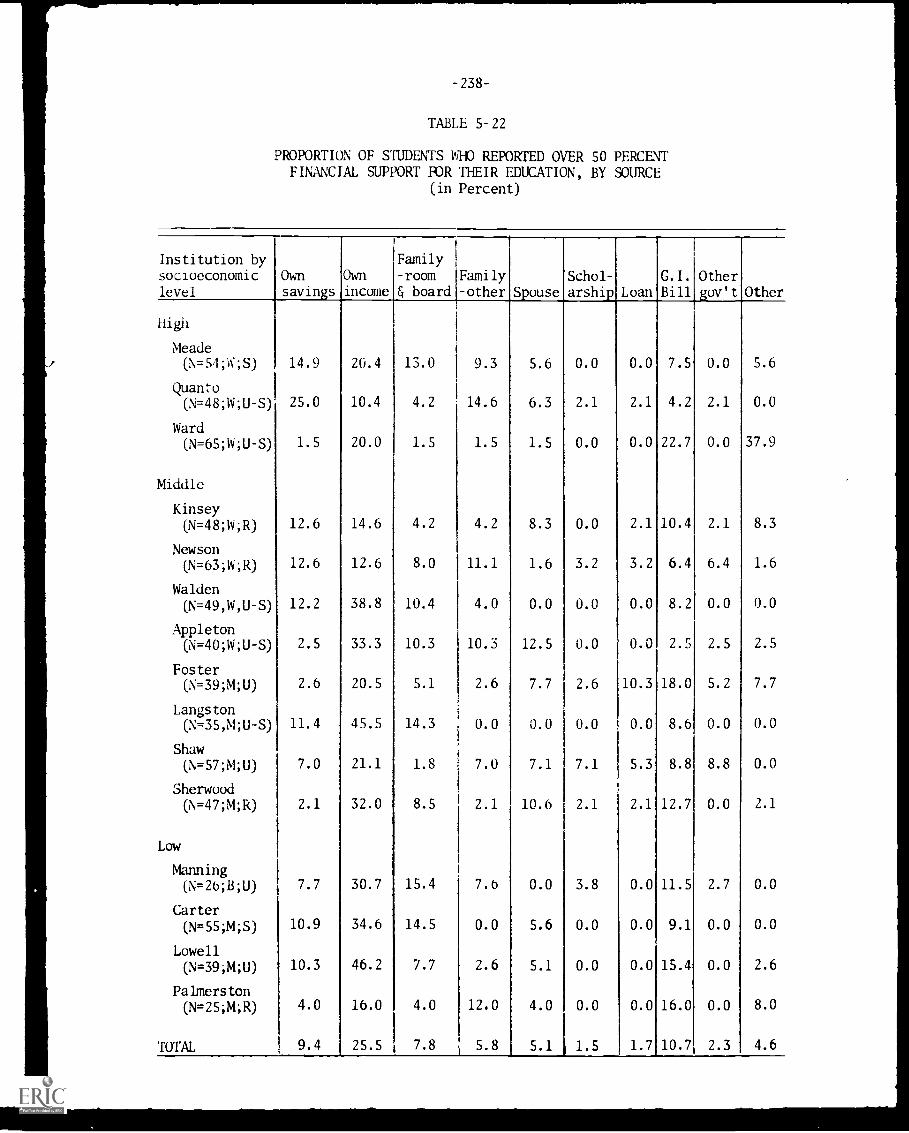
-238-
TABLE 5-22
PROPORTION OF STUDENTS WHO REPORTED OVER 50 PERCENTFINANCIAL SUPPORT MR THEIR EDUCATION, BY SOURCE
(in Percent)
Institution bysocioeconomiclevel
Ownsavings
Ownincome
Family-room& board
Family-other Spouse
Schol-
arship LoanG.I.
BillOthergov't Other
High
Meade(N=54;W;S) 14.9 20.4 13.0 9.3 5.6 0.0 0.0 7.5 0.0 5.6
Quanto(N=48;W;U-S) 25.0 10.4 4.2 14.6 6.3 2.1 2.1 4.2 2.1 0.0
Ward(N=65;W;U-S) 1.5 20.0 1.5 1.5 1.5 0.0 0.0 22.7 0.0 37.9
Middle
Kinsey(N=48;W;R) 12.6 14.6 4.2 4.2 8.3 0.0 2.1 10.4 2.1 8.3
Newson(N=63;W;R) 12.6 12.6 8.0 11.1 1.6 3.2 3.2 6.4 6.4 1.6
Walden(N=49,W,U-S) 12.2 38.8 10.4 4.0 0.0 0.0 0.0 8.2 0.0 0.0
Appleton(N=40;W;U-S) 2.5 33.3 10.3 10.3 12.5 0.0 0.0 2.5 2.5 2.5
Foster(N=39;M;U) 2.6 20.5 5.1 2.6 7.7 2.6 10.3 18.0 5.2 7.7
Langston(N=35,M;U-S) 11.4 45.5 14.3 0.0 0.0 0.0 0.0 8.6 0.0 0.0
Shaw(N=57;M;U) 7.0 21.1 1.8 7.0 7.1 7.1 5.3 8.8 8.8 0.0
Sherwood(N=47;M;R) 2.1 32.0 8.5 2.1 10.6 2.1 2.1 12.7 0.0 2.1
Low
Manning(N=26;B;U) 7.7 30.7 15.4 7.6 0.0 3.8 0.0 11.5 2.7 0.0
Carter(N=55;M;S) 10.9 34.6 14.5 0.0 5.6 0.0 0.0 9.1 0.0 0.0
Lowell(N= 39;M;U) 10.3 46.2 7.7 2.6 5.1 0.0 0.0 15.4 0.0 2.6
Palmerston(N=25;M;R) 4.0 16.0 4.0 12.0 4.0 0.0 0.0 16.0 0.0 8.0
TOTAL 9.4 25.5 7.8 5.8 5.1 1.5 1.7 10.7 2.3 4.6
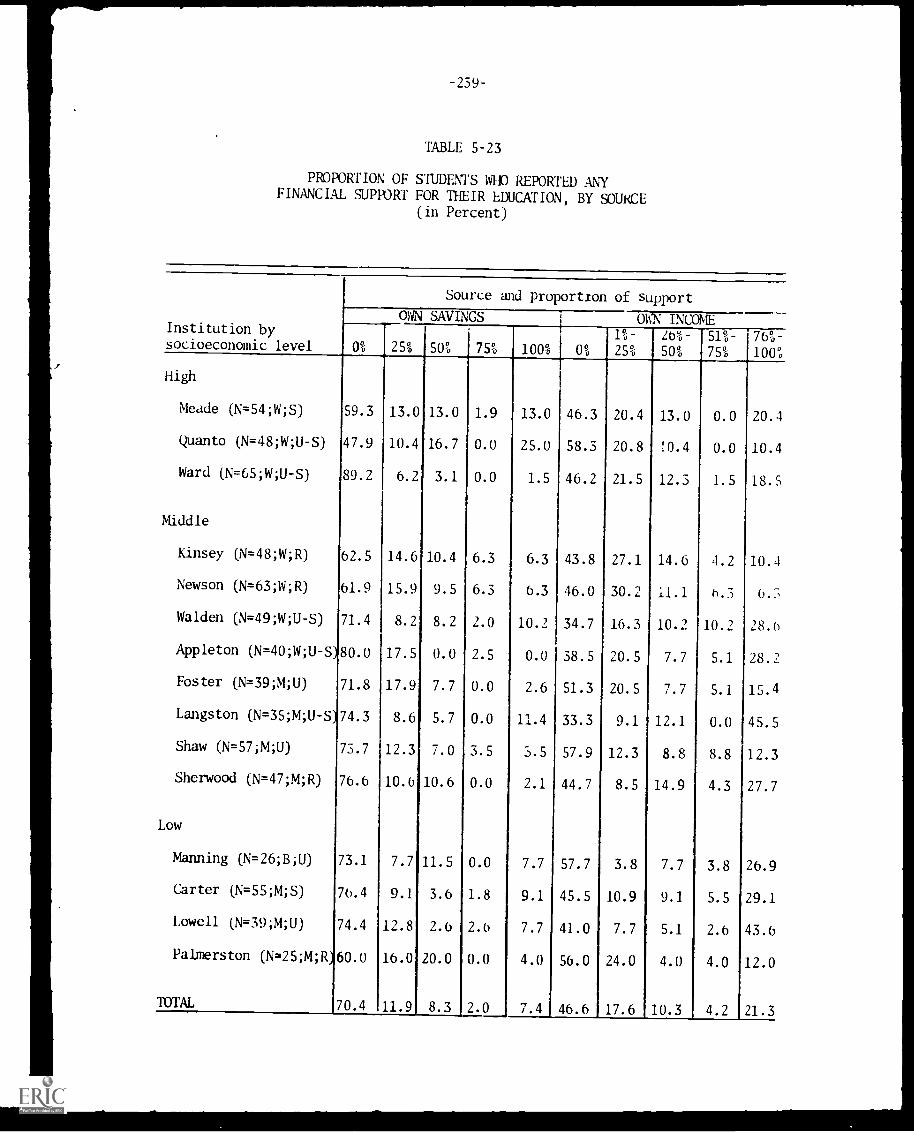
-239-
TABLE 5-23
PROPORTION OF STUDENTS WHO REPORTED ANYFINANCIAL SUPPORT FOR THEIR EDUCATION, BY SOURCE
(in Percent)
Institution bysocioeconomic level
Source and proportion of support
OWN SAVINGS OWN INCOME
25% 50% 75% 100% 00
1%-
25o
26%-
500
510
750
76%-
100%
High
Meade (N=54;W;S) 59.3 13.0 13.0 1.9 13.0 46.3 20.4 13.0 0.0 20.
Quanto (N=48;W;U-S) 47.9 10.4 16.7 0.0 25.0 58.3 20.8 !0.4 0.0 10.4
Ward (N=65;W;U-S) 89.2 6.2 3.1 0.0 1.5 46.2 21.5 12.3 1.5 18.5
Middle
Kinsey (N=48;W;R) 62.5 14.6 10.4 6.3 6.3 43.8 27.1 14.6 4.2 10.4
Newson (N=63;W;R) 61.9 15.9 9.5 6.3 6.3 46.0 30.2 11.1 6.3
Walden (N=49;W;U-S) 71.4 8.2 8.2 2.0 10.2 34.7 16.3 10.2 10.2 28.6
Appleton (N=40;W;U-S) 80.0 17.5 0.0 2.5 0.0 38.5 20.5 7.7 5.1 28.2
Foster (N=39;M;U) 71.8 17.9 7.7 0.0 2.6 51.3 20.5 7.7 5.1 15.4
Langston (N=35;M;U-S) 74.3 8.6 5.7 0.0 11.4 33.3 9.1 12.1 0.0 45.5
Shaw (N=57;M;U) 73.7 12.3 7.0 3.5 3.5 57.9 12.3 8.8 8.8 12.3
Sherwood (N=47;M;R) 76.6 10.6 10.6 0.0 2.1 44.7 8.5 14.9 4.3 27.7
Low
Manning (N=26;B;U) 73.1 7.7 11.5 0.0 7.7 57.7 3.8 7.7 3.8 26.9
Carter (N=55;M;S) 76.4 9.1 3.6 1.8 9.1 45.5 10.9 9.1 5.5 29.1
Lowell (N=39;M;U) 74.4 12.8 2.6 2.6 7.7 41.0 7.7 5.1 2.6 43.6
Palmerston (N=25;M;R)60.0 16.0 20.0 0.0 4.0 56.0 24.0 4.0 4.0 12.0
TOTAL 70.4 11.9 8.3 2.0 7.4 46.6 17.6 10.3 4.2 21.3
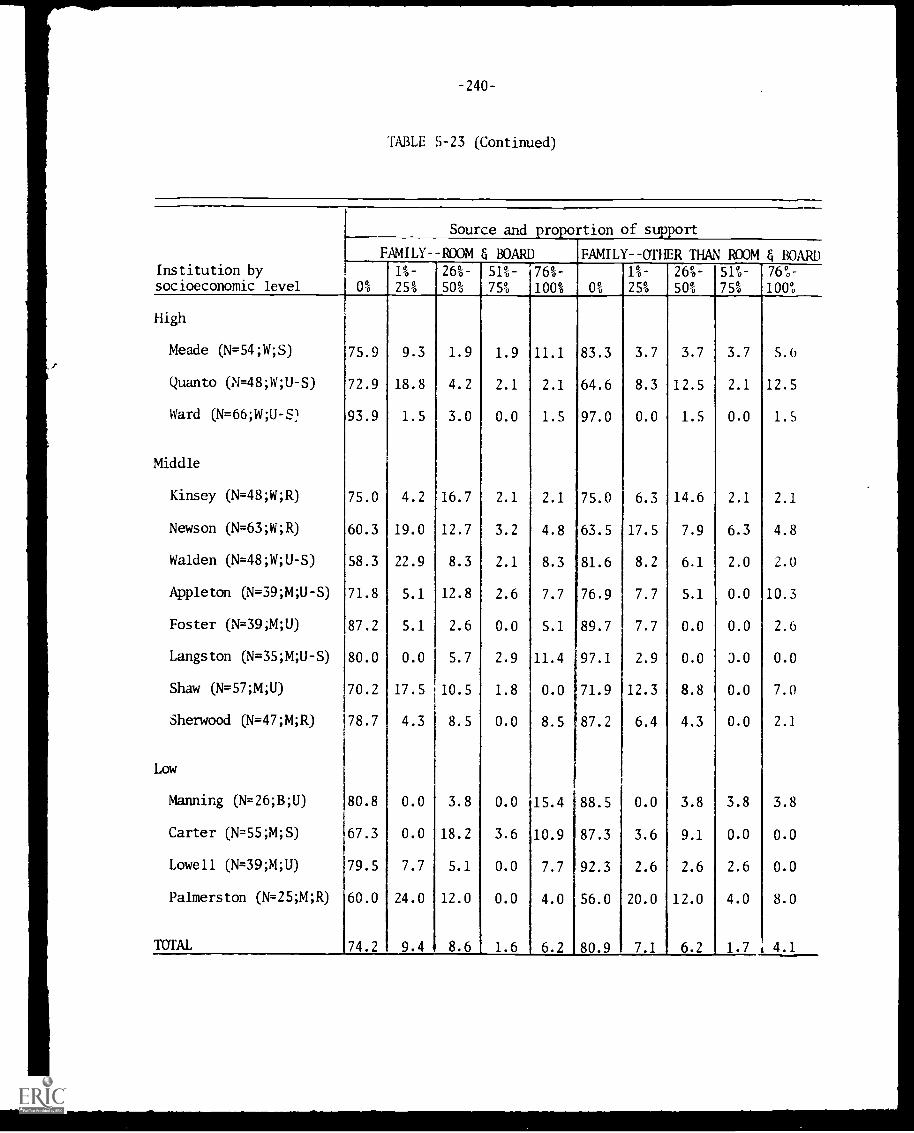
-240-
TABLE 5-23 (Continued)
Institution bysocioeconomic level
Source and propo rtion of support
FAMILY--ROOM & BOARD FAMILY--OTHER THAN ROOM & BOARD1 %-
25%
26%-
50%
51%-
7590
76%-
100% 0
1 %-
25%
26%-
50%
5190-
75%
76%-
100%
High
Meade (N=54;W;S) 75.9 9.3 1.9 1.9 11.1 83.3 3.7 3.7 3.7 5.6
Quanto (N=48;W;U-S) 72.9 18.8 4.2 2.1 2.1 64.6 8.3 12.5 2.1 12.5
Ward (N= 66;W;U -S' 93.9 1.5 3.0 0.0 1.5 97.0 0.0 1.5 0.0 1.5
Middle
Kinsey (N=48;W;R) 75.0 4.2 16.7 2.1 2.1 75.0 6.3 14.6 2.1 2.1
Newson (N=63;W;R) 60.3 19.0 12.7 3.2 4.8 63.5 17.5 7.9 6.3 4.8
Walden (N=48;W;U-S) 58.3 22.9 8.3 2.1 8.3 81.6 8.2 6.1 2.0 2.0
Appleton (N= 39;M;U -S) 71.8 5.1 12.8 2.6 7.7 76.9 7.7 5.1 0.0 10.3
Foster (N=39;M;U) 87.2 5.1 2.6 0.0 5.1 89.7 7.7 0.0 0.0 2.6
Langston (N= 35;M;U -S) 80.0 0.0 5.7 2.9 11.4 97.1 2.9 0.0 3.0 0.0
Shaw (N=57;MW) 70.2 17.5 10.5 1.8 0.0 71.9 12.3 8.8 0.0 7.0
Sherwood (N= 47;M;R) 78.7 4.3 8.5 0.0 8.5 87.2 6.4 4.3 0.0 2.1
Low
Manning (N=26;B;U) 80.8 0.0 3.8 0.0 15.4 88.5 0.0 3.8 3.8 3.8
Carter (N=55;M;S) 67.3 0.0 18.2 3.6 10.9 87.3 3.6 9.1 0.0 0.0
Lowell (N=39;M;U) 79.5 7.7 5.1 0.0 7.7 92.3 2.6 2.6 2.6 0.0
Palmerston (N=25;M;R) 60.0 24.0 12.0 0.0 4.0 56.0 20.0 12.0 4.0 8.0
TOTAL 74.2 9.4 8.6 1.6 6.2 80.9 7.1 6.2 1.7 t 4.1
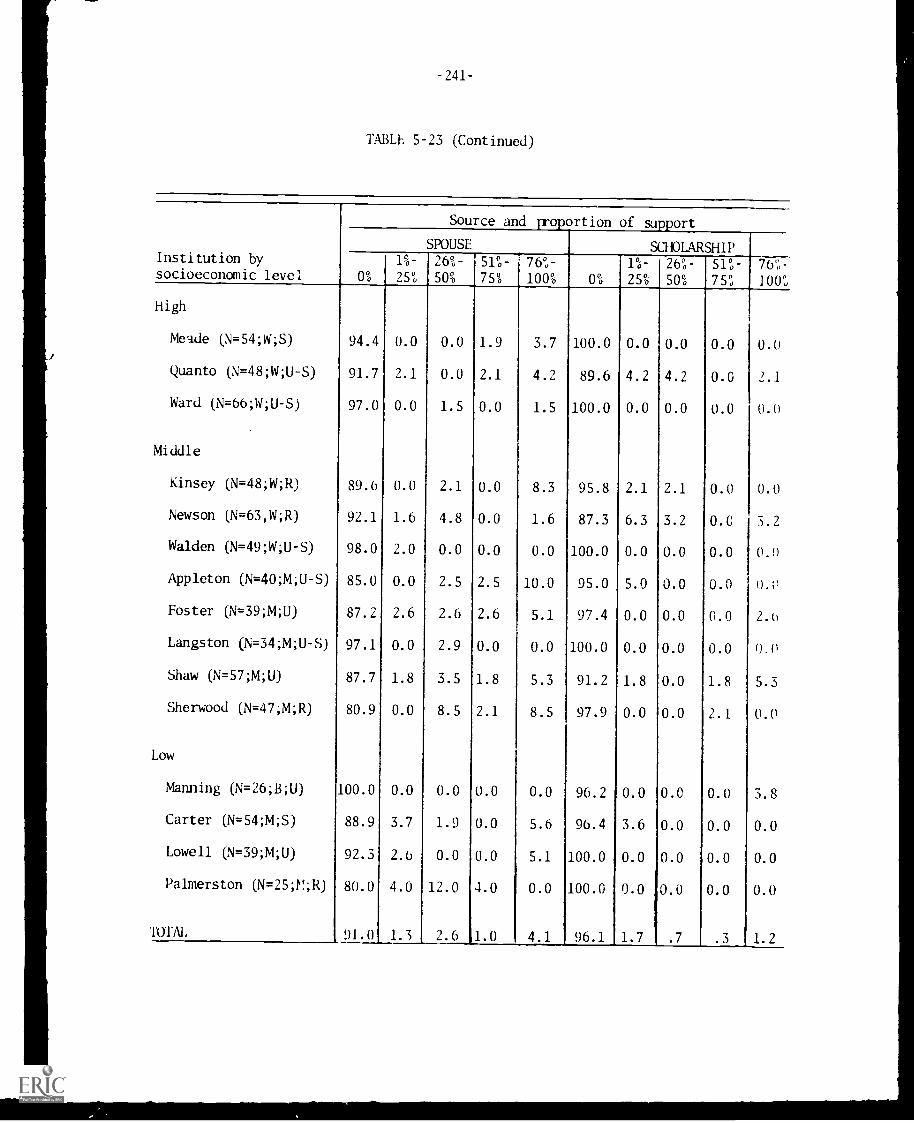
-241-
TABLE 5-23 (Continued)
Source and Froportion of support
SPOUSE SCHOLARSHIPInstitution by 1%- 269.- 51%- 76%- 1%- 26%- 51%- 76%-socioeconomic level 25% 500 750 1000 0% 250 500 75% 100%
High
Meade (N=54;W;S) 94.4 0.0 0.0 1.9 3.7 100.0 0.0 0.0 0.0 0.0
Quanto (N=48;W;U-S) 91.7 2.1 0.0 2.1 4.2 89.6 4.2 4.2 0.0 2.1
Ward (N=66;W;U-S) 97.0 0.0 1.5 0.0 1.5 100.0 0.0 0.0 0.0 0.0
Middle
Kinsey (N=48;W;R) 89.6 0.0 2.1 0.0 8.3 95.8 2.1 2.1 0.0 0.0
Newson (N= 63,W;R) 92.1 1.6 4.8 0.0 1.6 87.3 6.3 3.2 0.0 3.2
Walden (N=49;W;U-S) 98.0 2.0 0.0 0.0 0.0 100.0 0.0 0.0 0.0 0.0
Appleton (N=40AU-S) 85.0 0.0 2.5 2.5 10.0 95.0 5.0 0.0 0.0 0.0
Foster (N=39;M;U) 87.2 2.6 2.6 2.6 5.1 97.4 0.0 0.0 0.0 2.6
Langston (N=34;M;U-S) 97.1 0.0 2.9 0.0 0.0 100.0 0.0 0.0 0.0 0.0
Shaw (1\1=57;M;U) 87.7 1.8 3.5 1.8 5.3 91.2 1.8 0.0 1.8 5.3
Sherwood (N=47;M;R) 80.9 0.0 8.5 2.1 8.5 97.9 0.0 0.0 2.1 0.0
Low
Manning (N=26;B;U) 100.0 0.0 0.0 0.0 0.0 96.2 0.0 0.0 0.0 3.8
Carter (N= 54;M;S) 88.9 3.7 1.9 0.0 5.6 96.4 3.6 0.0 0.0 0.0
Lowell (N=39;M;U) 92.3 2.6 0.0 0.0 5.1 100.0 0.0 0.0 0.0 0.0
Palmerston (N=25;fl;R) 80.0 4.0 12.0 4.0 0.0 100.0 0.0 0.0 0.0 0.0
TOTAL 91.0 1.3 2.6 1.0 4.1 96.1 1.7 .7 .3 1.2
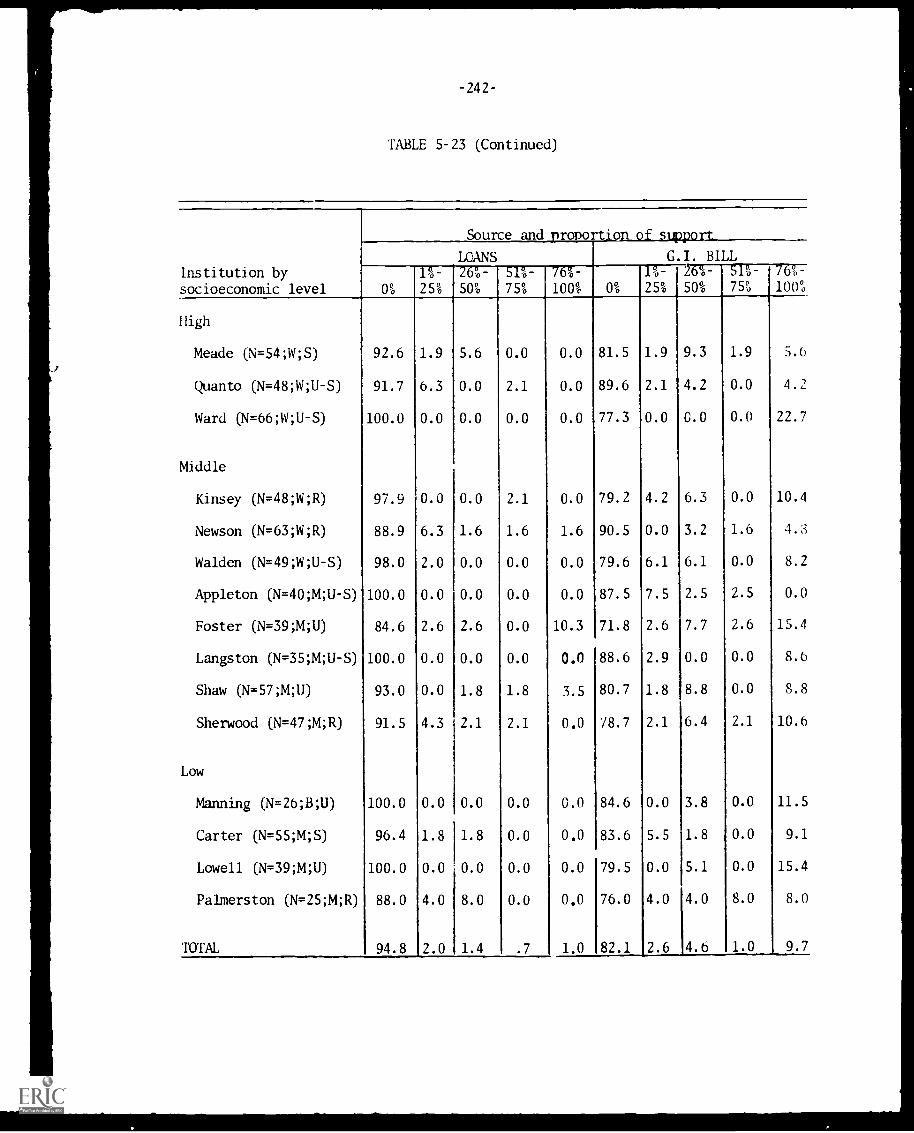
-242-
TABLE 5-23 (Continued)
Institution bysocioeconomic level
Source and II -tio
LOANS
0
1%-
250
260-
500
-51%-
750
76o-100%
00
1%-
250
High
Meade (N=54;W;S) 92.6 1.9 5.6 0.0 0.0 81.5 1.9
Quanto (N=48;W;U-S) 91.7 6.3 0.0 2.1 0.0 89.6 2.1
Ward (N=66;W;U-S) 100.0 0.0 0.0 0.0 0.0 77.3 0.0
Middle
Kinsey (N=48;W;R) 97.9 0.0 0.0 2.1 0.0 79.2 4.2
Newson (N=63;W;R) 88.9 6.3 1.6 1.6 1.6 90.5 0.0
Walden (N=49;W;U-S) 98.0 2.0 0.0 0.0 0.0 79.6 6.1
Appleton (N=40;M;U-S) 100.0 0.0 0.0 0.0 0.0 87.5 7.5
Foster (N=39;M;U) 84.6 2.6 2.6 0.0 10.3 71.8 2.6
Langston (N=35;M;U-S) 100.0 0.0 0.0 0.0 0.0 88.6 2.9
Shaw (N=57;M;U) 93.0 0.0 1.8 1.8 3.5 80.7 1.8
Sherwood (N=47;M;R) 91.5 4.3 2.1 2.1 0.0 78.7 2.1
Low
Manning (N=26;B;U) 100.0 0.0 0.0 0.0 0.0 84.6 0.0
Carter (N=55;M;S) 96.4 1.8 1.8 0.0 0.0 83.6 5.5
Lowell (N=39;M;U) 100.0 0.0 0.0 0.0 0.0 79.5 0.0
Palmerston (N=25;M;R) 88.0 4.0 8.0 0.0 0.0 76.0 4.0
TOTAL 94.8 2.0 1.4 .7 1.0 82.1 2.6
G.I. BILL2-6757---577--767=
500 75% 100°0
9.3 1.9 5.6
4.2 0.0 4.2
0.0 0.0 22.7
6.3 0.0 10.4
3.2 1.6 4.3
6.1 0.0 8.2
2.5 2.5 0.0
7.7 2.6 15.4
0.0 0.0 8.6
8.8 0.0 8.8
6.4 2.1 10.6
3.8 0.0 11.5
1.8 0.0 9.1
5.1 0.0 15.4
14.0 8.0 8.0
X4.6 1.0 9.7
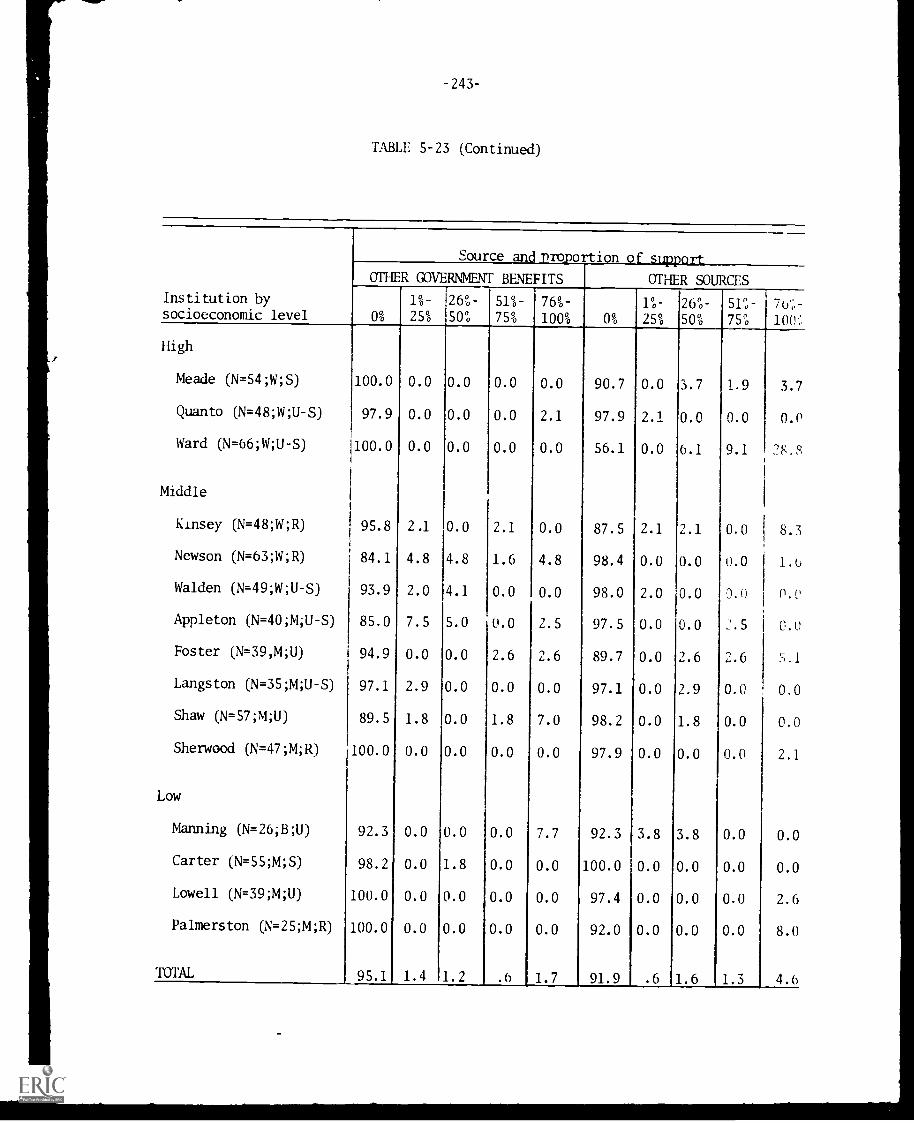
-243-
TABLE 5-23 (Continued)
Institution bysocioeconomic level
Source and Proportion of support
OTHER GOVERNMENT BENEFITS OTHER SOURCES
0%
1%-
25%
260-
50%
510-
75%
760-
100% 0%
100-
25%
260.-
50%
51"0-
75%
76'0-100°,
High
Meade (N=54;W;S)
Quanto (N=48;W;U-S)
100.0 0.0 0.0 0.0 0.0 90.7 0.0 3.7 1.9 3.7
97.9 0.0 0.0 0.0 2.1 97.9 2.1 0.0 0.0 0.P
0.0 0.0 0.0 0.0 56.1 0.0 6.1 9.1 28.SWard (N=66;W;U-S) 100.0
Middle
Kinsey (N=48;W;R) 95.8
Newson (N=63;W;R) 84.1
Walden (N=49;W;U-S) 93.9
Appleton (N=40;M;U-S) 85.0
Foster (N=39,M;U) 94.9
Langston (N=35XU-S)
Shaw (N=57;M;U)
Sherwood (N=47;M;R)
Low
Manning (N=26;B;U)
Carter (N=55;M;S)
Lowell (N=39;M;U)
Palmerston (N=25;M;R)
TOTAL
2.1 0.0 2.1 0.0 87.5 2.1 2.1 0.0 8.3
4.8 4.8 1.6 4.8 98.4 0.0 0.0 0.0 1.6
2.0 4.1 0.0 0.0 98.0 2.0 0.0 o.o
7.5 5.0 0.0 2.5 97.5 0.0 0.0 2.5 0.0
0.0 0.0 2.6 2.6 89.7 0.0 2.6 2.6 S.1
97.1 2.9 0.0 0.0 0.0 97.1 0.0 2.9 0.0 0.0
89.5 1.8 0.0 1.8 7.0 98.2 0.0 1.8 0.0 0.0
100.0 0.0 0.0 0.0 0.0 97.9 0.0 0.0 0.0 2.1
92.3 0.0 0.0 0.0 7.7 92.3 3.8 3.8 0.0 0.0
98.2 0.0 1.8 0.0 0.0 100.0 0.0 0.0 0.0 0.0
100.0 0.0 0.0 0.0 0.0 97.4 0.0 0.0 0.0 2.6
100.0 0.0 0.0 0.0 0.0 92.0 0.0 0.0 0.0 8.0
95.1 1.4 1.2 .6 1.7 91.9 .6 1.6 1.3 4.6
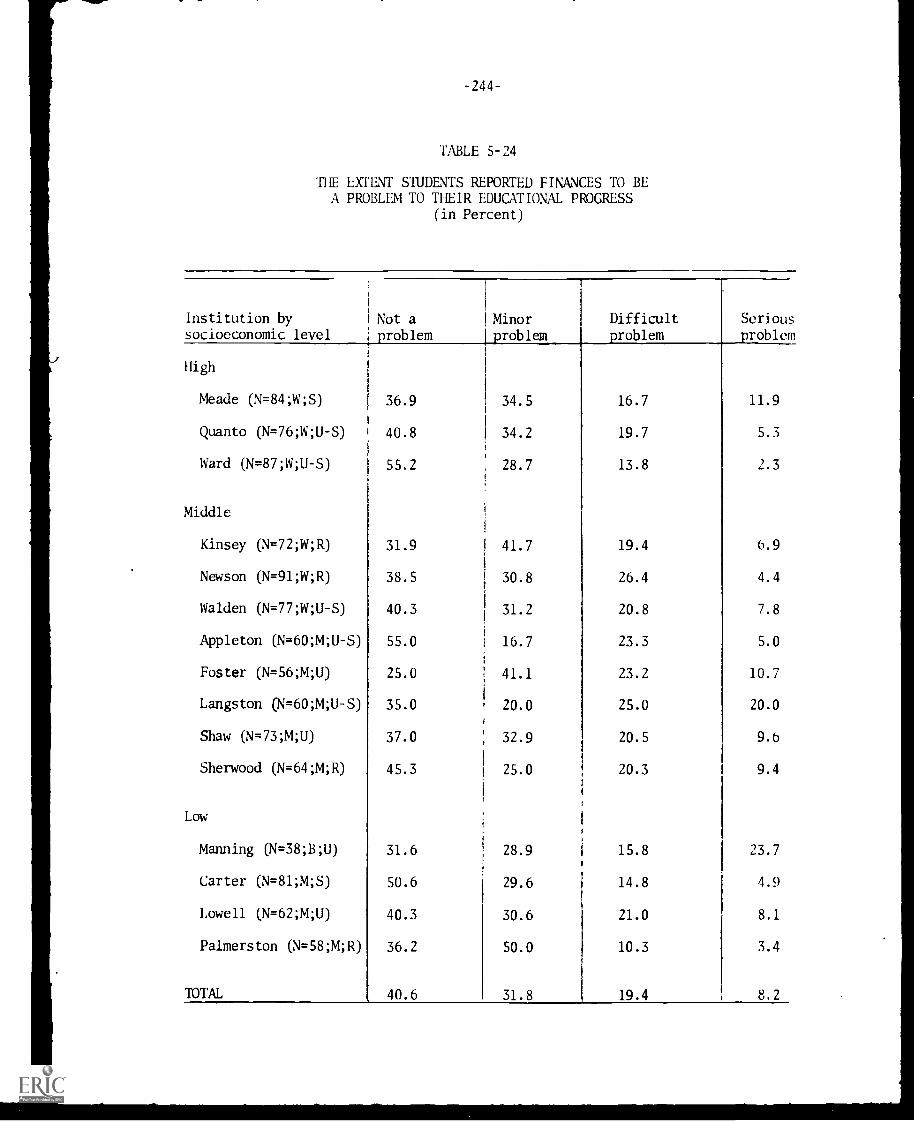
-244-
TABLE 5-24
THE EXTENT STUDENTS REPORTED FINANCES TO BEA PROBLEM TO THEIR EDUCATIONAL PROGRESS
(in Percent)
Institution by a
socioeconomic level problemMinor
I problem
Difficultproblem
Serious
problem
High
Meade (N=84;W;S) 36.9 34.5 16.7 11.9
Quanto (N=76;W;U-S) 40.8 34.2 19.7 5.3
Ward (N= 87;W;U -S) 55.2 28.7 13.8 2.3
Middle
Kinsey (N=72;W;R) 31.9 41.7 19.4 6.9
Newson (N=91;W;R) 38.5 30.8 26.4 4.4
Walden (N=77;W;U-S) 40.3 31.2 20.8 7.8
Appleton (N=60;M;U-S) 55.0 16.7 23.3 5.0
Foster (N=56;M;U) 25.0 41.1 23.2 10.7
Langston (N=60;M;U-S) 35.0 20.0 25.0 20.0
Shaw (N= 73;M;U) 37.0 32.9 20.5 9.6
Sherwood (N=64;M;R) 45.3 25.0 20.3 9.4
Low
Manning (N=38;B;U) 31.6 28.9 15.8 23.7
Carter (N=81;M;S) 50.6 29.6 14.8 4.9
Lowell (N=62;M;U) 40.3 30.6 21.0 8.1
Palmerston (N=58;M;R) 36.2 50.0 10.3 3.4
TOTAL 40.6 I 31.8 19.4 8.2
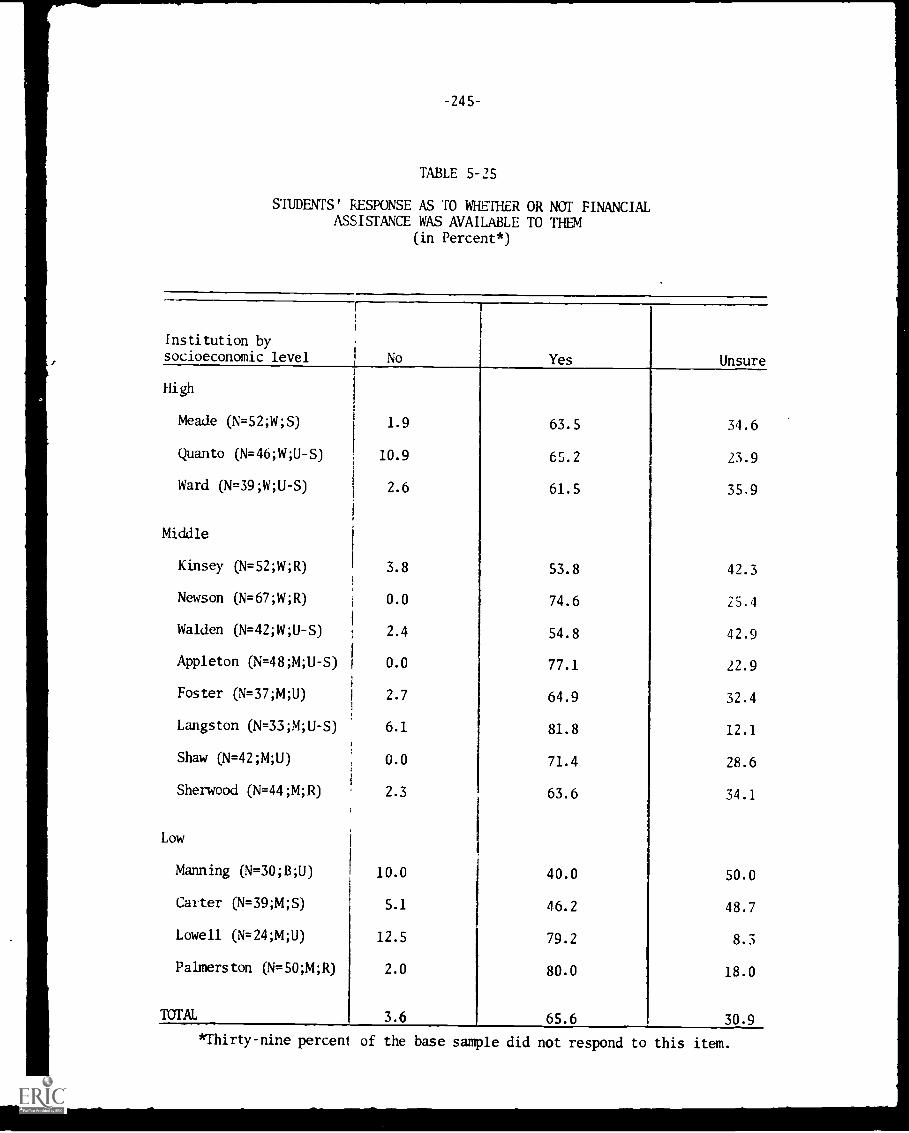
-245-
TABLE 5-25
STUDENTS' RESPONSE AS TO WHETHER OR NOT FINANCIALASSISTANCE WAS AVAILABLE TO THEM
(in Percent*)
Institution bysocioeconomic level No Yes Unsure
High
Meade (N=52;W;S) 1.9 63.5 34.6
Quanto (N=46;W;U-S) 10.9 65.2 23.9
Ward (N=39;W;U-S) 2.6 61.5 35.9
Middle
Kinsey (N=52;W;R) 3.8 53.8 42.3
Newson (N=67;W;R) 0.0 74.6 25.4
Walden (N=42;W;U-S) 2.4 54.8 42.9
Appleton (N=48;M;U-S) 0.0 77.1 22.9
Foster (N=37;M;U) 2.7 64.9 32.4
Langston (N=33;M;U-S) 6.1 81.8 12.1
Shaw (N= 42;M;U) 0.0 71.4 28.6
Sherwood (N=44;M;R) 2.3 63.6 34.1
Low
Manning (N=30;B;U) 10.0 40.0 50.0
Carter (N= 39;M;S) 5.1 46.2 48.7
Lowell (N=24;M;U) 12.5 79.2 8.3
Palmerston (N=50;M;R) 2.0 80.0 18.0
TOTAL 3.6 65.6 30.9
*Thirty-nine percent of the base sample did not respond to this item.
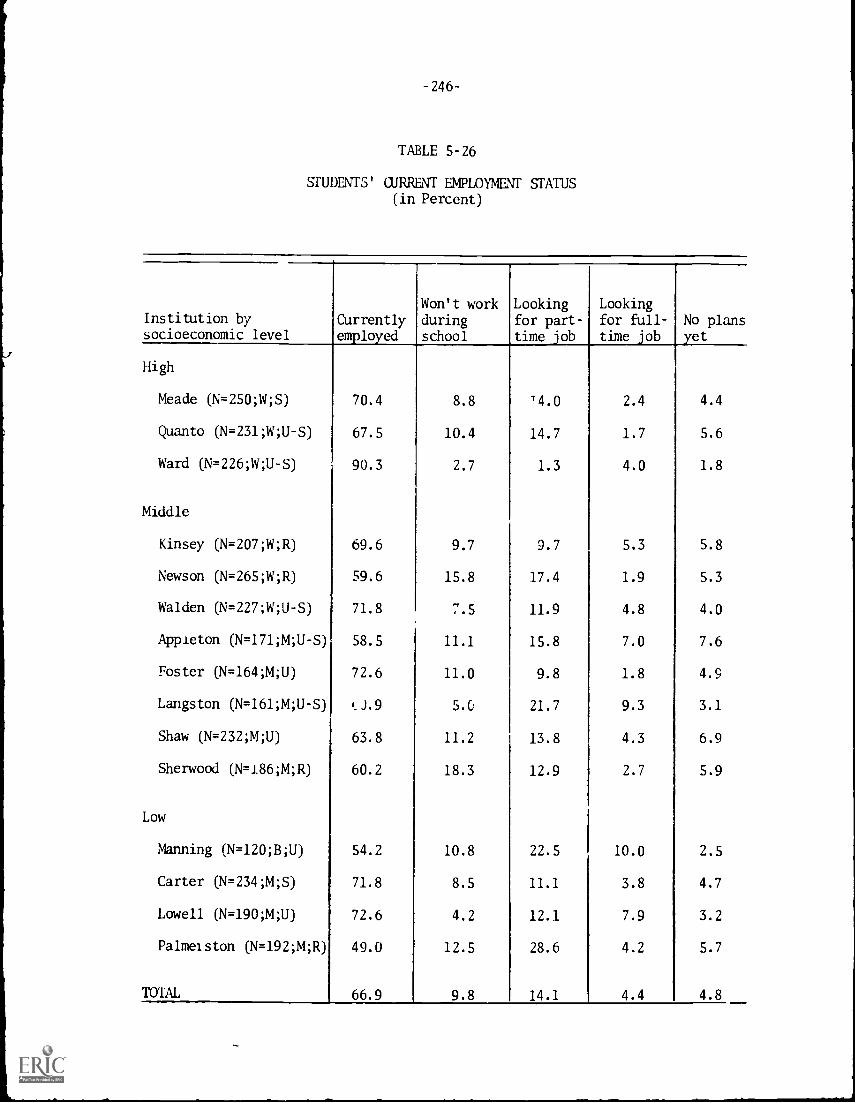
-246-
TABLE 5-26
STUDENTS' CURRENT EMPLOYMENT STATUS(in Percent)
Institution bysocioeconomic level
Currentlyemployed
Won't workduringschool
Lookingfor part-time job
Lookingfor full-time job
No plansyet
High
Meade (N= 250;W;S) 70.4 8.8 14.0 2.4 4.4
Quanto (N= 231;W;U -S) 67.5 10.4 14.7 1.7 5.6
Ward (N=226;W;U-S) 90.3 2.7 1.3 4.0 1.8
Middle
Kinsey (N=207;W;R) 69.6 9.7 9.7 5.3 5.8
Newson (N= 265;W;R) 59.6 15.8 17.4 1.9 5.3
Walden (N=227;W;U-S) 71.8 7.5 11.9 4.8 4.0
Appleton (N=171;M;U-S) 58.5 11.1 15.8 7.0 7.6
Foster (N=164;M;U) 72.6 11.0 9.8 1.8 4.9
Langston (N=161;M;U-S) t..).9 5.0 21.7 9.3 3.1
Shaw (N=232;M;U) 63.8 11.2 13.8 4.3 6.9
Sherwood (N=186;M;R) 60.2 18.3 12.9 2.7 5.9
Low
Manning (N=120;B;U) 54.2 10.8 22.5 10.0 2.5
Carter (N=234;M;S) 71.8 8.5 11.1 3.8 4.7
Lowell (N= 190;M;U) 72.6 4.2 12.1 7.9 3.2
Palmerston (N= 192;M;R) 49.0 12.5 28.6 4.2 5.7
TOTAL 66.9 9.8 14.1 4.4 4.8
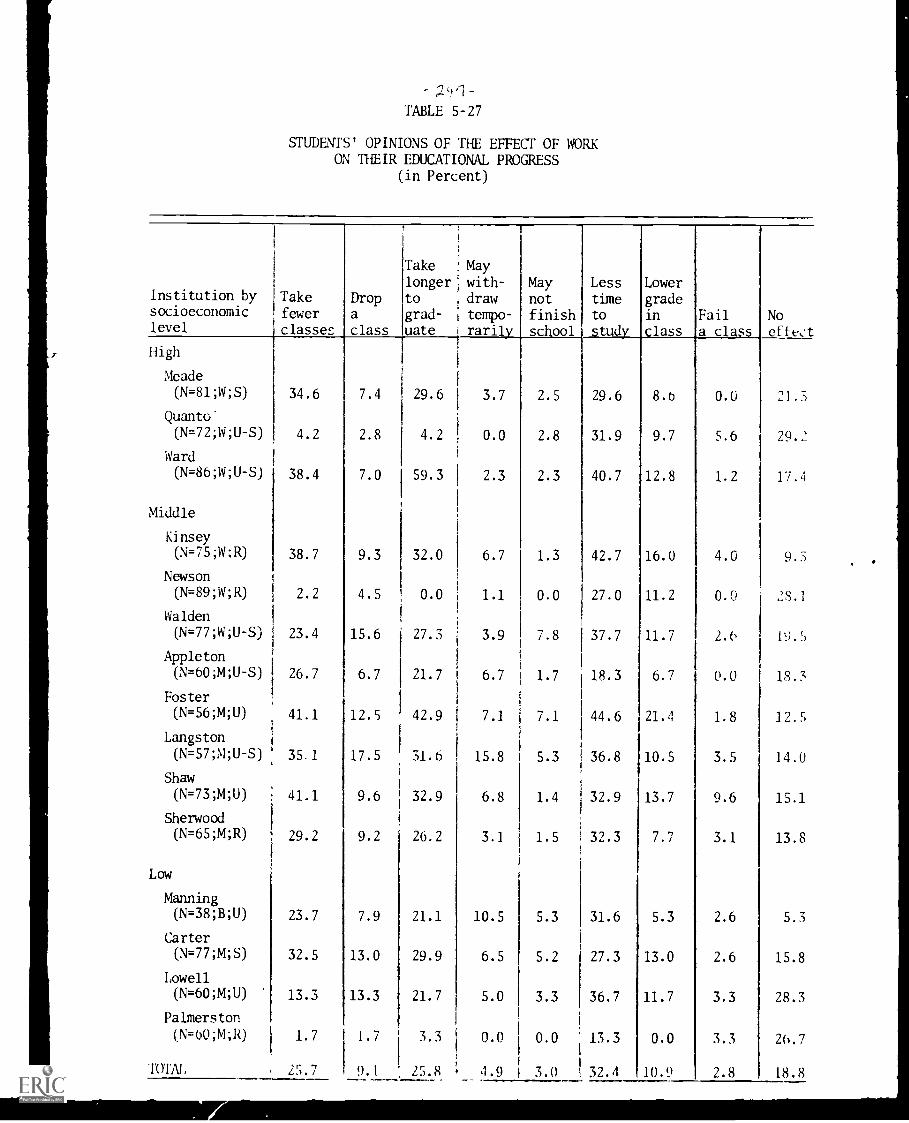
2'11
TABLE 5-27
STUDENTS' OPINIONS OF THE El-t-ECT OF WORK
ON THEIR EDUCATIONAL PROGRESS(in Percent)
Institution bysocioeconomiclevel
Takefewer
classes
Dropa
class
Take
longerto 4
grad-
uate
Maywith-drawtempo-
rariIIol
Maynotfinish
Lesstime
to
study
Lowergradein
classFaila class
Noeffect
High
Meade(N=81;W;S) 34.6 7.4 29.6 3.7 2.5 29.6 8.b 0.0 21.3
Quanto(N=72;W;U-S) 4.2 2.8 4.2 0.0 2.8 31.9 9.7 5.6 29.2
Ward(N=86;W;U-S) 38.4 7.0 59.3 2.3 2.3 40.7 12.8 1.2 17.4
Middle
Kinsey(N= 75;W;R) 38.7 9.3 32.0 6.7 1.3 42.7 16.0 4.0 9.3
Newson
(N=89;W;R) 2.2 4.5 0.0 1.1 0.0 27.0 11.2 0.0 22.1
Walden(N=77;W;U-S) 23.4 15.6 27.3 3.9 7.8 37.7 11.7 2.0 19.S
Appleton(N=60;M;U-S) 26.7 6.7 21.7 6.7 1.7 18.3 6.7 0.0 18.3
Foster(N=56;M;U) 41.1 12.5 42.9 7.1 7.1 44.6 21.4 1.8 12.5
Langston
(N=57;M;U-S) 35.1 17.5 31.6 15.8 5.3 36.8 10.5 3.5 14.0
Shaw(N=73;M;U) 41.1 9.6 32.9 6.8 1.4 32.9 13.7 9.6 15.1
Sherwood(N=65;M;R) 29.2 9.2 26.2 3.1 1.5 32.3 7.7 3.1 13.8
Low
Manning(N=38;B;U) 23.7 7.9 21.1 10.5 5.3 31.6 5.3 2.6 5.3
Carter(N=77;M;S) 32.5 13.0 29.9 6.5 5.2 27.3 13.0 2.6 15.8
Lowell(N=60;M;U) 13.3 13.3 21.7 5.0 3.3 36.7 11.7 3.3 28.3
Palmerston
(N=60;M;R) 1.7 1.7 3.3
!
1 0.0 0.0 13.3 0.0 3.3 26.7
10TAL 25.7 9.1 25.8 4.9 3.0 1 32.4 10.9 2.8 18.8
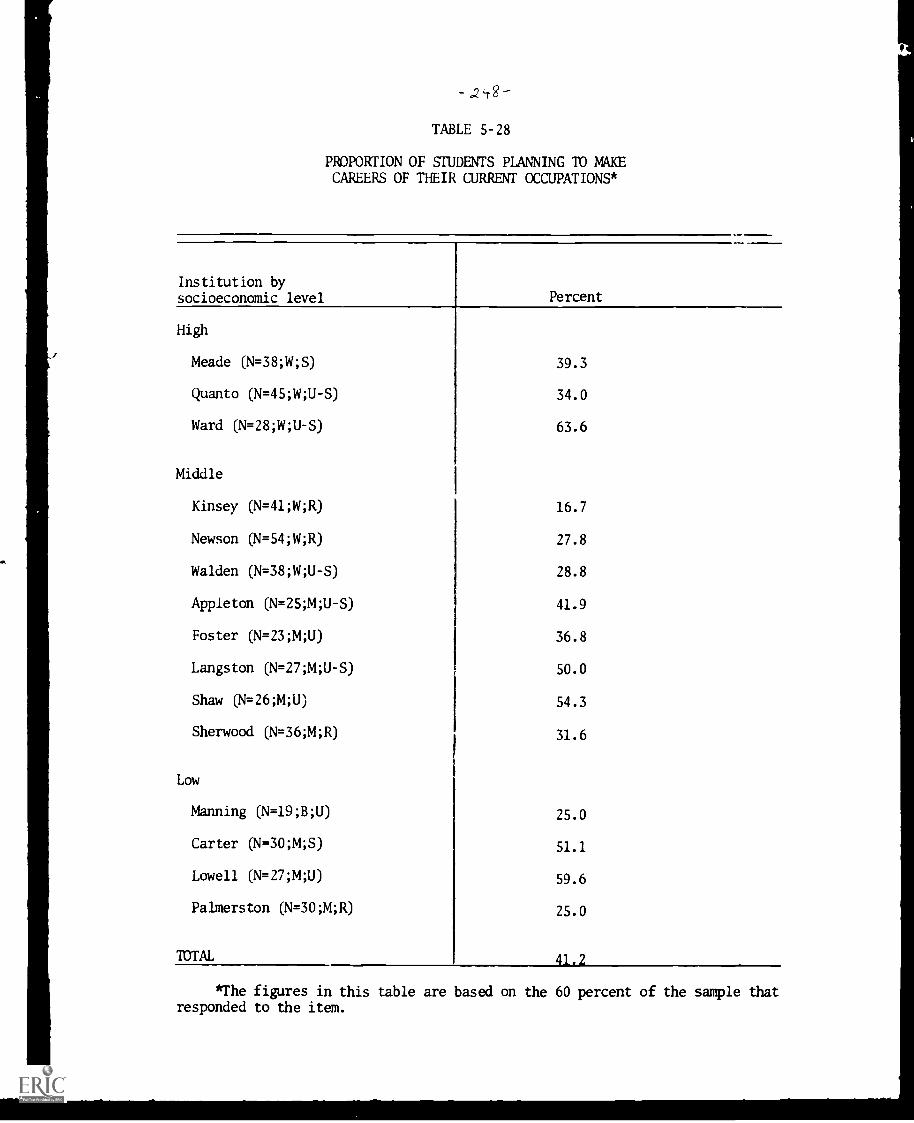
TABLE 5-28
PROPORTION OF STUDENTS PLANNING TO MAKECAREERS OF THEIR CURRENT OCCUPATIONS*
Institution bysocioeconomic level Percent
High
Meade (N=38;W;S)
Quanto (N=45;W;U-S)
Ward (N=28;W;U-S)
Middle
Kinsey (N=41;W;R)
Newson (N=54;W;R)
Walden (N=38;W;U-S)
Appleton (N=25;M;U-S)
Foster (N=23;M;U)
Langston (N=27;M;U-S)
Shaw (N=26 ;M;U)
Sherwood (N=36;M;R)
Low
Manning (N=19;B;U)
Carter (N=30;M;S)
Lowell (N= 27;M;U)
Palmerston (N=30;M;R)
'DOTAL
39.3
34.0
63.6
16.7
27.8
28.8
41.9
36.8
50.0
54.3
31.6
25.0
51.1
59.6
25.0
*The figures in this table are based on the 60 percent of the sample thatresponded to the item.
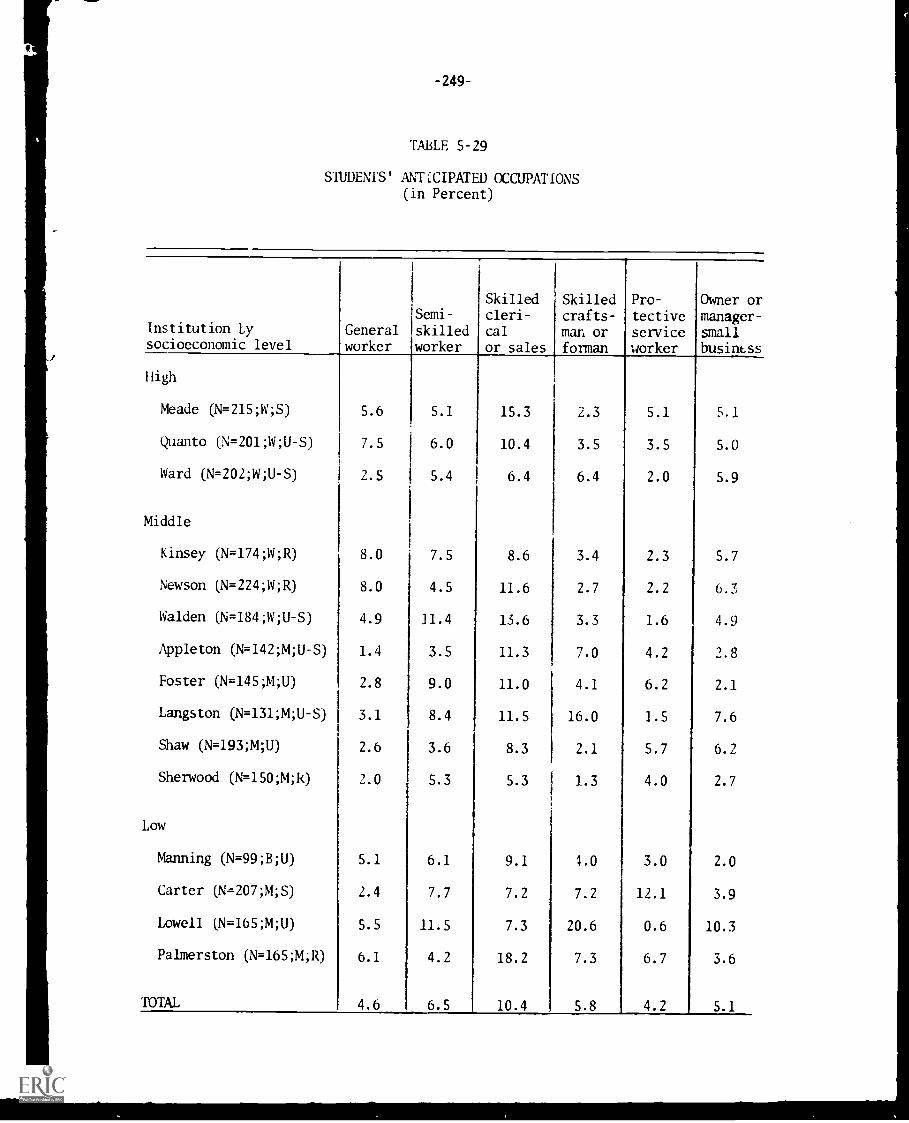
TABLE 5-29
STUDENTS' ANTXIPATED OCCUPATIONS(in Percent)
Institution Lysocioeconomic level
Generalworker
Semi-
skilledworker
Skilledcleri-
cal
or sales
Skilledcrafts-man orforman
Pro-
tectiveserviceworker
Owner ormanager-smallbusintss
High
Meade (N= 215;W;S) 5.6 5.1 15.3 2.3 5.1 5.1
Quanto (N=201;W;U-S) 7.5 6.0 10.4 3.5 3.5 5.0
Ward (N=202;W;U-S) 2.5 5.4 6.4 6.4 2.0 5.9
Middle
Kinsey (N= 174;W;R) 8.0 7.5 8.6 3.4 2.3 5.7
Newson (N=224;W;R) 8.0 4.5 11.6 2.7 2.2 6.3
Walden (N=184;W;U-S) 4.9 11.4 13.6 3.3 1.6 4.9
Appleton (N=142;M;U-S) 1.4 3.5 11.3 7.0 4.2 2.8
Foster (N=145;M;U) 2.8 9.0 11.0 4.1 6.2 2.1
Langston (N=131;M;U-S) 3.1 8.4 11.5 16.0 1.5 7.6
Shaw (N=193;M;U) 2.6 3.6 8.3 2.1 5.7 6.2
Sherwood (N=150;M;k) 2.0 5.3 5.3 1.3 4.0 2.7
Low
Manning (N= 99;B;U) 5.1 6.1 9.1 1.0 3.0 2.0
Carter (N= 207;M;S) 2.4 7.7 7.2 7.2 12.1 3.9
Lowell (N=165;M;U) 5.5 11.5 7.3 20.6 0.6 10.3
Palmerston (N=165;M;R) 6.1 4.2 18.2 7.3 6.7 3.6
TOTAL 4.6 6.5 10.4 5.8 4.2 5.1
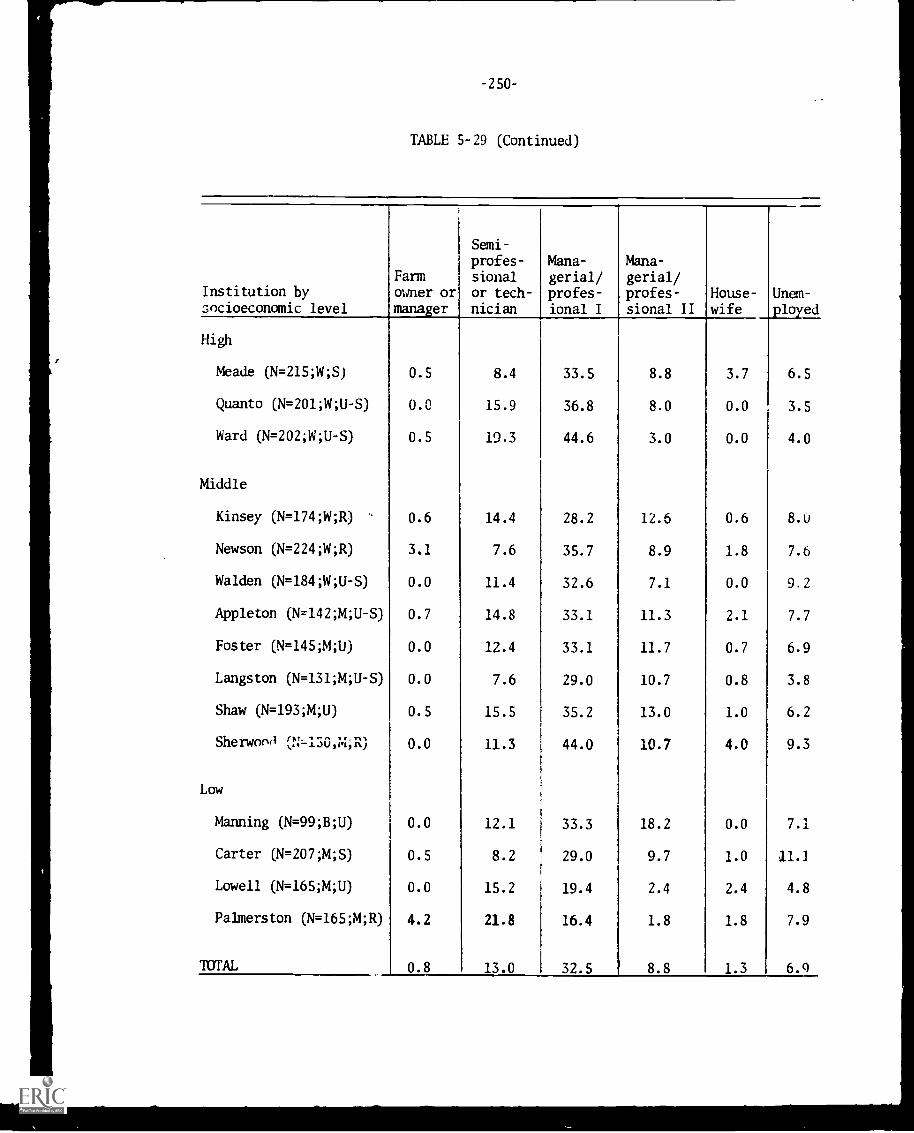
TABLE 5-29 (Continued)
Institution bysocioeconomic level
Farmowner ormanager
Semi-
profes-sionalor tech-nician
Mana-gerial/profes-ional I
Mana-gerial/profes-sional II
House-wife
Unem-
ployed
High
Meade (N=215;W;S) 0.5 8.4 33.5 8.8 3.7 6.5
Quanto (N=201;W;U-S) 0.0 15.9 36.8 8.0 0.0 3.5
Ward (N=202;W;U-S) 0.5 19.3 44.6 3.0 0.0 4.0
Middle
Kinsey (N=174;W;R) 0.6 14.4 28.2 12.6 0.6 8.0
Newson (N=224;W;R) 3.1 7.6 35.7 8.9 1.8 7.6
Walden (N=184;W;U-S) 0.0 11.4 32.6 7.1 0.0 9.2
Appleton (N=142;M;U-S) 0.7 14.8 33.1 11.3 2.1 7.7
Foster (N=145;M;U) 0.0 12.4 33.1 11.7 0.7 6.9
Langston (N=131;M;U-S ) 0.0 7.6 29.0 10.7 0.8 3.8
Shaw (N=193;M;U) 0.5 15.5 35.2 13.0 1.0 6.2
Sherwood (N,..130,m;R) 11.3 44.0 10.7 4.0 9.3
Low
Manning (N=99;B;U) 0.0 12.1 33.3 18.2 0.0 7.1
Carter (N=207;M;S) 0.5 8.2 29.0 9.7 1.0 11.1
Lowell (N=165;M;U) 0.0 15.2 19.4 2.4 2.4 4.8
Palmerston (N=165;M;R) 4.2 21.8 16.4 1.8 1.8 7.9
TOTAL 0.8 13.0 32.5 8.8 1.3 6.9
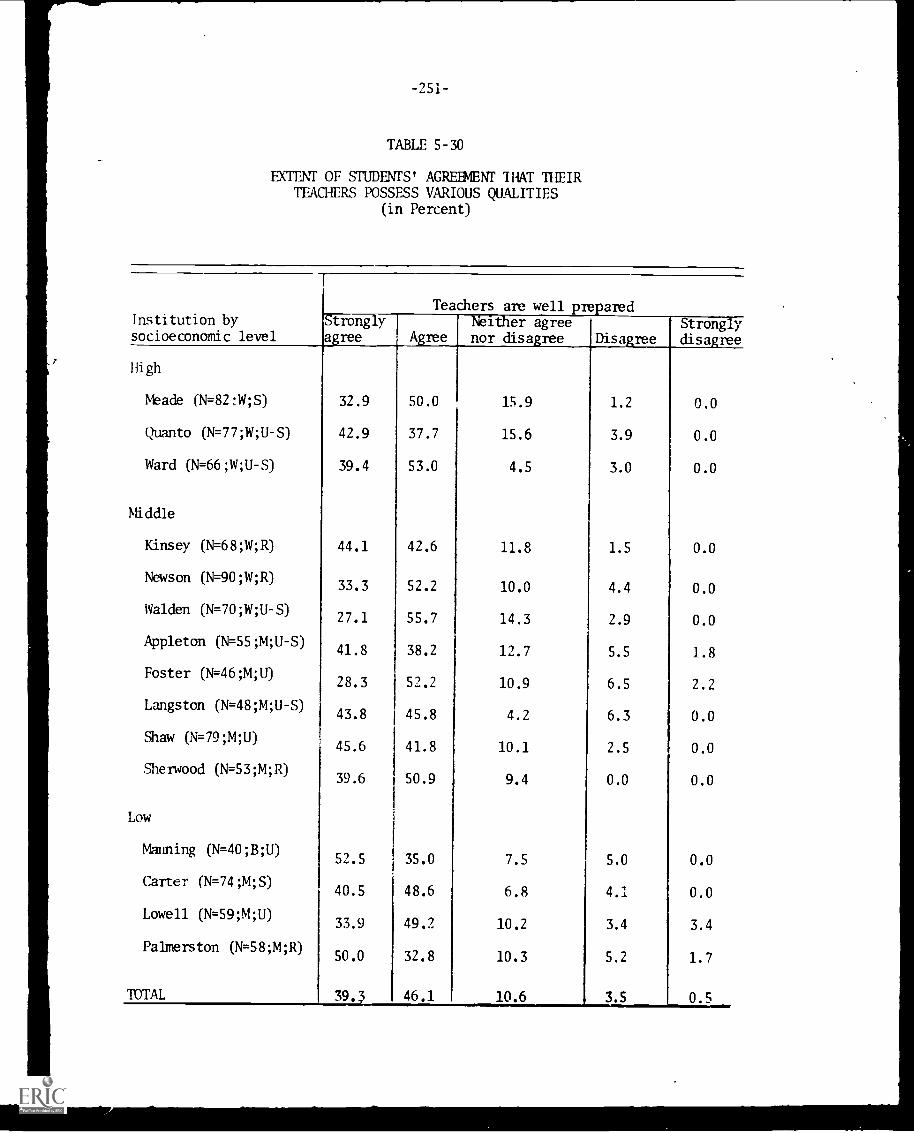
-25I-
TABLE 5-30
EXTENT OF STUDENTS' AGREEMENT THAT THEIRTEACHERS POSSESS VARIOUS QUALITIES
(in Percent)
Institution by
socioeconomic level
Teachers are well preparedStronglyagree Agree
Neither agreenor disagree Disagree
Stronglydisagree
High
Meade (N=82:W;S) 32.9 50.0 15.9 1.2 0.0
Quanto (N=77;W;U-S) 42.9 37.7 15.6 3.9 0.0
Ward (N=66;W;U-S) 39.4 53.0 4.5 3.0 0.0
Middle
Kinsey (N=68;W;R) 44.1 42.6 11.8 1.5 0.0
Newson (N=90;W;R)33.3 52.2 10.0 4.4 0.0
Walden (N=70;W;U-S)27.1 55.7 14.3 2.9 0.0
Appleton (N=55;M;U-S)41.8 38.2 12.7 5.5 1.8
Foster (N= 46;M;U)28.3 52.2 10.9 6.5 2.2
Langston (N=48;M;U-S)43.8 45.8 4.2 6.3 0.0
Shaw (N= 79;M;U)45.6 41.8 10.1 2.5 0.0
Sherwood (N=53;M;R)39.6 50.9 9.4 0.0 0.0
Low
Manning (N=40;B;U)52.5 35.0 I 7.5 5.0 0.0
Carter (N=74;M;S)40.5 48.6 6.8 4.1 0.0
Lowell (N=59;M;U)33.9 49.2 10.2 3.4 3.4
Palmerston (N=58;M;R)50.0 32.8 10.3 5.2 1.7
TOTAL 39,1 46.1 10.6 3.5 0.5
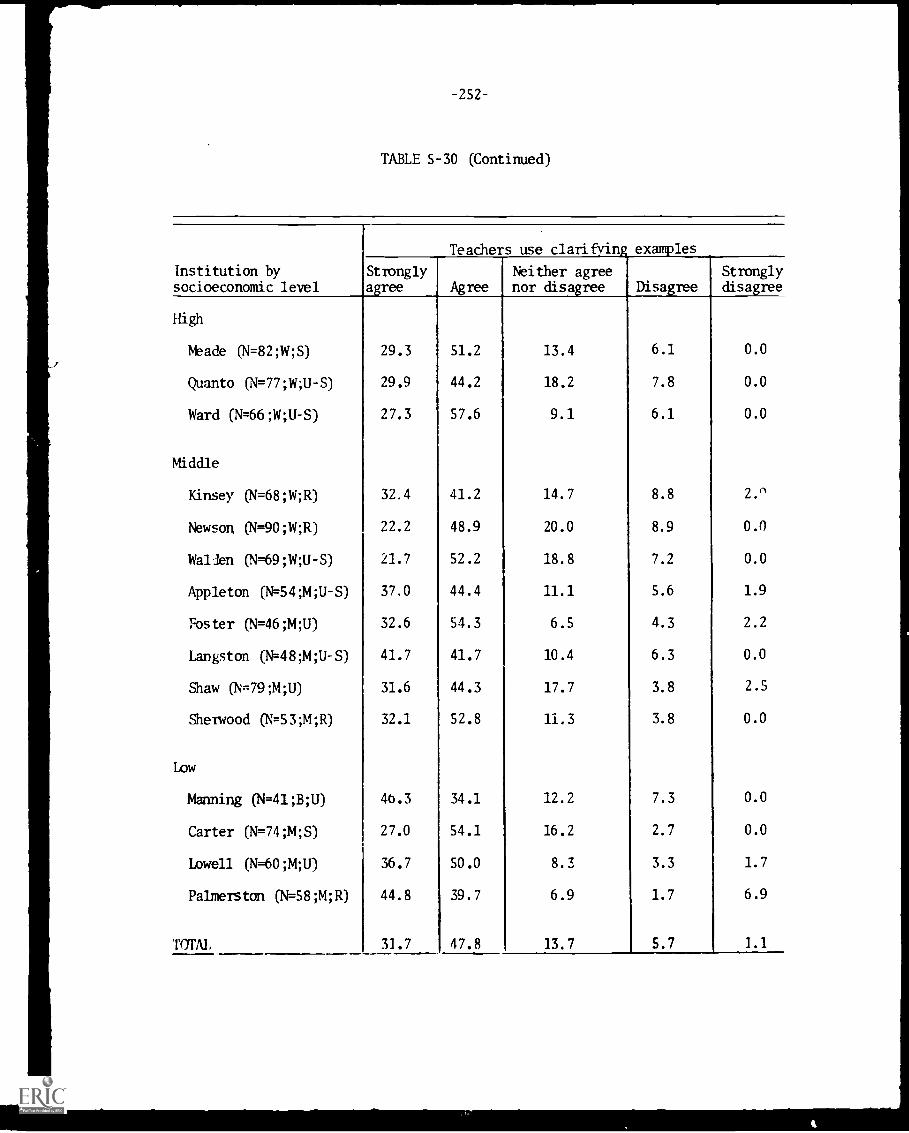
-252-
TABLE 5-30 (Continued)
Institution bysocioeconomic level
Teachers use clarifying examples
Stronglyagree Agree
Neither agreenor disagree Disagree
Stronglydisagree
High
Meade (N=82;W;S) 29.3 51.2 13.4 6.1 0.0
Quanto (N= 77;W;U -S) 29.9 44.2 18.2 7.8 0.0
Ward (N=66;W;U-S) 27.3 57.6 9.1 6.1 0.0
Middle
Kinsey (N=68;W;R) 32.4 41.2 14.7 8.8 2.'1
Newsom (N=90;W;R) 22.2 48.9 20.0 8.9 0.0
Walden (N=69;W;U-S) 21.7 52.2 18.8 7.2 0.0
Appleton (N=54;M;U-S) 37.0 44.4 11.1 5.6 1.9
Foster (N=46;M;U) 32.6 54.3 6.5 4.3 2.2
Langston (N= 48;M;U -S) 41.7 41.7 10.4 6.3 0.0
Shaw (N=79;M;U) 31.6 44.3 17.7 3.8 2.5
Sherwood (N=53;M;R) 32.1 52.8 11.3 3.8 0.0
Low
Manning (N=41;B;U) 46.3 34.1 12.2 7.3 0.0
Carter (N=74;M;S) 27.0 54.1 16.2 2.7 0.0
Lowell (N=60;M;U) 36.7 50.0 8.3 3.3 1.7
Palmerston (N=58 ;M;R) 44.8 39.7 6.9 1.7 6.9
TOTAL 31.7 47.8 13.7 5.7 1.1
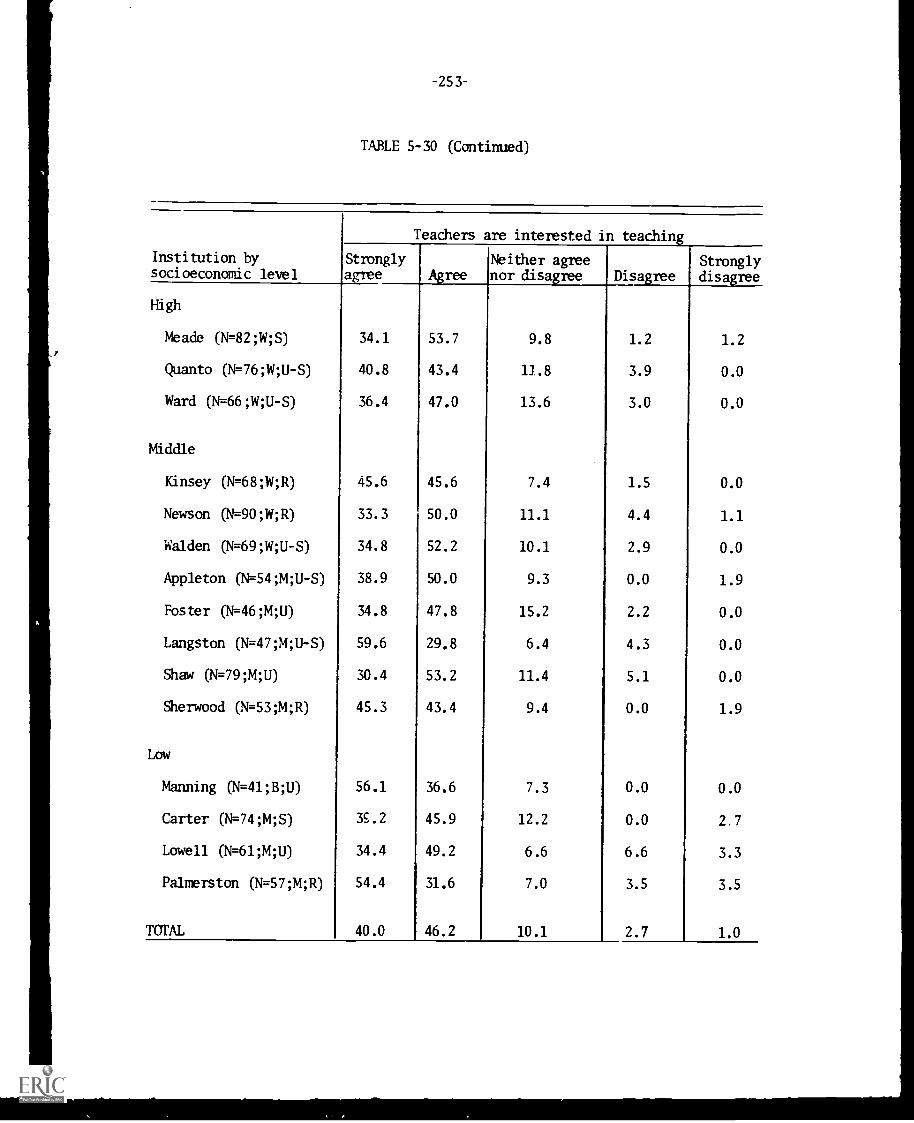
-253-
TABLE 5-30 (Continued)
Institution bysocioeconomic level
High
Meade (N=82;W;S) 34.1
Quanto (N=76;W;U-S) 40.8
Ward (N=66;W;U-S) 36.4
Teachers are interested in teaching
Stronglya' e
Middle
Kinsey (N=68;W;R) 45.6
Newson (N=90;W;R) 33.3
Walden (459;W;U-S) 34.8
Appleton (N= 54;M;U -S) 38.9
Foster (N=46;M;U) 34.8
Langston (N=47;M;U-S) 59.6
Shaw (N=79;M;U) 30.4
Sherwood (N=53;M;R) 45.3
Low
Manning (N= 41;B;U) 56.1
Carter (N=74;M;S) 3S.2
Lowell (N=61;M;U) 34.4
Palmerston (N= 57;M;R) 54.4
TOTAL 40.0
AgrNeither agreenor disagree Disagree
Stronglydisagree
53.7 9.8 1.2 1.2
43.4 11.8 3.9 0.0
47.0 13.6 3.0 0.0
45.6 7.4 1.5 0.0
50.0 11.1 4.4 1.1
52.2 10.1 2.9 0.0
50.0 9.3 0.0 1.9
47.8 15.2 2.2 0.0
29.8 6.4 4.3 0.0
53.2 11.4 5.1 0.0
43.4 9.4 0.0 1.9
36.6 7.3 0.0 0.0
45.9 12.2 0.0 2.7
49.2 6.6 6.6 3.3
31.6 7.0 3.5 3.5
46.2 10.1 2.7 1.0
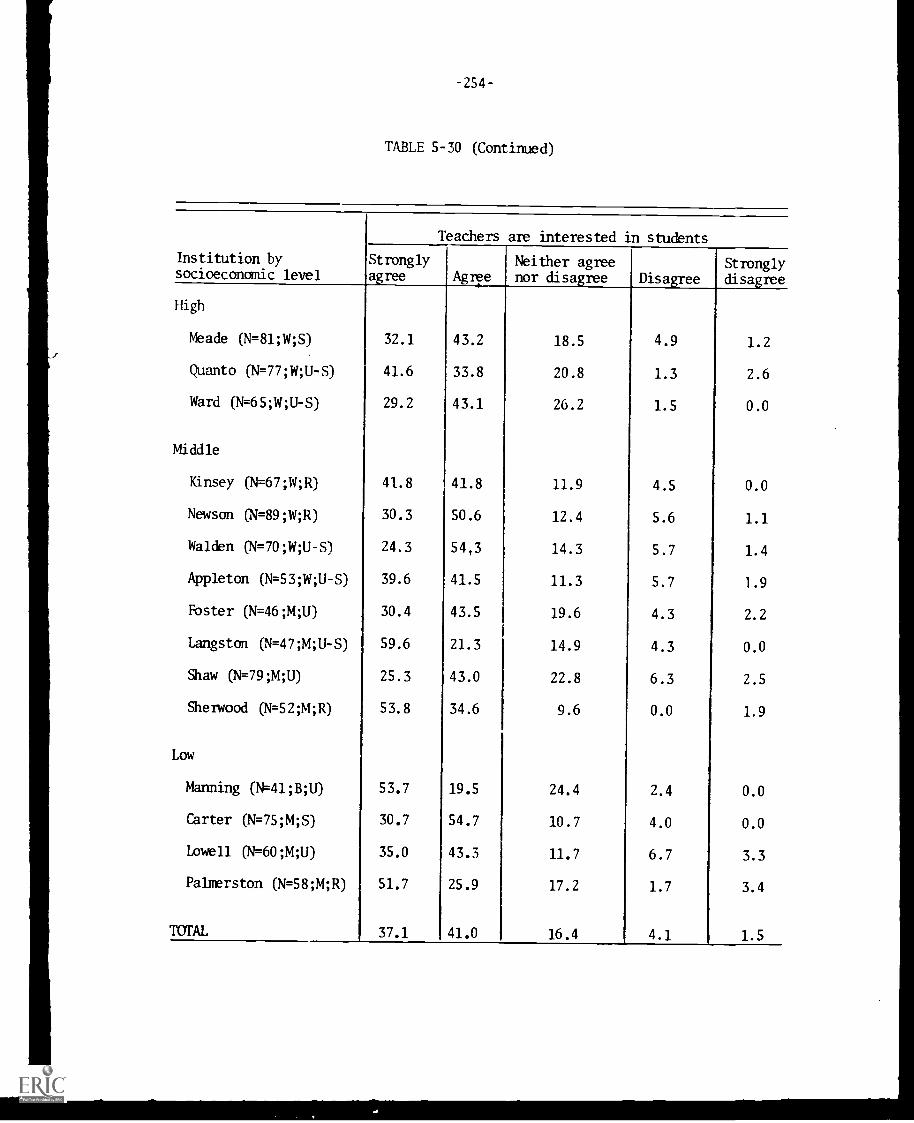
-254-
TABLE 5-30 (Continued)
Institution bysocioeconomic level
Teachers are interested in students
Stronglyagree Agree
Neither agreenor disagree Disagree
Stronglydisagree
High
Meade (N=81;W;S) 32.1 43.2 18.5 4.9 1.2
Quanto (N=77;W;U-S) 41.6 33.8 20.8 1.3 2.6
Ward (N=65;W;U-S) 29.2 43.1 26.2 1.5 0.0
Middle
Kinsey (N=67;W;R) 41.8 41.8 11.9 4.5 0.0
Newson (N=89 ;W;R) 30.3 50.6 12.4 5.6 1.1
Walden (N=70 ;W;U-S) 24.3 54,3 14.3 5.7 1.4
Appleton (N=53;W;U-S) 39.6 41.5 11.3 5.7 1.9
Foster (N=46;M;U) 30.4 43.5 19.6 4.3 2.2
Langston (N=47;M;U-S) 59.6 21.3 14.9 4.3 0.0
Shaw (N=79 ;M;U) 25.3 43.0 22.8 6.3 2.5
Sherwood (N=52;M;R) 53.8 34.6 9.6 0.0 1.9
Low
Manning (N=41;B;U) 53.7 19.5 24.4 2.4 0.0
Carter (N=75;M;S) 30.7 54.7 10.7 4.0 0.0
Lowell (N=60 ;M;U) 35.0 43.3 11.7 6.7 3.3
Palmerston (N=58;M;R) 51.7 25.9 17.2 1.7 3.4
TOTAL 37.1 41.0 16.4 4.1 1.5

-255-
TABLE 5-30 (Continued)
Institution bysocioeconomic level
Teachers hold students' attention
Stronglyagree Agree
Neither agreenor disagree Disagree
Stronglydisagree
High
Meade (N=82;W;S) 13.4 43.9 25.6 11.0 6.1
Quanto (N= 77;W;U -S) 22.1 36.4 29.9 11.7 0.0
Ward (N=65;W;U-S) 16.9 53.8 20.0 9.2 0.0
Middle
Kinsey (N=68;W;R) 22.1 58.8 10.3 7.4 1.5
Newson (N= 90;W;R) 11.1 44.4 23.3 16.7 4.4
Walden (N=70;W;U-S) 11.4 54.3 21.4 11.4 1.4
Appleton (N=55;M;U-S) 30.9 40.0 12.7 12.7 3.6
Fester (N= 46;M;U) 21.7 41.3 23.9 8.7 4.3
Langston (N=47;M;U-S) 44.7 34.0 17.0 4.3 0.0
Shaw (N= 78;M;U) 19.2 46.2 23.1 9.0 2.6
Sherwood (N=53;M;R) 28.3 49.1 15.1 7.5 0.0
Low
Manning (N= 41;B;U) 39.0 41.5 7.3 12.2 0.0
Carter (N=74;M;S) 13.5 54.1 25.7 5.4 1.4
Lowell (N=60;M;U) 28.3 45.0 15.0 10.0 1.7
Palmerston (N=58;M;R) 41.4 34.5 15.5 5.2 3.4
TOTAL 22.5 45.6 19.9 9.8 2.2
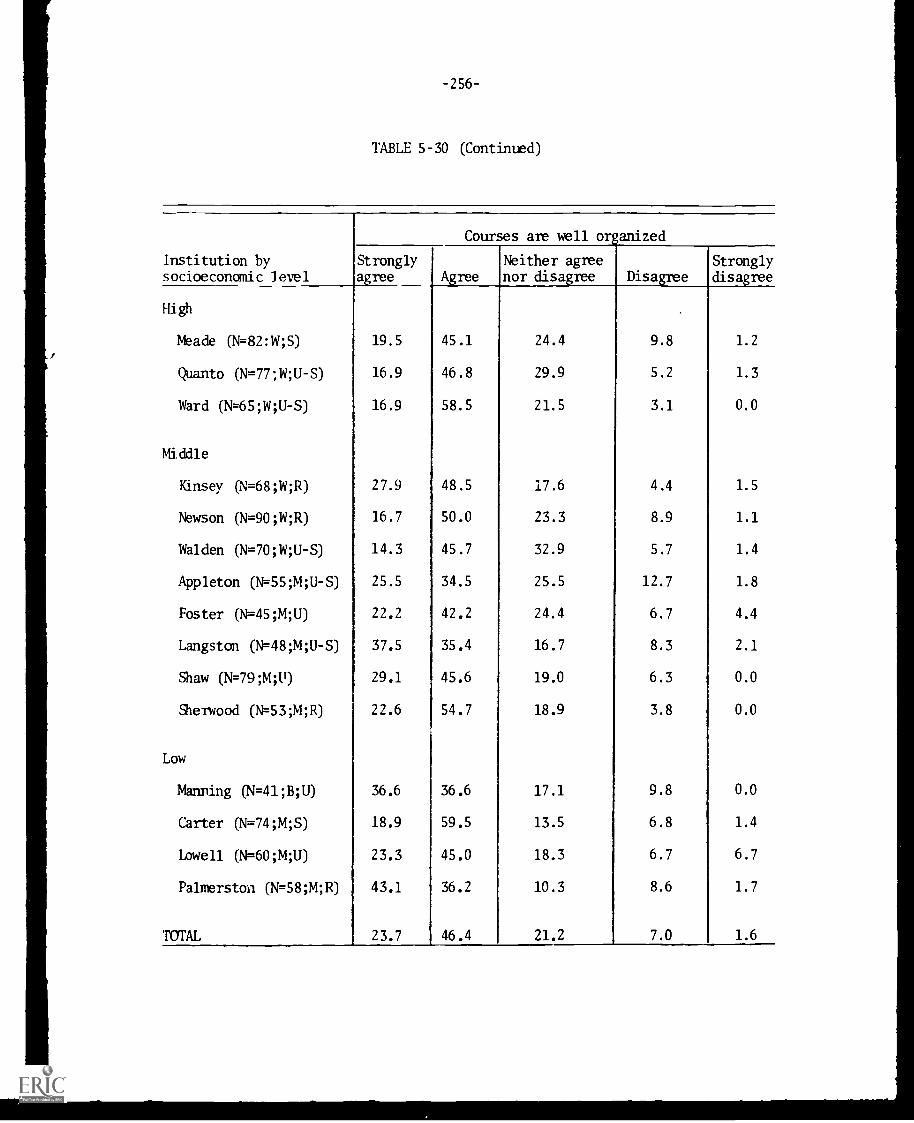
-256-
TABLE 5-30 (Continued)
Institution bysocioeconomic level
Courses are well organized
Stronglyagree Agree
Neither agreenor disagree Disagree
Stronglydisagree
High
Meade (N=82:W;S) 19.5 45.1 24.4 9.8 1.2
Quanto (N= 77;W;U -S) 16.9 46.8 29.9 5.2 1.3
Ward (N=65;W;U-S) 16.9 58.5 21.5 3.1 0.0
Middle
Kinsey (N=68;W;R) 27.9 48.5 17.6 4.4 1.5
Newson (N=90;W;R) 16.7 50.0 23.3 8.9 1.1
Walden (N=70;14;U-S) 14.3 45.7 32.9 5.7 1.4
Appleton (N=55;M;U-S) 25.5 34.5 25.5 12.7 1.8
Foster (N=45;M;U) 22.2 42.2 24.4 6.7 4.4
Langston (N=48;M;U-S) 37.5 35.4 16.7 8.3 2.1
Shaw (N=79;M;U) 29.1 45.6 19.0 6.3 0.0
Sherwood (N=53;M;R) 22.6 54.7 18.9 3.8 0.0
Low
Manning (N=41;B;U) 36.6 36.6 17.1 9.8 0.0
Carter (N=74;M;S) 18.9 59.5 13.5 6.8 1.4
Lowell (N=60;M;U) 23.3 45.0 18.3 6.7 6.7
Palmerston (N=58;M;R) 43.1 36.2 10.3 8.6 1.7
TOTAL 23.7 46.4 21.2 7.0 1.6
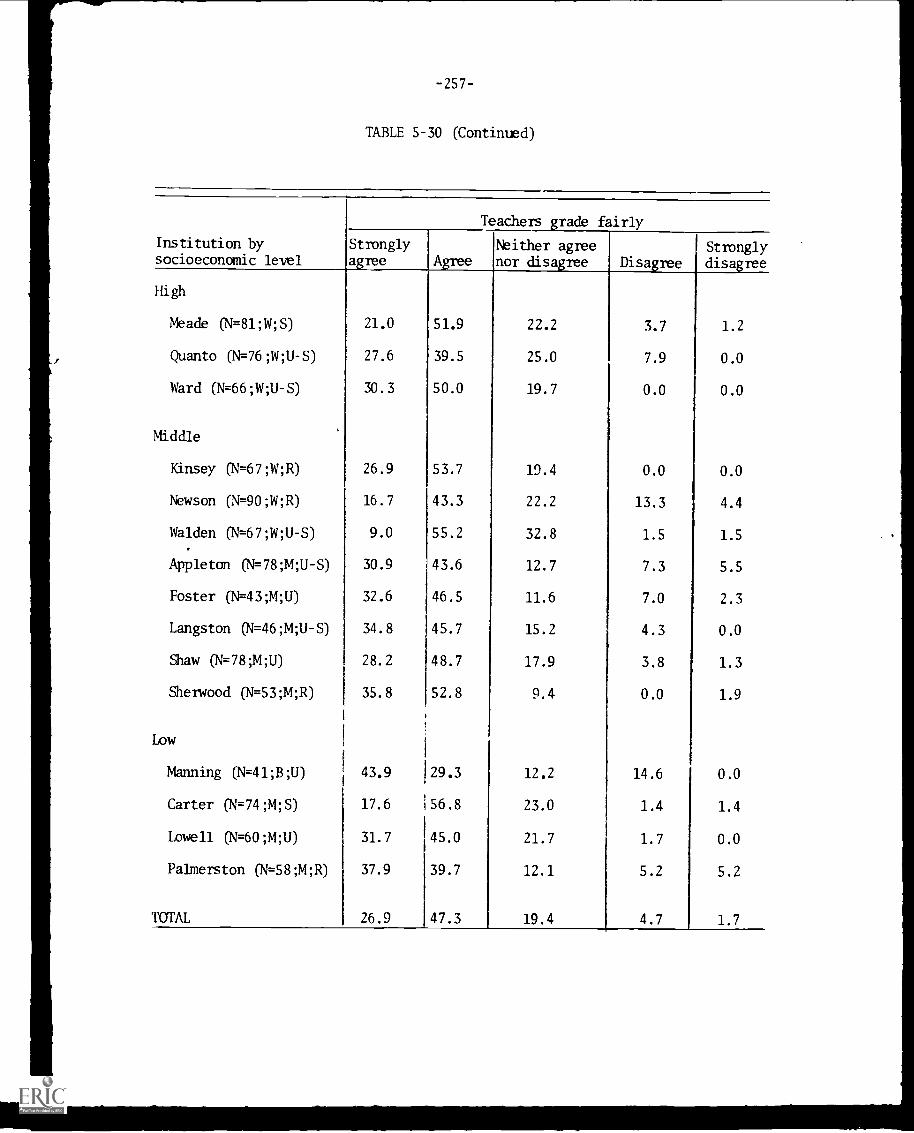
-257-
TABLE 5-30 (Continued)
Institution bysocioeconomic level
Teachers grade fairly
Stronglyagree A
Neither agreenor disagree Disagree
I Stronglydisagree
High
Meade (N=81 ;W; S) 21.0 51.9 22.2 3.7 1.2
Quanto (N=76 ;W;U-S) 27.6 39.5 25.0 7.9 0.0
Ward (N=66 ;W;U-S) 30.3 50.0 19.7 0.0 0.0
Middle
Kinsey (N=67 ;W;R) 26.9 53.7 19.4 0.0 0.0
Newson (N=90 ;W;R) 16.7 43.3 22.2 13.3 4.4
Walden (N=67 ;W;U-S) 9.0 55.2 32.8 1.5 1.5
Appleton (N=78 ;M;U-S) 30.9 43.6 12.7 7.3 5.5
Foster (N=43 ;M;U) 32.6 46.5 11.6 7.0 2.3
Langston (N=46 ;M;U-S) 34.8 45.7 15.2 4.3 0.0
Shaw (N=78 ;M;U) 28.2 48.7 17.9 3.8 1.3
Sherwood (N=53 ;M;R) 35.8 52.8 9.4 0.0 1.9
Low
Manning (N=41 ;B ;U) 43.9 29.3 12.2 14.6 0.0
Carter (N=74 ;M;S)1
17.6 156.8 23.0 1.4 1.4
Lowell (N=60 ;M;U) 31.7 45.0 21.7 1.7 0.0
Palmerston (N=58 ;M;R) 37.9 39.7 12.1 5.2 5.2
TOTAL 26.9 47.3 19.4 4.7 1.7
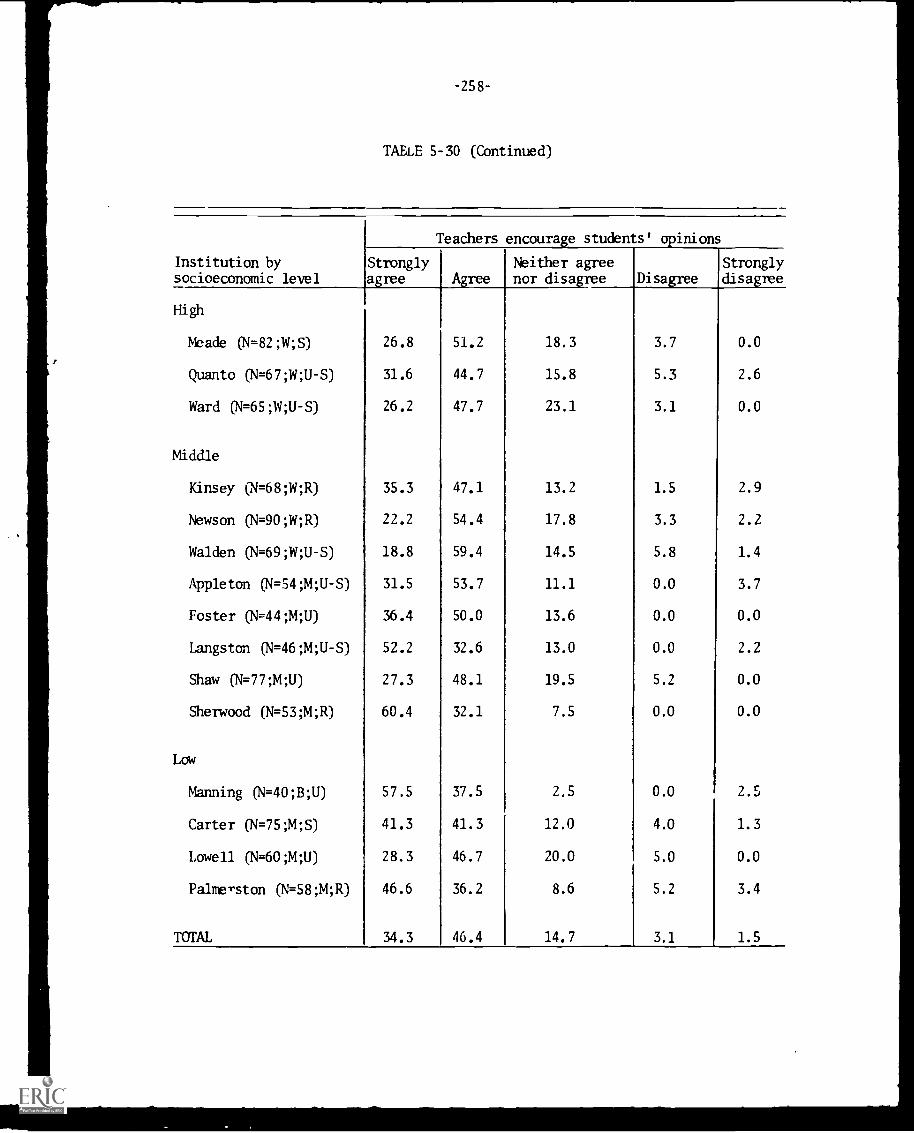
-258-
TABLE 5-30 (Continued)
Institution bysocioeconomic leve
Teachers encourage students' opinions
Strongly4_gree Agree
Neither agreenor disagree Disagree
Stronglydisagree
High
Meade (N=82;W;S) 26.8 51.2 18.3 3.7 0.0
Quanto (N=67;W;U-S) 31.6 44.7 15.8 5.3 2.6
Ward (N=65;W;U-S) 26.2 47.7 23.1 3.1 0.0
Middle
Kinsey (N=68;W;R) 35.3 47.1 13.2 1.5 2.9
Newson (N= 90;W;R) 22.2 54.4 17.8 3.3 2.2
Walden (N= 69;W;U -S) 18.8 59.4 14.5 5.8 1.4
Appleton (N=54;M;U-S) 31.5 53.7 11.1 0.0 3.7
Foster (N=44;M;U) 36.4 50.0 13.6 0.0 0.0
Langston (N=46;M;U-S) 52.2 32.6 13.0 0.0 2.2
Shaw (N= 77;M;U) 27.3 48.1 19.5 5.2 0.0
Sherwood (N= 53;M;R) 60.4 32.1 7.5 0.0 0.0
Low
Manning (N= 40;B;U) 57.5 37.5 2.5 0.0 2.5
Carter (N=75;14;S) 41.3 41.3 12.0 4.0 1.3
Lowell (N=60;M;U) 28.3 46.7 20.0 5.0 0.0
Palmerston (N=58;M;R) 46.6 36.2 8.6 5.2 3.4
TOTAL I 34.3 46.4 14.7 3.1 1.5
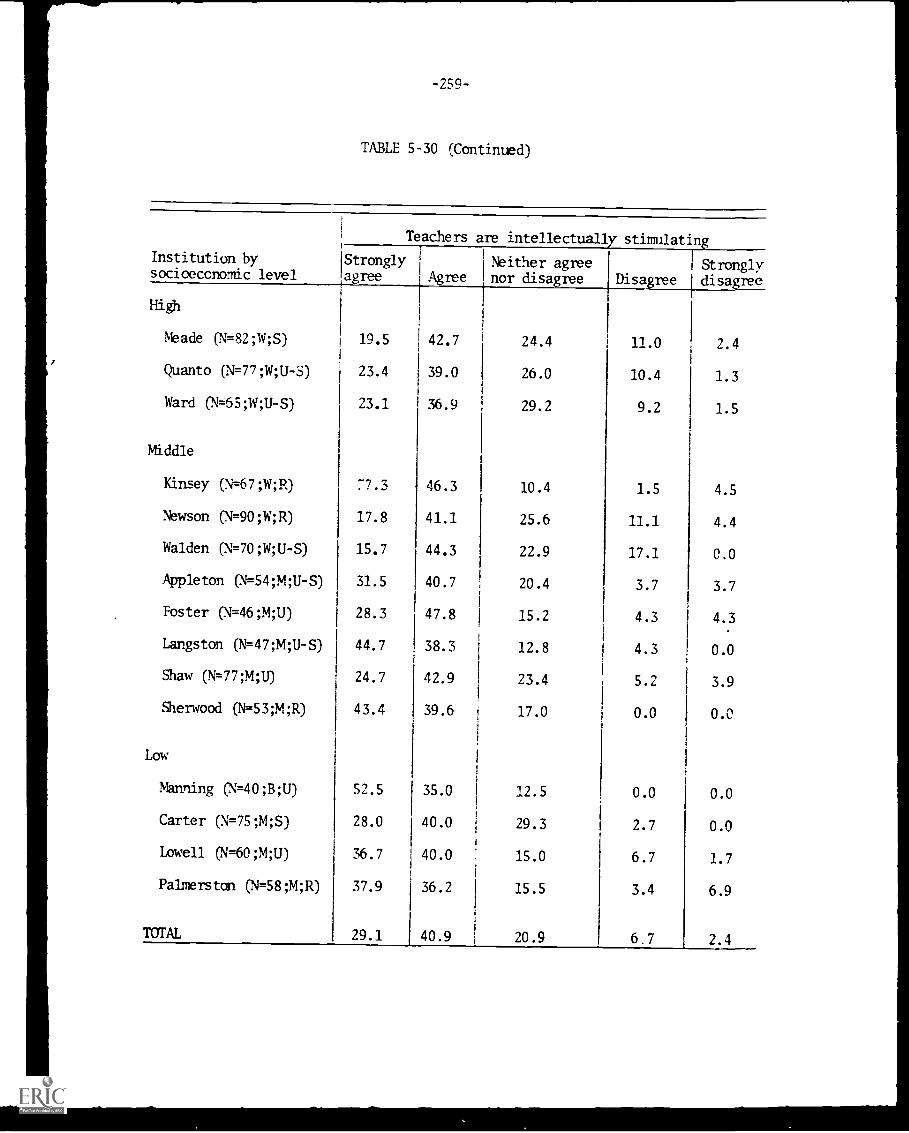
-259-
TABLE 5-30 (Continued)
Institution bysocioeconomic level
Teachers are intellectually stimulating
Stronglyagree Agree
Neither agreenor disagree Disagree
Stronglydisagree
High
Meade (N=82;W;S) 19.5 42.7 24.4 11.0 2.4
Quanto (N=77;W;U-S) 23.4 39.0 26.0 10.4 1.3
Ward (N=65;W;U-S) 23.1 36.9 29.2 9.2 1.5
Middle
Kinsey (N=67 ;W;R) 77.3 46.3 10.4 1.5 4.5
Newson (N=90 ;W;R) 17.8 41.1 25.6 11.1 4.4
Walden (N=70;W;U-S) 15.7 44.3 22.9 17.1 0.0
Appleton (N=54;M;U-S) 31.5 40.7 20.4 3.7 3.7
Foster (N=46;M;U) 28.3 47.8 15.2 4.3 4.3
Langston (N=47;M;U-S) 44.7 38.3 12.8 4.3 0.0
Shaw (N=77;M;U) 24.7 42.9 23.4 5.2 3.9
Sherwood (N=53;M;R) 43.4 39.6 17.0 0.0 0.0
Low
Manning (N=40;B;U) 52.5 35.0 12.5 0.0 0.0
Carter (N=75;M;S) 28.0 40.0 29.3 2.7 0.0
Lowell (N=60;M;U) 36.7 40.0 15.0 6.7 1.7
Palmerston (N=58;M;R) 37.9 36.2 15.5 3.4 6.9
TOTAL 29.1 40.9 20.9 6.7 2.4
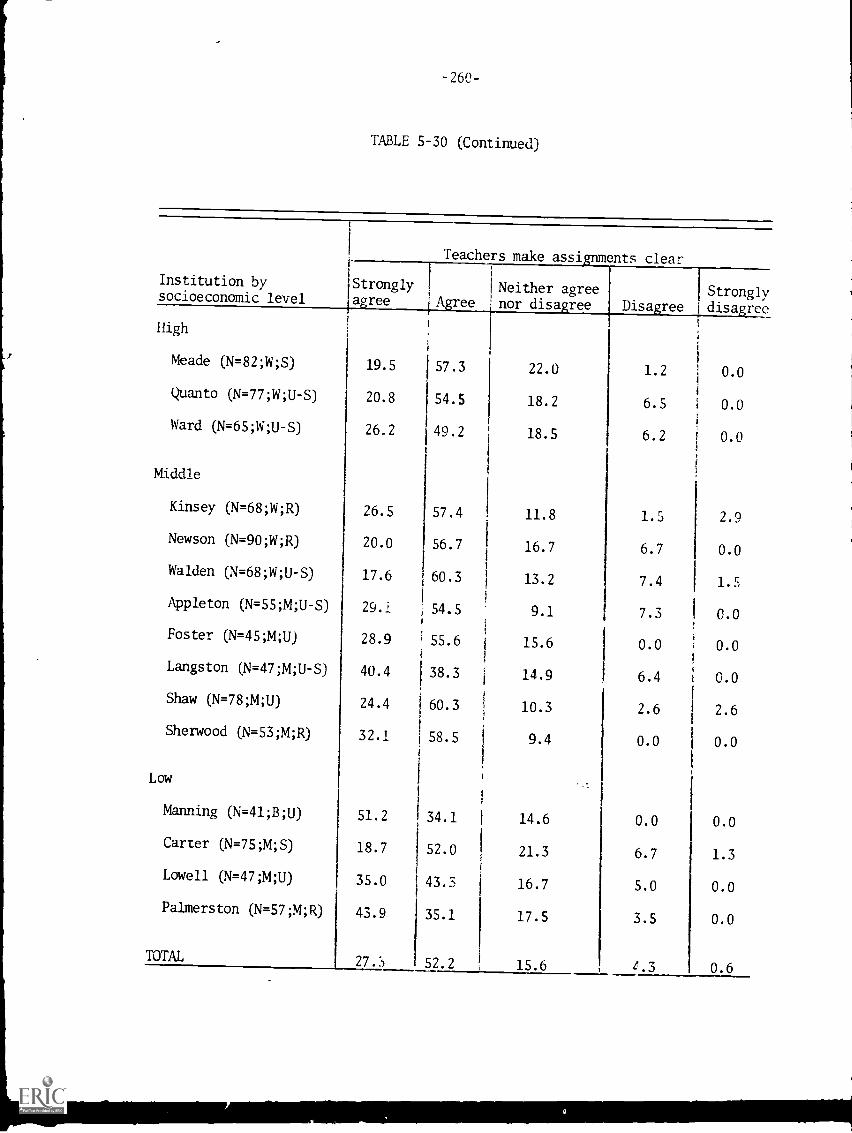
-260-
TABLE 5-30 (Continued)
Institution by Stronglysocioeconomic level agree
High
Meade (N= 82;W;S) 19.5
Quanto (N= 77;W;U -S) 20.8
Ward (N=65;W;U-S) 26.2
Middle
Kinsey (N=68;W;R) 26.5
Newson (N=90;W;R) 20.0
Walden (N=68;W;U-S) 17.6
Appleton (N=55;M;U-S) 29.i
Foster (N=45;M;U) 28.9
Langston (N=47;M;U-S) 40.4
Shaw (N=78;M;U) 24.4
Sherwood (N=53;M;R) 32.1
Low
Manning (N=41;B;U) 51.2
Carter (N=75;M;S) 18.7
Lowell (N=47;M;U) 35.0
Palmerston (N=57;14;R) 43.9
TOTAL 27.S
1
Teachers make assignments clear
AgreeNeither agreenor disagree Disagree
Stronglydisagree
57.3 22.0 1.2 0.0
54.5 18.2 6.5 0.0
49.2 18.5 6.2 0.0
57.4 11.8 1.5 2.9
56.7 16.7 6.7 0.0
60.3 13.2 7.4 1.5
54.5 9.1 7.3 0.0
55.6 15.6 0.0 0.0
38.3 14.9 6.4 0.0
60.3 10.3 2.6 2.6
58.5 9.4 0.0 0.0
34.1 14.6 0.0 0.0
52.0 21.3 6.7 1.3
43.3 16.7 5.0 0.0
35.1 17.5 3.5 0.0
52.2 15.6 I . 3 0.6
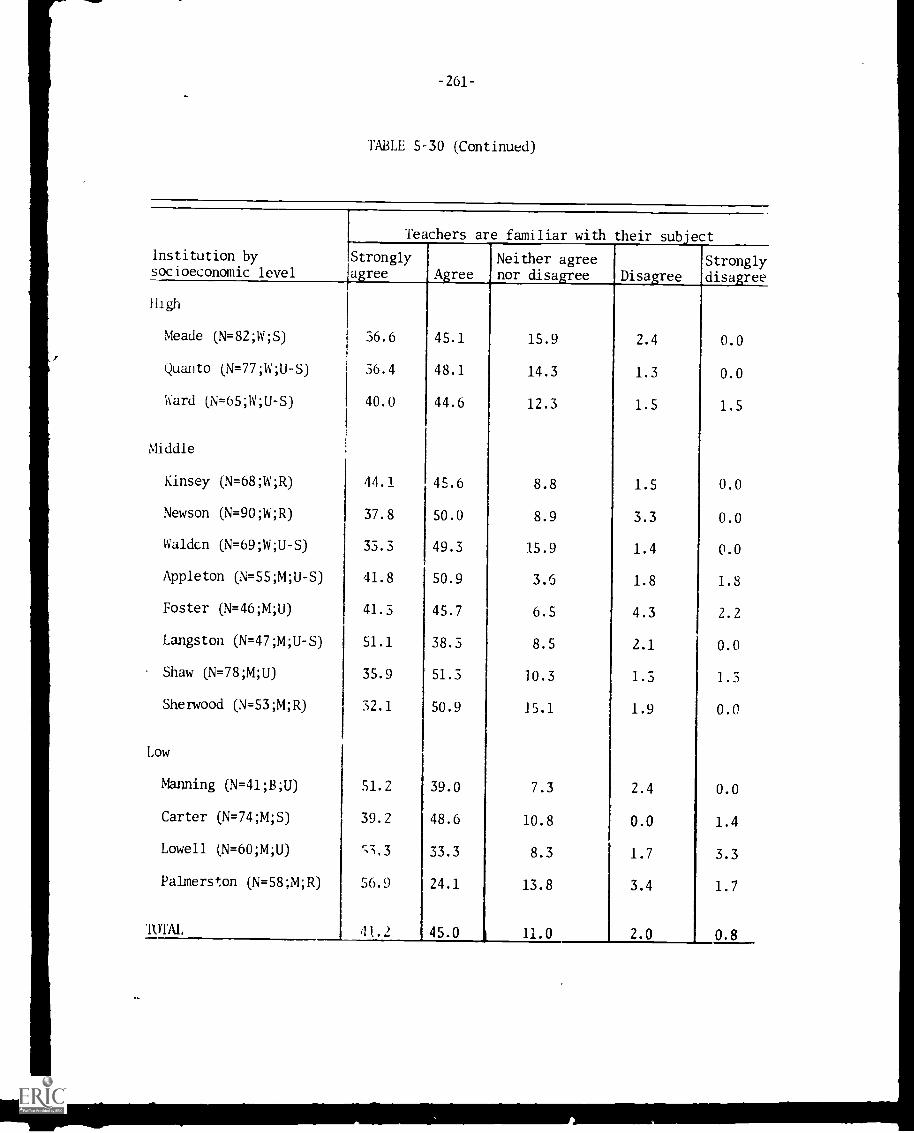
-261-
TABLE 5-30 (Continued)
Institution bysocioeconomic level
Tea chers are familiar with their subjec
Disagree
t
Stronglydisagree
Stronglyagree Agree
Neither agreenor disagree
High
Meade (N=82;W;S) 36.6 45.1 15.9 2.4 0.0
Quarto (N=77;W;U-S) 36.4 48.1 14.3 1.3 0.0
Ward (N=65;W;U-S) 40.0 44.6 12.3 1.5 1.5
Middle
Kinsey (N=68;W;R) 44.1 45.6 8.8 1.5 0.0
Newson (N=90;W;R) 37.8 50.0 8.9 3.3 0.0
Walden (N=69;W;U-S) 33.3 49.3 15.9 1.4 0.0
Appleton (N=55;M;U-S) 41.8 50.9 3.6 1.8 1.8
Foster (N=46;M;U) 41.3 45.7 6.5 4.3 2.2
Langston (N=47;M;U-S) 51.1 38.3 8.5 2.1 0.0
Shaw (N=78;M;U) 35.9 51.3 10.3 1.3 1.3
Sherwood (N=53;M;R) 32.1 50.9 15.1 1.9 0.0
Low
Manning (N=41;8;U) 51.2 39.0 7.3 2.4 0.0
Carter (N=74;M;S) 39.2 48.6 10.8 0.0 1.4
Lowell (N=60;M;U) '-;";.3 33.3 8.3 1.7 3.3
Palmerston (N=58;M;R) 56.9 24.1 13.8 3.4 1.7
41.2 45.0 11.0 2.0 0.8
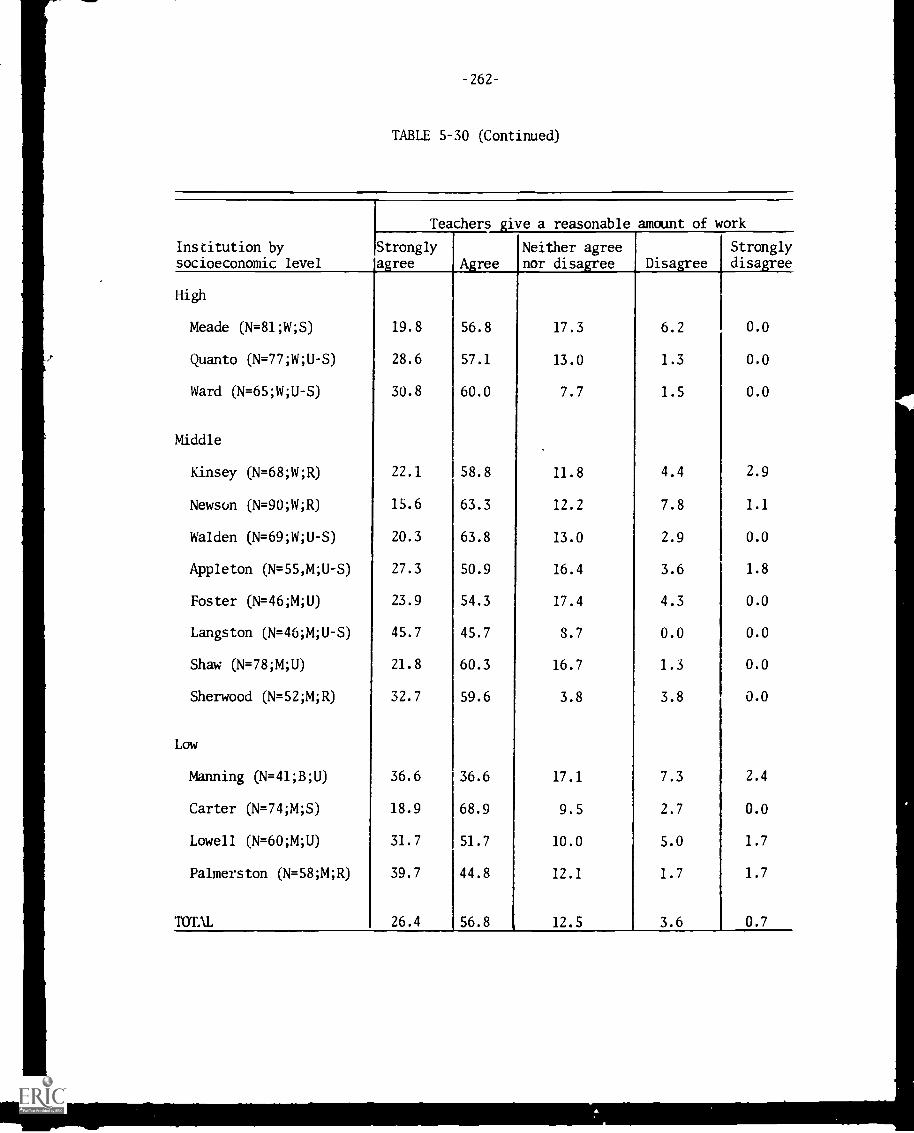
-262-
TABLE 5-30 (Continued)
Institution bysocioeconomic level
Teachers give a reasonable amount of work
Stronglyagree Agree
Neither agree Strongly
nor disagree Disagree disagree
High
Meade (N=81;W;S)
Quanto (N=77;W;U-S)
Ward (N=65;W;U-S)
Middle
Kinsey (N=68;W;R)
Newson (N=90;W;R)
Walden (N=69;W;U-S)
Appleton (N=55,M;U-S)
Foster (N=46;M;U)
Langston (N= 46;M;U -S)
Shaw (N=78;M;U)
Sherwood (N=52;M;R)
Low
Manning (N=41;B;U)
Carter (N=74;M;S)
Lowell (N=60;M;U)
Palmerston (N=58;M;R)
TOT.1L
19.8 56.8 17.3 6.2 0.0
28.6 57.1 13.0 1.3 0.0
30.8 60.0 7.7 1.5 0.0
22.1 58.8 11.8 4.4 2.9
15.6 63.3 12.2 7.8 1.1
20.3 63.8 13.0 2.9 0.0
27.3 50.9 16.4 3.6 1.8
23.9 54.3 17.4 4.3 0.0
45.7 45.7 8.7 0.0 0.0
21.8 60.3 16.7 1.3 0.0
32.7 59.6 3.8 3.8 0.0
36.6 36.6 17.1 7.3 2.4
18.9 68.9 9.5 2.7 0.0
31.7 51.7 10.0 5.0 1.7
39.7 44.8 12.1 1.7 1.7
26.4 56.8 12.5 3.6 0.7
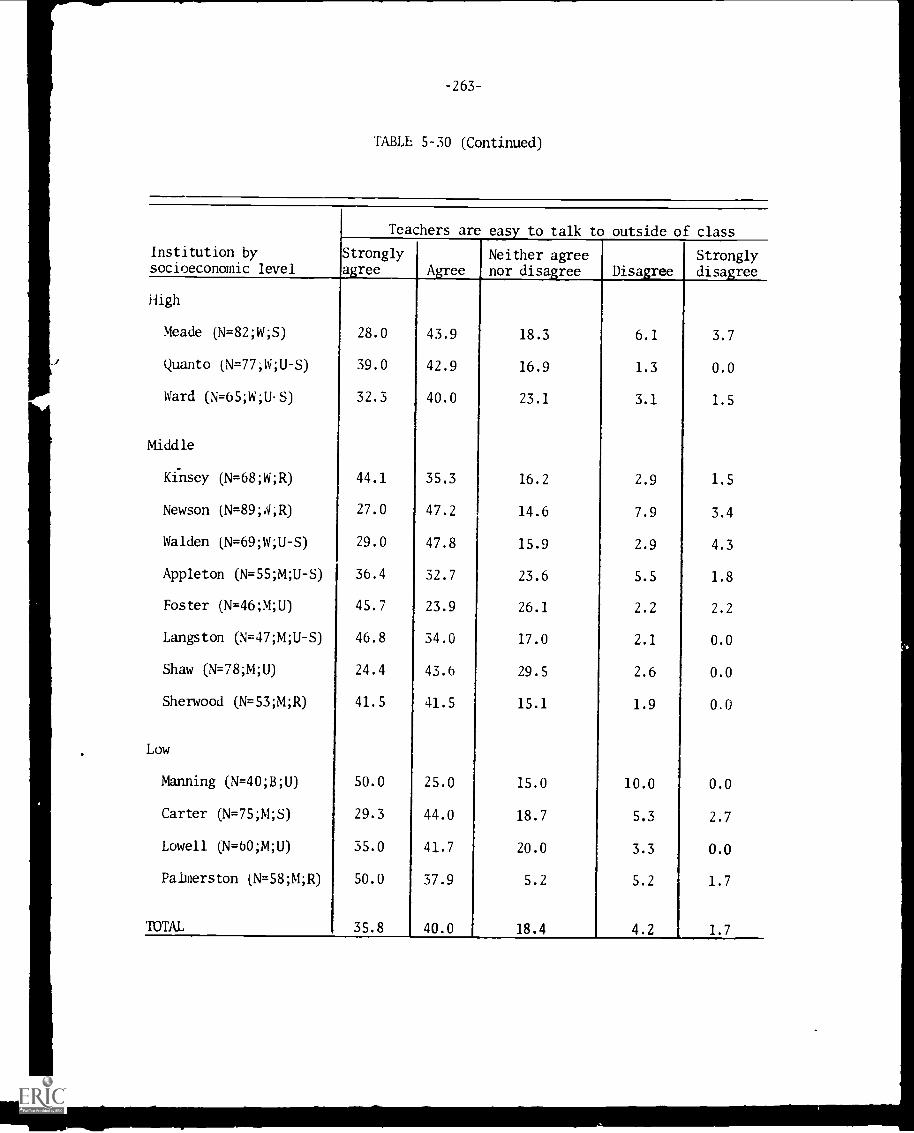
-263-
TABLE 5-30 (Continued)
Teachers are easy to talk to outside of class
Institution bysocioeconomic level
Stronglyagree Agree
Neither agreenor disagree Disagree
Stronglydisagree
High
Meade (N=82;W;S) 28.0 43.9 18.3 6.1 3.7
Quanto (N=77;W;U-S) 39.0 42.9 16.9 1.3 0.0
Ward (N=b5;W;US) 32.3 40.0 23.1 3.1 1.5
Middle
Kinsey (N=68;W;R) 44.1 35.3 16.2 2.9 1.5
Newson (N=89;4;R) 27.0 47.2 14.6 7.9 3.4
Walden (N=69;W;U-S) 29.0 47.8 15.9 2.9 4.3
Appleton (N=55;M;U-S) 36.4 32.7 23.6 5.5 1.8
Foster (N=46;M;U) 45.7 23.9 26.1 2.2 2.2
Langston (N=47;M;U-S) 46.8 34.0 17.0 2.1 0.0
Shaw (N=78;M;U) 24.4 43.6 29.5 2.6 0.0
Sherwood (N=53;M;R) 41.5 41.5 15.1 1.9 0.0
Low
Manning (N=40;B;U) 50.0 25.0 15.0 10.0 0.0
Carter (N=75;M;S) 29.3 44.0 18.7 5.3 2.7
Lowell (1060;M;U) 35.0 41.7 20.0 3.3 0.0
Palmerston (N=58;M;R) 50.0 37.9 5.2 5.2 1.7
'DOTAL 35.8 40.0 18.4 4.2 1.7
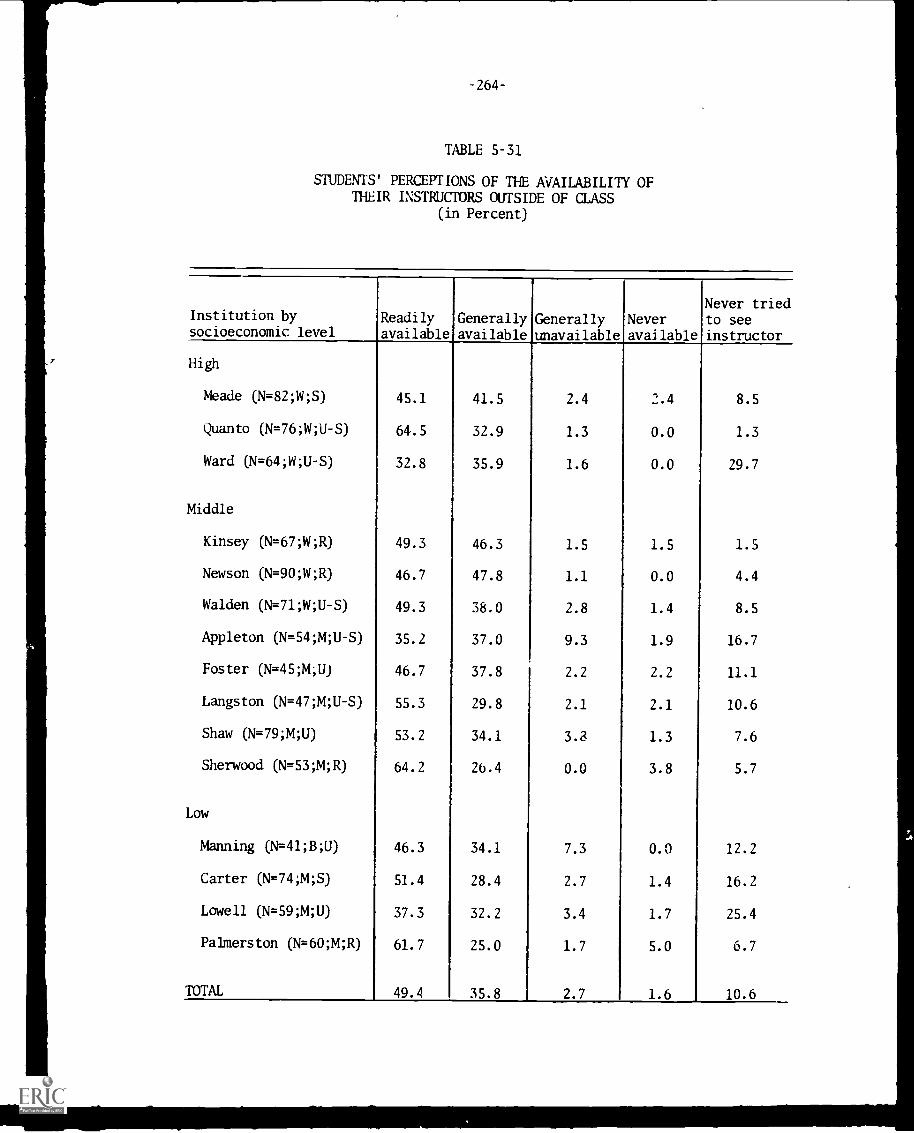
TABLE 5-31
STUDENTS' PERCEPTIONS OF THE AVAILABILITY OFTHEIR INSTRUCTORS OUTSIDE OF CLASS
(in Percent)
Institution bysocioeconomic level
Readilyavailable
Generallyavailable
Generallyunavailable
Neveravailable
Never triedto see
instructor
High
Meade (N=82;W;S) 45.1 41.5 2.4 2.4 8.5
Quanto (N=76;W;U-S) 64.5 32.9 1.3 0.0 1.3
Ward (N=64;W;U-S) 32.8 35.9 1.6 0.0 29.7
Middle
Kinsey (N=67;W;R) 49.3 46.3 1.5 1.5 1.5
Newson (N=90;W;R) 46.7 47.8 1.1 0.0 4.4
Walden (N=71;W;U-S) 49.3 38.0 2.8 1.4 8.5
Appleton (N=54;M;U-S) 35.2 37.0 9.3 1.9 16.7
Foster (N=45;M;U) 46.7 37.8 2.2 2.2 11.1
Langston (N= 47;M;U -S) 55.3 29.8 2.1 2.1 10.6
Shaw (4=79AU) 53.2 34.1 3.3 1.3 7.6
Sherwood (N=53;M;R) 64.2 26.4 0.0 3.8 5.7
Low
Manning (N=41;B;U) 46.3 34.1 7.3 0.0 12.2
Carter (N=74;M;S) 51.4 28.4 2.7 1.4 16.2
Lowell (N=59;M;U) 37.3 32.2 3.4 1.7 25.4
Palmerston (N=60;M;R) 61.7 25.0 1.7 5.0 6.7
TOTAL 49.4 35.8 2.7 1.6 10.6
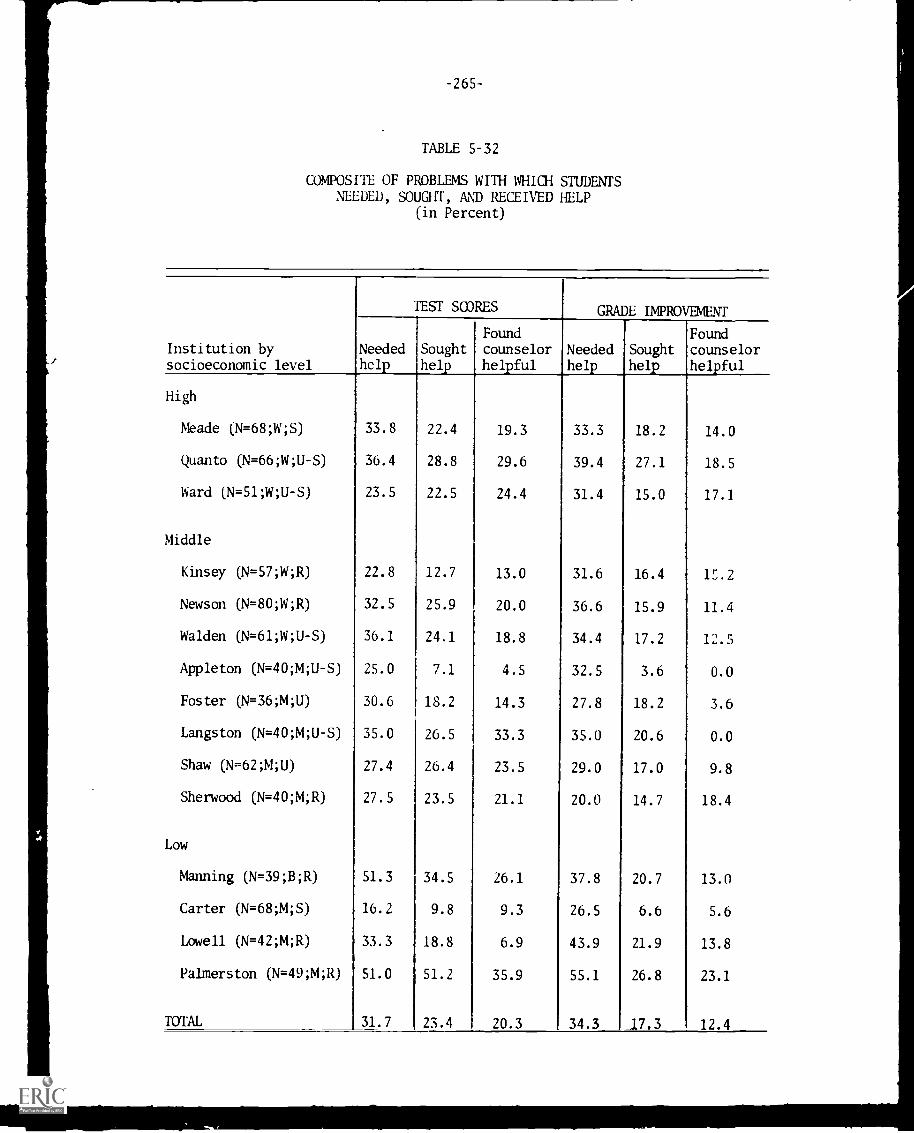
-265-
TABLE 5-32
COMPOSITE OF PROBLEMS WITH WHICH STUDENTSNEEDED, soma, AND RECEIVED HELP
(in Percent)
Institution bysocioeconomic level
TEST SCORES GRADE IMPROVEMENT
Neededhelp
Soughthelp
Foundcounselorhelpful
Neededhelp
Soughthelp
Foundcounselorhelpful
High
Meade (N=68;W;S) 33.8 22.4 19.3 33.3 18.2 14.0
Quanto (N=66;W;U-S) 36.4 28.8 29.6 39.4 27.1 18.5
Ward (N=51;W;U-S) 23.5 22.5 24.4 31.4 15.0 17.1
Middle
Kinsey (N= 57;W;R) 22.8 12.7 13.0 31.6 16.4 1S.2
Newson (N=80;W;R) 32.5 25.9 20.0 36.6 15.9 11.4
Walden (N=61;W;U-S) 36.1 24.1 18.8 34.4 17.2 12.5
Appleton (N=40;M;U-S) 25.0 7.1 4.5 32.5 3.6 0.0
Foster (N=36;M;U) 30.6 18.2 14.3 27.8 18.2 3.6
Langston (N= 40;M;U -S) 35.0 26.5 33.3 35.0 20.6 0.0
Shaw (N=62;M;U) 27.4 26.4 23.5 29.0 17.0 9.8
Sherwood (N=40;M;R) 27.5 23.5 21.1 20.0 14.7 18.4
Low
Manning (N=39;B;R) 51.3 34.5 26.1 37.8 20.7 13.0
Carter (N=68;M;S) 16.2 9.8 9.3 26.5 6.6 5.6
Lowell (N=42;M;R) 33.3 18.8 6.9 43.9 21.9 13.8
Palmerston (N=49;M;R) 51.0 51.2 35.9 55.1 26.8 23.1
TOTAL 31.7 23.4 20.3 34.3 17.3 12.4
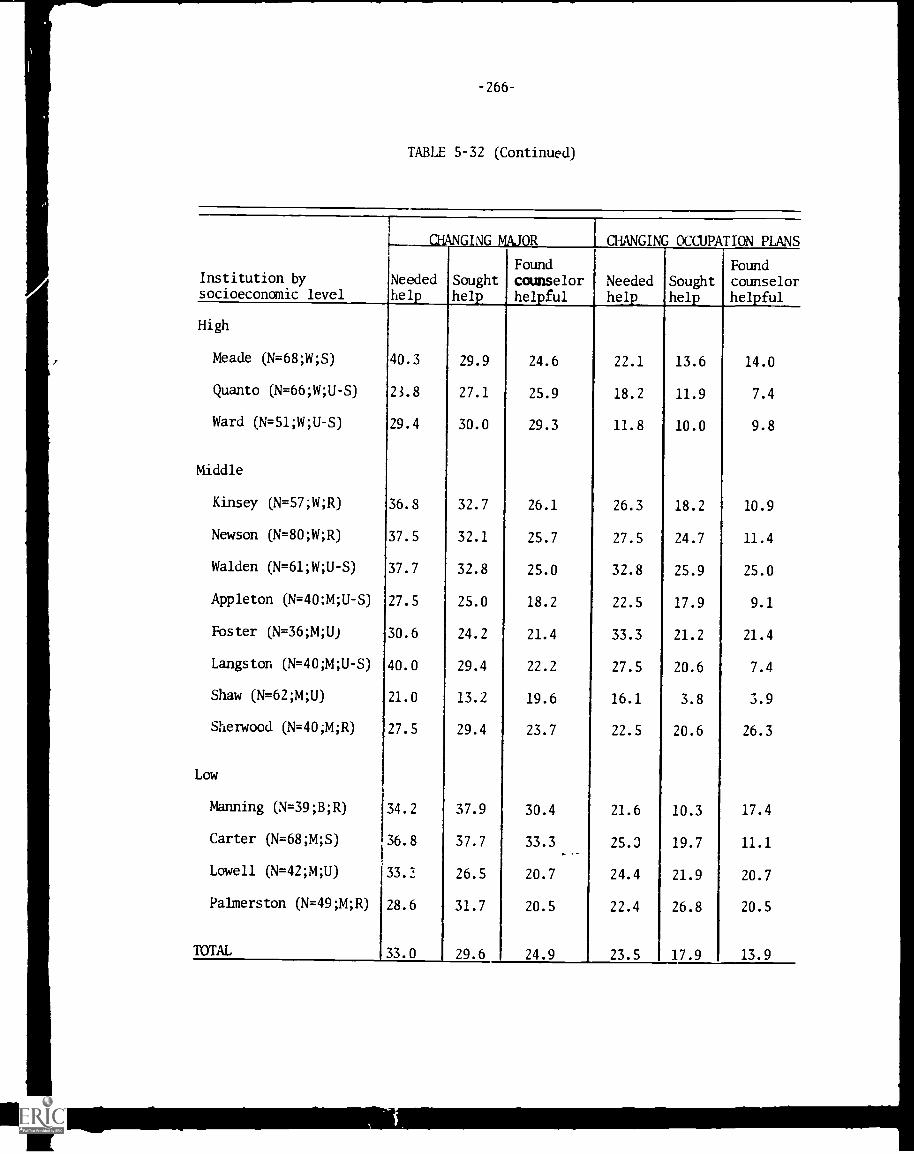
-266-
TABLE 5-32 (Continued)
Institution bysocioeconomic level
CHANGING MAJOR CHANGING OCCUPATION PLANS
Neededhelp
Soughthelp
Found
counselorhelpful
Neededhelp
Soughthelp
Foundcounselorhelpful
High
Meade (N=68;W;S) 40.3 29.9 24.6 22.1 13.6 14.0
Quanto (N=66;W;U-S) 23.8 27.1 25.9 18.2 11.9 7.4
Ward (N=51;W;U-S) 29.4 30.0 29.3 11.8 10.0 9.8
Middle
Kinsey (N=57;W;R) 36.8 32.7 26.1 26.3 18.2 10.9
Newson (N=80;W;R) 37.5 32.1 25.7 27.5 24.7 11.4
Walden (N=61;W;U-S) 37.7 32.8 25.0 32.8 25.9 25.0
Appleton (N=40;M;U-S) 27.5 25.0 18.2 22.5 17.9 9.1
Foster (N=36;M;U) 30.6 24.2 21.4 33.3 21.2 21.4
Langston (N= 40 ;M;U -S) 40.0 29.4 22.2 27.5 20.6 7.4
Shaw (N=62;M;U) 21.0 13.2 19.6 16.1 3.8 3.9
Sherwood (N=40;M;R) 27.5 29.4 23.7 22.5 20.6 26.3
Low
Manning (N=39;B;R) 34.2 37.9 30.4 21.6 10.3 17.4
Carter (N=68;M;S) 36.8 37.7 33.3 25.0 19.7 11.1
Lowell (N=42;M;U) 33.3 26.5 20.7 24.4 21.9 20.7
Palmerston (N=49;M;R) 28.6 31.7 20.5 22.4 26.8 20.5
TOTAL 33.0 29.6 24.9 23.5 17.9 13.9
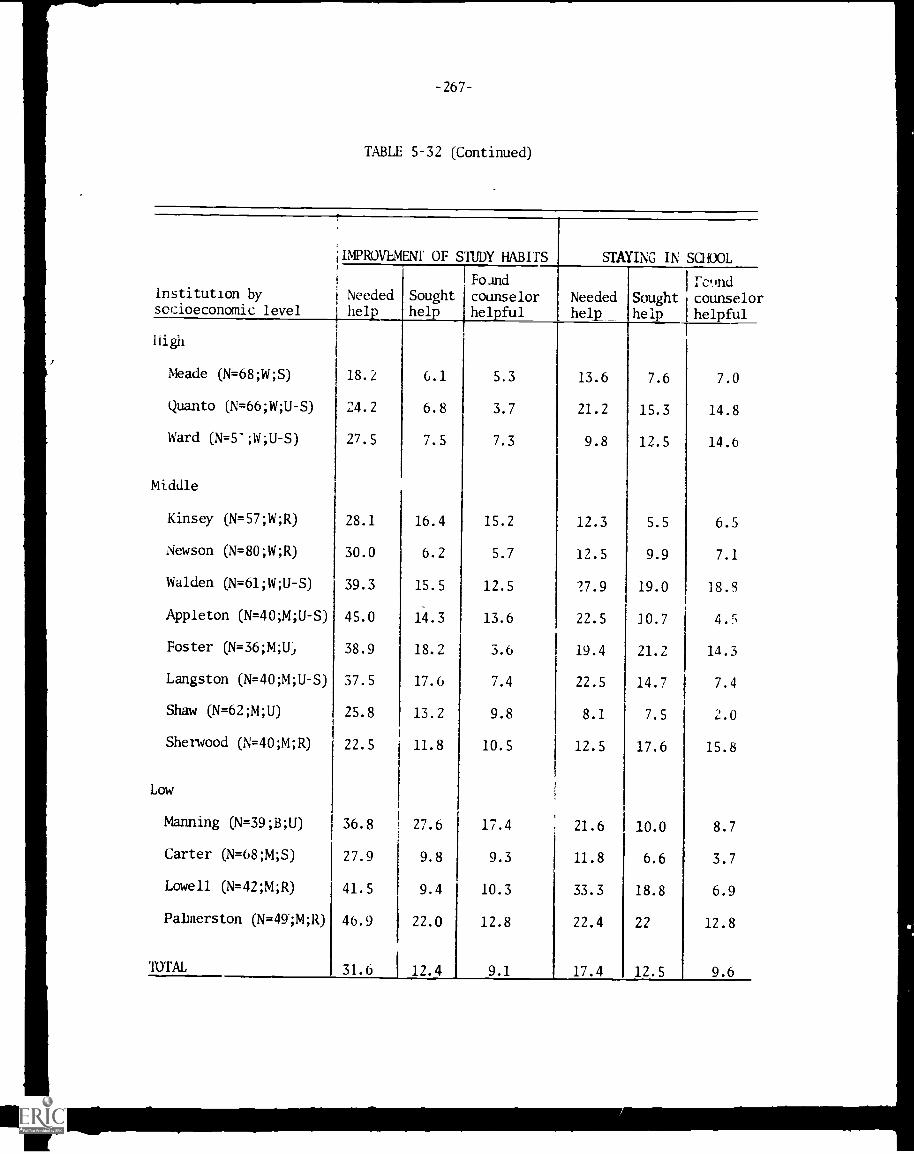
-267-
TABLE 5-32 (Continued)
IIMPROVEMENT OF STUDY HABITS STAYING IN SCHOOL
Institution by Needed Soughtsocioeconomic level help help
High
Meade (N= 68;W;S) 18.2 G.1
Quanto (N=66;W;U-S) 24.2 6.8
Ward (N=5';W;U-S) 27.5 7.5
Middle
Kinsey (N=57;W;R) 28.1 16.4
Newson (N=80;W;R) 30.0 6.2
Walden (N=61;W;U-S) 39.3 15.5
Appleton (N=40;M;U-S) 45.0 14.3
Foster (N=36;M;U, 38.9 18.2
Langston (N=40;M;U-S) 37.5 17.6
Shaw (N=62;M;U) 25.8 13.2
Sherwood (N=40;M;R) 22.5 11.8
Low
Manning (N=39;B;U) 36.8 27.6
Carter (N=68;M;S) 27.9 9.8
Lowell (N=42;M;R) 41.5 9.4
Palmerston (N=49-;M;R) 46.9 22.0
TOTAL 31.6 12.4
Foundcounselorhelpful
5.3
3.7
7.3
15.2
5.7
12.5
13.6
3.6
7.4
9.8
10.5
17.4
9.3
10.3
12.8
9.1
Neededhelp
Soughthelp
13.6 7.6
21.2 15.3
9.8 12.5
12.3 5.5
'2.5 9.9
27.9 19.0
22.5 30.7
19.4 21.2
22.5 14.7
8.1 7.5
12.5 17.6
21.6 10.0
11.8 6.6
33.3 18.8
22.4 22
17.4 12.5
Iromdcounselorhel ful
7.0
14.8
14.6
6.5
7.1
18.5
4.'",
14.3
7.4
2.0
15.8
8.7
3.7
6.9
12.8
9.6
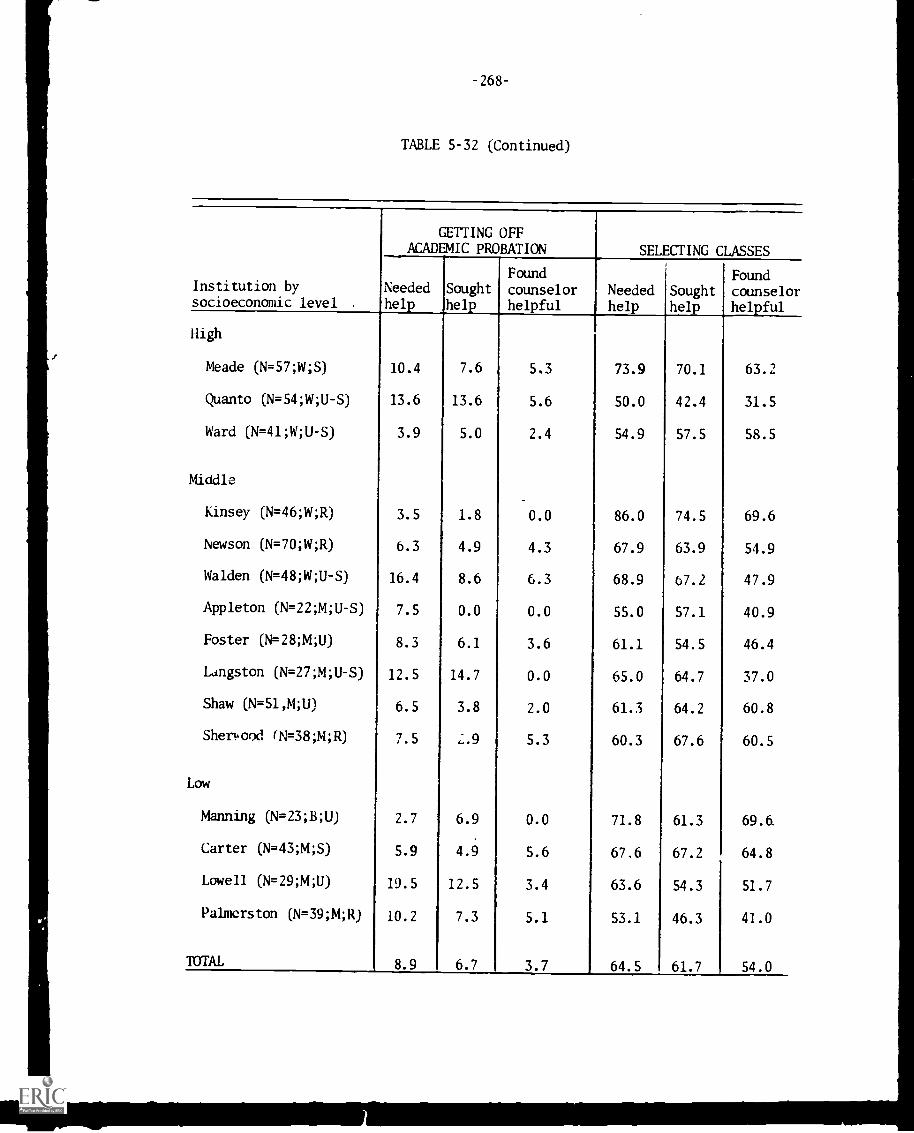
-268-
TABLE 5-32 (Continued)
Institution bysocioeconomic level .
GETTING OFFACADEMIC PROBATION SELECTING CLASSES
Neededhelp
Soughthelp
Found
counselorhelpful
Neededhelp
Soughthelp
Foundcounselorhelpful
High
Meade (N=57;W;S) 10.4 7.6 5.3 73.9 70.1 63.2
Quanto (N= 54;W;U -S) 13.6 13.6 5.6 50.0 42.4 31.5
Ward (N=41;W;U-S) 3.9 5.0 2.4 54.9 57.5 58.5
Middle
Kinsey (N=46;W;R) 3.5 1.8 0.0 86.0 74.5 69.6
Newson (N= 70;W;R) 6.3 4.9 4.3 67.9 63.9 54.9
Walden (N=48;W;U-S) 16.4 8.6 6.3 68.9 67.2 47.9
Appleton (N=22;M;U-S) 7.5 0.0 0.0 55.0 57.1 40.9
Foster (N=28;M;U) 8.3 6.1 3.6 61.1 54.5 46.4
Langston (N=27;M;U-S) 12.5 14.7 0.0 65.0 64.7 37.0
Shaw (N=51,M;U) 6.5 3.8 2.0 61.3 64.2 60.8
Shenood (N=38;M;R) 7.5 '-.9 5.3 60.3 67.6 60.5
Low
Manning (N=23;B;U) 2.7 6.9 0.0 71.8 61.3 69.6.
Carter (N= 43;M;S) 5.9 4.9 5.6 67.6 67.2 64.8
Lowell (N=29;M;U) 19.5 12.5 3.4 63.6 54.3 51.7
Palmerston (N=39;M;R) 10.2 7.3 5.1 53.1 46.3 41.0
TOTAL 8.9 6.7 3.7 64.5 61.7 54.0
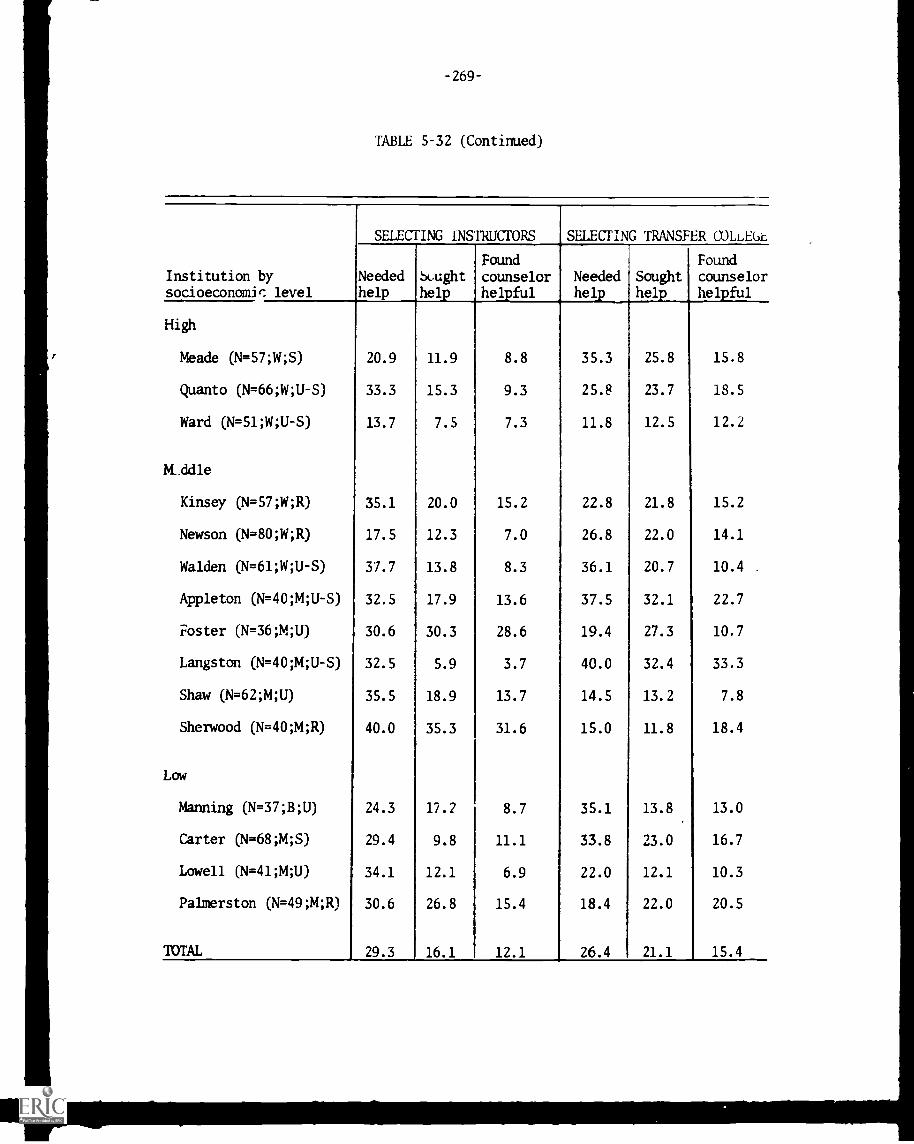
-269-
TABLE 5-32 (Continued)
Institution bysocioeconomic level
SELECTING INSTRUCTORS SELECTING TRANSFER OOLLEGL
Neededhelp
Sought
help
Foundcounselorhelpful
Neededhelp
Soughthelp
Foundcounselorhelpful
High
Meade (N=57;W;S) 20.9 11.9 8.8 35.3 25.8 15.8
Quanto (N=66;W;U-S) 33.3 15.3 9.3 25.8 23.7 18.5
Ward (N=51;W;U-S) 13.7 7.5 7.3 11.8 12.5 12.2
Mddle
Kinsey (N=57;W;R) 35.1 20.0 15.2 22.8 21.8 15.2
Newson (N=80;W;R) 17.5 12.3 7.0 26.8 22.0 14.1
Walden (N=61;W;U-S) 37.7 13.8 8.3 36.1 20.7 10.4
Appleton (N=40;M;U-S) 32.5 17.9 13.6 37.5 32.1 22.7
poster (N=36;M;U) 30.6 30.3 28.6 19.4 27.3 10.7
Langston (N=40;M;U-S) 32.5 5.9 3.7 40.0 32.4 33.3
Shaw (N=62;M;U) 35.5 18.9 13.7 14.5 13.2 7.8
Sherwood (N =40;M;R) 40.0 35.3 31.6 15.0 11.8 18.4
Low
Manning (N=37;B;U) 24.3 17.2 8.7 35.1 13.8 13.0
Carter (N=68;M;S) 29.4 9.8 11.1 33.8 23.0 16.7
Lowell (N=41;M;U) 34.1 12.1 6.9 22.0 12.1 10.3
Palmerston (N=49;M;R) 30.6 26.8 15.4 18.4 22.0 20.5
TOTAL 29.3 16.1 12.1 26.4 21.1 15.4
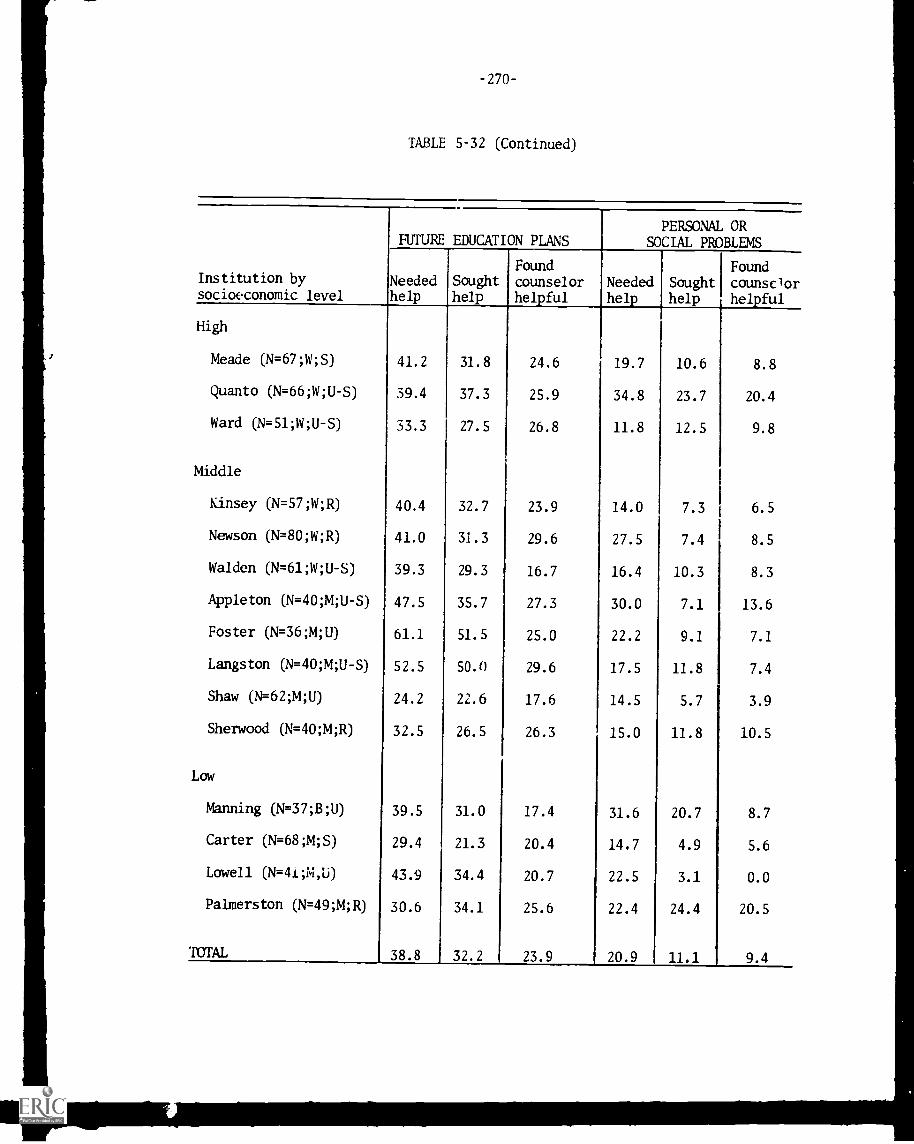
-270-
TABLE 5-32 (Continued)
Institution bysocioeconomic level
FUTURE EDUCATION PLANSPERSONAL OR
SOCIAL PROBLEMS
Neededhelp
Soughthelp
Foundcounselorhelpful
Neededhelp
Soughthelp
Foundcounselorhelpful
High
Meade (N=67;W;S) 41.2 31.8 24.6 19.7 10.6 8.8
Quanto (N=66;W;U-S) 39.4 37.3 25.9 34.8 23.7 20.4
Ward (N=51;W;U-S) 33.3 27.5 26.8 11.8 12.5 9.8
Middle
Kinsey (N=57;W;R) 40.4 32.7 23.9 14.0 7.3 6.5
Newson (N= 80;W;R) 41.0 31.3 29.6 27.5 7.4 8.5
Walden (N=61;W;U-S) 39.3 29.3 16.7 16.4 10.3 8.3
Appleton (N=40;M;U-S) 47.5 35.7 27.3 30.0 7.1 13.6
Foster (N=36;M;U) 61.1 51.5 25.0 22.2 9.1 7.1
Langston (N= 40;M;U -S) 52.5 50.0 29.6 17.5 11.8 7.4
Shaw (N= 62;M;U) 24.2 22.6 17.6 14.5 5.7 3.9
Sherwood (N=40;M;R) 32.5 26.5 26.3 15.0 11.8 10.5
Low
Manning (N= 37;B;U) 39.5 31.0 17.4 31.6 20.7 8.7
Carter (N=68;M;S) 29.4 21.3 20.4 14.7 4.9 5.6
Lowell (N=4i;M,U) 43.9 34.4 20.7 22.5 3.1 0.0
Palmerston (N=49;M;R) 30.6 34.1 25.6 22.4 24.4 20.5
TOTAL 38.8 32.2 23.9 20.9 11.1 9.4
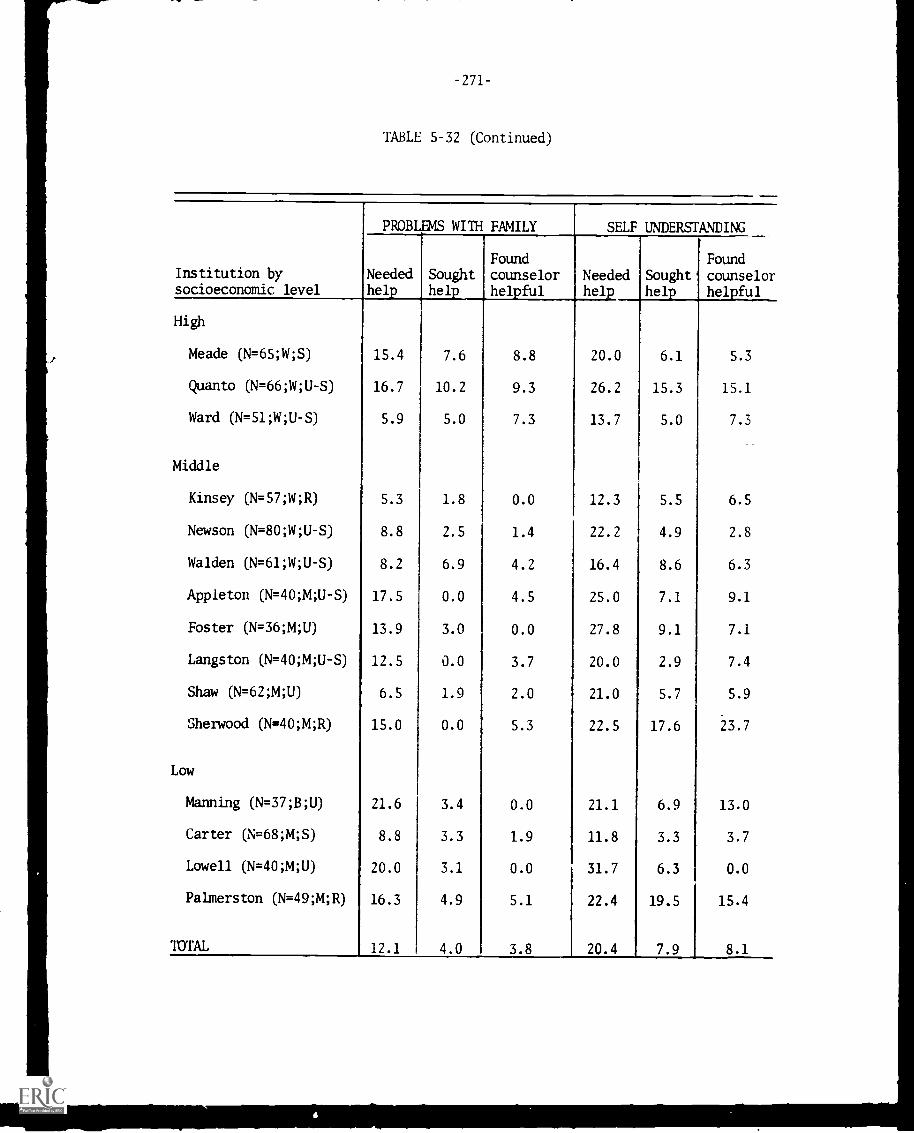
TABLE 5-32 (Continued)
Institution bysocioeconomic level
PROBLEMS WITH FAMILY SELF UNDERSTANDING
Neededhelp
Soughthelp
Foundcounselorhelpful
Neededhelp
Soughthelp
Foundcounselorhelpful
High
Meade (N=65;W;S) 15.4 7.6 8.8 20.0 6.1 5.3
Quanto (N=66;W;U-S) 16.7 10.2 9.3 26.2 15.3 15.1
Ward (N=51;W;U-S) 5.9 5.0 7.3 13.7 5.0 7.3
Middle
Kinsey (N=57;W;R) 5.3 1.8 0.0 12.3 5.5 6.5
Newson (N=80;W;U-S) 8.8 2.5 1.4 22.2 4.9 2.8
Walden (N=61;W;U-S) 8.2 6.9 4.2 16.4 8.6 6.3
Appleton (N= 40;M;U -S) 17.5 0.0 4.5 25.0 7.1 9.1
Foster (N=36;M;U) 13.9 3.0 0.0 27.8 9.1 7.1
Langston (N= 40;M;U -S) 12.5 0.0 3.7 20.0 2.9 7.4
Shaw (N=62;M;U) 6.5 1.9 2.0 21.0 5.7 5.9
Sherwood (N=40;M;R) 15.0 0.0 5.3 22.5 17.6 23.7
Low
Manning (N=37;B;U) 21.6 3.4 0.0 21.1 6.9 13.0
Carter (N=68;M;S) 8.8 3.3 1.9 11.8 3.3 3.7
Lowell (N=40;M;U) 20.0 3.1 0.0 31.7 6.3 0.0
Palmerston (N=49;M;R) 16.3 4.9 5.1 22.4 19.5 15.4
TOTAL 12.1 4.0 3.8 20.4 7.9 8.1
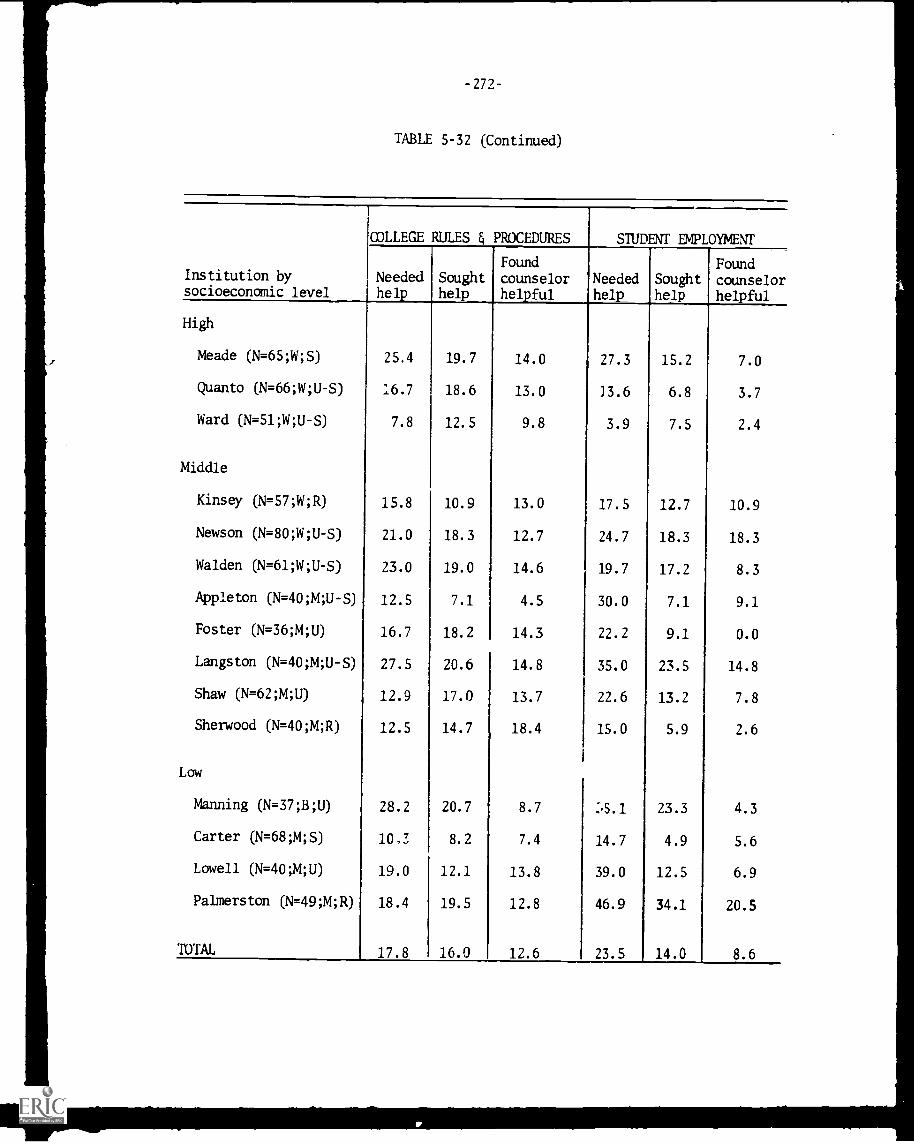
-272-
TABLE 5-32 (Continued)
Institution bysocioeconomic level
COLLEGE RULES & PROCEDURES STUDENT EMPLOYMENT
Neededhelp
Soughthelp
Found
counselorhelpful
Neededhelp
Soughthelp
Foundcounselorhelpful
High
Meade (N=65;W;S) 25.4 19.7 14.0 27.3 15.2 7.0
Quanto (N=66;W;U-S) 16.7 18.6 13.0 33.6 6.8 3.7
Ward (N=51;W;U-S) 7.8 12.5 9.8 3.9 7.5 2.4
Middle
Kinsey (N=57;W;R) 15.8 10.9 13.0 17.5 12.7 10.9
Newson (N=80;W;U-S) 21.0 18.3 12.7 24.7 18.3 18.3
Walden (N=61;W;U-S) 23.0 19.0 14.6 19.7 17.2 8.3
Appleton (N=40;M;U-S) 12.5 7.1 4.5 30.0 7.1 9.1
Foster (N=36;M;U) 16.7 18.2 14.3 22.2 9.1 0.0
Langston (N=40;M;U-S) 27.5 20.6 14.8 35.0 23.5 14.8
Shaw (N=62;M;U) 12.9 17.0 13.7 22.6 13.2 7.8
Sherwood (N=40;M;R) 12.5 14.7 18.4 15.0 5.9 2.6
Low
Manning (N=37;B;U) 28.2 20.7 8.7 23.3 4.3
Carter (N=68;M;S) 10,3 8.2 7.4 14.7 4.9 5.6
Lowell (N=40;M;U) 19.0 12.1 13.8 39.0 12.5 6.9
Palmerston (N=49;M;R) 18.4 19.5 12.8 46.9 34.1 20.5
17.8 16.0 12.6 23.5 14.0 8.6
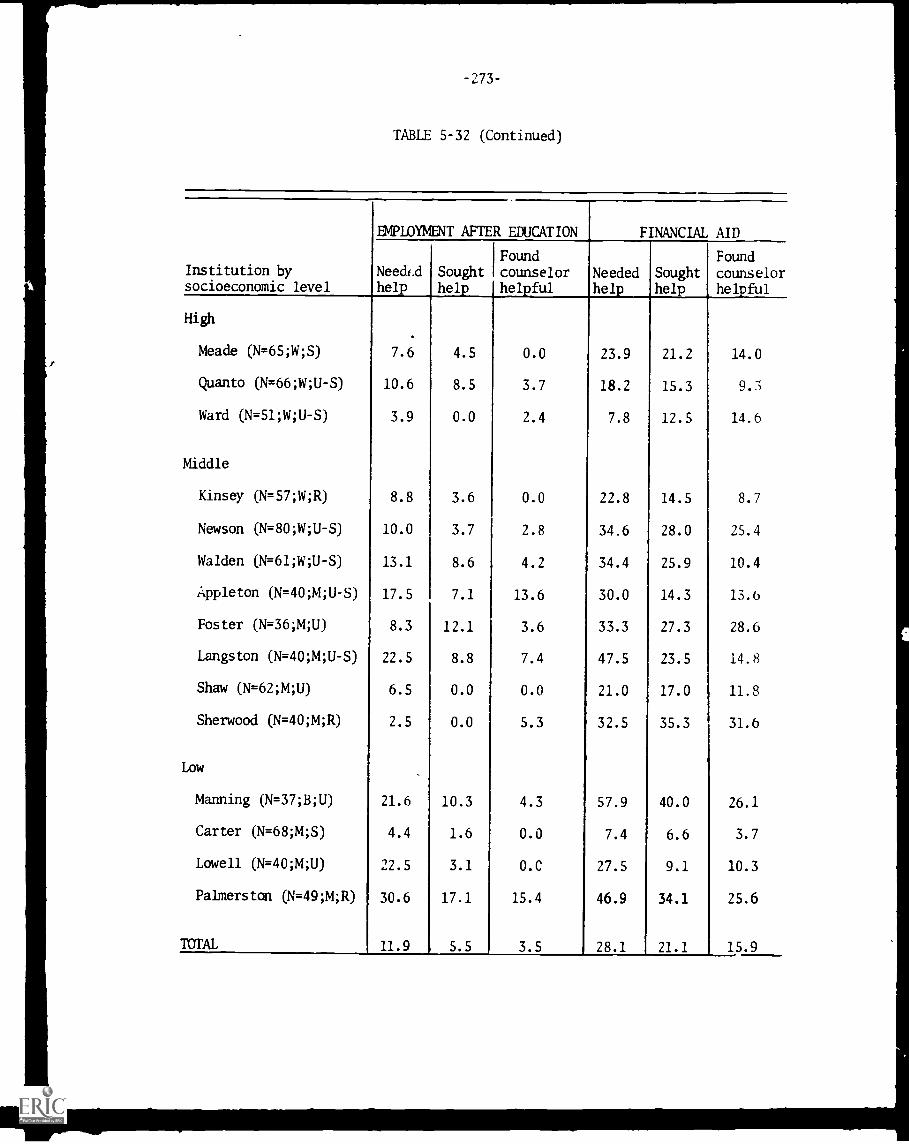
-273-
TABLE 5-32 (Continued)
Institution bysocioeconomic level
EMPLOYMENT AFTER EDUCATION FINANCIAL AID
Needcdhelp
Soughthelp
Foundcounselorhelpful
Neededhelp
Soughthelp
Foundcounselorhelpful
High
Meade (N=65;W;S) 7.6 4.5 0.0 23.9 21.2 14.0
Quanto (N=66;W;U-S) 10.6 8.5 3.7 18.2 15.3 9.3
Ward (N=51;W;U-S) 3.9 0.0 2.4 7.8 12.5 14.6
Middle
Kinsey (N= 57;W;R) 8.8 3.6 0.0 22.8 14.5 8.7
Newson (N=80;W;U-S) 10.0 3.7 2.8 34.6 28.0 25.4
Walden (N=61;W;U-S) 13.1 8.6 4.2 34.4 25.9 10.4
Appleton (N=40;M;U-S) 17.5 7.1 13.6 30.0 14.3 13.6
Foster (N=36;M;U) 8.3 12.1 3.6 33.3 27.3 28.6
Langston (N= 40;M;U -S) 22.5 8.8 7.4 47.5 23.5 14.8
Shaw (N=62;M;U) 6.5 0.0 0.0 21.0 17.0 11.8
Sherwood (N=40AR) 2.5 0.0 5.3 32.5 35.3 31.6
Low
Manning (N=37;B;U) 21.6 10.3 4.3 57.9 40.0 26.1
Carter (N= 68;M;S) 4.4 1.6 0.0 7.4 6.6 3.7
Lowell (N=40;M;U) 22.5 3.1 0.0 27.5 9.1 10.3
Palmerston (N=49;M;R) 30.6 17.1 15.4 46.9 34.1 25.6
TOTAL 11.9 5.5 3.5 28.1 21.1 15.9
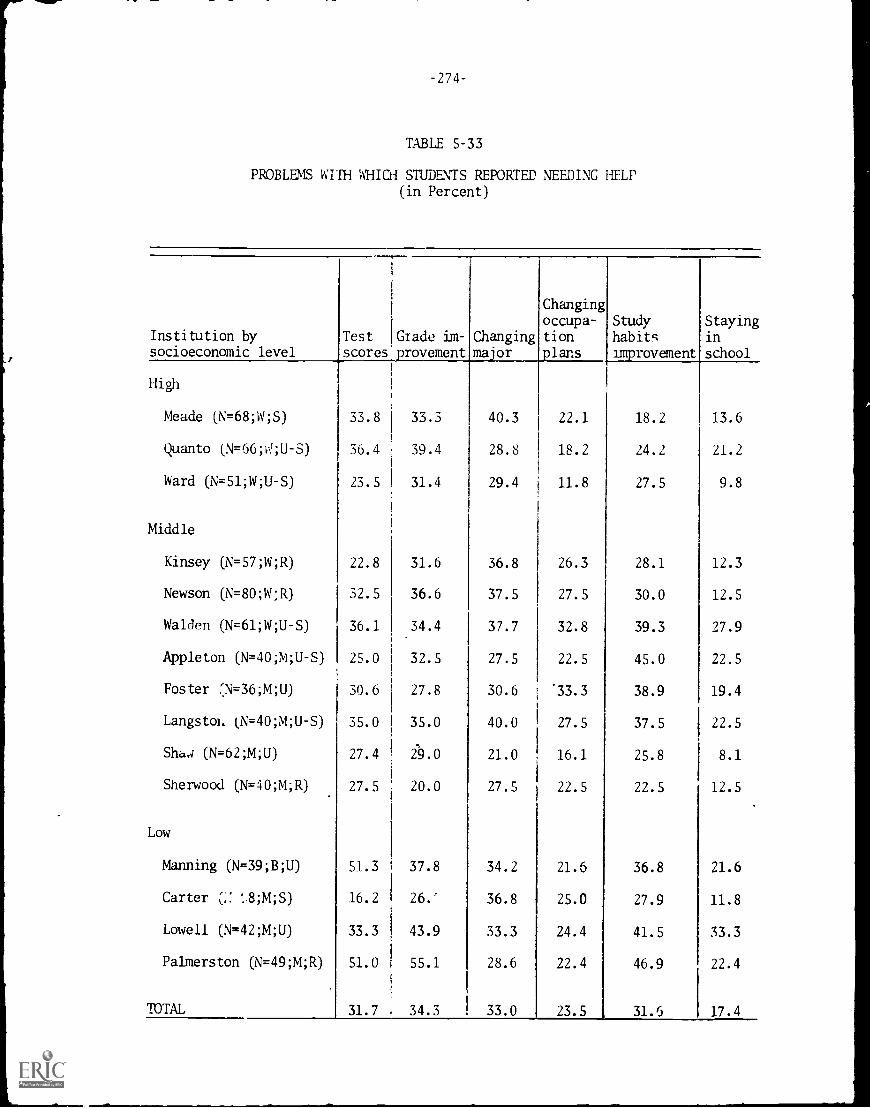
-274-
TABLE 5-33
PROBLEMS WITH WHICH STUDENTS REPORTED NEEDING HELP(in Percent)
Institution bysocioeconomic level
Testscores,yrovement
Glade im- Changingmajor
Changingoccupa-
tionplans
Studyhabitsimprovement
Stayinginschool
High
Meade (N=68;W;S) 33.8 33.3 40.3 22.1 18.2 13.6
Quanto (N=66-J;U-S) 36.4 I 39.4 28.8 18.2 24.2 21.2
Ward (N=51;W;U-S) 23.5 31.4 29.4 11.8 27.5 9.8
Middle
Kinsey (N=57;W;R) 22.8 31.6 36.8 26.3 28.1 12.3
Newson (N=80;W;R) 32.5 36.6 37.5 27.5 30.0 12.5
Walden (N=61;W;U-S) 36.1 34.4 37.7 32.8 39.3 27.9
Appleton (N=40;M;U-S) 25.0 32.5 27.5 22.5 45.0 22.5
Foster ;.N=36;M;U) 30.6 27.8 30.6 .33.3 38.9 19.4
Langston. (N=40;M;U-S) 35.0 35.0 40.0 27.5 37.5 22.5
Shad (N=62;M;U) 27.4 29.0 21.0 16.1 25.8 8.1
Sherwood (N=40;M;R) 27.5 20.0 27.5 22.5 22.5 12.5
Low
Manning (N=39;B;U) 51.3 37.8 34.2 21.5 36.8 21.6
Carter (:: 8;M;S) 16.2 26.E 36.8 25.0 27.9 11.8
Lowell (N=42;M;U) 33.3 43.9 33.3 24.4 41.5 33.3
Palmerston (N= 49;M;R) 51.0 55.1 28.6 22.4 46.9 22.4
TOTAL 31.7 34.3 33.0 23.5 31.6 17.4
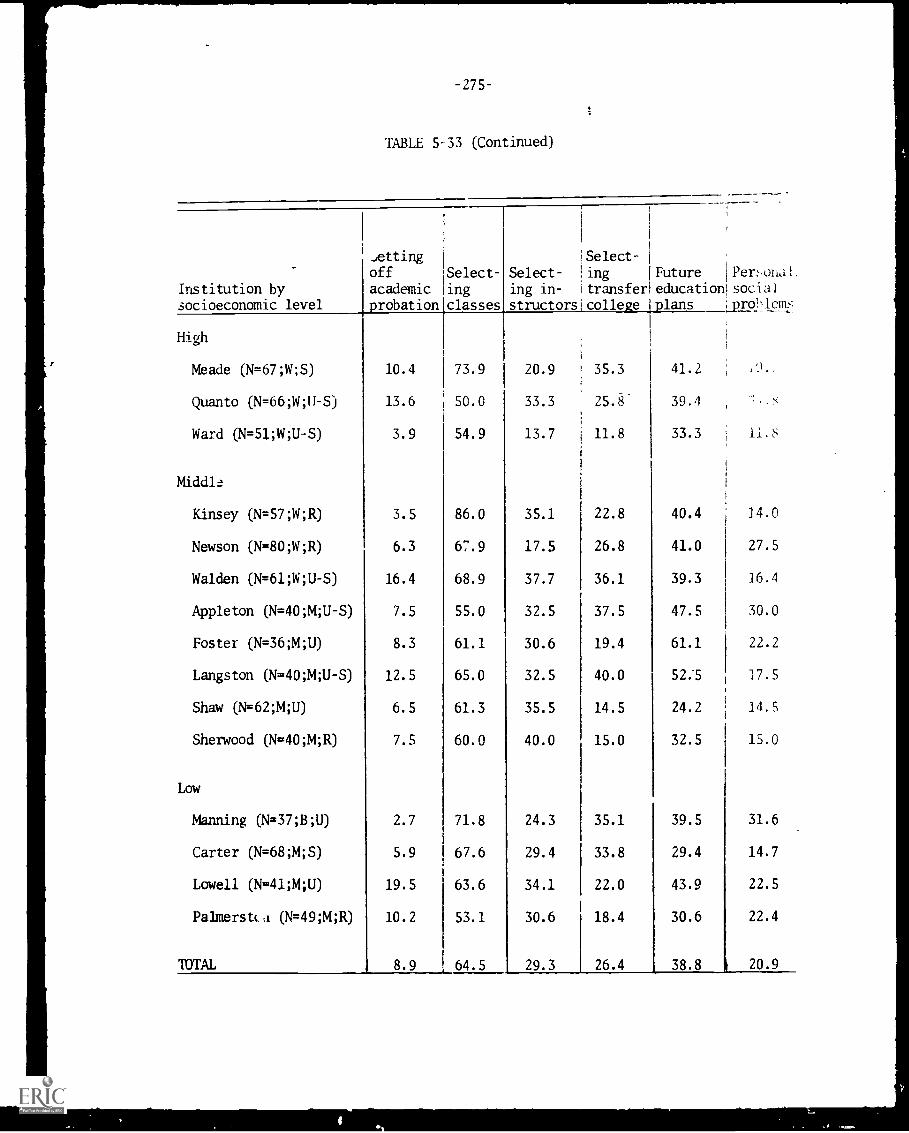
-275-
TABLE 5-33 (Continued)
Institution bysocioeconomic level
High
Meade (N=67;W;S)
Quanta (N=66;W;1I -S)
Ward (N=51;W;U-S)
Middle
Kinsey (N=57;W;R)
Newson (N=80;W;R)
Walden (N=61;W;U-S)
Appleton (N=40;M;U-S)
Foster (N=36;M;U)
Langston (N=40;M;U-S)
Shaw (N=62;M;U)
Sherwood (N=40;M;R)
Low
Manning (N=37;B;U)
Carter (N=68;M;S)
Lowell (N=.41AU)
PaImerstt4 (N =49;M;R)
TOTAL
1
Jetting iSelect-
off Select- Select- lingacademic ing ing in- !transfer
robation classes structorsicolle e
Future 1Pen,ona1,
educationisociallaps ;prol)len-;
10.4 73.9
13.6 50.0
3.9 54.9
3.5 86.0
6.3 67.9
16.4 68.9
7.5 55.0
8.3 61.1
12.5 65.0
6.5 61.3
7.5 60.0
2.7 71.8
5.9 67.6
19.5 63.6
10.2 53.1
8.9 64.5
20.9
33.3
13.7
' 35.3
25.8
11.8
41.2
39.4
33.3
35.1 22.8 40.4 14.0
17.5 26.8 41.0 27.5
37.7 36.1 39.3 16.4
32.5 37.5 47.5 30.0
30.6 19.4 61.1 22.2
32.5 40.0 52.5 17.5
35.5 14.5 24.2 14.5
40.0 15.0 32.5 15.0
24.3 35.1 39.5 31.6
29.4 33.8 29.4 14.7
34.1 22.0 43.9 22.5
30.6 18.4 30.6 22.4
29.3 26.4 38.8 1 20.9
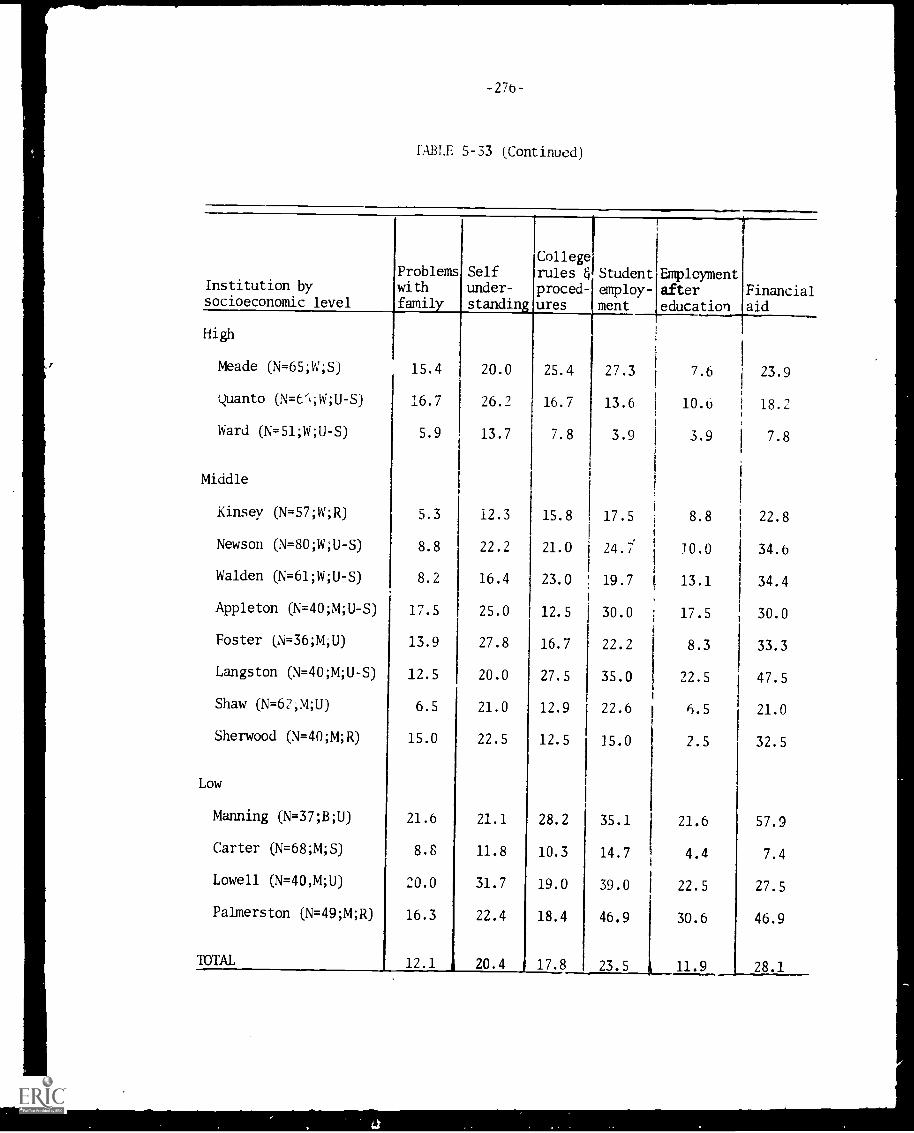
-276-
FABLE 5-33 (Continued)
Institution bysocioeconomic level
Problemswithfamily
Selfunder-standing
College
rules Eproced-ures
Studentemploy-ment
Employmentaftereducation
Financialaid
High
Meade (N=65;W;S) 15.4 20.0 25.4 27.3 7.6 23.9
Quanta (N=0,W;U-S) 16.7 26.2 16.7 13.6 10.6 18.2
Ward (N=51;W;U-S) 5.9 13.7 7.8 3.9 3.9 7.8
Middle
Kinsey (N=57;W;R) 5.3 12.3 15.8 E 17.5 8.8 22.8
Newson (N=80AU-S) 8.8 22.2 21.0 24.7 10.0 34.6
Walden (N=61;W;U-S) 8.2 16.4 23.0 19.7 13.1 34.4
Appleton (N=40;M;U-S) 17.5 25.0 12.5 30.0 17.5 30.0
Foster (N= 36;M;U) 13.9 27.8 16.7 22.2 8.3 33.3
Langston (N=40;M;U-S) 12.5 20.0 27.5 35.0 22.5 47.5
Shaw (N=62;M;U) 6.5 21.0 12.9 22.6 6.5 21.0
Sherwood (N=40;M;R) 15.0 22.5 12.5 15.0 2.5 32.5
Low
Manning (N=37;B;U) 21.6 21.1 28.2 35.1 21.6 57.9
Carter (N=68;M;S) 8.8 11.8 10.3 14.7 4.4 7.4
Lowell (N=40,M;U) 20.0 31.7 19.0 39.0 22.5 27.5
Palmerston (N=49;M;R) 16.3 22.4 18.4 46.9 30.6 46.9
TOTAL 12.1 20.4 17.8 23.5 11.9 28.1
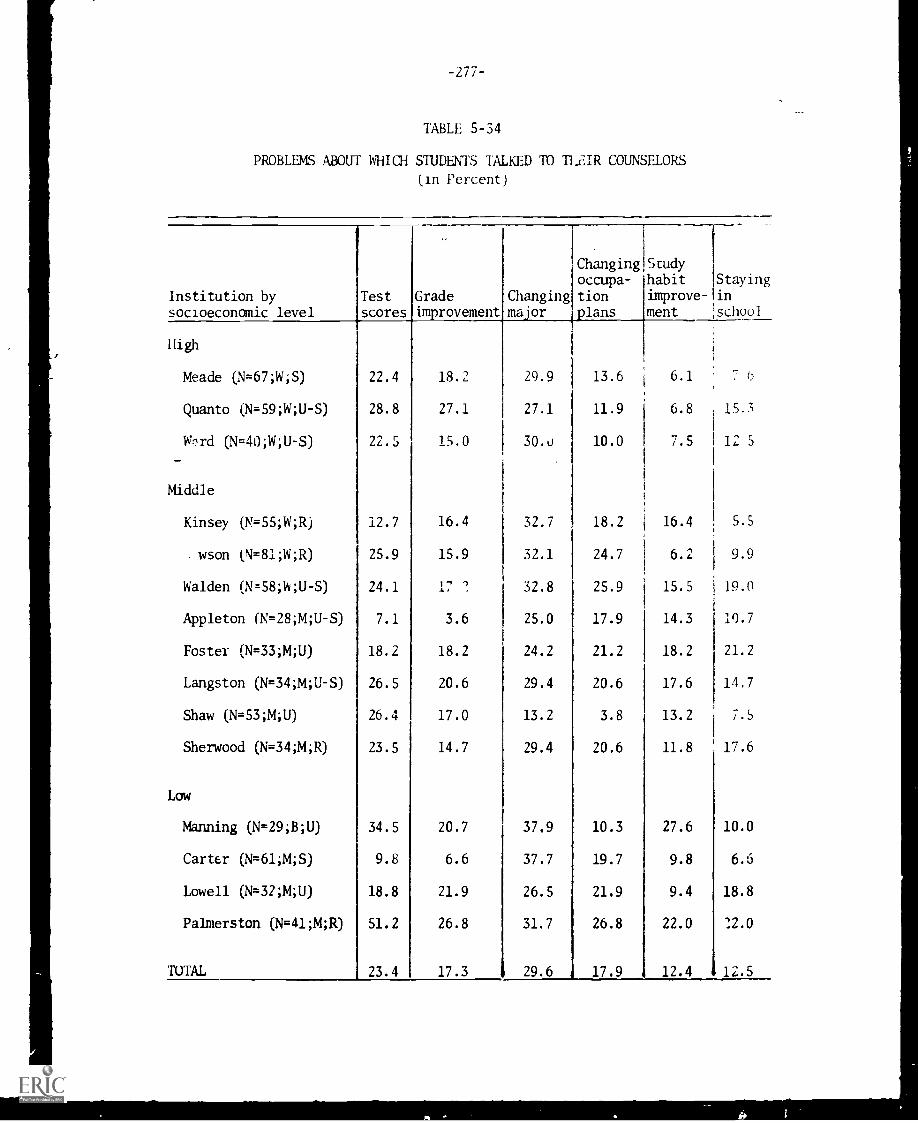
-277-
TABLE 5-34
PROBLEMS ABOUT WHICH STUDENTS TALKED TO 11JCIR COUNSELORS
in Percent)
Institution bysocioeconomic level
Testscores
Graderovement
Changingma'or
Changingoccupa-tionlans
Studyhabitimprove-
ment
Stayingin
school
High
Meade (N=67;W;S) 22.4 18.2 29.9 13.6 6.1 7 0
Quarto (N=59;W;U-S) 28.8 27.1 27.1 11.9 6.8 . 15.3
-
W1rd (N=40;W;U-S) 22.5 15.0 30.0 10.0 7.5 12 5
Middle
Kinsey (N=55;W;R) 12.7 16.4 32.7 18.2 16.4 5.5
. wson (N=81;W;R) 25.9 15.9 32.1 24.7 6.2 9.9
Walden (N=58;W;U-S) 24.1 17 7 32.8 25.9 15.5 19.0
Appleton (N=28;M;U-S) 7.1 3.6 25.0 17.9 14.3 10.7
Foster (N=33;M;U) 18.2 18.2 24.2 21.2 18.2 21.2
Langston (N=34;M;U-S) 26.5 20.6 29.4 20.6 17.6 14.7
Shaw (N=53;M;U) 26.4 17.0 13.2 3.8 13.2 7.5
Sherwood (N= 34;M;R) 23.5 14.7 29.4 20.6 11.8 17.6
Low
Manning (N=29;B;U) 34.5 20.7 37.9 10.3 27.6 10.0
Carter (N=61;M;S) 9.8 6.6 37.7 19.7 9.8 6.5
Lowell (N=32;M;U) 18.8 21.9 26.5 21.9 9.4 18.8
Palmerston (N =41;M;R) 51.2 26.8 31.7 26.8 22.0 12.0
TOTAL 23.4 17.3 29.6 17.9 12.4 12.5
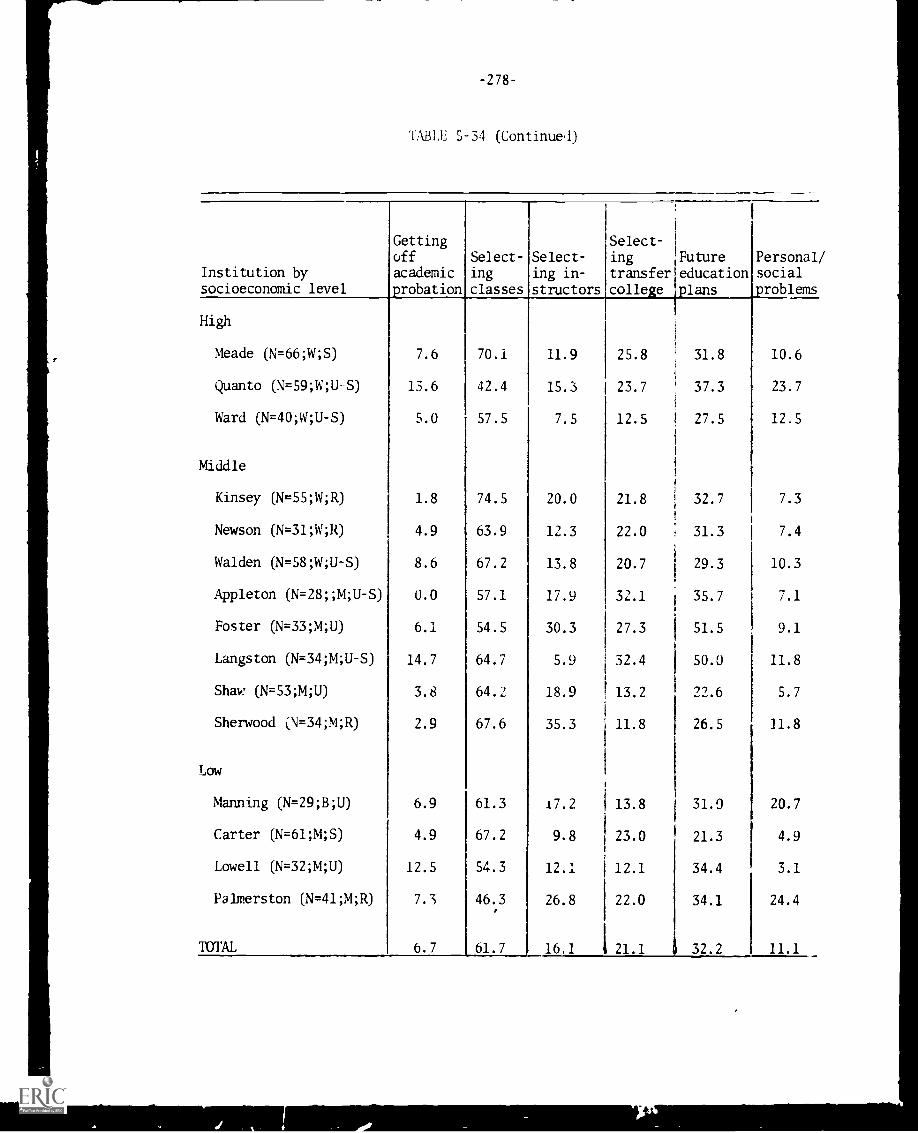
TABLE 5-34 (Continue4)
Institution bysocioeconomic level
Gettingoff
academicprobation
Select-
ing
classes
Select-ing in-
structors
Select-
ingtransfercollege
Futureeducationplans
Personal,
socialproblems
High
Meade (N=66;W;S) 7.6 70.1 11.9 25.8 31.8 10.6
Quanta (N=59;W;U-S) 13.6 42.4 15.3 23.7 37.3 23.7
Ward (N=40;W;U-S) 5.0 57.5 7.5 12.5 27.5 12.5
Middle
Kinsey (N=55;W;R) 1.8 74.5 20.0 21.8 32.7 7.3
Newson (N=31;W;R) 4.9 63.9 12.3 22.0 31.3 7.4
Walden (N= 58;W;U -S) 8.6 67.2 13.8 20.7 29.3 10.3
Appleton (N=28;;M;U-S) 0.0 57.1 17.9 32.1 35.7 7.1
Foster (N=33;M;U) 6.1 54.5 30.3 27.3 51.5 9.1
Langston (N=34;M;U-S) 14.7 64.7 5.9 32.4 50.0 11.8
Shaw (N=53;M;U) 3.8 64.2 18.9 13.2 22.6 5.7
Sherwood (N=34;M;R) 2.9 67.6 35.3 11.8 26.5 11.8
Low
Manning (N=29;B;U) 6.9 61.3 17.2 13.8 31.9 20.7
Carter (N=61;M;S) 4.9 67.2 9.8 23.0 21.3 4.9
Lowell (N=32;M;U) 12.5 54.3 12.1 12.1 34.4 3.1
Palmerston (N=41;M;R) 7.3 46.3 26.8 22.0 34.1 24.4
TOTAL 6.7 61.7 16.1 1 21.1 32.2 11.1
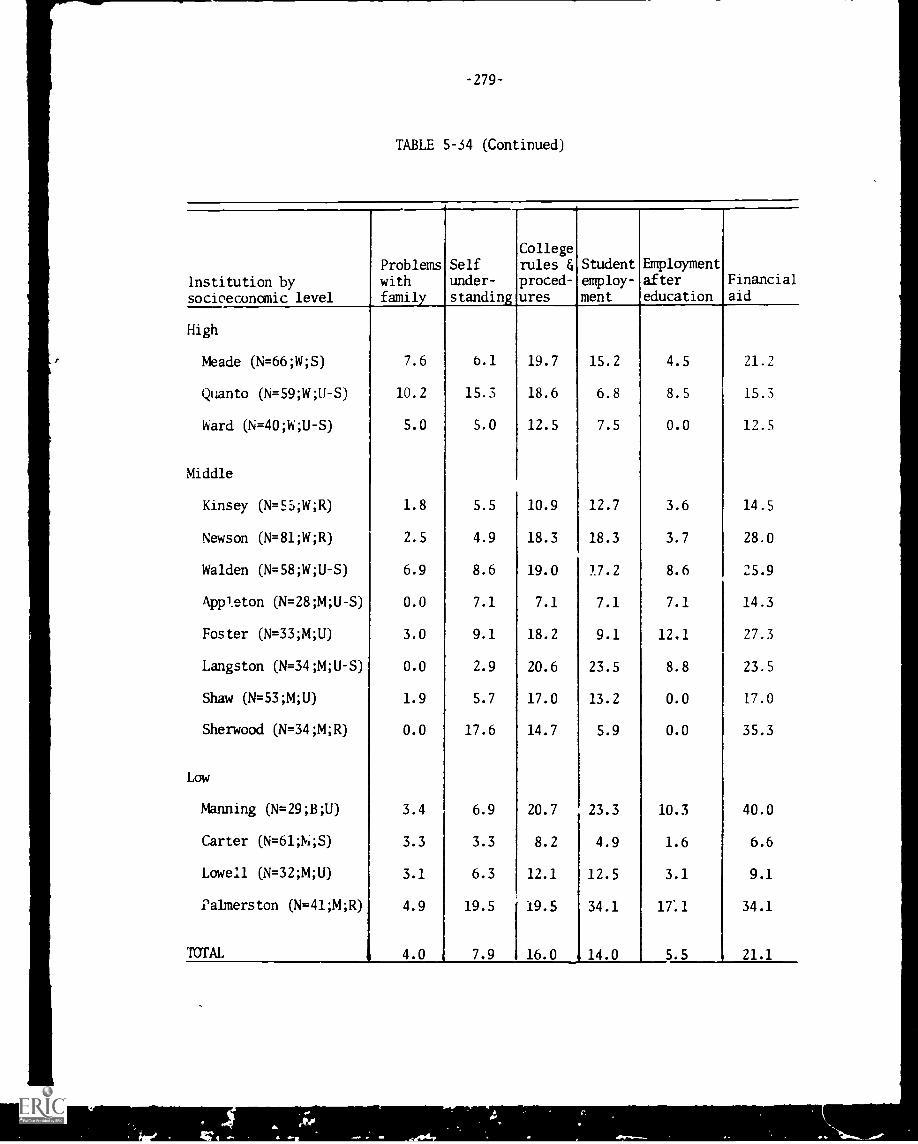
-279-
TABLE 5-34 (Continued)
Institution bysocioeconomic level
Problemswithfamily
Selfunder-standing
College
rules &proced-ures
Studentemploy-ment
Employmentaftereducation
Financialaid
High
Meade (N=66;W;S) 7.6 6.1 19.7 15.2 4.5 21.2
Quanto (N=59;W;U-S) 10.2 15.3 18.6 6.8 8.5 15.3
Ward (N=40;W;U-S) 5.0 5.0 12.5 7.5 0.0 12.5
Middle
Kinsey (N= 55;W;R) 1.8 5.5 10.9 12.7 3.6 14.5
Newson (N=81;W;R) 2.5 4.9 18.3 18.3 3.7 28.0
Walden (N=58;W;U-S) 6.9 8.6 19.0 17.2 8.6 25.9
App1eton (N= 28;M;U -S) 0.0 7.1 7.1 7.1 7.1 14.3
Foster (N= 33;M;U) 3.0 9.1 18.2 9.1 12.1 27.3
Langston (N= 34;M;U -S) 0.0 2.9 20.6 23.5 8.8 23.5
Shaw (N=53;M;U) 1.9 5.7 17.0 13.2 0.0 17.0
Sherwood (N=34;M;R) 0.0 17.6 14.7 5.9 0.0 35.3
Low
Manning (N= 29;B;U) 3.4 6.9 20.7 23.3 10.3 40.0
Carter (N= 61;N;S) 3.3 3.3 8.2 4.9 1.6 6.6
Lowell (N= 32;M;U) 3.1 6.3 12.1 12.5 3.1 9.1
Palmerston (N =41;M;R) 4.9 19.5 19.5 34.1 17.1 34.1
TOTAL 4.0 7.9 16.0 14.0 5.5 21.1
A 411.,.
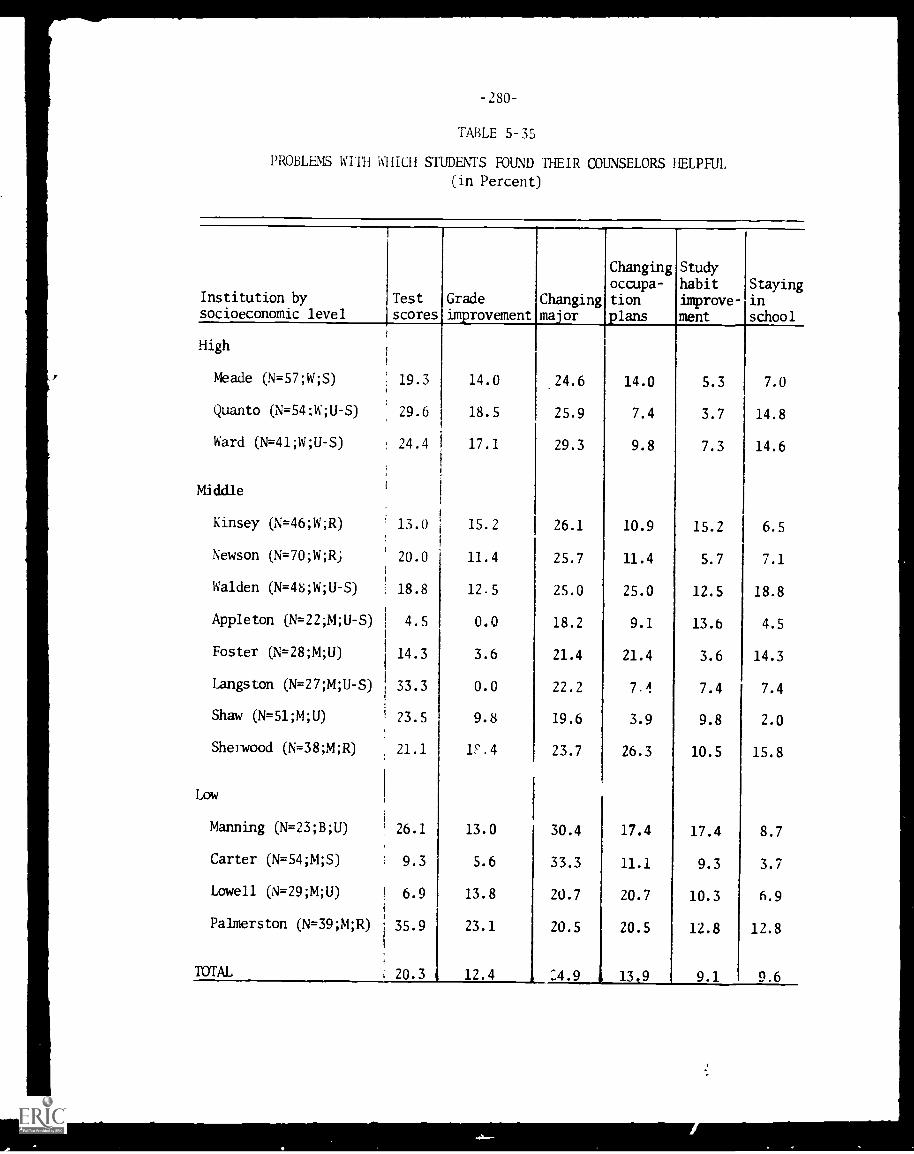
-280
TABLE 5-35
PROBLEMS WITH WHICH STUDENTS FOUND THEIR COUNSELORS HELPFUL
(in Percent)
Institution bysocioeconomic level
Test
scoresGradeimprovement
Changingmajor
Changingoccupa-tionplans
Studyhabitimprove-ment
Stayingin
school
High
Meade (N=57;W;S) 19.3 14.0 .24.6 14.0 5.3 7.0
Quanto (N=54:W;U-S) 29.6 18.5 25.9 7.4 3.7 14.8
Ward (N=41;W;U-S)! 24.4 1 17.1 29.3 9.8 7.3 14.6
Middle
Kinsey (N=46;W;R) i 13.0 15.2 26.1 10.9 15.2 6.5
Newson (N=70;W;R) 20.0 11.4 25.7 11.4 5.7 7.1
Walden (N=48;W;U-S) 18.8 12.5 25.0 25.0 12.5 18.8
Appleton (N= 22;M;U -S) 4.5 0.0 18.2 9.1 13.6 4.5
Foster (N= 28;M;U) 14.3 3.6 21.4 21.4 3.6 14.3
Langston (N=27;M;U-S) 33.3 0.0 22.2 7.1 7.4 7.4
Shaw (N=51;M;U) 23.5 9.8 19.6 3.9 9.8 2.0
Sherwood (N=38;M;R) 21.1 1F.4 23.7 26.3 10.5 15.8
Low
Manning (N=23;B;U) 26.1 13.0 30.4 17.4 17.4 8.7
Carter (N=54;M;S) 9.3 5.6 33.3 11.1 9.3 3.7
Lowell (N=29;M;U)1 6.9 13.8 20.7 20.7 10.3 6.9
Palmerston (N=39;M;R)
1
35.9 23.1 20.5 20.5 12.8 12.8
TOTALi 20.3 12.4 24.9 13.9 9.1 9.6
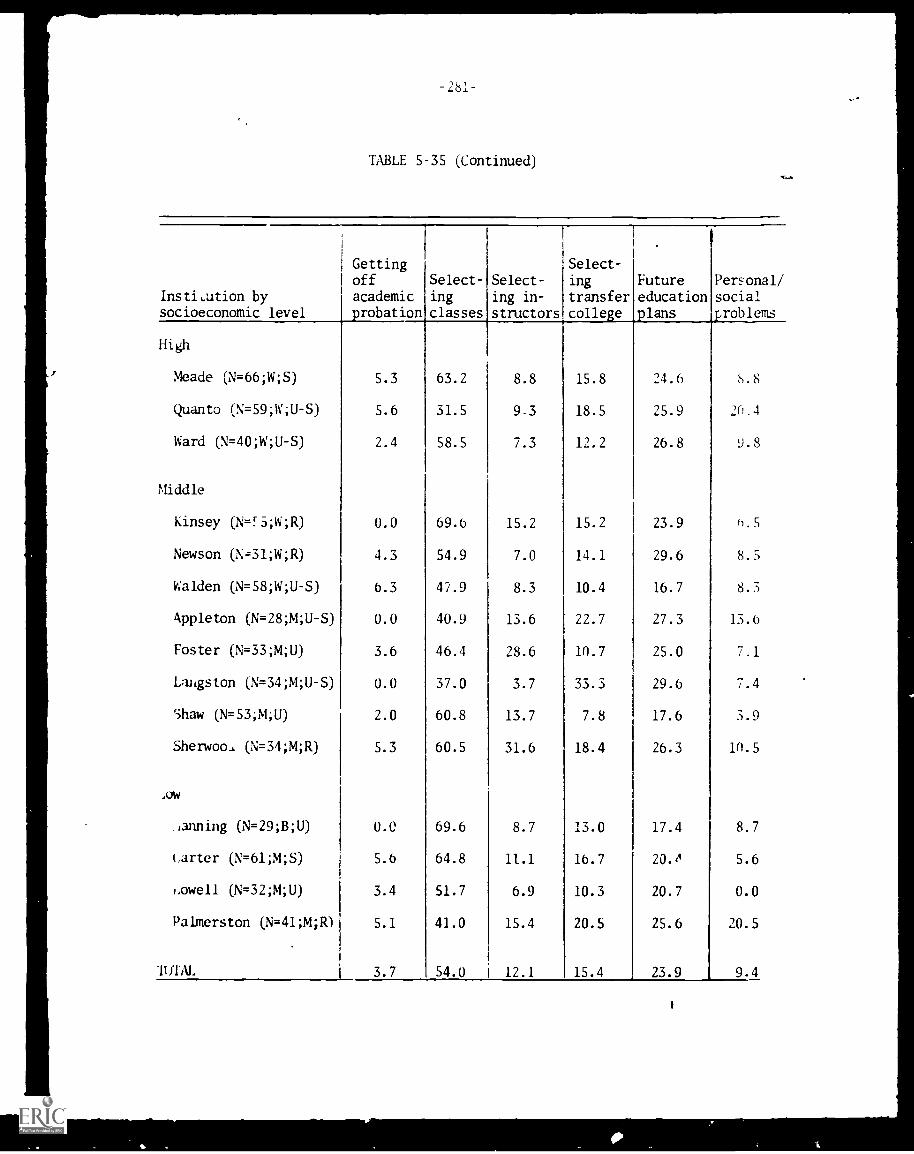
TABLE 5-35 (Continued)
Insti,ution bysocioeconomic level
Gettingoffacademic.robation
Select-
ing
classes
Select-
ing in-
structors
Select-
ing
transfercollege
Futureeducationplans
Personal/socialproblems
High
Meade (N=66;W;S) 5.3 63.2 8.8 15.8 24.6 S.8
Quanto (N=59;W;U-S) 5.6 31.5 9-3 18.5 25.9 21L4
Ward (N=40;W;U-S) 2.4 58.5 7.3 12.2 26.8 9.8
Middle
Kinsey (N=55;W;R) 0.0 69.6 15.2 15.2 23.9 h.5
Newson (N-31;W;R) 4.3 54.9 7.0 14.1 29.6 8.5
Walden (N=58;W;U-S) 6.3 47.9 8.3 10.4 16.7 8.
Appleton (N=28;14;U-S) 0.0 40.9 13.6 22.7 27.3 13.6
Foster (N=33;M;U) 3.6 46.4 28.6 10.7 25.0 7.1
Langston (N=34;M;U-S) 0.0 37.0 3.7 33.3 29.6 7.4
Shaw (N=53;M;U) 2.0 60.8 13.7 7.8 17.6 3.9
Sherwoo_L (N=34;M;R) 5.3 60.5 31.6 18.4 26.3 in.5
,ow
.,arming (N =29;B;U) 0.0 69.6 8.7 13.0 17.4 8.7
carter (N=61;M;S) 5.6 64.8 11.1 16.7 20.,1 5.6
Lowell (N=32;M;U) 3.4 51.7 6.9 10.3 20.7 0.0
Palmerston (N=41;M;R) 5.1 41.0 15.4 20.5 25.6 20.5
MAL 3.7 54.0 I 12.1 15.4 23.9 9.4
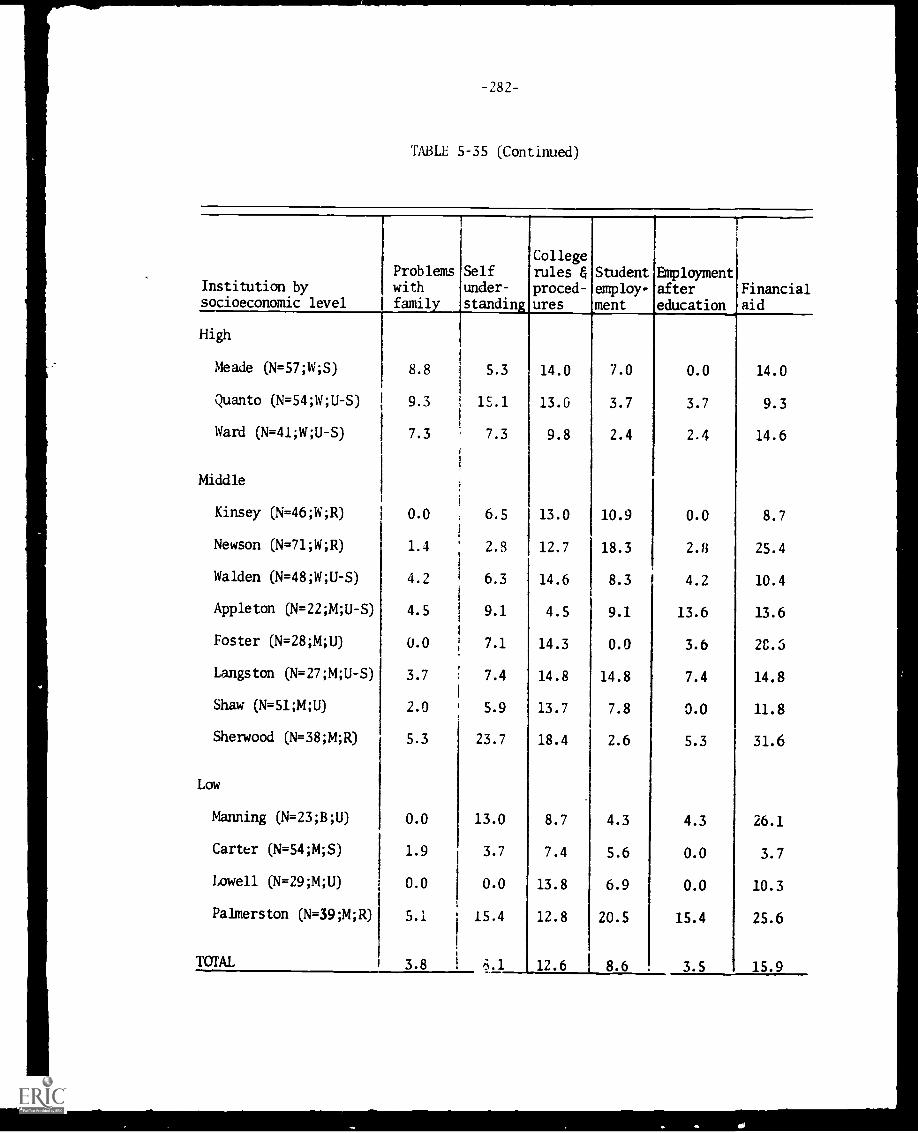
TABLE 5-35 (Continued)
Institution bysocioeconomic level
Problemswithfamil
Selfunder-
standin:
Collegerules &proced-ures
Studentemploy-ment
Employmentafter
educationFinancialaid
High
Meade (N=57;W;S) 8.8 5.3 14.0 7.0 0.0 14.0
Quanto (N=54;W;U-S) 9.3 15.1 13.0 3.7 3.7 9.3
Ward (N=41;W;U-S) 7.3 7.3 9.8 2.4 2.4 14.6
Middle
Kinsey (N=46;W;R) 0.0 6.5 13.0 10.9 0.0 8.7
Newson (N =71;W;R) 1.4 2.8 12.7 18.3 2.8 25.4
Walden (N=48;W;U-S) 4.2 6.3 14.6 8.3 4.2 10.4
Appleton (N=22;M;U-S) 4.5 9.1 4.5 9.1 13.6 13.6
Foster (N=28;M;U) 0.0 7.1 14.3 0.0 3.6 2C.5
Langston (M=27;M;U-S) 3.7 7.4 14.8 14.8 7.4 14.8
Shaw (N=51;M;U) 2.0 5.9 13.7 7.8 0.0 11.8
Sherwood (N= 38;M;R) 5.3 23.7 18.4 2.6 5.3 31.6
Low
Manning (N= 23;B;U) 0.0 13.0 8.7 4.3 4.3 26.1
Carter (N=54;M;S) 1.9 3.7 7.4 5.6 0.0 3.7
Lowell (N=29;M;U) 0.0 0.0 13.8 6.9 0.0 10.3
Palmerston (N= 39;M;R) 5.1 15.4 12.8 20.5 15.4 25.6
TOTAL 3.8 P.3.1 12.6 8.6 3.5 15.9
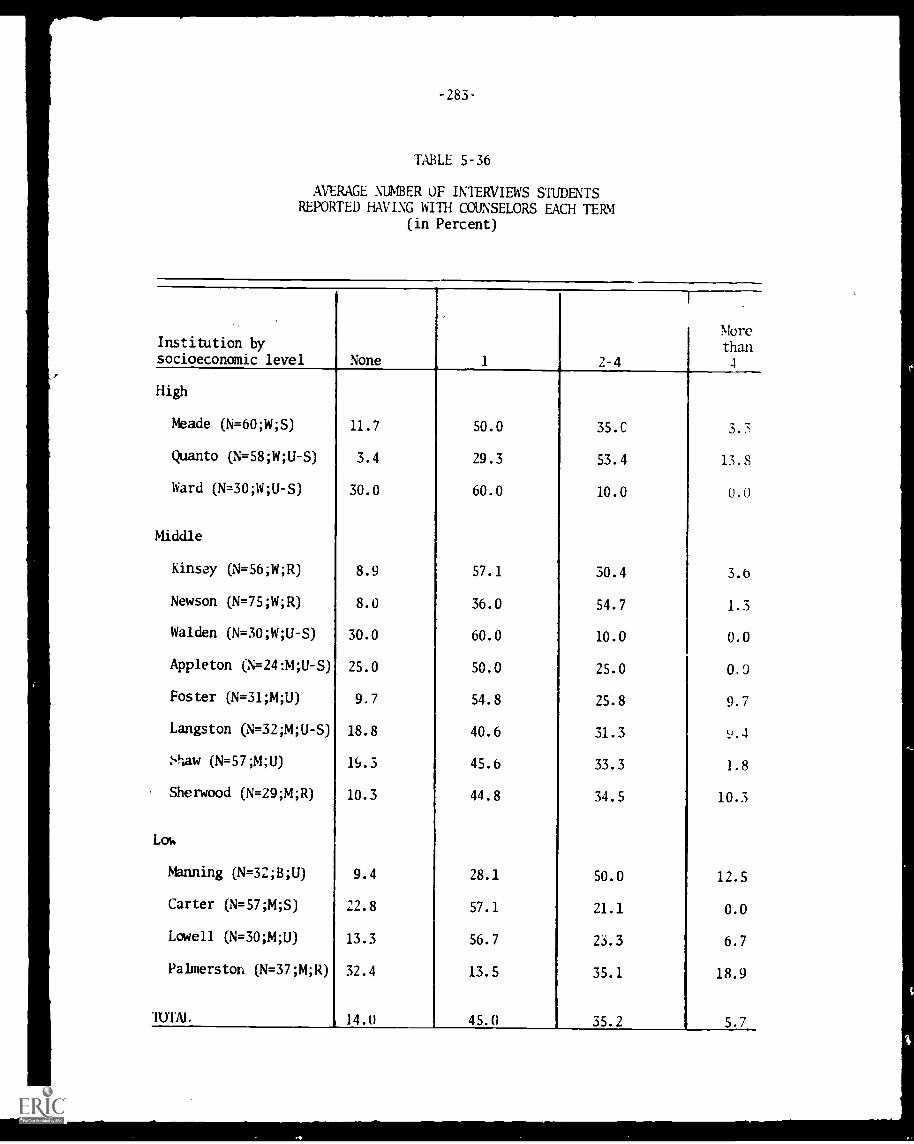
-283-
TABLE 5-36
AVERAGE NUMBER OF INTERVIEWS STUDENTSREPORTED HAVING WITH COUNSELORS EACH TERM
(in Percent)
Institution bysocioeconomic level None 1
1
2-4
Morethan4
High
Meade (N= 60;W;S) 11.7 50.0 35.0 3.5
Quanto (N=58;W;U-S) 3.4 29.3 53.4 13.8
Ward (N=30;W;U-S) 30.0 60.0 10.0 0.0
Middle
Kinsey (N=56;W;R) 8.9 57.1 30.4 3.b
Newson (N= 75;W;R) 8.0 36.0 54.7 1.3
Walden (N=30;W;U-S) 30.0 60.0 10.0 0.0
Appleton (N=24:M;U-S) 25.0 50.0 25.0 0.9
Foster (N=31;M;U) 9.7 54.8 25.8 9.7
Langston (N= 32;M;U -S) 18.8 40.6 31.3 9.3
Saw (N=57;M;U) 19.3 45.6 33.3 1.8
Sherwood (N=29;M;R) 10.3 44.8 34.5 10.3
Lou
Manning (N= 32;B;U) 9.4 28.1 50.0 12.5
Carter (N=57;M;S) 22.8 57.1 21.1 0.0
Lowell (N=30;M;U) 13.3 56.7 23.3 6.7
Palmerston (N=37;M;R) 32.4 13.5 35.1 18.9
MAI. 14.0 45.0 35.2 5.7
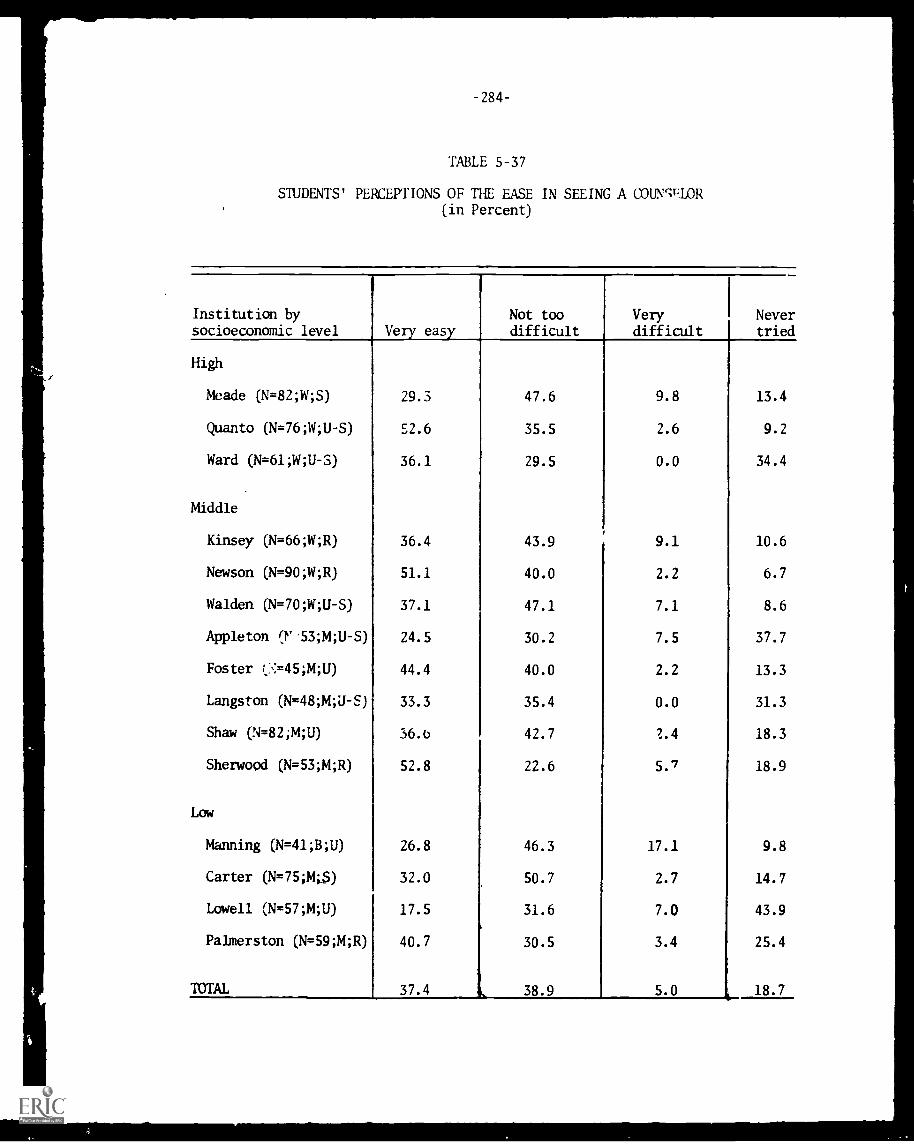
-284-
TABLE 5-37
STUDENTS' PERCEPTIONS OF THE EASE IN SEEING A COUNSELOR(in Percent)
Institution bysocioeconomic level Very easy
Not toodifficult
Verydifficult
Nevertried
High
Meade (N= 82;W;S) 29.3 47.6 9.8 13.4
Quanto (N= 76;W;U -S) 52.6 35.5 2.6 9.2
Ward (N=61;W;U-S) 36.1 29.5 0.0 34.4
Middle
Kinsey (N= 66;W;R) 36.4 43.9 9.1 10.6
Newson (N=90;W;R) 51.1 40.0 2.2 6.7
Walden (N=70;W;U-S) 37.1 47.1 7.1 8.6
Appleton (P''53;M;U-S) 24.5 30.2 7.5 37.7
Foster :,:-:=45;M;UD 44.4 40.0 2.2 13.3
Langston (N=48;14;U-S) 33.3 35.4 0.0 31.3
Shaw (N=82;14;U) 36.6 42.7 ?.4 18.3
Sherwood (N=53;M;R) 52.8 22.6 5.7 18.9
Low
Manning (N= 41;B;U) 26.8 46.3 17.1 9.8
Carter (N=75XS) 32.0 50.7 2.7 14.7
Lowell (N=57;M;U) 17.5 31.6 7.0 43.9
Palmerston (N=59;M;R) 40.7 30.5 3.4 25.4
TOTAL 37.4 d 38.9 5.0 1 18.7
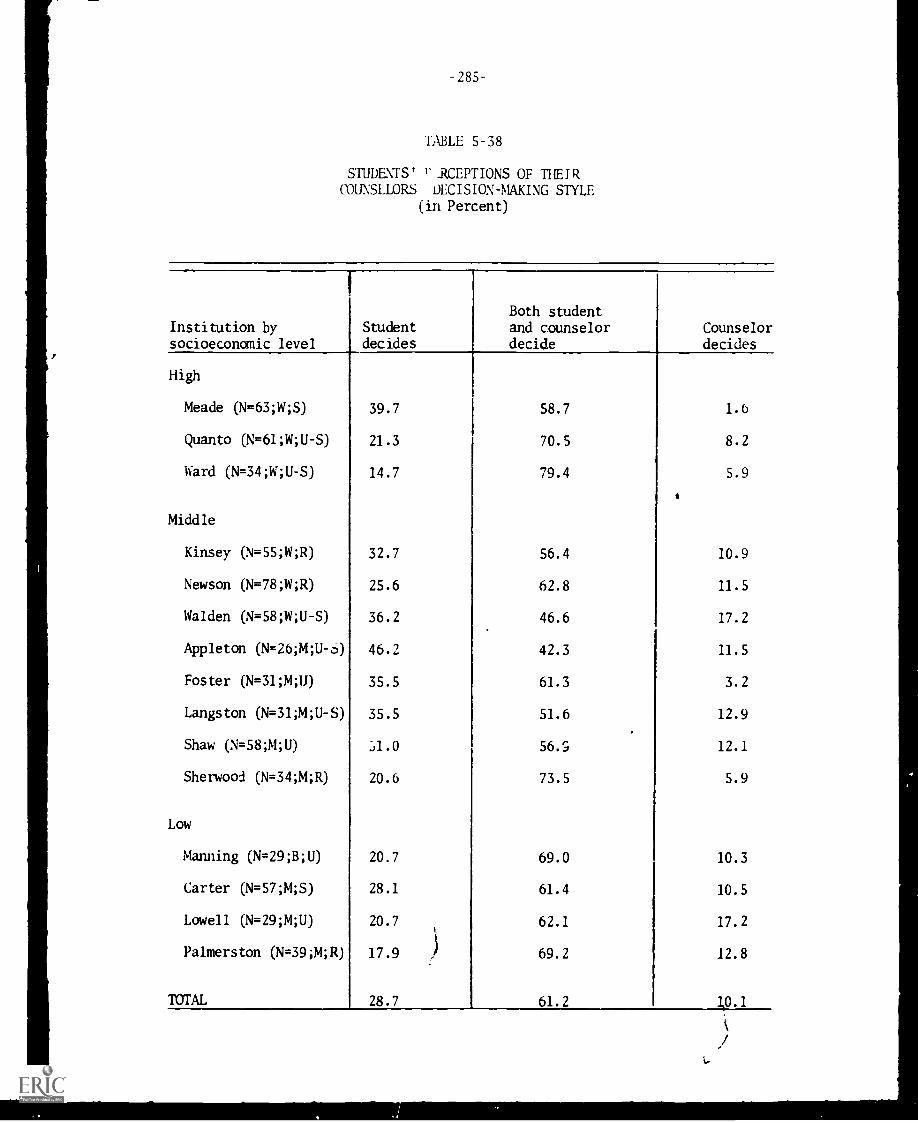
TABLE 5-38
STUDENTS' FACEPTIONS OF THEIRCOUNSELORS DECISION-MAKING STYLE
(in Percent)
Institution bysocioeconomic level
Studentdecides
Both studentand counselordecide
Counselordecides
High
Meade (N=63;W;S) 39.7 58.7 1.6
Quanto (N=61;W;U-S) 21.3 70.5 8.2
Ward (N=34;W;U-S) 14.7 79.4 5.9
*
Middle
Kinsey (N=55;W;R) 32.7 56.4 10.9
Newson (N=78;W;R) 25.6 62.8 11.5
Walden (N=58;W;U-S) 36.2 46.6 17.2
Appleton (N=26;14;11-6 ) 46.2 42.3 11.5
Foster (N=31;M;U) 35.5 61.3 3.2
Langston (N=31;M;U-S) 35.5 51.6 12.9
Shaw (N=58;M;U) :,1.0 56.S 12.1
Sherwood (N=34;M;R) 20.6 73.5 5.9
Low
Manning (N=29;B;U) 20.7 69.0 10.3
Carter (N=57;M;S) 28.1 61.4 10.5
Lowell (N=29;M;U) 20.7 62.1 17.2
Palmerston (N=39;M;R) 17.9 69.2 12.8
TOTAL 28.7 61.2 10.1
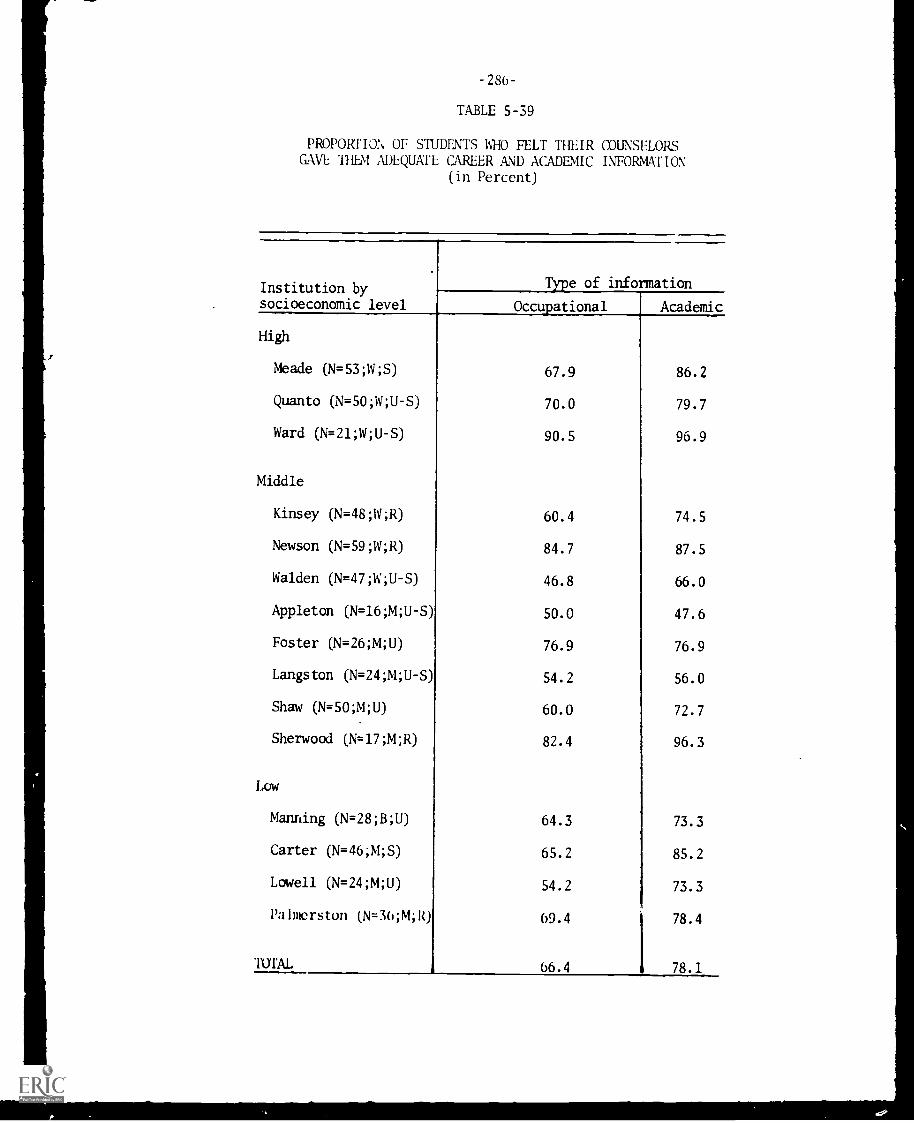
-28b-
TABLE 5-39
PROPORTION OF STUDENTS WHO FELT THEIR COUNSELORSGAVE 1101 ADLQUACL CAREER AND ACADEMIC INFORMATION
(in Percent)
Institution bysocioeconomic level
Type of information
Occupational Academic
High
Meade (N=53;W;S) 67.9 86.2
Quanto (N=50;W;U-S) 70.0 79.7
Ward (N=21;W;U-S) 90.5 96.9
Middle
Kinsey (N=48;W;R) 60.4 74.5
Newson (N=59;W;R) 84.7 87.5
Walden (N=47;W;U-S) 46.8 66.0
Appleton (N=16;M;U-S) 50.0 47.6
Foster (N=26;M;U) 76.9 76.9
Langston (N=24;M;U-S) 54.2 56.0
Shaw (N=50;M;U) 60.0 72.7
Sherwood (N=17;M;R) 82.4 96.3
Low
Manning (N=28;B;U) 64.3 73.3
Carter (N=46;M;S) 65.2 85.2
Lowell (N=24;M;U) 54.2 73.3
Palmerston (N=36;M;R) 69.4 78.4
TOTAL 66.4 78.1
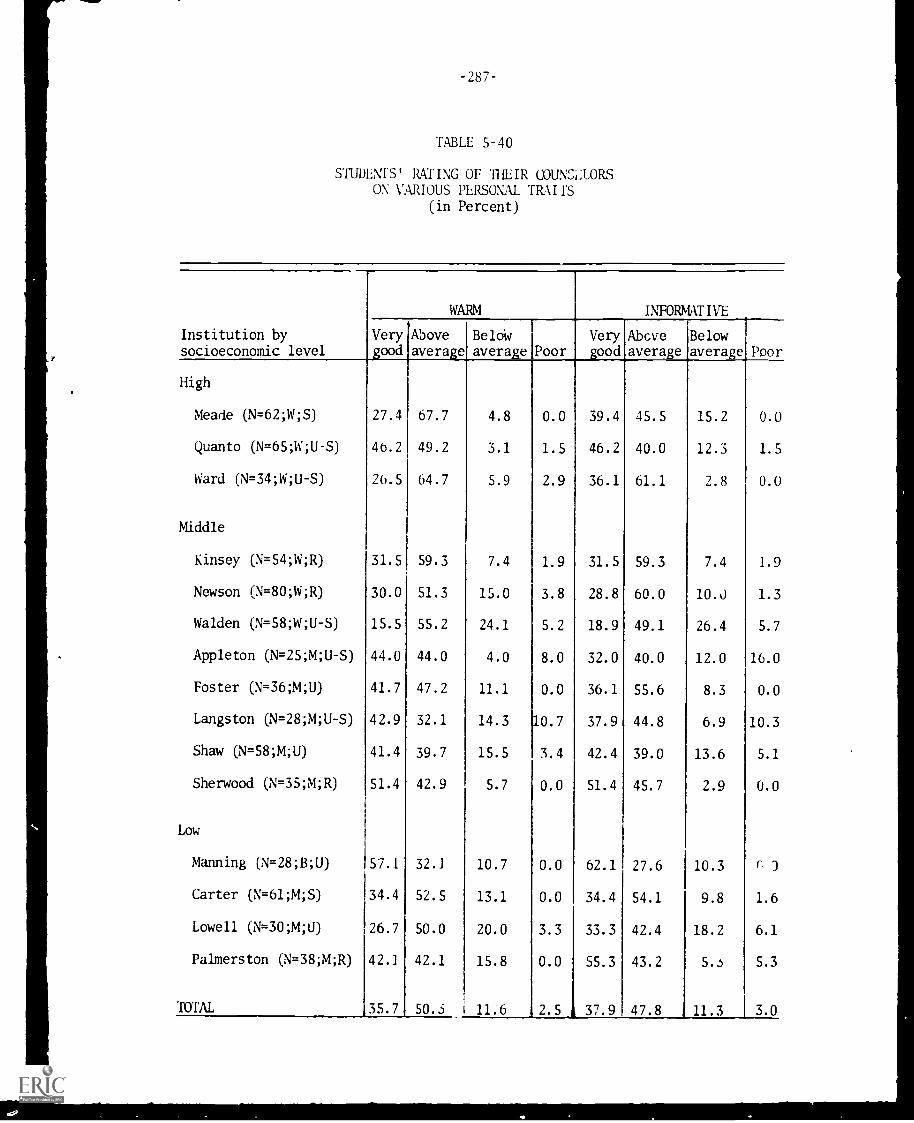
TABLE 5-40
STUDENTS' RATING OF THEIR COUNSZLORSON VARIOUS PERSONAL TRAITS
(in Percent)
Institution bysocioeconomic level
WARM INFORMATIVE
Very,good
Aboveaverage
Beldwaverage Poor
Verygood
Abcveaverage
Belowaverage Poor
High
Meade (N=62;W;S) 27.4 67.7 4.8 0.0 39.4 45.5 15.2 0.0
Quanto (N=65;W;U-S) 46.2 49.2 3.1 1.5 46.2 40.0 12.3 1.5
Ward (N=34;W;U-S) 26.5 64.7 5.9 2.9 36.1 61.1 2.8 0.0
Middle
Kinsey (N=54;W;R) 31.5 59.3 7.4 1.9 31.5 59.3 7.4 1.9
Newson (N=80;W;R) 30.0 51.3 15.0 3.8 28.8 60.0 10.O 1.3
Walden (N=58;W;U-S) 15.5 55.2 24.1 5.2 18.9 49.1 26.4 5.7
Appleton (N=25;M;U-S) 44.0 44.0 4.0 8.0 32.0 40.0 12.0 16.0
Foster (N=36;M;U) 41.7 47.2 11.1 0.0 36.1 55.6 8.3 0.0
Langston (N=28;M;U-S) 42.9 32.1 14.3 10.7 37.9 44.8 6.9 10.3
Shaw (N=58;M;U) 41.4 39.7 15.5 3.4 42.4 39.0 13.6 5.1
Sherwood (N=35;M;R) 51.4 42.9 5.7 0.0 51.4 45.7 2.9 0.0
Low
Manning (N=28;B;U) 57.1 32.1 10.7 0.0 62.1 27.6 10.3 r
Carter (N=61;M;S) 34.4 52.5 13.1 0.0 34.4 54.1 9.8 1.6
Lowell (N=30;M;U) 26.7 50.0 20.0 3.3 33.3 42.4 18.2 6.1
Palmerston (N=38;M;R) 42.1 42.1 15.8 0.0 55.3 43.2 5.. 5.3
TOTAL 35.7 50.3 i 11.6 2.5 37.9 47.8 11.3 3.0
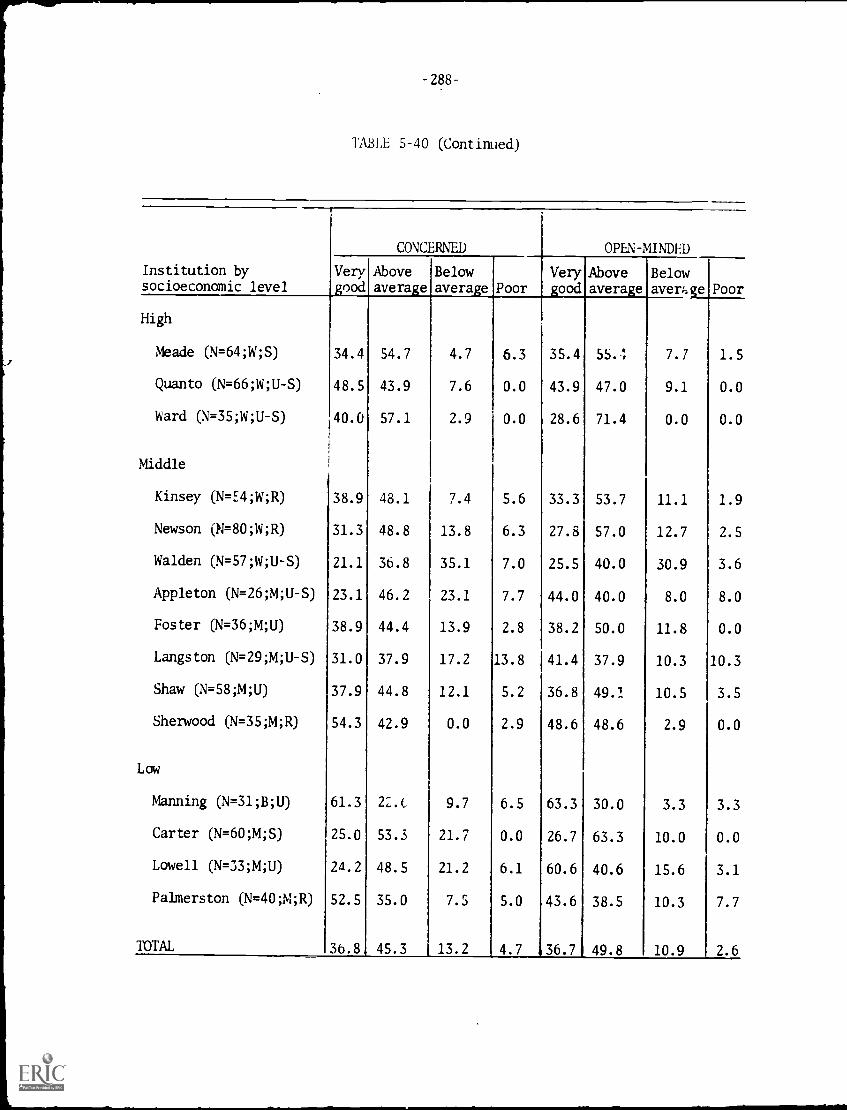
-288-
TABLE 5-40 (Continued)
Institution bysocioeconomic level
CONCERNED OPEN MINDED
VeryRood
Aboveaverage
Belowaverage Poor
Verygood
Aboveaverage
Belowaverh e
High
Meade (N=64;W;S) 34.4 54.7 4.7 6.3 35.4 5S.1 7.7
Quanto (N=66;W;U-S) 48.5 43.9 7.6 0.0 43.9 47.0 9.1
Ward (N=35;W;U-S) 40.0 57.1 2.9 0.0 28.6 71.4 0.0
Middle
Kinsey (N=E4;W;R) 38.9 48.1 7.4 5.6 33.3 53.7 11.1
Newson (M=80;W;R) 31.3 48.8 13.8 6.3 27.8 57.0 12.7
Walden (N=57;W;U-S) 21.1 3.8 35.1 7.0 25.5 40.0 30.9
Appleton (N=26;M;U-S) 23.1 46.2 23.1 7.7 44.0 40.0 8.0
Foster (N= 36;M;U) 38.9 44.4 13.9 2.8 38.2 50.0 11.8
Langston (N= 29;M;U -S) 31.0 37.9 17.2 13.8 41.4 37.9 10.3
Shaw (N=58;M;U) 37.9 44.8 12.1 5.2 36.8 49.1 10.5
Sherwood (N=35;M;R) 54.3 42.9 0.0 2.9 48.6 48.6 2.9
Low
Manning (031;8;U) 61.3 LA, 9.7 6.5 63.3 30.0 3.3
Carter (N=60;M;S) 25.0 53.3 21.7 0.0 26.7 63.3 10.0
Lowell (N=33;M;U) 24.2 48.5 21.2 6.1 60.6 40.6 15.6
Palmerston (N=40;M;R) 52.5 35.0 7.5 5.0 43.6 38.5 10.3
TOTAL 3b.8 45.3 13.2 4.7 36.7 49.8 10.9
Poor
1.5
0.0
0.0
1.9
2.5
3.6
8.0
0.0
10.3
3.5
0.0
3.3
0.0
3.1
7.7
2.6
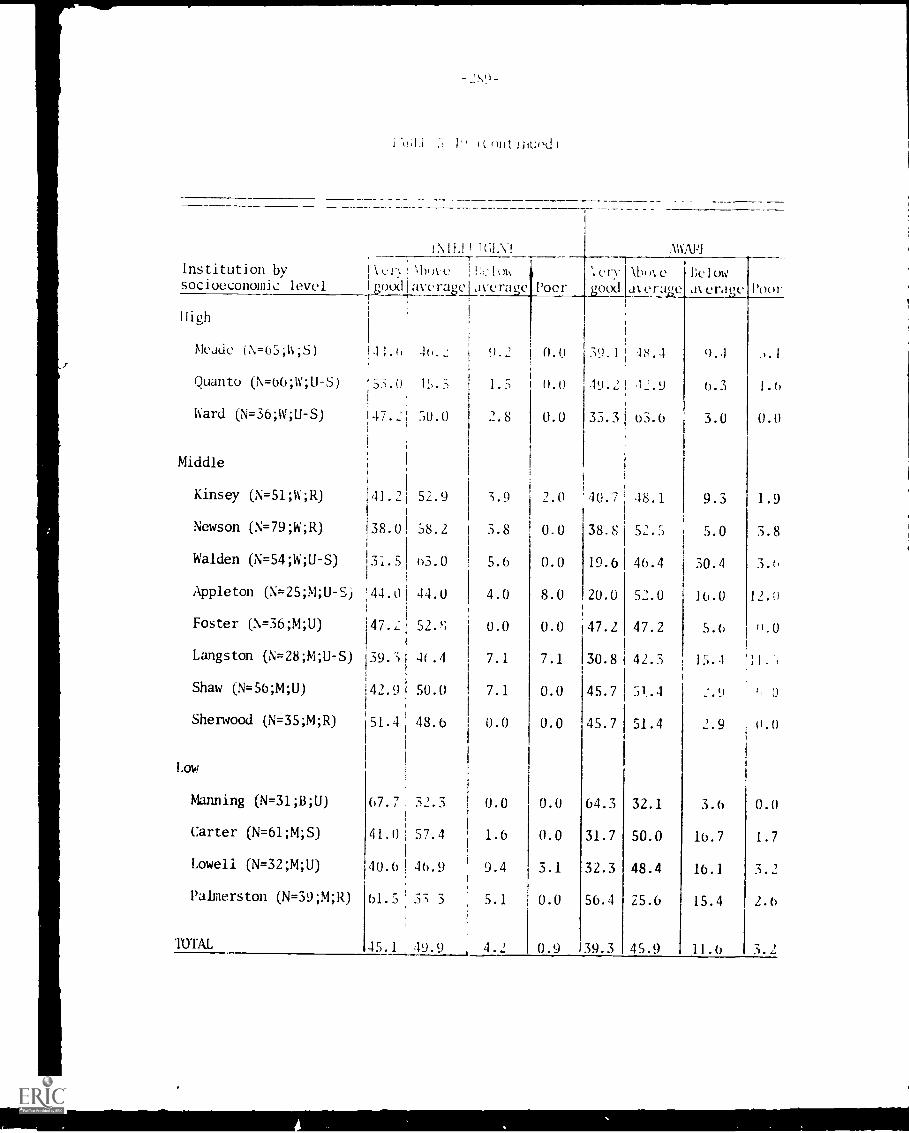
1" ont ti.:(sclI
!NIL( I f(;j_,f
Institution by k 'khove
socioeconomic level lgoodiaverelaverage Poor
High
Meade (N =03;1 ;5) I41.() 9.2 j 0.0
Quanto (N=66;W;1J -S) 15.5 1.5 i 0.°
Ward (N=36;W;U-S) 47.21 50.0 2.8 0.0
Middle
Kinsey (N=51;W;R)
Newson (N=79;W;R)
Walden (N=54;W;U-S)
41.2i 52.9
138.0! 38.21 !
31.5! 03.0
Appleton (N=25;M;U-S ) '44.01 44.0
Foster ( \= 36;M;U)
1
47.
2
52.
Langston (N=28;M;U-S) 39.3 4(.4
Shaw (N=56;M;U) 142.9 50.0
Sherwood (N=35;M;R) L51.4 48.6
Low
Manning (N=31;B;U)
Carter (N=61;M;S)
Lowell (N=32;M;U)
Palmerston (N=39;M;R)
TOTAL
67.7 32.3
41.0 57.4
40.6! 46.9
01.3 3; 3
45.1 49.9
3.9
3.8
5.6
4.0
0.0
7.1
7.1
0.0
2.0
0.0
0.0
8.0
0.0
7.1
0.0
0.0
0.0 0.0
1.6 0.0
9.4 3.1
5.1 0.0
4.2 0.9
:110.R11
%ery 11)4,e
'ood ateraue
39.1 18.4
Relow
aterave Poor
.).1
49.21 12.9 6.3 1.6
33.3 03.6 3.0 0.0
40.7 48.1 9.3 1.9
38.8 52.5 5.0 3.8
19.6 46.4 30.4 3.6
20.0 52.0 16.0 12.:)
47.2 47.2 5.6 11.0
30.8 42.3 15.-1 11.
45.7 51.4 I,
45.7 51.4 2.9 0.0
64.3 32.1 3.6 0.0
31.7 50.0 16.7 1.7
32.3 48.4 16.1 3.2
56.4 25.6 15.4 2.6
39.3 45.9 11.6 3.2
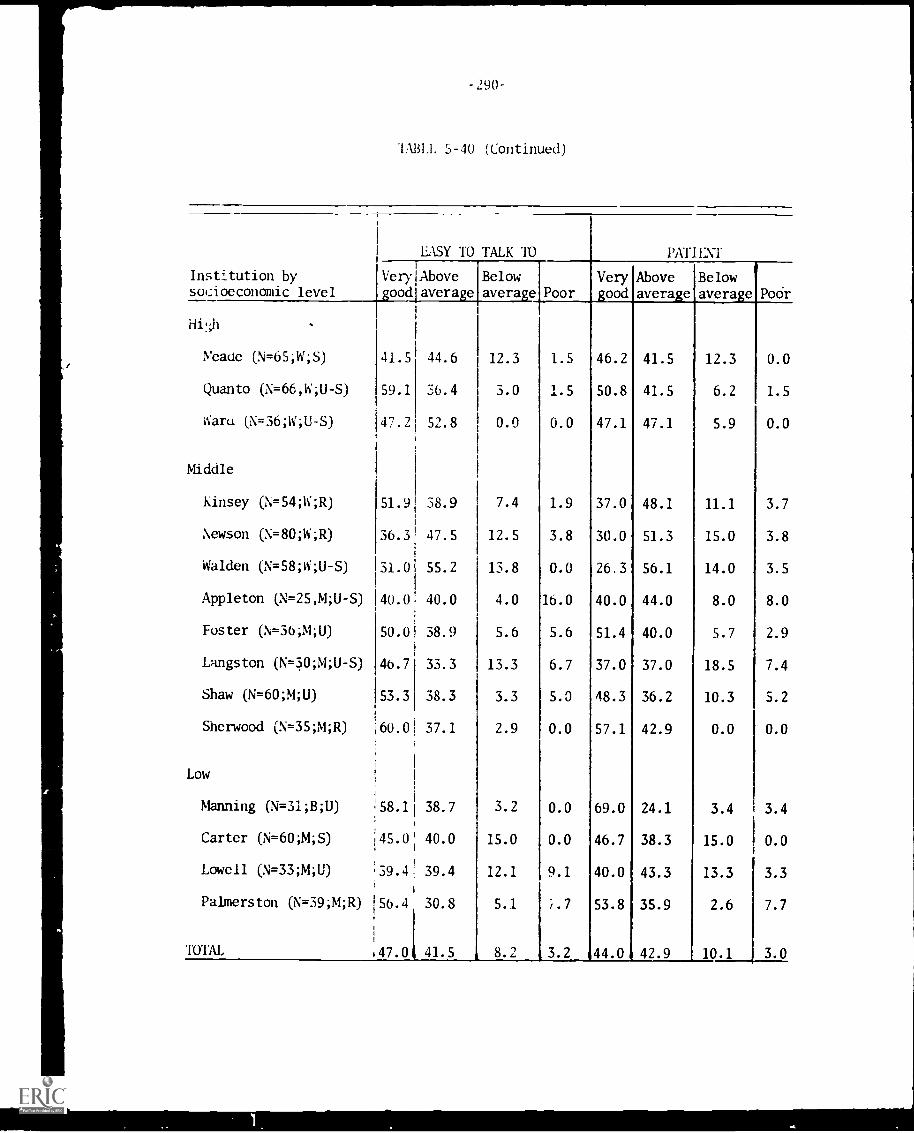
-290-
lABLL 5-40 (Continued)
Institution bysocioeconomic level
EASY TO TALK TO PATIENT
VerylAbovegood average
Belowaverage Poor
Verygood
Aboveaverage
Belowaverage Pocir
Hi ;h
Yeade (N =65;W;S) 41.5 44.6 12.3 1.5 46.2 41.5 12.3 0.0
Quanto (N=66,W;U-S) 59.1 36.4 3.0 1.5 50.8 41.5 6.2 1.5
itiaru (N=36;W;U-S) 47.2 52.8 0.0 0.0 47.1 47.1 5.9 0.0
Middle
Kinsey (N=54;W;R) 51.9 38.9 7.4 1.9 37.0 48.1 11.1 3.7
Newson (N=80;W;R) 36.3 47.5 12.5 3.8 30.0 51.3 15.0 3.8
Walden (N=58;W;U-S) 31.0 55.2 13.8 0.0 26.3 56.1 14.0 3.5
Appleton (N=25,M;U-S) 40.0 40.0 4.0 16.0 40.0 44.0 8.0 8.0
Foster (N=36;M;U) 50.0 38.9 5.6 5.6 51.4 40.0 5.7 2.9
Langston (N=30;M;U-S) 46.7 33.3 13.3 6.7 37.0 37.0 18.5 7.4
Shaw (N= 60;M;U) 53.3 38.3 3.3 5.0 48.3 36.2 10.3 5.2
Sherwood (N=35;M;R) 60.0 37.1 2.9 0.0 57.1 42.9 0.0 0.0
Low
Manning (N=31;B;U) 58.1 38.7 3.2 0.0 69.0 24.1 3.4 3.4
Carter (N=60;M;S) 45.0 40.0 15.0 0.0 46.7 38.3 15.0 i 0.0
Lowell (N=33;M;U) 39.4, 39.4 12.1 9.1 40.0 43.3 13.3 3.3
Palmerston (N=39;M;R) 56.4 30.8 5.1 .7 53.8 35.9 2.6 7.7
101AL 47.0 1 41.5 8.2 3.2 44.0 42.9 10.1 3.0
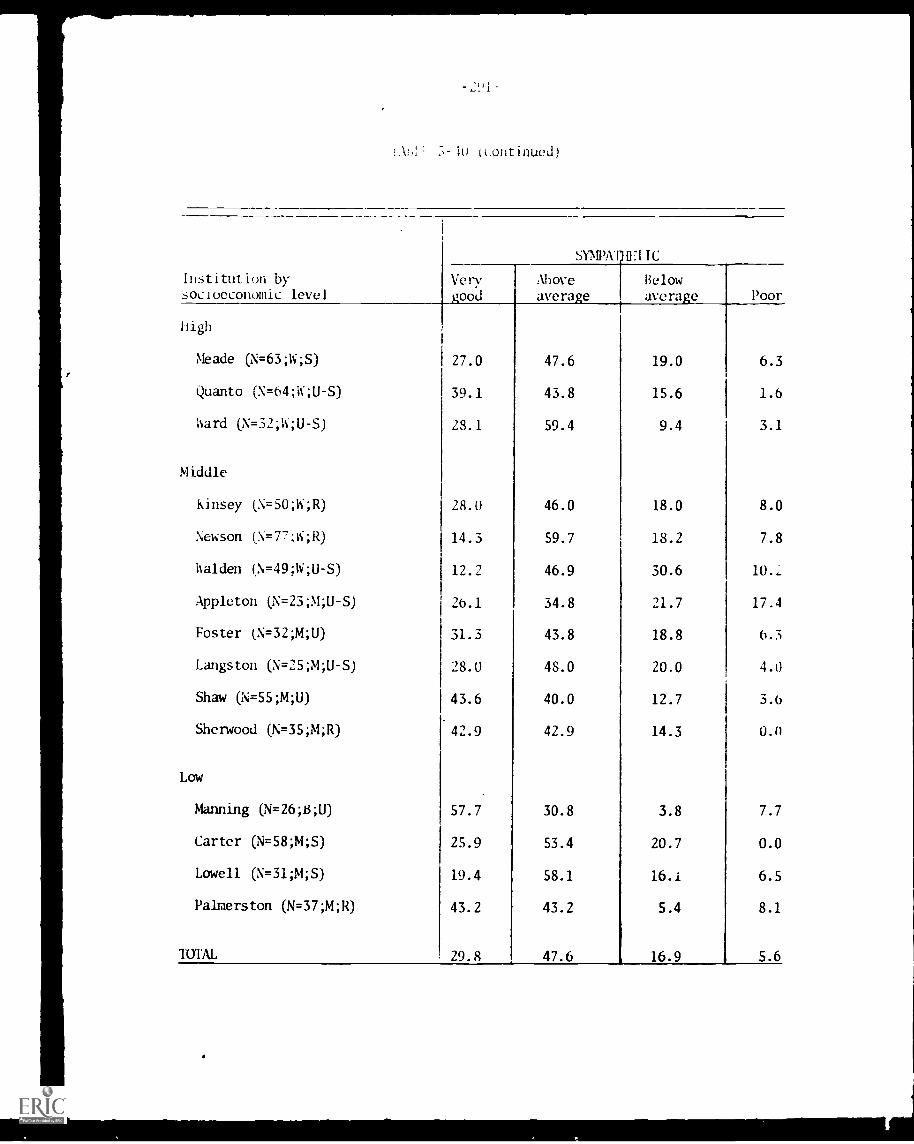
I
LV,!: lu tcontinued)
Institution bysocioeconomic level
High
Meade (N=63;W;S)
Quanto (N=64;W;U-S)
hard (N=32;W;U-S)
Middle
Kinsey (N=50;W;R)
Newson (N=77:iti;R)
halden (N=49;W;U-S)
Appleton (N=23;M;U-S)
Foster (N=32;M;U)
Langston (N=25;M;U-S)
Shaw (N=55;M;U)
Sherwood (N=35AR)
Low
Manning (N=26;B;U)
Carter (N=58;M;S)
Lowell (N=31;M;S)
Palmerston (N=37;M;R)
TOTAL
SYNIPA'l IC
Very Above BelowTood averae avera e Poor
27.0 47.6 19.0 6.3
39.1 43.8 15.6 1.6
28.1 59.4 9.4 3.1
28.0 46.0 18.0 8.0
14.3 59.7 18.2 7.8
12.2 46.9 30.6 10...
26.1 34.8 21.7 17.4
31.3 43.8 18.8 6.3
28.0 48.0 20.0 4.0
43.6 40.0 12.7 3.6
42.9 42.9 14.3 OM
57.7 30.8 3.8 7.7
25.9 53.4 20.7 0.0
19.4 58.1 16.i 6.5
43.2 43.2 5.4 8.1
29.8 47.6 16.9 5.6
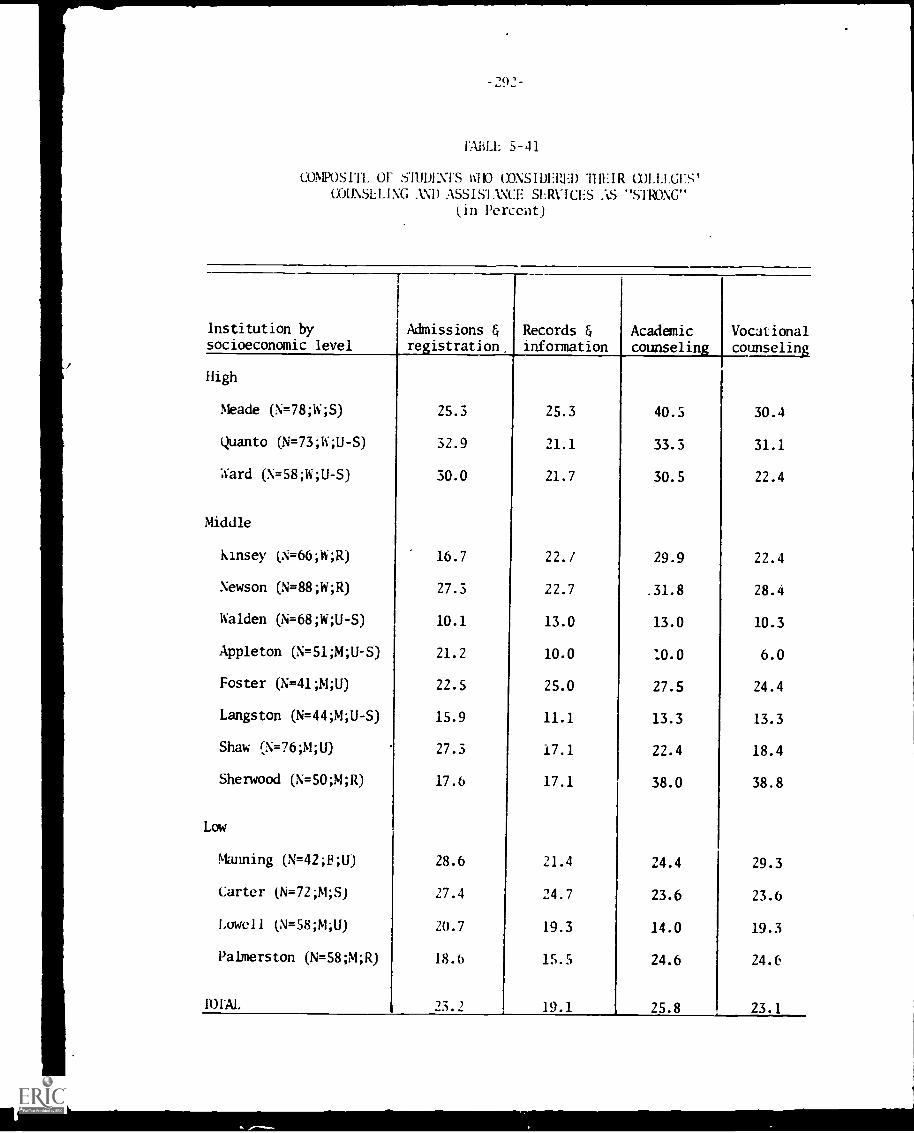
-29'-
LULL 5-41
CONIPOSITL OF SIUDENTS 11110 CONS II/El:ED 11ILIR COL LLGI : SCOUNSELING .kNII ASS151.NCE SERVICES :t.S "STRONG"
(in Percent)
Institution bysocioeconomic level
Admissions ®istration,
Records fl
informationAcademiccounseling
Vocationalcounseling
High
Meade (N=78;W;S) 25.3 25.3 40.5 30.4
Quanto (N=73;W;U-S) 32.9 21.1 33.3 31.1
Ward (N=58;W;U-S) 30.0 21.7 30.5 22.4
Middle
Kinsey (N=66;W;R) 16.7 22./ 29.9 22.4
Newson (N=88;W;R) 27.3 22.7 .31.8 28.4
Walden (N=68;W;U-S) 10.1 13.0 13.0 10.3
Appleton (N=51;M;U-S) 21.2 10.0 10.0 6.0
Foster (N= 41;M;U) 22.5 25.0 27.5 24.4
Langston (N=44;M;U-S) 15.9 11.1 13.3 13.3
Shaw (N=76;M;U) 27.3 17.1 22.4 18.4
Sherwood (N=50;M;R) 17.6 17.1 38.0 38.8
Low
Maiming (N=42;B;U) 28.6 21.4 24.4 29.3
Carter (N=72;M;S) 27.4 24.7 23.6 23.6
Lowell (N=58;M;U) 20.7 19.3 14.0 19.3
Palmerston (N=58;M;R) 18.6 15.5 24.6 24.(6
11)1AL 1- / 19.1 25.8 23.1
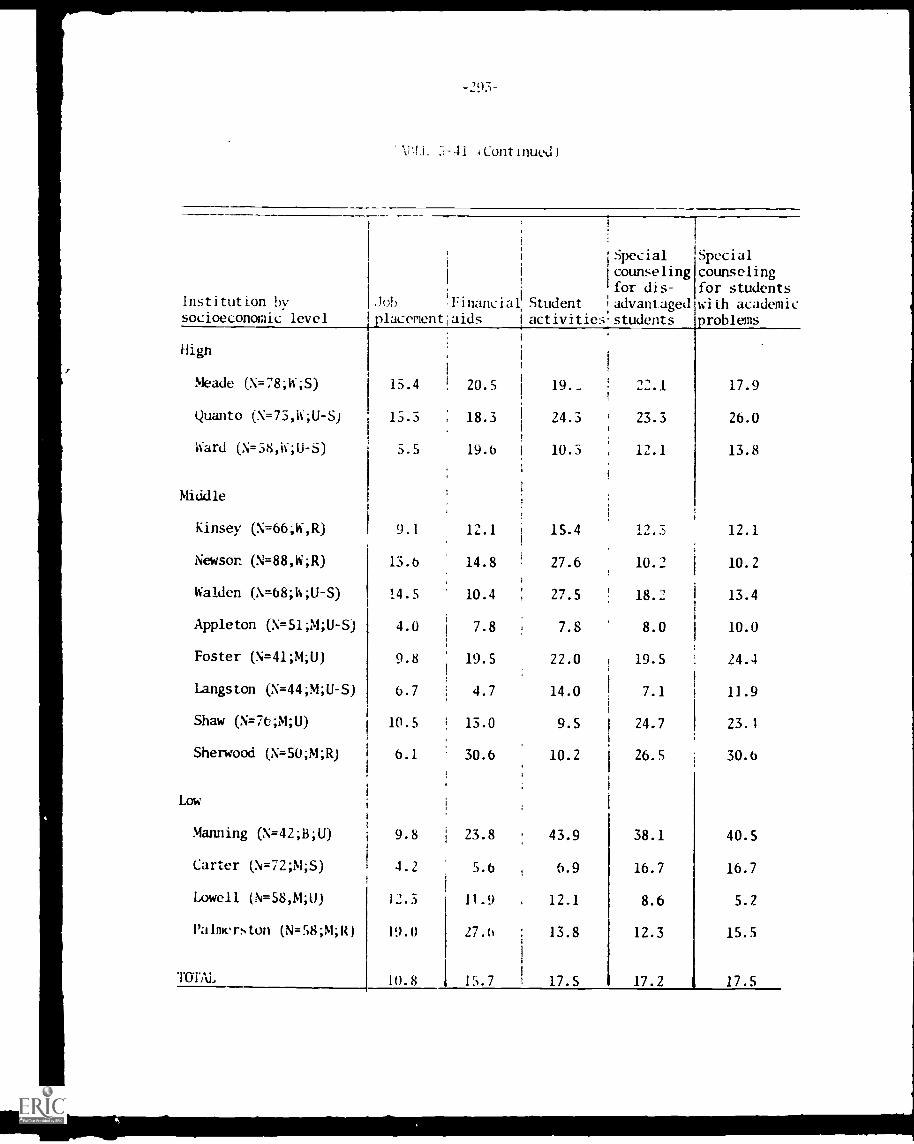
-.?93-
\:!i. ".;-41 iContinued1
Institution bysocioeconomic level
High
Meade (N=78;W;S)
Quanto (N=73,W;U-S)
Ward (N=58,h;U-S)
Middle
Kinsey (N.-66;14;X
Newson (N=88,h;R)
Walden (N=68;h;U-S)
Appleton (N=51;M;U-S)
Foster (N=41;M;U)
Langston (N=44;M;U-S)
Shaw (N=76;M;U)
Sherwood (N=50;M;R)
Low
Manning (N=42;B;U)
Carter (N=72;M;S)
Lowell (N=58,M;U)
Palmerston (N=S8AR)
TOTAL
i
;Special
1 ;counseling1
'for dis-Job !Financial Student ;advantagedplacement aids activities students
1
15.4 20.5 19._ 22.1 17.9
15.3 , 18.3 24.3 23.3 26.0
5.5 19.6 i 10.3 12.1 13.8
Specialcounselingfor studentswith academicproblems
9.1 12.1 15.4 12.3 12.1
13.6 14.8 27.6 10.2 10.2
14.5 10.4 ; 27.5 18.2 13.4
4.0 7.8 7.8 8.0 10.0
9.8 : 19.5 22.0 19.5 24.4
6.7 4.7 14.0 7.1 11.9
10.5 13.0 9.5 24.7 23.1
6.1 30.6 10.2 26.S 30.6
9.8i
23.8 43.9 38.1 40.5
4.2 5.6 6.9 16.7 16.7
12.3 11.9 12.1 8.6 5.2
19.0 27.6 13.8 12.3 15.5
10.8 15.7 17.5 17.2 17.5
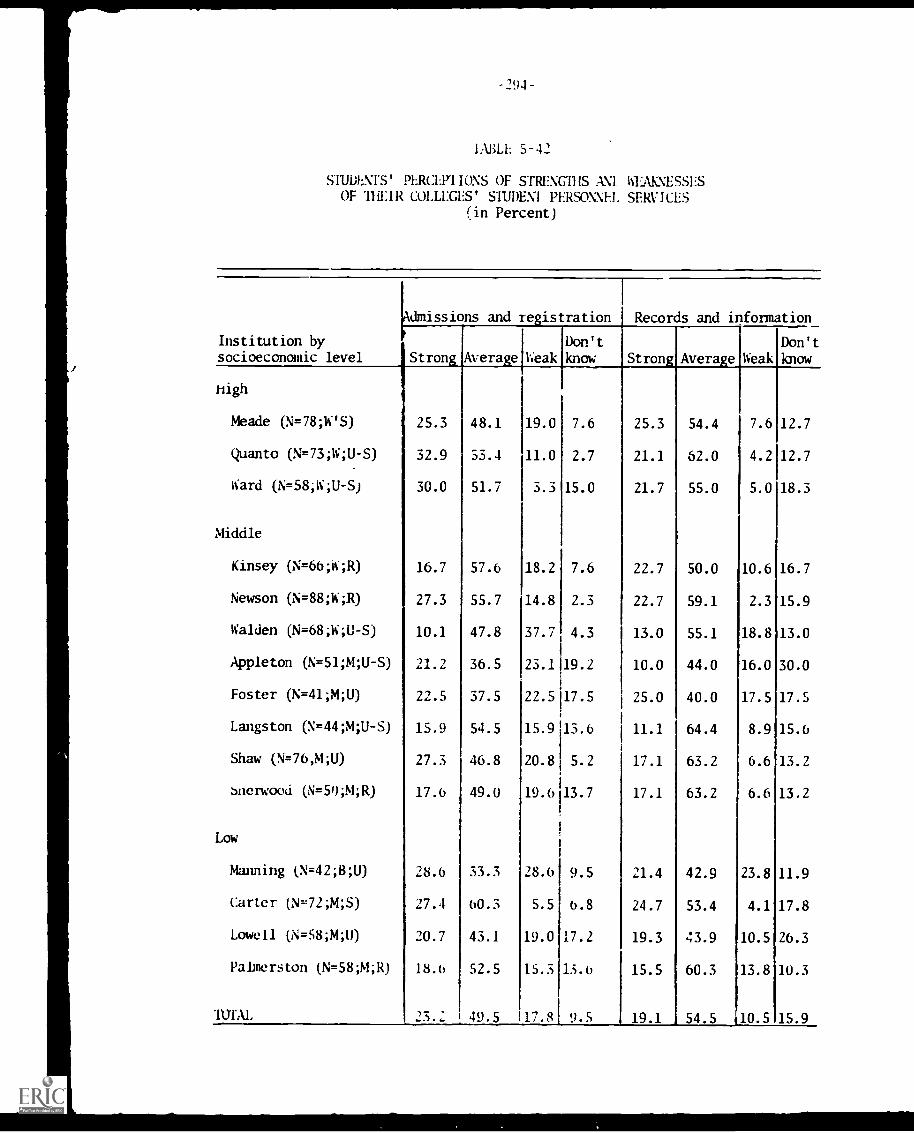
-294-
!ABLE 5-42
STUDENTS' PERCLVI IONS OF STRENGDIS A \1 WEAKNESSESOF 11 IEIR COLLEGES' STUDENI PERSONNEL SERVICES
(in Percent)
Institution bysocioeconomic level
IXdmissions and registration I Records and information
Don'tStrong Average Weak know
high
Meade (ti=78;W'S)
Quanto (N=73;W;U-S)
Ward (N=58;W;U-S)
Middle
Kinsey (N=66;W;R)
Newson (N=88;h";R)
Walden (N=68;W;U-S)
Appleton (N=51;M;U-S)
Foster (N=41;M;U)
Langston (N=44;M;U-S)
Shaw (N=76,14;U)
Snerwood (N=50;M;R)
Low
Manning (N=42;B;U)
Carter (sJ=72;M;S)
Lowell (;N=58;M;11)
Palmerston (N=58;M;R)
"IUTAL
25.3 48.1
32.9 53.4
30.0 51.7
19.0 7.6
11.0 2.7
3.3 15.0
16.7 57.6 18.2 7.6
27.3 55.7 14.8 2.3
10.1 47.8 37.7 4.3
21.2 36.5 23.1119.2
22.5 37.5 22.5117.5
15.9 54.5 15.9 13.6
27.3 46.8 20.8 5.2
17.6 49.0 19.6 13.7
28.6 33.3 28.6 9.5
27.4 60.3 5.5 6.8
20.7 43.1 19.0 17.2
18.6 52.5 15.3 13.6
23.2 49.5 17.8 9.5
Don'tStrong Average Weak know
25.3 54.4 7.6 12.7
21.1 62.0 4.2 12.7
1
21.7 55.0 5.0 18.3
22.7 50.0 10.6 16.7
22.7 59.1 2.3 15.9
13.0 55.1 18.8 13.0
10.0 44.0 16.0 30.0
25.0 40.0 17.5 17.5
11.1 64.4 8.9 15.6
17.1 63.2 6.6 13.2
17.1 63.2 6.6 13.2
21.4 42.9 23.8 11.9
24.7 53.4 4.1 17.8
19.3 43.9 10.5 26.3
15.5 60.3 13.8 10.3
19.1 54.5 110.5 15.9
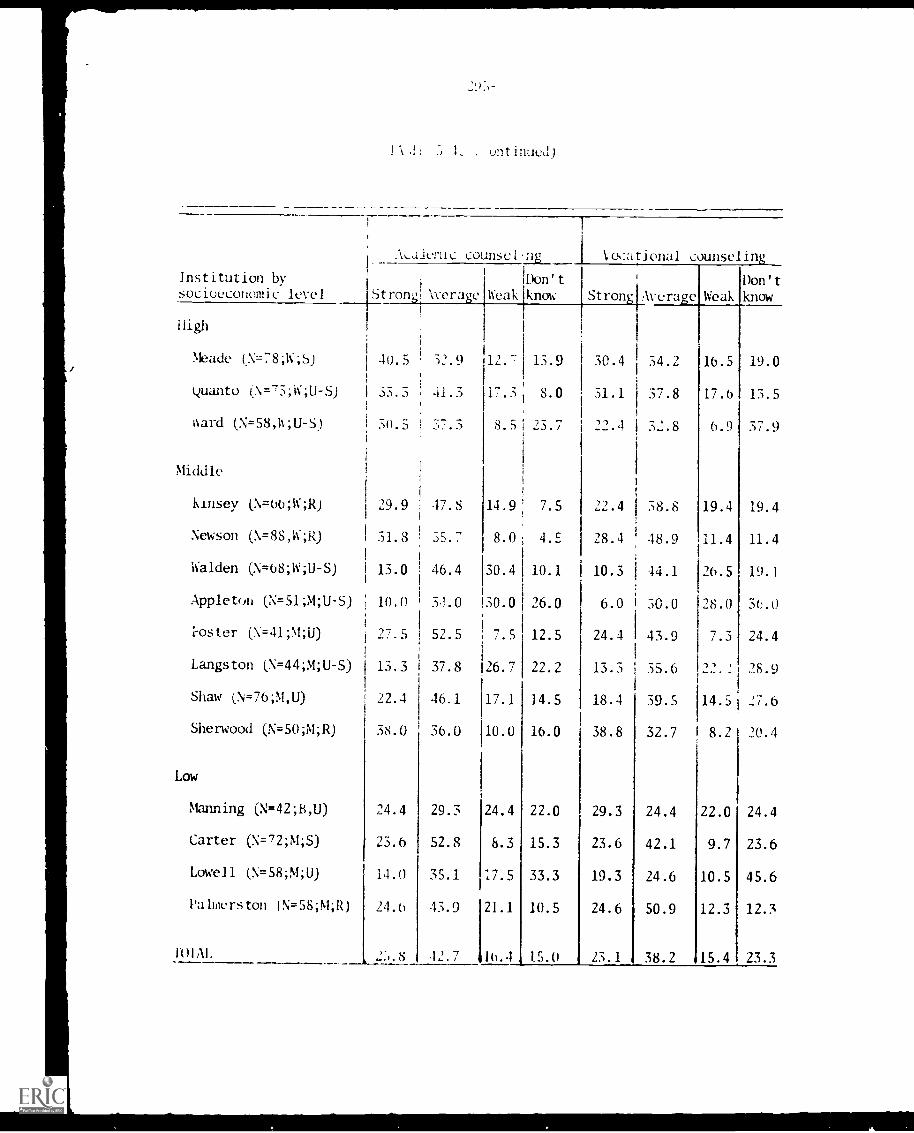
't : L .ont hued)
1
Institution bysocioeconomic level
ALdicruc counsel .no ocational counsel in
1
'Don't
Stron-1\vera e Weak know Stron Avera
High
Meade (N=78;W;S)
t.manto (N=73;W;U-S)
ward (N=58,W;U-S)
Middle
Kinsey (N=66;W;R)
Newson (N=8S,W;R)
Walden (N=68;W;U-S)
Appleton (N=51;M;U-S)
'roster (N=41;M;U)
Langston (N=44AU-S)
Shaw (N=76;M,U)
Sherwood (N=50;M;R)
Low
Manning (N=42;13,U)
Carter (N=72;M;S)
Lowell (N=58;M;U)
Palme rs ton IN=58;M;R)
40.5 1 32.9
33.3 : 41.3
30.5 .);..)
29.9 47.8
I 31.3 35.7
13.01
46.4
; 10.0 31.0
i 27.5 52.5
13.3 37.8
22.4 46.1
38.0 36.0
24.4 29.3
23.6 52.8
14.0 35.1
24.6 43.9
2:).8 12.7
Don'te Weak know
12.7 13.9 30.4 34.2
17.3 8.0 31.1 37.8
8.5. 23.7 22.4 32.8
14.9 7.5
8.0 4.E
30.4 10.1
30.0 26.0
7.5 12.5
26.7 22.2
22.4 58.8
28.4 48.9
10.3 14.1
6.0 50.0
24.4 43.9
13.3 35.6
16.5 19.0
17.6 13.5
6.9
19.4
11.4
26.5
28.0
7.3
37.9
19.4
11.4
19.1
3(:.0
24.4
28.9
17.1 14.5 18.4 39.5 14.5 27.6
10.0 16.0 38.8 32.7 1 8.2 20.4
24.4 22.0 29.3 24.4
8.3 15.3 23.6 42.1
:7.5 33.3 19.3 24.6
21.1 10.5 24.6 50.9
16.4 15.0 23.1 38.2
22.0
9.7
10.5
12.3
15.4
24.4
23.6
45.6
12.3
23.3

-296-
lABLL 5-42 (Continued)
Institution bysocioeconomic level
Job placement Financial aids
Strong Average WeakDon'tknow Strong Average Weak
Don'tknow
High
Meade (N=78,W;S) 15.4 35.9 11.5 37.2 20.5 32.1 9.0 38.5
Quanto (N= 73,W;U -S) 15.3 40.3 18.1 26.4 18.3 45.1 11.3 25.4
Ward (N=58,W;U-S) 5.5 20.0 14.5 60.0 19.6 33.9 0.0 46.4
Middle
Kinsey (N=66;W;R) 9.1 22.7 22. 45.5 12.1 22.7 12.1 53.0
Newson (N=88;W;R) 13.6 39.8 18.2 28.4 14.8 44.3 15.9 25.0
Walden (N=68,W;U-S) 14.5 37.7 15.9 31.9 10.4 38.8 11.9 38.8
Appleton (N=51,M;U-S) 4.0 24.0 26.0 46.0 7.8 17.6 27.5 47.1
Foster (N=41AU) 9.8 26.8 12.2 51.2 19.5 24.4 17.1 39.0
Langston (N= 44;M;U -S) 6.7 28.9 26.7 37.8 4.7 23.3 32.6 39.5
Shaw (N= 76;M;U) 10.5 23.7 13.2 52.6 13.0 39.0 9.1 39.0
Sherwood (N=50;M;R) 6.1 46.9 4.1 42.9 30.6 32.7 10.2 26.5
Low
Manning (N=42;B;U) 9.8 39.0 14.6 36.6 2.3.8 31.0 26.2 19.0
Carter (N=72;M;S) 4.2 28.2 15.5 52.1 5.6 35.2 7.0 52.1
Lowell (N=58;M;U) 12.3 17.5 21.1 49.1 11.9 23.7 5.1 59.3
Palmerston (N=58;M;R) 19.0 37.9 31.0 12.1 27.6 39.7 24.1 8.6
TOTAL 10.8 31.6 17.6 40.1 15.7 33.4 13.6 37.3
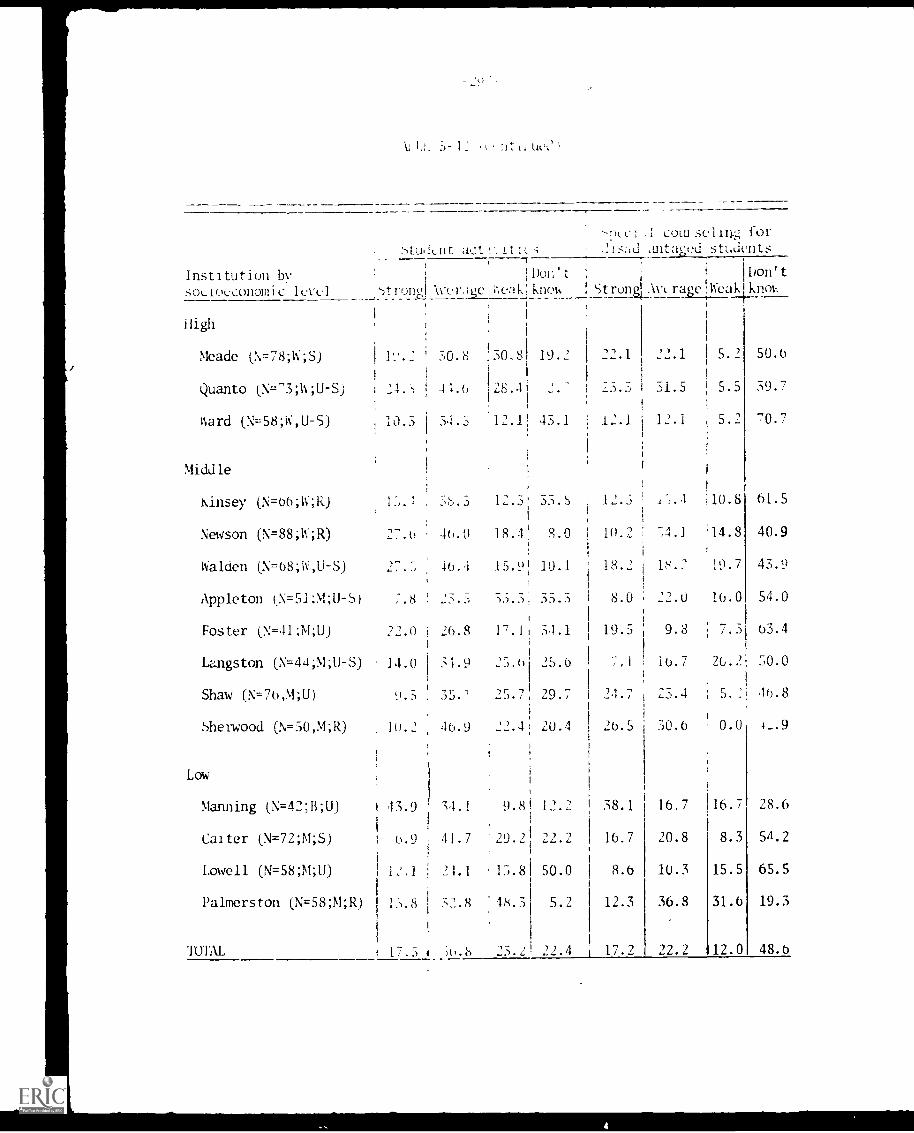
couiseIln2,4 for
stulLnt actf.itic-; ._!td antaged students
Institution by Don't
soLioeconomic level '-)troritr1 \verJge wea1.11.now
High
Meade (N=78;1;S) 30.8 !30.8 19.2
1
Quanto (N=-50N;U-S) 41.6 1 28.4
ward (N=58;W,U-S) 10.3 I 34.3 12.1 43.1
Middle
Kinsey (N=66;W;R) 13.1 . 38.3 12.3! 35.81
Newson (N=88;W;R) 27.o 46.0 18.4 8.0
Walden (N=68;W,U-S) 27.3 46.4 15.9! 10.1
Appleton (N=.51:M;U-S) 7.8 23.5 33.5, 53.5
Foster (,N=11;M;U) 22.0 i 26.8 17.11 34.1
Langston (N=44;M;U-S) 14.0 ..;1.9 23.6 '5.6
Shaw (N=76,M;U) 9.5 35.1 23.7, 29.7
Sherwood (h=50,M;R) 10.2 46.9 22.4 20.4
Low
Manning (N=42;B;U)
Caiter (N=72;M;S)
Lowell (N=58;M;U)
! 13.9 54.1 9.8 12.2
6.9 1 41.7 29.2 22.2
12.1 I 21.1 15.81 50.01
Palmerston (N=58;M;R) I 15.8 1 52.8 48.5 5.2
1
TOTAL [7.5 f ;6.8 23.2 22.4
:
! Strong AvLravelWeak
Don'tknov.
22.1 22.1 5.2 50.6
23.3 31.5 5.5 39.7
1.2.1 12.1 5.2 -0.7
12.5 I",.4 i10.8 61.5
10.2 14.8 40.9
18.2 18.2 19.7 43.9
8.0 22.0 16.0 54.0
19.5 9.8 7.3 63.4
7.1 16.7 26.2 30.0
24.7 23.4 5.2 46.8
20.5 30.6 0.0 4-9
38.1 16.7 16.7 28.6
16.7 20.8 8.3 54.2
8.6 10.3 15.5 65.5
12.3 36.8 31.6 19.3
17.2 22.2 U2.0 48.6
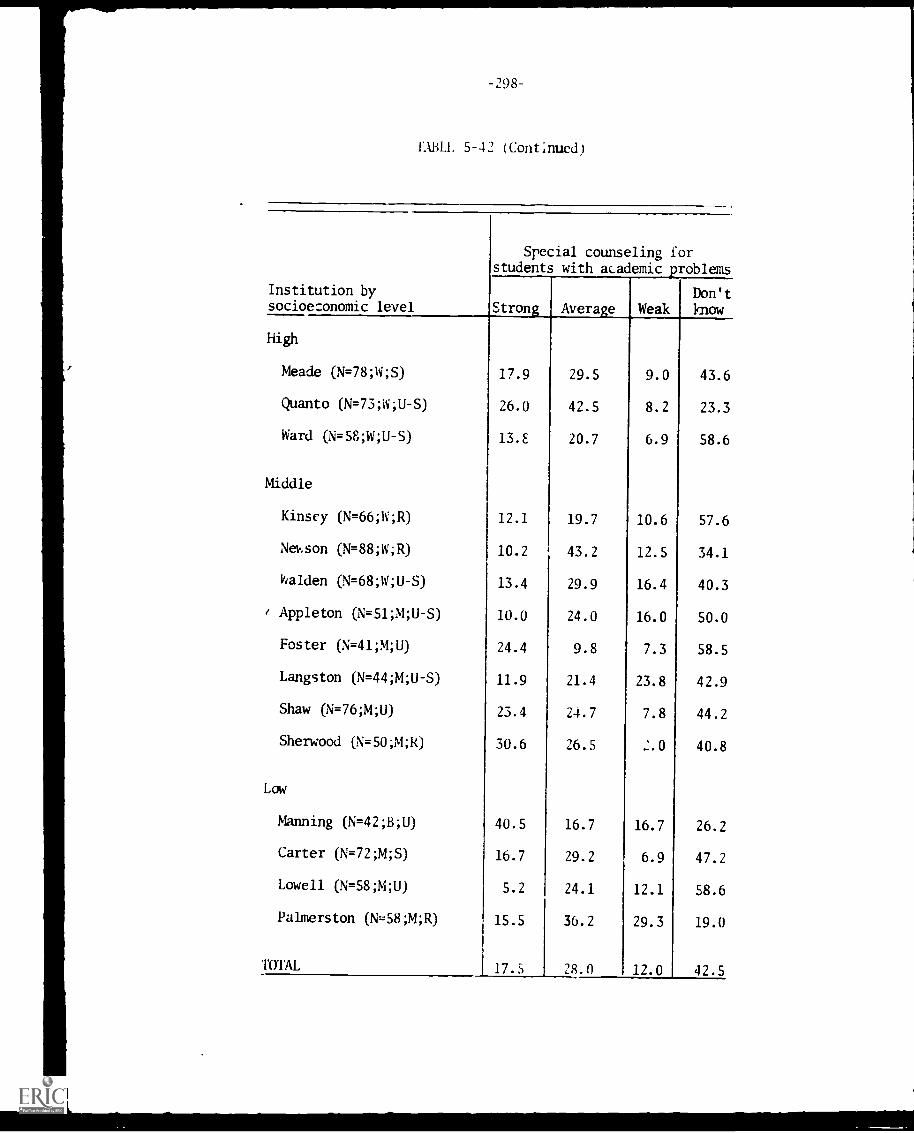
-298-
LIBLL 5-42 (Continued)
Institution bysocioeconomic level
High
Meade (N=78;W;S)
Quanto (N=73;1ti;U-S)
Ward (N=58;W;U-S)
Middle
Kinsey (N=66;W;R)
Nelt.son (N=88;W;R)
Walden (N=68;W;U-S)
/ Appleton (N= 51;M;U -S)
Foster (N=41;M;U)
Langston (N=44;M;U-S)
Shaw (N=76;M;U)
Sherwood (N=50;M;R)
Low
Manning (N=42;B;U)
Carter (N=72;M;S)
Lowell (N=58;M;U)
Palmerston (N=58;M;R)
Srecial counseling forstudents with academic problems
Don'tStrong Average Weak know
17.9 29.5 9.0 43.6
26.0 42.5 8.2 23.3
13.E 20.7 6.9 58.6
12.1 19.7 10.6 57.6
10.2 43.2 12.5 34.1
13.4 29.9 16.4 40.3
10.0 24.0 16.0 50.0
24.4 9.8 7.3 58.5
11.9 21.4 23.8 42.9
23.4 24.7 7.8 44.2
30.6 26.5 2.0 40.8
40.5 16.7 16.7 26.2
10.7 29.2 6.9 47.2
5.2 24.1 12.1 58.6
15.5 36.2 29.3 19.0
TOTAL 17.5 28.0 12.0 42.5
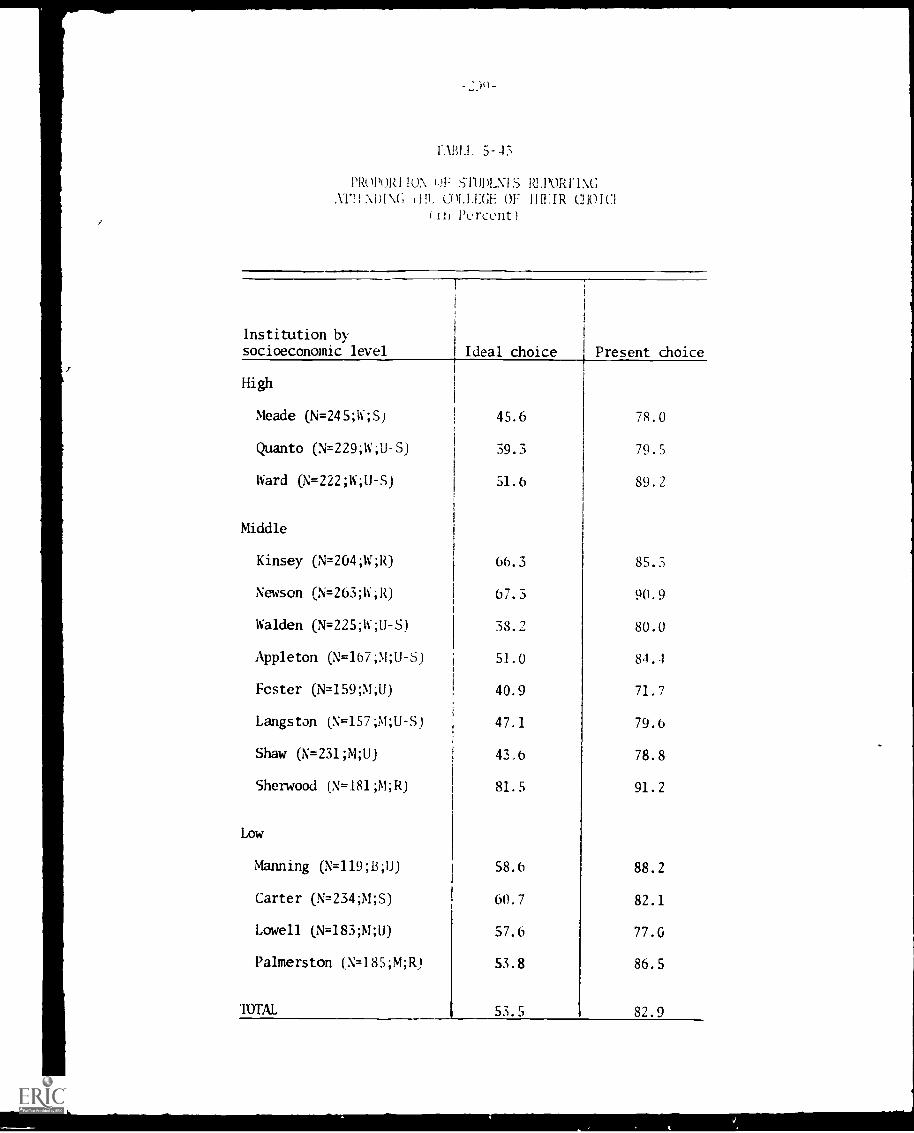
Evil" 5-43
PRopi AZ1 1O S 1L.1OR HNC,
VADI\A; 119, OF 1111:IR CHOI(1
in Percent)
Institution bysocioeconomic level Ideal choice Present choice
High
Meade (N=245;11 ;S) 45.6 78.0
Quanto (N=229;W;U-S) 39.3 79.5
Ward (N=222;W;U-S) 51.6 89.2
Middle
Kinsey (N=204;W;R) 66.3 85.3
Newson (N=263;W;R) 07.3 90.9
Walden (N=225;W;U-S) 38.2 80.0
Appleton (g=167;M;U-S) 51.0 84.4
Fester (N= 159;M ;U) 40.9 71.7
Langston (N=157;M;U-S) 47.1 79.6
Shaw (N= 231;M;U) 43.6 78.8
Sherwood (N=181;M;R) 81.5 91.2
Low
Manning (N=119;130J) 58.6 88.2
Carter (N=234;M;S) 60.7 82.1
Lowell (10183;M;U) 57.0 77.0
Palmerston (N=185AR) 53.8 86.5
TOTAL 53.5 82.9
-301-
APPENDIX D
FACULTY MARGINAL DATA
AND
TABLES TO CHAPTER 6
O.M.B. No. 51S71038EAPPROVAL EXPIRES 6-30-72
THE STUDY OF
JUNIOR COLLEGES
FACULTY QUESTIONNAIRE
MARGINALS
AND
% MISSING OBSERVATIONS (IN PARENTHESES)
Center for the Study of Evaluation
Graduate School of Education
University of California, Los Angeles
Office of Education Contract No. 0-70-4795OE FORM 2337, 11/71
=3c-,s -305--
1), If ( ,,11, 1,
1..1 keel, r in 1,1.1., .1. . trt,, 1 I L.! t
-tt t t t Tltr t 01,"`11111% tI;et I LI I 'tt III, t 1w, it Itiltt Of c t for e Stu t ' c,,t 1.111 r .
. 111, N. it I Center I t I v , )!1,, I l'It 1'1 11 11,11,11 ta'ned +t 11, 4 4.1 1 I .0(1, fl, -
II t 1, t .: tIlit Ill it If 4 11,r1
11.111A t 111111.11, t,. t t1111ill t, 1)11, M., 11o1.111,1., r u Mill 1,, 111.011, 1
1,11-1111 n Ma 111111111111./111,111 11',11,1"1,11111, II, ' n If 1111 1, 1, r 111, t I II1,1 ft 1111, t .1, u ..,11. -.In I, I Oil'
I' 11. 1, I OIL,. .t 11 III 11 'III 11 II 11., 1 PI 1
11 I 11 ,.111,, an! It it r, W II ',II. ; i't ; Itn. 11,11, 1 1,,
1 1 ) 1 . , , 1 1 1 1 1 , , , , 1 1111, ,4
. llht 11 \ Oa 11 ',III 1,11 11111, 'it, -1.,1111 tr, , I 1.1 it'll %.,111" 1111 i11(4
)1, NI, 1, 1,,11111, r It I ; I. 1r.t nIt11, 1, 11,,
tt, r1t t 1,11 III, 111 1111 1, 'tall 1' '11 1 11111, I If It, I1 'II 111. 11/1, .11,.
1111. t 11114 111,, S, II, 1 I 111"S Si III,. 11, 1, '1,111, :1 1, t111, ,11 .111111re.0,114 f rf,S 111,111%1'W I. 1 111, ,I1,, .11,1111 III. n -I .111,111
1A, ",111 1111, II 041 11 11 I 1., tit. 11111'1,I II, 1114 \%111 I1( ft '1 111,, ,11 1I II., ; 11111'1'a.
S k . rill t . . i i r , . r r, tul : t , t 1 I I I ..0 ilt II ;III,111Ill I It 1tt ITO, : 11, 1 I. e ta;,, seinadole
1; ,I1111, I, (1'1 (III, -410111111ft ,
1,111. Ti I r ,
James 1v, l .e,.I o :
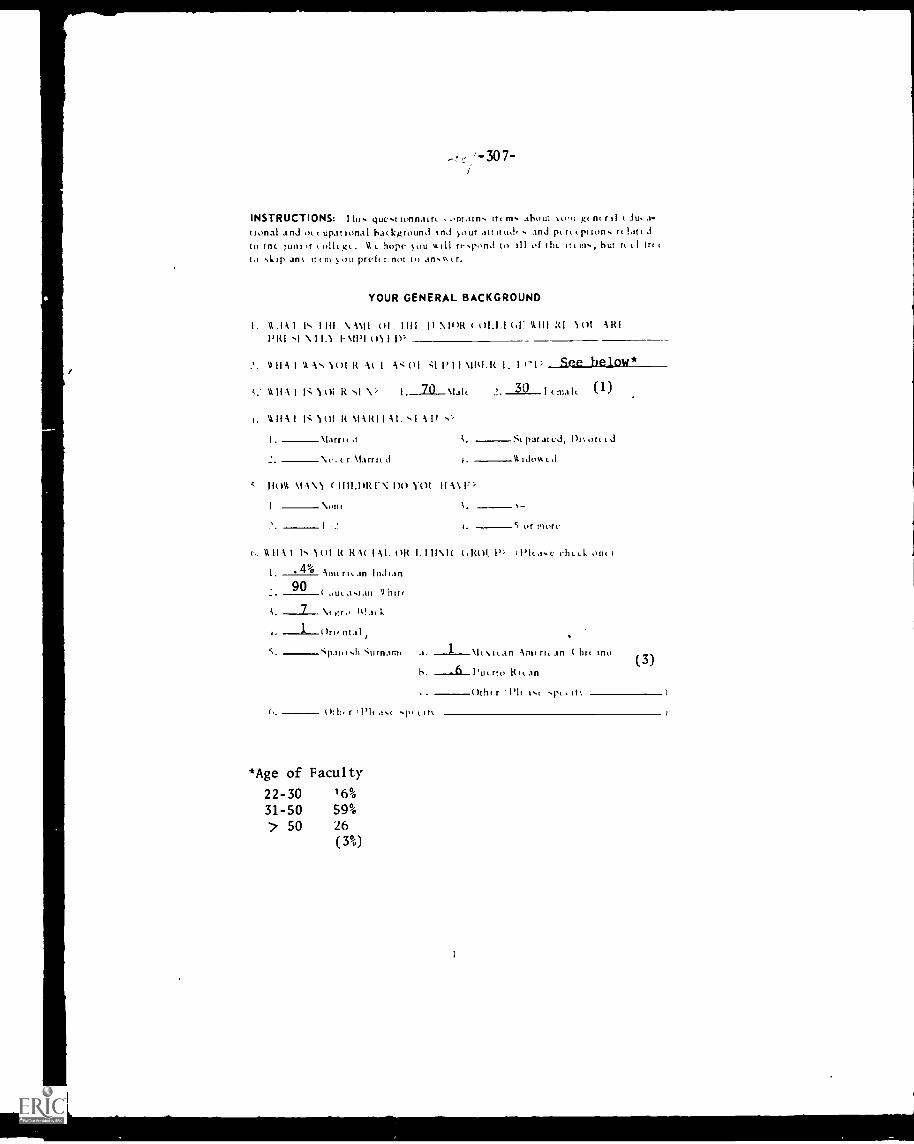
-307-
INSTRUCTIONS: I his quest tonnairt .,ntains arms about ,.,"n gt nt r tl t du. a-tional and ot upational background tnd your alt Lid, s and Nt tpt ions rt Ian dto tnc tuns,r ollt gt t hope you till respond to 111 o(tht itt ins, but rt t 1to skip an atm you r not to anssxtr.
YOUR GENERAL BACKGROUND
I. CIA I I' 1 111 \ 01 1 11 1 II N1OR ( O1 "1"1 III RI 1 01 iRII'RI sl \ 1 I h \Il'I 01 i IF"1
11 1 'A As 1 01 R 1 1(t1 q I' 1 1 \MLR 1. 1 r below*_See
11 1 1 1 l 01 R I 70 \tali 2. 30 i imaii (1)
I. I 1(11 R MARI 1-11. 1 -M d
\c.cr Marra d
110A \IA\ 1 ( 1111.1/RI \ DO Y01. 11 \ 1')
\oni. ;I '
Siparated, Ihtorttd
\1 tdowcd
S ur Or
11A 1 Is 1 01 1 Al. OR 1. 1 11\ 1( (.1(01. 1" it'Icase chctk on(
1. 4° Aim ric an Indian90 \lint(
\ k
1 On, ntal
S. ifi .11 'urnarnc t 1 an Aniaric an ( hit in°
h. Put rto Rican(3)
0th, r Plc isc spc. it c
h. 0.11 r 111( as< sp. tth
*Age of Faculty
22-30 16%
31-50 59%
50 26
(3%)
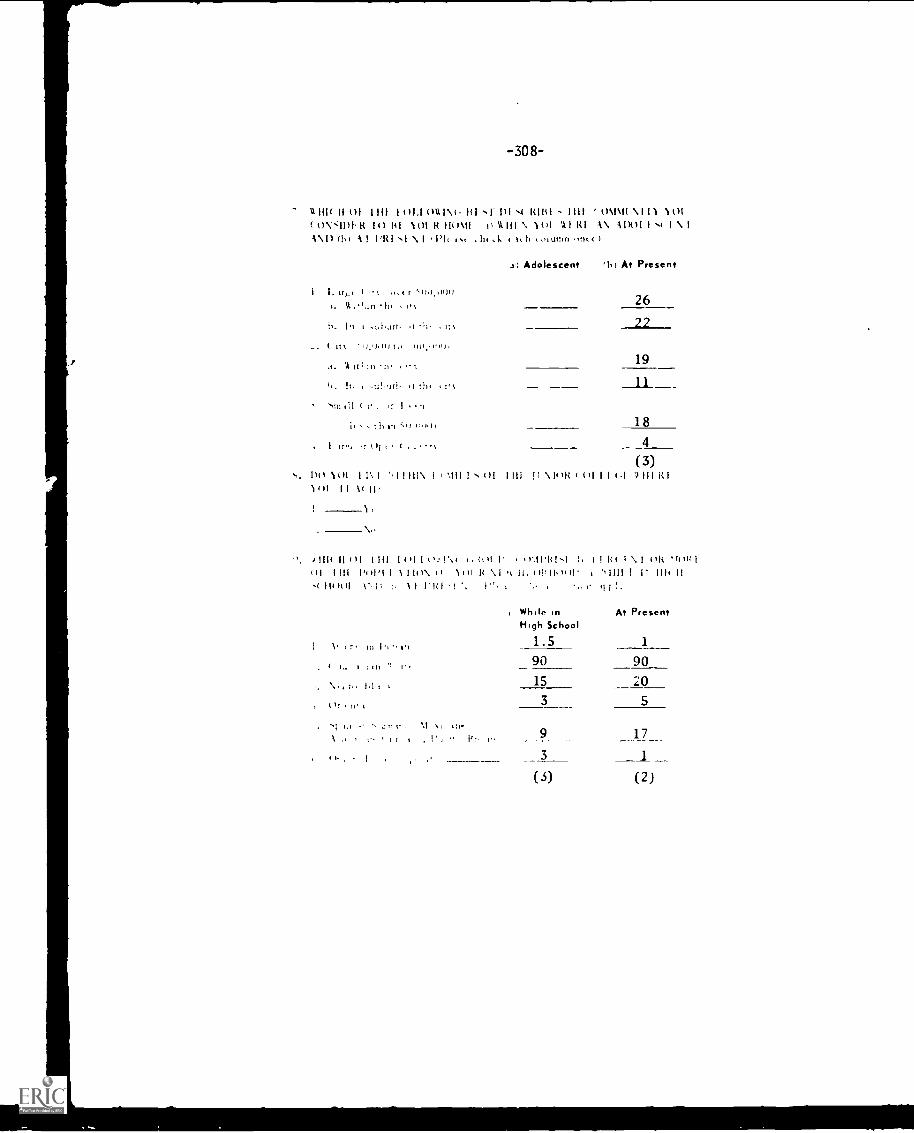
-308-
11 1 1 1 ( II 01 1 1 1 1 1 0 1 . 1 ( ) U 1 \ ( 1 4 1 1 1 1 1 { 1 1 1 1 1 1 1 1 ' \ 1 11 101( N:11)1-1( 1(1 111 101 11 11(1\11 1) 11111 101 RI A\ AIX)! 1 I I \ 1A\ 1 ) A l PRI 1 \ I t 1 S t t 16. 11(117,11 (
.t; Adolescent (h) At Present
26
22
19
_
18
4
(3)1)1) )01 11%1 '.11111\ I 1111 1 (/1 1111 H \ /R I Ill I %) III RI14)1 I I 1(
III( 11 I)! 1111 1 (III ;, 1 I RI I 'loop I
i)1 I III Ill)1,1 I \ "I i*
'4 III 1'11 t iI 1' R 1 ! 1" I . t !.
1 u, 1.1'.
o o ;on 'I I
11
`.1 N: I:1-
. o. 1 I
Whole in At PresentHigh School
1.5 1
90 90
15 20
3 5
9 17
(3) (2)
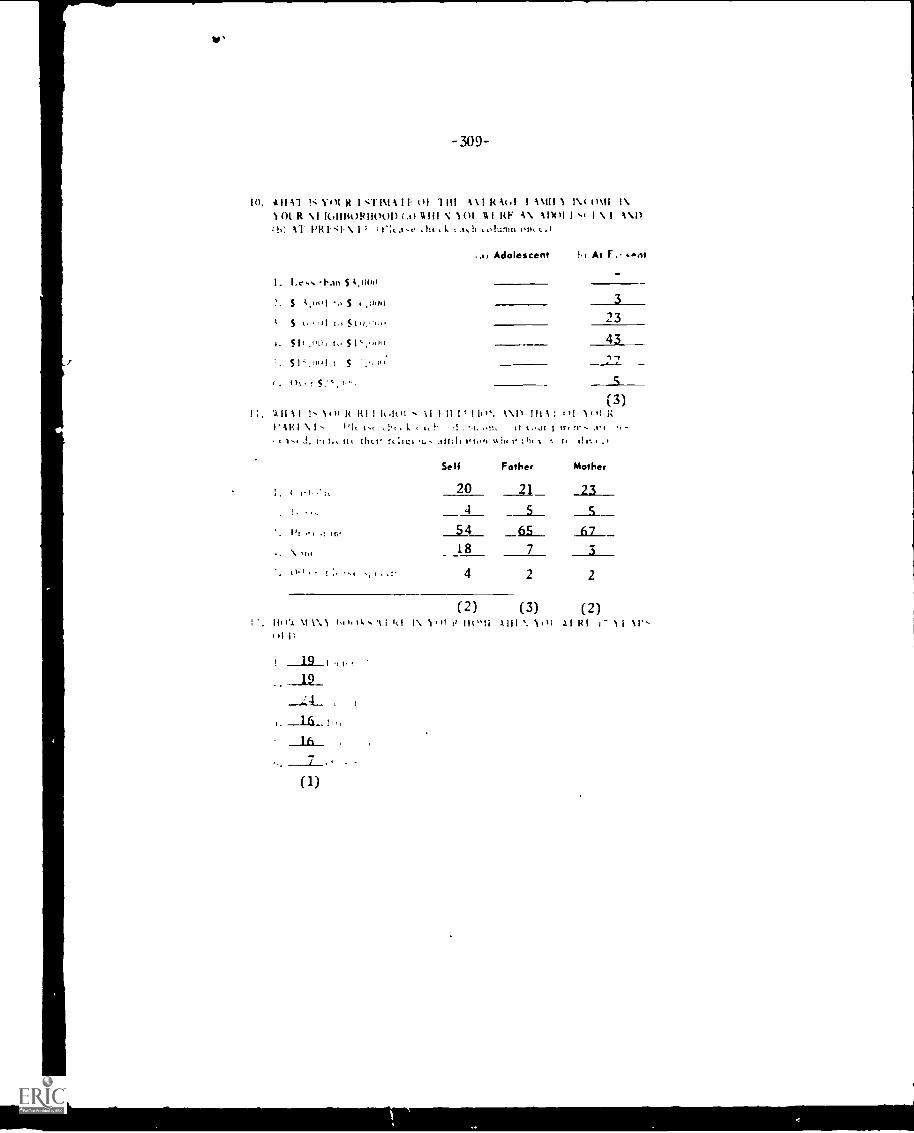
309
ID. JIM N R I 1-imA11- 01 1111 AA! RA(.1 I AAIII 1 IV 011I I\101 R \I 10111401+1100D (.01111 \ 101 11 RI: A\ 11)01 I 't i \ I 1 \I)th) AT PRI"..1- \ I tht,h :ALI) tolumn on' e..1
I. 1-e F.m 5 4e.1100
!. S k,001 5 ,00.)
Al Adolescent hi At F.- ,..at
3
s r1 5,,,..,, 23
,. , 43
S
(3)!;. A I 1,101 R RI I 01 -' Al II !lo'. A\ I) MIA .); 1111 is
\ k 1, I- '41. :1, It lut I Ire .re ,e -
is J. VI elide tel,n v r. 111..1.1
l'r in.
Self Fother Mother
20
4
54IS 7
4 2 2
Ile *.e 11 1 \1 111, I\(II
)1(2)
ii("11(3) (2)
1111% 101 11141 I- 11 11'
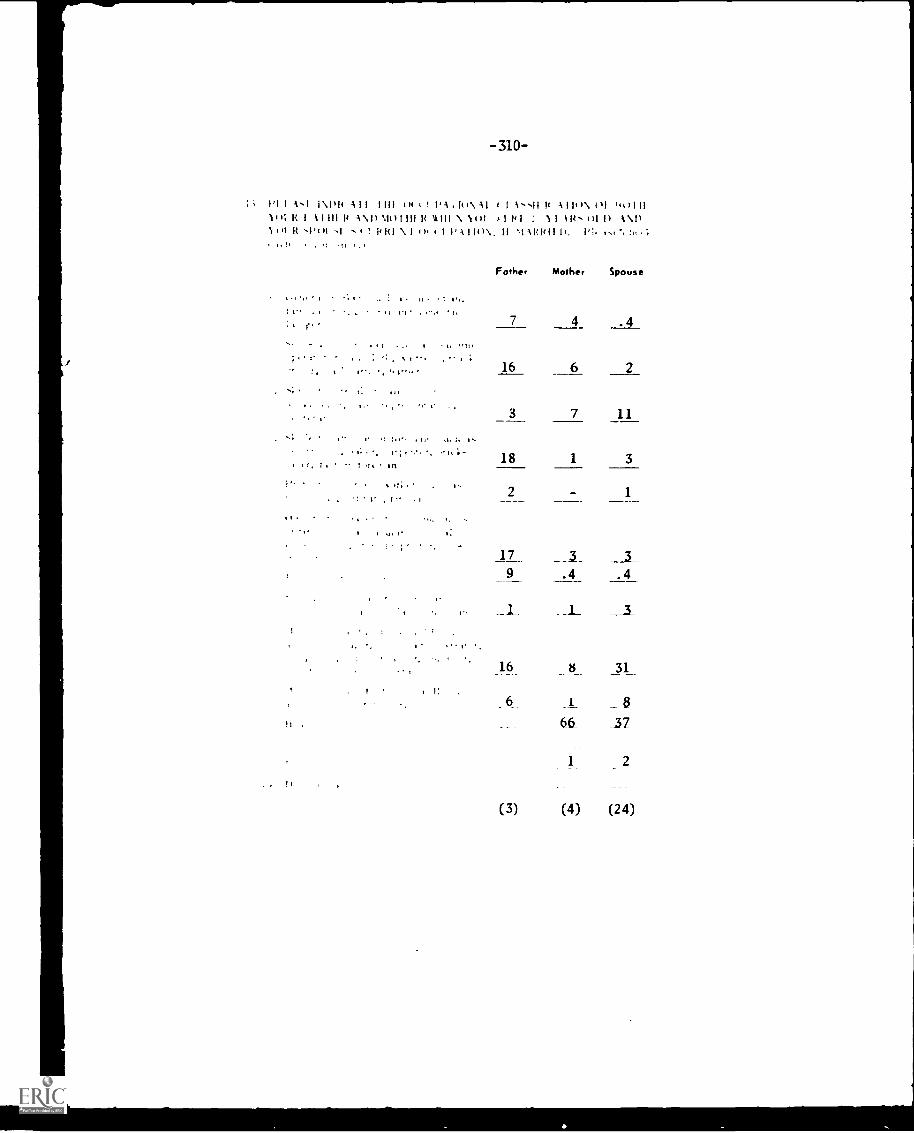
310
PI I AI iN.1)I( All I lll 4)( i ! PA .14)N. Al i I 1 .-11 It A I It N. (II 1411 ll1111 1< I 11111 It AN.I) `.14)1111 k 11111 N. It II 1 I III : 11 lit' ill It %N.FI
1111 R .1,11I .1 NI ! PHI \ I I). ( I PA 114)\.. 11 %1Altitil 1). P.:. I, ', !I ;
lI 1: '
.,
1 I - : 1,,
It ,,11,
Father
7
Mother
4
Spouse
.4
16 6 2
III
3 7 11
:-. 1 : :,, In 18 1 3
, I,2
9 .4
1
.4
_I___
16 is
_3
31
1 I I:6 i _$
66_ 37
2
. II
(3) (4) (24)
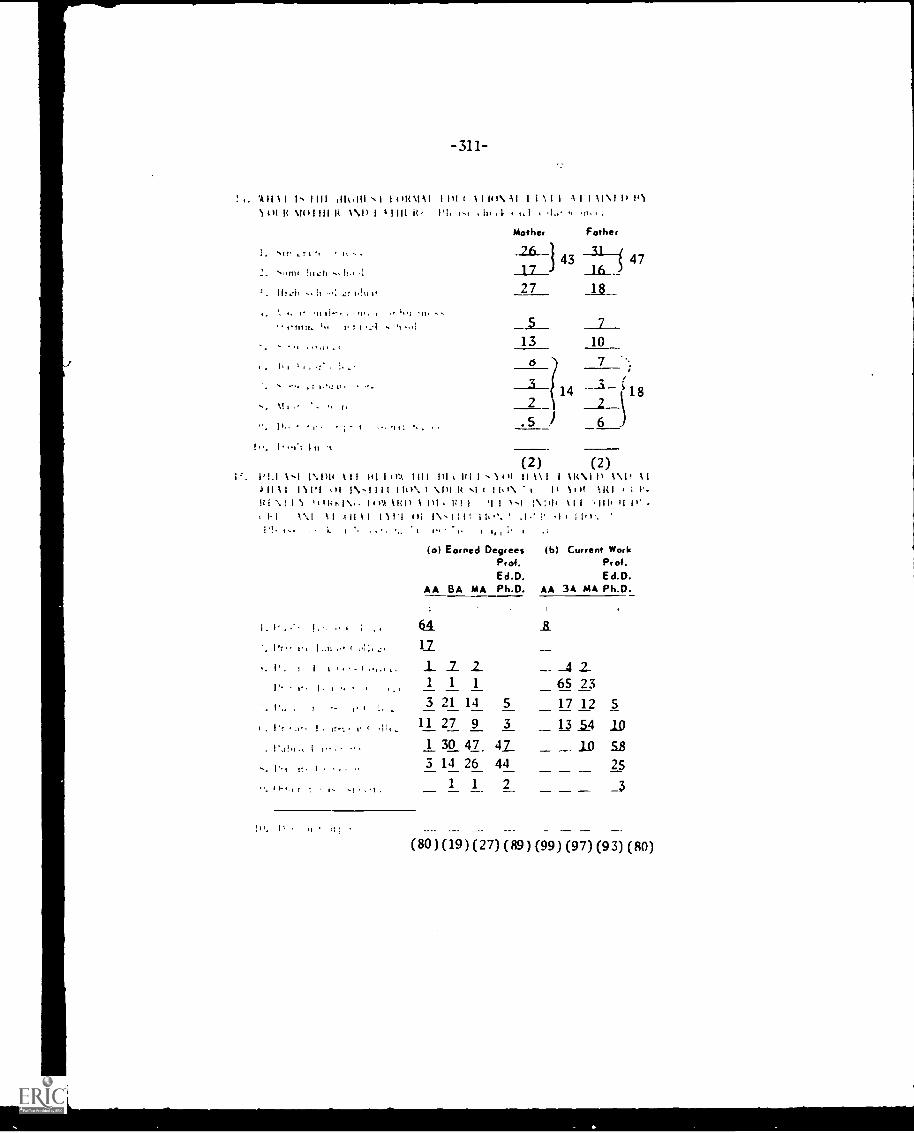
-311-
'01111 I 1, 1111 .11,111 "1 I ()14%1A1 Hit I MU\ 41 1 1 `, 1 1 11 111\111 1k11011( 111/1111 It 1\11 I 41111 P!! !it , i f 1.1 1 11 .
Mother Pother
1. stt !!
.,,Ix Ineti h.! 1
1111f1.. l 1 N 1` , +,f,
1,1 :. WO
N. 11! r.
!. 1 ' 1.1 In
1 43 31_
47
27
13 10
6 ) 7 -.;
14 x`'18.5 ) 6 .
(2) (2)1'1.1 11 1\1111 111 111 1 tVoi 1111 111 t 111 1 ,1t11 It '.3 I 110.111 1\11 11011111 111'1 III 1V-1111 1111% 1 \111 14 I 1141\ 11 1111 11(1 1
141 `N., 11 '.11KI's.. 1 t/Vt 11111 1 1111 1:1 1 'I I 1,1 1\1$1, 111 ''1114 11 11' -. 1.1 1%1 t1 _1111 111'1 oi - ; I" 1110, ' .1 ; '
1- .)
(a) Earned Degrees (b) Current WorkProf. Prof.Ed.D. Ed.D.
AA BA MA Ph.D. AA 3A MA Ph.D.
1! 1..11 .
1' 1
.1, ! .
1 '.! !!, 1
;$1 1: 111
1 1_ 2_ __4
1 1 1 65 233 21 14 5 17 12 5
11 27 9 3 13
1 30 47 47 10 SS
3 14 26 44 25_ _
(80) (19) (27) (89) (99) (97) (93) (80)
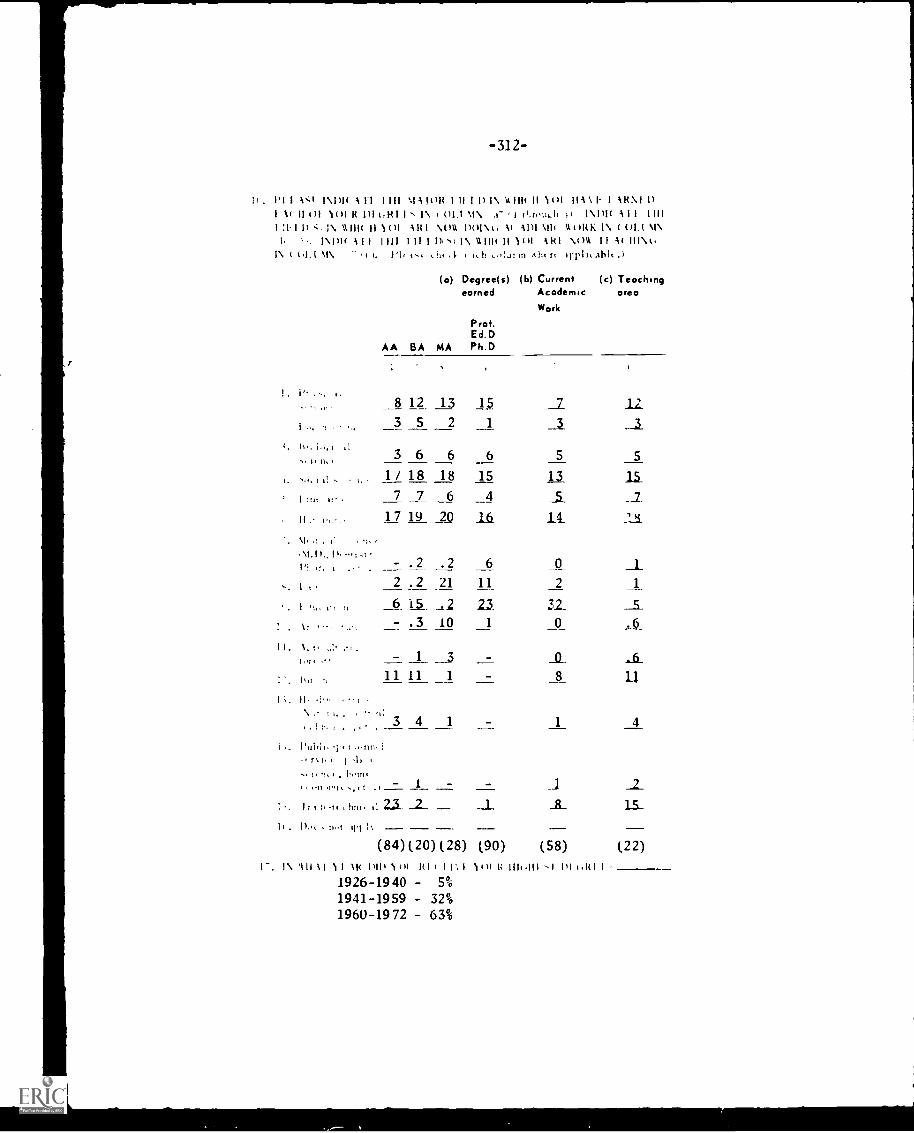
-312-
1, . I'I 1 A'0 I \111( A I-1 1 111 MA loR I II I 1) i% t Hit II 1()1 1 111 I- I ARN1 I)I 1( II 01 )(II 14 1)1 t,141 I , I\ ( 01.1 11N. .1" ' 1 ii.r.illi-il li I\ Di( AII 1111
I :I- I I) ''. I\ 1111( 11 1O1 )1 AR I \OA 1)01 \ 4, 1( AM %III A OR 1: 1 \ «)1.1 11\1 "--, 1 \ DI 4 A 1 1 1 1 1 1 J i l l IINI 1\ 11 1 II( II 1()1 AM \OW II A( 1 II\ 4,
IN. ( ( .1.1 11'1. '1 /. Ili 1,t tilt 4 I t lkil ,01..111n Allt rt Irli,..thlt .1
(a) Degree(s) (b) Current (c) Teachingearned Academic area
Work
Prof.Ed.D
AA BA MA Ph.D
8 12 13 15 _I 12.3 5 2 1 8
15,, i,,,A
.... ll I. < _3 6 6 6 5 5
-..,. ii - ,, 1/ 18 18 15 U _Li
1 :(1( It . 7 7 6 __4 _5_ __2_
17 19 20 lk It 2._s_
11, .1 , i' ,, -1,
Pi i r I ... .2 2 6 __I-
-. 1 i 2 .2 .21 11 2 1
I 't., 1'1 <I 6- a_ ,2 23 32_
1r , I., - .3 10 1 0 .6
H. \,: .7 .i,<1., -''' 1 3 - __0_. -6_
I' h. t, 11 11 1 8 II_II.
N..- . I, . .,:3 4 1 - 1 4
, , i ,. . , ,,____ ____
1%1141, -i'l I .111111 i
.., I I., . 1,,,,n,
11, W.1 l ` , ( 1 . 2 1 -- _2_
i ,. h , :, -I , .11111, i 113_ _2_ __I_ ...fl_ L.S_
II . 1).,, , 1114 111 l', -- --- - _(84) (20) (28) (90) (58) (22)
1 -. 1\ '11111 1 I 11( 11111 1,11 111 ( I 1% I
1926-1940 - 5%
1941-1959 - 32%1960-1972 - 63%
)()I 14 Illt.111,1 III (.1(1 I
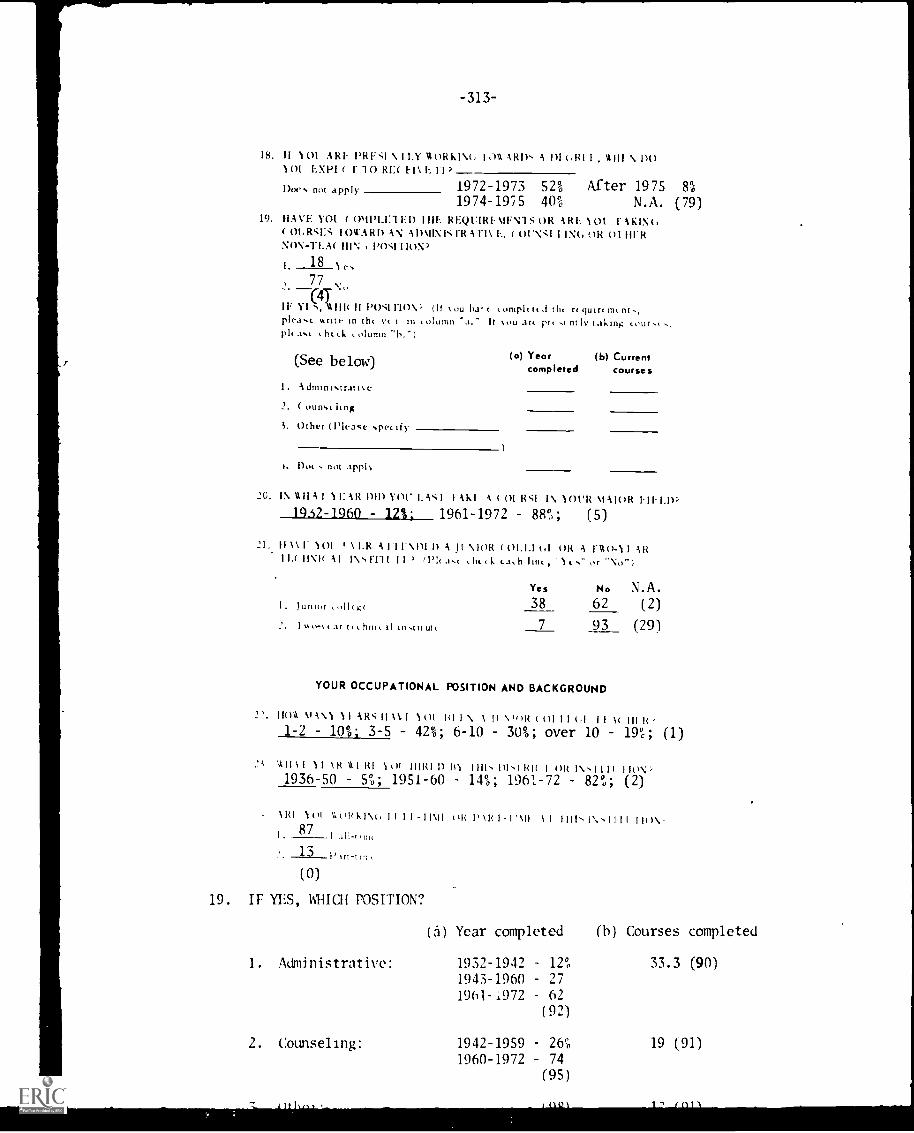
-313-
18. II 101 ,ARE N. 1 1.1' 10RKIN.(, AHD', A DI , ulli N. DO101 EXP1 t r Rr( E I\ 11,
Dues nut apply 1972-1973 52% After 1975 8%
1974-1915 40% N.A. (79)19. HAVE l'01. 0\1131.1:1 II) 1HE REQUIRE MEN1S OR ARE 101 AKIN('
( ()MISES I OWARD AN ADMINNI-R A 1.111-., 01N'A I INC, OR 01111KNON-TEA( Iii`. 110',,F1 ION)
L 18 1,77
TIF VI ("I11111 II 130';',11.10V, (It %cm ha. e complr re .1 thi. re (mut mc
please u.rtt to the vet in column 'a.' It ,ou are prr nth. taking Lout...,chick olumn "h."
(See below)
1. Admini,tratil.e
2, ( ounst ling
i. Other (Please specify
t. Dot nut appk
(a) Year (b) Currentcompleted courses
20. IN 111iA 1 1 I: AR 1)11) you I. As I I Aid A c 01 R'1 IN. 101'R MAJOR 1.111,1P1952-1960 12%; 1961-1972 88%; (5)
21. 11 1\ 101 1 11.1( Ali ENDI D A 31 N. IOR 101.1.1 01 OR A 1-110-1 I AR11.1 11\11 AI INN ni I I I > (Pk J., .htcl. cai.h lint, '1(..." or "No-)
I. Junior college
. I N L brill tl 111,ilttn(
Yes No N.A.38 62 (2)
7 93 (29)
YOUR OCCUPATIONAL POSITION AND BACKGROUND
2 2 . 11(1A MAN.\ 11 AV, 11 AN 1 l of R1 I N. 1 11 Volt t 01 I I til I I 1( Ill 12'1-2 10%; 3-5 42%; 6-10 30%; over 10 19%; (1)
'1111 I 1 I IR \II RI 1O1 11110 D 111 1111s Oh,' 1111 I OR I ION'1936-50 5%; 1951-60 14%; 1961-72 82%; (2)
I 110 101 V.(1111\1\(, II II-I DM
I. 87
13
(0)
(11.; \ I . I 'MI 11 1111-, 1N.,111I 11(1N
19. IF YES, MICH POSITION?
(a) Year completed (h) Courses completed
1. Administrative: 1932-1942 12% 33.3 (90)
1943-1960 27
1961-1972 62
(92)
2. Counseling: 1942-1959 26% 19 (91)
1960-1972 74
(95)
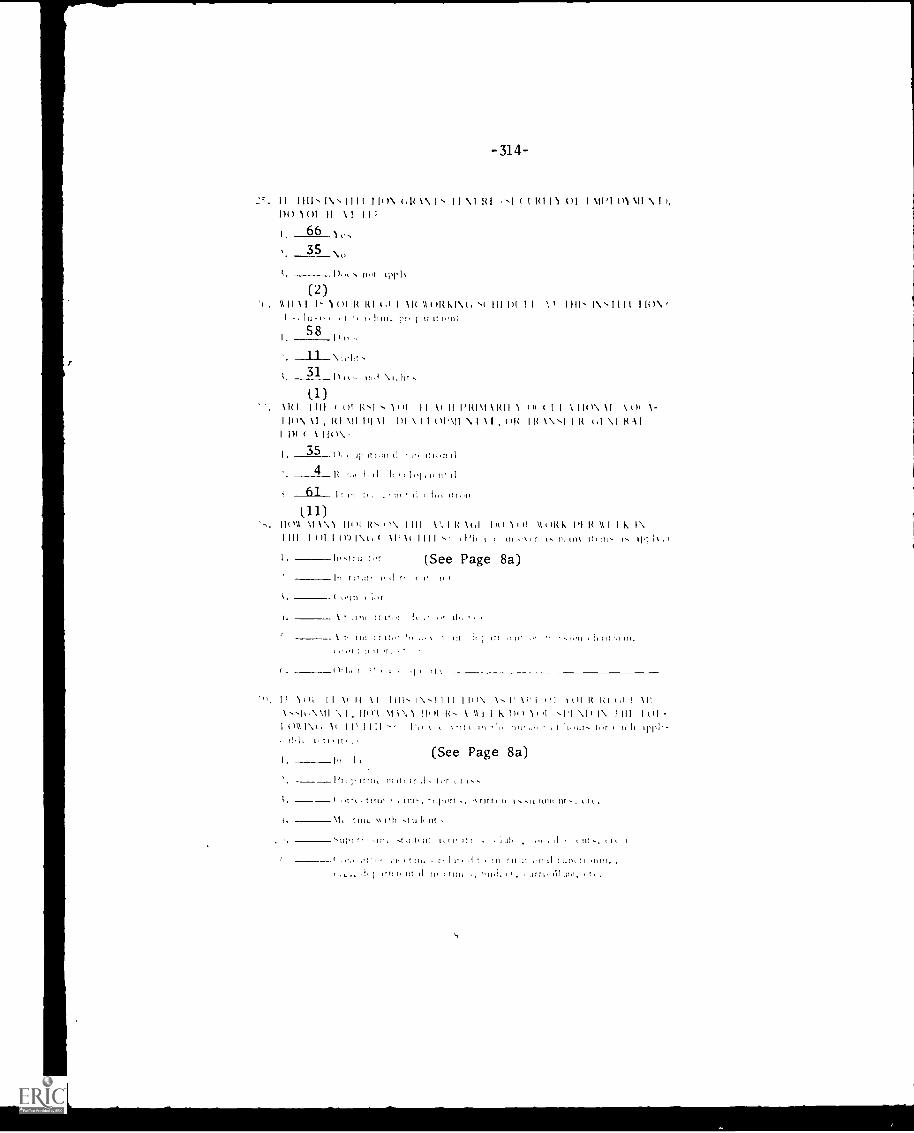
-314-
II HI' I\ ' 1111 110\ 1(1( \\ 1`, II \I RI 01 ( RI 11 01 I \11'I \11 \I 1,1)0 101 II \ 1 II
66 9,,
35
!WI IIT1\
(2)UII \I I. 1111 It HI 1.1 I \H 011.k1\ lt
1 lit it 1, hitt_ rr l tr a II1)58
I)
\31 1)(1., (1,1 \ IA(
III 1)1 I I I I I II 1 I IoN.'
(1)\Itl 1111 ( II \ ( II PIM' R 1 1 ) 1u ( 1 1 110\ 1 I 01 \-I 10 \ 1 1 H I \ I I 1 )1 1 1 DI \ I 1 ( 1 1 . \ 1 1 \ I 11 1 R 1\ 1 It (.1 \I RAI
1 PI ( \ 110\
I. 35 'III Itt, 11 11 1(1,1111
4 (1 It I oi .rit tit
61 I. 11
110`), ),1)\1 11tH R, 1 )(,1
1111 1 111 I (V)1\t.1 11'1( 1111." .1'1(
I.
III I I, III I,
t ,,r
1,0 1111 \1(11(1 1'1 H %II 1 k I\
(See Page 8a)
.Iit 1.r o..: II, ,
lIt 11,1`11.,
.1. II
1
I.
\
:
t
)( II1.
II tI
1'
)1
1111
.1,
t
1111,
\\
It -1,11
-1. it()II.,
)();
0A1\(.
11
\\(
1.1
I\,1111 110\ \. 1. )1.i (It )(III( 10111)1 H. \ kilt) 101 ,1,1 \l)
I tilt it nu I hour-, t,,r
(See Page 8a)
(.11
,11
\101 -,h1,1.-
Dr. r ri it, :1 11, tor 1
--I or-, k Illt , r port , rut t l-,1, 1.t,.
\It I -(1.1
-Ili, -4,1 I, s, t t it:, lit t,
tn, r. 1 It t.$ in I 11:h
It! II lit 11 III t 1.,u,{, t , 61,10, t.,
ti
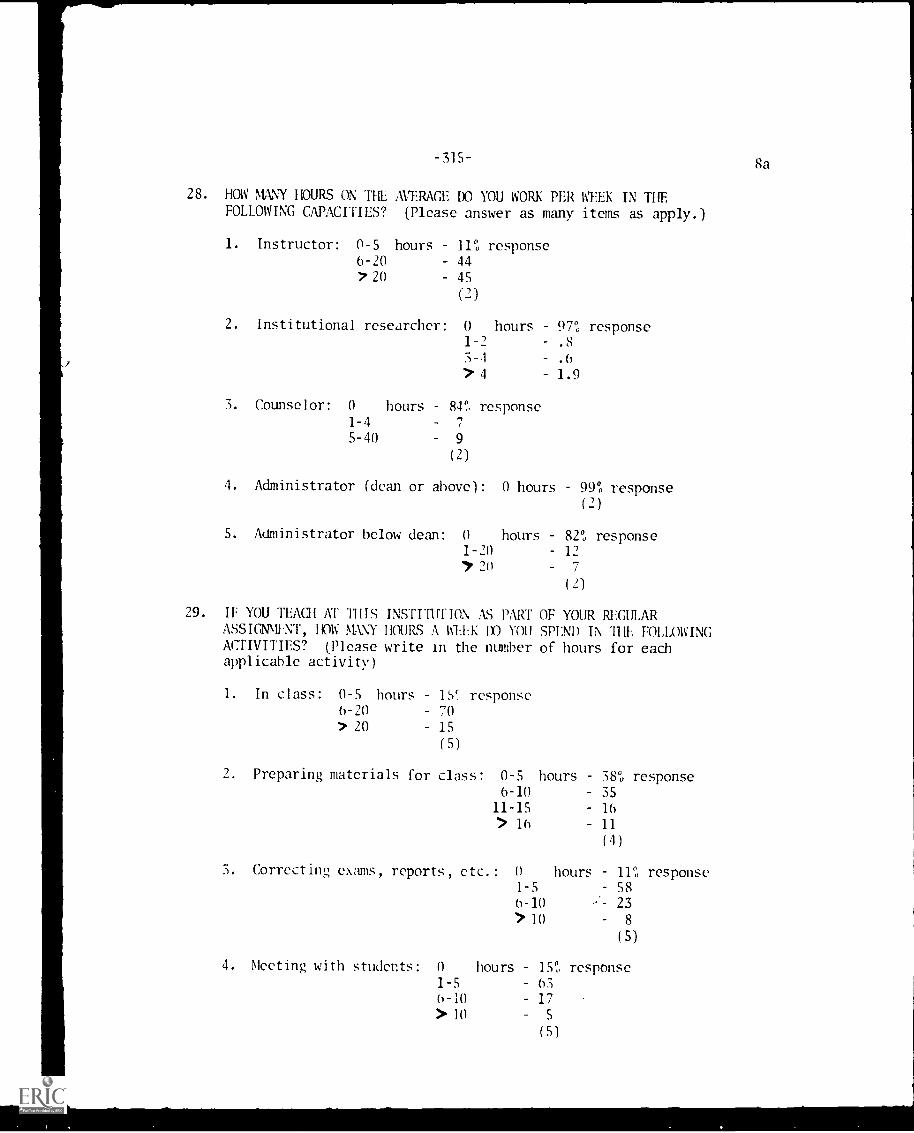
-315-
28. HOW MANY HOURS ON THE AVERAGE DO YOU WORK PER WEEK IN THEFOLLOWING CAPACITIES? (Please answer as many items as apply.)
1. Instructor: 0-5 hours 110 response6-20 44
720 45
(2)
2. Institutional researcher: 0 hours 97°, response1-2 .8
5-1 .6
>4 1.9
3. Counselor: 0 hours 84" response1-4
5-40 9
(2)
4. Administrator (dean or above): 0 hours 99°0 response(2)
5. Administrator below dean: 0 hours 82" response1-20 12
20 7
(2)
29. IF YOU TEAM AT "mrs INsTrrunoN AS PART OF YOUR REGULARASSIGNMI'NT, HOW MANY HOURS A 111:1 DO YOU SPEND IN 11IL FOLLOWINGACTIVITIES? (Please write in the number of hours for eachapplicable activity)
1. In class: 0-5 hours 1S' response6-20 70
7 20 15
(5)
2. Preparing materials for class: 0-5 hours 38° response6-10 35
11-15 16
> 16 11
(4)
3. Correcting exmns, reports, etc.: 0 hours H response1-5 586-10 ;- 23>10 8
(5)
4. Meeting with students: 0 hours 15", response
1-5 636-10 17
) 10 S
(5)
8a

-316-3b
5. Supervising student activities: 0 hours 80% response1 9
11
6. Committee meetings related to institutional functioning: 0 hours j0%
1
0 hours 30% response1 25
2-3 29
> 4 16
7. Activities involving professional teacher organizations:
0 hours 76". response1 16
>2 8
8. Administrative duties: 0 hours - 79% response1-10 14
> 10 7
(1)
9. Other teaching related activities: 0 hours 82% response1-5 14
> 5 4
(5)
10. Other non-teaching duties: 0 hours 88% response>0 12
(5)
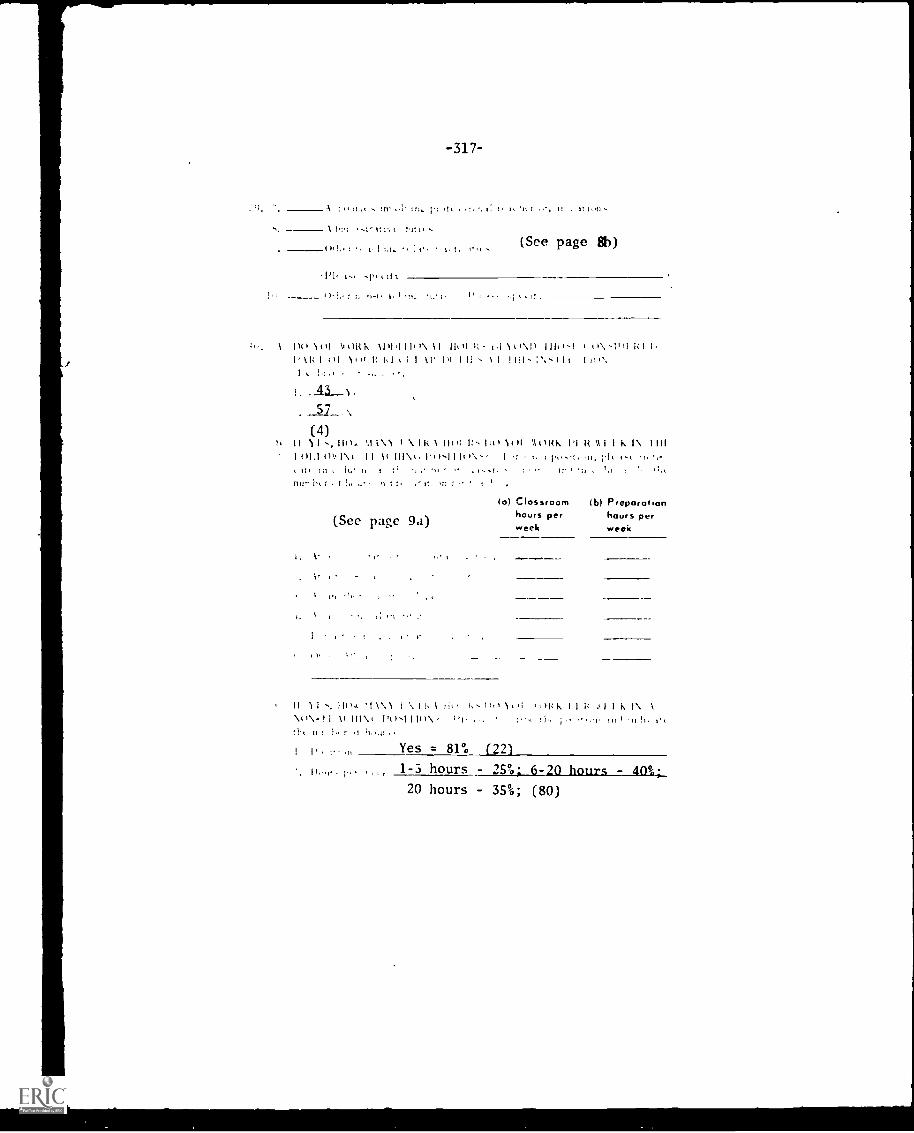
-317-
111,. I`; 1, I, 'IT , It 1.,11
A 'Vol Itr.t(See page 8b)(0... I 1. 1.1, l'1t
1)1, v., It I
; 'II. -
\ .. t I I \ I I I I I I 1 0.\.1) I I I O -RI to 1111 1.; 1,1 i. ill I , 1 I ; ;If, r,11;
43
57 s,
; ,
I II I`
(4)I I I \ I \ I I< \ 1 , 4 ) 4 ) 1 ,Atwk pi
I 1 1 1
(I1.1 11A,, I I \I \ 1,1 I (Os ; ;,1
i t t I n , Il. t i I ,",, I 11 .. 1
(See page 9a)la) Classroom lb) Preparation
hours per hours perweek week
iV 'T I III1A I I \ tilt I\ 1111 k I I It ; I I is \\(t \-II 1t III \t I ' 1 1 , 1 I ; \ I ; , , t n , t
;11t 11; I, 7 11.,11
1' 1.1 .11 Yes = 81% (22)1 -5 hours - 25% 6-20 hours - 40%;20 hours - 35%; (80)
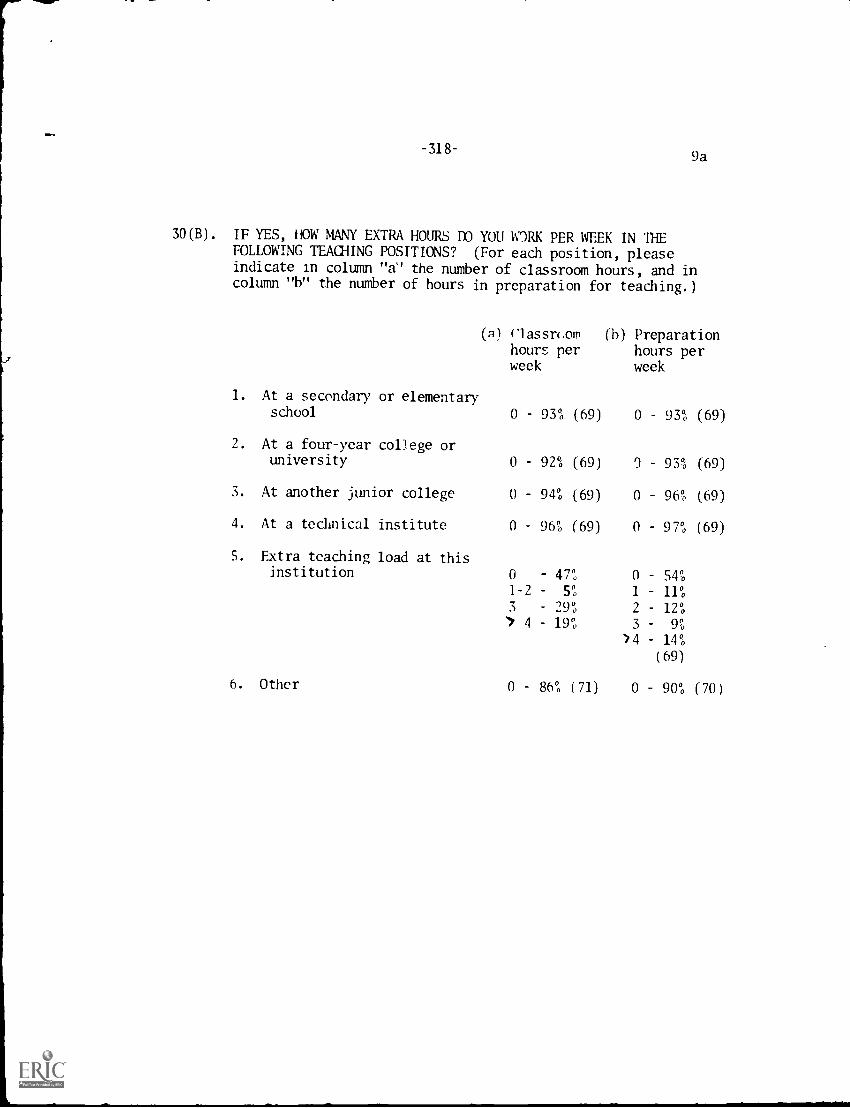
-318-9a
30(B). IF YES, HOW MANY EXTRA HOURS DO YOU WORK PER WEEK IN THEFOLLOWING TEACHING POSITIONS? (For each position, pleaseindicate in column "a" the number of classroom hours, and incolumn "b" the number of hours in preparation for teaching.)
1.
(A)
At a secondary or elementary
classmomhours perweek
(b) Preparationhours perweek
school 0 930 (69) 0 93% (69)
2. At a four-year college oruniversity 0 92% (69) 9 93% (69)
3. At another junior college 0 940 (69) 0 96% (69)
4. At a technical institute 0 96% (69) 0 97% (69)
S. Extra teaching load at thisinstitution 0 47% 0 54%
1-2 5% 1 11%3 290 2 120
4 19% 3- 9%
)4 14%
(69)
6. Other 0 86% (71) 0 90% (70)
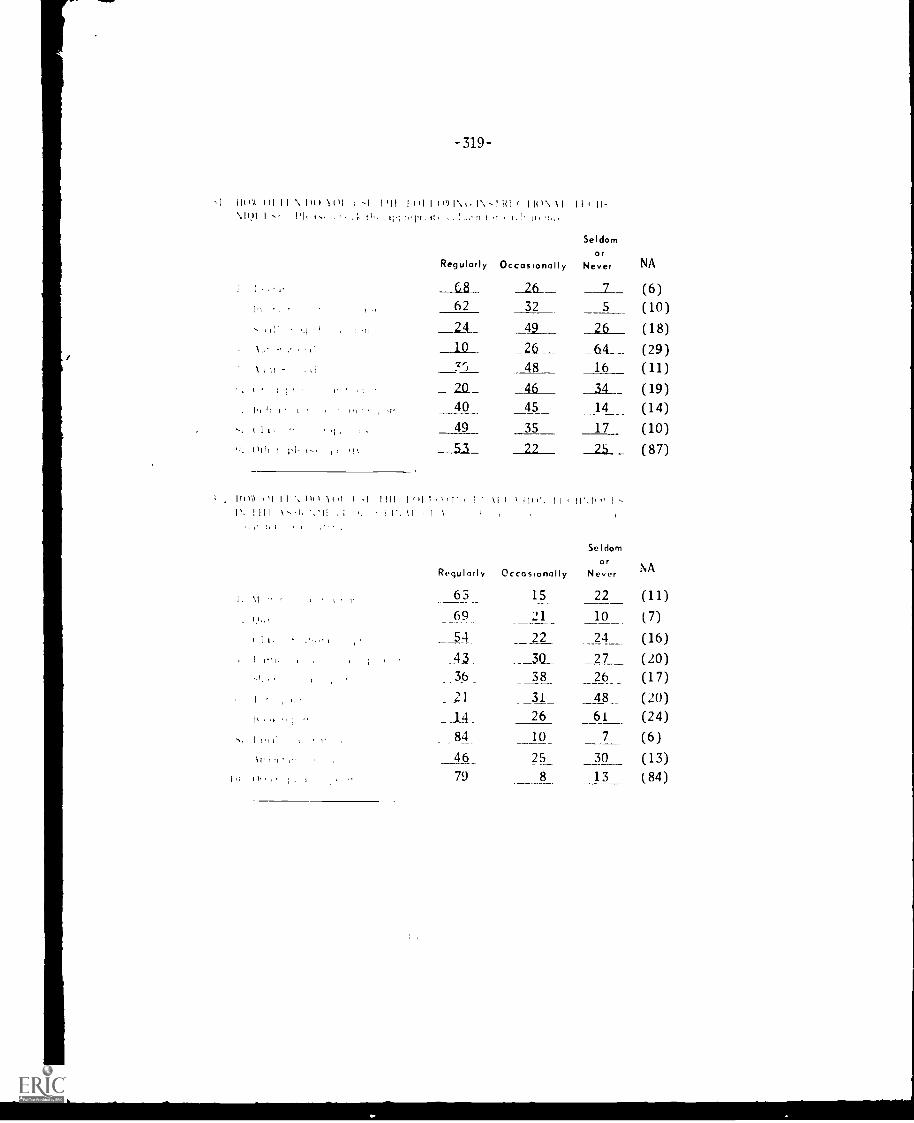
-319-
\ I 11011 (II I1 \ Ittt 101 t I 1'11 1 (11 I 10)1\ (. !Vs.! I:I t 111)\11 I I II-\I(11 I 1'1, INt t1, r,Tr, it, 1 n
Seldomor
Regularly Occasionally Never NA
t .,,,, 68 _a:I_ 7 (6)1,
,1
62 32 5 (10)(18)24 49 26
___10___ 26 64 (29)\ 1 ii - ...V:i 48 16 (11)
_ 2{1._ 46 34 (19)HI, i , t
40 45 14 (14)I I. 49 35 17 (10)
,1. Orli r r 'I% 53 22 (87)1
I 111(.". 1 I
__Li_
11%11)1 !. lIt,11 ,)I I I , 11,1 1(1; I -.1 1111 1111 I
I ' . 1 1 1 1 \ Ii . 1 1 .1 , 1 I I'. \ I I \
Seldom
Regularly OccasionallyOf
Never NA
63
69
54
15 22 (11)10 (7)
24 (16)
21
22
i 43 (20)36 38
_2726 (17)
21 31 48 (20)14 26 61 (24)84_ 10 7 (6)46 25 30 (13)
1,, 79 8 13 (84)
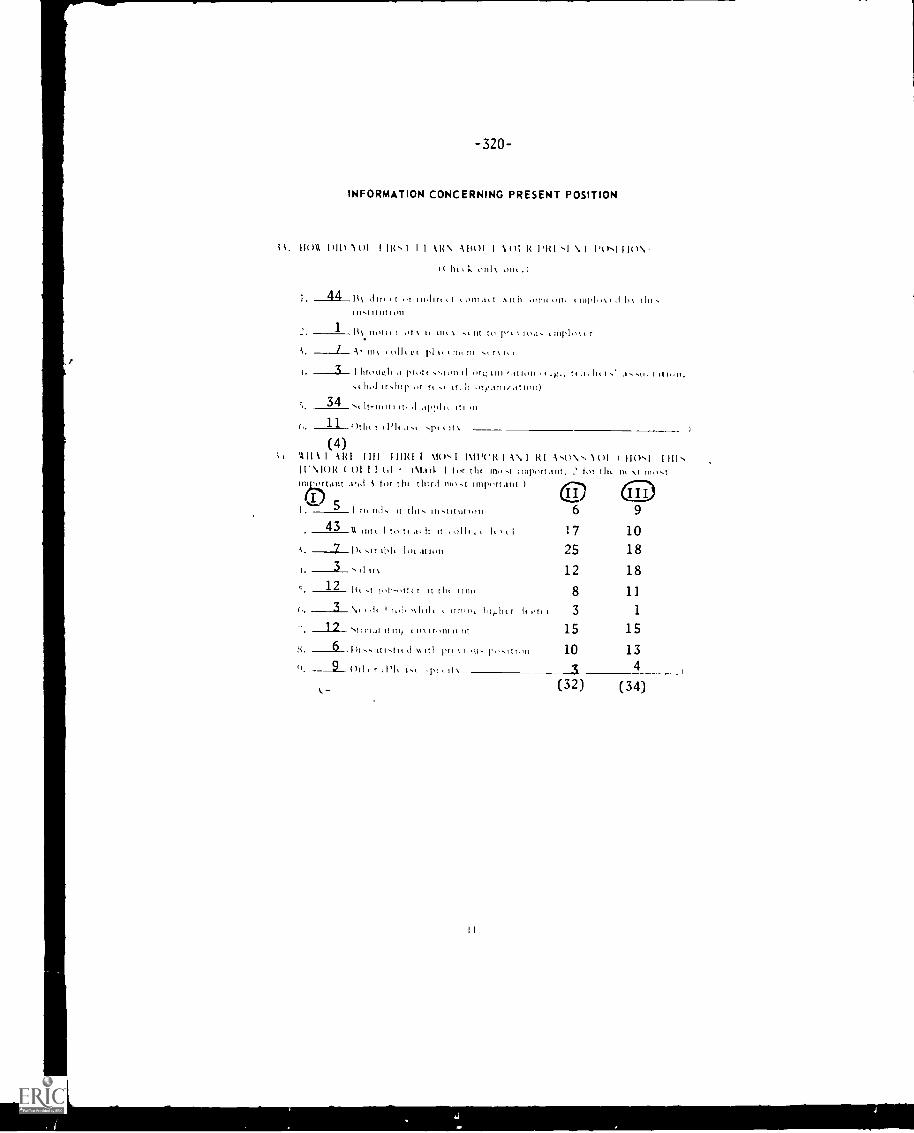
-320
INFORMATION CONCERNING PRESENT POSITION
ii()A Dii) WI I IR I I I RN Alt )I I 1()I R l'RI N I l'()I I I()N'I( 116 onIN onc.)
44 t I ttr 11411(1 t. ,111.1,1 t11111 t/Ilt t 111111, t \ 1111,
Ititittition1 I iN not', it lit to ri r
7 A 11,1.1, p1 1, t IIIt nt tt n I, t
I. _____3__ I hroueil prof ti ,r};1111,.1t1011 .1, In I.' hon.hid u.1111, of ft tt 1ft 11 "rganii.ition)
34 It-wit,
(,. 11 g)thi r pi it
(4);i \xit I ARI IIII HMI I \IWsl 1\11)C1 I \\I RI -\()N,. (
( Oi I I t,I (Mart I tor th, in,, mprt.int , ior tht n, \ti tor tin third mo.t important I
I1
...... c-- i r, ii,i., it !Ili, iiitit tit 1,,i1
43 ,1n 11111 I tc, It ..t, II it I 011, l 11. t I
i. ___2._ I), If litlt 1,4 tIIIttll
, 3 , d irN
s 12 ii, ,t it,l,n,11 t r it Flit 11111,
(,. _____3_ \, , ,i, i 10i, `11111t t 1M1'1, lush, r di or, ,
. _12_ ,t ,,,,, it ,,,,,_ , TIN irolitoi lit
s. 6 III.. iti, d ,A.ItI, pt, t 1.,11,- roIt 14,11
. _____9_ (),t , r ,Pli i,i -1,, it\
06 9
I 7 10
25 18
12 18
8 11
3 1
15 15
10 13
3 4
(32) (34)
-321-
''''. MO \ 'Hi II it1)1 1111 I HI I i)111%(, \If! 1, In L. i-, , i., li'4,,, in ,,,l,,,.11 t ol .'1'1' , 1 '',.. II 1." II,. , u Ill'111. '1,,,. ': ' 'r , ,,,I, Luc. ,A.011 hi III, ' t ri, . ii, ,
1, tii, ,,,,,, ,, I,
satisfied
., \
'-.. l' .1.
(See page 12a)
neither satisfiednor dissatisfied dissatisfied
it ' I, i r.,i'l ,I .11 .:11
i ,' .11' 't , t4' -. '
l'i i .. , 4' i" II ' I 1. I ... '', . .11 i '
Ili i ,,iil ' ' it .11.1.,
I : 1,1
I , \"I I
I
I '
I i.
Ili ' 1, ' I' :
(c) Yam'feelings
(b) Yourcolleagues'feelings
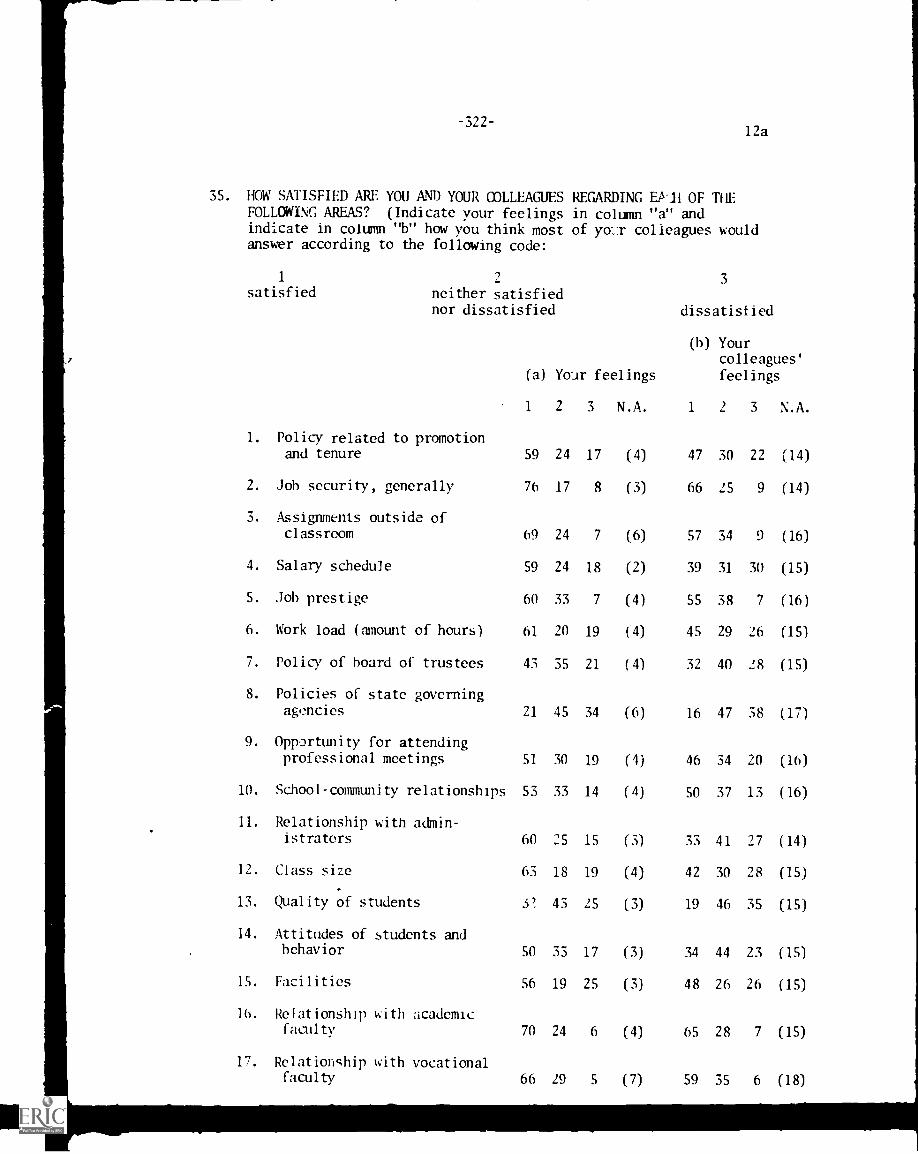
-322-12a
35. HOW SATISFIED ARE YOU AND YOUR ODLLEAGUES REGARDING OF TILE
FOLLOWING AREAS? (Indicate your feelings in column "a" andindicate in column "b" how you think most of yo-_ :r colleagues wouldanswer according to the following code:
1 2
satisfied neither satisfiednor dissatisfied
3
dissatisfied
(a) Your feelings
1 2 3 N.A.
(h) Yourcolleagues'
feelings
1 2 3 N.A.
1. Policy related to promotionand tenure 59 24 17 (4) 47 30 22 (14)
2. Job security, generally 76 17 8 (3) 66 25 9 (14)
3. Assignments outside ofclassroom 69 24 7 (6) 57 34 9 (16)
4. Salary schedule 59 24 18 (2) 39 31 30 (15)
S. Job prestige 60 33 7 (4) 55 38 7 (16)
6. Work load (amount of hours) 61 20 19 (4) 45 29 26 (15)
7. Policy of hoard of trustees 43 35 21 (4) 32 40 28 (15)
8. Policies of state governingagencies 21 45 34 (6) 16 47 38 (17)
9. Opportunity for attendingprofessional meetings 51 30 19 (4) 46 34 20 (16)
10. School-community relationships 53 33 14 (4) 50 37 13 (16)
11. Relationship with admin-istrators 60 25 15 (3) 33 41 27 (14)
12. Class size 63 18 19 (4) 42 30 28 (15)
13. Quality of students 43 25 (3) 19 46 35 (15)
14. Attitudes of students andbehavior 50 33 17 (3) 34 44 23 (15)
IS. Facilities 56 19 25 (3) 48 26 26 (15)
16. Relationship with academicfaculty 70 24 6 (4) 65 28 7 (15)
17. Relationship with vocationalfaculty 66 29 5 (7) 59 35 6 (18)
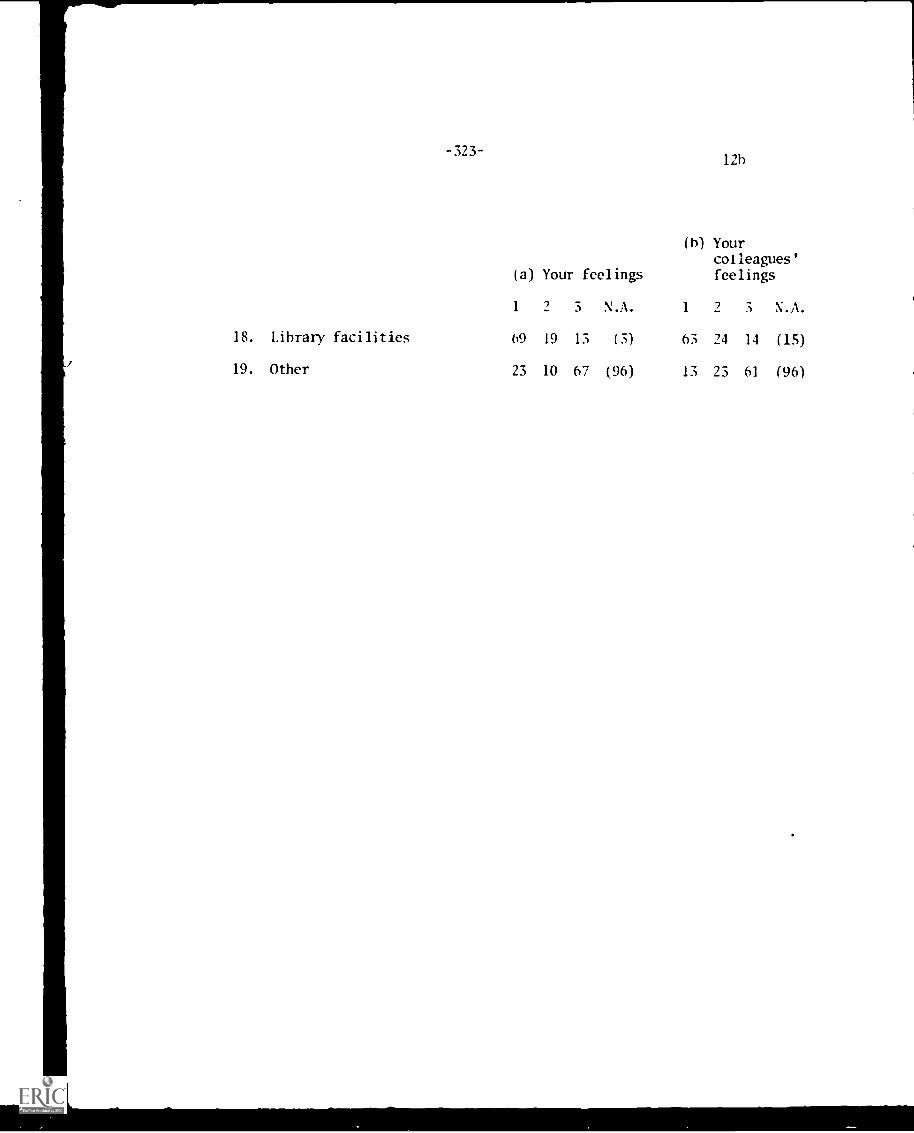
-323-
(a) Your feelings
12b
(h) Yourcolleagues'feelings
1 2 3 N.A. 1 2 3 N.A.
18. Library facilities 69 19 13 (3) 63 24 14 (15)
19. Other 23 10 hi (96) 13 23 61 (96)
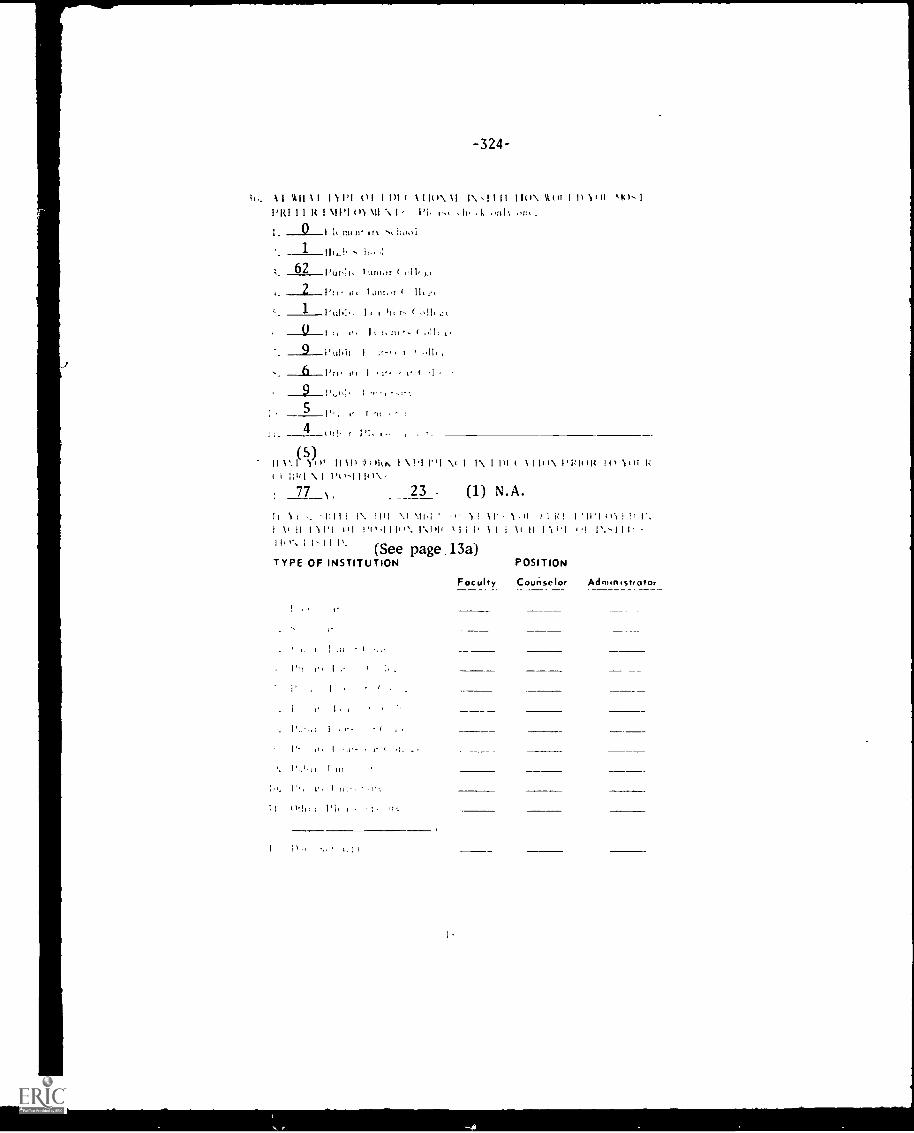
-324-
I All AI 111'1 ()I 1 1)1 II Ho\ \1111 I II1111 10.1PRI 1 1 01 MI \ I",t .111 nt
1. 1, nit :I In hooi
1 !. h.,
62 puv.h. I unior ( 01 I,
e. --2--P1- I.. 1,1111,1- ( II,,1 I'h. I , I ht. r. ( ttIit
t!. I t h nt ( a.
2Pti;it I I 114
9
: 5 ,
4 P!, r Pit
II 1`.1(5)
111' 10 ')()kt. I \1.11"1 \( 1 I\ I I It )\ PP ,HI \ I I'l)"`I i I"V
77 ), 23 (1) N.A.
)1 I<
it li I:I I I I. I `.I %Its; ' ! \ I' - 1. )1 I P! 1'111 Pit ! !!II I MI I, I 's I IP \ I i \ I i II I .1 I I I 11
I I. i P.(See page.13a)
TYPE OF INSTITUTION POSITION
Faculty Counselor Administrator
l',H1 I III
155 I I III'. .1".
II ttttl. I ":, '4'.

-325- 13a
37. IF YES, WRITE IN THE NUMBER OF YEARS YOU WERE DIPLOM TN EACHTYPE OF POSITION INDICATED AT EACH TYPE OF INSTITUTION LISTED.
TYPE OF INSTITUTION
Faculty:
POSITION
Counselor Administrator
1. Elementary 0 88% (25) 0 100% (24) 0 - 98% (24)
2. Secondary 0 45% 0 98% (24) 0 - 96% (24)
1-10 47
10 9
(7)
3. Public junior college 0 - 84% (!6) 1 100% (24) 0 - 98% (24)
4. Private junior college 0 97% (24) 0 100% (24) 0 106% (24)
5. Public teachers college 0 98% (24) 0 100% (24) 0 - 100% (24)
6. Private teachers college 0 100% (2) 0 100% (24) 0 - 100% (24)
7. Public four-year college 0 92% (25) 0 100% (24) 0 100% (24)
8. Private four-year college 0 92% (25) 0 100% (24) 0 - 99% (24)
9. Public university 0 87% (26) 0 99% (24) 0 - 99% (24)
10. Private aniversity 0 94% (25) 0 100% (24) 0 - 99% (24)
11. Other 0 85% (29) 0 99% (24) 0 96% (25)
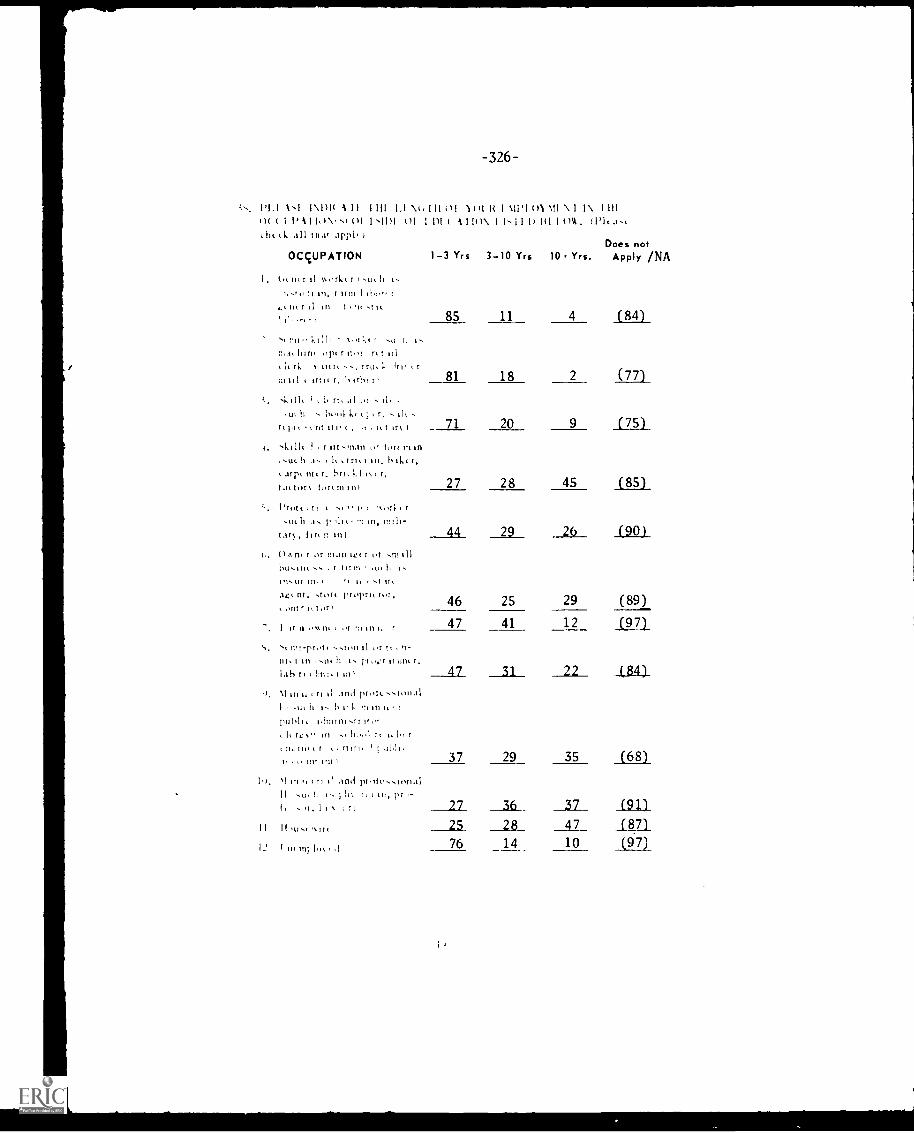
-326-
PIA A,1 1\1)1( A II 1111 LI V,111 ()I ) ()1 1( I ()) \11 \ I I\ I ilt()( ( I 1)A lov.) ()I 1,11)1 ()1 I 111 ( 1110\ 1 1,1I I) NI I ut.l. (1)1L.1.(IILLI, .111 that appl,
OCCUPATION
1 , ( m i n i I +orl.tr 1.11,11 1.
1..11,11 VI, 1 um I IIn.,1 r
11, r 11 III 1 ..it
I, 1.
:1,1.11111, npt r it ft f 111
t Ii f1,. 1. Ill ft Tr, I.111111 t un, r, huh, ri
ri, II 111 ,
ti, ll booi. l., (; t f. lit, tr% I
i. r tit ,11.111 or tort in inuth e. , , rri, I in, 1,11,,r,
arri t f, bflt f,I.Rturt tor( in
Prot 11 t ,11 1. r
',Mil .1. 1, '111' "i In, tril It-t.if), lift it in)
()AM f t,r 111.1111e, f
611.111, t,f 111111 .t1,11 1.
11111f 111, litagi nt, -.tor( propnt nu,, on: r 1, T,f
I if a 1.1111( 1 01 '111111, f
Irt-prot, ,,r t, ,
,t1( 11 I pi ne r It Ill'It1.1i t, 1 hill, I 1111
\I III I, fl 11 anti itf,11,t slon,11
it,,I1 1. la I, I, ,;1
putili, idnuni-dr II,-. I, re's. Z, it 1 1 r
(1,1111 rtititoAnt ill
andI \ 1, I it), pi. ,-
I, 11 1 if)11 11 111, '1 lit
12 I ni
Does not1-3 Yrs 3-10 Yrs 10 r Yrs. Apply /NA
85 11 4 (84)
81 18 2 (77)
71 20 9 (75)
27 28 45 (85)
44 29 26 (90)
46 25 29 (89)
47 41 12 (97)
47 31 22 (84)
37 29 35 (68)
27 36 37 (91)_15 _ZS_ ____17_ (87)
76 14 10 (97)
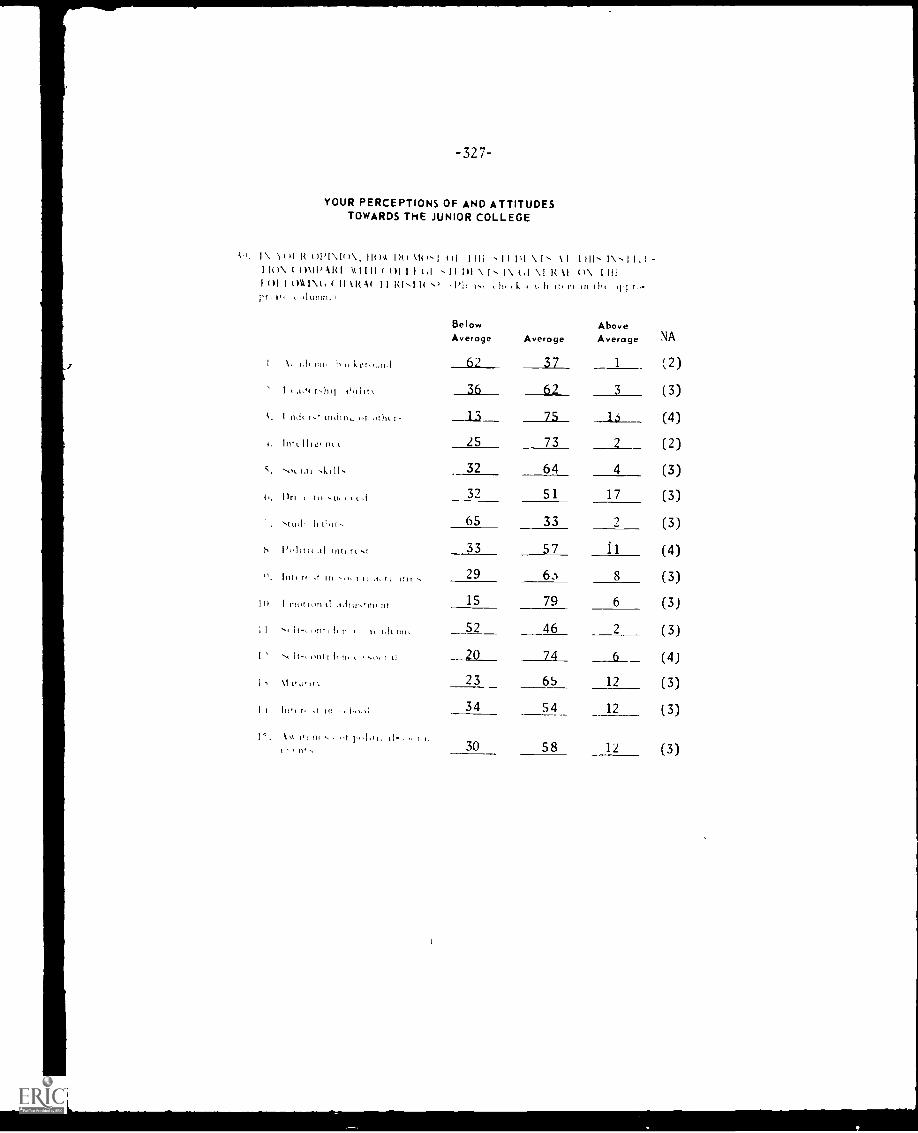
32 7
YOUR PERCEPTIONS OF AND ATTITUDESTOWARDS THE JUNIOR COLLEGE
I\ R I f 1 ) 1 \ 1 1 1\ I I ( ) \ 1 ( I ) ( ) ( I f '11 I ) I \ \I I IV.' I -I l()\ ( ( ()I 1 1 (,,1 I 01 \ I, \ 1,1 \I R \I ()\ 1111
I ( ) I I (AIM, ( II 1 R Al 11 10.-11( IN( k t, h it, m rn t
1,4
1
'
1, hi, mi. h . ker,,t,n,i
I ,,i,,, r.1111 0,111t \
1 ii,it rs, Indin, ,0 ,,t1. r-
BelowAverage
62
Average
37
AboveAverage
1
3
NA
,2)
(3)
(4)
36 62
75 Ls
C. 11.01.111,2. n'. (
___13____
25 73 2 (2)
-.km., 32 64 4 (3)
0. 11n , , su, , ,,. ,1 32 51 17 (3)
. 'stud' 11 cl,It. 65 33 2 (3)
1-, 1),,h1,, 1111t f l. S1 33 57 11 (4)
,.
.,1
111S, 1, III -,, I II (( In, , 29 6 .) 8 (3)
III
.( ,I,
I mot Ion lI 15 79 6 (3)
I I
.td{t1,'111(11(
''', [In_ ,,Ill Olt it t t, hi,. tilt, 52 46 2 (3)
1, -,,, it-, ,,nt,i, n, , .,,,,, I il 20 74 6 (4)
H \I t,,.(\ 23 65 12 (3)
ii 1,,,, r. .t In - , I..,.,; 34 54 12 (3)
I'. 1\t I, t. ,.... ,,t 1,,,IIII, tl- -,, t ti' 30 58 12 (3)
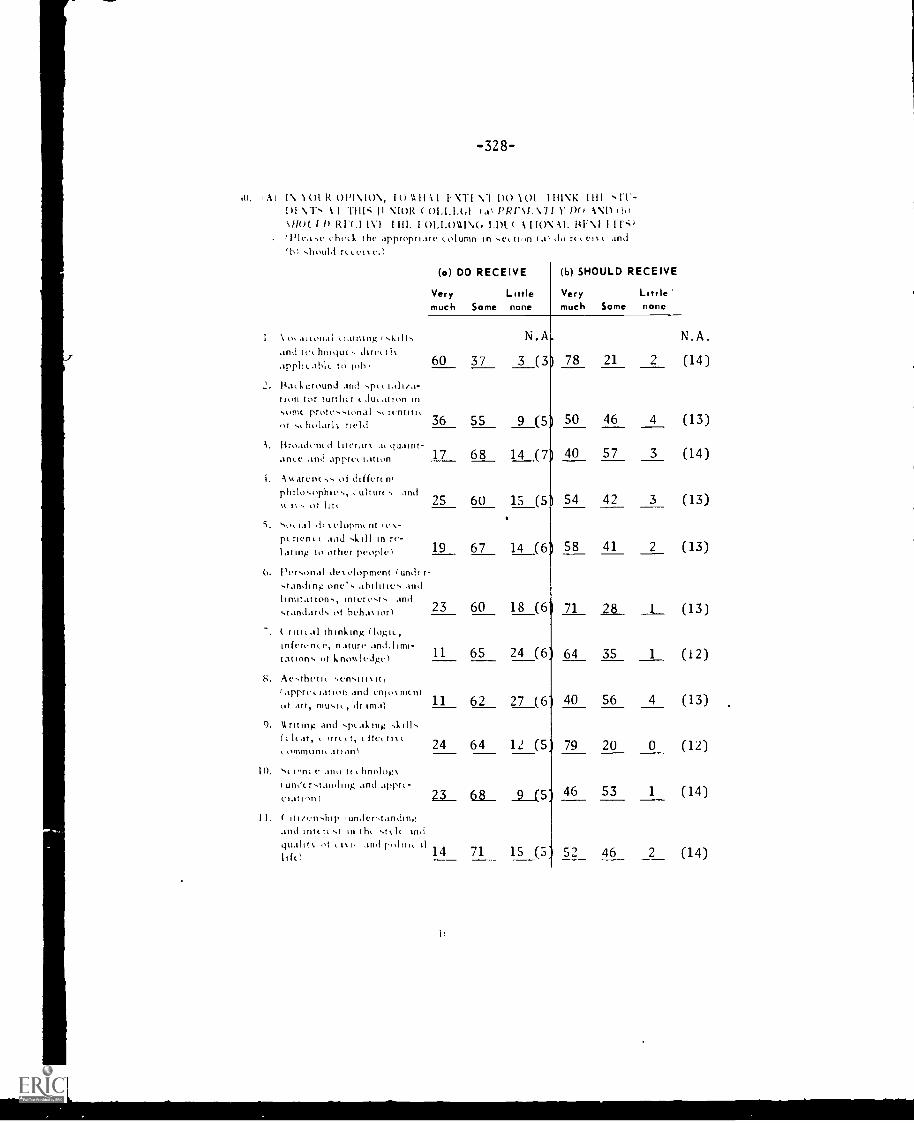
-328
10. A) I\ N(RR ON\ 10\., I() XTI vi Do \ 01 I HINK Lill\I-, I THIS II \IOR (al PRI-SI.V II 1)0 A\I) 110
Slluf I I) RI-CI IV I I III. I 01..1.0111\16 1.1)t ( 1 IRA I. RF \I I I r-7. cheek the ,ippropriate column in see t ion tai do re em.e. and
(hi should rccem.e.1
oeaeional training (skillsand tee hnietucs dire( th.applicablc to lob)
2. Haekstround and sp« ialiia-ion for further (due .ition in
lomt protessionalor se Indent\ field
lifoath'Ill 1 IlItraf At quaint-ane_e and appree 'anon
RECEIVE
LittleSome none
(b) SHOULD RECEIVE
Very Littlemuch Some none
N.A N.A.
37 3 (3 78 21 2 (14)
55 9 ( 50 46 4 (13)
68 14 40 57 3 (14)
60 15 (5 54 42 3 (13)
67 14 ( 58 41 2 (13)
60 18 (6 71 28_ 1 (13)
65 24 (6 64 35 1 (12)
62 27 (6 40 56 4 (13)
64 12 (5 79 20 0 (12)
68 9 (5' 46 53 1 14( )
71 15 (S 52 46 2 (14)
(a) DO
Verymuch
60
36
17
i. A,Aarencss of differentphilosophies, ulturt s and
Of lite 25
S. so. Cal di ,.elopme litpc nen, e and skill in re-
191 at mg to other people \
6. Personal de%elopment (unde r-standing one's abilities andlimitations, Interests and
standards of heha,.100 23
ritleal thinking (logic,inference, nature and.hmi-
11cations of knowledge)
S. Aesthtie sensiti(it,(appreklatlon and ento,.molt
t art, mini(, dr ma) 11o
9. \Arun-1) and spe.alongkar, ,rr«t, effc eti
24«,mmuni(attein)
10. se pm( e .111.1 tit hnologiundirstanding and ,ippre-
m 23__chitp)
II. ( iti/nship understandineziind fIR ,1 III t hl st,lt mit
pialit%of And d
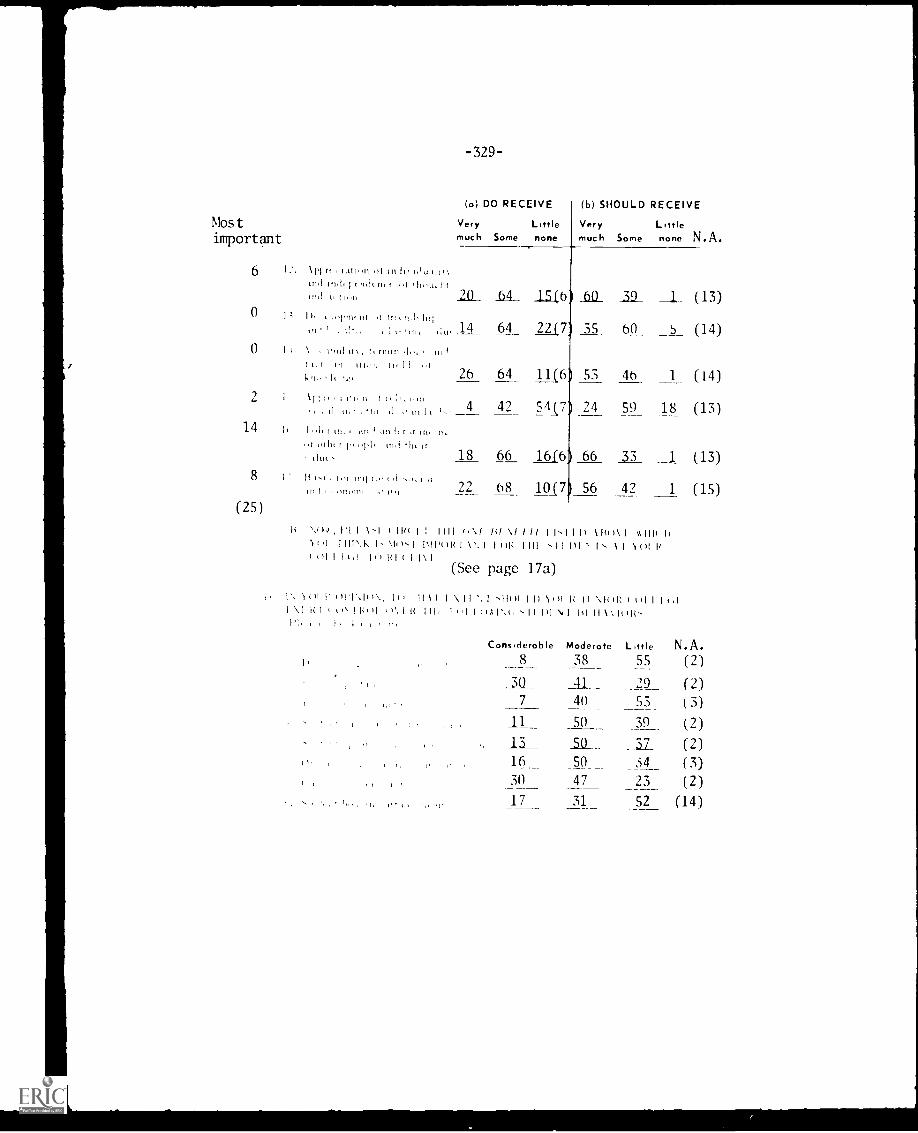
Mostimport ant
6
0
0
2
14
8
(25)
-329-
(a) DO RECEIVE (b) SHOULD RECEIVE
Very Little Very Littlemuch Some none much Some none N.A.
pi lati.tit to in 11,1,1l1.111!\ti, '11,1LL lit
(1.,11 20 _O4 15(6; I). t. In, n.1,1";
,:tp 14 64 22(7I t.tui tr, ti rwirr Si,,, s 111,1
r, r in rrirssi II, I I rrt26 64 116re,
\ IHt ? :f I _4 42 541/ 1
It I "It r ins t nn 1 rinsir r ssr Ins in.rst rsrIrr r rsisir triri rlir it
ltit `
li r,irs trsr ros t ,1 I rrir s
18 66 16(61
22 68 1017
60 39 1 (13)
35 60 (14)
53 46 1 (14)
24 59 18 (13)
66 33 1 (13)
56 42 1 (15)
It `.(1), , 1'1 I \ l ( Ilti I I 1111 f'\/ /1/ III I 1-1 1 11 1Ii(1\ I AM( 11\ i))) \I(1.1 imp( w I\ `.I (w III .1 \ } 1;
( 111 I I Id I() RI I I 11
(See page 17a)
'y ((I (' (I) It \ \ 11) 1111 1 II \1(11: ( (11 I 1 ()I\I l I i ) 1 \ 1 1 0 ) 1 R I I l t 1 1,1 1 »AI's() -)11 1)1 N I Ill II 1', I1M,
l't) ) ) ) ) ))
Considerable Moderate L tthe N.A.8 38 55 (2)
_3(1_ 4_1 29 (2)7 4O (3)
11 SO _39__ (2)13___ 5)____ _.3_7_ (2)16 50 ;A_ (3)30 47 23 (2)17 31_ 52 (14)
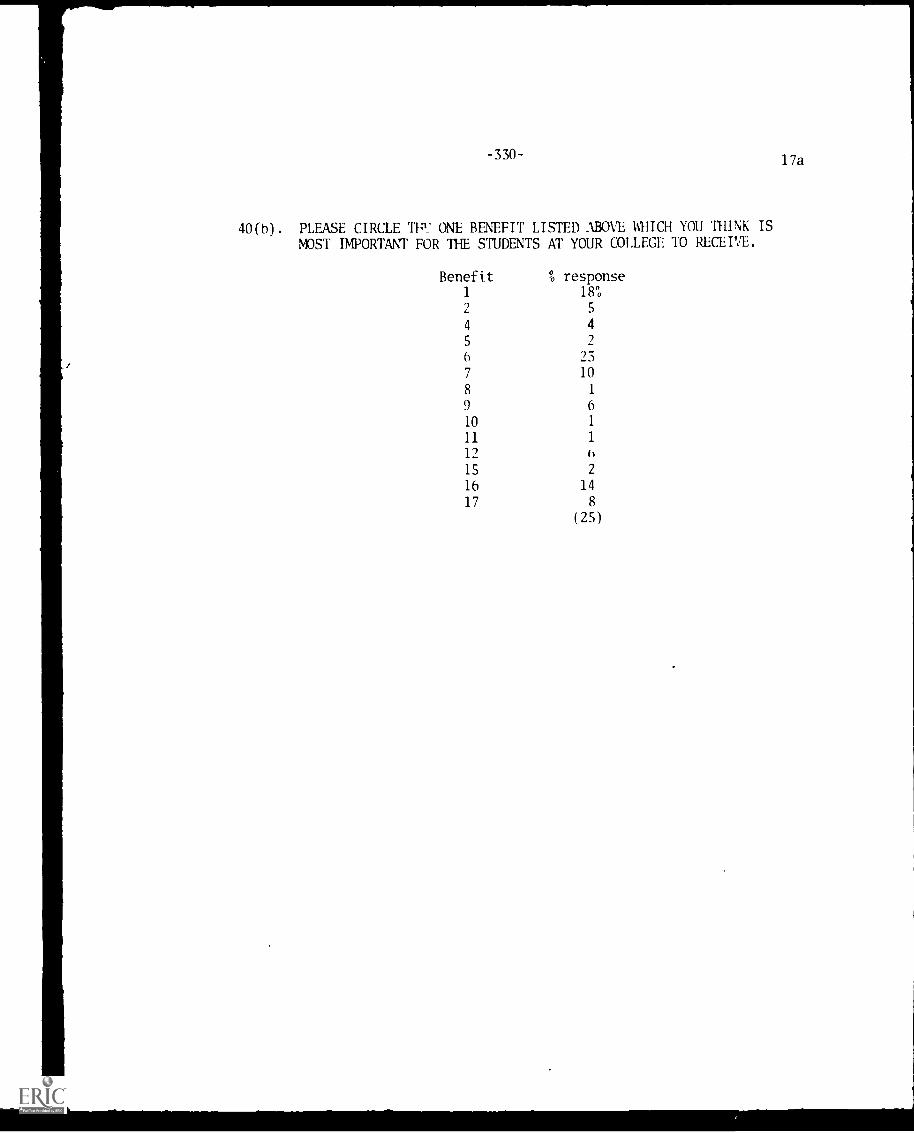
-330-
40(b). PLEASE CIRCLE TFr ONE BENEFIT LISTED ABOVE WHICH YOU THINK ISMOST IMPORTANT FOR THE STUDENTS AT YOUR COLLEGE TO RECEIVE.
Benefit % response1 18%,
2
4 4
5 2
b 23
7 10
8 1
9 6
10 1
11 1
12
15 2
16 14
17 8
(25)
17a
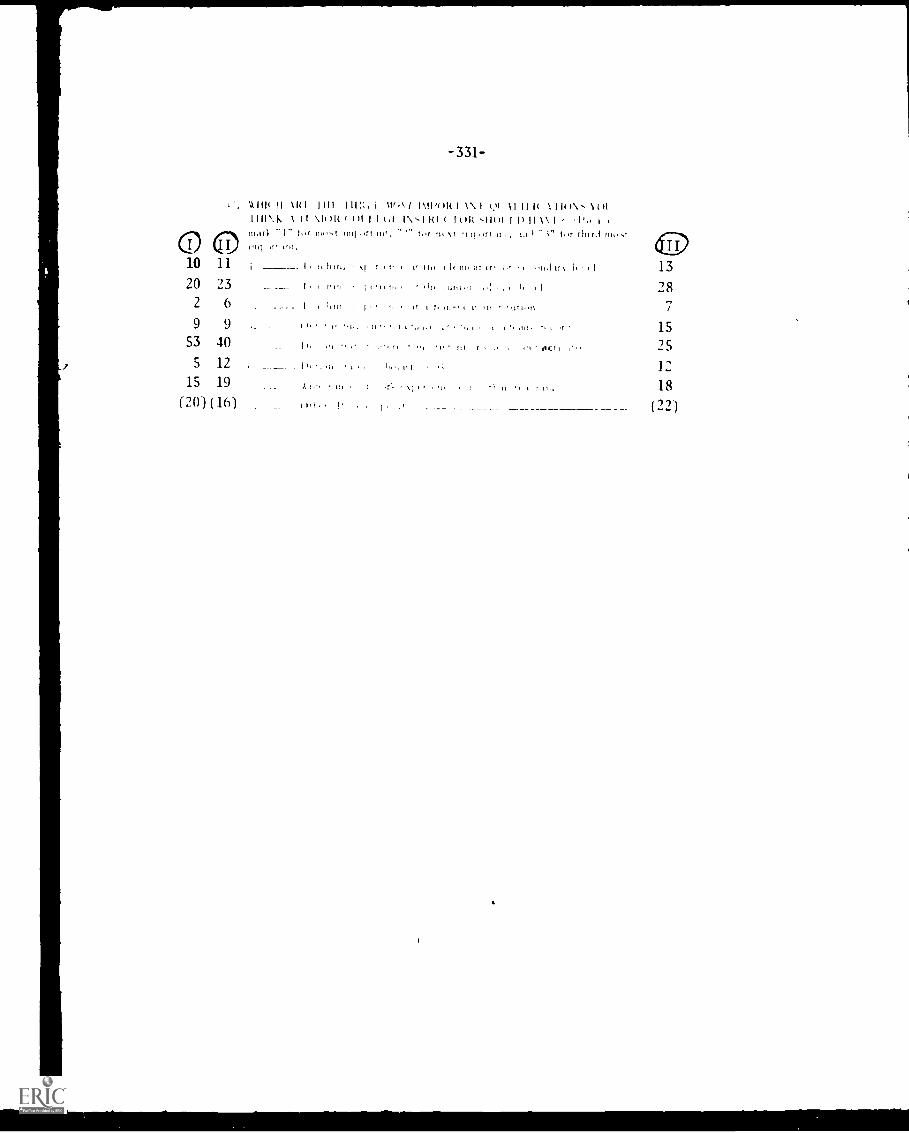
-331-
3
2
5
2
:1
2)
13
28
15
25
I:18
(22)
I III:, I 11011 1\11'nI( 1 1 \ I VI 11 Il It 1 I !UN`, 1(11I 111`.1. 1 11 %I'M « )1 I I (.1 1\ I RI ( 1()1( -,I1(11 1 It 111\ I 'I'I. t t
marl. -1" It,* ilk, 11111 rt Ito, '" tor it ..,! ,t II ,,rr 11 ., LI / ;" tor third rii,..t0 6--1) ,,, ,I' 1111,
10 11 1 ------ I , tt hitt, , NI r . t, t t, it, t lt 1111111 tr, -, .,11,1tr% It , t I
20 23 __ __ I , 1 111/. , 11'1111. . Olt 11
2 6 ____ 1 , ;,,,, . I , It t :, ti,-` t r '11 , tirt..11
9 9 _
53 401 ,,
S 12 i), t , 1,,,, ,, 1
15 19 A 1,i. in , t ql. , .; , , ,I. . 1 1 1 1.1111
(2(0(16) , ,i , I'
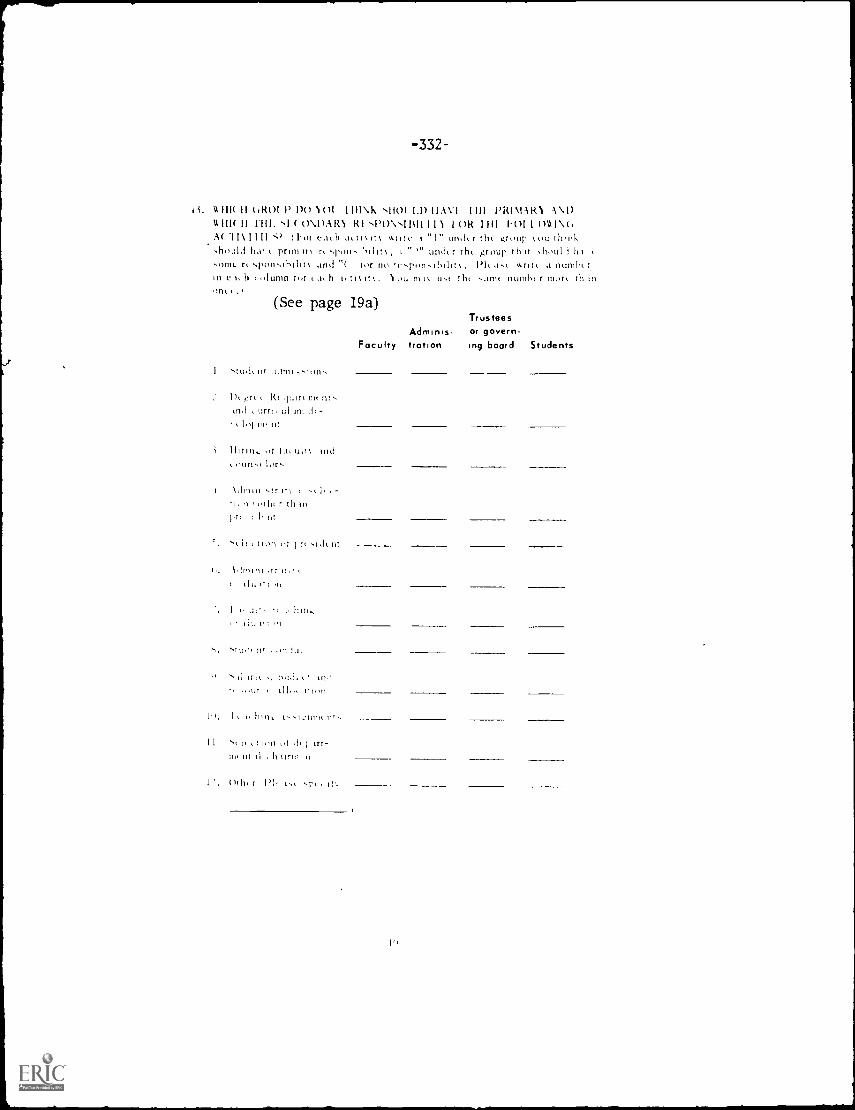
-332-
I HI( II (RO1 P 1)0 101 I III \ 1101 1.1) IIAVI I III Plt1 MAR) \ \I)V.111( II nil. o\DAR\ RI sPO\ s11111 I I 1 I OR 1 I ()M \(LA( \ I 1 II 1-or ca( h aL.ti% it% v,ritc t "I" Lind( r th( nnq %(iu thnk-,11,/.:1.1 ha' prim tr\ , t " " mai( r di( ,group th tt,t)mt, ft( spon.ihilit% and "( tor no t-c,rorp,,ibilit. ,t-( v,rit( a numb( rin c t, 11 "Limn (a. h t, to tti. 1 kit.. ma% (1.-,( thi ..ttn( numb( r ni,r( th to.
(See page 19a)
stud, it dorm
I)l t pun W.,IflI urrr ul 1111
Pp fit
/Jinn, ,t t.r, uln, Ind
1 \ diniiao-dr tot t i
tit ,i ',Thu r th tilprL nt
".( it ttl ',Id( III
it,t t
till t,r tlt
TrusteesAdrnims or govern-
Faculty trotion mg board Students
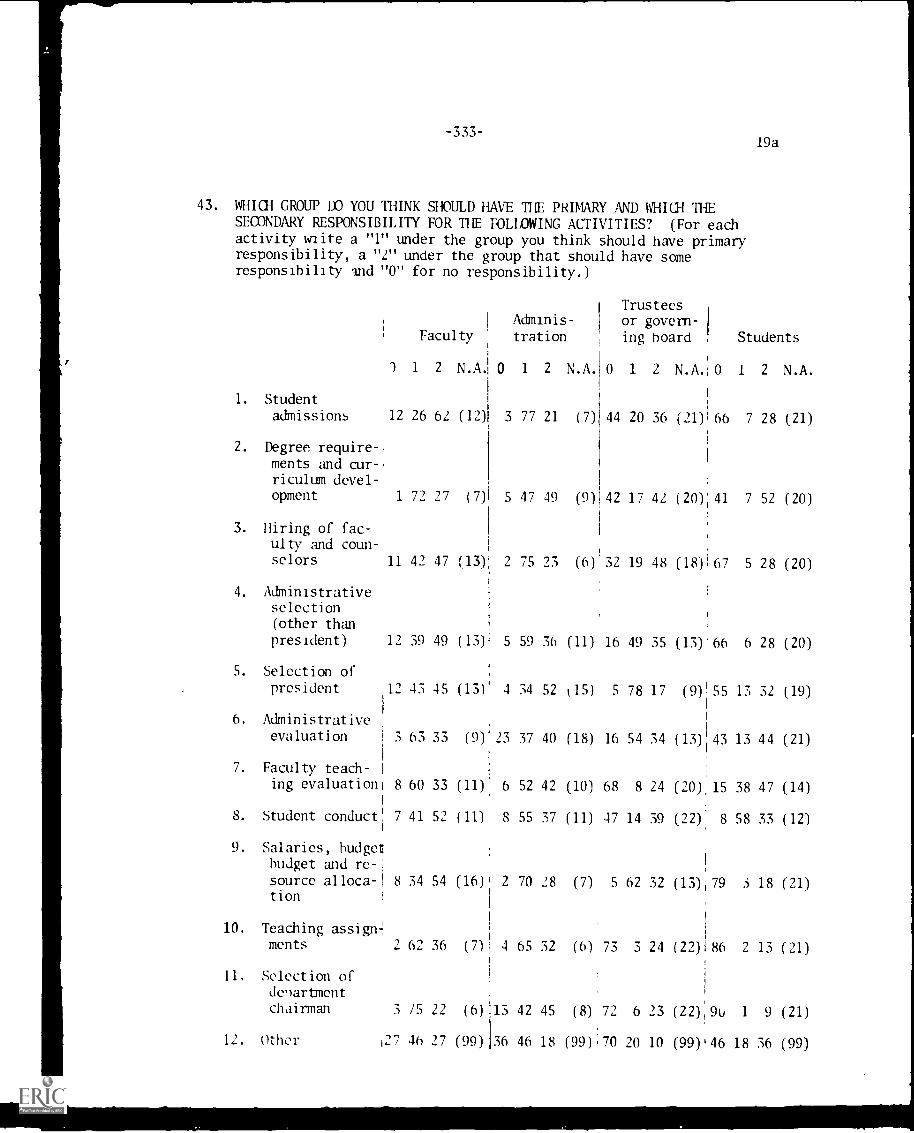
-333-
43. WHICH GROUP DO YOU THINK SHOULD HAVE THE PRIMARY AND WHICH THESECONDARY RESPONSIBILITY FOR THE FOLLOWING ACTIVITIES? (For eachactivity write a "1" under the group you think should have primaryresponsibility, a "2" under the group that should have someresponsibility and "0" for no responsibility.)
19a
1
Faculty
1 2 N.A. 1 0
Adminis-
tration
1 2 N.A. 0
Trusteesor govern-ing hoard
1 2 N.A. 0
Students
1 2 N.A.
1. Student
admissions 12 26 62 (12) 3 77 21 (7) 44 20 36 (21) 66 7 28 (21)
2. Degree require-.
ments and cur-,riculum devel-opment 1 72 27 (7) 5 47 49 (9) 42 17 42 (20);41 7 52 (20)
3. Hiring of fac-ulty and coun-selors 11 42 47 (13) 2 75 23 (6) 32 19 48 (18)167 5 28 (20)
4. Administrativeselection(other than
president) 12 39 49 (13) 5 59 36 (11) 16 49 35 (13)'66 6 28 (20)
5. Selection ofpresident 12 43 45 (13)1 4 34 52 15) 5 78 17 (9)!55 13 32 (19)
1
1
6. Administrativeevaluation 1 3 63 33 (9)123 37 40 (18) 16 54 34 (13)143 13 44 (21)
1
7. Faculty teach- 1
ing evaluation! 8 60 33 (11)' 6 52 42 (10) 68 8 24 (20):15 38 47 (14)1
8. Student conduct! 7 41 52 (11) 8 55 37 (11) 47 14 39 (22)' 8 58 33 (12)
9. Salaries, budgetbudget and re-,
source alloca -1 8tion
34 54 (16)1 2 70 28 (7) 5 62 32 (13),79 3 18 (21)
10. Teaching assign-1,
ments 2 62 36 (7) 4 65 32 (6) 73 3 24 (22)186 2 13 (21)
11. Selection ofdepartmentchairman 3 /5 22 (6) X13 42 45 (8) 72 6 23 (22),9u 1 9 (21)
12. Other 27 46 27 (99)36 46 18 (99),70 20 10 (99)146 18 36 (99)

-334-
ASSUMIV, LIMITED RESOI AltA I I\ R OPI \ 10 \ ARE 1 IIETWO MOS1 AND MI TAO LI As I I \IPOR FA\T L1)1 ( A 110\ AI. PRIORI-TIES OF R JI \ IOR OLLI CE (.0 Al PRESEN1 , AND (10 1 OR 1 III
II RI, (In both columns mark "1" for the MO t,rt s ' Imptrtant, and "2"for the t%,. o least important prtorities.)
(See page 20a)1. t,eneral eden. arum for tran.t, r to ,1
t at It7 st It III !MI
Priparation in .1 .spl Int : heldfor tran,f,r to .1 tour-0. Ir in.ntutton
i. ( ontinum, I du. lt1,11 t re tfit
t, ldult cdu, anon re dit
Reme dial in,' "high pot( null" programfor di.athant d stoat tits
:'1'tt t.11 o,eupational program, forlot al huvnc.. Ind imiutr,
0, upational program-. h .1,11111. t,cirtifittte ur .1s,ot_l it d<grt.
b. Other I p1( .1t .pc .its
(o) Present (b) Future
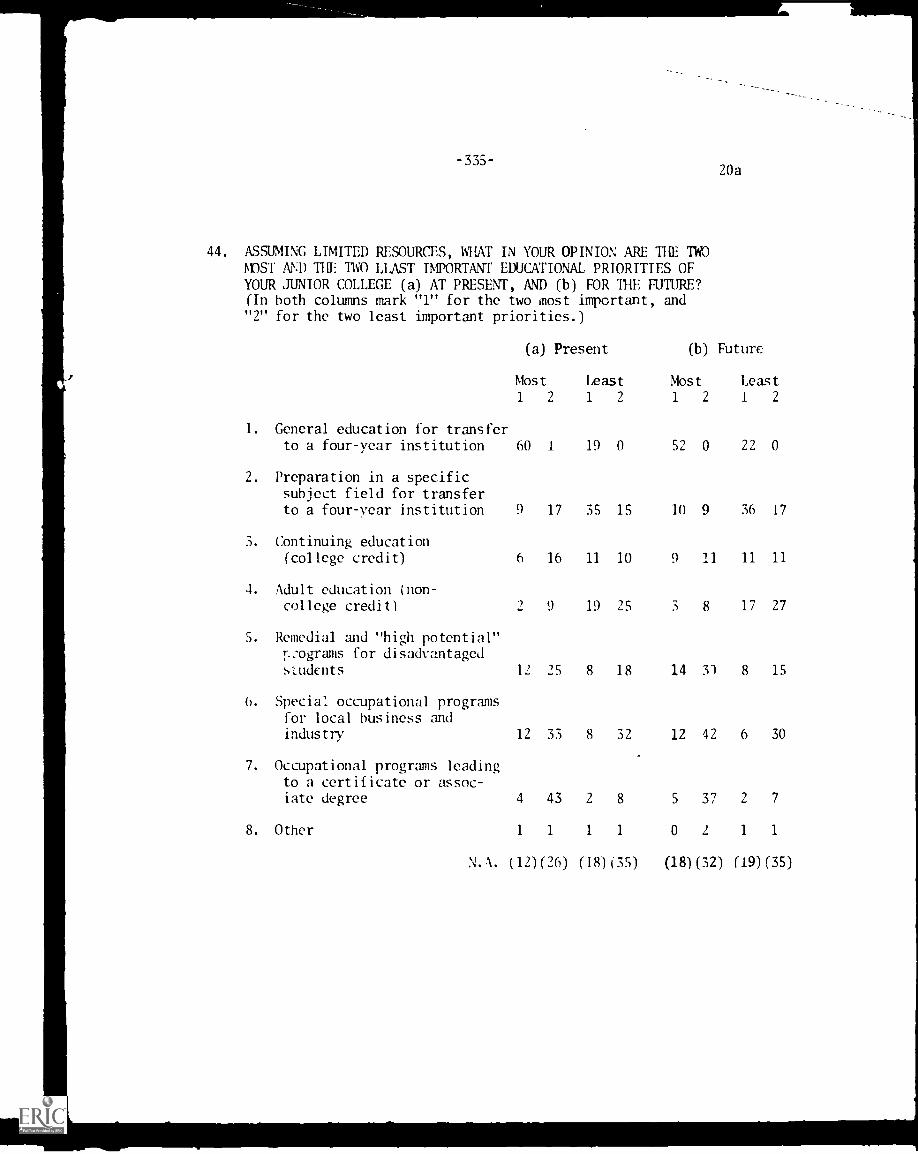
-335-
44. ASSUMING LIMITED RESOURCES, WHAT IN YOUR OPINION APE THE TWOMOST AND THE TWO LLAST IMPORTANT EDUCATIONAL PRIORITIES OF
YOUR JUNIOR COLLEGE (a) AT PRESENT, AND (b) FOR 1W FUTURE?(In both columns mark "1" for the two most important, and"2" for the two least important priorities.)
20a
(a) Present (b) Future
Most Least Most Least1 2 1 2 1 2 1 2
1. General education for transferto a four-year institution 60 1 19 0 52 0 22 0
2. Preparation in a specificsubject field for transferto a four-year institution 9 17 35 15 10 9 36 17
3. Continuing education(college credit) 6 16 11 10 9 11 11 11
4. Adult education (non-college credit) 2 9 19 25 3 8 17 27
S. Remedial and "high potential"1-.:ograms for disadvantaged
students
6. Specia: occupational programsfor local business andindustry
7. Occupational programs leadingto a certificate or assoc-iate degree
8. Other
12 25 8 18 14 31 8 15
12 33 8 32 12 42 6 30
4 43 2 8 5 37 2 7
1 1 1 1 0 2 1 1
N. 1. (12) (26) (18) (3S) (18) (32) (19) (35)
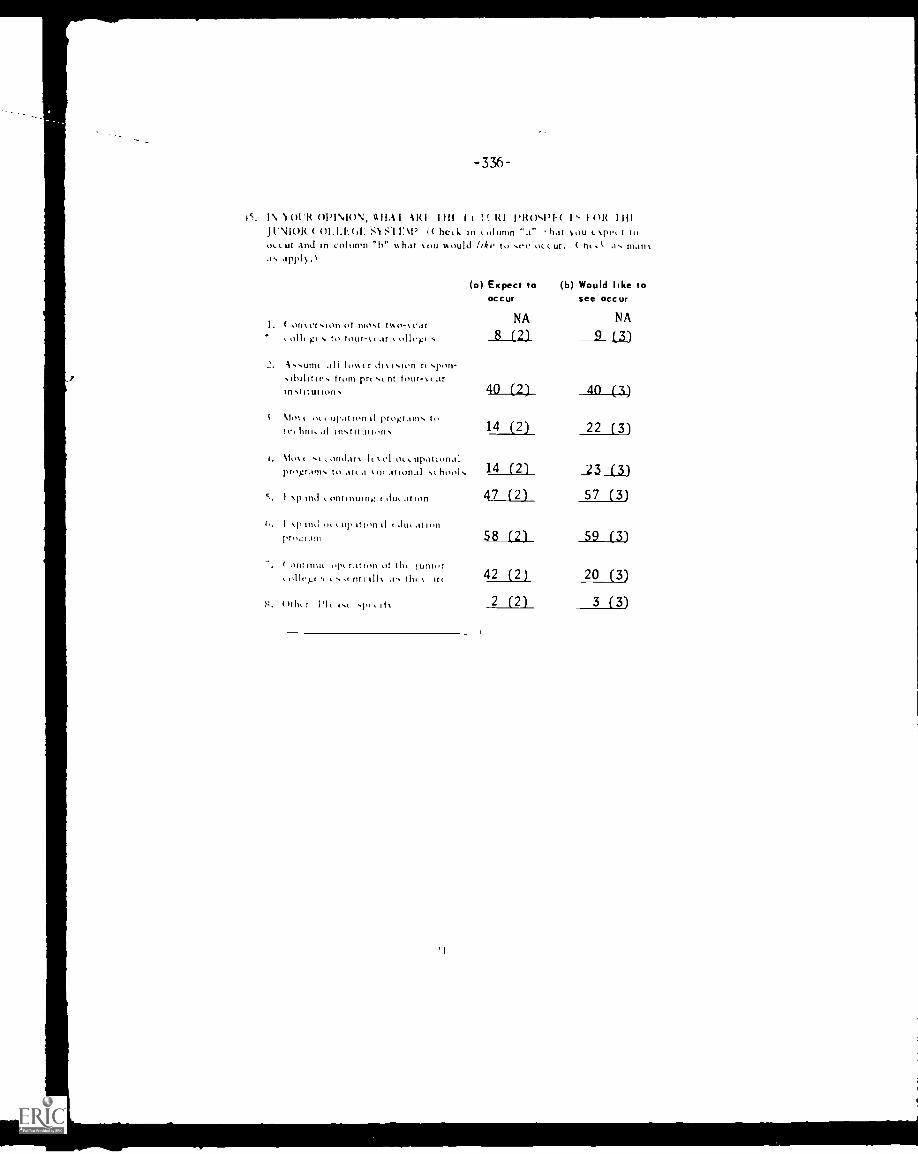
-336-
iS. l\ \ OUR Ol'INION, 1111A 1 ARI I III It II RI PROsN1)1( I' I OR 1111JUNIOR ( 01.1.1.61: SN S1 !AP 1( he, I. in , olumn "a" hat %,,,u t . pv, t toof ur and an column "h" what %011 would like to ,...e oLLur. ( nt, I a, man%.1% appl).)
I. ( on, er,ton of mo,t t v,,,-% car
(a) Expect toOccur
NA
(b) Would like tosee occur
NA
'.
, oil( g( , to four-% ( .1f , nilr.gr ,
-1,,unn ali 10,... r dt% ',don r ,pon-
8 (2) 9 (3)
,IblItt o.., from pr( ,.. nt four-N, at.in,t1tution,
\lo ( tt. t IlratIttIl It pftt);r.1111, to
40 (2) 40 (3)
1t.', 11111..11 111,W:111011, 14 (2) 22 (3)
I. 'Ott% t. ,t.t. ttIlti.If% Intel tt, Lupationalprogram, to art a ,o, at ional 'NC hook 14 (2) 23 (3)
s. I ,, p Ind , onrintung ( du, Alton 47 (2) 57 (3)
6. 1 p Ind .,, up mon tl .1u, at ton
program 58 (2) 59 (3)
( it11111111( ttp, rat onl of the 1111110f
t ttillfr.J. , , ,.t. MI 111% .1 ti % lft. 42 (2) 20 (3)
S. (h11,1 PI, 1,,,. ,1,,, 1I% 2 (2) 3 (3)
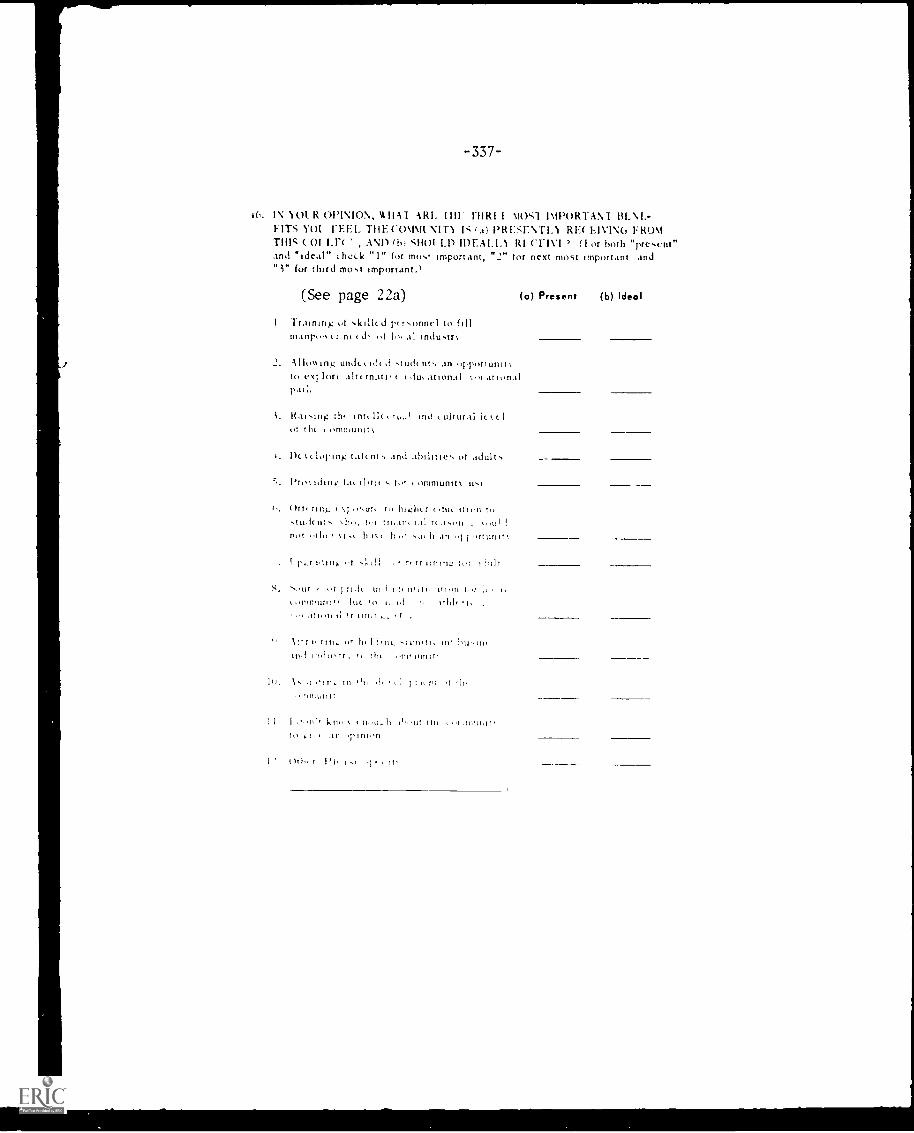
-337-
4(1. IN NOY R OPINION, 1111A1 ARE I IIF IHRI I M0S1 IMPORTAN1 BENI.-FITS Vol FEEL T11E 10\1\11 NIT N a) PRY:SEA-FL RE( EIVINO FROMTHIS ( 01 Ls( , AND (h) 51101 LD IPEALE1 RI CFIVI ) (for both "present"and "Ideal" (heck "1" (or most Important, "2" for next most important and"1" for third most important.1
(See page 22a)
Training of skilltd personnel to fillnt td- it tridumr
(o) Present (b) Ideal
2, Alle in g land( tudctits stn oppl[Sunit(to ext tort alto rnatt, t tduc ational tIl at ton,11
Itai,ong the !nit II( ultural It t t Iof the 011111111111I%
1. Dc %doping taltnt s and abilities of adults
Pro\ kiln.: la, ,,rumunIll 11,1_
I. ()It, (
',Ill.:1111, 014,, tia 111.311. I.It tc
not ,111, htl. h an .1;
. totna r, tr tmitur It.' I i tit
Si. Soul" I thil u,.f I I, 1..1
,II111,11111" :Ill III I: 1,1
.111011 ti tr 1111:1 a., .1 .
tI' 1,1111c 11,1 :-`11,111:
111,1 1}
1,111 III Hi : I I I rI ':I'1111'11i111
t 11,l11_11 II), t ,11111111}
III:, I Pi'
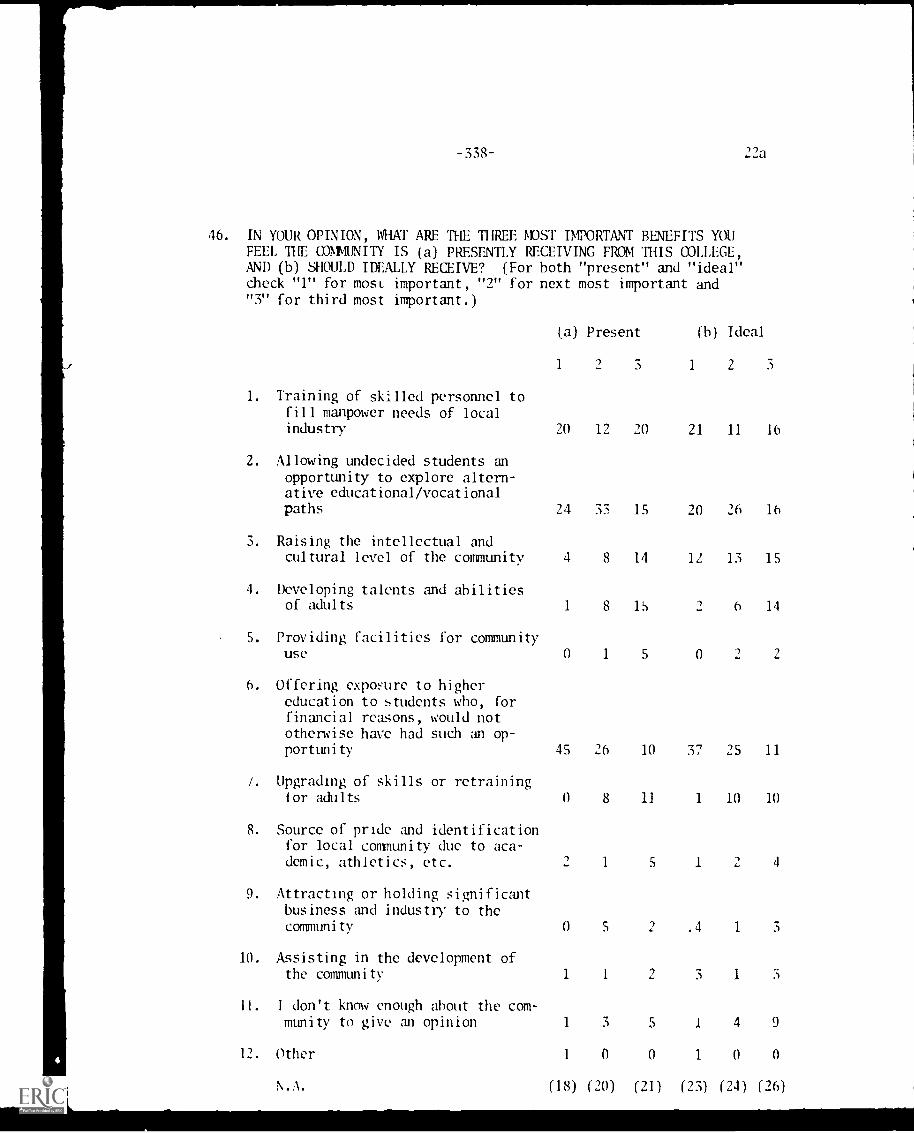
-338-
46. IN YOUR OPINION, WHAT ARE THE THREE MOST IMPORTANT BENEFITS YOUFEEL THE 0M4UNITY IS (a) PRESENTLY RECEIVING FROM THIS COLLEGE,AND (b) SHOULD IDEALLY RECEIVE? (For both "present" and "ideal"Check "1" for moss important, "2" for next most important and"3" for third most important.)
L,A.111,
(a) Present (h) Ideal
1 3 1 2 3
1. Training of skilled personnel tofill manpower needs of localindustry 20 12 20 21 11 16
2. Allowing undecided students anopportunity to explore altern-ative educational/vocationalpaths 24 53 15 20 26 16
3. Raising the intellectual andcultural level of the community 4 8 14 12 13 15
4. Developing talents and abilitiesof adults 1 8 15 2 6 14
5. Providing facilities for communityuse 0 1 5 0 2
6. Offering exposure to highereducation to students who, forfinancial reasons, would nototherwise have had such an op-portunity
/. Upgrading of skills or retrainingfor adults
45 26 10 37 25 11
0 8 11 1 10 10
8. Source of pride and identificationfor local community due to aca-demic, athletics, etc. 2 1 5 1 4
9. Attracting or holding significantbusiness and industry to thecommunity 0 5 2 .4 1 3
10. Assisting in the development ofthe communi tv
1!. I don't know enough about the com-munity to give an opinion
12. Other
1 1 2 3 1
1 3 5 1 4 9
1 0 0 1 0 0
N.N. (18) (20) (21) (23) (24) (26)
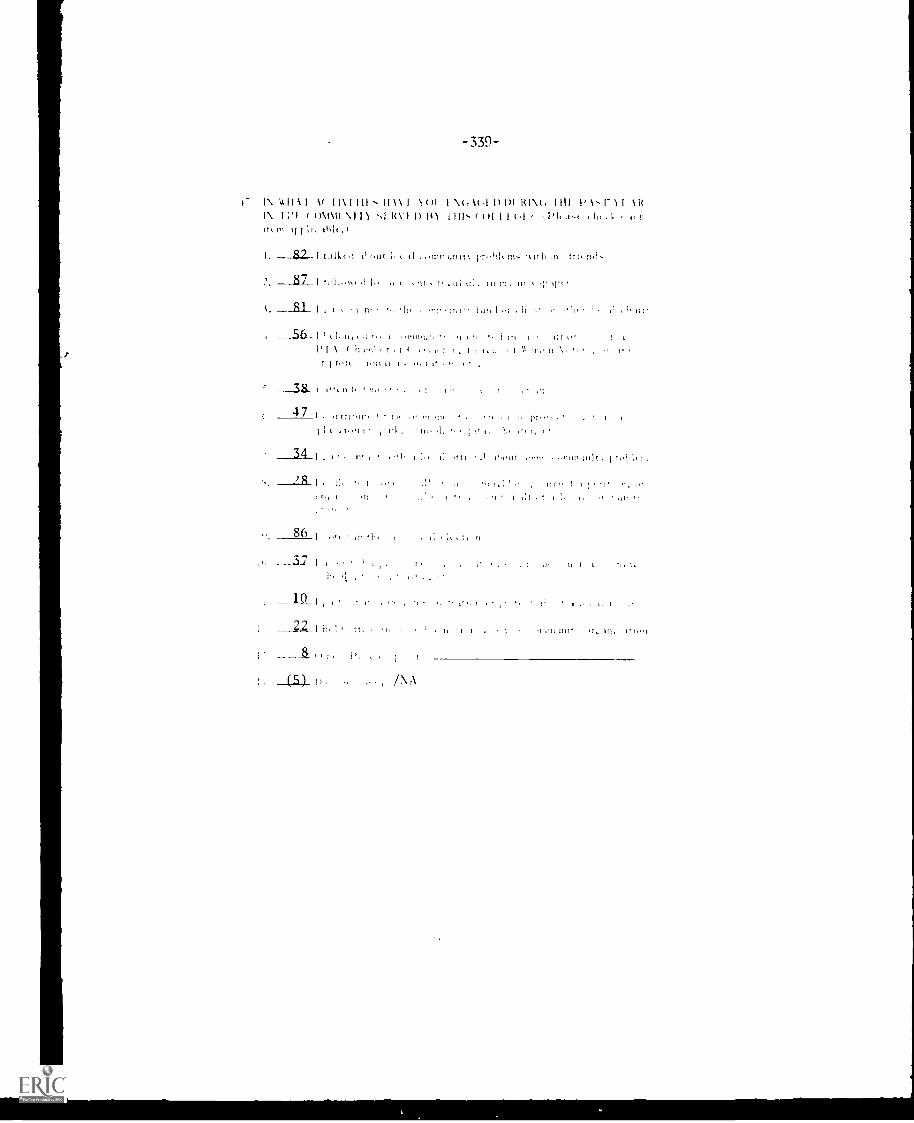
-339-
',111 I A( 11% 1111'N 111\ 1 1 ()I 1 \(,A(,11)1)1 1(1%(, 1111 PA,1' 1 1 11t
I\ I 1U \1 II \111 `,1 I) 1111, t I)! I I I. hm If I 11,
I. 82 I It Ills.1 I, s1 vnn W1171 tn, s,th at Iris nd,
sit til :15 51.yI
.11.1 '1 II I. I'll, . Itt
I n, 1:t I.I r I r 7 IL u I V I1'
r 1,:151 5 I 5'
I t". I, ' I
47I ,,,, sr sI ,rt, , I Is
I 5 ;..., t, 1I , n,. .1, I t,
34 I 51' t I It/ l,10 .5`11I11;11.1t r,,! 1( t t
2R ,I'
86i
10 1 .
22
8
(5) /NA
II
II I
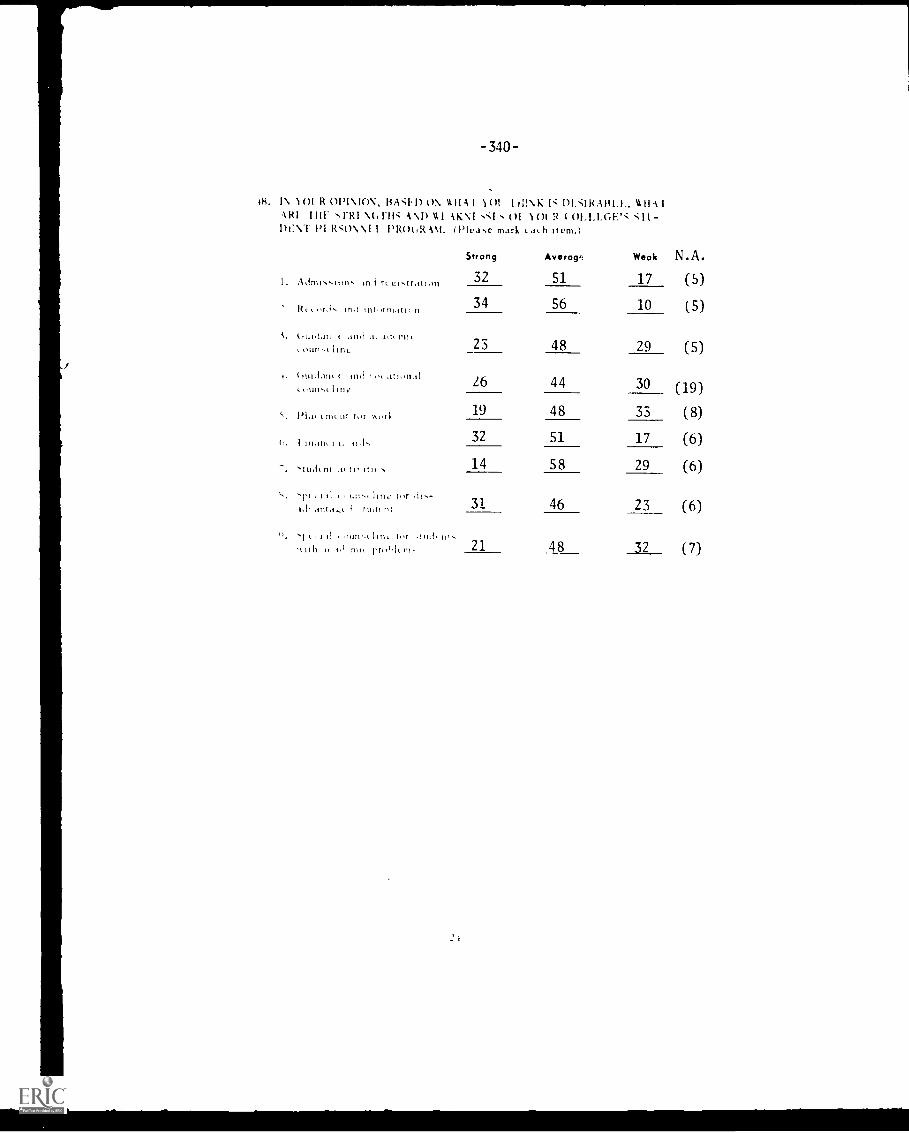
-340
48. I\ 101 R 01)1\10N, BASH) ON A 11 A 1 101 I 411\ K N M.:ARABIA., 0.111 I1R1 1111- ,i-Ri \.(,111,, AND 1t1 1KN1 ',SI 01 \01 9 ( OL1.1.01-:'; "dl-nt:vr P1 1-NONNI 1 131-20(,9 AM. (Plea,,e mark ca._ h item.)
I. Admi,,,i.m, in 1 r4 e i ,t r .tt 1 on
R, , ,,r1, Ina Int,rmatic n
i. (wiaan I an,1 a. 4,1. nu,. 0111, -..t it riL
I. (11.11,1.1III I Intl ' ,. .01,11.11L I'll11,t line
s. 11,, ( lilt III tor ri.,
I Math I I. 111,
. ,,,,,i, ii, .i, I i it], .
`.. ,p( 1 ti ,. 1.:1., line I.,r di.-si. .ito.t.., i ,,,id, r,:
'I. 1 t . I II 'Si01111 1111, 11" -Ttlil fl'`-`\1111 I, 1.I Mit rft*Il ,1).-.
Strang
32
Averages
51
Weak
17
N.A.
(5)
(5)
(5)
(19)
(8)
(6)
(6)
(6)
(7)
34 56 10
23 48 29
26 44 30
19 48 33
32 51 17
14 58 29
31 46 23
21 48 32
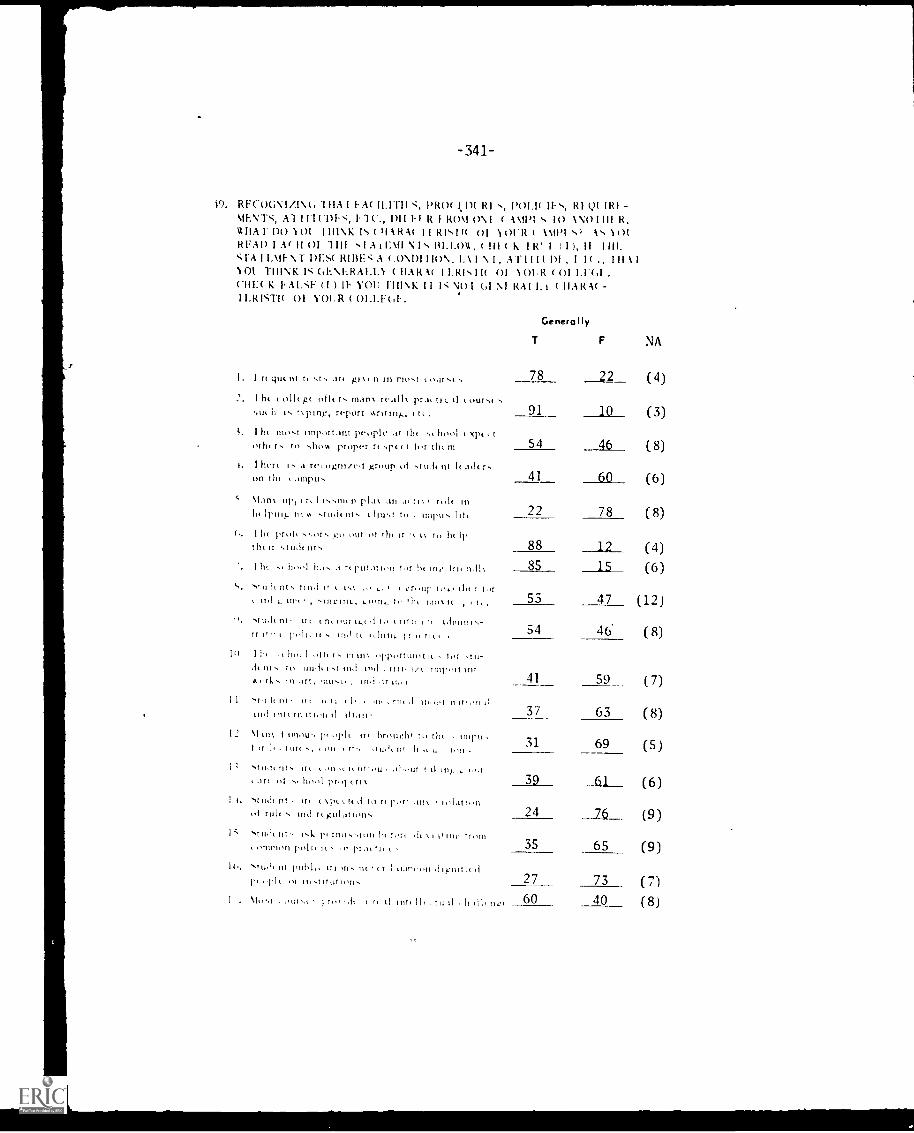
-341-
19. RI:OGNIIIV, -111A 1 I-A(11.1111 0R0( 1.01 RI s, 1'01.1( 11s, RI Qt IRI -11E\ITS, Al IFIUDIS, I.1 R 1 R0\1 0\1 ( A \tin s 10 \ \O III! R.\AIIA I- DO 101 I II1NK ( 11 A R A( 11 R1.11( 01 1Ol '12 ( \IN s% As 01READ I A( I I DI 1 1 1 1 s 1 A l'A11 \ I s 111.1.0A, ( III ( K I R' 1 I 1), II 1111.
srA I 1. MI- NT DES( RI A (.0N0I /ION, \ f \ I AT I 111 01 I I ( III \NOI THINK N \ ERA1.1_1 ( IIAR A( 1 [Rls 11( 01 10114 ( 01 1,1-01111:( K 1 AL.SI: ) 11 You FIII \K II iNt)i 61 NI RAI I. f ( 11.AR A( -11.RIST1( 01 1'01, R
Generally
NA
r( gut nt R .tr( n in most eour.e. 78 22 (4)#4,(
I he e olle ge oft( rs tnan prat tiL 11 e Our,(II 1, I\piry, re-port 91 10 (3)
I II( nu,.t important people .it the se 11001 e xpe t
of he .hot proper re .pce t for the in 54 46 (8)I. I heore Is a re.. own tc.1 group of 11. r
on the e.unpu. 41 60 (6)\lan upi I re I t..nu n plan an . ti\ rolehe 11'111)- 11: ,111(i(111, 11111,1 t0 t 1111111, 111( 22 78 (8)
(,. I he rot, our (N1 'hill' 1, 1, to he Ipill it 88 12 (4)I he pool 11.1, .1 Ti , 1'111.111,n tor he trii 85 15 (6)
Ind u e t., . i.rour 1111 Itt 11,1 11111% to I
nt, it -I 10 11-1111 '1 111111i111,-
53 47 (12)
if 1`1110. It 111.11( 11111111.- t, rik, .54 46 (8)
In I I }WI i oiIi r. III in% opportuni(Ii , for -.til-de tit s to Linde r. uui Ind rut, i/1 1111
ai,rk. in art. '1111,1. 111.1 It tie 1 41 59 (7)1 'I1 1, III" t 111i I, MI( III 11110'11
1101, 'n1(111111.11, tl itiao 37 63 (8)2 Mtn% 1 1101111,, ,,plk tr, brouilie I., the impn
Tor I, t lilt t111 (1. .111.1( r1I II31 69 (5)
T11, 011, Ie 1111.111 110111 1,a tnf 11.1
of , pri(rt 39 61 (6)stud, it e\pee1e,i 11/ ft p, 1 an%
I
111 rttle , 1011 1'1)1,111,01m,
, Ill t.l p rnu.aon he It 10 01
24 76 (9)
11111111.111 pAlt 3-1,1111k ( 35 65 (9)10. SI11.1( nt pull, 111 11 I 11.11,..iin
t/111 or Ili ,1111.111.17, 27 73 (7)I \1111 11lit-1, 1 (( ti I Ill, II( to h 1111 net 60 40 (8)
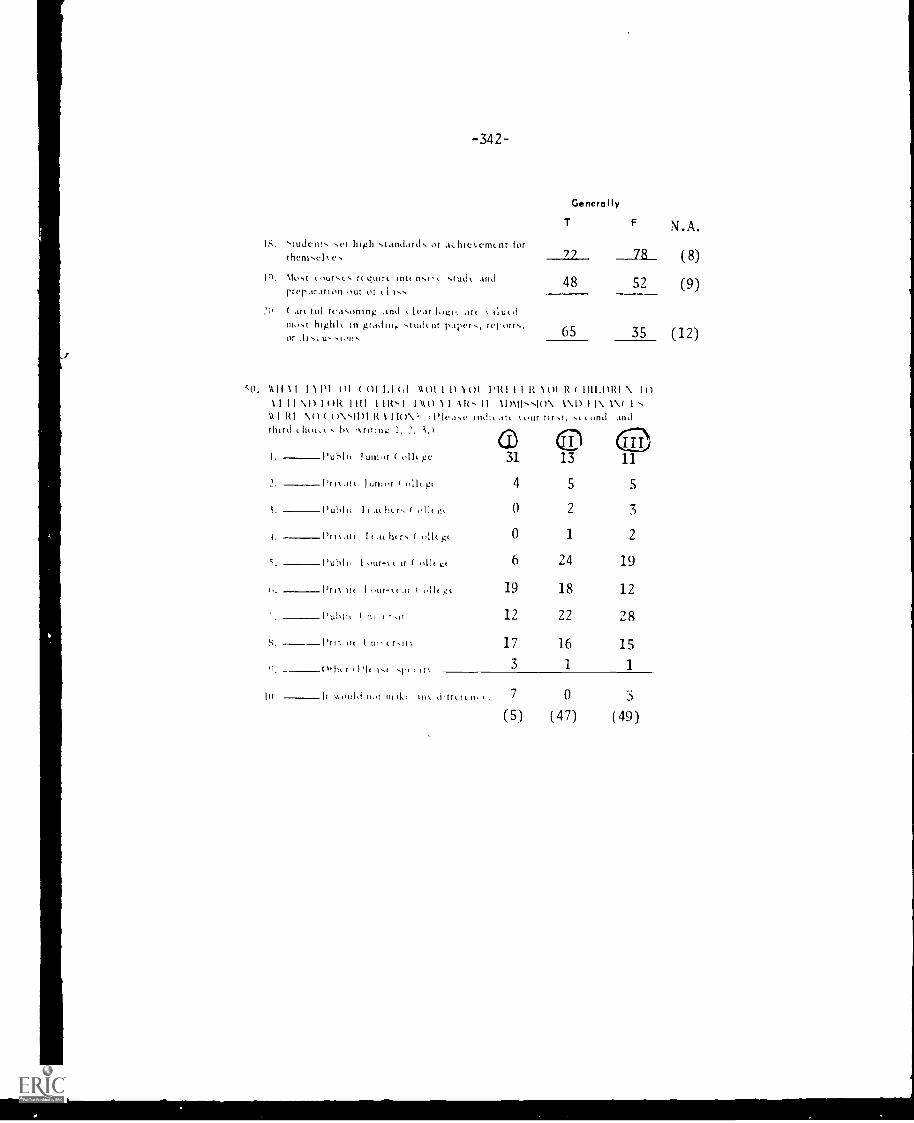
-342-
IS.
10.
students "et high standards of hie\ emcnt forthernsek es
\lost oursts re quire_ tnit n.r c stuth andpreparation out eel e I Is.
( are tul reasoning and e lear log], are e titledmost highl. ut gte,liie student rapers, reIrsortS,Of J1'1( ,1011,
Generally
T
72
F N.A.
(8)
(9)
(12)
48 52
65 35
sO. 1\11 \I I 1 PI 01 ( 01 LI (,1 1101 I I) 101 PRI 11 R 101 R ( 1111.0R1 \ I(1\ I I 1 \11 10R. 1111 I IRs1 I 1,k0 \ I AR. II \11\11.-...10\ \\I) I I\ \\( I s\\ I RI NAI ( ().v.,11)1 R \ 11(1 \' ,pie,,, ,mii,,,i,_ ,,,,,,. t...,,, .,,,,,,,,{ andthird e hole., s bk n.riting I, 2, 3,1 0I. Puhlie Tumor ( olle.ge 31 13 11
I'm ate. )1111:0t ( OH, ),Il 4 5 5
;. pub!, I, .te he_ rs ( ,t1le Lte 0 2 3
i. 1)-,, it, I , .t, hers ( ille.ge. 0 1 2
,. pub], I our -t, tr ( ilt ., 6 24 19
e.. Prig. it, I teir-ke it t olle ,,...e. 19 18 12
pub', I III , -sIt 12 22 28
s. Prie. et, I nrersitk 17 16 15
3 1 1
Ili It cull 10( m tl., Ink Jilt, rt n. C. 7 0 3
(5) (47) (49)
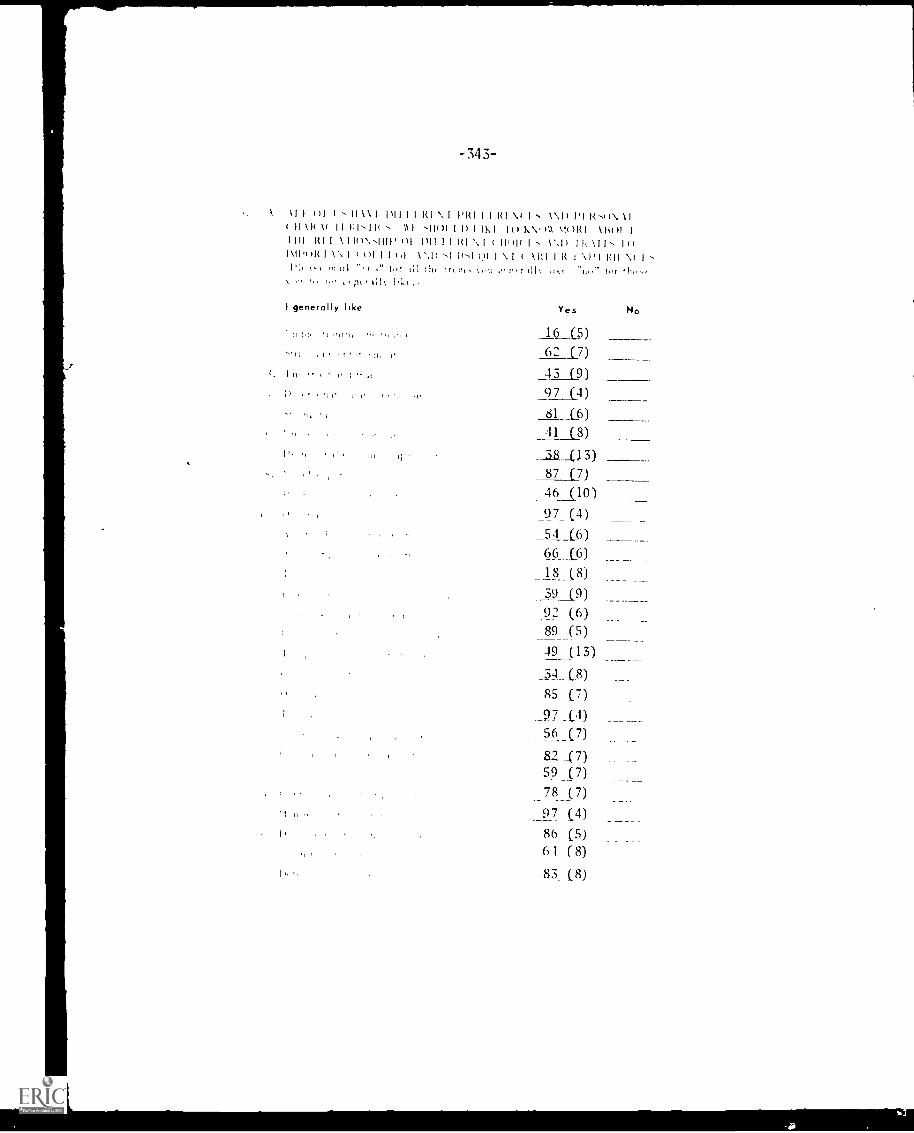
343-
\ \ I I n i I s I I \ I I)I I I I I P1(11110 \r I s \\I) I'l lksn\ 11r \H \( II HI.IH twI .1101 I I) I ik I k \')',1 \ 11 WI Alin!
I III II I \ I InN,sliip ()I 1)111
I HI ( !Inv I \,I) I l 1I Is InI \11'(W I \\I I nl I I n1 \`,1) lisl (,)I I \ I \Hi I I: t \I'l \I I
,`1 ul f r ill ;II, ItcnI, pt r ilk Ills(\ 1, m lu 'III\
I generally like
I 11 ,11,1, 4.t
) I I
Yes No
16 (S)
62 (7)43 (9)97 14)81_10)41 (8)
3)87 (7)
_46 _(_10)
97 (4)_54 (6)00 (6)18(8)39 (9)92 (6)89 (5)49 (13)
_34_18)
85 (7)_97 (4 )56 (7)82 _(7)59 (7)
97 (4)86 (5)61 (8)83 (8)
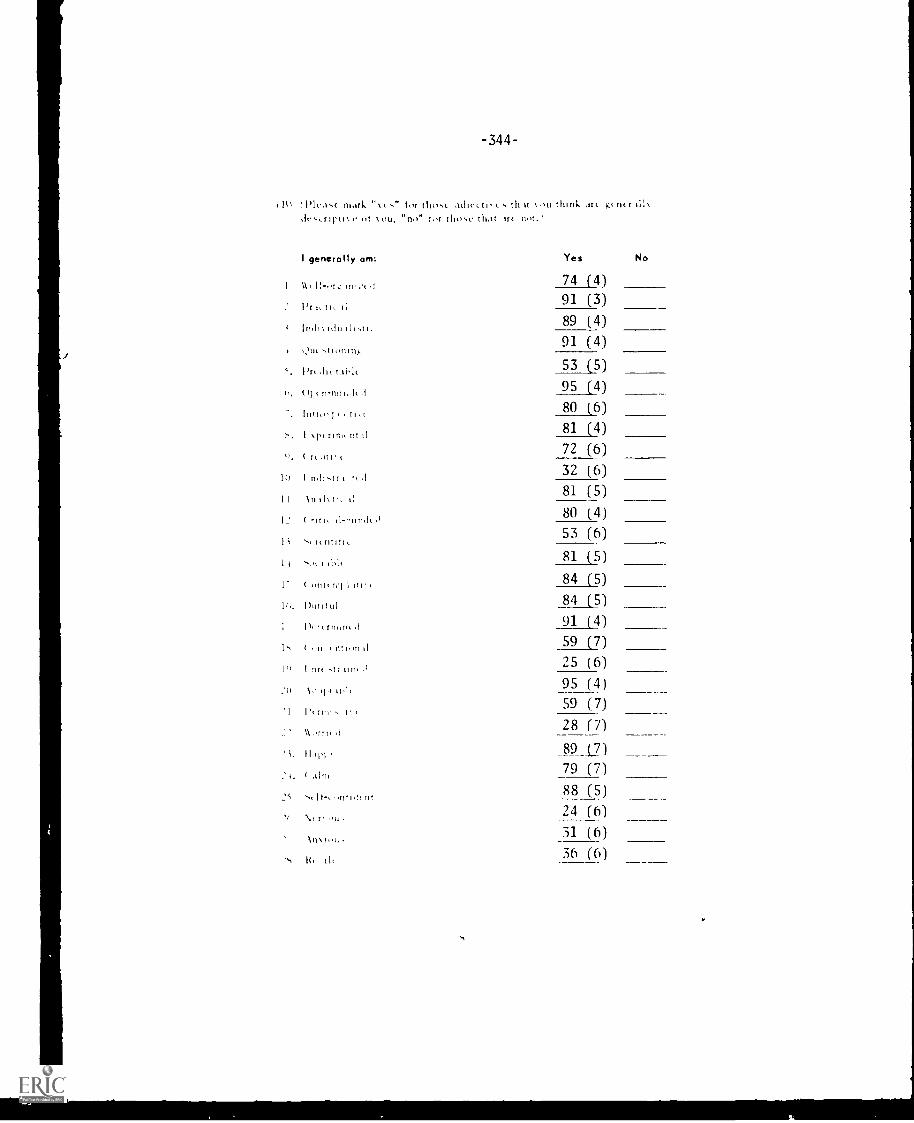
-344-
lit ( Pleas( mark " for thco.a& adit.;t1,; th think ar; n; r;1,;,rirt.t at 01.1, "no" t4r tho,, that IIC 1144.)
I generally am:
I 11, itl'r a ti;
; .11111 dii i i
l'r; ,Iii
ii-nu tolt t1
t t 11 tt
S. I r; tint, in 11
). t r,atl
10 I n,11,tr
1 \ 1111\ II. t't
'lilt 11-1'1111dt
,itnt111,
1 i St, I 11,14
Yes
74
No
(4)91 (3)89 (4)91 (4)
53 (5)95 (4)80 (6)81 (4)72 (6)32 (6)81 (5)80 (4)53 (6)
81 i5)
It..
1
1"
'I
21.
( 41144 1,111 1ti
II1liti/11
l)t t rin,nk .1
411 t11ri4n11
I lir, --tr tin, .1
,t,i,
Pt (I-11-, l\k 11(71, t1
II
t .11111
sttll-t .1111,1,11(
NO
84 (5)84
91
(5)(4)
59 (7)25 (6)95_(4)59 (7)
28 (7)
_89_1_7)
79 (7)88 (5)24 (6)31 (6)56 (6)
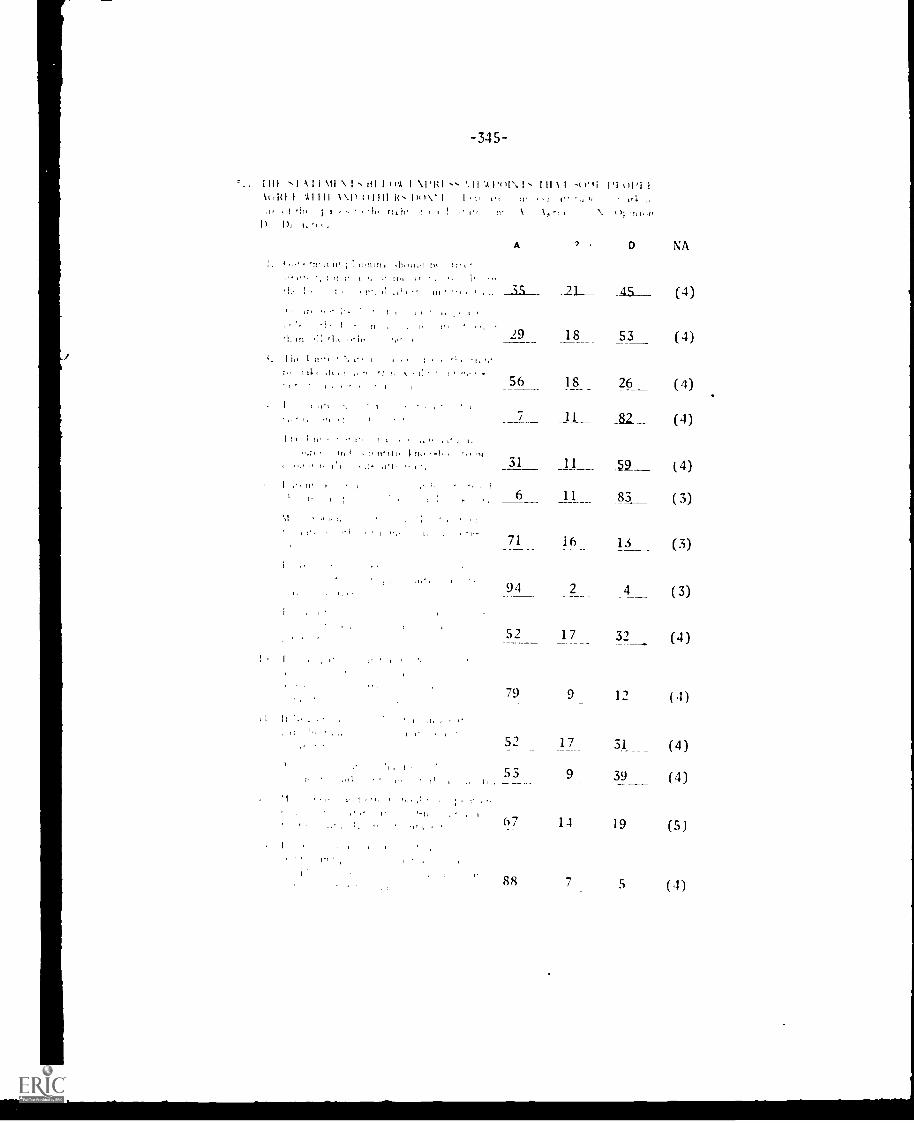
-345-
, I I I I .1 A I I \1I \ 1 s I i i I ( ) A I \pit{ s 'Hi ',I, p; II %,, I. III \ I .()..II II (01,1 I
VI(1(1 I 'AIM 1\111.)1111 Its 1)41\* I I I, 1 :I' "1 l. 1', 1 ,,I,
I),t 11, I I ..h. rli.il ; . r
1)1 1.'ll .
; ,a, .1. at II' ; : ipmn, ,11.,a1,1 t,t
a i .1 , . ir, 1, ' a
I
t I, , ''.
t \
A
%,...,
7
r )i .ni.,i.
D NA
! n.r. ._a5 45 (4); a
11
I( (11 .:', ;I., -.I, 29- 18 53 (4)4. I it< I ti ' '. ;
t,, a II., ,Ic , ; ,. , 1 t, k I:
56 18 26 (4)I
11_ 82_ (4)I t.. I ;,' . . - t ; a
a ' a' a III 4 I , II I [la 1. 1 la }.. , , , ,1,
31 _11 52___ ( 4)I . ii r
6 11 83 ( 3)
71 16 IS (3)
94 2 ( 3)
I
57 17 32 (4)I
79 12 ( 4)
r 1 17 31 (4)
1,53 9 39 (4)
'1
67 14 19 (5)I
88 5 (4)
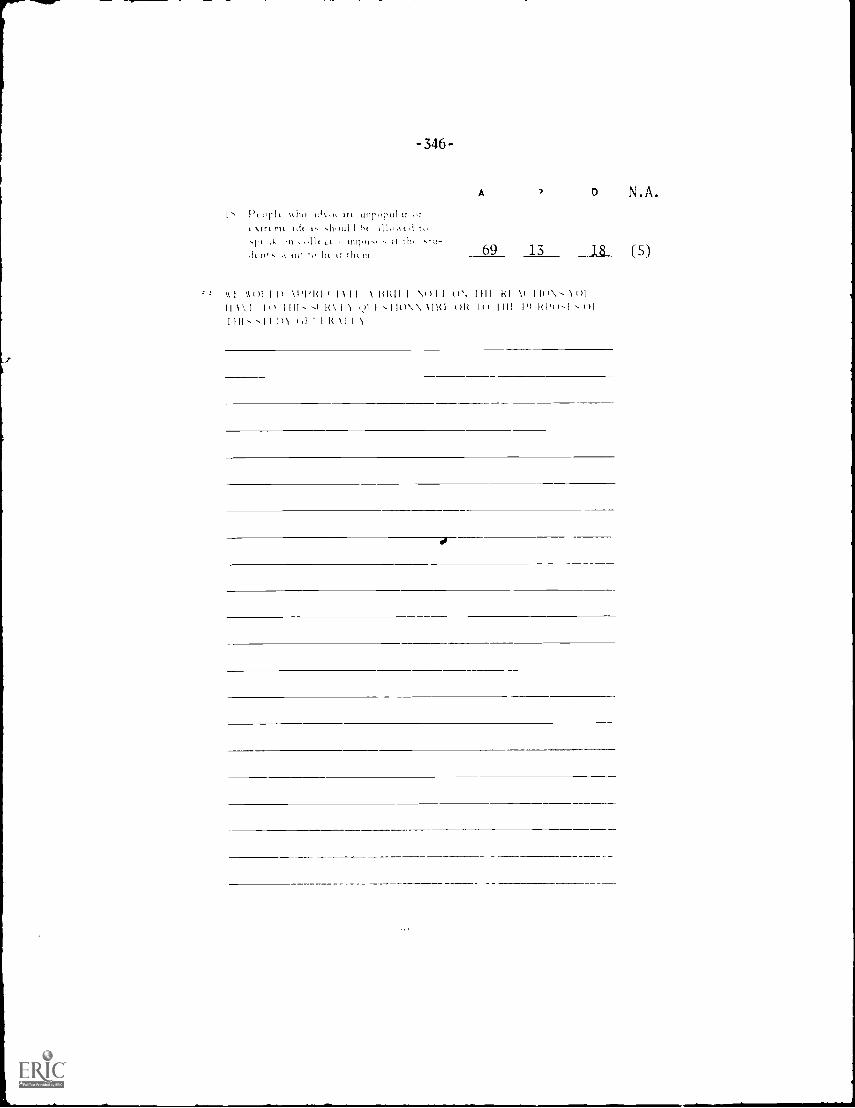
-346-
I c I), 1-It %%Ito t,1,,,, IN titir,ptil tr .$r
, \rr, mt id, ,, ,h,,ui I 1,, ,11,,,,i tItt ,k 'II ,,,Itt Lt t t1111,11, , It Olt ,t11-
,1, IV, A It It t,t Ill tr tit, Tit
A 7 0 N.A.
69 13 18 (5)
z ; m ,,k,)! I I) \ppm , I \ I i \ imil i .0 )11 ,r, Hit RI 1,( I Itt\., )1)1
II \\ I II) lin, -.1 R\ I) ,,)I I ,11tr\\1111 ()It II) IIII pi Rp(),I , ()I
1 1 1 1 , ' , I I 1 11 td I R1111
6

-347-
TABLES TO CHAPTER 6
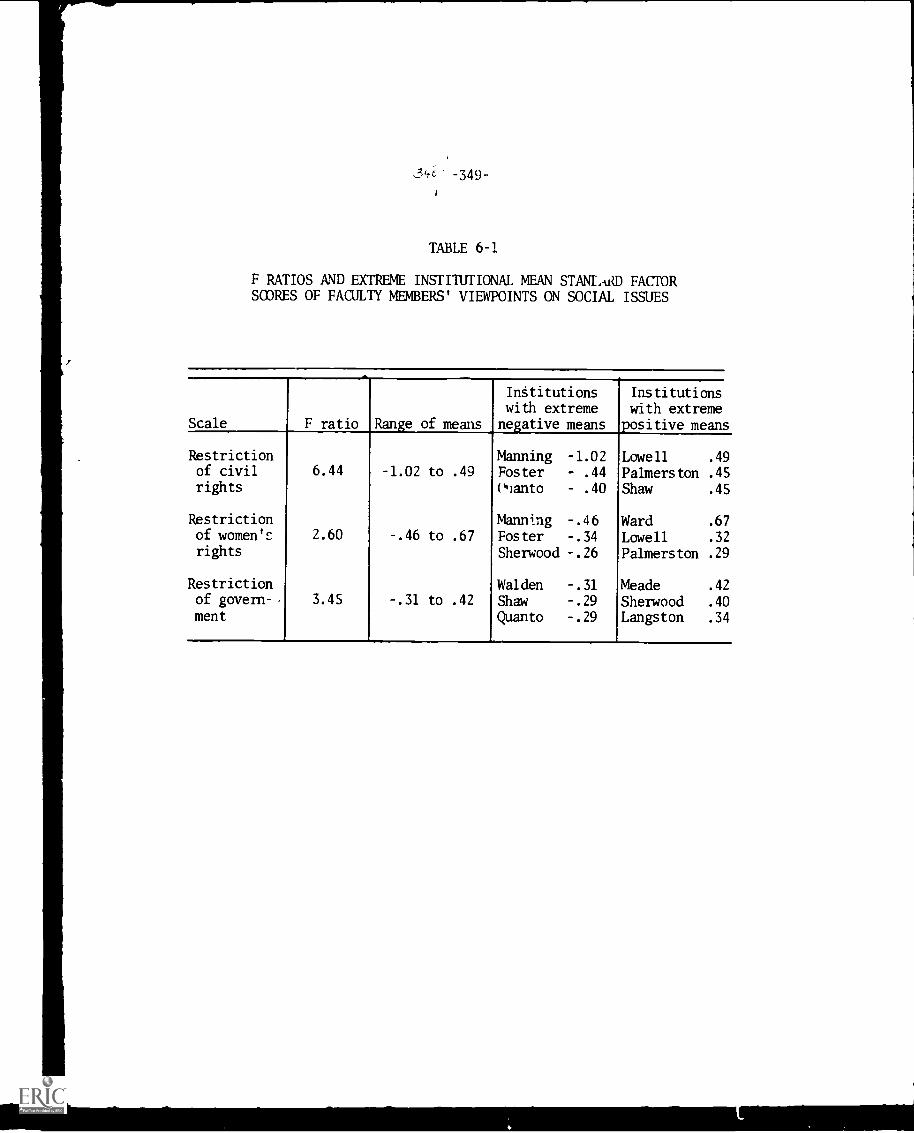
34-t- -349-
TABLE 6-1
F RATIOS AND EXTREME INSTITUTIONAL MEAN STANIARD FACTORSCORES OF FACULTY MEMBERS' VIEWPOINTS ON SOCIAL ISSUES
Scale F ratio ,Range of means
Intitutionswith extremenegative means
Institutionswith extreme
means
Restriction Manning -1.02
,positive
Lowell .49of civil 6.44 -1.02 to .49 Foster - .44 Palmerston .45rights Olanto .40 Shaw .45
Restriction Manning -.46 Ward .67of women's 2.60 -.46 to .67 Foster -.34 Lowell .32
rights Sherwood -.26 Palmerston .29
Restriction Walden -.31 Meade .42
of govern- 3.45 -.31 to .42 Shaw -.29 Sherwood .40ment Quanto -.29 Langston .34
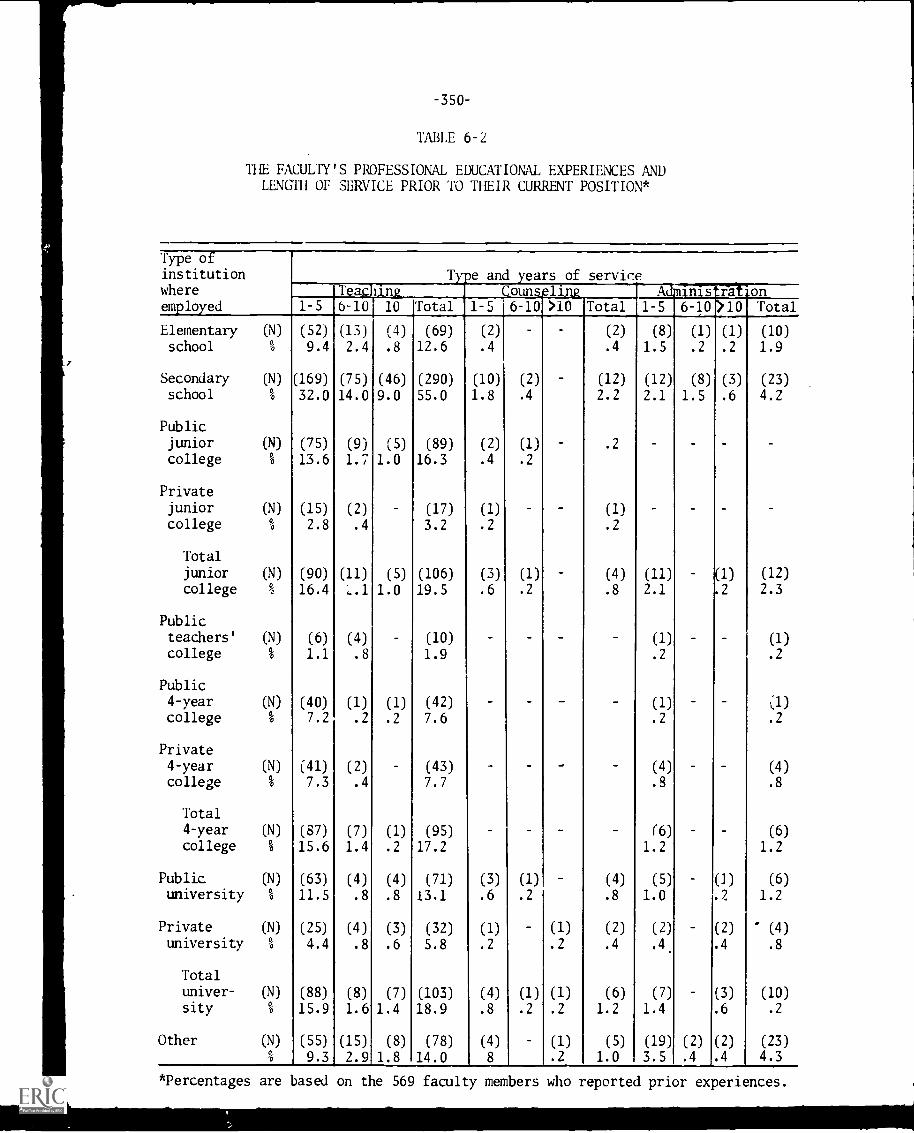
-350
TABLE 6-2
THE FACULTY'S PROFESSIONAL EDUCATIONAL EXPERIENCES ANDLENGTH OF SERVICE PRIOR TO THEIR CURRENT POSITION*
Type ofinstitutionwhereemployed
Type and years of serviceleachine Counsplinc_ Ac unistrat,on
6-10 )10 Total1-5 6-10 10 Total 1-5 16-101>10 Total 1-5
Elementary (N) (52) (13) (4) (69) (2) (2) (8) (1) (1) (10)
school 9.4 2.4 .8 12.6 .4 .4 1.5 .2 .2 1.9
Secondary (N) (169) (75) (46) (290) (10) (2) (12) (12) (8) (3) (23)
school 32.0 14.0 9.0 55.0 1.8 .4 2.2 2.1 1.5 .6 4.2
Publicjunior (N) (75) (9) (5) (89) (2) (I.)
college 13.6 1.7 1.0 16.3 .4 .2
Privatejunior (N) (15) (2) (17) (1) (1)
college 2.8 .4 3.2 .2 .2
Total
junior (N) (90) (11) (5) (106) (3) (1) (4) (11) (1) (12)
college 16.4 1.0 19.5 .6 .2 .8 2.1 .2 2.3
Publicteachers' (N) (6) (4) (10) (1) (1)
college 1.1 .8 1.9 .2 .2
Public4-year (N) (40) (1) (1) (42) (1) k:1)
college 7.2 .2 .2 7.6 .2 .2
Private4-year (N) (41) (2) (43) (4) (4)
college 7.3 .4 7.7 .8 .8
Total4-year (N) (87) (7) (1) (95) (6) (6)
college % 15.6 1.4 .2 17.2 1.2 1.2
Public (N) (63) (4) (4) (71) (3) (1) (4) (5) ( ) (6)
university % 11.5 .8 .8 13.1 .6 .2 .8 1.0 .2 1.2
Private (N) (25) (4) (3) (32) (1) (1) (2) (2) (2) (4)
university % 4.4 .8 .6 5.8 .2 .2 .4 .4 .4 .8
Total
univer- (N) (88) (8) (7) (103) (4) (1) (1) (6) (7) (3) (10)
sity 15.9 1.6 1.4 18.9 .8 .2 .2 1.2 1.4 .6 .2
Other (N) (55) (15) (8) (78) (4) (1) (5) (19) (2) (2) (23)
9.3 2.9 1.8 14.0 8 .2 1.0 3.5 .4 .4 4.3
*Percentages are based on the 569 faculty members who reported prior experiences.
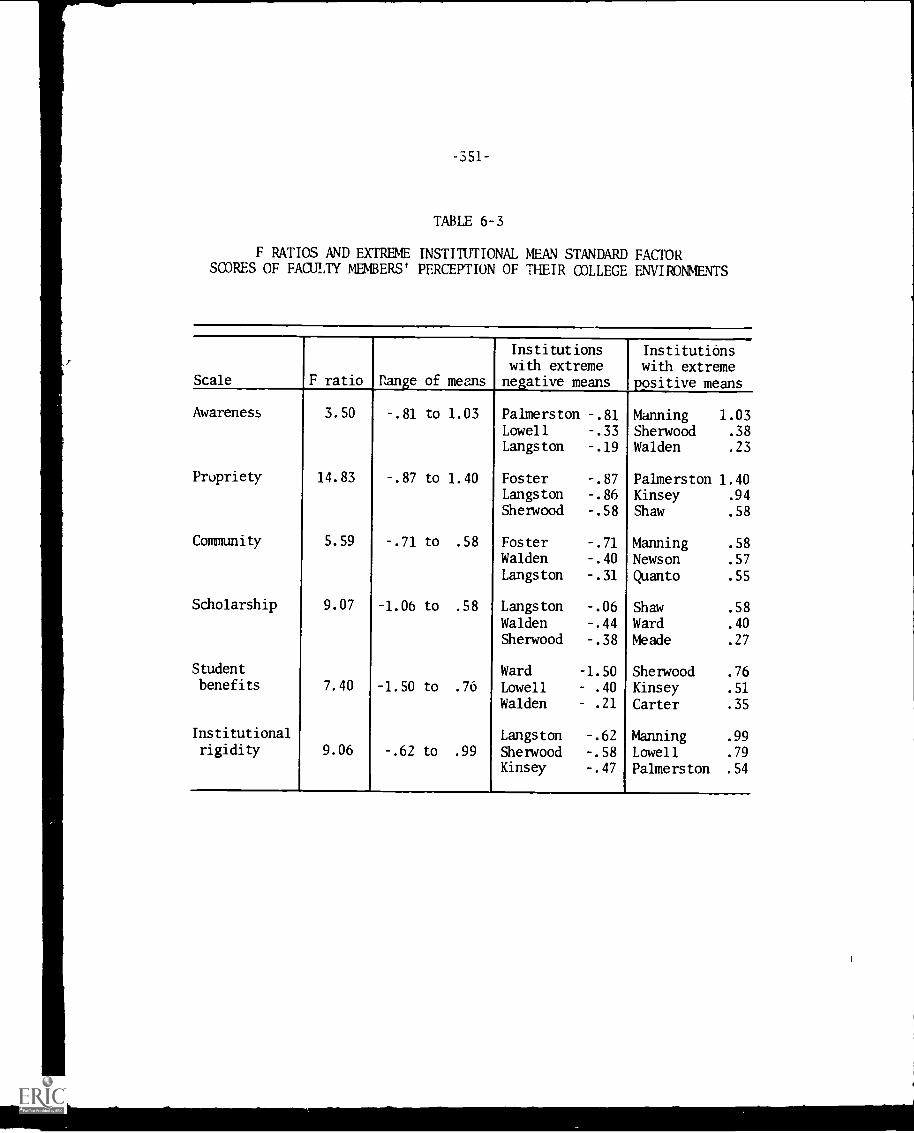
-351-
TABLE 6-3
F RATIOS AND EXTREME INSTITUTIONAL MEAN STANDARD FACTORSCORES OF FACULTY MEMBERS' PERCEPTION OF THEIR COLLEGE ENVIRONMENTS
Scale F ratio range of means
Institutionswith extremenegative means
..Institutionswith extreme
positive means
Awareness 3.50 -.81 to 1.03 Palmerston -.81 Manning 1.03Lowell -.33 Sherwood .38
Langston -.19 Walden .23
Propriety 14.83 -.87 to 1.40 Foster -.87 Palmerston 1.40Langston -.86 Kinsey .94
Sherwood -.58 Shaw .58
Community 5.59 -.71 to .58 Foster -.71 Manning .58
Walden -.40 Newson .57
Langston -.31 Quanto .55
Scholarship 9.07 -1.06 to .58 Langston -.06 Shaw .58
Walden -.44 Ward .40
Sherwood -.38 Meade .27
Student Ward -1.50 Sherwood .76benefits 7.40 -1.50 to .76 Lowell .40 Kinsey .51
Walden .21 Carter .35
Institutional Langston -.62 Manning .99rigidity 9.06 -.62 to .99 Sherwood -.58 Lowell .79
Kinsey -.47 Palmerston .54
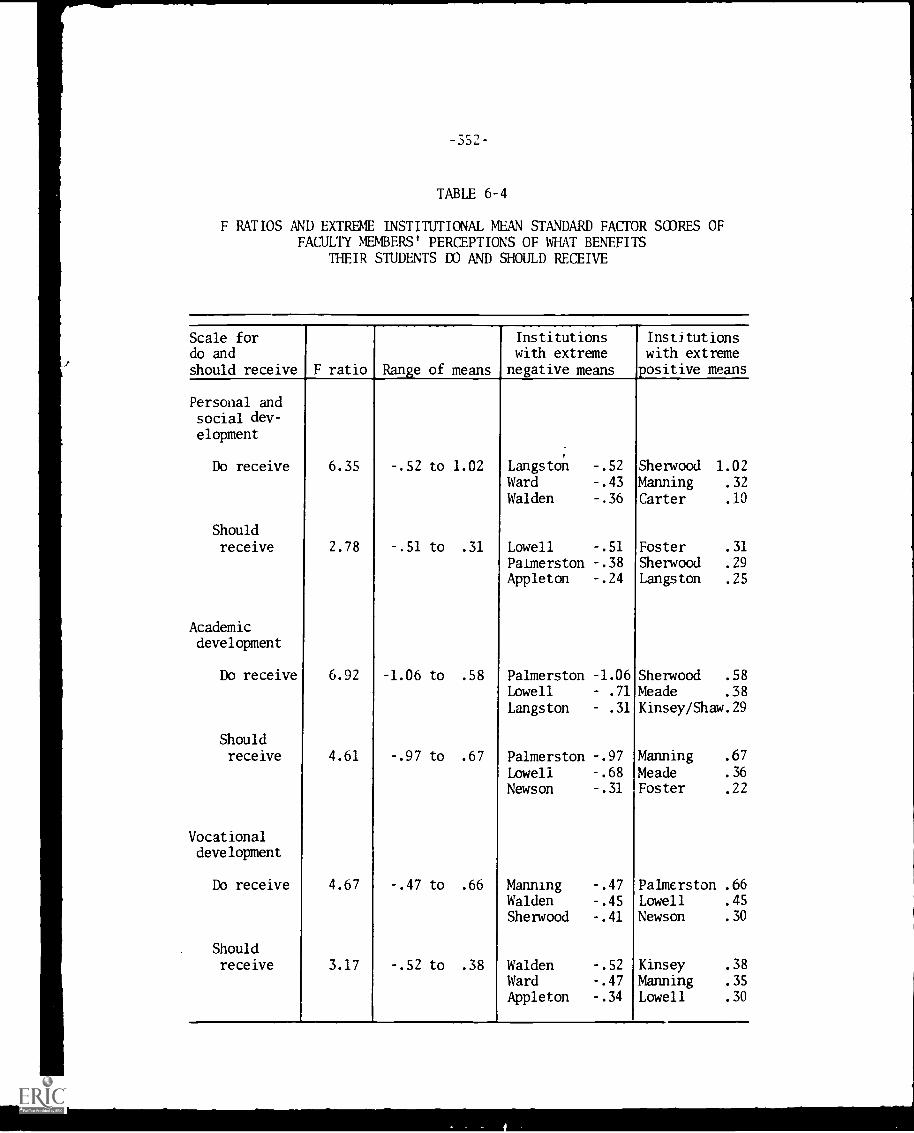
-352-
TABLE 6-4
F RATIOS AND EXTREME INSTITUTIONAL MEAN STANDARD FACTOR SCORES OFFACULTY MEMBERS' PERCEPTIONS OF WHAT BENEFITS
THEIR STUDENTS DO AND SHOULD RECEIVE
Scale fordo andshould receive F ratio Range of means
Institutionswith extreme
negative means
Institutionswith extreme
positive means
Personal andsocial dev-
elopment
Do receive 6.35 -.52 to 1.02 Langston -.52 Sherwood 1.02
Ward -.43 Manning .32
Walden -.36 Carter .10
Should
receive 2.78 -.51 to .31 Lowell -.51 Foster .31
Palmerston -.38 Sherwood .29
Appleton -.24 Langston .25
Academicdevelopment
Do receive 6.92 -1.06 to .58 Palmerston -1.06 Sherwood .58
Lowell .71 Meade .38
Langston .31 Kinsey/Shaw.29
Shouldreceive 4.61 -.97 to .67 Palmerston -.97 Manning .67
Lowell -.68 Meade .36
Newson -.31 Foster .22
Vocationaldevelopment
Do receive 4.67 -.47 to .66 Manning -.47 Palmerston .66Walden -.45 Lowell .45
Sherwood -.41 Newson .30
Shouldreceive 3.17 -.52 to .38 Walden -.52 Kinsey .38
Ward -.47 Manning .35
Appleton -.34 Lowell .30
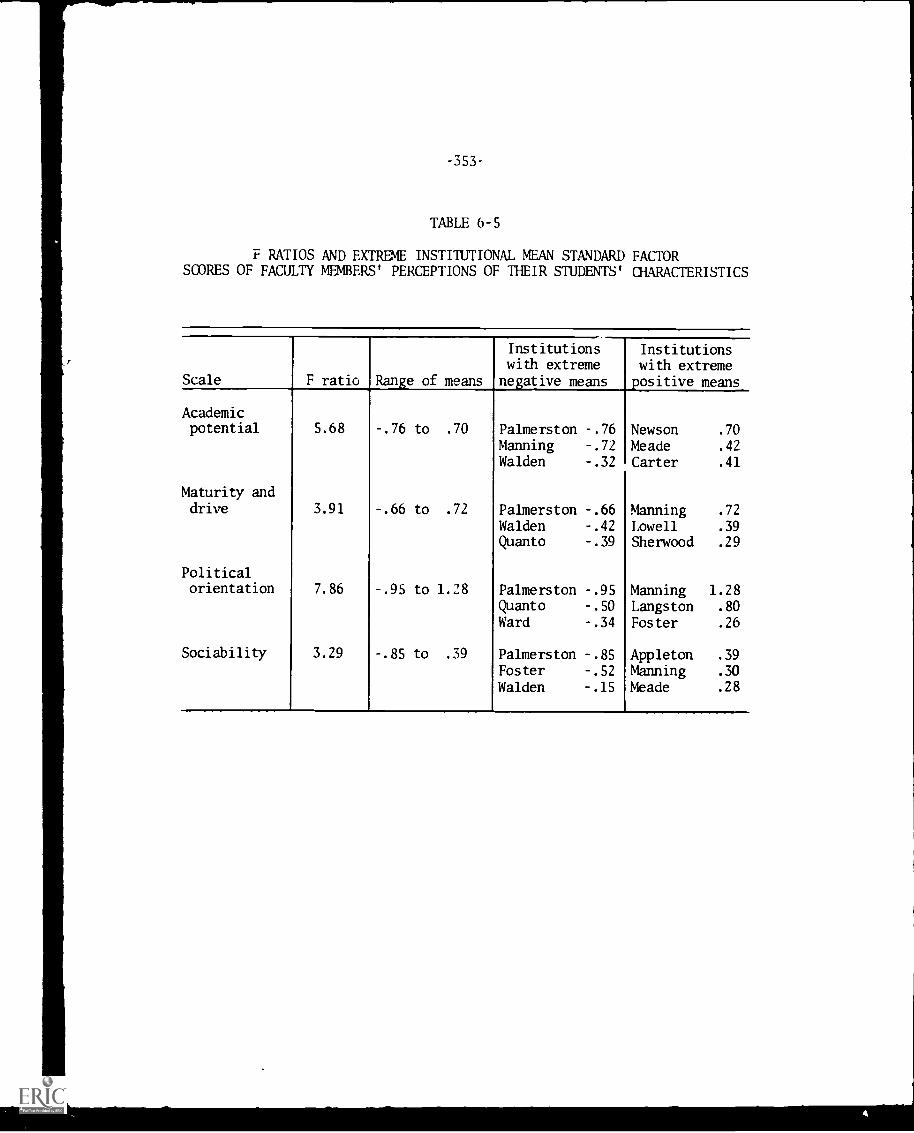
-353-
TABLE 6-5
F RATIOS AND EXTREME INSTITUTIONAL MEAN STANDARD FACTORSCORES OF FACULTY MEMBERS' PERCEPTIONS OF THEIR STUDENTS' CHARACTERISTICS
Scale F ratio Range of means
Institutionswith extreme
negative means
Institutionswith extremepositive means
Academicpotential 5.68 -.76 to .70 Palmerston -.76 Newson .70
Manning -.72 Meade .42
Walden -.32 Carter .41
Maturity anddrive 3.91 -.66 to .72 Palmerston -.66 Manning .72
Walden -.42 Lowell .39
Quanto -.39 Sherwood .29
Politicalorientation 7.86 -.95 to 1.28 Palmerston -.95 Manning 1.28
Quanto -.50 Langston .80
Ward -.34 Foster .26
Sociability 3.29 -.85 to .39 Palmerston -.85 Appleton .39
Foster -.52 Manning .30
Walden -.15 Meade .28
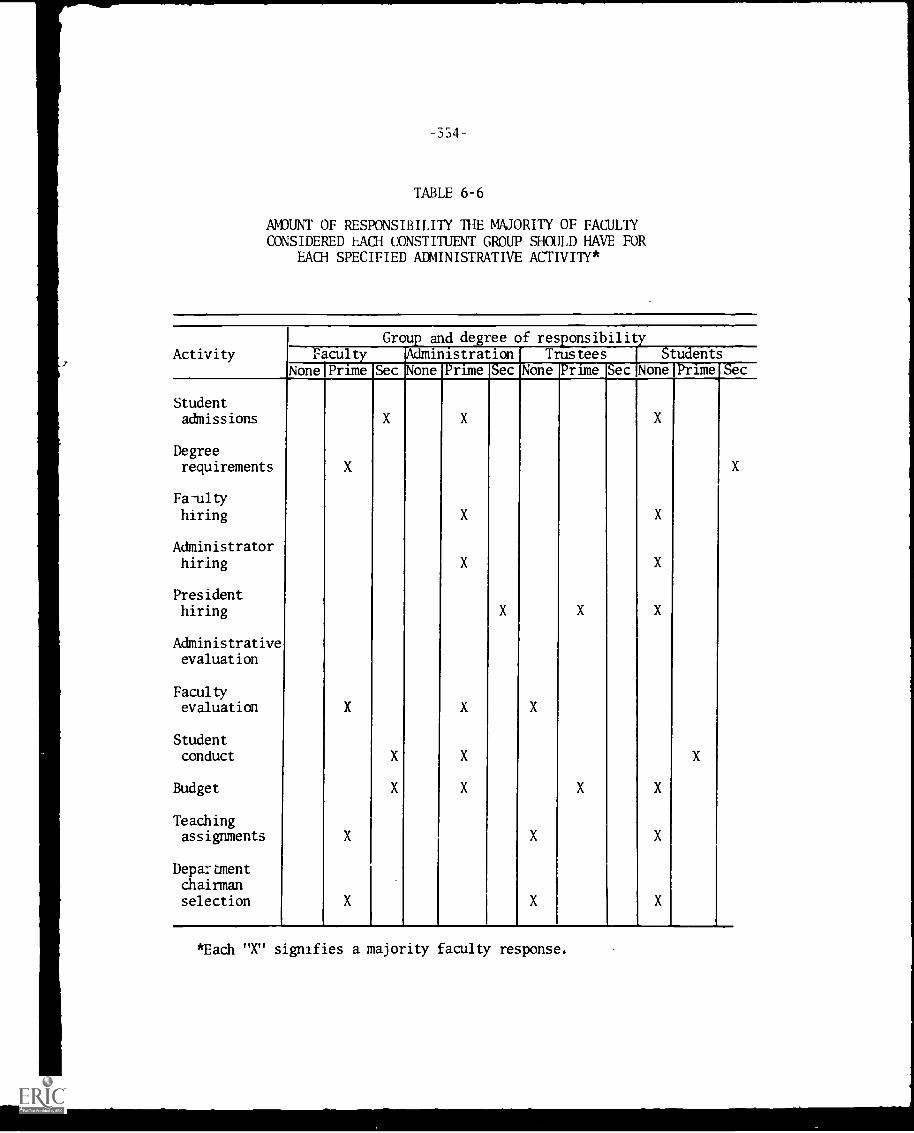
-334-
TABLE 6-6
AMOUNT OF RESPONSIBILITY THE MAJORITY OF FACULTYCONSIDERED EACH CONSTITUENT GROUP SHOULD HAVE FOR
EACH SPECIFIED ADMINISTRATIVE ACTIVITY*
Activity FacultyNone Prime
Group and degree of responsibilitTrustees Students
SecSec Prime Sec None Prime Sec None PrimeAdministrationNone
Studentadmissions
Degreerequirements
Fa -silty
hiring
Administratorhiring
Presidenthiring
Administrativeevaluation
Facultyevaluation
Studentconduct
Budget
Teachingassignments
Depa: tment
chairmanselection
X
X
X
X
X
X
X
X
X
X
X
X
X
X
X
X
X
X
*Each "X" signifies a majority faculty response.
I
-355-
APPENDIX E
COUNSELOR MARGINAL DATA
AND
TABLE TO CHAPTER 7
1
2c '1
.NppRo\ 1'iR1
THE STUDY OF
JUNIOR COLLEGES
COUNSELOR QUESTIONNAIRE
N1ARGINALS and
% MISSING OBSERVATIONS (IN PARENTHESES)
( (mit- for t hi Stud\ of F aluatton
Oraduatl S(11001 of Elk( anon
I ur-ot \ of ( alitornta,
off tc. c of Hoc at ion ( °num. t No. Cqs
(11 i ORM 2;;"-1, 11 -I
t
!
/
25,'!'-359-
Dear Colleague:
You have been randomly chosen to participate in a nationwide study of a
select group of approximately 15 community colleges. The study is being under-taken by the Higher Education Project of U.C.L.A.' c Center for the Study ofI valuation under contraet to the National Center for Educational Statistics ofthe Office of Education. This study is designed to provide the Office of Edu-cation with empirically hased suggestions for more effective development ofthe community or two-year colleges.
By taking a few minutes to complete this questionnaire you will be makinga significant contribution toward hridging the gap between action at the federallevel and real needs at the institutional level.
Be assured that your responses to this questionnaire, as well as those ofyour colleagues, will he analyzed in a statistical sense only and that youranonymity will be absolutely protected by your following the directions listedbelow:
I. Do not write your name on this booklet.
2. When you have completed this questionnaire, please write your nameand school in the space provided on the attached postcard (on the left).
I. Detach the postcard and return it in a mailing separate from the ques-tionnaire.
This procedure allows us to know who has not returned the questionnairewhile preserving the strict anonymity of the questionnaire respondents themselves. We will then be able to send follow-up requests to the nonrespondents.At no time will your responses be seen by anyone from your institution.
We will be very grateful if you would complete and return this question-naire to us withinl days. We thank you in advance for the time taken from yourbusy schedule to complete this questionnaire.
Very sincerely,
J -Imes W. TrentPrincipal Investigator
1
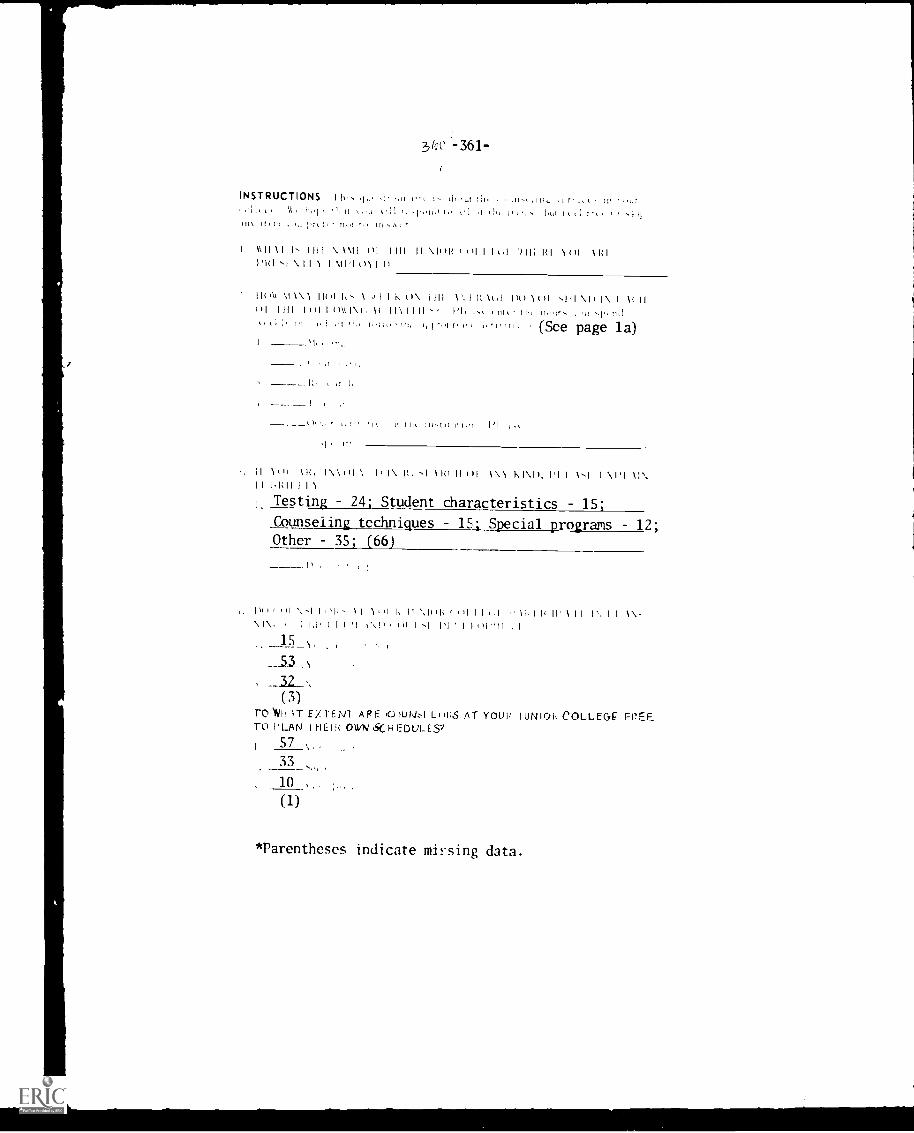
3(ac -361-
INSTRUCTIONS I t,, t ,.r
tm it, PI tt 114.! !t, in r
I 111111 1, 1111 \ 1111 ol 1111 11 \111k 1 ill 1 I id 1(1 1111 1111
l'1{1 \ I 1 1 I \IP! i11 1 11
\\), \ I I k 0\ I g \,,I flu \it)) \I) i\ I \ fl1)1 I III I t)1 1 ()111\.(. 11 11\1111 s,tl 1,1 T. 'II, (See page 1a)
).'t lk "t It tt tn, 111,t l'It'tt 1,t.
t It'
it 111. 1\ \111 \ 1 li 1\ 1R( II ()I 1\1 kl\.1). 11 1 1.1 I \ \I%I I HO 1 I I 1
I. Testing 24; Student characteristics 15;
Counseling techniques 15; Special programs 12;
Other 35; (66)
1)1i \ -111)k- \I 1.)1 1. 11 \ 1,111 11'111\1 11 `1 , \11 t,1 I ' 1 1 i,1-11 .1
),
53
, 32
(3)ro \T EX TENT ARE (01UtJ.1 Li 'RSTO PLAN 1 Flt: 1 It OWN SC H EWA- [Si
i 57 \
10 ,
(1)
AT YOUP IUNI01, COLLEGE FREE_
*parentheses indicate missing data.
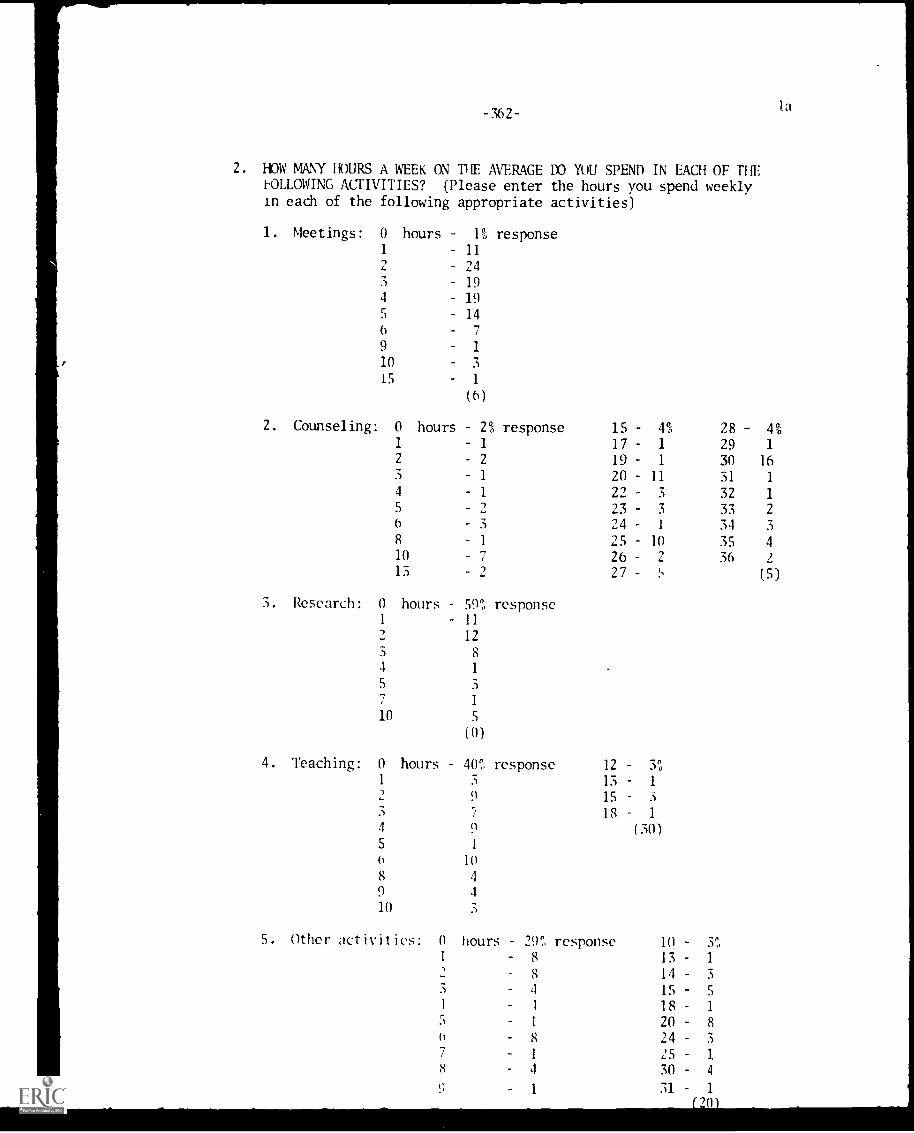
-362-
2. HOW MANY HOURS A WEEK ON THE AVERAGE DO YOU SPEND IN EACH OF THE1-OLLOWING ACTIVITIES? (Please enter the hours you spend weeklyin each of the following appropriate activities)
1. Meetings: 0 hours 1% response1 11
24
3 19
4 19
14
la
6
9
10
IS
2. Counseling: 0
7
1
3
1
(6)
hours 2% response 15 4% 28 401 1 17- 1 29 1
2 2 19 1 30 16
1 20 - 11 31 1
4 1 22 3 32 1
5 2 23 3 33 2
6 3 24 1 34 3
8 1 25 10 35 4
10 7 26 2 36 2
15 2 27 (5)
3. Research: 0 hours 59 response1 11
12
8
4 1
5 3
7 1
10 5
( 0)
4. Teaching: 0 hours 40% response 12 30
1 3 13 1
9 15 3
5 7 18 1
4 9 (3(1)
5 1
10
8 4
9 4
10
S. Other activities: 0 hours 29", response 10 3"1 8 13 1,
8 14 3
S 4 15 5
1 1 18 1
5 1 20 8
6 8 24 3
7 1 25 1
8 4 30 4
9 1 7,1 1
.70
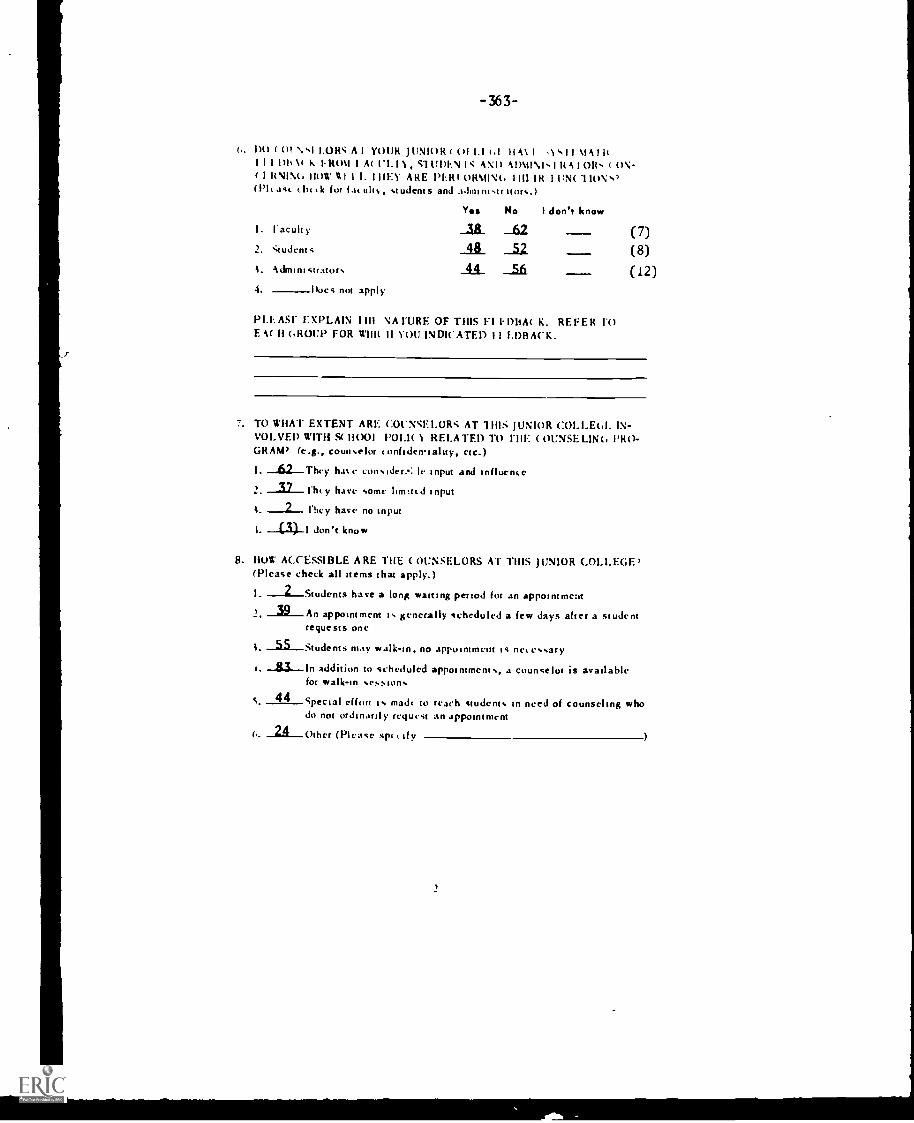
-363-
( . . Do ( 01 '0,1 1.016 A 1 YOUR JUNIOR( 011.1 IA iik\ I ,1 's 1 1 \IA I It1 1 I Ns %t Is IROM 1 A( l'1.1 1 S1 UDEN IS AND ADMIN1.1 It A I Olt. t ON-( I ItNIN(. 110W 1i 1 I. 111E1' ARE PERI ORA1INt, 1111 Ilt 1 UN( 1 IONs7(Plt JCL l ill i k for fat tilts, students and adininistr nor...)
Yos No I don't know
I. lacult y ._311_ __62 (7)2. Student s (8)
AA_ (12)i. Administrators
4 Does not apply
_56.
PLEASE. EXPLAIN 1111 NA PURE OF THIS El 1-1)BACK. REFER FOE A( H (iROUP FOR WIIR II YOU INDICATED 1 1 EDBACK.
7. TO WHAT EXTENT ARE COUNSELORS AT 1 IIIS JUNIOR COLLEtil. IN-VOLVED WITH S( 11001 1'01.1(1 RELATED TO HIE ( OUNSE LIM, PRO-GRAM) (e.g., counselor tonfidemiality, etc.)
I. _62_ They hat e consider..: le input and influence
2. __32._. rh, y have some limitcd input
i --2 !Icy have no inputi --C31-1 don't know
8. HOW ACCESSIBLE ARE THE ( 01:NSF.LORS AT THIS JUNIOR COLLEGE'(Please check all items that apply.)
I. 2 Students have a long waiting period for an appointment
2. _39 An appointment is generally scheduled a few days after a studentrequests one
i. --55--Students may walk-in, no appointment is net esary
i _83--In addition to scheduled appointments, a counselor is availablefor walk-in session..
s, 44 Special effort is madt to reach students in need of counseling whodo not ordinarily request an appointment
(,. 2 Other (Please apt Lily )
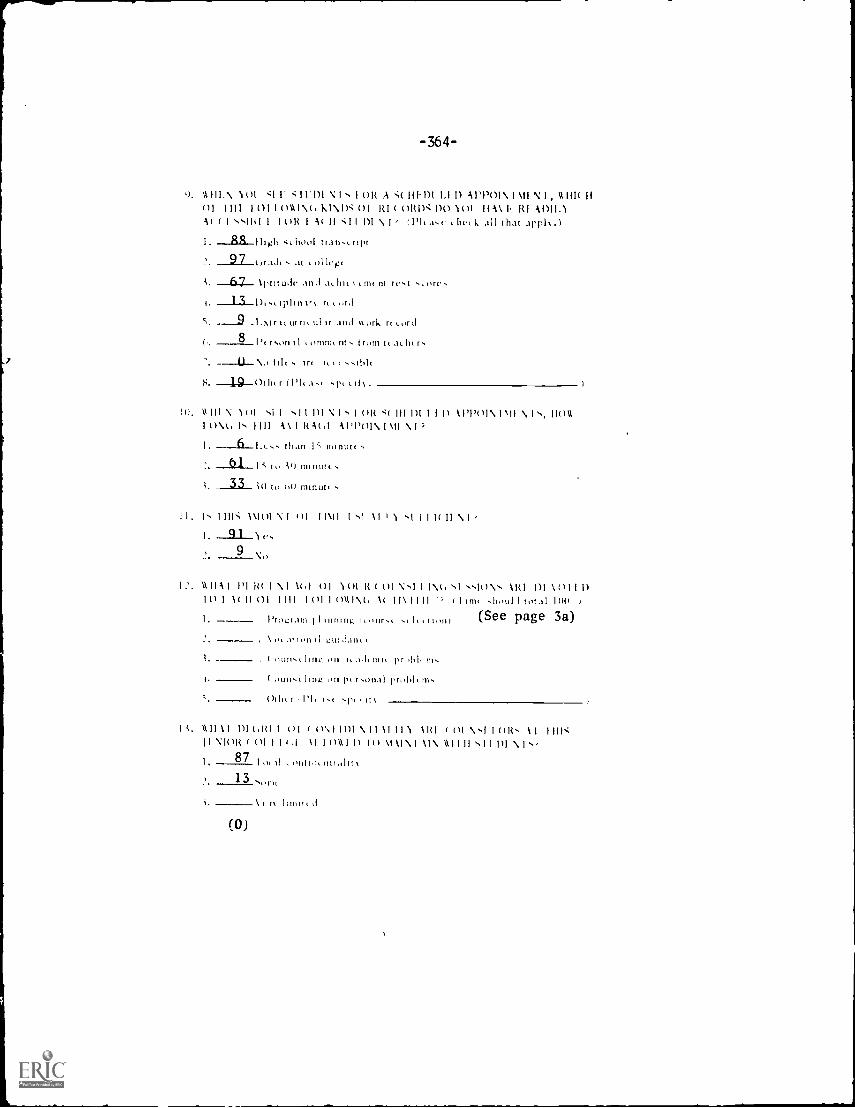
9.
-364-
tl III. \ l 01 F 1 1:1)I N I OR A :( 111.1)1 1.1 I) 1r1)01 \ I Ali N 1 , 'III( 1101 I III 1 01 I 0 %%I \ (, kl\ 1) 01 RI ORD' DO 101 11A\ I. RI AD11.1
( 1 N1141 I 1 OR I AI DI \ I CFR a., .hark all that appl% .1
I. --88Iligh ,hool tran, rim97 t.,r id( at r ollcp
kptituth and a,. In( t Lin( nt tc,t ,ore.
'putt) Ir t.,.rd
larILI.1111" And hurl. rrt.Ord
8 l'r (1( r9111 t ( .1( hi r7 hi( Irt tr 6..0)1(
S. r O'It ,II1(1. 11, III N 01 .1 1 .1I 1)1 N ()R'( III 1)1 1 111 \ PPM \ \I I s. 110
I O \(, 1 III 1\ 1 R A 11'01 \ 1 \II \ I
I. --6-1 c.. than 1-", nonut(
-.0.1... to nllitiltt
t. 33 it) to ot, mtnot,
III: \\lot Ni m I t I I \ .1 I I I( II N I ,
I. _9_1__
9 o
1:. 11 1 PI 10 I NI \t,1 01 1 01 R ( 01. N.1 I INt, \HI 01 \ 01 1 01 0 I 1 ( II 0 1 1 I l l 1 01 I (1111 \(, 1 ( I I\ I I II ' I !nu .11oul i total 1(111
I. Pro/zram I I 11111111y, r, Our, , I, t 'ion) (See page 3a)
\,,,arionit 0,tn.lant
on I, .1,1, nu. pr
t. (uun.i ling on pt r.un,tt prohlt
r ,1'1, t. ,p, it s.
I i. 11 II I 1)1 (MI I 01 ( O \1 11)1 \ 1 1 1 1 1 RI r (11 \ NI 1 OR, I I III":I N I O R I O I 1 I )I 10111 I ) i ( ) MI\ I \ I \ 11 1111 NI 1 \ IN'
1. 87 I ,1 0111111
13
Innut
(0)
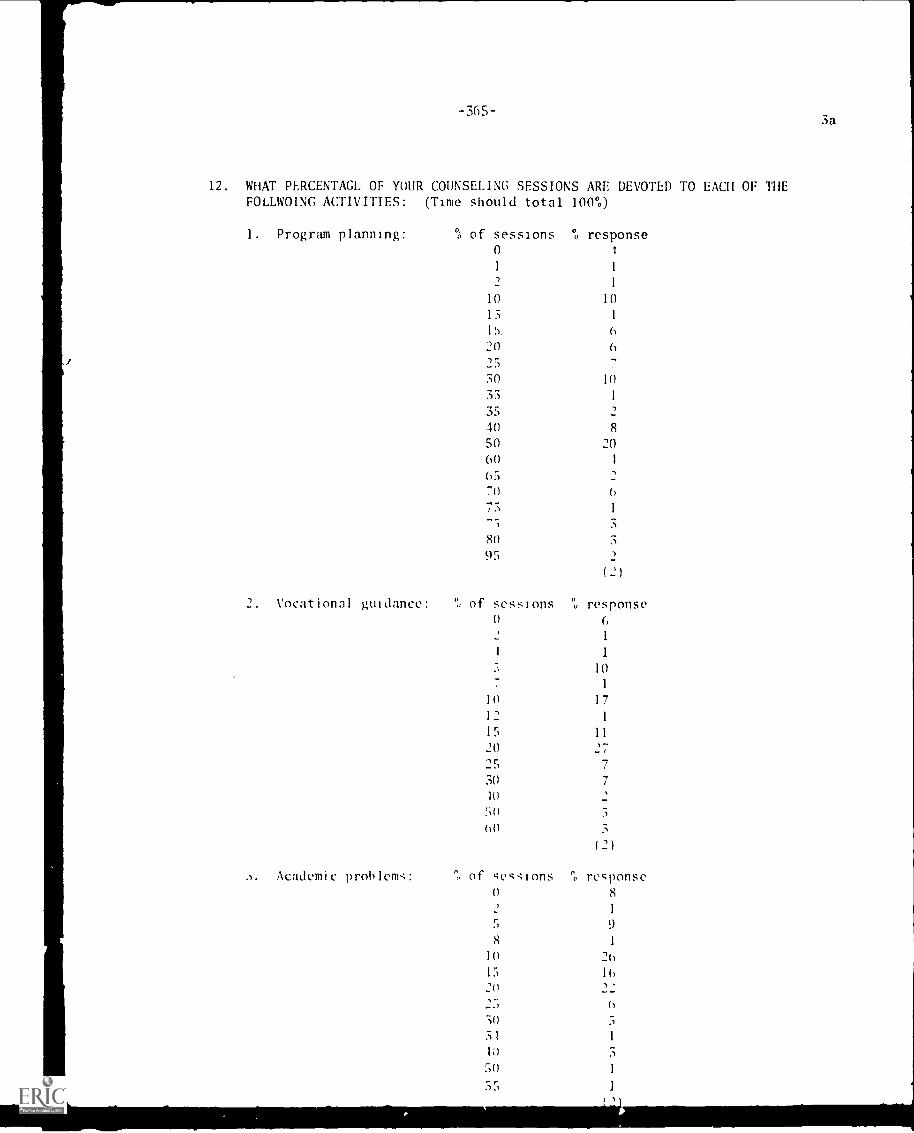
-365-
12. WHAT PERCENTAGL OF YOUR COUNSELING SESSIONS ARE DEVOTED TO EACH OF THEFOLLWOING ACTIVITIES: (Time should total 1000)
1. Program planning: % of sessions 1, response
0 1
1 1
i1
10 10
13 1
11,, 6
20 6
25
30 10
35 1
35 _1
40 8
SO 20
60 1
65 _
70 6
75 1
; S
80 3
95 1
(21
2. Vocational guidance: "., of sessions % response0 6
1
1 1
10
.). Academic problems:
1
10 17
12 1
15 11
20 ,..-..,
25 7
30 7
10
50 5
60 3
(2)
of sessions no response
I) 8,
1
5 9
8 1
10 26
15 16
20 _'-
-o 6
50 5
31 1
10 3
50 1
55 1
3a
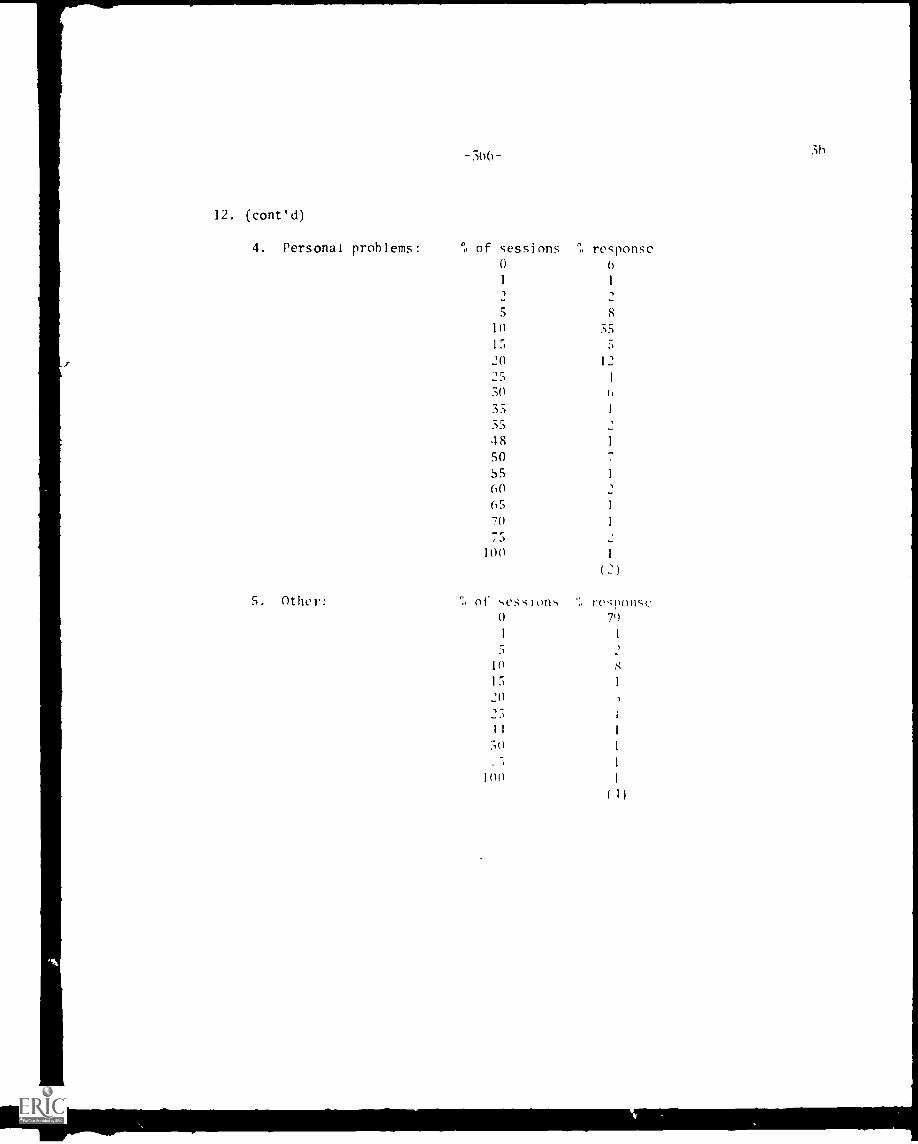
3h
12. (cont'd)
4. Personal problems: of sessions0
",, response6
1 1
5
,
8
10 SS
15 5
0
25
1,I
30 6
55 I
35
48 1
50
SS I
60
65 I
70 1
75
101) 1
( 2)
S. Other: of ,,cs,;ion,, ':, re,ponsc0 79
1 1
5 )
10 S
15 1
'0, -....) 1
11 1
50 1
1
100 1
II)
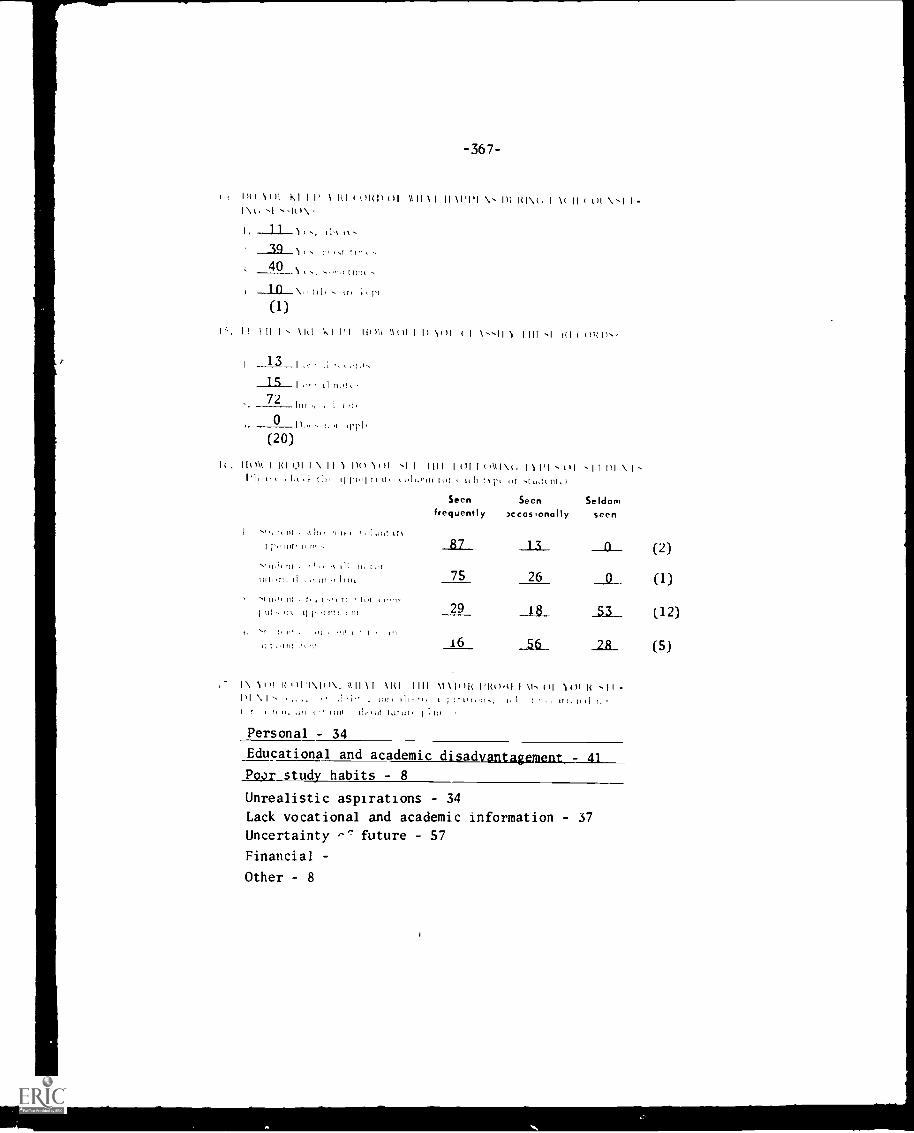
Ito ) 1(11 kI Ip 1 KI t pRp
i\, .1 ....,1/)\,
I . t tt. , I \ 1 \ -
39 1'1 11" t
40
\ tr,
(1)tilt
111111
-367-
II Ippi 111 1(1\t I 1( 11 «II \ "11
lc. II I II I'. 11(1 'NI III 111)10 '10/1 I It 1111 ( 1 1,,111 1111 1 1(1( (/1(1),'
13 1 'r
15_1 , not,
72
0 p, 111,1,
(20)
RI (.)( 1 \ lI \ 1111 \111 .1 I Hu I ()I I (1\11\k, I \ NI ttl .11 pi \L-, (I it "II I\11 "1 III.
I 't II.,
1j-01711,1, ;It,' WIT If%
Seenfrequently
_til_
Seen,ccasionally
_L3_
Seldomseen
__11_ (2)111 ' 11, lot
int,n 11:1L 75 26 (1)
'1111, 111 t r. , i t r c ' 1 i-__Q__
29 a_ (12)j _.55__
I. '11 1,111 1 '11 1 i111; .'111; .1 16 56 22L_ (5)
%, /)1,1\1(1\, A1111 11(1 1111 11111,1( 1'1(01i] 111 ttl )()1 It "IIItl \ I inr, I, l t it:, :1 tl i,
1,, toll " 11111 I1111 1111111. j 1111
Personal - 34
Educational and academic disadvantagement_z 41_
Poor study habits - 8
Unrealistic aspirations - 34
Lack vocational and academic information - 37
Uncertainty future - 57
Financial -
Other - 8
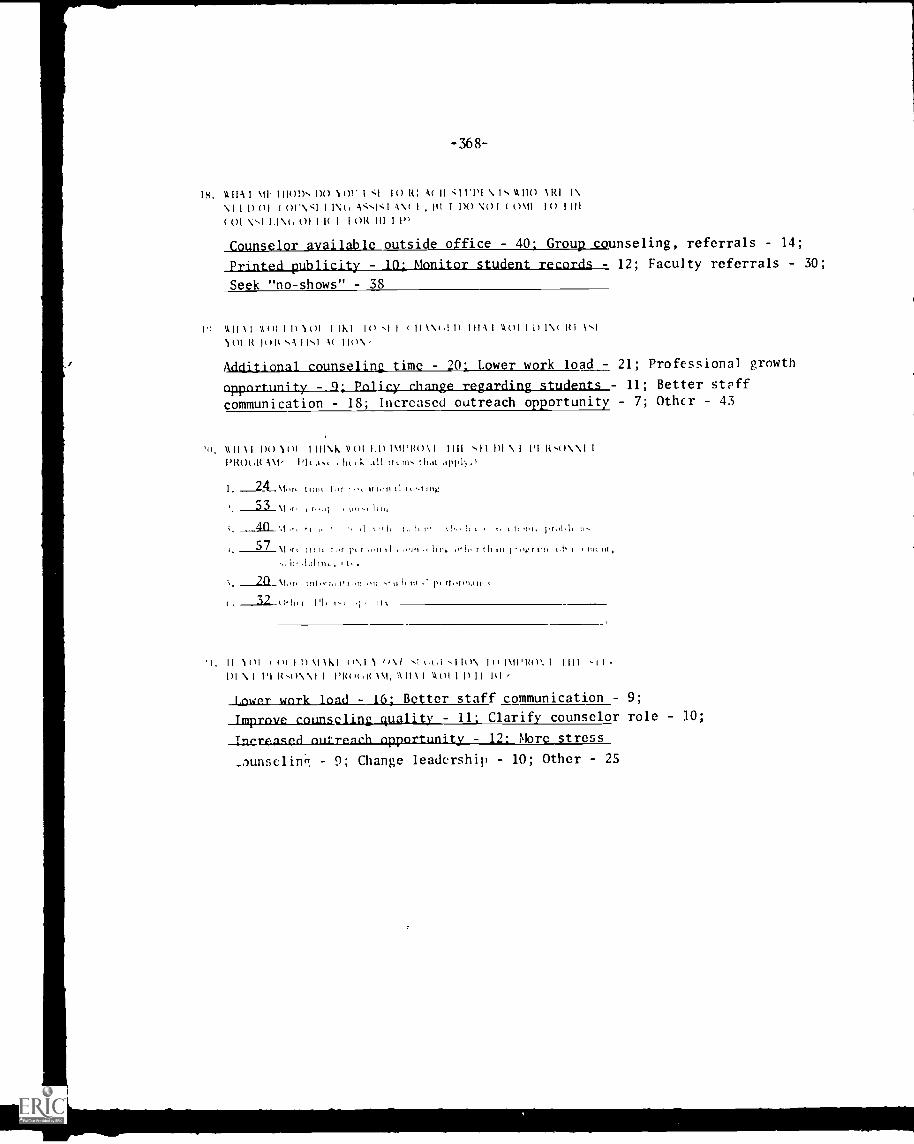
IS.
-368-
,\ HAI \11- I Hum. 00 )0 1 10 I( u II ;I I1 \ I 4110 AR! 1\\I I 1)01 ( 01'\q I IV. A;.1,-,1 AV 1 HI 1 IX) N01 ( 0\11 10 1 III( 01 oi 1 1( 1 1 01( 111 1 1»
Counselor available outside office - 40: Group counseling, referrals - 14;
Printed publicity 10; Monitor student records - 12; Faculty referrals - 30;
Seek "no-shows" - 38
I') 1111 11 11(11 I I) 01 1 10 ,1 I ( II 1V,I I) HI A 14OI I 0 Iv \.I101 R 101i .A 11.1 Ac 110\
Additional counseling time 20: Lower work load 21; Professional growth
opportunity - 9; Policy change regarding students - 11; Better staff
communication - 18; Increased outreach opportunity 7; Othcr 43
'ii. kil 11 I)) ol I Hi \k a '.11 I(,u\\I1,1(0(.,It .11,1, all u 111, I 11.1r .1
I. 24_ \1,,n tint, f, r 1,114m1H,,titig
53
40
57
20
\I 1111.
it %Hi Iss is II 1 s 1, 114 '1,1, irI1, n.rt tivit r .s,I1 1111L r 01111 I t nu n1 ,
11, t .
\I ,r4 1111 1,s 1'1;11 ,11 a i, 11, ristr116111,
32 (H,,,
II Nni ( 01 I 1) \ki 0\1 1 (0,/ 1,1.1 .110\ 10 Ripi()%11)1 \ I 1'1 R.0\ \ I no 4,it \ \I, \1111 I 1101 1 011
Lower work load - 16: Better staff communication 9;
ImpralaccuaSeling quality 11; Clarify counselor role 10;
_Incrpased nutrearh opportunity 12: More stress
_ounselido. - 9; Change leadership - 10; Other - 25
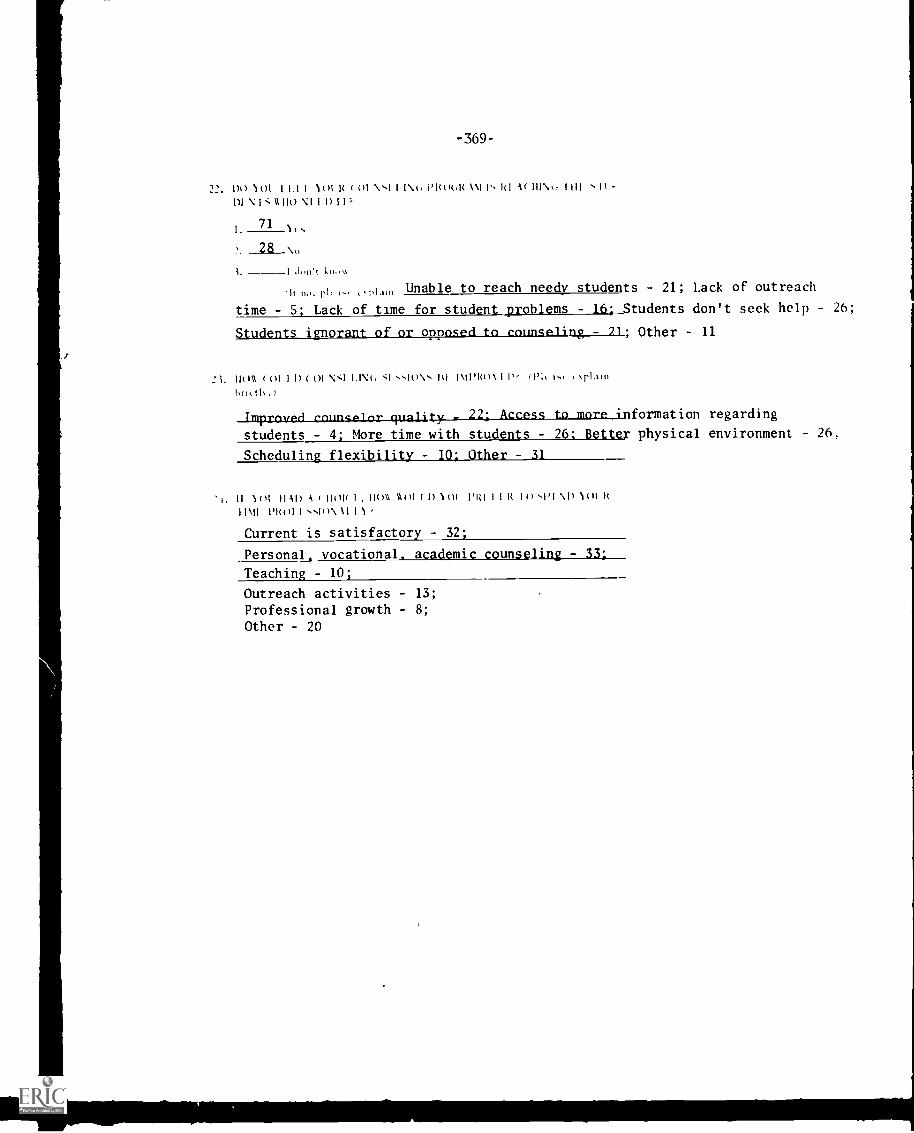
-369-
2 ' . DO 101 I 1 . 1 I WI R ( N.s1 I I N t , PRo(ilt 1\1 H R I At 1 1 1 N 3 i 1 1 1 1 11 -
DI N 1%; \ 1k) NI I I) II",
I. 71
, 28 N.,
3. I1,11,33
,h no. hi, . ,.1,1,m Unable to reach needy students 21; Lack of outreach
time - 5; Lack of time for student problems - 16: Students don't seek help 26;
Students ignorant of or apposed to counseling - 71; Other 11
i. 110A ( ()l I I) ( ()I \'.I LINt, 10\ hi IMPRo% I I), (I'I(
tip
improved co)rnsPlor quality__224 Access to more information regarding
students - 4; More time with students - 26; Better physical environment - 26,
Scheduling flexibility - 10: Other - 31
II )(A II AI) 4 um( I m)\\ Aol I I) 1()1 PRI I I I( I () \I) 1()I I(
PRO1 II 1
Current is satisfactory 32;
Personal, vocational, academic counseling - 33;
Teaching 10;
Outreach activities - 13;
Professional growth - 8;
Other - 20

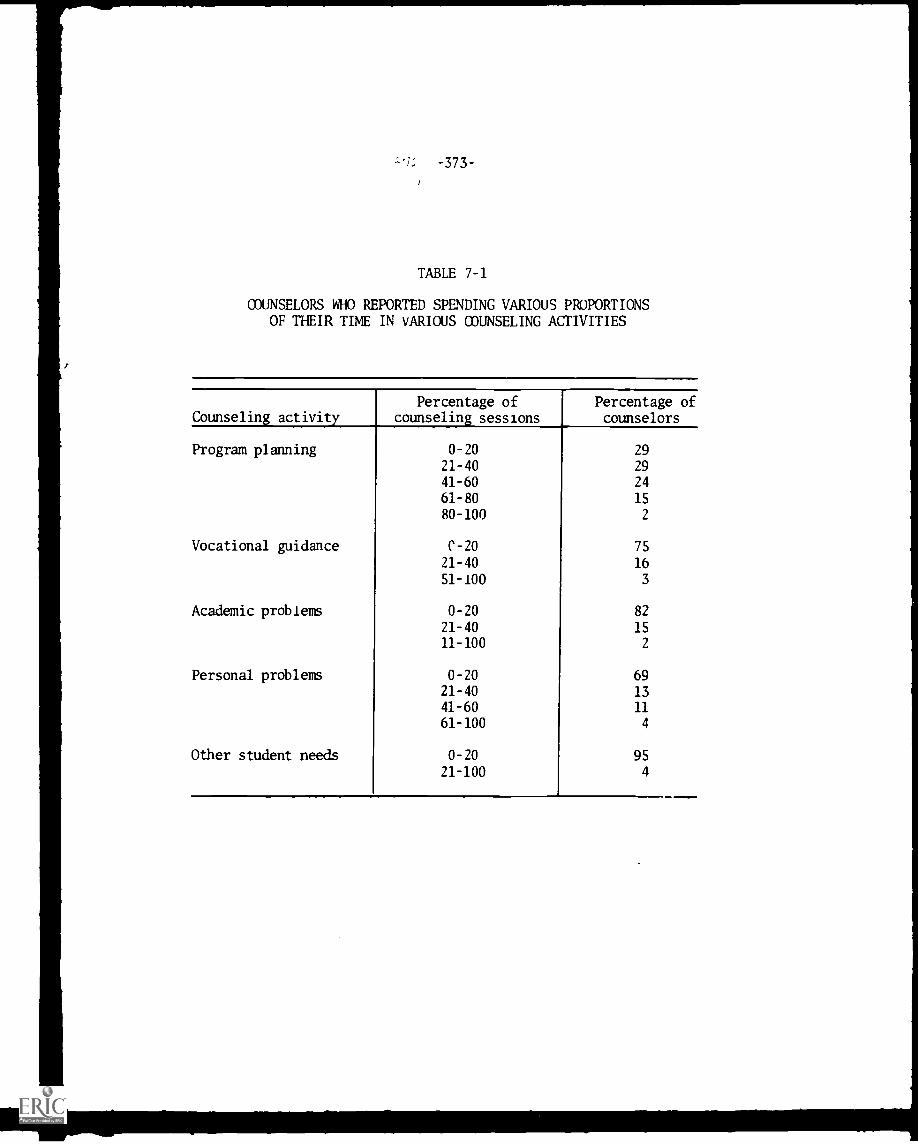
-373-
TABLE 7-1
COUNSELORS WHO REPORTED SPENDING VARIOUS PROPORTIONSOF THEIR TIME IN VARIOUS COUNSELING ACTIVITIES
Counseling activityPercentage of
counseling sessionsPercentage ofcounselors
Program planning
Vocational guidance
Academic problems
Personal problems
Other student needs
0-20
21-40
41-60
61-80
80-100
C-20
21-40
51-100
0-20
21-4011-100
0-2021-40
41-60
61-100
0-20
21-100
29
29
24
15
2
75
16
3
82
15
2
69
13
11
4
95
4
I, -375-
APPENDIX F
TABLES TO CHAPTER 8
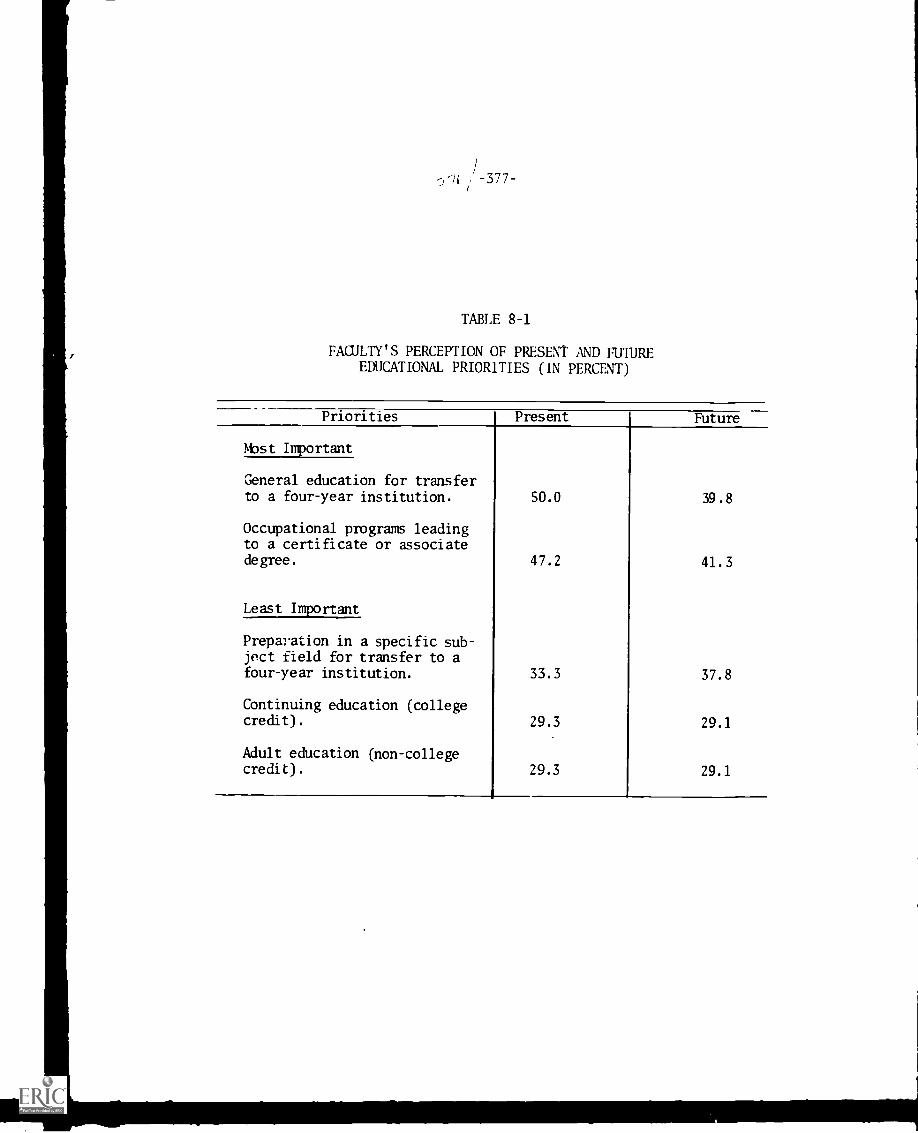
, -377-
TABLE 8-1
FACULTY'S PERCEPTION OF PRESENT AND FUTUREEDUCATIONAL PRIORITIES (IN PERCENT)
Priorities Present Future
Most Important
General education for transferto a four-year institution.
Occupational programs leadingto a certificate or associatedegree.
Least Important
Preparation in a specific sub-ject field for transfer to afour-year institution.
Continuing education (collegecredit).
Adult education (non-collegecredit).
50.0
47.2
33.3
29.3
29.3
39.8
41.3
37.8
29.1
29.1
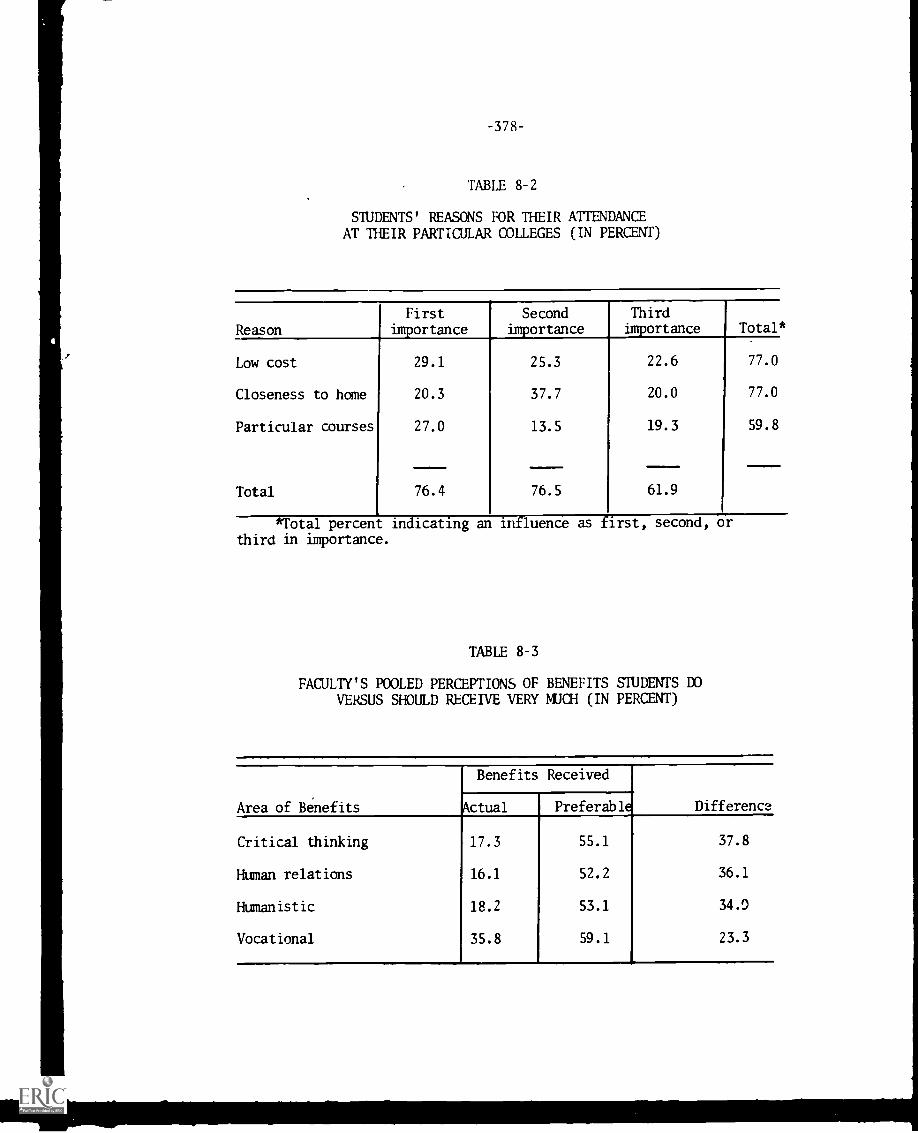
-378-
TABLE 8-2
STUDENTS' REASONS FOR THEIR ATTENDANCEAT THEIR PARTICULAR COLLEGES (IN PERCENT)
ReasonFirst
importanceSecond
importance
Thirdimportance Total'
Low cost 29.1 25.3 22.6 77.0
Closeness to home 20.3 37.7 20.0 77.0
Particular courses 27.0 13.5 19.3 59.8
Total 76.4 76.5 61.9
*Total percent indicating an influence as first. second, orthird in importance.
TABLE 8-3
FACULTY'S POOLED PERCEPTIONS OF BENEFITS STUDENTS DOVERSUS SHOULD RECEIVE VERY MUCH (IN PERCENT)
Benefits Received
Area of Benefits Actual Preferable Difference
Critical thinking 17.3 55.1 37.8
Human relations 16.1 52.2 36.1
Humanistic 18.2 53.1 34.0
Vocational 35.8 59.1 23.3
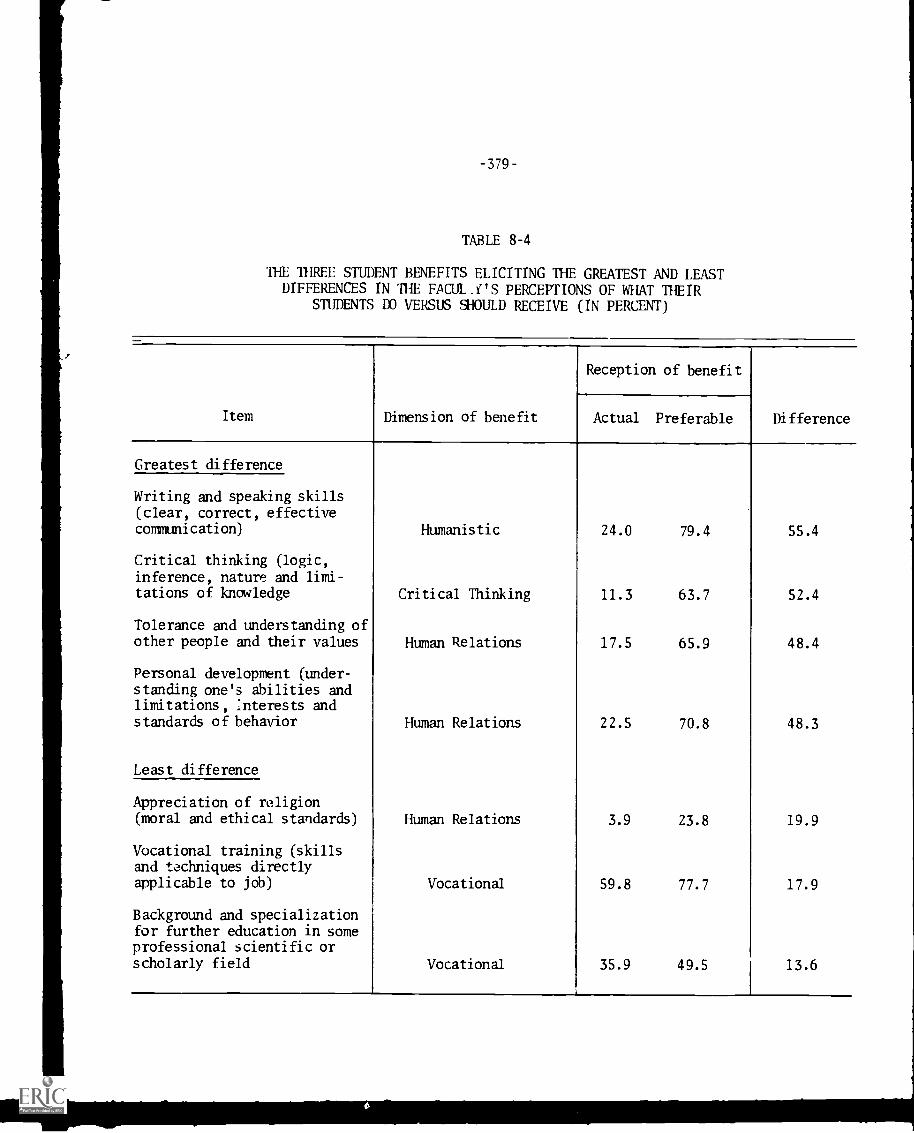
-379-
TABLE 8-4
THE THREE STUDENT BENEFITS ELICITING THE GREATEST AND LEASTDIFFERENCES IN THE FACUL.f'S PERCEPTIONS OF WHAT THEIR
STUDENTS IX) VERSUS SHOULD RECEIVE (IN PERCENT)
Item Dimension of benefit
Reception of benefit
DifferenceActual Preferable
Greatest difference
Writing and speaking skills(clear, correct, effectivecommunication) Humanistic 24.0 79.4 55.4
Critical thinking (logic,inference, nature and limi-tations of knowledge Critical Thinking 11.3 63.7 52.4
Tolerance and understanding ofother people and their values Human Relations 17.5 65.9 48.4
Personal development (under-standing one's abilities andlimitations, Interests andstandards of behavior Human Relations 22.5 70.8 48.3
Least difference
Appreciation of religion(moral and ethical standards) Human Relations 3.9 23.8 19.9
Vocational training (skillsand techniques directlyapplicable to job) Vocational 59.8 77.7 17.9
Background and specializationfor further education in someprofessional scientific orscholarly field Vocational 35.9 49.5 13.6
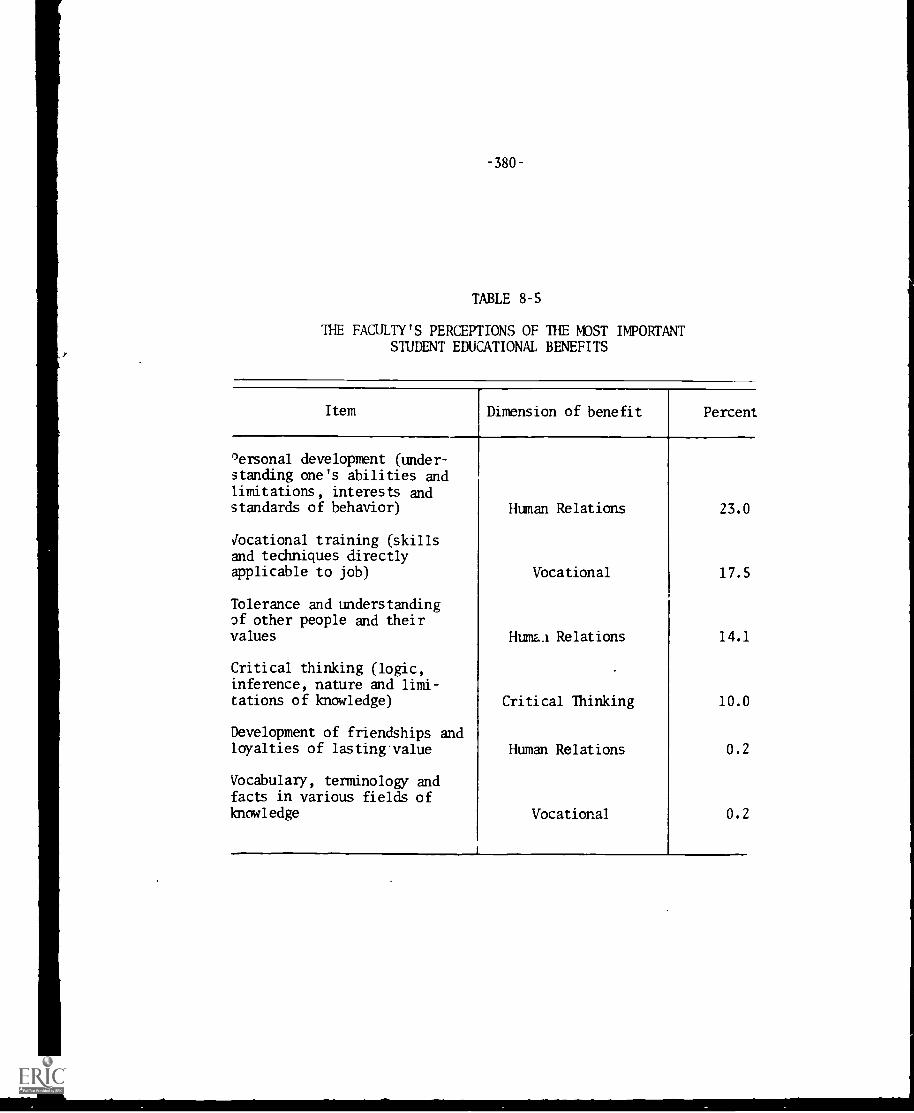
-380-
TABLE 8-5
THE FACULTY'S PERCEPTIONS OF THE MOST IMPORTANTSTUDENT EDUCATIONAL BENEFITS
Item Dimension of benefit Percent
oersonal development (under-standing one's abilities andlimitations, interests andstandards of behavior)
trocational training (skillsand techniques directlyapplicable to job)
Tolerance and understandingof other people and theirvalues
Critical thinking (logic,inference, nature and limi-tations of knowledge)
Development of friendships andloyalties of lasting'value
Vocabulary, terminology andfacts in various fields ofknowledge
Human Relations
Vocational
HUMLA Relations
Critical Thinking
Human Relations
Vocational
23.0
17.5
14.1
10.0
0.2
0.2
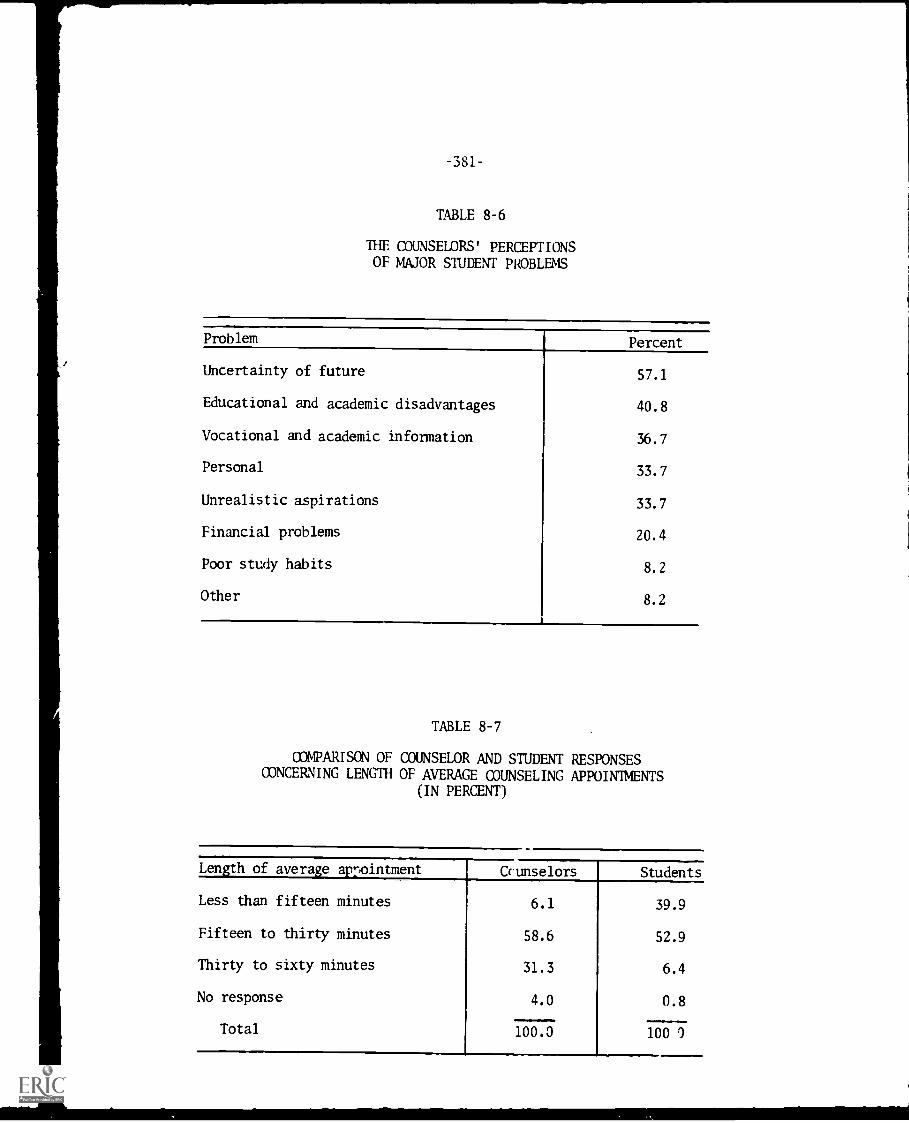
-381-
TABLE 8-6
THE COUNSELORS' PERCEPTIONSOF MAJOR STUDENT PROBLEMS
Problem
Uncertainty of future
Educational and academic disadvantages
Vocational and academic information
Personal
Unrealistic aspirations
Financial problems
Poor study habits
Other
Percent
57.1
40.8
36.7
33.7
33.7
20.4
8.2
8.2
TABLE 8-7
COMPARISON OF COUNSELOR AND STUDENT RESPONSESCONCERNING LENGTH OF AVERAGE COUNSELING APPOINTMENTS
(IN PERCENT)
Length of average appointment Crunselors
Less than fifteen minutes
Fifteen to thirty minutes
Thirty to sixty minutes
No response
Total
6.1
58.6
31.3
4.0
100.0
Students
39.9
52.9
6.4
0.8
100 9
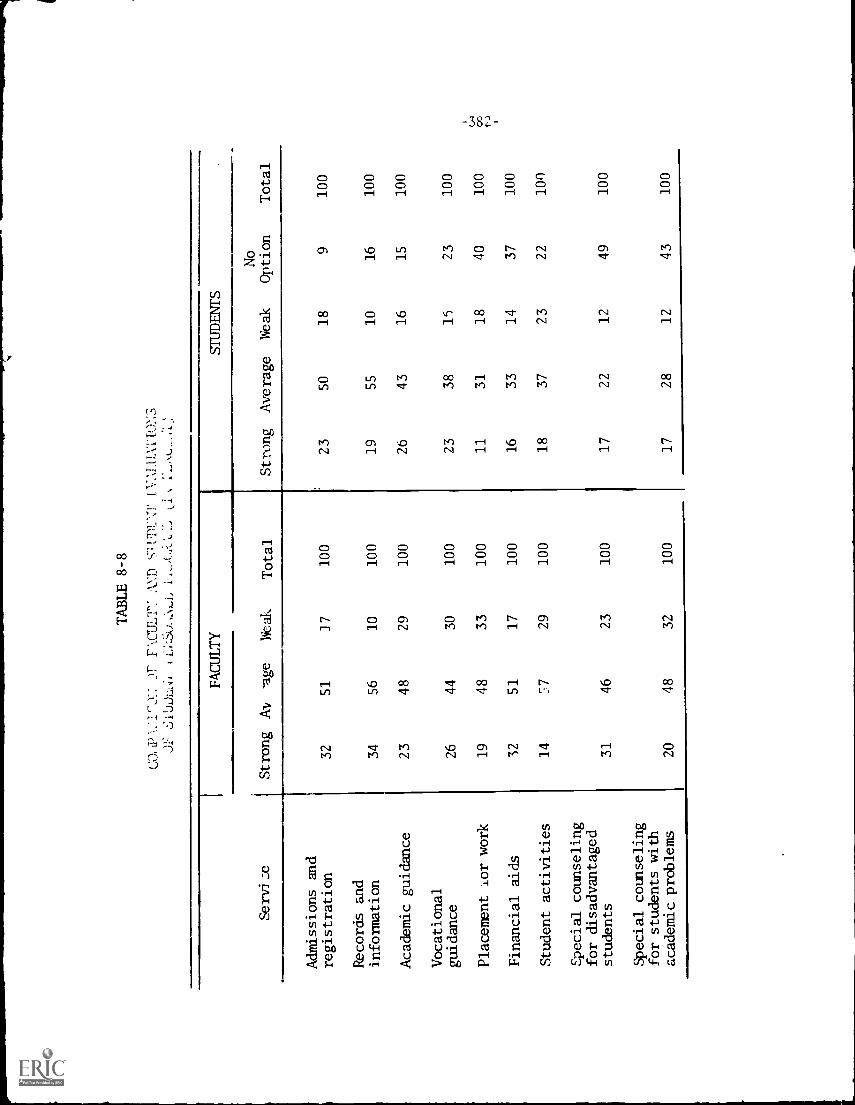
TABLE 8-8
co, F
L)
:)1-
17\CULT': :`ND
71)1
!Ai' X.
JF
LIN
Sen
d :e
FACULTY
STUDENTS
Strong
AA,
'age
Weak
Total
Strong
Average
Weak
No
Option
Total
Admissions and
registration
32
51
] 7
100
23
50
18
9100
Records and
information
34
56
10
100
19
55
10
16
100
Academic guidance
23
48
29
100
26
43
16
15
100
Vocational
guidance
26
44
30
100
23
38
15
23
100
Placement for work
19
48
33
100
11
31
18
40
100
Financial aids
32
51
17
100
16
33
14
37
100
Student activities
14
77
29
100
18
37
23
22
100
Special counseling
for disadvantaged
students
31
46
23
100
17
22
12
49
100
Special counseling
for students with
academic problems
20
48
32
100
17
28
12
43
100
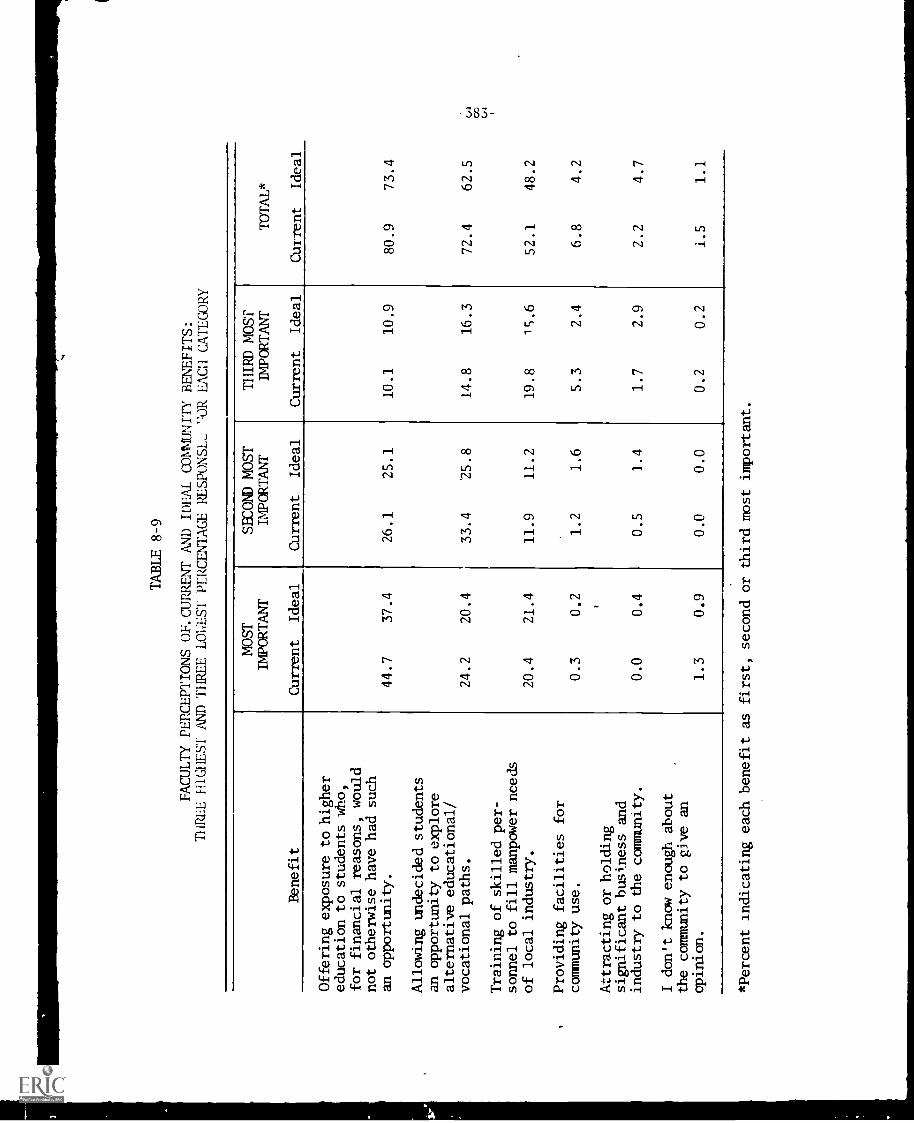
TABLE 8-9
FACULTY PERCEPTIONS OF. CURRENT' AND IDEAL COMMUNITY BENEFITS:
THREE finalST AND THREE LOWEST PERCENTAGE RESPONSE- l'OR EACH CATEGORY
Benefit
MOST
IMPORTANT
Current
Ideal
SECOND MOST
IMPORTANT
Current
Ideal
THIRD MOST
IMPORTANT
Current
Ideal
TOTAL*
Current
Ideal
Offering exposure to higher
education to students who,
for financial reasons, would
not otherwise have had such
an opportunity.
44.7
37.4
26.1
25.1
10.1
10.9
80.9
73.4
Allowing undecided students
an opportunity to explore
alternative educational/
vocational paths.
24.2
20.4
33.4
25.8
14.8
16.3
72.4
62.5
Training of skilled per-
sonnel to fill manpower needs
of local industry.
20.4
21.4
11.9
11.2
19.8
15.6
52.1
48.2
Providing facilities for
community use.
0.3
0.2
1.2
1.6
5.3
2.4
6.8
4.2
Attracting or holding
significant business and
industry to the community.
0.0
0.4
0.5
1.4
1.7
2.9
2.2
4.7
I don't know enough about
the community to give an
opinion.
1.3
0.9
0.0
0.0
0.2
0.2
i.S
1.1
*Percent indicating each benefit as first, second or third most important.
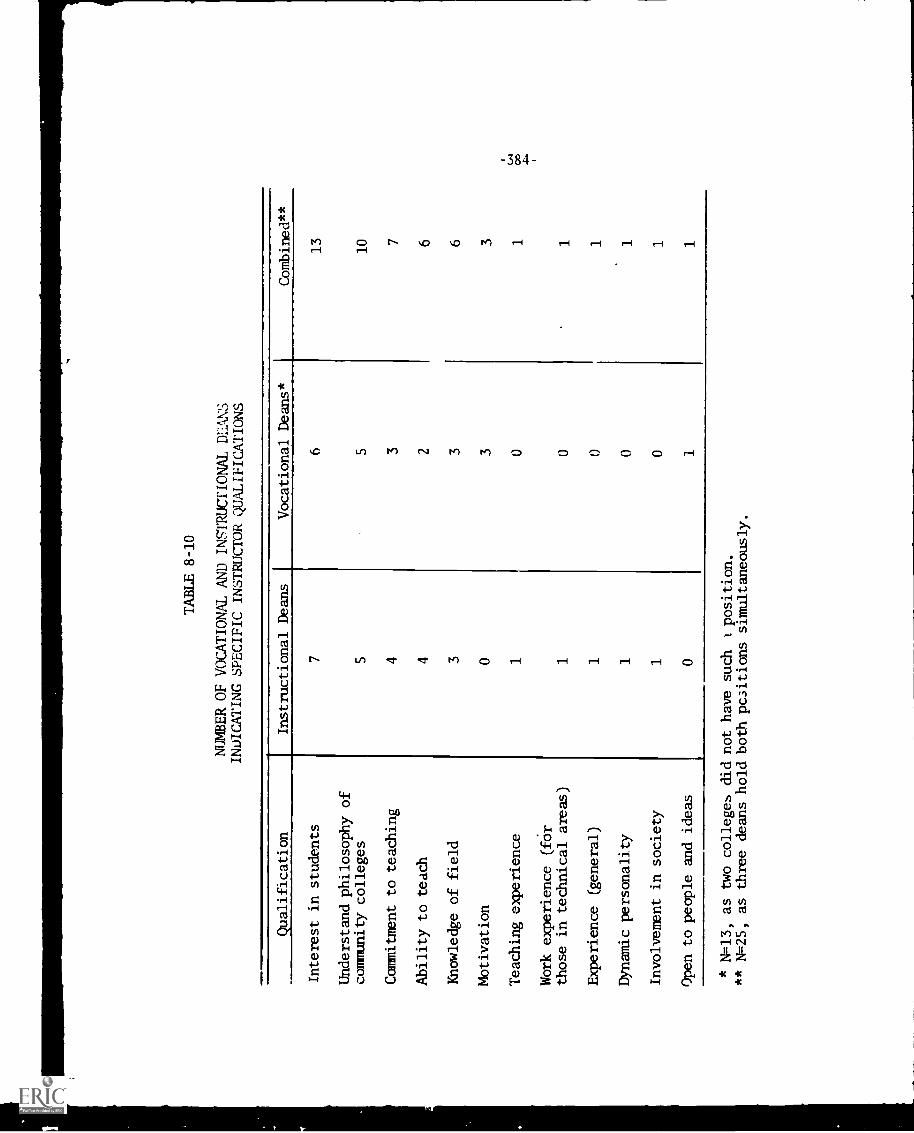
TABLE 8-10
NUMBER OF VOCATIONAL AND INSTRUCTIONAL _DEANS
INDICATING SPECIFIC INSTRUCTOR QUALIFICATIONS
Qualification
Instructional Deans
Vocational Deans*
Combined**
Interest in students
76
13
Understand philosophy of
community colleges
55
10
Commitment to teaching
43
7
Ability to teach
42
6
Knowledge of field
33
6
Motivation
03
3
Teaching experience
10
1
Work experience (fOr
those in technical areas)
10
1
Experience (general)
10
1
Dynamic personality
10
Involvement in society
10
1
Open to people and ideas
01
1
* N=13, as two colleges did not have such
i position.
** N=25, as three deans hold both positions simultaneously.
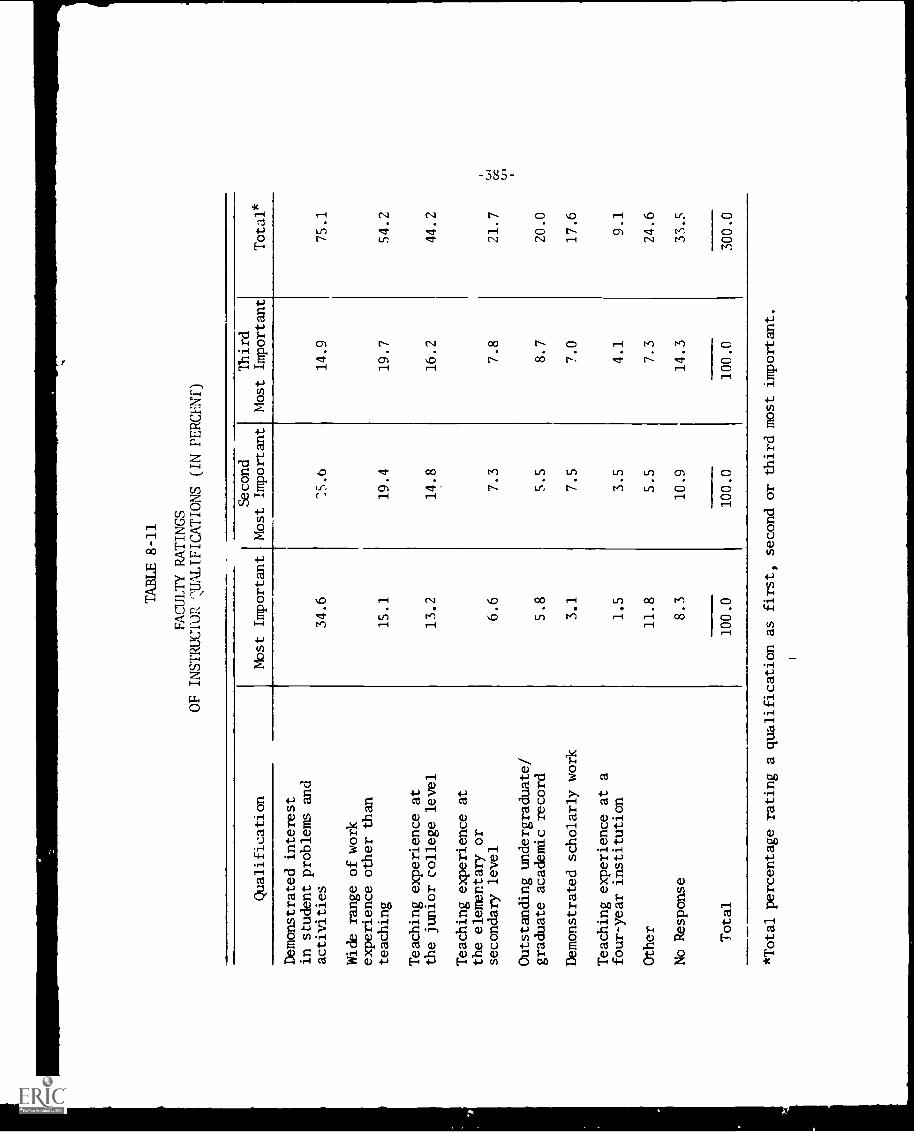
TABLE 8-11
FACULTY RATINGS
OF INSTRUCTOR I.ZUALIFICATIONS (IN PERCENT)
Qualification
Demonstrated interest
in student problems and
activities
Wide range of work
experience other than
teaching
Teaching experience at
the junior college level
Teaching experience at
the elementary or
secondary level
Outstanding undergraduate/
graduate academic record
Demonstrated scholarly work
Teaching experience at a
four-year institution
Other
No Response
Total
Most Important
Second
Most Important
Third
Most Important
Total*
34.6
S . b
14.9
75.1
15.1
19.4
19.7
54.2
13.2
14.8
16.2
44.2
6.6
7.3
7.8
21.7
5.8
5.5
8.7
20.0
3.1
7.5
7.0
17.6
1.5
3.5
4.1
9.1
11.8
5.5
7.3
24.6
8.3
10.9
14.3
33.5
100.
010
0.0
100.
0300.0
*Total percentage rating a qualification as first, second or third most important.
tJ1
-387-
APPENDIX G
,FORM LETTERS SENT TO SURVEY SUBJECTS
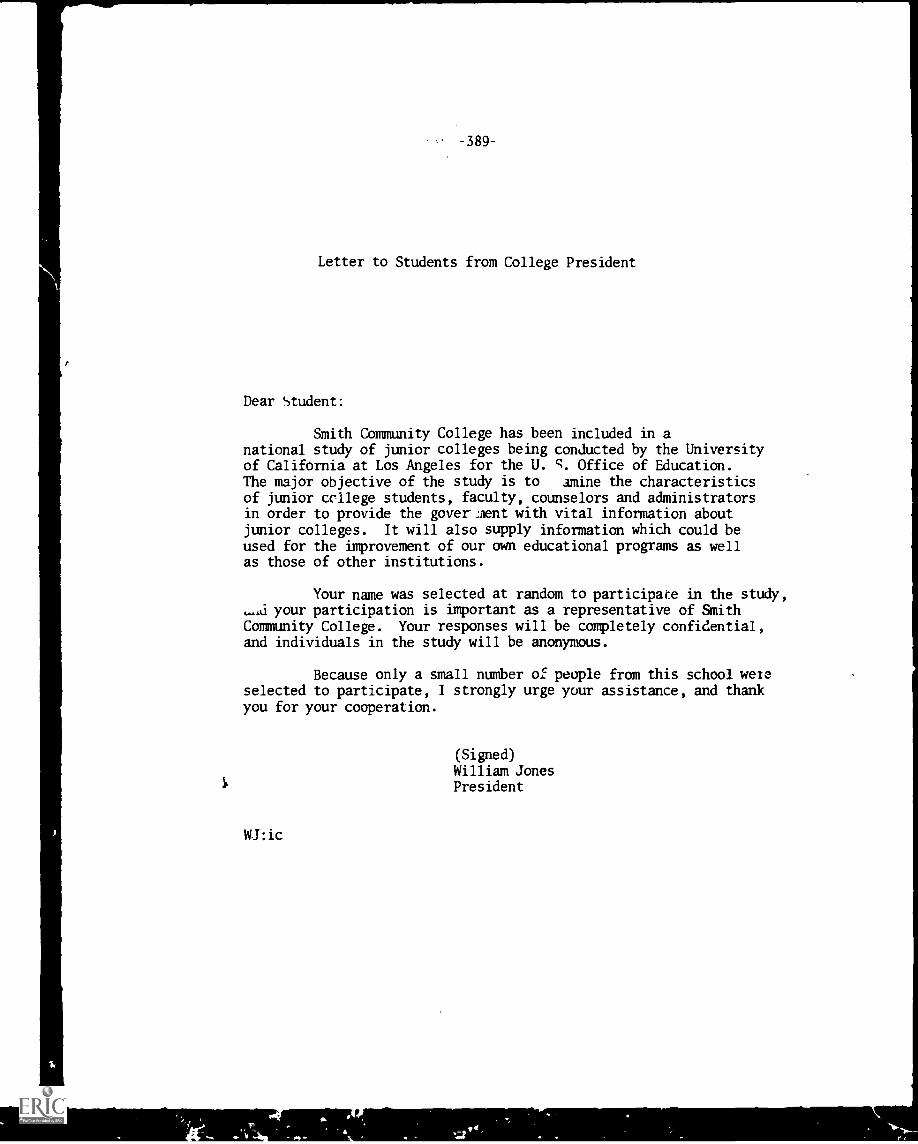
-- -389
Letter to Students from College President
Dear Student:
Smith Community College has been included in anational study of junior colleges being conducted by the Universityof California at Los Angeles for the U. c. Office of Education.The major objective of the study is to amine the characteristicsof junior college students, faculty, counselors and administratorsin order to provide the goverAent with vital information aboutjunior colleges. It will also supply information which could beused for the improvement of our own educational programs as wellas those of other institutions.
Your name was selected at random to participate in the study,...Ai your participation is important as a representative of Smith
Community College. Your responses will be completely confidential,and individuals in the study will be anonymous.
Because only a small number of people from this school wereselected to participate, I strongly urge your assistance, and thankyou for your cooperation.
Wj:ic
(Signed)
William JonesPresident
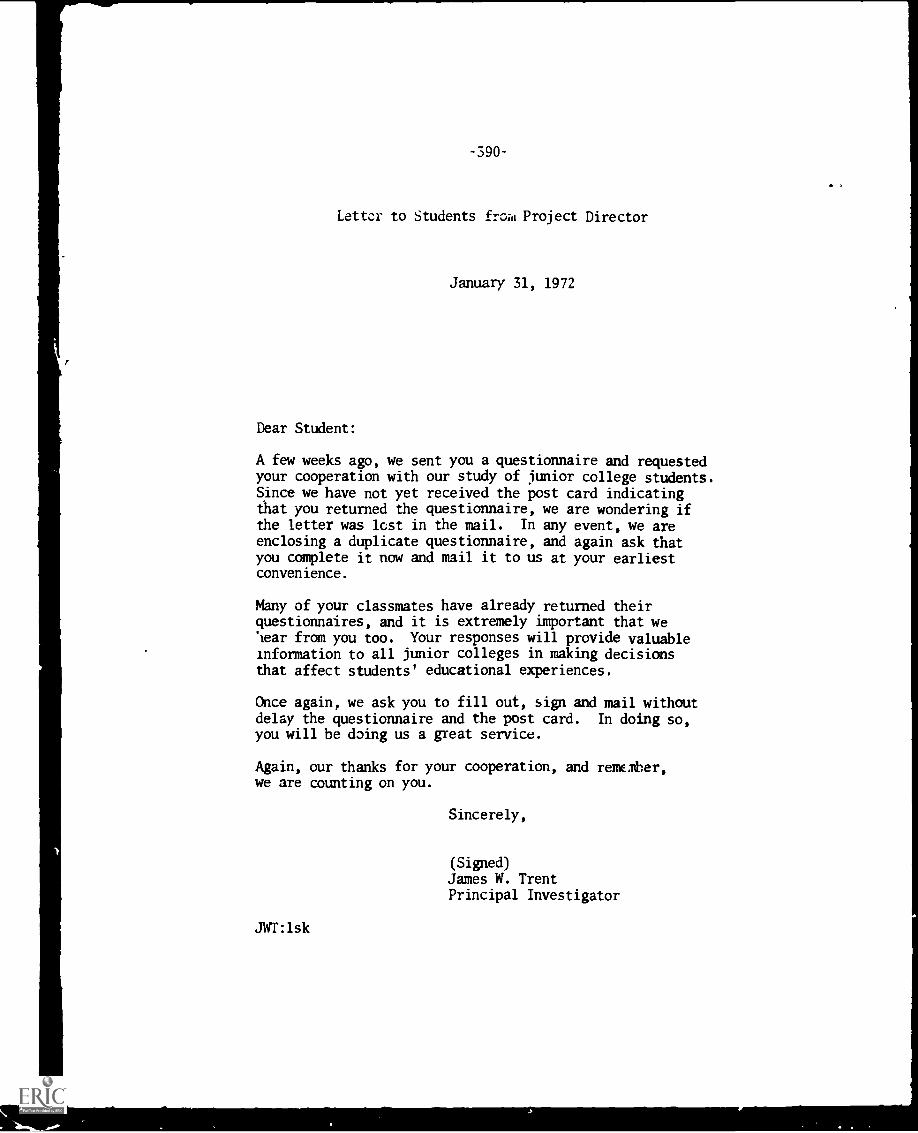
-390
Letter to Students frol Project Director
January 31, 1972
Dear Student:
A few weeks ago, we sent you a questionnaire and requestedyour cooperation with our study of junior college students.Since we have not yet received the post card indicatingthat you returned the questionnaire, we are wondering ifthe letter was lost in the mail. In any event, we areenclosing a duplicate questionnaire, and again ask thatyou complete it now and mail it to us at your earliestconvenience.
Many of your classmates have already returned theirquestionnaires, and it is extremely important that we''tear from you too. Your responses will provide valuableInformation to all junior colleges in making decisionsthat affect students' educational experiences.
Once again, we ask you to fill out, sign and mail withoutdelay the questionnaire and the post card. In doing so,you will be doing us a great service.
Again, our thanks for your cooperation, and remember,we are counting on you.
JWT:lsk
Sincerely,
(Signed)
James W. TrentPrincipal Investigator
-391-
Letter to Faculty from College President
Dear Faculty Member:
Smith Community College has been included in a nationalstudy of junior colleges being conducted by the University ofCalifornia at Los Angeles for the U. S. Office of Education. Themajor objective of the study is to examine the characteristics ofjunior college ',tudents, faculty, counselors and administrators inorder to provice the government with vital information about juniorcolleges. It dill also supply information ';rich could be used forthe improvement of our own educational programs as well as thoseof other inAitutions.
Your name was selected at random to participate in thestudy, and your participation is important as a representative ofSmith Community College. Your responses will be completely con-fidential, and individuals in the study dill be anonmous.
Because only a small number of people from this schoolwere selected to participate, I strongly urge your assistance, andthank you for your cooperation.
(Signed)
William JonesPresident
WJ:ic
-392-
Lettel- to Faculty from Project Director
February 7, 1972
Dear Colleague:
A few weeks ago, we sent you a questionnaire andrequested your cooperation with our study of juniorcolleges. *de have not yet received the post card
indicating that you returned the questionnaire.
We would like to remind you that yotit responses willprovide valuable information to all%junior colleges.Many of your colleagues have already returned theirquestionnaires, and it is extremely important that wehear from you too.
Once again, we ask you to fill out, sign and mailwithout delay the Questionnaire and the post card.If you have already done so, please accept our appre-ciation and disregard this letter. If you have mis-placed the questionnaire, please notify us and we will
forward a duplicate immediately.
Thank you for your cooperation.
Sincerely,
(Signed)
James W. TrentPrincipal Investigator
JWT: lsk
-393
Letter to Counselors from College President
Dear Counselor:
Smith Community College has been included in anational study of junior colleges being conducted by the Uni-versity of California at Los Angeles for the U. S. Office ofEducation. The major objective of the study is to examine thecharacteri3tics of jun;ar college students, faculty, counselors,and administrators in order to provide the government with vitalinformation about junior colleges. It will also supply informationwhich could be used for the improvement of our educational pro-grams as well as those of other institutions.
Because pupil personnel programs are of particular interestin the junior college institutions, I am requesting each of youto devote the short amount of time necessr..ry to complete andreturn the questionnaire. Your responses will be completelyconfidential, and individual identity will be anonymous.
I urge your assistance in this study, and thank you foryour cooperation.
(Signed)
William JonesPresident
WJ:ic
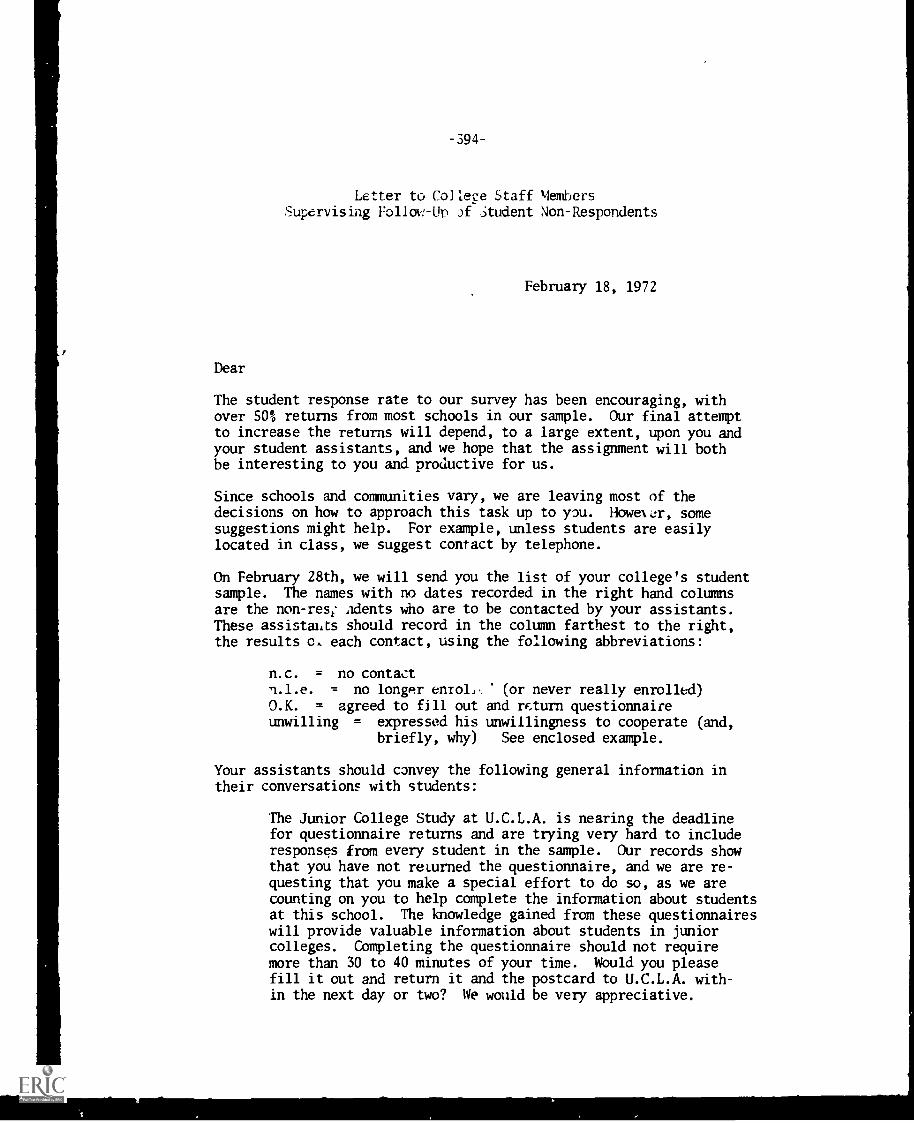
-394-
Letter to College Staff MembersSupervising Follow-Up of Audent Non-Respondents
February 18, 1972
The student response rate to our survey has been encouraging, withover SO% returns from most schools in our sample. Our final attemptto increase the returns will depend, to a large extent, upon you andyour student assistants, and we hope that the assignment will bothbe interesting to you and productive for us.
Since schools and communities vary, we are leaving most of thedecisions on how to approach this task up to you. HowexLtr, somesuggestions might help. For example, unless students are easilylocated in class, we suggest contact by telephone.
On February 28th, we will send you the list of your college's studentsample. The names with no dates recorded in the right hand columnsare the non-rest Adents who are to be contacted by your assistants.These assistants should record in the column farthest to the right,the results each contact, using the following abbreviations:
n.c. = no contactn.l.e. = no longer enrol,,O.K. = agreed to fill outunwilling = expressed his
briefly, why)
(or never really enrolled)and return questionnaireunwillingness to cooperate (and,
See enclosed example.
Your assistants should convey the following general information intheir conversations with students:
The Junior College Study at U.C.L.A. is nearing the deadlinefor questionnaire returns and are trying very hard to includeresponses from every student in the sample. Our records showthat you have not returned the questionnaire, and we are re-questing that you make a special effort to do so, as we arecounting on you to help complete the information about studentsat this school. The knowledge gained from these questionnaireswill provide valuable information about students in juniorcolleges. Completing the questionnaire should not requiremore than 30 to 40 minutes of your time. Would you pleasefill it out and return it and the postcard to U.C.L.A. with-in the next day or two? We would be very appreciative.
-395-
We are providing you with extra questionnaires (under separate cover)for students who have lost theirs. However, some procedures must brcarefully observed. You will notice that the questionnaires are -'green or orange, corresponding to Forms A (green), B (blue), or u (orange).The letter A, B, or C is written next to the name of each student on thelist, indicating which form he is to fill out. In other words, eachstudent is assigned a particular questionnaire form as indicated by theletter r -'corded next to his name, and it is only this form which heis to be given.
Regarding reimbursement, we are budget-d for one supervisor at eachschool, at $14.00 per hour (maximum, lo hours). We suggest that youemploy two students for a total of no more than 30 hours,each at $1.65per hour. As we can allow only two weeks for this task, (from March 1through March 15), each student would work about 15 hours per week ifyou employ two students. Each can probably make about five calls perhour, (including finding the telephone number), accounting for more callsthan any of our sample schools require. If a student is calling fromhis own phone and incurs non-local charges, he should keep a record ofthese expenses and include that amount on his invoice.
The above figures are all speculative, depending upon how many non-respondents there are for your school, how many students you employand how you schedule their time; but this should give you an idea ofhow' to proceed.
To encourage your assistants to do their utmost in obtaining the co-operation of non-respondents, we are offering a bcnus to those whosucceed in persuading S0% or more of the non-respondents on their listto return the questionnaires. "Success" will be determined by thenumber of postcards we receive. Therefore, the assistant's name shouldbe on each page for which he is responsible, so that we cm credithim with the postcards returned from his portion of the sample. Eachassistant who achieves this 50% return quota will be paid $2.00 anhour for his time rather thui the $1.65 rate.
Please note that there are five invoice forms enclosed, one for youand one for each of the students you employ. Please sign your ownand that of each student, and return them to us with the student listby the 15th of March.
If you have any questions, please feel free to call me collect at213-825-7831.
Respectfully yours,
Felice KarmanExecutive Officer, Study ofJunior Colleges
FK:ahEncls. 6