document resume ed 360 369 author johnson, … resume ed 360 369 tm 020 273 author johnson, william...
TRANSCRIPT
DOCUMENT RESUME
ED 360 369 TM 020 273
AUTHOR Johnson, William L.; And OthersTITLE Developing an Administrative Assessment
Instrument.PUB DATE 18 May 93NOTE 22p.PUB TYPE Reports Research/Technical (143)
EDRS PRICE MF01/PC01 Plus Postage.DESCRIPTORS *Administrator Evaluation; Content Validity;
*Continuing Education; Educational Cooperation;Educational Planning; Elementary Secondary Education;Factor Analysis; *Likert Scales; *Needs Assessment;Principals; Problem Solving; Questionnaires; SchoolAdministration; Staff Development; *TestConstruction; Test Reliability
IDENTIFIERS *Discrepancy Measure
ABSTRACT
The development of a needs instrument designed toassess the continuing education needs of school administrators isdescribed. The instrument was constructed to assess theadministrators' continuing needs in: (1) principalship; (2) theschool as a system; (3) problem solving; (4) staff development; (5)
collaborative long-range planning; (6) short-term planning; and (7)personal awareness. Thirty-eight questions for the assessment werewrtten using a standard domain sampling model, and the revisedquestions were made into a questionnaire using a Likert discrepancymodel. Respondents rated statements on a five-point scale ofperception of the degree to which the situation actually exists andperception of the extent to which it is desired to exist. Thediscrepancy between the two scale values is referred to as the needindex. Content validity was established through factor analysis witha sample of 191 school administrators. Reliability measures indicatethat the instrument can be used for group assessment. Items for thesurvey are listed, and two tables present the varimax rotated factormatrix for the two instrument columns (Contains 34 references.)(SLD)
***********************************************************************
Reproductions supplied by EDRS are the best that can be madefrom the original document.
***********************************************************************

U S DEPARTMENT OF EDUCATIONOn., e nI Ed,ahona, Res'a,rh and inv,overnent
ECM ,ATIONAL RESOURCES INFORMATIONCENTER 'ERIC,
Th.s document has been ,eproduced as'ece.ved from lye person , ,clart,zabon0rigtrlat.,19 .1
Minor changes have neen made In imprOrP,edroduchon Dually
Pconts of .nev, do.mons staled .n ins OOC u'nerd do not necessahh, ,edresenf ofh,a,OE RI poshon 0, 0011Cy
"PERMISSION TO REPRODUCE THISMATERIAL HAS BEEN GRANTED BY
1A)/ L/. /'1 2 13 rt A),50A-)
TO THE EDUCATIONAL RESOURCESINFORMATION CENTER (ERIC)."
DEVELOPING AN ADMINISTRATIVE ASSESSMENT INSTRUMENT
BY
WILLIAM L. JOHNSON, Ed.D.DEAN OF FACULTY
CHAIR, EDUCATION & PSYCHOLOGYAMBASSADOR COLLEGEBIG SANDY, TEXAS 75755
KAROLYN J. SNYDER, Ed.D.DIRECTOR, SCHOOL MANAGEMENT INSTITUTE
UNIVERSITY OF SOUTH FLORIDATAMPA, FLORIDA 33620
ANNABEL M. JOHNSON, Ph.D.ADJUNCT PROFESSOR OF HOME ECONOMICS
AMBASSADOR COLLEGEBIG SANDY, TEXAS 75755
BE s1 COPY

1
ABSTRACT
Educators are generating powerful ideas and practices to help education be more
successful. In this document, the authors discuss the development of a needs instrument
designed to assess the continuing education needs of school administrators.

2
During the past decade, Snyder and Anderson implemented a leadership training
program know as Managing Productive Schools (MPS) in Florida, Minnesota, and Virginia.
They have trained several thousand administrators worldwide. The program is based on an
extensive research base and also on a systems approach to organizational development. The
books by Snyder and Anderson (1986) and Snyder (1988) explicitly outline their model for
leadership training.
The model assumes that schools that are seeking to transform themselves and to solve
major challenges have a vision of a great school that is shared by all members. In addition,
an annual school enhancement plan is designed each year and becomes a focus for work
activity. A rich array of professional development opportunities that center around
enhancement goals is provided for all levels of staff. The central thrust of school
enhancement is to align the instructional program routinely to address the needs of various
student populations. Allocating resources where needs are the greatest creates natural new
structures of work and learning. Resources, information, and opportunity are fundamental
materials for organizational productivity (Johnson, Snyder, & Johnson, 1991). Progress with
goals, and toward better meeting client needs, is assessed routinely to provide feedback and
feed-forward information.
Considering the research base, an instrument was constructed to assess administrators'
continuing education desires in seven specified areas: (a) the principalship, (b) the school
as a system, (c) problem solving, (d) staff development, (e) collaborative long-range
planning, (f) short-term planning, and (g) personal awareness. These seven areas appeared

3
in the literature review to be important dimensions pertaining to culture, planning,
professional development, program development, and assessment.
These subscales, a brief content description, and a sample of an item statement
follow: principalship consisting of questions embracing the perspectives of leadership,
planning, organizing, and motivating organizational behavior. Next was the topic of the
school as a system. Questions addressed the environmental suprasystem as well as the goal,
psychosocial, structural, technical, and management subsystems. To our knowledge, there
have been no empirical studies that have accessed the specific effects of school subsystems
on school performance.
The third subscale was problem solving focusing on real school organizational
problems from the perspective of roles, communication skills, and problem solving steps.
Next was short-term planning, which focused on the principal's varied tasks such as action
planning and force field analysis. The fourth subscale addressed was staff development
encompassing clinical supervision, in-service training, and evaluation. The fifth subscale was
collaborative long-range planning for school improvement which included goal setting,
resource assessment, program planning, and implementation, and monitoring functions and
evaluation procedures. Finally, there was a personal awareness subscale embracing the
perspectives of personality characteristics, self-concept, and administrative-style effectiveness.
The 38 questions that were written were then randomly assigned to the instrument.
The construction and administration of the instrument involved the following steps:
(a) development of a pool of subscaled questions; (b) development of questionnaire forms
and a pool of instrument questions; (c) selection of administrative personnel to respond to

4
the scale; (d) actual administration of the scale; (e) analysis of the scale for the selection of
the pool of items to be included in the instrument; (f) development of computer programs
for instrument scoring and classification procedures; and (g) reliability and validity
assessments of the scale for the pilot r,.nd final versions.
Development of Items
The 38 questions were written using the standard domain sampling model supported
by Nunnally (1967) and Cronbach (1970). Initial questions addressing the seven major
training areas were written. These questions were scrutinized and studied. Next the pool
of items was expanded. Finally the questions were rewritten and revised. These final
revisions produced the pool of items contained in the Survey for Administrative Workshop
instrument.
Next a questionnaire form was developed for the pool of items. A Likert format was
employed as the response mode for all questions. Lemon (1973) has stated that much of
the experimental research pertaining to attitude change involves measuring attitudes by some
simple, easily administered instrument, usually a rating-scale format, and then attributing
changes or differences in the ratings to the experimental manipulations.
In this context, the Likert scale of summative ratings is the most widely used attitude
measure in current research. Gronlund (1976) stated that Likert's approach to attitude
scaling was less time consuming in development than earlier methods such as Thurston's and
Remmers'. Borg and Gall (1974) identified the Likert technique as the easiest method
presently available for developing scales needed in attitude research.

5
McGinnies (1970) clarified the procedures involved in constructing a Likert scale.
The first step involves the writing of a number of statements dealing with the topic under
investigation. Respondents then indicate their reaction to each question on an interval scale.
Severy (1974) added that it is assumed all written questions reflect the same
attitudinal dimensions when a Likert scale is developed. Advantages of the Likert scale are:
(1) that construction is less time consuming and easier than other scaling techniques, and (2)
that fewer items are required to obtain higher correlation coefficients (Ahmann & Glock,
1975; Borg & Gall, 1974; Gronlund, 1976; Lemon, 1973; Shaw & Wright, 1967).
Shaw and Wright (1967) indicated that items should be written in simple and clear
language, should contain a single idea, and should be unambiguous. Borg and Gall (1974)
noted that an instrument dealing with attitudes would generally be constructed as an attitude
scale and should include at least ten items to obtain a valid picture of the attitude
concerned. Tittle and Hill (1967) investigated the predictive efficiency of four frequently
used attitude measurement techniques in terms of predicting indices of voter behavior. The
Thurston, Guttman, Likert, and semantic differential scales were compared. In Tittle and
Hill's study, the Likert scale was superior to all other scales in predictive validity. Their
evidence suggested that in cases where the Likert and Thurston scales were of equal length,
the Likert scale exhibited higher reliability.
Likert scales are self-reporting tests commonly used in studies which include measures
of attitudes. Gronlund (1976) has observed that one of the most severe drawbacks of such
is the distortion of answers by respondents. Attitude scales, therefore, are most useful when
the participants have little reason for falsification.
1'1a

6
Borg and Gall (1974) have written that individuals who are planning to collect
information about attitudes should first search the literature to determine if a suitable scale
has already been constructed. If such a scale was not available, it would be necessary to
develop one.
A Likert discrepancy model was chosen because of its applicability in general or first-
time assessment trials (Witkin, 1977). Discrepancy as defined by Tyler (1949) is understood
to mean a difference between some standard of value and an actual status. Sarthory (1977)
has defined a need as a quantifiable gap in attitude, achievement, or performance between
the ideal and the real.
Kaufman (1972) and Southard (1974) have identified the four specific components
in a discrepancy needs assessment procedure: (1) determine desired conditions, (2)
determine existing conditions, (3) analyze discrepancies between the actual and desired
conditions, and (4) assign priorities to the discrepancies. These discrepancies constitute
indices of need.
Pertaining to the discrepancy format, respondents rate specific statements on two five-
point Likert scales: (a) perception of the degree to which the situation actually exists (A)
and (b) perception of the extent to which the situation is desired to exist (D). The
discrepancy between the two scale values, for a specific question, is referre to as the need
index.
The discrepancy format response mode included the following two column response
categories: (a) actual competence (ACT) (consisting of the following scale): (1) no
knowledge of; (2) knowledge of; (3) work with; (4) extensive work with; (5) expertise in; and

7
(b) desired training (DES) (consisting of the following scale): (1) desire no training, skill
unrelated; (2) desire no training, competency high; (3) desire awareness session; (4) desire
training; and (5) desire further training. The competency column is the actual status while
the training column is the desired status Ienkins and Taber (1977) found in an
agree/disagree context that the number of zsponse categories above five did not, in any
situation, yield a significant increase in Likert discriminability.
In recent years a great deal of research has been done to establish the fact that
response sets do exist in questionnaire responses (Bendig, 1962; Hand, 1964; Hand &
Brazzell, 1965; Rosenwald, 1961; Ruebush, 1963). In order to avoid response set bias or
acquiescence tendency, the try-out questions were randomly assigned within the instrument
(Cronbach, 1970). Many researchers believe that response sets are only a mild threat to
valid measurement, and that their importance has been overestimated. The available
evidence he asserts does not justify the strong negative assertions made by response-set
enthusiasts.
There is the question of a metric base for the variables. Stevens (1946) wrote that
factor analysis requires the variables be measured on at least an interval level. This
requirement is implied by the use of correlation or covariance matrices as the basic input
to factor analysis. If it were argued that the scaling used was not absolutely of a metric base,
would a researcher always avoid factor analysis? Kim and Mueller (1978) wrote that such
is not necessarily so. Many variables, such as measure of attitudes and opinions, do not have
a clearly established metric base. Furthermore, it is generally assumed that many ordinal
variables may be given numeric values without distorting the underlying properties. The
9
8
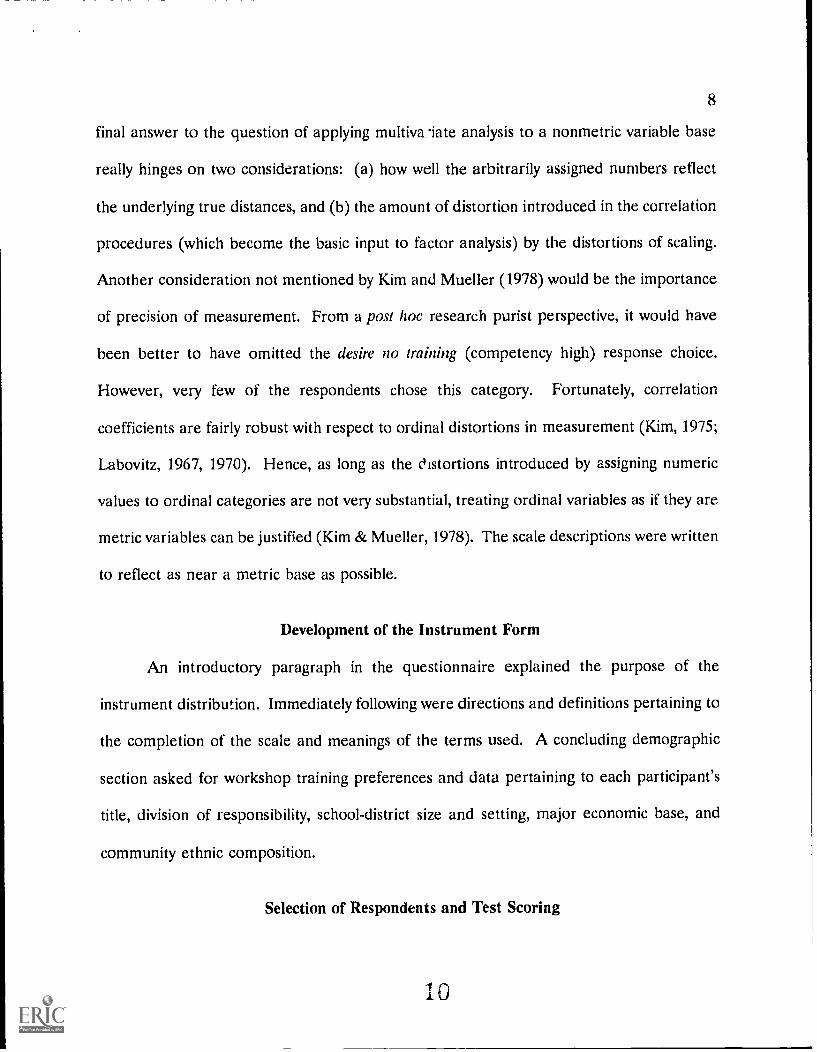
final answer to the question of applying multiva -iate analysis to a nonmetric variable base
really hinges on two considerations: (a) how well the arbitrarily assigned numbers reflect
the underlying true distances, and (b) the amount of distortion introduced in the correlation
procedures (which become the basic input to factor analysis) by the distortions of scaling.
Another consideration not mentioned by Kim and Mueller (1978) would be the importance
of precision of measurement. From a post hoc research purist perspective, it would have
been better to have omitted the desire no training (competency high) response choice.
However, very few of the respondents chose this category. Fortunately, correlation
coefficients are fairly robust with respect to ordinal distortions in measurement (Kim, 1975;
Labovitz, 1967, 1970). Hence, as long as the distortions introduced by assigning numeric
values to ordinal categories are not very substantial, treating ordinal variables as if they are
metric variables can be justified (Kim & Mueller, 1978). The scale descriptions were written
to reflect as near a metric base as possible.
Development of the Instrument Form
An introductory paragraph in the questionnaire explained the purpose of the
instrument distribution. Immediately following were directions and definitions pertaining to
the completion of the scale and meanings of the terms used. A concluding demographic
section asked for workshop training preferences and data pertaining to each participant's
title, division of responsibility, school-district size and setting, major economic base, and
community ethnic composition.
Selection of Respondents and Test Scoring
-1 0

9
All the respondents were administrative-type personnel, such as principals, assistant
principals, superintendents, assistant superintendents, supervisors, or curriculum directors.
School districts included both the Northeast and Northside Independent School Districts in
San Antonio, Texas; the Penn-Harris-Madison School Corporation in Osceola, Indiana; and
the Princeton Regional Schools in Princeton, New Jersey. The total sample size was 191.
A discrepancy format instrument like this would be scored using a correlated t test
to calculate a needs index for each question. The literature of statistical procedures is
replete with descriptions of and derivations for this procedure (Hicks, 1973; Hinkle &
Wiersma, 1979; Kirk, 1968).
Analysis of the Instrument
Construct validity was established through the factor analysis of the final 38-item scale
(Gorsuch, 1983). The factoring method used was PA2 (principal factoring using iteration)
with the varimax criterion specified as the method of orthogonal rotation (Nie, Hull, Jenkins,
Steinbrenner, & Bent, 1975). Three present status scales (PRE) and three desired status
scales (DES) emerged. The PRE and DES factors were paired and common questions were
extracted. This procedure reduces the common factors to two. The PRE questions for
factor one (factor loadings greater than or equal to .4) were PRE 16, 17, 18, 19, 21, 23, 24,
28, 31, 32, 35, and 36. Cronbach's alpha was .94 for this subscale. The corresponding DES
questions had an alpha value of .94. Both PRE and DES questions pooled had an alpha
value of .88. The identical procedure was followed in investigating the psychometric
properties of the second factor; the PRE questions which emerged were PRE 1, 2, 3, 5, 8,
12, and 29. Cronbach's alpha was .87. The corresponding DES questions had an alpha

10
value of .91. The pooled set of PRE and DES questions had an alpha value of .80. All
PRE questions (1, 2, 3, 5, 8, 12, 16, 17, 18, 19, 21, 23, 24, 28, 29, 31, 32, 35, and 36) had an
alpha value of .95. The alpha value for all the corresponding DES questions was .96. All
PRE and DES questions pooled had an alpha value of .91. Tables 1 and 2 list the varimax
rotated factor matrices for the PRE and DES column; (only items with factor loadings
greater than or equal to .4 were considered for inclusion in the instrument).
Questions 1, 2, 3, 5, 8, 12, and 29 dealt with planning and staff development.
Questions 16, 17, 18, 19, 21, 23, 24, 28, 31, 32, 35, and 36 dealt with assessment and
motivation. The administrators wanted to know how to assess the effectiveness of their
staffs, how to set goals, and how to motivate their staff to work at their peak and accomplish
their goals.
Summary and Conclusion
This article illustrates the process for the development and field testing of a needs
assessment instrument for the assessment of the continuing educational needs of
administrators. The process linked the literature review with a primary factor analysis. The
instrument was shown to be reliable and valid. Because of the reliability measures, the
instrument can be used for group assessment. If it were desired that norms be established
in an instrument development study, such would involve the use of converting and equating
procedures to generate a normal distribution process would allow the generation of
percentile reference points for the interpretation of a,. .ninistrators' scores. A sample could
be checked with respect to geographical distribution, socioeconomic level or other
information relevant to the study. For this particular study, however, norms were not

11
developed. Such could be a point-of-departure for another study which would encompass
a separate body of psychometric literature and statistical analyses.
3

INSTRUMENT ITEMS FOR SURVEY
1. How to design inservice programs which increase the effectiveness of my staff.
2. How to lead my staff and parents in long-range planning.
3. How to develop collaborative action plans for accomplishing school goals.
4. How to lead groups in creative problem solving activities.
5. How to develop effective action plans for accomplishing school goals.
6. How to think about my school (school system) from a systems approach toorg..mization and management.
7. How to provide leadership to my school in its continuous improvement.
8. How to plan for change and to be responsible to the emerging needs of my staff,students, and parents.
9. How to conduct formative evaluation.
10. How to conduct summative evaluation.
11. How to analyze my school organi7ation and its potential for growth.
12. How to plan for an conduct staff evaluation.
13. How to think about my school as an ecosystem and the various operational subsystemin my school environment.
14. How to set goals collaboratively.
15. How to involve teachers in peer supervision and continuous improvement on the job.
16. How to assess my administration effectiveness in working with my staff, students, andparents to improve my school.
17. How to involve teachers, students, and parents in planning for school improvement.
18. How to assess the needs of my school and set my own goals for improvement.
19. How to motivate my staff to work at the peak of their potential.
20. How to control all school activities so that we accomplish our goals effectively.

21. How to assess thd growth needs of my faculty.
22. How to use creative problem solving techniques in dealing with specific schoolorganizational problems.
23. How to assess my own beliefs and values in relation to what exists in my schoolcurrently and to my visions for improvement.
24. How to assess the various forces within and outside my school and their influence onmy goals for improvement.
25. How to conduct long-range planning for school improvement.
26. How to generate creative options for accomplishing goals.
27. How to evaluate the accomplishment of school goals.
28. How to identify my own personal characteristics and their effect on my performance.
29. How to monitor the implementation of school improvement plans.
30. How to plan for my own professional growth needs.
31. How to assess our resources for all goals.
32. How to develop creative solutions to school problems.
33. How to assess my self-concept and its effect on my goals.
34. How to nurture creativity among staff members.
35. How to organize my school so as to maximize our resources in accomplishing ourpurposes.
36. How to increase my visions of the possibilities for educational change in my school.
37. How to increase my own skills in supervision through observation of teachingperformance, critical analysis, and interpretation of data and data feedback andrecommendations for improvement.
38. How to prioritize goal options.

TABLE 1
VARIMAX ROTATED FACTOR MATRIX BY QUESTION FORTHE PRE COLUMN IN THE INSTRUMENT
Item Number' Factor #1 Factor #2 Factor #3(78.9)b (6.7) (4.3)
PRE 01 0.221 0.577 0.121PRE 02 0,288 0.634 0.190PRE 03 0.221 0.519 0.099PRE 04 0.091 0.529 0.180PRE 05 0.316 0.616 0.153PRE 06 0.199 0.328 0.208PRE 07 0.397 0.678 0.168PRE 08 0.355 0.594 0.260PRE 09 0.169 0.320 0.230PRE 10 0.2S8 0.298 0.158PRE 11 0.616 0.334 -0.040PRE 12 0.296 0.535 0.132PRE 13 0.280 0.176 0.115PRE 14 0.400 0.477 0.298PRE 15 0.379 0.106 0.212PRE 16 0.632 0.144 0.253PRE 17 0.571 0.335 0.260PRE 18 0.603 0.354 0.292PRE 19 0.592 0.345 0.287PRE 20 0.682 0.297 0.256PRE 21 0.649 0.167 0.229PRE 22 0.620 0.266 0.180PRE 23 0.530 0.166 0.365PRE 24 0.630 0.143 0.290PRE 25 0.566 0.365 0.107PRE 26 0.547 0.312 0.243PRE 27 0.683 0.377 0.198PRE 28 0.549 0.104 0,541PRE 29 0.560 0.407 0.325PRE 30 0.249 0.267 0.680PRE 31 0.615 0.194 0.360PRE 32 0.581 0.294 0.296PRE 33 0.352 0.218 0.724PRE 34 0.392 0.226 0.502PRE 35 0.624 0.282 0.349
(Continued)

TABLE 1 Continued
VARIMAX ROTATED FACTOR MATRIX BY QUESTION FORTHE PRE COLUMN IN THE INSTRUMENT
Item Number' Factor #1 Factor #2 Factor #3(78.9)b (6.7) (4.3)
PRE 36 0.662 0.289 0.308PRE 37 0.428 0.348 0.471PRE 38 0.552 0.242 0.455
a Items in present-competency column (PRE) correspond to the instrumentnumbering sequence
b Percent of total variance is in parentheses

TABLE 2
VARIMAX ROTATED FACTOR MATRIX BY QUESTION FORTHE DES COLUMN IN THE INSTRUMENT
Item Number' Factor #1 Factor #2 Factor #3(83.1)b (5.4) (4.3)
DES 01 0.231 0.512 0.105DES 02 0.182 0.578 0.175DES 03 0.120 0.458 0.479DES 04 0.203 0.176 0.258DES 05 0.202 0.412 0.258DES 06 0.198 0.246 0.626DES 07 0.332 0.249 0.284DES 08 0.322 0.464 0.220DES 09 0.163 0.671 0.330DES 10 0.185 0.594 0.357DES 11 0.386 0.454 0.512DES 12 0.272 0.609 0.248DES 13 0.101 0.154 0.687DES 14 0.270 0.339 0.503DES 15 0.244 0.435 0.165DES 16 0.598 0.427 0.043DES 17 0.408 0.514 0.092DES 18 0.504 0.438 0.361DES 19 0.540 0.391 0.076DES 20 0.348 0.292 0.335DES 21 0.640 0.289 0.151DES 22 0.289 0.272 0.225DES 23 0.510 0.304 0.464DES 24 0.474 0.173 0.541DES 25 0.335 0.477 0.270DES 26 0.223 0.198 0.373DES 27 0.271 0.506 0.199DES 28 0.571 0.318 0.317DES 29 0.266 0.428 0.223DES 30 0.521 0.287 0.266DES 31 0.413 0.296 0.349DES 32 0.408 0.165 0.236DES 33 0.565 0.159 0.436DES 34 0.548 0.157 0.179DES 35 0.537 0.200 0.388
(Continued)
8
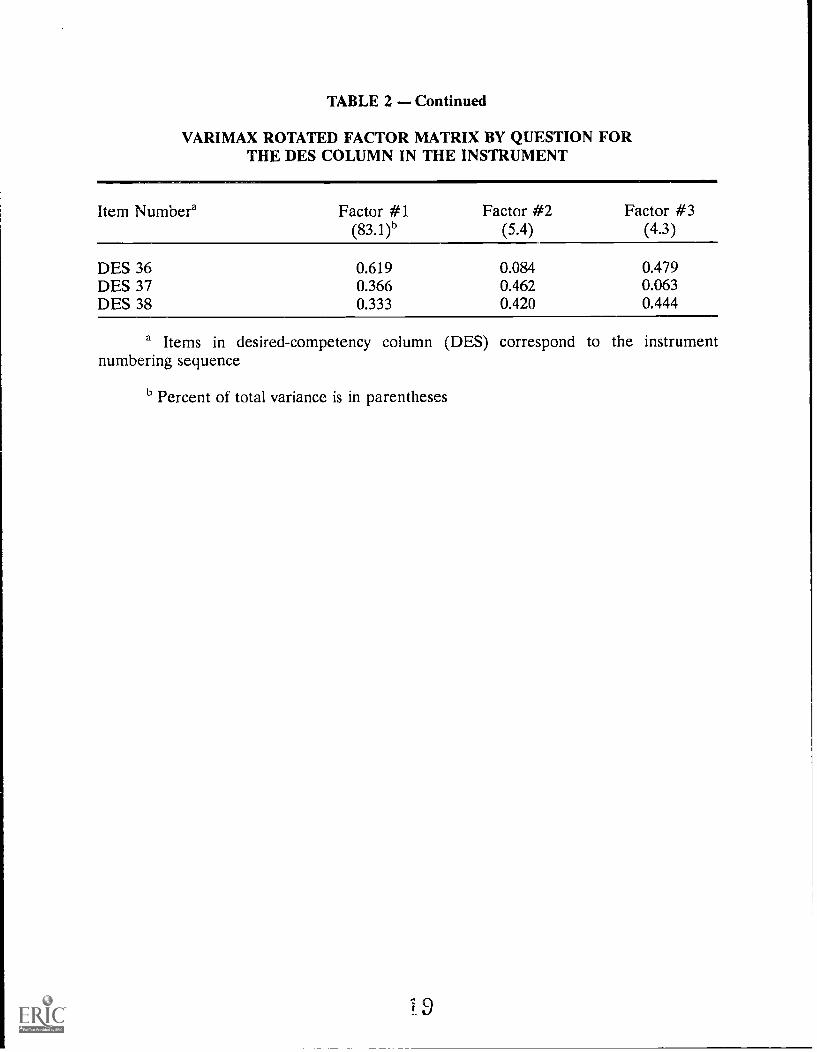
TABLE 2 Continued
VARIMAX ROTATED FACTOR MATRIX BY QUESTION FORTHE DES COLUMN IN THE INSTRUMENT
Item Number' Factor #1 Factor #2 Factor #3(83.1)b (5.4) (4.3)
DES 36 0.619 0.084 0.479DES 37 0.366 0.462 0.063DES 38 0.333 0.420 0.444
a Items in desired-competency column (DES) correspond to the instrumentnumbering sequence
b Percent of total variance is in parentheses

REFERENCES
Ahmann, J.S., & Glock, M.D. (1975). Evaluating pupil growth. Boston: Allyn & Bacon.
Bendig, A.W. (1962). A factor analysis of "social desirability," "defensiveness," "lie," and"acquiescence" scales. Journal of General Psychology, 66, 129-136.
Borg, W.R., & Gall, M. (1974). Educational research. New York: David McKay Company.
Cronbach, L.J. (1970). Essentials of psychological testing. New York: Macmillan.
Gorsuch, R.L. (1983). Factor analysis. Hillsdale, NJ: Lawrence Erlbaum Associates, Inc.
Gronland, N.E. (1976). Measurement and evaluation in teaching. New York: Macmillan.
Hand, J. (1964). Measurement of response sets. Psychological Reports, 14, 907-913.
Hand, J., & Brazzell, C.O. (1965). Contamination in measures of acquiescence and socialdesirability. Psychological Reports, 16, 759-760.
Hicks, C.R. (1973). Fundamental concepts in the design of experiments. New York: Holt,Rinehart & Winston.
Hinkle, D.E., & Wiersma, W. (1979). Applied statistics for the behavioral sciences.Chicago: Rand-McNally.
Jenkins, G.D., & Taber, T.D. (1977). A Monte Carlo study of factors affecting three indicesof composite scale reliability. Journal of Applied Psychology, 62(3), 392-398.
Johnson, W.L., Snyder, K.J., & Johnson, A.B. (1991). Instructional leadership for productiveschools. Teacher Education and Practice, 7(1), 51-58.
Kaufman, R.A. (1972). Educational system planning. Englewood Cliffs, NJ: Prentice Hall.
Kim, J.O. (1975). Multivariate analysis of ordinal variables. American Journal of Sociology,81, 261-298.
Kim, J.O., & Mueller, C.W. (1978). Factor analysis. Beverly Hills, CA: Sage Publications.
Kirk, R. (1968). Experimental design: Procedures for the behavioral sciences. Belmont,CA: Brooks/Cole.
Labovitz, S. (1967). Some observations on measurment and statistics. Social Forces, 46, 151-160.
2u

Labovitz, S. (1970). The assignments of numbers to rank order categories. AmericanSociological Review, 35, 515-524.
Lemon, N. (1973). Attitudes and their measurement. London: B.T. Batsford.
McGinnies, E. (1970). Social behavior: A functional analysis. ,oston: Houghton Mifflin.
Nie, N.H., Hull, C.H., Jenkins, J.G., Steinbrenner, K., & Bent, D.H. (1975). Statisticalpackage for the social sciences. New York: McGraw-Hill.
Nunnally, J.C. (1967). Psychometric theory. New York: McGraw-Hill.
Rosenwald, G.C. (1961). The assessment of anxiety in psychological experimentation: Atheoretical reformulation and test. Journal of Abnormal and Social Psychology. 62,666-673.
Ruebush, B.K. (1963). Anxiety. In H.W. Stevenson, J. Kagan, & C. Spiker (Eds.), ChildPsychology; The sixty-second yearbook of the national society for the study ofeducation (Part I). Chicago, IL: The University of Chicago Press.
Sarthory, J.A. (1977). Needs assessment and the practitioner: Problems and prospects.Educational Technology. 17, 24-26.
Severy, L.J. (1974). Procedure and issues in the measurement of attitudes. Washington,DC: National Institute of Education. (ERIC Document Reproduction Service No.ED 099 426).
Shaw, M.E., & Wright, J.M. (1967). Scales for the measurement of attitudes. New York:McGraw-Hill.
Snyder, K.J., & Anderson, R.H. (1986). Managing productive schools: Toward an ecology.San Diego: Harcourt, Brace and Jovanovich, Inc.
Snyder, K.J. (1988). Managing productive schools. San Diego: Harcourt, Brace &Jovanovich, Inc.
Southland, M. (1974). A framework for evaluating needs assessment models. Unpublishedmanuscript, Florida State University, Tallahassee, FL.
Stevens, S.S. (1946). On the theory of scale measurement. Science, 103, 677-680.
Tittle, C.R., & Hill, R.E.J. (1967). Attitude measurement and prediction of behavior: Anevaluation of conditions and measurement techniques. Sociometry, 31(2), 199-213.
Tyler, R. (1949). Basic principles of curriculum and instruction. Chicago, IL: TheUniversity of Chicago Press.

Witkin, B.R. (1977). Needs assessment kits, models, and tools. Educational Technology, 17,4-18.