document resume ed 294 022 - eric · computer chips. and paper clips. technology and women's...
TRANSCRIPT

ED 294 022
AUTHORTITLE
INSTITUTION
SPONS AGENCY
REPORT NOPUB DATENOTEAVAILABLE FROM
PUB TYPE
EDRS PRICE .
DESCRIPTORS
ABSTRACT
DOCUMENT RESUME
CE 050 059
Hartmann, Heidi I., Ed.; And OthersComputer Chips and Paper Clips. Technology andWomen's Employment. Volume II. Case Studies andPolicy Perspectives.National Academy of Sciences - National ResearchCouncil, Washington, DC. Committee on Women'sEmployment and Related Social Issues.Economic Development Administration (DOC),Washington, D.C.; National Commission for EmploymentPolicy (DOL), Washington, D.C.; Women's Bureau (DOL),Washington, D.C.ISBN-0-309-03727-187450p.; For volume I, see CE 050 058.National Academy Press, 2101 Constitution Avenue, NW,Washington, DC 20418 ($34.95; two-volume set:$49.00).Information Analyses (070) -- Reports -Research /Technical (143)
MF01 Plus Postage. PC Not Available from EDRS.Adult Education; Automation; *Employed Women;Employment Level; *Employment Patterns; *EmploymentPractices; Employment Projections; Females; Futures(of Society); Information Processing; *InformationTechnology; *Technological Advancement;Telecommunications
This volume contains 12 papers commissioned by thePanel on Technology and Women's Employment. "Technology, Women, andWork: Policy Perspectives" (Eli Ginzberg) is an overview thatprovides a context for the volume. The four case studies in Part IIdescribe the impact of information technology in the insuranceindustry, among bookkeepers, among secretaries, and incomputer-related occupations. They are "The TechnologicalTransformation of White-Collar Work: A Case Study of the InsuranceIndustry" (Barbara Baran); "'Machines Instead of Clerks': Technologyand the Feminization of Bookkeeping, 1910-1950" (Sharon Strom); "NewTechnology and Office Tradition: The Not-So-Changing World of theSecretary" (Mary Murphree); and "Integrated Circuits/SegregatedLabor: Women in Computer-Related Occupations and High-TechIndustries" (Myra Strober, Carolyn Arnold). The three papers in PartIII connect technological change with trends in women's employment:"Women's Employment and Technological Change: A HistoricalPerspective" (Claudia Goldin); "Recent Trends in Clerical Employment:The Impact of Technological Change" (H. Allan Hunt, Timothy Hunt);and "Restructuring Work: Temporary, Part-Time, and At-HomeEmployment" (Eileen Appelbaum). The four papers in Part IV providepolicy perspectives on important subjects: "Employer Policies ToEnhance the Application of Office System Technology to Clerical Work"(Alan Westin); "New Office and Business Technologies: The Structureof Education and (Re)Training Opportunities" (Bryna Fraser); "The NewTechnology and the New Economy: Some Implications for EqualEmployment Opportunity" (Thierry Noyelle); and "ManagingTechnological Change: Responses of Government, Employers, and TradeUnions in Western Europe and Canada" (Felicity Henwood, Sally Wyatt).The volume concludes with biographical sketches of all contributors.(YLB)

U S OEPARTMENT OF EDUCATIONOffice t Educational Research and Improvement
ED ATIONALRESOURCES
INFORMATIONCENTER ICI
This document has been reproduced asreceived hom the person or organizationoriginating it
r Minor changes have been made to improvereproduction quality
Points of view or opinions stated in this doorment do not necessarily represent officialOERI position or policy
"PERMISSION TO REPRODUCE THISMATERIAL IN MICROFICHE ONLYHAS BEEN GRANTED BY
TO THE EDUCATIONAL RESOURCESINFORMATION CENTER (ERIC)."
Co Chipsand Paper Clip
. Technology and Women's Em
.qt4AkNATIONAL IL
1

Computer Chipsand Paper ClipsTechnology and Women's Employment
VOLUME II
Case Studies and Policy Perspectives
Heidi I. Hartmann, Editor
Panel on Technology and Women's Employment
Committee on Women's Employment and Related Social Issues
Commission on Behavioral and Social Sciences and Education
National Research Council
NATIONAL ACADEMY PRESSWashington, D.C. 1987
3
National Academy Press 210i Constitution Avenue, NW Washington, DC 20418
NOTICE: The project that is the subject of this report was approved by the GoverningBoard of the National Research Council, whose members are drawn from the councilsof the National Academy of Sciences, the National Academy of Engineering, and theInstitute of Medicine. The members of the committee responsible for the report werechosen for their special competence. and with regard for appropriate balance.
This report has been reviewed by a group other than the authors according toprocedures approved by a Report Review Committee consisting of members of theNational Academy of Sciences, the National Academy of Engineering, and the Instituteof Medicine.
The National Research Council was established by the National Academy of Sciencesin 1916 to associate the broad community of science and technology with the Academy'spurposes of furthering knowledge and advising the federal government. The Counciloperates in accordance with general policies determined by the Academy under theauthority of its congressional charter of 1863, which establishes the Academy as aprivate, nonprofit, self-governing membership corporation. The Council has become theprincipal operating agency of both the National Academy of Sciences and the NationalAcademy of Engineering in the conduct of their services to the government, the public,and the scientific and engineering communities. It is administered jointly by bothAcademies and the Institute of Medicine. The National Academy of Engineering and theIns:itute of Medicine were established in 1964 and 1970, respectively, under the currentcharter of the National Academy of Sciences.
This project has been supported by funding from the Women's Bureau of the U.S.Department of Labor, the National Commission for Employment Policy, the EconomicDevelopment Administration of the U.S. Department of Commerce, and by the NationalResearch Council (NRC) Fund. The NRC Fund is s pool of private, discretionary,nonfederal funds that is used to support a program of Academy-initiated studies ofnational issues in which science and technology figure significantly. The NRC Fundconsists of contributions from a consortium of private foundations including the CarnegieCorporation of New York, the Charles E. Culpeper Foundation, the William and FloraHewlett Foundation, the John D. and Catherine T. MacArthur Foundation, the AndrewW. Mellon Foundation, the Rockefeller Foundation, and the Alfred P. Sloan Foundation;the Academy Industry Program, which seeks annual contributions from companies thatare concerned with the health of U.S. science and technology and with public policyissues with technology content; and the National Academy of Sciences and the NationalAcademy of Engineering endowments.
Library of Congress Cataloging-in-Publication Data(Revised for vol. 2)
National Research Council (U.S.). Committee on Women's Employment and RelatedSocial Issues. Panel on Technology and Women's Employment. Computer chips andpaper clips.
Bibliography: v. 1, p. 183-199.Includes index.Contents: v. 1. [without special title] v. 2. Case studies and policy perspectives /Heidi I. Hartmann, editor.
1. Women white collar workersEffects of technological innovations on. 2. OfficepracticeAutomation. 3. MicroelectronicsSocial aspects. 4. WomenEmployment.5. WomenEmploymentGoverment policyUnited States. 1. Hartmann, Heidi 1. 11.Kraut, Robert E. III. Tilly, Louise.HD6331.18.M39N38 1986 331.4 ' 8165137 '0973 86-18113ISBN 0-309-03688-7 (v. 1)ISBN 0-309-03727-1 (v. 2)
Printed in the United States of America
4

Panel on Technology and Women's Employment
LOUISE A. TILLY (Chair), Committee on Historical Studies,Graduate Faculty, New School for Social Research
TAMAR D. BERMANN, Work Research Institutes, Oslo, NorwayFRANCINE D. BLAU, Department of Economics and Institute of
Labor and Industrial Relations, University of IllinoisDENNIS CHAMOT, Professional Employees Department,
AFL-CIO, Washington, D.C.MARTIN L. ERNST, Arthur D. Little, Inc., Cambridge, Mass.ROSLYN FELDBERG, Massachusetts Nurses Association, Boston,
Mass.WILLIAM N. HUBBARD, JR., Hickory Corners, Mich.GLORIA T. JOHNSON, International Union of Electronic,
Technical, Salaried, and Machine Workers, AFL-CIO,Washington, D.C.
ROBERT E. KRAUT, Bell Communications Research, Inc.,Morristown, N.J.
SHIRLEY M. MALCOM, American Association for theAdvancement of Science, Washington, D.C.
MICHAEL J. PIOPE, Department of Economics, MassachusettsInstitute of Technology
FREDERICK A. ROESCH, Citicorp, New YorkTERESA A. SULLIVAN, Population Research Center, University of
TexasDONALD J. TREIMAN, Department of Sociology, University of
California, Los AngelesROBERT K. YIN, COSMOS Corporation, Washington, D.C.PATRICIA ZAVELLA, Merrill College, University of California,
Santa Cruz
HEIDI I. HARTMANN, Study DirectorLUCILE A. DIGIROLAMO, Staff AssociateGILLIAN MARCELLE, Editorial Assistant
in
5

Committee on Women's Employment andRelated Social Issues
ALICE S. ILCHMAN (Chair), President, Sarah Lawrence CollegeCECILIA P. BURCIAGA, Office of the Dean and Vice Provost,
Stanford UniversityCYNTHIA FUCHS EPSTEIN, Graduate Center, City University of
New York, and Russell Sage Foundation, New YorkLAWRENCE M. KAHN, Department of Economics and Institute of
Labor and Industrial Relations, University of IllinoisGENE E. KOFKE, Montclair, N.J.ROBERT E. KRAUT, Bell Communications Research, Inc.,
Morristown, N.J.JEAN BAKER MILLER, Stone Canter for Developmental Services
and Studies, Wellesley CollegeELEANOR HOLMES NORTON, Georgetown University Law CenterGARY ORFIELD, Department of Politica Science, University of
ChicagoNAOMI R. QUINN, Department of Anthropology, Duke UniversityISABEL V. SAWHILL, The Urban Institute, Washington, D.C.ROBERT M. SOLOW, Department of Economics, Massachusetts
Institute of TechnologyLOUISE A. TILLY, Committee on Historical Studies, Graduate
Faculty, New School for Social ResearchDONALD J. TREIMAN, Department of Sociology, University of
California, Los Angeles
iv
6 $.

Contents
CONTENTS, VOLUME I vii
PREFACE ix
ACKNOWLEDGMENTS xv
I. OVERVIEW
Technology, Women, and Work: Policy Perspectives 3Eli Ginzberg
II. CASE STUDIES OF WOMEN WORKERS ANDINFORMATION TECHNOLOGY
The Technological Transformation of White-CollarWork: A Case Study of the Insurance Industry 25
Barbara Baran"Machines Instead of Clerks": Technology and theFeminization of Bookkeeping, 1910-1950 63
Sharon Hartman StromNew Technology and Office Tradition: TheNot-So-Changing World of the Secretary 98
Mary C. Murphree
v
7

vi CONTENTS
Integrated Circuits/Segregated Labor: Women inComputer-Related Occupations andHigh-Tech Industries 136
Myra H. Strober and Carolyn L. Arnold
III. TECHNOLOGY AND TRENDS IN WOMEN'SEMPLOYMENT
Women's Employment and Technological Change:A Historical Perspective 185
Claudia GoldinRecent Trends in Clerical Employment:The Impact of Technological Change 223
H. Allan 11.nt and Timothy .., HuntRestructuring Work: Temporary, Part-Time,and At-Home Employment 268
Eileen Appelbaum
IV. POLICY PERSPECTIVES
Employer Policies to Enhance the Application ofOffice System Technology to Clerical Work 313
Alan F. WestinNew Office and Business Technologies: The Structureof Education and (Re)Training Opportunities 343
Bryna Shore FraserThe New Technology and the New Economy: SomeImplications for Equal Employment Opportunity 373
Thierty J. NoyelleManaging Technological Change: Responses ofGovernment, Employers, and Trade Unionsin Western Europe and Canada 395
Felicity Henwood and Sally Wyatt
BIOGRAPHICAL SKETCHES OF CONTRIBUTORS 433
s

Contents, Volume I
1. TECHNOLOGICAL CHANGE AND WOMEN WORKERSIN THE OFFICE
2. HISTORICAL PATTERNS OF TECHNOLOGICAL CHANGE
3. EFFECTS OF TECHNOLOGICAL CHANGE: EMPLOYMENTLEVELS AND OCCUPATIONAL SHIFTS
4. EFFECTS OF TECHNOLOGICAL CHANGE: THE QUALITYOF EMPLOYMENT
5. CONCLUSIONS AND RECOMMENDATIONS
REFERENCES
BIOGRAPHICAL SKETCHES OF PANEL MEMBERS AND STAFF
INDEX
vii

Preface
Striking advances in microelectronic and telecommunicationstechnology have transformed many worlds of work. These changeshave revolutionized information storage, processing, and retrieval;with immediate and long-range consequences for clerical work.Since womennearly 15 million of themare the overwhelmingmajority of clerical workers, they are and will be disproportionatelyaffected by this type of technological change. Jobs may be createdor eliminated, but they are also transformed. So far, knowledgeabout these large processes of change has been scattered and in-complete. Thus, there is great need for more systematic evaluationand understanding of technological change and its specific effectson the conditions of and opportunities for women's employment.
In light of this need, the Committee on Women's Employmentand Related Social Issues established its Panel on Technology andWomen's Employment in March 1984. The tasks of the panelincluded gathering existing data, identifying areas in which re-search is most needed and commissioning scholars to undertakethis research, and preparing a conference and a two-volume reportto present the panel's findings and recommendations. This workwas supported by the Women's Bureau of the U.S. Departmentof Labor, the National Commission for Employment Policy, the
ix
10

x PREFACE
Economic Development Administration of the U.S. Department ofCommerce, and the National Research Council Fund.
A number of questions faced the panel: To what extent do cur-rent changes differ from earlier ones? Is the new microelectronicand telecommunications technology creating or eliminating jobs?In what ways is it affecting the quality of employment for thosewhose job organization and content are being transformed? Arethere differential effects that depend on the skill, occupation, in-dustry, or demographic characteristics, such as minority status orage of workers? If jobs disappear or change drastically, what kindof supporttraining, retraining, or relocationmight be neededfor displaced workers? What institutional arrangements might benecessary or desirable for planning and implementing change ordevising support programs"
The panel's answers to these questions are presented in Vol-rme I (a listing of its contents precedes this preface). This secondvolume gathers many of the papers commissioned by the panelduring the course of its work. Each illuminates, from the author'sown perspective, one or more aspects of those questions examinedby the panel. Often these perspectives differ, indicating the con-tradictory interpretations of fact that characterize the research ontechnology and employment, particularly because the phenomenabeing studied are still unfolding and the data are very much lessthan adequate to the task. Each paper has been revised by itsauthor(s) to take into account the comments of panel membersand others who participated in a workshop held in February 1985to discuss early versions of the papers.
Professor Eli Ginzberg's overview provides a context for thevolume. He presents his view of the changes that have takenplace in the participation of women in the labor market, notingthat some of the economic sectors that in the past provided thebulk of job growth for women workers may no longer do so, atleast partly due to new office technologies. He stresses, however,that technological change is a critical factor in fostering economicgrowth and creating new types of jobs. His policy prescriptionsinclude continued research and development to enhance techno-logicel change and economic growth, full employment, improvededucation and retraining, continued enforcement of equal employ-ment opportunity laws and regulations, and increased provision ofchild care.

PREFACE xi
The four case studies in Part II describe the impact of infor-mation technology in the insurance industry, among bookkeepers(between 1910 and 1950), among secretaries, and in computer-related occupations. The first three case studies trace how theopportunities of women workers tend to change along with al-terations in the organization of work and the implementation ofinnovations. Barbara Baran, Sharon Strom, and Mary Murphreeall argue that women's opportunities have become more limited asthe division of labor has become increasingly structured. Barannotes the current contradiction within the insurance industry thatas jobs become more skilled in many ways as a result of comput-erization they also offer less mobility; she also anticipates declinesin the number of jobs likely to be available to clerical workers,particularly the least-skilled workers. Strom's history of changesin women's role in bookkeeping, an important clerical occupa-tion, gives equal weight to changes in the organization of workand to the various innovations in calculating machines availableto bookkeepers over the years. Up to 1950, bookkeepers grew innumber and became preponderantly female; their work was in-creasingly tied to machines and their opportunities increasinglycircumscribed. Murphree's contemporary case study shows howthe effects of office technologies on secretaries vary according tothe way these technologies are used. A critical variable, Murphreefinds, is the number of bosses the secretary serves; accordingly,with new equipment, her work may become more or less chal-lenging. In nearly all cases, however, Murphree finds that thepatrimonial nature of office work, in particular its strong relianceon differences in gendered roles, remains little changed.
Strober and Arnold examine the newly emerging occupationsrelated to computers: computer scientists and systems analysts,computer programmers, and computer operators. Using dataavailable from the Census Bureau, they find that even in thesenew occupations gender-based earnings differentials exist. Oneexplanation suggested is that women and men in these occupa-tions tend to work in different industries, with women less likelythan men to work in the "high-tech" industries.
The pessimistic impression left by these case studies of the im-pact of computers (and their forerunners) is somewhat mitigatedby the sweeping historical analysis provided by Claudia Goldin.The first of three authors in Part III who connects technologicalchange with trends in women's employment, Goldin reviews the
xii PREFACE
history of women's employment and productivity growth since the1800s. She reports that across indil:Aries women have tended toincrease their representation where productivity growth has beengreatest and also notes that the entrance of women into manufac-turing in the 1800s, where technologic 1 and organizational changewas especially pronounced, tended to raise women's wages. To-L , these facts indicate that technological and organizationalcl....6e generally enhance women's opportunities. In the morerecent period, however, Goldin sees the increase in women's ed-ucation as the single most important factor in changing women'slabor force status.
Allan Hunt and Timothy Hunt, in their review of trends inclerical employment from 1940 to the early 1980s, attempt to iden-tify specific impacts of office automation. Like Ginzberg, they notethat it is easier to attach technological explanations to areas ofdecreasing employment than to anticipate the new jobs technol-ogy may create. Their findings suggest that although employmentgrowth in clerical jobs has slowed (probably permanently), techno-logical change cannot in most instances be identified as the reason.For example, despite the increased capital investment in the finan-cial sector, no trend toward increased productivity (and possilslejob displacement) was discerned.
Eileen Appelbaum points to other important trends in therecent period: the significant increase in temporary work, shiftsin part-time work, and the modest increase in home-based work.All these shifts, she argues, are facilitated by computerization, butalso reflect changes in the organization of work. In Appelbaum'sview, these new forms of work are likely to become increasinglyimportant as employers continue to face the need to minimizecosts. Although new work may provide some important optionsfor women workers, Appelbaum believes that on the whole thesetrends have more negative consequences than positive ones.
The four papers in Part IV provide policy perspectives onimportant subjects. Alan Westin reviews recent exp-riences of asample of major employers with office automation . Id offers hissuggestions for how best to implement new office system technolo-gies. He reports that increasing attention is being given in work-places to enhancing the quality of employment and notes that themost important factor in determining how well an employer usesnew technology is the overall quality of its human resources policy.Bryna Fraser describes available options for attaining education
13

PREFACE ziii
and training related to new technologies and recommends impor-tant improvements in the delivery of education and training. Likemany of the authors in the collection, she notes the importance ofcontinuing education over a lifetime. Thierry Noyelle, on the basisof his analysis of changes in the service sector, argues that edu-cation will become even more important in the future in ensuringemployment opportunity. Like Appelaum, Baran, and others,Noyelle believes the structure of employment opportunities withinfirms is undergoing fundamental change. Internal labor markets,with clear job ladders providing upward mobility, are disappear-ing. Instead, increased hiring of skilled workers is occurring, andworkers must have greater skills to obtain entry-level jobs; on-the-job training is a less sure route to upward mobility for theless skilled. Felicity Henwood and Sally Wyatt, two researchersfrom the United Kingdom, provide an overview of employmentpolicies related to technological change in Western Europe. Theynote that workers are more involved in decisions involving the im-plementation of technological change in many European countriesthan they are in the United States. Henwood and Wyatt also re-view European education and training policies and policies relatedto easing unemployment, some of which may be due to technologi-cal change. Throughout, they stress that women, because of theirspecific locations in paid and unpaid employment, tend to haveperspectives and needs different from those of men. They notein particular that women have often been more sensitive to issuesconcerning quality of work.
The panel offers these papers, with their divergent viewpoints,not only because they were helpful to it in its own deliberations,but also in the belief that they will stimulate further discussionand research. The issues raised in these papers about the curr'nttransformations in employment concern both men and WOIP'.2workers, although the particular examples are taken primarilyfrom areas of predominant employment for women.
LOUISE A. TILLY, ChairHEIDI I. HARTMANN, Study Director
Panel on Technology andWomen's Employment

Acknowledgments
These papers were commissioned by the panel to inform itswork. The authors have earned our appreciation for the insight andtimeliness of their research. Many of them present here the fruitsof original data-collection efforts, vastly more involved than couldbe described in the space allotted to them here. Others have spentconsiderable effort to create consistent data series from published_and unpublished sources. All have brought their considerableanalytical skills to bear on questions of importance to the panel.Thanks also to the panel members for identifying topics for thepapers, thinking carefully about the questions that needed to beaddressed, and reviewing the work of the authors at many stages.
Even after the major effort of summarizing research resultsin a written product has been completed, producing a publishedvolume of collected papers is a formidable task. Lucile Di Giro-lamo, staff associate to the panel, ably organized much of theprocess, from the contracting and fiscal management involved incommissioning papers to keeping track of the numerous drafts andassisting in checking references and tables. She ably elicited coop-eration from the authors in matters both of format and substance.Gillian Marcel le, a student intern with the panel, who served as
xv

xvi ACKNOWLEDGMENTS
editorial assistant for this volume, made important intellectualcontributions to the overall shape of the volume. She also editedseveral of tae papers, making organizational and substantive im-provements. In this era of incomplete automation, many of thesepapers were produced on word-processing systems incompatiblewith that used by the National Academy Press. Much of thetranslation and cleanup involved were done by William Vaughan,staff assistant to the panel, and Estelle Miller, electronic composi-tion specialist, National Academy Press, in addition to Lucile andGillian. Estelle Miller used laser composition software to producecamel :eady copy. Nancy Winchester, project editor, NationalAcademy Press, supervised the production of the manuscript. Toall we express our appreciation for a great deal of hard work, oftenperformed under tight time pressures. Throughout this process,too, the authors were unusually responsive.
We also thank Alice S. Ilchman, chair of the Committee onWomen's Employment and Related Social Issues, for the manyways in which she facilitated the panel's work. Eugenia Grohman,associate director for reports for the Commission on Behavioraland Social Sciences and Education, provided useful advice andcoordinated production with the Press. David A. Goslin, executivedirector of the commission, has our appreciation for his continuedsupport of the work of the committee and its panels.
Several organizations made this report possible through theirfinancial support. We thank both the organizations and the in-dividuals who provided liaison. At the Women's Bureau of theU.S. Department of Labor, we thank Collis Phillips, Mary Mur-phree, and Roberta McKay. In addition, we would like to recognizeLenora Cole-Alexander, former director of the Women's Bureau,for her interest in and strong support of the project. Carol Romeroand her staff at the National Commission for Employment Policyprovided the impetus and the funds for a major review of cleri-cal employment trends, which was carried out by Allan Hunt andTimothy Hunt and reported briefly here. Beverly Milkman andRichard Walton, at the Economic Development Administration ofthe U.S. Department of Commerce, aided the panel with a grant toallow it to complete the project in a timely manner. Crucial earlyfunding was provided by the National Research Council Fund.
LOUISE A. TILLYHEIDI I. HARTMANN

Part I
Overview

Technology, Women, and Work:Policy Perspectives
ELI GINZBERG
THE CHANGING ROLE OF AMERICAN WOMEN
In the mid-1950s, the National Manpower Council decidedby only a single vote that "womanpower" was a subject worthexploring (National Manpower Council, 1957). And in the early1960s, when Barnard College required that its studei.Ls attenda series of lectures on jobs and careers, my lecture elicited onlybored faces and clicking knitting needles. Most of the studentswere not interested in the advice that I offered: to study calculusand to gain mastery over the quantitative approaches in one of thenatural or social sciences, which, I assured them, would providethem not only access to a job, but to a job with prospects. Earlyin the era of the feminine mystique, their minds and emotionswere focused in °the : directions (Ginzberg and Yohalem, 1966;Ginzberg et al., 1966).
These recollections are presented to contrast with the situationtoday, when many college-educated women are studying a broaderrange of subjects and are making an increasing commitment to thelabor force. The growing importance of women in the U.S. labormarket, where they now account for 43 percent of all workers, a
3
1

4 POLICY PERSPECTIVES
percentage that continues to grow, is a recent phenomenon. Butduring this short timesince around 1950there have been manystriking changes in the relation of women to work. Witness thefollowing:
Over half of all women aged 16 to 64 work, and the pro-portion is almost two-thirds for those who are at the end of theirchildbearing period.
Although it is true that more women than men work lessthan full-time, year-round, most women who work, like most men,are regular workers who hold full-time jobs.
Gender remains a critical determinant of the types of jobsand careers available to women, but it is not nearly as strong adiscriminatory influence as it was in the past. In law, medical, andgraduate business schools, women students account for at leastone-third of the graduates, up from less than one-tenth as recentlyas the mid-1960s.
For the first time in the nation's history, women outnumbermen among students enrolled in colleges and universities.
In the third of a century since 1950, women have accountedfor three out of every five new additions to the labor force.
The explosive growth of the service sector, which todayaccounts for more than 70 percent of total employment and totaloutput, was both a cause and an effect of the availability of womenworkers (St Inback et al., 1981).
Although the antidiscrimination laws and regulations ofthe 1960s and early 1970s and the changed attitudes and behaviorof employers opened up many hitherto restricted fields of work towomen (beyond the professions noted above), women continue tobe heavily concentrated in a narrow set of occupations. Some 20fields account for two ;Jut of every three women workers.
Over the last half century the occupational group thathas experienced the most rapid rate of growth has been clericalworkers, which is a reminder of the need to consider not only thebroad potential impacts of technology but to narrow the focus tospecific technologies that are likely to have a strong impact onwomen workers.
For the first time in the nation's history, white men nolonger constitute the majority of the work force. Women, togetherwith black, Hispanic, and other minority males, today account formore than half of the work force.
19

ELI GINZBERG 5
These observations suggest that our analysis pursue a middleroad. We must continue to be sensitive to the patterns that un-derlie the place of women in the world of work, but we must alsoconsider that women account for close to half of the entire workforce and their future jobs and careers will therefore be affected bythe broad labor market developments that will affect all workers.
OBSERVATIONS ON CHANGING TECHNOLOGY
Technological changes are a way of life for industrial societies,but most innovations involve changes in processes or products thatare relatively circumscribed. Even when a significant technologicalimprovement occurs, such as the discovery and manufacture ofnylon or the development of the electric typewriter, the impacton the labor market is likely to be absorbed without serious joblosses, because among other reasons the lower price or improvedquality tends to increase demand. The number of jobs placed atrisk by even significant new technology is relatively small and islikely to be stretched out over a period of years. Most textilemills made the transition from natural to artificial fibers withouthaving to lay off large numbers of workers; the same was true ofsome of the companies that had earlier manufactured standardtypewriters and had made the transition to e!,:ctric, electronic, orcomputerized typewriters.
There have been major technological breakthroughs, however,such as the development of the railroad, the telephone, electricpower, the automobile, and the airplane, in which the impactson work and workers were more pervasive, although it should benoted that these impacts were fully diffused only after long periods,often decades or generations. Whereas we will soon celebratethe hundredth anniversary of the first automobile, some outlyingfamilies still are not connected to an electric grid, and in someareas a home telephone is still not affordable by every family.
The development of the microprocessor and the linking of per-sonal computers into communications networks are major techno-logical breakthroughs that have the promise of affecting the U.S.economy and way of life on the order of magnitude of the ra: adand the automobile. We must allow for the possibility that thecomputer will prove even more revolutionary, since it has the po-tential of altering not only the movement of people and goods butthe nature of work itself (Ginzberg et al., 1986).

6 POLICY PERSPECTIVES
It must be emphasized, however, that no matter how dramaticthe new technology may become, it has been in existence for a thirdof a century and it would be difficult to point to its having hadlarge-scale adverse effects on significant groups of workers, maleor female, during that period. The most serious charges that canbe levied against it are that there have been "silent firings" (thatis, workers not hired) and other negatives such as some deskillingof jobs, downscaling of opportunities, and health hazards. But todate the new technology has been positively correlated with thecontinued growth of the service sector and in particular with theexpansion of women's employment.
Of all the effects of economic forces on the labor marketoverall growth, cyclical change, structural shifts, and technologicalchangethe last will surely be the least important a decade fromnow. The Bureau of Labor Statistics estimates that in the 1980sonly about 15 percent of the changes that occur in job struc-ture will be ascribable to technology; 85 percent will be due tothe cyclical and structural movements of the economy (Kutscher,1985).
In sum, the following conclusions are evident: (1) women'sshare of total employment has been mounting rapidly and is likelyto increase further, until women account for half of all workers;(2) this growth has been closely associated with the differentiallyrapid growth of the service sector; (3) while women are no longeras closely confined to a few major occupational fields, they re-main heavily concentrated; (4) the microprocessor and computer-communications linkages are likely to affect disproportionately theclerical arena in which women workers are heavily concentrated;and (5) even if the new technology were to have a strong impacton existing patterns of work, the consequences would be manifestonly over relatively long periods of time.
POLICY PERSPECTIVES
FRAMING THE ISSUES
As noted above, the single most important short-term deter-minant of the labor market experience of women (in fact, all)workers will be the growth rate of the U.S. economy and the tim-ing and severity of the next recession. We are now in the fourthyear of recovery from two back-to-back recessions, which started
21

ELI GINZBERG 7
in 1979 and ended in 1982. If past is prologue, there is only 1chance in about 100 that, if President Reagan remains in officethroughout the whole of his second administration, the nation willescape a new recession. At this time (August 1986), the outlookfor the year still appears to most forecasters to be positive. Theexpansionary capacity of the economy does not appear as yet tohave met its potential. But it would be an error to overlook themajor economic problems that continue to exist: (1) the $900 bil-lion debt of the less developed countries (LDCs); (2) the annual$170 billion deficit of the United States in its foreign trade; (3)the continuing high value of the dollar against many currencies;(4) the federal budgetary deficits that loom ahead as far as onecan see; and (5) the still high real rate of interest. In my view,if the leading industrial countries fail to attack these five prob-lems conjointly and effectively, the prospect of a severe recessionwith large-scale labor market consequences is not only possiblebut probable.
There is steadily accumulating evidence that the United Statesand other advanced economies are confronting a sea change inthe internationalization of their economies as evidenced by thefollowing:
the spectacular spurt in imports to the United States fromthe LDCs (with adverse effects in this country on many nondurablemanufacturing sectors with large numbers of women workers, suchas apparel manufacturing);
the relocation overseas of major labor-intensive jobs indurable manufacturing such as electronic components (again witha heavy impact on women workers);
the extraordinary transfer of capital funds to the UnitedStates, mostly from Europe and Japan, part of which are forinvestment in plant and equipment and part of which are held inmoney market instruments;
the never-ending trade negotiations that are aimed, in theshort run, at protecting U.S. jobs (as in automobiles and steel)and, in the longer run, at reducing tariff and nontariff barriersin international trade (the United States has been taking theleadership to expand the General Agreement on Trade and Tariffs[GATTI to include services, a high employment area for womenworkers 1Isloyelle and Dutka, 1987]).
8 POLICY PERSPECTIVES
As long as the U.S. economy remains expansionary, the oddsfavor the maintenance, or even the reduction, of barriers affectinginternational trade in goods and services. But, in my view, we aredangerously close to a reversal of our long-term efforts to reducetrade barriers. If the next recession is severe or prolonged, it isprobable that we will not be able to avoid new barriers. Sincethe United States is the dominant market for the exports of bothdeveloped and developing countries, we must exercise restraint toavoid erecting new protective trade barriers. The decade of the1930s provides one salient example of beggar-your-neighbor policy.The lessons learned have helped to set and keep the developedworld on the path to freer international trade, but there is agrowing risk that these lessons have begun to fade.
The most important question with regard to the future impactof technology on women's employment is whether the sanguine re-sults of the last 20 years can be projected to the remaining years ofthis century and beyond. The optimist might contend that thereis no reason to expect more "disturbance" in the years ahead thanwe have experienced over the past two decades, which saw thecomputer revolution resulting in few, if any, dysfunctional effects.The pessimist, of course, sees the future differently. In his or herview, the linkage of the computer to communications networks,which is only now hitting its stride, will have a range of adverseconsequences for women's employment: first, by eliminating anumber of white-collar positions, and second, by making possiblethe further relocation of :many back-office positions from centralcities to the suburbs, to distant communities, and also to overseaslocations, particularly to English-literate populations. The pes-simist goes further and points to the downskilling of jobs and the'degrading of careers that often accompany accelerated computer-ization.
As an iconoclast, I am unpersuaded by either the optimisticor the pessimistic forecast. There are three key elements in myview of the future.
First, the computer revolution has reached a point whereit is likely to have a greater "displacement" effect on women'semployment over the next 15 years than it has had in the past.A simple projection of the past fails to take into account the factthat computer technology is now on a steeper curve; employers andemployees are more willing and able to adapt to it since more than70 percent of all jobs are in the service sector. Moreover, since U.S.
23

ELI GINZBERG 9
management is striving to become and remain cost-competitive inthe world marketplace, it must reduce its white-collar payrolls;wider reliance on the computer offers reasonable prospects forsuccess in this effort.
Second, productivity can increase in the service sector. Overthe last half century, employment in agriculture has decreasedfrom 20 percent of the total labor force to under 3 percent; inmanufacturing, employment has declined from close to two-fifthsto under one-fifth. For many years neither the tools (computer)and communications resources nor the organizational structureand managerial know-how were available to run large organizationswithout many layers of staff. Further, we learned only recently howto tie large numbers of small units, owned or franchised, into asingle organization, but today we are the world's leader in thesestructuresfrom hotels and fast food establishments to banks.This experience has proved that earlier economists were wrongwhen they said that services were immune to economies of scaleand postulated that they suffered from the "cost disease," withcontinued dependence on additional labor resulting inevitably inhigher costs (Baumol, 1967).
Third, the new products and services that may be developedare as yet unknown. The expectation that the computer willfirst slow, and eventually reverse, the absolute and relative gainsmade by clerical workers in the past several decades is only oneaspect, of the future. What remains uncertain is whether and howquickly the computer-commudications link-up is likely to generatethe creation of new products and services that will lead to theemployment of large numbers of new workers, both women andmen. One has to engage in a historical experiment and identify thetypes of employment opened up by the widespread introduction ofthe automobile from the tens of thousands of people who obtainednew jobs in our national parks to millions of construction workerswho built homes in the suburbs. As the time period is extendedand the technology becomes more pervasive, it is more difficultand less relevant to assess the impact of a new innovation on totalemployment. Too many other factors intervene to influence theoutcome.

10 POLICY PERSPECTIVES
TABLE 1 Large Occupations (more than 1 million workers) in Which WomenAccounted for at Least Half of All Workers, 1982
OccupationAll Workers(millions)
PercentWomen
Registered nurses, cvIticians, therapists 1.7 92Teachers, except college 3.3 71Sales workers, retail 2.4 70Bookkeepers 2.0 92Cashiers 1.7 87Office machine operators 1.1 75Secretaries 3.8 99Typists 1.0 97Assemblers 1.1 54Food service workers 4.8 66Health service workers (excluding nurses) 2.0 90Personal service workers 1.9 77Private household 1.0 97
NOTE: Civilians, 16 years old and over.
SOURCE: Bureau of the Census (1983:Table 696).
ARE WOMEN WORKERS AT RISK?
The question of whether women workers are at risk is criticalfor the reasons noted earlier, namely, that such a high propor-tion of women workers are concentrated within a relatively limitednumber of occupational groupings and they account for a differen-tially larger number of all workers in selected industries. Tables 1and 2 provide the critical data.
Two important points can be derived from Table 1. First,the 13 occupational groups shown in the table account for morethan half of all women workers. Second, the six occupational fieldsdominated by women (90 percent or more of all workers) accountfor one out of every four women workers. What the table does notshow is that the occupational distribution of men workers is muchless concentrated.
Since our primary concern is to assess the probable impactof technology on women's employment in the remaining years ofthis century, it may be helpful to consider what happened inthe years 1972-1982 to the female-dominated occupational areas,
25

ELI GINZBERG 11
particularly those areas in which technology in general and com-puter technology specifically have made significant advances. Thetotal number of sales workers remained stable during the years1972-1932, as did the proportion of women workers. There was asignificant increase in the number of bookkeepers, from 1.6 mil-lion to 2.0 million, and the share of women in the field increasedfrom slightly under 90 percent to slightly over this proportion.The number of cashiers increased at a far higher rate than thenumber of bookkeepers, from 1.0 million to 1.7 million, but therewas no increase in the proportion of women, which remained at87 percent. Office machine workers expanded from under 700,000to 1.1 million, and the proportion of women increased from 71 to75 percent. There was a modest increase in the number of factoryassemblers, from 1.022 million to 1.087 million, and the share ofwomen increased from 47 to 54 percent.
Several points are worth noting. In a number of fields inwhich women workers predominated, total employment (men andwomen) increased significantly. For the most part, the proportionof women workers as a percentage of all workers did not changeappreciably. Most important, none of the data suggest that thecomputer and related technology displaced large numbers of work-ers in fields where women were heavily concentrated.
We can supplement our understanding of what transpiredin the recent past by looking at employment in industries wherewomen account for half or more of all employees. Table 2 illustratesthat, with the single exception of private household employment,which sustained a decline of one-half million, the industries char-acterized by a predominance of women workers expanded in theyears following 1970.
The optimistic implications of this recent experience with re-spect to total employment trends and their impact on womenworkers, however, must not be uncritically projected into the fu-ture. It is important to review the projections to 1995 of theBureau of Labor Statistics [BLS]. Table 3 presents the 8 female-dominated occupational categories of the 13 categories for whichthe BLS foresees the largest job growth: secretaries, nurses' aides,salespersons, cashiers, professional nurses, office clerks, waitresses,and kindergarten and elementary school teachers. Each of theabove categories will add, accord:ag to the BLS, between 230,000and 560,000 new jobs by 1995. Together they account for 20 per-cent of all anticipated job growth. Most of these occupations are
,?, 6

12
TABLfor at
POLICY PERSPECTIVES
E 2 1970 and 1982 Employment in Industries in Which Women Accountedeast Half of All Workers in 1982
All Workers(millions) Percent Women
Indu stry 1970 1982 1970 1982
Ret nil trade 12.3 16.6 46 52Fin ante, insurance, and real estate
Banking and finance 1.7 2.8 58 64Insurance and rea estate 2.2 3.5 45 52
P ersonal servicesPrivate households 1.8 1.3 89 85Hotels and longing chains 1.0 1.3 68 66
Professional and related servicesHospitals 2.8 4.3 77 76Health services 1.6 3.5 71 76Teachers, all levels 6.1 7.6 62 66
NOTE: Civilians, 16 years old and over.
SOURCE: Bureau of the Census (1983:Table 698).
TABLE 3 Female-Dominated Occupations with Largest Projected Job Growth,1984-1995
Occupation
Change in Total Percent ofEmployment Total(thousands) Job Growth
Cashiers 556 3.6Nurses, registered 452 2.8Waiters and waitresses 424 2.7Nurses' aides and orderlies 348 2.2Salespersons, retail 343 2.2Teachers, kindergarten and elementary 281 1.9Secretaries 268 1.7General office clerks 231 1.4
SOURCE: Silvestri and Lukasiewicz (1985:Table 3).
not the most rapidly growing ones, but even a slow-growing largeoccupation adds more to women's employment.
The BLS forecasts have held up reasonably well, at least intotal if not in all subsectors. But our concern here is with se-lected areas where the new technology is likely to have its greatest

ELI GINZBERG 13
impact and where both total employment and the proportion ofwomen workers are substantial. We will look more closely attwo industries, banking and hospitals, each of which reveals se-rious difficulties in assessing the future impacts of technologicaland other forces on women's employment. The computer andcomputer-communications linkages, including satellites, have hada head start in banking and finance, and the new technology hasalso been making headway, although more slowly, in the admin-istrative and financial, and more recently, in the clinical areas ofhospitals. Moreover, each industry has a large number of workers:in 1982 banking and finance employed about 2.8 million workers,of which women accounted for two-thirds, and hospitals employed4.3 million individuals, with women accounting for three-quartersof the labor force (see Table 2).
Banking and Finance
One reason that it is difficult to sort out clearly what hasbeen happening in banking and finance is the multiplicity of forcesaffecting the employment profile. In addition to computers takingover most of the number crunching from clerks, the number oflocations where such work is carried out has grown. The newtechnology is also leading to changes in hiring standards. Most citybanks prefer high school and junior college graduates because theyhave come to recognize that the dynamism of the new technologywill require the continuing retraining of staff. The high rate ofturnover of new employees, particularly women clerical workers,has enabled most banks to accommodate the changes to datewithout layoffs. But they have reduced new hires (Dutka, 1983).
The foregoing is only part of the story. In the last decade, whilethese changes were occurring in back-office work, many large citybanks were opening new branches, which required more personnel,and most recently, with deregulation, they moved aggressively tointroduce a wide range of new financial services, adding many newworkers to fill expanding front-office jobs.
To complicate matters further, the narrowed spread betweenthe rates at which the banks have been able to borrow and tolend, particularly in the early 1980s, caused an adverse effecton their profitability and liquidity. In short, the changes fromthe side of technology were dwarfed by cyclical and structuralalterations, which have buffeted and continue to buffet commercial

14 POLICY PERSPECTIVES
banking. But we must be careful not to minimize the technologicalfactors, since major structural transformations are under way thatwill permanently transform conventional banks into providers offinancial services of which the full reach remains to be revealed.
A cautionary assessment of the technological impacts on wom-en's employment in banking and financial services would have toinclude the following:
A substantial reduction has already taken place in lower-skilled clerical positions in insurance and banking as well as in theother sectors of finance, insurance, and real estate (FIRE).
It is likely that in addition to back-office clerical positionsthat have already been relocated out of urban centers, additionaljobs will migrate to outlying areas and even overseas locations.This trend will have a particularly adverse effect on the employ-ment prospects of urban minority women.
The raising of hiring requirements will close out most op-portunities for young women who do not possess at least a highschool diploma and preferably a junior college degree.
The likelihood that many middle management positionswill become redundant could have adverse effects on many womenwho have been able to gain a toehold on the executive ladder.
In contrast to the foregoing, which are "downbeat" fore-casts, allowance must be made for the extent to which the newtechnology will continue to stimulate and possibly accelerate thegrowth and development of new financial services for which therewill be a substantial and sustained demand.
Once this last pcl-entiality is taken into account, there is a rea-sonable pi aspect that the long-term employment effects of the newcomputer-communications technology on women's employment inFIRE will be positive, not negative (Noyelle, 1987).
Hospitals and Health Care
Let us now look at what has been happening to women'semployment in hospitals and the likely changes in the future. First,hospital employment increased in the 12 years after 1970 by noless than 50 percent, from 2.8 million to 4.3 million, and in bothyears women accounted for about three of every four membersof the work force. A little noted phenomenon in this period ofexpansion in employment has been the trend of most acute careinstitutions to raise the qualifications of their nursing staff and
29

ELI CINZBERG 15
technicians by hiring and retaining those with more education andtraining, a preference reflecting the increasing intensity of care andthe greater reliance on sophisticated technology. Many hospitalshave shifted their employment patterns in the direction of moreregistered nurses and have reduced the numbers of practical nursesand nurses' aides.
The introduction of the diagnosis-related group (DRG) sys-tem for the reimbursement of Medicare patients has acted as amajor spur to hospitals to move aggressively to modernize theiradministrative and financial record keeping via computerization.Their survival hinges on how quickly they are able first to under-stand their admissions and then control treatment regimens andlength of stay, since under DRGs they are paid a fixed price peradmission.
As noted earlier, the Bureau of Labor Statistics and mostother forecasters assume that health care in general, and hospitalsin particular, will continue to be a major growth industry betweennow and 1995. But that assumption must be inspected anew.Hospital admissions have leveled off; length of stay is dropping; thefinancing of hospital care is being tightened by third-party payers(government and insurance); and the DRG system is encouragingall providers to tighten their cost controls, in _ding their use ofpersonnel. In 1984 and again in 1985, total hospital employment,instead of expanding, experienced a small decline.
With for-profit enterprises playing a larger role in the provisionof health care, the future structure of the federal government'sfinancing of Medicare still evolving, the numbers of older personsrequiring more care continuing to increase, medical knowledge andtechniques continuing to advance, and the shift from inpatient toambulatory settings accelerating, it would be a seriour rror to usethe past as guide to the future, especially if the focus is centeredon hospitals, not on the totality of health care services.
There is no question that the computer and other new tech-nologies have already left their marks on the hospital indirectly.The strong trend toward for-profit and nonprofit chains; the shiftfrom inpatient to ambulatory care settings; radical changes in sur-gical procedures, particularly cardiac, ophthalmic, and urologicsurgery and many other changes have occurred during the pe-riod of increased computerization, from the introduction of thecomputer into medical education to its use in nurses' procedures.

16 POLICY PERSPECTIVES
The combined influence and impact of these technologicaland related changes (economic, organizational, managerial) onthe positive employment of women hospital workers are not clearlydiscernible, but the following may be considered a middle-of-the-road assessment.
The dominant view as of mid-1986 is that hospital employ-ment has peaked and that a decline of up to 20 percent in hospitalemployment over the next decade and a half is possible, somewould say, even probable. Clearly, such a decline would have a dif-ferentially adverse effect on women workers because they accountfor about 70 percent of all hospital employees and also are moreheavily concentrated in the lower-skilled occupational categoriesthat are most vulnerable to the inroads of the new technologies.
On the basis of selected field investigations in New YorkCity and in Boston, my associates and I have become aware ofthe increasing trend of late for hospitals to cut back on hiringless-educated and less-skilled persons. This means that minoritywomen who improved their employment prospects in the 1960sand 1970s by obtaining jobs in hospitals are definitely at risk.Some are being let go; many more who would have been hired inan earlier period are not even being interviewed.
It is true that at the upper end of the occupational distri-bution, women physicians and nurses with a master's or doctoratedegree are well positioned both with respect to employment andadvancement. On the other hand, the much bruited shortage ofnurses that commanded attention only 5 years ago has evaporatedwith little likelihood that a shortage will reappear. Part of thisstriking shift within such a short time period reflects the pressureof the new resistant climate on hospital administrators and their
_ability through computerization to exercise much closer controlover their personnel costs, particularly their nursing personnelcosts.
For a more balanced overview, it should be noted that theabove relates solely to hospital employment, not to total employ-ment in the health care sector. The latter is likely to expand asphysicians treat more people in their offices and as more patients,including patients who are quite ill, can now be cared for in theirhomes. Women workers, in particular registered nurses, practicalnurses, technicians, and nurses' aides will unquestionably find thatjobs are expanding in these out-of-hospital settings. On the whole,
31

ELI GINZBERG 17
total health care employment is expected to continue to increase.A small percentage of women workers, those with higher-levelskills, will continue to advance; many more with limited skills willhave to work at less attractive jobs with little upward mobility(Ginzberg, 1985).
POLICY RECOMMENDATIONS
Currently, more than half of all adult women are in the la-bor force and many more would probably work if suitable jobswere available. Six major factors have accelerated the growingimportance of women workers in the U.S. economy during thepost-World War II decades:
The need of the economy for more labor and the availabilityof women willing and eager to fill such jobs.
The differentially rapid expansion of the service sectorwhose employers were often seeking part-time workers while manywomen preferred or were willing to take such jobs.
Many of the new service jobs in clerical work and salesrequired individuals with a general education and little in the wayof specific skills. Women met these basic requirements.
In the long period of rapid expansion and high profits manycorporate employers built up large staffs. Declining profits andthe increased use of the computer have in recent years encouragedemployers to operate with fewer white-collar workers.
The increasing participation of women in work has beenparalleled by a greater percentage of women investing in highereducation so as to be able to improve their career prospects.
Despite these major changes in the relation of women tothe world of work, the earlier concentration of women workers in arelatively few occupational and industrial groupings has continued(although the concentration has been reduced). A high proportionof all women workers continues to be employed in the service sectorat the lower end of the wage scale.
In light of these six principal changes in the shape of women'semployment, policy makers should focus on the following:
Full Employment Women, like men, need employment op-portunities if they are to find jobs and enjoy career prospects. TheU.S. economy has been slack since 1979 as we have attempted to
3.

18 POLICY PERSPECTIVES
control inflation. We have redefined full employment in terms of7 or 8 percent not 3 to 4 percent unemployment. Moreover, thefederal government, the only agency capable of affecting macro-economic policy, has permitted the employment issue to drop offits agenda, although the Humphrey-Hawkins Act obligates boththe Congress and the administration to address a host of job is-sues. The first and most important contribution of policy makersshould be to strive to bring and keep the economy as close tofull employment as possible. At a minimum they should avoidill-advised actions such as new trade restricti-ns, radical reformsin the tax structure, and excessively large defense programs, whichcould reduce the capacity of the U.S. economy to move toward ahigh and sustainable level of employment.
Continued R&D There is every reason for the governmentand the corporate sector to maintain and increase their efforts tostrengthen their R&D structures. These hold the best promise forthe continuing growth and profitability of the U.S. economy in anincreasingly competitive world economy. Although new technologyhas the potential for placing people's skills, jobs, and careers atrisk, the penetration of new technology usually proceeds at a ratethat permits adjustments to be made through retraining, attrition,and early retirement rather than through job displacement. Whilea rapidly penetrating new technology can on occasion result injob losses, most workers who are displaced lose out because of theinability of their employers to remain competitive, as has been thecase in steel, autos, apparel, and many branches of electronics.
Strengthened Education and Retraining Policymakers shouldrecognize that the best approach to the prevention of increasinginstability in the world of work is a strengthened educational sys-tem that will enable workers to be properly educated, trained, andretrained. The economy needs expanded government and corpo-rate funding for retraining programs. The large numbers and highproportion of young minority women, particularly in large urbancenters, who fail to graduate from high school, need special atten-tion and help. As we noted, the new technology is leading largeemployers to raise their hiring standards. Hence young women,including teenage mothers who do not have high school diplo-mas, may be permanently restricted to the peripheral labor force.We need more and better second-chance programs such as the
33

ELI GINZBERG 19
Job Corps. The Job Training Partnership Act is not adequatelyresponsive to the needs of the hard-to-employ.
A National Jobs and Education Program The advances incomputer-communications technology will, as we have seen, con-siderably reduce the demand for clerical workers and result in therelocation of many clerical jobs from large high-ccst urban centersto outlying and even foreign locations. These developments willmake it even more difficult for the urban high school drop-out tofashion a permanent attachment to the labor force, particularlyin jobs that offer prospects of advancement. It may be desirable,even necessary, for our society to reappraise the need for a na-tional jobs program (with an educational component) that willassist poorly educated young people to acquire work experienceand at the same time overcome their educational deficiencies. Anational jobs program could also serve as an important bridge forolder women, particularly those who have been on and off welfarefor some period (Hollister, 1984).
Continued EEO Enforcement There is no question that thecrowding phenomenon referred to above has been a major fac-tor in keeping women's wages considerably below men's and inlimiting the opportunities of many to advance into better-payingjoi and careers. Antidiscrimination legislation and administra-tiie procedures have made some contribution to reducing wagediscrimination, but the major positive force has been the expan-sion of the economy and the willingness and ability of more andmore women to prepare for technical and professional careers. Weshould continue to use legal and administrative techniques to re-duce discrimination in the labor market, even while we recognizethat major gains to improve women's earnings and career oppor-tunities depend primarily on the expansionary potential of theeconomy. Of equal if not greater importance is the response of theurban school systems. They currently fail to provide many low-income women with a proper educational foundationwithoutwhich their entrance into and advance in the world of work will beseriously circumscribed.

20 POLICY PERSPECTIVES
Child Care No one who has reflected on women's employ-ment can overlook the importance of strengthening the social ser-vice infrastructure, particularly the expansion of child care facili-ties. Most women who work must also care for their children andrun their households. Greater equity and career opportunities forwomen require that society recognize that women workers carryexcessive burdens and seek to lighten these burdens (EconomicPolicy Council of UNA-USA, 1985).
A CONCLUDING NOTE
The thrust of the foregoing policy recommendations has beento emphasize that the major preconditions for the continued ex-pansion and improvement of employment opportunities for womenhinge on the continuing strong growth of the economy and onstrengthening the educational preparation of women for adult-hcod and for the world of work. A full employment policy andstrengthened educational system are the two principal founda-tions for further progress. Supplementary support can come fromstrong antidiscrimination mechanisms and from expanded childcare facilities.
However, it is unrealistic to expect our economy, or any devel-oped economy, to perform continuously at a high level of employ-ment. Similarly, even a well-functioning educational system willnot be responsive to the needs of all young people. A significantminority is likely to reach working age inadequately prepared forthe world of work. Large-scale shifts in markets and new tech-nological breakthroughs introduce further disturbances that willresult in job losses, skill downgrading, and reduced earnings, evenwhile they also open up new opportunities for job growth, skillimprovements, and higher earnings. A responsible and responsivedemocracy must act to assist those who are most vulnerable tothe inadequacies of our schools and the labor market. It can do soby providing second-chance opportunities fca the many who needto improve their basic competences if they are to be successful inobtaining a private-sector job; for interim public employment ifthey are not capable of competing successfully for such jobs; andfor access to training and retraining in the event that they arevictimized by market or technological change.
Our society confronts a paradox that it can no longer ignore.It cannot hold on to its conviction that all persons should work
3"

ELI GINZBERG 21
to support themselves and their dependents and z-.t the same timeignore the reality that many lack the required competences forgetting and holding jobs and that many others, competent others,cannot find jobs. If we reaffirm our commitment to the work ethic,we must see that everyone, men and women alike, who need orwant to work have an opportunity to do so.
REFERENCESBaumol, William J.
1967 Macroeconomics of unbalanced growth: the anatomy of urbancrisis. American Economic Review 57(3):415-426.
Bureau of the Census1983 Statistical Abstract of the United States, 1984. 106th edition. Washing-
ton, D.C.: U.S. Department of Commerce.Dutka, Anna B.
1983 A Review and Analysis of the Citibank Office Technology Pi-lot Project Program at Martin Luther King, Jr. High School.Report, Conservation of Human Resources, Columbia University,New York. January.
Economic Policy Council of UNA-USA1985 Women and Family in the United States: A Policy Initiative. Report of
the Family Policy Panel. New York: United Nations Associationof the United States of America.
Ginsberg, Eli1985 The restructuring of U.S. health care. Inquiry (Fall) 22(3):272-281.
Gins'. -g, Eli, and Alice M. Yohalem1966 Educated American Women: Self Portraits. New York: Columbia
University Press.Ginsberg, Eli, Ivar E. Berg, Carol A. Brown, John L. Herma, Alice M.Yohalem, and Sherry Gorelick
1966 Life Styles of Educated Women. New York: Columbia UniversityPress.
Ginsberg, Eli, Thierry J. Noyelle, and Thomas M. Stanback, Jr.1986 Technology and Employment: Concepts and Clarifications. Boulder,
Colo.: Westview Press.Hollister, Robinson G., Jr., ed.
1984 The National Supported Work Demonstration. Madison: University ofWisconsin Press.
Kutscher, Ronald1985 Factors Influencing the Changing Employmer.. Structure of the
United States. A paper given at the Second International Confer-ence of Progetto Milano, Milan, Italy, January 25. Washington,D.C.: Bureau of Labor Statistics.
National Manpower Council1957 Womanpower. New York: Columbia University Press.
Noyelle, Thierry J.1987 Beyond Industrial Dualism: Market and Job Segmentation in the New
Economy. Boulder, Colo.: Westview Press.
4 ..1c... ...j

22 POLICY PERSPECTIVES
Noyelle, Thierry J., and Anna B. Dutka1987 Business Services in World Markets: Lessons for D-ade Negotiations.
New York: Ballinger.Silvestri, George T., and John M. Lukasiewics
1985 Occupational employment projections: the 1984-95 outlook.Monthly Labor Review 108(11):42-57.
Stanback, Thomas M., Jr., Peter J. Bearse, Thierry J. Noyelle, and RobertA. Karasek
1981 Services/The New Economy. Totowa, N.J.: Allanheld, Osmun & Co.
37

Part II
Case Studies of Women Workersand Information Technology
3 "3

The Technological Transformationof White-Collar Work:
A Case Study of the Insurance Industry
BARBARA BARAN
Although white-collar automation has received considerablyless press than robots on the assembly-line, the introduction ofcomputer-based technologies into the office has generated growingconcern that industrialized working conditions and technologicalredundancy may be spreading to white-collar settings. Becauseof the pervasiveness of occupational sex segregation within theoffice work force, it is also feared that women will bear the bruntof the restructuring process. Feldberg and Glenn (1983), for ex-ample, argue that whereas women's jobs are disproportionatelydisappearing and their opportunities for upward mobility declin-ing, men may actually benefit from the new technologies bothbecause they will dominate the more highly skilled technical andprofessional jobs being created and because automatior, may cen-tralize control in the hands of (male) senior managers and systemsanalysts.
The limited numbers of case studies that have been publishedon the impacts of office automation report conflicting findings.
25

26 THE INSURANCE INDUSTRY
With regard to changes in the occupational structure, some re-searchers have found that job loss is concentrated among low-skilled clericals (Faunce et al., 1962; Roessner et al., 1985; Shep-herd, 1971), implying a general upgrading of labor. Other studiesindicate, on the contrary, the elimination of skilled clerical ac-tivities, resulting in a polarization of the occupational structure(Feldberg and Glenn, 1977; Hoos, 1961; U.S. Bureau of LaborStatistics, 1965). Similarly, whereas some analysts have reportedless task fragmentation as the technology becomes more sophisti-cated (Shepherd, 1971; Matteis, 1979; Sirbu, 1982; Adler, 1983;Appelbaum, 1984), others suggest that job content is narrowed andworker autonomy reduced (Murphree, 1982; Greenbaum, 1979;Cummings, 1977; Feldberg and Glenn, 1983, 1977). Finally, al-though in all cases women experienced the greatest job loss, insome reports it appeared that after automation women were rele-gated to lower-skilled activities (Feldberg and Glenn, 1977; Mur-phree, 1982), whereas in other accounts female clericals seemedto benefit from the new labor process (Matteis, 1979; Cummings,1977).
The intent of my research on the insurance industry was tocontribute to this nascent literature. The findings reported hereare based on a two-year study of the impacts of automation onthat industry. The first phase of this research was an in-depthcase study of a major national property/casualty carrier, whichincluded 26 interviews with employees in various parts of thecompany's operations (home office, branch office, data-processingcenter, commercial group, and personal lines centers) and dif-ferent levels of the occupational hierarchy, as well as analysis ofextensive quantitative personnel data which the company madeavailable. The second phase involved lengthy interviews with ex-ecutives, personnel managers, and systems analysts in 18 othercompanies, loosely stratified by size, product type, growth rate,distribution system, and so on; members of the industry's tradeassociations, agents' associations, and vendor companies were alsointerviewed. Third, a structured telephone survey u,Rs conductedof 37 companies-21 life firms and 16 property/casualty firmsagain loosely stratified. All of the firms in both samples wereamong the top 100 companies in their industry segment. Togetherthese 55 insurers account for approximately 55 percent of industryemployment; they range from firms of over 50,000 employees tofirms of less than 1,000. Finally, I have supplemented this field
40

BARBARA BARAN 27
work with secondary source material from government agencies,trade publications, and documents and survey data kindly pro-vided by the trade associations and consultants to the industry.
Two kinds of conclusions emerged from this effort. The first,of course, ar ; numbers of concrete observations which will bepresented in summary form in this paper. In addition to thesesectorally specific findings, however, analysis of the insurance in-dustry generated a set of more general hypotheses concerning thekinds of factors it is necessary to consider when attempting to as-sess the impacts of office automation technologies on a work force.Since tLe following discussion is not sufficiently comprehensive tocover all these issues, I want to discuss them briefly here beforeturning to the more detailed findings of the study.
First, as the case of the insurance industry made clear, itis virtually impossible to separate technological innovation fromother factors affecting the competitive dynamics of an industry.The competitive environment is both a major determinant of thespeed of diffusion of innovation andquite apart from technolog-ical changesignificantly affects the demand for labor.
Second, sind closely related, is that the impacts of the newtechnologies on the labor force are not limited to their efftcts onthe organization of the work process. In insurance, changes inproduct offerings and in the structure of both the industry itselfand the firms within it promise to be equally important influenceson the kind and amount of labor employed.
Third, it was deal from this study chat "office automation"cannot be analyzed as a single phenomenon. Impacts vary on thebasis of the specific kinds of technology being introduced (includ-ing, importantly, the generation of that technology) and the na-ture of the work process being automated (originating often in theunique characteristics of the product, market, and organizationalstructure of the industry). In terms of the first, I would underlinethe importance of periodizing the process of office automation;some of the disagreement in the literature can be attributed to dif-ferences in the generation of the technologies observed. In termsof the second, it is obvious that even in this one industry, thenew labor processes will vary widely by product line. It is alsoimportant to point out that the insurance industry is very differ-ent from office-type settings in which word processing is the coreapplication since systems development in the insurance industry

28 THE INSURANCE INDUSTRY
has been driven by its data-processing needs. In fact, in some re-gards, more accurate parallels can be drawn between automationin the insurance industry and automation in manufacturing indus-tries. In both cases, production work is increasingly performed bymachines while administrative support activity remains relativelylabor-intensive (although, in insurance, services activities are alsobecoming extremely automated).
Fourth, in assessing the impacts of automation on skill re-quirements and on the occupational structure of an industry, Iwould stress the importance of analyzing the changes occurring inthe entire labor process. In failing to do so, analysts often missthe forest for the trees. When the organization of work is beingfundamentally restructured, it is not so useful to talk about howspecific jobs are changing; instead, we need to begin to assess howparticular job functions or activities are being reconstituted andrecombined to produce new kinds of job categories.
Although this observation may seem banal, most studies ofthe effects of office automation have focused almost exclusivelyon the clerical work force. As such, they miss one of the mostimportant features of the current wave of applications, that is,the automation of professional functions and their transfer to less-skilled labor. As a result, these studies may be overly pessimisticboth about the decline of clerical-type occupations and their likelyskill levels; at the same time, they may be overly optimistic aboutthe expansion of higher-level, challenging, well-paid work.
Fifth, we have to be careful not to assume any necessaryidentity between skill levels and other job attributes, such as pay,satisfaction, or occupational mobility. Indeed, many of the newjobs emerging in the insurance industry may require fairly highlevels of skill and yet offer few rewards, material or otherwise.
Finally, this last point is true in part because different cat-egories of workers will not only be differentially affected by theprocess of transformation, but the nature of the available laborforce also shapes job design. In this case, the nature of the femalelabor market may be an important determinant of the emergingoccupational structure.
Some, although not all, of these themes will be explored ingreater depth in the remainder of this paper. To give context tothe discussion of the ways in which new technologies are having animpact on the labor force, the first section begins by describing thesignificant changes that have occurred in the last decade in terms
4 9"

BARBARA BARAN 29
of the Tate of diffusion and the kinds of computerized systemsimplemented in the insurance industry.
THE PACE OF DIFFUSION ANDTHE NEW IMPLEMENTATIONS
Insurance companies, along with financial institutions andthe government, were among the earliest users of electronic data-processing (EDP) computers. As early as 1959, the finance, in-surance, and real estate sector boasted the greatest number ofcomputer installations per million employees (Phister, 1979); by1970, the insurance industry employed a higher ratio of computerspecialists than any except the high-technology manufacturing in-dustries (Bureau of Labor Statistics, 1981b).
Size of the organization was initially the primary factor influ-encing the implementation decision; companies attempted little, ifany, formal cost-benefit justification. Applications were generallylimited to structured accounting tasks, billing, and claims dis-bursements. With the exception of the move to direct billingatransaction which had traditionally been handled at the agencylevel, the automation of these functions had little impact on therest of the organization.
For the first two decades, the pace of diffusion was extremelycivilized and the industry proceeded much as it had for the lasthundred years. The barriers to rapid adoption of more sophisti-cated office systems were both technological and organizational.'Beginning in the early 1970s, however, systems development tooktwo important new turns. First, the focus of automation shifted
1 The technological barriers included (a) equipment incompatibility, bot'lamong the various vendors and even within the product offerings of a partic-ular vendor, that prevented network extension and integrated system devel-opment; (b) substantial work station connection costs and communicationscosts; and (c) the difficulty of representing more complex white-collar activi-ties in computer algorithms. The attempt to impose a standardized logic onmany procedures often generated too many exceptions to be cost-effectiveand in some cases even diminished the efficiency of the organization. Theorganizational problems associated with the introduction of the new systemswere perhaps even more substantial than these technical problems: theseintegrated systems required a fundamental reorganization of production, ser-vice, and distribution, since their effrAt was not limited to clerical labor inword-processing and data - processing departments; higher-level workers hadtheir jobs redefined and in some cases even eliminated. Their resistanceerected a powerful barrier to diffusion.

30 THE INSURANCE INDUSTRY
from administrative functions such as accounting to automation ofthe production process itself, meaning primarily the underwriting,rating, and physical production of the insurance policy and thehandling of claims disbursements. Second, in the place of single-task, batch-oriented machines, multitask, multimachine systemsbegan to be introduced, often operating on-line.
The process of systems integration was an evolutionary one.As the price/performance ratio of the hardware continued to im-prove and the software became more sophisticated, more and morefunctions in the operational areas were automated and systemsbecame increasingly decentralized. Independent systems beganto proliferate, often geared exclusively to a company's in-housedata-/word-processing activities. Gradually, however, a counter-tendency developed as companies moved to link these systemstogether into what at first were fairly rudimentary networks. Ini-tially, in some of the 1-,cal settings, applications were developedthat went beyond the automation of a discrete task toward theperformance of a wider set of connected operations. Automatedlinkages were then s.owly constructed among systems, so thatinformation could L. eintronically transferred and shared.
On this basis, entry and processing functions were increas-ingly decentralized and distributed throughout the organization,but data bases were integrated and centralized. In the mid tolate 1970s, what are often referred to as "office automation" (OA)applications also began to be linked to these DP-based systems. Amultitude of new office machines were introduced. Optical char-acter recognition devices were applied to premium billing andcollection operations; computer output microfilm (COM)whichperm!. he transfer of data directly from computer to microfichewap i-casively by all insurers, and in conjunction withCOL .3:sted retrieval technology, increasingly replaced pa-per .. ..ally, more and more companies began to experimentwith electronic mail, teleconferencing, electronic fund transfer, in-teractive data access via television, and other "office of the future"technologies.
To an important extent, the introduction of these more so-phisticated systems in the 1970s was driven by a new competitiveenvironment. Unprecedented levels of inflation and correspond-ingly high interest rates and important demographic and socio-
4 4

BARBARA BARAN 31
economic changes2 combined to shake up this once stodgy industryby increasing uncertainty in financial markets and, consequently,dramatically increasing competition in the financial services sec--tor. Deregulation fueled these competitive flames. Giants in theindustry found themselves struggling for survival; and companieswith a long, proud history of paternalism were suddenly forcedto lay off up to 1,500 employees virtually overnight. In manyways, in fact, the insurance industry was hit by a crisis not un-iike the one faced by U.S. auto manufacturers; and in both cases,one important response on the part of companies was to turn toautomationboth to increase the efficiency of their operationsand to enhance their product offerings.
Whereas the early applications were basically limited to theautomation of discrete tasks (e.g., typing, calculating), the newimplementations called for rationalization of an entire procedure(e.g., new business issuance, claims processing), and ultimatelythe restructuring and integration of all the procedures involved ina particular division, product line, or group of product lines. Assuch, in the categories of Bright's (1958) original analysis, therehas been a dramatic leap in the span, level, and penetration ofthe automated systems and, therefore, in the impacts on the laborforce. The changes that have occurred in the underwriting andclaims support systems best illustrate this evolution, although Iwill also touch briefly on three others: administrative/clerical,decision support, and agency systems.
2 On the demand side, inflationary pressures initiated the demand foralternatives to ordinary insurance that would provide adequate protection atlower cost or higher rates of return on savings. Demographic shifts fueledthese trends. Dual income householdsand the more affluent dual careerhouseholdsgrew rapidly and consumer assets were increasingly concentratedhere. The needs and tastes of this population differed significantly from thetraditional insurance consumerwith more emphasis on investment overmere savings, less concern with thrift and more with spending, and ademand for a fuller range of sophisticated financial services. On the supplyside, competitors outside the insurance industry responded to the new marketconditions by offering reasonable substitutes for many traditional insuranceproducts and services. In addition, commercial banks began to lobby for thelifting of regulatory restrictions which bars them from the sale of insurance.Finally, insurance companies themselves moved to diversify their productofferings and successfully lobbied aul,hcrities to deregulate rates.
4, :i
1,

32 THE INSURANCE INDUSTRY
UNDERWRITING AND CLAIMS SUPPORT SYSTEMS
The underwriting function is a critical component of the in-surance policy production process; it entails an analysis of therisk involved and acceptance or rejection of that risk. As such,the heart of this operation has always been performed by profes-sional labor: insurance underwriters. However; today, in numbersof product lines, clerksaided by decision parameters embeddedin computer softwareare responsible for the risks their compa-nies accept; and in the most standardised lines, computers areeven performing this risk calculation task themselves. The un-derwriting systems now being used to produce property/casualtypersonal lines products (such as auto at d homeowners' insurance)are a good example of these new applications.
"keditionally, the production process for personal lines prod-ucts involved roughly the following: an agent gathered the client'spolicy information and forwarded this to an underwriting depart-ment, located either in the home or branch office; the underwritersestablished a file on the client, evaluated the risk, and determinedthe risk parameters, then sent the policy to the rating section. Arater (a skilled clerical employee) calculated the premium chargesbased on guidelines contained in numerous manuals; sometimesthat information had to be communicated back to the agent sothat the client could make a decision whether or not to use thisparticular company. In most cases, the policy went back to theunderwriter who reviewed it and then sent it to a typing poolwhere policy typists prepared the various forms and documents.Finally, the policy was mailed back to the agent who forwarded itto the customer.
In most large property/casualty carriers the first applicationsof computerized equipment to the underwriting process were im-plemented in the early 1970s and were aimed at speeding theunderwriter's access to client files, shortening the time involvedin rate making, and of course improving the efficiency of policyproduction. A typical system of this vintage might simply haveinvolved a stand-alone computerized rating systemwith most ofthe rating guidelines from the manuals built into the machineand an automated policy issuance system, which performed thetyping and sat:milt:4y function.
In many personal lines departments today, this kind c lonfig-
4 6

BARBARA BARAN 33
uration remains the current state of the art. Beginning in the late1970s, however, some of the largest carriers moved to institutewhat they variously call "underwriting by exception," "pigeon-hole underwriting," or "computer-assisted underwriting." Theaim is very simply to have the computer itself perform the riskassessment function on as large a fraction of policies as possible,on the basis of underwriting decision rules which are built into themachine.
In general, the production process associated with these kindsof systems looks something like the following: the agent sends thepolicy information to a personal lines department where a cleri-cal worker screens it and enters all routine risks directly into themachines; these policies are then often relayed in batch form tothe carrier's national (or regional) computer center; the computerevaluates the risk, rates the policy, and produces it. Policies whichfail to fit within the pre-established guidelines are kicked out bythe machine and returned to an underwriter, who often now callsup the information on a terminal and works with it on the screen.Although these systems are extremely new, a few companies al-ready report that 50 percent to 90 percent of their personal linespolicies are completely underwritten by the computer.
Most personal lines systems fall between the two just describedin their level of sophistication, but, in almost all cases, clerks areassuming greater, and sometimes almost exclusive, responsibilityfor underwriting. For example, in one major property/casualtycarrier, the introduction of computer-assisted underwriting twoyears ago shifted the bulk of the underwriting function from theunderwriting department to the operations department, a clericaloperation which had formerly been confined to assembling andproducing the physical policies. Although auto policies still go tothe underwriters for an initial screening process, most propertypolicies are sent directly to skilled clerks in the operations depart-ment, who themselves order all necessary inspection reports andissue the policies.
In some rare instances, the underwriting function has evenbeen integrated into the activity of a sales worker, entirely elim-inating it as a separate department. In these cases, a highlyskilled clerical position--customer representativehas been de-signed; this job includes answering inquiries fro, notential cus-tomers over the phone; accessing a terminal to p: ..,e on-Cie-spot

34 THE INSURANCE INDUSTRY
rate quotes; negotiating the rates; and then if a sale is made, cap-turing ad6itional information on-line. The computer underwritesand produces the policy that same night.
Similar kinds of work process configurations have emergedin the claims departments of large insurance companies. In thelife insurance division of the industry, for example, group healthclaims systemswhich were implemented early in the 1970s andare now probably the most sophisticated in the industryhaveallowed skilled clerks to take over 75 percent or more of the claimsfu..ction.
ADMINISTRATIVE/CLERICAL, DECISION SUPPORT, ANDAGENCY SYSTEMS
In contrast to the underwriting and claims support systems,neither office automation applications nor decision support sys-tems have, as yet, made a significant change in the organization ofwork, although in the case of the former, companies have reportedfourfold productivity increases when word-processing equipmentis substituted for traditional typewriters and 70 to 85 percent risesin output per operator when CRTs replace MagII equipment (LifeOffice Management Association, 1979). By the late 1970s, wordprocessors were widely diffused throughout the industry. Compa-nies concentrated on installing the text-processing systems first,since that is where large and immediate savings could be realized,and then gradually added more sophisticated technologies andapplicationselectronic mail, voice mail, image processing, elec-tronic office support, and decision support. In most cases, wordprocessing and data processing have been both organizationallyand technically independent; companies have moved extremelyslowly to merge the two through electronic communications capa-bilities.
Management information or decision support systems are thustruly in their infancy. Although the integrated systems describedearlier have made a wealth of information available on a timelyoften dailybasis, few insurance managers have on-line access tothese data bases. In the last few years, however, user acceptancehas improved significantly due largely to the proliferation of per-sonal computers. One of the promises of these systems is thatthey can begin to bypass middle management and provide top
48

BARBARA BARAN 35
executives with ongoing access to the performance of their variousdepartments.
The story of the agency support systems is somewhat morecomplex. As in the case of the carriers, the greatest leaps inproductivity have been attained in the production and servicingfunctions, but this is largely the result of extensive networking withthe carriers and has therefore been highly dependent on the natureof the distribution systems Over the last 5 to 6 years, insurers withcaptive or salaried agency forces have moved rapidly to integratesales electronically into the company's overall operations, allowingthem to substantially rationalize the flow of work. For example,the keying function can be moved to the field office, closer to thepoint of data generation; much of the servicing of the policies canb a computerized and moved from the field to the home office; salesproposals and policies can often be printed on-site in the fieldoffices, eliminating bulk ordering. The benefits of these integratedsystems include improved speed and quality of quotations, policyproduction, billing and customer service; greater sophisticationin marketing techniques; error reductions; and less duplication ofclerical effort.
EFFECTS OF AUTOMATION ON THE SIZE ANDCOMPOSITION OF THE WORK FORCE
Taken together, the effects of these new systems on the insur-ance work force has already been dramatic and because integratedimplementations did not begin in earnest until fairly recently, wecan expect even more significant changes in the future. Work isbeing both eliminated and redesigned.
According to a recent study funded by the U.S. Department ofLabor (Drennan, 1983), productivity in the insurance industry asa whole grew rapidly between 1969 and 1979, at an average annualrate of 2.7 percent (in contrast to a 1.1 average annual growth ratefor all private industries); and these productivity gains accelerated
3 The four major marketing systems in the insurance industry are indepen-dent agents and brokers, exclusive or "captive" agents, salaried employees(the "direct writer?), and direct mail. Both independent and exclusiveagents are independent contractors, but the latter represent only one insurer.The great advantage of the direct writers and exclusive agency systems isthe organizational integrity which has allowed them to make full use ofintegrated, computer-based systems.

36 THE INSURANCE INDUSTRY
so that by 1975-1979 the average annual percentage increase inproductivity was 6.7 percent using a GNP deflator and 4.2 percentusing an industry deflator.4
Also significant, registered productivity improvements variedwithin the industry. In the life insurance segment, where au-tomation of policy production proceeded most rapidly, purchasesof policies increased by 49.2 percent (between 1970 and 1980)while the labor force expanded by only 9.8 percent. In the prop-erty/casualty segment, on the other handwhere fewer lines ofbusiness were easily automated and, more important, insurers wereexpanding capacity to reap the benefits of high interest ratesemployment kept pace with gains in output. From 1970 to 1978,average annual employment gains in property/casualty carrierswere 3.2 percent, approximately one-fourth again higher than theindustry -wide average and just slightly less than four times higherthan the average gains of 0.85 percent annually in life carriers. By1980, however, reckless expansion caught up with these companies.Between 1980 and 1982, sales plunged by 6.5 percent and employ-ment growth slowed considerably. Since then there may even havebeen some labor-shedding. Every property/casualty company wevisited, with one exception, had experienced serious layoffs in thelast four years, ranging between 5 percent and 15 percent of theirwork force. In the coming years, labor savings are expected toaccelerate in all segments of the industry.
With respect to future job loss, three fairly comprehensiveemployment forecasts for the insurance industry have been re-cently published (Drennan, 1983; Leontief and Duchin, 1986;Roessner et al., 1985); all three predict dramatic declines in in-dustry employmentparticularly clerical employmentbetween
4 Relatively crude measures of real productivity figures are presentedhere, because of the difficulty in calculating inputs from real estate, stockbrokerage houses, and so on (estimated roughly at 6 percent of total industryemployment). Unpublished productivity figures for the insurance industrycalculated by the U.S. Department of Commerce show the dramatic improve-ment over the previous decade but suggest somewhat slower average annualgains during this period (2.0 percent). However, the Department of Laborfigures were based solely on insurance carriers, whereas the Department ofCommerce estimates include agents and brokers. The average annual em-ployment gain for agencies and brokers during these years was 4.5 percent, oralmost double the industry-wide figure. This then explains the discrepancyand strengthens the hypothesis that the new technologies were indeed payingoff in terms of labor savings at the insurance carriers.
50

BARBARA BARAN 37
1980 and the turn of the century. If, relative to output, requisiteclerical labor input in the industry declines by even 10 percentbetween 1981 and 1991, approximately 100,000 fewer clerical jobswould be created. If, by the end of the century, the clerical la-bor coefficient were to fall to 70 percent of its present levelthesmallest decline predicted by these forecastersover 400,000 fewerclerical jobs would be created; and between 1990 and 2000, ap-proximately 100,000 clerks would actually lose their jobs throughlayoffs or attrition (Baran, 1985:225-234). Clerical job loss maywell be even more serious. One of the studies is considerably morepessimistic; in addition, none of these studies take into accountthe effects of structural shifts likely to occur in the industry. Forexample, because agencies were responsible for 61 percent of allnew clerical jobs in the last decade, a reorganization and consolida-tion of the distribution functionwhich most industry observersexpectshould have a major effect on clerical employment.
Although layoffs in response to the overcapacity common inthe 1980s (and the anticipated job loss) could affect the entireoccupational structure, the impacts of technological change canbe more discriminate. Over the last two decades, there have beenvisible shifts i-, the composition of employment and effects havevaried with waves of implementation.
The first impacts of computerization were, as we have seen,on the accounting functions of carriers; in addition, billing shiftedfrom agencies and sales offices to the insurers' data-processingdepartments, and probably coincidentally, reporting requirementsto state regulatory agencies increased (Appelbaum, 1984). As aresult of these various forces, the most significant change in theoccupational structure of the industry during the 1960s was anextraordinary influx of technical personnel (see Table 1). Whereasin 1960 professional and technical workers had constituted 3.?percent of all employment, by 1970 this share had grown to 5.8percent (U S. Bureau of Labor Statistics, 1969, 1981b).6
6 There ate substantial problems involved in developing a longitudinaldata series on employment in the insurance industry. There are threeprincipal data bases: the first, the U.S. Census of Population, remainedconsistent between 1960 and 1970 and permits useful comparisons of oc-cupational change over that delade, although even for this time periodthe extant of disaggregation by occupationparticularly insurance-specificoccupationsis woefully inadequate. By 1980, census data were truncatedand occupatiunal categories were significantly reorganized and redefined; this

38 THE INSURANCE INDUSTRY
Over the next decade, data-processing technology continuedto diffuse and text-processing equipment was introduced; competi-tion had heated up markedly and firms were rushing to reduce unitlabor costs. By the end of this period, the impacts of technologicalchange on clerical labor are strikingly clear (see Table 1): clericalemployment as a percentage of total employment in the industryfell from 50 percent to 45 percent; 73,000 clerical jobs were elim-inated. This dramatic drop in employment share contrasts withthe experience of clerical labor in the economy as a whole andin other similar industries such as banking, securities, businessservices, and credit agencies. It occurred because the introductionand subsequent diffusion of new technologies occurred earlier forthe insurance industry and was therefore more widespread by thelate 1970s (Drennan, 1983).
Virtually all clerical categories experienced relative decline,but routine clerical occupationssuch as keyboarding, filing, tra-ditional office machine operators, and so onwere particularly
makes comparison with earlier years difficult and, in some cases, useless.The second important source, the Bureau of Labor Statistics' Occupa-
tional Employment Matrix, provides data reported for 1970, 1978, and 1980which are estimates based on other surveys. In 1980, the Matrix shiftedfrom basing itself primarily on census data to relying principally on datafrom the BLS Occupational Employment Survey (OES). However, the OESdata fail to correspond even generally to the census data. To illustrate, thetable below compares the occupational structure of the insurance industryas reported by the 1978 Matrix based upon the census and the 1980 Matrixbased upon the OES:
Census (1978) OES (1980)Professional/technical 6.79% 15.4%Managers/officials 12.08 13.8Sales workers 34.54 14.6Clerical workers 45.42 54.4
The third source of occupational data, the employer-based OES series,which appears to be the most reliable, has limited usefulness since it isavailable for the insurance industry only for the years 1978 and 1981. Despitethis limitation, this report has relied on it and the OES-based Matrix andhas used the census-based Matrix only when necessary for the earlier years.Although wide discrepancies in the data exist, at least the direction of changeis the same in most cases. Finally, we have used the BLS Employment andEarnings series in comparing aggregate employment changes, since these datawere the only longitudinal ones available disaggregated by major industrydivision. See Hunt and Hunt (1985) for a fuller discussion of methodologicalproblems.

BARBARA BARAN 39
TABLE 1 Percentage Distribution of Insurance Employment byOccupation, 1960, 1970, 1978
OccupationPercent of Total Employment Percent Change from
1910 to 19781960 1070 1978
Managers/officers 13.3 11.8 12 1 21.4Professional/
technical workers 3.2 6 8 6 0 24 0Clerical workers 47.4 50 0 45 4 8.0
Computer operators 0.7 1.3 119.0Keypunch operators 18 1.2 -21 9Statistical clerks 2.8 2.6 6 4Bookkeepers 3.6 2 8 -7.4Adjust ers/examiners 7 3 9 8 68.8File clerks 2 6 1 7 -19.7Mail handlers 0.7 0.6 -10.7Secretaries 13.2 12 0 8.2Typists 6.9 6.1 -11.7
Sales 336 300 34.6 37.2
NOTES: Percents for subcategories under the category "Clerical workers" donot total the percents for the category as a whole due to other clericaloccupations not listed. Columns do not add to 100.0 due to other occupationsnot listed.
SOURCE: 1960 data, U.S. Bureau of Labor Statistics (1969); for all otheryears, U.S. Bureau of Labor Statistics (1981b:Vol. I).
seriously affected. In absolute terms, the number of bookkeepingmachine operators fell by 60 percent, calculating machine opera-tors and duplicating machine operators by 41 percent, tabulatingmachine operators by 76 percent, keypunch operators by 22 per-cent, file clerks by 20 percent, and typists by 12 percent (Bureauof Labor Statistics, 1981b).
Secretarial employment in the insurance industry continuedto grow at about 1 percent a yearreflecting the relatively smallimpact of automation on traditional administrative support tasks,yet this growth rate was less than one-third that of secretariallabor in the economy as a whole and less than half the rate ofemployment growth in the insurance industry. Even in this occu-pational area, then, the introduction of word-processing equipmentand rationalizing moves such as the pooling of secretaries took atoll on employment opportunities. Professional, managerial, andespecially sales jobs, on the other hand, grew at a fairly rapid clip.
Although there are no current data available to reflect the re-cent implementations of integrated on-line systems, it is clear that,especially in the carriers, clerical jobs are continuing to disappear(see Table 2). Between 1978 and 1981, of the clerical occupati, altitles reported in the BLS Occupational Employment Survey of In-surance, approximately two-thirds grew more slowly than overallemployment and close to one-half experienced absolute job loss.

40 THE INSURANCE INDUSTRY
TABLE 2 Percentage Change in Employment in InsuranceCarriers by Selected Occupation, from 1978 to 1981
OccupationPercent Changein Employment
Total employment 5.6Managers and officers 10.9Professional and technical 9.5
Actuary 21.7Systems analyst 42.5Accountant/auditor -51.1Claims examiner, property/casualty 10.8Underwriter 3.0Computer programmer 36.2
Clerical 3.5Computer operator 0.4Bookkeeper, hand -15.2Claims adjuster -7.7Correspondence clerk -1.5File clerk -15.9General clerk -5.9Rater -1.6Secretary 6.6Stenographer -31.4Typist -2.9
Sales 6.6
SOURCE: Unpublished data from the U.S Bureau of LaborStatistics (1978, 1981a).
However, clerical categories such as "claims examiner, life, acci-dent and health," "insurance clerk," and "policy change clerk"continued to experience steady growth, probably reflecting thegrowing responsibility of clerks for the claims and underwritingprocesses.
Significantly, from 1978 onward the impacts of automation onprofessional work have become evident in aggregate data. Between1978 and 1981, underwriters lost employment share and the num-ber of accountants and auditors plunged dramatically. Althoughthe professional and technical category still grew faster than totalemployment, most of this expansion was directly attributable tothe continued addition of computer professionals (systems analystsand programmers); excluding these two categories, professional oc-cupations grew at about half the rate of total employment. Growthin the number of sales personnel also began to slow down (to about
J 4

BARBARA BARAN 41
half the rate of the previous period)probably reflecting decliningprofitability and the attempts on the part of insurers to improvethe efficiency of their distribution systems; but managerial rankscontinued to swell.
Three conclusions can be drawn fro,.. these data: First, atleast in relative terms, insurance is employing fewer people; and inincreasing numbers of occupational categories, the relative declinein employment sh: re has escalated into absolute job loss. Sec-ond, the weight of the occupational structure has shifted upward,tilting toward the higher-skilled categories of labormanagerial,professional, and sales. Third, however, even within the clericalcategory, routine occupations are being eliminated most rapidly.In contradiction, then, to observers who feared that widespreaddeskilling would accompany automation of this industry, the newtechnologies seem to be raising aggregate skill levelsboth acrossoccupations and within occupations. When the declining andgrowing clerical occupations in the life insurance segment of theindustry are ranked on the basis ofcurrent wage levels (as a proxyfor complexity of the job), this upwa,. shift in clerical skills isconfirmed. Almost without exceptiot sal occupations at the bot-tom of the pay scale are shrinking more rapidly than those ai,the top. Similarly, when the average skill level of declining andgrowing occupations in both the 1970-1918 and 1978-1981 peri-ods are computed on the basis of the U.S. Department of Labor's(1977) Dictionary of Occupational Titles job evaluation scheme,growing occupations in both time periods ranked higher in theareas of mathematical skills, language requirements, and specificvocational training (Baran, 1985:115-118).
Although these aggregate data are suggestive, they fail tocapture the logic of the new implementations and therefore arenot vsry useful either in predicting the future or in describing thekinds of new jobs actually emerging. For that kind of detail, it isnecessary to go to the level of the shop floor.
CHANGES IN THE NATURE OF WORK:THE VIEW FROM THE SHOP FLOOR
Conceptually, what is perhaps most notable about the emerg-ing organization of work in the insurance industry is that it rep-resents an electronic transcendence of the assembly-line, or more

42 THE INSURANCE INDUSTRY
precisely of the detailed division of labor which has come to domi-nate all modern industry, both blue and white collar. Despite thefact that the office automation literature, particularly the criticalliterature (see, for example, Braverman, 1974; Cummings, 1977;DeKadt, 1979; Driscoll, 1979, 1980; Feldberg and Glenn, 1977,1983; Greenbaum, 1979; Hoos, 1961; Nussbaum and Gregory,1980), has been dominated by the fear that industrialized laborprocesses would accompany the rising capital intensity of white -collar production, ironically it was the pre-automated rather thanthe newer highly automated labor processes in the insurance in-dustry that most closely resembled an industrial assembly-line.Traditionally, in huge open offices, white-collar insurance workerssat grouped by functionunderwriters, raters, typists, file clerks,and so on; the paper flowed manually from one station to anotheras each worker completed his or her portion of the productiontask. In line with established principles of industrial engineeringand scientific management over the last two decades, this workwas increasingly fragmented into its component parts and simplerfunctions were turned over to less-skilled labor. Just the checkissuance procedure in a preautomated claims office illustrates theextraordinary degree to which work was divided:
If a check had to be issued, first it was typed by a typist;then another clerical verified the amount; a third person auditedthe claim to insure that the doctor charged appropriate:y for theservice provided; a fourth person actually "br ,st" the check (tookapart the carbons); and a fifth then put the check through thesigning machine. Including supervisorial oversight, between six andseven people were involved in this one procedure alone (personalinterview).
Task fragmentation was not limited to processing functions. Inmany property/casualty companies, for example, underwritingwas also rationalized; at the bottom end, routine underwritingtasks were turned over to a newly created clerical position, "un-derwriting technical assistant," and, at the top end, the numberof specialty underwriters increased.
The early applications of data-processing and text-processingequipment tended to follow and intensify the Taylorist logic un-derlying this form of work organization, producing ever morehighly "industrialized" work settings. In the case of data pro-cessing, the early mainframes were large, noisy, and often requiredspecial rooms. Because of these technical requirements and the
56

BARBARA BARAN 43
tendency to automate in conformity with the rationalized bureau-cratic structure, separate data-processing departments were estab-lished in all insurance companies. These eventually generated theirown hierarchy of systems analysts, programmers, computer oper-ators, data-entry operators, and so on. With the improvementsin telecommunications in the last decade, the entry function wasoften separated sharply from the rest of the operation and fre-quently spatially isolated in suburbs or small towns where landand labor were cheaper. These were the "electronic sweatshops."Work within the centers was machine-linked, machine-paced, andoften machine-monitored as well; correspondingly, turnover wasextremely high. Many of the early applications of word process-ing had a similar character in that key entry was often separatedfrom other clerical activities and centralized in a word-processingcenter.
Beginning in the late 1970s, however, as companies began tointroduce integrated systems, they also embarked on a serious re-design of the labor process, which promises to reverse many ofthese earlier trends. Whereas the organizing logic of the last sev-eral decades produced an amazing proliferation of "detail" work-ers, today the white-collar assembly-lines are being internalizedwithin the machines themselves; an electronic reintegration of thework process is manifesting itself in at least three important newtrends.
First, multifunction jobs are replacing the extremely narrowedoccupational categories of the past. On the basis of the new inte-grated systems, insurers have been able to consolidate all policyholder data into central master records stored in the company'smain computer installation. In the past, these records were du-plicated in up to a dozen functional units; now users in remotesites can access and alter relevant policies and the changes can beintegrated into the master record. One individual can thereforehandle multiple service transactions and functional units can be-,onsolidated since the individual master record for each policy isa complete data base.
Second, "mental" and "manual" labor are (slowly) being rein-tegrated as entry functions are slipped unobtrusively into the ac-tivity of higher-level workers, such as underwriters and claimsadjustors. The apocryphal example is the insurance salesman,equipped with a portable terminal, who enters all necessary pol-icy data directly from the customer's home; through a regular
ri 7

44 THE INSURANCE INDUSTRY
telephone link, that information is received 34 the company'smainframe which then underwrites, rates, and produces the pol-icy. Although the current state of the art is perhaps a decadeaway from this futurist scenario (and many procedures simply donot lend themselves to such extensive automation), companies arebeginning to install systems that require professionals to performsome, if not all, of the requisite data entry.
Finally, apart from this kind of electronic integration of tasks,in several procedures and product lines, single-adi city units arebeing eliminated in favor of multiactivity teams. Whereas formerlytypists, raters, and underwriters were divided into separate units,each with its own supervisor, now a small team consisting of oneor two of each kind of worker will service some subset (oftengeographical) of the company's customers.
Although these overall trends are visible throughout the en-tire industry, a variety of actual job configurations are emergingboth within companies and across companies largely reflectingdifferences among product lines. In the case of high-volume, stan-dardized lines, two principal typos of work organization seem to bedeveloping. The first of these is found in purest form in the highlyautomated personal-lines underwriting departments of many largeproperty/casualty carriers. Here both rating and risk assessmenthave been largely assumed by the computer; as a result, func-tions formerly divided among entry clerks, raters, underwritingassistantsas well as additional low-level underwriting taskshave been consolidated and turned over to a highly skilled clericalworker.
Although closely circumscribed in their decision making, theseclerks are a long way from the typing pool. Judgment is required,and often they are required to interact directly with the agents,a level of responsibility formerly reserved for professional under-writers. Most important, these workers (limited by the decisionparameters built into the machines) are almost solely responsiblefor the soundness and accuracy of the millions of routine riskstheir companies write.
Underwriters have also had their jobs redefined as clerks havetaken over their lower-level functions. First, they have become"exceptions" handlers, responsible only for the policies that failto fit into the "pigeon-holes" of the computerized system; thus,their work has become more complex. Second, there has been a
5s

BARBARA BARAN 45
reorientation of the job function away from churning out policiesand toward planning and marketing.
A similar job configuration has emerged in the claims oper-ation of many group life and health insurers. On the basis ofhighly integrated computer systems, clerks have taken over mostof the work of professional claims examiners; the small number ofremaining examiners handle only the problem cases.
The emergence of this kind of work organization, where rou-tine clerical work is eliminated, professional jobs are reduced innumber while being enlarged in depth and scope of responsibility,and skilled clerks become the bulk of the work force, seems to de-pend on several factors. First, the operation is high volume, mak-ing automation cost-effective; second, the product is standardized,making it relatively easy to translate the decision parameters intoalgorithmic form; third, these operations still involve semiskilledfunctions that cannot be automated, often because interpersonalinteraction is required.
Alternatively, where products are standardized and volume ishigh but semiskilled functions can be assumed almost entirely bythe computer system, the work force is highly bifurcated be ween alarge number of routine data-entry clerks and a very small numberof skilled professionals. At the clerical level, there is little realdecision making and no interaction with agents or clients.
Finally, in product lines that are too low in volume, unique,or complex to lend themselves to this level of standardization,automation is less extensive and more confined to discrete tasks.Clerical work is routinized and narrow; professional work is com-puter-assisted to the extent technically feasible, but profession-als are not being replaced either by clerks or by machines. .ti.these situations, there are serious constraints on the automationof professional functions, either because low volume makes suchsophisticated systems unjustifiably costly or because the work it-self is too complex or unstructured. In the longer run, it is possiblethat some professional functions will be turned over to less-skilledlabor as the software improves; but it is also likely that clericallabor will be bypassed entirely as data entry is increasingly foldedinto the activity of higher-level originators.
The nature of the product may be the primary determinantof which of these job configurations emerges. The second seems tobe considerably more prevalent in life insurance companies (about

46 THE INSURANCE INDUSTRY
75 percent of our sample, as opposed to 50 percent for prop-erty/casualty firms); and even within property/casualty personallines, tilt production of homeowners policies often afforded cler-icals greater discretion and wider responsibility than auto policyproduction. The crucial parameter in both cases seemed to be thedifficulty of interpreting the necessary supporting reports (e.g.,medical records, auto history, property evaluation). However,there were important differences in apparently identical productsituations to emphasize the importance of a managerial decisionlevel in the design of the labor process.
Although each of these job configurations has different rami-fications for the employed work force, there are certain importantsimilarities among all three that distinguish them from the earlierlabor processes, beginning with their impacts on skill require-ments. First, even in the case of routine entry operators, clericalshave an increasingly important responsibility for the quality ofthe data. In the context of integrated data bases, errors are moresignificant, more costly, and more difficult to detect and correct,because data entered anywhere throughout the system is immedi-ately recorded in all relevant files. There are multiple reasons forthe new organizational and occupational designs just described,but in all cases an important motivation was the reduction of error;in each instance greater accountability was assigned to fir.it-lineworkers. Single-source entry and team systems, for example, bothencourage and demand that an individual or small groupoftenaided by feedback from the machinesassume responsibility forthe accuracy of their work. The move to decentralize and de-specialize entry was encouraged to an important degree becausecentralized work settings generated intolerably high error rates.To the extent then that responsibility is an essential component ofskill, skill requirements have been rising.
Similarly, there is evidence that even routine data-entry posi-tions involve greater levels of mental concentration than traditionaltext entry, to the extent that the work requires the operator toknow and use a multiplicity of codes (Adler, 1983). In the old-fashioned insurance typing pools it was possible, after sufficientexperience on the job, to semi-automatically pull out the appro-priate forms from the appropriate stack and fill in the requisiteinformation virtually without thinking, much like driving a cardown a familiar route; the work was boring and demanded littlein the way of mental effort.
60

BARBARA BARAN 47
As Adler notes when reviewing recent research, this kind ofcomfortable familiarity is never achieved when the language of thework is algorithmic. In addition, with increased computerizationthe span of functions for which any individual worker is respon-sible has widened; each transaction involves the entry of a widevariety of codes and discrete pieces of information, each step ofwhich must be performed quickly, accurately, and in the correctsequence. The new systems then demand a kind of continual men-tal alertness which might also appropriately be understood as anew kind of skill. Finally, the fact that the systems are continuallychangingboth in response to technological improvements andin the interest of product innovationmeans that the work forcemust be unusually flexible and adaptable and sufficiently polyva-lent to easily learn new routines, new codes, and new procedures.
On the other hand, as Adler noted in the case of routine cleri-cal activity in banking, what may be most notable about many ofthe new jobs is precisely the extent to which they demand muchof the worker with little reward (Adler, 1983): "If the al,strac-don of means increases training requirements and mental effort,the abstraction of ends leads to a very different resultwork isoften experienced as boring." There are also other roots to thisperceived disaffection. Although objectively work has been reinte-grated through the expansive reach of the computerized system,for any individual worker, task variety may have diminished. Formany insurance clerks, the previous work process involved a mul-tiplicity of activities, which in combination relieved the boredomof the day. Now all these functions are of the same quality, thatis, they center around the machine and the manipulation of itsabstract symbols. Worse, the sustained concentration that is re-quired introduces a new element of stress. Finally, the sociabilityof a job declines dramatically in the transition to a computerizedwork setting.
Evaluating the new skilled clerical categories is even moredifficult. On the one hand, there is no doubt that they are animprovement over most clerical jobs along a series of dimensions:task variety has widened rather than narrowed, the span of decisionmaking i6 broader, the responsibility for production is greater, andgeneral training and educational requirements have risen. How-ever, pay scales remain low and in some cases work is closelymonitored and even paced by the system, heightening occupa-tional stress. A recent survey by the 9 to 5, National Association

48 THE INSURANCE INDUSTRY
of Working Women (1984) found that respondents whose work issubject to computerized monitoring are much more likely to ratetheir jobs as "very stressful" than other office automation users.Similarly, those working under production quotas report signifi-cantly higher leveia of stress than other office workers.6 Equallyimportant, although skill levels may be rising, opportunities foroccupational mobility may be diminishing. As lower-level pro-fessional categories are eliminated, there is, in the words of onemanager, increasingly a "quantum leap" between the computer-linked clerical positions and the next step up the occupationalladder. In this sense, career paths may be structurally truncated.
Even for the professional and managerial labor forces the reor-ganization of work is only a mixed blessing. Although their work islikely to become more challenging, many jobs may be eliminated.?
WOMEN AND MINORITY WORKERS
Because of the prevalence of occupational stratification bygender and race, this reshaping of work and of the occupationalstructure has particularly affected female and minority workers.
6 The survey presented a picture of two prototypical skilled, computer-linked clerical occupations: customer service representative and claims ex-aminer in which white claims examiners were more likely than any of theother clerical categories reported to find their work always "interesting andchallenging" (50 percent of claims examiners as compared to 30 percent ofwhite legal secretaries, the second-ranked occupation). They were almosttwice as likely as other clerks to work under production quotas and 44 percentdescribed their jobs as 'always very stressful' (as compared to 29 percent.,r general clerks in automated settings). Customer service representativeswere even more likely to have set production quotas (72 percent) and toexperience their jobs as very stressful (60 percent).
7 In the case of sales workers, competitive pressures have probably beena more important source of change than automationalthough the two areclearly integrally connected. The primary impacts of the new technologieson the agency employees have been: first, a decline in their role as serviceproviders and an increased emphasis on their sales function; second, amuch closer connection on all levels with the rest of the organization. Skillrequirements have clearly risen in some product linesparticularly financialservices planningas evidenced by new training and licensing requirements.However, in more standardized product lines, both the role and necessarycompetencies of the sales worker are being eroded; the direct marketing clerkdescribed earlier is a good example of this kind of change.

BARBARA BARAN 49
TABLE 3 Number of New Jobs Created in the Insurance Industry by Gender,1960-1982
Year
Number of New Jobs Percentage of(thousands) New JobsTotal Women Men Held by Women
Insurance carriers1960-1970 198.0 109.7 88.9 55.11970-1978 143.9 144.7 -0.8 101.01978-1982 63.2 58.6 4.6 92.7
Agents/brokers1960-1970 70.7 46.6 24.1 65.91970-1978 115.2 86.6 28.6 75.21978-1982 71.0 55.3 15.7 77.9
Total1970-1982 393.3 345.2 48.1 87.7
SOURCE: U.S. Bureau of Labor Statistics (1983).
Therefore, it is impossible to evaluate the effects of the new tech-nologies on the work force without considering these more selectiveimpacts.
EFFECTS OF AUTOMATIONON THE FEMALE WORK FORCE
Despite the fact that female-dominated jobs are disappearingin great numbers, empirically the proportion of women in theinsurance industry has grown dramatically in the last decade. By1982, women comprised 61 percent of the industry's entire workforce, up from 54 percent in 1970 (Bureau of Labor Statistics,1983).
Between 1970 and 1978 women claimed approximately 231,000of the 259,000 new jobs created; and over the next 4 years womengained 113,900 jobs, whereas men gained only 20,300 (see Table3). In total during this period, female employment rose by 49percent compared to a meager 8 percent rise in male employment.
Since during this same decade clerical workers declined asa percentage of the work force, the increase in female employ-ment cannot be explained by the disproportionate growth of tra-ditionally female-typed jobs. On the contrary, what seems to be
3
6

50 THE INSURANCE INDUSTRY
occurring is a major movement of women into traditional maleoccupationsprofessional, managerial, technical, and even cleri-cal.
Between 1970 and 1979, the proportion of female managersand officers grew from 11 percent to 24 percent of the insurancework force; professionals grew from 17 percent to 38 percent;and technicians, from 38 percent to 65 percent. The percentageof women insurance examiners and investigators (formerly maleclerical occupations) grew from 9 percent in 1962 to 26 percent in1971 and to 58 percent in 1981 (Appelbaum, 1984).
Overall in the insurance industry, the ratio of women to menin professional and technical occupations rose by 19 and 27 per-centage points in 1971 and 1981, respectively, as opposed to a 4.3percentage point gain for women throughout the economy in pro-fessional and technical occupations combined. Although the disag-gregated comparative statistics are not extremely reliable, womenin the insurance industry seem to have increased their share ofprofessional employment more rapidly than in any other majorsector of the economy (see computations in Baran, 1985:144).
There are a number of plausible explanations for this rapidtransition from male to female labor. The first is simply affirma-tive action victories. Because of EEOC oversight aid successfulaffirmative action suits waged against numbers of insurers, com-panies throughout the industry have developed more egalitarianhiring and promotion policies.8 At the same time, however, thereis evidence that women are being hired in preference to men for thenew computer-linked jobs, whether those are presently designatedprofessional, technical, or clerical. For example, the professionalstaffs in the new highly automated personal-lines centers of onecompany are so overwhelmingly female that an administrator ofone joked that they are under pressure to develop affirmative ac-tion goals for men. She explained that the reason the companychose to hire women was that they are more flexible than men inadjusting to the computer-mediated labor process.
In another company, the introduction of computer-assistedunderwriting has shifted the bulk of policy processing from a
8 For example, in response to affirmative action litigation, between 1977and 1983, one company we studied increased its percentage of female man-agers from 4 percent to 33 percent; professionals, from 27 percent to 46percent; and technicians from 29 percent to 67 percent.

BARBARA BARAN 51
department that is over 60 percent male to one which is entirelyfemale. In still another, the change to a computerized claimsprocess was accompanied by an increase in the percentage of femaleemployees from approximately 25 percent of the claims force toover 60 percent.
In line with this hypothesis also, the percentage of femaleprofessional and technical workers in the industry varies widelyby product line. In the more highly automated life and medi-cal/health segments, women's share of employment in these occu-pational categories is considerably higher .°
The differences in the proportions of female labor are notsolely attributable to automation; other characteristics of the jobmilitate for or against the employment of women. For example, inall firms women hold a greater percentage of professional and man-agerial positions in the personal lines of business where externalcontacts are individual rather than corporate; similarly, womenhave been preferred for office rather than field operations (suchas claims adjustment or sales). Nevertheless, the jobs which havebeen more accessible to women also lend themselves more easilyto automation. Thus, although the congruence between femalepresence in an activity and its level of mechanization to some ex-tent reflects an older discriminatory structure of employment, thegrowing dominance of women in these occupations and productdivisions threatens to strengthen and perpetuate the inequality.
In a small number of companies, there seems to be someconcern over this prospect. A personnel manager in one majorproperty/casualty carrier said that she worries that numbers ofoccupational categories are segregating females and may be de-valued as a result. Despite the rapid movement of women out ofthe clerical ghettos in this company, 79 percent remained in posi-tions that were 80 percent or more female and 71 percent were inoccupations that were 90 to 100 percent female. Approximately20 percent of non clerical jobs were overwhelmingly occupied bywomen.
9 In 1979, 40 percent of all professionals in life carriers and 43 percentof professionals in medical/health carriers were women, as opposed to 35percent in property/casualty companies. Similarly, 68 percent of all lifeinsurance technicians were female and 81 percent of all medical/healthtechnicians, whereas women held only 50 percent of all technical jobs in theproperty /casualty segment.

52 THE INSURANCE INDUSTRY
Not surprisingly, then, although women are moving up inthe occupational hierarchy, female wage rates in the industry re-main extremely low. In our case study company, for example,female professionals earn only 16 percent more than male clericals(whereas male professionals earn 50 percent more); and the ma-jority of white female managers (57 percent) earn on the average$4 less per week than white male clericals. Overall in the in-surance industry, real average hourly earnings for nonsupervisorypersonnel fell by 4 percent between 1968 and 1978, in contrastto a slight rise in real wages during this same period across allindustries. Disaggregating by industry segment, the drop in wagescorresponds directly to the increase in the proportion of femalelabor (Bureau of Labor Statistics, 1983).
Automation and feminization are thus proceeding as twin andhighly interrelated processesand we should expect this trend tocontinue. Automation of professional functions is creating pre-cisely the kinds of jobs women have traditionally held in offices:the work is fairly routine, semi-skilled, and responsible, but offerslow monetary reward and little opportunity for occupational mo-bility. As Oppenheimer (1968) has argued, employment of meninstead of women in such occupations would mean a rise in theprice of labor, a decline in its quality, or both.
In today's environment, however, insurance companies arehaving an increasingly difficult time finding low-cost, high-qualityfemale labor. As a result, such labor may be becoming a significantlocational determinant. Nelson's (1982) study of the locationaldeterminants of automated office activities (including insurance)concluded that, holding land costs constant, companies have cho-sen to site such operations in areas with a disproportionately highpercentage of suburban married women. Compared with womenin the central cities, suburban wives are often less career-orientedand may therefore be more willing to accept jobs with limitedoccupational mobility; because they are much more likely to besupplementing rather than solely providing the household income,they may be more content with modest pay scales.1°
1° An executive of the Fantus Co., a subsidiary of Dim and Bradstreet,which specializes in corporate location, made an argument similar to Nelson'sregarding insurance company relocations in particular (Best's Review, 1979);see also Kroll (1984).
6 t3

BARBARA BARAN 53
Ross's (1985) study of insurance company relocations and ourown case work and survey tended to corroborate this hypothesis.Of the 75 percent of our sample who indicated that major spatialchanges had occurred in their company within the last 5 years,71 percent had moved a greater percentage of their operationsto suburban locations. Overwhelmingly, they cited labor quality,labor costs, or both as the primary locational criteria.
EFFECTS OF AUTOMATION ON MINORITY WORKERS
Although the relocations and, more generally, the changesoccurring in the labor pro zess may favor some categories of femalelabor, they threaten to have a negative effect on other categories.The situation of minority workers is particularly problematical.
In general over the last 15 years, paralleling the progress ofwomen, the position of minority labor in the insurance indus-try has improved significantly. Whereas in 1970, the percentageof blacks in insurance was seriously below the economy-wide av-erage in all occupational categories, by 1080 the EEOC reportsindicated higher than average minority employment in many oc-cupational categoriesincluding higher percentages of black em-ployment. Disaggregating these gains by industry segment, it isclear that minority workers also fared best in highly automatedsectors."
Given the occupational structure of the industry, the majorityof these minority employees are women. Approximately one-fifthof the female work force is composed of minorities as opposed toone-tenth of the male work force. Overwhelmingly these womenare concentrated in clerical positions (74 percent). Minority menalso hold a disproportionate share of clerical jobs; 32 percent of allminority men in the industry are clericals compared to 7 percentof all white men.
11 In the medial /health segment, in 1980, minority workers held 24percentof all jobs; although their greatest share of employment was in clerical work(almost 30 percent), minority workers held unusually high percentages ofjobs in all occupational categories. Minority employment was lowest inproperty/casualty firms (14.1 percent) and insurance agencies (12.4 percent),although even here in both cases minority workers held a disproportionateshare of clerical jobs (U.S. Equal Employment Opportunity Commission,1980).
G'i

54 THE INSURANCE INDUSTRY
The explanation for the influx of minority workers is identicalin most respects to the argument I made with regard to women:affirmative action gains and the automation of the labor process.At the same time, there was an important difference in the dynamicof entry that may be extremely important in the longer run.
Long excluded from office-type employment, at least in theprivate sector, minority womenespecially black womenbeganentering the clerical work force in significant numbers for the firsttime in the late 1960s. To some extent these women soughtand were grantednew job opportunities as a result of the CivilRights movement and its demands for greater equality in the jobmarket; to some extent, they were pushed to enter the clericallabor force as opportunities for employment as domestic serviceworkers declined. Nevertheless, they entered the office after thedivision of labor in administrative support activity had becomeexcessively detailedand they entered at the bottom, in what areoften referred to as "back-office" jobs.
This is still where minority clericals are overwhelmingly con-centratedin the data-processing centers, typing pools, and filingdepartments. As of 1980, almost 90 percent of all secretariesand 84 percent of all receptionists were white, whereas minorityworkers represented 25 percent of all typists; 27 percent of all fileclerks, office machine operators (other than computer operators),and messengers; and 28 percent of all mail clerks.12
Undoubtedly, then, the high proportion of minority clericalsin the insurance industry is a direct indication that much of itsoffice activity is production-oriented, rather than more traditionaladministrative support. In addition, the kinds of industrializedwork settings created by the first waves of mechanization in theindustry favored minority employment.
Today the concern is that these jobs are disappearing, throughmechanization, relocation, and perhaps also the new labor processconfigurations. First, as Table 4 suggests, of the eleven clericaloccupations with the greatest minority representation, all but twoare declining; in contrast, virtually all of the growing occupationsare dominated by whites. Second, the movement of automatedinsurance activities out of the central cities to suburbs and white
12 These data are for the economy as a whole (U.S. Equal EmploymentOpportunity Commission, 1980).

BARBARA BARAN
TABLE 4 Occupations in the Insurance Industry; by Race
55
Occupation Percent White Percent Black
All occupations 82.0 10.0
Professional/technical/sales
Underwriter 88.95 6.27
Computer systems analyst 89.06 4.64
Operations and systems research 88.73 6.02
Actuary 94.16 1.79
Statistician 84.86 7.88
Computer programmer 86.75 5.58
Insurance sales occupations 90.81 5.16
Clerical: above average black
Gelteral office supervisor 83.12 _C.Ji
Computer operator 80.13 11.64
Peripheral equipment operator-b 79.44 12.67
Typistb'C 75.30 15.78
Correspondence clerkC- 81.08 13.43
Order clerkb cFile clerk-'-
81.08
73.13
11.69
17.52
Billing, posting,
calculating machine operato?)? 77.67 12.50
Duplicating machine operatort 73.25 17.48
Office machine operator,
not elsewhere classified12'S 73.17 17.12
Telephone operatorb 79.05 14.38
Mail clerk-b 72.28 18.72
Messenger=' 73.03 17.59
Clerical: below average black2
Computer equipment supervisor 86.78 7.30
Financial record-processing
supervisor 90.16 4.67
Secretary 89.00 5.73

56 THE INSURANCE INDUSTRY
TABLE 4 (continued)
Occupation Percent White Percent Black
b cStenographer' 84.74 9.10
Receptionist/2 84.24 8.15
Bookkeeper/accountant/audit clerk 90.01 4.33
Payroll/timekeeping clerk 85.53 8.15
Billing clerk 85.34 7.115
Cost and rate clerks
(including raters) 85.29 7.88
NOTE: Employment share percentages are for the entire economy, not theinsurance industry, for 1980.
-4-Clerical occupations are grouped according to whether the proportion ofblacks is higher or lower than the proportion of blacks for "All occupations",10.0 percent).
Absolute decline 1970-1978 in insurance industry employment (OccupationalEmployment Matrix, Bureau of Labor Statistics, 1981b).Absolute decline 1978-1981 in insurance industry employment (Occupational
Employment Survey, Bureau of Labor Statistics, 1978, 1981a).
SOURCE: U.S. Equal Employment Opportunity Commission (1980).
towns also threatens minority employment. Again using the ex-ample of our case study company in the absence of reliable ag-gregate data, the three new, highly automated "personal-lines"centers described earlier were located in towns where minoritiesrepresented 3.1 percent, 3.3 percent, and 14.3 percent of the popu-lation (whereas their representation in the population as a whole iscloser to 20 percent). This company's centralized data-processingcenter (soon to be closed) and home office also relocated from acentral city with a minority population of over 40 percent to sub-urban locations which are 90 percent white. Third, and somewhatmore speculatively, the move to team-type work configurations,which involve close working relations among high-level and lower-level employees, may well favor the hiring of "socially compatible"white women (Nelson, 1982; Storper, 1981). The historically lowlevel of minority representation in secretarial and receptionist jobs

BARBARA BARAN 57
lends circumstantial evidence to this hypothesis. As the bulk-processing centers are closed and key entry functions are movedto decentralized settings, minority clericals are in real danger ofbeing displaced. And the centers are closing. A vice president inone company we interviewed predicted that within 2 years theirsix processing centers located across the country, which now em-ploy approximately 1,500 to 1,800 women, will have been closed.Although word processing is still somewhat centralized in manycompanies, over 70 percent of our sample in the survey respondedthat the trend in their company is toward decentralization of thisfunction.
Finally, and perhaps most important, are the prior disadvan-tages minorities face in the educational arena. If it is true, as Ibelieve, that the lesser-skilled jobs in the industry will continueto disappear, workers without adequate mathematics and literacyskills will be disadvantaged. To the extent that these occupa-tions increasingly involve interpersonal communication, workersfor whom English is their second language may also be passedover.
CONCLUSION
To conclude, it seems appropriate to return briefly to theprimary concerns raised in the office automation literature and tosummarize the perspectives presented here on the most contentiousquestions: Will automation deskill white-collar work? Will officeautomation result in widespread technological redundancy? Willwomen workers bear the burden of the restructuring process?
In terms of the deskilling debate, I have argued that threekinds of processes seem to be raising skill requirements in the in-surance industry. First, the rapid automation and elimination ofmuch low-skilled workas computers assume responsibility for themost-structured functionsis making the occupational structureincreasingly top heavy. Conservatively, we can expect that duringthis col .-Ig decade roughly two-thirds of all new jobs in the indus-try will be nonclerical; over the next decade, net job gain should alloccur in nonclerical job categories (Baran, 1985:234-238). Second,the transfer of higher functions to less-skilled laboras decisionparameters are embedded within computer softwareis creatingnew categories of skilled clerks, biasing the clerical hierarchy up-ward as well. For just this reason, in fact, there is some evidence
71

58 THE INSURANCE INDUSTRY
that clerical skills are higher in mass-produced product lines whereclerks are able to assume greater responsibility for the entire pro-duction process than in specialty lines where they remain adjunctsto professional labor. Finally, especially within the context of inte-grated data bases, computer-mediated work seems to demand newskills of the clerical work force. In all these ways, therefore, whatwe are witnessing is a rolling process of deskilling and reskillingwhich, in aggregate, should increase the industry's demand forskilled labor. At the same time, however, as I suggested at lengthearlier, opportunities for occupational mobility may decline, thequality of work life may deteriorate, and salary scales may remainlow.
Turning to the question of job redundancy, an important cora-lary to this argument about skills, I have argued that clericaliob loss may indeed reach serious proportions over the next twodecades.
In the last 10 years women have moved rapidly into profes-sional, technical, and managerial occupations. However, since ap-proximately 70 percent of the almost 1 million female employees inthe insurance industry are clericals, the predicted drop in clericaljobs would have important implications for employment opportu-nities for women. Assuming that women gain even 50 percent ofall new nonclerical jobs and continue to constitute 94 percent ofall clerical employment gained or lost, under conditions of moder-ate declines in clerical employment women will gain slightly lessthan half of all new jobs created in the industry over the next twodecades; in contrast, between 1970 and 1980, women gained closerto 88 percent of all new jobs. If the decline in clerical employmentis more substantialas two of the studies cited predict (Leontiefand Duchin, 1986; Roessner et al., 1985)female employment inthe industry would actually fall by 10 percent or more, unless, ofcourse, women claim a much larger share of nonclerical employ-ment (Baran, 1985:238-239).
While women are moving up the occupational hierarchy insignificant numbers, at the same time women at the bottom maybe losing their jobs. In this sense, the effects of automation onthe female work force will vary importantly by class and race. Forminority clericals and less-educated white women, especially inthe central cities, the threat of redundancy is serious. For skilledclerks, particularly in suburbs and small towns, there will prob-ably be jobs but not opportunities, unless new kinds of training

BARBARA BARAN 59
programs are developed. For college-educated women, there maybe new opportunities but there is also the danger, discussed ear-lier, that numbers of professional, technical, and lower managerialpositions may resegregate females and be implicitly or explicitlyreclassified downward as a result.
The truth is that in a real sense the future is both uncer-tain and open-ended. Ultimately the question of whether the newtechnologies are used to create more good jobs than bad ones willdepend on decisions made by the leadership of the firm; thesedecisions will be nonetheless shaped in significant ways by publicpolicy. There is, for example, historical evidence that skill avail-abilities and shortages impact directly on job design (Levitan etal., 1981). Public programs that absorb the costs of trainingincluding both general education and the kind of ongoing retrain-ing that a period of rapid technological change requiresmake"working smarter" strategies both more attractive to companiesand, in fact, possible.
Policy will also play an important role in determining whichworkers bear the burden of the transition. Without a greater pub-lic emphasis on education and training, for example, it is likelythat many of the workers presently employed in gi lat numbers inthe insurance industry will not only be expelled, bui may also findthemselves unable to secure comparable work. Similarly, aggres-sive affirmative action policies might act as a countertendency tothe gender bias of job loss.
One of the greatest dangers of studies such as this, which at-tempt to analyze the impacts of technological change on the workforce, is their underlying assumption of technological determinism.In fact, the findings of these studies are ambiguous and indeter-minate not only because the processes we are analyzing are in astate of flux but, more important, because collectively we haveconsiderable control over the eventual outcome of these processes.Nevertheless, with these caveats firmly in mind, I think that it issafe to predict that we need to begin to prepare our work forceparticularly our female work forcefor a labor market in whichthere will be many fewer routine clerical jobs.

60 THE INSURANCE INDUSTRY
REFERENCES
Adler, Paul1983 Rethinking the Skill Requirements of the New Technologies. Work-
ing Paper. Boston: Harvard Business School.Appelbaum, Eileen
1984 The Impact of Technology on Skill Requirements and OccupationalStructure in the Insurance Industry, 1960-1990. Unpublished pa-per. Temple University, Philadelphia.
Baran, Barbara1985 Technological Innovation and Deregulation: The Transformation
of the Labor Process in the Insurance Industry. Final Report forthe U.S. Congress Office of Technology Assessment under ContractNo. 433-3610.0. University of California, Berkeley.
Beet's Review1979 Insurance office locations in the 1980s. Beet's Review (August):62
63.Braverman, Harry
1974 Z....bor and Monopoly Capital. New York: Monthly Review Press.Bright, :ames R.
1958 Does automation raise skill requirements? Harvard Business Review(July August ):85 -98.
Bureau of Labor Statistics, U.S. Department of Labor1965 Impact of Office Automation on the Insurance Industry. Bulletin 1468.1969 Tomorrow'. Manpower Needs. Vol. II. National Mends and Outlook:
Industry Employment and Occupational Structure. Bulletin 1606.1978 Occupational Employment Survey: Insurance. Unpublished data.1981a Occupational Employment Survey: Insurance. Unpublished data.1981b The National Industry-Occupation Employment Matrix, 1970, 1978, and
Projected 1990. Bulletin 2086, Vols. I and II.1983 Employment and Earnings 30(January).
Cummings, Laird1977 The Rationalization and Automation of Clerical Work. Unpub-
lished Master's thesis. Brooklyn College, New York.DeKadt, Maarten
1979 Insurance: a clerical work factory. Pp. 242-256 in Andrew Zim-balist, ed., Case Studies in the Labor Process. New York: MonthlyReview Press.
Drennan, Matthew P.1983 Implications of Computer and Communications Technology for Lees Skilled
Service Employment Opportunities. Final Report to the U.S. Depart-ment of Labor under Grant No. USDL 21-36-80-31. New York:Columbia University.
Driscoll, James W.1980 Office Automation: The Dynamics of a Technological Boondoggle.
Presented at the International Office Automation Symposium,Stanford University.
1979 People and the automated office. Defamation (November):106-112.Faunce, Waliam, Einar Hardin, and Eugene H. Jacobson
1962 Automation and the employee. Annals of the American Academy ofPolitical and Social Science (340):60-68.
I-1 4

BARBARA BARAN 61
Feldberg, Roslyn, and Evelyn Nakano Glenn1983 Technology and work degradation: effects of automation on women
clerical workers. Chap. 4 in J. Rothschild, ed., Machina Ez Dea:Feminist Perspectives on Technology. Elmsford, N.Y.: Pergamon.
1977 Degraded and deskilled: the proletarianization of clerical work.Social Problems 25:52-64.
Greenbaum, Joan M.1979 In the Name of Efficiency. Philadelphia: Temple University Press.
Hoos, Ida1961 Automation in the Office. Washington, D.C.: Public Affairs Press.
Hunt, H. Allan, and Timothy L. Hunt1985 An assessment of data sources to study the employment effects
of technological change. Pp. 1-116 in Technology and EmploymentEffects. Interim Report of the Panel on Technology and Women'sEmployment, Committee on Women's Employment and RelatedSocial Issues, National Research Council. Washington, D.C.: Na-tional Academy Press.
Kroll, Cynthia1984 Employment Growth and Office Space Along the 680 Corridor:
Booming Supply and Potential Demand in a Suburban Area.Working Paper 84-75, Center for Real Estate and Urban Eco-nomics. Berkeley: University of California.
Leontief, Wassily, and Faye Duchin1986 The Future Impact of Automation on Workers. New York: Oxford
University Press.Levitan, Sar, Garth L. Mangum, and Ray Marshall
1981 Human Resources and Labor Markets: Employment and 71-aining in theAmerican Economy. New York: Harper and Row.
Life Office Management Association1979 Word Processing Survey. Atlanta, Ga.: Life Office Management
Association.Matteis, Richard J.
1979 The new back office focuses on customer service. Harvard BusinessReview 57(March-April):146-159.
Murphree, Mary1982 Impact of Office Automation on Secretaries and Word Processing
Operators. Presented at the International Conference on OfficeWork and New Technology, Boston.
Nelson, Kristin1982 Labor Supply Characteristics and 'lends in the Location of Rou-
tine Offices in the San Francisco Bay Area. Paper presented at the78th annual meeting of the Association of American Geographers,San Antonio, Tex.
9 to 5, National Association of Working Women1984 The 9-to-5 National Survey on Women and Stress. Cleveland, Ohio:
National Association of Working Woman.Nussbaum, Karen, and Judith Gregory
1980 Rase Against Time: Automation of the Office. Cleveland, Ohio:Working Women's Education Fund.
Oppenheimer, Valerie1968 The sex labeling of jobs. Industrial Relations 7(3):219-234.
7. 3

62 THE INSURANCE INDUSTRY
Phister, Montgomery, Jr.1979 Data Processing Technology and Economics. Santa Monica, Calif.:
Santa Monica Publishing Company.Roessner, J. David, Robert M. Mason, Alan L. Porter, Frederick A. Rossini,A. Perry Schwarts, and Keith R.. Nelms.
1985 The Impact of Office Automation on Clerical Employment, 1985-2000:Forecasting Techniques and Plausible Iliturea in Banking and Insurance.Westport, Conn.: Quorum Books.
Ross, Jean1985 Technology and the Relocation of Employment in the Insurance
Industry. Unpublished master's thesis. Department of City andRegional Planning, University of California, Berkeley.
Shepherd, J.1971 Automation and Alienation: A Study of Office and Factory Workers.
Cambridge, Mass.: MIT Press.Sirbu, Marvin A.
1982 Understanding the Social and Economic Impacts of Office Au-tomation. Unpublished paper. Cambridge, Mass.: MassachusettsInstitute of Technology.
Storper, Michael1981 Toward a structural theory of industrial location. In J. Rees, G.
Hewing, and H.A. Stafford, eds., industrial Location and RegionalSystems. New York: J.F. Bergen Publishers, Inc.
U.S. Department of Labor1977 Dictionary of Occupational Mee, 4th edition.1981 Selected Characteristics of Occupations Defined in the Dictionary of Oc-
cupational Titles.U.S. Equal Employment Opportunity Commission
1980 Minorities and Women in Private industry.Zuboff, Shoshanah
1982 Problems of symbolic toil. Dissent 29(Winter):51-61.
7 6

"Machines Instead of Clerks" :
Technology and the Feminizationof Bookkeeping, 1910-1950
SHARON HARTMAN STROM
The nineteenth-century office was a world inhabited by men.Chief clerk, bookkeeper, copyists, and messenger boys supervisedthe office, kept financial records, produced documents, and trans-mitted information. In the 1870s and 1880s women were recruitedto use the telephone and the typewriter as the production of doc-uments and transmission of information were mechanized. But, tomost observers it seemed that financial matters and record keepingwere still where they belonged: in the secure grip of the male book-keeper. The bookkeeper, C. Wright Mills said (1951:191), "was atthe very center of the office world. He recorded all transactionsin the day book, the journal, the cashbook or the ledger; all thecurrent orders and memoranda were speared on his iron spike; onhis desk and in the squat iron safe . . . were all the papers . . .
which the office and its staff served."But the traditional bookkeeper was soon to lose his importance
and more often would be a woman and not a man. Women wereonly 5.7 percent of the bookkeepers, cashiers, and accountants in1880, but were 38.5 percent of them by 1910. Along with the risingnumber of women classified as stenographers, typists, and machineoperators (many of whom were doing some sort of bookkeeping),these women, newly classified as bookkeepers, caused the numberof females working in offices to triple between 1910 and 1920. By
63
77

64 THE FEMINIZATION OF BOOKKEEPING
1930 the Census showed that more than half of all the bookkeeperswere women. In 1940, the Women's Bureau of the U.S. Departmentof Labor (1942:2) found that women were 42 percent of the handbookkeepers and 82 percent of the bookkeeping machine operatorsin Philadelphia, a major center of office employment.
Why did women become bookkeepers and why was the femi-nization of bookkeeping linked to the mechanization of office work?This paper will argue that management initially sought womenworkers to use bookkeeping machines because they could pay themless and because they thought women would offer less resistanceto the deskilling of bookkeeping than salaried male workers fa-miliar with the traditional craft of posting books by hand. Yetthe extent to which bookkeeping could be deskilled and mecha-nized remained problematic. Workers continued to apply hiddenskills of judgment and to integrate a number of tasks, particularlyto jobs in the middle levels of bookkeeping, even though thesejobs required the use of machines. Work done by machine opera-tors had to be supervised, checked, and prepared for use by headbookkeepers and accountants. Some of the machine work was sta-tistical or inappropriate for "factory"-like regimens. Most of thiskind of work had never been performed by traditional bookkeep-ers. The increasing numbers of women holding these jobs beforeWorld War II were thus neither "unskilled" nor "deskilled," yettheir duties remained largely unarticulated in official job titles anddescriptions.
Workers responded to these changing conditions in the officein a number of somewhat contradictory ways. Some male officeworkers sought to protect their jobs from feminization. Postal andrailroad clerks, who had powerful craft unions at the turn of thecentury, were largely able to do this. Men might try to move intothe new profession of accounting, more clearly off limits to mostwomen. Some women tried to improve their status in the officehierarchy by moving up to more interesting and better-payingpositions. Some women and men joined together and began tounionize to resist the worst aspects of mechanization, speed-up,and deskilling. And some women began to agitate for new jobtitles and higher salaries because they recognized the "hiddenskills" they were using and because they perceived that maleclerks received more pay than women for the same work.
Before taking up these issues, however, it must be explainedwhy the changes in bookkeeping and accounting after 1910 had
73

SHARON HARTMAN STROM 65
such wide-reaching consequences for American office workers.Both the size of business and government and the number ofbookkeeping and paperwork functions they performed increased.The cost of producing these functions became a matter of con-cern as overhead costs rose and margins of profits declined in the1920s and as depression hit in the 1930s. New kinds of corpo-rations and agencies based on extensive financial record keepingappeared, such as department stores, public utilities, life insurancecompanies, savings and loan companies, the Internal Revenue Ser-vice, and the Social Security Administration. The technology ofthe fine machine tool and die industry made possible significantbreakthroughs in the mass production of office machines. At thesame time a vast supply of women workers suitable for office workwere available to employers when sufficiently educated male work-ers were in short supply. The typewriter and telephone had alreadyestablished a link between the mechanization and feminization ofthe office. Finally, there was an explosion in the volume of finan-cial record keeping after 1910 due to the widespread introductionof cost accounting. Corporate and government managers, underinternal pressure to produce more information in comprehensibleform, and under external pressure to make themselves publiclyaccountable, turned to new methods of accounting and office man-agement, which necessitated, from their point of view, both themechanization and feminization of traditional bookkeeping.
SCIENTIFIC MANAGEMENT, THE COST ACCOUNTINGREVOLUTION, AND THE ACCOUNTANT
Braverman (1974) and Davies (1982) have both noted that bythe turn of the century principles of "scientific management," firstdeveloped for use in industry by F AI. Taylor, were being appliedto office work. These principles included scientific observation ofwork (time and motion studies) to develop more efficient workpatterns, the subdivision of tasks, standardized forms and officefurniture, rewards for employees based on measured output (bonusplans), a pace of work which encouraged workers to work as fast aspossible without loss of efficiency, and close supervision of workersto prevent slow-downs, sabotage, and error. What is not as widelyknown is that the scientific managers also urged reconstruction ofnot only how the office worked but the kind of work it produced.Bookkeeping, accounting, and statistical analysis were intrinsic to
7 9

66 THE FEMINIZATION OF BOOKKEEPING
the new systems because they allowed corporate managers to gainreal control of their enormous organizations. The office, once sci-entific management and cost accounting had been introduced, wasfar more than a "paper-pushing" sideline to real production andin fact became the nerve center that kept everything functioningsmoothly (Galloway, 1921:ix):
When it is seen that the activities of production and distri-bution are made possible only through the operations covered bythe term 'office work," then we approach the truer appraisal ofthe office as a necessary economic factor. The office managers andemployees cease to be passive agents. . . . They at once rise tothe dignity of active forces which furnish constructive ideas, andco-ordinate the activities of the business into smoothly workingunits of enormous size and power.
The chief goal of the new management thinkers was to co-ordinate factory and office by first defining and then integratingsuch functions as purchasing, production, inventory control, pric-ing, and personnel management through a series of administrativeunits which did not exist before 1900. At the heart of thesechanges lay a new concept of bookkeeping which pinpointed theactual cost of components of production and distribution: labor,overhead, materials, energy, shipping, and the like. Nelson (1975)argues that "cost Accounting" thus demanded the breaking downinto smaller operations of jobs once performed by the bookkeeperand the foreman and a consequent reduction of their control overthe workplace.
At the same time federal and state government investigationsof railroads, life insurance firms, and public utilities were revealingthat the largest economic institutions in America had the shod-diest accounting procedures imaginable. A progressive reformerlike Louis Brandeis argued for standard cost accounting partlybecause he admired efficiency but also because agencies like theInterstate Commerce Commission or the New York State PublicService Commission needed better records to review rates chargedto a aumers (Brock, 1981). The term "scientific management"was coined after a meeting between Taylor and Brandeis duringthe Eastern Railroad Rates cases in 1910 (Merkle, 1980:59).
During World War I government contracts spurred the growthof both cost accounting in private industry and government ac-counting procedures, which were rapidly becoming more and more
59_I

SHARON HARTMAN STROM 67
sophisticated. A wave of municipal reform after 1910 modern-ized many town and city accounting systems. Widespread growthof department stores and retail chains necessitated mechanizedbilling procedures and inventory control. The corporate incometax and the Federal Reserve System forced banks and corporationsto audit their books more thoroughly and responsibly.
Chandler (1962) argues that cost accounting was institutedalso in response to a series of crises which faced the larger cor-porations after 1900, including overexpansion, e.ccess inventory,growing labor unrest, and a sharp drop in demand in 1921. New"strategies and structures" for meeting these crises led to the cre-ation of the multidivision form of corporate organization. At theheart of the multidivisional corporation lay a new level of exec-utive management, "company headquarters." Here the financialmanagers sought and manipulated the pieces of information whichallowed them to account for costs, manage inventory, analyze sales,gauge profits and losses, raise capital through sale of stock cr com-mercial loans, and, above all, plan for and predict the future. Incontrast to the old offices, which had often been located in or nearplants and whose executives roamed between factory and officewith ease, the new headquarters were geographically and psycho-logically separated from plants, and were often housed in toweringbuildings in the center of town.
At the center of the new style of financial management wasa relatively new professional: the accountant. By 1910 somestate universities, commercial business schools, and prestigiouseducational institutions like the Wharton School or the HarvardGraduate School of Business Administration offered accountingdegrees. The schools advertised that accountants were neededeverywhere (System, November, 1918:767):
Accountancy firms need them. Business concerns need them.The Federal Government needs them. Financial knots must beuncovered and untangled. Waste must be cut down and outputspeeded up. Operating plans must be worked out and operatingstafts organized and directed. Related branches of industry mustbe coordinated and made to function together. These and similarproblems which confront the Government and Organized Businessare squarely up to the accountantsthe bueness techniciansofthe country.
The emergence of cost accounting after 1910 did give the ac-countant new prestige. Unlike the bookkeeper, who kept track ofall financial transactions, or the auditor, who checked the books

68 THE FEMINIZATION OF BOOKKEEPING
over for mistakes or fraud, the accountant was now as importantto a large company's well-being as a vice-president or treasurer.Accountants purposely tried to emphasize the distinction betweenthemselves and bookkeepers. Accountants were to plan or manage,not to actually 'do the books" (Bennett, 1926). One managementexpert (McAdams, 1927, no. 26:2, in Office Management Series,1967) described cost accountants as "business doctors" who couldput a firm in the pink again by providing "budgets, methods, stan-dards, and measurement." The accounting division of StandardOil of New Jersey employed 51 people in 1912, but had doubledin size by the mid-1920s, even though auditors and comptrollershad been moved to a separate department (Gibb and Knowlton,1956). Nonetheless, an ongoing problem with affiliate divisions,which were served by 20 traveling auditors from the home of-fice, "made comparative cost studies virtually impossible. . . ."Standard Oil hired Price Waterhouse to prepare a comprehensiveaccounting manual for in-house use, which was completed in 1934.This new grip on the company's finances allowed Standard Oil toradically change its operating methods. A smaller and more pro-fessionally trained executive committee was installed at the newRockefeller Center along with 900 office employees to oversee thelarger picture, to divorce itself from the petty interests of individ-ual affiliates, and to "consider all questions from the standpointof the general interest of the company" (Larson, Knowlton, andPopp le, 1971:26-27).
Accounting seemed to be a man's world. By 1982 nearlytwo-thirds of those studying business in high school were women,but 84 percent of those majoring in business training courses incolleges and universities were men (Morse, 1932:24). Some womenwere trained as accountants before World War H but they weresometimes excluded from taking CPA exams, and certainly womenwere never seen as potential business executives.
The Census of 1930, however, reported more than 17,000women auditors and accountants. Education for accounting re-mained more accessible to the general population than for theother professions. This was partly true because bookkeepers lob-bied so effectively to keep an exam, not educational degrees, asthe chief requirement for certification. Anyone who could gainpermission to take and then pass a CPA exam could be certi-fied, and would-be accountants could go to night school or takecorrespondence courses from schools like Pace and Pace of New

SHARON HARTMAN STROM 69
York. While an advertisement (System, August, 1918:259) bythe Walton School in 1918 was clearly aimed at men, "Be aWalton-Trained Man," Pace in the same year (System, November,1918:767) claimed that "demand for trained accountants, bothmen and women, is increasing daily, hourly."
During the Great Depression the interests of enlightened busi-ness planners and progressive reformers came together in a body offederal legislation which continued to transform accounting proce-dures. The securities ac of 1933 - -id 1934 required all firms sellingstock to be independently audited and to publicly disclose theirfi ancial statements. The Federal Power Act of 1935 mandatednew systems of accounting for public utilities. FHA legislationspurred the growth of monthly installment home mortgages, andthe Federal Banking _...i. of 1935 brought far more banks intothe Federal Reserve System and its accounting methods for creditcontrol. The new social security, unemployment insurance, andincome tax legislation required all but the smallest employers toadopt new methods of financial record keeping for employees.
The amount of financial paperwork that changes in account-ing, ma: :;,:3ment, and regulation created was staggering, andwithout fundamental changes in the organization of the clericallabor force, its composition, and the machines it used, the changeswould not have teen possible.
OFFICE MACHINES AND THEIR HISTORY
Most of the technology required for the mechanization of book-keeping had been developed by the late nineteenth century in smallmachine tool and die shops near factories, in large manufacturingcities by engineers, and by businessmen inventors seek:Dg more ef-ficient office methods. William Patterson, a former railroad owner,built the first cash registers (adding machines on d' lwers) for usein his Dayton coal yard business in 1882, and later founded theNational Ctush Register Co. Joseph Burroughs, a former bankclerk from St. Louis, named his adding machine the Asneric,inArithometer, and sold a grand total of 1,435 machines between1895 and his untimely death in 1898. After renaming the fir:Burroughs, his successor sold rvarly 8,000 machines in 1905 andwas producing 100,000 calculating machines by 1930 (Coleman,1949; Morgan, 1953). Frank Baldwin's machines were adoptedby the accounting department of the Pennsylvania Railroad and
8 3

70 THE FEMINIZATION OF BOOKKEEPING
a leading life insurance company. A young college graduate andemployee of the Western Electric Company, Jay Monroe, helpedBaldwin develop a higher-speed machine and by the mid-1920sthe Monroe Calculating Co. had 165 branch offices in the UnitedStates (Morse, 1932:33-85).
Listing adding machines required two motions: punching thekeys and turning a crank. Any additional functions made thembulkier, heavier, and more difficult to use. While electrical addingand calculating machines became more common during the 1930s,the fancier machines were still very large, expensive, and mostlikely to be used by accountants or statisticians. Consumerswanted more lightweight and affordable machines. Heavy com-petition developed between companies to produce the most reli-able lightweight adding machine in the teens and early 1920s. In1899 there were 18 establishments making cash registers. calcu-lators, and tabulating machines valued at less than $6 million intotal, but b- 1919 65 firms made more than $83 million worth ofproducts (Bureau of the Census, U.S. Department of Commerce,1933:1120).
The comptometer, developed by Felt and Tarrant in Chicago,was often more popular than the calculator because it was key-driven, lightweight, and inexpensive; and once a special systemwas learned, it could be used to do subtraction, multiplication,and division. Its chief drawback was that it was non-listing; thatis, there was no printed tape which showed each item entered,only a window in which a running total appeared. Since the bulkof financial record keeping required simple addition, the comp-tometer was suitable to a wide variety of purposes. Some of thefirst machines were ordered by the U.S. Treasury Department andthe Equitable Gas Light and Fuel Company (Darby, 1968). TheComptometer Corporation developed training schools for opera-tors, and in 1930 placed an estimated 27,500 operators in officesin the United States and Canada (Morse, 1932:78).
Bookkeeping and billing machines, used to enter transactionsand to make up bills, invoices, and purchase orders, were sim-ple combinations of typewriters and adding machines. Remingtonmade an "adding and subtracting" typewriter in the teens, butboth typewriter and calculating machine firms made all kinds ofbookkeeping and billing machines after World War I. The produc-tivity of both bookkeeping and ,ILlicating machines was greatlyenhanced if used in conjunction with the addressograph, which
i 84

SHARON HARTMAN STROM 71
permitted the mechanical reproduction of alphabetized names andaddresses on mailings and statements.
Tabulating and keypunch machines became well known tothe general public because of their role in compiling the Censusof 1890. The principle was to mechanically keypunch individualpieces of data onto a small card and then use a mechanical sorter tocompile the cards into different categories. Although any numberof patents for such machines had been filed in the 1880s, HermanHollerith, an engineering graduate of Columbia University, was thefirst to receive assurances from the Bureau of the Census that hismachines would be used once produced. A variety of agencies andcorporations began to use the machines, including the SurgeonGeneral's office, the Baltimore Department of Health, and theNew York Central Railroad.
Most of the renown went to the compilation of vital statistics,but the cost-accounting possibilities of the new machines were alsosignificant. The New York Central could, after the installationof its Hollerith system (Austrian, 1982:125), "tell on a nearlycurrent basis how many hundreds of tons of freight were movingEast or West, which of hundreds of stations along its lines wereprofitable; where freight cars should be sent or returned; whichfreight agents were being paid. It would give the railroad a muchfirmer command of its far-flung business." By 1900 Hollerith wasat work on a standardized cost-accounting machine to be usedin conjunction with time tickets filled out on the factory floor. In1910 a renamed Russian immigrant, John Powers, was hired by theBureau of the Census to supervise production of the Bureau's owacensus machines. He developed a new keypunch machine whichmore closely resembled a typewriter keyboard and a method forprinting tabulated information onto rolls of paper. Hollerith'smachines eventually served as the basis of IBM's empire, andPowers' machine was picked up by Remington Rand.
By the 1930s office machines were more likely to be electrified.They required less operator strength and were far more automaticand productive. The International Labour Office reported in 1937(p. 495) that "an employee addressing envelopes by hand couldnot do more than 500 in a day's work; a hand-worked addressingmachine can print 1,000 addresses in an hour, and the number risesto 1,500 for machines worked by the foot, and 2,000 for those actu-ated by electric motors, or even 10,000 in the case of special workfor which the machine has been prepared." Considerable progress
8 5

72 THE FEMINIZATION OF BOOKKEEPING
had been made in combining office machines in fairly compactelectrified systems to perform more complicated functions. At the1934 office equipment manufacturers' show in New 10-k, IBMoffered a new check proofing machine for banks (Business Week,October 20, 1934:14):
The operator runs an adding mechanism with her right hand.Her left controls 24 sorting keys for alphabetical division, clearinghouse bans, and other classifications. After recording the amountof each check, she presses one of the 24 keys and drops the checkin a slot. The checks come out sorted in 24 bundles. A mastertape gives a complete listing with code designation opposite theamount.
Remington Rand offered a "central records control" system to de-partment stores, which combined the dial telephone, punch card,and tabulating and adding machines. In 1935 National Cash Reg-ister sold a machine that "would perform all the bookkeepingrequired under the new Federal Home Loan Act," and in 1936Burroughs and Monroe offered special payroll machines to accom-modate new social security legislation (Business Week, October24, 1936:16).
By the 1920s, a handful of large diversified office machinecompanies had been created by merger or acquisition and dom-inated the industry until the 1950s: Adressograph-Multigraph,Burroughs, National Cash Register, International Business Ma-chines, Remington Rand, and Underwood Elliott Fisher. Whileall firms showed a drastic decline in sales in 1931, by 1935 theindustry had regained its highs of the 1920s and saw record profitsin 1937 and 1938. The year 1941 was a banner one, and officemachine firms received handsome war contracts because of theirfine machine-tooling capacities. Many of them made war materi-als such as bomb sights and rifles as well as office machines. Thewar spurred demand for more diversified and sophisticated ma-chines as the size and complexity of institutions and their functionsgrew; most new developments in technology were commissionedand financed by the federal government. The government literallydevoured most office machines for its agencies and war-relatedindustries during the war (Fortune, August, 1944:127-132, andDecember, 1944:150 -154, 194-196).
Soma (1976) argues that all the technology needed to createthe digital computer was available by WWI, but that no one in

SHARON HARTMAN STROM 73
government saw the need to provide massive funding for its re-search and development until WWII. While his assumption thatgovernment capitalization of computer research was inevitable issomewhat perplexing, it points out how important government pa-tronage of the office machine industry was and continues to be. Wemight add that the growing size and complexity of both businessand government in the 1940s rade it inevitable that computerswould be used if produced. The development of office machinetechnology responded to demand for machines more than inven-tions influenced demand. As Mills (1951:193) argued, machineswere mass manufactured because they complemented the chang-ing social reorganization of the office: "Thus machines did notimpel the development, but rather the development demandedmachines, many of which were actually developed especially fortasks already socially created."
MECHANIZATION, FEMINIZATION, ANDSCIENTIFIC MANAGEMENT
Substantial numbers of women began to work in bookkeep-ing departments in the decade before WWI. Some had studiedin business schools, were hired with the title of bookkeeper, andheld jobs comparable to those of men. But most were specifi-cally hired to use office machines. Women and their machinessometimes replaced men. Edward Page (1906:7683), a dry goodsjobber, instituted the use of carbon forms, loose-leaf ledger sheets,a vertical file, a typewriter, and some computing machines in hisoffice at the turn of the century. Six male clerks were replaced byone billing clerk and a "girl who sits at a desk with a comptometerand an arithometer. She adds the yards on the comptometer andthen extends the bills on the arithometer, and does the work of sixmen with great ease."
In a scientific management text from 1914, one expert (Ban-ning) titled his chapter 'Machines instead of Clerks" and gavea number of examples of how women machine operators mightreplace male hand clerks. In the payroll department of one manu-facturer, it had taken six clerks two days to compute the payroll.Two women using calculating machines could do the same work inthe same time with fewer errors. Felt and Tarrant reported that aKansas City steel firm had eliminated the jobs of three men in theestimating department by installing a woman machine operator
8

74 THE FEMINIZATION OF BOOKKEEPING
(Jadden, 1914:85). One promoter of business machine products(Beach, 1905:8) reminded his readers that "girls" were perfectlycapable of using the new machines and could be "employed at acomparatively small compensation."
We do not know how many male clerks lost their jobs as womenmachine operators replaced them, but given the labor shortages ofthe teens and the explosion of clerical work tasks, it is more likelythat men were simply moved to other positions. Many womenmachine operators were being hired to fill new jobs created by theintroduction of machines to accomplish new tasks. Murolo (1982)found that the first woman to be hired by Aetna Life InsuranceCo. was a telephone operator in 1908, but she was joined by 35temporary female employees who came to work Hollerith machinesin 1911 for a study of mortality statistics. Three stayed on aspermanent employees but were asked to use the back elevators sothey would not be seen by the company president, who did notapprove of women working in the insurance business. Althoughthe number of women working at Aetna had grown to 150 by1916, they remained in sex-segregated typing, filing, and machine-operating departments until WWI.
The boom in business, finance, and trade during WWI, com-bined with a general labor shortage, meant that many of thosewho remained resistant to women clerks had to give in to themodernizers. One study found that the large increase in femaleclerks in Ohio between 1910 and 1920 was almost entirely due tohiring during the war (Rotello, 1977:210). F.W. Rowland (1933,no. 61:3, in Office Management Series, 1967) of the Lincoln Insur-ance Co. recalled that during WWI office managers " . . . werecalled upon to organize . . . a rapidly increasing volume of busi-ness with male members of our staff leaving for the service inever increasing numbers. We advanced junior clerks to positionsof responsibility and trained large groups of girls to perform du-ties formerly considered as strictly male jobs." At Aetna womennow worked in departments with men, and by 1922 44 percent ofthe home office was female (Murolo, 1982). The Women's Bureau(Erickson, 1934:16) found that the use of female bookkeeping ma-chine operators in banks became general practice during the war,and by its end women were "entrenched as bookkeeping machineoperators on customer accounts and other applications of listingand balancing."
88

SHAkON HARTMAN STROM 75
Office machine companies urged businesses to buy their ma-chines and avoid wartime labor supply problems by training wom-en to use them. They claimed their products were so easily op-erated that even those with no previous bookkeeping trainingmight be put to work. "Uncle Sam took my experienced clerks.In their place I have willing workers but INEXPERIENCED. SoI must have simple office machines . . . inexperienced operatorssoon become lightening fast on the 10-KEY DALTON." The samemachine promised to "substitute woman-power for manpower; . . .
with little practice a girl . . . does the figure work of three or moreexperienced men." Burroughs announced that "anyone who canread can post ledgers with a Burroughs Automatic Bookkeepingmachine," and by 1925 the pretty "Monroe girl" was routinelyused to advertise the company's adding machine in a way whichsuggested women were firmly entrenched at calculating machines:"The Monroe girl turns out more figure-work in a day's time,smoothly and pleasantly. Monroe simplicity and lightening speedkeep her work moving rapidly, without mental or physical effort.Any girl in your office can be a Monroe girl if you provide a MonroeAdding Calculator" (System, July and November, 1981:endpieces;January, 1925:79; September, 1925:316).
Banking, insurance, manufacturing firms, public utilities, andconsumer services all experienced expansion in the 1920s, but theyalso faced declining margins of profit. Mergers and acquisitionsincreased the size of economic institutions and while grumblingover the cost of clerical costs continued, it became obvious to ex-ecutives and office managers alike that the more complicated thebusiness, the larger the clerical staff it required. "Overhead," thebane of those who sought higher profits, grew dramatically duringthe 1920s as office staffs and departments mushroomed (Melman,1951). One way to keep costs down was to hire women; theycost substantially less, particularly if given job titles which didn'tconnect them to bookkeeping. One employer tersely informed theWomen's Bureau (Erickson, 1934:34) that he had hired women toreplace male ledger clerks because the same volume of businesscould be produced at "a lower unit cost. Women [were] paid lessthan men so cost (was] reduced." Another way to cut costs wasto apply scientific management principles. So likely were mecha-nization, feminization, and scientific management to be applied tooffice work together in the 1920s that we think of them as being
8 9

76 THE FEMINIZATION OF BOOKKEEPING
inherently linked, or even causing one another. We should keep inmind, however, that these are three separate processes.
Scientific management experts repeatedly argued there wasno reason why the office could not be a factory. Streamlinedand rationalized, the office assembly line might be as efficientas its manufacturing counterpart. There were important areas ofresistance to scientific management in the office; executives, super-visors, male clerks, and private secretaries resented measurementand rationalization of their j&-,s (Davies, 1982). But young womenwho had never worked before could be placed at machines, stop-watched, and encouraged to work even faster through bonus plansand as a condition of continued employment.
Bookkeeping, billing machine, and comptometer operationswere perfectly suitable to the drive system, including time andmotion studies, bonus plans, and assembly-line production. Man-agers had pretty much achieved the fine art of this labor process bythe 1920s and had put it to use extensively in department stores,utilities offices, insurance firms, and large banks. The Milwau-kee Electric Railway and Light Company reported in 1930 that ithad doubled its billing production by measuring tasks and usingwage incentives. "Each bill necessitates about 35 key and motorbar strokes which means that in addition to striking 116 keys perminute, the operator must insert and remove the bill, insert andremove proof sheets, turn meter records, obtain and return stacksof bills as well ss take personal time. The best operator averages4.5 bills per minute, about one bill every 13 seconds, 8 hours aday, 5.5 days a week." Six machine billers could produce 230,000bills a month, or an average 200 bills an hour each (Seybold, OMS#54, 1930).
Other applications of scientific management included central-izing departments and creating stenography, typing, and com-puting pools. In 1927 the Roxana Petroleum Co. moved all itstranscribing, filing, figure work, and recording personnel to onefloor, from which they served 15 departments. Roxana beganwith the computing machine operators, and then moved on tothe transcribers, wherein lay the "greatest resistance." By mea-suring work, using time charts, deducting errors from bonus pay-ments, and providing intense supervision, the clerical staff pro-duced nearly twice as much work with half as many people andsaved the company $32,000 in salaries (Jones, 1928).
9'J

SHARON HARTMAN STROM 77
While it is dangerous to conclude overwhelmingly that thefirst women office workers who used these machines enjoyed doingso, impressionistic evidence indicates that at least some did. G.M.,who went to work at the Rhode Island manufacturing firm Brownand Sharpe in 1913, used a comptometer in the cost-accountingsection. "The section I was in had to check requisitions, and thenadd them and get a total. Then you had to post them and checkyour total. And stamp your initials. If you made more than onemistake, you were called down. But I liked itto be able to doyour day's work and feel that you had done it good." Since shewas paid on a bonus plan she tried to work up to as much speedas possible. She recalled that it was important to keep your handon the lower part of the machine to save time, "so we seldom useda 9, or an 8, we'd just press 4 twice." She was so valuable anemployee she worked for 2 years after her marriage in 1916 andwas later sent by the comptometer people to several other firmsto teach the use of the machine for inventory and payroll systems(Rhode Island Working Women, 1981).
At Roxana Petroleum, managers claimed that the 50 percentof the women workers who survived centralization came to enjoythe new methods of work. By working together instead of forindividual bosses, the workers enjoyed a "spirit of teamwork andcompetition." The new system allowed "girls" with particularlystrong skills to shine because speed and accuracy were the basis ofrewards instead of "personality factors." Finally, they were doingthe work they had actually been hired to do, "where formerly theywere doing considerable office and errand boy work for membersof the staff" (Jones, 1928).
The depression offered many office managers incentives to fur-ther mechanize and rationalize their offices. Certainly feminizationalso continued, but the desperate need of men for employment mayhave mitigated this trend somewhat. Managers did admit that thehigh rates of unemployment between 1931 and 1933 had allowedthem to permanently eliminate older male salaried workers andreplace them with younger ones, many of whom were female.Business Week reported in 1936 (May 16:18-20) that the highestnumber of jobs available were for bookkeeper-stenographers andbusiness machine operators, and that for every 13 women seekingwork there were nearly 30 men.
While many marginal firms either went out of business or wereforced to rely on improperly trained bookkeepers and antiquated
91

78 THE FEMINIZATION OF BOOKKEEPING
machinery, larger and more stable ones probably modernized theirbookkeeping systems for the first time. The Pierce School ofBusiness Administration found that 14 of 59 financial companiesthey surveyed in 1931 had begun to take additional steps to cutoffice costs, including time and motion studies and the "use of newoffice equipment, such as dictaphones and bookkeeping and billingmachines" (Monthly Labor Review, October, 1931:1058). A similarsurvey of 300 companies employing 35,000 office employees in 1936showed "a pronounced increase in the use of plans for measurementof production and wage incentives during the depression" (Stivers,1936, no.76:6 in Office Management Series, 1967). Complaintsabout both mechanization and speed-up were a common themein office worker union literature of the period (Pell, 1937; Strom,1985).
WOMEN OFFICE WORKERS:HOW MANY IN WHAT JOBS?
It is difficult to learn very much about the sexual divisionof labor in financial record keeping from the published censusfigures. The census figures show a steady increase in the pro-portions of women bookkeepers and business machine operatorsafter 1910. But they also seem to show that women did not enterfinancial record keeping as rapidly as they did typing and stenog-raphy. Careful analysis of the subjective criteria used to identifyand classify the clerical occupations in the census, the data them-selves, and other information regarding job classification leadsus to two somewhat different but not contradictory conclusions;women were underreported in financial record keeping jobs, andmen continued to work in bookkeeping long after they left otherclerical occupations. The entry of women into bookkeeping, incontrast to some other kinds of jobs, did not initially seem to leadto total feminization.
In all likelihood more women were performing accounting,auditing, and bookkeeping functions than indicated by the censusrecords. First, as Conk (1978:78) notes, "census statisticians couldnot analyze, except in a very general way, the changes going oninside the factories, offices, shops and corporations where peoplewere occupied." Occupations held by women, immigrants, andminorities in general received very little scrutiny and were far morelikely to be listed as large aggregate? than were occupations held by
9,?

SHARON HARTMAN STROM 79
white native-born men. In the years when the clerical occupationswere changing more rapidly than occupations in other sectors,most of the attention of the census takers went to differentiatingthe trades, manufacturing jobs, and the professions.
Second, the methods actually used by the Census Bureau mayhave distorted the data, especially for women and blacks. Ed-wards, director of the Census Bureau from 1910 to 1940, routinelyinstructed census clerks to reclassify individuals who did not fitinto preconceived categories and to "make use of supplemental in-formation on the census form" to change the respondent's originaldesignation of her or his occupation. Conk (1978:144) concludesthat
there are serious questions about the extent to which Edwardsand the census classifiers relocated women, blacks, and youngworkers from one occupation to another became such occupationswere 'very unusual' for these groups.... If there were, for example,blacks and women in skilled trades or high status occupations, thecensus data would tend to obscure them.
Third, since published census figures did not differentiateaccountants and auditors nor move them into the professionalcategory until 1950, and since most of the professional white-collar workers were men, even the actual census data showed thatwomen made up a larger percentage of bookkeepers than the earlierprinted aggregate categories had implied (see the disaggregationof accountants and bookkeepers in Table 1).
Fourth, it also seems likely that many women who used book-keeping and billing machines were listed as typists or secretariessince their machines incorporated typewriter mechanisms. Butthey were likely to be working in bookkeeping, purchasing, billing,sales, or accounts receivable departments, and were part. of thebookkeeping process. While machine operatc,,s were placed in aseparate category of clerical work in 1930, the relatively small to-tal of them compared to workers in other categories suggests thatonly those strictly designated as "machine operators" by employerswere w listed. It is also possible that some workers preferred to bethought of as clerks instead of machine operators and so reportedthemselves as clerks to the census takers. Nearly all bookkeepers,stenographers, and typists used machines but were not generallylisted as machine operators.
Finally, there is the rapidly and suspiciously growing categoryof "clerical and kindred workers not elsewhere classified." As the
J

80 THE FEMINIZATION OF BOOKKEEPING
TA B''E 1 Numbers of Employees for Selected Clerical and Office WorkProfessions, 1900-1950 (in thousands)
Occupi.tionand Sec 1900 1910 1920 1930 1940 1950
Accountants/auditors 22.9 39.2 118.5 191.6 238.0 390.4Male 21.5 36.7 105.1 174.6 218.3 332.6Female 1.4 3.6 13.4 17.0 19.7 57.8
Bookkeepers/cashiers 232.0 446.8 615.5 738.2 771.1 993.5Male 159.2 263.3 269.8 272.5 2 18.4 217.5Female 72.7 183.6 345.7 465.7 472.8 776.0
Stenographers/typists 134.0 387.0 786.0 1,097.0 1,223.2 1,660.7Male 38.0 86.0 80.0 66.0 81.3 92.4Female 96.0 311.0 706.0 1,031.0 1,141.8 1,568.3
Office machineoperators n.a. n.a. n.a. 38.1 66.1 149.6
Male n.a. n.a. n.a. 5.4 9.3 26.3Female n.a. n.a. n.a. 32.7 56.8 123.3
Clerical and kindred,not elselereclassified- 234.7 654.3 1,323.3 1,680.5 2,026.1 3,177.5
Male 223.8 578.5 990.0 1,260.7 1,289.9 1,628.1Female 10.9 75.8 332.4 419.9 736.1 1,545.4
For 1900-1920 includes office machine operator,, dispata a, banktellers, shipping and receiving clerks, and clerical and kindred workers.For 1930 includes all of the above except office machine operators. For 1940and 1950 includes all of the above except office machina operators andshipping and receiving clerks.
SOURCE: Kap n and Casey (1958).
data in Table 1 indicate, women began as about 4 percent of allthese workers in 1900 but were nearly 50 percent of them by 1950,and by 1950 so many women clerical workers were in this catch-allcategory they nearly equaled stenographers and typists. Whatjobs they did in the office often remained unclear, although theymust often have been using office machines other than typewriters.A survey of large offices in 1930-31 by the Womer's Bureau ledErickson to conclude (1934:5):
In today's offices with fifty or more clerical workers the book-keeping and letter writing activities frequently are overshadowedin the number employed by those engaged on the details of han-dling advertising, sales campaigns, market and credit analyses andcollections, involved statistical and financial reports of costs, and avariety of other recording activities. The extent of these new office

SHARON HARTMAN STROM 81
activities and the policies and practices naturally vary markedlyand are quite unstandardised, so it is only to be expected thatjob terminology for occupations is indefinite and not comparablefrom office to office. The duties of secretaries, typists, and machineoperators vary considerably, and wl en an attempt is made to clas-sify the work of most of the other office employees for analysis thevariations seem to be legion.
The institution of personnel offices in many large businessesin the late teens and early 1920s made job classification and de-scription an issue in the private sector as well as the public. Officemanagement magazines began to print growing numbers of articleson the "science" of job classification in the 1920s. Most of theseclassifications placed clerical workers using machines throughoutthe spectrum of "unskilled" and "skilled" jobs. Inexperiencedmachine operators (usually bookkeeping, billing, and keypunchworkers) fell at the bottom of the hierarchy, while steno ma-chine operators, stenographers, comptometrists, and typists werein the middle. Bookkeepers, cost clerks, statisticians, and somesecretaries and stenographers ranked near the top, just b neathmanagers and executives. A Women's Bureau survey of oiiices inmajor cities in 1930 (Erickson, 1934) showed that women were em-ployed in all of these occupations and were as likely to be machineoperators or general clerks as they were stenographers and typists(see Table 2).
Although the job titles used in business and listed in the Dic-tionary of Occupational Tidal (U.S. Department of Labor, 1939)were more accurate and more narrowly defined than those listedin the Census, these job classifications, like those of the CensusBureau, suffered from ambiguity and sex-stereotyping. Most officeworkers used machines, yet some were "operatives," some were"clerks," and some were "bookkeepers." Most of these workerswere women. The tendency to assign women to certain job cate-gories and not to others lent the manual and nonmanual dichotomy
1 The Dictionary of Occupational Titles, developed by the United StatesEmployment Service and first published in 1939, listed hundvds of clericaloccupations, many of them requiring use of the business machines that hadbeen developed since 1890. These occupation titles and definitions were basedon observation of workers in their places of employment and augmented byinformation from 6,500 employers, trade associations, labor urOons, and civilservice commissions. Accountants and auditors were listed as *professionalsand managers"; the Cerrne did not move them to a separate category frombookkeepers until 1950.

TABLE 2 Percentage Distribution for Employment of Women in Offices in Seven Cities- a in 1930
Occupation
AllTypes gfOffices-(N = 42,844)
AdvertisingAgencies(N = 941)
Banks(N = 7,821)
InsuranceCompanies(N = 15,321)
InvestmentHouses(N = 2,870)
Mail -orderHouses-(N = 4,951)
PublicUtilities(N = 5,917)
General clerk 34.7 25.1 20.6 37.5 18.2 39.0 46.1Secretary 4.4 17.1 6.5 3.1 9.7 1.6 2.4Stenographer 14.4 17.5 18.0 14.1 22.4 7.2 13.5Typist 15.2 17.0 15.2 20.4 16.6 10.2 7.3Machine operator 12.3 4.7 23.0 8.6 11.1 11.8 12.5File clerk 6.0 3.7 6.8 7.2 7.7 5.2 3.2Supervisor 3.7 4.7 2.5 4.0 3.1 3.8 4.3Telephone operator 2.1 3.2 3.6 1.2 3.2 0.4 3.8Hand bookkeeper 2.3 4.7 0.6 1 0 6.5 2,0 3.1Cashier, teller 1.0 1.0 2.0 0.0 0.2 0.2 2.3Correspondence,
messenger, andmerchandisingclerk 3.2 0.4 0.9 0.8 0.3 18.3 1.3
Other- 0.6 1.0 0.5 0.8 1.0 0.2 0.2
Total2 99.9 100.1 100.2 100.1 100.0 99.9 100.0
New York, Hartford, Philadelphia, Atlanta, Chicago, Des Moines, St. Louis.bPublishing houses included in total but not listed as a column.
- Includes some chain stores.This small group comprises professional and semiprofessional women such Is personnel directors, underwriters, and the like.
-Numbers do not add to 100.0 because of errors in rounding.
SOURCE: Erickson (1934).

SHARON HARTMAN STROM 83
a kind of sexual character, which also reflected the job classifiers'and census takers' disinterest in the actual qualifications of andskills performed by women workers. So many women had the skillsand qualifications necessary for office work, and they were quiteearly on taken entirely for granted. Neither job titles nor payscales adequately reflected them.
Leffingwell revealed much of this unintentionally when he ar-gued in 1917(p. 125) that clerical jobs should be closed to working-class women because "to be a good stenographer . . . requires amuch higher grade of education than many of them possess. Thestenographer must be able not only to run a typewriter, but alsoto spell and use the English language better, as a rule, than heremployer. . . ." Conveniently for employers, these attitudes co-incided with an overwhelming tendency for women of all agesand classes to seek clerical work, partly because office work hadstatus and prestige, because other jobs were not open to women be-cause of discrimination, and because wages in office work remainedrelatively attractive compared to other kinds of employment forwomen, even though these wages were lower than those of mendoing comparable work.
STRATIFICATION IN THE OFFICE
MARITAL STATUS, CLASS, AND RACE AND ETHNICITY
Before WWII clerical workers were overwhelmingly young,and younger than women in other occupations. Most firms hadrules against hiring married women, and the Women's Bureausurvey of 1930 (Erickson, 1934) found more married women re-porting discrimination in office hiring than in any other line ofwork. During the 1920s larger numbers of women began to stayin clerical jobs after they were married. Coyle (1929) argued thatsome women had begun to hide their marriages from employers tokeep their jobs. Some management experts suggested that therewere no longer real barriers to married women working exceptcustom and tradition (Leffingwell, 1934, no. 62, in Office Man-agement Series, 1967), but there was considerable public pressurefrom legislators, the media, and the general public for both pub-lic and private employers not to hire married women during thedepression. Nonetheless, the number of married women clerical
9 7

84 THE FEMINIZATION OF BOOKKEEPING
workers increased, as did the number of married women work-ers in general. As late as 1941 three-fourths of all women officeworkers were single, but as the labor shortages of WWII began tobe felt, most managers dropped strictures against married womenwith little reluctance (Niles, 1944, no. 96, in Office ManagementSeries, 1967).
Jobs for women clericals between 1910 and 1930 were designedfor white women with some high school education. Certainly inthe early years the high school education requirement was alsointended to exclude working-class women and immigrants fromthe office. But inexpensive business schools began to offer businesstraining by the turn of the century, and working-class parentswho were able to send daughters to these schools were able toplace them in offices. While there were fewer foreign-born womenin clerical jobs than in other nonagricultural occupations, therewas a higher number of native-born white women with foreign-born parents. In 1910 these women were nearly 41 percent of allclerical workers; native-born women with native-born parents were52 percent. About 7 percent were foreign-born (Rote lla, 1971).Leffingwell complained in 1917 (p. 125) that the "profession"of stenography was already attracting the sort of women whodevalued the office atmosphere.
One trouble with the typewriting "profession" is that some ofthe mail order houses have so standardised the work that any girlwho can read can learn to type off form letters and do addressingand fill in work. This tempts many girls to enter the field, and aftera year or so .. . they consider themselves fit for higher position.
Despite Leffingwell's distaste for the policy, employers by the1920s were consciously seeking working-class women to use officemachines in departments which had been subjected to principlesof scientific management. The Curtis Publishing Co., a pioneerin such techniques, reported that it had recruited ledger clerksto use Elliott Fisher bookkeeping machines (Morgan, 1925, no.6:9-10, in Office Management Series, 1967): "We seek girls ofseventeen years minimum age, at least two year's high school orits equivalent. ... We prefer inexperienced girls and those who havesome economic incentive to work as we have found they make thesteadiest workers and we select from our recruits what we classifyas the semi-dependent applicant, that is, the girl who is partiallyor wholly dependent on her earnings for her livelihood." CheneyBrothers, a New England silk mill which had been one of the first
98

SHARON HARTMAN STROM 85
manufacturing firms to Taylorize, reported that it preferred torecruit women clerical workers from mill employees, and by 1923had "promoted" 72 percent of its office staff from "minor millpositions." Only 14 percent of the office staff were foreign-born,but nearly 64 percent were American-born of foreign parentage,and 20 percent came from southern or eastern European ethnicgroups (Lamb, 1926, no. 21, in Office Management Series, 1967).
More than half of Murolo's (1982) sample of women workingat Aetna Life Insurance Co. between 1924 and 1930 were daughtersof blue-collar men. Aetna's office management specialist, MarionA. Bills (1929, no. 44:17, in Office Management Series, 1967), saidthat it was easier to both hire and keep women office workers intowns with large numbers of manufacturing workers: "We studiedthe occupations of the fathers of all our people who were with us ata certain time, and also those who left us within five or six years.We found that if you rated these occupations from day laborersup to professional men, the chance of the person remaining withyou increases as the social standing of the fathers' occupationsdecreased."
Of the tiny percentage of minority women working in clericaljobs (about 0.7 percent of the total by 1930) nearly all worked inbusinesses owned by Afro-Americans. Jones (1985:179) found thatMontgomery Ward, a Chicago-based mail order house, was thelargest employer of Afro-American clerical workers in the UnitedStates, with 1,050 of them on the payroll in 1920. But a 1930survey of offices in Chicago and Atlanta found not a single inci-dence of white and black women working together in the sameoffice. Black women clericals were generally older, more likely tobe married, and received lower wages than other clerical workers(Erickson, 1934).
The growing incidence of high school education in the 1920s,along with vocational education in a business curriculum for mosthigh school girls, created unlimited supplies of trained white work-ers for offices until WWII (Davies, 1982; Rotella, 1977). Weiss(1978:73-75) found that as early as 1915 more students were be-ing educated in commercial courses in public high schools than inbusiness colleges, and that by 1924, 66 percent of those enrolled incommercial courses in high schools were women. Discriminationagainst women in other kinds of education and training programs,the refusal of many middle-class parents to invest in college educa-tions for daughters, a,:d the desire of many working-class parents

86 THE FEMINIZATION OF BOOKKEEPING
to get their daughters out of factories and into offices meant thatmost women had little alternative to office work. The economistPaul Douglas argued flatly in 1930 (p. 366) that the high schools"primarily served to recruit juveniles for clerical work." The im-portance of high school for nearly everyone cannot be underesti-mated, for it greatly expanded management's control in the in-dustrialized countries over both industrial and clerical workers;even partial high school education conveyed a set of basic skillsthat made many workers interchangeable. As Lockwood (1958:37)says, "universal public education meant that every literate personbecame a potential clerk."
While the employment of clerical workers continued to increasesteadily over the course of the twentieth century and to increasemore rapidly than employment of industrial workers, the numberof women and men seeking clerical employment increased at aneven greater rate (International Labour Office, 1937). As early as1928 there were three to five clericals seeking jobs for every oneavailable in New York State, a greater disparity than in any otheroccupation (Coyle, 1929:187).
The crisis of women looking for clerical work, which was al-ready serious before the depression began, became more acute by1933 as many middle-class women and men, who were trainedin the professions, sought clerical work because they were unableto find jobs as teachers, librarians, or editors. The competitionbecame even more acute as more married women were looking forwork. Many working-class women who could type or keep bookswere forced to work in manufacturing, restaurant work, or domes-tic service. Black women, who had always found that work inoffices and most factories was hard to get because of racial dis-crimination, now faced competition from white women for eventhe lowest-paying jobs. The New York Employment Service re-ported in 1934 that one out of three women applying for work wasa white-collar worker but only one out of eight got a white-collarjob (Pell, 1937:8). In Philadelphia office workers were the fourthlargest group of unemployed workers registered at the State Em-ployment Office in 1933, and through 1936 were "one of the mostnumerous classes on the rolls" (Women's Bureau, U.S. Departmentof Labor, 1942:6).
1 0 9

SHARON HARTMAN STROM 87
WAGES AND CLERICAL WORK
One of the most important consequences of the rising literacyof the work force and the feminization of the office was a steadylowering of clerical wages compared to those in manufacturing.Male clerks particularly lost ground. Douglas (1930:363-366),after taking the rise in the cost of living into account, found thatwhile all wage earners in manufacturing earned 29 percent higherwages in 1926 than they had in 1890, all salaried and clericalworkers earned only 3 percent more. Certainly women clerksearned far less than male workers in industry and substantiallyless than the average male wage earner. Until WWII, however,they were likely to earn more than women in manufacturing jobs.
In his study of the male-female earnings differential in clericalwork between 1880 and 1970, Niemi (1983) found that "maleearnings levels consistently exceeded female earnings levels." Asclerical occupations became more feminized the gap between men'sand women's salaries within clerical work narrowed from a range of25-45 percent in the early twentieth century to a 15 to 20 percentgap in the 1960s and 1970s. At the same time, clerical wages werefalling relative to nonclerical wages.
From a working-class or middle-class woman's (or her family's)point of view, the salaries paid for office jobs must have lookedgood, even with the stagnating wages of the 1920s and 1930s,and may partly explain why so many women were still lookingfor office jobs before WWII. Since some high school was nowcompulsory for everyone, a daughter could receive free businesstraining and move right into an office job, where she made higherwages than women in any other line of work except the professions.Moreover, if she could advance into the middle ranges of clericalworkstenographer, bookkeeper, statistical clerk, or supervisor,for exampleshe could earn more than most other working womenand even as much as some men (see Table 3).
As clerical wages increased somewhat during the 1940s, theseperceptions of women's clerical jobs continued, and with good rea-son. The Census of 1950 still showed that median yearly incomesfor women clerical workers put them closer to managers, propri-etors, and professionals of the same sex than any other occupation.And while female professionals, who needed to invest in expensivecollege educations to obtain jobs, made 65 percent as much asmen in a similar category, on average women in clerical positionsearned 71 percent as much as their male counterparts (Table 4).
191
1

88 THE FEMINIZATION OF BOOKKEEPING
TABLE 3 Average Annual Earnings of Clerical Employees WhoWorked 48 Weeks or More in 1939, by Occupation -- Philadelphia
Occupation Women Men
Special office workers $2,010 $2,704Rate clerks -- 2,280Secretaries 1,469 1,920Bookkeepers, hand 1,446 2,016Audit clerks 1,413 2,099Cashiers, tellers 1,412 2,231Bond, security, and draft clerks 1,404 1,716Clerks, n.e.c.,- public utilities 1,360 1,948Renewal clerks -- 1,926Statistical clerks 1,332 1,989Cost and production clerks -- 1,791Payroll clerk% timekeepers 1,227 1,561Clerks, n.e.c.,- finance and insurance 1,225 1,415Stenographers 1,223 1,463Accounting clerks 1,213 1,667Clerks, n.e.c.-, federal and state government 1,202 1,838Claims examiners, adjusters 1,190 1,931Billing machine operators 1,183 1,583Actuarial clerks 1,181 1,209Bookkeeping clerks 1,171 1,467Billing, statement, and collection clerks 1,169 1,701Bookkeeping machine operators 1,169 --Tabulating machine operators 1,161 1,552Calculating machine operators 1,151 1,508Dictating machine transcribers 1,147 --Order and shipping clerks 1,144 1,585Keypunch operators 1,106 --Telephone operators 1,095Receptionists 1,061 --Duplicating machine operators 1,060 1,290Typists 1,056 1,384File clerks 1,054 1,355Credit clerks 925 1,612
Shot elsewhere classified.
SOURCE: Women's Bureau (1942).
1 0

SHARON HARTMAN STROM 89
TABLE 4 Median Yearly Income for Non-Farm Workers Working 50-52Weeks/Year, 1949, by Occupation
Occupation Men Women
Ratio ofWomen's Incometo Men's Income(percent)
Professional and technical $4,030 $2,600 64.5Managers, officers, and proprietors 4,327 2,536 58.6Clerical and kindred 3,136 2,235 71.3Sales 3,270 1,632 49.9Craftsmen, foremen 3,378 2,265 67.1Operatives 2,924 1,920 65.7Laborers 2,366 1,900 80.3Service workers 2,405 1,137 47.3
SOURCE: Kaplan and Casey (1958).
THE LIMITS OF RATIONALIZATION ANDTHE ISSUE OF UPWARD MOBILITY
Not all the new jobs for women in clerical work were forstandardized use of business machines. A 1927 survey of the sexof workers managers preferred for certain jobs found that whilemen were strictly preferred for shipping clerks and timekeepers,and women for typists, stenographers, file clerks, and bookkeepingmachine operators, either men or women would be hired as ledger,payroll, and statistical clerks or as bookkeepers (Rotella, 1977:25).Women were also hired to supervise machine departments or stenopools.
Accounting and bookkeeping functions were still growing rap-idly. The number of workers with the job title of 'bookkeeper grewuntil 1930, and from 1930 to 1940 the number of bookkeepersdeclined only slightly while the number of machine operators andclerical workers not elsewhere classified increased. There werenearly 47,000 new jobs for accountants and auditors. New urgencywas given to more sophisticated methods of cost accounting forthe office because of the establishment of government regulationand the increasing need to justify prices and minimize taxes.
Scientific management planners initially wanted to create asex-segregated labor force in which male professionals and headbookkeepers received salaries and female machine operators were
iti3

90 THE FEMINIZATION OF BOOKKEEPING
paid on a piece-work basis. But the continuation, even growth,of large numbers of jobs in between these two groups, and thetemptation to fill them with women, who were always paid lessthan men, created a more complicated labor force. G.L. Harris,active in the American Management Association and the authorof a textbook on office work (1935:163), noted that "expert book-keepers are not so much in demand, but expert billing calculatorsare. There are more opportunities for young women in the depart-ments than there are for men, and such young women can advanceto responsible positions in the division." For many women thechance to work in bookkeeping departments represented not onlyslightly higher salaries but a chance to think of themselves as "ad-vancing" in clerical work and even holding positions comparableto those of men. It is als( important to keep in mind that whilestenographers and typists used machines that were distinctly sex-stereotyped, both men and women used adding and calculatingmachines. And since so many educated middle-class men andwomen were unemployed and forced to take low-paying clericaljobs throughout the 1930s, women and men held some of the samejobs.
Once women worked in jobs also held by men, they werelikely to gain some of the job privileges and self-esteem of men,if not comparable salaries. These privileges might include moreself-pacing, self-direction, and a wider variety of tasks to perform.The comptroller of Fraton and Knight (Wilson, 1934, no. 63:18,in Office Management Series, 1967) argued that bonus plans werereally only effective "when quantity is the predominanting factor"such as in transcribing, typing, ordering, and invoicing. For gen-eral accounting, sales, and cost estimating, however, "we find onlythe direct salary base is applicable." These employees "contributematerially to the financial success of the company . . ." and "it isevident that in this division quality of the work cannot be sacrificedto speed." Marion A. Bills of the Aetna Life Insurance Company(1929, no. 44:11, in Office Management Series, 1967) disagreed.We "find innumerable cases where people are still doing the sim-plest routine work . . . but whose salaries have grown by smallincreases so that they are paid two, three, and even four timeswhat . . . they are worth. For example, we have the much misusedterm of 'bookkeeper.' In different companies we find bookkeeperswho are simply posting clerks, a job which they could learn in afew weeks, and bookkeepers who need to be expert accountants."
1 0 ,.i

SHARON HARTMAN STROM 91
Yet her success at implementing these ideas beyond the all-femaledepartments at Aetna remained limited (Murolo, 1982).
Prior to 1928, women clerical workers at Roxana Petroleumwere scattered throughout various functional departments. Whenthe corporation announced plans for centralizing and rationalizingits typing, transcribing, and comptometer operations into onedivision, both male executives and female operatives were resistantto the change (Jones, 1928). The men were resistant because theywould no longer control the operations performed by the womenclericals, and the women clericals because "they seemed to thinktheir work might be more humdrum and difficult. They felt insome cases that they might not be able to measure up to thestandard and quality of work expected, that they might lose theirfreedom, that their chances for promotion would not be so good.. . ." These women workers, in other words, perceived that workingalongside men improved their chances of securing better positionsand working conditions.
Managers had intended women's office jobs to be held by"workers whose highest ambition will be realized when they areplaced on your payroll as clerical workersthe kind that can bedepended upon to perform faithfully routine tasks day in and dayout without thought of promotion" (Nichols, 1934, no. 65:26, inOffice Management Series, 1967). But many women did receivepromotions to better jobs, held more responsibility than their jobtitles indicated, and became ambitious far beyond the expecta-tions of managers. Everyone knew, however, that there was anunspoken law: advancement for women stopped short of the ex-ecutive's door. Men, whether qualified or not, had to be the topmanagers and executives, and the shock of that reality must some-times have disturbed women workers. One management specialist(Barnhardt, 1933, no. 61:18-19, in Office Management Series,1967) worried about this problem in 1933:
Some of my studies have revealed the extent to which firmsemploying women for doing certain kinds of clerical, especiallysecretarial work have used and promoted women so extensivelythat there is an absolute absence of men in the upper levels fromwhich promotions to junior executives can be made. We checkedthe private secretaries and assistants to executives in one company,and found that in eighteen cases, fourteen assistants to executiveswere women who, if the executive went out of the organization,could not be promoted. Indeed at the time of our study some ofthese women were already falling down on the job because they

92 THE FEMINIZATION OF BOOKKEEPING
were sure they would not be promoted and could not see whythey should work very hard any longer. In this firm some of thesesecretaries and assistants were college-trained women, high-gradewomen.
Both women who worked in low-paying machine operator jobsand women who had moved to more responsible positions re-mained problematic for employers. Employers complained as earlyas the 1920s about higher rates of absenteeism and job turnoverfor women than for men in office jobs. These rates reached epi-demic proportions in the banking industry by the late 1940s (Mc-Col loch, 1983). Other women expressed their dissatisfaction inways that sometimes perplexed employers. One industrial psy-chologist (Giberson, 1939, no. 87:27, in Office Management Series,1967) classified "wily females" with alcoholics, psychoneurotics,paranoids, and other social misfits of the office. Their "deviousnatures," she concluded, were partly attributable to the fact thatthey are temporary workers frustrated by the "all-consuming mat-ter of pay levels."
One question that arises here is when and how the issue ofjob classification began to emerge in management-labor conflict inthe office. As noted above, managers in government and privateindustry both had devised job-classification schemes to facilitatehiring, job placement, salary setting, and the justification of amultiply stratified labor system. But once jobs were classifiedand given job descriptions employees could also argue that theywere not being paid wages commensurate with their duties orthat they should be moved to a higher job classification. Thereis some evidence that women and minorities in the expandingclerical labor force of the federal government of the 1930s and1940s, with its aighly refined civil service classification system,were the first to use this as a tool to achieve upward mobility andto attack sex discrimination. When the Bureau of AgriculturalEconomics listed a new position "for men only," women workersprotested and the designation was changed to "male or female"(Federal Record, Jan. 20, 1940:6). In 1941 ledger account clerksin the Veterans Administration won what was claimed to be a20-year battle to upgrade their position to a higher grade because"they did work which required a broad knowledge of laws and legalopinion governing the accounts handled by their division." Thirty-one clerks, led by Mrs. Marvel Lockhart Ball, drafted their ownappeal to the Civil Service Commission. As their union newspaper
1 0.

SHARON HARTMAN STROM 93
explained, "the greatest significance of this decision is that it raisesquestions concerning similar type advances for thousands of clerksin the Government service who are doing a calibre of work farabove their rank" (Federal Record, November 7, 1941).
A flurry of such office workers' union activity between 1937and 1950 began to address the issues of job classification, possibili-ties of promotion, working conditions and deskilling, and adequatecompensation for men and women (Strom, 1983; McColloch, 1983;Strom, 1985). These unions were crushed by employers, govern-ment, and rival craft unions during the McCarthy period, and itwas not until the emergence of the civil rights movement in the1960s and the women's movement in the 1970s that the same issuesemerged as political and trade union causes. By then the sexualcomposition of o;:ice work had changed dramatically. With thecoming of WWII, men who had been willing to take office jobs dur-ing the 1930s had a growing variety of occupational choices, andcompetition for managers, accountants, and servicemen quicklydecimated many male staffs of bookkeeping departments. In thelong run the disappearance of men from the lower levels of clericalwork proved to be a positive development for managers becauseit saved so much money. Management expressed concern overthe shrinking pool of women clerical workers, but an immediatesolution was simply to open office jobs to married and a smallbut steadily growing number of minority women. The hiring ofminority and married women workers allowed office employersto continue their major objectives in the labor management cf.bookkeeping: to steadily cheapen wages through feminization, tomechanize and deskill traditional salaried jobs, and to raise theproductivity of office staffs by reducing the number of privilegedmales.
As the number of married womennow likely to be in jobsfor many years at a timeand the number of single middle-class college womenunable to enter the professions becauseof discriminationincreased, managers apparently imposed newforms of segmentation on the office in the 1950s. While male ex-ecutives and top-level managers were still there to oversee things,older women may have more and more been asked to superviseyoung women and middle-class white women placed in more pleas-ant jobs. Minority women may have more frequently been assignedto machine operators jobs. There is every reason to believe thatthis pattern of segmentation still largely exists. What obstacles it

94 THE FEMINIZATION OF BOOKKEEPING
presents to worker solidarity is something that warrants furtherinvestigation. But it should have come as no surprise that whenmore mass-based union movements appeared in the 1970s theyemphasized higher wages, upgraded and fuller job classifications,adequate working conditions for machine operators, an end tosex discrimination, and the important connections between all ofthese.
REFERENCES
Austrian, G.D.1982 Herman Hollerith: Forgotten Giant of Information Processing. New York:
Columbia University Press.Banning, K.
1914 Machines instead of clerks. Library of Office Management, 1. Chicagoand New York: A.W. Shaw Co.
Beach, E.H.1905 Tools of Business: An Encyclopedia of Office Equipment and Labor Saving
Devices. Detroit: Bookkeeper Publishing Co., Ltd.Bennett, G.
1926 Accounting Systems: Principles and Problems of Installation. Chicagoand New York: A.W. Shaw Co.
Braverman, H.1974 Labor and Monopoly Capital: The Degradation of Work in the Twentieth
Century. New York: Monthly Review Press.Brock, B.
1981 The Development of Public Utility Accounting in New York. EastLansing: Michigan State University.
Bureau of the Census, U.S. Department of Commerce1933 Census of Manufactures, 1929, Volume IL Washington, D.C.: U.S.
Department of Commerce.Chandler, A.D.
1962 Strategy and Structure: Chapters in the History of the Industrial Enterprise.Cambridge, Mass.: MIT Press.
Coleman, J.S.1949 The Business Machinewith Mention of William Seward Burroughs,
Josephy Boyer, and OthersSince 1880. Princeton, N.J.: NewcomenLecture, Princeton University Press.
Conk, M.A.1978 The United States Census and Labor Force Change, 1870-1940. Ann
Arbor, Mich.: UMI Research Press.Coyle, G.L.
1929 Women in the clerical occupations. Annals of the American Academyof Political and Social Science 143(May):180-187.
Darby, E.1968 It All Adds Up: The Growth of the Victor Comptometer Corporation.
Victor Comptometer Corporation.
1 0

SHARON HARTMAN STROM 95
Davies, M.W.1982 Woman'. Place Is at the 21ipewriter: Office Work and Office Workers,
1879 -1990. Philadelphia: Temple University Press.Douglas, P.H.
1930 Real Wages in the United States, 1890-1926. Cambridge, Mass.:Harvard University Press.
Erickson, E.1936 The employment of women in °tikes. Women's Bureau BullItin 120.
Washington, D.C.. U.S. Government Printing Office.Fawcett, W.
1927 Uncle San rates the efficiency of his office workers. Office Economist9(May):3-4, 13.
Galloway, L.1921 Office Management: Its Principles and Practice. Nev. Yo'k: Ronald
Press Co.Gibb, G.S., and E. Knowlton
1956 The History of the Standard Oil Company of New Jersey: The ResurgentYears, 1911-1927, Vol. 2. New York: Harper and Row.
Harris, G.L.1935 Business Offices: Opportunities and Methods of Operation. New York:
Harper and Bros.International Labour Office
1937 The use of machinery and its influence on conditions of work forstaff. International Labour Review 36(October):486 -516.
Jadden, W.B.1914 Keeping labor records by machinery. Library of Off .4 Managemen:.
Vol. 4. Chicago, New York and London: A.W. Shaw Co.Jones, J.
1985 Labor of Love, Labor of Sorrow: Black Women, Work, and the Familyfrom Slavery to the Present. New York: Basic Books, Inc.
Jones, W.F.1928 Centralization means economy. Office Economist (November):5 -G,
13.Kaplan, D.L., and M.C. Casey
1958 Occupational trends in the United States, 1900-1950. Bureau of theCensus Working Paper, 5.
Larson, H., E. Knowlton, and C. Popple1971 The History of the Standard Oil Company of New Jersey: New Horizons,
1 927-1 950, Vol. 3. New York: Harper and Row.Leffingwell, W.H.
1917 Scientific Office Management. Chicago and New York: A.W. ShawCo.
Lockwood, D.1958 The Blackcoated Worker: A Study in Class Consciousness. London:
George Allen and Unwin Ltd.McColloch, M.
1983 White Collar Workers in Ransition: The Hem Years, 1940-1 970.Westport, Conn.: Greenwood Press.

96 THE FEMINIZATION OF BOOKKEEPING
Melman, S.1951 The rise of administrative overhead in the manufacturing indus-
tries of the United States, 1899-1947. Orford Economic Papers3(February):62-112.
Merkle, J.A.1980 Management and Ideology: The Legacy of the International Scientific
Management Movement. Berkeley: University of California Press.Mills, C.W.
1951 White Collar: The American Middle Classes. New York: OxfordUniversity Press.
Morgan, B.1953 Total to Date: The Evolution of the Adding Machine. The Story of
Burroughs. London: Burroughs Adding Machine, Ltd.Morse, P.
1932 Business Machines: Their Practical Applications and Educational Require-ments. New York: Longmans, Green and Co.
Murolo, P.1982 White-Collar Women: The Feminization of the Aetna Life Insur-
ance Co., 1910-1930. Unpublished paper. History Department,Yale University.
Nelson, D.1975 Managers and Workers: Origins of the New Factory System in the United
States, 1880-1920. Madison: University of Wisconsin Press.Niemi, A.
1983 The male-female earnings differential: a historical overview of theclerical occupations from the 1880s to the 1970s. Social ScienceHistory 7(Winter):97-107.
Office Management Series1967 Office Management Series, 1924-1941. Originally published by the
American Management Association. New York: Kraus ReprintCorporation.
Page, E.D.1906 The new science of business: making an office efficient. World's
Work 12(June):7682-7684.Pell, 0.
1937 The Office WorkerLabor's Side of the Ledger. New York: League forIndustrial Democracy.
Previts, G.J., and B.D. Merino1979 A History of Accounting in America: An Hwtorical Integration of the
Cultural Significance of Accounting. New York: John Wiley St Sons.Rhode Island Working Women
1981 Oral History Project. Unpublished transcripts. Rhode IslandWorking Women, Providence.
Rotella, E.J.1977 Women's Labor Force Participation and the Growth of Clerical
Employment in the United States, 1870-1930. Unpublished Ph.D.dissertation. Department of Economics, University of Pennsylva-nia.
Soma, J.T.1976 The Computer Industry: An Economic-Legal Analysis of Its Technology
and Growth. Lexington, Mass.: Lexington Books, D.C. Heath.
li 9

SHARON HARTMAN STROM 97
Strom, S.H.1983 0-.allenging `woman's place": feminism, the left, and industrial
unionism in the 1930s. Feminist Studies (Summer)8:359-386.1985 "We're no Kitty Foy les": organizing office workers for the CIO.
Pp. 206-234 in Ruth Milkman, ed., Women, Work and Protest. NewYork: Rout ledge and Kegan Paul.
U.S. Department of Labor1939 Dictionary of Occupational Mee. Washington, D.C.: U.S. Govern-
ment Printing Office.Weiss, J.
1978 Educating for Clerical Work: A History of Commercial Educationin the United States since 1850. Ed.D. dissertation. HarvardGraduate School of Education.
Women's Bureau, U.S. Department of Labor1942 Office work and office workers in Philadelphia in 1940. Women's Bu-
reau Bulletin 188-5. Washington, D.C.: U.S. Government PrintingOffice.
1 11

New Technology and Office Tradition:The Not-So-Changing World
of the Secretary
MARY C. MURPHREE
THE NEW TECHNOLOGY AND THE SECRETARY
Electronic word and data processinga multibillion dollarbusiness made possible by the invention and mass production ofthe microchipis invading the American office. Few work envi-ronments are immune to the temptations of the fast, cheap, andeffective automated office equipment now available. Organizationsranging from Fortune 500 corporations, law and accounting firms,public agencies, hospitals, and universities to small businesses andprofessional partnerships are experimenting with data- and word-processing equipment on a scale scarcely imaginable 10 or even 5years ago (U.S. Congress, Office of Technology Assessment, 1985).
The emergence of the modern office a century ago, its techno-logical evolution to mid-century, and even its impact on women'semployment have been documented by historians (Baker, 1964;Davies, 1982; Oelrich, 1968; Lockwood, 1958). The current phaseof technological revolution, particularly its effects on Americanoffice workers, calls for further documentation.
This paper examines the impact of office technology on thesecretarial occupation. It analyzes how the current revolution in
98
11=

MARY C. MURPHREE 99
office organization intersects with changes in secretarial attitudesand demographics and with an office culture traditionally based ongender. It argues that the persistence of patrimonial authority insecretary-boss relations, combined with new staffing ratios (wheneach secretary is assigned to work for more and more bosses),determineto a far greater extent than technology itselfthework life of the word-processing secretary.
History teaches us that technological changewhether in theform of the steam engine, electricity, or the automobileneveroccurs in a vacuum and that its effects on social organizationcannot be understood as random or idiosyncratic events. Nor areits costs and benefits shared equally by all members of society.Rather, much of industrial history depends on the interactionof technology with prevailing social, demographic, and politicalconditions in a particular era. The introduction of word and dataprocessing into the office of the 1980s, and its impact on thesecretary, is no exception.
Although there is no one way to define the word "secretary,"particularly in this period of transition or "shakeout," I use adefinition that relates both to the social characteristics of the job(e.g., the authority or superior-subordinate structure) and to thetasks characteristic of the job (e.g., the division of labor). My fo-cus will be entirely on what I call the "word-processing secretary."This is a clerical person working on a decentralized microcom-puter or terminal who is formally assigned as support staff to oneor more principals, with whom she is in daily personal contactand for whom she performs some combination of clerical tasks(e.g., text and data entry, editing, filing, copying, or stenography)and administrative or managerial services (e.g., gatekeeping, co-ordinating, planning, letter drafting). Such a secretary is distinctfrom a word-processing operator who works at a video display ter-minal (VDT) in a large, centralized facility and who is exclusivelycharged with word and data production.'
1 Currently, there are no data indicating how many word-processingsecretaries versus word-processing operators there are in the United States,nor how many workers use particular types of word-processing equipment.Such distinctions should be made in future data-collection efforts. Companieswith word-processing centers continue to employ large numbers of secretarieswho work in decentralized settings. An increasing number of companies aremoving to decentralize their clerical operations entirely.
1 1 '3

100 NEW TECHNOLOGY AND OFFICE TRADITION
The secretarial occupation is the largest and most catholic ofwomen's occupations, employing some 4 million women. Secre-taries are widely distributed among industries, professions, andthroughout government, in offices of every size, and in townsand metropolitan areas across the United States. Recently, theoccupation has experienced tremendous growth, although it hasnot ridded itself of its traditional sex-stereotyping. Since 1950,secretarial-typist employment has more than tripled. The compo-sition of the secretarial labor force has also changed. Since the1970s, the number of minority women has increased dramatically;between 1970 and 1980 the number of black women secretariesincreased 148 percent, while the number of secretaries of Spanishorigin increased 131 percent (U.S. Department of Labor, 19841985). And, like the female labor force in general, there are moreworking mothers, more moti ers with preschool children, more sin-gle heads of households, and more women who plan to be a partof the paid labor force on a sustained baths.
The secretary's relationship to technology, on which this paperfocuses, has also changed significantly. The secretary now interactswith sophisticated, computer-based office systems and electronictypewriters as well as with the familiar telephone, copy machine,and dictaphone.2
A wave of publicity heralded the introduction of these sys-tems and may have contributed to raising the expectations ofmany secretaries. Employers, eager to sell their support staffs onthe new equipment, have repeated vendor and media claims andwaxed enthusiastic about the benefits that office automation offers
2 Innovations and improvements in office technologies have essentiallybeen incremental since the 1870s (see Strom, this volume). Model aftermodel of typewriters, calculators, dictaphones, telephones, and duplica-tors have been designed with an end to making them more efficient, lesscostly, and more marketable. For example, the original beeswax and paraffin'Graphaphon? dictating machine, powered by a sewing machine treadle,was replaced at the turn of the century by a solid wax recording mediumwith a shaver making it erasable. This in turn was made obsolete by anelectronic desk model that appeared in 1936, and that, by World War II,was equipped with a flexible Dictabelt and transistors. Finally, by the 1970sthe dictating and transcribing units had been combined into a single smallunit; small magnetic cassette tapes were available, and remote doff premise?telephone transmission was developed. Similarly, improvements in carbonpaper streamlined early duplicating tasks alongside mimeograph machinesand stencils, which went through dosens of design innovations until the entireduplicating market gave way to the photocopying process.

MARY C. MURPHREE 101
secretaries. Employment agencies and secretarial schoolseagerto supply their clients with willing and trainable personnelhaveurged secretaries and prospective secretaries to acquire the newskills quickly so that they too can reap the benefits awaiting themin the electronic office. Many secretaries interpret this enthusiasmand encouragement to mean that all office work has become "hightech" and expect that they will be given a chance to do challengingwork, sharpen their skills, earn better pay, and move up in theirorganizations. Preliminary evidence indicates, however, that thereis a serious disjuncture between what secretaries have been led toexpect from the automated office and what many feel they areactually getting. Particularly at risk in this scenario are minorityand older women.
Understanding the effects of office automation on secretariesis difficult for several reasons. First, it is not clear whether sup-ply, declining cost, and marketing of new office technologies aredriving the push toward office reorganization or whether factorssuch as increasing labor costs, a shortage of skilled and willingwomen clericals, and management fears of clerical unionization arestimulating the demand for office automation (Murphree, 19R4b).Second, as pointed out above, the term "secretary" has no t, ner-ally accepted meaning, but rather is a catch-all word for a personperforming a variety of clerical, administrative, and personal tasks(Watstein, 1985). The term "office," moreover, is just as ambigu-ous and encompasses myriad shapes and forms. There are largeoffices and small ones, headquarters and branches, public-sectorsites and private-sector sites. An office can also have differentoccupational or industrial cultures: it can be a professional office(e.g., the doctor's office) or a sales office tied to a particular in-dustry (the brokerage office). The information process itself canalso take a multitude of forms. For example, hardware and soft-ware systems can vary according to how "multifunctional" theyare (i.e., the number of tasks they are capable of performing).Systems can also be more or less interactive. They range fromhighly integrated, advanced information systems to stand-alonemicro and personal computers. They may also vary in the extentto which they are "networked" to each other or a larger computer(Spinrad, 1982). Research also indicates that diffusion of the newtechnology is occurring at a fast but by no means uniform pace(Kelly Services, 1982).
11"- .._)

102 NEW TECHNOLOGY AND OFFICE TRADITION
Until very recently, most discussions have focused on thegeneral "goodness" or "badness" of word processing (Murphree,1984a). Vendors and their partisans extolled its promiseto lib-erate secretaries and turn them into high-tech managerswhilecritics feared it would reduce secretaries to robots or extensionsof machines, if not eliminate them altogether. These simplisticideas are being discarded as a growing corpus of research on officeautomation illuminates its complexities. Experts have now begunto distinguish among different kinds of word-processing arrange-ments and stress the differential effects these arrangements haveupon clericals (Pomfrett et al., 1984; Feldberg and Glenn, 1983).At the crudest level a contrast is drawn between word processingthat is centralized in pools, on the one hand, and that which isdecentralized to satellite stations, on the other (Johnson et al,1985; Iacono and Kling, 1984; Murphree, 1984a; Werneke, 1984;Menzies, 1981). In the former, an organization's word-processingfunctions are all located in a single work site or word-processingcenter. In decentralized word processing, satellite units are dis-tributed throughout the organization. Inherent in this distinctionis a focus on the difference between word-processing "operators,"who perform VDT work at the centers under the supervision of amanager, and the word-processing secretaries who concern us here,i.e., secretaries working at satellite VDT terminals in face-to-facerelations with principals or bosses to whom they are assigned.
Some research examines the sequential phases of the inte-gration process (Giuliano, 1982; Gery, 1982) and the effect ofoffice automation on different occupational groups (Kanter, 1983;Bjorn-Andersen, 1983). Westin et al. (1985), for example, focus oncustomer service representatives, data-entry clerks, and clerical-secretarial employees. Bikson and Gutek (1983) analyze the vari-ety of activities and complexities of the tasks performed by dif-ferent white-collar work groups (including secretaries) who sharean information-handling function. Johnson et al. (1985) refinethe centralized-decentralized theme by discussing different formsof integration of information processing into organizations andtheir consequences for organizations. The ergonomic arrangementof different settings has also received attenti^n in the literature.Filially, researchers have attempted to evaluce the success andproblems encountered in the use of different staffing arrangementswith word-processing equipment (Pomfrett et al., 1984)
This paper develops a focus omitted by other analysts, namely,
116

MARY C. MURPHREE 103
the strong gender-based authority relations and patrimonial orga-nization through which word-processing secretaries are linked totheir superiors, and by which, traditionally, the nature of theirtasks, prestige, wage levels, opportunities for mobility, and, hence,job satisfaction have been determined. 4
The discussion that follows is divided into four sections. Wher-ever possible, the analysis discusses the experience of minoritywomen, who make up a growing proportion of word-processingusers, and of older women secretaries, whose work patterns aresubject to the greatest disruption. The first section examines thepatrimonial form of social organization that has traditionally char-acterized secretarial work. The second section discusses the newbreed of secretary produced by a changing labor force supply andby women's changing expectations concerning their rewards andrights on the job. The third section explores how technology affectssecretarial expectations and experiences in the new office particu-larly through changes in "staffing ratios" (e.g., private secretariesversus shared secretaries versus team or minipool secretaries). Thefourth section argues that patrimony not only persists in the newoffice, but when combined with new staffing ratios also accountsin important ways for the lack of challenge, responsibility, andopportunity to move up in the job that many secretaries are ex-periencing. The section ends with a discussion of other variablessuch as size of office and organization, resources and wealth of the
3 Pomfrett et al. (1984) offer a useful typology of the possible permuta-tions of principal/secretary social organization, as well as a report on thesatisfaction and dissatisfaction of the different groups and individuals. Theyalso identify "quality of supervision" as an important variable for operator(read secretarial) satisfaction, especially where pool scenarios are concerned.The study does not deal with gender questions nor with the patrimonialaspects of word-processing secretarial jobs.
4 My analysis draws heavily on case studies and survey data rep-Irtedby vendors and by researchers in academia, unions, private research turns,and women's advocate organizations. It also uses interviews and case studiesconducted by the author with secretaries in a variety of industries, includinglaw firms, government agencies, universities, and broadcasting. Systematicresearch, however, on secretarial subtypes (by socioeconomic status, industry,size of firm) does not exist and should become a research priority for policymakers concerned with understanding the changes taking place.

104 NEW TECHNOLOGY AND OFFICE TRADITION
firm, and industry or service in which the firm engages, which mayinfluence changes and rewards in the secretarial occupation. Thefinal section brings together my conclusions.
PATRIMONY IN TRADITIONAL SECRETARIAL WORK
Traditionally the secretarial role has been understood as asupport role with the subordinate performing a variety of admin-istrative, clerical, and personal tasks for a superior. For the lastcentury, women have been secretaries while men have been princi-pals. The classic description of this role was provided by RosabethM. Kanter (1977) in her pioneering work, Men and Women of theCorporation. Focusing on the secretarial role in the structure ofa large organization called INDISCO, Kanter analyzed the pat-rimonial nature of the role relationship between secretaries andtheir principals. Using Weber's definition of patrimony as a guide,and the "lord-vassal" model as metaphor, she identified three as-pects of the traditional boss-secretary relationship: (1) principledarbitrariness (secretaries have no job description but rather aresubject to the arbitrary power of a boss who, within limits offair practice set by "principles" or tradition, can make whateverjob request of a secretary he chooses); (2) fealty (an emphasis onloyalty and "the personal" in boss-secretary relations, such thatsymbolic, emotional, and nonutilitarian rewards become substi-tutes for economic ones); (3) status contingency (the fact thatsecretaries derive their status from the rank and power of theirbosses). Each impacts in varying degrees on secretarial tasks andon the secretary's access to better pay and mobility.
TRADITIONAL SECRETACAL TASKS
Secretarial tasks are generally defined by a principal or bosswho has a great deal of latitude and personal authority in de-termining what a secretary does. Typically, a secretary and bosscarve out a personal set of procedures and understandings con-cerning what tasks the secretary will perform. The organizationprovides only the merest skeleton for the structure of the secre-tary's job. One boss may delegate challenging and creative work toa secretary. His successor may delegate nothing. The secretary'swork is also characterized by a constant flow of orders with noroutinized schedule. Typically she must respond "to momentary
lid

MARY C. MURPHREE 105
demands and immediate requests generated on the spot" (Kanter,1977:79). Traditionally the secretary acts as a kind of "office wife,"performing an array of personal and socioemotional services forher boss. These may include listening to his troubles, performingoffice housekeeping duties, running personal errands outside theoffice, or even granting sexual favors (Kanter, 1977:79-81).
The secretary must also act as a buffer between the boss andthe outside world. This includes acting as a "gatekeeper" (screen-ing calls and visitors), as well as assisting the boss in presenting acertain front to the organization or world. As I wrote about legalsecretaries in my 1977 case study (Murphree 1984a:142):
Essentially skilled "generalists,' legal secretaries have tradi-tionally performed a multitude of both simple clerical and housekeeping functions and complex administrative and lawyering tasks.Beyond taking shorthand and transcribing items Iv her boss's sig-nature and beyond acting as his gatekeeper . . . legal secretariestypically might type corporate minutes, draft standard wills orpetitions following boiler-plate forms, or check legal citations andreferences for her attorney. She might also monitor the court cal-endar or docket, handle the firm's bills and charges, and work withan outside accountant on firm taxes. All this has been in additionto filing, ordering supplies, handling the mail, typing endless copyfrom draft, collating multiple final copies, and, of course, makingcoffee. ...
In keeping with the office-wife role expected of her, the WallStreet legal secretary further has traditionally performed certainsupportive and nurturant tasks as well. Covering for an attorney'smistakes, lying about his whereabouts when it is helpful, listeningsupportively (and in confidence) to his career or family problems,. . . are all important tasks associated with her sex-stereotypedrole as handmaiden and confidante.
REWARDS AND CAREER MOBILITY
Secretaries in jobs defined by patrimonial relations are subjectto a special set of standards and rewards that, unlike most otheroccupations in the office, is highly particularistic. By and largesecretaries are rewarded for loyalty and devotion to their bosses.In the INDISCO study, for example, Kanter found that secretarialratings were determined by two main traits or attitudes. One wasinitiative and enthusiasm, and the other was the secretary's abilityto "anticipate and take care of personal needs." They were notnecessarily rated for professional skills. Even when the companyattempted to standardize the evaluation process, managers often
11;

106 NEW TECHNOLOGY AND OFFICE TRADITION
rated secretaries in terms of the quality of their relationships ratherthan in terms of skills that benefit the organization generally(Kanter, 1977).
A number of recent studies have begun to analyze the skilledbut often "invisible" labor that secretaries perform. Too oftenthese skills go unrecognized and undercompensated. Secretaries,for example, perform many highly skilled tasks that require expertsocial and cognitive judgments and use sophisticated mediatingand negotiating techniques that involve great diplomacy (Mur-phree, 1984; Suchman and Wynn, 1984). As "gatekeepers" theymust know when to disturb their managers for telephone calls aswell as how to put off the unwanted call diplomatically. In additionto knowing who's who in the manager's world, they must knowhow to read urgency in the tones of their bosses and their bosses'superiors; how to follow complicated and often poorly explainedinstructions; and how to negotiate and shepherd projects throughthe various departments and support services of the organization.These skills, according to Machung (1983), while handsomely re-warded at the executive or managerial level, are undervalued whenperformed by women labeled as secretaries.
This perception of inequity is increasingly a source of grievanceto secretaries. The Consensus Statement of Professioual Secre-taries International (a nonunion organization) insists that "discre-tionary judgment, not clerical skills, is the key component of thesecretary's productivity." Further it maintains that "[Apprecia-tion does not replace compensation." This message is similar tothat of "Raises Not Roses" promulgated by District 9 to 5 of theService Employees International Union.
Secretaries are paid less and have less control and less in-dependent recognition than they might have otherwise. Insteadthey receive such nonutilitarian rewards as praise, appreciation,prestige, love, or flattery.
Symbolic rewards are also frequent substitutes for promotion.Typically women in secretarial jobs derive their formal rank andpay from the formal rank of their bosses rather than from the skillsthey utilize or the tasks they perform. A common career path fora secretary traditionally has been to begin as a pool secretary,advance to working for a lower-level manager or divisional officer,and end up as a secretary to a vice president or a president (Kanter,1977).
120

MARY C. MURPHREE 107
In my study of legal secretaries I found two main types ofcareer mobility: vertical and horizontal. Vertical mobility wasmost commonly achieved by the "pool to partner" route. It alsomeant moving from the typing pool to working for any attorney,or moving from a junior law partner to a "top partner," or froman associate to a partner. Sometimes it involved moving froma pair of attorneys to a single attorney. Secretaries sometimesmoved horizontally within an organization as well. At Law FirmX, where I conducted a case study, this simply meant the secretarychanged to an attorney with the same rank as her present boss.For example, through the office grapevine a secretary might learnof a good position opening in the office of an attorney with areputation for being particularly nice and request permission fromthe personnel department to transfer laterally to that attorney.Partners' secretaries, h9tvever, were usually not permitted to movelaterally. Any move 014 made had to be to a higher-level attorneyor out of the firm altogether. Only rarely, however, did any legalsecretary move to another service department of the firm, i.e., tothe paralegal department, to proofreading, or to the library.
Whatever industry or profession they are tied to, secretarieshave generally not moved with any ease into managerial and pro-fessional jobs. Moreover, the ladders that do exist are exceedinglyshort and confining. Research indicates that moving up typicallymeans an easier work load but not necessarily a more challengingone. In many instances the "hardest work," with the most demandsand greatest variety of technical requirements, is performed at thelowest secretarial level (Kanter, 1977). Secretaries at the upperlevels of INDISCO, for example, had more responsibility in thesense that they took on a few administrative duties (and oftentheir mistakes had greater consequences), but they did not neces-sarily have the heaviest work loads. This was also true at Firm X,where legal secretaries to junior partners or senior associates hadless status and pay but heavier work loads than senior partners'secretaries. Their attorneysnot the senior partnerstypicallygenerated the most paperwork in the firm (Murphree, 1981).
1

108 NEW TECHNOLOGY AND OFFICE TRADITION
CHANGES IN THE SUPPLY OF WOMEN TOSECRETARIAL JOBS: RISING EXPECTATIONS
AND DECLINING SATISFACTION
For many years women secretaries have shaped their expec-tations to the patrimonial structure surrounding them. In recentyears, however, the workplace expectations of more and morewomen have soared, creating a striking dissonance between expec-tations and actual experiencea dissonance exacerbated by newoffice technology.
In the late 1970s, Daniel Yankelovich (1979) focused atten-tion on the growing "psychology of entitlements" characterizingAmerican workers, female as well as male. Workers increasinglydemand rights and rewards at work that they did not considerdue them in the past. Women, while generally satisfied with lessthan men (Gutek and Bikson, 1985), are nonetheless an importantpart of this movement. According to Rosabeth Kanter, since the1960s women in the nonprofessional rank and file have lobbiedwith a new legitimacy for an extension of their basic civil rightsinto the workplace and have demanded equity, discretion, andgreater employee control (Kanter, 1977).5 Many are questioningtheir subordinate place in organizational hierarchies as nurturant"office wives," servants, and sex objects. At the same time theyare seeking recognition for their "invisible labor" and their role asimportant players on the office team.
Accompanying this drive for entitlements has been an observ-able decline in the overall satisfaction of working women, especiallysecretaries. As early as 1977 women were reporting a gap betweenwhat they expected from their jobs and what they felt they weregetting. The Quality of Employment Survey, for example, re-ported a decline of some 25 points in the mean job satisfaction
6 There :s a wide range as to what different workers mean by their"rights." At the most radical level, the rights issue focuses on access to realpower for subordinates, namely, access to the resources of the organization,or what a union organizer in Terkel's American Dreamt: Lost and Found(1981) called 'profits and say-so." Worker rights may also involve "freedomfrom hierarchy* (Blauner, 1988; Presthus, 1978) and the opening up of anorganisation's opportunity system to any qualified workers (Kanter, 1977).In most instances, however, the rights discussed involve such specifics as theright to pay equity or privacy, the right to participate in decisions involvingdepartmental production, or the right to more control by the worker over hisor her immediate work tasks and environment.

MARY C. MURPHREE 109
score of secretaries between 1969 and 1977 (Quinn and Staines,1979; Staines, 1979).
A 1975 study by the U.S. Department of State examined themorale of its secretaries at home and abroad. It found over half ofthe 845 respondents to be dissatisfied with their careers. The mostfrequent criticisms concerned a lack of status and recognition, aswell as a lack of responsible and interesting work (i.e., respondentswere assigned work that made too few demands on their skills,felt overqualified for their present assignments, and thought them-selves al.le to do the work of their superiors) (U.S. Departmentof State, 1975:iiiv). A later study by the National Commissionon Working Women (1979) surveyed the perceptions, problems,and prospects at work of some 20,399 secretaries and typistsself-selected as respondents from the readership of a variety ofnational women's magazines. It too found widespread perceptionof underutilization, limited advancement opportunities, and lowpay.
Grandjean and Taylor (1980) examined sources of job satis-faction of 231 secretaries, stenographers, and typists in a federalagency. The items rated most important to secretarial job sat-isfaction were the opportunity to advance, do quality work, andhave responsibility. The importance placed on advancement andresponsibility, however, contrasts markedly with the actual satis-faction secretaries expressed regarding the opportunity to achievethem.
Over the last few years, the combination of increasing expec-tations and declining satisfaction has increased political activismamong many women clericals. Organizations of secretaries, in-cluding Working Women, 9 to 5, and Professional Secretaries In-ternational, all provide secretaries with an institutional base fromwhich to advocate better pay, greater respect on and off the job,more opportunity to perform interesting and challenging work,and an opportunity to advance in their careers. In addition, theseassociations seek to repudiate the stigma that became attachedto the occupation in the 1970s when being "just a secretary" wasoften seen as an inferior occupation compared to the many nontra-ditional occupations some women began to enter. Organizationssuch as the Women's Bureau of the U.S. Department of Labor, TheBusiness and Professional Women's Foundation, the commissionson the Status of Women, the Displaced Homemaker's Network,the National Commission on Working Women, and many women's
1 r,) ' .,
..s. /s., J

110 NEW TECHNOLOGY AND OFFICE TRADITION
centers in educational institutions and community-based organi-zations throughout the country have also taken up the secretary'scause. Unions have been active as well. The Coalition of LaborUnion Women serves as the research hub for national unions inter-ested in organizing secretaries. In 1980 the National Association ofOffice Workers joined with the Service and Industrial EmployeesUnion to form District 9 to 5.
The media's changing attitude toward working women in gen-eral supplements institutional support for secretaries. Television,newspapers, magazines, and movies sensitive to their buying powerpublicize the needs and wants of working women, including secre-taries. Television serials, movies, and documentaries have takenup such issues as sexual harassment, day care, pension and payproblems, and health and safety rights.
Contemporary studiesas I will show in the balance of thepapercontinue to show disparities between secretarial expecta-tions and experiences, especially as they pertain to specific factors.Moreover, the new breed of secretary does not encounter a staticworkplace. Her expectations are soaring at the same historicalmoment that offices are being transformed by automation.
THE NEW OFFICE ENVIRONMENT
WORD PROCESSING: THE CORE TECHNOLOGY
From the perspective of most secretaries, word processing isa handy technology and a welcome tool for getting the job done.Secretaries generally report that they like the new automatedequipment and they are optimistic about what it can do for them(Westin et al., 1985; Johnson et al., 1985; Professional SecretariesInternational and the Minolta Corp., 1984; 9 to 5, National As-sociation of Working Women, 1984; Honeywell Inc., 1983; Biksonand Gutek, 1983). In a national survey conducted by a majorvendor, 86 percent of the secretaries reported being satisfied tovery satisfied with their automated equipment (Honeywell Inc.,1983). About 9 out of 10 secretaries agreed that this equipmentspeeded up their routine chores, made their job easier, and im-proved the flow of work through the office. At least three-quartersagreed that the equipment allowed secretaries to get more doneeach day, improved the quality of their work, and freed their timefor more interesting and challenging tasks (Honeywell Inc., 1983).
, 124

MARY C. MURPHREE 111
Two other vendor-sponsored surveys (Westin et al., 1985; Pro-fessional Secretaries International and the Minolta Corp., 1984),as well as a large union-sponsored survey (9 to 5, National As-sociation of Working Women, 1984), also found that favorableattitudes were widespread. Sixty-eight percent of the respondentsof the 9 to 5 Working Women Education Stress Survey reportedthat using VDTs made their jobs more interesting and enjoyable,and 88 percent of the members of Professional Secretaries Inter-national said they liked using automated equipment. (See alsoBikson and Gutek, 1983). More important, none reportedly areeager to return to the typewriter (Pomfrett et al., 1984).
The problems associated with the quality of secretarial em-ployment in automated offices have much more to do with orga-nizational factors, including the design of new jobs, the way inwhich word processing is introduced, and general working con-ditions, than with the equipment itself. Iacono and Kling (1984)recently pointed out that, while most workers accept innovation asnormal and are highly pleased with new technologies, they are alsovery frustrated with the conditions under which they use them:
Women, who are most adversely affected by technologicalchange, are rarely dissatisfied or hostile toward their machine.However, clerical workers are much more frequently dissatisfiedwith the working conditions that accompany new technologies.
The objectionable conditions most commonly reported by sec-retaries involve a multitude of practical factors: lack of privacy,storage, and desk top space; noise; poor equipment maintenance;inadequate access to software consultants (Johnson et al., 1985);poorly written manuals; and low functionality of systems (John-son, 1984; Bikson and Gutek, 1983). Secretaries also object cobeing excluded from the process of deciding how to automate theoffice; they resent not being consulted about what kinds of equip-ment to buy for their offices or about whether and how their jobsshould be redesigned. They also want to take part in evaluatinghow well an office system works. For example, secretaries resenthaving to master a particular system thrust on them, only to havethat system replaced with an entirely different oneall withoutinput or evaluation from themselves, the primary users. Whiledeeply aggravating, these are short-term problems that in theorycould be solved.
A more difficult problem lies in the area of secretaries' long-term expectations. The introduction of word processing has raised
12 :i

112 NEW TECHNOLOGY AND OFFICE TRADITION
these expectations: secretaries anticipate that the new systemsand associated skills will give them access to more challengingwork, create opportunities for advancement in their organizations,and lead to more money and higher status. Sharing in these ex-pectations are large numbers of minority women, especially blacksand Hispanics. In the 1970s women benefited from new opportuni-ties, many of them made possible by equal opportunity legislationand affirmative action regulations in the 1960s. Different groupsof women, however, benefited in different ways. In the last decade,for example, large numbers of white, educated women who for-merly looked to secretarial work as an appropriate career havemoved into professional and managerial positions. Their exodus,together with a staggering increase in secretarial jobs, openedup many clerical positions to minority women, who had tradi-tionally been forced by discrimination to work at lower-paying,lower-status factory and domestic jobs. In 1970 there were ap-proximately 155,000 black and Hispanic secretaries; by 1980 thatnumber had more than doubled to 374,000. Secretarial and cler-ical positions have also become available to less-educated whitewomen whose level of schooling would previously have disqualifiedthem (Women's Bureau, U.S. Department of Labor, 1985). Thesenew groups, however, bring to their work a set of rising expec-tations haracteristic of American working woman generally, and,moreover, they are looking to the new technology to provide themwith even greater opportunities.
Commentators, including employers and policy makers, havemade much of the claim that secretarial work is a step up formany women in that it offers them better wages, a cleaner workenvironment, greater status outside the workplace, and a chanceto get dressed up and mix with white-collar professionals (Mur-phree, 1981; Crozier, 1964; Mills, 1956). Implicit in this analysis,however, is the assumption that expectations are statice.g., thatminority women, by virtue of the relative improvement in theirstatus and wages that secretarial jobs bring compared with mostservice and domestic work, will remain forever grateful and contentin these jobs. More recent research suggests that these clericalsrespond to new incentives and seek to grow in their jobs just asother employees do. My own field studies and much anecdotal ma-terial suggests that once a certain "mastery" of word processingis attained, most word-processing secretarieswhatever their raceor ethnic grouptend to seek greater compensation for new skillsacquired, the opportunity to improve those skills even more, anda chance to advance in their organizations.
1,26

MARY C. MURPHREE 113
In theory, new information-processing technology affords sec-retaries opportunities to perform a wide variety of interesting tasksranging from high-level inform :on-processing functions (e.g., nu-meric data manipulation, including spreadsheets and financialanalysis; planning and project management; and programmingand form development) (Goldfield et al., 1985; Hirschhorn, 1984)to a multitude of lower-level tasks such as filling in forms or keyingin text and data supplied by someone else (Bikson and Gutek,1983; Schrage, 1984). The list below enumerates the range oftasks. Recent research, however, indicates that secretarieswhileusing more skills than ever beforeare nonetheless performingfew of the higher-level, autonomous information-processing taskssophisticated computer systems make available to them (Biksonand Gutek, 1983; Gutek and Bikson, 1985). This, as the followingsections show, occurs because of the dominance of new staffingratios in offices where private secretaries are shared among princi-pals or are obliged to work as specialists in minipools and becauseof the persistence of patrimony in secretarial work, in particularthe still-operative stereotypes of the appropriate division of laborbetween principals and secretaries.
SECRETARIAL SHARING AND MINIPOOLS:NEW STAFFING RATIOS IN THE AUTOMATED OFFICE
Office economics, in particular the costs generated by invest-ment in computers and concerns about labor overhead, are pushingmany managersin a trend predicted by Mills (1956) and Braver-man (1974)to continue their efforts to reduce the number ofprivate secretaries in their organizations by decoupling secretariesand executives. Two observations, in fact, about word-processingsecretaries stand out in office after office today. First, while someword-processing secretaries are assigned to work for one person,far more work for two, three, or more principals in varying degreesof intimacy.6 Second, authority over the secretary is increasingly"shared" between a number of different bosses, be they several
6 Mills (1956) referred to the pool concept in White Collar. Until recently,systematic data on secretarial job design in decentralized groups has beenunavailable. However, a new study by Pullman and Szymanski (1986) for ThePrivate Industry Council of New York City presents a useful cross-sectionalanalysis of clerical workers in the banking, insurance, and legal industriesand the increased staffing ratios found there.

114 NEW TECHNOLOGY AND OFFICE TRADITION
Tasks of the Word-Processing Secretary
Administrative and Para-professional tasksAnswer letters and inauiries (including electronic mail)Drafting letters and documents for boss's signatureElectronic calendaring and time managementArranging conferences and meetings, including teleconferencingPlanning and project managementProject follow-through and cleanupSpreadsheets and financial managementResearchInventory controlPersonnel records (time and attendance logs)
Diplomatic and social tasksGatekeeping and buffering
Receiving visitors or incoming callsScheduling appointments for bossGathering information and gossip about organization
Shepherding projects through bureaucracyActing as sounding board for bossAdvising buss
Clerical tasksPlacing telephone callsMaking restaurant reservationsMaking travel arrangementsPhotocopyingStenographyTaking minutes or notes at meetingsProofreadingMaintaining files of paper copiesDistributing/sending out mail
Clerical tasks--computer-basedText and data inputting
Own (drafting)Others (copying; transcribing from dictaphone)
Formatting and graphicsUsing judgmentOnly as instructed
Text and data-editingOwn (editing and correcting)Others (making editorial changes and corrections as instructed)
File managementDevelop own system using judgmentUse ',redesigned system with preassigned and standardized file name
Proofreading, using spelling and grammar programsBudgeting space on disks
Maintenance and housekeeping tasks--computer-basedChanging ribbonsChanging print wheelsHand-feeding printer with paper or otherwise controlling paper inputGathering printed outputStocking and fitting computer suppliesFetching or ordering supplies
12 d

MARY C. MURPHREE 115
Maintenance and housekeeping tasks--non-computer-basedGetting coffee, ordering foodCleaning, straightening, and dustingsetting up conference rooms
Personal and sauasi.,personal tasksFinancial management (e.g., preparing tax material, paying bills for
boss, keeping securities or insurance records for boss)Carrying out club and social organization commitmen's of a clerical
nature for boss (e.g., alumni mailing)Gift buying/private errands
executives or an executive and the organization's personnel de-partment.
Essentially the job of every word-processing secretary can beanalyzed in terms of the number and configuration of principalsassigned to that secretary, i.e., the staffing ratio. In some WallStreet law firms and many other large organizations, two differentsecretary-to-boss configurations are predominant: shared word-processing arrangements and minipool or team arrangements.
The Shared Secretary
A common arrangement now found in many offices is theshared word-processing secretary. A secretary is assigned to workon a daily basis for two or more principals. This arrangementbears such names as the "two on one" or "three on one" plan.?In the Honeywell Inc. (1983) study, for example, 36 percent ofall the secretaries interviewed worked for two or three managers,while nearly 20 percent worked for four or more managers. Ratioscan range from 2 principals per secretary, such as found in asmall architectural firm or doctor's office, to 20 or 30 principalsper secretary, such as found in many high-tech engineering firms(Hor eywell Inc., 1983).
Knowing how many bosses the word-processing secretary hascan provide important clues to understanding the scope and qual-ity of the secretary's job. Exploratory research suggests that word-processing secretaries who are shared perform a more restricted
7 This is not to say that the private secretary has disappeared in theautomated office. In almost every office, one can find examples of the privateword-processing secretary working for a single executive or manager. Inpersonnel parlance this is known as the "one-on-one plan."
193

116 NEW TECHNOLOGY AND OFFICE TRADITION
set of tasks than secretaries who work for only one boss, regardlessof how sophisticated their particular word-processing system maybe. In large part this is due to the demands made on the secretary'stime by a stable of bosses for routine typing, data-entry, andediting chores. The bulk of the shared word-processing secretary'swork is often made up of text inputting and routine editing. Shemust also perform the many traditional gatekeeping and "officewife" functions. As a result there is little time, with even themost sophisticated system, for her to undertake high-level taskssuch as project management, accounting, electronic calendaring,or developing a data base or file management system.
Unrealistic expectations about the capabilities of new equip-ment further limit the shared secretary's work. Most people asso-ciate "high-demand, low-control jobs" with centralized data- andword-processing work (Karasek, 1979; 9 to 5, 1984). But theseproblems can be found just as readily in decentralized scenarios.
Dazzled by the speed and multiple text-editing features ofword processing, many bosses in decentralized settings see themachine, rather than the secretary, as the production unit (U.S.Department of Labor, 1984-1985). They give their secretariessloppier-than-usual first drafts, many more revisions to make, andless time in which to correct the material (Zimmerman, 1983).For shared secretaries the need to speed up tends to be worse thelarger the number of principals they serve. Challenge in these jobs,therefore, comes not from the intrinsic complexities of the tasks,but rather from one's ability to keep up with a demanding workload generated by many bosses.
Pomfrett et al. (1984), for example, describe a work situa-tion where only two secretaries now perform all the office's word-processing work. They report that the two secretaries felt theywere spending more time doing word processing and associatedtasks than they had previously spent at typing in the precomputeroffice, with a reduction in task variety and hence work satisfaction.
In addition, managers continue to vie with one another fora secretary's timejust as they did in the precomputer office,and pull rank and status with her to get their work done firstand fastest. The secretary frequently gets caught in the middlebetween two principals, and must stop working on one job toaccommodate the higher-ranking principal.
1 3 9

MARY C. MURPHREE 117
The Minipool Secretary
Many companies are using new office technologies as a vehicleto reorganize their secretaries into small decentralized pools. Al-though such pools existed in the precomputer office for years, theyare considered by some management consultants today to be thelatest trend in reorganizing office work.
These small work groups bear names such as teams, clusters,or minipools. Their attraction to managers is that they maximizethe use of every secretary's time and eliminate some of the "costs,inefficiencies, and inequities of the social office" that Mills (1956)and Kanter (1977) described. For example, the private and sharedsystems limit, to an extent, whom a secretary must take work fromand cast a patrimonial glow around boss-secretary relations. Incontrast, the team or minipool secretaryat least in principleisavailable to work for any principal. (Some of the greatest uproarsin the traditional office have involved an executive asking someoneelse's secretary to do work for him.)
From the perspective of the secretary seeking challenge, vari-ety, and control over her work, minipools can be a boon insofaras they cut down on the favoritism or prima donna syndrome.They also create a setting for secretaries to work out a division oflabor among themselves, such as who will specialize in what tasks(e.g., text editing, gatekeeping, maintenance) and how jobs willbe rotated among different staff members. They allow for groupsupport in learning new software techniques and, for secretariesattached to highly specialized teams, an opportunity to hone theirskills (e.g., gain proficiency at creating glossaries and "plombing"a software program or a system in great depth).
Decentralized pools, however, can create some very real prob-lems for those secretaries who find their new jobs enlarged butnot enriched. Too often they are very high stress, heavy work loadenvironments. More important, however, they are frequently coor-dinated by a senior secretary or supervisor who is answerable to adistant personnel department. While such a person can benefit thework group by running interference between the secretaries andthe managers, she often becomes a co-supervisor alongside the setof executives the pool serves. This arrangement frequently resultsin the secretaries not being sure who is boss, who to please most,or whose evaluation counts most. Many end up trying to pleaseboth the coordinator and the more powerful managers attached
L 2

118 NEW TECHNOLOGY AND OFFICE TRADITION
to their pool. Such supervisory ambiguity is characteristic of poolwork of any kind in that it mixes a kind of bureaucratic authoritywith old-fashioned patrimonial authority (Murphree, 1981). Likeso much else that characterizes today's office, it is independent ofany technology and can be found in both high-tech and low-techoffices.
The trend toward minipools and secretarial sharing is likely toaffect different groups of women in different ways. White, middle-class women are likely to move into the private secretarial jobsor be promoted to the team supervisor jobs. Minority women arelikely to move into lower-level shared or pool jobs.
THE PERSISTENCE OF PATRIMONYIN THE NEW OFFICE
THE NEW TASKS
Many patrimonial aspects of the traditional office persist inthe newly automated one. Kanter (1977) points out that high-challenge jobs in secretarial work have generally resulted froma manager's largess or the secretary's ability to persuade him toassign her such jobs. In automated offices dominated by a patrimo-nial ethos, in which secretarial work is decentralized, the divisionof labor between secretary and boss continues to be negotiated ina similar way.
Just as in the precomputer office, many secretaries working inautomated offices are kept busy accomplishing a host of lower-levelclerical and administrative tasks. For example, in the traditionaloffice the secretary did all the typing; in the automated office shecontinues to do most of itdepending upon how resistant her bossis to keyboards. (Indeed, managers' resistance to word and dataprocessing has been blamed on their disdain for typing, hence theeuphemism, "keyboarding.") As one analyst put it, women type,men keyboard .8
Secretaries, particularly private or executive secretaries whohave a professional orientation to their work, continue to feel
8 Bikson and Gutek (1983) found a high keyboarding rate for the man-agers, administrators, and text- and data-oriented professionals in theirstudy. They caution, however, that the organizations they studied wereearly adopters of new technology and hence not necessarily representative ofoffice work groups generally.
1 3,?

MARY C. MURPHREE 119
capable of performing far more demanding and responsible tasksin the new office than their male managers are willing to givethem. Half of the managers in the Honeywell study reportedwasting more than 10 percent of their time on activities such assupervision of minor tasks and composing routine correspondence,memos, or reports. These same managers, however, say they donot delegate these "time-wasting" tasks to their secretaries eitherbecause the nature of the task makes it impossible or becausetheir secretaries are too busy. The secretaries disagree. Onlyone in four secretaries say they are too busy to take on extraduties. Furthermore, 4 in 10 report that their managers see noneed to delegate work to them. The study also points out thedivergent viewpoints held by secretaries and managers as to whatmakes an office more productive. Secretaries were twice as likelyas their managers to say that more of a team relationship betweenmanagers and their secretaries would improve office productivity,with managers twice as likely as their secretaries to feel that "moreautomated equipment" was the answer (Honeywell Inc., 1983).
Even in organizations where word processing is highly inte-grated and executives work "on line" a great deal, secretaries andprincipals do quite different tasks (Johnson, 1984). And, just as inthe traditional office, it iv the principals who perform most of thecreative and rewarding tasks, : -_mely, those demanding high levelsof verbal skill, discretion, responsibility, and decision making, suchas writing original material, manipulating financial programs, orcreating project management systems (Bikson and Gutek, 1983).In many instances, for example, I witnessed executives passingdocuments that had been generated on a home computer to theirsecr- .-y for entry and text editing on the office system.
: n c. .taut group study suggests that executives are delegatingthese tasks to their secretaries out of boredom. According tothe director of the study, Tech Trends '85: Inside the AmericanOffice, "personal computing tends to glamorize clerical work, andmanagers have begun to realize that."
Many systems, for example, are designed ?r1 such a way thatthere is little or no room for secretarial input. Computerized filemanagement programs, for example, allow users to create, access,and store data ;n computerstasks that can involve varying de-grees of computer expertise and cognitive skill. In "hign-challenge"situations, secretaries are given a great deal of discretion in filemanagement. They can create their own file management program
133

120 NEW TECHNOLOGY AND OFFICE TRADITION
or customize an off-the-shelf program to fit their particular needs.Frequently, however, the word-processing secretary is required tomark up files or retrieve them using schemes predetermined andprogrammed by others. Similarly, text editing can vary in theamount of discretion and creativity allowed the secretary. Fewsecretaries are allowed to function as true editors, using theirconceptual and verbal skills to rework the writing of a principal.
The word-processing secretary is inheriting a good deal of thenew hardware maintenance tasks as well, in particular, supervisingthe printer. Keeping it supplied with paper, changing ribbons, andtearing off output are all tasks falling in the secretary's domain.
Inadequate training and time to experiment with new func-tions present other stumbling blocks to secretaries seeking chal-lenging work in the automated office. Too frequently, secretariesreceive little or no training in system functions (U.S. Departmentof Labor, 1986) and thus lack the background to experiment withnew programs such as project planning or spreadsheet software.
Career Opportunities
Women secretaries have long expressed a desire for greatercareer mobility and opportunity to advance in their organizations(Grandjean and Taylor, 1980; National Commission on WorkingWomen, 1979; Schrank and Riley, 1976; U.S. Department of State,1975). The sweeping changes in office organization that oftenaccompany automation offer employers an opportunity to improvewomen's access to higher-level professional and managerial jobs.An important attraction for secretaries of acquiring and honingcomputer skills has been the belief that such skills would facilitatetheir entry into higher-level occupations. (Honeywell Inc., 1983;Kelly Services, 1982; Verbatim Corp., 1982).
Contrary to the promise of many vendors and schools of-fering word-processing instruction, however, preliminary researchindicates that clerical women are increasingly frustrated with theopportunity for advancement offered them in the "office of thefuture." Many are reporting uncertainty as to whether word pro-cessing per se should be viewed as a clerical, a technical, or aprofessional occupation (Verbatim Corp., 1982). In its survey ofsome 900 women working in VDT occupations, the EducationalFund for Individual Rights found that nearly a third of the femaleclericals felt discriminated against in terms of the promotional
134

MARY C. MURPHREE 121
and career path opportunities they received compared to men intheir organization. In an employer survey of a large, highly au-tomated customer-service organization reported on by the sameresearchers, two-thirds of the women clericals said they were notsatisfied with their chances for advancement (Westin et al., 1985).Similar numbers were obtained in a 1983 study of professionalsecretaries (Professional Secretaries International and the MinoltaCorp., 1984): 49 percent of the secretaries said they were dissat-isfied with the opportunity for advancement offered by their jobs,with 22 percent being "very dissatisfied." In the same survey ap-proximately two-thirds of the secretaries felt there were limitationsto advancement for secretaries in their company.
A review of study research conducted for the National Acade-my of Sciences (Werneke, 1984) focuses specifically on the nexusbetween technology and women's occupational mobility and linkswomen's blocked mobility and their low pay to occupational seg-regation and the fact that women are locking into lower-levelcomputer jobs.
A concern of many researchers, in fact, is the eventual elimi-nation of many of the professional and managerial jobs into whichwomen have moved over the last decade as a result of affirmativeaction efforts. New data indicate a trend toward employers usingattrition and retrenchment to reduce the number of recently cre-ated lower-level management positions through a last in, first outpolicy (Applebaum, 1984, Kraft, 1985). The social reorganiza-tion and new staffing ratios being adopted by many offices whenautomating may, however, not only cut women off from upper.level jobs but reduce their access to secretarial jobs by eliminatingmany typists and clerk positions. These "bridge positions" tradi-tionally have offered womenmost Tecently, minority womenanimportant entree into higher-paid secretarial work (Noyelle, thisvolume). For years, entry-level typists have aspired to move upinto private secretarial or, more recently, administrative assistantjobs (Watstein, 1985). From there, as Kanter (1977) points out,mobility has traditionally been contingent on either the upwardmobility of the boss or on a kind of horizontal mobility, with thesecretary moving from firm to firm in search of a higher-payingjob in a more prestigious firm or industry.
To the extent that more and more private secretarial slotsare phased out and secretaries are shared or pooled, organiza-tional career ladders will become even shorter. This could be a
13:

122 NEW TECHNOLOGY AND OFFICE TRADITION
particular problem for minority -omen. In one Wall Street lawfirm, the private secretaries' slots are being eliminated throughattrition. Secretaries who leave or retire are not replaced. Allnew secretarial recruitsa large percentage of whom are minoritywomen from a local community collegeare hired with the clearunderstanding that as long as they are with the firm they willbe "team secretaries" and should not expect to be promoted to"private secretary." As such they will work in a pool with threeother secretaries for nine attorneys. At a salary of $400 per weekthese terms are easy for the new young recruits to accept. Ac-cording to the firm's director of personnel, however, problems doeventually arise. Typically these team secretaries, after a coupleof years on the job, will come to her seeking raises because theyare not permitted to move up to work for partners and their skillson the office's very advanced word-processing system have greatlyincreased .°
Hirschhorn, however, in a concept paper, suggests that a dif-ferent scenario is occurring in the automated office. He posits thatbecause a shift is taking place whereby office workers do more"negotiating" on their jobs than "taking orders," three "pars-professions' may emerge from "the increasingly obsolete secretar-ial role." These are the para-publisher, the para-librarian, andthe para-manager. The first supervises the document productionprocess; the second supervises file and index management, withparticular emphasis on cross-referencing; and the third preparesbudgets, monitors master-calendar preparations, and maintains"control system data bases," such as productivity and time records(Hirschhorn, 1984:1).
In Hirschhorn's view this development is likely to move sec-retaries into the professional and managerial ranks. In his words:"The pars - publisher, once a secretary, can become a manager ofan in-house publishing unit. The technology capitalizes his or herinnate skills." He also points out, however, that "the person whocannot achieve para-professional status cannot hope to rise fromfiling clerk to receptionist to secretary" and cites the dangers thisposes for "poor, uneducated or miseducated people," which could
9 Some law firms and academic departments are experimenting withbuilding career mobility into their teams by creating supervisory slots for"captains" or coordinators. The number of these slots, however, is verylimited and is not likely to compensate for the old career route of "pool topartner" or typist to departmental secretary.
136

MARY C. MURPdREE 123
disproportionately be minorities or older women excluded fromthe training process (Hirschhorn, 1984).
Minority secretaries also often have a problem of another kindin moving up. Ibra Bikson of the Rand Corporation reports ine private communication that the status of a work groupwhatshe calls its "organizational niche"is a powerful indicator of thegoodness and badness of women's opportunities in an organiza-tion (see ale.° Gutek and Bikson, 1985). Minorities frequentlyare attached to the least prestigious divisions or departments ofan organization. Their superiors, often minority males, have thepoorest access to the resources or power structure of the organi-zations and consequently lack the ability to promote their femalesubordinates in any meaningful way. These departments also oftenhave the poorest access to up-to-date equipment, and hence, thesesecretaries have the least opportunity to acquire those computerskills that would make them the most promotable. They may alsobe the first unit of an organization to experience budget cuts and,hence, the need for secretarial sharing or minipools.
Minorities may be disadvantaged by the electronic office inother ways. Electronic telecommunications technology makes itpossible for employers to move clerical work away from geograph-ical locations such as inner cities to other locations, o....lch as sub-urban and rural areas, thus depriving minorities of jobs (Nelson,1984; Baran and Teegarden, 1983). Another threat is posed bythe continuing transfer of clerical jobs out of the United States tocheaper, usually third-world, labor forces (U.S. Congress, Officeof Technology Assessment, 1985).
COMPENSATION AND SKILLS
Wages and Upakilling
The issue of equitable wages for secretaries has been of growingimportance over the last decade (U.S. Department of Labor, 1986;Professional Secretaries International, 1984). A great many secre-taries feel undervalued and underpaid. They resent not being paidfor the skills they use, both their traditionally "invisible" gate-keeping (diplomacy) skills and their new computer-based skills.
According to a study by Professional Secretaries International(1984), pay for secretaries has been based mainly on seniority.The length of time with an employer, in fact, has more impact
137

124 NEW TECHNOLOGY AND OFFICE TRADITION
on salary than skills, education, or even job title. The next mostinfluential factor affecting the secretary's salary is the title of herboss, followed by scope of the business (regional, national, inter-national); employer's pay policy (whether it pays high, average, orlow salaries to all employees); and finally, the number of employeesat the work location (the more employees, the higher the salary).The lack of a high school diploma costs a secretary approximately$2,500 a year, while having a master's degree adds only $1,500 tothe average annual salary. Experience also counts for little. Newsecretaries earn only $1,0n0 a year less than those with 20 years ofexperience. Titles also count for very little. A move up to a highertitle such as "executive assistant" or "senior secretary" counts foronly about $1,000 a year per step up.
With the advent of word processing, the definable skills ofthe traditional secretary (e.g., typing, filing, shorthand, and gate-keeping) have now becn expanded to include data handling, textediting, and other technical computer skills. As a result, the issueof equitable pay for secretarial workers has taken on a new rele-vance. According to a study by Kelly Services, 88 percent of allsecretaries believe that learning as much as possible about usingword processing will help them increase their salaries. Half, infact, believe it to be very influential (Kelly Services, 1984). Inmany offices, however, skill upgrading has not resulted in greatercompensation.
In most instances word-processing skills exceed those neededto operate a typewriter. Text editing and formatting, for exam-ple, both demand a degree of knowledge of software and hardwarelogic. On-line file management demands a blend of cognitive andconceptual skills in addition to computer logic. For example, toset up a workable file management system (e.g., affix appropriatelabels to a file, assign key words), secretaries must have a "knowl-edge of context" that realistically reflects the goals of the boss andthe organization as well as the capabilities of the office computersystem.
Many secretaries, moreover, are taking on training responsi-bilities and acting as informal teachers and instructors to othersecretaries and to managers and executives on how to use the newequipment (Kanter, 1983). Too often these instructional effortsare taken for granted, and the secretary is not paid for her specialknowledge.
1 3 d

MARY C. MURPHREE 125
Many employers (and some secretaries) believe that the on-the-job training on new equipment is a sufficient substitute for ad-ditional pay (Women's Bureau, U.S. Department of Labor, 1985).Most secretaries, however, want to see their new computer skillsreflected in their paychecks and argue their case through orga-nizations such as Professional Secretaries International and TheWorking Women's Education Fund.
In a recent poll of 1,250 secretaries, almost 90 percent believedtheir computer skills should earn them higher pay. However, thesame survey reports that 58.1 percent feel that their computerskills had not earned them a higher salary (Fusselman, 1986).Thirty-five percent of the secretaries interviewed in the PanasonicStudy, in fact, cited "insufficient pay" as a source of their great-est job stress. In the Kelly survey only 30 percent of the word-processing secretaries interviewed reported receiving pay increasesas a result of their word-processing skills. The Educational Fundfor Individual Rights also found "a strong minority"perhaps 25-35 percent of the women VDT users it studiedexpressing concernabout fairness of the pay trey were receiving. These attitudes wereparticularly strong among clericals, including secretaries, under 30years of age. (This is also the group, according to the Kelly study,most likely to receive a pay increase as a result of developing newword-processing skills [Kelly Services, 1982).)
It is essential that research be undertaken that tracks the typesof skills used in different word-processing jobs and how currentlythese skills relate to wages. Secretaries in private, shared, andteam jobs perform very different constellations of tasks and henceare likely to use a different collection of skills. Individuals workingin the same kind of word-processing job may vary greatly amongone another in expertise. Two secretaries can have very differentabilities in exploiting a sop,histicated word-processing programlike Wordstarr& or Xywr;teg. They may differ in the number ofcommands they know, knowledge of when a command shouki beused, understanding of the computer's operating system, abilityto save space on files, and ability to program the machine to takeshortcuts or customize it to their needs. Developing a fair andequitable formula for evaluating word-processing and secretarialskills is an essential job still to be done.
13

126 NEW TECHNOLOGY AND OFFICE TRADITION
OTHER VARIABLES AFFECTING CHANGE
Altered staffing ratios and the authority structure are onlysome of the organizational variables affecting change in the sec-retary's job. Other importaL., variables include the size of theoffice, the kind of industry or profession (legal secretary, medicalsecretary, bank secretary, etc.), and the resources and wealth ofthe office or work group.
Office Size
Office size has always had an impact on secretarial work. Sec-retaries working in small offices have always been spared the costsof extreme specialization. Most have great variety in their jobs as"Jills" of all trades. Their work includes typing, housekeeping, re-search, inventory control, and accounting. Caste distinctions tendto be played down, with work relations w ....mer and more family-like and rules and regulations kept to a minimum (Murphree, 1901,Litwak and Figueira, 1968).
Secretaries in small offices nevertheless generally forgo theperks of larger establishments. Large firms often tend to havegood back-up services (e.g., duplicating departments, mail andmessenger services, canteens in which to make coffee and wash thepot) and higher salary scales. Just as important, large organiza-tions tend to be financially sounder. As one secretary in a verylarge law firm pointed out to me: "They've got cash at the end ofthe month; their check is good!" Large organizations also afforda certain panache or status by association that reflects on anyemployee in her life outside the office, however modest her statusat work. ("I can read about our clients in the New York Times.")
Computerization is making dramatic inroads in small offices(U.S. Congress, Office of Technological Assessment, 1985). Theimpact of automation in small offices alters few of these differ-ences. Its impact, however, is not well defined.10 There are indi-cations that secretaries in small offices may be in a better positionto be delegated higher-level computer tasks, such as setting upa computerized billing system or some other administrative ormanagerial software packages. For example, many small law firms
10 Unfortunately, we have little systematic research on small-office au-tomation and its effect on secretaries. Such research is essential siAce smallbusiness generates the bulk of new clerical jobs in the United States today,and more and more secretaries are likely to find jobs there.
1 4 9

MARY C. MURPHREE 127
cannot afford customized packages, and the task of adapting aretail software package falls to the legal secretary with initiative.
Moreover, while salaries of word-processing secretaries in smalloffices are likely to remain lower than those of secretaries in largeorganizations, the opportunity in small firms to broaden one'sskills may put the small-office secretary in a better position toadvance into higher-paying jobs, depending on the industry inwhich she works.
Industrial Variation
Secretarial jobs, before and after the introduction of the com-puter, have tended to vary in significant ways by industry andprofession. Want ads routinely promote secretarial jobs by adver-tising different industrial or professional cultures. Secretarial jobsin broadcasting are considered glamour jobs; law and publishingare portrayed as intellectual and dignified; medicine is for thesecretary who wants to help people.
It is, in fact, true that the service or product put out bya company will have an effect on the secretary's tasks. Medicalsecretaries, brokerage secretaries, and academic secretaries, forexample, tend to have more client contact than do large-firm legalsecretaries.
Research, however, indicates that secretaries who work in theprofessions, while generally better paid (academia is the excep-tion), have the shortest career ladders and least opportunity formobility into management. In an earlier piece (Murphree, 1981), Idistinguished between professional or caste bureaucracies and classbureaucracies. In the former (e.g., law and accounting firms), mo-bility is based on credentials, and hence beyond the reach of thesecretary. In the latter (e.g., brokerage houses and some man-ufacturing firms), initiative, savvy, and salesmanship are highlyvalued, and secretaries have a better chance for advancement. Sec-retaries in the caste-like Wall Street law firms are, by definition,barred from moving into any professional jobs, except for two orthree supervisory jobs in personnel or as "leaders" or coordinatorsof a clerical team.
Public versus private sector is another variable that may affectthe nature of change in secretarial work in the automated office.Public sector secretaries are more likely to be protected by unionsthan are secretaries in the private sector. Increasingly, contract
141

128 NEW TECHNOLOGY AND OFFICE TRADITION
bargaining ;ncludes discussions of the impact of technology onoffice workers. Negotiating points can include job security, wageincreases for word- and data-processing skills learned, ergonomicimprovements, and job design standards.
Resources and Wealth of Office
The quality of secretarial jobs has always varied according tothe resources and wealth of the organization. This is no less truein the automated office. Wealthier firms are the most likely tospend extra dollars for upgrading the ergonomics of the office, i.e.,improving lighting and air quality, purchasing the proper chairsand desks, and keeping the equipment in top-notch condition.They are also the most likely to preserve the private secretarialrole. Secretaries give status to a boss, and this is importantin many offices. It is not cleardespite vendor claimsthat aterminal on the boss's desk can replace the prestige of having asecretary. More likely, those who can afford to maximize theirstatus will have both a terminal and a secretary. Most law firms,for example, have maintained private or shared secretaries as longas the bottom line has permitted.
Poor firms or economically shaky firms (or poor departments),on the other hand, are the most likely to attempt to cut costs bynot replacing secretaries who leave. They may also be more likelyto implement secretarial sharing or minipools in their office whenword processing is brought in. They are also the least likely togive extra pay to secretaries who work for a large number of bossesand who have very heavy work loads.
CONCLUSION
In this paper I have stressed the importance of examining thesocial context in which office automation is occurring in order todetermine its effects on secretaries. I have also pointed out the im-portance of examining the differential effects automation can haveon various "at risk" groups of women office workers, particularlyblack and Hispanic women, who come into offices with differentwork histories and backgrounds but who havemore than manymanagers are prepared to acknowledgethe same expectationsand needs for growth and advancement as their coworkers.
Key factors in my analysis have included gender relations atwork, especially the persistence of a strong patrimonial tradition

MARY C. MURPHREE 129
in boss-secretary relations, and variation in staffing ratio (private,shared, and pool secretaries), which are found in the contempo-rary office. These can either mitigate or exacerbate traditionalsocial relations between bosses and word-processing secretaries inimportant ways.
My focus, which considers office automation from the perspec-tive of the word-processing secretary, suggests hypotheses aboutwhere it is likely to succeed and to fail. Crucial to its success orfailure are the rising expectations working women bring to theirjobs and the limited extent to which these expectations are be-ing met. It appears that too often word-processing secretaries areled to expect more from the new technology than it can realisti-cally deliver, given the strong traditions that continue to shapeoffice organization. The trend toward secretarial sharing and cer-tain pool-like arrangements, along with a lack of training, makeit impossible for many secretaries to learn and perform the morechallenging high-tech tasks technology in principle permits. Thepersistence of patrimony in certain word-processing settings con-tinues to require secretaries to negotiate their job tasks just asthey always have.
Mobility and access to real career ladders continue to be aproblem. In the new, as in the traditional, office, favoritism andmanipulation of a boss is more likely to produce a move upward toa professional position than any reorganization of career laddersthat is technology-driven or management-inspired. Moreover, sec-retaries shuttled from private secretarial status into slots as sharedsecretaries or into strict minipools lose access to even the short-ladder career routes (e.g., pool to exet.utive) that were formerlyavailable.
Wages and salary increases for skills acquired may prove tobe the biggest problem of all. Word-processing secretaries mayhave to work "smarter" and "harder" and learn new skills just tomaintain their jobs and current pay. This is a source of frustrationfor many women who look for incentives to "get on the word-processing bandwagon" and contribute to office productivity.
The dearth of data on the subject should not be minimized.The occupation of secretary has reached a critical juncture in officehistory. Yet, analysis of it and its incumbents currently must bebased on exploratory case study material and crude preliminarysurvey data. Lacking more reliable data, I am sestricted in thispaper to presenting a series of hypotheses.
143

130 NEW TEChNOLOGY AND OFFICE TRADITION
My inquiry suggests a troubling relationship between women'sexperiences in the new office and their expectations, at least inthe typical case in which office automation is experienced as aninvasion of VDT terminals in a piecemeal and unsjstematic fash-ion. Many traditional tasks and rules remain. But there is alsoa troubling trend toward eliminating some secretarial functions.The trend of word processing by professionals, in which authorsor bosses handle everything from the generation of ideas to thegeneration of finished texts, may be growing.
What then becomes of the secretary? What are the conse-quences of these changes for secretarial job design, wages, workingconditions, and mobility? What jobs, if any, can minority womenmove into? What happens to older secretaries? What jobs forwomen office workers will continue to exist?
It is imperative to get answers to these kinds of questions.Careful, systematic research on those pace-setting high-tech envi-ronments that have moved beyond pools or secretarial sharing toa basic redivision of labci may furnish clues to what the nation'slargest women's occupation can expect.
REFERENCESAppelbaum, Eileen
1984 Technology and the Redesign of Work in the Insurance Industry.Project Report No. 84-A22. Institute for Research on EducationalFinance and Governance, School of Education, Stanford University.
Austin, William M., and Lawrence C. Drake, Jr.1985 Office automation. Occupation Outlook Quarterly Spring:16-19.
Baker, Elizabeth F.1964 Technology and Women's Work. New York: Columbia University
Press.Baran, Barbara, and Suzanne Teegarden
1983 Women's Labor in .he Office of the Future, Changes in the Occu-pational Structure of the Insurance Industry. Paper Prepared forthe Conference on Women and Structural Transformation. NewBrunswick, N.J.: Rutgers University (November).
Benston, Margaret Lowe1983 For women, the chips are down. Pp. 44-54 in Jan Zimmerman,
ed., The Technological Woman. New York: Praeger.}Kitson, Tora K., and Barbara A. Gutek
1983 Advanced Office Systems: An Empirical Look at Utilization andSatisfaction. Santa Monica, Calif.: Rand Corporation PublicationSeries.
Born-And..:Aen, Niels1983 The changing roles of secretaries and clerks. In New Office Technol-
ogy: Human and Organizational Aspects. London: Pinter.
144

MARY C. MURPHREE 131
Blauner, Robert1966 Work satisfaction and industrial trends in modern society. In R.
Bendix and S. Lipset, eds., Class, Status and Power. New York: FreePress.
Braverman, Harry1974 Labor and Monopoly Capital. New York: Monthly Review Press.
Crozier, Michel1964 The Bureaucratic Phenomenon. Chicago: University of Chicago
Press.Data-Pro Newsbriefs
1985 Technology and Compensation. In Data-Pro News Briefs, AutomatedOffice Management 8(1):1-2.
Davies, Margery W.1982 Woman's Place Is at the 710avriter: Office Work and Office Workers,
1870-1980. Philadelphia: Temple University.Driscoll, James W.
1979 People and the automated office. Datamation (November):106-112.1982 How to humanize office automation. Office, Technology and People
1:167-176.Duff, Thomas B., and Patricia A. Merrier
1984 Secretaries: caught in the past? Management World (October):9-11.Feldberg, Roslyn L., and Evelyn Nakano Glenn
1983 Technology and work degradation: effects of office automation onwomen clerical workers. Ch. 4 in Joan Rothchild, ed., MachinEz Dea: Feminist Perspectives on Technology. New York: PergamonPress.
Form, William, and David B. McMillen1983 Women, Men, & Machines. Work and Occupations 10(2):147-178.
Fusselman, Kay1986 Do computer skills mean higher pay, better jobs? The Secretary
(June/July)14-23.Gery, Gloria J.
1982 Office technology: creating receptivity among executives and pro-fessionals. National Productivity Review (Spring):204-216.
Giuliano, Vincent E.1982 The mechanization of office work. Scientific American 247(3):148-
164.Glenn, Evelyn Nakano, and Roslyn L. Feldberg
1977 Degraded and deskilled: the proletarian of clerical work. SodalProblems 25(1):52-64.
Goldfield, Randy J., et al.1985 Office technology: advancing or retreating? The Secretary (Novem-
ber/December):5-6.Grandjean, Burke, and Patricia Taylor
1980 Job satisfaction among femaleand Occupations 7(1):33-53.
Gregory, Judith, and Karen Nussbaum1982 Race against time: automation
People 1(2-3):197-236.
clerical workers. Sociology of Work
of the office. Office, Technology, and
1'`)4 -41. .)

132 NEW TECHNOLOGY AND OFFICE TRADITION
Gutek, Barbara, and Tora K. Bikson1985 Differential experiences of men and women in computerized offices.
Sez Roles 13(3,4):123-136.Gutek, Barbara A.
1983 Women's work in the office of the future. Pp. 159-168 in JanZimmerman, ed., The Technological Woman. New York: Praeger.
Hirschhorn, Larry1984 Office Automation and the Entry Level Job: A Concept Paper.
Management and Behavioral Science Center, Wharton School,University of Pennsylvania.
Honeywell Inc.1983 National Survey on Office Automation and the Workplace, a Na-
tional Survey of Managers and Secretaries. Minneapolis, Minn.Iacono, Suzanne, and Rob Kling
1984 Changing Office Technologies and the Transformation of ClericalWork: A Historical Perspective. Working Draft #9D, Public PolicyResearch Organization, University of California, Irvine.
Johnson, Bonnie McDaniel1985 Organisational Design of Word Processing from Typewriter to
Integrated Office Systems. American Federation of InformationProcessing Societies, Inc. Office Automation Conference (Febru-ary).
1984 Getting the Job Done. Glenview, Ill.: Scott, Foresman.Johnson, Bonnie McDaniel, et al.
1985 Innovation in Office Systems Implementation. National ScienceFoundation, Report No. 8110791, Washington, D.C.
Kanter, Rosabeth M.1977 Men and Women of the Corporation. New York: Basic Books.1983 Office automation and people: a new dimension white paper,
prepared for Honeywell Inc., Minneapolis, Minn.Karasek, Robert
1979 Job demands, job decision latitude and mental strain: implicationsfor job redesign. Administrative Science Quarterly 24:285-308.
Kelly Services1982 The Kelly Report on People in the Electronic Office. Survey
conducted by Research de Forecast, Inc., New York.1984 Kelly Report on People in the Electronic Office, Vols. I, II, and
III. Public Relations Department, Detroit, Mich.Kraft, Philip
1985 A review of empirical studies of the consequences of technologicalchange on work and workers in the United States. Pp. 117-150 inTechnology and Employment Effects, Interim Report of the Panel onTechnology and Women's Employment, Committee on Women'sEmployment and Related Social Issues, National Research Council.Washington, D.C.: National Academy Press.
Litwak, Eugene, and Josefina Figueira1968 Technological innovation and theoretical functions of primary
groups and bureaucratic structures. American Journal of Sociology73:468-481.

MARY C. MURPHREE 1.33
Lockwood, David1958 The Blackcoated Worker. London: George Allen & Unwin Ltd.
Machung, Anne1983 From Psyche to Technic: The P'litics of Office Work. Ph.D. disser-
tation. Department of Political Science, University of Wisconsin,Madison.
Marschall, Daniel, and Judith Gregory, eds.1983 Office Automation: Jekyll or Hyde? Cleveland, Ohio: Working
Women's Education Fund.Menzies, Heather
1981 Women and the Chip: Case Studies of the Effects of Informatics on Em-ployment in Canada. Montreal, Canada: The Institute for Researchin Public Policy.
Mills, C. Wright1956 White Collar. New York: Oxford University Press.
Murphree, Mary C.1981 Rationalization and Satisfaction in Clerical Work: A Case Study
of Wall Street Legal Secretaries. Ph.D. dissertation. Departmentof Sociology, Columbia University.
1984a Brave new office: the changing role of the legal secretary. Pp.140-159 in K. Sacks and D. Remy, eds., My ?{roubles Are Goingto Have ?bale with Me: Everyday Picas and Piumphs of WomenWorkers. New Brunswick, N.J.: Rutgers University Press.
1984b Management Discovers Women: The Reorganization of ClericalWorkers in the 1980's. Paper presented at the Sixth BerkshireConference on the History of Women. Smith College, June 1-3.
National Commission on Working Women1979 National Survey of Working Women: Perceptions, Problems, and
Prospects. Washington, D.C. June.9 to 5, National Association of Working Women
1984 The 9 to 5 National Survey on Women and Stress. NationalAssociation of Working Women, Cleveland, Ohio.
Nelson, Kristin Louise1984 Back-Offices and Female Labor Markets: Office Suburbanization
in the San Francisco Bay Area. Ph.D. dissertation. Departmentof Geography, University of California, Berkeley.
Oelrich, Elizabeth S.1968 The Position of the Female Secretary in the U.S. from 1900 through
1967. An Historical Study. Ph.D. dissertation. University of NorthDakota
Otos, Sally, and Ellen Levy1983 Pp. 149-158 in Jan Zimmerman, ed., The Technological Woman. New
York: Praeger.Pomfrett, S.M., et al.
1984 Proceedings of the 1st IFIP Conference on Human-Computer In-teraction. Interact 2:357-363.
Presthus, Robert1978 The Orgarizational Society. Revised edition. New York: St. Martin's
Press.

134 NEW TECHNOLOGY AND OFFICE TRADITION
Professional Secretaries International1984 Secretaries. .. Who Earns What? And Why? Kansas City, Mo.:
PSI Research and Educational Foundation.1983 Consensus Statement. Secretary Speakout '83. Boston, Mass.1981 Consensus Statement. Secretary Speakout '81. San Francisco,
Calif.Professional Secretaries International and the Minolta Corp.
1984 The Evolving Role of the Secretary in the Information Age. Surveysponsored by Minolta Corp., in cooperation with ProfessionalSecretaries International Research and Educational Foundation.Kansas City, Mo.
Pullman, Cydney, and Sharon Szymanski1986 The Impact of Technology on Clerical Worker Skills in the Banking,
Insurance and Legal Industries in New York City: Implications forTraining. A Study for the Private Industry Council of New YorkCity, The Labor Institute. August.
Quinn, Robert P., and Graham L. Staines1979 The 1971 Quality of Employment Survey. Ann Arbor, Mich.: ISR,
Survey Research Center, University of Michigan.Rothschild, Joan, ed.
1983 Machina ez dea: Feminist Perspectives on Technology. New York:Pergamon.
Salmans, Sandra1982 The debate over the electronic office. New York Times Magazine,
November 14, pp. 131-137,157-158.Schlefer, Jonathan
1983 Office automation and bureaucracy. Technology Review (July):32-40.Schrage, Michael
1984 PCs may redefine secretaries' jobs, Washington Post, "WashingtonBusiness," December 17.
Schrank, Harris T., and J.W. Riley, Jr.1976 Women in work organizations. Pp. 82-101 in Juanita Kreps,
ed., Women and the American Economy. Englewood Cliffs, N.J.:Prentice-Hall.
Scott, Joan W.1982 The mechanization of women's work. Scientific American 247(3):
166-187.Spinrad, R.J.
1982 Office automation. Science 215:808-813.Staines, Graham L.
1979 Is worker dissatisfaction rising? Challenge (MayJune):38-45.Suchman, Lucy, and Eleanor Wynn
1984 Procedures and problems in the office. In Technology and People.Amsterdam: Elsevier.
Terkel, Studs1981 American Dreams: Lost and Found New York: Balantine.
The Professional Survey on Secretarial Stress1986 Survey sponsored by Panasonic Industrial Co. and Professional
Secretaries International. The Secretary (March):10-21.U.S. Congress, Office of Technology Assessment
1985 Automation of America's Offices, Washington, D.C.: GovernmentPrinting Office, OTA-CIT-287, December.
1 4 :_

MARY C. MURPHREE 135
U.S. Department of Labor1984 Occupational Outlook Handbook, Washir.gton, D.C.: U.S. Government1985 Printing Office.
U.S. Department of State1975 Secretarial Task Force Report. Washington, D.C.: U.S. Govern-
ment Printing Office.Verbatim Corp.
1982 Office Workers' Views and Perceptions of New Technology in theWorkplace. Survey conducted by Group Attitudes Corp., NewYork.
Watstein, Esther1985 Administrative assistant. Just another title? Biz 16(1):4-9.
Werneke, Diane1984 Microelectronics and Working Women: A Literature Summary.
Committee on Employment and Related Social Issues, NationalResearch Council, Washington, D.C.
Westin, Alan F., et al.1985 The Changing Workplace: A Guide to Managing the People, Organiza-
tional and Regulatory Aopecte of Office Technology. White Plains, N.Y.:Knowledge Industry Publications, Inc.
Women's Bureau1986 Women, Clerical Work, and Office Automation: Issues for Re-
search. Report of a conference co-sponsored by the Women's Bu-reau and the Panel on Technology and Women's Employment,National Research Council. Washington, D.C.: U.S. GovernmentPrinting Office.
1985 Women and Office Automation: Issues for the Decade Ahead.Washington, D.C.: U.S. Government Printing Office.
Yankelovich, Daniel1979 Work, values, and the new breed. In C. Kerr and J. Rosow, eds.,
Work in America, The Decade Ahead. New York: Van Nostrand.Zimmerman, Jan, ed.
1983 The Technological Woman. New York: Praeger.
144

Integrated Circuits/Segregated Labor:Women in Computer-Related
Occupations and High-Tech Industries
MYRA H. STROBER and CAROLYN L. ARNOLD
We are just beginning to see the repercussions in all of ourlives of the technological feat of fitting the electronic wiring andswitches of what was a room-sized computer in 1946 onto a lessthan fingernail-sized piece of silicon and metal by the end of the1970s. This silicon chip is the core of a technological revolution,the result of many attempts over a century to produce a "com-puting machine" that is small, fast, and cheap. Now, as the chipsand, thus, the computers they make possible get smaller, faster;and cheaper, their applications in both old and new products arespawning a new high-technology industry. We see changes in amultitude of workplaces and homes, the expansion of opportuni-ties in existing industries and occupations, and the creation of new
The authors would like to thank Deborah Thresher for her excellentpreliminary research on this topic. An earlier version of this paper was givenat the annual meeting of the American Educational Research Association,New Orleans, April 25, 1984, and benefited from comments by RussellRumberger. We also received helpful comments from Francine Blau andPhilip Kraft on the version presented at the National Academy of Scienceson February 28March 1, 1985.
136
159

MYRA H. STROBER AND CAROLYN L. ARNOLD 137
industries and occupations that were not even imagined just a fewyears ago.
The occupations most involved in the computer revolutionare engineers, computer scientists/systems analysts, programmers,electronic technicians, computer operators, and data-entry work-ers; these occupations are expanding both within the computerindustry and in other industries as well. In addition, the com-puter industry provides new opportunities for managers, clericalworkers, and production workers. Traditionally women have beensharply segregated into different occupations from men and havebeen paid less than men (Gross, 1968; Lloyd and Neimi, 1979;Blau and Hendricks, 1979; O'Neill, 1983; Bielby and Baron, 1984;Strober, 1984; Treiman and Hartmann, 1981). This study posesseveral questions. Are there better opportunities for gender in-tegration and earnings equity in these new occupations that aregrowing rapidly, are exhibiting labor shortages, and are suppos-edly not locked into past traditions and stereotypes? Are therebetter opportunities for gender integration and pay equity in high-technology (high-tech) inc' stries? What does the growth of theseoccupations imply for v-, .en's employment?
This paper is divided into four sections. The first discussesthe details of the occupations we analyze. The second section usespublished data as well as the 1/1000 Public Use Samples (P.U.S.)from the 1970 and 1980 U.S. Censuses to look at how women arefaring in the six major computer-related occupations and in high-tech industries. In the third section, the 1980 published data andthe 1980 P.U.S. are used to examine the relative earnings of menand women in three computer-related occupations in high-techand non-high-tech industries. In the fourth section, we discuss ourfindings and their implications.
In brief, we found that although high tech in general andcomputer occupations in particular are often seen as the greatequalizers, especially for those with higher education, in fact, thereis considerable gender segregation in both high-tech industriesand computer-related occupation:: in all industries; there is alsoconsiderable male-female earnings differentiation. We suggest thatone possible cause of the earnings differentiation is that men andwomen in computer occupations are not employed equally across

138 COMPUTER-RELATED OCCUPATIONS
industries; women tend to be employed more frequently in thelower-paying end-user industries.'
COMPUTER-RELATED OCCUPATIONS
DESCRIPTIONS OF OCCUPATIONS
The development of semiconductors, computers, and com-puter languages spawned several new occupations and expandedseveral others. There are six major computer-related occupationgroupsengineers, computer specialists, engineering and sciencetechnicians, production workers, computer operators, and data-entry operators. For three of these groups (engineers, engineeringand science technicians, and production workers), we have re-stricted the analysis to those employed in the computer industry.For the other three groups (computer specialists, computer oper-ators, and data-entry operators), we have examined employmentin all industries. The following descriptions of the occupationsin these groups are based on definitions in the Standard Occu-pational Classification Manual, 1980 (U.S. Department of Com-merce, 1980), California Employment Development Departmentpublications (ABAG, 1981), and interviews with workers and em-ployment counselors.
Engineers
Engineers design hardware for computers, including the elec-tronic circuits. The largest group of engineers is electrical engi-neers, but mechanical and industrial engineers also work in thecomputer industry. Sometimes they incorporate softvare designsinto the circuits. Engineering is the highest-status and highest-paid computer-related occupation, with engineers generally havingat least a B.S. degree in engineering; many have advanced degrees.
1 We define "end-user" industries as those that use the products of thecomputer industry and make only minor changes to the products to accom-modate their needs, rather than making basic new developments in theseproducts. The companies developing computers and/or their software arepart of the computer industry. The companies in all other industries, whichwill use these computers and/or software, are part of end-user industries.It is true that even within the computer industry the administrative divi-sions of the companies are end-users of computers. However, census data donot permit us to make such fine distinctions within industries, and we areinterested here mainly in any broad differences between industries.
15 ;

MYRA H. STROBER AND CAROLYN L. ARNOLD 139
Computer Specialists
As we look beyond designing hardware to designing software,the sets of instructions that tell the computer which operations toperform, we encounter the computer specialist occupations. Whilecomputer engineers tend to be employed largely by computer com-panies, computer specialists are employed in virtually every majorindustry group. These jobs involve a hierarchy of tasks that usedto be done by one person with the title of computer programmer.
When the first computer was unveiled in 1946 (it was room-sized because the circuits were made with glass vacuum tubes),the engineers who designed it thought that the main task of ar-ranging the circuits had been done, and that giving instructionsto the computer to perform calculations would be a simple clericaltask. So they hired people who usually do clerical taskswomen.In this case the women were recent college graduates with mathbackgrounds. However, these women found that in order to getthe computer to do calculations, they (the programmers) hadto know all about the design of the circuits and the way thosecircuits worked in the computer; they had to tell the computernot only what to do, but how to do it. The simple operation ofperforming calculations (in this case for Navy shell trajectories)became a high-level task that involved a knowledge of logic, math-ematics, and electronic circuits. These women programmed thenecessary calculations and went on to do others. However, thosewho watched the programming process began to realize that pro-gramming was a high-level, challenging, and creative occupation.As the occupation grew, it became largely male (Kraft, 1979).
Ironically, some programming today is akin to the type of cler-ical job that computer designers (mistakenly) thought it would bein the late 1940s. Over time, with the development of higher-levellanguages (closer to human languages)2 and more routine appli-cations, programming tasks that were previously highly skilled,highly paid, and concentrated among highly educated workershave been broken down into more routine tasks and distributedamong less-skilled workers. Kraft (1977) has suggested that, asthis "deskilling" has occurred, it is women who have moved into
2 Note that higher-level languages are closer to human languages andhence are easier to use in programming. Thus, paradoxically, higher".levellanguages require lower skill and have lower prestige associated with theirUse.
1' 3

140 COMPUTER-RELATED OCCUPATIONS
the less-skilled jobs.3 Greenbaum (1979) found that the lowest-level programming jobs were disproportionately occupied by racialand ethnic minorities.
This history of the developing hierarchy in computer program-ming is reflected in the designations given by the Bureau of theCensus to the computer specialist occupations. In 1960 and 1970,computer specialists, including programmers, were included in theprofessional category. By 1980, the Census put the three-digitoccupational category of computer scientists/systems analysts inthe professional category and the three-digit category of computerprogrammers in the technical category.
The following descriptions attempt to capture the current hi-erarchy and educational requirements among computer specialists.Some workers in these occupations do not have formal credentials,having been trained or self-taught on the job. These job titles anddescriptions continue to change and overlap.
Computer scientists and some systems analysts work withengineers to design the overall hardware and software systemsand sometimes know just as much about the hardware, althoughtheir training is more concentrated in the logic and mathematicalmodels of computer systems, rather than on electronic principles.They also develop new languages to be used by other programmers.Generally, they have an M.S. or Ph.D. in computer science (CS)or electrical engineering (EE) or both (CS /EE).
Computer systems analysts conceptualize and plan how a busi-ness or industrial task, such as automating a payroll or an assemblyline, will be solved by computerization. Systems analysts do notwrite the programs but make flow charts to show the subtasks thatneed to be done by people and computers and their sequence andtiming.
Computer programmers are often promoted into systems ana-lysts positions because these positions represent higher-level skills,responsibility, and pay than do programming positions. If systemsanalysts were not previously programmers, their education is ei-ther in business or data processing. There is a debate in this fieldabout whether systems analysts need programming skills or not.
3 Braverman (1974) originally identified and labeled this process as the"degradation of work." It soon became known as "deskilling."
1 r- -1 3 i.fi

MYRA H. STROBER AND CAROLYN L. ARNOLD 141
Systems programmers maintain and modify operating sys-tems systems of programs that coordinate all the hardware ina particular computer so it will run according to certain high-levellanguages. They are also responsible for updating the high-levelsoftware on the system in their particular company. They gener-ally require a B.S., M.S., or Ph.D. in CS, EE, or math.
Programmer/analysts update operating systems and writeprograms that tailor the computer's uses to each individual work-place. Although ready-made software is available for many pur-poses, most firms need programmers to modify or write programsthat reflect their own computing needs. These programmers needto know both operating systems and high-level languages. Ed-ucation requirements are a B.A. in related subjects with someprogramming experience, a B.S. in CS, or an M.B.A.
Software engineers, as some programmers are increasinglycalled, design and write programs in high-level languages specif-ically for certain computers. These programs, often called pack-ages, are sold with the computer to make it easier for nonprogram-mers to use. Packages can include such items as games, accountingprograms, and instructional programs. Producing these programsrequires the creativity to conceptualize and design new ways touse the computer. People writing these software packages requirea good knowledge of the language used to program the softwareand good ideas about marketable packages. Acquiring knowledgeof programming and having creative ideas are more important forjob success than are educational degrees. Consequently, a rangeof people, from high school students to Ph.D.s, are designing andwriting software.
Programmers, sometimes called coders or applications pro-grammers, are mainly translators. They translate instructionsfor a certain application in one language into the programminglanguage that their particular computer will use to produce ' ;.,same results. The job category itself encompasses a range of skilland creativity from routine coding of sections of an applicationprogram to a task more like a programmer/analyst, dependingon their industry or firm. These jobs can be done with less thana B.S. in CS. However, if those with a B.S. degree are available,employers often prefer to hire them.
1. r ati

142 COMPUTER-RELATED OCCUPATIONS
Engineering and Science Technicians
A third major group of computer-related workers is engineer-ing and science technicians. This group is found in the com-puter industry and is mainly made up of engineering technicianstrained in electronics, although there are also some science techni-cians working within the industry. The electronic technicians haveenough specialized knowledge of electronics to be able to construct,test, and repair the circuitry and components of computers thatthe engineers design and to understand engineering specificationsand problems. Although they do not do original design work, theyoperationalize designs, test them, and then advise engineers onpossible modifications. They work both in research design and inproduction to test and troubleshoot both new and existing prod-ucts. Also included in the engineering tecnnician category aredrafters, who, using both manual and computer-assisted draftingtools, make drawings of the circuit boards and components thatthe engineers design. The standard degrees are the 2-year asso-ciate of arts (A.A.) or associate of science (A.S.) for an engineeringor science technician and an A.A. in drafting for a drafter.
Computer Operators
The fourth computer-related occupational group is computeroperators. They are employed in all industries. Computer opera-tors run the external operation of the computer; ensure that thecomputer receives the programs and data; and coordinate disks,tapes, and printing connections to the computer, either manu-ally or by supervising automated systems. This occupation rangesfrom active high-level interactions with the programs to routinizedsupervision of automated systems. It is sometimes an entry-leveljob leading to low-level programming. Education needed is simpleknowledge of the equipment from a short training course and/orfrom experience. The occupation is rapidly being deskilled as moreof its functions become automated.
Data-Entry Operators
Data-entry operators, the fifth computer-related occupation,put information into a form that can be read by a computer. Thisinformation used to be keypunched onto cards but is now almostalways put onto tapes or disks from terminals. The operators,
1 5 6

MYRA H. STROBER AND CAROLYN L. ARNOLD 143
who basically type numbers and letters into a terminal, requiretraining in typing. They are also employed in all industrie3.
Production Workers
The sixth major computer-related occupation is productionworker. While many of the production jobs are similar to those inether industries, the following jobs are unique to semiconductorand computer production. There are generally no specific edu-cational requirements for these jobs, although people with someknowledge of electronics are generally preferred. Often hazardouschemicals are used in the production process.
Semiconductor processors put materials through chemical andmechanical processes to create semiconductor integrated circuitson chips. They work either manually or, as these tasks becomemechanized, with processing machines.
Semiconductor assemblers assemble chips into wired deviceswhich become the complete integrated circuit. This includes bond-ing wires to circuits, a task which is done under a microscope, andcleaning the circuits with chemicals.
Electronic assemblers assemble the integrated circuits andother electronic components into a frame that becomes the fin-ished product (e.g., a computer). Electronic assemblers can bepromoted to electronic testers, who test chips, boards, and com-ponents as they go through assembly, or electronic inspectors, whoexamine the components for errors and specification requirements.
A skilled occupation that is sometimes part of productionand sometimes part of customer service is data-processing repair,which involves installing and repairing data-processing machineryin offices and on production lines. This job category includes arange of workers from electronic mechanics to assembly and wiringtechnicians.
There are also, of course, managerial, professional/technical,sales, clerical, and service occupations within the computer indus-try. These jobs tend to be similar to such jobs in other industries.
GENDER SEGREGATION
COMPUTER-RELATED OCCUPATIONS
In this section we begin the analysis of gender segregation byexamining trends in total employment and women's employment

144 COMPUTER-RELATED OCCUPATIONS
in computer-related occupations. Table 1 presents data both foroccupations that are computer related regardless of their industry(computer specialists, computer operators, data-entry operators,and data-processing repairers) and for occupations that are com-puter related only when found in computer industries (engineers,engineering and science technicians, and most production work-ers). As Table 1 shows, between 1970 and 1980, employment incomputer-related occupations grew about 80 percentfrom about1.5 million to 2.4 million. However, although the growth of theseoccupations is widely heralded, it is important to note that theyrepresented only 2.0 percent of all employment in 1970, and 2.5percent in 1980. (Among all women workers, those in computeroccupations represented 2.3 percent of employment in 1970 and2.9 percent in 1980. The corresponding percentages among menworkers were 1.8 percent in 1970 and 2.2 percent in 1980.)
This growth took place in the context of increasing participa-tion in the labor force by women. In 1970, women were 38 percentof the U.S. labor force; by 1980, they were 43 percent. However,in both those years, women's representation in computer-relatedoccupations was either considerably below or considerably abovetheir representation in the labor force as a whole, depending onthe specific occupation.
Despite the fact that the computer-related occupations are ofrelatively recent origin, they are already remarkably segregatedby gender. In 1970, women were 2 percent of all engineers inthe computer industry; in 1980, that figure had risen to only5 percent. Thus, in the highest-paid, highest-prestige computer-related occupation, women are virtually absent.
Among computer specialists in all industries, the situation issomewhat better, although women are still below their proportionin the overall work force. In 1970, women were 15 percent ofall computer scientists/systems analysts. This occupation morethan doubled from 1970 to 1980 (from 93,000 to 201,000), butby 1980, women were still only 22 percent. Among programmers,the proportion of women also increased, but they were also stillunderrepresented. The number of programmers almost doubled(from 161,000 to 313,000), and the proportion of women grewfrom 23 percent in 1970 to 31 percent in 1980.
Women were better represented among engineering and sci-ence technicians in the computer industry than among engineers,but were less well represented than among computer specialists.
1 5 .3

MYRA H. STROBER AND CAROLYN L. ARNOLD 145
TABLE 1 Total and Women's Employment in Computer-Related Occupations,1970 and 1980
Occupation
1970 1980
NumberPercentWomen Number
PercentWomen
Total employed in labor force 76,553,599 38 97,639,355 43Total employed in computer-
related occupations 1,497,683 -- 2,424,240 --Engineers- 90,626 2 125,055 5
Electrical/electronic engineers 47,004 2 67,320 4Computer specialists 254,537 20 513,863 28
Computer scientists/systems analysts 93,200 15 200,684 22Computer programmers 161,337 23 313,179 31
Engineering and science technicianA 58,292 11 90,990 17Electronic technicians 31,454 11 60,299 15Drafters 16,963 7 16,726 16
Computer operators 117,222 29 408,475 59Data-entry operators 272,570 90 378,094 92Production workers- 680,299 46 872,345 49
Operatives, fabricators,transporters, and laborers 519,221 58 591,091 58
Assemblers 158,191 74 208,284 72Electronic assemblers -- -- 55,879 77
Data-processing repairers- 24,137 3 35,418 88
Percent of total employed labor forcein computer-related occupations 1970 1980
2 0 2.5
NOTE: Computer-related occupations are defined in Appendix B.
lEmployment data for these occupations are only for the computer industry defined astwo three-digit industries: Electronic Computing Equipment (SIC Codes 1970 189,1980'322) and Electrical Machinery, Equipment, and Supplies, not elsewhere classified,including semiconductors (SIC Codes 1970.208; 1980:342). Data for all other occupationsare for all industries.
-Workers not in the computer industry; data-processing repairers in the computerindustry are included in "Production workers" above: 6,707 in 1970 and 11,208 in 1980.Women also accounted for 3 and 8 percent, respectively in 1970 and 1980, for theserepairers.
SOURCE. 1970 data, Bureau of the Census (1972.Table 8), 1980 data, Bureau of the Census(1984.Tables 1 and 4).
In 1970 in the computer industry, women were 11 percent of engi-neering and science technicians; in 1980 they represented 17 per-cent. They were similarly represented among electronic/electricaltechnicians-11 percent in 1970 and 15 percent in 1980. Asdrafters, women did less well in 1970 than other technicians-only 7 percent were women-but did better in 1980, when 16percent were women.
15 3

146 COMPUTER-RELATED OCCUPATIONS
Initially, there was no clear indication as to which genderwould be assigned to the occupation of computer operator. In1960, when there were only 2,000 computer operators, women held65 percent of the jobs (Dicesare, 1975). Between 1960 and 1970,the jobs in this occupation increased more than 50-fold, to 117,000.More of these new jobs were filled by men than by women so thatin 1970, women were only 29 percent of all computer operators.In the period from 1970 to 1980, however, while the occupationincreased fourfold, to 408,000, more of the new additions to theoccupation were women, so that in 1980, women were 59 percentof all computer operators.
Like most clerical occupations, data entry is preponderantlyfemale. In 1970 women were 90 percent of data-entry operators.Between 1970 and 1980 the occupation became even more seg-regated so that by 1980 women represented 92 percent of suchoperators.
Of all production workers in the computer industry, womenwere only slightly over their representation in the labor force asa whole: 46 percent in 1970 and 49 percent in 1980. However,when we look more closely at the less-skilled production occupa-tions, women's representation is much higher. Of all the operators,fabricators, laborers, and transportation workers, a group whichincludes the semiconductor processors and assemblers and all otherlower-level production workers in the computer industry, womenrepresented 58 percent in both 1970 and 1980. Among assemblers,a subset of operatives, women were about 73 percent in 1970 and1980. Of electronic assemblers, a group identified only in 1980,women were an even higher proportion: 77 percent.4 However,in the occupation "data-processing machine repairers," we findagain the extraordinary gender segregation we often see in techni-cal occupations: women held 3 percent of these jobs in 1970 and 8percent in 1980.
In Table 2 we present the difference between the percentageof women in the total labor force and the percentage of womenin each computer-related occupation listed in Table 1. This dif-ference represents a rough measure of occupational segregation. Ifwe compare the data for 1970 and 1980 we find that except for
4 In Silicon Valley in 1981, 40 percent of women assemblers were ethnicminorities (Rogers and Larsen, 1984). This production occupation is evenmore segregated abroad (Grossman, 1980).

MYRA H. STROBER AND CAROLYN L. ARNOLD 147
TABLE 2 Underrepresentation of Women in Computer-Related Occupations
IndexOccupation 1970 1080
Engineers 36 38Electrical/electronic engineers 36 39
Computer specialists 18 15Computer scientists/systems analysts 23 21Computer programmers 15 12
Engineering and science technicians.4 27 26Electronic technicians 27 28Drafters 31 27
Computer operators 9 -16Data-entry operators -52 -49Production workers -8 -6
Operatives, fabricators,transporters, and laborers -20 -15
Assemblers -36 -29Electronic assemblers -- -34bData-processing repairers 35 35
NOTE: Data from Table 1. The index is defined as the differencebetween percent women in total labor force and percent women in eachcomputer-related occupation. Computer-related occupations are definedin Appendix B.
b4Same as Table 1.Same as Table 1.
computer operators, the level of segregation was approximatelythe same for the 2 years.
Table 3 presents total employment and women's employmentfor the computer industry and for computer-related occupations inall other industries. These totals show the number of people whoare involved in developing, maintaining, or supporting the produc-tion of computers in the computer industry, plus those working inoccupations that were created as a result of the computer revolu-tion.
Between 1970 and 1980, combined employment in the com-puter industry and computer-related occupations grew about 60percentfrom about 1.8 million to 2.9 million. Still, they repre-sented only 2.4 percent of all employment in 1970 and 3.0 percentin 1980. (Among all women workers, those in the computer in-dustry and computer occupations represented 2.7 percent of em-ployment in 1970 and 3.4 percent in 1980. The correspondingpercentages among men workers were 2.3 percent in 1970 and 2.8
161

00
TABLE 3 Total and Women's Employment in the Computer Industry and in Computer-RelatedOccupations in All Industries, 1970 and 1980
1970 1980Industry or Number Percent Number PercentOccupation Employed Women Employed Women
Total employed in labor force 76,553,599 38 97,639,355 43aTotal employed in computer industryand computer-related occupationsin all other industries 1,805,481 43 2,940,891 48
Total in computer industry-1 1,173,866 38 1,685,461 41Executives, managers, and
administrators 66,043 6 181,362 11Professional/technical 229,017 9 321,185 12Sales 19,093 7 38,447 15Administrative support and clerical 158,276 66 243,693 70Services 21,138 19 27,728 20Production 680,299 46 873,046 49bTotal in computer-related occupations
in all other industriesS 631,615 -- 1,255,430 --Computer scientists/systems analysts 81,794 15 174,299 23Computer programmers 146,565 23 282,673 32Computer operators 112,646 30 394,421 59Data-entry operators 266,473 90 368,619 92Data-processing repairers 24,137 3 35,418 8

Percent of total employed labor force 1970 1980in computer industry and computer-related 2.4 3.0occupations in all other industries
!Computer Industry defined as two three-digit industries: Electronic ComputingEquipment Manufacturing (SIC Codes 1970:189; 1980:322) and Electrical Machinery,Equipment, and Supplies, not elsewhere classified (including semiconductors) (SIC Codes1970:208; 1980:342). Although an effort has been made by the authors to achieveconsistency, these occupational categories do not include precisely the same occupationsin 1970 and 1980, so the percentage of women in each category should be interpreted as thepercentage of women in that category as it was defined in each year rather than directlycomparing the percentages between years. However, the total employed in the computerindustry for each year includes all occupations, so these percentages can be directlycompared. For the computer industry data, a detailed listing of the occupational, ategories used here for 1970 and 1980 is available from the authors.Computer-related occupations are defined in Appendix B.Calculated by subtracting number employee. in these occupations in the computer industryfrom number employed in all industries.
SOURCE: 1970 data, Bureau of the Census (1972:Table 8); 1980 data, Bureau of the Census(1984:Tables 1 and 4).

150 COMPUTER-RELATED OCCUPATIONS
percent in 1980.) Although there appear to be changes between1970 and 1980 in the percentage of women in the occupations listedin Table 3, changes in occupational definitions during the 10-yearperiod were such that the categories cannot be reliably compared.
GENDER, RACE, AND ETHNIC DISTRIBUTIONIN FOUR COMPUTER-RELATED OCCUPATIONS
If we look more closely at the four computer-related occupa-tions that are present in all industriescomputer scientists /sys-tems analysts, computer programmers, and data-entry operatorswe can see how women and men in the three largest racial andethnic groups are represented. Table 4 shows that in the employedlabor force as a whole, white men are 50 percent of the workers,white women are 36 percent, black men are 4.8 percent, blackwomen are 4.8 percent, and other racial groups make up 8.4 per-cent of the workers. Men and women of Spanish origin, who can beof any race, represent 3 and 2 percent of the workers, respectively.
In the occupations of computer scientist, systems analyst, andcomputer programmer, women of all groups and minority men areunderrepresented compared to their representation in the laborforce as a whole, while white men are overrepresented. Withineach racial and ethnic group, men are better-represented thanwomen.
Among computer scientists/systems analysts, the highest paidof these four occupations, white men hold 71.3 percent of the jobs,which is much higher than their representation of 50 percent inthe labor force. White women occupy 19.5 percent of the jobs,only half as high as their representati- in the labor force Blackmen are less represented in this occia, ,n than in the labe r force(3 percent versus 4.8 percent). Black women's representation iseven poorer, 1.7 percent in computer scientists/systems analystsversus 4.8 percent in the labor force. People of other races are onlyabout half as well represented in this occupation as in the laborforce. Like black men, the representation of men of Spanish originis just over half that of their presence in the labor force (1.8 versus3 percent). Women of Spanish origin are virtually unrepresented;they are only 0.1 percent of computer scientists/systems analysts,though they are 2 percent of the labor force.
Among computer programmers, the next lower paying occu-pation, white men are still overrepresented, and the other groups
164

TABLE 4 Employment Distribution by Race, Spanish Origin, and Gender, Total Labor Force andFour Computer-Related Occupations, 1980 (in percent)
Race, Origin,and Gender
TotalLabor Force(N = 97,639,355)
ComputerScientists/SystemsAnalysts(N = 200,684)
ComputerProgrammers(N = 313,179)
ComputerOperators(N = 408,475)
Data-EntryOperators(N = 378,094)
WhiteMen 50.0 71.3 62.2 33.9 5.7Women 36.0 19.5 26.5 49.5 71.3
BlackMen 4.8 3.0 3.1 4.7 1.1Women 4.8 1.7 2.5 6.9 15.1
Other races 8.4 4.5 5.7 5.0 6.8Total 100.0 100.0 100.0 100.0 100.0
Spanish originMen 3.0 1.8 1.9 2.4 0.1Women 2.0 0.1 0.1 2.8 5.7
Not of Spanishorigin
95.0 98.1 98.0 94.2 94.8
Total 100.0 100.0 100.0 99.4 100.6
NOTES: Not all columns total 100.0 due to errors in rounding Persons of Spanish origin can be of any race.
SOURCE: Bureau of the Census (1984:Table 1).

152 COMPUTER-RELATED OCCUPATIONS
are still underrepresented, but scdnewhat less so. White men areoverrepresented by 12 percentage points (62.2 percent versus 50percent) and white women are underrepresented by 10 percentagepoints (26.5 percent versus 36 percent). Blac:, men's represen-tation is still about 3 percent, but black women's representationhas increased to 2.5 percent. However, both percentages are be-low their share of the labor force. Other racial groups have alsoincreased their representation, but it is still below their laborforce representation. Men and women of Spanish origin have vir-tually the same representation among computer programmers asamong computer scientists/systems analysts-1.9 and 0.1 percent,respectively.
This situation changes and in some cases reverses itself inthe lower-paying occupation of computer operator. White menare now only one-third of the workers, 16 percentage points lessthan in the labor force, and white women are now half of theworkers, 14 percentage points above their representation. Blackmen's representation is about the same as in the labor force, andblack women's representation is higher among computer operators(6.9 percent) than in the labor force (4.8 percent). People ofother racial groups are still underrepresented, however. Men ofSpanish origin have a representation among computer operatorsbelow their labor force percentage, while the percentage of womenof Spanish origin is above their percentage in the labor force. Thus,in this lower-paid computer occupation, white and black womenand women of Spanish origin are overrepresented, and white menare underrepresented, while the percentage of black men and menof Spanish origin reflects their percentage in the labor force as awhole.
When we look at the lowest-paid computer occupation of data-entry operator, a clerical occupation, we see that all women'srepresentation is dramatically higher and all men's representationis dramatically lower than for the other occupations listed in Table4. White women are 71 percent of data-entry operators, twice theirlabor force representation. Black women and women of Spanishorigin are represented in this occupation with a frequency threetimes greater than their representation in the labor force-15 and6 percent, respectively.
Like gender, race and ethnicity of workers in computer occu-pations is associated with pay and status of the occupation. Thehigher status and pay of an occupation, the more white men are
1 6 6

MYRA H. STROBER AND CAROLYN L. ARNOLD 153
overrepresented and the more minority men and all women areunderrepresented. In occupations with lower pay and status, thepresence of white men drops to much below their percentage of thelabor force, the percentage of women of all races becomes higherthan their labor force percentage, and the percentage of minoritymen approaches their labor force representation. In an occupationthat is clerical, women's representation doubles and triples abovetheir labor force percentage, and men virtually disappear.
HIGH -TECH INDUSTRIES
This section looks at how women are faring not just in comput-er-related occupations but in the group of industries known as"high tech," of which the computer industry is one part. We areinterested in whether the computer industry and other high-techindustries, because they are growing rapidly and are relativelynew, are, therefore, perhaps less gender stereotyped and morehospitable to women than are non-high-tech industries.
The Bureau of Labor Statistics recently reviewed all currentdefinitions of high-tech industries and developed a range of def-initions based on three factors (Riche et al., 1983:51): "(1) theutilization of scientific and technical workers, (2) expenditures forresearch and development, and (3) the nature of the product ofthe industry."
Different combinations of these factors produced three groupsof high-tech industries, from the least-inclusive definition with6 three-digit industries, to the most-inclusive definition with 48three-digit industries. In some respects, the most intuitively ap-pealing definitions of high-tech industries are the least inclusive(drugs; office, computing, and accounting machines; electroniccomponents and accessories; miscellaneous electrical machinery;aircraft and parts; and guided missiles and space vehicles). How-ever, the P.U.S. 1/1000 sample of employment in these six indus-tries is too small for the kinds of analyses we wish to do. Thus, weuse as our definition of high-tech industries the middle group of28 three-digit industries: 26 manufacturing industries (includingcomputers and semiconductors) with a proportion of technologi-cally oriented workers equal to or greater than the average for allmanufacturing industries and a ratio of R&D expenditure to salesclose to or above the average for all industries, and 2 nonman-ufacturing industries that provide technical support to high-tech

154 COMPUTER-RELATED OCCUPATIONS
TABLE 5 Number Employed in High-Tech Industries as Percentage of rmployedLabor Force, 1970 and 1980
1970 1980Number Percent of Number Percent ofEmployed All Employed Employed All Employed
All workers 4,557,000 6.5 6,060,000 6.4
All women 1,254,000 5.0 2,026,000 5.1
All men 3,303,000 7.4 4,034,000 7.4
NOTE: See Appendix A for definition of high-tech industries.
SOURCE: Calculated by authors from U.S. Census (1/1000 P.U.S. Tape, 1970 and1980).
manufacturing industries (computer and data-processing services,and research and development laboratories) (Riche et al., 1983). Alist of the industries designated as high tech appears in AppendixA.
Although employment in high-tech industries grew over the1970-1980 decade from 4.6 million to 6.1 million, these industriesemployed only about 6.5 percent of all employed workers, about5 percent of all women workers and about 7.4 percent of menworkers. Table 5 presents these employment trends for high-techindustries.
We find also that these industries are no less segregated bygender than are other industries and, in fact, may be even moreso. Table 6 shows that in both 1970 and 1980, most men in high-tech industries were in management, professional/technical work,or production, while most women were in clerical work or produc-tion. Compared to women in non-high-tech industries, women inhigh-tech industries are less likely to be in managerial and profes-sional/technical jobs and are much more likely to be in productionwork. High-tech industries provide more low-status occupations towomen, as a group, than do non-high-tech industries. By contrast,men in high-tech industries are more likely to be in managerial orprofessional/technical positions than are men hi non-high-tech in-dustries.
168

MYRA H. STROBER AND CAROLYN L. ARNOLD 155
TABLE 6 Percentage of Men and Women Employed in High-Tech Industries andNon-High-Tech Industries, 1970 and 1980
High-Tech Industries Non-High-Tech IndustriesOccupation Men Women Men Women
1970Number ( thousands)
Total 3,195 1,205 39,357 23,676
Percentage distribution
Managers 10 3 13 5Professional
and technical 27 6 12 16Sales 3 <1 8 10Clerics! 8 36 7 33St "Aces 2 1 8 20Production 48 55 37 14Other (farm and
transportation) 2 <1 14 1
1980Nu lm2criousanc131
Total 4,034 2,206 50,263 37,729
Percentage distribution
Managers 14 6 13 8Professional
and technical 26 10 13 18Sales 3 1 10 11Clerical 8 35 7 31Services 3 2 9 18Production 44 46 36 11Other (farm and
transportation) 3 1 12 2
NOTE: See Appendix A for definition of high tech and non-high tech.Occupational categories were adjusted for consistency between 1970 and1980 by the authors; a detailed listing of the categories is availablefrom the authors.
SOURCE: Calculated by authors from U.S. Census (1/1000 P.U.S. Tape, 1970and 1980).

156 COMPUTER-RELATED OCCUPATIONS
ANALYSIS OF RELATIVE EARNINGS OF WOMEN ANDMEN IN THREE COMPUTER-RELATED OCCUPATIONS
UNCORRECTED EARNINGS DIFFERENTIALS
To examine salary differences between women and men weanalyze three computer-related occupations where a sufficientnumber of jobs (at least 20 percent) are held by the "minor-ity gender " computer scientists/systems analysts, computer pro-grammers, and computer operators.5 We find that even whenwomen are employed in the same occupations as men, they do notreceive the same pay.
We used two sources to calculate the gender differential inpaythe published census reports, where the only available mea-sure was the mean annual earnings, and the census P.U.S. sam-ples, where we could calculate the median hourly earnings. Witheach source, for the years available, we calculated the ratio ofthe women's earnings to men's earnings for each of these threeoccupations in all industries combined. As each source has bothadvantages and disadvantages, we present data from both.
The advantage of using the published census reports is thatthey are more accurate than the samples. The disadvantages arethat only the mean annual earnings are available for 1980, and themean is a poor estimate of average earnings since it is so influencedby a few high values. In addition, since the median was used asan estimate for most of the comparable occupations in 1970, the2 years could not be compared, except in the combined categoryof computer specialist. Another disadvantage is that the use ofannual earnings precludes controlling for part-time or part-yearworkers.
The advantages of using the census samples are that we couldcalculate the medianthe most accurate estimate for averageearningsfor each occupation and year and could control for part-time and part-year workers by calculating the hourly earnings,
5 Although production workers also qualified under the criterion, we didnot study them, because they are only "computer related" if they are in thecomputer industry, and isolating that industry would have created too smalla sample. In addition, we wanted to compare computer-related occupationsacross industries, and computer-related production workers by definition arenot included in other industries.
6 Hourly earnings were calculated by dividing each person's yearly salary(from the year prior to the census year) by the number of weeks worked (in

MYRA H. STROBER AND CAROLYN L. ARNOLD 157
The disadvantage is that the estimates were subject to large stan-dard errors.
Interestingly, the two sources of income data produced similarand consistent results. Table 7 contains the uncorrected genderdifferentials in pay, based on the published census data. In the firsttwo columns are the numbers (in thousands) of total employees(men and women) in each occupation in 1970 and 1980. Thesecond two columns show percentages of all employees who werewomen in each year. The next four columns show, for the years itwas available, the mean annual earnings of men in that occupationand the ratio of women's mean annual earnings to men's earnings.This ratio is the gender differential in pay for each occupation,with no controls for education or experience.
For the combined computer specialist occupations, the uncor-rf -led ratio of women's to men's mean annual earnings was 0.71 in1970 and 0.72 in 1980. This constancy of the ratio is noteworthy,as employment more than doubled over the 10-year period and theproportion of women in these occupations increased by 40 percent.
In 1980, the uncorrected ratio of women's to men's meanannual earnings was available for the three occupations. For bothcomputer scientists/systems analysts and computer programmers,the ratios were 0.73. For computer operators the ratio was 0.65.Since these were not corrected for part-time or part-year workers,we would expect the ratio estimates that did have these correctionsto be somewhat higher, and they were.
Table 8 contains the gender differentials in pay based on theP.U.S. samples, corrected for part-time and part-year workers butnot for education or experience. In the first two columns are thesample numbers of men and women employed in each occupationin 1970 and 1980. These numbers are the samples upon which theearnings estimates are based. The second four columns show, foreach year, the median hourly earnings of men in the occupationand the ratio of women's median hourly earnings to men's earnings.
For the occupation computer scientist/systems analyst, theratio of women's to men's median hourly earnings was 0.75 in1970 and 0.74 in 1980. Again, such constancy is noteworthy since
the year prior to the census) and dividing that by the hours they worked inan average week. Because the data are based on the respondents' estimateof the average hours worked, the data are subject to possible errors.

TABLE 7 Employment and Annual Earnings for Men and Women in Three Computer-RelatedOccupations in All Industries, 1970 and 1980
TotalNumber Employed(thousands)
PercentWomenEmployed
Mean Annual Earnings
Men'sEarnings
F/M EarningsRatio
Occupation 1970 1980 1970 1980 1970 1980 1970 1980
Computerspecialists 254,537 513,863 20 28 $11,004 $20,090 0.71 0.72
Computerscientists/systemsanalysts 93,200 200,684 15 22 n.a. 23,405 n.a. 0.73Computerprogrammers 161,377 313,179 23 31 n.a. 17,967 n.a. 0.73Computeroperators 117,222 408,475 29 59 n.a. 14,203 n.a. 0.65
NOTE: See Appendix B for the definition of computer-related occupations.
SOURCE: 1970 data, Bureau of the Census (1972.Table 8); 1980 data, Bureau of the Census (1984:Table1).
1 7 )
41=11111,

MYRA H. STROBER AND CAROLYN L. ARNOLD 159
TABLE 8 Employment and Hourly Earnings for Men and Women in ThreeComputer-Related Occupations in All Industries, 1970 and 1980
TotalNumber Employed(sample size)
Median Hourly EarningsMen'sEarnings
F/M EarningsRatio
Occupation 1970 1980 1970 1980 1970 1980
Computer scientists/systems analysts 105 199 $5.17 $13.19 0.75 0.74
Computer programmers 155 312 4.10 8.12 0.85 0 83Computer operators 106 456 3 15 6.38 0.63 0.69
NOTE. See Appendix B for the definition of computer-related occupations. For1980, computer operators included computer equipment operator supervisors.
SOURCE: Calculated by authors from U.S. Census (1 /1000 P.U.S. Tape, 1970 and1980).
employment more than doubled over the decade. It is also inter-esting that correcting for part-time and part-year workers doesnot increase this differential to much above the estimate from thepublished data for computer specialists.
Among programmers, there was still a gender differential aftercorrecting for part-time and part-year workers, althou&h the gapwas smaller than that for computer scientists and systems analysts.The ratio of women's to men's median hourly earnings was 0.85in 1970 and 0.83 in 1980again, remarkably constant given themore than doubling of employment in the occupation.
For computer operators there was a rise in the differential withthe correction for part-time and part-year workers. In 1970, whenwomen had only 29 percent of the jobs, the female/male ratio ofmedian hourly earnings was 0.63. By 1980, the gender divisionof labor had reversed and women dominated the occupation, with59 percent of all the jobs. Still, the earnings ratio was 0.69, quiteclose to what it had been 10 years earlier.
Although the sources are based on different measures andsamples, they both show that women earn substantially less thanmen in these three occupations and that these ratios do not changemuch over time. Clearly, earnings equity is not an automatic resultof the existence or the growth of these occupations.

160 COMPUTER-RELATED OCCUPATIONS
Despite the fact that women earn less than men in computerprogramming and computer science/systems analysis, professionalcomputer-related occupations are financially attractive for women.Relative to what professional women earn in other occupationsrequiring similar years of educational attainment, computer pro-gramming and systems analysts positions enable women to earnat the top of the female earnings hierarchy. Table 9 shows that forwomen in 1981, computer systems analysts was the second highestpaying occupation and computer programming the seventeenthhighest. In both of these occupations, women earned more on av-erage than they did in secondary school teaching (Rytina, 1982),despite the fact that in 1980 the mean educational attainment wasonly 15.75 years for women systems analysts and only 14.88 yearsfor women computer programmers. For women secondary schoolteachers, the mean educational attainment was 16.43 years in 1980(according to P.U.S.).
EARNINGS REGRESSIONS
Earnings differentials between women and men in the sameoccupations are in part a result of differences between women'sand men's human capital and productivity and in part a result ofwage discrimination (lower payment to women even after humancapital and productivity have been held constant). To what extentis wage discrimination against women present in the relatively newcomputer occupations? Does employment in a high-tech indus-try lessen wage discrimination within the computer occupations?In order to answer these questions, we ran OLS (ordinary leastsquares) regressions for the three computer-related occupationsin 1970 and 1980 on the natural log of hourly earnings using theP.U.S. samples. The independent variables we used to proxy hu-man capital and productivity were determined by the availabilityof data. The census 1/1000 P.U.S. reports age, years of education,and gender but not years of work experience, type of degree, orfield of college major. We used AGE and AGE2 as continuousvariables. We divided years of education into six categories, re-flecting the fact that number of years of education affects one'sposition in the labor market in a discontinuous fashion. The cat-egories are: eight years or less; some high school; high schoolgraduate; some college; college graduate; and more than a college

MYRA H. STROBER AND CAROLYN L. ARNOLD 161
TABLE 9 Occupations with Highest Median Weekly Earnings for WomenEmployed Full Time in Wage and Salary Work, 1981 Annual Averages
Occupational TitledFemale
bEarnings
Operations and systems researchers and analysts $422Computer systems analysts 420Lawyers 407Physicians, dentists, and related practitioners 401Social scientists 391Teachers, college and university 389Posta'. clerks 382Engineers 371Ticket, station and express agents 370School administrators, elementary and secondary 363Life and physical scientists 357Health administrators 357Public administration officials and administrators,
not elsewhere classified 337Vocational and educational counselors 336Registered nurses 331Personnel and labor relations workers Z.30Computer programmers 329Editors and reporters 324Secondary schoolteachers 321Librarians 318
klccupations listed are those in which female employment was 50,000 or morebn 1981.Excludes earnings from self-employment.
SOURCE: Rytina (1982), based on Current Population Survey data.
degree. The category "some college" was the reference group andwas omitted from the regression.
These variables have some serious deficiencies as indicatorsof education and productivity. Although age is often used as aproxy for work experience, a component of human capital, ageis less likely correlated with years in the labor force for womenthan it is for men, and is, therefore, a less than satisfactory proxyfor experience. Level of education, although frequently used as ameasure of human capital and productivity, says nothing aboutthe quality or type of education. Because our controls for humancapital and productivity are problematic, the gender variable is

162 COMPUTER-RELATED OCCUPATIONS
a poor measure of discrimination.? We use age and level ofeducation as control variables only because we have no others; wehave traded off poor human capital proxies for the relatively largesamples of these three occupations which the Census provides.
In addition to human capital variables, the regressions havetwo dummy variables: GENDER (equal to one for women) andHTECHIND (equal to one for those employed in a high-techindustry). Race and ethnicity could not be included as variablesbecause the number of minorities in the P.U.S. sample was toosmall. The combined effects of the human capital variables andthe two dummy variables, GENDER and HTECHIND, on salarywere tested in an additive model.8
For computer scientists/systems analysts in 1970, age, gender,education, and industry type explained 20 percent of the variancein the log of hourly earnings (see Table 10); however, only having acollege degree and older age were significantly related to earnings.By 1980, only 10 percent of the variance was explained by thesefour factors. Age and a college degree still significantly increasedearnings, but gender less significantly decreased earnings. Holdingthe other variables constant, having a B.A. or B.S. increased one'ssalary by 27 percent, while being a woman decreased it by 20percent. The drop in explained variance suggests that by 1980other unmeasured factors were beginning to affect salaries for thisoccupation. Being in a high-tech industry was not significantlyrelated to earnings for computer scientists/systems analysts.
For computer programmers, we saw a more dramatic trend.In 1970, age, education, gender, and industry explained almostnone of the variance. However, by 1980, 20 percent of the variancewas explained by these factors, and all but industry type weresignificantly related to earnings. Age and having a B.A./B.S. ormore than a B.A./B.S. significantly increased earnings, while gen-der, somewhat less significantly, decreased earnings. The changesin the effects of age and education may reflect the formalization
7 See Strober and Reagan (1982) for a discussion of the problems ofusing regression techniques to measure discrimination.
8 We also ran regressions with the education and high-tech variablesinteracted with gender, testing a multiplicative model. No interactions weresignificant in 1980, the few interaction terms that were significant in 1970could have been so by chance, and most residuals in the additive model wereacceptable. Thus, we followed the usual statistical practice of reporting themore parsimonious model (Chatterjee and Price, 1977:78-85).
1_ 7 6

MYRA H. STROBER AND CAROLYN L. ARNOLD 163
TABLE 10 Earnings Regressions for Computer Scientists/Systems Analysts,Computer Programmers, and Computer Operators, 1970 and 1980
VariableComputer Scientists/Systems AnalystsMean (S.D.) B
1970Ln. of hourly earnings 1.7 (0.44)Education. up to 8 years 0.01 (0.10) 0.53Some high school 0.02 (0.14) -0.23High school 0.29 (0.45) -0.05BA or BS 0.23 (0.42) 0.26**More than BA/BS 0.22 (0.42) 0.15Age2 34.69 (9.77) 0.07***Age 1,297.66 (797.95) -0.0064'4'Gender (= 1 if female) 0.14 (0.35) -0.07High-tech industry 0.29 (0.45) 0.13Constant 0.02N 105.0Adjusted R.2 .20
1980Ln. of hourly earnings 2.16 (0.63)Education: up to 8 years 0 (0)Some high school 0.01 (0.07) 0.21High school 0.13 (0.33) 0.14BA or BS 0.31 (0.46) 0.274'4'More than BA/BS 0.27 (0.45) 0.15Age2 34.58 (8.39) 0.091*Age 1,265.98 (637.18) -0.001**Gender (= 1 if female) 0.25 (0.43) -0.20*High-tech industry 0.44 (0.50) 0.06Constant 0.10N 199.0Adjusted R.2 .10
Computer ProgrammersVariable Mean (S.D.) B
1970Ln. of hourly earnings 1.30 (0.79)Education: up to 8 years 0.0 (3)Some high school 0.02 (0.14) 0.29High school 0.23 (0.42) 0.09BA or BS 0.37 (0.49) 0.07More than BA/BS 0.07 (0.26) 0.04Age2 29.65 (8.05) 0.04Age 943.52 (568.57) -0.0002Gender (= 1 if female) 0.32 (0.47) -0.16High tech industry 0.36 (0.48) 0.05Constant 0.50N 155.0Adjusted R2 -.01
1980Ln. of hourly earnings 2.01 (0.57)Education up to 8 years 0.0 (0)Some high school 0.02 (0.15) -0.16
177

164
TABLE 10 (continued)
COMPUTER-RELATED OCCUPATIONS
Computer ProgrammersVariable Mean (S.D) B
High school 0.17 (0.38) -0.006BA or BS 0.31 (0.46) 0.22***More than BA/BS 0.15 (0.36) 0.24***Age2 32.28 (8.76) 0.10**Age 1,118.15 (656.98) -0.001***Gender (= 1 if female) 0.29 (0.45) -0.12*High tech industry 0.32 (0.47) 0.04Constant -0.13N 312.0Adjusted R2 .20
Computer OperatorsVariable Mean (S.D.) B
1970Ln. of hourly earnings 1.16 (0.67)Education: up to 8 years 0.01 (0.10) -0.14Some high school 0.07 (0.25) -0.12High school 0.53 (0.50) 0.02BA or BS 0.01 (0.10) 0.77More than BA/BS 0.01 (0.10) 0.12Age2 28.80 (9.40) 0.04Age 917.07 (675.91) -0.0004Gender (= 1 if female) 0.21 (0.41) -0.70***High-tech industry 0.25 (0.43) -0.10Constant 0.51N 106.0Adjusted R2 .16
1980Ln. of hourly earnings 1.70 (..58)Education: up to 8 years 0.01 (0.10) 0.01Some high school 0.04 (0.19) -0.16High school 0.48 (0.50) -0.01BA or BS 0.11 (0.31) 0.04More than BA/BS 0.02 (0.15) 0.09A3e2 32.08 (10.77) 0.06***Age 1,145.03 (812.62) -0.001***Gender (= 1 if female) 0.53 (0.50) -0.2788*High-tech industry 0.20 (0.40) 0.18***Constant 0.59N 456.0Adjusted R2 .2U
4, p < .10.** p < .05.
8** p < .01.
NOTE: See Appendix B for the definition of corAputer-related occupations. For1980, computer operators included computer equipment operator supervisors.
SOURCE: Calculated by authors from U.S. Census (1/1000 P.U.S. Tapes, samplesfor 1970 and 1980).

MYRA H. STROBER AND CAROLYN L. ARNOLD 165
of qualifications for this occupation; whereas earlier, people withdiverse education and experience were recruited and trained intoit, by 1980 there were more formalized career ladders and moreinstitutional training in the field. The beginning of an effect basedon gender suggests that some differences based on gender may alsohave been in the process of becoming institutionalized. For pro-grammers, being in a high-tech industry did not appear to affectsalaries when other variables were held constant. It may be thatfor both c '-mputer progammers and computer scientists/systemsanalysts, it is employment in the computer industry specifically,rather than in high-tech industries in general, that has a positiveeffect on salary.
Computer operators show a different pattern. For both 1970and 198C 16-20 percent of the variance was explained by age,education, gender, and industry. Being a woman decreased one'ssalary significantly in both years. In 1970, gender was the onlysignificant variable in the regression; being female, all other vari-ables held constant resulted in a 50 percent decrease in salary.9By 1980, higher age and working in a high-tech industry alsocontributed significantly to higher earnings, but education wasstill not significant. In 1980, the effect of gender on salary, whilestill highly significant, was much smaller (27 percent) than it hadbeen in 1970. These results reflect that this occupation has fewec cational req-irements, that training takes place largely on thejoo, and that jobs in high-tech industries pay more. However, italso points out that women with the same education and age arestill paid less than men, and that this was true ooth when theoccupation was predominantly male (in 1970) and when it waspredominantly female (in 1980).
g When the log of earnings is the dependent variable, the coefficient (6)on an independent variable is approximately the percentage effect of a unitchange in that variable on the dependent variable. Thu. approximationis worse the larger tae absolute size of 6. The exact effect is e6-1. Theonly cc,officient on gender that was large enough for the exact effect to beappreciably different from the approximate effect was for computer operatorsin 1970: = .50.
173

166 COMPUTER-RELATED OCCUPATIONS
A CLOSER LOOK AT EARNINGS ANDEMPLOYMENT DIFFERENCES BY INDUSTRY
How does the labor market operate to pay men and womendifferentially even when they are in the same occupation and aresimilar with respect to age and level of education? In her book ,nclerical employment, Blau (1977) reports that often women andmen in the same occupation in the same city earn different salariesbecause they work for different firmswomen for low-wage firmsand men for high-wage firms. It may be that, analogously, womenand men in computer occupations earn different salaries in partbecause they work in different industriesmen in high-payingindustries and women in lower-paying "end-user" industries.
These differences may not have shown up in the reported re-gressions because the industry dummy variable divided industriesinto only two groups, high tech and non-high tech. Unfortunately,the P.U.S. sample sizes in each industry are too small to includemajor industry groups as variables in the reported regressions.However, Table 11, based on the census publication, Occupationby Industry, shows that within these three computer-related oc-cupations in 1980, women and men are not employed in equalproportions across major industry groups.
In the first column of Table 11, we find the estimated num-ber of total employees (men and women) in each occupation byindustry. The second column contains the percentage of womenin the occupation for each industry. The third column shows themen's mean annual earnings in the occupation by industry. In thefourth column we have calculated the ratio of the women's meanannual earnings to men's mean annual earnings for each indus-try. The first row of each occupation contains these data for allindustries combined. The second row isolates these data for partof the computer industry, based on the census three-digit indus-try category, "Electronic Computing Equipment Manufacturing."The remaining rows show the data in the major two-digit industrygroups. Several industry groups (agriculture, forestry, and fish-ing; mining; construction; personal services; and entertainmentand recreation) have been removed from the analysis altogether,because they employ so few persons in computer-related occupa-tions.
As shown in Tab I.. 11, women are 22.3 percent of computerscientists/systems analysts in all industries, but only 14.9 percent
16 9

MYRA H. STROBER AND CAROLYN L. ARNOLD 167
of computer scientists in electronic computing equipment manu-facturing. Among the major industry groups listed in Table 11,the percentage of women employed ranges from 16.9 percent inmining to 35.6 percent in finance, insurance, and real estate. Forall industries, the men's mean annual earnings for computer scien-tists/systems analysts is $23,405; earnings figures are not availablefor electronic computing equipment manufacturing. Among ma-jor industry groups, men's mean annual earnings range from alow of $20,296 in professional and related sciences to a high of$26,031 in mining. Note that in mining, where the percent womenemployed is lowest, men's earnings are highest; conversely, wherethe percent women employed is highest (in finance, insurance, andreal estate) men's earnings are the second lowest.
To examine the relationship between the percent women andmen's mean annual earnings across major industry groups wecomputed a rank correlation coefficient. For computer scien-tists/systems analysts the rank correlation coefficient is .95,significant at the 99 percent confidence level. However, becausethe sample sizes are relatively small, we also computed the rankcorrelation coefficient, taking into account the standard errorsof the percentages and means.10 The corrected rank correlationcoefficient is .68, not significant at the 95 percent confidence
level.The ratio of female/male (F/M) earnings for computer sci-
entist/systems analyst is 0.73 for all industries and ranges from0.69 in manufacturing to 0.82 in transportation, communications,and public utilities. The data do not suggest a relationship acrossindustries between F/M earnings and percent women or betweenF/M and men's mean annual earnings, mainly because of the lackof wide variation in the F/M earnings ratio.
1° The standard errors for the percentages were calculated from Table B orthe formula below the table in Appendix C in Occupation by industry (Bureauof the Census, 1972, 1984). This was multiplied by 1.2, the appropriatedesign effect factor for a cross-tabulation of industries and occupations, asshown in Table C of Appendix C. A 95 percent confidence interval wascreated by calculating two standard errors on either side of the estimate. Thestandard errors for means were calculated using the formula in AppendixC, page C-2, for standard errors of means. The variances needed in thatformula were not provided by the Census, so a conservative guess was usedof a standard deviation equal to 5,000 for all salary distributions. Thiswas squared to produce the estimated variance. A 95 percent confidenceinterval was created by calculating two standard errors on eitb ^c aide of theestimate.
161

168 COMPUTER-RELATED OCCUPATIONS
TABLE 11 Employment and Earnings in Three Computer-Related Occupations for AllIndustries, Electronic Computing Equipment Manufacturing, and in Selected MajorIndustry Groups, 1980
OccupationTotalEmployment
PercentWomen
Men's MeanAnnualEarnings
F/MEarningsRatio
Computer Scientists/Systems Analysts
All industries 200,684 22.3 $23,405 0.73
Electronic computingequipment manufacturing 22,129 14.9 n.a. n a.
Mining 2,159 16.9 26,031 0.77Construction 1,500 22.3 22,661 0.70Manufacturing 65,606 17.5 24,093 0.69Transportation, communications,
and public utilities 12,947 28.8 23,812 0.82Wholesale trade 8,953 21.4 22,840 0.80Retail trade 5,336 26.6 22,195 0.71Finance, insurance, and
real estate 18,051 35.8 21,381 0.78Business services 46,384 19.9 23,288 0.74Professional and related
serves 15,241 28.4 20,296 0.68Public administration 23,415 24.4 24,991 0.75
Computer Programmers
All industries 313,179 31.1 $17,967 0.73
Electronic computingequipment manufacturing
22,702 22.0 n.a. n.a.
Mining 3,171 32.5 19,455 0.76Construction 2,802 34.8 17,275 0.89Manufacturing 93,010 28.5 19,037 0.75Transportation, communications,
and public utilities 22,537 34.9 19,704 0.78Wholesale trade 11,477 32.1 18,084 0.87Retail trade 10,052 33.8 18,400 0.73Finance, insurance, and
real estate 39,749 38.8 18,774 0.77Business services 83,423 28.0 17,828 0.72Professional and related
services 35,352 34.3 12,353 0.83Public administration 29,63E 35.9 18,868 0.74
Computer Operators
All industries 408,475 69.0 $14,203 0.65
Electronic computingequipment manufacturing 7,175 48.8 n.a. n.a.
18,

MYRA H. STROBER AND CAROLYN L. ARNOLD 169
TABLE 11 (continued)
Men's MeanTotal Percent Annual Earnings
Occupation Employment Women Earnings Ratio
Mining 4,647 42.9 16,041 0.63Construction 5,758 68.8 14,833 0.67Manufacturing 98,886 55.3 16,079 0.63Transportation, communications,
and public utilities 35,852 56.7 17,067 0.69Wholesale trade 30,876 73.2 14,213 0.64Retail trade 26,140 67.4 13,026 0.62Finance, insurance, and
real estate 63,660 57.3 12,878 0.66Business services 43,697 45.8 13,010 0.65Professional and related
services 54,466 67.2 10,024 0.80Public administration 39,185 69.3 15,237 0.65
NOTE: Computer-related occupations are defined in Appendix B. TheElectronic-Computing Equipment Manufacturing Industry is defined as CensusIndustry Code 322 in 1980.
SOURCE: Bureau of the Census (1984:Tables 1 and 2).
Among computer programmers, women are 31.1 percent ofemployees in all industries but only 22.0 percent in electroniccomputing equipment manufacturing. As in the case of computerscientists/systems analysts, women are more likely to be employedin end-user industries. Across major industry groups, the perce.itwomen employed ranges from 26.5 in manufacturing (which in-cludes the manufacturing of electronic computing equipment) to36.6 percent in finance, insurance, and real estate. Men's meanannual earnings are $17,967 for all industries; among major in-dustry groups, they range from a low of $12,353 in professionaland related services to a high of $19,704 in transportation, com-munications, and public utilities. However, unlike the situationfor computer scientists/systems analysts, neither the uncorrectednor, the corrected (for standard error) rank correlation coefficientshows a significant relationship between percent women's andmen's mean annual earnings.
The ratio of F/M earnings for programmers does n. c varyacross major industry groups. The ratio for all industries is 0.73;
1 s. 3

170 COMPUTER-RELATED OCCUPATIONS
for all but one major industry group, the F/M earnings ratiois within a few percentage points of the mean. However, inprofessional and related services the ratio is 0.83. It is interestingthat in this industry men's earnings are the lowest for all of theindustries listed.
Among computer operators, women are 59.0 percent of thoseemployed in all industries, but only 46.6 percent of those em-ployed in the manufacture of electronic computing equipment. Asin the case of computer scientists/systems analysts and computerprogrammers, women computer operators are more likely to beemployed in end-user industries than in the computer manufac-turing industry. Among major industry groups, the percentage ofwomen employed ranged from a low of 42.9 percent in mining toa high of 73.2 in wholesale trade.
Men's mean annual earnings were $14,203 for all industriesand ranged from a low of $10,024 in professional and relatedservices to a high of $17,067 in transportation, communications,and public utilities. There is no systematic relationship betweenmen's mean annual earnings and percentage of women in theindustry.
The ratio of F/M earnings for computer operators was 0.65for all industries. As in the case of the other two occupationsdiscussed, the F/M earnings ratio did not vary much across in-dustries. The only "outlier" was in the professional and relatedservices industry where the ratio was 0.80. And, as in the case ofcomputer programmers, this industry had both the highest F/Mearnings ratio and the lowest men's mean annual earnings.
Our data suggest that in computer occupations, women aremore likely to be found in end-vser industries than in the computermanufacturing industry itzeff. In some occupations, particularlycomputer scientists/systems analysts, women also may more likelybe found in industries where men are lower paid.1' However, itis not possible at this point to test this hypothesis definitively. Ifwe were to disaggregate industry groups further, the sample sizeswould become even smaller and the standard errors would riseaccordingly.
11 Kraft and Dubnoff found similar results in a 1982 survey of "softwarespecialists' in Boston. They found women concentrated in the "worst payingindustries' (Kraft and Dubnoff, 1983).
184

MYRA H. STROBER AND CAROLYN L. ARNOLD 171
CONCLUSIONS
FINDINGS
1. Although computer-related occupations are of recent ori-gin, they are not gender-neutral. The computer field was siredby the fields of mathematics and engineering, and the newly bornprestigious and technical jobs quickly took on the gender desig-nation of the parent fields. Computer engineering and electronictechnical work employ very few women. On the other hand, dataentry, which quickly took on the characteristics of clerical work,became a virtually exclusive female preserve. Production work,too, is preponderantly female (see Table 1).
Computer programmers were female when the occupation firstemerged, but very shortly after the computer was introduced,men began to fill the emerging jobs. Although women haveincreased their representation in the jobs of both programmerand analyst, women remain less than a third of the incumbentsof these occupations. While the occupation of computer operatordid not seem immediately to be gender typed, in that it waspreponderantly female in 1960 and male in 1970, it was becomingpreponderantly female again by 1980.
2. When the difference between the percentage of womenin the total labor force and the percentage of women in eachcomputer-related occupation is used as a measure of occupationalsegregation, the level of segregation was approximately the samein 1970 and 1980, except for computer operators (see Table 2).
3. Among four computer-related occupations found in allindustriescomputer scientists/systems analysts, computer pro-grammers, computer operators, and data-entry operatorsthehigher the status and pay of the occupation, the more white menwere overrepresented, compared with their representation in thelabor force as a whole, and the more minority men and womenof all racial and ethnic groups were underrepresented. In occupa-tions with much lower pay and status, the presence of white mendropped to much below their percentage in the labor force, thepercentage of women of all racial and ethnic groups became muchhigher than their percentage of the labor force, and the percentageof minority men approached their labor force representation (seeTable 4).
185

172 COMPUTER-RELATED OCCUPATIONS
4. Within high-tech industries, most men were in produc-tion, professional /technical, or managerial occupations, whilemost women were in production or clerical occupations. Womenand men were equally likely to be in production occupations.However, men were more likely to be in managerial and pro-fessional/technical occupations in high-tech industries than innon-high-tech industries; women fared worse in these occupationsin high-tech industries than in other industries (see Table 6).
5. Within the occupations of computer scientists/systems an-alysts, computer programmers, and computer operators, women'smean annual earnings and women's median hourly earnings wereless than those of men. In addition, the ratios of women's to men'searnings generally remained constant between 1970 and 1980 (seeTables 7 and 8).
6. Within the three occupations analyzed, women's hourlyearnings were generally less than those of men, even after age,level of education, and high-tech versus non-high-tech industrywere held constant (see Table 10).
7. Women employed as systems analysts, programmers, andcomputer operators were more likely to be found in end-userindustries than in the computer manufacturing industry itself.Within the three computer-related occupations, women were paidless than men no matter in what industry they were employed (seeTable 11). We found some evidence that in several occupations,particularly computer scientists/systems analysts, women may bemore likely to be found in industries where men are lower paid.However, this hypothesis has not been tested definitively here andrequires further investigation.
These findings dispel the myth that high tech is automaticallya great equalizer. Hign tech may produce integrated circuits,but it does not necessarily produce an integrated work force oreliminate the female/male earnings differential.
DISCUSSION
Although a detailed explanation of the implications of thesefindings is beyond the scope of this paper, it is likely that theexplanations can be found in the discussions of gender segregationand earnings differentials commonly found in the literature (seeBlau and Jusenius, 1976; Cain, 1976; Amsden, 1980; Sokoloff,
186

MYRA H. STROBER AND CAROLYN L. ARNOLD 173
1980; Strober, 1984; Reskin, 1984; and Reskin and Hartmann,1986). These theories focus on women's own behavior, on em-ployer discrimination, and on the interactions of labor marketsand gender relations in society. However, to devise the varioustypes of policies that are required to change existing patternsof gender segregation and earnings differentials for the computerindustry and computer-related occupations reported here, moreresearch on the dynamics of each aspect of gender segregation isneeded. More detailed research on the differences in women's em-ployment between and within industries and between and withinfirms would identify the bottlenecks preventing the gender integra-tion of occup&ions. Attention needs to be given to the processesby which wc.,:z2n are allocated and/or allocate themselves into thelower-paid occupations and industries. This involves investigatinghow employers structure and define occupations and career lad-ders and distribute skilled job applicant, and workers in ways thatresult in gender-segregated occupations and industries. Researchalso needs to be done on the degree to which technologicallytrained women (and some men) self-select out of certain occupa-tions or industries because a certain definition or culture for theoccupation or industry precludes respect for the participation ofpeople with different work styles or cultures.
Some explanations have been advanced for women's low rep-resentation among the specialized computer-related occupations.For example, De Boer (1984) argues that women are still morelikely than men to exclude themselves from advanced math andscience training: even when women in high school and collegescience perform at a higher level than their male classmates,they have a higher drop-out rate. He proposes that teachers insecondary and postsecondary education make special efforts toacknowledge the skills of talented women.
Hacker's work (1981), however, suggests that merely encour-aging women may not be sufficient to change their educationaldecisions, since women's decisions to exclude themselves fromtechnical fields may be related in part to a dislike of the fields'"culture." Hacker, based on research at a technical institute,argues that there is a "culture of engineering" that includes anextension of the profession's formal objectification and control ofthe natural world to an informal objectification ofwomen.
It may be that a distaste for being part of the "engineering cul-ture" also leads technically trained women to exclude themselves
'187

174 COMPUTER-RELATED OCCUPATIONS
from certain sectors of the computer industry. If an engineeringculture appears most strongly in those sectors and industries ofthe computer field that are at the technological forefront and mostcompetitive technologically, then it may be that those sectors andindustries are the least appealing to women. However, it may notbe accidental that these sectors have the strongest engineeringculture. In terms of Strober's theory (1984), men who work inthese intellectually challenging and highly lucrative sectors mayacquire the habits of the "engineering culture" in part preciselyto keep women out.
The work style and work pressures in the most technologicallycompetitive sectors of the computer industry may also keep manywomen out. While firms in all industries must remain compet-itive with similar firms, the computer industry, a new industrywith a steady stream of technological breakthroughs, has someunique pressures: to make and increase profits in a competitivenonoligopolistic environment, stay on the technological forefront,and stay ahead of not only young and old domestic companiesbut their Japanese counterparts as well. These financial and tech-nological pressures are intensified as each firm tries to surviveand succeed before the industry "shakes down." There is muchpressure on workers in the computer industry to maintain highlevels of productivity, including overtime work and other formsof commitment to the success of the firm. Women who want tosucceed have to put in long, hard hours of work, and this may bea barrier for women (and men) who are trying to balance theirhome and work lives.
We have presented evidence of gender segregation of the high-tech industries and highly technical computer occupations. At thesame time we have called for research-assisted strategies to endthese observed patterns of occupational inequity. While we en-courage women to enter these computer-related fields, we needto disseminate the findings of studies such as this one. Thiswill make women aware of the channeling that leads them intoless-prestigious, lower-paying occupations or "end-user" indus-tries within high-tech fields and help them develop strategies tocounteract this channeling. At the same time this research canbe used to assist in developing policies to make occupations andworkplaces more welcoming to both genders and more compatiblewith satisfying personal and family lives.
188

MYRA H. STROBER AND CAROLYN L. ARNOLD 175
REFERENCES
ABAG (Association of Bay Area Governments)1981 Silicon Valley and beyond: high technology growth for the San
Francisco Bay Area. Working Papers on the Region's Economy, 2.Berkeley, Calif.
Amsden, Alice H.1980 Introduction. Pp. 11-3Z in Alice H. Amsden, ed., The Economics
of Women and Work. Nc w York: St. Martin's Press.Bielby, William T., and James N. Baron
1984 A woman's place is with other women: sex segregation withinorganizations. Pp. 27-55 in Sex Segregation in the Workplace: Tends,Explanations and Remedies. Committee on Women's Employmentand Related Social Issues. Commission on Behavioral and SocialSciences and Education, National Re: earth Council. Washington,D.C.: National Academy Press.
Blau, Francine D.1977 Equal Pay in the Office. Lexington, Mass.: D.C. Heath.
Blau, Francine D., and Wallace E. Hendricks1979 Occupational segregation by sex: trends and prospects. The
Journal of Human Resources 14:197-210.Blau, Francine D., and Carol Jusenius
1976 Economists' approaches to sex segregation in the labor market: anappraisal. Pp. 181-199 in Martha Blaxall and Barbara B. Reagan,eds., Women and the Workplace: The Implications of OccupationalSegregation. Chicago: University of Chicago Press.
Braverman, Harry1974 Labor and Monopoly Capital. New York: Monthly Review Press.
Bureau of the Census1971 Census of Population: 1970. Alphabetical Index of Industries and
Occupations. U.S. Goverment Printing Office. Washington, D.C.:U.S. Department of Commerce.
1972 Census of Population: 1970. Occupation by Industry. Final ReportPC(2)-76. U.S. Government Printing Office. Washington, D.C.:U.S. Department of Commerce.
1982 Census of Population: 1980. Classified Index of Industries and Occupa-tiorzs, Final edition. U.S. Government Printing Office. Washington,D.C.: U.S. Department of Commerce.
1983 Data User News 18(June):8-9.1984 Census of Population and Housing: 1980. Subject Report, Occupa-
tion by Industry. PC80-2-7c. U.S. Government Printing Office.Washington, D.C.: U.S. Department of Commerce.
Cain, Glen G.1976 The chalk age of segmented labor market theories to orthodox
theory: a survey. Journal of Economic Literature 14 (December):12151257.
Chatterjee, Sampr.t, and Bertram Price1977 RegreEson by Example. New York: Wiley and Sons,
DeBoer, George E.1984 Factors Affecting the Science Participation and Performance of Women
183

176 COMPUTER-RELATED OCCUPATIONS
in High School and College. Hamilton, N.Y.: Colgate University,Department of Education.
Dicesare, Constance Bogh1975 Changes in the occupational structure of U.S. jobs. Monthly Labor
Review 98(March):24-34.Greenbaum, Joan M.
1979 In the Name of Efficiency: Management Theory and Shopfloor Practicein Data Processing Work. Philadelphia: Temple University Press.
Gross, Edward.1968 Plus ga change...? The sexual structure of occupations over time.
Social Problems 16:198-208.Grossman, Rachael
1980 Women's place in the integrated circuit. Radical America 14(Janu-at7/February):29-49.
Hacker, Sally L.1981 The culture of engineering: woman, workplace, and machine.
Women's Studies International Quarterly 4(3):341-353.Kraft, Philip
1977 Programmers and Managers. New York: Springer-Verlag.1979 The industrialisation of computer programming: from program-
ming to software production. Pp. 1-17 in Andrew Zimbalist, ed.,Can Studies in the Labor Process. New York: Monthly Review Press.
Kraft, Philip, and Steven Dubnoff1983 Software workers survey. Computer World XVII(November 14):3-
13.Lloyd, Cynthia B., and Beth T. Neimi
1979 The Economics of Sex Differentials. New York: Columbia UniversityPress.
O'Neill, June1983 The Determinants and Wage Effects of Occupational Segregation.
Project Report. Washington, D.C.: The Urban Institute.Reskin, Barbara F., ed.
1984 Sex Segr-ration in the Workplace: 7kends, Explanations, Remedies.Committee on Women's Employment and Related Social Issues.Commission on Behavioral and Social Sciences and Education,National Research Council. Washington, D.C.: National AcademyPress.
Reskin, Barbara F., and Heidi I. Hartmann, eds.1986 Women's Work, Men's Work Sex Segregation on the Job. Committee
on Women's Employment and Related Social Issues. Commis-sion on Behavioral and Social Sciences and Education, NationalResearch Council. Washington, D.C.: National Academy Pre..,.
Riche, Richard W., Daniel E. Heckers, and John U. Burgan1983 High technology today and tomorrow: a small slice of the em-
ployment pie. Monthly Labor Review 106(November):50-59.Rogers, Everett M., and Judith K. Larsen
1984 Silicon Valley Fever. New York: Basic Books.Rytina, Nancy F.
1982 Earnings of men and women: a look at specific occupations.Monthly Labor Review 105(April):25-31.
109

MYRA H. STROBER AND CAROLYN L. ARNOLD 177
Sokoloff, Natalie J.1980 Between Money and Love: The Dialectics of Women's Home and Market
Work. New York: Praeger.Strober, Myra H.
1984 Toward a general theory of occupational sex segregation: the caseof public school teaching. Pp. 144-156 in Barbara F. Reskin,ed., Sex Segregation in the Workplace: 7i-ends, Explorations, Remedies.Washington, D.C.: National Academy Press.
Strober, Myra H., and Barbara B. Reagan1982 Sense and nonsense in measuring employment discrimination in
higher education. Unpublished paper.Treiman, Donald J., and Heidi I. Hartmann, eds.
1981 Women, Work, and Wages: Equal Pay for Jobs of Equal Value.Washington, D.C.: National Academy Press.
U.S. Department of Commerce, Office of Federal Statistical Policy andStandards
1980 Standard Occupational Classification Manual.
APPENDIX A: INDUSTRIES WITHIN MAJOR INDUSTRYGROUPS, BY HIGH-TECH AND NON-HIGH-TECH
CATEGORIES
Industrial categories that comprise the hip-tech sector defi-nition used here are based on those designated Group III in Richeet al., 1983. This is a moderately inclusive definition containing27 three-digit SIC industries and 1 four-digit SIC industry. Cen-sus Industry Codes which most closely matched these SIC codeswere used to designate high-tech industries in the 1970 and 1980Census Public Use Sample tapes. The Census Codes each includefrom one to several SIC industries, and some Riche-designatedhigh-tech SIC industries are grouped with non-high-tech SIC in-dustries, so it is not possible to perfectly match the Riche GroupIII list using census data. Below are listed the census industrialcategories that were designated for this study as high tech andnon-high tech. For the high-tech industries, 1970 and 1980 CensusIndustrial Codes are shown in parentheses, with the 1970 codefirst followed by the 1980 code (Bureau of the Census, 1971, 1982).
HIGH-TECHNOLOGY INDUSTRY GROUPS(HIGH TECH)
DURABLE M "UFACTURING
Ordnance (258;248); engines and turbines (177;310); office andaccounting machines (188;321); electronic computing equipment

178 COMPUTER-RELATED OCCUPATIONS
(189;322); radio, television, and communication equipment (207;341); electrical machinery, equipment; and supplies, n.e.c. (2C8;342); aircraft and parts (227;352); scientific and controlling instru-ments (239;371); optical and health services supplies (247;372);photographic equipment and supplies (248;380).
NONDURABLE MANUFACTURING
Industrial and miscellaneous chemicals (281 and 368;192); plas-tics, synthetics, and resins (348 and 349;180); drugs and medicines(357;181); soaps and cosmetics (358;182); paints, varnishes, andrelated products (359;190); agricultural chemicals (367;191); notspecified chemicals and allied products (1970;3o9); petroleumrefining (377;200); miscellaneous petroleum and coal products(1970;378).
BUSINESS AND REPAIR SERVICES
Commercial research, development, and testing labs (729;730);computer programming or computer and data-processing services(739;740).
NON-HIGH-TECHNOLOGY INDUSTRY GROUPS(NON-HIGH-TECH)
DURABLE MANUFACTURING
Lumber, furniture, stone, clay, and glass products, other metalindustries, cutlery, handtools, hardware, other machinery, house-hold appliances, transportation equipment, clocks, toys, sportinggoods.
NONDURABLE MANUFACTURING
Food, tobacco, textile, apparel, paper, printing, rubber, leatherproducts.
192

MYRA H. STROBER AND CAROLYN L. ARNOLD 179
BUSINESS AND REPAIR SERVICES
Advertising, buildings services, personnel supply, business man-agement and consulting, detective and protective services, busi-ness services, automotive services and repair, electrical repair,miscellaneous repair.
AGRICULTURE, FORESTRY, AND FISHERIES
Agricultural production, crops; agricultural production, livestock;agricultural services; horticultural services; forestry; fisheries; fish-ing, hunting, and trapping.
MINING
Metal mining; coal mining; crude petroleum and natural gasextractions; nonmetallic mining and quarrying, except fuel.
CONSTRUCTION
General building contractors; general contractors, except building;special trade contractors; nonspecified construction.
TRANSPORTATION, COMMUNICATION, AND PUBLIC UTILITIES
Rail, bus, taxi, truck services, warehouses, U.S. Postal Service,water and air transportation, pipelines, miscellaneous transporta-tion services, radio, television, telephone, telegraph, electricity,gas, steam, water supplies, and sanitary services.
WHOLESALE TRADE
All wholesale trade of durable and nondurable goods, includingsale of high-tech products.
RETAIL TRADE
All retail outlets for durable and nondurable goods, including saleof high-tech products.
1 (4 3

180 COMPUTER-RELATED OCCUPATIONS
FINANCE, INSURANCE, AND REAL ESTATE
Banking, savings and loans, credit agencies, securities and invest-ment, insurance, real estate and real estate insurance and law
offices.
PROFESSIONAL AND OTHER SERVICES
Offices of doctors, dentists, chiropractors, optometrists, and otherhealth practitioners and services; hospitals, nursing, and personalcare services; legal services; elementary and secondary schools;colleges and universities; business, trade, and vocational schools;libraries; educational services; job training and vocational rehabil-itation; child care services; residential care; social services; muse-ums; art galleries; zoos; religious and membership organizations;engineering, architectural, and surveying services; accounting, au-diting, and bookkeeping services; and noncommercial educationaland scientific research.
PUBLIC ADMINISTRATION
Offices of chief executive and legislative bodies and their advisoryand interdepartmental committees and commissions; governmentcivil rights and civil service commissions; offices providing supportservices for government such as accounting, personnel, purchasingand supply; courts; police protection; correctional institutions;fire protection; government legal counsel; public finance; tax andmonetary policy; administration of educational programs; publichealth, social, manpower, and income maintenance programs;veterans' affairs; environmental protection; housing and urbandevelopment programs; regulatory agencies; national security;and international agencies.

MYRA H. STROBER AND CAROLYN L. ARNOLD 181
APPENDIX B: COMPUTER-RELATED OCCUPATIONS
We define computer-related occupations using the followingdetailed occupation categories and codes from the 1970 and 1980U.S. censuses:
Census Occupation Categories Census Occupation Codes
EngineersElectrical/electronic engineer
1970 1980
006-023 044-059012 055
Computer specialists 003-005 064,229Computer scientist/systems
analyst 004-005 064Computer programmers 003 229
Engineers and science technicians 150-162 213-217,Electrical/electronic 223-225
engineering technicians 153 213Drafters 152 217
Computer operators(includes computer and peripheralequipment operators) 343 308,309
Data-entry operators
Production workersa(includes crafts, precisionproduction, operatives,transportation, laborers,and farm occupations)
345 385
401-824 473-889
Electronic assemblers(a category in 1980 only)within precision production 683
Data-processing repairersWithin precision production 475 525
1 (4

182 COMPUTER-RELATED OCCUPATIONS
Operatives, fabricators,transportation, and laborers"
Within production (excludesfarm, crafts, and precisionproduction. Not preciselythe same occupations in each
year.) 601-785 703-889
AssemblersWithin operatives 602 785
" There were changes in occupational coding and categorizing betweenthe 1970 and 1980 Censuses (Bureau of the Census, 1983), which affected the
occupations included in large occupational categories such as "Production
Workers" and "Operatives, Fabricators, Transportation, and Laborers."
The category of "Production Workers" as defined here is so large that theoccupations included are identical except for three which are included in
1970 and not in 1980: decorators and window dressers (1970 code 425);
inspectors, n.e.c. (1970 code 452); and conductors and motormen, urban
rail transit (1970 code 704). Since few of these workers would be in thecomputer industry, we do not feel that this affects the results. However, the
category of "Operatives, Fabricators, Transportation, and Laborers" does
differ significantly between the years, and therefore the data presented for
1970 and 1980 are not strictly comparable.

Part III
Technology and Trends inWomen's Employment
1 9 7

Women's Employment andTechnological Change:
A Historical Perspective
CLAUDIA GOLDIN
The impact of technological change on female employment isan issue in two parts: that relating to all workers and that justto women. Technological change, in concert with the demand foroutput, is the driving force for all employment in the long run,and determines total employment, the share of employment in eachsector of the economy, and the share of output received by labor.Female workers, however, have characteristics that distinguishthem from their male counterparts and that cause them to bedifferentially affected by technological change.
Among the distinctive characteristics of the female labor forceare the lower participation rates of women as compared with thoseof men. Because of this difference the supply of women to thelabor market is more responsive to changes in earnings and oc-cupational opportunities. Related to this point is that women,on average, have less labor market experience than men, andtheir lower degree of seniority might make them more vulnerableto rapid technological change. It is also the case, however, thatwomen have less training specific to a particular technology andmight be less at risk of losing income from changes in the produc-tion process. For various reasons women work in certain sectors
185

186 A HISTORICAL PERSPECTIVE
and occupations more than in others. To the extent that certainsectors, industries, or occupations are "female intensive," techni-cal changes that increase employment in these areas relative toothers will have positive employment effects for women.
The precise employment impact of technological change, eitheron an individual sector or on the national economy, is a rathercomplicated affair. There are no a priori reasons to believe thattechnological change will reduce employment in any particularsector; itiprecise role is empirical in nature and is explored below.In addition, long-run and short -run effects may differ. In the longrun, technological change alters the relative size of different sectorsand the female intensity of the labor force in these sectors. We canassume, in the long run, that the economy adjusts to the variousshocks imposed on it by technological change, returning eventuallyto the natural rate of unemployment. But over the short run thereare displacement effects, involving retraining and geographicalmobility. Because the focus here is on historical changes over anextensive period of time, only the long-run effects are consideredin detail.
The conclusions of this research are many. Over the longrun, technological advances, proxied by a measure called total fac-tor productivity, have been positively associated with the femaleintensity of a sector; that is, female-intensive sectors have hadgreater advances in technology. But sectors having the greatestadvances in technology did not necessarily experience the largestexpansion in employment. Technological changes associated witha greater division of labor, both in the early part of the nineteenthcentury in manufacturing and in clerical work a half century later,fostered the employment of relatively unskilled workers, especiallywomen. Technological changes embodied in individuals, particu-larly advances in education, have provided the greatest impetus tothe employment of women in the more recent period, most oftenin sectors undergoing general technological change.
Without knowing the precise reasons for the expansion andevolution of the female labor force in general over the last twocenturies it is difficult to ascribe a portion of it to technologicalchange. But it is clear that advances in manufacturing in thenineteenth century increased the relative productivity of femalesto males (and children to adults) by substituting machinery andinanimate power for human strength. Such techrological changefrequently led to the substitution of capital and unskilled labor
is4

CLAUDIA GOLDW 187
for skilled (artisanal) labor, a factor substitution that is ratherdifferent from that observed later in the twentieth century.
It is equally difficult to ascribe a portion of the changes inthe sectoral distribution of labor in general over the last two cen-turies to technological change biased in favor of particular sectors.But it is clear that the relative decline in agriculture throughoutthe period and the rise of the tertiary (service) sector in the firstdecades of this century were instrumental in changing employmentopportunities for women. Not all women's employment changed inthe same direction in response to these movements. Black women,who have always been disproportionately employed in agricultureand domestic service, experienced decreases in employment withsectoral shifts that occurred early in this century, but these de-clines did not necessarily entail decreased well-being. In th% mostrecent period, black women's employment, along with employ-ment of white women, has been greatiy affected by educationaladvances.
This paper explores various aspects of technological changeand women's employment in the United States from 1800 to thepresent. I begin with a discussion of conceptual issues regardingtechnological change and then consider the evidence on female em-ployment over the last two centuries. Four aspects of the topic arethen detailed: (1) the correlation over time and in cross-sectionbetween technological change and the proportion of a sector or anindustry's labor force that is female; (2) the role of educationalchange in altering the employment of women; (3) changes in the or-ganization of work; and (4) the relative wages of females to males,a ratio measuring what is commonly termed the "gender gap."The focus is entirely on changes in technology outside the home,thus omitting changes in household production and contraceptivetechnology.
One way of integrating the topics in this paper is to partitionchanges in the proportion of the total labor force that is composedof women, F/L, into that portion due to changes within sectorsand that part due to the changing distribution of the labor forceacross sectors. Thus,
d(F/L) = Eitcl(F8 /Li)1(Li/L) + Ei(Fi/Li)d(Li/L), (1)
where F = the female labor force (F = EFi), L = the total laborforce (L = ELi), and i denotes sector or industry i. The change
209

188 A HISTORICAL PERSPECTIVE
in the proportion of the labor force that is female is divided intotwo sources, and each can be studied in terms of the impact tech-nological change has on it. The first is the impact of technologicalchange on changes in the female intensity of a sector or an industry(Fs /L;) times the relative importance of that sector or industryin total employment. The second is the impact of technologicalchange on sectoral shares (Li/L) times the female intensity of thatsector or industry. Each of these sources is discussed below.'
TECHNOLOGICAL CHANGE AND EMPLOYMENT:A THEORETICAL FRAMEWORK
To clarify the economist's conceptualization of technologicalchange (see Mansfield, 1969; Rosenberg, 1972; Stoneman, 1983),let me offer this brief description. Technology is knowledge, andtechnological change is an increase in knowledge measured as anincrease in output for a given quantity of inputs or, equivalently, adecrease in inputs required to produce a given amount of output.Technological change is identified with technological advance; allagents, in firms, sectors, and the economy as a whole, can rejectany technological change that decreases outputs or increases thecosts of production. One generally thinks of technological changeas altering the demand for a particular factor, such as labor; itcan also alter the set of prices and wages in the economy. Theemployment effects of technological change are complicated bythe impacts such price changes have on the demands for inputand output. Even a labor-saving technological change can resultin an increase in the demand for labor if the quantity of outputdemanded increases sufficiently because of a lower price or a higherquality of output. Further, a technological change that is neutralin its effects on the various inputs can alter the economy's demandfor labor if it tends to increase demand for outputs produced byrelatively less labor-intensive sectors (or less intensive in the useof a particular type of laborwomen, blacks, skilled, unskilled).
Production occurs when one combines particular inputs insome manner. Denoting the output as Q and the inputs as K
1 One can add another source, the increase in the female labor forceparticipation rate, by scaling each source. One can scale, for example, thefemale intensit- of each sector by expressing it as an index in relationshipto the female intensity of the economy as a whole. This index is used in theempirical work below.
20

CLAUDIA GOLDIN 189
(capital) and L (labor), Q = f(K,L) is a production function.The theoretical framework economists use to study technologicalchange can be condensed by considering a particular productionfunction known as Cobb-Douglas. This production function isa geometrically weighted average of the inputs multiplied by aconstant. term, T:
Q = (2)
In the case shown, the exponents of the two inputs, K and L, sumto one, which ensures the characteristic of constant returns to scale(a proportional increase in the inputs will increase the output pro-portionally). The constant term, T, indicates the degree to whichthe same input levels lead to greater output. Thus, the change inT is the measure of technical change, when the outputs and theinputs are measured properly. T is known as total factor produc-tivity, and changes in T are known as total factor productivity(technological) change. Various types of technological change areabsorbed in the constant term T.
Technological change can be disembodied or embodied in aparticular factor. Technological change can be disembodied inthe sense that it does not require the inputs to change in anync"ceable manner. One can think. of a disembodied technologi-cal change as some increase in general knowledge that allows anincrease in output for the same quantity of physical inputs. Em-bodied technological change is more easily conceptualized than isdisembodied. When technological change is embodied in a pieceof capital equipment we usually think of the new input as hav-ing a particular vintage, with later ones being the most efficient.When technological change is embodied in labor, we generallythink of labor as being more skilled, more educated, healthier,and so on. We can measure inputs in physical terms, as in hoursof labor or persons, or we can measure inputs in efficiency units,as in an education-weighted index of person-hours. When one isable to measure inputs in these efficiency units, one can moreeasily distinguish between technological change that is embodiedand disembodied. This procedure is required for understandingprecisely the sources of technological change and the impacts onwomen workers.
In the Cobb-Douglas production function, if either K or L ismultiplied by some amount A, we would not be able to discern

190 A HISTORICAL PERSPECTIVE
empirically its impact on output (Q) from a change in the con-stant term T. Thus the Cobb-Douglas form does not distinguishbetween disembodied change that augments K from that whichaugments L. Furthermore, if the inputs are measured in physicalterms, rather than in their efficiency units, and if their efficiencyui,.its expand (because of technological change that is embodied inlabor or capital) while the physical units stay constant, we wouldnot be able to distinguish the impact on Q from a disembodiedtechnological change.
In the analysis that follows, I explore the impact of technicalchange on the employment of women across various sectors ofthe economy and within the manufacturing sector from 1890 tothe present. The measure of technical change used is the rateof change in total factor productivity. Recall that total factorproductivity indicates the degree to which more output is producedfor a given level of inputs. Assume that the production technologycan be represented by a Cobb-Douglas production function, givenin Equation 2. When Equation 2 is expressed in rate-of-changeform, where an asterisk (*) over a variable indicates its timederivative, the rate of change in total factor productivity is givenby
* * * *T . Q ceK (1 ce)L. (3)
In other words, the rate of change in total factor productivity(read, in technology) is given by the rate of change in the outputminus a weighted average of the rates of change of the inputs. Thedefinition of technological change summarized in this mannerthat it is measured by how much output increases above andbeyond increases in the inputsis very intuitive.
The measurement of the inputs and the outputs pose certaindifficulties. The outputs and the inputs ought to be measured inphysical units rather than in value terms. The procedure is ordi-narily not possible, and one generally weights outputs by prices.Thus cars become the value of cars or value added in the auto-mobile sector. The inputs themselves are normally measured inconventional oz physical terms (for example, hours of labor) ratherthan in efficiency units. Thus part of total factor productivity willbe attributable to the increased efficiency of the factors (for exam-ple, from increased education, skills, or health), and disembodiedand embodied technological change are not distinguished. The
203

CLAUDIA GOLDIN 191
rates of change of the inputs are weighted by the exponents, andto get estimates of the exponents one must appeal to economic the-ory. Under conditions of equilibrium in the factor (input) marketsand competition, the exponents will be the shares of the factorsin national income. These data are easily located for even longperiods of time.
Standard measures of total factor productivity exist for vari-ous sectors and industries in the extensive work of Kendrick (1961,1973, 1983). One aspect of technological change that is necessarilyhidden in the use of this methodology is factor bias. To exploreissues of biased technological change requires a more flexible func-tional form than Cobb-Douglas, and some estimates of factor biasusing the translog production function are discussed below.
TRENDS IN FEMALE EMPLOYMENT: 1800 TO 1980
It is instructive to review the historical record regarding thelabor market involvement of women in the United States beforeexamining the impact of technological change. Data on the oc-cupations of women were first collected in 1860, but the printedtabulations were aggregated at the state level and provide littledetail by age and other characteristics. Marital status was notrequested by the. U.S. Census of Population until 1880. Readilyavailable labor force data dictate that the period under study be-gins with 1890. The period before 1890, particularly that from1832 to 1880, is explored with materials from the manufacturingcensuses, which necessarily include only a portion of the laborforce.
Although substantial change in the conventionally measuredfemale labor force has only recently surfaced, it has been rootedin a longer history of economic transition. Increases in educa-tion during the first three decades of this century and the relatedincrease in the tertiary sector, particularly clerical occupations,were instrumental in the post-World War II increase in partici-pation rates of women. The data on manufacturing labor forceparticipation rates indicate the importance of early factory devel-opment in the employment of young women, particularly in theNew England and Middle Atlantic regions. These points are morefully developed below.
Labor force data for the aggregate female population togetherwith data by race, marital status, and nativity are given in Ta-

192 A HISTORICAL PERSPECTIVE
ble 1. The overall trend for the aggregate from 1890 to 1980 isupward, but most of the movement comes from increases in theparticipation rate of married women, particularly after 1950. Theincrease is most apparent for white married women. Before turningto a more detailed exploration of the data for white women, thosefor black women must be given more careful attention.
The labor for . icipation of black women across all maritalstatuses and ages ; a, the exception of single young women) hasalways been higher than that for white women. Several factorsaccount for these differences (see Goldin, 1977, for a review andan exploration cf the role of slavery). The lower family incomes ofblack Americans throughout the period are responsible for muchof the difference that appears in Table 1, as are the rural, southernlocation of the black labor force in general and the crops producedin the South, especially cotton.
The geographical location of black women, their greater par-ticipation rate early on, and their occupational structure make theanalysis of the effects of technological change on their employmentdifferent from that for white women. In 1910, for example, fully95 percent of all employed black women were in just two occupa-tinnal groupingsagriculture and domestic and personal service;the comparable figures for white women were 43 percent for na-tive born and 27 percent for native born of foreign parentage. in1940 77 percent of black working women were found in these twooccupational groupings; in 1980 the figure was under 30 percent.Despite dissimilarities between the black and white female laborforces, various changes in the economy, such as increases in edu-cation and the rise of the clerical sector, have had strong impactson both.
The participation rate of young single women across the entireUnited States rose until around 1920, when it reached a plateau atabout the 0.40 level. Participation rates for this group varied sig-nificantly by geographical location. The daughters of native-bornwhite parents in urban areas in 1890, for example, experienced aparticipation rate of 0.43, almost twice the aggregate level for thatgroup. These data suggest that the labor force participation ratefor the entire population of young single women converged by 1920
2 o -;
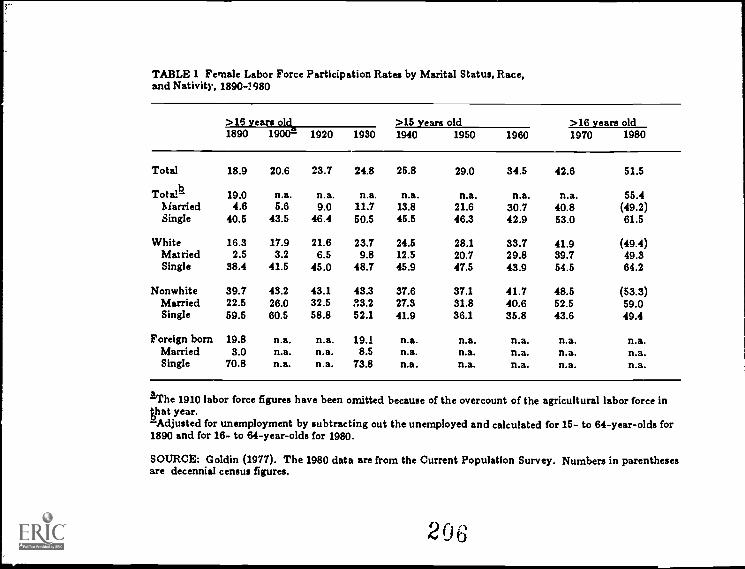
TABLE 1 Female Labor Force Participation Rates by Marital Status, Race,and Nativity, 1890-1980
>19 years old >15 years old >16 years old1890 1900n 1920 1930 1940 1950 1960 1970 1980
Total 18.9 20.6 23.7 24.8 25.8 29.0 34.5 42.6 51.5
Total-b 19.0 n.a. n.a. n.a. n.a. n.a. n.a. n.a. 55.4lkiarried 4.6 5.6 9.0 11.7 13.8 21.6 30.7 40.8 (49.2)Single 40.5 43.5 46.4 50.5 45.5 46.3 42.9 53.0 61.5
White 16.3 17.9 21.6 23.7 24.5 28.1 33.7 41.9 (49.4)Married 2.5 3.2 6.5 9.8 12.5 20.7 29.8 39.7 49.3Single 38.4 41.5 45.0 48.7 45.9 47.5 43.9 54.5 64.2
Nonwhite 39.7 43.2 43.1 43.3 37.6 37.1 41.7 48.5 (53.3)Married 22.5 26.0 32.5 33.2 27.3 31.8 40.6 52.5 59.0Single 59.5 60.5 58.8 52.1 41.9 36.1 35.8 43.6 49.4
Foreign born 19.8 n.a. n.a. 19.1 n.a. n.a. n.a. n.a. n.a.Married 3.0 n.a. n.a. 8.5 n.a. n.a. n.a. n.a. n.a.Single 70.8 n.a. n.a. 73.8 n.a. n.a. n.a. n.a. n.a.
The 1910 labor force figures have been omitted because of the overcount of the agricultural labor force inthat year.-Adjusted for unemployment by subtracting out the unemployed and calculated for 15- to 64-year-olds for1890 and for 16- to 64-year-olds for 1980.
SOURCE: Goldin (1977). The 1980 data are from the Current Population Survey. Numbers in parenthesesare decennial census figures.
206

194 A HISTORICAL PERSPECTIVE
on the rate experienced by the urban native-born group as earlyas 1890. The data for the 1832 to 1880 period demonstrate thatwherever manufacturing activity spread, labor force participationrates of young single women rose, and the elasticity of supply ofthis labor force was rather high.
Despite the apparent stability in the percentage of single ur-ban women in the labor force over the twentieth century, therewas substantial variation in the activities of the approximately 60percent who were not employed. In 1890 young women not in thelabor force were overwhelmingly occupied "at home," ostensiblyhelping their mothers. Data for 1900 indicate that about two-thirds of the young women not in the labor force were also not inschool, and were listed in the census as being at home. With theincrease in high school education, the percentage at home droppedrapidly over the early twentieth century to less than one-tenth by1930. Tne increase in formal education exactly offset the declinein time devoted to home production by young single women.
Participation rates of married women did not expand to anygreat extent until the 1920s. Also in contrast to the experienceof young single women, participation rates for married women didnot vary significantly by region or by industrial development. Al-though the 1920s marked the first discernible increase, it was onlyafter 1950 that the employment of married women rose rapidly,first for women over age 35 and later for those under 35 years (seealso Easterlin, 1980).
As part of a larger study of women's changing economic roles, Ihave prepared a matrix of cross-section and time-series labor forceparticipation rates by marital status, age, race, and national originfrom 1890 to the present. Figure 1 is part of this larger matrixand summarizes the expansion of the labor force participationof white (native-born) married women, born from 1866 to 1955.(Comparable data for black women are discussed below.) Eachset of solid (or dashed) lines represents the participation rateof a particular birth cohort, tracing its market role as it matures.Cross-sectional data can also be read from this figure by connectingthe relevant points on the cohort lines; for example, the data for1970 are given by the top set of dotted lines.
2 0 7

CLAUDIA GOLDIN 195
Although several qualifications2 should be kept in mind ininterpreting the data in Figure 1, they make a more or less trans-parent statement: for every cohort born since 1866, participationin the labor force has increased within marriage, at least tr aboutage 55. Despite the generally held notion that murkd womenuniversally have experienced interruptions in their work careers,the majority who entered the labor force at mid-life had not ex-perienced labor force work since they were single, if even at thattime. (Note that because the data are given only for marriedwomen, one cannot observe the participation rates of these womenwhen they were single.) The notion of interrupted work careers asthe norm has arisen, in part, from the pattern of double-peakedlabor force participation characteristic of cross-sectional data forwomen's work experiences in many contemporary developed na-tions. This pattern emerged in the United States in 1950 and isillustrated by the top dotted line in Figure 1, giving participationrates for the cross-section of married women in 1970.
Of most importance with regard to the issue of technology andwomen's employment is the variation in the increases for variouscohorts. These variations indicate period effects, and technologi-cal change is likely to have been more important in some periodsthan in others. Cohorts born around 1900 achieved a considerablyhigher labor force participation rate than those born previously.Similarly, cohorts born after 1945 had substantially increased par-ticipation rates. All other cohorts, to be sure, contributed to theexpansion of the female labor force participation rate, but thecohorts mentioned appear to have gone far beyond the trend line.
2 The qualifications are (1) while the data are for native-born whitemarried (spouse present) women, there is heterogeneity in other respects:women enter the data when they marry, and thus the data are contaminatedby selection bias if people who marry late or who are widowed early havedifferent labor force participation rates; (2) intermittency of participation isdisguised in these data and depends on the aggregate rate of labor turnoverfor married women; (3) there are numerous definitional issues, particularlythe change in 1940 from the "gainful worker" to the "labor force" constructand the omission in the early period of many women working on farms and inthe home (Goldin, 1987, addresses these issues); and (4) the 10-year intervalsmask certain changes, particularly those at the early ages. Related to thisconsideration is that the data concern only married women; participationrates for young single women are considerably higher than are those foryoung married women, particularly before the 1960s.
208

196
% In Labor Forte
60
50
40
20
10
A HISTORICAL PERSPECTIVE
1936.1945
1946.1955
'...1970
1926-1935
. . .........1916.1925
20 30 : 40t
50 601
70 80
Age
FIGURE 1 Labor force participation rates of cohorts of white marriedwomen, born 1866 to 1955, for the entire United States. Notes: Dashed linesdenote missing data. Data for 1890 to 1920 are for native-born women withnative-born parents. Dotted line is 1970 cross-section. Source: Derived frompopulation census data. Data appendix on request from author.
Similar data for black women have been compiled and rein-force the finding from the aggregated data in Table 1 that blackmarried women's participation rates have always been substan-tially hirher than those for white women. But beginning withthe cohort born around 1910, black married women have also hadlarge increases in participation rates. Unlike the data for this co-hort of white women, however, those for black women increaseonly for ages over 40. It is with the cohorts born around 1930 thatincreases in participation rates across the life cycle occur. These
2 9 9

CLAUDIA GOLDIN 197
findings complement those for white women. Even though thecohorts affected tend to be different, the underlying reasons forthe expansions in these two labor forces are similar. Educationaladvances occurred at different times for each group, and the find-ings for each reinforce the importance of increases in education forwomen as a whole.
The evidence that has been compiled for the period before1890, for which the aggregate data are either entirely absentor lacking in detail, indicate that wherever significant industrialdevelopment occurred, labor force participation rates for youngwomen rose. Furthermore, participation rates in industrial areaswere extremely high even as early as the 1830s. Although thedata are fragile at best for the period before 1860, estimates of a"manufacturing labor force participation rate" for young femalesin five northeastern states have been computed and are given inTable 2. The estimates must also be interpreted in light of the se-vere undercounting of manufacturing firms in the 1832 data for allstates but Massachusetts. The 1832 manufacturing participationrate estimates, ranging across states from 12 to 27 percent, indi-cate that the manufacturing sector attracted a substantial portionof the population of young women in the Northeast. In the earlyindustrializing state of Massachusetts, where the reporting wasmost complete, one-third of all young females were employed inthe manufacturing sector by 1850, if not before. This level roughlyquailed that prevailing in 1880.
Given that some young women were employed in alternativepursuits such as domestic service and teaching, the crude manu-facturing labor force participation rates indicate that a high pro-portion of single women in New England had been drawn into themarket economy by the 1830s. Comparable evidence on female la-bor force participation before 1832 is not available, but the levelsimplied by the 1830s data were most likely achieved quite rapidly,because opportunities for the employment of females were limitedprior to industrial development.

198 A HISTORICAL PERSPECTIVE
TABLE 2 The Manufacturing Employment of Females as a Percentage of 10-[or 15-] to 29-Year-Olds in Five States, 1832-1880
State 1832 1837 1850 1860 1870 18801
Connecticut [11.0 22.6 23.1 18.4 28.5[19.1] [33.7]
Massachusetts 27.1-b '- c 40.25 32.9 28.4 36.7 32.8[18.7] [29.7] [44.0] [39.5]
New Hampshire 11.6-b,- 20.1 22.0 21.` 28.1[10.5] [26.6] [36.6]
New York 8.0 6.8 9.2 15.3[10.8] [18.7]
Rhode Island 26.6- 26.5 33.3 48.7 40.9[24.6] [53.9] [45.0]
Percentage ofU S. totalfemalemanufacturingin five states 70.3 62.9 60.7 56.5
[61.3] [57.7]
aChildren were allocated between boys and girls as given by the 1880population figures for children in manufacturing employment by states.The bracketed figures express the number of females employed inhnanufacturing as a percentage of those 15 to 29 years old in the population.The returns for Rhode Island listed women and female children separately.The Massachusetts and New Hampshire returns did not, and the estimatesassume that 45 percent of all working children were female. The bracketedfigures give the employment of adult women as a percentage of those 15 to29 years old. The Connecticut estimate is only for adult women as apercentage of those 15 to 29 years old. In all cases, the populationgigures for 1832 are for white females only.-The estimates include women in home workshop employment, mainly palmleaf hats and straw hats, bonnets, and braids; the bracketed figures excludethem.
SOURCE: Goldin and Sokoloff (1982:Table 8).

CLAUDIA GOLDIN
TOTAL FACTOR PRODUCTIVITY ANDFEMALE EMPLOYMENT
TECHNICAL CHANGE AND FEMALE INTENSITY
199
Cross-section and time series data on female employment for1890 to 1980 are presented in Table 3 in two ways: as a percentageof the sector or industry labor force that is female and as an index,which divides the industry percentage by the percentage for theentire economy. The index is the more appropriate indicator ofchange over time and measures the extent to which particularsectors and industries expand their female employment at a rategreater than the national average.
The information contained in Table 3 is easily summarized.Most sectors and industries have been either male- or female-intensive for the entire century under consideration, although sev-eral have undergone shifts in labor force composition. Farming,mining, transportation, construction, and public utilities, amongthe sectors, have been male intensive.3 Lumber, furniture, chem-icals, petroleum, stone, metals, machinery, and transportation,among the manufacturing industries, have been male-intensive.Large shifts in the composition of the labor force have occurred inthe communications, professional, and clerical sectors.
How has the index of female intensity for the economy's sectorsand industries been affected by changes in total factor productiv-ity, the measure of technological change used in this analysis?4The answer can be found in Table 4, which presents the resultsof a pooled cross-section, time series regression in which the de-pendent variable is the relative proportion of the labor force in asector, at time t, that is female (given by the index in Table 3). Theexplanatory variables in the regressions are total factor produc-tivity change (TFP), lagged by 5 to 10 years; sector and industry
3 Male and female intensities are defined here in terms of whether theindex (times 100) is less than or greater than 100.
4 The data on total factor productivity are discussed in several volumesby Kendrick (1961, 1973, 1983). Total factor productivity data have beencomputed for the private sector, and those for the service sector join to-gether three major but disparate occupational groupsprofessionals, clericalworkers, and domestic workers. Thus the professional, clerical, and domesticoccupations cannot be included, and only the private sector can be consid-ered. The omission of services from the analysis is unfortunate because ofthe preponderance of women in these three areas of employment.
219

TABLE 3 Female Employment as a Percentage of the Labor Force (and as an Index) of the PrivateDomestic Economy's Sectors and Manufacturing Industries, 1890-1980
MajorIndustrialSector
Female Employment as a Percentage of the Sector's Labor Forceand as an Index1890 1900 1910 1920 1930 1940 1950 1960 1970 1980
Agriculture 7.9 9.1 7.9 9.2 8.0 5.8 8.5 10.0 11.2 18.5(45.8) (49.6) (41.7) (45.0) (36.5) (23.3) (30.6) (30.4) (29.4) (43.4)Mining 0.1 0.2 0.1 0.S 0.1 1.1 2.5 4.6 7.9 11.8(0.7) (1.0) (0.6) (1.3) (3.6) (4.5) (8.8) (14.2) (20.9) (27.8)Transportation 0.2 0.7 0.7 0.8 0.8 3.4(0.9) (S.6) (S.5) (3.7) (3.4) (13.8)
Communicationsand public 14.4 25.1 25.1 43.3 56.0 53.0utilities (83.8) (137.4) (132.3) (211.7) (254.7) (214.8)
Construction 2.7 3.8 5.8 7.9(9.8) (11.5) (15.3) (18.5)Rail transpor- 5.2 5.6 7.1 7.6tation (18.7) (17.0) (18.8) (17.9)Transportation 7.1 9.2 16.4 21.7(excluding rail) (25.6) (27.9) (4S.1) (51.1)Communications 57.4 52.3 48.8 46.4
(205.9) (159.4) (128.4) (108.9)Public utilities 12.1 12.2 13.0 16.8(4S.4) (37.3) (S4.2) (39.5)Trade S4.0 37.7 S8.0 4S.0
(122.0) (114.8) (99.8) (101.1)
2- ) 3

Finance and 44.5 49.5 53.1 61.5
insurance (161.4) (150.8) (139.6) (144.4)
Real estate 29.9 33.2 37.7 46.6(107.4) (101.2) (99.1) (109.4)
Manufacturing 9.0 19.2 17.0 15.0 15.7 22.0 25.0 25.8 29.0 32.5
(110.4) (104.8) (89.7) (73.5) (71.7) ( 89.1) (89.5) (78.7) (76.2) (76.3)
Two-digit SICManufacturingIndustries Female Employment as a Percentage of the Industry's Labor Force
Foods 20.2 21.0 29.5 29.7 24 9 29.7 24.4 26.8 30.0 32.3
Beverages 0.8 1.3 1.9 1.1 2.2Tobacco 31.9 39.3 46.5 58.9 67.2 65.0 53.5 48.3 41.4 37.2
Textiles 40.8 41.4 61.0 47.6 45.7 43.0 42.8 44.8 47.0 48.2
Apparel 60.2 65.2 62.6 63.7 68.1 73.3 70.4 74.9 77.9 78.6
Lumber 0.7 0.6 0.6 0.1 0.9 1.5 4.6 5.7 10.3 14.5
Furniture 4.8 3.9 2.6 8.3 6.6 11.7 15.6 17.8 26.7 31.1
Paper 39.9 34.6 32.9 24.6 25.4 24.3 23.7 22.0 22.7 24.5
Printing 17.6 21.6 22.4 24.0 16.7 23.8 25.0 26.7 32.2 41.2
Chemical 16.9 13.2 14.2 10.7 8.7 16.0 19.8 19.5 23.0 28.2
Petroleum 0.0 0.0 0.0 0.1 0.4 1.5 11.5 12.3 14.4 16.7
Rubber 48.8 36.8 16.4 11.9 19.2 24.8 26.6 28.2 32.1 33.8
Leather 21.0 23.2 24.8 30.2 34.2 40.3 44.0 49.7 57.4 60.4
Stone 1.4 2.6 3.5 7.2 7.6 11.9 17.2 16.6 19.4 23.8
Primary metal 0.0 0.5 0.3 0.8 1.8 2.9 6.5 7.3 9.3 13.3
Fabricatedmetal 3.3 6.6 10.8 11.0 13.8 16.8 17.4 17.7 19.3 22.7
Machinery 0.8 0.6 1.8 3.1 2.6 7.4 13.4 13.9 17.0 21.7
Electricalmachinery 16.8 15.3 22.7 22.9 28.5 32.6 33.6 35.4 39.5 43.3
Transportation 0.6 0.6 0.5 1.6 2.6 6.0 11.5 12.5 14.0 19.1
214

TABLE 3 (continued)
Two-digit SICManufacturing Female Employment as a Percentage of the Industry's Labor ForceIndustries 1890 1900 1910 1920 1930 1940 1950 1960 1970 1980
Residual servicesProfessional 26.3 37.0 42.9 46.8 46.9 A5.8 57.7 60.2 63.5 66.5Domestic 87.8 69.6 67.3 54.3 64.2 /71.7 66.5 72.0 71.7 70.3Clerical 14.1 25.4 34.4 45.8 49.4 * *
* *
Entire UnitedStates 17.2 18.3 19.2 20.4 22.0 24.7 27.9 32.8 38.0 42.6
NOTES: The labor force is defined as those 10 years old and over for 1890 and 1900 and as those 14years and over for 1910 to 1980. Experienced civilian labor used for 1950 to 1980.
After 1940 Beverages are included in the Food industry.The professional category includes educational services publicly provid .d.Domestic includes personal services.The index is defined as the percentage of the sector's labor force that is female divided by
the percentage of the national labor force that is female multiplied by 100. It measures thefemale intensity of a sector relative to the national average.
A slash within a series (/) indicates u change in definition and noncomparability over time.An asterisk (*) indicates that the series does not exist for that year.
SOURCES: All but manufacturing detail, 1891) to 1980 Censuses of Population. Manufacturing detailfor 1390 to 1930, Censuses of Manufacturing. The two-digit SIC groupings were approximated usingonly those industries with more than 15,000 employees in the earlier years and more than 25,000 inthe later years.
2 1.D

CLAUDIA GOLDIN 203
TABLE 4 Explaining an Index of Female Employment Across Sectors andIndustries, 1890 to 1980
Dependent Variable: Index of FemaleEmployment (in year.1)- Estimation 1-b Estimation 2-b
Constant 0.789 (7.94) 0.805 (10.86)Total Factor Productivity (TFP) change
at time (t -j), 5 <1 < 10 years 0.0234 (1.74) -0.0317 (1.31)Time, years from 1900 -0.0020 (1.59) 0.0007 (0.91)Sector and industry dummies
Farm -0.298 (1.38) -0.431 (5.33)Mine -0.496 (3.11) -0.709 (9.98)Transportation (before 1940) -0.762 (1.92) -0.843 (6.95)Communications and public utilities
(before 1940) 0.853 (1.62) 0.762 (5.03)Construction -0.463 (2.56) -0.718 (9.38)Rail -0.427 (1.58) -0.683 (7.34)Transportation (non-RR) -0.298 (1.36) -0.533 (6.50)Communications 0.032 (0.05) -0.282 (1.65)Public utilities -0.242 (0.92) -0.518 (5.56)Trade 0.403 (0.95) 0.141 (1.11)Finance 0.836 (4.38) 0.579 (7.40)Real estatt 0.398 (1.40) 0.131 (1.35)Food 0.482 (2.25)Apparel 1.981 (7.50)Textiles 1.291 (5.39)
Interactions with TFPFarm *
Mine *
Transportation 0.065 (1.60)Communications and public utilities 0.174 (3.87)ConstructionRail * 0.032 (1.01)Transportation (non-RR) * 0.068 (1.77)Communications 0.149 (1.22) 0.218 (5.38)Public utilities 0.039 (1.36)TradeFinance 0.071 (1.61)Real estate * 0.056 (1.01)Food -0.085 (1.15)ApparelTextiles -0.131 (1.90)
Number of observationsR
328 107.60 .97
NOTES: Absolute values of 't'-statistics are in parentheses. Ordinaryleast-squares estimation used. An asterisk (*) indicates coefficient isinsignificant at even unconventional levels of significance testing.Manufacturing is the omitted sector in both estimations; two-digit industriesother than food, apparel, and textiles are omitted from Estimation 1.
IThe index is defined in the note to Table 3.-See text for discussion.SOURCE: Calculated by the author based on data from Table 3 and Kendrick(1961, 1973, and 1983).
21J

204 A HISTORICAL PERSPECTIVE
dummies; a time trend; and interactions between TFP and thedummy variables. The estimation indicates that female intensityhas increased with increases in total factor productivity--wheretechnological advances have been greatest, women's employmentshare relative to the average has increased the most.
Estimation 1, which includes all sectors and all industrieswithin manufacturing, indicates that each percentage point in-crease in total factor productivity increases the index by 0.0234.(The mean of the index is 0.794, and the mean of the change in totalfactor productivity is 2.19.5) Estimation 2 excludes the 19 detailedtwo-digit SIC manufacturing industries, reducing the number ofobservations from 328 to 107. While the coefficient on the changein total factor productivity is negative (-0.0317, but not verystatistically significant), the interaction terms with the varioussectors suggest strong positive net effects. The coefficients on theinteractions with transportation (before 1940); communicationsand public utilities (before 1940); and transportation, communi-cations, trade, public utilities, and finance tsre large enough (andgenerally statistically significant) to outweigh the negative coeffi-cient on technical change. Only the farm, construction, mine, rail,trade, and real estate sectors appear to have either negative or zeronet impacts of changes in total factor productivity on the index.The impact of total factor productivity change on female intensityis different in these sectors than for the economy as a whole, andthe reasons in the cases of the farm, construction, mine, and railsectors seem obvious.
Several qualifications to this analysis must be noted. The re-lationship between the index and total factor productivity has notbeen explicitly modeled, and the anal}sis should be viewed as onethat is exploratory rather than one of hypothesis terting.5 Total
5 The index would have a mean of 1.0 if all sectors were included, becausethe index is merely the female intensity of a sector at time t divided by thefemale intensity of the economy's labor force at time t. The private serviceand the government sectors have been excluded because of the lack of totalfactor productivity data; taken together these sectors have an index greaterthan 1.0.
6 Kendrick (1983:44) regressed changes in total factor productivity onvariables that included the proportion of the sector's labor force that wasfemale, for the cross-section 1966 to 1979. The size of the coefficient on thepercentage female is in the range of those in Table 4 (although note thereversal of the causality). Kendrick's motivation, it should be noted, was to
217

CLAUDIA GOLDIN 205
factor productivity (read technological) change is implicitly as-sumed to be independent of the female intensity of a sector's laborforce, but it may not have been. More female-intensive sectors mayhave had higher levels of total factor productivity change becauseof lower unionization and less-specific human capital, among otherinfluences that might reduce resistance to technological advanceSeveral variables that might be included in the analysis, such asthe education and the skills of the labor force and the level ofunionization, have not been. In addition, the total factor produc-tivity measure of technological change is constructed as a residual,and as such it can measure more than the change in output forconstant inputs. It may unintentionally measure changes in theinputs that are not observed.? Leaving this source of potentialbias aside, the findings from the estimation indicate that sectorsthat have increased total factor productivity more than average
study the determinants of technological change rather than to understandits impact.
7 The labor force is measured by a weighted average of hours of work,where the weights are based on labor compensation (see Kendrick, 1961,Appendix A for further details). As the labor force increases because morewomen enter it, the measure will increase less than a labor force increasebecause men entered. The lower average compensation of women accountsfor the difference. But if the lower compensation of women does not entirelyreflect lower productivity, the labor force measure will be biased downward.Sectors and industries increasing their labor force by adding women willappear more productive in terms of the total factor productivity index,because their labor force will be increasing by less than their output evenif there had been no change in technology. A related bias concerns theefficiency units of labor. Increases in education for society as a whole havehad impacts on the labor force that differ for males and females. Certainoccupations, it appears, enable workers to substitute training acquired off thejob for that traditionally acquired on the job, and women, whose life-cyclelabor force participation is more discontinuous and shorter than that of men,have tended to enter such occupations. Thus, as the average educationalattainment of the population has increased, women have become a higherproportion of the labor force in certain sectors, such as those employingclerical workers. More highly educated workers will increase the measure oftotal factor productivity, because only the number of laborers or the hoursof labor input, and not the quality-adjusted labor input, is used. Thusa positive correlation between the index and the measure of technologicalchange can occur. This possible bias can be accounted for by including themean level of education of the work force in each sector. Such data existonly for relatively recent periods of time.

206 A HISTORICAL PERSPECTIVE
tend to have more female-intensive methods of production.° Theresult stems primarily from the correlation found in the cross-sections, rather than from a pos'Ave relationship between totalfactor productivity change and female intensity in time series forgiven sectors. %deed, the female-intensity indices of most of thesectors and indtstries are relatively constant.
Why might there be a positive correlation between the indexof female intensity avid the change in total f actor productivity?It is possible that the most innovative sectors require flexiblelabor forces, and that the female 'bor force, being less unionizedand less experienced, has been more amenable and receptive tochange in work organization. it may also be the case that totalfactor productivity change is correlated with an increase in theproportion of the labor force that is less skilled.° The degreeto which technological change increases or decreases a portionof the labor force is probably dependent on the degree to whichthe capital employed is a relative substitute or complement tothat type of labor. Technological change in the clerical sector,in manufacturing earlier in this century, and in communicationsmay well have involved the substitution of relatively unskilledfor skilled labor, but other evidence suggests that skilled laborhas more recently become a relative complement to capital inthe economy as a whole (see, for example, the evidence cited inWilliamson and Lindert, 1980).
What does the positive correlation between changes in totalfactor productivity and the relative female intensity of a sector
8 Manufac curing data for the early nineteenth century confirm the positivecorrelation between the proportion of females in an industry and the rate oftechnological change found here. From 1820 to 1850, total factor productivitychange was greatest in cotton textiles, hats, tanning, and wool and mixedtextiles. All but tanning was a female-intensive industry. Total factorproductivity change was the lowest in liquors, flour milling, and tobacco.Only the tobacco industry, among the three, hired female employees. (Indexesof total factor productivity for 1820 to 1860 were produced by KennethSokoloff as part of Sokoloff (19841 and were made available to me by t'eauthor.) The evidence on facto bias is more mixed (Cain and Paterson,1986). Tae industries with the greatest labor-saving technical change from1850 to 1919 were apparel, rubber, leather, and metals (both primary andfabricated). The female intensities of the labor forces in these industries werediverse and did not change much over the 70-year period.
9 Kendrick does find a positive correlation between the proportion of thelabor force consisting of production workers and the change in total factorproductivity.
2.0

CLAUDIA GOLDIN 207
or an industry imply about the impact of technological changeon female employment? That female-intensive sectors have beenthose experiencing the greatest technological advances dces notnecessarily mean that these sectors have had the greatest increasesin employment. Indeed, the opposite could have occurred.
The regression analysis examined the first portion of Equa-tion 1, the impact on an index of female intensity of a sector orindustry. The second part of that equ,ttion concerns the impacton total employment. Equations similar to those it Table 4 (butnot presented here) have been estimated for the entire labor force,where the dependent variable was some function of the propor-tion of total employment in a particular sector. The dependentvariable was expressed as the percentage, the change in the per-centage, or the percent change in the percentage. In almost allestimations the dependent variable was negatively related to totalfactor productivity in the preceding decade. That is, sectors withhigher productivity growth had a smaller increase in their employ-ment share or a smaller share or a smaller proportional increasein the share. Simply put, employment growth was negatively as-sociated with technological advance. The agricultural sector hadthe largest impact on the regression and, in at least one variant ofthe estimation, was responsible for the entire effect. Agricultureexperienced relatively small increases in total factor productivityuntil the mid-twentieth century when its technological advancewas among the greatest in the economy. It has also been a sectorof rapidly reduced employment. The example of agriculture is areminder that the income and price elasticities of demand, whichare only implicit in this simple analysis, are driving many of theresults.
It does appear to be the case that more female-intensive sec-tors have generally had expanded employment relative to all othersbecause of less, and not greater, technological advance. That is,among the female-intensive sectors, those with the least techno-logical change grew the most in empluyment. Services are a well-known example, although it has also been claimed that total factorproductivity measures do an imperfect job of capturing technolog-ical advance in this diverse sector (National Research Council,1979). On balance, the role of technological change in the totalemployment picture is less one of encouraging the expansion offemale-intensive sectors as it is one of allowing the reduction in
22

208 A HISTORICAL PERSPECTIVE
the employment of the single largest sector early in this century,that of agricultural production.
EDUCATION AND THE CHANGING EMPLOYMENT OF WOMEN
The expansion of knowledge, termed technological advancehere, is frequently embodied in a factor and expands it when thefactor is expressed in efficiency units.w Measures of total factorproductivity do not ordinarily use efficiency units, and embodiedtechnological change is then e.ecessarily included in the residualmeasure of technological change. Denison (1962, 1974), amongothers, has computed the portion of the residual due to increasesin education. From 1929 to 1957 real national income rose at 2.93percent average annually. Labor, land, and capital, conventionallymeasured, accounted for 1.43 percentage points, with the residualmeasure of technological change equal to 1.50. Of this 1.50, almostone-half, or 0.67 percentage points, was due to the augmentationof labor in the form of increased education.
In the American case, educational advances for males andfemales have paralleled each other, but the impact on the oc-cupational structure and labor force participation of women hasprobably been greater. I turn first to the data on educationalchange and then to the impact on employment and occupations.
The two lines in Figure 2 give, from left to right, median yearsof schooling for female cohorts born from 1876 to 1952 and thepercentage with 4 or more years of college. The data on medianyears of schooling clearly show a sharp rise in the educationalattainment of young American women beginning approximatelywith the cohorts born between 1900 and 1910. During a verybrief period, the median female in-rc:ased her years of educationby one-third, from about 9 to 12 years. The rapid rise in years ofschooling was a product of the well-known increase in high schooleducation, with these individuals leaving school from 1915 to 1928.
10 Inputs are gene:ally measured in physical units, such as labor hours.To express a factor in efficiency units means that one measures, in somemanner, the degree to which the factor is skilled or educated, for example.One method of doing this is to use a weighting scheme for, say, education.Years of education are valued using earnings at some date to form an index,and as the labor force becomes more educated its value rises.

CLAUDIA GOLDIN
13
209
Year of Birth
FIGURE 2 Educational attainment for cohorts of white women born from1876 to 1952. Note: Horisontal lines indicate the width of the birth cohortsfor which data on educational attainment are given. Source: Bureau of theCensus, Current Population Reports, Series P-20 for years 1940, 1947, 1962,1966, 1968, 1970, 1972, 1974, 1977.
After the initial schooling increase with the cohorts born from1900 to 1910, median years of education have increased only gradu-ally, with the exception of the most recent cohorts. Change in theireducational attainment can be seen more clearly with reference tothe graph in the far right of Figure 2, which gives the percentageof women with 4 or more years of college. That indicator hasincreased most rapidly with cohorts born after 1940.
The employment effects of increased education can be seenby comparing the educational data with those on cohort laborforce participation in Figure 1. It is not at all coincidental thatthe cohorts experiencing the greatest increases in participationrates over their lifetimes were those with the greatest increasein education when young. The cohort born from 1900 to 1910achieved an educational transformation in high school completionrates; it was precisely this cohort that experienced substantialincreases in its labor force participation both during its early yearsand even more so during the 1950s when it was 40 to 50 years old.Although Figure 1 does not show the labor force participation
2 T., ,L

210 A HISTORICAL PERSPECTIVE
rate of single women, the cohort born around 1910 also achieveda high rate of labor force participation when single, even thoughit had an increased educational attainment. It was able to achievethis both by spending considerably less time "at I_ e," as thecensus termed those individuals not at school and not having anoccupation.
The data on education in Figure 2 are for the white femalepopulation. Increases for the black female population have beengreater than those for the female population as a whole, beginningwith cohorts born around 1900. Cohorts of black women bornin 1900 had, on average, three years less schooling than theirwhite counterparts; cohorts born around 1950 had one-half yearless schooling (Smith, 1984). The large increase in high schoolcompletion evident from Figure 2 for white women was achievedabout two decades later for black women. Thus, differential ratesof educational attainment might explain some of the differencespointed out earlier in labor force participation rates between blackand white married women.
How did educational change in the first three decades of thiscentury affect the job opportur'ies of young women, and how didit later affect their labor force participation when married? Occu-pational data arranged by cohort suggest that young women withincreased education moved into the clerical sector and, relatively,out of manufacturing employment in 1930 and 1950; and otherdata indicate that women, who in the 1920s and 1930s were em-ployed in such occupations, had a higher probability of remainingin or reentering the labor force when older (Goldin, 1986b). Table5 gives various occupational distributions by age for 1930 to 1950,where the group described varies somewhat over time because ofdefinitional changes in the census. Despite this complication, it isclear that the percentage of women in the clerical sector is lowestfor those birth cohorts having the least amount of education, withthe latter variable given by the data in Figure 2. Cohorts bornafter 1900 increased their percentages in the clerical sector fromabout 13 to 24 percent for married women in 1930 and from 17to 23 percent for all marital statuses in 1950. Micro-level datafrom 1940 demonstrate that educational levels above high schoolsubstantially increased earnings in clerical-sector jobs (Goldin,1984), and in general, occupations in the clerical sector have hademployees with relatively high levels of education.

CLAUDIA GOLDIN 211
TABLE 5 Percentage of the Female Labor Force Employed in the Clerical (andsales) Sector, 1930-1950 by Birth Cohort
Demographic Group
Birth Cohorts1916-1922
1911-1915
1906-19t0
1896-1905
1886-1895
1885-andearlier
1930 Married, native white 26 9 24.0 13.3 6 71930 Single, native white 26.1 35 6
1940 Married, white! 35.5 36.4 34.2 28 8 19 51940 Married, white,urban 42.4 43.0 39 6 31 9 21.4
1926- 1921- 1916- 1906- 1896- 1891- 1886-1930 1925 1920 1915 1905 1895 1890
1950, All marital statuses,white 48.9 39.7 30.3 26 4 23.1 17.3 14.0
!Married, husband present Employment away from home and not on public emergency works.Married, husband present, in cities with more than 100,000 persons.
SOURCE: U.S. Censuses of Population, 1930-1950.
Thus, increased educational standards for all Americans dur-ing the first few decades of this century expanded the employmentof women at that time and later, as cohorts with increased edu-cation aged. Furthermore, the increase in educational attainmentwith the cohorts born after 1940 to 1945 is easily correlated withsubstantially higher labor force participation in the most recentdecades. The influence of increased education on labor force par-ticipation can also be observed in cross-sectional analysis. Almostall labor supply studies find positive coefficients on education inparticipation or hours equations (see, for example, the studies inSmith, 1980). The reasons for this positive cross-sectional rela-tionship are a bit different from those offered here. Educationaugments wages, and labor supply increases with the wage, hold-ing income constant or giving a relatively small income effect. Therelationship for the time series analysis concerns the shift in occu-pations from those requiring on-the-job training to those for whichoff-the-job training is a good substitute.
CHANGES IN WORK ORGANIZATION
Technological change also encompasses alterations in work or-ganization that enhance productivity. During the first half of the
294
212 A HISTORICAL PERSPECTIVE
nineteenth century the employment of young women in the manu-facturing regions of America greatly expanded both in industriesthat were mechanized, such as textiles, and in those that were not,such as boots and shoes, paper, and clothing (Goldin and Sokoloff,1982; Sokoloff, 1984). In the mechanized industries, part of theincreased scale of firms and the increased employment of womenwas due to technological change involving new and improved typesof capital equipment. But even in these industries, and certainlyin the nonmechanized ones, much of the increased employment ofwomen was attributable to an increase in the division of labor andthus to changes in the organization of work in nascent factories.Changes external to the firm, such as improved transportation ofgoods, better-integrated labor markets, and more efficient capi-tal markets, enabled firms to increase their scale of operations,and thus benefit from the increased division of labor and achievegreater efficiency.
Within manufacturing, there have been wide differences in theorganization of work for female and male employees. In 1890, forexample, 47 percent of all female manufacturing operatives werepaid by the piece, but only 13 percent of the males were. Femaleswere therefore 3.5 times as likely to be employed on piece ratesthan were males. Furthermore, piece-rate payment almost alwaysprevailed when males and females occupied the same position inthe same firm Examples from the textile industry are instructive.In only one out of the six predominantly male occupations incotton textiles was payment generally made by the piece, butamong four, in which both men and women were found, only onewas paid by time. Also, males, but not females, were frequentlyemployed in teams and by the method of inside contracting, bywhich independent contractors organized labor within a firm.
Goldin (1986a) explores the role of monitoring and supervisorycosts in the adoption of different methods of work organization formale and female manufacturing employees. Firm-level data onsupervisory costs and the numbers of male and female workersin piece and time rate positions suggest that differences in thecosts of supervision influenced the form of work organization. Infactories, male workers were more often paid time-based wagesrather than piece rates and employed on teams because their timeon the job was generally longer than that of females and thus theyrequired less supervision. The ability of manufacturing enterprisesboth to use a technology with an intricate division of labor and to

CLAUDIA GOLDIN 213
monitor the output of workers therefore fostered the employmentof females.
The existence of monitoring and supervisory costs can alsoexplain the transformation of occupations in the clerical sectorthat were "feminized" rapidly from 1900 to 1920. It has frequentlybeen claimed that this feminization was the result of technologicalchanges, such as the mechanization of the office. But was thefeminization of the office a function of the reduced level of skillrequired with the division of office work into tasks or was it afunction of a reduced level of supervision needed to elicit somelevel of output?
In the early history of the modern office various tasks werepaid by the piece. Typewriters in the Graton and Knight Manu-facturing Company, for example, were equipped with cyclometers;"240 depressions of the typewriter keysor space bar [were] equiva-lent to one point .. . 600 points [were] considered base productionand each point produced in excess [was] allowed for at the rateof one and one-half cents a point" (Coyle, 1928:23-24). But piecerates did not prevail in this sector, and their decline was a tributeto the ability of employers to pretest employees whose trainingin commercial and high school courses was completed before jobentry.
Monitoring in the office became even simpler and cheaperthan in the factory. Employers divided workers into homogeneousgroups and paid each a set day rate. Standardization enabled em-ployers to screen workers prior to employment. Thus, it appearsthat women began to be employed in the clerical sector when itsjobs could be more finely divided, as had occurred a full centurybefore in manufacturing, and its output more cheaply monitored.(See Rotella, 1981, for an analysis of clerical employment thatstresses human capital aspects of the mechanization and feminiza-tion of the office.)
RELATIVE EARNINGS OF FEMALES TO MALES, 1815 TO 1982
The degree to which technological change is biased withinsectors or industries and the degree to which even neutral techno-logical change occurs in particular sectors or industries alters therelative earnings of inputs, such as capital and labor or male andfemale labor. Such impacts can be ignored when only one sector orone industry is at issue, but not when the entire economy is being
2`-),:;., l

214 A HISTORICAL PERSPECTIVE
considered. Changes in female earnings alter female employmentbecause their labor supply function is elastic. How have the earn-ings of females changed relative to those of males over the course ofAmerican history, and what role has been played by technologicalchange?
Table 6 and Figure 3 give the ratio of female to male earningsfoz the manufacturing sector from 1820 to 1970 and for all sectorsfrom 1890 to 1982. The relative wage of females to males wasfairly low in the northeastern states prior to industrialization butrose quickly wherever manufacturing activity spread (Goldin andSokoloff, 1982, 1984). Around 1815 the ratio of female to malewages in agriculture and domestic activities 'as 0.288 and rose toabout 0.303 to 0.371 among manufacturing establishments at theinception of industrialization in the United States in 1820. By 1832the average ratio in manufacturing was about 0.44, and it contin-ued to rise to 0.50 in the northeastern states by 1850. Nationwidethe ratio rose slowly to about the year 1885, when it reached its1970 value of approximately 0.56. Early industrialization, there-fore, increased the relative wage of females to males by almost 50percent, and in the briefest of periods, a mere two decades, thegender gap in manufacturing and domestic employment narrowedby 15 percentage points.
The ratio of female to male full-time earnings for the entirepopulation increased from 0.463 to 0.603 over the period 1890 to1970, using the series constructed from earnings in six sectors. Theincrease over time is somewhat greater when earnings :lie adjustedfor hours of work among full-time employees, frc-in 0.498 to 0.657The gender gap has remained relatively constant over the periodsince 1950, with the exception of an initial decline in the ratioand a rise beginning in about 1980. The recent rise appears tobe substantial in magnitude, and if the explanations in (4oldin(1986b) and Smith and Ward (1984) are correct it will continuefor some time.
Goldin (1986b) and Smith and Ward (1984) present data Cathe life cycle labor force experience of the working population ofwomen, which indicates that working women's labor market expe-rience has not increased substantially, if at ail, during the periodfrom 1950 to the present. The increase in the labor force partici-pation rate of women was su'ostantial enough that new labor forceentrants pulled down the average labor market experience accu-mulated by those already employed. Because wages are computed
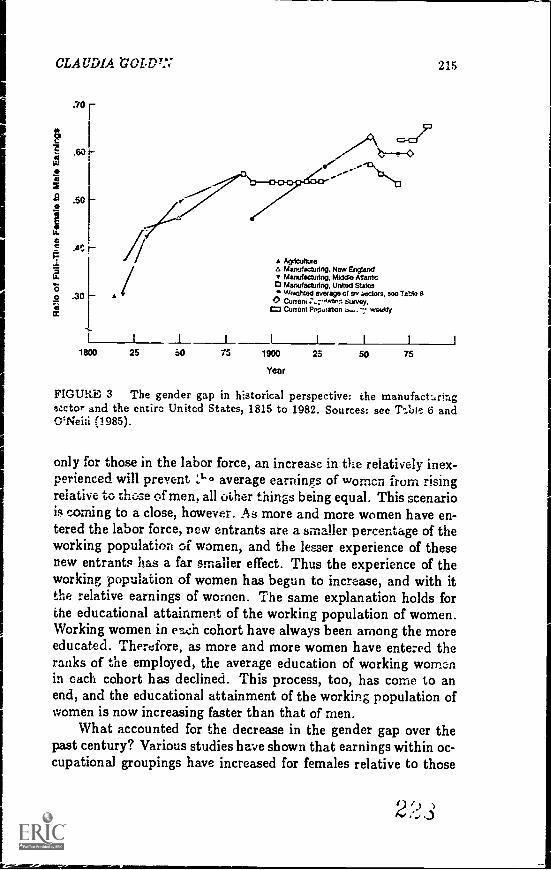
CLAUDIA .0L^ 215
3or
.60f-
.50
f4C r
.30
AgricultureA Manufacturing, New England
Manufacturing, Midair Atlantico Manufacturing, United States
werahted average of an lectors, see TabieQ Current Survey.
0 Current Fincdration veaeldy
.t.I1 --I I I I I
1800 25 SO 75 1900 25 50 75
Year
FIGURE 3 The gender gap in historical perspective: the manufactaingezctor and the entire United States, 1815 to 1982. Sources: see Tfoic 6 andO'Neiii (1985).
only for those in the labor force, an increase in the relatively inex-perienced will prevent :,1-o average earnings of women from risingrelative to those of men, all other things being equal. This scenariois coming to a close, however. As more and more women have en-tered the labor force, new entrants are a smaller percentage of theworking population of women, and the lesser experience of thesenew entrants has a far smaller effect. Thus the experience of theworking population of women has begun to increase, and with itthe relative earnings of women. The same explanation holds forthe educational attainment of the working population of women.Working women in each cohort have always been among the moreeducated. Therefore, as more and more women have entered theranks of the employed, the average education of working womenin each cohort has declined. This process, too, has come to anend, and the educational attainment of the working population ofwomen is now increasing faster than that of men.
What accounted for the decrease in the gender gap over thepast century? Various studies have shown that earnings within oc-cupational groupings have increased for females relative to those
2',

216 A HISTORICAL PERSPECTIVE
TABLE 6 Wage Ratios for Males and Females in Manufacturing Employment,1815 to 1970, and Across All Occupations, 1890 to 1982
Agriculture1815 0.29
Manufacturing18202 0.37-0.3018322 0.44-0.4318502 0.46-0.501885 0.5591890 0.539
189919041909
Full Time0.5350.5360.536
Actual0.5360.5350.537
Full TimeWeekly Hourly
1914 0.535 0.534 0.568 0.5921920 0.559 0.6451921 0.536 0.536 0.617 0.6531922 0.612 0.6771923 0.535 0.536 0.607 0.6721924 0.593 0.6641925 0.536 0.536 0.592 0.6571926 0.585 0.6621927 0.597 0.6521328 0.573 0.6451929 0.575 O.R371930 0.578 0.6351931 0.612 0.6211932 0.653 0.6181933 0.661 0.6561934 0.688 0.7041935 0.653 0.700
ManufacturingAll Occupations(median earnings)
ConstructedfromSix Sectors
1890193C
Full Time Total ActualAdjustedfor Hours
0.4630.556
1939 0.539 0.513 0.5811950 0.5371951 0.5321952 0.5581953 0.5121954 0.4971955 0.580 0.526 0.639 0.6891956 0.583 0.515 0.639 1.6901957 0.554 0.496 0.633 0.6801958 0.570 0.477 0.630 0.6771959 0.580 0.613 0.664
2,? .1

CLAUDIA GOLDIN 217
TABLE 6 (continued)
ManufacturingAll Occupations(median earnings)
ConstructedfromSix Sectors
19601961196219631964196519661967196819691970197119721973197419751976197719781979198019811982
Full Time Total
0.5590.5340.5570.5440.5470.5320.5240.5630.5490.5440.540
Actual
0.6080.5940.5950.5960.5960.6000.5800.5780.5820.6050.5940.5950.5790.5660.5720.5880.6020.5890.6000.5960.6020.5920.617
Adjustedfor Hours
0.6630.6470.6520.6540.6590.6660.6460.6390.6440.6690.6550.6530.6360.6270.6270.6330.6660.6480.6580.6560.6460.6460.672
0.603
NOTE: Except where noted these ratios are based on mean earnings of full-timeyear-round employees.
!The range is for New England and the Middle Atlantic.
SOURCES: This series has been compiled by the author from a variety of sources.See Goldin (1986c) for details. Data for All Occupations category from O'Neill(1985:Table 1).
2 3 1

218 A HISTORICAL PERSPECTIVE
for males, particularly in the clerical and professional sectors.Furthermore, the skill differential across all occupations narrowedconsiderably after 1940 (Heat, 1960). Thus, relative earnings forfemales to males have increased within occupations, and this fac-tor has been of overwhelming importance in accounting for theincrease in the earnings ratio over time. It appears that the oc-cupational distribution mattered far less than earnings within oc-cupations in determining the overall earnings ratio of females tomales (Goldin, 1986c; Polachek, 1984). This finding is particularlynoteworthy, since it is generally presumed that the occupationaldistribution is the primary determinant of the gap between maleand female earnings.
The degree to which the occupational distribution mattersin determining the aggregate ratio of female to male earningsinvolves constructing two hypothetical cases. In one, all womenhave the occupational distribution of men, but their earnings foreach occupation remain the same. In the other, counterfactualworld, all men have the occupational distribution of the womenbut have the earnings for each occupation that they ordinarilyhave. There are then three (or more) measures of the percentageof the earnings gap that is explained by occupations; one minusthis measure gives the difference in pay within occupations. Thethree measures include the two from the hypothetical cases and athird which averages the first two.
This technique has been used by Polachek (1984) and Treimanand Hartmann (1981). One problem with it is that the answer de-pends on how many occupations are used. Polachek uses 195occupations and finds that somewhat more than 10 percent ofthe earnings gap is explained by occupational differences; Treimanand Hartmann use 222 occupations and find that somewhere be-tween 11 and 19 percent of the gap is explained. Neither of thesemeasures seems particularly large. But when the number of occu-pations rises to 479, more is explained. If the first of the counter-factual worlds is used (and this seems to be the one that makesthe most sense in this context), then 19 percent of the pay gapis explained; the second counterfactual world leads to 41 percentbeing explained.11 Even 19 percent seems rather low. Further-more, it is not clear whether it would be useful to increase the
11 Note that these numbers differ from those cited in early printings ofTreiman and Hartmann (1981:Table 9), which were in error.
- 2 3.i.

CLAUDIA GOLDIN 219
number of occupations in the analysis beyond 222. The issue ofthe optimal or correct number of occupations to use is still verymuch unexplored.12
Technological change narrowed the gender gap during the pe-riod of early industrialization, when the use of new forms of capitalequipment and work organization raised the relative productivityof females and the young. The increase in the manufacturing sec-tor, which was relatively female intensive, also served to raise theoverall ratio of female to male earnings. But changes in the earn-ings ratio after the first half of the nineteenth century are morecomplicated. Employment effects of technical change combinedwith differing demand, income elasticities expanded certain sec-tors and contracted others, and the increase in education raisedthe relative earnings of females within occupational groups.
The large increase in female labor force participation overthe last 30 years has meant that recent labor market entrants havehad substantially less job training than have previous participants.Entrant3 have, until recently, also had less education than theaverage female population. Therefore, the average wages of theworking population of women as a whole have been depressed bythe wages of the new entrants, even though the wages of priorparticipants have been rising. In a period of rising labor forceparticipation, a stable ratio of female to male earnings does notnecessarily indicate an absence of economic and social progress forwomen.
CONCLUDING REMARKS
Technological advances have altered the employment of wom-en in the following ways throughout American history:
1. Increases in total factor productivity across sectors from1890 to 1980 have been positively associated with an index of thefemale intensity of the labor force, but total employment of bothmales and females has not necessarily been positively related totechnological advance.
12 One procedure would be to assess the cross-elasticity of substitutionamong occupations for individuals. Such a procedure would be similar tothat used in antitrust cases in deciding what the market is for a particulargood, and thus what the definition of a good is. As a general rule, one doesnot want to disaggregate occupations so finely that occupation itself is anexact proxy for earnings.

220 A HISTORICAL PERSPECTIVE
2. Increases in education have been positively associated withincreases in female labor force participation and may be the singlemost important factor in altering the shape of participation ratesfor married women during their life cycles.
3. Changes in work organization, in particular an enhanceddivision of labor in manufacturing from 1820 and in the clericalsector from around 1900, have increased the demand for femaleemployees.
4. Relative earnings for females to males rose after 1820 andcontinued to rise to about 1930 or 1940. The aggregate ratio wasvirtually constant from 1950 to 1980, but has risen during thepast half decade. The ratio for manufacturing employment hasremained virtually constant since about 1885. Changes in tech-nology seem to be the most likely reason for the initial advance,and changes in the experience and education of the working pop-ulation of women appear to have been responsible for much of therem nt rise.
The se ular increase in female employment in America hasowed much to the relative growth of particular sectors in the econ-omy, such as those employing clerical and professional workers,and to the decline of others, such as agriculture. Further workwill have to perform the major task of separating the role of tech-nological change from those of demand and income elasticities inaltering the sectoral distribution of labor.
REFERENCESCain, Louis P., and Donald G. Paterson
1986 Biased technical change, scale, and factor substitution in Americanindustry, 1850-1919. Journal of Economic History 56(March):153164.
Coyle, Grace1928 Present Ti.ends in the Clerical Occupations. New York: The Woman's
Press.Denison, Edward F.
1962 The Sources of Economic Growth in the United States and theAlternatives Before Us. Supplementary Paper 13. New York: Com-mittee for Economic Development.
1974 Accounting for United States Economic Growth. las to 1969. Washing-ton, D.C.: The Brookings Institution.
Easterlin, Richard1980 Birth and Fortune: The Impact of Numbers on Personal Welfare. New
York: Basic Books.
23.3

CLAUDIA GOLDIN 221
Goldin, Claudia1987 The female labor force and American economic growth, 1890 to
1980. Ch. 10 in S.L. Engerman and R. Gellman, eds., Long-Term?Fends in the American Economv. Chicago: University of ChicagoPress.
19863 Monitoring and occupational segregation by sex: a historical anal-ysis. Journal of Labor Economics 4(January):1-27.
1986b Life-Cycle Labor Force Participation of Married Women: HistoricalEvidence and Implications, University of Pennsylvania. Revisedversion of National Bureau of Economic Research Working Paper#1251. Cambridge, Mass. December.
1986c The Earnings Gap Between Male and Female Workers: An Histor-ical Perspective. National Bureau of Economic Research WorkingPaper #1888. Cambridge, Mass. April.
1984 The historical evolution of female earnings functions and occupa-tions. Ezplorations in Economic History 21(January):1-27.
1983 The changing economic role of women: a quantitative approach.Journal of Interdisciplinary History 13(Spring):707-733.
1977 Female labor force participation: the origin of black and whitedifferences, 1870 to 1880. Journal of Economic History 37(March):87-108.
Goldin, Claudia, and Kenneth Sokoloff1982 Women, children, and industrialisation in the early republic: evi-
dence from the manufacturing censuses. Journal of Economic History42(December):741-774.
1984 The relative productivity hypothesis of industrialization: theAmerican cue, 1820 to 1850. The Quarterly Journal of Economics44(August):461-487.
Keat, Paul G.1960 Long run changes in occupational wage structure, 1900-1956. Jour-
nal of Political Economy 68(December):584-600.Kendrick, John W.
1961 Productivity ?Fends in the United States. National Bureau of EconomicResearch. Princeton: Princeton University Press.
1973 Postwar Producnvity ?Penile in the United States, 1948-1969. NationalBureau of Economic Research. New York: Columbia UniversityPress.
1983 interindustry Difference.. in Productivity Growth. Washington, D.C.:American Enterprise Institute.
Mansfield, Edwin1969 The Economics of Technological Change. New York: Norton.
N .tional Research Council1979 Measurement and Interpretation of Productivity. Report of the Panel to
Review Productivity Statistics, Committee on National Statistics.Washington, D.C.: Naticnal Academy of Sciences.
O'Neill, June1985 The ttnd in the riale-female wage gap in the United States,
Journal of Labor Economics 2(January, Suppl.):49-70.Polachek, Solomon William
1984 Women in the economy: perspective! on gender inequality. Pp.34-53 in U.S. Commission on r;ivil Rights, Comparable Worth: Issues
2 `74 il...

222 A HISTORICAL PERSPECTIVE
for the 80'a. v11.1. A consultation held June 67. U.S. GovernmentPrinting Office 1984-524-379. Washington, D.C.: U.S. Commissionon Civil Rights.
Rosenberg, Nathan1972 Technology and American Economic Growth. New York: Harper &
Row.Rotella, Elyce
1981 from Home to Office: U.S. Women at Work, 187. 1930. Ann Arbor:UMI Press.
Smith, James, ed.1980 Female Labor Supply: Theory and Estimation. Princeton: Princeton
University Press.Smith, James
1984 Race and human capital. American Economic Review 74 (Septem-ber):685-698.
Smith, James, and Michael Ward1984 Women's Wages and Work in the Twentieth Century. Santa Monica,
Calif.: Rand.Sokoloff, Kenneth
1984 Was the transition from the artisanal shop to the nonmechanizedfactory associated with gains in efficiency? Evidence from the U.S.Manufacturing Censuses of 1820 and 1850. Explorations in EconomicHistory 21(October):351-382.
Stoneman, Paul1983 The Economic Analysis of Technological Change. Oxford, England:
Oxford University Press.Treiman, Donald J., and Heidi I. Hartmann, eds.
1981 Women, Work, and Wages: Equal Pay for Jobs of Equal Value. Wash-ington, D.C.: National Academy Press.
Williamson, Jeffrey, and Peter Lindert1980 American Inequality: A Macroeconomic Hiatory. New York: Academic
Press.

Recent Trends in Clerical Employment.The Impact of Technological Change
H. ALLAN HUNT and TIMOTHY L. HUNT
THE GROWTH OF CLERICAL ANDFEMALE EMPLOYMENT
Clerical jobs are the largest single occupational group in theeconomy; they are also one of the most diverse. Generally peopleassociate the traditional office occupations with the term "cleri-cal." Indeed, secretaries, typists, stenographers, file clerks, officemachine operators, and receptionists do make up a large propor-tion of all clerical workers. But bookkeepers and bank tellersare also clerical workers e ,rding to the Bureau of the Census,as are bill collectors it :dusters, postal carriers, facto.yexpediters, and most er :::. and interviewers.
The tremendous g . the number of clerical workersin the United States is well known, but the true magnitude ofthis expansion cannot be appreciated without comparing it to thegrowth in total employment. Figure 1 shows that the proportion
Facts and observations presented in this document are the sole respon-sibility of the authors. The viewpoints do not necessarily represent positi asof the W.E. Upjohn Institute for Employment Research.
223

224 RECENT TRENDS IN CLERICAL EMPLOYMENT
0.20
0.18
0.16
0.14
0.12
0.10
0.08
0.06
0.04
0.02
0
"...PP...m.4P
1940 1950 1960 1970 1980
YEAR
FIGURE 1 Decadal growth in :lerical employment as a proportion of totalemployment, 1940-1980. Source: Hunt and Hunt (1986); based on 1940-1980census data.
of clerical workers in total employment has doubled in the last 40years, from just under 1 employee in 10 in 1940 to 1 in 5 by 1980.However, the general recessionary conditions of the last 5 yearscombined with developments of the last 10 years or so in officetechnology raise one of the most puzzling questions about futureemployment: Will this trend continue?
Those who are convinced that this trend cannot continue andmay reverse itself base their predictions primarily on the introduc-tion to the office of microprocessor-based technologies. The incred-ible reductions in the cost of computing power, combined with thereductions in bulk made possible by microprocessor technology,may possibly constitute a revolutionary technical development.And there has been an apparent reduction in the rate of increasein the proportion of clerical workers. As Figure 1 indicates, whilethe clerical proportion rose almost linearly from 1940 to 1970,a slight reduction in the rate of increase occurred between 1970and 1980. Is this the beginning of the end of clerical employmentgrowth? If so, what will be the impact on women workers?
9 u /

H. ALLAN HUNT AND TIMOTHY L. HUNT 225
Clerical jobs are also female jobs. Is it a coincidence that theexpansion of clerical employment occurred simultaneously withthe expansion of female labor force participation rates? To whatextent have female job opportunities been linked to the expansionof the clerical work force? The overwhelming majority of clericalworkers are in fact female, and this is even more true today thanit was 30 years ago: from just over 60 percent female in 1950, theproportion grew to nearly 80 percent by 1980. Indeed, not only areclerical workers increasingly women but women are increasinglyerical workers. Between 1950 and 1980, the proportion of womenworkers who worked in clerical jobs grew from about 27 percent toover 35 percent. Thus, the sex segregation of clerical occupationsappears to have been increasing, although there was very littleincrease in the proportion of females employed as clerical workersbetween 1970 and 1980.1 The participation rate for men in clericalwork was only 7.6 percent in 1980. Cleariy, females are much morelikely than males to work as clerical workers and clerical work hasincreased in importance as a source of employment for women.
This paper revi-ws trends in clerical employment over thelast 30 years and seeks evidence of the impact of changes in pro-cess technology on those trends. It also assesses prospects for thefuture of clerical employment. The next section reviews clericalemployment trends from 1950 to 1980 by decade, as well as annualemployment changes.2 Because this period encompasses the firstcomputer revolution, the introduction of mainframe computrs tothe office, and the beginnings of the microcomputer age, the reviewcan be interpreted as a search for the employment effects of tech-nological change. If changing office technologies displaced largenumbers of clerical workers during the first computer revolution,the evidence should be in the employment record of the 1960s and1970s. Similarly, if the current office technologies threaten clericaljobs, some evidence of this should be found in the employmentfigures of the early 1980s.
The following section of the paper discusses the determinantsof clerical employment in the broadest sense. The influence ofindustry occupational structure and industry employment trends
1 See Reskin and Hartmann (1985) for a discussion of sex segregation onthe job.
2 A much more thorough review of existing data is provided by Hunt andHunt (1986:Ch. 2 and 3).

226 RECENT TRENDS IN CLERICAL EMPLOYMENT
on clerical employment totals are examined. The aggregate changein clerical employment from 1972 to 1982 is decomposed intoportions attributabl" to general economic growth, changes in thesectoral composition of the economy, and changes in occupationalstaffing patterns. Evidence of the direct impact of technologicalchange on office employment levels is sought for the finance andinsurance industry, reputedly the most advanced user of officeautomation systems.
This paper does not try to assess the influence of other impor-tant factors that will determine future labor market outcomes forclerical workers. In particular, there is no consideration of futuresupply issues. If female labor force participation rates continue torise as they have in the past, the issue of job creation for womenwill be of even greater significance. On the other hand, if womenincrease their penetration of nontraditional female occupations,the number of females seeking clerical positions in the future maydecline. Whether men are more likely to begin to look to cler-ical positions for career opportunities in the future presumablydepends on labor market developments for clericals, as well as thejob outlook in more traditional male occupations.3 Clearly theseconsiderations are crucial to understanding whether the supplyand demand of clerical workers will be in approximate balance inthe labor market of the future, but these questions are beyond thescope of the present effort. We seek only to illuminate past trendsin clerical employment and investigate the causes behind thosetrends. Throughout the analysis we strive to develop an under-standing of the employment implications of technological changefor clerical workers. In a concluding section, we draw on these find-ings and on a review of existing forecasts of clerical employment tonarrow the range of uncertainty about the probable future impactof technological -hange on the demand for clerical employment.
A CLOSER LOOK AT CLERICAL EMPLOYMENT TRENDS
EMPLOYMENT FROM 1950 TO 1980,DECENNIAL CENSUS DATA
Table 1 reports the best derivable estimates of detailed cler-ical employment on a consistent basis across the 1950 to 1980
3 Many of these issues are addressed by Hartmann, Kraut, and Tilly(1986).
2 3

H. ALLAN HUNT AND TIMOTHY L. HUNT 227
time span. These figures are based on data from the decennialcensuses, and although they are far from perfect, everything thatcan be done has been done to maximize the consistency of theestimates and minimize the distortions introduced by the mea-surement system and changes in it.4 Table 1 shows that therewere just over 19 million clerical workers employed in 1980 in 42separate clerical occupations ranging from secretary, the largest, totabulating machine operator, the smallest. There were more than4 million secretaries employed in 1980; they represented just over
4 Because these data have been adjusted rather extensively for consis-tency, the figures reported here do not correspond exactly with censusfigures from other sources. Comparisons of occupational data among decen-nial censuses are complicated, first, because the data came from a sampleof all census respondents (though the numbers are very large by normalsampling sta.:Ida:As), and second, because the measuring rod, the occupa-tional classification system, changes between censuses. In 1950, occupationalemployment was tabulated in 12 major groups and 469 detailed occupa-tional categories. In 1960, the same 12 major groups contained 494 detailedoccupations; in 1970 therc were only 417 detailed occupations but still ac-cumulated into 12 major occupational groups. The overall changes in theclassification system can be regarded as relatively minor over this period,although with regard to individual occupations, major distortions can occurwhen an occupational category is added or deleted. In 1980, however, themagnitude of the differ-nces in the occupational coding system are enor-mous: 503 detailed occupations, which have been reshuffled into 13 newmajor groups. For example, cashiers, who have previously been classifiedas clerical workers, are reclassified as sales workers; 1.65 million workersare thereby moved from one major occupational group to another. For thefirst time there is a fundamental lack of consistency at the major occu-pational group level between adjacent census observations. To convert alloccupational employment numbers to a consistent basis, the classificationsystem of 1970 was chosen as the standard upon the advice of the Bureau ofthe Census. The comparison between 1960 and 1:170 employment in termsof the 1970 classification was readily available from the Bureau (Bureauof the Census, 1972:Table 221, and Priebu et al., 1972). The 1950 censusemployment could not be converted directly into 1970 categories, and werefirst reclassified :nto 1960 terms, using Technical Paper No. 18; then thosenumbers were converted to the 1970 basis using Priebe et al. (1972). The1980 data were converted to the 1970 basis using preliminary unpublishedresults from the Census Bureau. It requires a painstaking effort to bridgefrom one decennial census to the next in this manner, and the accuracy ofthe results is uncertain. All of the reclassification work is done on the basisof sample results. TI+.p mclassified employment figures are thus subject bothto the original sampling error in estimating occupational employment andthe secondary sampling error involved in the reclassification study. Theseissues are discussed more fully in Hunt and Hunt (1986:Ch. 2).
2,.;

TABLE 1 Employment in Clerical Occupations, 1950 to 1980, Ranked by Level of Employment in 1980
Occupational TitleEmployment Annual
PercentChange1950 1960 1970 1980
Total employment 57,178,206 64,639,256 76,553,599 97,639,355Clerical workers 6,875,546 9,575,247 13,856,074 19,119,280Secretaries 1,005,968 1,539,017 2,875,826 4,058,182 4.8Not specified clerical workers 1,185,906 1,610,020 862,394 1,880,102 1.5Bookkeepers 744,053 973,224 1,633,490 1,804,374 3.0Cashiers 252,252 510,179 884,531 1,654,151 6.5Miscellaneous clerical workers 253,633 328,399 506,677 1,163,635 5.2Typists 60,534 547,923 1,041,804 799,561 9.0Stock clerks and storekeepers 274,089 384,115 482,259 580,979 2.5Receptionists 77,965 164,446 323,552 536,963 6.6Shipping and receiving clerks 323,785 325,307 400,890 483,183 1.3Bank tellers 56,944 139,477 265,197 476,233 6.8Estimators and investigators, n.e.c. 112,469 171,901 LL2,074 442,553 4.7Counter clerks, except food 96,313 127,630 243,697 398,029 4.8Computer and peripheral equipmentoperators 868 2,023 124,684 391,909 22.6Keypunch operators 75,091 169,000 290,119 382,118 5.6Clerical supervisors, n.e.c. 44,348 56,887 119,887 340,946 7.0Expediters and production controllers 123,277 151,191 217,107 329,621 3.3File clerks 118,211 152,160 382,578 316,419 3.:Postal clerks 216,164 242,872 321,263 315,111 1.3Telephone operators 363,472 374,495 433,739 314,674 -0.5Statistical clerks 109,956 143,922 265,431 297,939 3.4Mail carriers, Post Office 164,851 203,116 268,612 258,966 1,5Payroll and timekeeping clerks 05,697 112,901 165,815 218,387 4.1
24i

Teachers' aides, except schoolmonitors 6,105 17,804 139,790 207,391 12.5
Mail handlers, except Post Office 53,563 67,300 133,839 182,223 4.2Insurance adjusters, examiners, and
investigators 33,061 58,726 102,043 159,124 5.4Ticket, station, and express agents 69,807 76,994 104,285 152,841 2.6Library attendants and assistants 16,235 38,203 133,911 140,808 7.5Billing clerks 32,357 45,254 112,876 117,943 4.4Stenographers 429,424 283,486 136,197 91,593 -5.0Enumerators and interviewers 85,013 118,723 68,697 88,712 0.1Dispatchers and starters, vehicle 33,746 49,205 63,699 87,622 3.2Messengers and office helpers 111,508 61,303 61,050 82,225 -1.0Collectors, bill and account 25,395 34,229 54,728 76,982 3.8Meter readers, utility 40,696 39,712 35,144 41,407 0.1Real estate appraisers 11,754 15,822 72,75 41,343 4.3Office machine operators, n.e.c. 9,788 21,352 38,659 39,864 4.8Bookkeeping and billing machine
operators 26,610 53,914 67,341 37,200 1.1
Weighers 80,915 44,548 41,410 29,717 -3.3Proofreaders 12,708 17,171 29,940 27,321 2.6Clerical assistants, social welfare 0 . 0 1,279 24,128 n.a.Duplicating machine operators 5,520 14,392 21,682 17,971 4 0Calculating machine operators 19,176 38,903 37,153 17,881 -0.2Telegraph operators 34,811 21,064 13,052 7,604 -4.9Tabulating machine operators 9,725 26,937 8,685 3,345 -3.5
NOTE: n.e.c. = not elsewhere classified.
SOURCE: Decennial Census. Data were adjusted for consistency by the authors.
P . ,").., ...

230 RECENT TRENDS IN CLERICAL EMPLOYMENT
4 percent of total employment and 21 percent of clerical employ-ment in that year. The second largest category was bookkeepers,with about 1.8 million employee:, followed by cashiers, with 1.7million. The only other clerical occupation that has approrched 1million employees is typists.
Together, these "big four" clerical occupations accounted for8.5 million jobs, or about 45 percent of all clerical employment in1980. These same four occupations accounted for only 27 percentof clerical employment in 1950; all four of these occupations havegrown substantially in employment during the last 30 years. Onthe other end of the scale in terms of size, there were only about3,300 tabulating machine operators and about 7,600 telegraph op-erators employed in 1980. These occupations have been decliningfor some years, PS have the next two smallest occupations, dupli-cating machine operators and calculating machine operators. Eachof these occupations has been adversely impacted by changes intechnology.
When these same data for the various occupations are ex-amined in terms of their annual compound rates of change inemployment between 1950 and 1980, computer and peripheralequipment operators far exceeded all other clerical occupations intheir rate of increase. This occupation has grown from an employ-ment level of 868 persons in 1950 at the dawn of the computer ageto nearly 400,000 persons in ::.980, an annual rate of growth of over22 percent. This is the labor market expression of the computerrevolution, which began to substantially affect employment levelsin computer-related occupations in the 1960s. It is interesting tonote that the second fastest growing clerical occupation over the1950 to 1980 period was teachers' aides: from high tech to hightouch in one easy step! The number of teachers' aides increasedfrom 6,000 to over 200,000 in this 30-year period, or about 12percent per year. The third fastest growing clerical occupationwas typists, even though there was actually a 23 percent declinein employment from 070 to 1980. The phenomenal growth oftypists in the 1950s and 1960s was sufficient to offset the recentdecline, for an average annual rate of growth of 9 percent whenthe entire !.i0-year period is considered. Following in order of rateof growth are library attendants, clerical supervisors, bank tellers,receptionists, and cashiers. Clearly, there is not a high-tech oc-cupation among them, although they have all been impacted in
24 3

H. ALLAN HUNT AND TIMOTHY L. HUNT 231
one way or another by technological change as well as many otherinfluences.
There were also a few clerical occupations that showed abso-lute declines during this 30-year period. The most rapid de ;lineswere among stenographers and telegraph operators, declining inemployment by about 5 percent annually. Both occupations havebeen impacted by technolo_ -,, but not in an obvious way. Thetelegraph has been all but replaced by superior communicationsdevices, and this has nearly eliminated the jobs of telegraph oper-ators. Improvements in dictation equipment and changing habitsof users have spurred the decline in the stenographer occupation.In 1950, there were 2.3 secretaries per stenographer while by 1980the ratio had risen to 44 to 1.
Fairly rapid declines were also shown by tabulating machineoperators and weighers. Actually, the tabulating machine opera-tors would have been the most rapidly retreating if 1960 had beentaken as the base year. This occupation provides an excellent ex-ample of a technology-specific occupation that experiences rapidgrowth and then declines. Tabulating machines were very popu-lar in the 1950s for analyzing data on punc'ied paper cards. Thenumber of tabulating machine operators aearly tripled between1950 and 1460. But data-processing teamology moved rapidlybeyond the capabilities of tabulating machines, and the number ofemployees in this occupation has fallen by nearly 90 percent since1960. Rounding out the declining occupations are messengers andoffice helpers, calculating machine operators, and telephone op-erators. All appear to be office-technology-related declines, sincethe communications and computing capabilities of modern officeshave rendered these jobs less essential than in the past.
With the spectacular exception of the computer operator cat-egory, the rapid-growth jobs do not show any particular high-technology bent. On the other hand, the declining occupationsdo seem to offer a technological interpretation, at least in part.Whether this represents a general principle is not clear at thistime. What is clear is that the bulk of clerical employment occursin a few very large, very diffuse occupational titles, such as secre-tary and bookkeeper. This was more true in 1980 than in 1950.It is possible that one impact of office technology over the last 30years has been to foster more generality in job title and perhapsin duties, but that cannot be conclusively demonstrated with thedata that are currently available.
0 ,4; 1
4 1 4

232 RECENT TRENDS IN CLERICAL EMPLOYMENT
ANNUAL EMPLOYMENT CHANGES, CURRENTPOPULATION SURVEY DATA
The long-term decennial census data do not seem to demon-strate a widespread impact of technology on clerical occupations,but annual data from the Current Population Survey (CPS) maybe more revealing. Figure 2 shows aggregate clerical employmentas a proportion of total employment on an annual basis from 1958to 1984. It clearly shows that the rate of increase of clerical work-ers relative to all employment was much slower in the 1970s thanit was in the 1960s.° Even more apparent is the stagnation in theproportion of clerical workers since 1980. Clerical workers did notfare as well in the last recessionary period as they did earlier. It isless certain what the downturn in the clerical proportion in 1984means. Such a decline has been typical of recovery periods in thepast (as in 1976-1977), when the number of production workersrises rapidly to restore the prerecession balance between produc-tion and nonproduction workers, including clericals. Whether thetrend of the early 1980s is something different is not yet dear. Themagnitude of the drop is unprecedented, but that does not provethat the cause is fundamentally different.
A look at recent annual CPS data for detailed occupationsmay be instructive. Unfortunately, the only time period for whichthis can be done is the decade from 1972 to 1982. If the mi-croprocessor revolution is going to have catastrophic impacts onclerical employment, it should have become apparent by 1982when the microcomputer population reached the 1 million unitlevel (Computer and Business Equipment Manufacturers Associ-ation, 1985:87). While this period would seem to be adequatefor analysis, it is complicated by the fact that the recession of1981-1982 occurs right at the end of the periods In addition,because of the smaller sample used by the CPS, some reservationmust be expressed about any particular annual observation. More
5 The apparent drop in 1971 should be ignored as it reflects the conversionto new census codes rather than any actual change in clerical employmentlevels.
6 It is frustrating to stop the analysis in 1982; however, the massivereorganisation of the occupational classification system introduced to theCPS in 1983 (corresponding to the 1980 decennial census reclassification)prevents the development of consistent data for all occupations after 1982.

H. ALLAN HUNT AND TIMOTHY L. HUNT
0.19
0.18
0.17
0.16
0.15
233
0.14 1 1 I I I I 1 1 1 1 1 1 1
1960 1964 1968 1972 1976 1980 1984YEAR
FIGURE 2 Annual changes in clerical employment as a proportion of totalemployment, 1958-1984. Source: Hunt and Hunt (1986); based on 1958-1984CPS data.
confidence can be put in trends that emerge over a period of 3 or4 years.
Table 2 shows the CPS clerical occupations sorted by the an-nual rate of change over the 1972-1982 decade. As in the decennialdata for 1950 to 1980, computer and peripheral equipment oper-ators experienced the most rapid rate of increase of any clericaloccupation, although it was only about half the average annualrate shown for the 1950-1980 period. Bank tellers and insur-ance adjusters, examiners and investigators both edged ahead ofteachers' aides in growth rates during the more recent decade.This reflects the falloff in the rate of growth in teachers' aides asemployment growth in education as a whole faltered because offunding difficulties and a reduction in the student population.
Other clerical occupations showing relatively rapid growthduring the 1972 to 1982 decade include cashiers, estimators andinvestigators, and receptionists. All three of these occupationsinvolve direct customer contact and probably would fall intothe "hard to automate" category. Messengers and office helpersemerge as a relatively rapidly growing clerical occupation in the
2,1i3

TABLE 2 Employment in Clerical Occupations, 1972 to 1982, Racked by Relative Change, 1972 to 1982
Employment (m thousands) Ann. %Occupational Title 1972 1973 1974 1975 1976 1977 1978 1979 1980 1981 1982 Chg.
Computer and peripheralequipment operators 199 220 251 302 295 311 403 465 535 564 588 11.4Bank tellers 290 329 356 356 378 416 458 503 542 569 561 6 SInsurance adjusters,examiners, and investigators 109 114 127 153 159 172 173 178 179 191 200 6.3Teachers' aides, exceptschool m mitors 208 232 253 292 325 326 348 357 391 381 373 6.0Cashiers 998 1,060 1,127 1,200 1,280 1,354 1,434 1,512 1,592 1,660 1,683 5.4Estimators and inve.t;gators,n.e.c. 350 334 374 389 423 459 460 506 545 540 570 5.0Receptionists 439 450 465 468 511 542 600 614 644 675 672 4.3Messengers and office helpers 79 85 77 78 83 95 89 95 98 97 115 3.8Collectors, bill and account
Mail handlers, except Post Office61
12959
14464
14873
14566
14073
14980
16477
17081
16893
175 81823.63.5An other clerical workers 1,329 1,331 1,388 1,375 1,444 1,587 1,705 1,818 1,899 1,956 1,871 3.5Enumerators and interviewers 39 49 53 44 49 55 54 61 87 58 53 3.1Clerical supervisors, n.e.c. 200 184 231 228 239 229 207 241 245 250 270 3.0Expediters and production
controllers 198 202 201 214 210 219 228 244 238 254 257 2.7Secretaries 2,964 3,088 3,218 2,281 3,428 3,470 3,646 3,792 3,944 3,917 3,847 2 6Clerical workers 14,329 11,667 15,199 15,321 15,788 16,372 17,207 17,953 18,473 18,564 18,466 2.6
24

Keypunch operators 284 255 251 253 279 284 277 279 271 248 364 2 5Dispatchers and starters, vehicle 86 88 92 93 89 99 99 109 105 115 110 2.5Bookkeepers 1,692 1,673 1,706 1,709 1,712 1,754 1,861 1,945 1,942 1,961 1,968 21Statistical clerksPayroll and timekeeping clerks
301186
301200
328206
331202
342211
363231
384245
408241
396237
370231 326254 11 99
Ticket, station, and express agents 130 118 123 138 126 132 131 148 144 148 154 1 7Counter clerks, except food 331 352 350 351 359 349 383 369 358 360 373 1 2Shipping and receiving clerks 453 461 469 433 446 474 469 493 515 525 499 1 0Library attendants and easistants 138 123 135 146 143 144 174 168 155 152 150 0 8Billing clerks 149 166 158 145 140 157 170 164 165 153 154 0 3File clerks 274 287 279 268 274 280 279 312 332 315 278 0 1Mail carriers, Post Office 271 268 238 254 244 244 258 256 247 242 264 -0 3Stock clerks and storekeepers 513 478 493 479 499 505 516 539 544 528 497 -0 3Postal clerics 282 303 295 293 291 271 272 264 291 269 271 -0 4Typists 1,025 1,040 1,046 1,035 995 1,020 1,060 1,038 1,043 1,031 942 -0 8Telephone operators 394 390 393 348 343 347 317 333 323 308 283 -3.3Bookkeeping and billing
machine operatorsStenographers
69125
57107
69104
60101
49101
5384
4796
5978
5266
4974
42 -.482
NOTE: n.e.c. = not elsewhere classified.
SOURCE: Current Population Survey.
2,1 )

236 H. ALLAN HUNT AND TIMOTHY L. HUNT
1970s, which is in contrast with their declining employment from1950 to 1970. The number of bill collectors increased at 3.6 percentannually during the decade, and non-Post Office mail handlers in-creased at 3.5 percent. No particular pattern emerges from thelisting X clerical occupations that grew more rapidly than averageduring this recent decade.
At the other end of the distribution, the declining occupations,stenographers and telephone operators, are joined by bookkeepingand billing machine operators in rather rapid decline for the 1972to 1982 period. Small annual declines were registered for typists,postal clerks, mail carriers, and stock clerks and storekeepers.Bookkeeping and billing machine operators are another clericaloccupation that may be impacted by the microprocessor revolu-tion. As microcomputers have become more widely distributed,increasing attention has been paid to creating accounting softwarethat win run on the micros. This has undoubtedly impacted thenumber of bookkeeping machine operators. What is not clear iswhether it has reduced the number of people doing bookkeepingwork. Since they are not doing it on a special purpose device, itwould no longer be appropriate to call them bookkeeping machineoperators, however, and the job titles are very likely changed.
Without more careful study of both inputs and outputs of of-fice production, definitive conclusions about the impacts of officetechnology cannot be drawn. This analysis leaves the impressionthat office technology cannot be regarded as an important deter-minant of clerical employment for more than a few occupations.Nonetheless, it is also the case that clerical employment growthhas slowed in the last decade.
DETERMINANTS OF CLERICAL EMPLOYMENT
Analysis of the trends in occupational employment indicatedthat some clerical jobs were growing while others were declining.On an aggregate basis, it was seen that clerical jobs as a wholewere becoming relatively more important as a proportion of totaljobs in the economy, although that growth slowed in the 1970s. Italso appeared that in the recession of 1980-1982 the proportionof clerical jobs did not increase significantly as it has in pastrecessions. What might be causing those movements?
24

H. ALLAN HUNT AND TIMOTHY L. HUNT 237
In the broadest terms possible, employment depends upon thedemand for output and the productivity of the workers who pro-duce that output. National output is generally measured by grossnational product (GNP), the value of all final goods and servicesproduced in the economy in a year. This simple relationship, al-though devoid of occupational and industrial content, emphasizestwo important points.
First, if one accepts the notion that productivity is more or lessfixed in the short run by the technological structure of production,then it should be clear that changes in GNPaggregate demandin the economydrive any changes in employment. Many factorsaffect both the level and rate of growth of GNP, including unfore-seen shocks to the economy, such as the energy crises of the 1970s,which at least temporarily disrupt the national economic system,and business cycles, which may vary tremendously in terms of theirlength and severity. All occupations and industries are adverselyaffected by the failure of GNP to grow sufficiently; likewise, all oc-cupations and industries tend to benefit from reasonable economicgrowth.
The second factor that influences employment is productivity.The concern, of course, is that productivity growth will outpacethe growth of GNP. Di ring recessionary periods it is not unusualfor the lack of jobs 1 be blamed on labor-saving technology, andoffice automation is a case in point. However, productivity growthand GNP growth are actually intertwined: productivity gainsallow the possibility of economic growth. Historically, technologicalchange has not created permanent unemployment for millions ofworkers; instead it has raised living standards. To be sure, therehave been winners and losers in this process, both among firmsand individuals, but the net result has been real economic growth.No one can guarantee that history will repeat itself with officeautomation today, but some appear to be too easily persuadedthat history will not repeat itself, that office automation andother labor-saving technologies will wipe out millions of jobs.
The demand for labor is a derived demand based upon the de-mand for the goods or services which that labor produces. The riseand fall of occupations is related to the rise and fall of products andservices which are produced in particular industries. Prospects forclerical workers, then, are linked to the prospects of the industriesin which they work.
23 )

1
238 RECENT TRENDS IN CLERICAL EMPLOYMENT
TABLE 3 Employment by Industry, 1982
Industry
TotalIndustryEmployment(thousands)
Percent ofTotalEmployment
Percent ofWorkers inIndustry inClerical Job:ill
ClericalEmployment(thousands)
Percent ofAll ClericalWorkersEmployedin Industry
Agriculture 3,401 3.4 2 4 83 0.4Mining 1,028 1.0 12 5 128 0 7Construction 5,756 6 8 7.8 451 2 4Durables 11,968 12.0 12 6 1,513 8 2Nondurables 8,318 8 4 12.9 1,074 5.8Utilities 6,552 6.6 22 3 1,463 7 9Wholesale trade 4,120 4 1 20 5 844 4.6Retail trade 16,638 16.7 17.1 2,840 15 4Finance 6,270 6.3 43 9 2,750 14.9Serv:ces 30,259 30.4 18.1 5,473 29.7Public
administration 5,218 5.2 35 0 1,827 9 9
Total 99,528 100.0 I3.f 18,466 100.0
This percentage is also known as the clerical staffing ratio.
SOURCE: Calculated by the authors from CPS data
CLERICAL EMPLOYMENT BY INDUSTRY
The relative importance of the various industries in the na-tional employment picture is presented in Table 3, based on CPSdata for 1982. By far the most important of the individual one-digit industries is the service sector. It accounts for a little over30 percent of all employment, almost double the size of the nextbiggest sector, retail trade. Table 3 also shows the clerical staffingratio, which indicates how important the clerical jobs are in eachof these industries. A staffing ratio for an occupat:,,n measures therelative importance of that occupation compared to all others inan industry. The ratio is obtained by dividing employment in thatoccupation in an industry by total industry employment. (Thestaffing ratios of all occupations within an industry must sum toone; shown as percents, they must sum to 100.)
According to Table 3, the finance industry shows the highestpercentage of clerical workers; nearly 45 percent of all employeesin this inc _dry are clerical workers. While not shown in the table,twice as many clerical workers work in finance as any other type ofworker. Public administration is also a heavy employer of clericalworkers; 35 percent of all jobs in this industry are clerical. It is
2 5 )

H. ALLAN HUNT AND TIMOTHY L. HUNT 239
followed by utilities and wholesale trade, which also utilize heavyproportions (more than 20 percent) of clerical workers to producetheir output. However, in neither of these industries are clericalworkers as dominant as in finance or public administration. Theservice industry and retail trade both show between 15 and 20 per-cent of their total employment in clerical occupations (althoughtheir needs for other occupations do not look similar at all). Thedurable and nondurable manufacturing industries show between10 and 15 percent of their total employment in clerical occupations(both are the home base of operatives, of course). Last is the con-struction industry, which employs relatively few clerical workers(but is the dominant user of skilled craft workers in the economy).
Clearly, different industries use very different mixes of occupa-tions to produce their final output. The occupational staffing ra-tios are relatively unique to each type of production. It is this vari-ation in the staffing ratios between industries that makes trends inindustry employment an important influence on the distributionof occupations throughout the economy.
The absolute number of clerical jobs in each of the majorindustries is also presented in Table 3. About 5.5 million clericalworkers can be found in the service industry. Just under 3 millionclerical jobs are located in each of two sectors, retail trade andfinance. These three sectors combinedservices, retail trade, andfinanceaccount for more than 11 million clerical jobs, almost60 percent of total clerical employment. Clerical workers maybe dispersed broadly throughout the national economy, but thesethree sectors are especially important to total clerical employment.
The 20 most important industrial employers of clerical workersin 1982 are presented in Table 4. These data are from the Bureauof Labor Stat;Itics (BLS) Occupational Employment Statistics(OES) program, which currently collects the most detailed data onoccupational employment by industry.? The entries in the table areranked by the number of clerical employees in each industry. Theclerical staffing r?"'os and total employment in each industry arealso included Filially, the percent of total clerical jobs accounted
7 These data provide the historical basis for the staffing ratios in theBureau of Labor Statistics (BLS) industry-occupation matrix, which is sub-sequently used as the starting Joint for the BLS projections of futureoccupational employment. See BLS (1981).
c' ..' " )4 L) ,,'

240 RECENT TRENDS IN CLERICAL EMPLOYMENT
TABLE 4 Clerical Employment by Industry, 1982
Industry
TotalIndustryEmployment( thousands)
ClericalEmployment(thousands)
ClericalStaffingRatio(percent)
Percentage ofTotal ClericalEmployment
CumulativePercentage ofTotal ClericalEmployment
State and local governmentand educational services 13,068 2,512 19 2 13 4 13.4
Miscellaneous retail trade 10,476 2,496 23 8 13 3 26 8Wholesale trade 5,194 1,531 28 9 8 2 34.9Ranking 1,650 1,180 71 5 6 3 41.2Federal government 2,739 1,138 41.5 6.1 47 3Insurance 1,700 911 53 6 4 9 52 2Miscellaneous business
services 3,139 896 28.5 4 8 57 0Hospitals 4,166 666 16 0 3 6 60 5Social services,
museums, and membershiporganizations 2,755 587 21 3 3 2 63 7
Credit agencies, securityand commc illy brokers 1,015 577 56 9 3 1 66 8
Legal and miscellaneousservices 1,628 560 34 4 3 0 69 7
Telephone and othercommunication 1,174 529 45.1 2 8 72.6
Physician and dentaloffices 1,309 394 30 1 2.1 74 7
Construction 3,913 324 8 3 1 7 76 4Eating and drinking
places 4,781 224 4 7 1 2 77.6Electric services and
gas distribution 792 207 26.2 1 1 78.7Trucking and warehousing 1,206 199 16 5 1 1 79 8Miscellaneous print,ng
and publishing 846 192 22 8 1 0 80 8Real estate 986 188 19.1 10 81 8Miscellaneous personal
services 1,219 186 15 3 1 0 82.8
SOURCE Calculated by the authors, based on data tape from the 1982-1995 OES/BLS occupationalemployment projections
for by each of the 20 industries as well as the cumulative total isalso reported.
The top 10 industries in terms of clerical employment accountfor about two-thirds of all clerical employment. The top 20 in-dustries account fcr over 80 percent of all clerical jobs. Federal,state, and local go% ernment sectors are clearly important to cler-ical employment; jointly they account for more than 3.6 millionclerical jobs or almost 20 percent of the total. We can also seethe importance of IA:.:11cing and insurance, the two largest sectorswithin finance in terms of clerical employment. Finally, clericaljobs are important in a variety of service sector industries, :rombusiness services to personal services. None of the top 10 clericalemployment industries is from the goods-producing sector.
2 ri 3

H. ALLAN HUNT AND TIMOTHY L. HUNT
220
200
180
160
140
120
100
Top 10 Industries
0-0 All 105 Industnas
241
1960 1965 1970
YEAR
1975 1980
FIGURE 3 Total employment in the top 10 clerical-employing industries,1958-1989. Source: Hunt and Hunt (1986); based on 1958-1984 BLS data.
Since industry employment is so crucial to occupational em-ployment levels, the trends over the last 27 years in industryemployment are presented in Figure 3 and Table 5. Figure 3 ag-gregates the employment in the top 10 industries, while Table 5presents the employment trends for each of the 10 industries. Thenumbers are reported in index number form to make it easier tocompare the growth trends. The average growth in employmentfor all industries is also reported to facilitate comparisons betweenthe particular industry and the average for all industries.
Figure 3 demonstrates a number of important features of thetop 10 clerical employment industries. First, these industries havebeen much less susceptible to the vagaries of the business cyclethan all industries. The growth rate of the sum of these 10 sectorshas remained positive through two of the three recessions duringthe period. It was only in 1982, during the worst recession sinceWorld War II, that the composite growth rate of these 10 sectorsturned negativeand then, barely so. Second, the average growthrate of these 10 industries has clearly outdistanced the all-industryaverage for the eltire 27-year period, but this is mostly because

TABLE 5 Total Industry Employment Growth of Sectors with the Largest Number of Clerical Employees,1958-1984
State Creditand Mace Ila- Miscella- Agencies SocialLocal neous Whole- Federal neous and Corn- Services Top 10 AllGovern- Retail sale Bank- Govern- Insur- Business Hos- inodity and Indus- Indus-
Year ment Trade Trade ing ment ance Services petals Brokers Museums tries tries
1958 100 100 100 100 100 100 100 100 100 100 100 1001959 104 103 103 104 102 101 110 106 109 118 104 1041960 108 98 105 109 104 103 116 113 116 122 108 1051961 112 105 105 112 104 105 123 120 124 128 109 1051962 116 107 107 116 107 106 135 126 129 131 113 1071963 122 109 109 120 108 109 146 134 132 133 116 1081964 128 112 112 124 107 111 159 143 138 134 120 111
1965 136 116 116 128 109 112 173 149 142 136 126 1141966 146 121 121 134 117 114 192 156 149 140 132 1191967 154 124 124 141 124 119 211 171 156 146 138 1221968 161 128 127 148 125 122 224 182 171 153 144 1251969 167 133 131 159 126 125 248 195 186 157 150 1291970 174 136 134 169 125 129 262 205 182 159 154 129Ion 180 139 134 174 123 131 264 213 184 163 158 130
1972 189 144 138 181 123 133 282 218 194 157 163 1341973 196 149 144 191 122 135 308 226 202 158 169 1391974 203 149 149 202 124 139 326 238 202 162 174 1411975 211 148 148 206 125 140 333 250 202 165 178 1391976 215 153 153 212 125 142 359 260 210 170 183 1421977 220 158 158 220 124 148 386 271 222 172 190 1481978 229 165 167 231 126 154 429 280 238 177 199 155
1979 233 168 175 243 127 163 472 287 256 183 206 1591980 237 167 177 255 131 164 504 303 268 189 210 1601981 235 168 180 264 127 167 540 320 284 190 212 1611982 232 166 177 268 125 168 551 332 291 190 212 1591983 232 169 176 270 126 169 580 334 317 190 215 1601984 233 177 185 273 127 172 654 329 343 196 222 167
FNOTE: 1958 equals 100 2 1 5SOURCE: Calculated Sy the author., based on data from the BLS Input-output industry series

H. ALLAN HUNT AND TIMOTHY L. HUNT 243
employment in these sectors does not ordinarily retreat duringrecessionary periods, but continues to expand.
As Table 5 shows, growth patterns among the top 10 indus-tries have been diverse.. Their average growth over the 27-yearperiod was 122 percent; all but one grew faster than the economy-wide rate of 67 percent. The most. robust growth has clearly oc-curred in miscellaneous business services; hospitals; banking; andcredit agencies and security and commodity brokers. The growthin employment in miscellaneous business services is particularlystriking, with more than six times as many workers in this sectorin 1984 as there were in 1958. This sector provides myriad ser-vices to business firms, from accounting to customized computersoftware to consulting advice. Also striking is the growth rate ofemployment in hospitals; employment tripled over the period 1958to 1984. Some of the causes of this growth, such as the aging ofthe population and the increasing availability of medical insurancefor retirees and the indigent through government programs, arewell known. In any event, the growth of this sector has not beenaffected by business cycles and may have even accelerated duringthe last recessionary period. Surprisingly, however, hospital em-ployment growth slowed in 1983 and actually turned negative in1984. The recent emphasis on cost containment and the shorteningof hospital stays may be having an impact on employment.
It is also clear that the finance sectorespecially banking;credit agencies and security and commodity brokers; and insur-ancecontributed significantly to clerical job growth during theseyears. All three of these sectors have staffing ratios for clericalworkers in excess of 50 percent, the highest of all industries. In-surance employment grew at about the economywide average untilabout 1974, then began to accelerate, and outdistanced the na-tional :conomy in job growth thereafter (except for 1984). Thegrowth of employment in banking was consistently higher thanthat for insurance, nearly tripling from 1958 to 1984.
The slowest growth among the 10 industries with large clericalemployment occurred in the federal government. The federal gov-ernment has not been a source of significant, employment growthin the last 20 years; its growth is well below average. State andlocal government employment, while generally above average ingrowth, actually declined absolutely during the 1980-1932 reces-sion. By the end of 1984, employment had still not exceeded its
r4

244 RECENT TRENDS IN CLERICAL EMPLOYMENT
peak employment Tavel, achieved in 1980. This is significant be-cause it is the first such decline and sluggish recovery in recenthistory for the largest single employer of clerical workers amongthe 105 industries in this analysis.
Of course, the gnawing question is: Will these industriesshow rapid employment growth in the future? That questioncannot be answered at this point. However, the nation is stillexperier :ng a long-run shift from a goods-producing economy toa servi :oducing economy. Historically, clerical workers havebenefited from this shift since service industries employ muchhigher proportions of clerical workers. Thus, even if staffing ratiosbegin to fall for clerical workers (because of office automation orother factors), it is still possible for them to grow at or abovethe average rate for all jobs because they are concentrated in thenon-goods-producing sectors. Clerical workers have so far had afortunate industry mix in their employment pattern.
TECHNOLOGICAL CHANGE AND CLERICALEMPLOYMEN E GROWTH
Because one of the goals of office automation is to improvelabor productivity, actual gains in labor productivity may be thebest measure of the degree to which this goal is realized. The majorproblems in attempting to estimate the true gains from office au-tomation are twofold. First, it is impossible to glean from currentdata any information whatsoever about the relative importance ofoffice automation spending by firm or industry. Investment dataare subdivided only into the two broad subcomponents of machin-ery and equipment and structures. Second, complete data aboutclerical jobs are not available over time, and no information linksworkers to the use of equipment. Thus, it is impossible to estimatethe productivity gains specifically attributable to clerical workersutilizing various types of electronic office technology.8
One simple approach to examining the productivity gains fromoffice automation is to study those sectors that are significant em-ployers of clerical workers and that are also believed to be leadersin office automation. The broad industrial sector of finance andinsurance is the recognized leader in the field of office automation,
8 See Hunt and Hunt (1985) for a more detailed discussion of the availabledata.
25y

H. ALLAN HUNT AND TIMOTHY L. HUNT 245
and more than one-half of the workers in this sector are clericalworkers. Of the 105 detailed industries analyzed in this paper,the finance and insurance sector is composed of three of these in-dustries: banking, insurance, and credit agencies and security andcommodity brokers. Thus, if office automation improves produc-tivity, these three industries are logical candidates to demonstratethe effects of such gains.
Figure 4 reports the productivity gains for banking, insurance,and credit agencies and security and commodity brokers for theperiod 1958-1983.° The data are reported in index number form tobetter depict the percentage changes in productivity from year toyear. The productivity trend for all private nonfarm employmentis reported as well to facilitate a comparison of these industrieswith the aggregate. Surprisingly, Figure 4 reveals no discernibletrend that can be attributed to office automation. The productiv-ity gains in banking, insurance, and credit agencies and securityand commodity brokers have all tended historically to lag behindthe average for private nonfarm employment. In fact, productivityfor credit agencies and security and commodity brokers was veryslightly lower in 1983 than in 1958, and productivity deterioratedabsolutely in insurance after 1977. Since 1981, banking produc-tivity has improved relative to all private nonfarm productivity,but the improvement is hardly revolutionary, especially given thatbanking productivity declined from 1979 to 1981.
It should be emphasized that these are not measures of theproductivity gains for clerical workers nor can these gains be at-tributed to office automation. They are industry-wide measuresfor output gains due +3 all improvements across all employees. Allthat can be fairly concluded is that there is nothing in the aggre-gate industry data to support the notion that office automationhas engendered significant overall productivity gains in these threeindustries.
Have these industries been investing in office automation? Al-though office automation expenditures are not reported separately,Figure 5 reports, in index number form, real investment spendingper employee for the financial industries. The data are for &lance
9 The gross output in constant dollar terms and employment measuresare defined in Bureau of Labor Statistics, 1979; the data utilized here arefrom an unpublished update (April 1985).
253

246 RECENT TRENDS IN CLERICAL EMPLOYMENT
150 -
TOTAL e...._....e / \/
1 /INSUR t
,""*".
F...---
. ,- i--, j--- BANKS
ti0 100 Az I...,,.--s 90..A: i \ CREDIT AGEN :
E_.k..../ 't 7-..-t. 180
\ / \ p 1
\ I \_,/ ..\/\ /*\/70
60N....i V
50 I 1 I I 1 I I i I 1 I I 1 I I I I I I I I I I I I
1960 1965 1970 1975 1980
YEAR
FIGURE 4 Productivity gains in terms of output per hour for banking,insurance, and credit agencies, 1958-1983. Source: Based on unpublisheddata provided by BLS, April 8, 1985.
and insurance firms, the smallest level of industrial detail avail-able for such investment data (Seskin and Sullivan, 1985). Onceagain, the totals for private nonfarm employment are also shownfor comparison. In contrast to the lack of any "takeoff" evidentin the productivity data for finance and insurance, the investmentdata in Figure 5 clearly indicate much higher than average invest-ment trends in finance and insurance after 1966-1967. In fact,investment per employee virtually exploded, growing a little morethan five times the average for all private nonfarm employment
after 1966-1967."Although there is no doubt that the finance and insurance
industries are investing heavily in new capital equipment, it is lesscertain that they are investing in office automation. What can beconcluded is that the dramatic growth in investment in financeand insurance has not resulted in measurable labor productivitygains to date. One explanation of this puzzling situation is that theaggregate industry data may be flawed, but given such pronounced
10 Historically, absolute investment per employee in finance and insurance
has tended to be much less than the average for all nonfarm private industries.
25

H. ALLAN HUNT AND TIMOTHY L. HUNT 247
550
500
450
§ 400
350
300
1.!
250
200
150
100
50 I I I I 11111111111 II 111111960 1965 1970 1975 1980
YEAR
FIGURE 5 Real investment spending per employee for finance and insur-ance firms, 1958-1983. Source: Based on unpublished data provided by BLS,April 8, 1985.
investment growth in finance and insurance over such a long periodof time, it is difficult to believe that the productivity data are soflawed that they would not register at least the beginning of a newtrend, if one were actually occurring."
The lack of productivity increase shown in the aggregate datais borne out to some extent by other sources. Although formalcase studies of the economic impacts of office automation are gen-erally lacking,'2 there is fragmentary information that casts doubton the most wildly optimistic productivity claims of advocates of
11 There are serious concerns about the quality of the aggregate data (seeHunt and Hunt, 1985). BLS has constructed special productivity indexes inbanking, measuring output as services rendered and labor input as actualhours worked. The overall result, 1967-1980, is that productivity growthin banking remains very slightly below the national average for all nonfarmbusinesses (Brand and Duke, 1982).
12 Salerno (1985) and Strassman (1985) concur in the paucity of studies.For a review of a considerable literature about the sociological impactsof office automation, see Attewell and Rule (1984). From the economists'perspective, this literature is lacking in a systematic treatment of output,capital input, prices of outputs and inputs, and other economic variables.
2

248 RECENT TRENDS IN CLERICAL EMPLOYMENT
office automation. First, a number of recent books (Bailey et al.,1985; Diebold, 1985; and Katzan, 1982) designed to be guidesfor managers interested in improving productivity through officeautomation contain surprisingly few references to the actual ex-periences of firms or to the productivity gains that managers canreas,ilably hope to achieve with office automation. For instance,Katzan includes an entire chapter on word processing, but providesno hint about the likely potential productivity gains.
Second, Paul Strassman, ar. executive and office automationspecialist with Xerox, in a recent assessment (1985) of the technol-Dgy with which he has been associated for over 20 years, eschewsthe current focus on hardware. Although he is optimistic aboutthe potential productivity gains from computers and informationtechnology generally, he stresses that the hardware is less relevantthan the people using it. In fact, he suggests (1985:159) that thegrowth rates in office automation investment of the early 1980sare unsustainable unless that investment produces demonstr.blereturns. Strassman finds little evidence of such returns curreii.ly:
The preliminary findings of my research raise doubts about the as-sumptions which managements in the businesses I have sampled sofar must have mad, when they increased their computer-technologybudgets in pursuit of improved productivity.
Strassman thinks the payoff will come when management focuseson strategic goals and the people who wit' ..:omplish those goals,rather than on the methods to achieve th 3 goals.
Third, a recent study points to the hidden costs of adop-tion of information technology, costa so large that productivitygains do not occur. Researchers King and Kraemer (1981) con-tend that, while the cost of hardware is falling, the total costof electronic computing is rising rapidly (1981:102): "Softwareprocurement, software maintenance, and data management andcomputing management, are all becoming increasingly expensive."Furthermore, because many of the non-hardware costs tend to behidden from normal accounting procedures used to justify imple-mentation, these costs do not necessarily affect the implementationdecision itselfalthough they would adversely impact the firm'sactual operating results. New positions and even departments arespringing up in firms to evaluate software, perform system main-tenance, coordinate among different users, etc. Firms often findthat "off-the-shelf" software is unsatisfactory for their competing
2 G

H. ALLAN HUNT AND TIMOTHY L. HUNT 249
needs, necessitating significant investment in softwar program-ming.
As electronic computing becomes more widespread in firmsthrough the adoption of personal computers, King and Kraemer(1981:101) believe it will become increasingly difficult for man-agement to track these costs. Users at all levels dedicate someportion of their time to routine maintenance tasks. Worse, somemay even develop a personal interest in the technology that divertsthem from other work. According to King and Kraerner manage-ment seldom knows the ongoing costs of training, normal systemmaintenance, or unplanned downtime that are in fact incurredbecause of the firm's utilization of information technologies. Theycite a variety of other studies and fragmentary data, which appearto indicate that the annual costs for system maintenance run atleast 20 ercent of the cost of the development of the system it-self, and may even be much higher. They think the costs due tobreakdowns may be particularly significant in highly integratedsystems. According to King and Kraemer (1981:107),
when systems become integrated and units become more interde-pendent in a real-time sense, problems in one system or unit canliterally stop progress in others simply by disruption of the processof interaction. As integration increascs, interdependency increases.Together, these two phenomena result in increased costs.
Fourth, Liternational Data Corporation (IDC), which may bethe information industry's largest market research and consultingfirm, has repeatedly stressed that the labor productivity gainsfrom office automation fall far short of justifying the purchase ofthe equipment. According to IDC (1984, 1983, 1982), the directlabor savings attributable to an office automation project over a5-year period usually amount to no more than one-half the costof implementation of the system. IDC states that this rule ofthumb does not include the training costs of implementing officeautomation. However, it also does not include any improvementsin the quality of the output of offices. IDC concludes that thequality improvements justify the adoption of office automation.Even some computer vendors are not emphasizing cost savings perse in their attempts to sell office automation. A booklet about costjustification that Wang Laboratories makes available to potentialcustomers stresses the complexity of the cost justification processfor office automation. One o; the premises of the booklet (WangLaboratories, Inc., 1985:3) is that information technology systems

250 RECENT TRENDS IN CLERICAL EMPLOYMENT
are fundamentally "different from other kinds of capital equipmentinvestments and should be treated differently with regard to costjustification." In the six examples of firms that have successfullycost-justified their systems included in the booklet, the emphasisin all cases is on improvements in quality rather than on directcost savings.
In general, these sources indicate little improvement in pro-ductivity overall (Katzan, Strassman), higher costs of installationand operation (King and Kraemer), or quality rather than quan-tity improvements (IDC and Wang). Still other reasons why officeautomation may not have a significant impact on productivityinclude its limited spread to date, weaknesses in its technical ca-pabilities, and its role in making production more informationintensive.
First, one of the most obvious reasons that office automationmay not have created measurable productivity gains industry-wideis that the diffusion of the technology may not have proceedednearly as far as implied by the popular media. According to anational madom survey by Honeywell Inc. (1983) of 1,264 generaloffice secretaries employed in information-intensive establishmentswith 100 or more employees, office automation equipment is notyet in widespread use in most offices. Fewer than one-half ofthe secretaries reported having access to an electronic memorytypewriter/word processor/personal computer in the general officearea in which they work; less than one-fourth possessed any of thisequipment at their individual workstation (1983:111-5). Almostnone of the secretaries reported having direct access to electronicmail, computerized scheduling, or computerized filing, while about15 percent said that such equipment was located somewhere intne office area (1983:111-5). The limited use of automation foundis especially surprising because the survey was limited to largeestablishments in information-intensive industries, exactly whereone would expect to find office automation in place.
Second, office automation may not be producing the promisedproductivity gain because technical constraints inherent in thecurrent technology reduce its effectiveness. Word processors maynot be that much different from their earlier nonelectronic prede-cessors; both are tools used to accomplish standard office func-tions. More advanced de-vices and appropriate methods may benecessary to bring about more significant changes in productionmethods. There also appear to be severe hardware and software
263

H. ALLAN HUNT AND TIMOTHY L. HUNT 251
compatibility problems across computer systems, which limit ap-plications. Electronic mail, for example, is currently limited bysystem incompatibilities. Even when direct communications sys-tems are installed, for example, in the form of a local area network,it will likely still be a relatively primitive system. It may not bepossible to use the local area network to access the large databases on the firm's mainframe computer. It may not be possibleto transmit graphics via the network. While it may be possibleto access a user who is not on the local area network, the pro-cedure may be too tedious and cumbersome to be truly useful inthe transmission of serious business messages. In short, the allow-able traffic on the local area network may be very structured andseverely limited by the available hardware and software. The officewith instantaneous access to any data base around the world andtotal communications flexibility still lies somewhere in the future.
Many writers have compared this stage in the evolution ofcomputers with that of automobiles in the 1920s. The technologyfor automobiles had already been firmly established by that date.What was needed, however, were the highways which would makeit possible to effectively utilize the technology. According to thisanalogy, computers now need "pathways" to effectively communi-cate across dissimilar hardware and software systems before it willbe possible to realize their full potential.
The third reason that office automation may not be havingan impact on productivity is that much of what we term officeautomation is not being purchased as labor-saving process tech-nology at all. A deepening of capital may be occurring as productsand services become more information intensive and new productsF,nd services are developed. Office automation may represent sim-ply additional capital support for office workers rather than capitalsubstitution for labor.
In part, this is a restatement of the quality argument pre-sented earlier. Office automation may be seen as a means to en-sure a firm's competitive survival by providing improved access todata and feedback. Aside from the question of whether electronicoffice technology saves labor time directly, there is no doubt thatit permits more adequate analytical support for decision making,timely answers to customer inquiries, more rapid tracking of salesdata allowing better inventory control, and many other gains inquality. Those who have utilized electronic spreadsheet softwareknow that it results in a whole new world of opportunities for

252 RECENT TRENDS IN CLERICAL EMPLOYMENT
tabular and graphical analyses. The availability of personal com-puters taps hidden computing needs that executives always hadbut that could not be satisfied previously because of insufficientstaff or time available to do so on the firm's mainframe computer.The diffusion of the newer and smaller micros is eliminating thisroadblock. Managers are simply taking advantage of the lowermarginal cost of computing by utilizing it in new and differentways. This result is compounded by the difficulty of adequatelymeasuring output from an office; it is extremely difficult to knowhow much the new technologies have added to the bottom line ofthe firm. In particular, changes in quality are especially difficultto measure.
In summary, this review of the technological influences onclerical employment has been relatively unsatisfying. There areno general time series data about office automation spending byindustry or about the application of devices by individual occu-pations. The analysis of overall productivity gains in finance andinsurance did not provide any evidence that office automation isproducing significant productivity gains in that sector despite thefact that real investment spending in finance and insurance hasincreased rapidly since the late 1960s. Similarly, other sources,citing a variety of explanations, support the notion of an apparentlack of productivity gains from office automation to date. Conse-quently, it seems likely that productivity gains are not having amajor impact on clerical employment trends.
DECOMPOSITION OF CLERICAL EMPLOYMENT CHANGES
Employment change in ar. occupation cast be understood asresulting from three factors: (1) general economic growth, (2)differential rates of industry growth (because each industry uses adifferent mix of occupations), and (3) the relative importance ofeach occupation within each industry, which can be thought of asthe intensity of use of a particular occupation (or the occupationalstaffing ratio introduced above). The above discussion focusedon industry growth rates and the impact of office automationon the intensity of use of clerical workers. If the net effect ofoffice automation is the displacement of clerical jobs, over timeclerical staffing ratios will fall. In the following discussion, ananalytical tool is used to summarize the effects of all three factors.Using the mathematical technique of decomposition, occupational

rL ALLAN HUNT AND TIMOTHY L. HUNT 253
employment changes can be artificially separated into their threecomponents.
The decomposition methodology provides another, more sys-tematic opportunity to assess the technological influence of officeautomation on clerical jobs. In general, changing staffing ratiosare probably the most visible manifestation of the specific effectsof technological change on occupational employment. For exam-ple, the staffing ratios for computer-related occupations h .ve risenin many industries over time because of the dramatic increases inthe use of computers. On the other hand, the staffing ratios forstenographers have been falling over a long period of time becauseof the adoption of dictc, ;ion equipment, a technological changethat reduces the need for stenographers.13
The mathematical decomposition technique holds some of thefactors constant over time while allowing others to vary. Forexam-ple, the effects of a change in staffing ratios on clerical employmentduring a particular time period can be determined by comparingcurrent clerical employment with simulated employment levels ob-tained by holding staffing ratios constant at their original levelsbut using current industry employment as the multiplier. In otherwords the simulated clerical employment level uses the "correct"industry levelsactual current employment in these industriesbut the "wrong" staffing ratiosthose that existed at the start ofthe period. Thus, the difference between actual current clericalemployment and simulated employment indicates the extent towhich the change can be attributed to staffing ratio changes."While one may presume that these changes are due to techno-logical change, the mathematical decomposition of occupationalemployment growth is not an explanation of cause and effect;many complex economic and noneconomic forces lie behind thenumbers revealed by the technique.
13 It should be emphasized that staffing ratios may change for reasonsother than the use of innovations, such as organizational change, job titlechange with no change in job content, or others. Any time an individualoccupational staffing ratio changes, all of the remaining staffing ratios inthat industry will change as well. (This occurs because the sum of thestaffing ratios in an industry must equal one.) For example, if a particularindustry was very successful in automating production worker jobs, perhapsby using robots, then the relative importance of other jobs such u clericals,professionals, etc. will increase.14 A more technical description of the decompc,sition is provided in Hunt
and Hunt (1986:Ch. 4).

254 RECENT TRENDS IN CLERICAL EMPLOYMENT
TABLE 6 Clerical Employment Growth by Industry, 1972-1982
Industry
Mental Employment ChangesChange in Change in
1972 1982 Employ- Employ-Employ- Employ- merit 1972- ment 1972 -ment ment 1982 1982(000's) (000's) (000's) (%)
Agriculture 18 83 35 72.9Mining 59 128 69 116.9Construction 362 451 89 24 6Durables 1,352 1,513 161 11 9Nondurable. 1,040 1,074 31 3 3Utilities 1,307 1,463 156 11 9Wholesale trade 684 811 160 231Retail trade 2,099 2,840 741 35 3Finance 2,007 2,750 713 :.'.7 0
Services 3,691 5,473 1,782 18 3Public administration 1,678 1,827 149 8 9
Total
Industry
14,326 18,446 4,120 288
Decomposition of Clerical Employment Changes, 1972-1982Absolute Changes (in thousands) Percent of EmploymentDue to: Changes Due to.
Differential DifferentialAggregate Rates of Staffing Aggregate Rates of StaffingEconomic Industry Ratio Economic Industry RatioGrowth Growth Changes Growth Growth Changes
Agriculture 10 -11 36 211 -22.9 75.0Mining 12 29 28 21 1 49 1 17 5Construction 77 -14 56 21 1 -12 1 15 5Durables 286 -244 119 21.1 -18 0 8 8Nondurable. 220 -222 36 21 1 -21 3 3.5Utilities 276 -23 -97 211 -1.8 -7.4Wholesale trade 145 86 -71 21.1 12 6 -10 1Retail trade 144 45 252 21.1 2 1 12 0Finance 424 457 -138 21 1 22 8 -6 9Services 781 605 396 21 1 16.4 10 7Public admin. 355 -53 -153 21 1 -3 2 -9 1
Total 3,029 625 468 21.1 1 4 3 2
NOTES Totals and percentages may not add exactly due to rounding. Percentages based on 1972employment
SOURCE Calculated by the authors, based on data from the Current Population Survey.
The results of the decomposition for the major occupationalgroup of clerical workers are presented in Table 6. One-digitindustries and occupations are used in this analysis, based on CPSdata, because the sample is far too small to provide both industrialand occupational detail below that level. The time period for theanalysis, 1972-1982, is selected because that is the only recent timespan for which consistent data are available. From 1972 to 1982

H. ALLAN HUNT AND TIMOTHY L. HUNT 255
the number of clerical jobs increased by just over 4 manor-11.°r a28.8 percent gain over 1972 employment levels. During that sametime span total employment increased by 21.1 percent. Clericaljobs grew faster than the average for all jobs, which also meansthat clerical jobs were becoming relatively more important in thenational economy.
The bottom row in Table 6 indicates that the bulk of all newclerical jobs, a little more than 3 million, were added as e. con-sequence of the overall growth of the economy; another 625,000clerical jobs were added because clerical workers were more preva-lent in industries that were growing faster than the average for allindustries (the factor labeled differential rates of industry growthin the table); finally, 466,000 clerical jobs were added becauseof increasing staffing ratios for clerical jobs; that amounts to 3.3percent of the 1972 employment level for clerical workers. Thisdoes not mean that staffing ratios in all industries were increasingfor clerical occupations, but rather that the net effect across allindustries was positive. Neither changing staffing ratios nor differ-ential rates of industry growth, however, were major contributorsto clerical employment growth in the 10 years from 1972 to 1982,although both factors were modestly positive during the period.
An examination of the data for each industry shows thatstaffing ratios for clerical jobs are actually falling in a number ofindustries. Most interesting are the results for the finance sector,as noted above probably the biggest user of office automation todate. The finance sector has been a rapidly growing sector asindicated by the 37 percent overall growth rate of clerical jobsin that sector versus the 28.8 percent growth rate for all clericaljobs. Thus, the effects of falling staffing ratios, which would havereduced jobs in this sector by 6.9 percent from 1972 employmentlevels, were more than recovered by the fast growth of the industryitself. However, if the industry had not expanded so rapidly,there would have been actual reductions in employment of clericalworkers in the finance sector.
Staffing ratios for clerical jobs have also been falling in threeother important industriesutilities, wholesale trade, and publicadministration. The decline in public administration may not bedue primarily to office automation. Except in the postal service,which has automated the mail-sorting operation, government hasnot been in the forefront in adopting automation. Government wasone of the slowest-growing sectors during this time period. Perhaps
28

256 RECENT TRENDS IN CLERICAL EMPLOYMENT
government administrators, when faced with tight budgets andrising demands for services, economized more on clerical jobs thanother positions. It is not easy to provide an adequate explanationof the fall in staffing ratios for public administration or the otherindustries. It is possible that they are linked to office automation.Clearly, more study of these trends is called for.
It is possible that office automation is raising the productivityof clerical workers, contributing to the falling staffing ratios inthose sectors, and thereby negatively impacting clerical jobs. Itis puzzling that the aggregate productivity data for finance andinsurance showed below-average productivity growth fc- the sec-tor as a whole, yet the decomposition analysis showed decliningstaffing ratios for clerical jobs within finance and insurance. Manyunanswered questions remain about the causes of employmenttrends for clericals in sectors such as finance and insurance.
The changing composition of industries has tended to favorclerical jobs, but the influence of industry mix was only moderatelypositive during the 1970s, and some sectors that are heavy em-ployers of clericals have recently experienced much slower growthor even absolute declines in total employment. This is particularlytrue for hospitals, and state and local government, the latter ofwhich is the largest single employer of clericals. Even though othersectors, notably services, will likely continue to be fast growing,there is no strong reason to think that industry mix will play amore significant role in the future employment outlook for clericalworkers; it may . all play a less-significant role.
Most importantly, this analysis reveals that economic growthis by far the most importaia factor in determining clerical employ-ment. Economic growth accounted for three-fourths of the clericaljobs created. Yet this factor may be in the process of becoming lessfavorable to clerical employment. In the past, clerical employmentcontinued to grow when the economy as a whole experienced a re-cession. In the last recession, however, clerical jobs failed to grow.They may be becoming more like other jobs in their sensitivity togeneral economic conditions.
CONCLUSION
Clerical employment has grown rapidly in the last 40 yearsor so, but many factors suggest that the growth of clerical jobs
2 ._ ; I

H. ALLAN HUNT AND TIMOTHY L. HUNT 257
has slowed significantly. Clerical workers have had a favorable in-dustry mix in their employment pattern, benefiting from the shifttoward finance and other service-related industries because thoseindustries employ much higher proportions of clerical workers.Furthermore, the relative importance of clerical jobs has tendedto rise within industries. Thus, in the past all the factors havetended to be positive and the result has been spectacular growthin clerical employment. Given the rapid growth in clerical jobsover the last 30 years or so, it appears reasonable to corclude thatmany goods and services have been becoming more any more in-formation intensive per unit of output over time. This has tendedto boost clerical employment.
However, it is clear that the rate of growth of clerical jobsslowed during the last decade. Clericals did not benefit from thelast recession as they have in earlier recessions, nor are some ofthe sectors that are important employers of clericals growing asfast as they once were. Finally, although office automation maynot be producing a revolution, it should at least con;ribute to theslowing of employment growth in these occupations in the future.
Changing staffing ratios, probably the most visible manifesta-tion of the specific effects of technological change on occupationalemployment, had a moderately positive effect on the employmentgrowth of clerical workers from 1972 to 1982, creating about450,000 new clerical jobs (compared to about 3 million createdby aggregate economic growth and 600,000 by the concentrationof clerical workers in rapidly growing industries). Although thenet effect of changing staffing ratios on clerical employment wasmodestly positive across all industries, there were a few sectors,notably finance, where the effect was negative. This is taken asevidence of the adverse impact of technological change on cleri-cal employment. Investment in this sector has been dramaticallyhigher than the historical average for that sector for the last 15years, but measured industry-wide productivity gains in financeand insurance do not support the thesis that office automation ishaving a significant impact. This lack of measured productivityresults remains a puzzle. Nevertheless, future employment maywell be impacted by the capital buildup in this and other sectorsthat have traditionally been large employers of clerical workers.
i, .... ,4 . 9

258 RECENT TRENDS IN CLERICAL EMPLOYMENT
A LOOK TOWARD THE FUTURE
It is, of course, risky to attempt to predict what might happento clerical employment in the future, but the changes that liebehind the trends noted above provide some clues, as do recentforecasts made by the Bureau of Labor Statistics (BLS) and otherresearchers. These will not be fully reviewed here, but their majorconclusions are summarized as part of our assessment of the likelyfuture for clerical employment. (For a more complete discussionsee Hunt and Hunt, 1986.)
The BLS occupational projections represent the most impor-tant effort of the federal government to anticipate future needs forspecific occupations. The BLS methodology is based on a mod-eling framework that accounts for many economic variables. Theresulting occupational projections are not necessarily superior toothers, but they do have the advantage of being produced in acomprehensive and reasonably consistent manner. Other forecastsof clerical employment growth are not nearly as comprehensive asthat of the BLS. For example, Leontief and Duchin (1986) of NewYork University analyze the impacts of computer automation onemployment from 1963 to 2000. Their research is limited to cer-tain specified computer technologies and does not consider otherproductivity-enhancing technologies or any other source of produc-tivity growth. Roessner et al. (1985) of the Georgia Institute ofTechnology, examines cleri^,a1 jobs in two industries, banking andinsurance. Finally, Drennan (1983) of Columbia University looksat clerical employment in six industries. His projection methodol-ogy utilizes extrapolation of historical trends after accounting forthe effects of the 1980-1982 recession.
The BLS anticipates near average growth for clerical jobs.Between 1982 and 1995, BLS anticipates an average growth inemployment of 28.1 percent. Growth in employment of clericaloccupations is anticipated to be 26.5 percent. The effect of differ-ential rates of industry growth is expected to be slightly positiveat 1.6 percent (smaller than their contribution between 1972 and1982). The effect of changing staffing ratios is expected to benegative at minus 3.1 percent. In fact, all the existing forecasts ofemployment in clerical occupations are unanimous in predictingthat staffing ratios for clerical jobs will decline in the years ahead,presumably because of office automation. The fall in staffing ratiosanticipated by BLS is modest compared with other predictions.
`27

H. ALLAN HUNT AND TIMOTHY L. HUNT 259
Still, it; is significant that the only turnaround from historicaltrends anticipated by BLS at the major occupational group leveldue to changing staffing ratios is that for clerical workers. At leastthrough 1982, the decomposition analysis discussed earlier showedthat the staffing ratios for clerical jobs were rising, whereas theBLS forecast (base year 1982) and other forecasts expect that thistrend will be reversed in the years ahead.
Growth rates forecast by BLS for 95 specific clerical occu-pations range from a positive 76.1 percent to minus 20 percent.The range in the portion due to clerical staffing ratio changes isfrom plus 38.4 percent to minus 55.6 percent. Clearly, though theeffect of BLS's staffing ratio for clerical workers is negative overall,BLS expects many positive staffing effects for clerical workers aswell. The fastest-growing clerical jobs are expected ..o be com-puter operators, claims adjusters, insurance checkers, peripheralEDP equipment operators, telephone ad takers, claims clerks, andcredit authorizers. All are expected to have staffing ratio im-pacts equivalent to increases in employment levels of 20 percentor more. Besides the obvious technological impacts of comput-ers on this list, it may be important to note that many of theseoccupations require the worker to interact in some way with thecustomer who is being served. That may provide a clue as to whyBLS thinks secretaries will not decline in importance, or perhapswhy cashiers are the 10th fastest-grow;ng occupation, w:th a 48.2percent growth rate. Again a world of both high tech and hightouch is anticipated.
Roessner et al., Drennan, and Leontief and Duchin all con-clude that office automation will have a muc:, greater negative im-pact on clerical jobs than the BLS predicts, with Leontief-Duchinand Roessner et al. predicting absolute declines in clerical em-ployment within the next decade. Roessne* et al. is particularlypointed about his concerns regarding the BLS methodology andforecasts, while Drennan's projections appear to be nearer the BLSposition. We find the studies of Leontief and Duchin and Roessneret al. to be seriously flawed for serving policy needs; we think thatLeontief-Duchin and Roessner et al. are unduly pessimistic aboutthe outlook for clerical jobs.
There are a variety of reasons that support our contention.First, although Leontief-Duchin use the BLS forecast for demandfor goods and services, they predict revolutionary change in the
2 7 )

260 RECENT TRENDS IN CLERICAL EMPLOYMENT
process technology by which those goods and services will be pro-duced. The revolution in office automation is assumed to leavethe demand side of the marketplace unchanged. But that is notthe way a complex, dynamic market economy operates. If officeautomation were adopted rapidly, it wou.., change the relativecosts of production for those goods and services that are inten-sive users of office automation. Those lower production costs willgenerate lower prices. Since office work is concentrated in the ser-vice sector, where demand growth has been above average, thereis every reason to think that both the lower prices and incomegrowth over time will generate additional demand. This scenariois even more plausible when one realizes that the product marketsthemselves are not static. So the new electronic office technolo-gies may provide the impetus for the development of entirely newgoods and services. Industry interrelationships may change orscale economies may be so significant that they fuel the devel-opment of a mass market that heretofore was undreamed of. Inour opinion it is inappropriate to fix demand or the growth ofdemand and then assume a revolutionary change on the supplyside of the market. Obviously, such a partial analysis can createfalse impressions about the true impacts of office automation.
Second, it appears that none of these other studies accountfor the tendency of output to become more information intensiveover time. Yet this is a process that has been occurring for sometime. The production recipes for many different goods and servicestoday require more information processing than yesterday. This isnot simply a function of the changing composition of demand butrelates to the ingredients for a standard unit of output. To theextent that this trend continues in the future, it implies that officeautomation may have less impact on clerical employment levelsthan anticipated by some researchers.
Third, it should be mentioned that office automation is likelyto lower the marginal cost of some new types of work so much thatthe required labor needed to produce that work rises by more thanthe labor-saving impact of the new techniques themselves. Thecommon example is redrafts of documents with word processing.The probability that this will occur may be enhanced by ourinability to measure output from offices in the first place. Thistype of new work or rework is explicitly rejected by Leontief-Duchin, and perhaps implicitly by Roessner et al.
0 M I N
( ,J

H. ALLAN HUNT AND TIMOTHY L. HUNT 261
Fourth, these studies do not account for the fact that thenew technologies must be cost-effective and relatively reliable forwidespread application. The technologies may appear to be cost-less, producing quantum leaps in productivity for the users. Yetthere are purchase costs, installation costs, and ongoing costs thatmust be accounted for. The ongoing costs include system main-tenance, software development, and training, among others. Thecost of unscheduled downtime may become increasingly significantwith more integrated systems.
Finally, Leontief-Duchin and Roessner et al. appear to us tobe truly overoptimistic technologically, both in terms of what officeautomation equipment can do and in the speed of diffusion of thatequipment. Leontief-Duchin assume that word processors alonewill produce productivity gains for typists and secretaries of 500percent. Yet this assumption is based upon a short, anonymoustrade journal article that is five times more optimistic than theother articles which Leontief-Duchin reference. Roessner et al.,on the other hand, emphasizes the potential for two breakthroughtechnologies, voice input and artificial intelligence. He assumesthat innovations will occur in these technologies in the next fewyears, that they will be successfully marketed, and that they willdramatically reduce clerical employment in banking and insuranceduring the 1990s.
Our major complaint with the technological assumptions ofboth Leontief-Duchin and Roessner et al. is not that they maybe technically wrong, although there is ample reason to questionthem, but that the level of uncertainty about the technical fore-casts is so great that no one should seriously want to base policydecisions on them. Artificial intelligence, for example, is a technol-ogy that has been touted since the 1950s as a major breakthrough.Perhaps we will always be overoptimistic about new technologies;it seems to be part of the human condition. But that is no justi-fication to shape public policy based on our dreams of the future.Suffice it to say that we are unconvinced that technology willevolve as far or as fast as Leontief-Duchin and Roessner et al.predict. This is the kind of analysis that leads to the fear thatwe will experience massive technological unemployment at somepoint in the future. Various analysts have been predicting such anevent at least since the dawn of the industrial age. Somehow theemployment apocalypse is always just ahead, yet fortunately wenever quite reach it.

262 RECENT TRENDS IN CLERICAL EMPLOYMENT
Because of the u certainties about future demand and thecapabilities of future technologies, we would encourage a focuson shorter-range occupational forecasting, exactly the oppositeapproach being suggested by Leontief-Duchin and Roessner et al.Roessner et al. argues that public policy makers need a longertime period for planning. But, if technological change is occurringfaster today, then it is becoming even more impossible to developlong-run employment forecasts. Surely it is folly to think thatwe can peer 15 to 20 years into the future and see the detailedoccupational and industrial structure of this nation. In fact, wethink that the current BLS efforts, which produce about a 10-yearple.nnirg horizon, tax existing forecasting abilities to the limit's
What has this review shown for the future of clerical jobs?First, we think the pessimists who -laim that these jobs will eitherstop growing absolutely or actually u-3cline are wrong. The forcesof economic growth. the shift toward services, and the currentlimitations of office automation technologies all argue stronglyagainst this scenario. However, it is clear that the historical rateof growth of clerical jobs has slowed. Clericals did not benefit fromthe last recession ab -y have in earlier recessions, nor are someof the sectors that aie important employers of clericals growingas fast as they once were. Finally, office automation is likely toat least contribute to the slowing of employment growth in theseoccupations in the future. Ne think that the overall growth ofclerical jobs in the future w .1 be average to slightly below average.There is broad agreement among forecasts that clerical jobs willam, continue their rapid growth of the past few decades. The recentslowdown in the growth of clerical jobs is very likely permanent.
We find no persuasive evidence, however, that there will bea iificant decline in the absolute number of clerical jobs. Theforecasts of declining clerical employment are based on overopti-mistic expectations of technological improvements or exaggeratedproductivity claims on behalf of existing technology. In our °p.a...ion, current office technology offers significant improvements inproduct quality and modest improvements in productivity. There
16 We also th'nk BLS should be more open -.bout their handling oftelhnological change in their forec:.5ts. Like the other forecasters discussedhere, BLS should reveal the basis for its judgments concerning technologicalchange.
2 7

H. ALLAN HUNT AND TIMOTHY L. HUNT 263
is as yet no empirical evidence of an office productivity revolu-tion that will displace significant numbers of clerical workers. Thegrowth of computer-related clerical positions will continue to bestrong. Office automation is not sufficiently advanced at this pointto slow the growth of these jobs.
Many factors will contribute to the continued, if slower, jobgrowth of clericals in the future. Chief among these is the simplefact that clericals are so diffused in the national economy. More-over, to the extent that clerical jobs are concentrated in particularindustries, it has been in industries growing faster than average.Even if the t,. myth rate of some of these slows, as it has in somefinancial industries for example, others, such as services, are likelyto continue tio grow at above average rates. Therefore, even al-lowing for negative employment impacts from office automation,the growth of this large, diverse, and diffused major occupationalgroup should not be much below the average growth for all occu-pations for the next decade.
Many commentators believe hat back-office clerical jobs willdisapppear. We do not think this is likely. An analogy to man-ufacturing may be useful. Automation has not caused the totalelimination of production workers in manufacturing, but these jobshave not been increasing in absolute terms for 40 years either. Likemost of the forecasts discussed, we think the back-office jobs aremore threatened by automation than other positions. They sharewith production workers a routinization of tasks, which tends tosupport automation. This will not necessarily lead to their demise,but their growth will be well below average.
A good example of the limits of technological change is pro-vided by bank tellers. The growth of this occupation has slowed inrecent years. The future growth prospects for bank tellers appearto be directly tied to the public's acceptance of automatic tellermachines. But these machines today are used mostly for with-drawals and cannot handle nonroutine transactions. They cannotbe thought of as a substitute for a fully staffed bank. Furthermore,it is difficult to know if and when the public will be willing to breakthe human link in making banking transactions.
Secretaries fall somewhere between the back-office jobs andthose positions that involve considerable customer interface.Therefore, secretarial employment growth may slow but will notstop. We think that the growth of secretaries will be average tobelow average, but the absolute number of these jobs win definitely
2 7 43

264 RECENT TRENDS IN CLERICAL EMPLOYMENT
increase. Secretarial positions require a variety of skills and manyare generalist in nature; they are more difficult to eliminate withautomation. A variety of skills helps to ensure that the automa-tion of any one of these skills leaves the job intact. It seems clearthat secretaries of the future will require an even greater varietyof skills and will utilize much more capital equipment.
Computer technology is still not ready to tackle the unstruc-tured situations where humans excel. Clerical positions that in-volve direct interface with customers or co-workers are likely toexperience at least average growth. The office of the future willrequire both "high tech" and "high touch" occupations.
REFERENCESAttewell, Paul, and James Rule
1984 Computing and organizations: what we know and what we don'tknow. Communications of the ACM (December):1184-1192.
Bailey, Andrew D., James H. Gerlach, and Andrew B. Winston1985 Office Systems, Technology and Organizations. Reston, Va.: Reston
Publishing Company.Brand, Horst, and John Duke
1982 Productivity in banking. computers spur the advance. MonthlyLabor Review (December):19-27.
Bureau of the Census1972 1970 Census of Population, Detailed Characteristics, United States Sum-
mary. PC(1)-D(1). Washington, D.C.: U.S. Department of Com-merce.
Bureau of Labor Statistics1981 The National Industry-Occupation Matrix, 1970, 1978, and Projected 1990.
Bulletin 2086. Washington, D.C.: U.S. Department of Labor.1979 Time Series Data for Input-Output Industries: Output, Price, and Em-
p:oyment. Bulletin 2018. Washington, D.C.: U.S. Department ofLabor. March.
Computer and Business Equipment Manufacturers Association1985 The Computer and Business Equipment Industry Marketing Data Book.
Washington, D.C.: Computer and Business Equipment Manufac-turers Association.
Diebold, John1985 Managing Information: The Challenge and the Opportunity. New York:
AMACOM.Drennan, Matthew P.
1983 Implications of Computer and Communications Technology forLess Skilled Service Employment Opportunities. Final report pre-pared for the Employment and Training Administration. Wash-ington, D.C.: U.S. Department of Labor.
Hartmann, Heidi I., Robert E. Kraut, and Louise A. Tilly, eds.1986 Computer Chips and Paper Clips: Technology and Women's Employment.
Vol. I. Washington, D.C.: National Academy Press.
27/

H. ALLAN HUNT AND TIMOTHY L. HUNT 265
Honeywell Inc.1983 Office Automation and the Workplace: A National Survey. Minneapolis,
Minn.: Honeywell Inc.Hunt, H. Allan, and Timothy L. Hunt
1986 Clerical Employment and Technological Change. Kalamazoo, Mich.:W.E. Upjohn Institute for Enik.loyment Research.
Hunt, Timothy L., and H. Allan Hunt1985 An Assessment of Data Sources to Study the Employment Effects
of Technological Change. Pp. 1-116 in Technological EmploymentEffects: Interim Report. Panel on Technology and Women's Employ-ment, Committee on Women's Employment and Related SocialIssues. National Research Council. Washington, D.C.: NationalAcademy Press.
International Data Corporation1982 Information systems for tomorrow's office. Fortune (October 18):
17-81.1983 Office systems for the eighties: automation and the bottom line.
Fortune (October 3):89-162.1984 Information systems for tomorrow's office. Fortune (October 15):
99-138.Katzan, Harry, Jr.
1982 Office Automation: A Manager's Guide. New York: American Man-agement Associations.
King, John L., and Kenneth L. Kraemer1981 Cost as a social impact of informs;ion technology. Pp. 93-129 in
Mitchell L. Moss, ed., Telecommunications and Productivity. Reading,Ma Addison-Wesley.
Leontief, Wassily, and Faye Duchin1986 The Future Impact of Automation on Workers. New York: Oxford
University Press.Priebe, John A., Joan Heinkel, and Stanley Greene
1972 1970 Occupation and Industry Classification Systems in Terms oftheir 1960 Occupation and Industry Elements. Technical Paper No.26. Washington, D.C.: Bureau of the Census, U.S. Department ofCommerce. July.
Reskin, Barbara F., and Heidi I. Hartmann, eds.1985 Women's Work, Men's Work Sez Segregation on the Job. Washington,
D.C.: National Academy Press.Roessner, J. David, Robert M. Mason, Alan L. Porter, Frederick A. Rossini,A. Perry Schwarts, and Keith R. Nelms
1985 The Impact of Office Automation on Clerical Employment, 1985-2000: Forecasting Techniq'ies and Plausible Futures in Bankingand Insurance. Westport, Conn.: Quorum Books.
Salerno, Lynn M.1985 What happened to the computer revolution? Harvard Business
Review (NovemberDecember):129-138.Seskin, Eugene P., and David P. Sullivan
1985 Revised estimates of new plant and equipment expenditures in theUnited States, 1947-1983. Survey of Current Business (February):16-27.
266 RECENT TRENDS IN CLERICAL EMPLOYMENT
Strassman, Paul A.1985 Information Payoff: The Rarnformation of Work in the Electronic Age.
New York: Free Press.Wang Laboratories, Inc.
1985 Issues in Information Processing: Cost Justification. Lowell, Mass.:Wang Laboratories, Inc.
BIBLIOGRAPHY
Administrative Management1978 The many cases fo: WP. Administrative Management (April):70- 71.
Bureau of the Census1982 1980 Census of Population: Classified Indez of Industries and Occupations.
Washington, D.C.: U.S. Department of Commerce.Business Week
1985 The computer slump. Business Week (June 24):74-81.Downing, Hazel
1980 Word Processors and the Oppression of Women. Pp. 275-288in Tom Forester, ed., The Microelectronics Revolution. Cambridge.Mass.: MIT Press.
Employment and Training Administration1977 Dictionary of Occupational Titles. 4th ed. Washington, D.C.: U.S.
Department of Labor.Gold, Bela
1981 Robotics, programmable automation and increasing competitive-ness. Pp. 91-117 in Exploratory Workshop on the Social Impacts ofRobotics: Summary and Issues. Office of Technology Assessment,Congress of the United States. Washington, D.C.: U.S. Govern-ment Printing Office.
Karan, Mary A.1982 Word processing: when it doesn't work. Computer World (March):
16.Klein, Deborah P.
1984 Occupational employment statistics for 1972-82. Employment andEarnings (January):13.
Kutscher, Ronald E.1982 New economic projections through 1990an overview. Pp. 1-9 in
Economic Projections to 1990. Washington, D.C.: U.S. Departmentof Labor.
Miller, Ann, Donald J. Treiman, Pamela S. Cain, and Patricia A. Roos, eds.1980 Work, Jobs, and Occupations: A Critical Review of the "Dictionary of
Occupational Titles." Washington, D.C.: National Academy Press.Murphree, Mary
1981 Rationalization and Satisfaction in Clerical Work: A Case Studyof Wall Street Legal Secretaries. Ph.D. dissertation. ColumbiaUniversity, New York.
Office of Economic Growth and Employment Projections1981 Projected Occupational Staffing Patterns of Industries. OES Tech-
nical Paper Number 2. Washington, D.C.: U.S. Department ofLabor.
274

H. ALLAN HUNT AND TIMOTHY L. HUNT 267
Office of Technology Assessment1984 Effects of Information Technology on Fin.mcial Services Systems. Wash-
ington, D.C.: Congress of the United States.Silvestri, George T., John M. Lukasiewicz, and Marcus E. Einstein
1983 Occupational employment projections through 1995. Monthly LaborReview (November):37-49.
Stanford Research Institute1984 Drop in business demand for personal computers. The SRI Journal
(May):4-5.Winston, Patrick H.
1985 The AI business: a perspective. Manufacturing Engineering (March).
260

Restructuring Work:Temporary, Part-Time, and At-Home
E nployment
EILEEN APPELBAUM
This paper examines the extent to which women participate inalternative work schedules and the relation of such arrangements tothe implementation and diffusion of computer-based technologies.Alternative work schedules include temporary work, part-timework, multiple jobholding, and at-home work. Each of these em-ployment strategies predates the introduction of high-technologyproducts and production processes; this paper attempts to identifythe particular impact of developments in technology on the chang-ing extent of these work schedules. This is not an easy task for tworeasons. First, while mainframe computers have been in use sincethe early 1960s, it is only in the last few years that computer-basedtechnologies have altered the nature of the work process and theway in which work is organized. Second, employment data byoccupation and industry, even when they are available, are rarelydisaggregated to the extent required for a definitive analysis ofthe effects of technological change on work schedules. At best, wecan hope to find some trace of the impact of technological changeon the work options available to women. A limited number ofinformal interviews have been conducted in order to obtain infor-mation to supplement the published data, especially with regard
268

EILEEN APPELBAUM 269
to the relative importance of technological change in influencingthe work schedules of women.
The paper is organized as follows: the next section briefly dis-cusses the transformation of internal and external labor markets,changes in the opportunity structure facing women who work, andthe effects of technological change. The following sections discusstemporary employment, part-time employment, multiple jobhold-ing, and at-home work. The final section draws some preliminaryconclusions and implications from the available information.
THE TRANSFORMATION OF LABOR MARKETS
To a large extent, increased use of alternative work schedulescan be explained by developments over the last decade and a halfthat have reduced the importance and undermined the existence ofinternal labor markets. These developments include the spread ofmicroprocessor-based technologies, increased emphasis on reduc-ing labor costs, and the growth of higher education. Companieshave adopted human resource strategies that increase their flexi-bility in deploying their work forces. For workers, nearly 6 millionof whom are currently employed part-time involuntarily, this hasmeant increasing difficulty in obtaining the security, fringe bene-fits, and wages associated with permanent, full-time employment.
TECHNOLOGY AND INTERNAL LABOR MARKETS
The new microprocessor-based technologies currently beingimplemented have the dual effect of reducing unit labor require-ments and reorganizing the labor process. Their effect on workerskills and occupational mobility depend critically on strategic de-cisions by firms with respect to how they are implemented. At themicro level, the crucial issue is job design. Computer and com-munication technologies allow for considerable flexibility in thedesign of the worker/machine interface and the associated skillrequirements of jobs (discussed at length by Albin, 1984). At themacro level the pattern of technical development that results fromjob design choices will have its major impact on the functioningof internal labor markets. In the last half century, internal labormarkets, through on-the-job training and promotion along well-defined job ladders, have generated significant numbers of workingclass jobs paying middle -clasp wages. Though women and blacks
2g.?

270 RESTRUCTURING WORK
were systematically excluded from these job ladders and often con-signed to dead-end work in jobs in the secondary labor market,internal labor markets did provide avenues of upward mobility formany white male workers, thus contributing substantially to thelarge size of the American middle class. Preliminary evidence sug-gests that the pattern of implementation of the new productiontechnologies will reduce the importance of these internal labormarkets, with, in my view, potentially serious implications for thebroader institutional and social framework of society.
Familiarity with the intrinsic capabilities of the new technolo-gies suggests that they are most efficiently utilized when they aredeployed so that tasks are integrated, job content is complex, anddecision making is decentralized (see, for example, Hirschhorn,1984). Implemented in this way the technologies would lead to in-creased employment opportunities for skilled and educated work-ers. Work would be highly adaptive with numerous opportunitiesfor learning by doing and for related improvements in productiv-ity, and both the private and social returns to formal educationwould increase. Initially, however, implementation of these tech-nologies in the United States has often followed the older patternassociated with Taylorismspecialization and fragmentation ofwork. Despite the technology's capability for integrating workprocesses, computers and telecommunications are sometimes usedto fragment work still further as the production process is un-coupled and the stages physically dispersed. Another aspect ofcomputer-based technologies is that they automate the routineaspects of skilled technical and professional work as well as lessskilled clerical work. In the process, these technologies eliminateboth entry-level positions and the jobs that traditionally formedthe rungs of career ladders from semiskilled to skilled work. Natu-ral learning sequences are disrupted and the possibility of learningmore complex tasks on the job diminishes.
Thus, I would argue that by-products of the implementationof computer and communications technologies include the disrup-tion of natural learning sequences, a decline in the importance ofjob ladders and internal labor markets for nonprofessional employ-ees, the resulting weakening in internal labor market structures,and the attendant reduction in occupational mobility for ordinaryworkers. It would be a mistake, however, to attribute all changesin the organization of work that undermine internal labor marketsto the direct effects of the way in which technological change is
2 S 3

EILEEN APPELBA UM 271
implemented. Other forces, some of them indirectly related totechnology, are at work here as well.
POISED FOR CONTRACTION
Internal labor markets play a special role in meeting the needsof companies that are poised for expansion: they guarantee thatthe company has workers already in the pipeline at every skilllevel ready to move up the job ladder should an increase in de-mand for the company's products warrant increases in production.Under these conditions, assistant managers are not an unnecessaryand costly layer of bureaucracy; rather, they are a pool of work-ers, loyal to the company, steeped in its culture, and possessingthe requisite skills to assume the position of manager should thecompany decide to open additional branch operations. The costof having such workers on the payroll does not appear excessivewhen weighed against the costs of quickly recruiting, hiring, andtraining such workers from outside the firm in order to respond tomarket opportunities in a timely manner.
Today, however, companies are poised for contractionantici-pating a loss of markets or market share or a decline in unit laborrequirements as the labor-saving potential of office automationtechnologies are realized. In this context, a pipeline filled withworkers ready to move up appears to the company to be an un-justifiable expense rather than an investment in its future. Asituation in which the competitive position of U.S. industry hasdeclined as a result of the combined effects of an overvalued dol-lar and the movement of capital into export zones established incheap labor areas of the world and in which even domestic marketsare increasingly subject to foreign penetration dictates that firmsdevelop a lean profile. Deregulation and increased competitionamong financial institutions and changes in federal payments tohospitals have unleashed powerful pressures for cost containmentin these industries as well. Add to this the indirect role playedby technological change. Firms that expect a drop in unit laborrequirements do not need a pipeline filled with workers expectingto advance. Moreover, with technology in flux, skills learned to-day at company expense are likely to become obsolete before theyare ever used. It becomes clear to a company that a labor pro-cess organized to provide a substantial number of nonprofessionalworkers with successive jobs in which skills are upgraded through

272 RESTRUCTURING WORK
on-the-job training or employer-sponsored training programs hasbecome obsolete. While appropriate for the conditions of the 1950sand 1960s, it appears wasteful and costly in the 1980s.
Moreover, a decreasing reliance on internal labor markets andon-the-job training to provide business with skilled workers hasbeen facilitated by the growth of higher education (see Noyelle,this volume). By 1980, nearly one-fourth of those between 25 and29 years of age had 4 or more years of college educatiln compare3with about 10 percent in 1960. Firms have shifted to outside hiringto fill administrative, professional, and managerial positions thatuntil recently would have been filled from within. In the process,they have used formal credentials to create significant barriers toentry into these occupations and have required workers to obtainvocational skills through formal schooling and higher education.Traditional internal ladders are being disbanded, and the earlierlink between occupational mobility and training provided withinthe industry or firm has been weakened.
Though these are recent developments, evidence is accumu-lating that firms are adjusting to technology and these changes intheir environment by reorganizing on a core and ring basis, holdingto a minimum the number of workers who can expect to have afuture with the company and for whom the company is willing toprovide health and life insurance and retirement benefitstheseworkers make up the stable core, while other workers constitute anever-changing ring. Flexibility in meeting staffing needs and theability to retrench quickly increasingly take precedence over thedesire for a loyal, well-trained work force and low turnov r rates.Firms are experimenting with ways to shift the costs of fringebenefits and the risks associated with a cyclical downturn or alabor-saving advance in technology to their workers. Strategiesinclude the use of part-time workers, temporary employees, andcontract labor. This is a major reason for the explosive growth intemporary work and subcontracting during the last few years.
IMPLICATIONS FOR WOMEN WORKERS
The occupational changes brought about by office automationtechnologies and the desire of many companies for immediate re-ductions in employment have direct implications for career mobil-ity for women within organizations. Internal labor marketswiththeir opportunities for promotion and career advancementhave

EILEEN APPELBA UM 273
only recently been opened to women, often as a result of suc-cessful enforcement of equal employment opportunity laws. Theseinternal job ladders have played a significant role in enabling capa-ble and ambitious clerical workers in industries such as insuranceand, to a lesser extent, retail sales, to work their way up throughlower-level supervisory or para-professional jobs into managementor professional positions. The weakening of internal labor marketsis closing off opportunities for advancement for women that haveonly recently become available.
The outcome for women is complex. In the last decade, firmshave begun to rely less on internal job markets to provide formaland informal training for lower-level employees and, instead, toexternalize training. Professional and managerial employees aretrained in colleges and business schools and then recruited directlyinto upper-level positions. Even the more-skilled clerical jobs arefilled not through promotion from the typing or word-processingpool but from the ranks of community college and vocationalschool graduates. One effect of office automation technologies isthat the skills required of clerical workers in diverse industries arebecoming more homogeneous. There is considerable overlap in theskills required of directory assistance operators, customer servicerepresentatives, travel agents, library assistants, classified adver-tisement takers, and so on. The replacement of on-the-job trainingand occupational mobility within firms by extended formal school-ing and job mobility through the external labor market increasesthe probability that socioeconomic conditions will limit access totraining and hence to better jobs. The picture that emerges is oneof continuing advancement opportunities for professional women,increased opportunities for lateral moves among firms but no up-ward mobility for skilled clerical or sales workers, and severelycurtailed opportunities for employment or promotion for womenin traditional clerical jobs.
The erosion of internal labor markets has weakened the claimof clerical workers to the protections and be aefits afforded bypermanent full-time employment. Firms have :died on office au-tomation technologies to facilitate their use of clerical temporaryworkers and home workers. Women workers have, thus, been af-fected disproportionately by these changes to date, though thelogic of organizing the labor market on a core and buffer basissuggests that other occupations and workers, many of them men,will be affected.
2 1.3

274 RESTRUCTURING WORK
TEMPORARY EMPLOYMENT
Of the four alternative work schedules examined in this pa-per, temporary employment has shown the most dramatic changessince the 1970s. Temporary employment in the United States isbooming. According to the Bureau of Labor Statistics, employ-ment growth in the temporary help services industry has averaged11 percent a year over the last 13 years, compared with a 2.1 per-cent growth rate for nonagricultural jobs throughout the economy(Collins, 1985). In December 1984 the industry placed 665,400workers a day in temporary positions (Employment and Earnings32(1), 1985:Table B-2). These figures do not include the growing,number of employers who are hiring workers on a temporary basisdirectly, without requiring the services of a temporary help agency.The U.S. Office of Personnel Management, for example, reportsthat the federal government filled 244,692 jobs with temporaryworkers in 1984 (data provided by Mary Ann Madison, Office ofTechnology Assessment), and the number is expected to increasesharply as a result of new regulations governing the employmentof temporary workers, which took effect in January 1985. The newrules allow "temporary" jobs, which, unlike permanent jobs, carryno medical or retirement benefits other than social security, to beextended to higher skill categories and to last up to 4 years. Thesedevelopments in federal employment mirror changes already underway in the private sector.
FORCES DRIVING THE GROWTH OF TEMPORARY WORK
Sam Sacco, executive vice president of the National Associa-tion of Temporary Services, observes that employment is increas-ingly being organized on a "ring and core basis with temporaryemployment acting as a buffer for the economy" (telephone inter-view, February 1, 1985). Thus feden1 officials publicly welcomedthe new rules on temporary employment because having moretemporary employees without civil service protection will make iteasier for them to adjust the size of the work force. They expectto be able to use the temporary workers as a cushion to protectpermanent employees from being laid off first.
" nother major force behind the growth of temporary employ-mentthe fundamental reason for its expansion according to Au-drey Freedman, a ,abor economist for the Conference Boardis
2S'i

EILEEN APPELBA UM 275
the desire of firms to contain costs. As Freedman put it, "Whatthe companies are doing is organizing so they don't have to payfor vacations, holidays, health benefits, or pensions. In addition,they don't have to allocate money for training and for promo-tion" (quoted in Collins, 1985:B1). The savings can be large, andsome firms are now building temporary work into their employ-ment strategies. According to Sacco, "companies are increasinglypre-planning for the use of temporary workers and budgeting forthem at the beginning of the year." For example, Johnson andJohnson Products, a health care supplier that is an affiliate ofthe Johnson and Johnson Corporation, has built the use of 450temporary workers during the year into its personnel plans. Thecompany is budgeting $500,000 for temporary clerical workers, sec-retaries, lab technicians, data-processing clerks, accounting clerks,and computer clerks to be hired through temporary help agencies(Flamingo, 1984). This use of temporary workers by companies ona preplanned basis, rather than as an expedient for dealing withan unforeseen situation, is a recent development.
Some companies have begun to staff certain of their facilitieswith temporary help workers. They are staffing mail rooms wherethere is higE turnover, or facilities that have peak periods, withtemporaries. Thus, an advertisement from Norrell Temporary Ser-vices that appeared in May 1984 issues of Office Administrationand Automation and of Office magazines promises to solve theturnover problem: "Facilities staffingusing temporary employ-ees as a group to tackle routine jobs permanent employees view asunattractive or dullNorrell guarantees performance by rotatingfresh, trained temporary employees into the job before burnoutoccurs." The approach appears to be attracting business for thetemporary help agencies and increasing the number of long-te-marrangements. Western Temporary Services of Walnut Creek, Cal-ifornia, reports that most of its contracts are for 1 year; some arelonger. Good People Office Automation Temporaries in New YorkCity reports that 80 percent of the assignments it receives are forlong-term temporaries. A typical long-term assignment for thiscompany involves providing experienced temporary workers to acompany changing from manual filing to a records-processing sys-tem. The positions this temporary help agency fills usually require6 months experience, though some positions may require a year(Flamingo, 1984).
2 SS
276 RESTRUCTURING WORK
Advances in technology have contributed to the rapid growthof temporary employment. Companies turn to temporary helpsupply agencies in order to handle temporary increases in workload associated with the conversion from manual to computer-based data management and filing systems. Some businesses areturning to temporary help agencies to obtain workers experiencedwith office-automation equipment to assist in training their per-manent staff. Companies that face a montl.ly peak load problemin sending updated reports or form letters to customers often turnto temporary help agencies to obtain workers experienced withword processing. In addition, firms that have made substantial in-vestments in dedicated word-processing equipment or in personalcomputers find that the equipment is too valuable to stand idlewhen regular employees are ill and hire experienced temporaryworkers to fill in for employees who are sick.
The nature of temporary work is changing. The temporaryhelp services industry has diversified far beyond the clerical work-ers who were its mainstay 15 years ago. The industry currentlysupplies temporary workers in four main areas: office clerical/officeautomation (OA) operators, medical (with hospital distinguishedfrom nursing home and homemaking services), industrial, and pro-fessional. The medical segment is the fastest-growing componentof the industry (Gannon, 1984). By 1982, 46.2 percent of em-ployment and 56.6 percent of total receipts were generated in thenon-office help components of ti.e industry.
REVENUE AND EMPLOYMENT GROWTH
Between 1977 and 1982, the temporary help services industrygrew substantially. According to census data, industry receiptsmore than doubled from $2.32 billion to $5.14 billion b3tween1977 and 1982, despite the fact that 1982 was a recession year(see Table 1). Revenue growth continues to be high. The leadingtemporary services companies, Kelly Services Inc. and ManpowerInc., each had revenue increases of more than 30 percent in 1984,while a temporary agency based in Silicon Valley, Adia ServicesInc., had an increase in net income of 98 percent (Business Week,1985). Industry sources report that the temporary help payrollwent from $431 million in 1971 to $3.48 billion in 1981, an annualrate of increase in nominal receipts of 24 percent over the decade.Payroll declined somewhat in 1982 because of the recession but
2 .'4 jZ--

EILEEN APPELBA UM
TABLE 1 Size of Temporary Help Supply Services, 1977 and 1982
1977 1982
Number of establishmentsTotal $ 4,235 $ 6,247Office help supply 3,324Other 2,923
Receipts (in thousands)Total 2,323,676 5,143,132Office help supply 2,230,926Other 2,912,206
Payroll (in thousands)Total n.a. 3,595,609Office help supply 1,599,217Other 1,996,392
EmploymentTotal n.a. 470,541Office help supply 253,167Other 217,374
SOURCE: Bureau of the Census (1980, 1985).
277
recovered and reached $5.50 billion in 1984 (National Associationof Temporary Services, unpublished data). This is an annual rateof increase in nominal receipts of 16.5 percent, despite the 1982decline. Since inflation has been much lower in the 1980s than inthe 1970s, real growth in recent years has been higher than it wasa decade ago. The industry is expected to continue to grow rapidlythrough the 1980s. According to the U.S. Department of Labor,temporary help services will be the third fastest growing industryduring this decade, after computers and health care (Flamingo,1984).
Since temporary employment now functions in part as an eco-nomic buffer, it is not surprising that employment in the temporaryhelp services industry declines early in a recession and recoversquickly at the beginning of an expansion. Nevertheless, the mag-nitude of employment growth in this industry during the recoveryfrom the 1981-1982 recession was unexpected. The most accurateemployment data are probably the monthly establishment datacollected in the Current Population Survey (CPS) and reportedin Employment and Earnings. These are reported monthly forthe temporary help services industry beginning in 1982. Annualaverage employment in temporary help services in 1983 increased

278 RESTRUCTURING WORK
17.5 percent over the corresponding figure for 1982. For women,temporary employment increased 18.3 percent between 1982 and1983 (calculated from data in Table 2). By comparison, annual av-erage employment in nonagricultural establishments increased byless than 1 percent between those 2 years, 1.9 percent for women.In June, July, and November of 1983, employment growth in thisindustry exceeded 10 percent of the number of nonagriculturaljobs added in the economy, despite the fact that temporary helpservices accounted for less than 0.5 percent of total nonagriculturalemployment in 1982 (calculated from data in Table 2). The rise inannual average employmentthat is, the increase in the numberof temporary help jobs every year between 1982 and 1983wasequal to 12.6 percent of the number of jobs added in nonagricul-tural establishments in the first year of the recovery. Employmentincreases in the industry continued during 1984, but at a moremoderate pace. Nearly 86,000 temporary help jobs were addedbetween December 1983 and December 1984. This followed anincrease of about 176,000 jobs between December 1982 and De-cember 1983 (see Table 2). Figures on temporary help jobs do nottell the whole story, however. Sacco estimates that while the tem-porary help services industry filled more than 600,000 jobs per dayon average in 1984, the number of people who held a temporaryjob at some time daring the year was about 5 million. BusinessWeek reports that the industry's giants, Kelly Fervices Inc. andManpower Inc., have more than 800,000 temporary workers ontheir books (Business Week, 1985). It shouie. he remembered thatthese figures refer only to jobs filled through temporary help agen-cies. There are no estimates of the number of temporary jobs filled
directly by firms.Increases in temporary work are outweighed by increases in
the number of year-round jobs for women. The proportion ofwomen with work experience during the year who worked fulltime (50 to 52 weeks) increased from 36.9 percent in 1960 to 40.7percent in 1970, 45.1 percent in 1981, and 48.0 percent in 1983(Women's Bureau, U.S. Department of Labor, 1983; Bureau ofLabor Statistics, unpublished data).
IMPLICATIONS FOR WOMEN WORKERS
Temporary work does not appear to be viewed by most womenwho do it as a stopgap measure until they car, find permanent work.
29i

EILEEN APPELBAUM 279
TABLE 2 Employment in Nonagricultural Establishments and Temporary HelpSupply Services, by Sex, 1982 to 1985
Nonagricultral Temporary HelpEstablishments Supply Services(thousands) (thousands)
Year Total Women Total Women
Annual average1982 89,566 39,052 400.9 255.71983 90,138 39,812 471.8 302.91984 99,156 41,831 630.8 398.9
1983Jan 87,590 38,849 387.2 254.9Feb 87,598 38,945 379.5 248.5Mar 88,208 39,225 410.1 266.1Apr 89,064 39,509 433.6 279.3May 89,921 39,774 447.9 287.1June 90,738 39,886 461.1 294.5July 90,112 39,243 483.4 314.0Aug :,3,842 39,097 498.5 317.4Sept 91,485 40,237 519.3 328.3Oct 92,049 40,669 535.1 338.0Nov 92,406 40,998 534.3 335.6Dec 92,645 41,316 571.2 370.6
1984Jan 91,065 40,590 547.0 352.5Feb 91,612 40,862 551.6 353.4Mar 92,234 41,210 575.2 365.4Apr 93,234 41,390 597.9 379.5May 94,063 41,584 621.3 392.5June 95,003 41,735 633.6 394.0July 94,236 41,966 649.7 406.8Aug 94,486 42,094 669.8 419.2Sept 95,358 42,246 685.3 430.0Oct 95,894 42,441 687.0 432.7Nov 96,215 43,142 678.0 427.9Dec 96,308 43,313 675.7 433.2
1985Jan 94,628 42,595 644/ 410.8Feb 94,851 42,785 637.5 402.1
SOURCE: Bureau of Labor Statistics (1984a:Table 309; 1984b:Tables B-2 andB-3; 1985a:Tables B-2 and B-3; 1985c:156).
29 ?

280 RESTRUCTURING WORK
TABLE 3 Survey Results: Nurses' and Homemakers' Most Important Reason forWorking at a Particular Temporary H&j) Firm (percent)
Reason
EntireSample(N=1,101)
RegisteredNurses orVisitingNurses(N=262)
LicensedPracticalNurses(N=221)
Nurses'Aides(N=408)
Home -makers(N=210)
Variety in work,that is, frequentchanges inassignment 16.6 8.6 13.1 21.5 20.6
A stopgap measureuntil I can obtaina permanent job 8.2 9.2 8.0 7.2 9.0
Freedom to schedulemy work in aflexible manner 60.2 70.3 65.3 55.9 50.3
Employment duringschool vacation 1.0 0.8 0 0.8 2.6
Other 14.1 10.9 13.6 14.6 16.9
SOURCE: Gannon (1984).
Nor is the appeal of temporary work, as industry spokespeoplesuggest, the possibility of increased variety in work. A studyof a large national firm that hires more than 50,000 health caretemporary employees each year found that more than 60 percent ofthe temporary workers gave freedom to schedule work in a flexiblemanner as the most important reason for working at a temporaryhelp firm (Gannon, 1984; see Table 3). Less than 17 percent chosetemporary work for the variety it provides, and only 8 percentwere doing it until they obtained a permanent job. Flexible workschedules are important to many women who have both work andhome responsibilities, but these jobs are not widely available. A1977 American Management Association survey estimated that12.8 percent of private sector organizations have some kind offlextime program (Women's Bureau, U.S. Department of Labor,1983:38). Some women are turning to temporary help agencies toarrange flexible work schedules.
2 L.J

EILEEN APPELBAUM 281
The availability of benefits for women doing temporary workvaries, though most receive very few. Temporary jobs with thefederal government carry no fringe benefits except social securitycontributions, and most workers hired directly by private-sectorfirms appear to face the same situation. Workers employed bytemporary help agencies are covered by Workers' Compensationaccording to Sacco, and after a certain number of hours (requiredhours vary by state) they are eligible for unemployment compen-sation as well. Some temporary employment agencies offer fringebenefits on a prorated basis. Manpower Temporary Services ap-pears to have one of the better benefits packages. In Philadelphiathe agency has a group insurance program for its workers as wellas paid vacations, holidays, and a training program to help cleri-cal workers learn to operate automated office equipment (Collins,1985).
Training for employees of temporary help agencies also varieswidely. Some companies provide no training and require 6 monthsor more of hands-on experience. Good People Office AutomationTemporaries in New York City, Word Processors Personnel Servicein Menlo Park, Calif., Personnel Pool of America Inc. in FortLauderdale, Fla., and Victor Temporary Services of Northbrook,Ill., are in this category. Some companies will provide trainingto enhance proven skills of experienced workers. Norrell ServicesInc. of Atlanta and Western Temporary Services in Walnut Creek,Calif., have such a policy. Several temporary help agencies providetraining in word processing and office automation to their clericalworkers: Kelly Services of Detroit, which has equipped 360 oftheir 500 offices to teach basic word-processing operations for avariety of PCs; Olsten Temporary Services of Westbury, N.Y.,which provides training at 45 office-automation training centers;and Manpower Temporary Services of Milwaukee, which providestraining in word processing and in business applications of personalcomputers (using IBM PCs). Manpower Temporary Services has1,050 offices nationwide, and its goal is to have training facilitiesin all of them (Flamingo, 1984).
RELATIONSHIP TO NEW TECHNOLOGY
Employers are turning to the use of temporary workers pri-marily to keep labor costs down and to achieve maximum flexibilityin scheduling work. The use of temporary workers reduces labor
2 (4

282 RESTRUCTURING WORK
costs in two ways. Pools of temporary workers function as anemployment bufferavailable to meet surges in the demand forgoods and services and easily dispensed with when demand de-clines. In addition, temporary workers typically receive few fringebenefits and very little access to job training The constraintson employers with respect to job assignment layoffs, hiring andpromotion policies, fringe benefits, and retirement benefits thatexist as a result of both explicit and implicit contracts betweencompanies and their full-time employees are waived in the case oftemporary workers. As a result employers enjoy complete flexibil-ity in scheduling these workers and are free to use them as a bufferor reserve to accommodate increases or declines in demand.
Technology plays only an indirect role in this process. Com-panies that have invested in costly office-automation equipmentare reluctant to have it stand idle. They rely on temporary helpagencies for workers experienced with word processing to replaceabsent workers. High-tech manufacturing firms face seasonal andcyclical variations in the demand for silicon chips and computers.As much as 30 percent of the work force of some Silicon Valleymanufacturers are obtained from temporary help agencies. Per-manent employment at Apple Computer Inc., for example, is justover 5,400. Employment at Apple rises to 7,000, however, as thecompany adds 1,600 temporary workers for the Christmas sea-son. Finally, the temporary help service agencies themselves arehighly automated and have computerized their rosters of tempo-rary workers. This has increased the number of workers a tempo-rary agency can handle and the number of employer requests towhich it can respond. Office automation has expedited the rapidgrowth of this industry. Thus, while technology has facilitatedthe expansion of temporary work, cost containment is the drivingforce behind its rapid growth.
PART-TIME WORK
While most women who work are employed full time, a sizableminority of working women work less than 35 hours a week. InMarch 1985, 28.9 percent of employed women worked part time,22.7 percent of them voluntarily choosing shorter hours (Employ-ment and Earnings 32(4), 1985:Table A-9). Adult women havefrequently sought part-time employment as a means of meeting
2(--,4L,

EILEEN APPELBA UM 283
home and child care responsibilities while contributing to house-hold income. Family and home responsibilities are the most com-mon reasons cited by women for working part time, although thisreason has declined in importance since 1960 (Deutermann andBrown, 1978). Economic theory notwithstanding, the choice ofpart-time employment cannot be assumed in all cases to reflectthe preferences of women fcr fewer hours of work. For womenwith children, decisions regarding the number of hours of work areseverely constrained by the lack of affordable, quality child care. Itis currently estimated that there is just one day-care position openfor every 10 children who need placement, and that the averagecost of day care for 2 children is $4,000 a year (U.S. Commissionon Civil Rights, 1983). One study of a national sample of motherswith children under the age of five found that one-fourth of hoseemployed part time felt they were prevented from working morehours by the unavailability of suitable day care (Presser and Bald-win, 1980). On the demand side of the labor market, the growthof part-time employment has paralleled the growth of retail tradeand service industries. Of the more than 18 million part-time jobsfilled on average in each month of 1984, nearly 13 million were inwholesale and retail trade or in services (Employment and Earn-ings 32(1), 1985:Table 32). Thus, nearly 71 percent of part-timejobs are found in these two industry groupings.
TRENDS IN PART-TIME EMPLOYMENT
The growth of part-time work since 1954, the first year forwhich data on the number of such workers were collected, is welldocumented. Using data from the CPS, Deutermann and Brown(1978) found that the number of part-time employees in nonagri-cultural industries increased at an average annual rate of nearly4 percent, more than double the rate for full-time workers. Asa result, part-time workers increased from 15.4 percent of em-ployed workers in May 1954 to 22.1 percent in May 1977. Forwomen the corresponding increase was from 27.2 percent to 32.6percent. Since 1977, however, the proportion of workers employedpart time has been virtually unchanged, except for the increasein the number working part time for economic reasons during the1982 recession. Data on part-time employment reported in Table4, while also derived from the CPS, are not strictly comparableto those reported above because Deutermann and Brown treat
293

284 RESTRUCTURING WORK
those on full-time schedules who work less than 35 hours a week aspart-time workers. Among nonagricultural workers, 15.8 percentworked part time in May 1967; 26.9 percent in the case of womenworkers. By May 1977 these figures had risen to 19.0 percent forpart-time employment, 29.9 percent in the case of women workers.The proportion employed part time in May 1978 was again 19.0percent and was virtually unchanged at 19.5 percent in May 1980and May 1984 (see Table 4). For women, there has been a slightdecrease in the proportion employed part time, from 30.0 percentin May 1978 to 29.6 percent in May 1980 and 28.8 percent in May1984 (see Table 4).
A more dramatic decline has occurred in the proportion ofwomen working part time voluntarily. At its peak in May 1970,26.0 percent of employed women worked part time voluntarily,but this figure declined to 24.3 percent in 1980 and 22.7 percent in1984 and 1985. Corresponding to this, the proportion of employedwomen working part time because they could not find full-time jobsincreased from 2.7 percent in May 1967 to 3.6 percent in May 1970,4.5 percent in May 1978, 6.1 percent in Mai 1984, and 6.2 in 1985(see Table 4). Thus, the proportion of women desiring part-timework is decreasing, and there are currently about 3 million womenemployed part time who want full-time schedules. Involuntarypart-time employment of women increased 300 percent since 1967,while total employment increased by 77 percent.
Monthly figures on part-time employment are only part of thepicture. The number of workers who experience some involuntarypart-time employment during the year, either because of slackwork on their regular jobs or because they can only find part-time work, is much higher than this. In 1983, the last year forwhich such data are available, the number of workers with someinvoluntary part-time employment totaled 14.9 million, up from11.5 million in 1979 (Bureau of Labor Statistics, 1985b:5). Ofthese, approximately 9 million were wcznen.1 The public policyinterest in part-time work is related to the poor economic positionof part-time workers. These workers typically receive few fringebenefits and they earn, on average, only $4.50 an hour compared
1 About 65 percent of part-time workers in 1983 were women. Assumingthat this percentage also applies to workers with some involuntary part-timeemployment during the yer..r, then the number of such women was well over9 million.

EILEEN APPELBAUM 285
with $7.80 for full-time workers. Involuntary part-time work isoften associated with poverty status. In 1983, 19.1 percent ofthose with some involuntary part-time employment during theyear lived in households with household incomes below the povertylevel compared with 13.4 percent in 1979. Among women whomaintain families, the proportion of those with some involuntarypart-time employment in 1983 whose family income for the yearwas below the poverty level was 48.0 percent, 62.7 percent in thecase of black women (Bureau of Labor Statistics, 1985b:5, 18).In addition to receiving lower pay and benefits, part-time workersare stereotyped as having a low commitment to their jobs andhence they face more difficult career paths. Part-time jobs andthe part-time workers who hold them are often viewed as marginalby employers (Rosow and Zager, 1981). An important concern,then, is whether technological conditions are increasing part-timeemployment.
PART-TIME EMPLOYMENT IN INDUSTRIES AND OCCUPATIONSAFFECTED BY NEW TECHNOLOGIES
Sorting out the effects of technological change on part-timeemployment is not easy because of the limitations inherent inavjable data (Hunt and Hunt, 1985). Analytically, one can makethe argument that the importance of part-time work in retailtrade and services but not in goods-producing industries can beexplained by the fact that goods can be produced at an even paceand held in inventories to meet demand, whereas services cannotbe inventoried but must be provided on demand. When demandis uneven, or must be met outside the normal working day or onweekends, employers favor part-time employment as a means offitting the work force to the work load. Moreover, Nol len et al.(1978) found that employers tend to view part-time work as astrategy for reducing labor costs. In part, this is accomplishedby substituting part-time workers fa, overtime work by full-timeemployees; but part-time employment is also used to reduce laborcosts by paying part-time workers less than full-time workers andby excluding them from some or all fringe benefits. However,Nol len and his colleagues round that employers generally hold theview that jobs involving continuous-process technologies are notsuited to part-time employment. These include, in particular,jobs in manufacturing industries and employment in supervisory,
2 Li 3

TABLE 4 Full-Time and Part-Time Employment of the Civilian Labor Force, Selected Dates,1967-1984 (in thousands)
Year, Sex, and TotalEmployment Part Time Labor PercentStatus Full Time Involuntary Voluntary Total Force Part Time
May 1967Total 61,978 1,573Men 42,605 851Women 19,373 722
VoluntaryInvoluntary
May 1970Total 64,413 2,128
Men 43,700 1,080Women 20,713 1,048
VoluntaryInvoluntary
May 1977Total 72,963 3,237
Men 47,347 1,564Women 25,.,16 1,673
VoluntaryInvoluntary
May 1978Total 76,000 3,212
Men 49,014 1,485Women 26,986 1,727
VoluntaryInvoluntary
10,086 11,659 73,637 15.83,688 4,539 47,144 9.66,398 7,120 26,493 26.9
24.22.9
11,816 13,944 78,357 17.84,184 5,264 48,964 10.87,632 8,680 29,393 29.5
26.03.6
13,842 17,079 90,042 19.04,614 6,178 53,525 11.59,228 10,901 36,517 29.9
25.24.7
14,639 17,851 93,851 19.04,812 6,297 55,311 11.49,827 11,554 38,540 33.0
2 q J 25.54.5

May 1980Total 78,776 4,212 14,813 1 325 97,801 19.5Men 49,240 1,973 4,613 6,586 55,826 11.8Women 29,536 2,239 10,200 12,439 41,975 29.6
Voluntary 24.3Involuntary 5.3
May 1982Total 79,141 5,808 15,009 20,817 99,958 20.8
Men 49,069 2,956 4,742 7,698 56,767 13.6Women 30,072 2,852 11,125 13,977 44,049 31.7
Voluntary 25.3Involuntary 6.4
May 1984Total 84,595 5,292 15,209 20,501 105,096 19.5
Men 51,841 2,478 4,742 7,220 59,061 12.2Women 32,754 2,814 10,467 13,281 46,035 28.8
Voluntary 22.7kvoluntary 6.1
March 1985Total 84,758 5,466 15,544 21,010 105,768 19.9
Men 51,357 2,571 4,845 7,416 58,773 12.6Women 33,401 2,895 10,699 13,594 46,995 28.9
Voluntary 22.7Involuntary 6.2
SOURCE: Derived from Employment and Earnings (1985a, 1984b, 1982a, 1980, 1978a, 1977a, 1967:Table A-7, A-8, or A-9).
3 0 i 1

288 RESTRUCTURING WORK
management, and executive occupations where the work to beperformed requires continuity. On the other hand, job technologiesinvolving discrete tasks or repetitive, tedious, or stressful work arebelieved by managers and employers to be particularly well suitedto part-time employment.
An implication of this argument is that to the extent that com-puter and con ation technologies are used to fragment workor to unbundle ,iroduction process and allow discrete parts ofthe process to be done at locations remote from one another, op-portunities for part-time employment increase. Thus, one wouldexpect part-time employment of professional workers and clericalemployment in office industries, such as insurance or public ad-ministration, to increase as well. Retrospective data on the workexperience of men and women during the year provide an overviewof where individuals have found jobs. These data are available forpart-time work by industry for all persons with work experienceduring the year for the period 1975 through 1983. Table 5 reportsthe proportion of those with work experience who were employedpart time for all workers, and separately for men and women, inbroad industrial groups likely to be affected by office-automationtechnologiesfinance, insurance, and real estate; business andrepair services; other professional services; and public adminis-tration. The proportion of workers with part-time employment atsome time during the year is, of course, higher than the proportionemployed part time during May of that year. It increases from 20.8percent in 1975 to 22.8 percent in 1983. Most of the increase is inthe part-time employment of men. This is not surprising since thetechnology reduces the importance of continuity in jobs tradition-ally held by men. Opportunities for free-lance professional workhave increased, especially for computer programming specialists.This is reflected, in part, in the growth of part-time employmentamong self-employed men from under 16 percent in 1975 to morethan 21 percent in 1983.
The part-time employment of women with work experienceis virtually unchanged between 1975 and 1983 when all nonagri-cultural employment is considered. This may not be surprisingin light of the increased commitment of women to paid work.However, the fact that part-time employment of women in officeindustries does not show a relative increase, except for the cate-gory "other professional services," is unexpected. The part-timeemployment of women in that industry increased from 28.6 percent
301

TABLE 5 Part-Time Employment of Men and Women with Work Experience During Year by Selected Industries for Selected Years,1975-1983
1975 1977 1979 1981
i9Total with Total with Total with Total with Total withWork Work Work Work WorkIndustry Expenence Part Time Experience Part Time Experience Part Time Experience Part Time Experience Part TimeGroup (thousand.) (percent) (thousands) (percent) (thousands) (percent) (thousands) (percent) (tho .sands) (percent)
Nonagriculturalindustnes 97,088 208 102,937 21 2 111,070 20 9 112,880 22 2 113,792 22 8Men 55,113 11 9 57,613 12 2 61,030 12 1 61,698 13 5 61,639 14 3Women 41,976 32 6 45,325 32 6 50,040 31 6 51,181 32 7 52,152 32 8
Finance, insurance,and re 1 estate 4,748 13 7 5,238 13 9 5,890 15 0 6,238 11 3 6,559 13 7Men 2,127 9 1 2,236 9 5 2,254 10 2 2,475 11 3 2,665 10 0Women 2,621 17 4 3,002 17 1 3,637 18 0 3,763 16 3 3,894 16 3
Business and repairservices 2,690 23 1 3,221 22 1 3,603 22 0 4,110 22 6 4,887 22 7Men 1,750 16 5 2,049 11 S 2,212 15 1 2,563 15 5 2,824 16 IWomen 940 36 3 1,172 35 4 1,392 32 9 1,547 34 4 2,063 31 7
Other professional 1,990 20 2 2,214 19 9 2,384 18 6 2,774 18 9 3,191 24 5Men 1,025 12 1 1,132 1 1 4 1,209 12 1 1,410 12 7 1,611 11 7Women 965 28 6 1,082 28 9 1,174 25 3 1,364 25 2 1,580 37 7
Public administration 5,560 10 1 5,649 11 : 6,057 10 7 5,911 11 6 5,407 9 2Men 3,658 5 1 3,628 5 9 3,770 5 8 3,597 6 2 3,185 5 1Women 1,903 19 7 2,021 20 6 2,287 18 7 2,314 19 9 2,222 14 9
Self-employed 5,724 25 6 8,402 26 3 7,068 24 9 7,378 29 2 7,668 29 8Men 4,177 15 7 4,546 16 5 4,863 14 9 5,007 19 2 5,136 20 7Women 1,548 52 5 1,8:7 50 3 2,205 46 8 2,371 50 4 2,532 48 1
SOURCE Bureau of Labor Statistics (1976, 19786, 19826) and unpublished data for 1979 and 1983
3 9 3

290 RESTRUCTURING WORK
to 37.7 percent between 1975 and 1983. In contrast, in finance,insurance, and real estate, it decreased from 17.4 percent to 16.3percent; in business and repair services it decreased from 36.3percent to 31.7 percent; and in public administration it decreasedfrom 19.7 percent to 14.9 percent over the same period. If therehas been an increase in the number of women doing back-office anuother routine processing work on part-time schedules as a result ofthe computerization of such tasks, it has apparently been offset bydeclines in the number working part time at other tasksby thereplacement of part-time bank tellers on evenings and weekendsby automatic teller machines, for example.
While retrospective data are informative with respect to thework experience of the population, monthly employment data pro-vide a clearer picture of the actual jobs in the economy. Table 6indicates the percentage of men and women workers in each indus-try and in the labor force as a whole who are employed part timefor 1970, 1980, and 1984. Tables 7 and 8 report the percentageof men and women workers in each occupation who are employedpart time for the same time period.2 Given the standard definitionof part-time workless than 35 hours a weekthe data on personsat work do not show an increase in the proportion of women whohold part-time jobs as a result of the implementation of technol-ogy. Nor do they show a major restructuring of women's jobs ingeneral, with part-t:-..,. work for women increasing more rapidlythan full-time work. Overall, the proportion of women workingless than 34 hours a week declined from 35.0 percent in 1970 to32.6 percent in 1984, with most of the drop occurring between1970 and 1980 (see Table 6). In each of the industries most likelyto be affected by the adoption of new technologymanufacturing,transportation, and public utilities; finance, insurance, and realestate; business and repair services; other professional services;and public administrationthe proportion of women working parttime declined during this period. Only in retail trade and personalservices did the proportion of women in the industry working part
2 Several points should be kept in mind while interpreting Tables 6, 7,and 8: (1) the tables report data for wage and salary workers only andexclude the self-employed; (2) some jobs which are scheduled for less than35 hours are full-time jobs; (3) hours are not rep,rted for employed workerswho are not at work, so it is impossible to know whether they work lessthan 35 hours a week. I estimate that about 10 percent of the employednonagricultural labor force is affected by these caveats.

EILEEN APPELBA UM 291
TABLE 6 Part-Time Employment of Wage and Salary Workers, by Industry andSex, for 1970, 1980, and 1984 (percent)
Employed Part Time (1 to 34 hours per week)
Industry1970 1980 1984Men Women Men Women Men Women
All industries 18.3 35.0 16.4 33.5 15.9 32.6
Mining 12.5 19.1 8.9 15.1 12.5 19.1Construction 24.9 34 2 21.0 31.4 19 4 31.9Manufacturing 13.6 25.2 10.1 19.7 9.2 17.3Transportation and
public utilities 14.7 27.8 12.9 22.6 11.5 19.4Trade 23.1 45 9 23.3 48.5 23.5 47.7
Retail 26.6 47.7 28.4 51.8 28.8 50.9Finance, insurance,
and real estate 16.4 26.4 14.3 23.2 12.4 20.1Service 22.6 37.6 20.9 35.9 19.9 35.7
Business and repair 19.7 39.5 18.5 37.1 17 9 35.2Personal 20.7 40.4 23.2 42.8 20.9 41.8Other professional 18.1 33.5 15.5 28.1 12.4 27 0
Public administration 17.8 31.6 14.0 27.8 12.8 23.8
NOTE: Percentages are based on data for wage and salary workersexcluding agricultural and private household workers.
SOURCE: Derived from Bureau of Labor Statistics unpublished monthlydata; annual averages.
time actually increase, from 47.7 percent to 50.9 percent in retailtrade and from 40.4 percent to 41.8 percent in personal servicesbetween 1970 and 1984 (see Table 6). The situation for male wageand salary workers is quite similar. The number of part-time jobsin the economy has increased substantially since 1970 but, exceptfor retail trade and personal services, the growth of jobs in whichwomen work less than 35 hours a week has been slower than thegrowth of full-time jobs.
The data in Table 6 are consistent with the retrospectivedata in Table 5. Both show declines in the proportions of womenworking part time in industries affected by office automation-finance, insurance, and real estate; business and repair services;and public administration. Only the "other professional" categoryregisters a divergence, with the retrospective data showing anincrease in the last year reported (1983) and persons-at-work datashowing a consistent decrease in the part-time employment of

292 RESTRUCTURING WORK
TABLE 7 Part-Time Employment by Occupation and Sex of Worker in 1970, 1980,and 1982
Percent Employed Part Time (1 to 34 hours per week)
Occupation1970 1980 1982Men Women Men Women Men Women
White-collar workers 7.2 24.0 7.8 24.3 8.5 25.5Professional and
technical 6.7 22.8 7.0 21.2 7.5 23.0Managers and admin-
istrators 3.3 13.2 3.8 12.4 4.2 12.3Sales workers 13.5 48.4 13.3 49.2 14.8 49.5Clerical workers 11.0 20.9 13.6 23.3 14.6 24.8
Blue-collar workers 9.7 17.6 11.3 19.3 13.8 22.3
Service workers(except privatehousehold) 21.7 38.2 27.4 45.0 28.4 47.2
NOTE: Excludes farm occupations and private household workers.
SOURCE: Derived from Bureau of Labor Statistics (January 1971:133; January19816:192; January 19836:170); data are annual averages of monthly data.
TABLE 8 Part-Time Employment by Occupation and Sex of Worker in 1984
Percent Employed Part Time(1 to 34 hours per week)
Occupation Men Women
Managerial, professional 5.7 18.2Technicians 6.7 20.3Sales 12.4 43 0Administrative support,
including clerical 11.7 21.0Service, except
household 27.3 46.7Precision production,
craft, and repair 8.3 14.5Operators 13.9 19.8
NOTE: Nonfarm occupations only. Occupational categories changed in 1983.Data are not comparable to those in Table 8.
SOURCE: Derived from Bureau of Labor Statistics (January 1985a:Table 34);values are annual averages of monthly data.

EILEEN APPELBA UM 293
women. The overall figures for part-time work are also quitesimilar, with 32.6 percent of the women at work in 1984 workingless than 35 hours and 32.8 percent of women with work experiencein 1983 having held part-time jobs.
The proportions of men and women working part time in themajor occupational groupings are examined in Table 7. The in-crease in part-time work for men again shows up quite clearly, withthe proportion of men working part time increasing in every majoroccupational category. The largest increase occurred among maleclerical workers, where the proportion working part time increasedfrom 11.0 percent to 14.6 percent; among male blue-collar workers,where it increased from 9.7 percent to 13.8 percent; and amongmale service workers, where it increased from 21.7 percent t" 28.4percent between 1970 and 1982. These occupations also registeredthe largest increases in the proportion of women working parttime. A comparison of Tables 6 and 7 indicates that the increasein the proportion of clerical workers employed part time has nottranslated into an increase in part-time work in industries such asbusiness services; public administration; and finance, insurance,and real estate. The spread of office automation technologies inthese industries has reduced clerical labor requirements per unit ofoutput and, hence, the relative importance of clerical occupations(Appelbaum, 1984).
HOURS OF WORK OF PART-TIME EMPLOYEES
It has been suggested that expected increases in part-timework in office industries do not show up in comparisons of thosewho work less than 35 hours a week with those who work 35hours or more because the real change involves a decline in hoursfor those who work 30 to 34 hours a week and an increase inthe proportions working less than 30 hours. Anecdotal evidenceindicates that when clerical jobs are moved from central cities torural or suburban areas, companies cut hours of work substantially,both to attract women whose hours of work are limited by theirfamily responsibilities and to avoid paying these workers the fringebenefits they make available to employees working more than somecritical number of hours per week. If true, this suggests that thereshould be some variation over time in the proportion of part-timeemployees working 1 to 14 hours, 15 to 29 hours, or 30 to 34 hoursper week.
3,i

294 RESTRUCTURING WORK
This is, in fact, the case. Perhaps the widely held percep-tion that part-time work for women is increasing arises becausethe proportion working 15 to 29 hours per week has increased,with most of the change occurring during the decade of the 1970s.The proportion of all working women employed 15 to 29 hours in-creased from 15.9 percent in 1970 to 17.1 percent in 1980, while theproportion employed 30 to 34 hours decreased from 11.8 percentto 9.9 percent. The change can be seen more clearly if only womenworking less than 34 hours are considered. Among women workingpart time, the proportion employed 15 to 29 hours increased from45.5 percent in 1970 to 51.0 percent in 1980 and 52.0 percent in1984. The proportion working 30 to 34 hours decreased from 33.6percent to 29.5 percent over the same time period (see Table 9).
Among women working part time, increases in the propor-tions working 15 to 29 hours were registered in every industryaffected by new technologymanufacturing, transportation, andpublic utilities; finance, insurance, and real estate; business andrepair services; other professional services; and public administra-tion. Simultaneously, the proportion of women working 30 to 34hours declined in every affected industry (Table 9). A few of theseindustries registered declines in the proportion of women working1 to 14 hours as well. Manufacturing, transportation, and publicutilities; finance, insurance, and real estate; and public adminis-tration showed increases in this category between 1970 and 1980.However, the proportion working fewer than 15 hours in finance,insurance, and real estate and in public administration has de-clined since 1980. Most of the decline in very short hours (1 to 14hours) occurred in retail trade and services.
Thus, while the proportion of part-time jobs in many indus-tries has declined since 1970 when the conventional definition ofpart-time workless than 34 hours a weekis employed, a differ-ent picture emerges when jobs employing women 15 to 29 hours aweek are considered. This is where the continued growth of short-hour work is evident, particularly in industries affected by officeautomation. It seems likely that jobs in which the usual work weekis 30 to 34 hours either are full-time jobs or are considered quiteclose to full-time work both by the women who hold them andthe companies that employ them. Hence, the shift in part-timework to jobs in which the work week is 15 to 29 hours probablyrepresents an increase in jobs without the protections and benefits
3 -,/

TABLE 9 Percentage Distribution of Part-Time Women Workers Across Hours per Week Worked for Major IndustryGroups in 1970, 1980, and 1984
Hours per week: 1970 Hours per week: 1980 Hours per week: 1984Industry 1-14 15-29 30-34 1-30- 1-14 15-29 30-34 1-35.1 1-14 15-29 30-34 1-35-
All industries 21.0 45.5 33.6 100.0 19.3 51.0 29.6 100.0 18.5 52.0 29.5 100.0
Mining 14.2 28.6 57.1 100.0 16.7 50.0 33.3 100.0 9 5 52.3 38.0 100.0Construction 29.8 43.3 26.9 100.0 23.2 45.6 31.2 100.0 23.6 50.7 25.7 100.0Manufacturing 10.1 36.2 53.7 100.0 11.2 42.0 46.8 100.0 12.8 42.6 44.6 100.0Transportation and
public utilities 14.7 46.3 38.9 100.0 15.5 52.7 31.8 100.0 18.6 46.9 34.5 100.0
Trade 24.3 52.0 23.7 100.0 20.6 56.7 22.7 100.0 17.9 58.1 23.9 100.0Retail 24.6 52.8 22.6 100.0 20.8 57.1 22.1 100.0 17.9 58.4 23.7 100.0
Finance, insurance,and real estate 14.2 43.1 42.7 100.0 14.8 50.1 35.1 100.0 13.9 49.5 36.6 100.0
Service 24.9 46.2 28.9 100.0 21.6 50.1 28.2 100.0 21.0 50.7 28 3 100.0Lusiness andrepair 24.0 43.3 32.7 100.0 20.6 53.5 25.9 100.0 21.4 51.5 27.1 100.0
Personal 21.7 50.2 28.1 100.0 20.2 50.2 29.6 100.0 18.9 51.4 29.7 100.0Other professional 27.1 44.7 28.2 100.0 22.1 52.3 25.6 100.0 22.6 50.5 26.9 100.0
Public administration 14.7 34.7 50.6 100.0 16.7 39.5 43.7 100.0 12.4 40.8 46.8 100.0
NOTE. Percentages are based on data for wage and salary workers excluaing agricultural and private household workers
Numbers may not add to 100.0 due to rounding.
SOURCE: Derived from Bureau of Labor Statistics unpublished monthly data; annual averages

296 RESTRUCTURING WORK
associated with full-time work and a worsening of employmentopportunities for women.
MULTIPLE JOBHOLDING
During the 1970s both the number and the proportion ofwomen holding more than one job increased substantially. Forwomen without a husband present, the increase was even moredramatic. By May 1980, the most recent year for which dataare available, 1.5 million women were multiple jobholders (Taylorand Sekscenski, 1981). Thus, 3.8 percent of employed women weremoonlighting in 1980 compared with 2.0 percent early in the 1960sand 2.2 percent in 1970 (see Table 10). Dual jobholding was lowerfor married women, with 3.4 percent of employed married womenholding more than one job, and higher for women who had sole orprinciple responsibility for their own support. Among employednever-married single women, 3.9 percent held more than one jobin 1980, while among those who were separated, divorced, orwidowed, 4.6 percent were dual jobholders (Taylor and Sekscenski,1981). The proportion of multiple jobholders who are womenmore than doubled over the 1970s, from 16 percent in 1970 to 33percent in 1980. These changes have been reported as "consistentwith the increased proportion of women in the total work force"(Women's Bureau, U.S. Department of Labor, 1983:38). In fact,the number of women in the labor force increased 44 percentbetween March 1970 and March 1980 (Women's Bureau, 'U.S.Department of Labor, 1983:Table I-8), while the number of womenwho are multiple jobholders increased 144 percent during thoseyears (see Table 10). Thus, multiple jobholding has become anincreasingly important phenomenon among women.
The growth in multiple jobholding occurred mainly amongwhite women. The proportion of black women holding more thanone job was 2.2 percent in 1969, 2.0 percent in 1979, and 2.6percent in 1980 (Sekscenski, 1980; Taylor and Sekscenski, 1981).But black women were more likely than white to report thateconomic reasonsmeeting regular expenses or paying off debtswere their main motivation for moonlighting. Nearly three-fifthsof black women, but only two-fifths of white women, gave this astheir main reason for working two jobs. Overall, about 42 percentof women hold multiple jobs for economic reasons compared with
3 0

EILEEN APPELBA UM 297
TABLE 10 Multiple Jobholding Rates for All Workers, Men, and Women, SelectedYears, May 1970 to May 1980
All Female Women asTotal Multiple Multiple Percent of MultipleEmployed Jobholders Jobholders All Multiple Jobholding Rate
Year (thousands) (thousands) (thousands) Jobholders All Men Women
1970 78,358 4,048 636 16 5.2 7.0 2.21974 85,786 3,889 867 22 4.5 5.8 2.61976 87,278 3,948 911 23 4.5 5.8 2.61977 90,482 4,558 1,241 27 5.0 6.2 3.41978 93,904 4,493 1,281 29 4.8 5.8 3.31979 96,327 4,724 1,407 30 4.9 5.9 3.51980 96,809 4,759 1,549 33 4.9 5.8 3.8
SOURCES: Brown (1978), Rosenfeld (1979), Sekscenski (1980), and Taylor andSekscenski (1981).
35 percent of the men (Sekscenski, 1980; Taylor and Sekscenski,1981).
The increase in multiple jobholding appears to be related tothe increase in the number of women who have primary economicresponsibility for themselves and/or their families and to the dif-ficulty of meeting this responsibility while working at a part-timejob. Part-time workers in 1981 averaged 19.0 hours per week, 46percent of the hours worked by full-time workers. Their earnings,however, averaged only 28 percent of those of full-time workers.Among part-time clerical workers, most of whom are women, theaverage work week was 50 percent of full-time hours, while earn-ings were 38 percent of full-time earnings (Mellon and Stamos,1982:Table 5). These figures have remained virtually unchangedduring the last few years. Women working part-time in the thirdquarter of 1984 still earned 38 percent of what women who workedfull time earned (Employment and Earnings 32(1), 1985:TablesA-73 and A-74). Almost half of all women who were multiple job-holders held two part-time jobs. In contrast, less than one-fifth ofmen who held more than one job had two part-time jobs. About 82percent of the men who were multiple jobholders had at least onefull-time job, compared with 54 percent of the women (Sekscenski,1980; Taylor and Sekscenski, 1981).
The relationship of multiple jobholding to technology is tenu-ous at best. Some companies, particularly in manufacturing, have

298 RESTRUCTURING WORK
added non-day shifts of part-time and full-time workers in orderto recover the costs of sophisticated new equipment more rapidly,both because the equipment is more costly, and because it is ex-pected to become obsolete more quickly (ILO Symposium, 1978).This has probably had the effect of increasing women's opportu-nities for multiple jobholding somewhat. One study found thatone-fifth or more of women in operative occupations worked non-day shifts. However, the study also found that most occupationsin which women work non-day shifts are unrelated to the use ofnew kinds of equipment. These include nurses and other healthworkers; cashiers; and women working in cleaning, food, personal,and protective services (Presser, 1984:Table 4).
AT-HOME WORK
While cottage industry and at-home work for women has along history in the United States, telecommuting or electronicat-home work is a very recent innovation.3 As recently as 1981,only 11 companies that employed workers at home on terminals orword processors could be identified (Pratt, 1984). Partly becauseit is so new, it affects the smallest number of workers of any of thealternative work styles in which women can be found. Its potential,however, is quite large. Elisabeth Allison of Data Resources, Inc.,estimates that there are currently 15 million jobs that could bedone at home; Jack Nil les of the University of Southern Californiapredicts that within a decade 5 million white-collar workers couldbe working mainly at home (BusineasWeek, 1982).
The growth of telecommutingdefined by Nilles as "a total orpartial substitution of the daily commute by communication viaa computer terminal" (Pratt, 1984:1-2)has been rapid, but thenumber of people involved is still small. BusinessWeek (1982) es-timates that there were 35 home worker programs for white-collarworkers in 1982, involving perhaps 600 workers. Larger estimatesput the number of workers employed as telecommuters at 10,000,though Nilles reports that no more than 1,000 of these were full-time telecommuters (Kingston, 1983). The most recent estimateis that there are about 250 companies with approximately 10,000
3 This section is based in part on the paper, "A Sociological Reviewof Telecommuting," by Maureen Martella, a graduate student at TempleUniversity.

EILEEN APPELBA UM 299
employees working at home using computer technologies. Between20 and 30 of themincluding New York Telephone, American Ex-press, Walgreens, and McDonaldsare planning to expand theirprograms (Chin, 1984).
DISTINCTIONS BETWEEN CLERICAL ANDPROFESSIONAL AT-HOME WORK
While telecommuting is a recent phenomenon, and still notlarge, it has some very noticeable characteristics. It is alreadyquite clear that there are important differences between clericaland professional electronic home work. Companies are adopt-ing telecommuter programs for professional employees to meetshortages of skilled personnel, such as computer programmers andanalysts, or to attract or retain skilled workers whose family orpersonal situation places constraints on the amount of time theycan spend in an office. The Travelers Insurance Company, forexample, has an experimental home work project that enableshighly skilled data-processing employees to do most of their workat home, spending between half a day and two days a week atthe office. According to an executive at Travelers, "The exper-iment is designed to help employees who have unique computerskills meet family and other responsibilities. It serves Travelers'business requirements by helping us keep top performers on thejob who might otherwise drop out of our workforce temporarily,or even leave permanently" (Mortenson, 1983:112). Time framesfor completing work and supervision of professional telecommutersare often based on "mutual trust and respect" (Olson, 1983a:185).
The situation for clerical workers is much different. Theyare more likely to be paid piece rates, less likely to receive fringebenefits, and are sometimes required to pay rent for the equipmentthey need to do the work. Thus, the Blue Cross Cottage KeyingProgram in Washington, D.C., pays its home workers 16 cents percompleted insurance claim. The women receive no benefits andmust deduct their own taxes, and in addition they are requiredto pay $95 every 2 weeks to rent the terminals they use (Chin,1984; Business Week, 1982). Supervision of off-site clerical workersis viewed as a problem by management. Companies deal withthis problem by giving clerical telecommuters discrete tasks thathave definite beginning and ending points and that can easily bemeasured and by paying piece rates. The 46 home office workers
<

300 RESTRUCTURING WORK
interviewed by Pratt (1984) were critical of the poor organizationof their work by the companies employing them, which they feltreduced their earnings.
Claims examiner is a skilled clerical position that Califor-nia Western States Life Insurance Company now fills with homeworkers hired as independent contractors. The company providescomputer terminals linked by telephone lines to the company'sdata-processing center to the claims examiners. The claims ex-aminers are independent contractors who are paid on a piece-ratebasis. They rent terminals from the company for $50 per monthand furnish their own supplies and equipment. The company isable to spot check the work of its at-home examiners as claimspayments are entered into the data system. "The task of auditingand managing the at-home examiners is simplified by having alltheir work instantly accessible in the home office via the com-puter system. The average at-home claims examiner representsmore than $1,000 in reduced costs to the company each month"(Mortenson, 1983:114).
Clerical home work is attractive to firms because of its poten-tial for reducing labor costs. The strategies adopted are a causefor concern to organizations such as 9 to 5, the National Asso-ciation of Working Women, which opposes electronic home workbecause it shifts overhead costs, including machinery rental, toemployees; it reduces hourly wages by switching to piece rates; itshifts costs of health and life insurance and social security and re-tirement income to individual workers; and it provides employerswith workers whom they can easily release (Gregory, 1983). Pro-ductivity is also an issue. Home workers, professional as well asclerical, have reported working during, outside of, and in additionto normal business hours and have complained about the pressureson them to work overly long hours (Kingston, 1983; Pratt, 1984).And 9 to 5 is concerned that employers are "experimenting withproductivity measures . . . to develop benchmarks as leverage toincrease pressures and intensify control over the main office workforce" (Gregory, 1983).
Though there are little data available on the productivityeffects of teleworking, corporate experiments with electronic homework indicate that it results in productivity increases among bothclerical and managerial teleworkers (Kraut, 1985). In reviewingthe evidence from these pilot projects, one researcher tentativelyconcluded that "the productivity gains associated with telework
313

EILEEN APPELBA UM
are probably the result of highly motivated, volunteer workersputting in more time on their jobs when they were working athome than when they were working in a conventional office. Thegains may not be sustained with more general use of teleworking byless-motivated workers who have no choice but to work at home"(Kraut, 1985:6).
ADVANTAGES OF TELEWORKING
The major advantages of electronic home work to employershave already been discussed. In the case of managerial and pro-fessional employees, firms turn to home work in order to retainor attract qualified workers with skills that are in short supplycomputer programmers and other skilled data-processing employ-ees, for example. Firms undertake clerical home work to reducelabor costs. This is often accomplished by setting piece-work ratesso that the employee receives no compensation for time spent set-ting up work, collecting work, delivering work, discussing workwith supervisors, or for difficulties encountered and time lost incompleting it satisfactorily. The limited data available suggestthat while professional home workers are usually permanent, full-time employees receiving full salaries and benefits, clerical homeworkers are rarely in this position. Instead they are usually part-time employees earning hourly wages or piece rates with reducedfringe benefits or no benefits at all (Olson, 1983b). The costsshifted from companies to workers as a result of the reduction infringe benefits, especially health insurance, can be substantial. Inaddition, as in the case of temporary workers, firms have substan-tial flexibility in scheduling home workers to meet high demandand not using them in off-peak periods, without incurring the costsassociated with layoffs and unemployment compensation.
In addition, some firms have achieved cost savings by shiftingoverhead costs and equipment rental to home workers. Workersmay be required to lease terminals or maintain their own comput-ers, provide office furniture, install dedicated telephone lines, andpay for higher telephone, heating, cooling, and electricity bills.Finally, as another advantage to companies, if the home workinvolves the use of a company's mainframe, it can be scheduledduring times of low computer utilization. The company realizessavings both from more intense use of computer resources andfrom a decreased need to expand computer capacity.
3 /i

302 RESTRUCTURING WORK
The advantages sought by workers who take jobs as electronichome workers include the opportunity to control their own timeand a reduction in child care costs. Control over the scheduling ofwork is an important benefit to some women who are balancinghome responsibilities with paid employment. In practice this ben-efit accrues mainly to professional employees, since professionalwork is less c'osely supervised and allows for more freedom inscheduling particular tasks. For some who cannot find affordablequality day care, teleworking may provide the only opportunity towork at all. Another benefit is tr at home workers save commutingtime and expenses as well as out, -g is for clothing, dry cleaning, andrestaurant meals. These savings, however, need to be comparedwith the costs that companies have shifted to employees workingat home in assessing the benefit to home workers. Finally, tele-working increases employment opportunities for those who cannoteasily work away from home on a daily basisthe handicapped,the elderly, and, to some extent, mothers of young children.
THE FUTURE OF HOME WORK
Despite its attractiveness to employers, explosive growth inthe number of home workers does not seem likely. Substantialinstitutional and managerial commitment is required to establish ahome work program. Employers express strong reservations aboutthe ability to maintain standards and adequately supervise workers(Cole, 1981; Sample, 1981). Professional employees are afraid thatworking at home will limit their career mobility since visibilityremains essential for prom,, ((lin, 1984; Olson, 1983). OfPratt's respondents, no or" Leiceorr.r,-wi,ing was beneficialto his or her career. Women. :Irra;.:1 that working at home wasdetrimental to their careers, u they viewed it as an alternativeto dropping out completely (Pratt, 1984). Low wages and lack ofjob security are critical issues for clerical telecommuters. Finally,federal, state, and local laws and restrictions currently regulatinghome work are slowing the adoption of telecommuting. Theseconsti;:nts may be weakened if pilot programs prove successful.
Still, given the apparent cost advantages to firms of electronichome work, these reasons do not seem sufficient to explain whyteleworking is not more widespread. A perceptive analysis of thelack of substitution of home work for office work is given by Kraut(1985). He argues that the current office structure is highly stable
315

EILEEN APPELBA UM 303
and provides a resistant barrier to the spread of telework because"conventional, 9-to-5 office arrangements support a large numberof activities critical to the functioning of any work organization.Radical changes in the conventional office have the potential todisrupt these other activities" (Kraut, 1985:14). Among the ac-tivities that Kraut identifies are socialization of new workers tothe workplace, transmission of job skills, informal communicationand information flows, communication of organizational normsand information collaboration among individuals, structuring ofworkers' time, and the spatial and temporal segregation of de-mands of work and family life. In addition, as Kraut observes,employers have ways other than home work of utilizing computerand communications technologies to reduce costs. These includethe relocation of E ick -office work to suburban or foreign locationswhere cheaper labor is more abundant, as well as the reductionof both production and information workers through productivityincrease.
In light of the advantages to organizing clerical and profes-sional work in a more conventional office setting, the potentialcost savings associated with teleworking suggests that a steadybut not explosive expansion in the still-small trend toward homework is likely to continue. Work at home as an adjunct to workin a conventional office location may increase and may even beencouraged by employers. A 1982 AT&T study found that 30percent of those employed outside the home brought work homewith them (cited in Kraut, 1985). Most of the work done at homedid not require sophisticated equipment but was done with tele-phone, paper, pencil, and calculators. This may change as morehouseholds own personal computers and other new technology.The result would be an increase in telework at home as workerswith conventional jobs used telecommunications to complete sometasks at home, rather than a rapid increase in electronic homework and the clerical cottage industry.
CONCLUSION
Management's interest in implementing alternative workschedules and using temporary workers, part-time workers, andhome workersespecially in clerical occupationsappears to bemore closely related to management's desire to reduce labor costs
. 3 1 G

304 RESTRUCTURING WORK
than to the requirements of office automation technologies. Com-puter and communications technologies do not require that clericaloffice work be fragmented and the separate stages of the produc-tion process be physically dispersed while decision making and thework process continue to be controlled from corporate headquar-ters. On the contrary, the evidence suggests that the technologyis most productive when it is combined with skilled workers whohave a knowledge of the overall production process and when it isused to integrate tasks and decentralize decision making (Albin,1984; Appelbaum, 1984; and Hirschhorn, 1984). Initial trainingcosts are higher when the technology is implemented in this man-ner, but the potential for prociactivity gains over the long termare substantially increased (Albin, 1984; Hirschhorn, 1984).
Concern with reducing labor costs and, in some cases, withrealizing savings from office automation immediately rather thanover a longer time horizon appears to have led some firms to imple-ment alternative work schedules. These schedules function mainlyto increase the flexibility of employers in varying hours to meetperiods of high demand and, in some instances, to eliminate fringebenefits to employees. Full -time employees in most medium- andlarge-size firms have won substantial benefits, including paid holi-days, vacations, health insurance, life insurance, and pensions (seeTable 11). Office automation technology has enabled some iirmsto rearrange work schedules on some jobs so that hours of workfall below full time and the job no longer carries some or all ofthe benefits. The savings to companies of shifting health insur-ance and other costs to employees are substantial. Concern withquantifiable improvements in productivity sometimes leads to thefragmentation of tasks and to the assembly-line pacing of work,factors which also contribute to the use of part-time or tempo-rary workers because jobs have become subdivided. Productivityconcerns may, for example, lead to an increase in remote workingclerical employees located in satellite processing centers or in theirown homes doing repetitive and easily measured taskslinked tothe firm's central offices via communications lines and with thecomputer performing the task of electronically reintegrating thework process and producing a finished product.
At the same time, a substantial minority of women workershave expressed a preference for flexibl.:, work schedules in orderto meet both work and home responsibilities. Flexil-le full-timeschedules are not widely available, and these women have opted
31 /

EILEEN APPELBA UM 305
TABLE 11 Percent of Full-Time Employees by Participation in EmployeeBenefit Programs, Medium and Large Firms, 1983
Employee BenefitProgram
AllEmployees
Professionaland Adminis-tr- tiveEmployees
TechnicalandClericalEmployees
ProductionEmployees
Paid:Holidays 99 99 100 98Vacations 100 100 100 99Persorial leave 25 31 35 17Lunch period 11 4 5 17Rest time 74 58 76 80Sick leave 67 92 91 42Sickness and
accident insurance 49 29 34 67Long-term disability
insurance 45 66 58 28Health insurance for
employee 96 98 95 96Health insurance for
dependents 93 95 91 92Life insurance 96 97 95 95Retirement pension 82 66 84 79
NOTE: Participation is defined as coverage for time off, insurance, orpension plan. Benefits for which the employee must p-y the full premium areexcluded. Only current employees are counted as participants.
SOURCE: Bureau of L4bor Statistics (1984c).
for part-time, temporary, or home work arrangements rather thanleave the labor force entirely. But the negative effects of thesearrangements on career mobility and/or earnings growth are aconcern even to those who choose these options (Pratt, 1984).
There is no evidence of an increased desire for such alternativework styles by women. At-home work, while a discernible trend,involves only a tiny fraction of workers. Temporary work is in-creasing rapidly at present, but it is not certain that this increasereflects the preferences of women, especially when the initiativecomes directly from the employer as in the case of the new federalregulations on temporary work. The increase in temporary helpservices does appear to represent an effort by women, particularlythose who are skilled workers, to achieve flexibility in scheduling
3 1 ,,)-

306 RESTRUCTURING WORK
work (Gannon, 1984). It should be noted, however, that the in-creases in home work and temporary help services since 1982 havebeen more than offset by the decline in voluntary part-time workbetween May 1982 and March 1985 (see Table 4). L. suggestscaution in attributing the trends in home work and temporarywork to the desires of women.
Alternative work schedules are, however, desired by manyemployers who see increased flexibility in scheduling workers asan important way to keep labor costs down. Companies thatanticipate cyclical slowdowns in business or expect automation toreduce employment needs are staffing at less than full strengtheven du;cing periods of economic recovery and expansion. Humanresource strategies include the use of temporary workers, part-time workers, and home workers to supplement a smaller staffof permanent full-time employees when employment needs arehigh in order to avoid layoffs later. The cost savings to firms aresubstantial and include ease in scheduling work and in cutting backemployment, as well as savings on fringe benefits and pensions.Often, there are savings from paying part-time workers lower wagesor home workers on a piece-rate basis as well.
The reduction of labor costs has been the main driving forcebehind the development of these work schedules. Nevertheless,office automation technologies have played an important role inencouraging and facilitating their use and women workers havebeen very much affected by the changes. However, it should benoted that both the analysis of the reasons for alternative workschedules and the growing use of temporary workers in non-officesectors of the economy, such as hospitals and light industry, suggestthat men as well as women are finding it more difficult to obtainthe benefits of permanent, full-time jobs. The combined growth ofinvoluntary part-time work and temporary employment for bothmen and women, while small in relation to the total labor force,is nevertheless significant. Concern centers on the fact that thesetrends may signal a restructuring of employment opportunitiesand the extension of sub-par working conditions to sectors of theeconomy where full-time work and benefits have usually prevailed.

EILEEN APPELBA UM
REFERENCES
307
Albin, Peter S.1984 Job design within changing patterns of technical development. Pp.
125-162 in E. Collins and L.D. Tanner, eds., American Jobs and theChanging Industrial Base. Cambridge, Mass.: Baiiinger PublishingCompany.
Appelbaum, Eileen1984 Technology and the Design of Jobs in the Insurance Industry.
Institute for Research on Educational Finance and Governance,Stanford University.
Brown, Scott C.1978 Moonlighting increased sharply in 1977, pa.ticularly among women.
Monthly Labor Review 101(1). Reprinted with supplementary tablesin Bureau of Labor Statistics, Multiple Job Holders in May 1977,Special Labor Force Report #211. Washington, D.C.: U.S. De-partment of Labor
Bureau of Labor Statistics1985a Employment and Earnings 32 (various issues). Washington, D.C.:
U.S. Department of Labor.1985b Linking Employment Problems to Economic Status. Bulletin 2222.
Washington, D.C.: U.S. Department of Labor.1985c Supplement to Employment and Earnings, Revised Establishment
Data. Washington, D.C.: U.S. Department of Labor.1984a Supplement to Employment and Earnings, Revised Establishment
Data. Washington, D.C.: U.S. Department of Labor.1984b Employment and Earnings 31 (various issues). Washington, D.C.:
U.S. Department of Labor.1984c Employee Benefits in Medium and Large Firms. Bulletin 2213. Wash-
ington, D.C.: U.S. Department of Labor.1983a Work Experience of the Population in 1982. Washington, D.C.: U.S.
Department of Labor.1983b Employment and Earnings 30 (various issues). Washington, D.C.:
U.S. Department of Labor.1982a Employment and Earnings 29(6). Washington, D.C.: U.S. Depart-
ment of Labor.1982b Work Experience of the Population in 1981. Washington, D.C.: U.S.
Department of Labor.1981a Work Experience of the Population in 1980. Washington, D.C.: U.S.
Department of Labor.1981b Employment and Earnings 28 (various issues). Washington, D.C.:
U.S. Department of Labor.1980 Employment and Earnings 27 (various issues). Washington, D.C.:
U.S. Department of Labor.1979a Employment and Earnings, United States, 1909-78. Bulletin 1312-11.
Washington, D.C.: U.S. Department of Labor.1979b Employment and Earnings 26(6). Washington, D.C.: U.S. Depart-
ment of Labor.1979c Work Experience of the Population in 1978. Washington, D.C.: U.S.
Department of Labor.
320

308
1978a
1978b
1977a
1977b
1976
1971
1970
1967
n.d.
n.d.
RESTRUCTURING WORK
Employment and Earnings 25(6). Washington, D.C.: U.S. Depart-ment of Labor.Work Ezperience of the Population in 1977. Washington, D.C.: U.S.Department of Labor.Employment and Earnings 24(6). Washington, D.C.: U.S. Depart-ment of Labor.Work Ezperience of the Population in 1976. Washington, D.C.: U.S.Department of Labor.Work Ezperience of the Population in 1978. Washington, D.C.: U.S.Department of Labor.Employment and Earnings 17 (variousU.S. Departwent of Labor.Employment and Earnings 16 (variousU.S. Department of Labor.Employment and Earnings 13 (variousU.S. Department of Labor.Unpublished data from the Current Population Survey, March1971, 1976, 1981, 1984, and 1985.Unpublished tables on work experience of the population in 1979and 1983.
Bureau of the Census1980 1977 Census of Service Industries, Geographic Area Studies, United
States. Washington, D.C.: U.S. Department of Commerce.1985 1982 Census of Service Industries, Geographic Area Studies, United
States. Washington, D.C.: U.S. Department of Commerce.BusineasWeek
1982 If home is where the worker is. Business Week (May 3):66.1985 Part-time workers: rising numbers, rising discord. BusinessWeek
(April 1):62-63.Chin, Kathy
1984 Home is where the job is. Infoworld 6(17):28-32.Cole, Bernard C.
1981 Computing to work. Interface Age 6(8):93-95.Collins, Huntley
1985 Unions decry trend to short-term federal jobs. Philadelphia Inquirer.February 5:B1.
Deutermann, William V., Jr., and Scott Campbell Brown1978 Voluntary part-time workers: a growing part of the labor force.
Monthly Labor Review 101(6):3-10.Flamingo, Josephine
1984 Need a pro? Try temporary help. Office Administration and Au-tomation (August):48-55, 68-70.
Gannon, Martin J.1984 Preferences of temporary workers: time, variety and flexibility.
Monthly Labor Review 107(8):26-28.Gregory, Judith
1983 Clerical workers and new office technologies. Pp. 112-114 inOffice Work Stations in the Home. Board on Telecommunications.Washington, D.C.: National Academy Press.
Hirschhorn, Larry1984 Beyond Mechanization. Cambridge, Mass.: MIT Press.
3
issues). Washington, D.C.:
issues). Washington, D.C.:
issues). Washington, D.C.:

EILEEN APPELBA UM 309
Hunt, Timothy L., and H. Allan Hunt1985 An assessment of data sources to study the employment effects
of technological change. Pp. 1-116 in Technology and EmploymentEffects. Interim Report of the Panel on Technology and Women'sEmployment, Committee on Women's Employment and RelatedSocial Issues, National Research Council. Washington, D.C.: Na-tional Academy Press.
ILO Symposium1978 Arrangement of Working Time and Social Problems Connected with
Shift Work in Industrialized Countries. Geneva: International LabourOffice.
Kingston, Jane1983 Telecommuting: its impact on the home. Pp. 287-300 in H.F.
Didsbury, Jr., ed., The World of Work, Careers and the Fiiture.Bethesda, Md.: World Future Society.
Kraut, Robert E.1985 Predicting the use of technology: the case of telework. In Robert
E. Kraut, ed., Technology and the 71.anaformation in White-CollarWork. Hillsdale, N.J.: Lawrence Erlbaum.
Leon, Carol, and Robert W. Bednarzik1978 A profile of women on part-time schedules. Monthly Labor Review
101(10):3-12.Mellon, Earl F., and George D. Stamos
1982 Usual weekly earnings: another look at intergroup differences andbasic trends. Monthly Labor Review 105(4):15-24.
Mortenson, Patricia1983 Telecommuting: the company perspective. Best's Review Property-
Casualty Edition (November):112-114.Nollen, Stanley D., Brenda B. Eddy, and Virginia H. Martin
1978 Permanent Part-Time Employment. New York: Praeger Special Stud-ies.
Olson, Margarethe H.1983a Remote office work: changing work patterns in space and time.
Communications of the AMC 26(3):180-190.1983b Overview of Work-At-Home TVends in the United Staten. New York:
New York University Center for Research on Information Systems.Pratt, J.H.
1984 Home telecommuting: a study of its pioneers. Technological Fore-casting and Social Change 25:1-14.
Presser, Harriet B.1984 Shift Work and the Family. Paper presented at the Population
Issues Research Center, Pennsylvania State University.Presser, Harriet B., and Wendy Baldwin
1980 Child care as a constraint on employment: prevalence, correlatesand bearing on the work and fertility nexus. American Journal ofSociology 85(7):1202-1213.
Rosenfeld, Carl1979 Multiple jobholding holds steady in 1978. Monthly Labor Review
102(2):59-61.
3 ri ()i'd ",
310 RESTRUCTURING WORK
Rosow, Jerome M., and Robert Zager1981 New Work Schedules for a Changing Socie
in America Institute, Inc.Sample, Robert
1981 Coping with the "work -at -home" trend.42(025-30.
Sekscenski, Edward S.1980 Women's share of moonlighting nearly doubles during 1969-1979.
Monthly Labor Review 103(5):36-39.Taylor, Daniel, and Edward S. Sekscenski
1981 Workers on long schedules, single and multiple jobholders. MonthlyLabor Review 104(5):47-53.
U.S. Commission on Civil Rights1983 Disadvantaged Women and Their Children. Washington, D.C.: U.S.
Commission on Civil Rights.Women's Bureau, U.S. Department of Labor
1983 Time of Change: 1988 Handbook on Women Workers. Bulletin 298.Washington, D.C.: U.S. Department of Labor.
ty. Scarsdale, N.Y.: Work
Administrative Management

Part IV
Policy Perspectives
324
Employer Policies to Enhancethe Application of Office System
Technology to Clerical Work
ALAN F . WESTIN
SCOPE AND FOCUS
In this paper, I dray/ on a recently completed study' of officeautomation (OA) experiences at 110 business, government. and
Financial support for the study was provided, in part, by IBM, Hewlett-Packard, NCR., OCLI, Control Data Business Advisors, Haworth, KellyServices, and Northern Telecom. The research design, field work, and projectreports were the responsibility of the Educational Fund, and the sponsors arenot responsible for any of our judgments or positions. My senior colleagueson the project were Michael A. Baker, Heather A. Schweder, and SheilaLehman. The first product of the study, The Changing Workplace: A Guideto Managing the People, Organizational, and Regulatory Aspects of Office Technology(Westin et al., 1985), was published by Knowledge Industries, 701 West-chester Avenue, White Plains, NY 10604, in April 1985. A second book, TheOffice Automation Controversy, will be published in 1987.
1 Between April 1982 and June 1984, the Educational Fund for IndividualRights conducted a study of "The Workplace Impact of Using VDTs inthe Office." The centerpiece of the research was a program of on-sitevisits to 110 organizations implementing office system technology. About60 percent of these were business firms, in the insurance, manufacturing,financial services, media, transportation, retail, utility, distribution, energy,and consumer-services industries. About 40 percent were federal, state,and local government agencies and nonprofit organizations, such as private
313
314 APPLICATION OF OFFICE SYSTEM TECHNOLOGY
nonprofit organizations to explore four issues of concern: (1) howorganizations are going about implementation of new office sys-tem technologies; (2) how women workers have been respondingto these implementation policies, under both favorable and unfa-vorable circumstances; (3) what policies of "leading edge" organi-zations hold promise for long-term productivity and job enhance-ment; and (4) whether favorable adaptations by both workers andmanagers will likely occur on their own, or rather be enhanced byintervention.
The discussion concentrates on women clerical workers, sinceclerical work is the area toward which most office system applica-tions have been directed in the past decade. In this kind of work,video display terminals (VDTs) are used most intensively, and forthe longest period per day. Women make up over 90 percent ofthe clerical work force in the offices where the new technologiesare being implemented.
One conclusion from the larger study is that there is con-siderable variation at this point in the policies and proceduresthat employer organizations are using in implementing office sys-tems technology. We do not share the view that the technologysomehow dictates one dominant implementation strategy, or thatwomen clerical workers are encountering one set of "OA (officeautomation) impacts" wherever VDTs are being installed. In thispaper, the focus is on the quality of work life and equality aspectsof applying office systems technology to clerical work where femaleemployees predominate. We did not study the employment-levelimpacts of office automation, nor the effects on job security orinsecurity.
The 110 organizations that were visited on-site for the largerstudy were not a representative sample of corporations, govern-ment agencies, or nonprofits. They were chosen primarily on the
universities, hospitals and civic groups. At these sites, we conducted open-ended interviews with over 1,100 end users of VDTs, primarily at theclerical, secretarial, and pro:essional levels, and with over 650 managersand executives. In addition, the project made visits to 15 large vendorsor office systems and support equipment; interviewed officials at 40 U.S.labor unions concerned with VDT and OA issues; did a pilot survey andhad follow-up meetings with information-system directors in 55 businessand government organizations; and interviewed representatives of women's,religious, minority, industry, and user groups concerned with the impact ofoffice technology. We also conducted interviews with 75 employees usingVDTs in organizations to which we did not make site visits.

ALAN F. WESTIN 315
basis of their reputations as "advanced" and "active" users of officesystems technology. Many were selected because of a reputationfor having "good human resources policies," though this was not aprerequisite for selection. These reputational characteristics weredrawn from nominations by vendors, articles in the computer andbusiness press, articles in the personnel and labor relations media,and suggestions from interest groups, OA experts, and academi-cians. About 10 percent of the sites were union-represented, aboutevenly divided between private and government employers.
In the course of our site visits, we spoke with approximately900 women that use VDTs at their jobs. About 15 percent of thesewomen were professional, technical, or managerial employees, andabout 85 percent were clerical workers.
Four main types of clerical work were examined: word process-ing in both centralized and distributed settings; customer-servicework via terminal and telephone; intensive data-entry work; andgeneral secretarial functions. Most of the conversations were con-ducted with individual employees, but about 20 percent took placein small focus groups.
We used a topic checklist for these interviews, made up ofneutrally worded questions designed to minimize prompting orforcing of issues? Our questions asked how long the employeehad been using a VDT; whether she had done this job previouslywithout a VDT; what kind of training for the machine she hadreceived; what personal involvement, if any, she had had in theprocess of using office system technology at her job; how the VDTwas affecting "her job" and "her work"; whether she had read orheard anything about "VDT issues"; how management supervisedher performance; what problems, if any, she had encountered usingthe VDT and whether she had raised these with management; how
2 We guaranteed employees complete anonymity for their comments, andour interviews were done without supervisors or managers present. As a re-sult, wa believe these women clericals were open and candid in their discussionof how ti.:..y saw VDT uses affecting them, and their responses provided uswith valuable reports on the reactions and problems of clerical workers doingintensive VDT work. However, since we did not conduct a representative-sample survey, or use a standardized questionnaire, our interviews do notprovide the basis for making statistical statements about national trends,particular industries, or specific occupational groups. Therefore, we feelmost comfortable reporting what we found for these 110 organizations, usingbroad terminology. Our conclusions must therefore be viewed as exploratoryrather than representative.
3. `I'

316 APPLICATION OF OFFICE SYSTEM TECHNOLOGY
she saw her future at this organization or elsewhere being affe-tedby her VDT skill; and similar broad inquiries.
In addition, I draw in this paper on two other interviewsources. In the course of the larger study, we conducted in-depthinterviews averaging about 1.5 hours each with 12 white, black,and Hispanic clerical workers in one large metropolitan area, andthese have been used for our analysis of women clerical workerlife situations, career aspirations, and orientations on "women'sissues." We also obtained the transcripts of 10 excellent in-depthinterviews with women clericals conducted in 1983 as part of alarger University of Connecticut Labor History project (Asher,1983). Both sets of interviews probed personal history, education,pre-VDT work experiences, career goals, social and family situ-ations, treatment as women on the job, and other key elementsshaping the reaction of these women to the use of VDTs.
OFFICE AUTOMATION AND WOMEN'SISSUESEVIDENCE FROM CASE STUDIES
The following are trends among organizations in our fieldstudy that relate most directly to the impact of office systemstechnology trends on women clerical workers (for the detailed dataand full-scale discussions of these trends, see our study report,Westin et al., 1985).
Varied Application Among the organizations visited, we didnot find the kind of unitary, deterministic application of officesystems technology that some social analysts or group spokesmenhave asserted to be taking place. Rather, we found significantvariations in the design and implementation of VDT clerical workfrom industry to industry, among individual firms within indus-tries, from division to division, among different local work units,and even among specific types of jobs. In addition, there wereoften significant variations in how supervisors and unit managerswere applying top management "OA policies" to clerical work-ers. Such diversities affected both the experiences and attitudesof women clerical workers toward the institution of VDTs at theirworkplaces.
I.nportance of Overall Human Resource Policy The overall hu-man resources or personnel philosophy of managements at theorganizations we visited was the strongest single variable in howthe quality of work life aspects and the women's equality issues of

ALAN F. WESTIN 317
OA were being perceived and addressed, both in general and as faras clerical work was concerned. We found firms with nearly iden-tical types of clerical operations, work force characteristics, linesof business or government activity, and economic circumstanceswhose policies toward the twc issues of concern in this paper weredramatically different and were perceived as such by women cleri-cal workers we interviewed. (See the profiles of "Great Northern"and "National Services" later in this paper for specific illustrationsof this contrast.)
Significant Differences Among Women Attitudes toward VDTwork among women clericals interviewed differed as a result ofimportant individual and group characteristics, such as education,social class, race and ethnic status, age and life situation, economicneeds, attitude toward "women's issues," experiences with sexdiscrimination, etc. (This will also be discussed in greater detaillater.)
Pos live Perceptions of Office Automation Confirming the re-sults of various national office worker surveys conducted in thepast 3 to 4 years, a large majority of the clerical women we inter-viewed (in the 80 to 90 percent range) expressed positive commentsabout having VDTs to use in their jobs. Specifically, they reportedimportant quantitative and qualitative improvements in their jobperformance as a result of the new office systems, and they wereglad to have VDT skills which they believed would make themmore "marketable" for jobs both within and outside the firms forwhich they were working Furthermore, even those women cleri-cals who did not like the content of their jobs very much, or whowere upset at the manner in which the new technology was intro-duced at their workplace, did not attribute the problems to "themachine" as such, but rather to the way that their managementwas structuring jobs or work settings around the new technology.
Problems of Office Technology Implementation Despite theirinitial positive attitude toward the technology, a majority of cler-ical women we interviewed reported a combination of significantVDT problems that they wanted their managements to address.(This also parallels the findings of national surveys of VDT usein offices.) Some of these were general problems growing out ofhow well or poorly VDT technology was applied (ergonomics,job design, computer-based monitoring), while other problemsthese clericals reported are issues specific to women workers (such
3 9 :

318 APPLICATION OF OFFICE SYSTEM TECHNOLOGY
as pregnancy concerns from VDT use, pay equity for "women'swork," etc.).
Job Reorganization Women clericals in each of the job sec-tors we examineddata entry, customer service, word processing,and secretarialwere experiencing a significant reshaping of thecontent of their jobs compared with the way these jobs had beenstructured in recent decades. However, contrary to some commen-taries, we did not find this to be unidirectional in the organizationswe studied. Some clerical jobs were increasing in variety, scope,and satisfaction and were perceived so by employees. For exam-ple, new capacities to search data bases and to perform completeon-line transactions for customers in banking, utilities, or news-papers were making customer-service work more interesting forthese workers. Similarly, graphics capabilities in word processingwere enhancing effectiveness and satisfaction in many secretarialoperations. We found other clericals had moved ii.to interestingpara-professional jobs, in which they were managing informationcollection and distribution for work teams in their organizations.However, some clericals, such as claims adjusters in invirance firmsand back-office workers in financial institutions, were having theskilled and interesting elements of their jobs taken over by soft-ware, and these employees found themselves functioning largely asdata -entry workers inputting routine customer information. Thefeelings of women we interviewed were significantly shaped bywhether managements were providing task variety and interestingactivities in the new VDT jobs, or whether they were providing re-training and new job opportunities for clerical employees for whomstraight data -entry work would be an unsatisfactory job. In termsof the physical comfort of women clericals using VDTs, especiallyoperators using terminals for data entry, customer service, andword-processing jobs for more than 5 hours per day, over three-fourths of the organizations we visited during 1982-1984 did nothave the majority of their clerical-worker stations in "minimallycorrect" ergonomic conditions. We defined this as an adjustablechair, an adjustable terminal or work surface, and a nonglarework environment (however achieved, with antiglare screen, ad-justed workstation illumination, etc.). As a result, a majority ofwomen ..lericals we interviewed complained of recurring physicaldiscomforts attributable to such weak ergonomic conditions forintensive VDT use.

ALAN F. WESTIN 319
Women's Labor-Force Experience A strong minority of womenclerical employeesperhaps 25 to 35 percentexpressed concernabout the fairness of the pay they were receiving for working withVDTs in their jobs and about the discriminatory treatment theyfelt they were getting in promotional and career path opportuni-ties compared with men at their organizations. These attitudeswere stronger among women clericals we interviewed who wereunder 30 years of age: they were more inclined to expect man-agement to provide such opportunities and were more ready tomake an issue of this at their workplaces than older women. How-ever, "women's consciousness" was also present among some olderwomen, especially those who had been employed a long time attheir organizations and knew firsthand how men had been system-atically preferred over women in key job opportunities.
Role of Popular Opinion and Activism Feelings about "fairtreatment" of women in the high-technology office were beingstimulated among women we interviewed by the growing criticaldiscussion of these issues by women's activist and mainstreamwomen's groups, the mass media, unions, and major reli,;ious bod-ies. Though worried about the availability of jobs and z.bout voic-ing complaints in a time of job insecurity, especially at nonunionsites where there is no protection against arbitrary dismissal, astrong minority (about a fourth) of women clericals we inter-viewed were convinced that only if they spoke up at the workplacewould women's concerns about pay equity and fair promotionaltreatment be addressed by management.
Variations at the Job-Type Level The executives and managerswe interviewed described attracting and keeping good employeesfor customer service and secretarial work, using VDTs as a majororganizational need. In contrast, many managers believed thatdata -entry work would be greatly reduced in the next few yearsby a combination of optical scanning and direct custo__Ler input,or else would be exported to cheap labor service bureaus abroad.Therefore, ensuring job satisfaction for data-entry work seemed tobe less important to these managements than for customer serviceand secretarial work. Although we visited some sites (about 10percent) in which having a high-turnover, low-paid, and acceptingwork force for customer service and secreta:;a1 activities was thestaffing approach taken by top management, this was not thepolicy we found being consciously pursued by 90 percent of theseorganizations. At most corporate and nonprofit organizations we
331

320 APPLICATION OF OFFICE SYSTEM TECHNOLOGY
visited, considerable attention was being paid to how to balancemanagement interests in cost control and head-count reductionwith organizational needs for a highly motivated and effectivecustomer service and secretarial work force.
Managerial Responses to Women's Issues In about three-quarters of the organizations we visited, managements had not, byearly 1984, developed direct and responsive strategies for dealingwith the women's concerns and interests we cited. In some ofthese organizations, staff groups had recommended new policiesto improve job quality for women clericals, reduce discriminatoryeffects, or take positive actions to enhance women's opportuni-ties, but these staff groups had not yet been able to persuadetop management to implement the policies. In only a fourth ofthe organizaticns had top management set clear affirmative actiongoals for VDT clerical work and had line managers actually begunputting such policies into effect.
Pleases in Office Automation Implementation In the first eraof OA implementation in the United States, which we would datefrom 1978 to 1983, vendors stressed productivity and reduction oflabor costs and offered few ergonomically designed terminals andworkstations. This was partly because they saw no user willingnessto phy for such features. At the same time, purchasers of VDTsthat we studied saw themselves as struggling to make OA appli-cations work and to achieve the promised productivity benefits;little serious attention was given by most of these managements toergonomics, employee communication on health and safety issues,or employee involvement. The overall social climate supportedsuch a focus. Despite the presence of occasional stories raisingissues of possible advene health or other harmful effects of "officeautomation" on emplc ;nterests, overall media treatment in thefirst era was highly
However, 1983. s the transition into a second era ofoffice system utilizat: _ the United States. This was markedby trends such as vendors responding to criticism and greater userconsciousness by providing ergonomically sound products and ma-jor user-education campaigns; increased internal attention at mostsites we visited in 1984 to sound VDT policies and practices; majormedia attention to VDT concerns; a very active regulatory ar'd leg-islative debate over VDT interventions throughout the country, inat least 25 states; growing interest by academics and public inter-est groups in office automation trends and impacts; and a growing

ALAN F. WESTIN 321
concentration on special issues facing women clerical workers doingintensive VDT jobs. Follow-up calls we made in 1985-1986 to sitesvisited early in the project showed increased attention being paidby these managements to issues of ergonomics, training, employeecommunication, and other aspects of using VDTs, compared with1982-1984.
GOOD MANAGEMENT POLICIES AFFECTINGCLERICAL WORKERS: THE GRAPHIC
A REPRESENTATIVE EXAMPLE
Among the 110 organizations we visited, there were sites atwhich objective work conditions for VDT use and managementpolicies toward women's equality issues were both quite positive.To illustrate, we selected a medium-sized organization, with sev-eral thousand employees, largely because some analysts assumethat good VDT policies in the interest of the users are only de-veloped by very large employers, with large staffs and substantialbudgets for innovative policy experimentation. While measuresof "good user" need to be defined and applied by researchers, Iadopt at this point the subjective perceptions of women clericalsas the primary basis for terming management policies as "good"for "women's interests."
The Graphic is a nonunion newspaper located in a subur-ban area. It is technologically advanced, profitable, and highlyregarded for both journalistic and business excellence. Adoptionof office systems technology has not led to reduced employmentin this firm over the past decade, but rather major expansion ofbusiness services (such as selling advertising inserts) that havebeen accomplished through greater productivity and effectivenessby the same-sized work force. The Graphic is well regarded locallyfor its employment of women and minorities, and its turnover rateis very low, compared to other newspapers regionally.
We interviewed about 50 managers, editors, reporters, andadministrative an,: clerical employees at The Graphic. Twenty-oneof these were women clericals doing VDT-based customer-servicework in the classified advertising and circulation departments,selected by us at random from the operators on duty the dayswe visited the site. The six customer-service operators whoseoffice autom-hion experiences we will describe are representative offemale clerictel:. working at The Graphic who use a combined VDT
333

322 APPLICATION OF OFFICE SYSTEM TECHNOLOGY
and telecommunication system in a 60-person customer-servicedepartment. A new VDT system had been selected and was soonto be installed. It has an automated call system that distributeswaiting calls to the next available operator, ands Leo allows moredetailed customer information to be displayed on the screen andupdated by the operator. This department is presently housedin temporary quarters while a new, ergonomically advanced worksite is finished. The employees have been in this makeshift area,with standard office desks and chairs, for about 6 months.
The VDT system they operate allows the operator to call upa customer's account history on the screen, consult it while takingorders or bar iling complaints from a customer on the telephone,and then complete the transact ion by keying in an action andupdating the customer's file. Work gets extremely heavy at certainpeak points in the week. and there are often delays and downperiods in the present system that have . aused this department tofall behind deadlines.
The women working in this department are mostly in theirtwenties, though there are some older women and a few menalso in the group. About a quarter of the operators are black orHispanic. The positive experiences of six women clericals follow:
Norma, a black woman in her twenties, has worked for4 years in this organization. Before that, she worked in a localgraphics shop. She works 6.5 hours a day, 6 days a week on theVDT, and says, "I like it a lot. I like machines, period. It's fun. I'dlike to program more, which I did at the other job I had in graphics,while hera I just put in codes. It would be more interesting if Icould do more programming and this is something that I wantto get into. Now we just type a few words in and the computertakes over and does all the rest." Norma attends school at night tostudy computer programming, an educational program that theemployer pays for. She hopes to still be working here in the nextfew years, but in a job that involves computer programming: "I'dlike to be able to do something with programming here, since itis a great place to work." Norma feels her opportunities here asa woman and as a black are very satisfactory, 'much better thanlots of my friends are finding."
Alice, a white woman in her mid-twenties, has worked atthe VDT since she joined The Graphic 3 years ago. At her pre-vious job with a manufacturing company, she also worked on a

ALAN F. WESTIN 323
VDT, entering orders. Alice comments "I like working on theVDT very much. I like to see what I do come up on a screenright away. The only real problem we have is when the systemgoes down. Everything comes to a stop. Work backs up." Shesaid management understands the problem and doesn't lean onemployees unfairly, and that is what makes the situation accept-able. Although she feels that ti'e "pay could be better" at TheGraphic, Alice says that the benefits are quite good, which makesa considerable difference. However, Alice also feels that customer-service representatives must cope with a lot of stress in dealingwith customers who are sometimes angry and upset. In her lastjob, she didn't have contact with customers, she just input orders.She feels that dealing with customers and defusing people's angerare skills that ought to draw better pay. If she stays at this job,she will try to raise this issue seriously with management. Hergoal is to become a district manager. To do that she must takecourses in sales, and she plans to register for them next year.Since she is a parent with a very small child, she must work hereducation and career plans into her family responsibilities, andsees her advancement as a gradual process. Because she is "veryhappy" at her job, she says that she doesn't mind this. Alicereported no headaches or backaches and no problems with glare.She said some experts came in to check radiation levels some timeago, and thinks that such radiation checks have been conductedtwice in the time she has been with the company. She has heardthings about alleged dangers from VDTs on the news but she'snot upset ("Oh, there's always something that's being discussedin the newspapers."). But if it was a real problem, she feels hermanagement would know about it and would do the right thing,so she isn't worried.
Rosa is a Hispanic woman in her mid-thirties who has beenat The Graphic for 5 years, and went right into VDT work in thisdepartment. Previously, she worked for 3 years at a local SocialSecurity office, where she was trained on the VDT and where shehandled the issuance of checks for disability insurance. Of herpresent job, Rosa says "I love computers. But we could do morewith the system. I'd like to see it upgraded so we can get .noreinformation out of it. .. . I'm looking forward to the challenge andthe interest that the new system (which The Graphic has on order)will bring. I pick up easily on technological things and so I have notrouble learning and adjusting to a new system." Rosa spends 6 to
33'i

324 APPLICATION OF OFFICE SYSTEM TECHIJOLOGY
7 hours a day on the terminal. She says that she hasn't had one daywhen she was bored in her work at The Graphic. "The work is verydiverse here," she notes. "It challenges you and I love talking topeople and dealing with the public. I guess I could adjust to doingjust one function on the VDT all day, because I adapt easily, butI like the variety of work that we have here." Rosa also feels thatThe Graphic has excellent working conditions and supervision,and enjoys her co-workers. She isn't looking to change her job orto upgrade herself because she feels she's happy with what she'sdoing. "If you're happy at the job, and the pay isn't bad and thebenefits are good, why would you want to change?" Rosa stressesthat everybody is coping with the temporarily bad VDT workingconditions now without too much complaint, because they knowthey'll be moving into excellent quarters soon. "We make fun andgames out of it; we laugh a lot and talk about how bad things arebut nobody really minds it." She's had no backaches, neckaches,or headaches, and has no problem with glare. She has 20-20 visionwithout glasses and has had no change in her eyes over the 5 yearsthat she's worked on the VDT. "You can always adjust your screenwith the contrast; I don't have to do it but if I had any problemsI could certainly take advantage of that."
Pat, a young white woman, has been working at TheGraphic for a few months, and came directly from high school.She said "They threw me on the machine with a list of codes.You learn pretty quickly in the first 2 days. Another employee sitswith you, shows you how to operate the terminal, and answersyour questions. It worked fine because we're a small group andwe all help or another." Pat says that she does have tiring ofthe eyes and she's bothered by the fact that her head has to goup and down constantly. "It's very annoying to look at the paperand then look up at the screen," she says, and she hasn't masteredthat yet. However, she hasn't talked to other people about it andhas not yet found a way to prop up pages on the machine becausethere's not enough room on the desk. She knows that 'the newquarters that we will go into soon will provide better space on thedesk to help solve that problem." She mentioned that she has noback, neck, or headache problems. However, she indicated thateach terminal is slightly different, and when you move from oneterminal to another, you should really do some adjustment. Whenpeople don't do that adjustment, she said, they begin to feel slittle extra tired from working on a different machine. Pat works

ALAN F. WESTIN 325
7 hot rs a day on the terminal. Since she's young and new, she ex-pects to stay at that for some time. She likes the job and likes thepeople and is very happy with the position that she has. Someday,she says she would like to be a supervisor in this department orbecome a district manager, though she knows she would have togo back to school for that. Since she just got out of school andwas "sick of it," she expects it to be "a while" before she will takecourses to enable herself to apply for a district manager's job.
Florence has been at The Graphic for 4 years. She isa black woman who came to the company straight out of highschool, and started working on the VDT. She feels that trainingwas very easy: "[The machine] is just like a typewriter and a bigTV set." "I'm not crazy over computers," she comments, "butthey do make the job more professional." She also says that shelikes the status that working on the computer gives her. Whenshe tells her friends she works on a terminal and is hooked into acomputer, they regard her as having an interesting job, especiallythose that are working in low-status service jobs. Florence has nocomfort problems and no eye strain. The only problem is that ifshe works a straight 2- to 3-hour shift, she sometimes gets fingercramps from keyboarding. Florence sees The Graphic rs beingsomewhat low in pay but offering good benefits. She mentionedthat there is an annual performance review in which managementtells you your strong and weak points, your absence level, yourrelations with other employees and so forth. The managers willtell you about your errors and whether your error rate is okay,but doesn't compare your volumes and rate of work with thoseof other employees: "I would hate to have something 1.ike that ona job; that would bring too much pressure." The thing Florencehates most is when the computer system goes down. However, shefeels that management is very understanding when the system isdown, and the situation is improving greatly. She likes her job andshe likes keeping busy all the time"I would be bored out of myskull if there wasn't enough work to do."
Jennifer it a supervisor in this department, and has heldthat post for the past 4 years. A white woman in her thirties,she joined The Graphic 7 years ago, and was trained in-house onthe VDT as a customer service clerk. "I really like the VDT, andnow I like helping to set up the new terminal system we're puttingin." She is thinking about getting further systems education and
, ,
328 APPLICATION OF OFFICE SYSTEM TECHNOLOGY
possibly getting a professional post in The Graphic's EDP depart-ment. She participated on a task force that developed the newVDT system that The Graphic is installing, and liked that partic-ipation very much. Jennifer finds supervising VDT work highlychallenging. She thinks the pay could be better for operators afterthe first year, and hopes to get an "upgrade" authorized when thenew terminal system comes in. She notes that she "tried installingformal rest breaks a while ago, to relieve back and headache prob-lems, but the employees don't like that. When we get peak workperiods they don't take the set breaks, so I told people to get upanytime. If they want a full 15-minute break, they just tell me andI arrange to have their work covered." Jennifer feels worried aboutradiation and possible effects on pregnant women, and thinks themanagement should tell the employees more about this "sincewe're hearing about it all the time. They should give us materialto read up on, and answer our questions." She also wants to startan exercise program, and to have more discussion about physicalproblems and guidance for dealing with them in the training pro-gram. She sees herself as a "young professional" in the new fieldof VDT work, and finds the whole area of technology "exciting towork in."
ELEMENTS OF GOOD USER PRACTICE
Good user practices in office system implementation do notcome from printed assembly instructions in boxes housing VDTs,nor do they arise through some kind of accidental serendipity.They will not occur in exploitive or repressive work environments,in the "sweatshop" mold. Good user practices take place onlywhen there is an existing structure of management policy andpractice committed to organizational excellence and a progressivehuman resource philosophy, plus a recognition that a particularnew activity or problem (in this case, implementing new officesystem technology) requires mobilization of management attentionand organizational resources.
In the real world of competitive business pressures or pres-sures to reduce budgets in government, this requires recognitionby top management of positive "bottom line" incentives to addressVDT issues (increased productivity, reduced turnover) or some se-rious concerns about organizational 'exposures" if this is not done
3 3 ,3

ALAN F. WESTIN 327
(ngulato:y controls, legal liability, bad labormanagement rela-tions, unionization of nonunion work forces, etc.). Sometimes,an organization may be in the midst of a changeover in humanresources policies from a traditionalist/authority-centered philos-ophy to a more participative quality-of-work-life approach. If thisis happeningusually because of a change in tup managementapplying the new human resources philosophy to office automationcan be part of the transition process in such an organization.
A CHECKLIST OF GOOD USER POLICIES
At our site visits, we identified 10 basic ongoing policies thatcompanies with good human resource philosophies were adoptingto deal effectively with VDT implementation. Such organizations
1. Build employee satisfaction and organizational change re-quirements into the organization's overall office technology planand obtain top management commitment to such requirements.
2. Create a task force, coordinating committee, or multifunc-tion group to guide peopletechnology aspects of office automa-tion.
3. Develop a program of employee involvement in office au-tomation that fits the organizational culture, or use joint unionmanagement committees in union-represented companies, exper-imenting with different modes of involvement for different worksettings.
4. Inventory ergonomic conditions in VDT uses, starting withthe most intensive applicati Ins and creating a graduated programof ergonomic upgrades to acceptable standards in all facilities.
5. Examine techniques of performance evaluation for VDTwork and install "fair work measurement" systems that avoid"Big Brother" monitoring.
6. Monitor health and comfort responses of VDT employees,take measures to reduce problem areas, and have staff keep abreastof external research findings.
7. Conduct employee-centered rather than machine-centeredtraining programs on using VDTs or installing new applications,and hold similar broad-based supervisor/manager training pro-grams on implementing new office systems.
8. Develop continuous employee communication programscovering both positive achievements and uses of the technologyand ways to cope with expected problems.
3 3 3

328 APPLICATION OF OFFICE SYSTEM TECHNOLOGY
9. Address women's equality and special workplace needs, es-pecially among clezical and professional employees heavily involvedwith VDTs.
10. Monitor interest group, media, regulatory, and academicdevelopments relating to VDTs, to understand social concernsand proposals being voiced, and to bring the organization intoanticipatory compliance with sound standards emerging from suchdialog.
Figure 1 identifies the organizational policies that user man-agements need to consider in their VDT implementation, and thebasic employer, employee, and special women's interests that needto be taken into account in such policy making.
JOB SATISFACTION AMONG WOMEN CLERICALSAT THE GRAPHIC
Referring back to the vignettes of our representative customer-service operators at The Graphic, we can easily identify the sourcesof the generally high job satisfaction these women conveyed. Man-agement at The Graphic had instituted the following:
Excellent educational benefits for employees to pursue ad-vanced study and good in-house training in advanced VDT ap-plications. This provided women with opportunities for the skillsacquisition needed for career advancement, at the employer's ex-pense.
Clear promotional ladders and structure within the organi-zation, well known to these women and discussed in performanceplanning sessions. Based on what they could see other womenclericals having achieved at The Graphic, these women could, iftheir ambitions, needs, and life situations stimulated them, worktoward supervisory posts in their own department, professionaljobs in data processing (programming, data analyst), and middlemanagement (district managers).
Performance evaluation of their VDT work that was con-sidered absolutely fair. Management knew that the systems wentdown periodically and output was affected. It knew that peak-period commitments needed to be balanced by rest time andat-will breaks. Supervisors did not use machine monitoring tocompare one employee's call rates with another's in order to setquotas.

ALAN F. WESTIN
EMPLOYER ROLESAND INTERESTS
Strategic planning
Effective Introduction
Good transition tofull operation
Positive employeereception and use
Increased productivity
"Problems" respondedto effectively
improved competitiveposition
Overall cost-benefitadvantage
ORGANIZATIONALPOLICIES
System Design
Hardware/SoftwareSelection
Training
Job Design
PerformanceEvaluation
Work-f roupOrginIzabon
Work Environment(Ergonomics)
Health and SafetyConditions
Compensation andBenefits
Employment Policies(Promotions, Turnover)
SPECIAL WOMEN'S
ISSUES
Pay Equity
Equal PromotionalOpportunities
Absence of EnforcedSex Segregation
Flextime, Flexpiace,Child Care, etc.
329
EMPLOYEE ROLESAND INTERESTS
Involvement Innew-technologydecisions
Adequate and broadtraining
A "challenging' fob
"Far performanceevaluation/supervision
Good work-group support
Sound ergonomicconditions
Safe, unharmful fob
"Fair par
Career opportunitiesas desired and earned
Reasonable fob security
FIGURE 1 Organizational policies for good VDT implementation, andinterests to be considered in developing such policies.
3
330 APPLICATION OF OFFICE SYSTEM TECHNOLOGY
Ergonomics in most of The Graphic's facilities that werevery good. At the location where these women worked, conditionswere very poor, because temporary space was being used while top-of-the-line ergonomics were being prepared for this unit in newspace. Because these women knew that excellent facilities werebeing prepared for them, and supervisors did not "lean on them"when performance suffered because of poor ergonomic conditions,these employees retained a highly positive attitude toward theiremployer and their treatment as employees. Employees felt asinvolved in VDT implementation policies as each wanted to be.They had been given opportunities to test vendor equipment beingconsidered and to give their reactions, and several employees fromthis unit had volunteered for planning task forces.
While there had been some educational sessions for employ-ees on health and safety issues in using VDTs, and some literaturehad been provided, several employees and the supervisor felt moreshould be forthcoming from management. After our site visit, ad-ditional employee communications on these issues were providedby management.
The one significant problem at The Graphic, as we reported,was pay. Since customer-service work was primarily being doneby women (about 90 percent), this seemed to be heading in theminds of the women we interviewed toward a "pay equity" con-cern. Because The Graphic offered what these women saw asexcellent benefits, including education support, the pay questionmight not become acute. Or it might develop into a real grievance,in which case, based on its overall human resource philosophy, TheGraphic's management might be expected to recognize the concernand act on it before it became a deep grievance.
Most important, in terms of identifying model-user practices,what characterized employeeemployer relations at The Graphicwas a condition of basic trust by employees in the good intentionsand professional competence of management in the design andimplementation of office systems in clerical work. And, businessgrowth and the absence of fears about imminent layoffs provideda solid "floor" to support such employee trust. Taking all thesefactors together, clerical workers at The Graphic were both eagerand satisfied users of new office technology. Where there wereproblems in system design and applications (and there were some,

ALAN F. WESTIN 331
stemming from personal problems in the data-processing manage-ment group), or when ergonomics were pursued on an upgraderather than an all-at-once basis, the basic trust of the clericalwork force provided a vital support resource for management.
EXPLOITIVE OR DISCRIMINATORYTREATMENT OF WOMEN CLERICALS
The sites we visited, as already noted, were weighted in the di-rection of organizations with positive human resource philosophiesand good labormanagement relations. Nevertheless, we visitedsome sites and collected non-site-visit interviews with women cleri-cals in which a pattern of exploitive and discriminatory treatmentof women clericals was demonstrated. Here, too, the advent ofoffice sys:em technology was almost never the source of the poorpractices. These managements had applied harsh personnel prac-tices and engaged in sex discrimination before they had installedVDTs. Now, they were extending their basic approacheF into new-technology work settings. The following vignettes, dray . 7rom ourinterviews and from the Asher (1983) transcripts, ill crate someof the main kinds of practices women clericals are encountering:
Sheila is a young woman just out of high school who had re-ceived basic training in word processing as a course in school. Sheobtained a job with a small mail-order jewelry firm in a metropoli-tan area that sells low-cost diamond rings. Five operators verifycustomer orders, trace invoices, enter refund amounts, and performsimilar operations at their VDT keyboards, accessing a customerdata base. Their work is monitored by computer printouts andalso by sthlreiilance cameras used by this firm, both for securitypurposes and to watch employee performance. Sheila recalled that"they used the cameras to watch how hard you seemed to be work-ing, when you got up to stretch or take a break, and your 'attitude'at work. It was really a totally monitored place." This woman wasnot granted the standard raise after 6 months of "probationary"work at minimum wageeven though this was recommended byher supervisorbecause the management said "she didn't looklike she was working that hard" when they observed her on thecamera. She had no access to her own production figures or tothose of other employees with which to challenge that judgment,nor were there stated production standards she could rely on even
343

332 APPLICATION OF OFFICE SYSTEM TECHNOLOGY
if she had any complaint procedure. She quit in anger and disgust,as did many of the women working in this small shop after theirfirst 6 months. The management saw such a heavy turnover asquite all right, since they had a steady supply of trained VDToperators willing to take "probationary" pay, and the firm didnot need operators knowledgeable about the business to do thedata -entry work involved. Sheila decided to leave VDT work andis now employed in the food service business.
Marian worked for 10 years as a customer-service represen-tative for a city government transportation agency in the North-east. She used the telephone and manual files to handle callsreporting problems on the bus system, in an all-female depart-ment. When the agency put in a terminal system, a set of dailyproduction quotas was set by the new male operations managerwho took over direction of her unit. Training was weak, and mostof the women in the unit had trouble meeting the quotas. Many ofthe women developed headaches, stomach pains, and muscle pains.Marian developed serious chest pains, and was told by her doctorthat it would be "dangerous" for a 55-year-old woman to continueworking at a job that was creating such symptoms. When Mariandiscussed the chest pains with the operations manager, and herfeeling that this was caused by the high quotas, he said that "thewomen will have to keep up or get out." When she tried to appealhis position to higher management, she was told that decisionsconcerning work quotas were up to unit managers, and may' .e "itwas time for her to retire." Marian left the agency and now worksfor a rt. all store. She feels that she is "a victim of the computerage," but especially because she and her colleagues were women."I don't think they would get away with that if it was a newgarbage truck that was developed, or if the terminal was broughtinto the accounting department, which is mostly men."
Claire, 57 years old, is chief clerk in the cash loan surrenderdepartment of a large insurance operation run by a national reli-gious organization. After graduating from high school, she enteredthe Army Air Corps for 2 years (serving in a motor pool in WorldWar II), worked in manufacturing, and later in an office job. Shejoined the religious organization as a clerk in 1960 and has beenthere for 20 years. She uses a VDT occasionally for calculatingloans and cash - Surrender payments, but does not work intensivelyon the terminal the way other clerks do. Claire is also the pres-ident of the local union of the Office and Professional Workers
I 1 4 I<A (j.... ..,

ALAN F. WESTIN 333
that represents about 300 employees at this company, a post shehas held since the early days of the local union, in 1962. Clairesees blatant sex discrimination as the long-time, regular policyof the organization. Men have all the executive and departmentmanager posts; women stay in the clerical ranks. The best EDPjob sectorssystems positionsare held by males. Women workalongside men and "are being paid less." When new jobs openup that have higher salaries and status, they are supposed to beopen to bidding by all, but a man always gets them. The unionhas filed sex discrimination complaints with the state commis-sica on human rights, but has lost its cases. Also, this companyhas been shifting the higher levels of VDT work into jobs that itnow classifies as "supervisory work," which takes them out of theunion bargaining unit. These jobs also are overwhelmingly filledby males. The union has filed charges contesting this with theNational Labor Relations Board (NLRB) and has raised the issuein contract bargaining talks, but has lost there as well. Claire seesthis religious body as really conducting a commercial operationavery big onebut running it under the cover of the religious or-der, and getting away with discriminatory practices "that it oughtto be ashamed of." Claire feels that it runs as a "men's club,"and that legal and union actions will be the only way to forcechange. Some women have been admitted to underwriting andprofessional jobs, but these have not been promotions for talentedclerical women.
It would be easy to multiply these vignettes many times over.What they have in common is that exploitive or discriminatorypractices that were followed in pre-VDT work settings are nowbeing applied in the context of VDT-based clerical work.
THE CENTRAL ROLE OF MANAGEMENT PHILOSOPHY:"GREAT NORTHERN" AND "NATIONAL SERVICES"
Policy choices of user managements are key to whether womenclericalsor any other VDT usersexperience good or bad workand are fairly or unfairly treated at the workplace. To illustratethis concretely, we present anonymous profiles of two large cor-porations we visited. We will call these "Great Northern" and"National Services" and make only those alterations of fact nec-essary to prevent recognition of their identities (the profiles are
34'.;

334 APPLICATION OF OFFICE SYSTEM TECHNOLOGY
adapted from Westin et al., 1985). Both of these are well-knownnational firms with successful products and services and currentlyprofitable operations. Neither firm has had any significant sexor race discrimination findings against them by EEO agenciesor courts over the past decade. Each is also well regarded inmanagement circles and in general public reputation for its pastemployee-relations policies.
Between 1982 and 1984, managements enjoyed almost totalautonomy in applying office system technology, because there wasno state or federal legislation in place and virtually no EEO agencyattention to special issues of office technology impact. Less than10 percent of clerical workers were represented by unions, andeven in union-represented workplaces, neither collective bargainingcontracts nor grievance systems exercised significant influencesover management use of VDTs.
In the Great Northern example we found evidence of sexstereotyping. Sex roles at Great Northern follow strict lines.About 95 percent of the nonexempt workers using VDTs to docustomer-service work are women, primarily white. Supervisors ofthese women are mostly female. At the sales level, the jobs are 95percent male. At the local-offices level, at which this company'swork is primarily done, managers are virtually all male, except forthe post of "Personnel Specialist," which has been made into afemale-typed position and is mostly occupied by women.
When we interviewed women VDT operators, the absence ofcareer paths into sales and management was often brought up.At Great Northern, about a third of the VDT operators havecommunity college or even 4-year college degrees, and many ofthem would like to move up into sales and management ranks.There is no path for them to do that now, and their morale is low.
In addition, when we met with women supervisors at GreatNorthern offices in five states, there was much banter about the"token woman" personnel specialist at their locations, and aboutthe absence of promotional opportunities for these women super-visors into sales or middle-management ranks. "We were the onesthat put the new computer system in, worked out its bugs, trainedthe operators on the CRTs, and made the transition into the auto-mati system succeed. But none of us are considered good enoughto go into management. That's the 'boy's preserve.' "
Women supervisors were bitter in their comments on GreatNorthern's male management. They feel that headquarters people
3

ALAN F. WESTIN 335
"tap dance around questions" raised by women and that "staffdoesn't have much credibility." Nothing is done about the com-plaint that women are not being allowed into field jobs that area prerequisite for moving into management posts, nor are womenwell represented in Great Northern's Management DevelopmentProgram.
As a result of these policies, women we interviewed see com-munications between employees and management as poor, andmanagement's basic posture as highly defensive, mostly concernedwith averting unionization. There is an "open door" type com-plaint program at the company, but, as one woman put it, "Thedoors may be open, but their ears are closed." In some local of-fices, women told us that the atmosphere was annoying"womenare called 'honey' and 'sweetie' or 'girls,' and the men are verycondescending."
Some members of the personnel staff at Great Northern'snational headquarters are aware of this situation. In fact, concernover sex stereotyping and lack of affirmative action promotionalopportunities for women clericals and supervisors surfaced in onerecent employee survey in which two-thirds of women said theyweren't satisfied with their chances for advancement. However,when this firm underwent a recent reorganization and a reductionin staff, its sales and management ranks became loaded with menwho had seniority, and top management doesn't want to "cockthe boat." The alternatives it is considering include having morepart-time employees (and getting some men for that work), andaccepting a much higher turnover rate among its now dissatisfiedfemale customer-service work force than this company would haveaccepted in earlier times.
Very few of the upwardly striving women clericals or supervi-sors that we talked to felt anything would change soon at GreatNorthern. They like the company, they like the new VDT work,but they feel like second-class citizens in terms of fair treatmentas women.
In contrast to Great Northern, when National Services decidedto create a large customer-service center for ordering parts andsupplies for its manufactured products in an all-VDT system, itset out to imps ve the work environment. Traditionally, thosejobs had been women's work, done by telephone, and there was noshortage of female job-seekers in the exurban community in whichthe call center would be located.

336 APPLICATION OF OFFICE SYSTEM TECHNOLOGY
In setting grade levels for this work, however, and in its adver-tising, recruiting, and interviewing processes, the location managerand personnel staff of National Services decided that it wanted amixed work forcemen and women, black and white, and olderas well as younger workers. Its experience told it that morale ishigher and employee satisfa'tion greater in such a diverse work-ing group, and this firm has an anticipative approach to equalemployment opportunity (EEO) and affirmative action consider-ations. The location-staffing objective was aided by two otherfactors: the weak job market when they opened this facility andthe strong national reputation of this firm as a good empioyer.These factors provided them with a large applicant pool of men aswell as women, and people of varied backgrounds. In addition, thecompany was able to offer transfers to this location for a variedgroup of its own employees who were being affected by a majorreorganization this firm had also undergone. The result was aboutas evenly balanced a customer-service work force at the VDTs asany political party convention manager or EEO visionary couldimagine, by sex, race, and age.
Since the pay levels at National Services are above averagefor customer-service work in the area, since there is a generousbenefits policy, and since the firm has a history of providing strongjob security, it was not surprising that individual VDT operatorswe interviewed considered working at this site an "outstandingjob." They particularly liked the mixture of people they workedwith. "I used to operate a VDT at an all-women's job," one youngwoman in her twenties commented, "and it was a sorority houseall day. Here, there are men of various ages, and things are justmore interesting."
Of /0 women we specifically asked about their career plansat this company, 6 were working to go into supervision or pro-gramming and felt they had good prospects of succeeding in theseambitions. One was entering a sales training course offered by thecompany. The other three said they expected to keep on workingat their cust_iner-service jobs for the near future. This firm hasan annual career-planning exercise at which each employee andmanager discuss the employee's skills, performance, and aspira-tions and develop a blueprint for advancement for those employeesseeking it.

ALAN F. WESTIN 337
TWO COMPANIES, TWO PATHWAYS
These two companies illustrate two different pathways to of-fice technology implementation. At Great Northern, because ofits reorganization and consolidation, VDT customer-service workwill probably remain almost all female, unsatisfying for the ca-reer concerns of many of these women employees, and likely tomake Great Northern's employees less accepting of managementprogress on other VDT issues (ergonomics, work quotas, stresseffects, etc.). The attitude of top management and especially itsinformation system experts has been highly deterministic; theyfeel that using the technology "requires" that certain work forcepatterns be adopted to achieve maximum efficiency. They assumethat "people problems" created by a need to rush in their newVDT system will disappear as employees "get used to the work."As of 1984, the concerns of some personnel staff at Great Northernhad not led to any basic change in top management's blueprint orits attention to women's issues.
At National Services, top management, its technical special-ists, and its personnel staffs have a philosophy that office systemstechnology should be used in ways that further the firm's basic em-ployee relations and "people policy," rather than undercut these.Management set out to create a certain kind of VDT work forceat its new center, and they achieved it. They report that produc-tivity, the employee climate, and overall facility effectiveness havebeen excellent; and our interviews confirmed high employee sat-isfaction, especially among women. National Services follows thesame policies as to equality and opportunity for all its employees:clericals, professionals, and managers. It has uniform policies inall its installations, in central cities as well as suburbs and ruralareas, and it has facilities in all types of communities. Its ap-proach is also carried through in bad as well as good economictimes, rather than being an approach that is tailored to exploiteconomic pressures.
RESEARCH IMPLICATIONS
The larger study on which this paper is based draws on datagenerated in an exploratory field study. We identified issuesrelating to office technology and women clerical workers which
343

338 APPLICATION OF OFFICE SYSTEM TECHNOLOGY
should be fully explored and studied through structured and rep-resentative social research. However, there are many conceptualand methodological difficulties associated with trying to measure"technology impact," especially on the interests of women workers.
First, the treatment of womeL at the workplace and their op-portunities to achieve good jobs, equal pay, and fair participationwith men is shaped by very large social forces and not just of-fice technology applications. These forces include the following:overall economic conditions, national and local labor markets,changing requirements for particular occupations or skills, and in-dustry employment and staffing trends. They also reflect patternsof sex discrimination in American society and institutions thathave been built up over long periods of time and that are not eas-ily dismantled. Although some of these discriminatory attitudesand practices at the workplace are in the process of being changedin our time by new social values, women's rights pressures, andEEO law enforcement, they remain significant factors affectingmost working women, especially in long-time sex-segregated areassuch as clerical and secretarial jobs.
Second, quality of work life and equality issues for womenclericals are powerfully affected by the general levels of employ-ment available in our society. This will be shaped significantlyby the overall strength of the U.S. economy and competitivenessof American companies in a global economy marked by high-techtools and low-wage work forces; by the levels of government em-ployment available in the next decade (and the fiscal strengths ofthe economy that undergirds this); by social policies in educationand retraining of workers, job sharing, and work week length; andby the distribution of the rewards of achievement among variousclaimants in the social system.
Finally, in terms of social impact, the introduction of newoffice technology can have one of several alternative effects onthe equality and quality of work-life interests of women clericalworkers:
OA could produce important positive changes in the ob-jective condition of women clerical workers, along dimensions suchas pay, job quality, working conditions, career opportunities, etc.
OA could have no appreciable effects one way or the otheron the equality and equity interests of women, proving to be a weak
35..i

ALAN F. WESTIN 339
or even negligible factor when measured against larger economic,social, or legal forces unfolding in contemporary offices.
OA could reinforce existing negative aspects of the statusquo, perpetuating patterns of differential treatment of women cler-ical workers in aspects such as pay, promotion, and participation.OA would therefore operate to retard or weaken social efforts toclose the equality gaps between women and men office workers.
Finally, OA could actively increase discriminatory treat-ment of women clerical workers, by enlarging the differential treat-ment of women in office work under what were perceived by man-agements as imperatives for effective technological utilization andeconomic efficiency.
Researchers therefore need to frame studies that set baselinesof pre-OA conditions; measure changes in objective conditionsand perceived worker satisfaction in OA settings and comparedto non-OA work; factor in the presence of changing economicconditions, social values, and legal standards; and produce as solidan empirical description as can be assembled for all scenarios.
THE FUTURE OF GOOD USER POLICIES
Events are moving rapidly in the evolution of user policies to-ward the "people" and "quality of work life aspects" of installingand expanding office system technology. Both the positive andnegative incentives we noted earlier are increasing the motivationof managements to address these VDT issues. In addition, mod-els for management have been suggested by negotiated provisionson VDT work in collective bargaining contracts, such as thoseat Boston University, Equitable Life Assurance, and others. Fol-lowing the pattern in other areas of technologysociety relations,such as privacy and databank issues in the 1964-1980 period, aset of value judgments, organizational policy frameworks, oper-ating standards, and implementation procedures have begun toemerge as "organizational software" for dealing with VDT appli-cations; and the successful experiences of pioneering, organizationsare beginning to be made available for adoption by mainstreammanagements. There has been a surge of "how to do it" educa-tional materials and seminars for user managements, developed byindustry and government user associations, vendor organizations,university and consulting groups, and many others.
351

340 APPLICATION OF OFFICE SYSTEM TECHNOLOGY
If we were to rank the breadth of adoption of good user policiesinvolving VDTs among the 110 organizations we studied, ourestimate as of mid-1986 would run something like this:
The most widely developing management responses aredirected at ergonomicsbetter terminals, more user-friendly soft-ware, adjustable workstations, and proper work environments.This is the "nuts and bolts" aspect of better VDT policies, andwhile it involves significant costs, it is essentially noncontroversial.Ergonomics can be "sold" within organizations on a combinationof productivity gain, health claim avoidance, and decent treatmentof employees arguments.
Better employee communication on health and safety is-sues is next in rank. Because the great weight of scientific evi-dence supports the position that VDTs cannot be shown to causedisease, managements are increasingly communicating with em-ployees on this issue, preparing briefing booklets and stories inemployee newspapers that report scientific findings and explaintheir conclusions. The "don't make waves" concept of not talkingto employees about VDT health issues has given way in most orga-nizations we visited to direct communications, including practicalguides for exercises to relieve musculo-skeletal tensions, restingthe eyes from intensive VDT work, dealing with job stress, andso on. Reducing potential worker compensation claims, absences,and high turnover provide important employer incentives here.
Next in order of emerging policies would be matters of jobdesign and performance evaluation. Providing variety in tasks, al-lowing employees some discretion in work pacing, setting fair workstandards, giving employees access to work records, and similarmatters are being considered, as more powerful office system ap-plications are applied to claims processing, customer-service work,and secretarialadministrative functions. The key here is usuallywhether the personnel or human resources function is brought intothe application planning, as opposed to having this done exclu-sively by a DP or OA function. Increasingly, personnel depart-ments were being brought into VDT planning in the organizationswe visited.
Employee involvement seems to be the next most wide-spread policy we saw being adopted. Clerical work has not beenas frequent an occupational sector for "quality circle" or otheremployee participation programs as factory work has been in the

ALAN F. WESTIN 341
past 6 to 8 years. This was changing at the sites we visited. In1984-1986, use of employee involvement mechanisms for clericalgroups was clearly growing and almost half of the organizationswe visited were making some use of formal employee involvementprograms in office automation.
As far as unique women's issues in clerical VDT operationsare concernedsuch as pay equity, internal career opportunities,and sex-segregated work groupinginnovative management poli-cies in this area were not developing as fast in 1984-1986 as theother aspects of VDT-based work. Only 25 percent of the sites wevisited were addressing women's issues directly. This is probablydue to a combination of factors: the deeply institutionalized na-ture of organizational policies in these areas; the absence of clearor relatively cheap "fixes" for these problems; the absence of reg-ulatory pressures on these issues from the Reagan administration,federal or state EEO agencies, or the courts; and labor-marketconditions that currently provide employers with ample suppliesof willing women clerical workers.
As of 1986, then, new policies addressing the quality of worklife aspects of VDT use were developing widely among the organi-zations we studied, following the most common to least commonpatterns we have just estimated. Our observation of user publica-tions and educational efforts suggests that this trend is also takingplace among most substantial users of VDTs, especially in theclerical sectors which have generated the greatest publicity andcontroversy. These data are reported in Westin (1987).
However, it is not clearly established whether these employerinitiatives are coming primarily from use's' own learning as tosound employee-relations policies for using office systems technol-ogy effectively, or whether employers are acting primarily to headoff threats of regulatory action and to defuse attacks by unionsand activist groups. Our own judgment is that the office automa-tion controversy has not caused the development of good policiesamong leading-edge organizations, such as the company we called"National Services." However, the controversy has accelerated theprocess of mainstream-user consideration of quality of work life as-pects of office automation and has also strengthened the positioninside mainstream organizations of those staff and managementgroups that believe such policies should be pursued.
'353

342 APPLICATION OF OFFICE SYSTEM TECHNOLOGY
Since policy initiatives are under way in the user community,regulatory action may not be necessary. However, at this time,attitudes toward the need for regulation depend more on the ana-lyst's philosophy about the scope and timing of social regulationthan on any objective or empirical measures of VDT usage condi-tions. The key questions in deciding about regulatory proposalswill be (1) whether the need for regulation can be preempted bywidespread usage of effective, substantive measures in the usercommunity and (2) whether regulatory advocates can produce ev-idence of harm to employee health or well-being that convincespolicy makers that the substantial costs employers would have tobear would be worthwhile.
We have shown that there are good policies present amongsome user organizations we studied, addressing both the qualityof work life and women's equality issues of concern to millions ofwomen clericals in business, government, and nonprofit organiza-tions. These policies work well, are not prohibitively expensive,contribute to strong employee job satisfaction and women's equal-ity interests, and support the productivity goals of organizationsin a time of challenge and competition. How widely and well theseapproaches will be adopted in the next few years is therefore anissue of enormous importance, not only to women clericals but toall employees and employers in the United States and to Americansociety as a whole.
REFERENCESAsher, R.1983 Unpublished transcripts of interviews for the Project on Connecti-
cut Workers and Technological Change. Storrs: University ofConnecticut.
Westin, A.F.1987 VDT Update Report: User Policies and Practices in Applying Office
System Technology. New York: The Educational Fund for IndividualRights.
Westin, A.F., H. Schweder, M. Baker, and S. Lehman1985 The Changing Workplace: A Guide to Managing the People, Organiza-
tional, and Regulatory Aspects of Office Technology. Westchester, N.Y.:Knowledge Industries.
3r3 '4

New Office and Business Technologies:The Structure of Education and
(Re)Training Opportunities
BRYNA SHORE FRASER
THE IMPORTANCE OF TRAINING FOR WOMEN
Will the introduction of new technologies into a wide rangeof business and commercial settings enhance the skill and job op-portunities of those affected? Are existing education and trainingstrategies adequate to help women workers take advantage ofnewopportunities, or will they only serve to maintain the existingopportunity structure? The introduction of new office and com-mercial technologies is of particular concern to working women,who, in 1983, accounted for 99 percent of all secretaries, 97 percentof typists, 92 percent of bookkeepers and bank tellers, 87 percentof cashiers, and 70 percent of retail clerks (Serrin, 1984:A3). Thispaper seeks to determine how these types of jobs are being affectedby new computer technologies, how workers are being trained orretrained in their use, and, wherever possible, how women's expe-riences differ from those of men in the use of the new technologiesand in their access to training.
Studies to date on the differing effects of technological changeon men and women are not encouraging. Data from the firstnational study of technological change show that proportionately
343
3 5 ';

344 NEW OFFICE AND BUSINESS TECHNOLOGIES
more women than men operate machines, are more exposed tomachines that have alienating effects, and suffer more from thenegative effects of technological change. Relatively more menoperate machines that require skill and encourage work autonomy.Moreover, the changes for men enhance their job skills and improvetheir opportunities for advancement. Not so for women (Formand McMillan, 1983). Gutek and Bikson (1984), in a study of 55offices in 26 different private sector organizations, reported similarfindings. Women used computers more than men and used themmore routinely, while men's computer use was more flexible andautonomous. The authors concluded that "nothing in our datasuggests that these 55 offices will use technological innovation asan occasion for improving the situation of working women" (p.16).
A recent survey of 300 senior human resource executives inFortune 1500 firms found that 44 percent of the companies aremost likely to hire new employees with required skills rather thanretrain workers whose skills have become obsolete. Two otherfrequently used options, cited by 40 percent of the companies,are (1) switching employees into new positions that require noadditional skills and (2) reducing the number of employees. Ona more hopeful note, the report states that a shrinking workforce may make it more difficult for companies to rely on newworkers and may make worker retraining a more attractive long-term solution (ITT Educational Services, 1984). Some companiesdo retrain their employees. IBM, for example, supports a policy offull employment, meaning that employees should not lose their jobsdue to advancing technologies, among other circumstances. -Thecompany maintains no records on the amount of retraining giveneach year "because it is business as usual to move people from onjob to a totally different job" (IBM Corporation, 1985:13).
The most sophisticatedas well as the simplestequipmentwill not increase productivity unless those using it have the knowl-edge and motivation to make it work. Recent studies show thatthe prospect of working with new technology is welcomed by mostpeople when it is first suggested. One recent survey of more than500 secretaries and administrative assistants found that "office au-tomation has been accepted with open arms" (Gallant, 1984:24).On a scale of emotional responses ranging from love to hate, 83percent of the respondents said they loved the word-processingequipment, while none expressed any hatred of the equipment.
3 r^.--I',

BRYNA SHORE FRASER 345
Eighty-seven percent said they felt that their word-processing skillswould lead to new career opportunities, while 88 percent expressedthe belief that these skills would result in salary increases.
But the same survey revealed some troubling disparities be-tween respondents' beliefs and the reality of their situations. Only30 percent had actually received pay raises as a result of acquiringword-processing skills, and while 75 percent said that the equip-ment freed them from typing chores and allowed them more timefor work involving decision making, when asked what new respon-sibilities the electronic equipment had allowed them to undertake,alir-at all cited traditional secretarial tasks such as drafting lettersand researching reports.
The survey pointed to the importance of age as a factor.Forty-eight percent of the respondents under age 25 reported payraises resulting from word-processing skills, compared with muchlower figures among older secretaries. The younger secretaries saidtheir knowledge of word processing was more important than suchcustomary skills as shorthand, while the older secretaries placedmore value on traditional abilities. In addition, almost a third ofthe respondents under age 25 had already had training in eitherCOBOL or BASIC programming, compared with a very small per-centage of the older respondents. In another survey of more than1,200 secretaries and 900 managers in 443 information-intensivebusinesses, younger secretaries were also found to view automatedequipment more favorably than their older connterparts. In thissurvey secretaries in particular cited training the single mostimportant change needed when introducing automation into theworkplace. The most frequent suggestion r.-.4de for improving pro-ductivity in businesses where automation already existed was moreand better training (Keefe, 1984:23).
As new technology is introduced into more and more workenvironments, changes will be needed in aork skills and patterns.Changed tasks, roles, and machine pacing must be learned. Forexample, a secretary who moves from a typewriter to a wordprocessor has to learn to increase concentration on work (dueto the machine's sensitivity); hand-eye coordination (due to thespeed of the information flow); and ability to respt,nd to signsrather than complete symbols (due to the shorthand language ofthe computer). All of this learning depends, in turn, on mentalflexibility. Even under the best working conditions, it is difficultfor workers to learn so a:Any new skills well, and all at once. Adults

1
346 NEW OFFICE AND BUSINESS TECHNOLOGIES
often cite a variety of reasons, however, for not participating in(re)training and education programs that would help them learnnew skills. These barriers can be categorized as follows (Charner,1980; Charner and Fraser, 1984).
Situational factors arise out of an individual's position in afamily, workplace, or social group at a given time. Within thiscategory, costs, lack of time, age, and level of education head thelist.
Social/psychological factors are related to an individual's atti-tudes and self-perceptions or to the influence of significant others(family, friends, etc.) on the actions of an individual. Includedare lack of confidence in ability, feeling of being too old, lack ofinterest, and lack of support from family or friends. Only smallproportions of adults report such factors as barriers to their partic-ipation in education or training activities. Women more frequentlythan men report that they feel they are too old to begin. Men, onthe other hand, cite lack of confidence in ability more than women.
Structural factors are policies and practices of organizationsthat overtly or subtly exclude or discourage adults from participat-ing in (re)tra;ning and education activities and include schedulingproblems (course and work); location and transportation prob-lems; lack of courses or relevancy of courses; procedural problems(red tape, credit, admission, required full-time attendance); andinformation/counseling problems. These factors fall between sit-uational and social/psychological barriers in the proportion ofadults reporting such factors as deterring their participation. Lo-cation, scheduling, and lack of courses are most often mentionedas barriers, with few differences among subgroups of adults.
Given the general barriers confronting adults participating inany (re)training/education program, how does a clerical worker,secretary, telephone operator, or any of the millions of workers inservice and retail occupations go about getting trained in up-to-date technological skills for office and commercial settings?
The next three sections briefly describe a variety of programscurrently provided by employers, educationd institutions, andgovernment agencies that can be used by women workers. A finalsection outlines education and training policies that, if adopted,would contribute to a smooth transition for women workers fromthe old work environment to the new. One of the most impor-tant policy areas discu-sed is the need for more information. In-deed, the following description of available programs suffers from
3

BRYNA SHORE FRASER 347
a lack of published information. Not only do we not know howmany programs are available to which workers, we also know littleabout their effectiveness. Careful review of the latest journals,newsletters, and publications dealing with the retail trades, officeautomation, computer technology, management, and training anddevelopment yielded little in the way of gender-specific examples oftraining in new office and business technology for this population.Furthermore, most companies are reluctant to provide detaileddescriptions of company-specific training courses, and while al-most all organizations with 500 employees or more have at leastone full-time person responsible for training activities, many officeand commercial enterprises employ less than 100 employees andhave no one in-house with even part-time training responsibili-ties. Therefore, much of the program-specific information relatedbelow has been based on the limited published material availableor on anecdotal information provided by researchers or programsponsors.
EMPLOYER-PROVIDED EDUCATION AND(RE)TRAINING PROGRAMS
Employer-provided training includes a wide variety of pro-grams that are either provided or sponsored by an employer. Al-though private and public employers provide the lion's share oftraining in the United States, spending $30 billion annually accord-ing to the American Society for Training and Development (morethan three times the amount spent by federal, state, and localgovernments combined), mcst of these programs are concentratedin only 200-300 of the largest companies. Furthermore, businessesare spending more and more money on remedial math and readinginstruction rather than on focused skill training (BusinessHigherEducation Forum, 1984:30).
A substantial portion of corporate training is generally gearedto respond to changes ii -. company's technology, organization,or products. In the case of technological innovation, for example,manufacturers of office computer equipment usually provide train-ing for employees of companies buying their equipment. There areno statistics on the volume of this training, but prevailing wisdomsuggests that this is a major mode of training, if not the mostimportant one.

348 NEW OFFICE AND BUSINESS TECHNOLOGIES
Subjects in which training is provided include the operation ofcomputers of various sizes with already-prepared programs, pro-gramming, maintenance and repair, systems management, othermanagement problems associated with computers, communica-tions systems, and operation and programming of computer-as-sisted desig.1 or manufacturing equipment.
The courses are typically brief, lasting from 1 to 5 days, al-though some courses go on for several weeks. They tend to bequite specific, focusing on a single model of equipment, use of asingle program, teaching a single programming language, and soon. Thus, an employee wishing to advance beyond this level mayneed to take additional courses to round out the skills acquired.Moreover, since the technology is changing rapidly, the employeemay need retraining in order to learn new equipment.
Self-study is used extensively. Textbooks, programmed learn-ing books, anie computer-based training programs are availablefor many of the subjects. A growing proportion of this materialis being produced in the form of video cassettes, computerizedinstruction, satellite-transmitted teleconferences, and other waysof allowing the necessary training to take place in many locationsand at flexible times. At the same time there continues to be muchuse of traditional printed manuals. Only rarely, however, is thismaterial geared to the needs of a particular group.
Employer-provided/sponsored training generally falls into oneof four categories: (1) in-house programs, (2) contracts with apostsecondary educational institution, (3) tuition assistance pro-grams, and (4) union-negotiated (re)training programs. Variousanecdotal examples of each type of program are presented below.
IN-HOUSE PROGRAMS
In-house training programs are usually delivered by companystaff, frequently by a pact- or full-time trainer. Employers eitherdevelop their own training curricula or buy/lease prepackagedtraining programs. A third option is to bring in outside consultantsto design and/or deliver training courses at the worksite.
A good example of an employer-designed and delivered pro-gram is provided by the Intel Corporation, a manufacturer of inte-grated circuits, which recently installed 65 personal computers inits microprocessor division over a 6-month period (Johnson, 1985).

BRYNA SHORE Fr.!ASER 349
Implementation activities focused on three efforts: the Continu-ous Learning Center (CLC), the Offi-e Systems Center (OSC),and twice-monthly meetings for all the microprocessor divisionsecretaries. The CLC was designed as a place where people wouldboth learn how to use the PC and bring their new applicationsfor others to learn. The OSC provided "hot line" help for anyonewho needed immediate assistance with either the hardware or thesoftware. Currently, the OSC's primary activities are training andsoftware applications and evaluation.
To evaluate the success of the implementation process, In-tel used as h control group secretaries who had been given thesame PCs but who had received a more conventional 8 hours oftraining from in house word-processing instructors. Based on theself-reports of 20 microprocessor division secretaries and 9 controlgroup secretaries, 52 percent of the former reported an increase inproductivity compared with 15 percent of the controls; 80 percentof the first group reported new procedures developed comparedwith 10 percent of the control group; and 70 percent of the micro-processor division secretaries reported new uses in place comparedwith 20 percent of the control group secretaries. In addition, thesecretaries in the first group had freed up 2 hours a day they hadpreviously spent in typing revisions. They were using this timeto (1) support more people; (2) provide better support for theirmanagers (e.g., drafting routine reports previously done by theirmanagers); (3) eliminate the need for temporaries; and (4) de-velop more PC skillsthey now have time to spend in the CLC,as they are completing their other work in half the time it usedto take. These secretaries have become a creative source of newapplications and have been rewarded by their managers for theircreativity. They have also gained new respect within the com-pany for their use of PCs as information tools. Further follow-upof these different training approaches by Intel could assess thelonger-range career impacts of each approach to PC training forsecretaries.
United Virginia Bank, which purchased a computer-basedtraining program designed to increase the effectiveness of its tellertraining efforts, provides an example of employer delivery of a pur-chased program. The bank determined that a generic computertraining program could be purchased from a local vendor at muchless cost than developing an interactive videotape system in-house.
36

350 NEW OFFICE AND BUSINESS TECHNOLOGIES
The purchased program consisted of 22 lessons, supporting texts,and other materials.
Each year, more than 100 tellers in the Richmond region, thevast majority of whom are women, attend the bank's 4-week tellercourse. The trainees in each class spend the first 4 days of theirtraining on the terminals. The program presents lessons and asksthe students relevant questions. It also tells them whether theyhave answered correctly. Students move at their own pace. Theinstructor is free to help students who require one-on-one assis-tance; meanwhile, the rest of the class members stay busy at theirterminals. Trainees say they enjoy learning from a computer andthey now score higs.er on final, tests-90 percent or moreand arebeing taught 15 percent more than with traditional methods. Theprogram also shaves 1 day from classroom work. Overall, UnitedVirginia Bank views its experience with computer-based trainingvery positively, and the bank intends to continue to experimentwith the concept and expand the program (Coleman, 1983).
With the help of outside consultants, Metropolitan Life Insur-ance Company developed a program to train 20,000 employees at1,250 sites to use the company's recently acquired minicomputer-based network. Metropolitan is spending more than $30 millionfor the network hardware and approximately $3 million for thetraining program. Applications of the system include data entryand editing, a client data base specific to each sales office, wordprocessing, electronic mail, and policy and contract illustrations.Almost all Metropolitan employees will be users of the system.
Metropolitan's training plan was developed with the help ofan outside consulting firm. Called a "top-down" training program,it resembles an inverted pyramid in structure. Senior exect,tivesin the personal insurance field were trained first, senior sales staffwere trained second, and key people in eight regional head officeswere trained next. Each regional office became home to a nucleusof six to eight trainers. Next in line were the "critical users"sales managers and office managers in 1,100 U.S. sales outlets.These users traveled to the company's eight regional head officesfor training. When the sales and office managers were trained,they became responsible for training sales office staff. The trainingemphasized hands-on experience, with 20 percent of the time spentin lectures and the rest of the time spent actively using the system(Desmond, 1984).

BRYNA SHORE FRASER 351
Outside consultants can also be used to deliver complete train-ing programs. ITT Educational Services, Inc., Business Division,offers employers complete training programs (including provisionof facilities) in such areas as automation, bank teller, computerprogramming, data processing, electronic office-machine technol-ogy, keypunch operator, retail technical sales, secretarial, telecom-munications, and word processing. In addition to generic orcustom-designed training programs, ITT offers to take care ofall arrangements, including site selection, employee recruitment,student enrollment, assessm .it, basic/remedial education, Englishas a second language, skill training, career counseling, and supportservice coordination. ITT also offers more advanced training be-yond the initial level for supervisory personnel, as well as coursesthat provide part of the training at the trainee's workstation onthe job.
CONTRACTS WITH POSTSECONDARYEDUCATIONAL INSTITUTIONS
Many employers, particularly those smaller businesses that donot have an in-house training capability of their own, are contract-ing with postsecondary educational institutions for both custom-designed and generic training programs. A growing number ofcollegesmainly 2-year community collegeshave established of-fices or centers to offer the colleges' educational services, resources,and facilities to local business and industry, although, overall, in-stitutions of higher education provide only a small amount ofemployer-sponsored education and training. The majority of con-tracted programs involve a small number of employees and are ofshort duration, ranging from a 1-hour seminar to a full-semestercourse. These programs may be standard courses identified in thecollege catalog that are presented at times and locations conve-nient to the firm and in time blocks appropriate to circumstances;they may be customized versions of standard college offerings; orthey may be totally new programs, structured to meet the specificdemands of the company. They may be taught by college facultyor by instructors hired specifically for the course.
The Vermont State Colleges Office of External Programs(OEP), for example, assists employers, particularly in small busi-nesses, to identify their education and training needs. Through its
3 6 3

352 NEW OFFICE AND BUSINESS TECHNOLOGIES
Educational Brokering Service, OEP communicates these employ-ers' needs and specifications to more than 30 educational institu-tions in the state. Interested schools then bid on providing thetraining services, with the employers making the final selection ofthe desired program provider.
TUITION ASSISTANCE PROGRAMS
A very high proportion of companies, particularly the largerones, have some form of tuition aid or tuition assistance programsunder which employees receive partial or full reimbursement ofthe costs incurred for courses taken on their own. Generally, theseprograms have a very low participation rate, particularly amonglower-level, nonmanagement employees.
Unlike most programs, the Polaroid Corporation's Tuition As-sistance Plan has a very high rate of participation, even amonghourly employees. Polaroid has developed a systematic and com-prehensive series of courses and programs for its employees whichincludes internal education and skills training programs; technol-ogy-based programs and seminars for technical and nontechni-cal personnel; and career counseling workshops to help employeesdetermine career goals and methods for achieving them.
The Tuition Assistance Plan prepays 100 percent of the costsof approved educational programs successfully completed by em-ployeesboth hourly and salaried, with all those working 20 ormore hours per week eligible to participate in the plan on a pro-rated basis (30 hours equals 75 percent payment). Acceptablecourses and programs include
Any basic course in reading, writing, or arithmeticCourses or programs that will improve the employee's skill
on his or her present jobCourses or programs that relate to the next job in the
employee's job familyCourses or programs required or relevant to a trade or
craft licensing or certification program appropriate to the indi-vidual's career and specific to Polaroid's need for the trade- orcraft-specific degree programs (associate, bachelor's, and gradu-ate degrees). All engineering, science, mathematics, accounting,finance, and secretarial programs. All general business manage-ment, marketing, transportation, economics, journalism, nursing,and criminal justice programs, if currently job related.
3 t; 4

BRYNA SHORE FRASER 353
According to company figures, about 6,000 (50 percent) of itsdomestic employees participated in an average of 1.5 internal orexternal education and training programs in a recent year. Tenpercent of the eligible domestic work force participated in theTuition Assistance Plan, and of these, 40 percent were from thehourly ranks (Knox, 1979).
UNION-NEGOTIATED (RE)TRAINING PROGRAMS
Unions are very active in the support of training and retrain-ing for their members. A number of union-negotiated agreemefltscall for advance notification of expected technological changes andthe retraining of those workers who would be displaced. A recentexample is the Communications Workers of America (CWA) Na-tional Training Fund, under the retraining provisions negotiatedwith the seven regional Bell System holding companies. A provi-sion in the agreement stipulates that retraining will be providedfor any worker who needs or desires it. Local committees havebeen established in each of the seven regions and are responsiblefor the development of appropriate programs in response to localmembership needs.
CWA Local 8519 has developed, through its Arizona TrainingFund (ATF), a 600-hour, 15-course curriculum leading to a LevelI certification in telecommunications. Interested CWA memberscan enroll in courses ranging from Basic Circuit Reading to DigitalElectronics as well as an elective computer literacy course. Allcourses are fully accredited, and tuition costs are reimbursed byMountain Bell and AT&T. Of the 316 CWA members who havetaken one or more ATF courses, about 55 percent are female.Thus far, no one has failed, but 26 persons have dropped outwith an additional 9 incompletes, resulting in an overall retentionrate of nearly 90 percent. The ATF training program is aimedat developing "broad, generic skills that will be useful to CWAmembers inside or outside the Bell system" (Hilton, 1984:4). As aresult of their participation in the program, many CWA membershave been promoted, while others, threatened with job loss, havefound new jobs outside the Bell companies.
Only a very small number of workers in offices and businessesbelong to a union. The majority of employees in these work settingsare dependent on employer-provided (re)training or must look toother sources of education and training for programs.

354 NEW OFFICE AND BUSINESS TECHNOLOGIES
SUMMARY
Corporate training that is mandated, provided, and/or paidfor by the worker's employer can eliminate a significant numberof the barriers facing employed adults noted above. Some of thesebarriers and the means used for overcoming them include
Financial constraintsemployer finances the total costs ofthe training.
Time and location constraintsprograms are offered atthe workplace or a nearby training facility during ri 'ilar workinghours.
Problems due to prior educational attainmentremedialcourses are offered; programs are held in familiar or nonthreaten-ing settings (e.g., the workplace); active, hands-on participationby the learner is encouraged.
Scheduling problemsprograms are generally short term,at or near the workplace, with flexible curricula.
In addition, training is provided on state-of-the-art equipmentand frequently gives the trainee important, transferable skills use-ful for job and career transitions.
Unfortunately, not all workers have the opportunity to receivetechnology training from their employers. And, of course, thereare thousands more unemployed adults who desire such training.They must rely on other providers.
EDUCATIONAL INSTITUTIONS
The range of education and training opportunity currentlyavailable, in addition to that provided or sponsored by employers,is considerable and is offered by a wide variety of institutionalproviders and organizations. While it is likely that, for the fore-seeable future, employers will continue to provide the majority oftraining in a variety of new t :hnologies, educational institutionsare increasingly offering training in a variety of new technologiesas part of their educational programs.
NONCOLLEGIATE POSTSECONDARY SCHOOLS
A growing number of people are turning to noncollegiate post-secondary schools (often called proprietary or trade and technicalschools) for courses in electronics, communications, computers,
3', 6

BRYNA SHORE FRASER 355
health care, and secretarial fields. In the past 2 years, enrollmentsin these schools have increased by 25 percent. More than 1.5million people are enrolled annually in these public and privatetraining institutions. Women, once a minority in these schools,currently constitute 52 percent of their enrollments.
Many proprietary schools are small and independently ownedand specialize in training students for a single vocation. But manyothers are part of chains of three, four, or more schools. Largenational corporations are active in the field, too. ITT EducationalServices, Inc., is the leading example, operating a nationwidenetwork of 28 proprietary schools offering technical and businessprograms and 19 career training centers. ITT trains more than15,000 people annually in 39 business and technical skill areas.Offering primarily vocational and techniCal courses on a part-timeand full-time basis, noncollegiate postsecondary schools do notgrant degrees. Programs last from 2 weeks to 2 years. Tuition for atypical 10-month course held 5 days a week, 5 hours a day averages$2,000, a price that clearly puts it out of reach of the average low-skilled, low-paid worker or unemployed would-be worker. Thereis no guarantee of a job upon completion of a course, althoughthe schools frequently emphasize the high starting salaries offeredin sought-after fields and the schools' close links to communityemployers.
Noncollegiate postsecondary schools maintain a high degreeof flexibility in admissions reqnirements and in courses offeredand are generally responsive to local employment needs. In re-gard to the effectiveness of these schools in training students foractual jobs, however, evidence to date is mixed at best. Severalstudies have found that relatively few graduates of professional ortechnical-level training courses actually find jobs in that area. Thisis particularly true for graduates of computer courses. Clearly, theneed for obtaining information on quality of the program, comple-tion rates, entry requirements, costs, financial aid, job placementrates and assistance, and refund policies is crucial for any individ-ual seeking (re)training in hopes of obtaining a new or better job(Kaercher, 1983).
TWO -YEAR COLLEGES
The nation's 1,296 2-year community and junior colleges offera variety of courses in technology training and updating, for those
3 fi`i

356 NEW OFFICE AND BUSINESS TECHNOLOGIES
currently employed as well as those seeking to enter or reenterthe labor market. Because the majority of the 2-year schoolsare publicly supported, tuition and fees are generally low andaffordable. Also, because of their liberal admissions policies, 2-year colleges may be particularly attractive to those would-beadult learners who have not fared well within the traditional formaleducation system.
Recent data reveal that the community and junior college pop-ulation is a working population (in 1985, more than 70 percent offull-time students at 2-year colleges were employed), with partic-ular interest in the occupational pay-off of the programs in whichthey are enrolled. The data also show that the 2-year collegesare serving an extremely varied clientele consisting of adults (theaverage age of community college students is 27), women (whocomprise 55 percent of enrollment), minorities, and the "disad-vantaged," as well as substantial numbers of conventional postsec-ondary students (Charner and Fraser, 1984).
These schools have been very responsive to the learning andtraining needs of adult workers in their communities, particularlyblue-collar workers. A recent study indicated that 41 percent ofcommunity colleges had developed programs in response to unionrequests. Twenty-five percent were offering classes off-site in work-places, union halls, and community centers. Programs includedskill-upgrading in such areas as el' _Ironies, welding, and secretar-ial work. The main unions involved were the electrical workers,machinists, carpenters, plumbers, and sheet-metal workers (Gold-stein, 1984). It is likely that this responsiveness on the part ofcommunity colleges accounts for the finding that a higher percent-age of blue-collar and service workers enrolled in adult educationwere in 2-year colleges than in any other type of institution (Na-tional Center for Education Statistics, 1979).
Community and junior colleges also work effectively with localbusiness and industry. These partnerships take a variety of forms,most frequently including plant-specific training provided by thecollege under contract with a local employer or employers, equip-ment use or donation, industry assistance in dev'clopin programs,faculty assignments in industry, industry pe-.."-innel as part of theinstructional staff, sharing of facilities, and on-the-job training.
One cooperative program is the Associate Degree Programfor Motorola Technicians operated by the Rio Salado (Arizona)Community College. Its goal is to train entry-level workers to
3 fj

BRYNA SHORE FRASER 357
develop knowledge and skills sufficient to earn an Associate in Ap-plied Science degree in Electronic Technology and to allow them toreturn to the workplace at a higher-level job. Traditionally tech-nicians in this industry have been men while wemen have tendedto fill the ranks of the assembly-line. The program's objective isto move more women into higher-skilled, better-paying technicianpositions.
Normally a 2-year degree program, the 64-credit program hasbeen compressed into 1 year. The curriculum leads to an Associateof Science degree for either an electrical technician or semiconduc-tor technician and was developed jointly by the college and the in-dustry. Courses are concentrated in a short time period of 5 weekswith classes meeting for 3.5 to 4 hours, 5 days per week. Among thecourses included are Introduction to Algebra, Economics, GeneralPsychology, Electronics I, Speech, Stress Management, Digital andLogic Circuits, and Solid State Devices. Finally, all participantstake part in on-the-job training cooperative work experience whenthey actually work at technician jobs in the plant. In additionto instruction, the college provides counseling and other studentservices.
Motorola provides the students for the program from the ranksof its assembly-line employees. The company pays the employee'ssalary for the entire year of the program, in addition to all appli-cable tuition and book costs. The company also has provided aTechnical Training Center at the work site consisting of 2 class-rooms (for instruction) and 18 lab stations (for instruction andpractice). A full-time director, lab technician, and secretary arealso provided by the company. The cost for the program runsabout $18,000 per student. This includes student salaries but notfacility and staff costs.
Participants in the program included 130 individuals, almostall women, over 2 years. Although placement in technician po-sitions was not guaranteed, 98 percent of participants completedthe program, and 95 percent of the participants were promoted,on a competitive basis, to either electronic technician or processtechnician positions in the company. The average salary increaseafter program completion was approximately $2.00 per hour, from$8.25 per hour as an assembly line-worker to $10.00 per hour as astarting technician.
3'$ 9

358 NEW OFFICE AND BUSINESS TECHNOLOGIES
FOUR-YEAR COLLEGES AND UNIVERSITIES
Colleges and universities have long been involved in the fur-ther education of adults through their continuing education andextension departments. Approximately 1,230 4-year institutionsof higher education operate such programs or variations thereof.In general, the range of courses is broad and varied, although usu-ally not for degree credit. The participants in these continuingeducation programs are usually well educated and fairly well-off,and the programs are generally supported almost entirely fromstudent fees.
Recent trends in overall college enrollment indicate that morewomen and adults are entering the regular departments of collegesand universities. Overall the proportion of college students whowere women rose from 43.1 percent in 1972 to 51.5 percent in1982. Students 25 years old and over accounted for 28 percentof enrollment in 1972 and for 35.6 percent in 1982. Part-timestudents increased from 34.1 percent of the entire student body to41.9 percent in the same time span (National Center for EducationStatistics, 1983:98). Given the decline in the traditional youthfulpopulation and the increase in adult students, higher educationinstitutions may be forced to move away from what some criticshave called prejudice against the adult worker toward a "newunderstanding of adult learning" (Barton, 1982:143).
Colleges and universities are providing more learning oppor-tunities for adults through two separate approaches: adapting thedelivery of traditional programs to accommodate a nontraditionalstudent population and offering nontraditional programs to bothtraditional and nontraditional students. Among the modificationsbeing made are scheduling classes at night and on weekends; of-fering classes at diverse locations, such as libraries, employmentsites, and union halls; using the media to transmit courses, lec-tures, and reading materials; easing admission requirements andformal entry qualifications for certain courses of study, includingthe granting of credit for life experience; and encouraging greateruse of independent study.
An unusual example of a nontraditional prograin in technicaltraining is the Grass Roots Computer Literacy for Rural AdultsProject operated by the University of Idaho Cooperative Extension(with funding from the U.S. Department of Education's Fundfor the Improvement of Postsecondary Education). This project,

BRYNA SHORE FRASER 359
started in the fall of 1983, has two goals. The first is to design,test, and evaluate a curriculum to teach computer literacy to ruraladults, particularly women. By computer literacy, the projectmeans the ability to understand simple computers and to be ableto use mini- and microcomputers in work or home settings. Thesecond goal is to develop a delivery system that is appropriate forteaching in rural communities. In developing the curriculum, thedesigners recognized the necessity of incorporating rural valuesand experiences.
This curriculum eliminates a numi .tr of the 'mown barriersix, adult participation in the project. There are no costs to the.)articipants in tl_z program, because they are covered throughthe project's federal grant. Courses last for 4 weeks (2 eveningsper week) and are located at local high schools. The curriculumincludes a math-readiness component tin ; covers math concepts,problem solving, and manipulation skills. A language-readinesscomponent focuses on logical thinking and the communicationskills involved in information processing. Participants are encour-aged to share feelings and successes by teaching each other andby encouraging and facil;',ting ideas to be exchanged. Classes aresmall (12 per class) to for group interaction and discussion.
Community people, small business persons, farmers, andhomemakers participate in the delivery of the program as su-pervised peer teachers. These n 'er teachers are selected by localadvisory committees and train by project staff to recruit stu-dents and teach the course.
All of the program participants have become computer liter-ate. To date over 600 students have enrolled in the program.
Both colleges and universities seem to be moving towardgreats 9exibility in accommodating diverse new populations ofwould-be learners. Practices vary significantly, however, as doesthe level of institutional responsiveness to the special needs ofworkers in search of specialized technology training. Innovativeapproaches such as those cited above represent, in most in-tames,isolated departures from traditional delivery systems geared to-ti and traditional student populations.
3 '71

I
360 NEW OFFICE AND BUSINESS TECHNOLOGIES
PROFESSIONAL ASSOCIATIONS
Professional associations are composed of member practition-ers within a particular occupational group avid are aimed at ad-vancing the interests of the occupation as a whole as well as en-hancing the occupations! competence of its individual members.These associations are organized on a national, regional, state,or local basis and consist of such diverse memberships as engi-neers, real estate brokers, doctors, secretaries, and sociologists.They serve their members through meetings and conferences, pro-fessional publications, workshops, courses, and other educationalactivities. These activities are almost always part time and areusually paid for by the participants or their employers.
The American Management Association (AMA) is a majorprovider of education, with its 7,500 lecturers and discussion lead-ers and the provision of almost 100,000 courses for business per-sonnel in a recent year (Anderson, Kasl, and Associates, 1982).Most of the courses last 1 'o 4 days and include subjects suchas Production Planning and Control, Utilizing Computer-AidedEngineering for Better Design, Pre-retirement Planning, CareerWorkshop for Executive Secretaries, and Improving InterviewingSkills. Recently the AMA began offering courses on integrated of-fice systems to assist in making the changeover to the automatedoffice. For those unable to leave their places of business, the AMAprovides in-house courses for groups or supplies multimedia pack-ages and a trainer for companies to use.
GOVERNMENT AGENCIES
Government agencies provide a wide range of programs offer-ing technology training at low cost or no cost to the participant.Very few programs, however, are aimed at the adult female workerwho has been, or expects to be, affected by the introduction oftechnology into the office or business.
PUBLIC SCHOOL SYSTEMS
Local school systems, though mainly focused on educatingyouth, have long offered adult education courses. With projectedstabilization and, in some cases, decline in enrollments, it is likely
3 72

BRYNA SHORE FRASER 361
that the trend of offering programs for adults will increase, par-ticularly at the secondary level. Many schools, especially voca-tional schools, are upgrading their equipment through donationsfrom and partnerships with employers, and schools throughoutthe country are benefiting from contributions from computer com-panies in particular. It is very likely, therefore, that computertraining courses in a variety of fields will be increasingly availableto community members through adult education programs.
One example of such a program is the "Computers for theMedical Assistant" course offered by the Fairfax County (Virginia)Public Schools Office of Adult and Community Education. Theclass, which meets weekly at a local high school for 5 weeks,explores the use of automation in the doctor's office. Anothercourse covers the coding system being implemented in hospitals,insurance companies, and doctors' offices. Classes are held atnight, and costs are very low.
LOCAL COMMUNITY PROGRAMS
Increasing numbers of community agencies and organizationsare offering courses in technology use, particularly the operation ofmicrocomputers and computer literacy. One example is a free com-puter education program started in 1983 by the Tacoma (Wash-ington) Public Library. Local library officials developed the pilotprogram, named Compulit, after learning that while computer ed-ucation courses were available in area schools, no such programswere available for adults. Compulit consists of three computer lit-eracy classes, a microcomputer laboratory, and a computer check-out service in which class enrollees are allowed to take home amicrocomputer. The computer laboratory is equipped with a va-riety of microcomputers and many popular home and businesssoftware programs. The students have been about equally dividedbetween mea and women, and slightly more than half have beenbetween 36 and 64 years old (Computerworld, 1984:34).
FEDERAL EMPLOYMENT AND TRAINING PROGRAMS
The federal government, through an array of employment andtraining programs, provides significant education and (re)trainingopportunities, focusing on entry-level training for the disadvan-taged would-be worker, with some attention paid to the retraining
373

362 NEW OFFICE AND BUSINESS TECHNOLOGIES
of the dislocated worker. Most recently, federal programs forunemployed and disadvantaged workers have included the Com-prehensive Employment and Training Act of 1973 (CETA) and itssuccessor, the Job Training Partnership Act (JTPA); the WorkIncentive (WIN) program; and tie Trade Act of 1974. The typesof training provided through these programs include machine tool,welding, secretarial, electronics, clerical, and nursing (LPN). TheCETA program, which focused mainly on disadvantaged workers,relied increasingly during its life span on public sector employ-ment as its chief mechanism, with training accounting for onlyone-quarter of program expenditures by the end of the 1970s. De-spite the negative image often associated with CETA, it was foundthat the program helped raise earnings substantially for womenand male workers with little or no recent work experience (U.S.Congress, Office of Technology Assessment, 1986:170).
The current Job Training Partnership Act (JTPA) is expectedto produce 800,000 to 1,000,000 trainees in fiscal year 1984 ata cost of $3.5 billion. The bulk of this money was to supportthe training of disadvantaged youth in marketable skills. In FY1983, about $215 million was allocated under Title III for theretraining of adult workers who lost their jobs in heavy industrybecause i automation or the 1981-1982 recession. The programemphasizes training in fields where job openings are increasing, i.e.,the service industries: health care, food services, clerical work,and computer sciences. According to the Office of TechnologyAssessment (OTA), only 4 percent of eligible displaced workersare estimated to have participated in Title III programs in 1983,the majority of whom were white males (U.S. Congress, Office ofTechnology Assessment, 1986:174). In addition, OTA expressesconcern over whether displaced workers in these programs aregetting enough chances at training for new skills and occupations.Some critics, moreover, believe that trainees, particularly women,are being shortchanged because the program emphasizes short-term training for low-level jobs that could be obtained withoutthe training (Johnson, 1984:9).
For eligible workers (those losing jobs due to foreign compe-tition), the Trade Act of 1974 provides some important benefitsnot available under Title III of JTPA: support payments for work-ers in training and generous relocation assistance. The numbersserved, however, are very small and are decreasing; in 1984, only6,538 workers entered training under the program, compared with
3'74

BRYNA SHORE FRASER 363
20,386 in 1981 (U.S. Congress, Office of Technology Assessment,1986:197).
The Work Incentive (WIN) program provides training andemployment services for Aid to Families With Dependent Children(AFDC) participants, 90 percent of whom are women. In FY1985, approximately 350,000 WIN participants found employment,generally entry-level positions in maintenance/clerical fields, parkservice, and human services. In keeping with the aims of the WINprogram (to help participants lessen their dependence on welfare),the bulk of the training provided focuses on remedial education,job search techniques, and basic occupational skills, with littleemphasis on higher-skilled technology training (Employment andTraining Reporter, 1986:647).
Since, 1980, and particularly under JTPA, local partnershipprograms have been preferred as both the locus of responsibilityand service deliverer for federally funded training programs. Thesepartnerships take a variety of forms but, in almost every case, al-ways include the involvement of one or more major employer(s)in the community. The presence of the employer is designed toassure that training programs are up-to-date and provide trainingin skills needed for current or projected jobs in local industry andbusinesses. The programs described below are typical of the col-laborative efforts focusing on the provision of technology trainingat the state and local levels.
Word Processing Training Centers are currently operatingin 32 cities across the country. These centers are run by localconununity-based organizations in partnership with the IBM Cor-poration, with additional funding from the Job Training Partner-ship Act. Training in word processing, computer operation, andcomputer programming is provided to some 3,000 individuals an-nually, most of whom are women in their late twenties and thirties,although ages range from 18 to 55. The training is done on up-to-date equipment provided and updated periodically by IBM, whichalso provides loaned staff to the centers for the first 3 years ofoperation, at which time centers are expected to be self-sufficient,although IBM continues to donate and upgrade equipment.
One specific example, the Washington, D.C., Word Process-ing Center, is operated by the Washington Urban League andserves three main categories of workers: women returning to thework force, workers whose jobs have been terminated, and public

364 NEW OFFICE AND BUSINESS TECHNOLOGIES
assistance recipients. Ninety-eight percent of the program partic-ipants are female. The training course, which is promoted heavilythrough local advertising, lasts for 26 weeks and consists of 6 hoursa day, 5 days a week. While no stipend is offered to trainees, theydo receive $35 a week to cover transportation, and other supportservices, including counseling, are provided. The center trained153 word processors in 1983, over 85 percent of whom were placedin jobs with an average starting salary of $13,400. In a follow-upof trainees placed during the center's first 3 years of operation,75 percent had been retained by their employers, and several ofthe trainees had moved up to become administrative assistants ormanagers. Its operators are convinced that the program offers par-ticipants not just entry-level skills but also the skills needed to gainupward mobility within the employing organization. Twenty-threenew centers were added to the national program in the summer of1985.
A state-funded cooperative effort, the Bay State Skills Corpo-ration (BSSC) was created by the Massachusetts state legislaturein 1981 to act as a catalyst in forming partnerships between busi-nesses and educational institutions to train workers in skills neededby growing industries in the state. BSSC provides grants to publicor nonprofit education and training institutions, which link upwith one or more growing companies to train workers for specificjobs. Participating companies are required to match the grantwith contributions of equipment, materials, staff time, or cash.
The training can take place at community colleges, vocationalschools, 4-year colleges, universities, and community-based em-ployment and training organizations throughout the state. Thetraining is not restricted to unemployed or poor individuals. Be-cause employers' major criteria are the need for skilled workers,BSSC's primary focus is on training people for jobs, regardless oftheir economic status. The programs cover a variety of traininglevels, including entry-level training, employee upgrading, retrain-ing, and advanced (college- and university-level) programs and runfrom 20 weeks to 20 months. Training is provided in a wide va-riety of new and emerging occupations, such as nuclear medicinetechnology, computer-aided design/computer-aided manufactur-ing, plastics technology, and advanced automation and robotics,in addition to the more traditional occupations of the machinetrades, licensed practical nursing, and junior accounting.
a76

BRYNA SHORE FRASER 365
To date, BSSC has served approximately 1,500 adults in itstraining programs. Women tend to predominate in the technician-level training courses and are currently underrepresented in thehigher-skilled programs, such as robotics and manufacturing engi-neering. Several mid-level programs have been targeted for womenand minorities and have been .iccessful in moving them into jobsas technical writers and computerized materials managers (at an-nual salaries averaging between $15,000 and $25,000). In addi-tion, BSSC has contracted with the Women's Technical Instituteof Boston to provide training for women in higher-level electronicsjobs and with Northeastern University to provide programs forwomen in engineering and in information systems.
IN SEARCH OF TECHNOLOGICALTRAINING EQUITY
Probably the most typical technology training for womenworkers today is several hours of instruction in word process-ing, provided by the employer to meet its immediate needs. A fewof the innovative technology training programs described in thepreceding sections offer some hope that attention is beginning tobe paid to the broader needs of women for training and retrainingin new office and business technologies. A wide variety of educa-tioaal and training programs is available, but very few focus ontraining for higher-skilled, higher-level positions in emerging occu-pations. Nor is training being designed to meet the differing needsof women at varying stages over the life span. Very few programsappear to differentiate between the training needs of women andmen. Counseling and career development are included in only afew programs.
It is possible, perhaps, that this review does not reflect thebulk of what is currently happening in individual programs, butit is unlikely that a significant number of programs are operatingin relative obscurity. The limited information available and thegrowing concern over women's role in the "Office of the Future"lead us to a discussion of appropriate research and actions to bettermeet the technological training and educational needs of women.
377

366 NEW OFFICE AND BUSINESS TECHNOLOGIES
INFORMATION GAPS
There is an imperative need for better and more comprehen-sive information on education and training for occupations andjobs affected by the new office and business technologies. Stud-ies such as the National Commission for Employment Policy'sproject, "Technological Change and Employment: The Effects ofComputer-Based Equipment," are beginning to fill some of theinformation gaps, but currently there does not exist a single database that examines the complete system of training opportunityin the United States. Within this larger category, specific data areneeded on the structure of (re)training opportunities for womenand men in terms of the providers of (re)training services; theneed for (re)training in terms of changing occupational skill re-quirements due to technology; and the demand for technology(re)training by individuals and employers.
Specifically, an inventory of technology training programsneeds to be developed, particularly for service and informationoccupations. Such an inventory should provide a history of pro-grams (goals, objectives, population served, and outcomes) as wellas descriptions of training and services offered and instructionalapproaches. Complementing the inventory, additional informationcould be obtained through a longitudinal data collection com-ponent that would emphasize patterns of occupational mobility,attitudinal and behavioral changes, and patterns of technologyeducation and training for women and men at different stages oftheir life spans. Analysis of such longitudinal data could trackpatterns of participation; assess the short-term and long-term na-ture of barriers to participation for population subgroups; measurethe impacts of different education and training experiences on jobmobility, attitudes, and behaviors; and assess the impacts of in-stitutional initiatives aimed at increasing the technology trainingopportunities for women. This information could be collected ona regular basia by the federal government, perhaps as part of theNational Center for Education Statistics' survey of participationin adult education.
A parallel information collection effort would focus on a seriesof case studies of a selected number of technology training pro-grarns in service and information occupations designed to trainwomen for middle-level and higher skilled positions in these indus-tries. These case studies could help identify specific components
373

BR1 IVA SHORE FRASER 367
that best serve the needs of or eliminate the barriers for differentgroups of women in obtaining the skills required for the higher tierof jobs within those occupations affected by new technology.
One approach to conducting these case studies might be tobuild on the groundwork laid by the authors of In Search of Excel-lence (Peters and Waterman, 1984). The majority of companiesidentified as "excellent" were in the service, information, and high-technology sectors and were judged to be far above the norm in theamount of time they spent on training activities. Although system-atic data on training were not collected and no mention was madeof these companies' policies with regard to women specifically,several of the companies have reputations for being particularlyresponsive to the education and training needs of their office work-ers. It would be worthwhile to examine more closely some of thesecompanies' policies and programs relating to the introduction ofnew technology into the workplace.
Case studies should also be conducted of programs offered byeducational institutions and by other public and private trainingproviders, particularly those developed by groups with a long-terminterest in the technological preparation of women for occupations,such as those operated by unions and community service organi-zations.
Dissemination of the information resulting from the case stud-ies as well as from the inventory and the longitudinal study shouldnot be limited to researchers and government policy makers. Acentral clearinghouse with direct access to employers and educa-tors is essential to the implementation of any recommendationsarising from the information collection efforts. One possible sitefor such a clearinghouse might be the recently established Centerfor Education and Employment, operated by Teachers College,Columbia University, whose mission is to explore education andtraining alternatives that contribute to lifelong learning and re-training for both personal development and effective instruction.
EDUCATION POLICY
Beyond the collection of more and better-quality informationon training for new technologies, special attention must be paidto what is (and is not) currently happening at the various levelsof education today, with particular concern focused on long-range
3 7 9

368 NEW OFFICE AND BUSINESS TECHNOLOGIES
occupational and career impacts relating to women and technol-ogy.
Early emphasis at the elementary and secondary school lev-els must be placed on access to math and science skills for girls,so that more options will be open to women on completion ofsecondary schooling for training in higher-level scientific and tech-nical occupational skills. This is true for all students, not simplythose traditionally college-bound. Such education is increasingly aprerequisite for those wishing to enter 2-year technology trainingprograms without first having to participate in remedial courses.Currently, too many options for advanced technology trainingappear to be closed to women due to the lack of an adequatebackground in science and related fields.
Vocational education is often criticized for perpetuating sexualsegregation in training offered to students at the secondary level.Girls are still being tracked, for the most part, into clerical andsecretarial courses, while boys are encouraged to enter the moretechnical training programs. Frequently, critics charge, even thetechnical courses lag behind economic realities, teaching skills thatare no longer in demand on equipment that is already obsoletefor jobs that are being eliminated. Clearly, the role of vocationaleducation in preparing women and men for emerging technologicaloccupations needs to be reassessed and perhaps restructured.
As far as postsecondary education is concerned, reference wasmade earlier to higher education's "prejudice" against the adultlearner. In an age when there is an expanding need for the retrain-ing of adults and a dwindling number of traditional young stu-dents, colleges and universities must start rethinking their policiesregarding the education and training required for an increasinglyknowledge-intensive, service-oriented economy. This rethinkingprocess has already begun at some institutions, as evidenced byseveral of the innovative programs referenced earlier in this paper.It should be noted, however, that most of these programs oper-ate on the fringes of the sponsoring educational institutions andare generally not held in the same regard as the more traditionalmainstream offerings.
Community and junior colleges have historically been respon-sive to local economic conditions and the training needs of areaemployers. In 1978, 2-year colleges became the course providersmost frequently cited by adult education participants. Reflectingtheir concern for the learning and training needs of adult workers
3 6 ii
BRYNA SHORE FRASER 369
in their communities, these schools offer a wide variety of occupa-tional programs. Information is lacking, however, on the level oftechnological skills offered in many of these programs and on howcourse completers fare in the job market and in their career devel-opment. Concern has been expressed by some that the focus onnarrow job-specific training may limit the general employability ofprogram participants and may ultimately reduce the adaptabilityof the work force. The inventory of technology training pr.( gramsrecommended earlier would contribute much-needed informationon these issues.
Educational institutions at all levels would do well to rethinktheir missions in terms of changing demographic, economic, andtechnological factors. Training and retraining will hecome evermore important as new skills are needed by workers over theirlife span. Educators sli,I,uld begin thinking in proactive terms,anticipating changing educational demands, rather than simplyreacting to crisis situations related to the immediate needs of themoment.
EMPLOYER. RESPONSIBILITIES
Perhaps, as Lewis Perelman suggests in his recent book, it istime for employers, managers, and workers to "rethink the socialcontract surrounding the human capital they employ" (Perelman,1984:58). In 1982, for example, companies invested an average of$3,600 per worker in new facilities and equipment, much of whichwas probably linked to the introduction of new technologies. I tthese same companies invested an average of just $300 per workerfor training. Research from In Search of Excellence indicates thatall of the "excellent" companies treat their people (they are notthought of simply as workers) as the primary source of productivitygainsnot capital spending or automation. The most pervasivetheme in these companies is "respect for the individual." Thecommon practice among most companies of letting employees leaverather than retrain them for new technology reflects little of suchrespect.
Unfortunately, existing federal policies tend to favor physicalcapital over human capital development (witness many of the taxprovisions), and the current climate is unlikely to favor additionaldrains on the treasury. Therefore, traditional recommendations,such as offering federal tax incentives to encourage employers to
,381

370 NEW OFFICE AND BUSINESS TECHNOLOGIES
establish or enhance in-house technical training, are highly unlikelyto be implemented at this time. How then might employers beencouraged to allocate more resources to (re)training office workersto allow them to benefit from opportunities generated by newtechnologies?
Perhaps changing demographic and economic factors will forceemployers to reverse their underinvestment in training for thispopulation. As the supply of entry-level workers declines, womenand minority workers, in whom human capital investments havebeen least, will comprise a greater share of available workers. Thisreality may require that employers invest more heavily in trainingto provide themselves with the skilled employees that they need.Particular attention will have to be paid to the retraining needs ofemployed workers whose skills no longer match the needs of theiremployers, as well as the basic skill needs of workers entering thelabor market.
A CONTINUING EDUCATIONAL SYSTEM
If such demographic and economic conditions do not bringemployers to invest more resources in industry-provided training,then, once again, the responsibility will revert to the educationalsystem. As Noyelle, Perelman, and others have suggested re-cently, we may be moving toward a "truly continuing educationalsystemone that is more equitable, more flexible, better adaptedto shorter term passages, more ubiquitous, and perhaps less spe-cialized in orientation than it has traditionally been" (Noyelle,1984:39).
For the educational system to be responsive to the needs ofadults, particularly women, preparing for -Jew office and businesstechnologies, it must look beyond its traditional role of educationof youth toward its emerging role in training adults. The educa-tional system must be responsive to the &verse needs of a diversesociety, but education and training proviiers cannot work alone;they must work collaboratively with business, labor, government,and other educational organizations.
Such collaborative efforts are important because few technolo-gies have expanded as rapidly as the computer or penetrated somany sectors of the economy so quickly. Twelve to 15 millionworkers (one out of every eight employed Americans) currently
3 82

BRYNA SHORE FRASER 371
use computers in their jobs. More than 2 milliol business com-puters were sold in 1984 alone, added to the 7.5 million alreadyin the workplace. This has resulted in a formidable training task,involving workers currently on the job as well as young and olderwould-be workers. It is critical that this process ensure the eq-uitable availability of training in new technologies for all currentand future members of the work force.
REFERENCESAnderson, R.E., E.S. Kasl, & Associates
1982 The Cost and Financing of Adult Education and Thaining. Lexington,Mass.: Lexington Books.
Barton, P., and the National Institute for Work and Learning1982 Worklife Tinnsitions. New York: McGraw-Hill.
BusinessHigher Education Forum1984 The New Manufacturing: America's Race to Automate. Washington,
D.C.: BusinessHigher Education Forum.Charner, I.
1980 Patterns of Adult Participation in Learning Activities. Washington,D.C.: National Institute for Work and Learning.
Charner, I., and B.S. Fraser1984 Different Strokes for Different Folks: Access and Barriers to Adult Educa-
tion and Duining. Washington, D.C.: National Institute for Workand Learning.
Coleman, J.S.1983 Virginia bank says micro teller training works. ABA Banking Journal
(June):58.Computerworld
1984 Library's computer course swamped with registrants. Computer-world (March 26):34.
Desmond, J.1984 Insurer's network training program works from top down. Comput-
erworld (August 6):8.Employment and Mining Reporter
1986 Education and Labor Committee calls for fewer program cutsthan Reagan budget. Employment end Thaining Reporter (February26):646-647.
Form, W., and D. McMillan1983 Women, men, and machines. Work and Occupations 10(2):147-178.
Gallant, J.1984 Survey reveals OA accepted with open arms. Computerworld (March
5):24.Goldstein, H.
1984 Institutional Sources of Education and Training in the Adult Years.Unpublished paper.
Gutek, B., and T. Bikson1984 Differential Experiences of Men and Women in Computerized Of-
fices. Unpublished paper.
383

372 NEW OFFICE AND BUSINESS TECHNOLOGIES
Hilton, M.1984 CWA Training: Local Success Stories. Unpublished paper. Com-
munications Workers of America, Washington, D.C.IBM Corporation
1985 IBM Education: Notes for the Presentation. Unpublished paper.Armonk, New York.
ITT Educational Services1984 America at Work The Management Perspective on 7aining for Business.
Washington, D.C.: ITT Educutional Services.Johnson, B.
1985 Organizational Design of Word Processing from Typewriter to In-tegrated Office Systems. Paper presented at American Federationof Information Processing Societies, Office Automation Conference,Atlanta, Ga.
Johnson, S.1984 Retraining's come a long way, baby. The New York Times (October
14), Section 12:9.Kaercher, D.
1983 Trade school: ticket to a better job? Better Homes and Gardens(November):57-62.
Keefe, P.1P84 Three unresolved issues identified for OA users. Computerworld
(March 26):23.Knox, K.
1979 Polaroid Corporation's 74ition Assistance Plan: A Case Study. Wash-ington, D.C.: National Manpower Institute.
National Center for Education Statistics, U.S. Department of Education1979 Survey of Participation in Adult Education, 1978. Washington, D.C.:
U.S. Government Printing Office.1983 Digest of Education Statictics 1988-84. Washington, D.C.: U.S. Gov-
ernment Printing Office.Noyelle, T.
1984 Work in a World of High Technology: Problems and Prospects for Econom-ically Disadvantaged Workers. Knoxville: University of Tennessee.
Perelman, L.1984 The Learning Enterprise: Adult Learning, Human Capitc1, and Eco-
nomic Development. Washington, D.C.: Council of State PlanningAgencies.
Peters, T.J., and R.H. Waterman, Jr.1984 In Search of Excellence: Lessons From America's Best-Run Companies.
New York: Warner Books.Serrin, W.
1984 Experts say job bias against women persists. The New York Times(November 25):A1, A3.
U.S. Congress, Office of Technology Assessment1986 Technology and Structural Unemployment: &employing Displaced Adults.
Washington, D.C.: U.S. Government Printing Office.
3 ..." ' 1

The New Technology and theNew Economy: Some Implications for
Equal Employment Opportunity
THIERRY .1. NOYELLE
Are sex and race still major determinants of employment dis-crimination? Is the new computer technology changing the de-mand for labor to such an extent as to reshape the terms underwhich women and minorities encounter discrimination? As I arguein this paper, using evidence from empirical studies of the retail,insurance, and financial sectors, both questions deserve qualifiedanswers (Noyelle, 1986; 1987).
While major advances have been made in alleviating sex andrace discrimination in the workplace, discriminatory barriers basedon sex and race remain. Still, other bases for discrimination, whichin the past played a lesser role, loom larger today. For example,there may be an increasing tendency to use age to differentiateyouth and some groups of older workers from others in the labormarket today. During the 1950s or 1960s, the age factor seemedrelatively unimportant. More significantly, the role played bysocioeconomic status may be growing in importance because of itsimplications for access to formal schooling and higher education.While our economy places increasing value on formal educationas a criterion for hiring, our society continues to lag behind inproviding equal access to quality education.
373

374 EQUAL EMPLOYMENT OPPORTUNITY
The new technology is changing the nature of many jobs andskills and, as a result, is redefining the demand for labor. In theprocess, it is loosening the hold of particular groups of workerson specific occupations. But its displacement effects are not re-stricted to women and minority workers. At the same time, thenew technology cannot be viewed in isolation. Deep economic andsocial changes and dramatic industry shifts have acted to alter theoverall occupational structure and to increase the importance offormal schooling and higher education for employment opportu-nity. The new wave of technological change simply reinforces thesetrends.
The overall thesis of this paper is straightforward. I argue thatthe current labor market transformation is altering fundamentallyemployment and mobility opportunities by changing, in particular,the need for training and the way training is provided. Further,I argue that this transformation has disturbed an earlier balanceamong sources of discrimination.
A principal conclusion of the paper is that while direct equalemployment opportunity (EEO) enforcement in the workplacemust continue, the reach of EEO enforcement must be widenedfrom an almost exclusive focus on the workplace to one that linksthe workplace to the educational arena. At the federal level, thismay require a redefinition of the scope of activities of the EqualEmployment Opportunity Commission (EEOC) through new leg-islation, since, under Title VII of the Civil Rights Act of 1964,the scope of the Commission is largely restricted to the workplace.Currently, equal opportunity in federally financed educational pro-grams is mandated by other portions of the 1964 Civil Rights Act,as amended, and other legislation, and is the responsibility ofother federal agencies. Enhancing equality of opportunity in thetransformed labor market may well require a consolidation of en-forcement power and an awareness of the increasingly importantlink between the two.
The paper is divided into three main parts. The first parttraces trends in aggregate employment data and shows whichgroups of workers have tended to gain in their employment oppor-tunities and which have tended to lose. The second part empha-sizes key changes that have occurred in the structure of the U.S.economy and the concomitant changes in the demand for labor.The third discusses the changing nature of discrimination with
386

THIERRY J. NOYELLE 375
examples from back-office and retail employment and with spe-cial reference to various groups of women and minorities. Policyimplications are discussed in the conclusion of the paper.
TECHNOLOGY AND DISCRIMINATION:EVIDENCE FROM AGGREGATE DATA
FOR 1970-1980
What can be discerned about the critical linkages betweentechnology and discrimination from employment aggregates? Toseek some answers, I developed two sets of measuresone basedon decennial census data, the other on EEOC data.
Table 1, based on 1970 and 1980 census data, presents an in-dustry shift-share analysis for six major groups of workers: youth(ages 16-19), black females, Hispanic females, white females, blackmales, and Hispanic males. For each group, employment growth(or decline) in an industry has been broken down among threecomponents: first, growth (or decline) associated with the relativegrowth (or decline) of the industry; second, growth (or decline) as-sociated with an increase (or decrease) in the group's participationin the employed labor force; and third, growth (or decline) associ-ated with the pure "shift" of the group in or out of the industry.In other words, the "shift" measure indicates the gains or lossesin a given group's penetration in a particular industry, everythingelse being held constant. For each group, the "shift" measureis shown as a "turnover" ratio indicating the number of workers"shifted" during the 10-year period shown as a percentage of thegroup's 1980 employment. In addition, the positive and negativeshifts are distributed in percentage terms among industries. Theoverall impact of the shift is shown by means of normalized sharesfor 1970 and 1980. The share of employment of a group in anindustry is divided by its share in the total labor force. This ratioshows the group's standing in an industry relative to the economyas a whole. A ratio below 1 means that the group penetration inthe industry is lagging; a ratio above 1 means that the group isoverrepresented.
For example, Table 1 shows an aggregate turnover measureof 2.6 percent for white women, indicating that 2.6 percent of the34,806,839 white women found themselves in 1980 in an industrydifferent from that in which they would have been employed hadthere been no change in the penetration of white women in various
36 '7,

376 EQUAL EMPLOYMENT OPPORTUNITY
TABLE 1 Industry Shifts of Major Groups of Workers and Distribution of Positiveand Negative Shifts Among Industries
Industry
EmploymentDistributionAll Sexes,Races, Ages(percent)
Youth (16.19Years Old)NormalizedShare Shift
(percent)
BlackFemaleNormalizedShare Shift
(percent)
HispanicFemaleNormalizedShare Shift
(percent)1980 1970 1980 1976 1980 1970 1980 1970
1 Health 7 4 5 5 0 68 0 93 -21 3 2 35 2 35 4-0 3 1 42 1 81 -23 6
2 FIRE 60 S0 067 085 -132 103 070 -151 123 117 +34
3 Social 18 I6 087 070 +31 213 132 +105 148 118 +107
4 Businessservices- 66 57 072 090 -147 060 085 -106 073 083 -66
5 Education 86 80 062 075 -135 159 149 4.94 114 111 -124
6 TCU5 73 68 033 059 -232 071 044 +148 052 049 +68
7 Wholesale 43 41 0 71 068 -08 0 34 0 32 -.08 0 71 081 -7 3
8 Construction 59 61i 071 052 +129 010 006 +I4 014 011 -08
9 Public adm 53 f5 040 037 +19 1 51 107 +182 090 073 -168
10 Consm.iejservices- 20 3 21 4 2 46 2 II +80 6 1 06 1 70 -86 I I 23 1 39 -62 5
11 Other goods= 4 0 4 5 1 06 1 02 -0 7 0 20 0 33 -3 4 0 59 0 56 .0 2
12 Manut.scturing 22 4 259 060 064 -14 1 078 060 +294 114 006 +52 3
1980 Employment 6,973,441 4,650.177 2,168,649
Turnover! 83 139 57
NOTE The 12 industries are ranked by rate of growth between 1970 and 1980 from the fastest growing
(health) to the slowest growing (manufacturing) The industry brensdown used is based on
classification of service industries found in Stanback et al (1981) The first two columns show the
distribution of all employed among the 12 industries in 1970 and 1989 The positive and negative"shift" is distributed for each group on a percentage basis The normalized shares of major groupsof workers shown for 1970 and 1980 are computed by dividing the share of employment held by each group
in each industry by that same group's share of employment in all industries combined An index below1 00 indicates underrepresentation, above 1 00, overrepresentation. For definition of "shift," see
text
a-Firrince, insurance, and real estateLegal, accounting, advertising, and the like
=Transportation, communications, and utilities-Retailing and personal services=Agriculture, mining-Total shift for given group measured as percentage of 1980 employment See text
SOURCE Bureau of the Census, 1974, 1084
s

THIERRY J. NOYELLE 377
TABLE 1 (continued)
Industry
Black MaleNormalizedShare Shift
(percent)
HispanicMaleNormalisedShare Shift
(percent)
WhiteFemaleNormalizedShare Shift
(Percent)1980 1970 19 1TY) ZY 1980 1970
1 Health 0 65 0 58 +7.7 0.42 0.46 -3.4 1.74 1 93 -28.4
2 FIRES 0 58 0 53 +45 0.54 0.61 -83 1 43 1 41 +147
3 Social 0 84 0 86 -2.1 0 48 0 61 -7.4 1.45 1 32 +Z. 1
4 Business bservices 0.82 0 84 -4 9 0 98 0 96 +7 2 0 92 0 co +11 5
5. Education 0 68 0.54 +16 4 0 42 0.45 -8 9 1 53 1 70 -37 9
6 TCU5 1.72 1 45 +38 5 1.12 1 17 -11 3 0 56 0 59 -1 5
7 Wholesale 096 1.00 -7 2 1 18 1 25 -11.3 0 67 0 65 +4 7
8 Construction 1 37 1 56 -29 5 1.70 1 47 +34.4 0 21 0.17 +10 8
9 Public adm 1 33 1 32 -1 7 0 87 1.12 -44.0 0 88 0 77 +25 8
10 Conssmesservices 0 72 0 74 -16.7 090 0 90 -2 9 1 30 1 28 +3 4
11 Other goods! 0 88 1.30 -37 8 204 1 97 -4 5 0 40 0 27 +20 9
12 Manufacturing 1 29 1 21 +32 9 1 26 1.10 +58.4 0 72 0 77 .32.1
1980 Employment
fTurnover.
4,674,871
4 3
3,288,208
3 3
34,806,83:
2 6
3> '1

378 EQUAL EMPLOYMENT OPPORTUNITY
sectors of the economy between 1970 and 1980. In addition, the ta-ble shows that this shift was primarily due to increased penetrationin public administration (explaining 25.8 percent of the positiveshift); other goods (+20.9 percent); finance, insurance, and realestate (FIRE) (+14.7 percent); and business services (+11.5 per-cent), matched by decreased penetration in education (explaining37.9 percent of the negative shift), manufacturing (-32.1 percent),and health (-28.4 percent).
On the whole, Table 1 points to the following: industry shiftswere extensive among black females (turnover of 13.9 percent forthe entire group) and youth (8.3 percent turnover) and rather lim-ited among white females (2.6 percent turnover), Hispanic males(3.3 percent), and black males (4.3 percent).
The largest exit move for black females was out of the personalservices industries where large numbers used to be employed asdomestic servants. Their greatest gains were in manufacturing(+29.4 percent); public administration (+18.2 percent); and FIREand transportation, communications, and utilities (TCU) (+29.1percent combined) where they made substantial gains in clericalwork; and the educational sector (+9.4 percent). Youth's greatestlosses were in TCU, FIRE, and business services (51.1 percent oftheir losses combined), while their greatest gains were in retailing(a staggering 80.6 percent).
The patterns of gains and losses among Hispanic femalestended, with some discrepancies, to resemble those of black fe-males. Among black males and Hispanic males, there were limitedpositive shifts, overwhelmingly concentrated in some of the least-dynamic and slowest-growing sectors of the economy: manufactur-ing and TCU for black males (+71.4 percent), and manufacturingand construction for Hispanic males (+92.8 percent). Lastly, thekey finding for white wcmen remains that industry shifts over thedecade were very limited, with an overall turnover of only 2.6percent.
The second set of data, presented in Table 2, shows changesin the normalized shares of five demographic groups of workers inmajor occupt.tions between 1966, 1978, and 1981. These data arefor large private-sector firms only (100 or more employees) andare based on EEO-1 reports, which large employers must file everyyear. They show the progress made by various groups of workersin what has been traditionally the most progressive sector of theeconomy in terms of EEO enforcementthat of large employers.

THIERRY J. NOYELLE 379
Some major changes are worth highlighting. The data showwhite women advancing out of clerical positions and making larger..... ns in professional ranks; black women and Hispanic women,respectively, moving out of service worker and laborer positionswhile, in both cases, gaining in clerical positions; and black menand Hispanic men shifting out of laborer positions and into oper-ative and craft positions. Despite some scattered gains, minoritymales in general continue to trail considerably in the fast-growingwhite-collar occupations. Of all groups, Hispanic males appear tobe the least mobile.
Together these two data sets suggest the following: (1) arelative narrowing of job opportunities for youth as their concen-tration in retailing increased; (2) a relative improvement in theposition of women as shown by the gains of minority women intoclerical positions and the advances of white women into profes-sional positions; and (3) a general lack of progress by minoritymen in entering the relatively fast-growing service industries andwhite-collar occupations.
Findings regarding age-based discrimination are incomplete.Aside from the patterns observed among youth, the statisticalanalysis developed for this paper appeared too crude to yield sig-nificant evidence of age-based discrimination among other groups,although it is thought to exist.
THE TRANSFORMATION OF THE AMERICAN ECONOMYAND CHANGES IN THE DEMAND FOR LABOR
THE RISE OF THE NEW SERVICE ECONOMY ANDITS IMPACT ON THE INDUSTRY-OCCUPATION STRUCTURE
For some time now, the U.S. economy has been in the midstof a major transformation, involving the shift of capital and laborout of the smokestack industries and into high-tech and serviceindustries. While this transformation had been in the makingthrough much of the early postwar period, the acceleration in theinternationalization of the economy after the first oil crisis of 1973contributed to speeding the redeployment of resources, as manyolder industries were put through the wrenching test of worldwidecompetition (Noyelle, 1984; Stanback and Noyelle, 1982; Stanbacket al., 1981; Ginzberg and Vojta, 1981).
3 9.1

COCO
TABLE 2 Employment by Sex, Race, and Occupation in EEO Reporting Firma: All Industries, 1981, 1978, 1966
Occupation
EEO Firm EmployeesDistnbuted
Occu ?tionNormalized SharesWhite Male White Fe tale Black Male Black Female Hispanic Male Hispanic Female
1981 1978 1966 1981 1978 1966 1981 1978 1966 1981 1978 1966 1981 1978 1966 1081 1973 1966 1981 1978 1966
Managers andadministrators 11.7 10.8 6 2 1.54 1.56 1.47 0.55 0.48 0.32 0 47 0 41 0 12 0 27 0.21 008 050 0 48 0.31 0 27 0 21 0.10
Professionals 9.7 8 6 6.6 1 17 1 21 1.38 1.01 096 0 46 0.32 0.30 0 13 0 44 0 40 0 24 0 35 0.39 0.37 0 32 0.32 0 16
Technicians 5.7 5.0 4.5 I 10 I 10 1.09 0.98 098 099 063 0.57 0.26 0 89 0 92 1 03 068 068 0 63 0 59 063 056
Sales workers 9 0 8 8 7.1 0 86 01515 0 98 1.40 1.39 1.30 0.48 0 43 0 17 080 0 77 0 56 0 56 0 52 0.41 1.00 0 89 0.92
Clerical workers 16.3 15 6 16.7 0 27 0.30 043 1 07 : r6 2.43 0.35 030 0 16 1 73 1 65 1 OS 0 29 0 29 0 31 1 73 168 1.39
Craft workers 12.1 12.6 14.2 1 63 1 58 1 46 0 21 0.21 0 20 1 20 1.10 0 55 0 22 0 21 0 17 1.38 1.33 1 01 0 27 0.32 0.33
Operatives 19.1 21.1 25.4 106 104 100 0.72 ri 75 0 85 168 1.67 . 46 109 1 12 0 98 1 41 1 39 1.30 1.18 1.16 1 15
Laborers 7.5 8 5 9.7 0 92 0 89 066 0.70 0.74 066 2 C.- 2116 3 07 1 16 1 21 1 45 2 47 2 48 2.79 1.73 1.84 1.74
Service workers 9.1 9.0 7.1 0 61 060 0.66 1.15 1.21 1 13 1 65 160 2 32 2.20 2 35 3 93 1.47 1.35 1 62 1.59 1 68 I 57
Total 1000 100 0 100 0
Percent employed inEEO reporting firms 480 502 606 330 31.7 28 0 60 63 5.7 55 5.2 2.5 34 31 1.7 22 19 08
NOTE The first three columns of the table show the distribution of all EEO firm employees (allsex and race combined) by occupationfor 1966, 1978, and 1981, respectively. These three columns give an indication of the changing relative importance of the majoroccupa.ions in EEO reporting firms in 1966, 1978, and 1981. The normalized shares of major groups of workers shown for1966, 1978, and1981 in the remainder of the table are computed by dividing the share of employment held by each groupin each occupation by thatgroup's share of all employment in EEO reporting firms (shown on the last line of the table). An melt : below 1 00 indicatesunderrepresentation; an index above 1.00. overrepresentation.
SOURCE: U.S. Equal Employment Opportunity Commission, 1966, 1978. and 1981. -4--

THIERRY J. NOYELLE 381
Between 1970 and the last quarter of 1984, 27.2 million netnew jobs (Employment and Earnings, household survey data) wereadded to the economy, of which nearly 95 percent were in the ser-vice industries. Looking at the Reagan years only, the shift toservices was even sharper since, by November 1984, employmentin the goods-producing industriesagriculture, mining, construc-tion, and manufacturinghad not even caught up with their Jan-uary 1981 level (Employment and Earnings, establishment surveydata). In net terms, this means that employment growth, sinceearly 1981, had been 100 percent in the services.
In occupational terms, the labor market transformation of the1970s has led to more than 7 out of every 10 workers being em-ployed in either white-collar or service-worker occupations. Simul-taneously, a very sharp drop in the share of blue-collar workersfrom 39.2 percent to 29.3 percent of the nonagricultural laborforceoccurred between 1965 and 1983 (Employment and Earn-ings, household survey data). In short, growth has shifted toservice industries dominated by white-collar or service-worker oc-cupations, technological change in manufacturing accelerated theshift to managerial, engineering, technical, sales, and clerical oc-cupations, away from blue-collar jobs.
As Tables 1 and 2 indicate, these shifts have been tilted towardwomen and minority workers. During the 1970-1984 period, nearlytwo-thirds of the new jobs were filled by members of these groups.By late 1984, white males, for the first time, no longer constitutedthe majority of the labor force: their share of the employed haddropped from nearly 55 percent in 1970 to 49.5 percent by late1984.
THE EARLY YEARS OF EEO: OPENING INTERNAL LABORMARKETS TO WOMEN AND MINORITY WORKERS
The aforementioned statistics mean little until one analyzeswho gets hired, for which jobs, and through which mechanisms.Looking back at the record of the postwar period, it is surprisingto see the extent to which employers used to rely on internal labormarket structures to train workers and staff the ranks of their orga-nization, and how rapidly this practice began changing in the early1970s (Edwards, 1979; Osterman, 1982a, 1982b; Noyelle, 1986).It is important to stress that this earlier reliance on "internal la-bor markets" was extensive not only among the manufacturing
3 93

382 EQUAL EMPLOYMENT OPPORTUNITY
giants that typified the erathe IBMs and the GMsbut alsoamong many medium-sized firms, including those in the servicesectors (Appelbaum, 1984; Noyelle, 1986). Thus, the recent loos-ening of the reliance on internal labor markets cannot solely beascribed to the overall industry shift to the services, but must beseen as part of a total labor market transformation affecting bothmanufacturing and service industries.
In the insurance industry, for example, most workers enteredfirms straight out of high school, at the very bottom of the orga-nization as messengers or file clerks. Through on-the-job trainingand seniority, they would move up the ranks. For example, themost successful would move gradually from an entry-level cleri-cal into a professional position, from, say, messenger to statisticalclerk, claims examiner, or policy rater and later to assistant un-derwriter or underwriter (Appelbaum, 1984; Noyelle, 1986). Inthe department store industry, workers would enter as stockroomclerks and would move into sales positions (possibly to a commis-sioned sales position in a high-ticket department such as furniture,household, appliances, etc.), or even to department manager, as-sistant buyer, and buyer positions (Noyelle, 1986).
There were important differences among industries and firms,however. In the construction sector, for example, mobility ladderswere industry and craft based rather than firm based, with tradeunions often playing a central role in operating the mobility sys-tem (Gallo, 1983). In addition, most small firms lacked both theresources and the range of employment opportunities necessaryto operate internal labor markets and relied extensively on theopen labor market. More important, perhaps, sex and race stereo-typing was often used to create sex- or race-labeled occupations.In turn, these were used to restrict mobility opportunities ::"ail-able through internal labor markets to white males, by channelingwomen and minority workers into dead-end jobs. A good deal ofthe mid-1970s literature on internal labor markets sought to ac-count for many of these differences and the way they contributedto discrimination among different groups of workers.
Consistent with the dynamics of labor markets prevailing atthe time, a principal focus of EEO policy, when first formulated,was to open internal labor markets through both hiring quotas andinternal quotas to those who, for reasons of race or sex, had beenleft out or left behind. Much attention was focused on industriesthat were then the pillars of the economy: manufacturing and the
3 p. ,:::, I4

THIERRY J. NOYELLE 383
public sector. The efforts of the federal government to acceleratethe promotion of minorities and women within its own agencies,as well as within the private sector, through major consent decreessuch as those secured in 1973 between AT&T and the Equal Em-ployment Opportunity Commission (Northrup and Larson, 1979),and in 1974 between the Commission and the steel industry (Ich-nowski, 1983), typified that period of EEO enforcement.
Although these decrees led to substantial gains during the1970s, in retrospect, we can see that these efforts were focused onindustries and work settings that were declining in economic im-portance. We are left with only limited clues as to how to approachand solve labor market discrimination in today's economy. Overthe past decade, the role of internal labor markets has weakeneddramatically across a broad range of industr;-s. The reasons forthis declining role are numerous and diverse, but it is evident thatfirms are increasingly externalizing the cost and responsibility forthe training process, are relying more and more on external labormarkets for new workers, and are putting in place new arrange-ments affecting whom they hire and promote (Noyelle, 1986). Twoprimary forces are responsible for this new dynamic: the postwarexpansion of schooling and higher education and the new wave oftechnological change.
THE POSTWAR EXPANSION OF SCHOOLING ANDHIGHER EDUCATION AND ITS IMPACT ON
HIRING REQUIREMENTS AND MOBILITY LADDERS
The first factor behind the transformation in hiring and mobil-ity opportunitiesthe postwar expansion of schooling and highereducationalbeit slow in the making, is nevertheless irreversible.The transformation has been largely a case of supply changesleading to demand changes. By changing the makeup of the laborsupply, the expansion of the educational system put pressure onall firms to adjust their hiring procedures to the new availabilitiesof a labor supply increasingly differentiated by grades and typesof education. For example, whereas only slightly more than 10percent of those between age 25 and 29 had received 4 or moreyears of college education in 1960, by 1980 their share had risento nearly 25 percent.
The expansion of formal education led to a major shift tooutside hiring, first felt most strongly at the level of professional
3 9 -j

384 EQUAL EMPLOYMENT OPPORTUNITY
and managerial personnelthe so-called "exempt workers." Thistrend significantly weakened some traditional internal ladders, es-pecially those designed to move the ablest workers from nonex-empt positions into supervisory and middle managerial positions.No longer could a sales clerk expect to become a buyer for a majorretail organization, or a messenger expect to become an insur-ance executive by simply moving through the ranks. Rather, mostcompanies began recruiting exempt workers directly from college(Noyelle, 1986). In that respect, the 1970s represent a turningpoint as the cumulative effect of several decades of expansion ofthe educational systems and the coming of age of the baby boomwe felt massively on the supply side of the labor market.
THE IMPACT OF THE NEW TECHNOLOGY ON SKILLREQUIREMENTS AND THE ACCELERATION OF CHANGES IN
HIRING AND MOBILITY OPPORTUNITIES
Whereas earlier changes in hiring and mobility opportunitieshad been mostly supply driven, recent changes have been largelydemand driven. They are the result of the introduction of the newcomputer-communications technology and its impact on skills.Broadly speaking, the new technology has acted to reinforce thetendency toward a weakening of internal ladders. Two preliminaryobservations are warranted to support this point.
First, vast areas of work are being transformed and reor-ganized around the processing of information through interactionwith computerized systems. Until recently, the areas most directlyaffected had tended to be primarily in the middle range of occupa-tions, from relatively low-level clerical positions or even blue-collaroperative positions, all the way up to low- or middle-level profes-sional workers (Hirschhorn, 1984; Bertrand and Noyelle, 1984;Appelbaum, 1984). Today, however, higher-level technical, profes-sional, and/or managerial work are also being unaffected. Only inthe case of the lowest-level occupations primarily laborers, ser-vice workers, and low-level sales and clerical classificationshasthe new technology, thus far, had little or no direct impact on workand skills. It may be relevant to note here that these low-skilledoccupations, including sales clerks, building janitors, guards, or-derlies, cooks, and others have been among the fastest-growingareas of employment and that mobility ladders are conspicuouslyabsent in these occupations (Bureau of Labor Statistics, 1984).
3 9 is

THIERRY J. NOYELLE 385
Second, the new technology does not, as many initially be-lieved, lead ineluctably to downskilling but rather to varyingdegrees of upskilling. This generalization does not preclude oc-casional downskilling or occasional lags between current and po-tential uses of technology by firms. Upskilling comes about forthree principal reasons: first, because the most efficien6 use of thenew technology oft, q to lead to a reintegration of tasks pre-viously parcelled out Among different workers; second, because,as intelligent systems take over "processing finctions," workersare left with "diagnosis" and "problem-solving" functions; andthird, because the shift to "problem-solving" functions at lowerlevels of the organization calls for a simultaneous decentralizationin decision-making power (Adler, 1984; Hirschhorn, 1984; Rajan,1984; and others reviewed in Bertrand and Noyelle, 1984).
As the new technology changes skill requirements for manyjobs, it also leads to the homogenization of skills across a widerange of industries, encouraging the externalization of trainingfor many middle-level workers. This means that the jobs of bankclerks processing letters of credit or fund transfers on a comput-erized system, of insurance examiners processing claims, of airlineager.:,s processing reservations and ticketing, or even of telephoneswitchmen routing and managing traffic flows through switchesare becoming not only more demanding in terms of skills, butalso increasingly similar in terms of skills required (Appelbaum,1984; Noyelle, 1984). Not surprisingly, a major focus of the current"training debate" about the need for more sophisticated traininginstitutions concerns this middle range of occupations, becausethese are occupations, that, in their older configurations, hadrarely been brought within the purview of formalized training pro-cesses. These were jobs for which skill training was traditionallyacquired on the job through internal labor market mechanisms.Hirschhorn (1984) refers to this transformation as the processof "para-professionalization." Thus, the institutions most directlyconcerned with the new demand for training are clearly not simplyhigh schools but, increasingly, vocational-educational institutions,community colleges and even 4-year colleges.
3 9 ,

386 EQUAL EMPLOYMENT OPPORTUNITY
TECHNOLOGICAL CHANGE AND INCREASINGINSTITUTIONAL AND GEOGRAPHICAL MOBILITY
Since formal education and training have become increasinglyimportant in determining a worker's position in the labor market,there is a presumption that better-prepared workers should havean edge particularly in terms of improving their earnings. Thusfar, this has not necessarily been the case. The tendency towarduniversJization/homogenization of skills has also weakened thedegree to which workers are sheltered from competition as theyonce were when skills were more specific to the output of theindustry or firm. Further, this has been aggravated by a contextof weakening unionization.
In addition, the new technology makes it increasingly feasibleand cost efficient to separate geographically so-called back-officefunctions (dominated by clerical and service worker occupations)from "front-office" functions (dominated by technical, sales, pro-fessional, or managerial occupations). Two consequences follow.First, the separation contributes to breaking the institutional joblinkages that used to exist when entire departments, from the bot-tom up, were located in the same physical location. Second, theincreasing mobility of back-office establishments puts workers onthe defensive because the rise in two-wage-earner households ishindering geographic mobility for many.
THE SHIFTING NATURE OF DISCRIMINATION
The broad changes that have taken place on the demand sideof the labor market and the gains made by certain groups ofworkers in selected occupations and industries as a result of earlyEEO efforts have both acted to shift the nature of discrimination.
Two examples will serve to illustrate some aspects of the shift:(1) back-office clerical employment and (2) sales employment inthe retailing sector. In the first example, technology is broughtin to reform, reorganize, and rationalize work involving large con-centrations of workers. As suggested above, the introduction oftechnology has led to some degree of upskilling and associatedchanges in the demand for labor. In the second case, the directimpact of technology on sales and related occupations is relativelymodest. Technology figures in mostly indirectly in that it permits
393

THIERRY J. NOYELLE 387
great improvements in the control and coordination of the orga-nization itself (in buying, inventory control, and accounting). Tothe extent that changes in labor demand can be observed, theseare unlikely to be associated directly with technology.
These two examples are instructive because they cover worksituations in which large numbers of women and minority workershave traditionally found and continue to find employment.
THE REORGANIZATION OF BACK-OFFICE EMPLOYMENT
This example relates to the reorganization of clerical worktypical of the back offices of banks, insurance companies, telephoneand other utilities, and other organizations with large processingfacilities. In the 1960s and early 1970s, these firms hired largenumbers of youth as messengers and file clerks directly out of highschool to staff entry-level clerical positions. Later, many of theseyoung workers would be trained in-house and would move up theladder as they matured.
As Appelbaum (1984) has noted, the long-standing tendencyin back offices was to discriminate between white men and womenand minority workers by operating a two-track system. One track,reserved mostly for white men, lead those workers into professionalor managerial employment; the other, used primarily for womenand minority workers, would channel most of them into dead-endpositions. By forcing companies to do away with these practices,EEO, for a time at least, opened new avenues of opportunitiesto women and minority workers. Yet, no sooner had these av-enues been opened than their access was considerably curtailedas the result of the tendency toward the weakening of internallabor markets, and in particular the delinking of nonexempt fromexempt jobs. This did not completely shut out access for womenand minorit.es to many managerial and professional positions; but,typically, it forced them to enter through another route, that ofhigher education. At the same time, changes were also occurringat the traditional entry level, with impacts on both adult workersand youth.
For many years companies with large back-office employmentwere known for their close links to the local high schools. Dur-ing the 1970s, however, this situation changed dramatically as aresult of the new technology. As one executive of a large NewYork insurance firm reported in a recent interview: "Up until the
3 9 9

388 EQUAL EMPLOYMENT OPPORTUNITY
early 1970s, we hired nearly 2,000 kids every summer. Today, wehire at most 100 kids. Nowadays, most entry takes place at ahigher level typically community college or equivalentstraightinto claim examiner positions. Most of the filing and messengerfunctions have been eliminated through computerization."
In a recent study of the youth labor market in New York City,Bailey and Waldinger (1984) found that of the nearly 40,000 jobslost by youth in New York City during the last decade (1970-1980), nearly half could be attributed to the sheer contraction ofthe city's economy. The other halfthat is nearly 20,000 jobs-could be attributed to the elimination of filing clerks, messengers,and similar positions in local public utilities (telephone, gas, andelectric), banks, and insurance firms. The industry shift data foryo._.th presented above corroborate this finding for the nation as awhole. Beyond the magnitude of the numbers involved, these lossesimplied that by the late 1970s a major group of workersyouthwith high school or equivalent diplomasno longer had availableto them entry opportunities with built-in promotion ladders. Theyhad largely been relegated to entering retail and consumer services,with far more limited opportunities for upward mobility.
The trend just discussed, which was set in motion in the early1970s when large back-office organizations began investing in cen-tralized EDP, is being followed by yet another trend growing outof the deployment of distributed data processing in the late 1970sand early 1980s. The new generation of computer-communicationstechnology permits geographic separation of back offices from frontoffices of the firm and permits the parent. organization to seek newlocations away from the central districts of very large cities such asNew York, Los Angeles, Chicago, Philadelphia, and other placeswhere back-office jobs have traditionally been located. The great-est impact of this new trend appears to fall on minority women,who had made great gains in entering clerical ranks during the1970s but who may now be left behind in the inner cities where theyreside, while back-office jobs are being moved elsewhere (Noyelle,1986, especially Ch. 5).
While some groups are losing, others are clearly gaining fromthis restructuring/relocation of back-office work. In general, em-ployers relocate their facilities not only in areas where operatingcosts (rent, utilities) and labor costs are lower, but also often inareas where they can find an infrastructure of community colleges(or equivalent) that will help them prepare and train employees.

THIERRY J. NOYELLE 389
Typically, such moves bring firms to the suburbs where they seeklarge pools of middle-aged, married, usually white women. In somecases, they bring employers to communities with large military in-stallations where they hire both married wive3 of enlisted menand retired military clerks willing to put in a few more years ofwork. The advantage of hiring from these groups is that these areworkers who typically demand little by way of mobility opportu-nities, something that most employers can no longer offer becauseof delinking between back-office clerical positions and higher-leveljobs.
THE TRANSFORMATION OF RETAIL EMPLOYMENT
Retail is one sector where employment transformations appearto be less directly linked to recent or past technological changes.This does not mean, however, that the new technology has notfound its way into this sector, but that its impact has been morediffuse and indirect.
The postwar period witnessed the rapid growth and diffusionof large chain organizations. Up until the 1940s, organizations suchas Seal,. or AO' were exceptions. The postwar period saw a rapidgrowth of multiunit organizations in foods, dry goods, hardware,gasoline, and many other areas, penetrating markets traditionallydominated by "mom-and-pop" businesses. The resulting shift inthe scale of operations made possible substantial rationalization,with accompanying major productivity gains .n buying, inven-tory control, and accounting, facilitating the further growth oflarge sales organizations with relatively thin administrative staffs.These changes also made it easier for large retail organizationsto follow their customers into the suburbs, where they were ableto tap into underutilized pools of suburban married women ofteneager to work.
Simultaneously, the cumulative effect of changes in work hab-its and spending patterns (e.g., two-worker families) led retailorganizations to stay open for more hours during the week and tomake more use of part-time employees. In place of thc basic 9-to-5,40-hour work week, many retail organizations, today, are open 65hours a week (10 hours on weekdays; 7.5 hours on Saturday andSunday). In some of the largest metropolitan areas, supermarketscompete on a 24-hour, 7 days-a-week basis. The impact of thesechanges on employment patterns has been dramatic: the reliance
4O

390 EQUAL EMPLOYMENT OPPORTUNITY
on part-time employees has skyrocketed. In department stores, thebreakdown between full-time and part-time employment shiftedfrom 65 percent full time/35 percent part time in the mid-1960sto the reverse ratio nowadays as stores added half-time and short-hour shifts (Noyelle, 1986).
Much of the employment expansion in retail was first based onthe hiring of womenfirst white women, later minority women.Clearly, the expansion of part-time jobs was aimed in part atfacilitating the employment of married women, many of whompreferred not to put in a full work week. While large retail or-ganizations were leaders in uncovering tho'e underutilized poolsof women, the discovery did not go unnoticed for long in otherindustries. As noted previously, large clerical organizations arenow actively seeking such employable women by relocating back-office facilities in the suburban rings of large cities. In the process,these organizations are creating new pressures on the adult womenlabor market. As a result, many retail organizations are now seek-ing to recruit more actively from among high school youth, manyof whom are now available, because, short of educational creden-tials higher than a high school diploma, they are blocked fromcompeting for more desirable jobs.
POLICY IMPLICATIONS
For more than 20 years now, this nation has had a policy ofequal employment opportunity enacted into law, administered bya specialized federal agency, and enforced through the courts.
Because EEO was shaped under specific historical circum-stances, namely, as an outgrowth of the civil rights and, later,women's movements, and because it was shaped in response to thereality of the labor markets of the 1960s and early 1970s, the prin-cipal emphasis of early EEO policy was to stress the eliminationof sex-based or race-based discrimination in the workplace. Work-place discrimination, at the time, was primarily rooted in blatantsex or race job stereotyping, perpetuated not simply through cul-tural biases but quite concretely by excluding women and minorityworkers from entering white men's jobs and from accessing oppor-tunity ladders available to white men. In a period when the largemajority of workers was rarely educated beyond high school, for-mal education beyond the acquisition of basic skills was seen asplaying a relatively minor role in determining what happened to
492

THIERRY J. NOYELLE 391
workers once they entered the labor market. Still, considerableeffort was also placed on desegregating schools to increase the like-lihood that minority youth would acquire basic skills and be ableto enter the labor market on the same terms as white youths.
To assert that sex or race discrimination in the workplace hasbeen eliminated and no longer needs the nation's attention wouldbe ridiculous and wrong. But it would be equally wrong to writeoff the past 20 years of EEO enforcement and assert that nothinghas changed.
This paper suggests that we need (1) a stronger assessmentof the changes that have occurred in the labor market as a resultof earlier EEO efforts, the increasing importance of education,technological change, and the structural shift from manufacturingto services; (2) a stronger assessment of the impact of these changesand their role in bringing to the fore factors of discriminationother than sex or race, especially age and socioeconomic status;and (3) a stronger assessment of the way in which these newfactors of discrimination may be used either independently or inconnection with sexual or racial characteristics to bring aboutdifferent patterns of discrimination.
Formal education is clearly becoming a major determinant of aworker's long-term position in the labor market. This is not simplya case of growing credentialism for the sake of erecting new barri-ers, although the tendency may also be at work. While professionshave traditionally used formal accreditation or licensing based oneducational degrees as a way to keep entry restricted, the risingimportance of education is also a reflection of a growing reliance onexternalization of training. This tendency has been in the makingfor several decades, especially among the upper echelons of the oc-cupational structure. Still, the new technology is intensifying thetrend, by accelerating the formalization of training and educationfor workers employed in a broad range of middle-level occupations.
The increasing importance of education appears to be creatingboth new opportunities and potential problems for groups of work-ers that have traditionally been the target of discrimination. Onthe one hand, the process of externalization of training may makeit increasingly difficult for employers to close off access to skillacquisition as a way to discriminate against women and minorityworkers. The substantial progress of women over the past twodecades in professional occupations attests to this. On the other
403

392 EQUAL EMPLOYMENT OPPORTUNITY
hand, the externalization of training is unlikely to be problem-free. For example, the current structure of our higher educationalsystemcharacterized by considerable disjunction among variouslevels (2-year colleges, 4-year colleg 3s, graduate schools) and oftenlacking flexibilitymakes it difficu .t to find workable continuing-education solutions that arc incrf asingly necessary in order toprogress upward in the labor market during one's work life. Inaddition, to the extent that employers may partly control accessto higher education, for example, by financing retraining programsat the community college level or tuition reimbursement programsat 4-year colleges, there may be room for discrimination to creepback in.
In general, these developments point to the increasing im-portance of the issue of who gets access to preferred educationand why. In a society that is still far from having an equitableeducational system in place, one's family socioeconomic statusmay largely determine one's future position in the labor mar-ket. It has been primarily middle-class women, mostly althoughnot exclusively white, who, over the past two decades, have beenmost successful in advancing to professional positions through thehigher educational route. Short of major changes, this trend mayaccelerate.
In concluding, three points must be emphasized. First, Ibelieve that EEO's traditional emphasis on eliminating culturalbiases and institutional arrangements that perpetuate discrimina-tion in the workplace must be maintained. But I also believe thatEEO policy must begin to reach outside the employing institu-tion to the educational process in order, ultimately, to strengthenenforcement in the workplace. As noted at the outset, this mayrequire new legislation to bring about a more coordinated enforce-ment effort in the two areas.
Second, the linkage between work achievement, education,and socioeconomic background may have major implications forwomen and minority groups that have traditionally used "sex" or"race" as a lever in the workplace. Increasingly, sex or racial groupsmay become differentiated along socioeconomic class lines, so thatrecourse to "sex" or "race" as rallying points in the workplace maylose some strength.
Finally, as the aggregate data indicate, we may need to putin place special efforts to assist minority men who appear to befailing in entering many of the white-collar occupations in the
404

THIERRY J. NOYELLE 393
service sector where much of the future lies. The unrelenting highunemployment among young minority workers must be a matterof special concern. We must find ways to intervene and turn thistrend around.
REFERENCES
Adler, P.1984 Rethinking the Skill Requirements of New Technologies. Working
Paper HBS 84-27, Harv:rd Business School, Division of Research,Cambridge, Mass.
Appelbaum, E.1984 The Impact of Technology on Skill Requirements and Occupational
Structure in the Insurance Industry, 1960-1990. Working Paper.Temple University, Department of Economics, Philadelphia. April.
Bailey, T., and R. Waldinger1984 A skill mismatch in New York labor market? New York Affairs
(Fall):3-18.Bertrand, 0., and T.J. Noyelle
1984 Development and Utilization of Human Resources in the Contextof Technological Change and Industrial Restructuring: The Case ofWhite Collar Workers. Expert Report, Organization for EconomicCooperation and Development, Center for Educational Researchand Innovation, Paris, OECD/CERI/CD(85/8).
Bureau of the Census1974 Census of Population: 1970. Detailed Characteristics. Report PD(1)D.
Washington, D.C.: U.S. Department of Commerce.1984 C maim of Population: 1980. Detailed Characteristics. Report PC80-1-
D. Washington, D.C.: U.S. Department of Commerce.Bureau of Labor Statistics
Var. Employment and Earnings. Washington, D.C.: U.S. Department ofyears Labor.1984 1995 Industry-Occupational Employment Outlook. Washington, D.C.:
U.S. Department of Labor.Edwards, R.
1979 Contested Terrain. New York: Basic Books.Gallo, C.
1983 The Construction Industry in New York City: Immigrants andBlack Entrepreneurs. Working Paper. Conservation of HumanResources, Columbia University, New York.
Ginsberg, E., and G. Vojta1981 The service sector of the U.S. economy. Scientific American 244
(March):48-55.1985 The Large Corporation at Risk. New York: Basic Books.
Hirschhorn, L.1984 Information Technology and the Office Worker: A Developmen-
tal View. Working Paper. Management and Behavioral Center,University of Pennsylvania, Wharton School, Philadelphia.
405

394 EQUAL EMPLOYMENT OPPORTUNITY
Ichnowski, C.1983 Have angels done more? The steel industry consent decree. Indus-
trial and Labor Relations Review 36(2):181-198.Northrup, H.R., and J.A. Larson
1979 The Impact of the AT&T- -EEO Consent Decree, Vol. #20. LaborRelations and Public Policy Series, University of Pennsylvania,Wharton School, Industrial Research Unit, Philadelphia.
Noyelle, T.J.1984 Work in a World of High Technology: Employment Problems and
Mobility Prospects for Disadvantaged Workers. Paper prepared forthe Educational Resources Information Center, U.S. Departmentof Education and the University of Tennessee, Office for Researchin High Technology Education, Knoxville.
1986 Beyond Industrial Dualism: Market and Job Segmentation in the NewEconomy. Boulder, Colo.: Westview Press.
1987 Technological Change and Employment in the Financial Service Indus-tries. Conservation of Human Resources, Columbia University,New York.
Osterman, P.1982a Internal Labor Markets in White Collar Firms. Working Papers
#90. Boston University, Department of Economics.1982b Employment structures within firms. British Journal of Industrial
Relations 20(3):349-361.Rajan, A.
1984 New Technology and Employment in Insurance, Banking and BuildingSocieties: Recent Experience and Figure Impact. Gower and Aldershot,U.K.: Institute of Manpower.
Stanback, T.M., Jr., and T.J. Noyelle1982 Cities in Ransition. Totowa, N.J.: Rowman and Allanheld.
Stanback, T.M., Jr., P.J. Bearse, T.3. Noyelle, and R. Karasek1981 Services/The New Economy. Totowa, NJ.: Rowman and Allanheld.
U.S. Equal Employment Opportunity Commission1966 EEO-1 Report on Minorities and Women in Private Industry. Washing-1978 ton, D.C.: U.S. Equal Employment Opportunity Commission.1981

Managing Technological Change:Responses of Government, Employers,and Trade Unions in Western Europe
and Canada
FELICITY HENWOOD AND SALLY WYATT
NEW TECHNOLOGY IN THECURRENT ECONOMIC CLIMATE
Technological change has always been a major factor in theuneven development of industries and occupations. It is often sug-gested that the development of radical new technologies has pro-vided the impetus for major changes in the pattern of economicdevelopment both within and between countries. The restructur-ing of industry that accompanies such technological innovationthen leads to significant changes in the level and structure of em-ployment and in the nature and organization of work. The waysin which these changes E re managed differ between countries ac-cording to the part played by governments, employers, and work-ers' organizations. Furthermore, the role of each of these groupschanges over time and is closely related to the overall economicclimatein particular, the level of unemployment.
In the 30 years after World War II, many Western industrial-ized countries experienced faster technological change than duringany period since the Industrial Revolution, and yet these changeswere largely managed within a cooperative environment, by mu-tual agreement between unions and managers. The relative lack
395

396 MANAGING TECHNOLOGICAL CHANGE
of worker resistance to technological change during this period is,of course, directly related to the fact that this was also a period ofeconomic growth and prosperity in most western European coun-tries. By the mid-1970s, however, economic recession and risingunemployment had led to the reemergence of debates about therelationship between technological change and unemployment. Ithas been during this last decade or so that there has been, in mostof these countries, a serious challenge to the established frameworkfor managing technological change.
Clearly, on one level, employers can be seen as having theprerogative in many of the decisions surrounding technologicalchange. It is they who make investment decisions and they whohave the final right to hire and fire their employees. The relation-ship between labor and capital in market-oriented economics hasbeen described as a "compulsory symbiosis in which the employersare in a fundamentally favorable position" (Markmann, 1985:141).There are many examples, however, of government interventionand worker participation in technological decision making thathave resulted in more favorable outcomes for employees. Throughgovernment initiative in establishing more progressive frameworksfor labor-management negotiations around technological change,many countries are now realizing the benefits of involving workersin such negotiations. In the next section, we discuss and com-pare the parameters of government, employer, and trade unionintervention in technological decision making in several westernEuropean countries and Canada. This discussion forms the back-drop for the discussion in the following sections, which examines,in some detail, the part played by each of these groups in resolv-ing conflicts over specific issues related to the introduction of newtechnologies, such as job design, changing locations and hours ofwork, and education and training.
The overall aim of this paper is to examine these issues withspecific references to women and women's employment. We shallpay particular attention to the different experiences of women andmen. It is important to examine women and men as distinct groupswhen analyzing the relationship between new technology and paidwork and, therefore, when developing policies aimed at alleviatingthe problems that are encountered when new technology is intro-duced into the workplace. Reasons include the following: First,the labor markets in the countries under consideration are char-acterized by a high degree of occupational segregation in which
4 9

FELICITY HENWOOD AND SALLY WYATT 397
women are concentrated primarily at the lower levels in a fewoccupations. Not only does this help to explain women's lowerearnings on average and their relative powerlessness, it also makeswomen more (or less) vulnerable to changes in technology. Second,women's participation and experience in paid work will continueto be different from men's as long as women continue to bearmajor responsibility for household work and child care. (Table 1presents indicators of women's position in the labor market forselected industrialized countries.) Government legislation againstsex discrimination and in favor of equal pay exists in most West-ern industrialized countries; it is generally recognized, however,that these measures have not yet achieved equal opportunity inthe workplace nor have they begun to address women's and men'sunequal family roles.
THE MANAGEMENT OFTECHNOLOGICAL CHANGE
The management of technological change takes different formsin different countries according to the political organization, indus-trial relations, and cultural environments of the different countries(Evans, 1983:154). However, it is possible to point to three mainmethods of management which, to a greater or lesser extent, canbe found in most western European countries. Jostein Fjalestadof the Norwegian Computer Centre has described these meth-ods as (1) regulationbased on legislation, standards, and rules;(2) negotiationsresulti.lg in technology agreements; and (3) lo-cal developmentswhich ensure that agreements are relevant toparticular -.7orkplaces (Fjalestad, 1981). Table 2 summarizes thevariety of procedures adopted in different European countries.
Evans (1983:156) has argued that regulation, negotiation, andlocal developments should be seen as complementary approachesto the effective management of technological change:
Laws and standards define minimum requirements. National, sec-toral and corporate technology agreements establish the proceduresand broad actions to be followed and the mechanisms to resolveconflicts. They set out the framework to be used in negotiatingacceptable arrangements at local levels. Without genuine localagreement, however, the other methods will fail to achieve theiraims.
We shall discuss briefly the relative importance of each of thesemethods for the management of technological change in several
41_19

TABLE 1 Selected Indicators of Women's Position in the Labor Market for Selected Countries, 1982
Indicator Belgium Denmark
FederalRepublic ofGermany France Sweden
UnitedKingdom Cz.nada
UnitedStates
Women as percent ofecoromically activepopulation 30.71 45.7-b 33.9 33.5 46.3 35.9 41.2 40.3
Percent of women who areeconomically active b48.7- b72.0- b50.1- b52 5- 70.0 b57.3- 52.8-
b
Women as percent of totalbemployees in employment 36.9 44.8- 38.6 38.8 46.1 41.1 41.2 43.5
Unemployment rateTotal 13.8 9.8 7.5 8.5 3.1 12.1 11 0 9.7Women 20.0 10.4 8.6 10.8 3.4 7.8 10.8 9.4
Women's wages in non-agricultural activitiesas percent of men's 73.6 83.9 72.7 88.6 69.1 72.012
-1 I 0

Percent of women inemployment who work parttime (lets than 30 hoursper week) 29.01-1 42.01 24.01 20.0A 61.65 46.0 24.0
Usual emtractually agreedhours of work of industrialworkers (weekly) 37.6-40 40.0 40.0 39.0 37.6-40.0
Union members as percentof all workers 72.6 76.6 42.0 26.0 52.6
-Data for 1980.Data for 1981.SData for 1983.
SOURCES: Compiled by the authors from data in ILO (1983), Berner (1984), Equal Cpportunities Commission (1984),David-McNeil (1984), Department af Zmployment (UK) (1984), Boulet (1984), Liiea Rantalaiho (personal communication, 1985),Johannesson and Pennon-Tanimura k1984), and Peitchinis (1984).
41_1

TABLE 2 Examples of Procedures for Regulation of Technological Change in Several European Countries (to 1983)
Country Laws and RegulationsCollective AgreementsNational Agreements Sectoral Level Company or Plant Level
West Germany
U.K.
Norway
Works ConstitutionAct 1972
Works Safety Act 1973phi' VDT regulations1981
None
Health and Safety at NoneWork Act 1985
Working EnvironmentAct 1977, plus VDTRegulations, 1982
Job protectionagreements inmetal working,textiles, footwear,leather, paperprocessing, printing
Parts of publicsector
1975 Employer/Union BankingAgreement oncomputer-basedsystems
4 R
Over 100 agreementsconcluded
Over 200 agreementsconcluded
Most of industryand services coveredby local agreements

Sweden
Various
Working EnvironmentAct of 1978, plus VDTRegulations 1981Codetermination Act1977
Health and SafetyLaws (France, Italy,and elsewhere)Codetermination laws(e.g., in Austria)Statute of WorkersRights 1970 (Italy)
1976 Employer/UnionWork EnvironmentAgreement
1981 agreement forprivate sector inDenmark
Technology agreementin printing. Co-deter-mination agreementsin public governmentand private industry
Printing sectorin Netherlands,Belgium, Austria, andGreece; metal workingin Italy
Use of legislativerights
In USA, 1979 Fordagreement on proceduresfor introducing technology.General Motors quality ofworking life programme.
In :apart, company unionsconsensus in return for jobsecurity and incomesector.
SOURCE: Evans (1983:155). /I..-printed with permission from Francis Pinter Publishers.
4 1 3

402 MANAGING TECHNOLOGICAL CHANGE
European countries, in some cases comparing European experi-ences with those of the United States and Canada.
THE ROLE OF GOVERNMENTS
Most western European governments take the view that em-ployment will be generated only if and when the "new technology"industries are established. Thus, a major part of government ac-tivity in the new technology area is concerned with the promotionof research and development (R&D) in the fields of microelectron-ics, telecommunications, and computers and in the strengtheningof links between government, research establishments, and indus-try. There are important differences between countries regardingthe extent and nature of government intervention in such pro-grams. For example, the French government, unlike the UnitedKingdom and West German governments, believes that it is le-gitimate and necessary for politicians to control industry overtly,not only to strengthen it in a general way. Over the last fewyears, several broad, new programs were launched: for example,the 3-year program for the promotion of "productique" in France,the Technological Development Program in Denmark, and theAlvey program in the United Kingdom (Commission of the Euro-pean Communities, 1984b). In early 1984, a European EconomicCommunity f,BEC) initiativethe European Strategic Programfor Research on Information Technologies (ESPRIT)was giventhe go-ahead. Like the national programs, the main purpose ofthe EEC program is to promote cooperation among enterprises,research centers, and universities through public subsidies, with aview to creating or consolidating European industrial potential innew technology fields such as advanced microelectronics, softwaretechnologies, advanced information processing, office automation,and computer-integrated manufacture.
The above examples of government initiatives to promote newtechnologies illustrate the separation that is so often made bygovernments between the growth of new technology industries andthe employment problems that such growth may cause. In manycases, the priority for governments is the development of the newtechnologies. The "effects" of the new technology, such as jobdisplacement and changing skill requirements, are generally dealtwith "after the fact" by separate employment and/or trainingpolicies, usually administered by various government departments.
41

FELICITY HENWOOD AND SALLY WYATT 403
Governments in some countries, however, are beginning to take amore interventionist role in attempting to prevent, rather thansimply alleviate, the most adverse effects of new technol,- -ies.
Of course, the relationship between technology and the de-mand for workers is complex. The industries based on the newtechnologies, once established, may or may not generate manyjobs. And job displacement and changing skill requirements canoccur for reasons unrelated to technological change. Uneven eco-nomic growth, international competition, and shifts in demandgenerate employment change as well. Moreover, changes in workorganization, such as subdividing or integrating jobs, occur moreor less continuously, often without the facilitating influence ofspecific innovations. Nevertheless, current technological develop-ments are widely recognized as 11,...ving enormous potential for bothproductivity improvement and work reorganization, with substan-tial, if nut totally known, effects on workers. And, as noted above,these rapid technical developments have also occurred during aperiod of economic difficulty. Interventions by government aimedat shaping technological change, though important, necessarily donot address all factors affecting employment.
Legislation to set minimum standards in technological deci-sion making is used in several countries in two key areas: healthand safety and "co-determination." The 1977 Norwegian WorkEnvironment Act is a good example of government interventionto ensure that the health and safety of employees is maintainedwith the introduction of new technologies. Among its provisions(quoted in Deutsch, 1986:37) are the following: "Technology, orga-nization of the work, working hours and way systems shall be setup so that the employees are not exposed to undesirable physicalor mental strain and so that their possibilities of displaying cautionand observing safety measures are not impaired." The Act alsoextends to encouraging workers' personal and professional devel-opment, avoiding undiversified and repetitive work, and involvingemployees and their elected representatives in planning work andwork changes. Another example of legislation being used to setminimum standards is the 1976 Swedish Act of Co-determination.Employers are required by it to inform trade unions about plansfor future developments and to initiate discussions and negotia-tions on new technology before any changes take place or any finaldecisions are made on the nature of the system (Evans, 1983:157).West Germany also has a form of co-determination legislation.
41

404 MANAGING TECHNOLOGICAL CHANGE
Under this law, any plant or company of more than five employ-ees must have a works council composed solely of representativesof employees. Works councils have found it difficult, however,to use information disclosed to them because they are outsidethe mainstream of collective bargaining, which takes place be-tween employers' associations and union confederations (Evans,1983:164).
THE ROLE OF EMPLOYERS AND TRADE UNIONS
The role ..,L government in influencing the pattern of intro-duction of new technology in any particular workplace is limited.The most important negotiations about technological change atthis level take place between the employers or management andthe workers, often, although not always, via the local trade unionbranch. During the 1970s, a fairly coherent and comprehensiveapproach toward negotiating about technology began to emerge inseveral western European countries. The "new technology agree-ments" or "technology agreements" had the effect of placing onthe agenda of collective bargaining "a range of topics which affectall aspects of technological and organizational change" (Evans,1983:158). This development has been an important one that hasmarked a shift, on the part of organized labor, from what mightbe seen as a reactive strategy toward new technology, to a moreproactive one.
The 1975 agreement between national management organiza-tions and unions in Norway can be seen as the archetypal tech-nology agreement that influenced discussions and actions aroundthe world. Evans (1983:158) has described the principle stated inthat agreement as one where "the social effects of new technologyshould be regarded with equal importance to economic and techni-cal considerations." Both procedural and substantive elements arefound in technology agreements. The former is concerned with themethods of introducing the new technology and the latter withthe operational conditions once the technology is implemented.A summary of the main clauses to be found in most technologyagreements can be found in Table 3.
In spite of a great deal of discussion among organized workersconcerned with broad issues such as the future of work and theways in which different groups of workers are affected by the in-troduction of new technology, technology agreements on the whole
41i3

FELICITY HENWOOD AND SALLY WYATT 405
TABLE 3 Summary of Main Clauses Found in Technology Agreements
Procedural provisions in technology agreementsA commitment by all parties to encourage the introduction of new
technology and the successful management of change.The provision by management of full and timely information, in clear
and jargon-free language, about plans for technological change.To be useful, the information must be provided at an early stage,before decisions are implemented. The agreement should beexplicit about the likely effects of change and the optionsavailable.
The establishment of joint management/union bodies to discuss,monitor, and negotiate change at corporate and local levels.
The opportunity for the election and training of "technologyrepresentatives" or "data stewards" with responsibility formonitoring the introduction of new technology on behalf of staff,and who keep in close touch with grassroots experience andopinion.
The arrangements by which unions can have access to outsideexpertise, just as management hires external consultants.
The establishment of a procedure for monitoring and regulating thecollection and use of personal data on individuals working in theorganization.
A status quo clause which gives the unions a right to veto changesunless they have been consulted and an agreement reached.
Substantive issues on technology agreementsJob security following the introduction of new technology. This
could aim to maintain the same number of job posts (total volumeof employment) or, if some reduction in employment is unavoidable,to offer guarar...ees of no compulsory redundancy.
The provision of adequate retraining opportunities to staff whosejobs are changed or eliminated by new technology and theestablishment of guidelines on the maintenance of status and payin them new job.
Methods for sharing the benefits of new technology with employeesthrough, for example, improved pay, shorter working hours, and abetter working environment.
For older staff, the offer of adequate schemes for voluntary earlyretirement.
Monitoring of the impact of new technology on the workplace in termsof issues such as stress, alienation, reduced social contact, orincreased central control and supervision.
Health and safety regulations on aspects of working with computers,based on independent guidelines encompassing physical, software,and psychological ergonomics factors.
Protection of the confidentiality of personal information collectedabout employees and guaranteeing that such information will belimited to activities of direct relevance to work at theorganization. Many countries have Data Protection Legislation toprovide the basic guidelines.
SOURCE: Evans (1983:162).
4r/

406 MANAGING TECHNOLOGICAL CHANGE
have been primarily concerned with protection of existing jobs andconditions of work for existing employees. This narrow focus hasled to the making of agreements that have implicitly discriminatedagainst women. "No redundancy" (layoff) clauses, for example,have protected existing employees but have done nothing to pro-tect jobs for which there is a high turnover, as is the case for manywomen's jobs. In many instances, employers have relied on thesehigh turnover groups to provide "natural wastage" (attrition).Clearly, unions are working under enormous constraints when ne-gotiating around new technology, with technology agreements be-ing seen by some employers as "interfering with the manager'sright to manage." However, unions have an obligation to repre-sent the interests of all their members fairly; recognition of existingdifferences and a commitment to overcoming existing inequalitiesare necessary first steps.
Insofar as trade unions are an important vehicle through whichworkers can influence the shape of technological change, women'sparticipation in the unions is important. Again, there are signif-icant differences between countries in this respect (see Table 1).In relation to negotiations around new technology, iomen can beseen as both disadvantaged and well placed to negotiate in theseareas. In the following discussions of specific issues that arise innegotiating around technological change, we discuss how, whilewomen may be disadvantaged in terms of their position in thelabor market and their low levels of unionization relative to men,they have, by virtue of their particular experiences of work, bothpaid and unpaid, some very important contributions to add tothese negotiations. We argue that this is particularly the case inrelation to quality of work issues: job design, changing locationand changing hours of work, and education and training.
POLICY ISSUES
JOB DESIGN
_ Many studies of women's work and new technology have fo-cused on changes in office work, where women workers predom-inate, and it is with this area of work that we shall be mostconcerned in the following sections. Although research has high-lighted a host of changes associated with the introduction of newoffice technologies, such as changes in job content, skills required,
413

FELICITY HENWOOD AND SALLY WYATT 407
increasing specialization, and/or routinization of jobs for secre-taries and clerical workers, most successful negotiation has tendedto focus on the narrower, although perhaps more tangible, ques-tion of ergonomics. Successful negotiation about the ergonomicaspects of video display terminals (VDTs) and about the lengthof time people can be required to work on them without a breakhas occurred in most European countries. As many commentatorshave pointed out, however, increased stress and other psychologi-cal problems associated with the use of VDTs are not entirely dueeither to the physical arrangement of the workstation or to thetime spent on the machines.
A comprehensive German study which examined the effects ofworking with VDTs points out that the "stress" associated withthe use of VDTs is related to the nature of the job itself (Cakir etal., 1978). The study found significant differences in levels of stressexperienced by workeia depending on whether they were using theVDTs as a tool in their job or whether their job was to operatea VDT. Thus, VDT operators were found to have much higherstress levels than programmers and publishing editors. Clearly, itis not possible to be absolutely certain as to the reasons for thehigher levels of stress found among VDT operators, but the study'sfinding of a high correlation between the time spent working atthe screen and the feeling that all the details of the work were toorigidly defined suggests that broader aspects of the job than timespent on VDTs must be taken into consideration.
Some interesting work done at the Norwegian Computing Cen-tre on visual display terminals and the working environment makesa similar point (Thoresen, 1983:85). This research illustrates thattackling ergonomics alone will not necessarily improve the job over-all because so many additional factors affect the quality of work.Thoresen describes how, in attempting to overcome the physicaland psychological problems associated with the use of VDTs, at-tention has generally been focused on the physical arrangementof the workstationthe desk, chair, lighting, display unit, andkeyboard. She points out, however, that "one soon discovers thatsuch measures only have limited effects" (Thoresen, 1983:85) andthat other aspects of work, not associated with the physical ar-rangement of the workplace, must be considered. Following theconcept of work adopted in the Norwegian Work Environment Actof 1977, Thoresen stresses the opportunities for professional andpersonal learning and development that a job can provide.
43

408 MANAGING TECHNOLOGICAL CHANGE
Bjorn-Anderson (1983), in his study of the changing roles ofsecretaries and clerks following the introduction of new technology,identified four main factors central to the design of jobs. Theseare job content, work autonomy and control, ergonomics, and psy-chological aspects. In his research he found that new technology,as currently used, tends to lead to overspecialization, which inturn leads, especially at the lower levels of the office hierarchy,to the creation of boring jobs with limited scope for learning andinitiative, and that overcontrol by the computer has led to lossof autonomy for individual workers. However, he round that thisneed not be the case. He argues that, provided the computer sys-tem has been designed with enough flexibility, most job functionsin the office can be enlarged to encompass a variety of activitiesand skills.
As noted above, employers in most European countries aremoving toward the recognition of the importance of worker par-ticipation. In many cases, employer support for such participa-tion has been won by persuading them that dissatisfaction amongworkers will, in the end, result in less-efficient workplaces. Bjorn-Anderson (1983) addresses employers when he argues that themost effective and acceptable way of overcoming any staff resis-tance to new technology is to allow staff to take an active partin designing their own work environment. Obviously, the extentto which emplt,;p0s are able to exert influence depends on numer-ous factors, including access to the relevant information at theright time, the level of organization among those affected, and thesupport they receive from other workers, especially those seen bymanagement as essential workers. In many cases, where women'sjobs at the lower end of the job hierarchy are particularly affected,this may mean relying on the support of the more secure, oftenmale, workers. Conflicts of interest between workers at differentlevels of the occupational hierarchy will have to be faced and tosome extent overcome if workers are to be effective in influencingdecision making.
Numerous examples of successful negotiations around job de-sign have resulted in maintenance or even improvement of the qual-ity of work after the introduction of new technologies. The mostsuccessful have been those that have been concerned with morethan ergonomic issues and have looked at job design in the broadersense discussed here. Some good examples include (1) the Copen-hagen Business School in Denmark where some secretaries took
429

FELICITY HENWOOD AND SALLY WYATT 409
on responsibilities for new tasks following the introduction of newtechnology, which reduced their previous work load and removedsome of the decision making from their jobs (see Bjorn-Anderson,1983:123); (2) the introduction of a new computer-based systeminto the Norwegian savings banks: as a result of union involve-ment and negotiation with the systems designers at the bankingindustry's research and development center, the workers were ableto retain certain decision-making aspects of their jobs which mostcertainly would have been removed had they not been involved inthe discussions (Howard and Schneider, 1985:30); and (3) the caseof the postal workers in Norway where the workers managed toretain some elements of their jobs which they believed contributedto their sense of job satisfaction: customer contact was retaineddespite attempts by the postal authorities to introduce a systemwhich would have prevented direct contact between an individualworker and a customer (Bermann, 1985).
In considering the gender dimension of these debates and nego-tiations, we found that some of the most important and progressiveapproaches to questions of jab design and quality of work have beeninformed by the experience of women's work. Indeed, Bermann(1985) suggests that women's involvement in people-oriented ser-vice work means that they are in a far better position than mento assess how the qualitative aspects of jobs may change 1-44-h newtechnology. As she also notes, women's influence is not alwaysdirected through the trade unions. In discussing the importanceof informal worker influence, Bermann (1985:235) describes "self-selected groups of women organizing word-processing units andgaining considerable competence in programming and repairingmachines and in organizing work, [and] groups of women workingto rule after computer systems had been 'dumped' on them." Shegoes on to point out that, whereas the women's supervisors sawtheir work only in terms of "narrow, formalized, `ft nctions.thereproduction of signsthese women made their broader knowl-edge relevant" (Bermann, 1985:235). As a zcsult of the women'sefforts, several regional and sector-specific union chapters startedto provide for the exchange of such experiences in the form ofcourses or seminars that then provide the basis for mobilization.This example illustrates both how women have valued aspects oftheir work that their superiors would have overlooked and howthey were, therefore, in the best position to represent their owninterests.
421

410 MANAGING TECHNOLOGICAL CHANGE
The importance of discussion and negotiation about job designis the recognition that the organization of jobs and the use ofmachinery and equipment in those jobs are the result of politicalstruggle and political decision making. As we have noted, thereare often significant differences of interest and certainly differentialaccess to the decision-making structures both between employersand employees and between groups of workers, not least betweenwomen and men. There are als1 institutional differences betweencountries concerning the extent to which different groups are ableto effect change. In Denmark and Norway, for example, there is amuch stronger tradition of worker participation than in either theUnited States or the United Kingdom.
CHANGING LOCATIONS AND CHANGING HOURS OF WORK
When we examine the debates around the changing locationsof work and the changing hours of work facilitated by the newtechnology, we find, as with job design, that women's experiencesof work have often led them to make demands different fromthose of men. For example, in the debates around homeworking,women's and men's different experiences of work have led themto focus on different concerns (Huws, 1984; Monod, 1984). Inparticular, groups of office workers have been concerned about thepossible increase in the use of homeworkers in data-entry and data-processing type jobs because these workers are not likely to escapethe disadvantages that traditional homeworkers have faced, suchas low pay, little job security, and inadequate working conditions.While women in the more professional groups of new homeworkers,such as software designers and programmers, may be better placedthan clerical workers to cope with the problems associated withhomework, insofar as they still have the major responsibility forhousework and child care, they, too, will remain disadvantagedrelative to the majority of men.
In the discussions around changing working hours, womenand men have again had different priorities, largely attributableto women's greater domestic responsibilities and their particularexperience of paid work. The Organization for Economic Coop-eration and Development (OECD) conducted an informal surveyof the institutions of its member countries and found a wide vari-ety of attitudes and policies related to working time adjustments(OECD Sectretariat, 1985:188-189):
422

FELICITY HENWOOD AND SALLY WYATT 411
1. In many countries, notably Scandinavia, the reduction ofworking time is discussed in terms of the improvement of socialwelfare.
2. Some other countries, France for example, regard policiesfor reducing working time as fundamental in the fight againstunemployment.
3. Employers are generally against the reduction of workingtime. They are worried about its effects on production costs and,thus, on their competitive position.
4. In nearly every case, unions are in favor of reduced workingtime, though they are concerned with the timing of any measures.
5. There exists considerable uncertainty as to the actual im-pact on employment and unemployment. Estimates vary in thebasic assumptions adopted and do not always take account ofsecondary effects.
The Commission of the European Communities is concernedprimarily with how to reduce working time in order to reduce thehigh levels of unemployment that exist in its member countries.The Commission issued some (legally binding) directives earlierthis decade which were intended to ensure that part-time andtemporary workers had the same rights and obligations as full-time workers. One obvious goal of the directives was to providelegal safeguards for forms of work that deviate from the currentnorm, but it is interesting to note that such directives were is-sued at a time when unemployment was at an unacceptably highlevel. By making part-time work relatively more attractive toworkers, the Commission may have hoped to reduce the demandfor full-time jobs. The Commission of the European Communities(1984a:21) is also concerned with changing the norm through sup-porting measures aimed at redistributing work; rather than issuea binding policy directive, however, they issued a set of guidelinesand objectives concerned with the reduction and/or redistributionof working time, which includes the following:
1. The competitiveness of enterprises should not be affected;i.e., unit production costs must not rise.
2. The reorganization of working time should result in moreflexible utilization of capital equipment; i.e., actual productiontime should be lengthened.
3. Special measures should be taken, where necessary, to avoidshortages of particular types of workers.
42,3

412 MANAGING TECHNOLOGICAL CHANGE
4. The characteristics of particular sectors and specific types ofenterprises, particularly small firms, must be taken into accou .t.
Policies attempting to reduce or reorganize working time fallinto one of the following categories: part-time work and job shar-ing, reductions in the length of people's working lives, longerleisure blocks and redistribution of working time, and reductionsin working time for everyone. Such policies may not be primarilymotivated by the current wave of technological change, just as thecurrent unemployment may have no direct relation to technicaladvances, but enacting such polies may be facilitated by the newinnovations. And many believe that the productivity-enhancingcharacteristics of the new innovations may make such policies in-creasingly necessary in the future.
Part-Time Work and Job Sharing
Most part-time workers are women, and many women whowork, work part-time (see Table 1). Part-time work almost in-evitably means low pay, low status, and little job security. Thedecision to work part-time is not often one of positive choice bywomen but rather one of necessity, particularly when there isminimal public provision for the care of children or the elderly.
Job sharing has become an acceptable alternative form ofpart-time work; it refers to the sharing of a full-time, usually pro-fessional, position with commensurate rights and responsibilities.Job sharing is on the increase in the United Kingdom, especially inthe public sector. Employers benefit because staff are more likelyto return after maternity leave, the job is covered when one personis ill or on holiday, and, as one personnel manager says, "Twoheads are often better than one and because staff are content andcommitted, they often put in more than a week's work" (Meade-King, 1985:9). Job sharing also gives the employee the optionof meeting domestic responsibilities or of pursuing other interestswhile maintaining some career continuity. So far, however, jobsharing has not been widespread among low-paid women or men.Among its disadvantages as a policy are that it is an individualsolution, rather than a direct attack on a broader problem, and itleaves unchallenged the notion that the full-time week is the norm.
One OECD commentator expressed his concern that the in-creased availability of part-time work or job sharing will not actu-ally lead to a reduction in the level of unemployment because the

FELICITY HEN WOOD AND SALLY WYATT 413
only effect will be to induce more women to enter the labor market(Barou, 1985:221). This is a good illustration of the fact that whenmany people talk about a return to full employment what theymean is full-tiLie male employment, rather than everyone's rightto paid work.
The United Kingdom government has found a way of notchallenging the classic definition of full employment while, at thesame time, promoting part-time work. The Job Splitting Schemeprovides cash incentives for employers who split a job in orderto offer part-time work to unemployed people seeking full-timeemployment. This scheme explicitly excludes married women who,since 1983, are not recognized as unemployed if they are living witha man who has a paid job (Meade-King, 1985:9).
.teecluctions in the Length of People's Working Lives
Together with a move t3 longer schoolingcompulsory edu-cation or youth training schemes (see below for further discussionof training and education)a feature of recent years has been tolower the retirement age and promote early retirement schemes.One example is the early retirement law, which came into effectin Germany in May 1984. The retirement age, for women andmen, was lowered from 59 to 58. When firms, on the basis ofcollective agreements or individual agreements between workersand employers, agree to early retirement schemes they receive asubsidy from the government if they replace the retiree with anunemployed person or with someone under age 26 (Commission ofthe European Communities, 1984a:101).
Many firms were able to lower the average age of their staff,adjust their skill mix, and reduce their total wage bill as a resultof the departure of long-serving workers on high rates of pay. Theeffect on unemployment was significant. While such measures dorelieve labor market congestion in the short term, there are costsinvolved such as the subsidies to employers (though this mustbe offset against the costs of paying unemployment benefits orwelfare to those young people who might otherwise have remainedunemployed), and the economy is deprived of the accumulatedexperience of older workers (Barou, 1985:215-216).

414 MANAGING TECHNOLOGICAL CHANGE
Longer Leisure Blocks and Redistribution of Working Time
The phenomenon of long periods of free time is still relativelynew, and the 8-hour day, 5-day week is still the norm. Interest inthe redistribution of working time is growing: workers can gainlonger periods of free time and employers can use their capitalequipment for longer periods, if not continuously, through flexi-ble shifts. In Italy and the United Kingdom, experiments havebeen conducted with five crew members shiftworking in either8- or 12-hour shifts (Commission of the European Communities,1984a:64). Such plans could have the effect of further excludingwomen from certain areas of the labor market because, in manycountries, women are prohibited from working night shifts in se-lected manufacturing industries.
Women's and men's different responsibilities have affectedtheir views on redistributing working time. In Slandinavia, inbroad-based discussions regarding the overall reduction of workingtime, women have tended to favor the option of a shorter workingday, whereas men favor a shorter working week (DELFA, 1984:3).One suggestion (to our knowledge, as yet untried) has been for a30-hour week to become the norm, because it provides for manydifferent possibilities of work organization, such as a 4-day weekfor workers, but the firm itself would operate for 5 or 6 days; a6-hour day, 5-day week, in which case the firm could operate for12 hours a day, with relatively acceptable working hours for itsworkers; variable working hours related to seasonal activities, i.e.,6 months with a 20-hour week and 6 months with a 40-hour week(Barou, 1985:221).
For any of these arrangements, it is important to see whetherthey complement the worker's other responsibilities. Cooperationof the work force is necessary because all of these arrangementshave the potential to profoundly affect people's daily and weeklyroutines. Care must also be taken to ensure that new work policiesdo not reinforce existing gender inequalities; indeed, such arrange-ments could contribute to redistributing unpaid work more equallybetween men and women, notably caring for children, older people,and sick or disabled people.
Reductions in Working Time for Everyone
Overall reductions in working time are most often the resultof collective bargaining. Many different agreements have been
4:-!t;

FELICITY HENWOOD AND SALLY WYATT 415
reached in Europe. In some cases the government has not beeninvolved, in others, such as the Netherlands, the government hasmade recommendations, and in some, notably France, the govern-ment has played a much more active role.
One obvious way to reduce working time is to introduce longerperiods of paid holiday. In Germany, a sixth week of annual leaveis fast becoming the norm. The first agreement was reached in themetal-working sector in 1978. Since then the proportion of workersentitled to 6 weeks leave has risen from 4 percent in 1980 to 25percent in 1981 to 38 percent in 1982. Other workers whose termsof employment are governed by collective agreements (90 percentof all wage earners) are entitled to at least 5 weeks. Employersconsider this method to be the least disruptive of production;however, this may not be the case in countries such as Francewhere whole firms usually close in the August holiday period. Forthat reason when a fifth week of holiday was introduced in Franceit was explicitly stated that it could not be taken consecutivelywith the other 4 weeks (Barou, 1985:216).
For countries where weekly working time is statutory, anothermethod of reducing working time is simply to change ',he law. Thiswas done in France at the beginning of 1982. Five weeks holidayand a statutory 39-hour week were introduced, with maximumworking hours reduced to 48 in a given week and to a weeklyaverage of 46 over a 12-week period; detailed arrangements at theenterprise or sectoral level were settled subsequently. Studies doneby the French authorities to assess the impact of these measuresestimate that 70,000 nonagricultural jobs were saved or created bythese reductions in working time (Barou, 1985:216-218).
In addition to the statutory measures introduced in France,some collective agreements were reached at the enterprise level. Inone "solidarity contract" the aim was to achieve a 3 lour weekwith a planned 5 percent increase in the number of jobs and a10 percent increase in productivity. The package was worked outbetween workers' representatives and management, with the gov-ernment providing the legal framework and some financial aid.This scheme aims to achieve an expansion of business, togetherwith a reduction in unemployment. The advantage of this schemeis that the objectives of the workers regarding employment oppor-tunities are in line with the management's objective of maintaining

416 MANAGING TECHNOLOGICAL CHANGE
or improving their competitive position through reducing unit pro-duction costs. In this case, it was possible for management andworkers to share productivity gains.
There are many ways of reducing working time tht are ofbenefit to both workers and employers. The most effective arethose that are more flexible and innovative than traditional shiftwork and that are agreed to on a collective basis at the enterpriselevel, though governments have a role to play in facilitating discus-sion and providing financial assistance in order to have a positiveimpact on employment levels. These new initiatives can be atleast partly funded through gains in productivity, achieved eitherthrough the use of new capital equipment or through the extendeduse of equipment currently owned. Collective bargaining shouldallow for differences between workers; individuals should have theoption of choosing between working patterns, which might be de-pendent on their life-cycle stage. In addition to providing greaterchoice for individual workers, such schemes should also aim toredistribute the unpaid work in society, at present, largely per-formed by women. The widespread use of part-time work is nota substitute for a collective policy on reducing working time. Theintroduction of new technologies and the possibilities it offers fora reorganization of working time create potential for radical socialchange that could benefit both men and women.
TRAINING AND EDUCATION
There is little agreement among the "experts" regarding pre-cisely what skills will be needed in the future (Townson, 1983;Women's Bureau, L ' our Canada, 1982; Leontief and Duchin,1986). It is not c' -.t new jobs there will be nor I. ow ex-isting jobs will b i It is agreed, however, that at thevery least people .. :re some generic scientific and technicaltraining to prepare them for the rapid changes in technology thatare characteristic of today's industrialized economies.
Training is often seen as the key factor in enabling peopleto take advantage of the opportunities provided by new technol-ogy. Without training or retraining, workers are more likely tobecome unemployed or stuck in routine, unskilled jobs. Over thelast few years, many training programs and courses offering newtechnology-related skills have been initiated, some aimed specifi-cally at women.
4,
FELICITY HENWOOD AND SALLY WYATT 417
Training and educational initiatives need to be taken at manydifferent levels in order to widen the opportunities provided bynew technology to as many people as possible. In this section,we shall discuss public awareness, training, educational initiativestaking place within schools (and, to a much lesser extent, universi-ties), and vocational training. In all cases we shall pay particularattention to the specific needs of women. At the outset, we outlinesome of the major differences between the countries under con-sideration in terms of what types of training and education areprovided and who is responsible for administering them.
Government, Employer, and Union Responsibilitiesfor Training and Education
In each member country of the European Community the ed-ucation and training systems have evolved over a period of 100years or more; therefore, the very terms "training," "education,"and "school" are not always strictly comparable across countries.In many ways the education systems in Great Britain and Irelanddiffer significantly from those on the continent. However, mostvariation occurs in the provision of facilities for continuing educa-tion and training (for further details, see CEDEFOP [1984a,b1).
Employers contribute to the cost of vocational training in allEEC countries, though the extent to which they do so varies fromone country to another. Even in France, where most training isprovided by schools or other state institutions, employers piay animportant part in continuing vocational training, although not inthe initial training of young people. This is similar to the situationin the United Kingdom. In both France and the United Kingdom,a major role is played by intermediary training centers and organiz-ing bodies; para-governmental organizations and facilities run byjoint training boards are particularly important. Many of the lat-ter are funded by a wide variety of bodies, including government,industry, foundations, chambers of trade and industry, donations,and professional associations (CEDEFOP, 1984b:51).
In contrast to France and the United Kingdom, firms in theFederal Republic of Germany are very active not only in continuingtraining but also in the initial training of young people. As a result,employers contribute a larger share of the total cost of trainingthan the government (CEDEFOP, 1984b:22). In Italy and Lux-embourg, continuing education and training are largely financed
-4;s9

418 MANAGING TECHNOLOGICAL CHANGE
through government subsidies; and in Belgium, the financial bur-den is carried jointly by the government, employers, trade unions,and professional institutions (CEDEFOP, 1984a:43).
Training centers run on a purely commerial basis are ex-tremely rare. In all member countries, young people do not haveto pay any fees for initial training; they receive grants that varyin amount, however. A legal right to educational leave exists inBelgium, France, Italy, Luxembourg, and some of the individualstates of Germany ( CEDEFOP, 1984a).
Methods adopted by different EEC members for financingand organizing training vary enormously. It is not possible toidentify an ;deal solution. Bah Germany's system of considerableindustry involvement and the Netherlands' system of state-funded,school-based vocational train ng appear to be stable and efficientwithin the context in which 'ley operate. Italy's new systemof a regionally devolved approach ;,1 vo-ational training mightbe better able to meet labor market problems, given the verydifferent structural problems of its individual regions. Presumablydecentralized solutions will be more flexible and appropriate insuch countries.
Public Awareness
Many commentators express the need for increasing publicawareness of the broader social implications of information tech-nology (Menzies, 1981; Berner, 1984; Sjorup and Thomsen, 1984;Thomsen, 1984). People need to be alerted about the need to un-dertake training at various times throughout their working lives,and women need to be alerted to changing conditions in clericaljobs. Understanding the broader implications of information tech-nology would also help to equip workers to act more effectively innegotiations with employers.
The Women's Bureau of Labour Canada (1982) identifies com-ponents necessary to a local awareness campaign run by a city orlocal government (see Table 4). In the United Kingdom, the EqualOpportunities Commission, the Manpower Services Commission,and the Engineering Industry Training Board declared the year1984 to be Women Into Science and Engineering (WISE) Year.While some courses were developed for target groups such as 14-to 16-year-old girls, women returning to paid work, and unem-ployed women, its major function was to increase public awareness
4 3. v

FELICITY HENWOOD AND SALLY WYATT 419
TABLE 4 Components of a Local Awareness Campaign Run by a Local Council
Press and the electronic-mail paid advertisingPublic service announcementsInterviews with press and television mediaRelated film clips and fillers to be provided to local television
stationsFilms and audiovisual programs about women and microtechnology for use
in schools, community groups, etc.Establishment of a speaker's bureauSponsoring of speakers on the subjectOrganisation of workshops to inform the public about the high-techindustry and its human resource requirements
Preparation and circulation of a manual containing details of localtraining programs
SOURCE: Women's Bureau, Labour Canada (1982:50-51).
regarding engineering as a career choice for women. This initiativearose out of British industry's often-expressed need for more engi-neers and technicianswomen were a hitherto unexploited sourceof such labor. Activities during the year appear to have broadeneddiscussion about women entering engineering and technical jobs.
Many informal efforts to increase public awareness have alsobeen made. The women's movement in Copenhagen has starteda course to teach women about specific technical skills and aboutthe social impacts of information technology. A group of womenresearchers, technicians, and users in Denmark have formed "Fo-rum," whcse role is to provide public education (Thomsen, 1984).The Brighton Women and Technology Group has twice organizeda 10-week course, through the local adult education authority,concerned with the impact of technology on various aspects ofwomen's lives. Thy :e are now many other sirnilar courses acrossEurope.
Schools
Many Eurlpean countries are beginning to adapt their edu-cational systems to meet tin, changing technological envir mment.Policies adopted have been quite similar, especially where theintroduction of microcomputers into schools is concerned. In Den-mark, children are obliged to participate in courses dealing withmicrocomputers and information processing in both primary and
431

420 MANAGING TECHNOLOGICAL CHANGE
secondary school (Thomsen, 1984). By June 1983, nearly half ofthe primary schools in the United Kingdom had ordered or re-ceived a microcomputer under a grant scheme organized by theDepartment of Trade and Industry. By the same date, 7,000 micro-computers had been installed in 800 secondary schools in France.The plan is to have 100,000 installed by 1988. Also, four centershave opened for teacher training in information technology. Amajor concern in many countries is the lack of qualified teach-ers at all levels (Dirrheimer, 1983; Commission of the EuropeanCommunities, 1984a:110). In the Netherlands, government initia-tives are being supplemented by private enterprises. The DutchSavings Bank, in cooperation with Philips, is planning to supplymicrocomputers for courses taking place during the last 2 yearsof primary school. There is a similar initiative in Belgium. InItaly, some national firms involved in robotics have agreed to pro-duce 200 robots for demonstraLion purposes in technical schools(Commission of the European Communities, 1984a:110).
While such programs will enable children to become familiarwith the capabilities of microcomputers, they are not entirelyunproblematic. The Canadian Union of Public Employees (CUPE)objects to the widespread introduction of microcomputers intoschools. They maintain that children should not be subjectedto the possible negative health effects, particularly since growingchildren may be more susceptible to physical problems and maynot be able to effectively express any problems they do experience(CUPE Research Department, 1982:8).
Another problem, specifically facing girls, is that they mighthave difficulty in gaining access to the machines without interfer-ence from boys (Harding, 1983; Thomsen, 1984). Berner (1984)points to the need for affirmative action programs in this area thatshould act on three levels: counteracting stereotypes, providingoptions, and strengthening self-confidence. In Sweden, technicalsubjects are compulsory at all levels; the possibilities of opting outof mathematics or science courses before the age of 16 are limited.Also, additional points are given to girls who choose traditionallymasculine subjects and to boys who choose traditionally femininesubjects. She also cites many cases where girl-only workshopsare provided in order to give the girls the support they require(Berner, 1964:233).
43

FELICITY HENWOOD AND SALLY WYATT 421
The United Kingdom's Engineering Industry Training Board(EITB), as part of WISE Year, organized a pilot program to en-courage more girls to consider becoming technicians or engineers.Thirty girls, aged 14 to 16, participated in a 4-day residentialcourse during which they visited firms and engineering depart-ments in polytechnics, and met with women technicians and engi-neers (Engineering Industry Training Board, 1984). The pilot wasthought to be successful. Similar programs are now being orga-nized on a regional basis. The EITB is also considering whether torun 1 -day courses for 12 to 14 year olds, in order to provide themwith more information before they make their "0 level" choices.'Such programs are valuable and necessary as long as girls continueto be socialized away from scientific and technical subjects in theirearly school careers; ideally, if girls were encouraged and expectedto develop their scientific and technical capabilities from an earlyage, such programs would not be necessary.
In the meantime, for girls who have gone through the edu-cation system without receiving adequate scientific and technicaltraining some remedial action is necessary. The Chelmer Insti-tute of Higher Education in England was awarded a grant by theEuropean Social Fund of the EEC to retrain women in survey-ing, microprocessing and computer technology, accountancy, andmanagement. The first part of the course includes basic studyskills and mathematics. To date, some of the women who havecompleted the course have found jobs, many others have used itas a bridge into higher level courses, and about 30 percent have,through necessity or choice, opted out of the labor market (Com-mission of the European Communities, I983a:75-77).
Vocational Training
One of the most frequent themes in the literature on voca-tional training involves, though not always explicitly, the rela..emerits of on-the-job training and formal training (Women's Bu-reau, Labour Canada, 1982; Dirrheimer, 1983; CEDEFOP, 1984a;EOSYS Ltd., 1984; Gensior, 1984; Goldstein, 1984; Johansen,1984; Thomsen, 1984). One advantage of on-the-job training is
1 "0 level" examinations are taken at the age of 16. They are importantbecause they determine what "A levels" a student can take (at 18) and thuswhat subject at university.
433

422 MANAGING TECHNOLOGICAL CHANGE
that it is more likely to provide a work force with the skills rele-vant to the employer's needs. Also, the difficulties associated withfulfilling domestic and child care responsibilities outside of work-ing hours are not so acute if training is provided on the job, withinregular working hours.
The disadvantages of on-the-job training are that the skillslearned are not always formally recognized and that the unem-ployed and those outside the labor force are excluded (see below).The fact that skills learned on the job are not always formallyrecognized means that worker mobility is reduced. Both womenand men will be less able to move outside the firm. And womenmay also experience difficulty moving within the firm, particularlywhere management discriminates against women, either becausethey think a secretary only types even if she actually possessesquite advanced information-technology-related skills, or simplybecause they think -women should not have professional or high-paying jobs.
The major advantage of formal training is that skills learnedare recognized. The skills needed in office work include knowledgeof routines; knowledge of the firm and branch; ability to inter-pret questions, combine information, and solve nonroutine cases;and social skills. Often, only the first of these skills is visible tomanagement (Lie and Rasmussen, 1984:6). Not only does formaltraining improve worker mobility, it also overcomes some of theproblems typical when workers are insufficiently trained. Clericalworkers who are not aware of all of the capabilities of a piece ofequipment are often dissatisfied. The Danish Union of Commercialand Clerical Employees, together with some schools of commerce,has initiated courses in word processing for its members (Thom-sen, 1984). The disadvantages of formal training are related to(lack of) time anu money.
Ways to combine the advantages of both types of vocationaltraining include having formal training paid for by industry or thestate and scheduling it within working hours, or introducing somemeans of assessing skills gained on the job. The usual objectionraised by employers to paying for formal training is precisely thatit will increase worker mobility: why pay for someone else's workforce? In the long run, however, training for a skilled and flexiblework force will benefit everyone.
4 3 4

FELICITY HENWOOD AND SALLY WYATT 423
As noted above, on-the-job training does nothing to meet theneeds of the unemployed. Unemployment, particularly youth un-employment, is becoming an increasingly serious problem in mostof the countries under consideration. The tremendous increases inunemployment are partly a result of new technology and partly aresult of the more general economic climate. In most countries,trainiag for people who are not in paid employment is seen as theprimary responsibility of the government. As Goldstein (1984)
argues, some government schemes have negative elements. In herview, the New Training Initiative (NTI) of the current Britishgovernment is an attack on the conditions cf paid work, disguisedas training to meet changing market and technological conditions.
The publicly funded Youth Opportunities Program (YOP)provided young people with jobs for 6 months during which theywere paid a weekly allowance. Employers received free labor. YOPworkers were heavily concentrated in distributive, retailing, andadministrative jobs; opportunities for learning new skills were few.In 1981-1982, more school leavers were in YOP than in regularjobs. Employers have admitted that 30 percent of these repre-sented abuses of the goals of YOP; they substituted YOP workersfor regular workers (Goldstei-, 1984:100). The chief disadvantageof YOP, Goldstein (1984) argues, is that they have given credi-bility to the notion that putting people in the workplace to serveemployers' short-term needs represents training.2 Training needno longer lead to gaining skills or access to long-term paid employ-ment. This type of program also undercuts organized labor anddiverts resources away fr nn other types of training. The problemsassociated with shortages of skilled labor remain.
Similar programs have been adopted in other countries. InBelgium, both private and public enterprises with more than 50employees are required to recruit between 1 and 2 percent of their
2 The Community Programme scheme designed to help the long-termunemployed does not even pretend to provide anything but the most broadlybased "introduction to work"-type trainiag. It is mentioned here becauseit illustrates the government's attitude to women's right to paid work. Thescheme authorizes local authorities to hire the long-term unemployed to workon projects for 4 days a week for the benefit of the community. Those eligibleinclude people over the age of 25 who have been unemployed for more than1 year (Goldstein, 1934:88). The wage may not exceed an average of £63(1985 figuro) per week. Since 1983, women who are living as married witha man in paid work are not eligible for these schemes, since they are notofficially recognized as unemployed.
43'6

424 MANAGING TECHNOLOGICAL CHANGE
work force from people under 30 years of age with no previous workexperience for a maximum period of 1 year. Not only are employersrequired to pay only 90 percent of the agreed wage rate, they alsoreceive a grant from the government for each trainee, above theminimum 1 ?ercent (Commission of the European Communities,1984a:90).
Some more positive training schemes aimed at unemployedwomen have been developed. The Ministry of Education in Den-mark, together with the equality of opportunity consultants, hasinitiated the formation of a number of "data centers" for womenwho would not otherwise receive any training (Thomsen, 1984).Other schemes have begun in various cities in the United Kingdom.They involve women teaching other women nontraditional skills,often programming and electronic engineering but also carpentryand plumbing. The schemes are supported by the local councilsand the European Social Fund. They all include the following: acreche, or child care allowances; a training allowance; a scheduleto coincide with school hours; and assertiveness training. Womenover 25 with no formal qualifications are given priority. Linkswith local employers are more established in some schemes than inothers (informal discussion with E. Cousins, Women's TechnologyScheme, Liverpool).
These schemes are a good example of how women's needscan be taken into account. Courses offered in the evenings areoften inaccessible for women with children, and company trainingis sometimes only provided to full-time workers, while women aremore likely to work part time. Training "open to all" is insufficientif it is not recognized that women face restrictions on their abilityto participate.
A study done for the Women's Bureau of Labour Canada(1982) surveyed different groups of women regarding their atti-tudes to technology and training. They found that women whowere not in the labor force were the group most afraid of tech-nology and that they would prefer full-time training during theday. Women in the labor force, but not in technology-related jobs,preterr..d some form of apprenticeship. Lack of confidence, timeand money, fatigue, and stress were the difficulties cited in relationto out-of-hours training. They felt it was the employers' respon-sibility to train them. Women using word processors had usuallybeen trained either by their employer or by the equipment sup-plier. The latter is usually a marketing exercise; women receiving

FELICITY HENWOOD AND SALLY WYATT 425
such training thought it was not always adequate. Women work-ing in electronic assembly received informal, on-the-job training.Their employers sometimes offered to pay for night-school courses,but the women felt night school would be too much, in additionto their existing work and domestic responsibilities. Women inboth arts and science subjects in postsecondary education wereaware that they would probably work with technology in someform; however, science students were more confident about theirjob prospects (Women's Bureau, Labour Canada, J.982:27-33).
Many training initiatives aim to develop specific industrialskills. Given the rapid change that characterizes industrial econo-mies, it may be more appropriate for training and retraining to beaimed at developing broader skills, such as basic scientific under-standing, computer literacy, logical thinking, and communicationsskills. Training focused in this direction would enhance workermobility, whereas training in specific skills increases the danger ofcreating the job ghettos of the future (Canadian Advisory Councilon the Status of Women, 1982; Dirrheimer, 1983).
Training and educational initiatives need to be taken at manydifferent levels in order to widen the opportunities provided bynew technology to as many people as possible. The aim of anytraining or educational initiative must be to increase workers'mobility and their ability to participate in technological decisionmaking. Governments and employers have a responsibility to atleast contribute to the cost of training, especially because theybenefit from having access to a skilled work force. Also, it isimportant to remember that not all workers are starting fromthe same point in terms of training and education; therefore, forwomen and other disadvantaged groups, some positive action isnecessary.
SUMMARY AND CONCLUSION
Today, the industrialized countries of the world and many ofthe newly industrializing countries are experiencing major changesin employment and work patterns as the rapid diffusion of the cur-rent "new technologies," based on microelectronics, is transform-ing the industrial structure of their economies. Both governmentintervention and negotiations between employers and trade unionsconcerning the introduction of new technologies are becoming in-creasingly widespread. Employers attempting to maintain profit
43V

426 MANAGING TECHNOLOGICAL CHANGE
levels in increasingly competitive market situations can do so invarious ways; technological change is only one of the options avail-able, but productivity-enhancing, labor-saving technologies are anobvious tool to employ.
We have noted that the unequal distribution of power betweensocial groups means that some groups have more influence overtechnological decision making than others. The roles played bygovernments, employers, and trade unions in this process differfrom country to country. We have noted that women and menoften have different priorities and choose different strategies.
In the European countries, governments have a crucial, iflimited, role, mainly through the provisions of legislation, whichsets minimum standards to which employers must adhere. Mostnegotiations about the introduction of specific technologies takeplace between employers and trade unions, as negotiations aroundjob design illustrate.
To negotiate around job design is, we argued, to reject thenotion of technological determinism. It accepts that technology,as such, does not determine how jobs are defined, how the workshould be done, and how the person doing the job relates (or doesnot reh.te) to other people in the workplace. The importance ofdiscussions of job design is the recognition that the organizationof jobs and the use of machinery and equipment in those jobsis the result of political struggle and decision making, involvinggroups of people with different amounts of power to influencethose decisions. Such discussions also move the focus away fromthe important, yet narrow, question of ergonomics, to the broader,more fundamental questions of quality of work.
Important differences between countries concern the extentto which employees are able to effect change; these differencesdepend, in large part, on the different traditions of worker partici-pation and on the relationship between employers and workers. InDenmark and Norway, for example, there is a much stronger tradi-tion of worker participation than in either the United States or theUnited Kingdom. There is also a much higher rate of unionizationin these countries (see Table 1). It is not surprising, therefore,that some of the most progressive examples of workers securing adegree of control over decisions surrounding new technology arefound in these countries.
Women's position in the labor market and in the occupationalhierarchy gives them less access to decision-making structures (via
433

FELICITY HENWOOD AND SALLY WYATT 427
the trade unions) than men. But their position has both positiveand negative aspects. In particular, we have argued that women'srelationship to work, both paid and unpaid, has led them in manycases to have different priorities from many male trade unionists.Many of women's priorities have proved particularly relevant indiscussions of the quality of work and have since been taken upmore widely by the trade unions.
Our discussion of changing lc ations and changing hours ofwork showed that there currently exists the potential for radical so-cial change. The pervasiveness of the new technologies has openeda debate about the role of work in advanced industrial societies.Gender relations could both affect and be affected by changes inthe role of work. The various proposals should be evaluated interms of their benefit to individual workers, and not merely theireffect on reducing unemployment levels; furthermore, discussionsof, and choices about, the relative merits of the different schemesmust take into account the existing differences between womenand men in their relation to work, especially unpaid work. By rec-ognizing women's and men's different starting points -trategiesand policies could, if the political will existed, set r , to redressexisting imbalances, resulting in a genuine redistribution of allforms of work (paid and unpaid) that would enable both womenand men to achieve greater work fulfillment.
In our discussion of the role of governments, employers, andtrade unions in providing education and training, we argued thateducation and training should aim to increase the availability toindividual workers of opportunities for satisfying work and shouldnot merely aim to reduce unemployment in the short term. Fur-ther, it is nit enough to provide training for all; efforts must bemade to identify factors that prevent certain groups from takingadvantage of such opportunities. The difficulties women face intaking part in education and training programs are well docu-mented. In addition to providing the necessary support services(such as child care) that will enable more women to participate intraining schemes, trainers and educators must take into accountthe very different relationships girls and boys, women and menhave to technology, and structure their training programs in sucha way as to best overcome past discrimination and socialization inthis area.
The formulation of strategies and policies aimed at dealingwith the issues raised in this paper should start by identifying
4 3,)

428 MANAGING TECHNOLOGICAL CHANGE
existing differences and inequalities between groups of workers.We have been concerned here with gender inequality but there aremany othersage, race, and skill all divide workers and sometimeslead to conflicts of interest. Until these differences are recognizedand a commitment is made to overcome resulting inequalities, itwill be impossible for employees to make the best of opportunitiesthat now exist for their participation in decision making regardingtechnological change. This commitment must be demonstrated atall levels, by governments, employers, and trade unions.
ACKNOWLEDGMENTS
We would like to thank the following people who sent us ma-terial: Isa Bakker, Paula Bennett, Patricia Blackstaffe, FernandeFaulkner, Iris Fitzpatrick-Martin, Michael Gurstein, Michael Mc-Bane, Kathryn McMullen, Mary!ee Stephenson, and Jane Stinsonfrom Canada; Jannet GrOnfeldt, Janni Nielsen, and Karen Sjorupfrom Denmark; Andreas Drinkuth, Sabine Gensior, CamillaGrebsbach-Gnath, Werner Kleges, Heinz Murer, Barbel Schiller,and Suzanne See land from the Federal Republic of Germany; LiisaRantalaiho from Finland; Marie-Therse Letablier, Yvette Lucas,Elsbeth Monod, Martina Ni Cheallaigh, and Claire Terlon fromFrance; Bente Rasmussen and Kari Thoresen from Norway; andBoel Berner, Lars Ingelstram, Karin Ohrt, Lesley Palmer, IngaPersson-Tanimura, and Ulla Weigelt from Sweden. We at alsograteful to Heidi Hartmann and members of the Panel on Technol-ogy an : Women's Employment for their comments on an earlierdraft. Their help greatly facilitated our task. Responsibility forerrors of interpretation or of fact remain, of course, our own.
REFERENCESBarou, Y.
1985 Reduction of working time: collective bargaining and governmentaction. Pp. 211-226 in Employment Growth and Structural Change.Paris: OECD.
Bermann, T.1985 Not only windmills: female service workers and new technologies.
Pp. 231-248 in A. Olerup, L. Schneider, and E. Monod, eds.,Women, Work and Computerisation. Amsterdam: North-Holland.
Berner, B.1984 New technology and women's education in Sweden. Pp. 227-239
in S. Acker, ed., World Yearbook of Education 1984, Women andEducation. New York: Kogan Paige, Nichols Publishing Co.
449

FELICITY HENWOOD AND SALLY WYATT 429
Bjorn-Anderson, N.1983 The changing roles of secretaries and clerks. Pp. 120-137 in H.J.
Otway and M. Peltu, eds., New Office Technology: Human andOrganisational Aepects. London: Francis Pinter.
Boulet, J.-A.1984 La diversification professionnelle des femmes en milieu de travail.
Paper presented at a Colloquium on the Economic Status ofWomen in the Labor Market, Montreal, Canada.
Cakir, A., H.J. Reuter, L. von Schmude, and A. Armbruster1978 Anpassung von Bildschmirmarbeitsplatzen an die physiche und
psychishe Funktionsweise des Menschen. Bonn, Germany: Bun-desminister fur Arbeit und Sozialordnung.
Canadian Advisory Council on the Status of Women1982 Microelectronics and Employment: Imes of Concern to Women. A
Brief to the Task Force on Microelectronics and Employment.July. Ottawa, Ontario.
CEDEFOP1984a Vocational 7Faining SI/dems in the Member States of the European Com-
munity, Comparative Study. Luxembourg: Office for Official Publi-cations of the European Communities.
1984b Vocational Tivining Bulletin Number 15. Luxembourg: Office forOfficial Publications of the European Communities.
Commission of the European Communities1983a Social Europe Special lame. Directorate-General for Employment, So-
cial Affairs and Education. Brussels: Commission of the EuropeanCommunities.
1983b Social Europe, 0(September) Directorate-General for Employment,Social Affairs and Education. Brussels: Commission of the Euro-pean Communities. September.
1984a Social Europe, 3(December) Directorate-General for Employment,Social Affairs and Education. Brussels: Commission of the Euro-pean Communities.
1984b European National Actions on Information Technology. InformationTechnology Task Force, Intelligence Unit. Brussels: Commissionof the European Communities, June.
1984c European Women in Paid Employment 1984. Brussels: Commissionof the European Communities.
CUPE Research Department1982 CUPE'e Response to the Report of the Labour Canada Task Force on
Microelectronics and EmploymentIn the Chip: Opportunities, People,Partnerships. Ottawa: CUPE.
David-McNeil, J.1984 The Female Labour FOrce: A New Place in the Canadian Economy.
Ottawa: Economic Council of Canada.Department of Employment, United Kingdom
1984 Employment Gazette 92(12). London: Her Majesty's StationeryOffice.
DELFA, The Committee for the Study of Working Hours1984 Preferred Working Hours. DELFA Debate Report No. 3. Stockholm:
Ministry of Labour.
4.41

430 MANAGING TECHNOLOGICAL CHANGE
Deutsch, Steven1986 International experiences with technological change. Monthly Labor
Review (March):35-40.Dirrheimer, A.
1983 Information Technology and the 7}aining of Skilled Workers in the ServiceSector. Report of the Evaluation of the Literature and of Interviewswith Experts. Luxembourg: CEDEFOP.
Engineering Industry Training Board1984 Girls and Technical Engineering. London: EITB.
EOSYS Ltd.1984 Case Studies in Information Technology and Career Opportunities for
Women. A Study by EOSYS Limited for the Manpower ServicesCommission. Sheffield, England: Manpower Services Commission,Training Division.
Equal Opportunities Commission1984 The Fact About Women Is . . . Manchester, U.K.: EOC.
Evans, J.1983 Negotiating technological change. Pp. 152-168 in H.J. Otway and
M. Pletu, eds., New Office Technology: Human and OrganisationalAspects. London: Francis Pinter.
Fjalestad, Jostein1981 Information Technology and Participation: Problems and Experiences.
Oslo, Norway: Norwegian Computer Centre.Gensior, S.
1984 New TechnologiesPossibilities for a New Valuation of Women'sWork. Berlin: The Berlin Institute for Social Research and Socio-logical Practice. Mimeograph.
Goldstein, N.1984 The new training initiative: a great leap backward. Capital and
Class 23(Summer).Harding, J.
1983 Switched Off: The Science Education of Girls. York, England: Long-man for Schools Council.
Howard, R., and L. Schneider1985 Worker Participation in Technological Change; Interests, Influ-
ence, and Scope. Paper prepared for the Panel on Technologyand Women's Employment, Committee on Women's Employmentand Related Social Issues. Washington, D.C.: National ResearchCouncil (February).
Huws, U.1984 The New HomeworkereNew Technology and the Changing Location of
White-Collar Work. Low Pay Pamphlet No. 28. London: Low PayUnit.
ILO1983 Yearbook of Labour Statiatics 1983. Geneva: ILO.
Johannesson, J., and I. Persson-Tanimura1984 Labour Market Policy Under Reconstruction Studies of the Swedish
Labour Market and the Effects of Labour Market Policy. An Englishsummary of the report Arbetamarknadspolitik under omprotming, sou1984:31 from the Delegation for Labour Market Policy Research(EFA). Stockholm: Swedish Ministry of Labour.
4 4 ...,

FELICITY HEN
Johansen, D.1984 Eroding jobs by bits and bytes. Our Timed, May.
Leontief, W., and F. Duchin1986 The Figure Impact of Automation on Workers. New York: Oxford
University Press.Lie, M., and B. Rasmussen
1984 Office Work and Skills. Paper presented at the IFIP "Women,Work and Computerization" conference, Italy.
Markmann, H.1985 The -ole of trade unions in coping with the labour implications
of technological change. Pp. 141-147 in Employment Growth andStructural Change. Paris: OECD.
Meade-King, M.1985 Two into one will go. Guardian, June 27.
Menzies, H.1981 Women and the Chip: Case Studies of the Effects of Informatics on
Employment in Canada. Montreal, Canada: Institute for Researchon Public Policy.
Ministere de ('Education nationale1984 Note d'information. Vanves, France: Ministere de ('education
nationale.Monod, E.
1984 TelecommutingA New Work, but Is It Still Just the SameOld Story? Paper presented at the IFIP "Women, Work andComputerization" conference, Italy.
OECD Secretariat1985 The current debate on working-time adjustments. Pp. 188-196 in
Employment Growth and Structural Change. Paris: OECD.Peitchinis, S.
1984 Microelectronic Technology and Female Employment. Paper pre-sented at the Colloquium on the Economic Status cf Women inthe Labour Market, Montreal, Canada.
SjOrup, K., and F. Thomsen1984 The Future: Do Women Play a Part? Roskilde, Denmark:
Roskilde University Centre. Mimeograph.Thomsen, T.
1984 Country Report: Denmark. Roskilde, Denmark: Roskilde Univer-sity Centre. Mimeograph.
Thoresen, K.1983 Working with visual display units. Pp. 85-104 in E. Fossum,
ed., Computerisation of Working Life. Chichester, England: EllisHorwood.
Townson, M.1983 The Impact of Technological Change on Women. Paper presented
at the Canada Tomorrow Conference, Ottawa.Women's Bureau, Labour Canada
1982 Towads the Integration of Women into the High TechnologyLabt zr Force in the National Capital Region. Discussion Paper No.1 in Series B Changing World of Work, prepared by CommunicadoAssociates, Ottawa: Labour Canada.
WOOD AND SALLY WYATT 431
443

Biographical Sketches of Contributors
EILEEN APPELBAUM is associate professor of economics atTemple University. She is on the editorial boards of the Jour-nal of Post Keynesian Economics and Computers and the SocialSciences and serves as a consultant to the Office of TechnologyAssessment and the Mayor's Commission for Women in Philadel-phia. Her research and writing encompass both theoretical andapplied work in labor economics, with emphasis on implicationsfor women workers. She is the author of Back to Work (AuburnHorse, 1981), an econometric analysis of the experiences of ma-ture women returning to the labor force. Appelbaum is also theauthor of several articles on employment and technology issuesas well as on part-time and temporary work. She has a B.A. inmathematics from Temple University and a Ph.D. in economicsfrom the Unive::Ity of Pennsylvania.
CAROLYN L. ARNOLD is a Ph.D. candidate in the sociologyof education at Stanford University. Previously she was a com-munity college instructor in women's studies, social sciences, andstatistics; a project associate at Far West Laboratory for Educa-tional Research and Development; and a counselor and funding
433
444

434 BIOGRAPHICAL SKETCHES
coordinator in a community women's health clinic. She has con-ducted research on women's education, gender segregation in thelabor market (with Myra Strobel.), and women's participation inhigh technology. She is currently researching the development ofstratification by gender in technical occupations. Arnold has aB.A. from Smith College, an M.A. in women's studies from SanFrancisco State University, and an M.S. in statistics from StanfordUniversity.
BARBARA BARAN is a postgraduate research fellow at theBerkeley Roundtable on Internal Economy (BRIE) currently work-ing on a study to examine work reorganization and skill changein manufacturing and service industries for the Carnegie Forumon Education and the Economy. Her research has focused on thetechnological transformation of white-collar work, with particu-lar emphasis on changes occurring in the structure of women'semployment, and included a study of technological change in theinsurance industry. Prior to returning to school, she served as achairperson of the San Francisco Women's Union and was editorof a community newspaper in San Francisco. She has a B.A. inhistory from the University of Wisconsin, Madison, and an M.A.and a Ph.D. in city and regional planning from the University ofCalifornia, Berkeley.
BRYNA SHORE FRASER is a senior program officer at the Na-tional Institute for Work and Learning in Washington, D.C. She isthe editor of the Postsecondary Education for a Changing Econ-omy series and the director of the National Study ofEmploymentin the Fast Food Industry. She has done extensive research onemployment-related education and training for youth and adults.Her most recent publications have focused on the impact of com-puters and new technologies on training and the workplace. Fraserhas a B.A. f-Jm Brandeis University and an M.A. in Slavic lan-guages from Indiana University.
ELI GINZBERG is A. Barton Hepburn professor emeritus ofeconomics and director of Conservation of Human Resources,Columbia University. From 1941 to 1981 he served as a consul-tant to various departments of the federal government, includingState, Defense, Laboi, Health and Human Services, and the Gen-eral Accounting Office. He is the author of 100 books, primarilyon human resources and health policy, the most recent of whichis Understanding Human Resources (Abt, 1985). Ginzberg has an
44:;

BIOGRAPHICAL SKETCHES 435
A.B. in social sciences and an A.M. and a Ph.D. in economics,from Columbia University.
CLAUDIA GOLDIN is professor of economics at the Universityof Pennsylvania, research associate at the National Bureau ofEconomic Research, and editor of the journal of Economic History.She has previously held positions at Princeton University and theUniversity of Wisconsin. Her research interests are in Americaneconomic history, and her research subject matter 117.1s includedurban slavery in the American South, early industrialization, theimpact of the Civil War, the postbellum southern economy, and,most recently, the evolution of the female labor force from 1790to the present. She is currently writing Understanding the GenderGap (to be published by Oxford University Press). Goldin holdsa B.A. from Cornell University and an M.A. and a Ph.D. from theUniversity of Chicago.
HEIDI I. HARTMANN is study director (on leave) of the Com-mittee on Women's Employment and Related Social Issues, thePanel on Technology and Women's Employment, and the Panelon Pay Equity Research at the National Research Council (NRC).She has edited or coedited a number of NRC reports on compara-ble worth and other women's employment issues. Previously shetaught economics on the Graduate Faculty at the New School forSocial Research. Her research has concentrated on employmentissues related to women and minorities, particularly discrimina-tion and internal labor markets, women's economic independence,and political economy and feminist theory. In the 1986-1987 aca-demic year she is an American Statistical Association fellow doingresearch on women in poverty at the Bureau of the Census. Hart-mann has a B.A. from Swarthmore College and an M.Ph. and aPh.D. from Yale University, all in economics.
FELICITY HENWOOD is a social scientist studying genderand technology issues. While working on her contribution to thisvolume, she was a research fellow at the Science Policy ResearchUnit. She has published mainly in the area of new technologyand women's employment and works in adult education, teachingcourses on women and science/technology. Henwood is currentlystudying for a Ph.D. in the Arts Graduate School of the Universityof Sussex.
H. ALLAN HUNT is manager of research at the W.E. UpjohnInstitute for Employment Research in Kalamazoo, Michigan. Hehas been at the Institute since 1978 and in his current position since
446

436 BIOGRAPHICAL SKETCHES
1982. His professional experience has involved him in the areas ofworkers' disability compensation, employment and training policy,and the employment impacts of technological change. Hunt hastaught at Lehigh University; California State University, Hayward;and the University of Connecticut. He studied at the Universityof Wisconsin; Lehigh University; and the University of California,Berkeley, where he received a Ph.D. in economics.
TIMOTHY L. HUNT has been a senior research economistat the W.E. Upjohn Institute for Employment Research since1981. In 1983, he co-authored an Institute monograph entitledHuman Resource Implications of Robotics, which examines theemployment impacts of robots in the United States by 1990. Withthe support of the National Research Council and the NationalCommission for Employment Policy, Hunt has recently completedseveral other studies exploring various aspects of the employmentimplications of technological change. He has published numerouspapers and given presentations to government agencies and vari-ous other groups at the state, national, and international levels.He holds a B.A. in history from Otterbein College, an M.S. ineconomics from South Dakota State University, and a Ph.D. ineconomics from Kansas State University.
MARY C. MURPHREE is New York regional administrator forthe Women's Bureau of the U.S. Department of Labor. She for-merly served the Women's Bureau as an expert consultant, direct-ing the bureau's study of the impact of computer-based technologyon women clerical workers. She is the author of the recent Women'sBureau publication Women and Office Automation: Issues for theDecade Ahead. Murphree has taught college-level courses, servedas a consultant to government and private industry, and writtenand spoken widely on the subject of women and technology. Shereceived a B.A. from Hollins College and an M.A. and a Ph.D. insociology from Columbia University.
THIERRY J . NOYELLE is senior research scholar at Conser-vation of Human Resources, Columbia University. His areas ofexpertise include labor market segmentation; technology, change,and employment; the service industries, especially financial andbusiness services; and the internationalization of services. He hasa B.A. in economics from the University of Lyons (France), anM.S. in engineering from the Ecole Centrale of Lyons (France),
44.1

BIOGRAPHICAL SKETCHES 437
and an M.A. in regional science and a Ph.D. in city and regionalplanning, both from the University of Pennsylvania.
MYRA H. STROBER is an associate professor of education atStanford University. She has been on the faculty at the Univer-sity of Maryland; the University of California, Berkeley; and theStanford Business School. Her research focuses on women's em-ployment, particularly the relationship between work and familyamong educated women. Strober's most recent work is on occu-pational segregation. She was one of the founders of the Centerfor Research on Women at Stanford and served as its director for7 years and was also the first chair of the board of the NationalCouncil for Research on Women. Currently, she is the directorof the Stanford Education Policy Institute. Strober has a B.S. inindustrial and labor relations from Cornell University and a Ph.D.in economics from the Massachusetts Institute of Technology.
SHARON HARTMAN STROM is a 1986-1987 fellow at theBunting Institute of Radcliffe College, on leave from the Uni-versity of Rhode Island, where she is professor of history and aformer coordinator of the women's studies program. She recentlyserved as a consultant on several projects related to women's workand technology for the Office of Technology Assessment. She haspublished work on the history of women's clerical work unions andis currently completing a monograph on the history of the Ameri-can office between 1910 and 1950. Strom has a B.A. from WhittierCollege and an M.A. and a Ph.D. from Cornell University, whereshe studied social and intellectual history.
ALAN F. WESTIN is professor of public law and governmentat Columbia University, where he has taught since 1959. A spe-cialist in constitutional law, civil liberties, and civil rights, he hasfor 30 years studied the effects of new information technologieson organizations, individuals, and society and the impacts of thepublic policy choices that such developments raise in democraticnations. Among his works are Privacy and Freedom (Atheneum,1967); Databanks in a Free Society (Quadrangle, 1972); and TheChanging Workplace: A Guide to Managing the People, Organi-zational, and Regulatory Aspects of Office Technology (Knowledgeand Industry Publications, 1985). He is president of the Educa-tional Fund for Individual Rights, a nonprofit research foundationthat studies employee rights issues at the workplace. Westin hasa B.A. from the University of Florida and an L.L.B. and a Ph.D.in political science from Harvard University.
448

438 BIOGRAPHICAL SKETCHES
SALLY WYATT is a research associate for The Program onInformation and Communication Technology at the Economic andSocial Research Council, London, England. Previously she was aneconomist at the Science Policy Research Unit of the Universityof Sussex, where she worked on various science and technologypolicy issues. She is currently conducting research on the transferof technology from the western oil companies to China's offshoreoil industry. She received a B.A. from McGill University and anM.A. from the University of Sussex, England, both in economics.
44 -)

NATIONAL ACADEMY PRESS
The National Academy Press was created by theNational Academy of Sciences to publish the reportsissued by the Academy and by the National Academyof Engineering, the Institute of Medicine, and theNational Research Council, all operating under thecharter granted to the National Academy of Sciencesby the Congress of the United States. ISBN 0-309-03727-1
459_