document resume ea 020 049 - ed
TRANSCRIPT

DOCUMENT RESUME
ED 295 301 EA 020 049
AUTHOR Arter, Judith A.TITLE Assessing School and Classroom Climate. A Consumer's
Guide.INSTITUTION Northwest Regional Educational Lab., Portland,
Oreg.SPONS AGENCY Office of Educational Research and Improvement (ED),
Washington, DC.PUB DATE Apr 87CONTRACT 400-86-0006NOTE 80p.PUB TYPE Reports - Evaluative/Feasibility (142) -- Guides
Non- Classroom Use (055) -- Tests/EvaluationInstruments (160)
EDRS PRICE MF01/PC04 Plus Postage.DESCRIPTORS *Academic Achievement; *Classroom Environment;
*Educational Environment; Elementary SecondaryEducation; *Measurement Techniques; Outcomes ofEducation; School Effectiveness
ABSTRACTSchool and classroom climate is often cited in
effective schools research as being important for studentachievement. This consumer guide is intended to help educatorsevaluate their own educational climate by providing reviews anddescriptions of the major tests and surveys used to assess climate.Section 2 presents reasons for examining school climate, includingits relationship to student achievement, differences in the waysstudents and teachers view their ambience, the need to analyze hiddenmessages, growing evidence that change is possible, and climate'susefulness in evaluating curricula. Section 3 differentiates betweenschool and classroom climate, discusses various definitions, anddescribes four categories of instrument subscales (relationships,personal development, system maintenance and change, and physicalenvironment) based on Moos' psychosocial dimensions. Section 4discusses ways to measure educational climate, focusing on sharedperceptions obtained through paper and pencil surveys. Section 5briefly mentions state-of-the-art research and discusses validity andusability issues involved with definitions, measurement, importanceto .tudent outcomes, and practicality. Because no simple guidelinesexist, section 6 provides some standards of comparison whencompleting a profile of climate variables, and section 7 offers fivesteps on selecting educational climate measures. Included are 1table. 38 references, and 4 appendices providing reviews ofeducational climate instruments, a summary table of instrumentcharacteristics, a list of resources, and a checklist for selectingeducational climate measures. (MLH)
************************************************************************ Reproductions supplied by EDRS are the best that can be made *
* from the original document. *
***********************************************************************

UNC'N "PERMISSION TO REPRODUCE THISMATERIAL HAS BEEN GRANTED BY
U.E. DEMATMENT OF EDUCATIONOfhce of Educational Reassich and Improvement
EDUCATIONAL RESOURCES INFORMATIONCENTER (ERIC)
11 This document has been reproduced asreceived from the person Or organization
onginating It0 Minor changes have been made to Improve
reproduction gustily
Points of view or ocilmons stated m thidocr-ment do not necessarily represent otho,aiOERI position or poky
CZLt.1
J THE EDUCATIONAL RESOURCESINFORMATION CENTER (ERICI."
A CONSUMER'S GUIDE
Assessing School and ClassroomClimate
by
Judith A. Arter
April 1987
Northwest Regional Educational Laboratory101 S.W. Main Street, Suite SOOPortland, Oregon 97204Telephone (503) 275-9500
SPoltsored by OEM Office of EducationalResearch and ImprovementU.S. Department of Education
2
111[111 Ii
BEST COPY AVAILABLE

Assessing School and Classroom Climate
A Consumer's Guide
By
Judith A. Arter
April 1987
Northwest Regional Educational Laboratoryi01 S.W. Main Street, Suite 500
Portland, Oregon 92704(503) 275-9500(800) 547-6339

Acknowledgements
The author would like to acknowledge several people who made this Guide possible. Theadvisory panel for the project included:
Dr. Beverly Anderson, Edt.:ation Commission of the StatesDr. Gordon Ensign, Washington Office of State Supt. of Public InstructionDr. Ichiro Fukumoto, Hawaii Department of EducationDr. Walter Hathaway, Portland Public SchoolsDr. Alexander Hazelton, Alaska Department of EducationDr. Alexander Law, California State Department of EducationDr. Jason Millman, Cornell UniversityDr. Wayne Neuburger, Oregon Department of EducationMr. Henry Reed, Washington ESD No. 121Mr. Ray Shackelford, Montana Office of Public InstructionDr. Tom Trotter, Idaho State Department of Education
They provided many good ideas for the format and content of the Guide. Brian Smith, ofthe Church Educational System, spent a summer finding assessment instruments,background information on climate and contacting authors for more information. JenniferSalmon, Test Center librarian at NWREL assisted in obtaining instruments. Rhonda Stoneand Sue Rohrich "word processed" the document and did proofreading.
This guide is published by the Test Center of the Northwest Regional EducationalLaboratory, a private nonprofit corporation.. The work contained herein has beendeveloped under Contract 400-86-0006 of the Office of Educational Research andImprovement, U.S. Education Department and the Chapter 1 Evaluation TechnicalAssistance Center also funded by the U.S. Education Department. The opinions expressedin this guide do not necessarily reflect the views of that agency and no official endorsementby the office should be inferred.
4

TABLE OF CONTENTS
1. Purpose of This Guide 1
2. Why Look At Education.. Climate/ 1
3. What Is Educational Climate? 2
Table 1 5
4. Ways of Measuring Educational Climate 7
5. State-of-the-Art in Assessing Educational Climate 7
6. Standr.-ds of Comparison 10
7. How To Select A Measure Of Educational Climate 11
References 13
APPENDIX A: Reviews of Educational Climate Assessment Instruments 17
Classroom Climate Instruments 19
School Climate Instruments 41
Other Educational Climate Instruments 61
Higher Education Climate Instruments 63
Naturalistic, Case Study and Observational Approaches 64
Classroom Interaction Analysis - 6,"
APPENDIX B: Summary Table of Instrument Characteristics 65
APPENDIX C: Resources 73
APPENDIX D: Checklist for Selecting a Measure of Educational Climate 79
Title Index - 83
5
1. Purpose of This Guide
School and classroom climate is often cited in the research on effective schools as beingimportant for student achievement. This consumer guide is intended to assist educators toevaluate their own educational climate by providing views and descriptions of the majortests and surveys which can be used to assess climate.
To make these reviews more understandable we will present some information on thevariations in definitions of educational climate and some issues surrounding the assessmentof school climate.
To make these reviews more useful we will provide information about how to select aninstrument to assess climate, and further resources in assessing climate (e.g. current majorresearchers and research projects, books and articles outlining issues and concepts in moredetail, and training materials).
Sections 2 through 7 of the introduction briefly discuss why one would want to examineeducational climate, what educational climate is, ways of measuring educational climate,state-of-the-art in assessing educational climate, and some current findings on what a goodeducational climate should be like.
Appendix A contains reviews of assessment instruments. Appendix B contains a list ofadditional resources. Appendix C contains a checklist that can be used to select a measureof educational climate.
2. Why Look At Educational Climate?
There are several reasons why educators may want to systematically look at the climate intheir classrooms or schools.
First, school and classroom climate have consistently been shown to be relateu to studentachievement as well as how students behave and feel about school, themselves and others(Fraser, 1986a,b; Bhushan, 1986; Cognetta et al, 1985; Haertcl et al, 1981: Saldern, 1986;Anderson, 1982; Chavez, 1984; Anderson and Walberg, 1974). Students' reaction to schoolmay increase the chance that students stay in school, develop a lasting commitment tolearning and use the school setting to their advantage (Epstein and McPartland, 1978).
Second, there are often differences in how students and teachers view the climate thatsurrounds them (Fraser, 1986a; Fisher and Fraser, 1983). Thus, having a "feel" for how anysingle group perceives the school may not provide one with a clear and comprehensivepicture of school climate.
Third, the existence of a climate that most persons (students, teachers and administrators)find satisfying is a reasonable end in itself (Fraser, 1986a; Williamson et al, 1986). Next tothe family, the school is one of the most important socializing agencies (Fraser, Walbergand Anderson, 1982). Thus, it is important to analyze what messages we are sendingstudents.
Fourth, there is evidence that classroom and school climate can be changed (Anderson,Walberg and Welch, 1969; Fraser, 1986a).
1
6

Finally, climate is useful in evaluating curricula. Them. is some evidence that climatedifferentiates between curricula even when achievement does not (Fraser, 1986a). Forexample, the ICEQ has been used to monitor differences in training programs designed toincrease individualization.
The perspective of this Guide is that school climate improvement is not something that isdone to fix the school so that it stays fixed. School climate improvement is a long-rangeprocess of becoming ever better. In addition, school climate, although important, is not theonly possible focus of school improvement. No single factor is associated with effectiveschools. Rather, effective schools are the result of an integrated set of practices. Theseinclude leadership, quality of instruction, parent involvement, using data for decisionmaking and a school climate conducive to learning.
3. What Is Educational Climate?
As with many other concepts in education, there is no unanimous agreement as to exactlywhat constitutes school or classroom climate. There is some agreement, however, that"climate is a group phenomenon involving something about consensus in perception"(Saldern, 1986), and that it concerns those aspects of the psychological, social and/orphysical environment that affect behavior. Some variations in viewpoint concern classroomversus school climate, how broad the definition of climate is, and the specificcharacteristics that should be included even when definitions are similar.
School Versus Classroom Climate
Some individuals feel that school and classroom climate can be assessed separately and thatboth have an effect on students and staff (Fraser, 1986a,b). Classroom climate involvesrelationships between teachers and students or among students. School climate involvesrelationships between teachers and their colleagues, administrators and relationships in thecommunity. Others feel that the school climate is the sum total of the individual classroomclimates (Johnson and Johnson, 1979).
In this Guide we will differentiate between instruments that seem to have more of aclassroom focus or more of a school-wide focus, although, as seen in the next section, someinstruments solicit both kinds of information.
Breadth of Definition
Some individuals take a narrower view of what contributes to establishing educationalclimate than others. For example, some feel that educational climate primarily refers to thepsychosocial aspects of the environment (Fraser, 1986a,b). Still others expand climate toinclude everything that takes place in a school-leadership, classroom instruction andmanagement, physical surroundings, the value structures of individuals, as well asrelationships (Anderson, 1982; Gottfredson et al, 1986). Such a broad definition caninclude all components outlined in current research on school effectiveness. Thus, the twobecome synonymous.
2
7

Differences in Definitions
Differences on focus and intent affect content. For example, the ICEQ is designed to lookat the climate components associated with individualization, school climate instrumentsfocus more on teacher and administration characteristics, and classroom climate instrumertsfocus more on student components.
However, even within categories of instruments there is a large difference in content.
To illustrate this point, we were initially going to classify subscales across instruments sothat it would be easy for consumers to see which instruments measured the same anddifferent things. What we discovered was that the subscale descriptions varied so much thatonly a few had components in common.
For example, of the nine classroom climate and 12 school climate scales examined in detailthere were only four dimensions of classroom environment and one of school environmentthat were measured by five or more instruments:
Classroom Environment Characteristics
Student-Teacher RelationshipsFavoritism (CEI) and quality of interactionswith teachers (QSL, SCI, CES, ICEQ, TAMS, SOI, SLEQ)
Attitude Toward School--General satisfaction with school (MCI, LEI, QSL,ESES, SCI, CES, SOI, TAMS)
Student RelationshipsHow well students get along with each other (CES,CEI, MCI, POI, TAM)
Democracy- -How much students are involved in class decision making (SCI,LEI, CES, ESB, TAMS)
School Environment Characteristics
Rules for Staff--The extent to which there are rules for staff behavior (LCI,SLEQ, WES, HSCI, WES)
Examples of scales which seemed to appear on only one or the measures are:
Classroom Environment Characteristics
OpportunismAn environment which is characterized by behavior whichadapts to expediency or circumstance.
OrderlinessClassrooms characterized by caution, seriousness and austerity.
School Environment Characteristics
Race RelationsHow well different ethnic groups get along.
Student ParticipationRange of activities available to students.
Vie of Test Data--The extent that test results are used tc modify instruction.
3

Our Approach to Describing the Content of Instruments
We want to assist educators to find assessment instruments which meet their needs in termsof what areas of school or classroom climate they wish to look at. Because differentauthors have different definitions of climate, and because they use different terminologyeven when they are describing the same phenomenon, we take two approaches to describingthe content of assessment instruments. First, in our reviews, we report all subscaledescriptions as written by the authors. This is so that consumers can make their owndecisions about similarities and differences.
The second approach we use in describing content is to classify the various subscales oneach instrument into four broad categories which Moos' (1974) proposes describes thedimensions of any social climate, including that of schools and classrooms. In so doing, weare not advocating any particular theoretical approach. Rather we are merely trying tocompare the general types of things being measured by each instrument in order to assistconsumers. Moos' framework was chosen because many of the instruments are based onMoos' work, the categories appear to be directly relevant to education, the language used isfairly clear and because it generally covers all the areas mentioned in the variousinstruments reviewed. The three general dimensions are:
Relationships. This dimension covers the intensity and nature of personalrelationships within the environment, the extent to which people areinvolved in the environment and support and help one another, and thedegree of free and open expression. This category includes such things asstudent relationships to each other, student relationships to the teacher, andprofessional staff relationships to each other.
Personal Develogme_nt. This dimension covers the basic direction along whichpersonal growth and self enhancement tends to occur. This would includesuch things as the autonomy of teachers, how much competition isencouraged between students, and the emphasis on academic achievement.
vstem MSghgraugAndfkaugtChange. This dimension involves the extent to which theenvironment is clear in its expectations, is orderly, maintains control overindividuals, and is responsive to change. This category includes such thingsas clear sets of rules, students knowing the consequences of infractions ofthe rules, teacher consistency in dealing with infractions, emphasis onbehaving in an orderly and polite manner, and how change occurs in rules,policy, curricula, etc.
To this we have added a fourth dimension:
Physical Environment. This dimension assesses the extent to which the physicalsurroundings contribute to a pleasant work environment. This includesphysical comfort and resource availability.
Table 1 .shows the way 13 major environment instruments fit into this classificationscheme. The table illustrates the differences in content of school and classroom climateassessment instruments.
Many of these were classifications made by the authors themselves. Others were taken from previous reviews ofthe instruments Some subscales do not fit neatly into a single category because the content may seem to fall intotwo
4
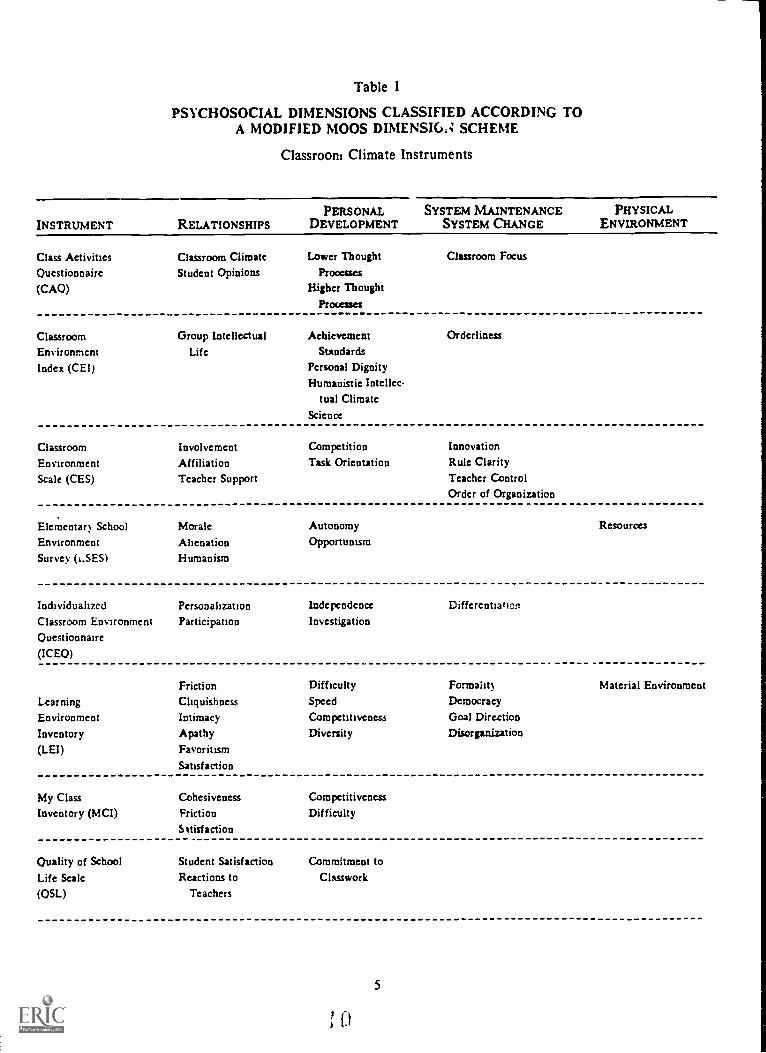
Table I
PSYCHOSOCIAL DIMENSIONS CLASSIFIED ACCORDING TOA MODIFIED MOOS DIMENSIG,4 SCHEME
Classroom Climate Instruments
PERSONAL SYSTEM MAINTENANCE PHYSICALINSTRUMENT RELATIONSHIPS DEVELOPMENT SYSTEM CHANGE ENVIRONMENT
Class Activities Classroom Climate Lower Thought Classroom Focus
Questionnaire Student Opinions Processes
(CAO) Higher ThoughtProcesses
Classroom Group Intellectual Achievement
Environment Life Standards
Index (CE!) Personal DignityHumanistic Intellec-
tual ClimateScience
Orderliness
Classroom Involvement Competition Innovation
Environment Affiliation Task Orientation Rule ClarityScale (CES) Teacher Support Teacher Control
Order of Organization
Elementary School Morale Autonomy
Environment Alienation Opportunism
Survey (i.SES) Humanism
Resources
Individualized Persooalmation Independence
Classroom Environment Participation Investigation
Questionnaire(ICEQ)
Differentian
Friction Difficulty Forma lit)
Learning Cliquishness Speed Democracy
Environment Intimacy Competitiveness Goal Direction
Inventory Apathy Diversity Disorganization
(LEI) Favoritism
Satisfaction
Material Environment
My Class Cohesiveness Competitiveness
Inventory (MCI) Friction DifficultySatisfaction
Quality of School Student Satisfaction Commitment to
Life Scale Reactions to Clssswork
(QSL) Teachers
5

PSYCHOSOCIAL DIMENSIONS CLASSIFIED ACCORDING TOA MODIFIED MOOS DIMENSION SCHEME
School Climate Instruments
INSTRUMENT RELATIONSHIPSPERSONAL
DEVELOPMENTSYSTEM MAINTENANCE
SYSTEM CHANGEPHYSICAL
ENVIRONMENT
High School
Climate Inventory(HSCI)
(ESIshort form)
Group Social LifePeer Group
Dominance
Intellectual ClimatePersonal Dignity/
Supportiveness
Achievement StandardsExpressiveness
Orderliness/Control
Organizational Espirit Trust Production EmphasisClimate Description Disengagement Hindrance AloofnessQuestionnaire Consideration(OCDO) Intimacy
School Learning Emphasis on Administrative Leadership Safe & OrderlyClimate Assessment Achievement Grouping EnvironmentInstrument (SLCAI) Expectations or Time for Instructiol
Students Use of Test Data
School Learning Affiliation Professional Interest Formalization Resource AdequacyEnvironment Student Achievement CentralizationQuestionnaire Supportiveness Orientation Innovativeness(SLEO)
Work Environment Involvement Autonomy Clarity Physical ComfortScale (WES-)974) Peer Cohesion Task Orientation Control
Staff Support Work Pressure Innovation
6
11

4. Ways of Measuring Educational Climate
School climate can be assessed through paper and pencil surveys/ opinionnaires, interviews,direct observations, and, to a lesser extent, examining existing records. Most currentlyavailable instruments are paper and pencil surveys. The rationale for this encompat -s thefollowing arguments (Fraser, I986a,b; Anderson, 1982; Steele, 1971; Ehman, 1970;Remmers, 1963; Fong, 1976).
I. Many authors define school or classroom climate in terms of "sharedperceptions." This definition implies that people's opinions and perceptionsare what is of interest. These can be easily obtained through paper andpencil surveys.
2. Perceptual measures ha\ e typically been shown to be more related to studentaffective and cognitive outcomes than the type of things related to climatethat can be measured through observation (e.g. percent teacher talk, teacher-student verbal interaction patterns, size of :lass, etc.).
3. For those variables which can be measured by both observation and self-report of perception, there is some evidence that perception matches reality.
4. There is some evidence that perception is not merely a reflection of theperson's personal characteristics and that descriptions of environment can beseparated from attitudes.
5. One's behavior is more controlled by the "perceived" environment than bythe "real" environment.
6. Paper and pencil measures are more economical.
7. Perceptual measures are based on students' experiences over many lessons,while observational data usually are restricted to a small number of lessonsactually observed.
For these reasons, in this Guide we will concentrate on paper and pencil instruments thatclaim to measure participant perceptions about school and classroom climate. Appendix Alists some studies which have used ethnographic techniques, case studies, and observation ofinteractions between teachers and students to examine school climate. Appendix B providesreferences that might assist with developing alternative types of instruments for assessingeducational environments.
5. State-of-the-Art in Assessing Educational Climate
Most currently available instruments are paper and pencil surveys of students and/orteachers which solicit their comments on various dimensions of class or school climate.Several of the instruments have been used widely in research studies--for example, thc.LEI, MCI, ICEQ, OCDQ, and CES. There is an increasing body of research on how schooland classroom climates affect achievement and affective outcomes, how student perceptionsof the actual classroom environment differ from their stated ideal environment, how
7
12

student observations differ from teacher observations, differences between grades andsubjects, and whether school climate can be modified (Fraser, 1986b has a good review ofthese topics).
Even with the current quantity and quality of research in the area there are general validityand usability issues with respect to the instruments used to assess educational climate. Theissues are of four types: (a) definitions-- is there an entity called school climate, and if so,how is it defined; (b) measurement-- if it can be defined, can it be measured in a reliableand valid manner; (c) importance-- if it can be measured, does it have an important effecton student outcomes; and (d) practicality-- even if it has an important effect on studentoutcomes, can it be changed to be better?
Definitions
Table 1 shows that the content of the instruments varies widely. There is only a moderatelevel of agreement as to what should be on such instruments. This obviously affects thenature of the studies used to validate the instrument and statements about the effects ofclimate on outcomes. However, there seems to be some consensus that climate refers to agroup phenomenon relating to the social and psychological atmosphere of a setting. Lackof common definition is not necessarily a problem--it just means that users need to attendto content so that they obtain the information desired.
Measurement
Even though it is generally agreed that perception is a useful way to obtain informationabout climate, this does not necessarily imply that the instruments currently availablevalidly capture the perceptions that are important. Issues include: Do respondcnts knowwhat is being asked for on the instruments? Is one's perception of the environment merelya reflection of his or her personality or is it an independent ertity? Do people in the samesetting see things the same way? Will people answer honestly? Does perception match upwith reality?
There has been a great deal of researcheon these issues both apart from and during thedevelopment of assessment instruments. In general, it appears that there are instrumentscurrently available that generate information about climate in a reliable and valid manner(Chavez, 1984; Filet, 1986; Fraser, 1986a,b). However, reliabilities of subtests often appearto be too low to make any educationally important decisions about individual students orteachers. The reliabilities of subtests are satisfactory for study of the perceptions ofgroups, Total score reliabilities, however, tend to be better and often can be used to lookat individuals.
Importance
Although there appears to be consistent relationships between climate and outcomes (Haertelet al, 1981), the exact nature of the relationships are yet to be defined. That is, differentsubtests on different instruments relate to different achievement and affective outcomes.One cannot yet say that increasing scores on instrument X will always increase studentreading scores. Current results are more like *high scores on the pa ticipation scale of the
Appendix D has information on the types of validity studies that should ideally be done on these instrument!Our reviews of instrument considered all of these
8
3J_

7
CES seem to be related to increased student leisure interest in science." There is generalevidence and tempting leads, but no one-to-one relationship between aspects of theenvironment and effects on student outcomes.
Fraser (1986a,b) also notes that most past research on the relationships between climate andoutcomes is corelational--aspect A of the climate appears to be related to aspect B ofoutcomes. There is a need for more information on causation--where classroom or schoolenvironments are deliberately changed in certain ways to check the effect of such changeson student outcomes. The implication of this is that there is a good deal of evidence thatclimate affects outcomes, but the precise cause and effect relationships have not yet beendetermined.
Practicality
In general, the instruments are quick to give and easy to score. However, there are somedeficiencies when it come to interpretation and use. There is no easily read summary ofthe relationships found so far. One has to dig through the research literature to find suchinformation. Thus, it can be difficult for practitioners to know what to look at, whatdifference scores of various sizes have on various outcomes, and what to do about it.(Several recent reviews of relationships between climate factors and outcomes are mentionedin Appendix B. In addition, the next section attempts to summarize some major points inthese reviews.)
In a similar vein, there is typically only brief assistance on how to interpret and use resultsin the test manuals themselves, although some are better than others. For example, fewhave norms. Those that do base their "norms" on the research sample of the instrumentwhi;11 are often small, represent only a few grade levels and are regionally located. Thoseinstments that do provide assistance with interpretation either list research findingsregarding the instrument or only emphasize profiling and comparing the opinions of variousparties. There is only scattered help on what aspects of climate are most important andwhat to do about it. Fra.ler (1986b) probably presents the best current summary of what isimportant and what to do about it. We recommend that if you get an instrument, also get ahold of research summaries surrounding it (We have tried to list sources of suchinformation in the reviews.)
Finally, most of the instruments that have better documented terhnical characteristicsappear to have been developed for research purposes more than for school self-examination.This means that packaging is not "slick," scoring must be handled at the local level, andknowledge on the part of users about test use and interpretation is assumed. On the otherhand, instruments developed primarily for self-use tend to be much better in terms of howto use the results but are almost totally lacking in documentation of validity and reliability(e.g., Fox et al, 1966, 1973).
In summary, several instruments look quite good and many appear promising. They areevolving and will continue to be improved with ongoing research. There will be continuingimprovements in content, interpretation and use. Hopefully there will be an improvementin packaging instruments for use by schools.
9

6. Standards of Comparison
Because of the issues described above, there are no simple guidelines for a district to use inorder to compare their profile of climate variables to some ide-1 profile. The lack ofstandards means that one doesn't know what profile is best. Based on some current reviewsof research (Fraser, 1986a,b; Anderson, 1982; Haertel, et. al., 1981; Johnson & Johnson,1979), the following provide a little assistance in this area.
1. In combining results from 12 studies (Haertel et al, 1981), the authors found that"better achievement on a variety of outcome measures was consistently found inclasses perceived as having greater Cohesiveness, Satisfaction and Goal Direction,and less Disorganization and Friction," (Fraser, 1986, p. 14). (For definitions ofthese dimensions see the MCI or LEI instrument descriptions in Appendix A.) Theauthor acknowledges however, that the nature of this relationship varies by subscaleand outcome measurenot all scales are related to all kinds of outcomes.
2. There is some evidence that being in a classroom having one's preferred climateimproves student outcomes. Fraser points out, however, that "it cannot be assvmedthat an individual student's achievement would be improved by moving him or herto a classroom which matched his/her preferences. Rather, the practical implicationof these findings for teachers is that class achievement of certain outcomes might beenhanced by attempting to change the actual classroom environment in ways whichmake it more congruent with that preferred by the class" (Fraser, 1986, p. 22). Thisfinding would lend credence to surveying students for both "actual" and "preferred"climates and comparing the two.
3. Anderson (1982) notes that the following seem to be related to achievement--teachermorale, student morale/alienation, teacher-administration rapport, teachercollegiality; staff participation and leadership in decision-making, teacher-studentrelationships, students having a role in decision-making, the number ofopportunities students have .o participate in activities and relate to each other,teacher commitment to improving student achievement, peer emphasis on academics,cooperation rather than competition between students in the classroom, frequent andpublic rewards and praise, and consistency in rewards and punishments.
4. There has been a great deal of research on the relative effectiveness of cooperative,competitive and individualistic goal structures (Fraser, 1986b, p. 108). In general,cooperative learning is more effective than the other two. Cooperation is mosteffective when there are group rewards but individual accountability (i.e., studentsproduce individual work, but the sum total, of the individual work is rewarded). "Itappear- that working with others to achieve a group goal creates peer normssupporting learning and these increase student motivation to achieve and help oneanother? (Fraser, p. 109).
5. Fraser (1986b, p. 119) also notes, "numerous past studies have revealed theconsistently positive influence of classroom environment dimensions such ascohesiveness, goal direction and democracy?
10
J

Again, however, it has to be pointed out that the type of generalizations presented abovehave to be dug out of the research literature. There is a relative lack ,)f this type ofassistance in the test manuals themselves. In addition, a note of caution is required. Theabove represent general findings across many studies. As with any complex socialconstruct, there is no guarantee that these findings will apply to any single individual orgroup. There is some evidence that what is best may vary depending on the type of group.
7. How To Select A Measure Of Educational Climate
Step 1--Decide Why You Want To Gather Information On Educational Climate
Such information can be used for all of the following purposes:
a. To improve student achievement.
b. To change student affective response to the school and/or learning such asattitude toward school, self-concept, motivation to learn, etc.
c. To compare the climate in classrooms of various grades, subjects, and typesof students.
d. To evaluate curriculum in terms of the climate produced.
e. To compare differences between student and teacher perceptions of climate.
f. To change the climate perceived by participants to be more like tht climatethey prefer.
In some of these uses the climate measure is used as a means to another end such aschanging climate to improve achievement. o other of these uses, the climate measure isused as an end in itself. That is, all other things being equal, we should be in enjoyableenvironments.
The desired use will have an impact on what instrument is chosen because some instrumentsare valid for some of these uses and others are not.
Step 2--Decide What To Look At
Before one can select a measure of climate, a decision has to be made about what aspects ofclimate will be looked at. As seen previously, definitions of educational climate vary andnot all aspects may be of local interest. As seen in Section 3, assessment instruments varyaccording to whether they primarily look at classroom or school climate, and withinclassroom or school climate what specifically is included. If the use is to mediate studentoutcomes (affective or achievement) then an instrument needs to be found which has beendemonstrated to predict these outcomes. There is less leeway in deciding or content. Ifthe use is more descriptive, then there is more leeway in deciding what content to cover.The discussion in Sections 3 and 6 (plus the descriptions of the content of individualinstruments themselves) may help to guide the decision of what to assess.
II

Step 3--Decide Haw To Best Gather This Information
!fie are assumirg that most people will choose to assess climate using a survey rather thancase studies, cbservation of interactions in the classroom or naturalistic enquiry. As wehave seen, there is theoretical and practical support for this approach. Fraser (1986b)concludes, however, that although results from various approaches corroborate each other,each provides its own type of detail. Appendix A has references to consult if analternative to paper and pencil assessment is considered.
The other decision is from whom informatior vill be gathered. For classroom climate,ittforr ation should probably be gathered fro, both students and teachers. For schoolclime ce information should be gathered from teachers, administrators, and sometimesstudents.
Siep 4--Obtain Instruments To Review
The descriptions of instruments in Appendix A will help guide you in choosing instrumentswith the best potential of meeting your needs. However, you should still compare several.If none of these looks like what you want, you may need to develop your own. Someguidance for this is included in Appendix B.
Step 5--Review Instruments For Final Choice
A checklist is provided in Appendix C to assist you to review the instruments in moredetail. This checklist covers content, reliability, validity and usefulness.
-a.
12

References
Anderson, C. S. (1982). The search for school climate: A review of the research. Reviewof Educational Research, 52, 368-420.
Anderson, G. J. & Walberg, H. J. (1974). Learning environments. In H. J. Walberg (Ed.),Evaluating educational performance: A sourcebook of methods. instruments, andexamples. Berkeley, CA: McCutchan.
Anderson, G. J., Walberg, H. J., & Welsh, W. W. (1969). Curriculum effects on the socialclimate of learning. American Educational Research Journal, 315-329.
Astin, A. W. & Holland, J. L. (1961). The environmental assessment technique: A way tomeasure college environments. Journal of Educational Psvcholoav, 51, 308-316
Bhushan, V. (1986a). Relationships between teacher's attitudes and classroom learningenvironment. In B. J. Fraser (Ed.), The study of learning environments (pp. 41-46).Salem, OR: Assessment Research.
Blum, R. E. (1984). Onward to excellence: Making schools more elf_e_othe. Portland, OR:Northwest Regional Educational Laboratory, Goal Based Education Program.
Chavez, R. C. (1984). The use of high inference measures to study classroom climates: Areview. Review of Educational Researsh, a, 237-261.
Cognetta, R. A., Malveti, A. C., & Wilson, C. F. (1985). Measuring school climate.Sacramento, CA: California Evaluation Improvement Project.
Coughlan, R. J. (1970). Dimensions of teacher morale. American Educational ResearchJournal, 7, 221-234.
Deer, C. E. (1980). Measuring organizational climate in secondary schools. AustralianJournal of Education, L, 26-43.
Ehman, L. H. (1970). A comparison of three sources of classroom data: Teachers,students and systematic observation. Minnesota: American Educational ResearchAssociation.
Ellett, C. D. (1986). Conceptualizing the study of learning environments. In B. J. Fraser(Ed.), The study of learning environments (pp. 34-40). Salem, OR: AssessmentResearch.
Epstein, J. L., & McPartland, J. M. (1978). OSL Administration and Technical Manual.Boston, MA: Houghton Mifflin Co.
Finlayson, D. S. (1973). Measuring *school climate" trends in I motion. 30, 19-27.
Fisher, D. L., & Fraser, B. J. (1983). Validity and use of the classroom environment scale.Educational Evaluation & Poticv Analysis, 1, 261-271.
13
18

Fong, C. P. (1976). Factors related to student perceptions of the high school environment.Journal of Educational Administration, Li, 199-210.
Fraser, B. J. (1986a). Two decades on perceptions of classroom environment. In B. J.Fraser (Ed.), The study of learning environments (pp. 1-33). Salem, OR:Assessment Research.
Fraser, B. J. (1986b). Classroom environment. Dover, NH: Croom Helm.
Fraser, B. J., Anderson, G. J., & Walberg, J. H. (1982). Assessment of learningenvironments: Manual for LEI and MCI. Bent ly, Western Australia: WesternAustralian Institute of Technology.
Fraser, B. J., & Fisher, D. L. (1983, April). Assessment of classroom Dsvchosocialenvironment workshop manual. Paper presented at the annual meeting of theNational Association for Research in Science Teaching. (ERIC No. ED 228 296)
Fraser, B. J., Treagust, D. F., & Dennis, N. C. (1986). Development of an instrument forassessing classroom psychosocial environment at universities and colleges. Studies InHigher Education, 11, 43-54.
Gottfredson, D. C., Hybl, L. G., Gottfredson, G. D., & Castenada, R. P. (1986). Schoolclimate assessment instruments: A review. The Johns Hopkins University, Centerfor Social Organization of Schools.
Haertel, G. D., Walberg, H. J., & Haertel, E. H. (1981). Socio-psychological environmentsand learning: A quantitative synthesis. British Educational Research Journal, 7 27-36.
Hoyle, J. R., et al. (1985). Skills for successful school leaders. Arlington, VA: AmericanAssociation of School Administrators.
Johnson, D. W., & Johnson, R. T. (1979). Cooperation, competition and individualization.In H J. Walberg (Ed.), Educational environments and effects (pp. 101-119).Berkeley, CA: McCutchan Publishing Company.
Moos, R. H. (1974). The social climate scales: An overview. Palo Alto, California:Consulting Psychologists Press.
Murray, H. A. (1938). Explorations in Personality. New York: Oxford University Press.
Remmers, H. H. (1963). Rating methods in research on teaching. In N. L. Gage (Ed.),Handbook on research on teaching. Chicago: Rand McNally.
Rentoul, J. A. & Fraser, B. J. (1983). Development of a school-level environmentquestionnaire. Journal of Educational Administration, 21, 21-39.
Roberts, D. L. (1984). Ideal teaching/learning environments and effective supervisoryclimates: Contradictory or comparable? Education, 1, 173-197.
Sadker, D., Sadker, M., & Cooper, J. M. (1973). Elementary school: Through children'seyes. The Elementary School Journal, 2/, 289-296.
14

Saldern, M. V. (1986). Multilevel perspectives on social emotional climate. In B. J. Fraser(Ed.), The study of learning environments (pp. 69-75). Salem, OR: AssessmentResearch.
Steele, J. M., House, E. R., & Kerins, T. (1971). An instrument for assessing instructionalclimate through low-inference student judgments. American Educational ResearchJournal, 447-466.
Stern, G. G. (1970). Peon le in context_Measurinknerson-environment congruence ineducation and industry. New York Wiley.
Thomas, A. R. (1976). The organizational climate of schools. jnternational review ofTducation, LZ, 441-456.
Treagust, D. F., & Fraser, A. J. (1986, April). Validation and application of the collegeand university environment inventory (CUCEII. Paper presented at the meeting ofthe American Educational Research Association.
Wang, M. C., & Walberg, H. J. (1986). Classroom climate as mediator of educationalinputs and outputs. In B. J. Fraser (Ed.), The study of learning environments (pp.47-58). Salem, OR: Assessment Research.
Williamson, J., John, K. G., & Fraser, B. J. (1986, April). Use of classroom and schoolenvironment scales in evaluating alternative high schools. Paper presented at themeeting of the American Educational Research Association.
15

APPENDIX A
Reviews of Educational ClimateAssessment Instruments
There are three types of reviews in this Appendix. The most widely used instrumentsand/or those commercially available are summarized in detail. These summaries have beenreviewed by the authors of the instruments and are organized by whether they are intendedto primarily measure school or classroom climate. Less frequently used instruments aredescribed more briefly. Finally, lengthier instruments having educational climate as onecomponent are listed as are studies using naturalistic or case study approaches in studyingclimate.
17

CLASSROOM CLIMATE INSTRUMENTS
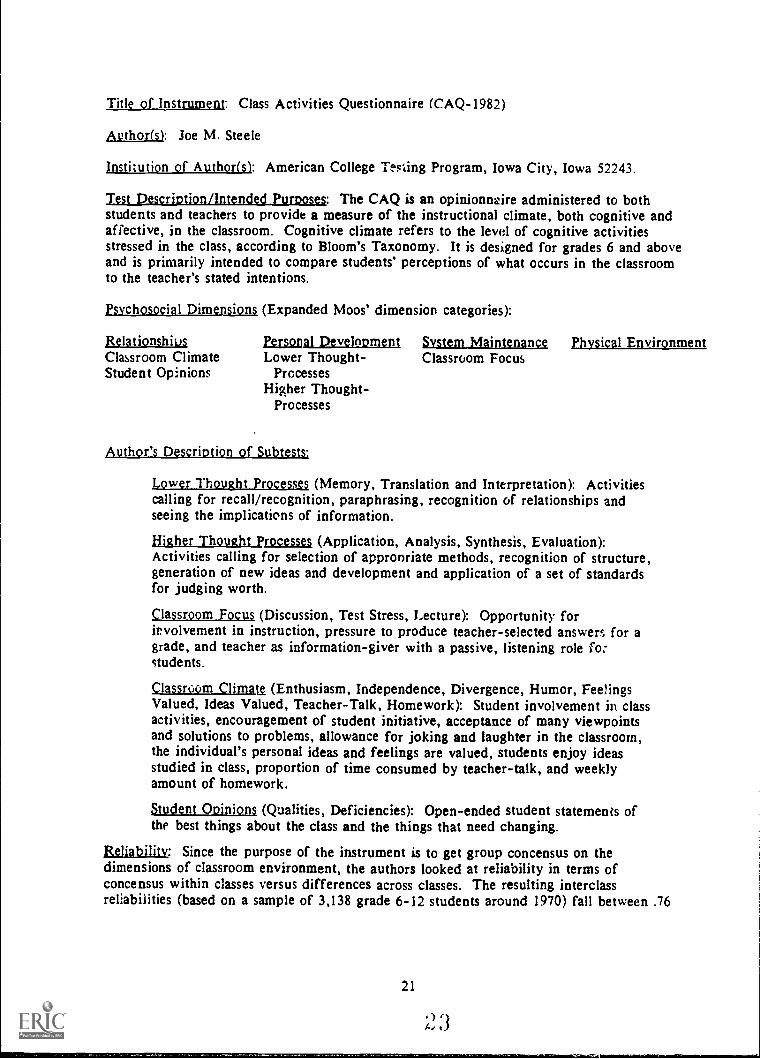
Title of Instrument: Class Activities Questionnaire (CAQ-1982)
Author(st Joe M. Steele
Jnsti;ution of Author(s): American College Tesling Program, Iowa City, Iowa 52243.
Test Description/Intended Purposes: The CAQ is an opinionneire administered to bothstudents and teachers to provide a measure of the instructional climate, both cognitive andaffective, in the classroom. Cognitive climate refers to the level of cognitive activitiesstressed in the class, according to Bloom's Taxonomy. It is designed for grades 6 and aboveand is primarily intended to compare students' perceptions of what occurs in the classroomto the teacher's stated intentions.
Psvchosocial Dimensions (Expanded Moos' dimension categories):
Relationships Personal Development System Maintenance Physical EnvironmentClassroom Climate Lower Thought- Classroom FocusStudent Opinions Processes
Higher Thought-Processes
Author's Description of Subleats.
Lower Thought Processes (Memory, Translation and Interpretation): Activitiescalling for recall/recognition, paraphrasing, recognition of relationships andseeing the implications of information.
Higher Thought Processes (Application, Analysis, Synthesis, Evaluation):Activities calling for selection of appronriate methods, recognition of structure,generation of new ideas and development and application of a set of standardsfor judging worth.
Classroom Focus (Discussion, Test Stress, Lecture): Opportunity forirvolvement in instruction, pressure to produce teacher-selected answers for agrade, and teacher as information-giver with a passive, listening role fo:students.
Classroom Climatg (Enthusiasm, Independence, Divergence, Humor, FeelingsValued, Ideas Valued, Teacher-Talk, Homework): Student involvement in classactivities, encouragement of student initiative, acceptance of many viewpointsand solutions to problems, allowance for joking and laughter in the classroom,the individual's personal ideas and feelings are valued, students enjoy ideasstudied in class, proportion of time consumed by teacher-talk, and weeklyamount of homework.
Student Opinions (Qualities, Deficiencies): Open-ended student statements ofthe best things about the class and the things that need changing.
Reliability: Since the purpose of the instrument is to get group concensus on thedimensions of classroom environment, the authors looked at reliability in terms ofconcensus within classes versus differences across classes. The resulting interclassreliabilities (based on a sample of 3,138 grade 6-12 students around 1970) fall between .76
21
L.1

and .88 for the four major dimensions of the test. Reliability estimates for the 16 factorsrange from .58-.94 with only five beiow .75. Test-retest reliabilities ranged from .59 to .91for the four major dimensions. These are acceptable.
YaliditY: A review of the literature was conducted to find features of instructional climatethat would be shared by a diverse range of classes and would be educationally meaningful.This resulted in two areas-- cognitive and affective. The cognitive items are based onBloom's Taxonomy. Items were reviewed by educators and other judges familiar withBloom's Taxonomy to achieve consensus that items matched cognitive levels. In theaffective area items are not based on a theoretical model, but rather on "consensusregarding classroom climate dimensions relevant to an instructional climate conducive -olearning." Items were reviewed by educators. Students were interviewed to snake sure thatthey understood what was being asked. There was also a fair amount of work tc,substantiate construct validity. There is some evidence to support the factor structure ofthe instrument. The authors also examiazd how well student responses to certain itemsmatched up to classroom observation of the same climate aspect, such as percentage ofteacher-talk. There is no evidence relating these dimensions to student outcomes.
Usability: The CAQ is a 30-item paper/pencil questionnaire. Items 1-27 ask aboutcognitive and affective emphasis in the classroom. Items 28-30 allow the student todescribe in their own vords what they perceive to be the strengths and weaknesses of theclass. Teachers also complete the questionnaire--once to indicate what they intend toemphasize in a classroom and a second time to indicate what they predict students will sayabout the classroom. The questionnaire takes approximately 20 minutes to complete. Theinstruments can be computer scored by the publisher. There is some information providedon how to interpret results, and some standards of comparison are provided. There are nonorms. The materials are professionally packaged.
Suovlemental Materir,%. A manual for administration contains directions, suggestions forinterpreting results, and technical information is proVided.
Pistribution!Availability: Creative Learning Press, Box 320, Mansfield Center, Connecticut06250.
Comments: This is based on research that shows that students, as groups, can be accurateobservers of classroom interactions. The author emphasizes a decision-making procedurebased on clear-cut concensus. This procedure combined with the reliability of theinstrument makes the procedure justifiable. The major shortcoming of the instrument is itslack of evidence that scores predict student outcomes. This could be a problem if the userwants to use a clinnte instrument to measure aspects of climate related to outcomes. If theuse is to make people's perceptions more congruent then it is not as much of a problem. Areview in Buros (9th edition) agrees that a problem is lack of evidence relating to studentoutcomes, and states that until this is available, the LEI, LES and CES may be better to usebecause of the accumulation of research based on them. Dr. Steele is presently developinga form for the college level with the same six cognitive levels of this version of the CAQ.
The author notes that the CAQ can also be used for program evaluation to providedescriptions of patterns of emphasis across classrooms, and to characterize the instructionalclimate of a content area, a school, or a special program
22

Title of Instrum<At: Classroom Environment Index (CEI-1975)
&villa(n George Stern and Associates
institution of Author(s): Syracuse University
Test Description/Intended Purposes: The CEI is intended to measure the psychologicalenvironment of a classroom as perceived by students. It is normally used for grades 5-12,but can have some application to certain college classes.
Psychosocial Dimensions (Expanded Moos' dimension categories):
Relationships Personal Development System Maintenance Physical EnvironmentGroup Intellectual Achievement Orderliness
Life StandardsPersonal DignityHumanistic Intellectual
ClimateScience
Author's Description of Subtests:
Humanistic Intellectual Climate: This scale includes aspects of achievementtogether with elements of contemplation in social concern.
Group Intellectual Life: This scale includes aspects of intellectuality,reflectiveness, objective thinking and practicality.
Achievement _Standards: This is a measure of striving for success, accompaniedby high levels of activity and effort.
personal Dignity: This scale indicates individual responsibility anti personalautonomy. It is characterized by tolerance, self-confidence and friendliness.
Orderliness: Classrooms that score high on this factor would be characterizedby caution, seriousness, and austerity.
Science: A high score on this factor involves an interest in the natural sciences,together with aspects associated with sexuality and egotism.
Reliability: Internal consistency reliabilities of the six subscales ranged from .68 to .84 withfour being above .80. This is good for this type of measure. The size and composition ofthe sample on which this is based is not, however, provided in the manual.
Validity: Based on the needs press paradigm of Murray (1938), the CET was an adaptationof Stern school climate measures for use in assessing classroom climate.. A subsequent studylends support that the CEI differentiates between classrooms, subjects, grades andeducational levels. The 30 original elements on the instrument were grouped into sixdimensions of environment using factor analytic techniques. There is no evidence providedof the relationship of the CEI to student outcomes.
23

Usability: The CEI is a 300-item paper/pencil, true/false inventory. It can be split intotwo 150-item parts and administered independently to different respondents in one classperiod. It takes approximately 40 minutes to administer. Scoring is available from thesource listed in Availability below. Hand scoring appears difficult (even with scoringoverlays). Means and standard deviations are provided for comparison purposes (the sampleon which these are based is not specified). Standard scores can be computed. There is noevidence that the procedure they suggest for converting to percentiles is justified. There isno other help with interpretation and use. The instruments are attractively packagedalthough the manual is not.
Supplemental Matrajak: Technical manual containing a brief description of the scales,instructions for administration, scoring key, norms and references. Scoring overlays areavailable at extra cost.
Distribution /Availability: Evaluation and Research Associates, P.O. Box 6503, Teal! Station,Syracuse, New York 13217, (315)685-5757.
Comments: This is part of a series of instruments developed by Stern (and others). Theinstruments include those which assess both the needs (Stern Activities Index) and the press(OCI, CE1, HSCI, ES1, CC1) in Murray':, needs press paradigm. Needs refer to individualsand press refers to demands of the environment. The scales are set up so that press scalescan be directly related to the needs scales.
In general, materials accompanying the instruments are skimpy. The series of instrumentsof which the HSCI and ESI are a part is intriguing, but without more information th.;ywould be difficult to use. A review in Anderson (1982) appear.; supportive of theinstruments and cites a little research using them. More information about the instrumentsis available in Stern (1970).
24
A.

Title of Instrument: Classroom Environment Scale (CES-1974).
Autlyirjil Rudolf H. Moos and Edison J. Trickett.
Institution of Author(sl: Social Ecology Laboratory, Dept. of Psychiatry, StanfordUniversity and Veterans Administration Medical Center, Palo Alto, CA; Dept. ofPsychology, University of Maryland, College Park, MD (respectively).
Test Description/Intended Purposes: The CES assesses student perceptions of the learningenvironment of junior and senior high classrooms. It 's recommended for use in grades 7-12.
Psvchosocial Dimensions (Expanded Moos' dimension categories):
Relationships personal Development System Maintenance physical EnvironmentInvolvement Competition InnovationAffiliation Task Orientation Rule ClarityTeacher Support Teacher Control
Order & Organization
Author's Description of Subtests:
Involvement: The extent to which the students have attentive interest in classactivities, participate in discussions, do additional work and enjoy the class.Affiliation: The extent to whis .1 students help each other, get to know eachother easily and enjoy working together.Teacher Support: The extent to which the teacher helps, befriends, trusts and isinterested in students.Task Orientation: The extent to which it is important to complete the activitiesthat have been planned and to stay on the subject matter.Competition: The extent to which students compete with each other for gradesand recognition.Order and Organization: The emphasis on students' behaving in an orderly, quietand polite manner, and the overall organization of classroom activities.
Rule Clarity: The emphasis on clear rules, on students knowing the consequencesfor breaking rules, and on the teacher dealing consistently with students whobreak rules.Teacher Control: The extent to which rules are enforced and rule infractions arepunished.
jfinovation: The extent to which the teacher plans new, unusual and varyingactivities and techniques, and encourages students to contribute to classroomplanning and to think creatively.
Reliability: Originally (in 1974), reliability on the real form was calculated using a sampleof 465 high school students in 22 classes in the U.S. Class reliabilities for the subscalesranged from .67 to .86 with six of nine .80 or above. A later validation study of about1,100 junior high students in Australia calculated individual student and class reliabilitiesfor the real and ideal forms, and teacher reliabilities for the real form. Reliabilities werein the moderate range of .51-.90 with median (based on 36 reliabilities) of .69. Thisseems somewhat low. Teacher reliabilities ranged from .57 to .77.
25

Validity: Development was based on Moos' dimensions characterizing all psychosocialenvironments. Ninety final items were selected based on item tryouts and their ability todiscriminate between perceptions of groups of students in different classrooms. Originalvalidation information was provided only on Form R. A validation study (Fisher & Fraser,1983) attempted to add to previous validity studies. Both R and I forms were examined.This study provided some evidence for the effect of CES climate variables on studentoutcomes and that student outcomes depend somewhat on the correspondence between thestudents' perception of the actual climate and their statements about the climate theyperceive as ideal. This instrument has been used extensively in research.
Usability: There are Real, Ideal and Expectations Forms. The Real (R) Form measurescurrent perceptions, the ideal (I) Form measures student preferred environment and theExpectations (E) form measures what students expect the environment they are about toenter will be like. Forms I and E are not in published form but can be reproduced, withpermission from the author, from the manual.
There are 90 true-false items on each form which take approximately 20 to 30 minutes eachto complete. There is also a short form and separate form to measure teacher perceptionsof the real classroom climate. Means and standard deviations for the validation sample areprovided in ERIC 228 296 and norms are available in the 1974 manual. Interpretation inthe manual emphasizes profiling and comparison between teachers and students. Moredetail on how profiles relate to student outcomes is available in the voluminous researchbase on this instrument, but has to be "dug for" by the user. All scoring is done locally.Packaging is attractive for the R form.
Supplemental Materials: The publisher provides: The Overview of Social Climate Scalespresents the conceptual background for this and related instruments developed by Moos; Atest manual includes descriptions of the scales, statistical information, administration andinterpretation of results; Bibliographies of research using the CES; separate answer sheetsand scoring key. There is also a 36-item short form of the CES available in Fraser (1986b).
Distribution/Availability: Consulting Psychologists Press, 577 College Avenue, Palo Alto,CA 94306. ERIC ED 228 296 provides a version of the CES modified based on the resultsof a 1983 validity study by Fraser and Fisher. The instrument is also available in Fraser(1986b).
Comments: It appears that the CES was developed mainly for research purposes and hasbeen used extensively since. There is little help with interpretion and use of results in thepackaged materials provided by the publisher. But since the instrument has been used in afair number of studies, districts could find the associated studies to aid in interpretingresults. (There is a summary of such studies in Fraser 1986b). Two reviews in Buros (9thedition) noted the potential of the instrument but also noted lack of help in interpretation.The instrument was developed based on the view that school climate should be based on aconsensus of individuals characterizing their environment. The author recommends its usefor describing how participants see their environment, comparing perceptions, evaluatingenvironmental chinge examining how environment affects student outcomes, use by aoutside observer, and moving individuals to settings more congruent with their preferences.There is little evidence provided for the validity of the last two uses. It seems, however, tobe generally accepted as one of the better tools.
26

Title of Instrument: Elementary School Environment Survey (ESES-1967)
Author(s): Robert L. Sinclair and David Sadker
Institution of Author(s): University of Massachusetts and the American University,Washington D.C. (respectively).
Test Description/Intended Purposes: The ESES is intended to measure young students'perceptions of the physical, social and intellectual conditions and happenings in schools.
Psychosocial Dimensions (E-.panded Moos' dimension categories):
Relationships personal Development System Maintenance Physical EnvironmentMorale Autonomy ResourcesAlienation OpportunismHumanism
Author's Description of Subtes1:
Alienation: This scale measures the feeling of estrangement between a childand the school.
Humanism: This scale measures the atmosphere of concern with the value andintegrity of the individual.
Autonomy: This scale measures student independence and self-direction. Italso helps determine if the lines of communication between students andteachers are open.
Morale: This scale measures the cheerfulness and good feelings felt by studentstoward the school.
Opportunism: This scale reflects an environment which is characterized bybehavior which adapts to expediency or circumstance.
Resources: This scale reflects quality and availability of optional learningresources.
Reliability: None provided
Validity: The ESES was adapted for elementary school use from the CUES, developed foruse in colleges based on the needs-press concept of Murray (1938). The instrument wasadministered to over 5,000 5th and 6th grade students in Massachusetts. Based on a factoranalysis of these data, items were placed onto the six subscales. Several subsequent studiesshowed that the ESES distinguished between sites. There is no information about therelationship to stude- outcomes.
Usability: This survey has 42 true/false questions. Each cf the six dimensions aremeasured by seven consecutive items on the questionnaire. Recommended age level is 9-11years. Sadker et al (1973) provides assistance with standards--how the ideal school vouldlook on each subscale (no empirical support is, however, provided for these statements).The instrument can be obtained in booklet form--which is usable but not "slick."
27
'.'tl
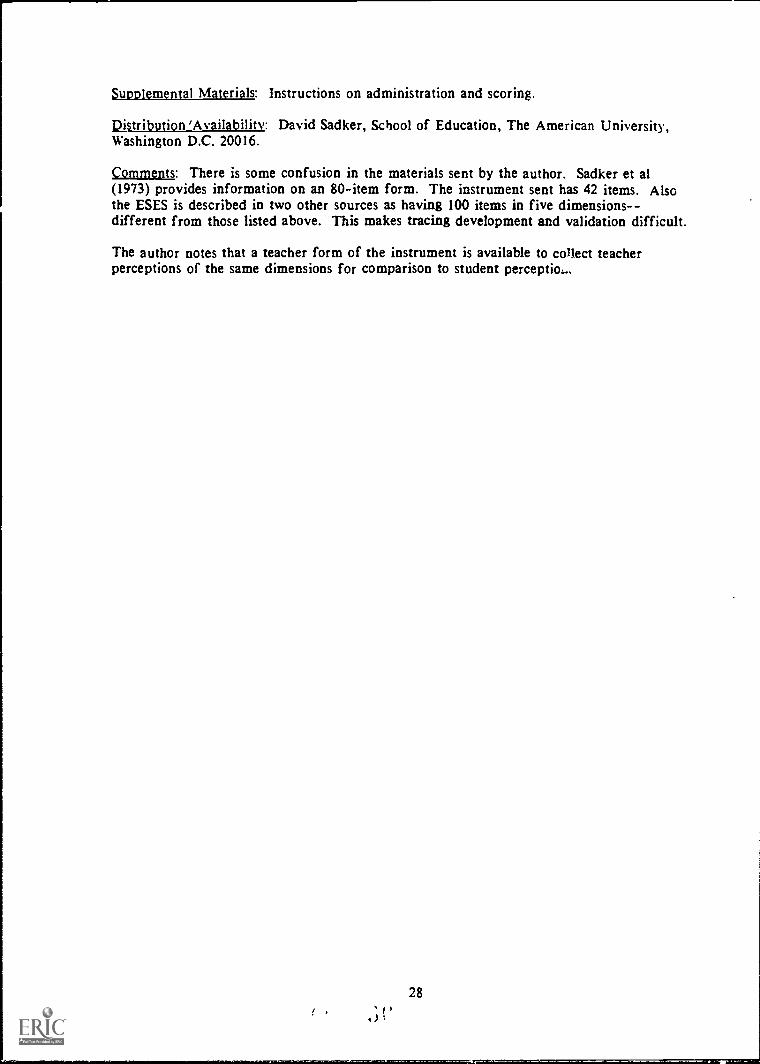
Supplemental Materials: Instructions on administration and scoring.
Distribution!Availabilitv: David Sadker, School of Education, The American University,Washington D.C. 20016.
Cmnments: There is some confusion in the materials sent by the author. Sadker et al(1973) provides information on an 80-item form. The instrument sent has 42 items. Alsothe ESES is described in two other sources as having 100 items in five dimensions- -different from those listed above. This makes tracing development and validation difficult.
The author notes that a teacher form of the instrument is available to collect teacherperceptions of the same dimensions for comparison to student perceptio,....

Title of Instrument: Individualized Classroom Environment Questionnaire (ICEQ-1979)
Author(st Barry J. Fraser
Institution of Author(s): Western Australian Institute of Technology, Bentley, WesternAustralia 6102.
Test Description/Intended Purposes: The ICEQ is intended to measure student and teacherperceptions of actual and preferred classroom learning environments along dimensionswhich differentiate individualized classrooms from conventional ones. It is intended for usein grades 7-12.
Psvchosocial Dimensions (Expanded Moos' dimension categories):
Relationships PersonalPersonalization IndependenceParticipation Investigation
Author's Description of Subtests:
System Maintenance Physical EnvironmentDifferentiation
Personalization: The emphasis on opportunities for individual students tointeract with the teacher and on concern for the personal welfare and socialgrowth of the individual.
Participation: The extent to which students are encouraged to participate ratherthan be passive listeners.
Independence: The extent to which students are allowed to make decisions andhave control over their own learning and behavior.
Investigation: The emphasis on the skills and processes of inquiry and their usein problem-solving and investigation.
Differentiation: The emphasis on the selective treatment of students on thebasis of ability, learning style, interests, and rate of working.
Reliability: Reliabilities are based on about 1,800 Australian students in grades 7-9.Internal consistency reliabilities for the actual and preferred forms are similar and rangefrom .67 to .76. For teachers, the reliabilities ranged from .74 to .90. Test-retest reliabilityfor a sample of 105 grade 7-9 students on the actual form (three weeks apart) ranged from.67 to .83.
Reliabilities for student groups and teachers are acceptable. Those for individual studentsare a little low for the instrument to be used for any educationally important decisionsabout individual students.
Validity: Dimensions were chosen to characterize the classroom learning environmentdescribed in individualized curriculum materials and in the literature of individualizededucation. Teachers and students were interviewed about the saliency of items anddimensions. Final items were selected based on conventional item statistics andindependence of subtests.
29
43
Data on actual and preferr-J use with students is based on over 1,800 grade 7-9 students inAustralia. Data on actual and preferred use with teachers is based on fewer than 100teachers in Australia. The instrument seems to differentiate between classrooms.Subsequent research has provided evidence for the relationship between ICEQ dimensionsand student outcomes, that perceptions of individualization relate to actual attempts toimprove individualization, and that there is a relationship between preferredindividualization and achievement in that setting.
Usability: The ICEQ's long form contains 50 items. Each item is responded to on a five-point scale with the alternatives ranging from almost never to very often. The scoringdirection is reversed for many items. The instrument has two forms -- Actual (studentperceptions of the actual environment), and Preferred (student opinion as to what theenvironment should be like). The forms can also be used with teachers. The ICEQ isuntimed but typically takes 15-30 minutes for each form.
Scoring must be done locally.
Averages and standard deviations for students, classes and teachers in the sample for eachsubtest is presented. There is some guidance on how to profile results and compare themfor actual versus preferred and teacher versus student. There is also a little guidance onhow to use the results to alter th... climate perceptions of students.
The instruments must be copied from a "Test Master" set supplied with the manual fromthe author.
$uoplemental Materials: A manual (1986) including instrument development,administration, review of research using the instrument and copies of the actual andpreferred long and short forms.
Distribution 'Availability: See address above. It is also available from ERIC ED 228 296and in Fraser (1986b).
Comments: This instrument was intended to fill a gap in existing instruments -- dimensionsimportant in open or individualized classrooms. This instrument has been used quite a bitin research. It appears to be one of the better instruments. The author recommends theuse of the short form only for looking at classes, not individual students. A summary ofresearch using the ICEQ is available in Fraser (1986b).
30
32

Title of Instrument: Learning Environment Inventory (LEI-1982), 3rd Version.
Author(s): Barry J. Fraser, Gary J. Andersen, and Herbert J. Walberg.
Institution of Authorlsi: Western Australian Institute of Technology, Perth; McGillUniversity, Montreal; University of Illinois, Chicago (respectively).
Test Description/Intended Purposes: The LEI is intended to measure student perceptions of15 dimensions of the social climate of high school classrooms. It could be used withstudents aged 12 to adult (grades 7-12).
psvchosocial Dimensions (Expanded Moos' dimension categories):
RelationshipsFrictionCliquenessCohesivenessFavoritismSatisfactionApathy
Personal DevelopmentDifficultySpeedCompetitivenessDiversity
Author's Description or Subtests:
System Maintenance Physical EnvironmentFormality Material-EnvironmentDemocracyGoal DirectionDisorganization
Cohesiveness: Extent to which students, know, help and are friendly towardeach other.
Diversity: Extent to which differences in students' interests exist and areprovided for.
Formality: Extent to which behavior within the class is guided by formal rules.
Speed: Extent to which class work is covered quickly.
Material Environment: Availability of adequate books, equipment, space, andlighting.
Friction: Amount of tension and quarreling among students.
Goal Direction: Degree of goal clarity in the class.
Favoritism: Extent to which the teacher treats certain students more favorablythan others.
IMissIty: Extent to which students find difficulty with the work of the class.
Apathy: Extent to which students feel no affinity with the class activities.
Democracy: Extent to which students share equally in decision-making relatedto the class.
Cliqueness* Extent to which students refuse to mix with the rest of the class.
Satisfaction: Extent of enjoyment of class work.
Disorganization: Extent to which classroom activities are confusing and poorlyorganized.
Competitiveness: Emphasis on students competing with each other.
31

Reliability: The internal consistency reliabilities on each subscale for individual studentsrange from .54 to .85 (N=1,048). Interclass correlations for groups range from .54 to .92(N=83). Test-retest reliabilities range from .43 to .73 (N=139). This information is good inthat it provides correlations for each suggested use. But data are old and some subscalereliabilities may be too low for profiling individual students.
Validity: The authors tried to choose climate dimensions which were good predictors oflearning, were relevant to theory or those which seemed to be relevant. A panel of judgesclassified items to ensure agreement on what dimension each item measured. The authordid traditional item analysis and correlations *uetween subtests. The manual cites a numberof studies done between 1969 and 1981 on the relationship between LEI scores andachievement gains.
Usability: The final version of the LEI contains a total of 105 items measuring 15dimensions. There is one form and one level. The student responds by indicating thestrength of his/her agreement or disagreement on a four-point scale ranging from stronglydisagree to strongly agree. It is untimed but takes 40-55 minutes to administer. Thesurvey instruments are scored locally only--no machine scoring is offered by the publisher.A number of research studies are cited showing the relationship of each subscale to learningoutcomes. This provides some standards for interpreting scores as does means for 1,048students in grades 10 and 11 (the student sample, however is old--1969). The test must bereproduced from an appendix in the manual with approval from the authors.
Supplemental Materials: Scoring key, manual, answer sheet.
Distribution/Availability: Bary J. Fraser, Faculty of Education, Western Australian Instituteof Technology, Bentley, Western Australia 6102. Herbert J. Walberg, College of Education,University of Illinois at Chicago, IL 60680. The LEI and a short form of the LEI are alsoavailable in ERIC 228 296 and Fraser (1986b).
Comments: The authors suggest that the LEI could be used for individual student or groupprofiling. The authors recommend that subscale scores not be combined to get an overallmeasure of climate because the 15 dimensions are supposed to be independent. (This claimis partially borne out in studies cited in the manual. The reliability of individual subscalesmay be too low, however, for profiling individual students.)
There are two reviews in Buros (9th edition). The reviews found potential problems withlow reliabilities for some subscales and a lack of general help in interpreting and usingscores. Neither reviewer argued with the validity of the test and both thought that it hadpotential for research or use in the schools. Reviews by Chavez (1984) and Fraser (1986b)include summaries of research studies adding to the construct and predictive validity of thetest. Chavez is convinced of the validity and usefulness of the LEI.
The manual was rewritten in 1982, but the test itself is the same as that developed in thelate 60's. Although old, the LEI has been used extensively in research and in schools andhas evidence of validity and usefulness. It seems to be one of the better instruments.
32

Title of Instrument: My Class Inventory (MCI-1982)
Author(s): Barry J. Fraser, Gary J. Anderson and Herbert J. Walberg
Institution of Author(s): Western Australian Institute of Technology, Perth; McGillUniversity, Montreal, Canada; and University of Illinois, Chicago (respectively).
lea rijas i:iiliesalEurgurx The MCI was designed to measure student perceptionsof five dimensions of classroom social climate. It is intended for use with students 8-12years old. It is a simplified version of the LEI.
Psychosocial Dimensions (Expanded Moos' dimension categories):
Relationships Personal Development System Maintenance Physical EnvironmentCohesiveness CompetitivenessFriction DifficultySatisfaction
Author's Description of Subtests:
Cohesiveness: Extent to which students, know, help and are friendly toward eachother.
Friction: Amount of tension and quarreling among students.Satisfaction: Extent of enjoyment of class work.
Difficulty: Extent to which students find diffit;ulty with the work of the class.Competitiveness: Emphasis on students competing with each other.
Reliability: Internal consistency reliabilities for individuals range from .62-.78 (N=2305).Interclass correlations for groups range from .73 to .88 (N=I00 classrooms). Reliabilities aretoo low for profiling individual students. Group profiling appears justified. Thesereliabilities are, however, based only on 7th graders.
Validity: The items are simplified versions of those on the LEI. The authors revised anearlier version because of low subscale reliabilities to form the current 1982 version. Theauthors examined the ability of the subscales to differentiate between classes and how wellit predicts student outcomes. Two reviewers in Buros (9th edition) felt that the instrumenthas promise but needs more validation work at grades lower than 7th. Chavez (1982)summarizes research studies using the MCI and feels it is a good instrument. Fraser (1986)also summarizes research using the MCI.
Usability: The MCI has 38 questions in a yes or no format. Students answer on the testform itself rather than a separate answer sheet. To help interpret results and providestandards of comparison, the manual provides means for 2,305 7th graders in Australia.There are no norms or other assistance with interpretation. To use the instrument, onemust photo copy it from an appendix in the test manual after obtaining the authors'approval. Scoring must be done locally. Buros reviewers felt that the manual wassomewhat skimpy in assistance with interpreting and using results, but that it is easy toadminister and score.
33

Supplemental Materials: Test manuals, reviews of relevant research concerning the use ofthe instrument along with suggestions for ways in which teachers and researchers mightmake use of the scales is also provided. Items are cross-referenced to subtests.
Distribution /Availability: Barry J. Fraser, Western Australian Institute of Technology,Bentley, Western Australia 6102 or Herbert J. Walberg, College of Education, University ofIllinois at Chicago, Chicago, IL 60680. The most recent MCI and a shcrt form of the MCIare also available in ERIC ED 228 296 and in Fraser (1986b).
Comments: This instrument has not been as extensively used as the CES or LEI, but seemsto be regarded as one of the better instruments.
34
()

Title of Instrument: The Quality of School Life Scale (QSL-1978)
Author (sl: Joyce L. Epstein and James M. McPartland
jnstitution of Author(s): The John Hopkins University
Test Description/Intended Purposes: To assess the attitudes and reaction of students ingrades 4-12 to school life.
avchosocial Dimensions (Expanded Moos' dimensions categories):
Relationships Personal Development System Maintenance physical EnvironmentStudent Satisfaction Commitment to
ClassworkReactions to Teachers
Author's Description of Subtests:
Satisfaction With School: General student reaction to school.
Reactions to Teachers: Student evaluations of instructional and personalinteractions with teachers.
Commitment to Class Work: Level of student interest in classwork.
Reliability: Internal consistency reliability of the QSL was calculated on the scores of 4,266elementary and secondary students. The overall KR-20 reliability for the QSL is .87 and.89 for secondary and elementary students, respectively. Subscale reliabilities range from.64 to .89. This is fairly good fur instruments of this nature.
Validity Student interpretation of items was solicited to ensure that students understoodwhat was being asked. Items were revised using traditional item analyses. The authorscorrelated scores on this measure to other factors which seem to relate to attitude towardschools. Relationships were small to moderate in the directions predicted. They looked atdifferences between groups of students expected to differ in their reaction to school life.The factor structure lends credibility to the subscales, although reactions to teachers couldbe divided into two parts--personal and instructional interactions. There is some evidencethat scores relate to adjustment problems in school. ThP authors report a low relationshipwith student achievement.
Usability: Students respond to 27 items - -14 true/false, nine multiple choice, and fouritems in which respondent makes a selection ranging from always to never. The QSL alsoasks the students to comment in their own words about the quality of their schoolexperience. The questionnaire may be administered to small or large groups of students inabout 20 minutes. Stanine-like norms for students and classes (based on the pilot testsample of 4,266 students in Maryland) are reported. There is some help with theinterpretation of results. The instrument is attractively packaged.
Supplemental Materials: The administration and technical manual gives instructions foradministering the survey along with documentation of reliability and validity, summaries ofresearch on student attitudes, a scoring key, directions for developing local norms, andsample report formats.
1 35

Distribution/Availability: Riverside Publishing Company, 8420 Bryn Mawr Avenue,Chicago, Illinois 60631, 1-800-323-9540.
Comments: The QSL was developed with the belief that attitude towards school should bestudied as an educational outcome in addition to academic success. The authors recommendits use for individual students, to make rrogram decisions, and to measure satisfaction withschool as an outcome measure in and of itself. The scales include overall attitude towardschool as well P.S more conventio:<:.I aspects of learning environment. There appears to besome confusion as to whit the sct..le actually measures (see Buros' review, 9th edition).Vz.-7idation relied of correlations with other measures of student attitudes toward schoolrather than a.^:sociat,.13 student percepticas to other measures of school climate--such asstudent-ttach:,,, intetectians and percentage of teacher- talk. Also, reported correlationswith achievement are ;ow The author interprets this to mean the QSL measures aspects ofstudents other than achievement. Thus, the QSL might be a better measure of student?ttitude to school than educational climate as a predictor of achievement.
T!,v; author notes that subject specific attitudes can be obtained by revising the basic QSLiteii,s to refer *o specific subjects. No norms are available fn- this use. Further researchon tilt t.se of th? QSL is reported in The Quality of School life, Joyce L. Epstein (Ed.),Lexington Books, 1981.
36

Title of Instrument: School Climate Index (NS1-1981)
Author(s): Douglas S. Finlayson
Institution of Author(sl: University of Liverpool, Great Britain
Test jauripiiimanknildpa=1: The NS1 is intended as one part of an index of socialclimate for secondary schools. Pupil: provide their perceptions of certain aspects of thebehavior of their teachers and their peers in the school.
Psychosocial Dimensions (Expanded Moos' dimension categories):
RelationshipsEmotional ToneConcern
Personal Development System Maintenance physical EnvironmentTask Orientation Social Control
Author's Description of Subtests:
Task Orientation: The degree to which the pupils perceive their peers to haveaccepted the tasks set for them by the school and to be applying themselves tothese tasks.
Emotional Tone: The degree to which pupils perceive their peers derivingsocial and emotional satisfaction from participation in school activities.
Concern: The degree to which pupils perceive their teachers to be sensitive tothe individual social and emotional needs of students.
Social Control: The degree to which pupils perceive their teachers to imposetheir expectations on pupils and to be reauired to exercise power in an attemptto secure compliance.
Reliability: Based on the final sample of 978 studezs, internal consistency reliability ofsubscales range from .77 to .84. This is adequate for group profiling.
Validity: The NS1 is based on the work of Halpin and Croft who developed the OCDQ.The social climate of a secondary school is seen as the behavior of teachers, departmentheads and the principal with regard to social control and social/emotional needs. Fourbooklets were devised to assess this area--pupils' perceptions of the behavior of their peersand teachers and teachers' perceptions of the behavior of their colleagues, heads ofdepartments and principal. The NS1 form appears to be the pupil instrument.
Items were developed based on aspects of behavior that appeared to be related to studentoutcomes. Many items were developed from interviews with students and all werereviewed by teachers. Subscales were developed based on factor analysis of items usingseveral samples of students in Great Britain. The final sample consisted of 978 students inGr'de 12. The scales differentiated between schools. No work was done to assess therelationship of scores to actual behavior or student outcomes.
Deer (1980) revalidated the subscales on a sample of students in Australia and providesshortened versions of the scales.
37
Usability: The final instrument has 24 items which students rate on a five-point scale from"strongly agree" to "strongly disagree," and takes about 30 minute:, to give. Means for thefinal 978 grade 12 students in the final sample are provided for comparison. (But, thesedata are old, and represent only ane grade in Great Britain.) There is little help withinterpretation in the manual. Subseq'ient research using the instrument would need to beconsulted for additional help on interpretation. The booklets are not professionallypackaged--they appear to have been been developed mainly for research purposes.
Supplemental Materials: A manual includes development of the scales, test administration,scoring instructions, some help with interpretation, and an answer sheet.
Distribution/Availability: NFER, The Mere, Upton Park, Slough.
Comments: The teacher subscales seem to cover student perception of both teacherinstruction and interaction with students. The manual is hard to read.
Although we have examined only the student rating scale, we assume that the other threeinstruments were similarily developed. From later publications (Finlayson, 1973) thesubscales on the other instruments are:
Teacher Group Behavior Scales:
Teacher Interaction Scales:
Identification: Behavior which reflects work satisfaction and involvement withthe school.
Familiarity: Behavior indicative of staff willingness to establish and maintainclose, satisfying relationships with their colleagues.
Social Disintegration: Behavior indicative of disunity amongst the staff andwhich is reflected in fragmentation into 'cliques'.
Obstr:,:tion: Teachers' feelings that the school does not offer them sufficientsupp...rt with their work. References to equipment, clerical and timetablematters are included.
jeacher/Communav Interaction Scales:
Teacher Professional communication: Amount of contact the staff areperceived to have with other teachers in professional situations, e.g. meetings,visiting, inservii:e training, ttc.
Teacher/Commnity Communication: Amount of community contact the staffare perceived to have with people and organizations who would be importantfor individual pupils, e.g. parents, school welfare officers, etc.
Teacher/Parent Communication: Behavior indicative of the extent to which theschool actively seeks to give information about pupils and the school to parents.
38

Head of Department Behavior Scales:
problem Orientation: Behavior which actively seeks to move the organization,and to anticipate problems rather than deal with them only when circumstancesforce action.
Personal and Professional Concern for Staff: Behavior which shows awillingness to treat staff as human beings and to encourage their participationin the school and educational developments.
bureaucratic Orientation: Behavior which is highly directive towards juniorstaff and which limits 'feed-back' from them.
Friendliness: Behavior indicative of easy social relationships with othermembers of staff.
Head Behavior Scales:
Awareness: Behavior indicative of sensitivity to problems and awareness ofwhat is going on in the school.
Professional Colic= for Staff: Behavior indicative of interest in theprofessional development of the staff.
Personal Concern for Staff: Behavior which shows a willingness to treatmembers of staff as individuals and to become involved in their personalwelfare.
pureaucratic Orientation: Behavior which is highly directive towards juniorstaff and which limits 'feed-back' from them.
Openness: Behavior which reflects the head's willingness to encourage staffinvolvement in policy-making by seeking information a. d advice from them.
Friendliness: Behavior indicative of easy social relationships with othermembers of staff.
Finlayson (1973) also reports that the internal consistency reliabilities of all scales rangefrom .68 to .91 which seem adequate for group profiling. Finlayson (1973) providesadditional assistance with interpretation of results.
These scales have been used in a number of studies. There appears also to be anothercomparison instrument--the School Organinton Index. It seems to assess studentperceptions of opportunities for students t,. interact, be involved in decision making, degreeof control by teachers and teacher flexibilty in teaching.
39
4/

SCHOOL CLIMATE INSTRUMENTS
41

Title of Instrument: Effective School Battery (ESB-1981)
Author(s): Gary D. Gottfredson
Institution of Author(s): Center for Social Organization of Schools, the Johns HopkinsUniversity.
Test Description/Intended Purposes: To assess a variety of features of effective schoolsorder to determine how effective a school is and what features could be improved.
Psvchosocial Dimensions (Expanded Moos' dimension categories):
Relationships Personal Development System Maintenance
Teacher Scales:Race Relations Planning and ActionSmooth Student Influence
AdministrationMorale Grades as Sanctions
Student Scales:Respect for
Students
Author's Description of Subtests:
Teacher Scales:
Planning and ActionFairness of RulesClarity of RulesStudent Influence
in
Physical Environment
ResourcesParent /Community
InvolvementSafety
Safety
Safety: How safe teachers report the school environment to be.
Morale: The degree of enthusiasm of a school's faculty and faculty confidencein the school.
Planning and Action: Teacher reports of the degree to which the school takesan experimenting or innovative approach to planning school improvements andis open to confront rather than ignore emerging problems.
Smooth Administration: How teachers perceive the school adminis-tration,getting the help they need to do their jobs when they need it, administratorsare supportive of teachers, administrators reward staff for doing a good job,and degree of conflict or tension between teaching staff and administrators.
Resources: Adequate instructional supplies and other resources.
Race Relations: How well different ethnic groups get along.
parent/Community Involvement Indicates the degree to which the school usescommunity resources in its programs.
Student Influence: The extent to which students participate in school decisions.
Avoidance of the Use of Grades a a Sanction: The extent to which teachersavoid lowering grades in response to student misconduct.
43

Student Scal,F.:
Safety: How safe students report the school environment to be.
Respect for Students: How students feel they are treated in the school.
Planning. and Action: The degree to wh3ch the school undertakes efforts to planand implement school improvement.
Fairness of Rules: Whether students believe the school's rules are equitable andfairly administered.
Clarity of Rules: Whether students know what the school rules are and whatthe consequences are for rule violation.
Student Influence: The extent to which students are able to influence mattersof concern to them.
Reliability: Requested
Validity: The instrument is based on a review of the literature on characteristics ofeffective schools and ongoing research at the Center listed in (3) above. No otherinformation is provided.
Usability: There are both student and teacher forms to gather perceptions about the actualenvironment. There are 118 multiple choice, true/false, and three-point Likert items onthe student form. There are 115 multiple choice, true/false, and Likert items on theteacher form. It is attractively packaged. (More information ;s requested.)
Supplemental Materials: The score report includes profile graphs of percentile rankings,and averages with error bands. Assessing Effectial Schools is a booklet coveringcharacteristics of effective schools in more detail.
Distribution/Availability: Psychological Assessment Rescurces, Inc., P.O. Do. 96. Odessa,FL 33556 (1-8o0-331-TEST).
Comments: The instrument includes a callectiun of information about students and ,aachersas well as information on psychcsocial climate and other topics fornd in the effectiveschools literature, e.g., relationship with parents and staff develop rent. Thus, it has abroader definition of school climate than other instruments reviewed.
1). In addition to the subtests listed, the ESB also collects ot' Jer attitudinal information which can be used toWei at the affective effect of school. The student scales are Positive Peer Associations, Social Intergration,
R.tschment to School, Involvement, Educational Expectation, School Effort, Belief in Rules, Avoidance ofPunishment, and School Rewards The teacher descriptive scales are Pro-Integration Attitude, Job Satisfaction,Professional Development, Clusroom Orderliness, Nonainhoritarian Attitude, and Personal Security.
44

Title of Instrument: The High School Characteristics Index (P 21);The Elementary and Secondary School Index (ESI)
Author(s): George G. Stern
jnstitution of Author(s): Syracuse University
Test Dscriotion/Intended Purposes: The instruments ale intended to measure thepsychological characteristics of the academic environments of elementary and secondaryschools. The HSCI is designed for grades 9-12 and the ESI is designed for grades 4-12.
Psychosocial Dimensions (Expanded Moos' dimension categories):
Relationships. Personal Development SYsternMaintenance Physical EnvironmentGroup Social Life Intellec_ual Climate Orderliness/ControlPeer Group Personal Dignity/
Dominance SupportivenessAchievement StandardsExpressiveness
Author's Description of Subtests:
intellectual Cbiaate: Qualities of a staff and plant specifically devoted toscholarly activities in the humanities, arts and social sciences.
Expressiveness: Aesthetic awareness and emotional participation; opportunitiesoffered to the student for the development of leadership potential and self-assurance.
Group Social Life: An environment that is fun-loving, friendly and activelyoutgoing.
Personal DiRriin,ZSupportiven_ess: Encouragement of autonomy among students,and allowance for expression of dependency and defensiveness.
Achievement Standards: High standards for achievement.
Orderliness/Control: Administrative structure and regulatory orderliness.
Peer Ormp Dominance: Value of peer group relations.
EgliPhility: T ;SCI was given to 947 high school students in several U.S. cities. Internalcony ,tency Tell, :ties ranged from .75 to .91. This is adequate for profiling individuals atthe subscore level. reliabilities for the ESI range from .71 to .81. This is a littlelow for profiling individual students.
Validity: Based on the nc.g.is press paradigm of Murray (1938). Based on 947 high schoolstudents, each subscale differentiated between schools. The seven sca'ies were deveiopedbased on a factor analysis of scores on an original set of 30 elements--elements thatgrouped together were placed on the same subscale. A factor analysis based on 6,733 HSCIcases was used to cross-check the 3ubsmles on the instrument and was used to develop theESI. There is nu information on the relationship of scores to achievement.
45

Usability: The HSCI contains 300 true/false items and takes approximately 40-50 minutesto administer. The ESI is a short form of the HSCI, has 61 items, and requires about 15minutes to complete. Both forms have a separate answer sheet. The instruments areattractively packaged although the manual is not. There is a little help with interpretationin terms of average -cores for various groups and what high scores on each subscale mean.Scorir,g is Mailable from the source listec: in Availability below. Hand scoring appearsdifficult (ever, with scoring overlays).
Supplemental NUteriall: Separate answer sheet. The manual contains a brief description ofcontent, statistical properties, answer key, scoring worksheet, and average scores for variousgroups.
is T.; i raj_jwisithAliktiaty: Evaluation and Res arch Associates, P.O. Box 6503, Teall Station,Syracuse, New York 13217, (315)685-5757.
Comments: This is part of a series of instruments developed by Stern (and others). Theinstruments include those which assess both the needs (Stern Activities Index) and the press(OCI, CEI, HSCI, ESI, L 1) in Murray's needs-press paradigm. Needs refer to individualsand press refers to demands of the environment. The scales are set up so that press scalescan be directly related to the needs scales
In general, materials accompanying the instruments are skimpy. The series of instrumentsof which the HSCI and ESI are a part is intriguing, but without more information theywould be difficult to use. A review in Anderson (1982) appears supportive of theinstruments and cites a little research using them. More information about the HSCI isavailable in Stern (1970).
46

Title of Instrument: Learning Climate Inventory (LCI-1976)
Author(s): John R. Hoyle
Institution r.(1): Texas A & M University.
Test Description/Intended Purposes: To measure teachers' perceptions of five dimensions of schoolenvironment at the elementary or secondary school level.
Psychosocial Dimensions (Expanded Moos'
RelationshipsLeadership
dimension categories):
mg= System Mainframe physical EnvironmentEvaluation
Personal DeveloFreedomComplianceCooperation
Author's De -ription of Subtests:
Leadership: The extent to which the teachers perceive the leadership behaviors of theadministrators as positive and helpful.
Fr m: This extent to which teachers feel free to experiment and determine their owninstructional activities in their classrooms. (5 items).Evaluation: The extent to which teachers and students are involved in teacher andadministrator evaluation (3 items).Compliance: The extent to which teachers feel the pressure to conform to the rules ofthe system (3 items).Cooperation: The extent to which teachers are supported in their efforts to team-teachand use resource people (3 items).
Reliability: Based on six samples of teachers in the U.S. (of 134 to 1,000 teachers), internalconsistency reliabilities ranged from .50 to .75. Test-retest reliabilities ranged from .75 to .92.Subscale reliabilities are a little low for individual profiling.
Validity: Tire information provided with the instrument indicates that the 20 items were allocatedto subscales based on a factor analysis. More information on this study is available in Chapter 2 ofHoyle et al. (1985), pp. 22-24.
Usability: The instrument has 20 items with a seven-point scale ranging from "Never" to "Always."Except for two items, a response of seven indicates an open environment. The LCI is untimed andrequires about 15 minutes to give. There is a little help in the manual with profiling andcomparison between teacher and principal ratings. The instrument is available in two different,attractively packaged, formats.
apliamelliaMaierials: Three-page summary of development, scoring and research stud:es usingthe La
Distribution/Availability: Climate Research Associates, 1308 Todd Trail, College Station, TX77840.
Comments: The LCI appears to have been originally developed for use in staff development andlater for r"search. The information on administration lnd use sent with the instrument is brier butusers are encouraged to contact the author for more information.
47

Title of Instrument: Organizational Climate Description Questionnaire (OCDQ -1963)
Author(s): A ndrew W. Halpin and Don B. Croft
Institption of Author(s): Halpin is retired and Don Croft is at New Mexico StateUniversity.
Test Description/Intended Purposes: The OCDQ was designed for administration to facultyand principals elementary or secondary schools to assess school climate (morespecifically, organizational climate). It focuses on perceived social interactions betweenteachers and between the principal and teachers.
Psychosocial Dimensions (Expanded Moos' dimension categories):
Relationships Personal veloDment System Maintenance Physical EnvironmentEspirit Trust Production EmphasisDisengagement Hindrance AloofnessConsiderationIntimacy
Author's Description of Subtests:
Teacher's Behavior.
Disengagement: How well the teachers work together.
Hindrance: Extent that teachers feel that their principal burdens them withroutine duties, committee demands, and other requirements construed asunnecessary work.
Morale--whether teachers' social needs are being satisfied, and whetherthey have a sense of accomplishment in their job.
Intimacy: The degree of teacher enjoyment of friendly, social relations witheach other. Social needs satisfaction.
Principal's Behavior:
Aloofness: Refers to the formal and impersonLl behavior of the principal.
roduction Emphasis: The degree to which the behavior of the principal ischaracterized by close supervision of the staff. Highly directive.
Trust: Principal behavior marked not by close supervision of the teacher, butby the attempt to motivate the teachers through the example which he or shepersonally sets.
Consideration: The principal's inclination to treat the teachers humanly.
Reliability: Split half reliabilities (internal consistency) range from .26 to .84 (with amedian of .64). Several reviewers have noted that, given the extensive use of theinstrument, there are relatively few reliability estimates available
48r,

Validity: The initial pool of items was developed from analysis of critical incidents,interviews and other questionnaires. Final items were selected on the basic of pilot testing.The e:?ht subtests were developed by factor analysis--items that clustered were E.ssigned toa common subscale.
The author assumes that the "open" end of the climate continuum is best. Subsequentstudies as reviewed by several recent authors show an inconsistent relationship between theOCDQ and student achievement.
Usability: The final version of the OCDQ contains 64 items. The respondents rate eachitem aiong a four-point scale ranging from rarely occurs to very frequently occurs. TheOCDQ is untimed but takes about 20 minutes to administer. Scoring is available fromHaipin at the address noted under availability or from Croft, College of Education, NewMexico State University, Las Cruces, New Mexico 88001 (505-646-2004). Responseprofiles can be used to classify the school into six climate types: open, autonomcus,controlled, familiar, paternal and closed. (However, several reviewers of the OCDQ findlittle subsequent research which supports these profile types).
$upolemental Materials: No information
Distribution/Availability: Andrew Hayes, Department of Educational Design, University ofNorth Carolina-Wilmington, 601 South College Road, Wilmington, North Carolina 28403.Also in Halpin, A.W. Theory and Research in Administration. New York: The MacmillanCompany, 1966. Permission for use must come from the author because the instrument hasa copyright.
Comments: The OCDQ is probably the most widely used instrument measuring school levelenvironment Thomas (1976) has pointed out that the OCDQ has been used over 200 timesin at least eight different countries. Despite several inadequacies that have been noted byrecent researchers, it has promoted a broad-based interest in school climate (Andersen,1982). In general, the OCDQ has appeared to be useful in describing and comparing schoolclimates. However, several reviewers feel there is little support for the six climate typesgenerated by profiling schools using the eight subtests. They also note the inconsistentrelationships with student outcomes (affective or achievement).
49
Title of Instrument: Organizational Climate Index (OCI)
Author(s): George G. Stern and Carl R. Steinhoff
Institution of Author(s): Syracuse University
Test Description/Intended Purposes: The OCI is intended to characterize the psychologicalclimate of a wide variety of institutional work settings as perceived by the staff. Thedifferent institutional types tend to elicit slightly different factor structures for thesubscales.
Psvchosocial Dimensions
RelationshipsClosenessGroup Life
Reliability: Requested
(Expanded Moos' dimension categories):
Personal Development System Maintenance Physical EnvironmentAchievement Standards Orderliness
Impulse ControlPersonal DignityIntellectual Climate
Validity: The OCI is based on the needs-press paradigm of Murray (1938). The originalstudy sample consisted of 931 teachers rind administrators in 43 schools in a single schooldistrict. The subscales were based on 2 factor analysis using this group. The subscalesdiffeientiated between schools. There was no relationship between the subscales andteacher turnover or absenteeism (Stern, 1970, p. 282). Some subscale scores relate tostudent absenteeism and achievement (p. 285).
Usability: The OCI long form contains 300 true/false items. It generally requires 40 to 50.iiinutes for administration. The short form contains 80 items and can be administered inless ::tan 20 minutes. From the materials obtained so far, help with interpretation isskimpy.
Supplemental Materials: A manual has been requested, but has not yet been received.
Distribution/Availability: 'evaluation and Research Associates, Inc., P.O. Box 6503, TeallStation, Syracuse, New Y ., 13217, (315)685-5757. The instrument can 1.'11
reconstructed from Stern (1970).
Comments: This is part of a series of instruments developed by Stern (and others). Theinstruments include those which assess both the needs (Stern Activities Index) and the pre;(OCI, CEI, HSCI, ESI, CCI) in Murray's needs-press paradigm. Needs refer to individualsand press refers to demands of the environment. The scales are set up so that press scalescan be directly related to the needs scales. Although this is an instrument which can beused in a variety of settings, both the long and short forms have been used in the schools.
More information is available in Stern (1970). There needs to be more informationavailable to the user on interpretation and use of results.
50
,fr 0

Title of Instrument: Parent Opinion Inventory (P01-1981)
Author(s). National Study of School Evaluation
jnstitution of Author(sl: National Study of School Evaluation
Test Description/Intended Purposes: To assess parents' attitudes in reference to their school and itsprograms.
Psvchosocial Dimensions (Expanded loos' dimension categories):
Relationships personal Development System Maintenance Phvsical EnvironmentGeneral Psychological Parent Intra-School
Climate Involvement ProblemsIntra-Student Innovative
Body Relation Programs
Author's Description of Subtestsi None is provided. Based on an examination of test content, thesubscales appear to cover:
jntra-Student Body, Relationships (2 items): Relationships between students.
School Information Services (2 items): Adequacy of information provided to parents.Pannt Inyolvement (3 items): Degree of parent involvement in decision making.Tducational Objectives (11 items): How well the school is preparing students in variousareas.
Intraschool Problems (8 items): Safe and orderly environment.Innovative Programs (2 items): There is ongoing innovation.
School Program Factors (7 items): Instructional program is adequate.
Student Activities (4 items): Adequacy of activities for students.
Support Services (7 items): Adequacy of support and auxiliary services.
General Psychological Climate (7 items): Moral of teachers and students, relationshipsbetween students and others.
Reliability: Based on a sample of 1,566 teachers, the internal consistency reliabilities of thesubscales (3 or more items) ranged from .50 to .80. (Some subscales have only three items.) Thisis too low for individual profiling on subscales.
Validity: Other parent questionnaires were examined for content. Items were reviewed by n panelof experts. Items were field tested. Final items were selected based on traditional item statistics.No other information is provided.
Usability: There are 53 multiple choice and five open-ended questions.
Supplemental Materials: A manual has directions for administration and scoring.
Distribution/Availability: National Study of School Evaluation, 5201 Leesburg Pike, Falls Church,VI 22041.
Comments: There are three companion instruments--SOI, TOI and POI. There is no rationale forthe construction of the scales. The items put together on the same subscale seem to be veryheterogeneous. This one seems marginal in terms of content related to 1sychosocial climate.
515

Title of Instrument: School Learning Climate Assessment Instrument (SLCAI). (Nopublication date given).
Authoral: Wilbur Brookover, Lonnie McIntyre, John Schweitzer and Edward Slawski.
Institution of Author(s): Michigan State University; and Pontiac City Schools.
Test Description/Intended Purposes: The goal of this instrument is to validly measure thecharacteristics that distinguish between schools with higher levels of mastery of the basicobjectives and schools with low levels of such achievement.
Psychosocial Dimensions (Expanded Moo's dimension categories):
EslationshiDs Eersonal Development System Maintenance Physical EnvironmentEmphasis on Administrative Safe and Orderly
Achievement Leadership EnvironmentExpectations of Grouping
Students Use of Test DataTime for Instruction
Author's Description of Subttasi
Administrative Insir_uclienal_Leadershitx This factor measures behaviors ofprincipals in effective schools. It also measures how effective the teacherrewards systems are perceived (18 items).
Emphasis on Achievement or Commitment: This factor measures howcommitted the teachers are to academic achievement in their students (8 items).
Anorts and Evaluations of Students: This factor measures the teachersassessment of the academic ability of the students it; their school and theirexpectations of them.
Use of Test Data: This factor measures the extent that tests results are used tomodify instructional programs.
Safe and Orderly Environment: This factor measures the extent of positivefeelings that permeates the school and the physical condition of the school (10items).
Grouoinst for Instruction: This factor measures the heterogeneous groupiLpractices of the school (4 items).
Time for Instruction: This factor measures the attendance practices of teachersand students at the school (4 items). (The authors note that this scale is not avalid measure of time-on-task.)
ligabjlay: The author feels that it 4 impossible to calculate reliability on this type ofinstrument because of the significant changes that occur in school climate.
Validity: The instrument content was based on the effective schools literature. Theinstrument was pilot tested twice in order to identify those dimensions which distinguishedmost between low and high achieving schools.
52
r)

Usability. This instrument is designed for the professional school staff to use in assessingthe school learning climate. It has 60 questions with five-point likert-type resnonse scale.It takes approximately 25 minutes to complete. There are no norms. There at someguidelines for interpreting results. The instrument is not commercially packaged--it comesin typewritten format on 8-1/2 x 11" paper.
Supplemental Materials: A factor identification and scoring manual is included with theassessment instrument.
Pistribution/Availability: Urban Affairs Program, Michigan State University, 138 WestOwen Hall, East Lansing, Michigan 48824.
5 :i53

Title of Instrument: School Level Environment Questionnaire (SLEQ-1983)
Author(sI: John Rentoul and Barry J. Fraser
Institution of Author(s): St. Andrews Presbyterian Boys School, Christchurch, NewZealand; and Western Australian Institute of Technology, Bentley, Western Australia 6102(respectively).
Test Description/Intended Purposes: The SLEQ measures teachers' perceptions of eightpsychosocial dimensions of the environment of primary and/or secondary schools.
Psychosocial Dimensions (Expanded Moos' dimension categories):
RelationshipsAffiliationStudent
Supportiveness
PersonaLDeveloomentProfessLnal
InterestAchievement
Orientation
$vstem Maintenance physical EnvironmentFormalization Resource AdequacyCentralizationInnovativeness
A±uthoes Description of Subtests:
Affilizi:ion: The extent to which teachers can obta n assistance, advice andencour2' .!ment and are made to feel accepted by cL.....agues.Studer. Supportiveness: The extent to which there is good rapport betweenteachers and students and students behave in a responsible manner.Professional_ Interest: The extent to which teachers discuss professional matters,show interest in their work and seek further professional dr velopment.Achievement Orientations: The extent to which teachers value and expect highstudent achievement and how much competition is encouragcd among students.
Formalization: How teachers are expected to comply with set rules, guidelines,and procedures and are supervised to ensure rule compliance.Centralization: The degree to which decisions ere illacle by an individual or asmall group within the school.jnnovativeness: The degree to which the school is in favor of planned changeand experimentation and fosters classroom openness and individualization.Resource Adeauacv: The degree to which equipment, financial resources, andsupport personr.el are perceived as being suitable and adequate.
Reliability: Internal cot. istency reliability on a group of 83 teachers in A' cralia -angedfrom .70 to .91 for the various subscales. This was replicated with a subsequent sample of34 teauters. A later study of 106 teachers (Williamson et al, 1986) looked at both actualand preferred forms of the SLEQ. Internal consistency reliability ;or the actual formranged from .64 to .78 and for the preferred form from .63 to .81. These 7dliabilities are abit low for profiling individual teachers.
Validity: The test content is based on Moos' (1974) work on the dimensions of psychosocialenvironments. The authors report that they attempted to avoid some problems with otherinstruments by reviewing the school environment literature and having extensive teacherreviews to insure its relevance to the schools. They also attempted to have minimumoverlap with existing classroom climate instruments.
r, 4 54

The subscalkJ correlate moderately with each other suggesting that they measure differentbut slightly overlapping aspects of school environment.
Usability: The final version of th SLEQ contains 56 items with each of the eight scalesbeing assessed 1,y seven itemq. Each item is rated on a five-point scale with responsesranging from strongly agree to strongly disagree. Teachers respond to the survey. Thereare no norms available. The instrument was designed for research purposes and must bereproduced from one of the sources listed below. There is assistance with scoring but littlehelp with interpretation and use.
Supplemental Materials: Scoring key
Distribution /Availability: Barry J. Fraser, Western Australian Institute of Technology,Bentley, Western Australia 6102., Also available in Rentoul and Fraser (1983) andWilliamson, et al (1986). Williamson et al also contains both "actual" and "preferred" forms.
Comments: The SLEQ is a fairly new instrument developed as one of Fraser, et al's"package" of classroom and school environment Instruments. As such it has considerablepromise, but as yet it has not been used in much research and has not been subjected to agr!at deal of validity study--especially relationship to student outcomes. Being a researchtool it has not been packaged for easy interpretation and use in the schools.
55

Title of Instrument: Student Opinion Inventory (SOI-1981)
t!Ap_ioral: National Study of School Evaluation
Institution of Author(s): National Study of School Evaluation
Test Description/Intended Puroosej: The instrument is intendeci to assess student morale andattitude toward various aspects of the school and its program. It is intended for use in secondaryschools.
Psvcho_social Dimensions (Expanded Moos' dimension categories):
Relationships personal Development System Maintenance Physical EnvironmentStudent-Teacher Student-Curriculum/Student-Counselor InstructionStudent-Admin. Student ParticipationStudent-School
Author's Description of Subtests: None provided. 3ased on an examination of items, the subscalesseem to assess:
Student-Teacher: Clarity of task assignments and teacher encouragement and help.Student-Counselor: Amount of help provided by the counselor in various areas andgeneral satisfaction with this help.
Student-Administration: Degree of involvement in decision making, personalrelationship with administration and encouragement in school work.
Student-Curriculum/Instruction: Usefulness of content, how much is being learned,teaching methods.
Student Participation: Range of activities available to students.Student-School Image: General satisfaction with school.
Reliability: Internal consistency reliabilities (based on a sample, of 10,120 secondary students in 10stnes) for subscales range from .68 to .87 and the reliability for the total inst;ument is .93. Theseare good.
Validity: No theoreticai rationale for content is provided. items were pilot tested. Subscales onthe SOI were correlarA with scores on a semantic differential instrument designed by the authorsto assess the same aims. Correlations ranged from .34 to .59. This seems low. No otherinformation is provided.
Usability: There are 34 multiple choice and 12 open-ended items. The of -end questions can beexpanded by local users. Scoring must be done at the local level. There is AO time limit, but moststudents can finish both parts in 45 minutes. There are no norms. There is little assistance ithinterpretation. The instrument is attractively packaged.
Sum:den., .1 Materials: A manual containing a brief description of development of theinstrument, administration and scoring.
Distributionr..vailabilitv: National Study of School Evaluation, 5201 Leesburg Pike, Falls Church,VI 22041.
Comments- There are three companion ,nstrumentsSOI, TOI and POI. These is no rationale forthe construction of the scales. The items put together on the same subscale seem to be veryheterogeneous.
56

Title of Instrument: Teacher Opinion Inventory (T01-1981)
L. thor(sl: 'Iational Study of School Evaluation
Institution of Author(s): National Study of School Evaluation
Test Descrintion/Intended Ptirmses: To assess teacher opinion toward many facets of the school.
Psychosocial Dimensions (Expanded Moos' dimension categories):
Relationships Personal Development System Maintenance Physical Environm ntContent is too diverse within subscales for classification.
Author's Description of Subtests: None is provided. Based on an examination of items, thesubscales seem to assess:
Organintio_n and Administration: Involvement in decision-making, qualified inservice,faculty meetings, committee work, good relationship with ad, nistration.Curriculum and Instruction: Usefulness of content, how much kids are learning.relationships between t' chers and students, autonom y of teachers in instruction, workload, availability of activities for students, emphasis on various curriculum areas.
Student Discipline. Counseling, Advisement: Extent of student invL vement in decision-making, consistency of discipline, relationships between students and others.
School/Community Relations: Parent knowledge of school activities and relationshipbetween parents and the school.
Job Satisfaction: Morale.
Reliapility: Based on a sample of 1,435 teachers, the internal consistency reliability of the totalscore is .91. No reliabilities are provided for subscales.
Validity: A panel of experts was used to develop an initial set of items they considered to be validand useful. The items were field tested and the final items selected based on traditional itemstatistics. No other information is provided.
Usability: There are 64 multiple choice and eight open-ended items. There is a table relatingitems on the SOI, TOI and POI so that the opinions of the three groups on the same topic can becompared. It is untimed and no estimate of administration time is provided. There are no normsand no assistance with interpretation and use. The instrument is attractively packaged.
Supplemental Materials: A manual includes administration and scoring instructions.
Distribution/Availability. National Study of School Evaluation, 5201 Leesburg Pike, Falls Church,VI 22041.
Comments: There are three companion instrumentsSOL TOT qnd POI. There is no rationale forthe construction of the scales. The items put together on the same subscale seem to be veryheterogeneous.
57

Title of Instrument: Thinking About My School (TAMS -1985)
Author(sl: Joanne R. Whitmore
Institutior of Author(sl: Not Given
Igaiksccisijonantoldignaugx The TAMS is designed to measrre student perceptions of theschool environment and feelings about their school. It was designed for use in grades 4-6.
psychosocial Dimensions (Expanded Moos' dimension categories):
elationshios Personal Development System Maintenance physical EnvironmentSocial Work PowerTeachersLiking For School
Author's Description of Subtests*,
Power. The extent of student participation in decision making.&gig Pleasant relationships between students.Work: Extent of involvement in school work and attitude toward school work.
Teachers: Teacher-student relationships and teacher enjoyment of their job.Liking For School: General desire to be in school.
Miscellaneous: xhool rules, parents opinion of school, feeling of importance.
Reliability: Internal consistency reliability (based on the initial group of students on wham it wasused--no size given) for the total score was .92. The subscales ranged from .60 to .76. Subscalereliabilities are a little low to profile individual students.
Validity: The instrument was designed to assess several areas of interest in a particular schooldistrict in California. It was also intended to be simple in structure (one response format) andvocabulary. Statements for the inventory were taken from discussions with students on school life.Items were selected based on traditional item statistics. A factor analysis was used to confirm thescales. (A reference is provided for this information, but the data is not presented in the manual.)The manual states the scores on the TAMS are related to observed behavior and other self-reports.They also state that scores discrimmate between groups of students identified by teachers asdiffering in their attitude toward school. (Again, no concrete data is provided in the manual.) Noevidence is provided for rela.;onship *.() student cognitive outcomes.
There are 47 statements for which students respond on a four-point scale from "not atall" to "all the time? The instrument is untimed and takes about 30 minutes to give. Help oninterpretation consists mainly of profiling. There are no norms.
Supplemental Materials: A manual includes description of development of the instrument, scoringand some help with interpretation. A separate score summary sheet is provided.
Distribution/Availability: United Educational Services, Inc., P.O. Box 605, East Aurora, New York14052 (716)652-9131.
Comments: This seems to assess both student attitude toward school and student perceptions ofsome aspects of the psychosocial climate at school. It appears to have good technicalcharacteristics. It is not as comprehensive as other measures.
58r,

Title of Instrument: Work Environment Scale (WES-1974)
Author(s): Rudolf Moos
Institution of Author(sI: Social Ecology Laboratory, Department of Psychiatry, StanfordUniversity; and Veterans Administration Medical Center, Palo Alto, California.
lecaj2gscriotion/Intended Purposes: The WES comprises 10 subscales that measure thesocial environments of different kinds of work settings. When used in the schools itmeasures teacher involvement ani morale in the teaching environment.
Psychosocial Dimensions (Expanded Moos' dimension categories):
RelationshipsInvolvementPeer CohesionStaff Support
Personal DevelopmentAutonomyTask OrientationWork Pressure
Author's Description of Sift
System Maintenance physical EnvironmentClarity Physical ComfortControlInnovation
Involvement: The extent to which employees are concerned about andcommitted to their jobs.
Peer Cohesion: The extent to which employees are friendly and supportive ofone another.
Supervisor Suppor: The extent to which management is supportive ofemployees and encourages employees to be supportive of one another.
Autonomy: The extent to which employees are encouraged to be self-sufficientand to make their own decisions.
Task Orientation: The degree of emphasis on good planning, efficiency, andgetting the job done.
tiork_Pressure: The degree to which the press of work and time urgencydominate tLe lob milieu.
Clarity: The extent to which employees know what to expect in their dailyroutine and how explicitly rules and policies are communicated.
Control: The extent to which management uses rules and pressures to keepemployees under control.
jnnovation: The degree of emphasis on variety, change, and new approaches.
Physical Comfort The extent to which the physical surroundings contribute toa pleasant work environment.
Reliability: Reliability information was generated using the two samples described undervalidity. Internal consistency reliabilities ranged from .69 to .86 and test-retest reliabilitiesranged from .51 to .63 (after 12 months). These reliabilities are somewhat low forindividual teacher profiling.
Validity: This is part of Moos' Social Climate Scales series based on his work showing thata diverse number of social environments can be characterized using the same small set of
59

dimensions. Items were adapted from other Social Climate Scales and generated frominterviews with workers. Final items were selected for the Real Form using traditionalitem statistics and the ability of items tc' discriminate between work settings. The IdealForm was given to 348 people and the Expectations Form to 81. There is little evidence tosupport the subscale structure. There has been little work relating the WES to studentand/or staff/ organizational outcomes in the schools. There has been more use of the WESin other work settings.
Usability: There are three forms of the WES--the Real Form (Form R) measuresperceptions of existing work environments; the Ideal Form (Form I) measures therespondents' conc( 'tion of the ideal work environment; and the Expectations Form (FormE) measures the respondents' expectations about a prospective wok environment. Form Ris a 90-itei. , paper/pencil, true/false survey that takes approximately 20 minutes tocomplete.
Health care (N=1,607) and ratio station plus others (N=1,442) norms for Form R areavailable as well as means for Forms I and E of a subsample of those in the R norms.
Suggestions for interpretation involve profiling and comparisons of various groups.
Supplemental Materials: A 1986 technical manual is provided containing an overview ofthe concepts behind the WES along with test administration, scoring and suggestions foruse. Also available are a scoring overlay, separate answer sheet, profiling form andabstracts of research studies using the WES between 1979 and 1983.
Distribution /Availability: Consulting Psychologist Press, Inc., 577 College Avenue, PaloAlto, California 94206.
Comments: Although designed to assess the . ocial environments of industrial or workmilieus, this instrument has been used to measure the work environment of diverse kinds ofwork groups including the educational setting.
This instrument has potential for use in the schools but there is not mucn assistance withinterpretation and use of results in that setting.
60

OTHER EDUCATIONAL CLIMATE INSTRUMENTS
Bards ley, W. N. (1978). The Assessment of school environments. education Research &Perspectives, 4, 39-51.
This measures teacher perceptions of classroom and school environment. It was specificallydeveloped to differentiate between settings in terms of openness of education. The twosubscales are school organization and interpersonal-classroom. The scale can bereconstructed from the article cited.
Coughlan, R. J. (1970). Dimensions of teacher morale. American Educational ResearchJournal, 7, 221-235.
This instrument was developed to measure teachers' morale and satisfaction with the workenvironment. The instrument was developed through several field trials using factoranalysis. The final instrument has 14 subscales--administrative practices, professionalworkload, nonprofessional workload, materials and equipment, buildings and facilit'es,educational effectiveness, evaluation of students, school/community relations, voice ineducational programs, performance and development, and financial incentives. It has beenused in a number of studies in conjunction with the LEI and MSI (Anderson, 1982). Theinstrument can be reconstructed from the source given above.
Fox, R. S. et al. (1974). $chool climate improvement: A _challenge to the schooladministrator. Bloomington, IN: Phi Delta Kappa.
This survey can be completed by students, teachers, parents, other staff, and administrators.There are 130 statements on respect, trust, morale, opportunity for input, cohesiveness,school renewal, instruction, rewards, how decisions are made and resources Each statementis rated twice--what is and what should be.
Gardner, P. L., & Taylor, S. M. (1980). A transmission-interpretation scale. BritishJournal of Educational Psycho logv, 51, 186-187.
The instrument was designed to measure student perceptions of teacher's verbal behaviorregarding how teachers view learners (transmission v. interpretation). The instrument has20, five-point L. -rt items and was developed through reviews by experts and field trial.
Ka lis, M. C. (1980, April). Teaching experience: Its effect on school climate, teachermorale. 'VASS!' Bulletin.
Sixteen statements (rated strongly agree to strongly disagree) based on review of literaturedesigned to cover attitudes of teachers toward the principal, faculty, administration andadministrative duties.
61

N1cDill, E. L., and Rigsby, L. C. (1973). Structure and num:Ise in secondary schools: Theacademic Impact of_educational climates. Baltimore, MD: The Johns Hopkins UniversityPress.
The authors devised three questionnaires--student, teacher and principal to use in a largestudy of the relationship between climate and studnt outcomes and the dimensions ofclimate in the schools. The instruments gather both perceptions of climate and self reportof population characteristics. The surveys are long, and were designed for researchpurposes. As an example, of how this would make use difficult in the schools, the authorsanalyzed data to delineate six climate dimensions, but the authors never detail specificallywhich items on the surveys contribute to each of these dimensions. Although well done,this scale would not be useful fo: self-evaluation.
Owens, L., & Straton, R. G. (1980). The development of a cooperative, competitive, andIndividualized learning preference scale for students. British Journal of EducationalPsychology, 511, 147-161.
The authors report on the development of the Learning Pre,erene_kale for Students--a42-item survey eliciting student preferences for working cooperatively, competively orindividually. The instrument was developed through two field trials and interviews withstudents. The scale can be reconstructed from the source given above.
Stern, V. (1974). The School Environment Inventory. ERIC ED 102 139.
V. 'nstrument was developed as part of the Child Behavior Observation System. It wasdesibg.ed to measure five dimensions--curriculum, teaching mode, teacher organization,teacher-student relationship, and physical environment. The document has only the scale- -there is no documentation of development or use. The instrument is interesting in that itappears to be intended for outside observation of the classroom. Each item has statedcriteria by which to judge t:.e quality of the environment. (But, no rationale is given forthis choice of items or for the relevance of each criterion.)
The len, H. A. (1981). The classroom society. London: Com-Helm (p. 86).
The author used a 24-item scale to assess student perceptions of the stimulation andusefulness of classroom content. The three subscales are: Authenticity (the quality ofactivity which facilitates the search for "who am I?"); Legitimacy (what set of agreements,having what sort of authority, provide the justification for activities); and Productivity (theextent of individual and group development). The scale can be reconstructed from thebook above.
G262

HIGHER EDUCATION CLIMATE INSTRUMENTS
Astin, A. W., & Holland, J. L. (1961). Environmental assessment technique: A way tomeasure college environments. Journal of Educational Psychology, 11, 308-316.
Designed for the college environment, this instrument examine, climate by looking atobservable features of the college and students--average intelligent level of student body,size of student body, and six personal value orientations of the students.
Stern, George G. The college characteristic_Index. Syracuse, New York: Evaluation andResearch Associates.
The College Characteristics Index (CO) is part of the Stern series including the HSCI andCEI. It is a measure of the perceived press found in college environments. As a measureof college climate, it is based on items referring to curriculum, teaching and classroomactivities, rules, regulations, policies, student organizations, activities, interests, features ofthe campus, services and facilities, and to relationships among students and faculty. The300 CCI items have been arranged in a long form to reflect press corresponding to the 30need scales found in the Activities Index (AI) by the same author. In addition, there is ashort form which has 92 items. The 300 item form requires 40-50 minutes foradministration while the short form can be completed in about 15-20 minutes. A "True" or"False" response is required for each item.
The 30 basic press scales can only be obtained by using the 300 item form. Fo'irteen factorand area scores can be derived from either form. These scores are: Aspiration Level,Intellectual Climate, Student Dignity, Academic Climate, Academic Achievement, SelfExpression, Group Life, Academic Organization, Social Form, Play-Work, VocationalClimate, Intellectual Climate, Non-Intellectual Climate, Impulse Control.
Treagust, D. F., & Fraser, B. J. (1986). Ihtssgisys_usLuniversity classroomenvironment inventory (CUCEI). Bentley, Western Australia: Western Australian Instituteof Technology. Also Validation and application of the college_and university environmentinventory (CUCEI). Paper presented at the Annual Meeting of the American EducationalResearch Association.
The CUCEI assesses the student's and/or instructor's perceptions of the following sevenpsychosocial dimensions of actual or preferred classroom environment personalization,student cohesiveness, satisfaction, involvement, task orientation, innovation, andindividualization.
63
1;3

NATURALIST:C, CASE STUDY AND OBSERVATIONAL APPROACHES
Cusick, P. A. (1973). inside high school: The students' world. New York: Holt, Rinehart& Winston.
Jackson, P. W. (1968). Life in classrooms. New York: Holt, Rinehart & Winston.
Rutter, M., Maughan, B., Mortimore, P., Ouston, J., & Smith, A. (1979). Fifteen thousandhours: Secondary schools and their effects on children. Cambridge, MA: HarvardUniversity Press.
Stack, R. E., & Easley, J. A. Jr. (1978). Case studies in science education. Urna.a, IL:University of Illinois.
CLASSROOM INTERACTION ANALYSIS
Amidon, E. J., & Hough, J. (1967). interaction analysis: Theory, research and aonlication.Reading, MA: Addison-Wesley.
Dunkin, M. J., & Biddle, B. (1974). The studs' of teachers. N.rw York: Holt, Rinehart &Winston.
64
k; 1

APPENDIX B
Summary Table of Inc- rument Characteristics

CLASSROOM ENVIRONMENT INSTRUMENTS
Summary Table of Instrument Characteristics
Instrument
Psycho-socialDimen-sions* Grades
WhoResponds
No. No.Forms Levels
No.Items Item Types Ad Time
Class ActivitiesQuestionnaire
1,2,3 6-12 StudentsTeachers
1 1 30 Structured;open-ended
20 min.
(1982)
Classroom 1,2**, 5-12 Students 1 1 300 T/F 40 min.Environment 3Index (1975)
Classroom 1,2, 7-12 Students 1 90 T/F 20-30Environment 3** min.Scale (1974)
Elementary School I**, 3-5 Students 1 1 42 T/F NotEnvironment 2,4 providedSurvey (1967)
IndividualizedClassroom Environ.
1,2,3 7-12 StudentsTeachers
1 1 50 Likert 30-60min.
Questionnaire(1979)
Learning 1445 7-12 Students 1 1 105 Li: zrt 40-55Environment 2**, min.Inventory (1982) 3**,4
My Class 1,2 3-7 Students 1 1 38 Y/NInventory (1982)
The Quality ofSchool LifeScale (1978)
1,2 4-12 Students 1 1 27 T/F,M/C.,Likert
20 min.
School Climate 1 2,1 9-12 Students 1.% A
1.41%.C11 30 min.Index (1981)
1. Relationships2. Personal Development3. Systems Maintenance
4 Physical Environment
" Emphasized
U

Scorini NormsOtherInterp.
Re lia-bility Validity
Hand,machine
Fair Some Good Some
Hand,machine
Fair None Good
Hand Fair Some ** Fair-Good
Exten-sive
None Some None Some
Hand Fair Some+ Fair- Some+Good
Hand Fair Some Fair-Good
Exten-sive
Hand Fair None Fair- SomeGood
Hand Fair Some Good Some+
Hand Fair Snmp** Conti cnrna
Comments Availability
Compares studentto teacherperceptions.
Creativity Learning Press,Box 320, Mansfield,Centers CT 06250
Hand, scoring isdifficult. Partof a series ofinstruments by Stem.
Evaluatien and ResearchAssociates, P.O. Box 6503,Teall Station, Syracuse,
Solicits views ofactual and idealenvironment. Alsohas short form andteacher form.
Consulting PsychologistsPress, 577 College Avenue,Palo Alto, CA 94306
There is also aparallel teacherform zvailable.
David Sadker, School ofEducation, The AmericanUniversity, Wash. DC 20016
Solicits views ofactual and idealenvironment rela-ted to individual-ized classrooms.
Western Australian Instit.of Technology, Bentley,Western Australia 6102.ERIC ED 228 296.
Same as above
Simplifiedversion of CEI.
Same as above
May be more ameasure of attitudetoward school thanclassroom climate.
Rivers::e Publishing Co.8420 Bryn Mawr Avenue,Chicago, IL 60631
Part cf n pachegeof .acher,principal andcommunity scales.
10 D "T"L --_A 4...s%, 111C IVIG1G,
Upton Park, Slough
Must b. jug for in research literature.

SCHOOL ENVIRONMENT INSTRUMENTS
Summary Table of Instrument Characteristics
Psycho-socialDimen- Who No. No.
Instrument sions Grades Responds Forms Levels
Effective School 1,3*,4 Students 1 1
Battery (1981) Teachers
High School 1,2,3 9-12 Students 1 1
CharacteristicsIndex
Learning Climate 1,2,3*Inventory (1976)
Organizational 1,2,3ClimateDescriptionQuestionnaire
Organizational 1,2,3Climate Index
Parent Opinion 1,3,4Inventory (1981)
School Learning 2,3 *,4Climate Assess-ment Instrument
K-12 Teachers 1 1
K-12 Teachers 11
Principals
K -12 All Staff 1 1
K -12 Parents 1 1
K-12 All Staff 1 1
1. Relationships
2 Persona! Development
3. Systems Maintenance
4. Physical Environment
" Emphasited
No.Items Item Types Ad Time
118 T/F, M.C.,Liken
300 T/F 40-50min.
20 Likert 15 min.
r,4 Likert 20 min.
300 T/F 40-50min.
58 M.C.Open-ended
60 Likert 25 min.
GS

OtherScoring Norms Interp.
Hand, None Nonemachine
Hand, Fair Somemachine
Relia-bility Validity Comments Availability
None None
Good- Someexcel-lent
Hand None Some Fair- SomeGood
Hand,rachine
None Some Poor Some
Hand None None None Some
Hand None None Poor-Fair
Psychological AssessmentResources, Inc., P.O. Box98, Odessa, FL 33556
A companion instru-ment is the Elemen-tary and SecondarySchool Index forgrades 4-12. Partof a series of instru-ments developed byStern. Hand scoringmay be difficult.
Evaluation and ResearchAssociates, P.O. Box 6503,Teall Station,Syracuse, NY 13217
Climate Research Associates1308 Tood TrailCollege Station, TX 77840
Designed ft_r broadvariety of settings,but has been used inthe schools.
Andrew Hayes, Dec of EducDesign, U of N. Carolina -Wilmington, 601 S. CollegeRoad, Wilmington, NC 28403
Designed for a broadvariety of settings, Associates, Inc., P.O. Boxbut has been used in 6503, Tell Station,the schools. Part of Syracuse, NY 13217a series by Stern.Has a short form.
Some Marginal in terms ofcontent related topsychosocial climate.Part of a series- -POI, SOI, TOI.
National Study of SchoolEvaluation,5201 Leesburg Pike,Falls Church, VI 22041
Hand None Some None Some Urban Affairs Program,Michigan State University,138 W. Owen Hall,East Langsing, MI 48824
*** Must be dug for in research literature
t:9

IIMMM.M.7SCHOOL ENVIRONMENT INSTRUMENTS
Summary Table of Instrument Characteristics
Instrument
Psycho-socialDimen-sions* Grades
WhoResponds
No. No.Forms Levels
No.Items Item Types Ad Time
School Level 1,2,3,4 K-12 Teachers 1 1 56 LikertEnvironment (1983)Questionnaire 1
Student OpinionInventory (981)
1**,2 9-12 Students 1 1 34 M.C.open-ended
45 min.
Teacher OpinionInventory (1981)
1,2,3 K-12 Teachers 1 1 64 M.C.open-ended
Thinking About 1,2 4-6 Students 1 1 47 Likert 30 min.My School (1985)
Work Environment 1,2,3 K-12 All staff 1 1 90 T/F 20 min.Scale (1974)
Norms (Value judgement implied)
None No rormative information is provided.Fair Has some standards of comparison, e.g. means of research sample, decile norms or item
statistics.Good Has norms based on a good sized sample.Excellent Has norms based on a national sample, item statistics, means and standard deviations o
normative sample.
Other Interpretation (No value judgement as to i!ie quality of the assistance is implied)
St
none No help with interpretation.Some Has some help with interpretating scores, e.g. what the various scores mean.Some+ Has information on what the various scores mean and some help with use in instructioExtensive Has extensive information on what the scores mean and how to use them in instruction
1. Relationships2. Personal Development
3. Systems Maintenance4. Physical Environment
Emphasised

Other Relia-Scoring Norms Interp. bility Validity Comments Availability
Hand None None Fair- Some Western Australian Instit.Good of Technology, Bentley,
Western Australia 6102
Hand None None Good- Some Part of a series-- National Study of SchoolExcel- POI, SOL TOI E . aluation (address above)lent
Hand None None Good- Some Part of a series-- National Stdy of SchoolExcel- POI, SOI, TOI Evaluation,lent 5201 Leesburg Pike,
Falls Church, VI 22041
Hand None Some Good Some United Educational ServicesInc., P.O. Box 605,East Aurora, NY 14052
Hand Fair Some Fair- Some Designed for a broadGood variety cf settings, Press, Inc.,
but has been used in 577 College Avenuethe schools. Palo Alto, CA 94306
Reliability (Value judgement implied)
None orovided No information was found.Poor All r'' 'ow .70Fair ,cast one reported r is greater than .70Good Total r is greater than .85; most subtests have r greater than .75Excellent Several kinds reported; total score above .90; most subtest scores above .80
;'alidity (This describes quantity of informatior available, not the extent to which the instrume..t is valid.)
No information No information on validity is reported.Some information At least one activity related to validation is reported.Some+ information Validity .vas examined in several different ways. The relationship of
environment (as measured by the instrument) to student outcomes was explored.Kxtensive information There was special effort to ensure that alternative explanations for results wer
ruled out and the relationship of environment (as measured by the instrument) to studeoutcomes was explored. There is a large research base for the instrument.
". Must be dug for in research literature.

APPENDIX C
Resources
73

RESOURCES
American Educational Research Association fAERAl_Snecial Interest Grout) (SIG)
This group on learning environments is chaired (1986-87) by Barry Fraser, WesternAustralian Institute of Technology. The SIG meets each year at the AERA annual nationalconvention. The SIG publishes a newsletter, edited by Chad El let of Louisiana StateUniversity.
Anderson, C. S. (1982). The search for school climate: A review of the research. Reviewof Educational Research, 51, 368-420.
This article is an analysis of the school climate literature based on over 200 references.Anderson reviews the history of school climate research, discusses how differences indefinition lead to differences in results, and presents various problems when attempting tolook at anything as complex as climate. The article discusses some school and classroomclimate measurement instruments and s,..mmarizes certain school characteristics that appearto be relate( to student outcomes.
Chalez, R. C. (1984). The use of high Inference measures to study classroom climates: Areview. Re Am of Educational Research, 54, 237-261.
This article reviews the history of measurement of school and classroom climate. Includedis a selection of research results using various assessment instruments.
Cognetta, R. A., Malvetti, A. C., & Wilson, C. F. (1985). Measuring school climate.Sacramento, CA: California Evaluation Improvement Project.
This school climate evaluation guide provides a process by which personnel can developtheir own instrument to measure school climate. This publication is an ins:uctionalinstrument in the form of a workbook designed to assist educators in planning andmonitoring the procedures, techn les; and methods necessary for an effective schoolclimate evaluation. Included are sample instruments. These instruments are accompaniedby answer sheets and scoring guides, but arc presented without evidence of reliability orvalidity. A copy of this publication can be obtained from the California State Departmentof Education, Bill Honig, Superintendent of Public Instruction, Sacramento, California.
Fox, R., Luszki, M. B. & Schmuck, R. (1966). Platznosinn, classroom learningenvironments. Chicago, IL: Science Research Associates, Inc.
Although pnhlished 20 yens ago, this little monograph has some useful ieteas on variousways to assess classroom en ironments. Included are a variety of paper and pencil andob4ervation instruments and procedures which can be used to assess social relations in theclassroom, peer-group expectati ms, pupil-teacher interaction, t_ utside influences onclassroom learning, parental influences, and student self-concept. Although no theoreticalrationale or technics' information is presented on any of these r ocedures, the authorsspend a good deal of time discussing how they can be used in the classroom (including casestudies of use). There are no arguments, except intuition, that suggestions for improver entsuggested in the monograph actually affect student ffective and cognitive outcomes.
75
Fox, R. S., Schmuck, R., Van Egmond, E., Ritvo, M. & Jung, C. (1973). Diagnosingprofessional climate of schools. Fairfax, VA: NTL Learning Resources Corp, Inc.
This appears to be the school climate counterpart to the resource described above. Thereare three types of instruments presented--perceptions that school personnel hold about theirown role responsibilities, perceptions of and reactions to the responsibilities of others, andgroup functions performed by staff members. The authors claim that all the instrumentswere "carefully developed in collaboration xith social scientists and with members of schoolfaculties" (p. 26). None of this information is provided in the monograph. Again, there isa lot of detail on the use of the instruments presented, including case studies of use.
Fraser, B. J. (Ed.). (1986a). The study of learning environments. Salem, OR:Assessment Research.
This publication is sponsored by an American Educational Research Association (AERA)Special Interest Group on learning environments. It contains eight paplr., presented at the1985 annual meeting of AERA. Articles include a review of current assessment tools, areview of current research in the area, and reports of individual studies. The publicationcan be obtained from Assessment Research, 142 Glynbrook Street N., Suite 207, Salem,Oregon 97303.
Fraser, B.J. (19E6). Classroom environment. Dover, NH: Croom Helm.
The author reviews severs' gnajor educational climate measures in detail and presents shortdescriptions of many others. He also summarizes current research findings on therelationship between climate and outcomes, the degree to which the match betweenindividual climate preferences and actual climate affects outcomes, and how climates varybetween settings. These summaries of current research findings are tied to individualinstruments and can be used to interpret and use the results of school self-study.
Gottfredson, D. C., Hybl, L. G., Gottfredson, G. E., & Castendta, R. P. (1986). Schoolartiste assessment instrummtv Areview. The Johns Hopkins University, Center forSocial Organization of Schools. (Also a paper presented at the annual meeting of theAmerican Educational Research Association, 1986.)
The authors reviewed 70 school effectiveness instruments from 22 school improvementprojects around the country. The authors present reviews of 20 of the best instruments (interms of sound psychometric development). The instruments are mostly surveys but doinclude some interviews. All grade levels are covered. In these reviews climate wasbroadly drfined to include all school characteristics associated with the effective schoolsliterature. Some components of these instruments would, however, also fall into narrower,psychosocial definitions of climate. The instruments come mainly from schoui districts andstate departments of education.
Guzetti, B. J. (1983). Report on instruments for %enuring school effectiveness. Aurora,CO: Mid-Continent's! Regional Educational Laboratory. Also ERIC No. ED 253578.
Tie author reviews 24 instruments for examining school effectiveness. Some of theseinclude sections on school climate. Many include individual aspects that are also sometimesincluded on climate instruments, e.g., "safe and orderly environment," "high expectations forstudent achievement," "automony in planning instruction," "adequacy of resources," and"collegiality."
76
r A

CURRENT INSTRUMENT DEVELOPMENT ACTIVITIES
Angulo, Luis M. Villar, University of Seville, Eas translated the CES, MCI, LFI, and ICEQinto Spanish and applied them to educational environments in Sevillian me- ary andtechnical school classrooms.
Barclay, James, is developing a revised scale that can spot early (K-2) at-risk kids. Itidentifies neglected and rejected children.
Steele, Joe, ACT-COM?, has designed an experimental college version of his CAQ thatmeasures the same six cognitive levels as the original instrument.
77
75

APPENDIX D
Checklist for Selecting a Measure of Educational Climate
79
r ,00
1

Checklist for Selecting a Measure of Educational Cnnate
I. Usefulness
A. Information Obtained
1. Do the stated uses of the A astrument match up with vhat you want to use theinformation for?
2. Dc .s the instrument or method measure the dimensions of educational climateon which you want inf., .mation?
3. Does the instrument permit you to gather information from all those fromwhom information needs to be collected (e.g. students, teachers, administrators,parents, community)?
4. Are standards of comparison (such as norms or other statements of what a goodclimate should be like) available?
5. Is there informaticn about how to use the results to improve climate?
B. Logistics
L Is the instrument or method easy to use?
2. Is it easy to score and interpret the results?
3. Is the length of time required to collect information acceptable?
C. Ccst
L Are costs within available resources? (Include costs of obtaining the instrumentor method, training data collectors and collecting data.)
II. Technical Adeguacv
A. Theoretical Basis
I. Do the supporting materials for the instrument or method present a cleardefinition of the aspects of educational climate that it measures". Does the testmanual discuss how this definition was developed and why the test has thecontent it has? Is evidence provided (based on research or theory) that thedefinition(s) and test content are reasonable?
B. Reliability
1. Was the instrument pilot tested?
2. Is there some measure of reliability available for the instrument? For a surveythis includes at least item discriminations, internal consistency and test-retestreliabilities; for an observation or interview this would include interraterreliability. Re liabilities should be presented for all uses recommended by theauthor(s). For example, if the instrument is to be used to examine bothindividual students and groups of students then reliabilities for individuals andgroups should be included. If the instrument can be used by students, teachers,and classroom observers, then reliabilities for each of these groups should bepre sent.
81

If the results are going to be used to make important (and hard to reverse)decisions about individual students, reliaL"ity should be above .90. 1:Gi groupuses, or for educational decisions that are easily reversible, reliabilities shouldbe above .75.
C. Validity
Is there evidence that the instrument measures what it claims to measure? Validityis in the relationship between the instrument and its use. Time should be evidencethat the instrument can be validly used for the purposes stated.
1. For paper and pencil instruments of the type reviewed here, an Waal set ofvalidity studies would include:
a. The respondent understands what is being asked. Vocabulary or conceptsunfamiliar to a group would make the instrument unusable for that group.
b. RespcneenZs report their true feelings and do not alter their responsesaccording to what others are responding or according to what they feelwould be the most socially desirable response.
c. There are an equal number of positively and negatively worded questionsso that a respondent doesn't get into a response set of answering the sameway each time.
d. There is evidence that the reported perception is not merely a reflection ofthe person's personal characteristics--that is, some part of stater. 4 ofclimate are separcte from the background characteristics of respondents.
e. Groups that should be different in their ratings are indeed different. Thiscould include the ability of an instrument to differentiate between classesor schools in terms of climate or student outcomes.
f. The instrument measures changes or difff.treaces in climate after trainingdesigned to change climate.
g. The instrument correlates with other measures of the same dimension anddoes not correlate with measures purporting to measure somethingdifferent.
h. It is the opinion of knowledgeable judges that he instrument measuresclimate.
2. In addition, if the instrument purports to measure aspects of climate that can bechanged to affect achievement, then the instrument needs:
a. Evidence that ttere is a relationship between scores on the instrument andstudent outcomes (achievement or affective).
b. Evidence that systematic changes 'n climate produce systematic changes inoutcomes.
82

Title Index
Assessment of school environments. Education Research & Perspectives, 61
Cue studies in science education, 64Class Activities Questionnaire (CAQ-1982), 21Clusroom Environment Index (CEI-1975), 23Classroom Environment Scale (CES-1974)., 25
Clusroom sociey, 62College and university classroom environment inventory (CUCEI), 63
College Lharactaistic index, 63Development of a cooperative, competitive, and individualised learning pr.. :ence scale for students. British Journal
of Educational Psychology, 62Dimensions of teacher morale. American Educational Research Journal, 81
Effective School Battery (ESB-1981), 43Elementary and Secondary School Index (ESI), 45
Elementary School Environment Survey (ESES-1967), 27Environmental ',testament technique: A way to meuure college environments. Journal of Educational Psychology, 63
Fifteen thousand hours: Secondary schools and their effects on children, 64
High School Characteristics Index (HSCI), 45Individualized C tearoom Environment Questionnaire (ICEQ-1979), 29Inside high school. The students' world, 64Interaction analysis: Theory, research and Lpplication, 64Learning Climate Inventory (LCI-1976), 47Learning Environment Inventory (LEI-1982), 3rd Version., 31
Life in classrooms, 64
My Class Inventory (MCI-1982), 33Organizational Climate Description Questionnaire (OCDQ-1963), 48
Organizational Clien;sti Index (OCI), 50Parent Opinion Inv..ntory (F01-1981), 51Quality of School Life Scale (QSL-1978), 35School climate improvement: A challenge to the school administrator, 61
SchLol Climate Index (NS1-1981), 37
School Environment Inventory, 62Sch"-,1 Learning Climate Assessment litstrument (SLCAI), 62
School Level Environment Questionnaire (SLEQ-1983), 54Structure and purpose in secondary schools: The academic impact of educational climates, 62
Student Opinion Inventory (SOI-1981), 56Study of teachers, 64
Teacher Opinion Inventory (T01-1981), 57Teaching experience: Its effect on school climate, teacher morale NASSP Bulletin, 61
Thinking About My School (TAMS-1985), 58Transmission-interpretation scale. British Zournal of Educational Psychology, 61Validation and application of the college and university environment inventory ( CUCEI`, 63
Work Environment Scale (WES-1974), 59
83

The Test Center
The Test Center at the Northwest Regional Educational Laboratory is a library of tests andtesting resources. Materials are loaned to educators in Alaska, Hawaii, Idaho, Montana,Oregon, Washington and the Pacific Islands; and to Chapter 1 programs in Arizona,California, Colorado, New Mexico, Nevada, Utah and Wyoming. Most of the AssessingSchool and Classroom Climate instruments in tins guide are available for a three-week loanby contacting:
The Test CenterNorthwest Regional Educational Laboratory
101 S.W. Main Street, Suite 500Poaland, OR 97204
(503)275-9500 or (800)547-6339