document resume cs 503 794 - eric · 2014-03-04 · document resume ed 214 226 cs 503 794 title...
TRANSCRIPT

DOCUMENT RESUME
ED 214 226 CS 503 794
TITLE Speech ,Research: A1Report on the Status and Progressof Studies on the Nature of Speech, Instrumentationfor Its Investigation, and Practical Applications,January 1-March 31, 1982.
INSTITUTION Haskins Labs., New Haven, Conn.SPONS AGENCY National Inst. of Child Health and Human Development
(NIH), Bethesda, Md.; National Inst. of Neurologicaland Communicative Disorders and Stroke (NIH),Bethesda, Md.; National Science Foundation,Washington, D.C.
REPORT NO SR-69PUB DATE 82CONTRACT NICHHD-N01-HD-1-2420GRANT NICHHD-HD-01994; NIH-RR-05596; NINCDS-NS=13870;
NSF-PRF-8006144NOTE 301p.
EDRS PRICEDESCRIPTORS
MF01/PC13 Plus Postage.*Articulation (Speech); Auditory Perception; *HearingImpairments; Language Skills; Memory; *Oral Language;Perceptual Motor Coordination; Psychomotor Skills;Reading Ability; Sign Language; *SpeechCommunication; *Speech Handicaps; Speech Skills
ABSTRACTOne of a regular series on the status and progress of
studies into the nature of speech, instrumentation for itsinvestigation, and practical applications of research, this reportcovers t'° period of January 1 to March 31, 1982. The 13 studies dealwith the following topics: (1) speech perception and memory coding inrelation to reading ability, (2) the use of orthographic structure bydeafadults, (3) information support for speech, (4) the stream ofspeech, (5) using the acoustic signal to make inferences about placeand duration of tongue-palate contact, (6) the patterns of humaninterlimb coordination that have emerged from the properties ofnonlinear limit cycle oscillatory processes, (7) motor control, (8)the nature of motor control in Down's, syndrome, (9) periodicity andauditory memory, (10) reading skill and language skill, (11) the role
.% of sign order and morphological structure in memory for American SignLanguage sentences, (12) perception of nasal consonants with specialreference to Catalan, and (13) speech production characteristics ofthe hearing impaired. (FL)
***********************************************************************Reproductions supplied by EDRS are the best that can be made
from the original document.******************.*****************************************************

U.S DEPARTMENT OF EDUCATIONNATIONAL INSTITUTE OF EDUCATION
EDUCATIONAL RESOURCES INFORMATIONCENTER (ERIC)
f This document has been reproduced asreceived horn the person or organizatrononginatingMinor changes have been made to improvereproduction oualdv
Points of v.ew or OpooOnS stated in Ithsdocu
meat do not neCeSSanty rehteSent official NIE
Posibon or policy
V
Status Report on
SPEECH RESEARCH
A Report onthe Status and Progress of Studies onthe Nature of Speech, Instrumentationfor its Investigation, and Practical
Applications
1 Januar - 31 March 1982
t Haskins Laboratorie;270 ,Crown Street
New Haven, Corn. 06510
' SR-69 (1982)
Distribution of this document is unlimited.
(This document contains no information not freely available to the
general public. Haskins Laboratories distributes it primarily for
library use. Copies are available from the National Technical
Information Service or the ERIC Document Reproduction Service. See
the Appendix for order numbers of previous Status Reports.)
If

SR-69 (1982)
(January-March)
ACKNOWLEDGMENTS
The research reported here was made possible in part by support
from the followifig sources:
National Institute oI' Child Health and Human Development
Grant HD-01994Grant HD-16591
National Institute of Child Health and Human Development
Contract NO1-HD-1-2420
National Institutes of HealthyBiomedical Research Support Grant RR-05596
National Science FoundationGrant PRF-8006144Grant BNS-8111470
National Institute of Neurological and Communicative
Disorders and StrokeGrant NS13870Grant NS13617Grant NS18010
iii
3

HASKINS LABORATORIES
Personnel in Speech Research
Alvin M. Liberman,* President and. Research DirectorFranklin S. Cooper,* Associate Research DirectorPatrick W. Nye,. Associate Research DirectorRaymond C. Huey,* TreasurerAlice Dadourian, Secretiry
Investigators
Arthur S. Abramson*Peter J. Alfonso*ThomAs BaerAlan Bell1Frederic::a Bell-Berti*Catherine Best*aria J. Borden*Susan Brady*Giuseppe Cossu2
Robert Crowder*Carol A. Fowler*Louis Goldstein*Vicki L. HansonKatherine S. Harris*Alice Healy*Kiyoshi Honda3Leonard Katz*J. A. Scott KelsoAndrea G. Levitt*Isabelle Y. Liberman*Leigh Lisker*Virginia Mann*Charles MarshallIgnatius G. Mattingly*Nancy S. McGarr*Lawrence J. Raphael*Bruno H. ReppPhilip E. RubiiElliot SaltzmanDonald P. Shankweifer*Michael Studdert-Kennedy*Betty Tuller*
L Michael T. Turvey*
Robert Verbrugge*
Technical and Support Staff
Eric L. Andreasson
Margo CarterElizabeth P. Clark
Vincent GulisanoDonald HaileySabina D. KorolukBruce Mar cin
Agnes M. McKeon*
Nancy O'BrienMarilyn K. ParnellWilliam P. ScullyRichard S. SharkanyLeonard SzubowiczEdward R. WileyMary-Anne Wolf .
David Zeichner
ti
SR-69 (1982)
(January-March)
Students*
Suzanne Boyce
Andre CooperTova Clayman
Steven EadyJo EstillLaurie B. FeldmanNancy FishbeinCarole E. Gelfer
Janette Henderson'Charles HoequistRobert KatzRena KrakowPeter KuglerGerald LameAnthony Levas
Harriet MagenSharon ManuelRichard McGowanSuzi PollockBrad hakerdDaniel RecaSens'Rosemarie RotunnoHyla RubinJudith Rubin
Arnold ShapiroSuzanne SmithBen C. Watson'Douglas WhalenDeborah WilkenfeldDavid Williams
*Part-time1Visiting from University of Colorado, Boulder, Colorado2Visiting from Istituto Di Neuropsichiatria Infantile, Sassari, Italy3Visiting from Uniyersity of Tokyo, Japan
V 4

CONTENTS
I. Manuscripts and Extended Reports
Speech perception and memory coding in relation to
reading ability--Susan Brady, Donald Shankweiler,
and Virginia MannH
ac
The use of orthographic structure by deaf adults:.
Recognition of fingerspelled letters- -
Vicki L. Hanson
Exploring the information support for speech- -
J. A. Scott Kelso and Betty Tuller
SR-69 (1982)
(January-March)
The stream of speech--Robert E. Remez and Philip E. Rubin
Using the acoustic ignal o make inferences about
place and duration of tongue-palate contact--P. J. Price
Patterns of human interlimb coordination emerge frOm
the properties of non-linear limit cycle oscillatory
processes) Theory and'data--J. A. Scott Kelso, Kenneth
G. Holt, Philip Rubin, and Peter N. Kugler.
1
27
43'
55
61
71
Motor control: Which themes do we orchestrate?- -
J. A. S. Kelso and E. L. Saltzman111 a
Exploring the nature of motor control in Down's syndrome- -
Walter E. Davis and J. A. Scott Kelso'123
Periodicity and auditory memory: A pilot study--Janet
May and Bruno H. Repp145
Reading skill and language skill--Virginia A. Mann 151
On the role of sign order and morphological structure
in memory for American Sign Language sentences--Vicki
L. Hanson and Ursula Bellugi171
Perception of nasal consonants with special reference to
Catalan--Daniel Recasens'89
Speech production characteristics of the hearing impaired- -
Mary Joe Osberger and Nancy S. McGarr
II. Publications
III. Appendix: DTIC and ERIC numbers (SR-21/22 - SR-66)
vii
227
291
293
I. MANUSCRIPTS AND EXTENDED REPORTS
o.
6

SPEECH PERCEPTION AND MEMORY CODING IN dELATION TO READING ABILIT1:
Susan Brady, Donald Shankweiler,+ and Virginia Mann++
Abstract. Previous work has demonstrated that children whp are poor
"eaders have short-term memory deficits in tasks in which the
stimuli lend themselves to phonetic coding. The aim of the presentstudy was to explore whether the poor readers' memory deficit mayhave its origin in perception with the encoding of the stimuli.
Three experiments were conducted with third-grade good and ,poor
readers. As in earlier experiments, the poor readers were found to
perform less well on recall of random" word strings, and to be less
affected by the phonetic characteristics (rhyming or not rhyming) of
the items (Experiment 1). In addition, the poor readers produced
more errors of transposition (in the nonrhyming strings) than did
the good readers, a further indication of the poor readers' problem.
with memory for order. The subjects were tested on two auditoryperception tasks, one employing words (Experiment 2) and the other
nonspeech environmental sounds (Experiment 3). EaCh was presented
under two :conditions: with a favorable signal-to-noise ratio and
with masking. The pocr readers made significantly more errors thanthe good .readers when listening to speech in noise, but did not
differ in perception of speech without noise or in perception, of
nnonspeech environmental sounds, whether noise-masked or not.
Together, the results of the perception studies suggest that poorreaders have a perceptual difficulty that is specific to speech. It
is suggested that the short-term memory deficits characteristic of
poor readers may stem from material - specific problems of perceptual
processing.
)4-Also University of Connecticut, Storrs, Ct.
++Also, Bryn Mawr College, Bryn Mawr, Pa.
Acknowledgment. The authors wish to thank several colleagues for their
helpful comments and suggestions: Carol Fowler, Vicki Hanson, Leonard Katz,
Robert Katz, and Alvin Liberman. We are especially grateful to Isabelle
Liberman, whose insightful comments on earlier drafts contributed to the
clarity of this presentation. We are also indebted to Holland,
Superintendent of Schools, Narrangansett, Rhode Island, and to the faculty
at the Narragansett Elementary School for their kind cooperation: "David
Hayes, Principal; Judy Aiello, Reading Coordinator; and the third grade
teachers (Sue Boland, Leslie Flynn, Edward O'Brien, Hope Rawlings, and
Margu9rite St:ain). This research was supported by a grant from the
NatiAal Institute of Child Health and Human Development (Crant HD-01994) to
Haskins Laboratories.
['HASKINS LABORATORIES: Status Report on Speech Research SR-69 (1982)]
7

Many studies have shown that children who are poor readers tend to
perform deficiently on short-term memory tasks. There is considerable evi-dence, however; that the memorylooltblem is specific to linguistic material andto ether material that lends if to linguistic representation. A hypo-thesis has been proposed that failure to make effective use of phonetic codingin short-term memory may account for some of the deficiencies poor readerstypically show in language processing (Liberman, Shankweiler, Liberman,Fowler; & Fischer, 1977). Tests of this hypothesis have utilized the well-known phenomenon that when normal .adult subjects are required to recallstrings of rhyming and nonrhyming letters or words, many more errors typicallyoccur on the rhyming strings (Baddeley, 1966;'Conrad,'1964, 1972). Childrenwho ,are good readers, like normal adults, tend to be strongly affected byrhyme; poor readers, on the other hand, are significantly less_ affected. Forthem, phonetic similarity has relatively little effect on recall (Liberman et-al., 1977).
Subsequent experiments have confirmed and extended this result under avariety of conditions: when memory is tested by recognition as well as whenit is tested by recall (Byrne & Shea, 1979; Mark, Shankweiler, Liberman, &Fowler, 1977); when sentences or word strings are the stimuli as wen-4as whenlettee'strings are preseh.;ed (Mann, Liberman, & Shankweiler, 1980); when the'items are presented auditorily instead of visually (Shankweiler, Liberman,Mark, Fowler, & Fischer, 1979) In each of these conditions it was found thatpoor readers are relatively insensitive to the phonetic characteristics of theitems. Accordingly, it has been supposed that poor readers have a generalproblem with the use of a phonetic code, hOwever.the material is presented,and not a specific difficulty in deriving a phonetic representation from print(ShankweilPr & Liberman, 1976). It would seem, therefore, that one reason forpoor readers' deficieat performance in short -term memory tasks is theirfailure to fully exploit phohetic coding.
It remains to be determined what limits full utilization of phoneticcodes by poor readers. To what extent does" the problem arise in per,ceptionwith the encoding of stimuli, and to what extent does the problem involve theuse of information already represented in phonetic form? Our intent in thisstudy was to investigate whether the poor readers' phonetic-doding deficiencyin short-term memory is related to the perceptual process as such.
A study by Rabbitt 1968) gives a way to understand how such a
relationship might come abOut. This study points to a direct connectionbetween .stimulus variables that affect perception and those that affectrecall. In Rabbitt's experiment, the subjects were required to listen tospoken digits presented with a white noise mask. In one condition the
subjects' task was to repeat individual items, in another condition they weretested for recall of strings of items. It was found that noise levels thatproduced no manifest effect on perception and recall of the individual itemssignificantly impaired recall of the strings. Thus adding noise, and increas-
ing the perceptual difficulty, adversely affected memory even when the
individual items could still be identified correctly. The insight we gainfrom Rabbitt's findings may give us a purchase on the problem of why poorreaders typically reveal deficits in verbal short-term memory. Their failure
to make full use of phonetic coding in short-term memory may be traceable, asPerfetti and Lesgold have supposed (1979), to a disorder at the level of
perceptual proceising.
82

4
It is well known that severe reading problems often occur in children who
show no obvious abnormalities in language development. These poor readers
typicallg do not manifest clinically' apparent difficulties in perception of
speech. It is conceivable, howeV'er, that such children may have subtle
deficiencies in speech perception that special testing procedures may bring to
light.
One study (Goetzinger, Dirks, & Baer, 1960) hints that in order to
discern differences in perpeptual skills among good and poor readers it may be
necessary to use a quite demanding task% Goetzinger et al. raported no
difference- between reading groups for a list of well-articulated words but a
significantldifference in favor of the good readers on a list of rapidly, and
somewhgt indistinctly; articulated items. Although the study does not permit
a_direct cotparison to be made (different'words occurred in the two test
lists)., the results suggest that discrepancies in'speech.PhrcePtion
may have been present for good and poor readers 'that wou1 be detected on a
sufficiently difficult task.
AlthoUgh relevant data, are scarce., there is reason to suggest that the,
charactercsiid differences so often observed between good and poor readers on
memory task's might be associated with differences in speech perception. Our
purpose in the research we present here was to examine this possibility.
Accordingly, good'and poor readers were tested on a memory task in which the
effects of phonetics coding are knotin_ to be discernible. tieing the procedure
of Liberman et al: (1977), we compared peufvmance on recall of phonetically
similar'(rhympig) and phonetically dissimilar (nonrhyming) sequences of mono-
syllabic words in good and pdOr readers. It was expected that, as ,in previous
experiments, good readers, in contrast to poor,,would find recall of the
rhyming sequences more difficult than the nonrhyming sequences, reflebting
4ore efficient use of a phonetic code. We then addressed the question of
hether the reading group differences on memory tasks are related to speech
perception abilities. The subjects were tested on a speech perception task
requiring Tepetition of monosyllabic words. The items selected included high
and low frequency words phonetically balanced to permit phonetic analysis of
errors and examination of .error location within the syllable. The stimuli
Were presented under two conditions, with and without masking noises in order
to vary the difficulty of the task. In addition, a test of perception of
environmental nonspeech sounds was conducted, again with and without noise
masks, to enable us to investigate any differences in perceptual performance
that exist beyond. the speech domain.
METHOD
Subjects
The subjects were third-grade children from a suburban public school in
southern Rhode IslLnd. A school reading specialist was asked to, select the
poorest readers and the good readers from the third-grade classes. The
children were given the Word Attack and Word Recognition subtests of the
Woodcock Reading Mastery Tests, Form A (Woodcock, 1973), and a test of
receptive vocabulary, the Peabody,Picture Vocabulary Test (PPVT;,Dunn, 1965).
On the basis of scores obtained on the Woodcock test, "two groups were formed,
that were non-overlapping in reading level.
.,
0
3

'Eight children were eliminated because their inconsistent scores on the
two Woodcock sub -tests made them difficult to classify_as good or poorreaders. Three additional selectio4 criteria were employed to determine
qligibility for participation in the experiments. First,'In order to restrictthe range of vocabulary skills, only the children were selected whosz, PPVTIQ score fell between 90 and 120. An additional five children failed to meet
this requirement. Second, in view of the evidence that the speech perceptionskills of children continue to develop during elementary school years (Finken-binder, 1973; Goldman, Fristoe, & Woodcock, 1970; Schwartz tx Goldman, 1974;
Thompson, 1963), subjects were selected whose ages fell within a limited range
(96 to 108 months). The age requirement excluded five more potential
subjects. And third, the remaining _:-.'laren were screened for hearing loss.The right and left ears were presented with tones at 500 Hz (25 db), 1000 Hz
(20 dB), 2000 Hz '(20 dB), 4000 Hz (20dB); and' 8000 Hz (20 dB), using a
standard tudiometer. Seven children failed the hearing screening.
Thirty Children met all the requirements for participation in the study.
Table 1 summarizes the characteristics of the good and poor reader groups.The 15 children who qualified as good readers were weld ahead of third gradereading skills with a mean reading gradIllrevel of 5.88 The 15 children
labelled !Nor readers averaged slightly more than one-half year below their
expected level (with a mean reading grade level of 2.76).
) Table 1,,
Means for Turd-Grad,,Children Grouped According to Reading' Achievement
Group Age IQa , "Reading Tradeb
Good 15' 8 yr. 5 mo. 106.8 5.88
Poor 15 b yr. 6 mo. 102.5 2.76
aPeabody Picture Vocabulary.' Test
bFrom the average of the reading grade scores obtained on the Word Attack andWord Recognition subtesteX.the Woodcock Reading Mastery Tests, Form A.
4

The ages of the good (mean = 8 yr. 5 mo.) and or readers (mean = 8
yr.. 6 mo.) did not differ significantly. Nor were he IQ scores as assessed
by the PFIFT significantly different. -The mean IQ score for the good readers
was_106.8; for the poor readers 102.5.
Procedure \
Each child was tested f, individually for three sessiOns. The first
session included- the screening procedure, the speech perception noise-masked
condition and one half (set A as explained below) of the memory ,experiment.
The second session, occurring at least a week later, consisted of the speech
perception unmasked condition and the other half (set B) of the memory
experiment. The third session, approximately twdli months after the irst, was
devoted to the environmental-pounds experiment.
The _experiments were conducted in a quiet room. The tape-recorded
material for the memory, speech perception, and environmental sounds tasks
was played to subjects over earphones. ,,The subjects' responses,were recorded
on audidtape. Transcriptions of the subjests' responses were also made
during the testing sesbion. The tapes were played back within an hour of the
experimental session in order to corroliorate the transcription and to allow
any necessary corrections.
;EXPERIMENT 1: Susceptibility of Go'od and Poor Readers to Phonetic
'Confusions in S -.ort- term Memory
The first experiment employed short-term memory task with rhyming and
nonrhyming word strings. Our aim was to confirrii previous evidence that ,poor
readers make less effective use of phonetic coding in short-t,erm memory than
do good readers.
Stimuli
'Twenty strings of five monosyllabic 'words were treated, ten rhyming and-
ten nonrhymingl. A single list of 50 common nouns was used a3 the word source
for the rhyming and nonrhyming tests. Thus word frequency, phonetic struc-
ture, and word length were strictly controlled for the two conditions. The
five words 'in each rhyming .tring had the same vowel and the same final
consonant if any. The five words in each nonrhyming string all, had different
vowels and final consonant.
The twenty strings were recorded on magnetic tape in two sets ( A and B)
of ten lists read by a phonetically-trained male speaker. Each set comprised
an alternating presentation of rhyming and nonrhyming strings. Within each
string ihe 'items were spoken with a neutral prosody at the rate or one per
second. The two sets are presented in Table 2.
Procedure
Each suNect heard, set A during the first session and set B during the
second. On both occasions the same procedure was followed.
5

4
11.
r
Table 2
Experiment 1: Word Lists
.:. -
Set AI
1. chain train ri
brain rain pain
2. cat fly //
score mcAt scale,
3. pair air hair chair bear
4. roar wheat fat tail sky
5. state plate weight gate fate
6. tie hat nail floor sheet
7. cell shell well bell spell8. mail pie store cap feet
9. bee tree knee . tea key.
10. treat door eye sail map
Set B
1.,...
bell. state knee pain chair
2. fly pie tie eye sky3. ,bee cell train air plate
'--.4. -cat hat fat map cap
5.' gate brain pair tea well
6. tail scale mail sail ',nail
7. ' bear key weight shell chain
P. score roar door floor store
9. rain hair spell fate tree
10. meat wheat sheet feet treat
1
6
1 al.
12

The child was told that a list of words would be played and that the
task was to repeat the list in the order given.,, After practicing with two
lists read by the experimenter, the subject then heard the pre-recorded setof ten five-item word strings.
Results and Discussion
First, an analysis was made of the correct responses in terms of itemrecall and serial order. Secondly, the errors were analyzed qualitatively inrelation to phonetic structure of the stimulus words.
Analysis of Correct Responses4
The subjects' responses were scored in two ways. In the first proce-dure, a response was considered correct only if the item was accuratelyreported and if it was assigned to the appropriate serial position. Thesecond procedure ignored serial position and counted as correct all responses
of words that had occurred in the given string, regardless of order ofreport.
The error data for each scoring procedure (summarized in Table 5) were
,subjected to analysis of variance. We examine first the results from themore strict scoring procedure: In agreement with earlier studies (Naidoo,`1970; Miles & 1'977; Shankweiler et al., 1979; Mann et al., 1980) theoverall accuracy ,of recall was greater for good readers, F(1,28) = 5.6,
p = .025.. where was as expected, a significant effect 5 list type,
F(1,28) = 44.2, p < .001. And, as predicted, the good readers made fewererrors on the Eanrhyming word sequences than on the rhyming. The poor
readers also showed an effect, though a smaller one; of phonetic similarity.Thus, while we obtained significant effects of reader group and of list typethat conformed to the pattern of earlier studies (Shankweiler,et al., 1979;
Mann' et al.,: 1980), the interaction between reading group and list type didnot reach significance, F(1,28) = 2.9, p = .098.
Table 3
Experiment 1: Mean Number Correct Summed Over Serial Positions2
for Strict Order Scoring and for Order Free Scoring
Order Correct Scoring Order Free Scoring
Rhyme Non-Rhyme
Good 15.8 28.0 q
Poor 12.2 19.4
difference
2Maximum = 50
3.6 8.6
Rhyme Non-Rhyme
32.7 , 35.5
31.7 29.5.
1.0 6.0

OF.
Table 4
Experiment 1: Analysis, of Incorrect Responses
Composition of incorrect responses:
The percentage with:a
Reading
incorrect responses initial final
consonant vowel consonant
initial consonantand vowel fromsame word
vowel and
final consonantfrom sawwordtotal responses
Group Condition
Good' Rhyme 15 66 99 98 0 79
Nonrhyme 17 81 97 97 19 68
Poor Rhyme 16 59 99 97 2 75
NonrhymP 26 79 98 92 16 73
ai.e., the percentage with phonetic information that was available in
the two strings.
1415

Evidence that the two reading groups differed in the recall strategies
they employed onerges when the data were re-examined after applying the morelenient scoring procedure. As in other studies utilizing lists of high intra-list similarity, item information suffers less than order information. So for
both groups the order-free recall scores are markedly higher, particularly for
the rhyming strings. Overall, the performance level of the two reading groups
was not significantly different, F(1,28) = 3.6, = .071, nor was there a main
effect of rhyme, F(1,28) = .1, 2 > .500. In Table 3 we can see, however, that
while the scores for the two groups were very close in the rhyming condition,they were dissociated on the nonrhyming sequences. Thus, we find a signifi-cant interaction between reading group and list type, F(1,28) = 6.7,
s.z...016). The good readers showed inproved-performance in the nonrhymingcondition, F(1 ,28) = 4.2, p = .05, where an efficient phonetic strategy canoperate to advantage. The readres, in contrast, did not improve on thenonrhyming sequences, F(1 ,28) = 2.6, p < .20; indeed they tended to do worse.
The memory experiment undertaken here was intended mainly as a replica-
tion. In previous research, good readers evidenced generally-superior recallbut were relatively more penalized by phonetic similarity within a list thanwere poor readers. The present study does generally conform to this picture,though here the differences between the groups were somewhat less marked,perhaps because the subjects were a year older than those in the earlierresearch. At present, the appropriate studies to examine developmental
changes in use of a phonetic strategy have not been done. If poor readers are
employing a non phonetic strategy, as has been suggested (see Byrne & Shea,1979), we might expect their use of this strategy to diminish with increasingage (Conrad, 1972).
Qualitative Analysis of Errors
The construction of the present experiment, using words as stimuli ratherthan letters, permits a closer inspection of the nature of the difficulty poor
readers, have in preserving order information. In analyzing the response
sequences, it became apparent that the recall problems of poor readers applynot only to the order of the stimuli in a string but also to the retention of
phonemic sequences within individual words. The subjects'.response sequences
(for both good and poor readers) included items that had not occurred in the
strings. These errors were often obvious recombinations of phonetic compo-nents that had been present in the presented sequence (e.g., for the targetitems train and plate several subjects reported trait and plane). Such errors
of transposition have previously been reported in memory experiments withadults (Drewnowski, 1980; Ellis, 1980). We undertook to analyze the phonetic
errors in the present experiment to determine .how often the incorrect
responses could be accounted for as transposed phonetic segments from adjacent
items. In this analysis, the given string and the previous sequence wereconsidered as the available source of phonetic information.
The data base for determining whether errors of transposition were
present was the 451 phonetic errors obtained from all 30 subjects. Seven of
these errors were whole words from previous lists and were disregarded. An
additional seven were discounted because they were phonetically unrelated toany item in either word list. The phonetic composition of the remaining 437responses could, for the most part, be accounted for in terms of the phonetic
1 6
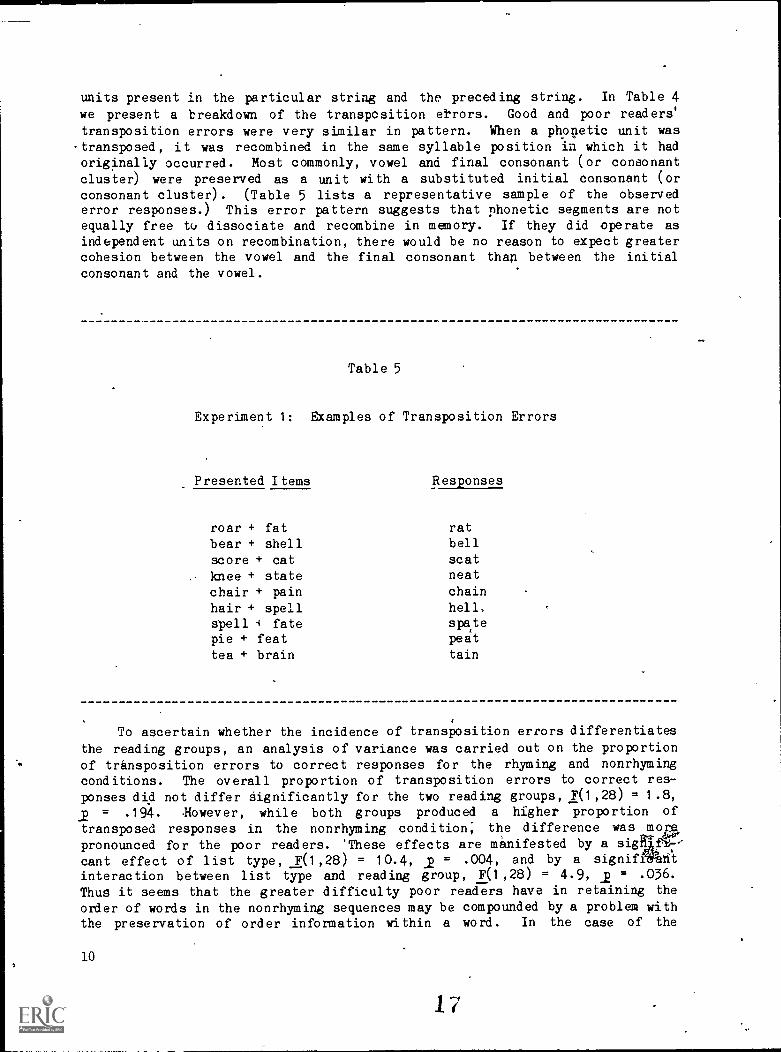
units present in the particular string and the preceding string. In Table 4
we present a breakdown of the transposition etrors. Good and poor readers'
transposition errors were very similar in pattern. When a phonetic unit was-transposed, it was recombined in the same syllable position in which it hadoriginally occurred. Most commonly, vowel and final consonant (or consonantcluster) were preserved as a unit with a substituted initial consonant (orconsonant cluster). (Table 5 lists a representative sample of the observederror responses.) This error pattern suggests that phonetic segments are notequally free to dissociate and recombine in memory. If they did operate asindependent units on recombination, there would be no reason to expect greatercohesion between the vowel and the final consonant than between the initialconsonant and the vowel.
Table 5
Experiment 1: Examples of Transposition Errors
Presented Items Responses
roar + fat rat
bear + shell bell
score + cat scat
knee + state neat
chair + pain chain
hair + spell hell,
spell i fate spatepie + feat peat
tea + brain tain
To ascertain whether the incidence of transposition errors differentiatesthe reading groups, an analysis of variance was carried out on the proportionof transposition errors to correct responses for the rhyming and nonrhymingconditions. The overall proportion of transposition errors to correct res-ponses did not differ significantly for the two reading groups, F(1,28) = 1.8,
= .194. 4owever, while both groups produced a higher proportion of
transposed responses in the nonrhyming condition; the difference was mores
pronounced for the poor readers. 'These effects are manifested by a sigap7-'cant effect of list type, F(1,28) = 10.4, _p = .004, and by a signiffnntinteraction between list type and reading group, F(1,28) = 4.9, 2 = .036.
Thus it seems that the greater difficulty poor readers have in retaining theorder of words in the nonrhyming sequences may be compounded by a problem withthe preservation of order information within a word. In the case of the
10
17

rhyming strings, of course, subjects may well produce transposed responses
that would be undetectable. This may account for the better performance ofthe poor readers in the order-free scoring of rhyming words.
The present study confirms earlier reports that poor readers recall fewer
items than good readers and that they are less affected by phonetic similarity
within a list than are good readers (Liberman et al., 1977; Mann ,?.t al., 1980;
Mark et al., 1977; Shankweiler et al., 1979). In this study the result of the
phonetic error analysis allows us to extend our understanding of poor readers'
performance on memory tasks. It indicates first.of all that the poor readers
definitely obtained the phonetic information in the stimuli. However, the
greater incidence of transposition errors by poor readers (in the nonrhyming
condition) also points. to inferior retention of the correct combinations ofphonetic sequences specifying the in0,Aridual items. This finding is consis-
tent with other indications (Katz, Shankweiler, & Liberman, in press) that
poor readers encounter difficulty in preserving serial order information in
linguistic tasks. It further suggests that the problem extends to the
ordering of segments within the syllable.
EXPERIMENT 2: SpeeCh Perception in Good and Poor Readers
We now turn to the second question: the speech perception abilities of
the good and poor readers. The aim of Experiment 2 was to investigate whether
the language deficits of the poor reader are evident in phonetic perception as
well as in short-term memory.
Stimuli
The perception .test consisted of 48 words especially chosen to control
for syllable pattern, phonetic composition, and word frequency. There were 12
words for each of the following syllabic patterns: CVC (consonant-vowel-
consonant), CCVC, CCVCC,' and CVCC. Within each syllable pattern, half of the
words selected were judged to have high frequency of occurrence in children's
-literature and half had low frequency (Carroll, Davies, & Richman, 1971). The
frequency values were validated with a second word frequency source (Thorndike
& Lo.rge, 1944).
In order to permit a clearcut analysis of phonetic errors and of errors
of-position (i.e., medial and final word position) words were chosen
to provide a systedatic phonetic set. Twenty words began with stop eonsonants
(/b/, /d/, /g/, /p/, /t/, /k/) and twenty words began with fricatives or
affricates (/tS/, /s/, /f/, /J/, /d3/, /v/). For each of the above phoneticcategories half of the occurrences were in high frequency words and half were
in low frequency words. Of the remaining eight items, four began with nasalconsonants (/m/., Ini) and fow with liquids (/r/, /1/). The same distribution
of phonetic elements occurred in word final position.1
The occurrences of segments in medial position were not controlled except
in one respect: every syllabic pattern that occurred in a high frequency word
was matched in a low frequency word (e.g., front [high frequency] and flint
[:tow frequency] were matched in syllabic pattern: each consisted of the
sequence: fricative, liquid, vowel, nasal consonant, stop consonant). The
word list is presented in Table 6.11
1,

Table 6
Experiment 2: Speech Stimuli
High Frequency Words Low Frequency Words
door
team
road
knife
chiefjobgrain
breathcrowdsleepscalespeechfrontplantfriendclouds
blocksplanesbankchancelist'monthchildships
bale
dinlobemashcheffig
tram
grousecragslagspireskiffflintclampfrondgladesdrapes
pruneskinkfinchraspnymphvaultshacks
19
12

The words were recorded by a phonetically-trained male speaker, .each
being produced as the final word of a meaningful sentence. The sentences were
subsequently digitized at 10,000 samples/sec and each stimulus word was
excised from ,the rest of the sentence, using the Haskins WENDY waveformediting system (Szubowicz, Note 1). The words were then arranged into a fixed
random sequence and recorded cr,to magnetic tape. When the stimuli werereplayed,.. a comfortable listening level was selected, approximately 78 dB SPL.
The noise-masked conditiodwas then constructed by following the method
,described by Schroeder (1968). The technique involves computing the maskingnoise signill direbtly from the digitized speech sample to be' masked. Each
speech sample of the digitized waveform of. a stimulus word is multipled byanother, randOily chosen with equal probability. The waveform that resultsfrom this manipulation preserves the time-varying amplitude characteristics ofthe speech signal while having a flat long-term frequency spectrum. Thus it
is referred to as an amplitude-match noise signal. Each digitized word and
its amplitude matched noise signal were added linearly to yield a 0 dB S/N
ratio. The woras in noise were subsequently arranged into a fixed randomorder and recorded on magnetic tape.
ProcedureO
Each subject listened to the noise-masked words curing session 1, and the
unmasked words during session 2. The child was told that a list of words
would be played (and, in the noise-masked condition, that the words were
recorded in some noise). The subjects were instructed to repeat each item
clearly immediately after heiring it. The test sequence was preceded by four
practice trials.
Results and Discussion
Few words were missed by either the good readers (mean errors =,1.3) or
the poor (mean errors = 2.0) in the unmasked condition. As we can see in the
left-hand portion of Figure 1, whereas both groups made considerably moreerrors in the noise-masked condition, the poor readers (mean errors = 20.7)
did markedly worse than the good readers (Mean errors = 15.1).
These effects were analyzed oy a two -way factorial analysis of variance.
The between-gm-ups factor, reading achievement, was significant, F(1 ,28) =
17.6, .2 < .001, with good readers misreporting fewer words than poor readers.In addition, there was a significant main effect of noise, F(1,28) = 687.4,
< .001. From previous perception research with adults (e.g., Licklider &
'Miller, 1951), the detrimental effect of masking noise on intelligibility iswell known. What is new, from our point of view, was the, finding that there
were notable differences in the magnitude of the effect of noise on per'Ception
for the two reading groups. A significant interaction between the effect of
masking, and reading group was obtained, F(1,28) = 15.8, < .001. When the
stimuli were ,presented clearly in the unmasked condition, all the subjects
reported the stimulus items accurately. The addition of,noise, however, made_
it significantly more difficult for the poor readers to perceive the stimuli
than for the good readers to do so. Thus it seems that the speech perception
skills of poor .readers are less effective than those of good readers but thatthis difference is observable only when they are required to respond to
degraded stimuli.13
2()
4

100
9010wer
0cc 8001--zw 700ccwa
60
50
t.
Speech
ttt
%GOOD
.
POOR
Environme-ntal SOunds
i POOR
GOOD
No-Noise Noise Masked No-Noise Noise Masked, .
Figure 1. Performance of good and poor readers on the speech perception task
(Experiment 2) and the environmental sounds task (Experiment 3),plotted in mean percent correct.
21
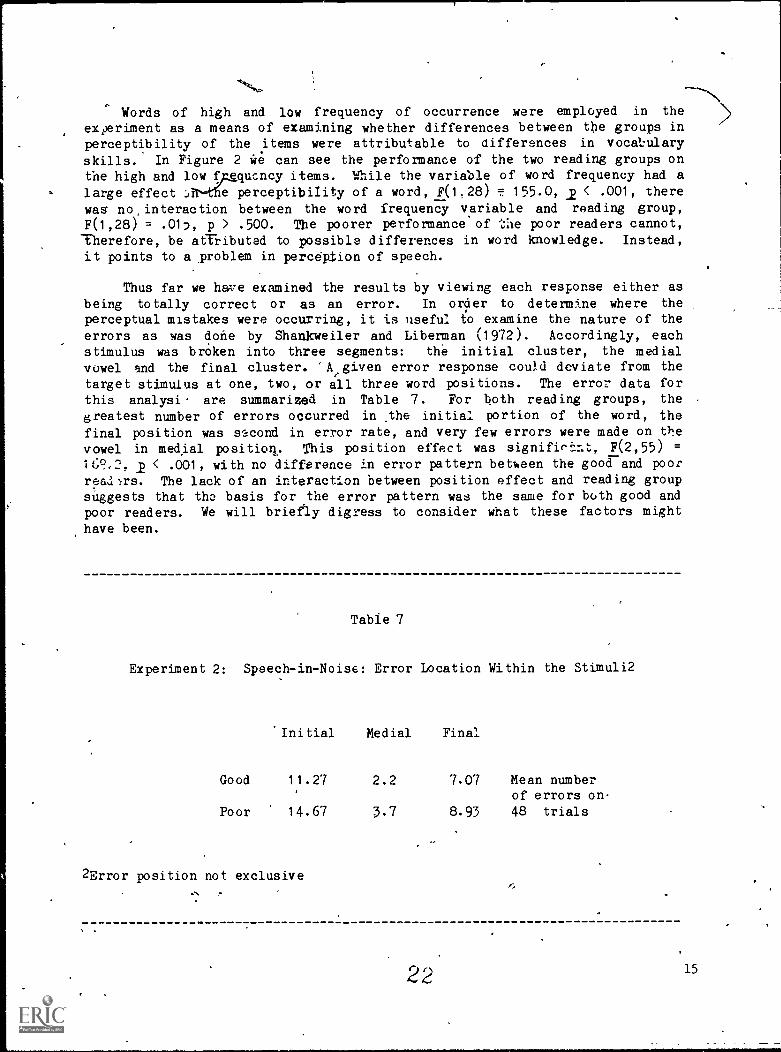
Words of high and low frequency of occurrence were employed in the
ex;)eriment as a means of examining whether differences between the groups inperceptibility of the items were attributable to differences in vocabulary
skills. In Figure 2 We can see the performance of the two reading groups onthe high and low tglqucncy items. While the variable of word frequency had alarge effect Ar-tfie perceptibility of a word, F(1.28) = 155.0, p < .001, there
was no,interaction between the word frequency variable and reading group,F(1,28) = .012, p > .500. The poorer performance of the poor readers cannot,Therefore, be aiTi.ibuted to possible differences in word knowledge. Instead,
it points to a ,problem in perception of speech.
Thus far we have examined the results by viewing each response either asbeing totally correct or as an error. In oraer to determine where theperceptual mistakes were occurring, it is useful to examine the nature of theerrors as was done by Shankweiler and Liberman (1972). Accordingly, eachstimulus was broken into three segments: the initial cluster, the medialvowel and the final cluster. 'A given error response could deviate from thetarget stimulus at one, two, or all three word positions. The error data forthis analysi are summarized in Table 7. For both reading groups, the
greatest number of errors occurred in the initial portion of the word, thefinal position was second in error rate, and very few errors were made on thevowel in medial positiorl. This position effect was significfint, F(2,55) =16? 2, < .001, with no difference in error pattern between the good and poop
read:-rs. The lack of an interaction between position effect and reading groupsuggests that the basis for the error pattern was the same for both good andpoor readers. We will briefly digress to consider what these factors mighthave been.
Table 7
Experiment 2: Speech-in-Noise: Error Location Within the Stimuli2
Initial Medial Final
Good 11.27 2.2 7.07 Mean numberof errors on-
Poor 14.67 3.7 8.93 48 trials
2Error position not exclusive
22 15


The uneven distribution of errors across the three word positions.seemsto correspond with the relative acoustic saliency of the segments. The vowel
in aceystic terms is more intense than consonants and is longer in durati.on.
It is therefore not surprising to.observe superior identification of vowels one
a listening :task. Our .finding that the
the
consonant (or consonant
cluster) is misheard more often, than the final consonant (or consonant
cluster) parallels research with Cirand VC syllables (see Ohde & Sharf, t977,for a major paper ija this area; and Ohde & Sharf, 1981, and Pols & Schouten,
1981, for recent discussions of those findings), and again seems to be related
to the acoustic characteristics of the segments. The results of research on
the speech cues suggest that the consonant in final position is more clearlyrepresented in the acoustic signal than is the initial consonant. Syllable
final formants have been observed to have transitions of greater duration(except following the vowels /e/ and /i/) (Lehiste & Petersdn, 1961 ) and
,greater frequency change (Broad & Fertig, 1970) than have initial transitions.Further, the vowel nucleus of the syllable has been found to provide a variety
of cues that may aid in identification of 'final segments. Peterson and
Lehiste, 1960; observed vowel lengthening accompanying voiced final fricatives
and voiced final consonants, -and greater nasalization, of vowels preceding
nasal consonants than for vowels following nasal consonants. - Thus final
consonants may be easier to perceive because a greater amount of information
specifies their identity.
In view of the position effects obtained here, it seemed appropriate to
examine the phonetic composition of errors occurring in initial and final
position. For both positions, an adequate sampling was available to compare
the relative frequencies of occurrence of errors on stop consonants andfricatives (see Table 8), but' not on liquids or nasals. Accordingly, an
analysis of variance was carried out on the stop consonant errors and the
fricative errors with error position, initial or .final, specified. In this
analysis our previous findings were again substantiated: good readers made
fewer errors, F(1,28) = 10.0, 2 = .004; more errors occurred on initial
position than on final, F(1,28) = 51.2, < .001; and there was no interaction
between reading. groups and the position effect. A significant difference was
obtained between the two phonetic categories examined. More stop consonants
were missed than fricatives, F(1,28) = 51.1, < .001 and an interaction
between reading group and phonetic category was obtained, F(1,28) = 5.4, 2 =.03. The poor readers missed the stop consonants significantly more often
than. did the good readers. This could be taken as an indication that poorreaders have particular difficulty in processing stop consonants. At the
presentwe are inclined to make the more conservative speculation that, with
the particular noise utilized, the stop information in the signals was
'relatively more obscured than was fricative information. Given that the
amplitude characteristics ot the word were preserved. in the noise signal, an
impprtant cue for Tricative identity would also be preserved while placeinformation for the stops would be less salient.
17 ,
24

t.
Table 8,
Experiment 26Y
Speech-in-Noise: Analysis of Error Position and Phonetic Category
ARelative occurrence of errors of a phonetic . category: e.g. the stop conso-
nants missed in initial position/ the stop consonants that occurred in
initial cluster.', -. .
Final PositronInitial Position...
Stops Fricatives -Stops Fricativesfr
Good 25.1 12.7 11.8 12.9
Poor 35.4 17.7 .17.7' 13.4
In sum,,we found that on the unmasked condition the poor readers did as
well as the good readers. When the perceptual system was stressed by theaddition of noise, the poor readers made significantly more errors in
perceiving the stimuli than did the good readers. With these results in hand,
we may now consider the question whether thesdifficultiei the poor reader has
yith reading may stem from a more general Problem in auditory perception. If
poor readers are generally inferior to good 'feeders on another auditory
perception task, where speech proCessing is not required, a different in-terpretation of the nature of the poor readers' problem would be necessary
than would be appropriate if the problem were specific to speech.
EXPERIMENT 3: Perception of,Environmental Sounds With and Without
Noise Masks
In the final experiment the subjects listened to a tape of environmental
sounds: first with the stimuli in noise, then in-quiet.
. .
the stimuli for this experDient were selected and .edited froth a magnetic
tape recording of environmental sounds that had- obtained \VTIC the
Neuropsychology Lhboratory at the University of Victoria (Spreen & TLAnton,1969). The source tape had 26 sounds, two of which were excluded for use here
because they contained speech. 'The remaining 24 stimuli, listed in Table 9,
included human nonspeech sounds (e.g., coughing)-, human activities (e.g.,knocking on a door), mechanical sounds (e.g., machine-gun fire), animal noises
18

a
C
Table 9 ,
Experiment 3: Environmental Sounds Stimuli
1. Knocking on a door
2. Water running from a faucet3: Organ - wedding march4. Phone ringing.
5. Whistling6. Airplane engine7. Door opening and closing8. Artillery9. Car starting up and driving away..
.10. Dial ing a phone
11. Drum12. Birds1.3. Church bell-time14. Frogs and crickets15. Piano`6. Dog barking
Trumpet fanfare18. 'Train whistle19. Cat meowing
20. Clapping21. Coughing22. Baby crying23. Thunder24. Typing
ti

hk.
(e.g., frog croaks and cricket chirps), and sounds of nature (e.g., thunder).Each sound was digitized on the Haskins Laboratories DDP-224 PCM system andrecorded on magnetic tape. One taped sequence, for the unmasked condition,contained the sounds presented in a fixed random order. In constructing thenoise-masked sequence, it was not advantageous to use amplitude matched noisesas we had done in the case of the speech perception experiment, since theamplitude characteristics of the environmental sounds often provided strongcues to the identity of those sounds. We therefore chose instead to use a`broad band (0 to 10 kHz) white-noise signal as the masking stimulus. Pilot'work suggested that a 0 dB S/N ratio, as employed in the speech task, did notsufficiently mask the stimuli, but that a -2 dB S/N ratio would be appropri-ate. A second sequence for the noise-masked condition was recorded with eachsound, masked by the white noise signal at the -2 dB S/N ratio. The stimulifor the two listening conditions were replayed at a comfortable listeninglever of approximately 75 dr SPL.
P rodedure
Both the noise-tasked and the unmasked stimuli were presented in a single-
session, with all subjects listening to the .noise-masked tape first. Prior tothe testing the examiner explained that the child would hear two sets ofsounds and that in the first set the items were recorded with noise. Thechild was asked Ito identify the source of each sound immediately after hearing
it, providing as much detail as possible. Three practice trials wereconducted, without noise, to familiarize the subject with describing nonspeechsounds.
Results and Discussion
e.,
The, subjects' responses were compiled into a single list. Before..,
scoring, all the responses to each sound were evaluated. A point system wasdevised ranging from 0 to 3. A score of zero was assigned if the responsebore no relation to the stimulus; three was awarded if a fully specificidentification had been provided. For the intermediate scores, a score of onewas given if the response reflected the nature of the sound though wrong indetail (e.g., for coughing, if the S responded ' talking' or 'laughing' that
person had correctly determined that a human vocal tract was the source); twowas assigned if the response was not inaccurate but somewhat unspecific (e.g.,for an organ playing the, wedding march, the response 'music' ). Responses
distributed themselves somewhat unevenly: for some of the stimuli not All'four of the scoring categories were assigned. The scoring was reviewed by acolleague who did not know which responses came from good readers and whichfrom poor ones. Discrepancies in numerical assignment by the two scorersoccurred' for two responses and these were resolved by joint discussion of thetwo cases. The subjects' answer sheets were then scored and ta
\ulated. The
1l`mean error score in the unmasked condition ;was 6.7 for the poor c aders and7.6, for the good readers (maximum =-72). In the noise-masked condition themean error scores .were 31.4 for the poor readers and 36.9 for the goodreaders. These performance levels 'are displayed. in the right-hand portion ofFigure 1.
, ...
. . \As in the speech perception experiment, few errors were made by either
.c.;:reading group in the unmasked condition. With the addition of masking noise,;,-
iAi,' -
I
27
performance for both groups was markedly reduced. The analysis of variance
revealed a main effect of noise, F(1,28) = 510.9, p < .001, and a main effect
of reading group, F(1,28) = 4.7,p = .04. We dole that the poor readers
performed better than the good readers on the nonspeech task. However, if age
and IQ are controlled, the difference did not reach significance,
F(1,26) = 3.6, p = .071.2 Given the equality of the performance of the poorreaders with that of the good readers on this nonspeech auditory task, we canrule out inattention as ,the explanatioi for their inferior performance on the
noise-masked speech perception task. The results of this control experimentfurther suggest that the difficulty the poor readers manifested in perceivingspeech in noise is not the, consequence of generally deficient auditory
perceptual ability, but rather is related specifically to the processing
requirements for speech.
DISCUSSION
Earlier work has demonstrated that children who are poor readers haveshort-term memory deficits in situations where the stimuli lend themselves-to
phonetic coding. The present experiments were intended to investigate the
basis of this deficit, by asking whether the language processing problems ofpoor readers may extend to the area of phonetic perception. Third-grade
school children selected :. for reading ability were first tested on serial
recall of word strings, a task that previously had been found to differentiategood and poor readers (Mann et al., 1980). As before, the poor readers made
more errors than the good readers. The results are consistent with the
hypothesis (Liberman et al., 1977; Shankweiler et al., 1979) that a failure to
use phonetic coding efficiently reads to the poor reader's deficiency inshort-term Memory for labelable stimuli.
In order to investigate the origin of this memory coding problem, the
subjects were further tested on two tasks. One of these employed spoken words
and the other, nonspeech environmental sounds. Each task was presented under
two conditions: one with a favorable signal-to-noise ratio and one withmasking noise. The results indicated a deficit for the poor reader group that
was specific to speech stimuli and occurred only in the noise-masked condi-
tion. Significantly more errors were made by the poor readers than the goodreaders when listening to speech in noise; the groups did not differ, however,in the perception of nonspeech environmental sounds, whether noise-masked ornot. This pattern of results suggests that the poor readers could process thespeech signal adequately, as expected, but they required a higher quality
signal for error-free performance than the good readers. The absence ofdifferences between the reading groups on the control experiment with environ-mental sounds suggests that the poor readers' problem is not-manifest on justany auditory task in which the stimuli are. noisy, but is instead more
selective. The joint outcome of these perception studies suggests that poorreaders require more complete stimulus information than good readers in orderto apprehend the phonetic shape of spoken words.
The present experiment has demonitrated associated deficits on the same
group of poor readers: inferior performance on serial recall and inferiorperformance on a stringent test of speech perception. We now turn to consider
how these two deficits might be related. First, we have noted that poor'
N, 21

readers show weak effects of phonetic similarity in recall tasks, a fact thathas been taken as evidence that they make inefficient use of phonetic codingin short-term memory. In the memory experiment of the present study, the
analysis of the error responses provides direct evidence that the poor readerswere using a phonetic code to retain material in short-term memory, though, of
course, less effectively than the good readers. The errors that occurred were
rarely semantically related to the target items, which might have indicateduse of an alternative coding strategy; instead, they consisted.of transposi-
tions of phonetic segments from adjacent syllables. Such an error pattern aswe obtained seems possible only if the subjects were indeed using a phonetic
coding strategy. Thus, it is apparent that whereas both good and poor readers
were phonetically coding the stimuli,' the poor readers were more, apt to
exchange segments across word boundaries and they experienced greater diffi-culty in retaining the crder of words within each word string.
Thus the suggestion that poor readers have greater difficulty in correct-ly retaining phonetic representations is corroborated by the pattern of their
errors on the serial recall task. In the word perception task, we obtainedevidence that poor readers also experience greater difficulty perceiving thephonetic form. On the contrary, analysis of errors in word perception showed
that good and poor readers did not differ in the effect of word frequency on
item identifiability. Therefore, the greater susceptibility of the poor
readers to errors of identification apparently does not arise from differences
between good and poor readers in vocabulary level. The problem thus appears
to be not in dealing with the linguistic content of the ..."Iimulus items, bu+
rather with the form. In perception a3 well as in recall of linguistic items,
the poor readers' problems would seem to stem from failure to adequately
internalize certain formal properties of language: in these instances,
properties relating to the phonetic pattern.
We may speculate therefore that the problems of'poor readers, evident onboth the memory task and the perceptual task, arise_ at least in part from a
common cause. In this connection, it may be relevant to recall the finding byRabbitt (1968), to which we have referred, in which there was shown to be a
relationship between recall performance and the stimulus factors that affect
perceptual clarity. When adult subjects were asked to recall strings of
digits, recall of items presented without noise was impeded if subsequent
items were presented in noise. Thus, making some items difficult to perceive
seems to reduce ability to rehearse the non-noisy items of the string also.
We may speculate, by extension, that poor readers' recall suffers in part from
the difficulties they incur in perceptual processing.
Thue one may surmise from our results that the recall performance of poorreaders for words presented auditorily suffers as a result of faulty phonetic
coding of the stimuli. Moreover, we suppose that this difficulty may arisewhenever a phonetic representation is formed irrespective of the sensorymodality of the signal. We base this conjecture on the outcome of earlierfindings (Liberman et al., 1977; Shankweiler et al., 1979) which have shownthat the failure of poor readers to make full use of phonetic coding in recalloccurs both with auditory presentation and with visual presentation of the
stimulus items. These parallel findings for presentation of stimuli by ear or
by eye led us to suppose that poor readers' problems in memory coding are of alinguistic nature.
22 29

It is noteworthy that other investigators who have employed similar
criteria for subject selection, but who have used very different experimentalapproaches to that adopted in the present study, have reached a similar
conclusion. Using the memory scan procedure of Sternberg (1966), Katz andWicklund (1971) have found slower encoding times for poor readers than forgood readers with visually-presented word-strings. If we are correct in
supposing that the,memory deficit in poor readers at least in part has itsorigin in phonetic perception,, it should be possible to. demonstrate differ-
ences in a variety of situations in the facility and accuracy with which good
and poor readers process linguistically codable material that is presented
either visually or auditorily.
REFERENCE NOTES
1. Szubowicz, L. A tutorial guide to Wendy: The Haskins wave editing and
display system. Haskins Laboratories, 1977.
REFERENCES
Baddeley, A. D. Short-term memory for word sequences as a function of
acoustic, semantic and formal similarity. Quarterly Journal cf
Experimental Psychology, 1966, 18, 362-365.Broad, D. J., & Fertig, R. H. Formant-frequency trajectories in selected CVC-
syllable nuclei. Journal of the Acoustical Society of America, 1970, 47,
1572-1582.Byrne, B., & Shea, P. Semantic and phonetic memory in beginning readers.
Memory & Cognition,' 1979, 7, 333-338.Carroll, J: B., Davies, P., & Richman, B. Word frequency book. New York:
American Heritage Publishing Company, Inc., 1971.
Conrad, R. Acoustic confusions in immediate memory. British Journal of
1964, 55, 75-84.
Conrad, R. Speech and reading. In J. Kavanagh & I. Mattingly (Eds.),
Language ly ear and ly eye: The relationships between speech and
reading. Cambridge, Mass.: MIT Press, 1972, 205-240.
Drewnowski, A. Memory functions for vowels and conscnants: A reinterprets- '
otion f acoustic similarity effects. Journal of Verbal Learning and
Verbal Behavior, 1980, 19, J76-193.
Dunn, L. M. Peabody picture vocabulary test. Circle Pines, Mn.: American
Guidance Service, 1965.Ellis, A. 4. :rrors in speech and short-term memory: The effect: of phonemic
similarity and syllable position. Journal of Verbal Learning and Verbal
Behavior, 1980, 19, 624-634.Finkenbinder, R. L. A descriptive study of the Goldman-Fristoe-Woodcock test
of auditory discrimination and selected reading variables with primary
school children. The-Journal of Special Education, 1973, 7, 125-131.
Goetzinger, C., Dirks, D., & Baer, C. J. Auditory discrimination and visual
perception in good and poor readers. Annals of Otology, Rhinology and
Laryngology, 1960, 69, 121-136.Goldman, R., Fristoe, M., & Woodcock, R. W. Goldman-Fristoe-Woodcock test of
auditory discrimination. Cir6le Pines, Mn.: American Guidance Service,
1970.
23

Katz, L., & Wicklund, D. A. Word scanning rate for good and poor readers.Journal of Educational Psychology, 1971, 63, 138-140.
Katz, R. B., Shankweiler, D., & Liberman, I. Y. Memory for item order andphonetic recoding in the beginning reader. Journal of Experimental ChildPsychology, in press.
Lehiste, I., & Peterson, G. E. Transitions, glides and diphthongs. Journal
of, the Acoustical Society of America, 1961, 33, 268-277.Liberman, I. Y., Shankweiler, D., Liberman, A. M., Fowler, C., & Fischer,
F. W. Phonetic segmentation and recoding in the beginning reader. In
A. S. Reber & Scarborough (Eds.), Toward a psychology of reading:112 proceedings of the CUNY Conferences. Hillsdale, N.J.: Erlbaum,
1977, 207-225.ticklider, J. C. R., & Miller, G. The perception of speech. In S. S. Stevens
(Ed.), Handbook of experimental psychology. New York: Wiley, 1951Mann V. A., Liberman, I. Y., & Shankweiler, D. Children's memc7y for
sentences and word strings in relation to reading ability. Memory &Cognition, 1980, 8, 329-335
Mark, L. S., Shankweiler, D., Liberman, I.
recoding and reading difficulty inCognition, 1977, 5, 623-629.
Miles, N. C., & Miles, T. R. Dyslexia as
Y., & Fowler, C. A. Phonetic,
beginning ,readers. Memory &
a limitation in the ability toprocess information. Bulletin of the Orton Society. 1977, 27, 72-81.
Naidoo, S. The assessment of dyslexic children. In A. W. Franklin &
S..Naidoo (Eds.), Assessment and teaching of dyslexic children. London:
Invalid Children's Aid Association, 1970.Ohde, R. N., & Sharf, D. J. Order effect of acoustic segments of VC and CV
syllables on stop and vowel identification. Journal of Speech andHearing Research, 1977, 20, 543-554
Ohde, R. N., & Sharf, D. J. Stop identification from vocalic transition plusvowel segments of CV and VC syllables: A follow-up study. Journal ofthe Acoustical Society of America, 1981, 69, 297-300.
Perfetti, C. A., & Lesgold, A. M. Discourse comprehension and sources of
individual differences. In M. Just & P. Carpenter (Eds.), Cognitiveprocesses in comprehension. Hillsdale, N.J.: Erlbaum, 1979.
Peterson, G. E., & Lehiste, I. Duration of syllable nuclei in English.
Journal of the Acoustical Society of America, 1960, 32, 693-703Pols, L. C. W., & Schouten, M. E. H. Identification of deleted plosives: The
effect of adding noise or applying a time window (A reply to Ohde andSharf). Journal of the Acoustical Society of America, 1981, 69, 301-303
Rabbitt, P. M. A. Channel-Capacity, intelligibility and immediate memory.Quarterly Journal of Experimental Psychology, 1968, 20, 241-248.
Schroeder, M. R. Reference signal for signal quality studies. Journal of the
Acoustical Society of America, 1968, 44, 1735-136.Schwartz, A., & Goldman, R. Variables influencing performance on speech-sound
discrimination tests. Journal of Speeci and Hearing Research, 1974, 12,
Z5-32.Shankweiler, D., & Liberffian, I. Y. Misreading: A search for causes. In
JJ. 1% Kavanagh & I. G. Mattingly (Eds.), Languageear and by eye: Therelationship between speech and reading. Cambridge, Mass.: The MIT
Press, 1972, 293-317.Shankweiler, D., & Liberman, I. Y. Exploring the relations between reading
and speech. In R. M. Knights & D. K. Bakker (Eds.), Neuropsychology oflearning disorders: Theoretical jproaches. Baltimore: University Park
Press, 1976, 297-313
24
31

Shankweiler, D., Liberman; I. Y., Mark, L. S., Fowler, C. A., & Fischer, F. W.
The speech code and learning to read. Journal of Experimental
Psychology: Human Learning and Memory., 1979, 5, 531-545.
Spreen, 0., & Benton, A. L. Sound recognition test. Victoria, B.C.:
Neuropsychology Laboratory, University of Victoria, 1969.
Sternberg, S. High-speed scanning in'human memory. Science, 1966, 153, 652 -
b74.Thompson, B. A longitudinal study of auditory discrimination. Journal of
Educational Research, 1963, 56, 376-378.Thorndike, E. L.,& Lorge, I. The teacher's word book of 30,000 words. New
York: College Press, 1944.Woodcock, R. W. Woodcock Reading Mastery Tests. Circle Pines, Mn.: American
Guidance Services, Inc., 1973.
FOOTNOTES
1In word final position the fricative and affricate set was slightlydifferent, consisting of /f/, /s/, /tS/, /j/, /0/ and /z/.
2 In Experiments 1 and 2, the data were likewise reanalyzed controllingfor age and IQ. In these experiments, the significance of the differencesbetween reading groups was not reduced when age and IQ were controlled.
,..
3 '4
25
THE USE OF ORTHOGRAPHIC STRUCTURE BY DEAF ADULTS: RECOGNITION OF FINGERSPELLED LETTERS
Vicki L. Hanson
Abstract. Deaf adults' knowledge of English word structure was
tested in a_task requiring letter, report for fingerspelled words,pseudowords, and nonwords. Deaf subjects, like hearing subjects,were sensitive to orthographic structure as indicated by accuracy of
letter report: Letters. of words were reported most accurately,while letters of pseudowords were reported more accurately thanletters of nonwords. Analysis of the incorrect letter reports forcorrectly recognized words revealed that deaf subjects tended toProduce orthographically regular responses. However, in contrast tothe reports of hearing subjects, the responses of deaf subjects did
not tend to be phonetically, consistent with the presented word.These results provide clear evidence that deaf adults are able toabstract principles of English orthography, although the phonetically inconsistent letter reports suggest that the spelling process fordeaf persons may be fundamentally different from that for hearingpersons.
The present research examines the use of orthographic structure by
prelingually and profoundly deaf adults. The orthography of English reflects
the phonological structure of the spoken language. Ai a result, segments of
*An earlier version of this paper was presented 'at the meeting of the AmericanPsychological Association, Los Angeles, August, 1981.
Acknowledgment. I am grateful to many people for their help on this project.
First, I would like to thank Carol Padden for making the stimulus tape. I
would also like to thank the people who made arrangements for facilities and
subjects' for the reported experiment and for pilot work: Nancy Fishbein,
Nancy Frishberg, Peg Hlibok, Gary Scharff, Dennis Schemenauer, and Marie
Taccogna. The cooperation of the following organizations and institutions is
gratefully acknowledged: National Center on Deafness at California StateUniversity, Northridge; New York University; New York Society for the Deaf;.Connecticut Commission for the.Deaf and Hearing Impaired; and the LinguisticsResearch Laboratory at Gallaudet College. John Richards graciously helpedwith portions of the data analysis. The handshapes in Figure 1 were drawn by
John Conti. Portions of this research were conducted while the author was apostdoctoral-fellowat The SalkInstitute for Biological StUdiea. The workwas supported by the Nationallnstitute of Education Grant #NIEG-80-0178 andby NINCDS Research Service Award #NS06109 and NICHD Grant HD-01994.
[HASKINS LABORATORIES: Status Report on Speech Research SR-69 (1982)7
27

the written language map onto segments of the spoken language. The question
here is whether deaf adults, in the absence of normal speech input, are ableto abstract the regularities of English orthographic structure.
Ability to use the regularities of the orthography is an important
component both in word recognition and in spelling. Research on wordrecognition with normallyhearing adults has found that there is an advantagein letter recognition for orthographically regular nonsense words (pseudowords) over orthographically irregular nonwords (Aderman & Smith, 1971; Baron& Thurston, 1973; Carr, Davidson, & Hawkins, 1978) and an advantage in letterrecall for these regular over irregular nonsense words (Gibson, Pick, Osser, &Hammond, 1962).
In spelling, the ability to access and exploit the orthographic regularities of English is a factor determining spelling success. While accuratespelling of words can result from rote memorization or from visual recognitionof the correct spelling from a collection of possible spellings (Simon &,Simon, 1973; Tenney, 1980), these strategies ignore the systematic aspects ofEnglish orthography (Chomsky, 1970; Klima, 1972; Venezky, 1970). Recent workby Fischer (1980) has shown that good spellers have greater ability to exploit
these regularities of the orthography than do poor spellers.
To date, Tittle work has been concerned with the question of use of
orthographic structure bi deaf individuals. One study that has been directedat this issue is that of Gibson, Shurcliff, and Yonas (1970). Testing forrecall of tachistiscopically presented pseudowords and nonwords, they found
that deaf adults, like hearing adults, correctly recalled more of the
orthographically regular than of the orthographically irregular letter
strings. Similar findings were obtained by Doehring & Rosenstein (1960) in an
experiment with deaf children (ages 9-16 years). They found better recall ofCVC trigrams (pseudowords) than of CCC trigrams (nonwords). These findingsled Gibson et al. (1970) to conclude that "The redundancy contributed by
invariant mapping of speech sounds may well make it easier for the hearingchild to pick up the common spelling patterns an' regularities as he learns toread, but clearly it can be done without this" (p. 71).
The present research examined their conclusion. The ability of deafadults to use orthographic structure in word recognition and in reporting theletters of words was tested. Deaf subjects in this research were all
congenitally and profoundly deaf adults. These persons are unable to acquireknowledge of speech by normal means: -Since the orthography of Englishreflects the structure of the spoken language, these deaf adults may beexpectea to be less able than hearing adults to acquire knowledge of thisstructure and to use it. If, however, as suggested by Gibson et al. (1970),
ability_ to acquire knowledge- of-orthographic structure does not depend on
availability of normal speech input, then deaf adults may still be able to 4
acquire this knowledge. To investigate whether these deaf adults differ fromhearing adults in the use of orthographic structure, the performance of agroup of normallyhearing subjects was compared with that of deaf subjects.
The use of orthographic structure was investigated testing recognition
and recall of fingerspelled letter strings. Fingerspelling is a manualcommunication system based on English in which words are spelled out by the
28
34

sequential production of letters of the manual alphabet. As shown in Figure
1, the American manual alphabet has a handshape for each letter of the English
alphabet. Fingerspelling is used both in American Sign Language (ASL orAmeslan) and in manual communication systems based on English.
In fingerspelling, words are presented as a temporally sequential display
of individually produced letters with an average presentation rate of 20 msec
per letter (Bornstein, 1965). Letters are displayed with the hand held in one
spatial location. For printed letters, display characteristics such as this
make word recognition difficult. With sequential presentation of printed
letters displayed in one spatial location, normally-hearing readers can
accurately name words only when the duration of each letter is at least 375
msec (Kohlers & Katzman, 1966). Even when the printed letters are spatially
distinct, ability to read words is dramatically reduced for sequentially
displayed individual letters compared with multi-letLEr displays (Newman,
1966). -Fingerspelling provides an interesting case in word recognition in
that fingerspelled words can be recognized at rates that are difficult for the
recognition of sequentially presented printed letters. For this reason, a
secondary goal of the present research, was to examine skilled reading of
fingerspelling.
A sequential presentation of letters might suggest sequential recognition
of individual letters. However, it-may be that, similar to the recognition of
printed words, orthographic structure iss used in the recognition of
fingerspelled words. Since it has been demonstrated that there are "co-
articulatory" effects in skilled fingerspelling, with letter context
influencing letter production (Reich, 1974), this could allow for the use of
orthographic structure in word recognition.
In the present experiment, fingerspelled words, pseudowords, and nonwords
were presented to deaf and hearing adults skilled in the use of fingerspel-
ling. If orthographic structure is used in processing the fingerspelled
stimuli, then letters of orthographically regular nonsense wrds should berecalled more accurately than letters of orthographically irregular nonsense
words. Errors in letter report for words were analyzed to'examine orthograph-
ic regularities in production for both deaf and hearing subjects.
METHOD
Stimuli
t.
Sixty stimulus items were used. Thirty were real words chosen from
__samples _ofwordsfound misspelled in writingby -01-eraa--aduit-d. These words
ranged in length from five to thirteen letters, mean length being 8.3 letters
per word. The words ranged in frequency of occurrence from 1 - 190 (median of
10.5) according to Kucera and Francis (1967). These thirty words were matched
in mean length'with 20 orthographically regular pseudowords (e.g., BRANDIGAN,
MUNGRATS, VISTARMS) and 10 orthographically irregular nonwords (e.g., FTER-
NAPS, PKANT, VETMFTERN). . The selection criteria for the orthographically
regular and irregular words were in accord with the criteria outlined in
Appendix A of Massaro, Venezky, and Taylor (1979). According to these
criteria, the regular strings (pseudowords) were pronounceable and had ortho-
29

HI J K
0 PCo
Q
Figure 1. Handshapes of the American Manual Alphabet.

graphically legal spelling patterns. The irregular strings (nonwords) con
tained unpronounceable consonant clusters. A complete listing of the stimuli
is given here in the Appendix.
.,Stimuli were recorded on videotape by a deaf native signer of ASL (i.e.,
a person who had deaf parents and had learned ASL as a first language). The
signer made no mouth movements nor facial expressions that would indicate the
lexical status of items. Measurement of the length of each recorded itemrevealed a mean presentation rate of 354 letters per minute. This rate is
consistent with the rate found by Bornstein (1965) to be a natural ASL rate.The production rate for the thirty words did not differ from the production
,rate for the other thirty items, t(58)=1.87, p.05. Words, pseudowords, and
nonwords were mixed throughout the list. Following each item, a blank
interval of approximately, 10 seconds was recorded for use as a response
period.
Procedure
Subjects were instructed that they would see many fingerspelled items and
that for each they were to make two responses: First, write the letters of
the item they had just seen; second, make a lexical decision. They were to
cirole, YES or NO on,their answer sheet to indicate whether they thought the
presented letter string was or was not an actual word. The instructions,
signed in ASL, were recorded on videotape.
Subjects were run in groups of one to six persons. The entire experiment
lasted approximately 30 minutes.
Subjects
A group of deaf subjects and a group of hearing subjects were tested.
Subjects in both groups had deaf parents and had learned fingerspelling from
their parents.
Deaf subjects were 14 congenitally deaf .adults recruited through New York
University and California State University, Northridge. All were profoundly .
deaf. Thera were six women and eight men, ranging in age from 17 53 years,
median age 28,5 years.
Hearing Aubjects were recruited through interpreter services in Connecti
cut and New York. There were five 'women and three men ranging in age from
22 --49 years, median age 29 years.
RESULTS AND DISCUSSION
To examine possible processing differences for the two groups, the eight
hearing subjects were matched in overall accuracy with eight deaf subjects.
Overall accuracy was determined for each subject as the percentage of correct
responaes across conditions. Only items for which there was both a correct
lexical decision and a correct report of all letters were considered to be
correct responses. Overall, hearing subjects had an accuracy rate of 43.7%
(range 21.7% 65.0%). Eight deaf subjects, whose accuracy was in the middle
37
31

of the performance range for the 14 who participated, performed at a
comparable level. Overall they were 40.8% accurate- (range 20.0% 70.0%);
which was not significantly different from the accuracy of the hearing
subjects, t(14)=.34, 1).05. Further analyses are based on these two matchedgroups of.eight subjects each-.
Lexical Identification
Mean overall accuracy for the lexical decision task was 85.5%. Analysis,
of ,group (deaf, hearing) by stimulus type (words, pseudowords, nonwords) foundthat there was no significant difference in accuracy across stimulus type,F(2,28)=.88, MSe=70.06, p.05, nor was there an interaction between:group andstimulus type, F(2,28)=.74, MSe=70.06, p.05. There was a tendency for deafsubjects to perform this task more accurately than hearing subjects, althoughthe difference only approached significance, F(1,14)=3.00, 144:339.35, 1<.20.The performance of both groups of subjects in this task is shown in Table 1.
'Table 1
Mean percentage correct lexical decisicns and correct identification of words.
Deaf Hearing
Lexical DecisionsWOIJS 91.7% 80.4%
Rseudowords 89.4% 84.4%
Nonwords 88.8% 77.5%
Word Identification:correct lexical decision
93.0% 92.6%
To ensure that this high accuracy could not have been due to some non
linguistic cue to wordness of the stimulus items (e.g., facial cues or"awkward" production of pseudowords and nonwords), eight hearing adults, naivewith respect to fingerspelling, were asked to make lexical decisions regarding
the stimuli. They viewed the videotape and were told that for every
fingerspelled item they were to circle YES or NO on their answer sheet to
indicate whether or not they thought the item was an actual word. This group
of naive adults was only 49.2% accurate in the task, a rate that does not
differ from chance performance, x2(1)=.05, 1)05. Therefore, the high accura
cy of the two groups of deaf and hearing subjects in this task can be
attributed to their knowledge of fingerspelling.
32
38

J
The whole report technique of the present experiment allowed for a
determination asto whether or not there was correct identification of words.Three types of response errors were considered to be 'failures to identify the
word. First were those responses on which more than 50% of the letters were
omitted. These omissions were rare; only three such errors were made (by deaf
subjects). The ,second source of error consisted of responding with a
morphologically incorrect form of-the word '(e.g., baptized for BAPTIZE) and
accounted for three errors o,f the deaf subjects and five errors of the hearing
subjects. The third source of error consisted 'of responding with the wrong
word ('e.g., complicate -for COMMUNICATE), accounting for five errors.of the
'deaf subjects and nine errors of the hearing subjects. Table 1 presents
subjects' accuracy of word identification given a,correct lexical decision.
Deaf and hearing subjects did not differ in their accuracy on word,identifica
tion, t(14)=.09, p.05.
These latter two sources of error in lexical identification appear_ to
result from guessing the word on the basi's of a few letters. It should be
pointed out that th4 strategy of identifying a word on the basis of a few
perceived lettrs i& not a bad one in normal conversations. In these
conversations, letters of fingerspelled words are often omitted or sloppily
produced Caccamise, Hatfield, & Brewer, 1978), but within the syntactic and
semantic context provided by the conversation, word identification from
7.partial informat,on is possible. In the present task, however, recognition of
only a few letters led to the errors in lexical identification. These errors
resulted both in incorrectly identifying actual, words and in incorrectly
responding that pseudowords and nonwords were words (e.g., raps. for RAPAS and
veteran for VETMFTERN).
Letter Report Accuracy
Given a correct response on the lexical decision task and a correct
lexical identification of the words, how accurate were subjects at reporting
all the letters of an item? A summary of this performance by the two groups
on each word type is shown in Table 2. An analysis of the percentage correct
was performed on group (deaf or hearing) by word type (word; pseudoword,
nonword) for trials on which there was a correct ,exical decision and
identification. The analysis revealed a strong effect of word type,
F(2,28)=170;03, MSe=129.32, 2 <.001. This difference was significant betweenall word types (NewmanKeuls, 2,<.01), thus indicating effects of word famili
arity (letters of words better 'recalled than letters of pseudowords) and
orthographic structure (letters of pseudowords better recalled than letters of
nonwords). There was no main effect of group for accuracy of letter report,
F(1,14)=1.65, MSe=368.33, 2>.05, but there was an interaction of group by word
Type, F(2,28)=6.70, MSe=129.32, 2 <.005. Analysis of the simple effects
revealed that the two subject groups differed in letter report accuracy for
words, F(1,28)=13.93, 2<.001, but did not differ significantly in letter
report accuracy for pseudowords, F(1,28)=,00, p.05, or nonwords, F(1,28)=.29,
2>.05. Thus, the interaction of group by word type was due to greater
accuracy by hearing than deaf subjects on letter report for words.
33

34
Table 2
Mean percentage correct report of all letters given a correct identificationof words and a correct lexical decision for the pseudowords and nonwords.
Words
Pseudowords
Nonwords
r
Deaf Hearing
70.2% 92.3%
30.7% 31.4%
9.3% 6.0%
If subjects were using orthographic structure in the processing of words
and pseudowordg, there should be honindependence of letter report for thesestimuli. That is, the probability of letter report of a given letter shouldbe a function ofIthe probability of the recall of the other letters. in the
word. This interdependence of letter report' would mot be expected to beinvolved in letter report for nonwords, however, since principles of Englishorthography are violated in these nonwords. Tests for independence of letter
report were performed separately on- words, pseudowords, and nonwords.
Independence is indicated if the following equation holds:
p(al letters of an item) =,p(individual letter)n (1)
where n=number of lettei.r"in the word.
Analyzing for group (deaf or hearing) by word length by probability .(allletters vs, individual letterS), itwas found that for'words and,pseudoWordsthe probability of correctly reporting all the letters of the item was greater
than the probability of reporting the letters independently: -for words,
V1,14)=71.71, M5e=263.40, 11.<.001; for pseudowords, F(1,14)=86.95, MSe=285.02,11.<.001. The effect did not interact- with subject populatitn for either theanalysis of words, F(1,14)=.22, Mse=263.40, .0.05, or pseudowords,
F(1,14)=.81, MSe=285.02, p.05. Thus., the letters of words and pseudowOrdswerenot processed independently. However, for the fingerspelled items thatviolated orthographic structure"(the nonwords), the probability of correctlyreporting all the letters of the item was not greater than.the probability ofindependently reporting each letter, F(1,14)=1.98, MSe=103.43, p.05. For
nonwords, therefore, the letters were processed independently. As before,
there was no interactiom with subject group, 1(1,145=1.35, mse=103.43, p.05.
These results give evidence for the ability, of .deaf adults to use
orthographic structure. Similar to the orthographic structure effects previ-
ously reported for deaf adults by Gibson et al., (1970), the present study
found greater accuracy in letter report for pseudowords than nonwords. In
accord frith these findings, the nonindependsnee of letter processing for words
and pseudowords indicates interdependence of letter processing. That is,processing of a given letter was influenced by other letters of the word or
4O

pseudoword. There le also other indications that deaf and hearing subjectsin the present experiment were aware of violations of English orthography:
When ,.the fingnrapelled nonwords were presented, subjects often laughed.
Generally a look of surprise would appear.og their faces at these violations
of orthographic structure.
Together, the above results also clearly indicate that orthographic
structure is' used in processing fingerspelling. They indicate that eventhough letter presentation is temporally sequential, letter processing is
influenced by surrounding letters. Since there are coarticulatory effects inskilled fingerspelling, it is reasonable to assume that a fingerspelled letter
contains information about adjacent letters. A skilled fingerspellertherefore, be expected to make use of this context information in wordrecognition (see Wickelgren [1969, 1976] for a discussion of contextsensitive
coding in speech). mata contextsensitivity may explain how orthographicstructure is'able to be-Zed in identifying fingerspelled letters despite thetemporally sequential display of letters, and may explain how these sequential
letters can be processed so much more rapidlythan sequentially presentedprinted letters.
In addition to the effects of orthographic structure, word familiarity
effects were found here. These word familiarity effects, involving betterrecall Of letters of words than letters of pseudowords, are consistent with
the greater accuracy of letter report for letters of printed words than for
letters of printed pseudowords (Manelis, 1974; Spoehr & Smith, 1975). A word
superiority effect of fingerspelled words over fingerspelled nonwords, consistent with the present findings, has been reported earlier by Zakia and Haber
(1971).
Some theorists attribute the word familiarity effect to the fact thatwcrds allow for holistic recognition of visual configurations. However, it is
unlikely that this interpretation can account for the present results for the
`following reason: The majority of stimulus words would rarely, if ever, havebeen seen as fingerspelled words by the subjects prior to this experiment
because the words would- tend to-be signed rather than fingerspelled in signed
conversations. The familiarity that the subjects have with these words,
therefore, would be with the printed form of the word. This situation is
analogous, perhaps, to that of the recognition of mixed -/case printed words in
that the orthographic integrity of the words is preserved, but the visual
configuration is disrupted. Studies have found the while there is a perceptual advantage for samecase over mixedcase words, word, familiarity effects areobtained with mixedcases, indicating that. the word'familiarity effect neednot be totally attributable to holistic word recognition (Coltheart & Freeman,1974; McClelland, 1976): What, then, contributes to superior letter reportfor words in the present experiment?
Two factors appear to be involved. The first is that the associationsbetween letter sequences of words should be stronger than the associations forthe sequences of permissible although novel items. These stronger associations would allow more perceptual facilitation of letters for words than
pseudowords (Adams, 1979). Thus, the letters would be more accurately
recognized for tiords than for pseudowords. The'second factor contributing to
the word familiarity effect is one of memorability. Pseudowords and nonwords
35
4i

60
400ir
. w
20
DEAFHEARING ,
DELETIONS INSERTIONSSUBSTITUTIONS TRANSPOSITIONS
Figure 2. Mean percentage occurrence of each error type for deaf and hearingsubjects.

represent novel letter sequences. The subjects must recall the letters babed
on a single presentation. But for words, once the word is recognized, thesubjects are able to bring their productive spelling abilities to bear on the
task of letter report. Incorrect letter reports for these words, in this
respect, represent. spelling errors.
Incorrect Letter Reports for Words
Each incorrect letter report for a correctly identified word was scored
in three ways0 : (1) each was classified as to whetner or not the reportedletter string produced a sequence that preserved the phonetic structure of the
presented word, (2) each was classified as to whether the reported sequencewas orthographically regular or irregular, and (3) each was classified as to
the type of error.
For hearing adults and children, the predominant form of spelling error
is a phonetically consistent but orthographically incorrect rendering of the
intended word (Fischer, 1980; Frith, 1980; Masters, 1927), In these misspel-lings, each phonetic segment of the word is.graplemically represented in the
order of occurrence. The phonetic structure is therefore maintained in the
misspelling. Did the incorrect responses for words in the present experimentpreserve the phonetic structure ofthe words presented? Analysis revealed
that the hearing subjects made more incorrect letter reports phonetically
equivalent to the target word than did the deaf subjects,x2(1) =10.01,2<.005.For hearing subjects, the mean percentage of such responses was 63.6%; for
deaf subjects, the corresponding percentage was only 18.6%.
But while the letter reports for deaf subjects were not consistent with
the phonetic structure of the target word, by and large, the responses were
orthographically regular. Orthcgraphically regular words, in accord with
Massaro et al. (1979), were both pronounceable and contained only legal
consonant and vowel clusters. For deaf subjects, 93.8% of the ',incorrect
responses were regular English letter sequences. For hearing subjects, 95.8%
were regular. There was no difference in the frequency of deaf and \hearing
subjects making such responses, X2(1)=.62, .0.05. This indicates that, like
hearing adults, deaf adults have a definite knowledge of English orthographic
LI constraints.
The incorrect letter reports were further classified using the following
categories of error type: letter deletions, substitutions, insertions, and
transpositions. As shown in Figure 2, a major difference in error type for
deaf and hearing subject's was the tendency for deaf, but not hearing, subjects
to order the letters of words incorrectly, resulting in a transposition of
phonetic segments. Some examples are adveristement for ADVERTISEMENT, funreal
for FUNERAL, hemsiphere for HEMISPHERE, viedo for VIDEO, and vechile for
VEHICLE. While deaf Subjects made 17 errors of this type (representing 23.9%
of their total errors), only: 1 such error was made by hearing subjects (7.7%
of the total). For hearing persons, the incidence of letter transpositions is
generally so low that it may be possible to account for all the errors inspelling experiments without even including a category for letter transposi-
tions (Fischer, 1980). It is interesting to note that none of these
transpositions preserved the phonetic str..cture of the words. In all cases
the transposed letters incorrectly ordered phonetic segments.
37
43

Little work has been undertaken to understand the spelling process fordeaf persons.' The present finding of the low percentage of letter reportsphonetically equivalent to the target is of great interest as it suggests thatthe cognitive processes underlying Spelling for deaf adults may be fundamen-tally different from those underlying productive spelling for hearing adults.Models ofthe spelling procasi for hearing persons commonly hypothesize thatproductive spelling involves generating a phonetic representation of thetarget word and then generating possible orthographic realizations of thisrepresentation (Frith, 1980; Simon & Simon, 1973). These models thereforeaccount for the tendency of hearing persons to make misspellings that preservethe phonetic structure of the intended word.
The low incidence of phonetically consistent letter reports by the deafadults in this experiment suggests that the spelling process of deaf personsis not well described by the 'se models. The few studies that have beenconcerned with the spelling process for deaf persons have been conducted withdeaf children. Dodd (1980) examined the spelling of words by orally-traineddeaf children in England- The task in Dodd's experiment was to lipread wordspronounced by'the experimenter and then spell the words. The children (meanage 14.5 years) made only abort 11% misspellings that were classified asreflecting the phonetic structure of the pronounced words. It should benoted, however, that 64.8% of the children's errors were classified as
"refusals" to spell the pronounced word. If only the actual misspellings of
the children are considered in Dodd's data, the incidence of phoneticallyconsistent misspellings is 31.5%.
In another experiment designed to determine the underlying spelling
processes of deaf children, Hoemann, Andrews, Florian, Hoemann, and Jansemp(1976) found that few of the misspellings of the deaf and hearing-impairedchildren they tested could be considered phonetically equivalent to.the targetword. Children in their experiment were ages 6 - 19 years and were beingeducated with the Rochester Method (combined speech and fingerspelling). The
children were presented with pictures of objects and were asked to spell thename of each of the objects. Earlier work had found that the majority ofmisspellings made by hearing children on this task were phonetically consis-
tent with the target word (Mendenhall, 1930). No more than 19% of themisspellings of the children tested by Hoemann et al. could he considered
phonetically equivalent to the target.
Cromer (1980) analyzed samples of free writing from six orally-educated
deaf children in England (median age 10.5 years). By Cromer's analysis,
62.25% of the misspellings of the deaf children were "phono-graphic errors,"defined as resembling "in some respect the sound of the target word whenpronounced" (p. 412). By this definition, errors such as basking for "basket"
and amanals for "animals" were scored as phono-graphic errors. Thus, not allthese phono-graphic errors would be phonetically consistent with the target.Examining Cromer's corpus of errors' according to the present concern of
phonetic misspellings, it is apparent that only few of the misspellings can beconsidered to be consistent with the phonetic structure of the intended word.
One final point is worth mentioning. The deaf children studied by Cromer
(1980) made transpositions similar to those made by the adults in the present
study. Cromer classified these transpositions and ordering errors under the
38
4,1

category "Visual Errors." While this type of error accounted for 15.75% of the
errors made by the deaf children in his study, no such errors were made by the
normallyhearing control children. As 'with the present findings, these
ordering errors did not preserve the phonetic structure of the target word.
Together, these studies with children and the present one with adults ace
consistent, a consistency that is especially striking given the differences in
methodology of these studies and the differences in the age and language
background of the subjects. These studies converge on the findi g that deaf
persons do not make phonetically consistent spelling errors to tit degree that
hearing persons do. The suggestion from these findings is that the 'spelling
process for deaf persons may be fundamentally different from the spelling
process for hearing persons. In comparison with hearing persons, it appears
that deaf persons'may make less use of a stored phonetic representation of
words when spelling. The types of errors they make appear to be consistent
with what Ellis (in press) terms as errors based on "partial lexical
knowledge" in which the speller knows "some but not-all of the letters, or all
of the letters but not the correct order." While the errors of deaf adults in
the present experiment were often consistent with this definition, it should
be borne in mind that deaf signers may have additional strategies available to
them.
One strategy of deaf signers in the present experiment deserves mention:
'Very often the deaf subjects fingerspelled items on their hands before writing
their responses. This fingerspelling often allowed them to try different
spellings in an effort to decide the correct letter sequence. This "trying
out" spellings should not be thought of as equivalent to the strategy of
writing down various spellings of a word to determine which "looks" correct.
The deaf subjects occasionally employed this strategy also. Rather, the
manual strategy seems more to determine which spelling "feels" correct. Often
subjects did not even look at their hands while trying out the letter
sequences. Often the hand they were not using for writing their answers was
held under the table as they fingerspelled tie different sequences. This
suggests, therefore, that whereas a component of the spelling process for
hearing persons is phonetic, a component of the spelling process for deaf
siks:.rs may be kinesthetic.
CONCLUSIONS
The present experiment clearly indicates that deaf adults are able to
make use of orthographic structure. This was shown both in the recalladvantage for orthographically regular over orthographically irregular letter
strings, similar to the findings of Gibson et al. (1970), and in the analysis
of errors in letter reports for words. These results support the conclusion
of Gibson et al. that while the mapping of speech sounds to graphemes may
facilitate the acquisition of orthographic structure for hearing persons,
Congenitally and profoundly deaf persons are, nevertheless, able to acquire
this knowledge.
The analysis of letter report errors for words indicates that the deaf
adults were sensitive to the orthographic regularities of English in their
productions. But in contrast to the hearing adults, the responses of deaf
39
45

adults were not consistent with the phonetic structure of words. These
results suggest that deaf adults may use orthographic but not phonetic
structure when spelling.
A secondary goal of the present research was to examine recognition offingerspelled words. The work suggests'that.signers, both deaf and hearing,make use of orthographic structure in the processing of fingerspelling.
REFERENCES
Adams, M. J. Models of word recognition. Cognitive Psychology, 1979, 11,
133-170.Aderman, D., & Smit' , E. E. Expectancy as a determinant of functional units
in perceptual recognition. Cognitive Psychology, 1971, 2, 117-129.Baron, J., & Thurston, I. An analysis of the ,word- superiority effect.
Cognitive.Psychology, 1973, 4, 2077228.-Bornstein, H. Reading the manual alphabet. Washington, D.C.: Gallaudet
College Press, 1965.Caccamise, F., Hatfield, N., & Brewer, N. Mandal/Simultaneous Communication
(M/SC) research: Results and implications. American Annals of the Deaf,1978, 123, 803-823.
Carr, T. H., Davidson, B. J., & Hawkins, H. L; -Perceptual flexibility in word
recognition: Strategies affect orthographic computation but not lexicalaccess. Journal of Experimental Psychology: Human Perception and
Performance, 1978, 74, 674-690.
Chomsky, N. Phonology and reading. In H. Levin & J. P. Williams (Eds.),
Basic studies on reading. New York: Basic Books, 1970.
Coltheart, M., & Freeman, R. Case alternation impairs word identification.
Bulletin of the Psychonomic Society, 1974, 3, 102-104.Cromer, R. F. Spontaneous spelling by language-disordered children. In
U. Frith (EL..), Cognitive processes in spelling. London: Academic
Press, 1980.Dodd, B. The spelling abilitites of profoundly pre-lingually deaf children.
In U. Frith (Ed.) Cognitive processes in spelling. London: Academic
Press, 1980.Doehring, D. G., & Rosenstein, J. Visual word recognition by deaf and hearing
children. Journal of Speech and Hearing Research, 1960, 3, 320-326.
Ellis, A. W. Spelling and writing (and reading and Speaking). In A. W. Ellis(Ed.), Normality and pathology in cognitive functions. London: Adademic
Press, in press.
Fischer, F. W. Spelling proficiency and sensitivity to linguistic structure.Unpublished doctoral dissertation, University of Connecticut, 1980.
Frith, U. Unexpected spelling problems. In:U. Frith (Ed.), Cognitive
processes in spelling. London: Academic Press, 1980.Gibson, E. J., Pick, A., Osser, H., & 'Hammond, M. The role of grapheme-
phoneme correspondence in the, perception of words. American Journal of
Psychology, 1962, 75, 554-570.Gibson, Elf J., Shurcliff, A., & Yonas, A. Utilization of spelling patterns by
deaf and hearing subjects. In H. Levin & J. P. Williams (Eds.), Basic
studies in reading. New York: Basic Books, Inc., 1970.
40
46

Hoeclann, H. W., Andrews, C. E., Florian, V. A., Hoemanu, S. A., & Jansema,
C. J. The spelling proficiency of deaf children. American Annals of the
Deaf, 1976, 121, 489-493.
Klima, E. S. How alphabets might reflect language. In J. F. Kavanagh '&
I. G. Mattingly (Eds.), Language tx ear and by eye. Cambridge, Mass.:
MIT Press, 1972.Kohlers, P. A., & Katzman, M. T. Naming sequentially presented letters and
words. Language and Speech 1966, 9, 84-95.
Kucera, H., & Francis, W. Computational analysis of present-day American
English. Providence, R.I.: Brown University Press, 1967.
Manelis, L. The effect of meaningfulness in tachistoscopic word perception.Perception & Psychophysics, 1974, 16, 182-192.
Massaro, D. W., Venezky, R. L., & Taylor, G. A. Orthographic regularity,
positional frequency, and visual processing of letter strings. Journal
of Experimental Psychology: General, 1979, 108, 107-124.
Masters, H. V. A study of spelling errors. Iowa City: University of Iowa
Studies in Education, IV (4), 1st Series 138, September 1, 1927.
McClelland, J. L. Preliminary letter identification in the perception ofwords and nonwords. Journal of Experimental Psychology: Human
Perception and Performance, 1976, 1, 80-91.
Mendenhall, J. E. An analysis of spelling errors: A study of factors
associated with word difficulty. New York: Bureau of Publication,
Teachers College, Columbia University, 1930.
Newman, E. B. Speed of reading when the span of letters is restricted.
American Journal of Psychology, 1966, 79, 27227e.Reich, P. A. Visible distinctive features. In A. Makkai & V. B. Makkai
(Eds.), The First LACUS Forum. Columbia, S.C.: Hornbeam Press, 1974,
348-356.Simon, D. P., & Simon H. A. Alternative uses of phonemic information in
spelling. Review of Educational Research, 1973, 43, 115-137.Spoehr, K., & Smith, E. The role of orthographic and phonotactic rules in
perceiving letter patterns. Journal of Experimental Psychology: Human
Perception and Performance, 1975, 1, 21-34.Tenney, Y. J. Visual factors in spelling. In U: Frith (Ed.), Cognitive
processes in spelling. London: Academic Press, 1980.
Venezky,,R. The structure of English orthography. The Hague: Mouton, 1970.
Wickelgren, W. A. Context-sensitive coding, associative memory, and serial
order in (speech) behavior. Psychological Review, 1969, 76, 1-15.
Wickelgren, W. A.' Phonetic coding, and serial order. In E. C. Carterette &
M. P. Friedman (Eds.), Handbook of perceptions Vol VII: Language and
Speech. New York: Academic Press, 1976.
Zakia, R. D., & Haber, R. N. Sequential letter and word recognition in deafand hearing subjects. Perception & Psychophysics, 1971, 9, 110-114.
41
417

42
Appendix
Words Pseudowords
ADVERTISEMENT. BRANDIGAN
AWKWARDLY CADERMELTONBANKRUPTCY CHIGGETHBAPTIZE COSMERTRANCADILLAC EAGLUMATECAREFUL FREZNIKCHIMNEY FRUMHENSERCOMMUNICATE HANNERBADELABORATE INVENCHIPFUNERAL MUNGRATSGRADUATE PHALTERNOPEHELICOPTER PILTERNHEMISPHERE` PINCKMOREINTERRUPT PRECKUMMOUNTAIN RAPASPANTOMIME SNERGLINPHILADELPHIA STILCHUNINGPHYSICS SWITZELPREGNANT VALETORPSYCHOLOGICAL VISTARMSPUMPKINRHYTHM NonwordsSUBMARINE CONKZMERSURGERY ENGKSTERNTHIRD FTERNAPSTOMATO HSPERACH:UMBRELLA PGANTERLHVEHICLE PIGTLANINGVIDEO PKANTVINEGAR RANGKPES,
RICGH
VETMFTERN
48
EXPLORING THE INFORMATION SUPPORT FOR SPEECH*
J. A. Scott Kelso+ and Betty Tuner++
Abstract. A well-established feature of speech production is- that
talkers, faced with both anticipated and unanticipated perturba-tions, can spontaneously adjust the movement patterns of articula-tors such that the acoustic output remains relatively undistorted.
Less clear is the nature of the underlying process(es) involved. In
this study we examined five subjects' production of the point vowels/i, a, u/ in isolation and the same vowels embedded in a dynamicspeech context under normal conditions and a combined condition in
which (a) the mandible was fixed by means of a bite block, (b)
proprioceptive information was reduced through bilateral anaestheti-zation of the temporomandibular joint, (c) tactile information fromoral mucosa was reduced by extensive application of topical anaesth-
etic, and (d) auditory information was masked by white noise.
Analysis of formant patterns revealed minimal distortion of thespeech signal under the combined condition. These findings are
unfavorable fOrccentral (e.g., predictive simulation) or peripheralclosed-loop models, both of which require reliable peripheral infor-mation; they are more in line with recent work suggesting thatmovement, goala_may_:be z
a way that is qualitatively similar to a nonlinear vibratory system.
The remarkable generativity of human movement is.a mystery that continues
to resist explanation. Within lidits, people (and animals) can achieve the
same 'goal' through a variety of kinematic trajectories, with different muscle
groups and in the face of ever- ch*nging postural and biomechanical require-
ments. This phenomenonvariously referred to as motor equivalence (Hebb,
1949) or equifinality (von Bertalanffy, 1973)--his been demonstrated again
quite recently by Raibert (1978), who showed writing patterns to be charac-teristic of the same individual even when produced by structures (such as thb
foot or mouth) that had never previously been used for the act of writing.
*A preliminary version of this payer was presented at the 101st meeting ofthe Acoustical Society oAmerica, May 18-22, 1981.
+Also Departments of Psychology and Biobehavioral Sciences, The University ofConpecticut.
++Also Department of Neurology, New York University Medical Center.
Acknowledgment. This research was supported by NIH Grants NS13617 and
Biomedical Research Support Grant RR05596 to Haskins Laboratories and NIHPost - Doctoral Fellowship 1-F32-N8-06718-01 to the second author. We thank
Thomas Gay and the University of Connecticut Health Center at Farmington foruse of facilities. We are especially grateful to Dr. Robert Gross ofLouisiana State University Medical Center for performing anaesthetizationprocedures.
[HASKINS LABORATORIES:_ Status Report on Speech Research SR-69 (1982)]
4 :3

Human language is generative in a qualitatively similar way: We seem tohave a potentially infinite number of ways of constructing sentences. Nor isit trivial that language, even when stripped of its symbolic component, is a
creative or generative activity. Articulatory maneuvers for producing speechsounds can be effected in spite of continuously varying initial conditions.Often the same phonetic segment in different environments can be achieved byvery different movement trajectories and end-states. One commonly used
experimental paradigm_fcr examining equifinality in speech takes the form ofplacing a bite block between the teeth, thus fixing the position of themandible. Under such conditions, so-called "steady state" vowels can beproduced apparently without the need for on-line acoustic feedback. Normal:range formant patterns are obtained even at the first glottal pitch pulse(Gay, Lindblom, & Lubker, 1981; Lindblom, Lubker, & Gay, 1979; Lindblom &Sundberg, 1971). Moreover, apeakers are capable of such "compensatory articu-lation" with little (if any) articulatory experimentation. Recent work onbite-block speech has shown that response times rroduce vowels of the sameacoustic quality under normal and bite-block cond Lons are nearly identical.In addition, the degree of "compensation" (as indexed by deviations fromnormal foment frequencies) remained unchanged as a function of practice(Fowler & Purvey, 1980; Lubker, 1979). The evidence, then, favors aninterpretation that articulatory adjustments to novel contextual conditionsare relatively immediate.
What kind of control process could accounte_adaptive, generativeu e speech production? An open-loop control system in which commands
for producing a given vowel prescribe in detail-the activities of'relevantmuscles can be dispensed with because, by definition, such systems areinsensitive to changing contextual conditions. On the other hand,.closed-loopcontrol does offer the advantage of adjustment to initial conditions. In
peripheral closed-loop, _feedback systems, a sensory goal in the form of aspatial (MacNeilage, 1970) or auditory-target (Ladefoged, DeClerk, Lindau, &Pap'un, 1972; MacNeilage 1980) is paired viith an appropriate set, of commandsfor Accomplishing the goal, Resulting sensory consequences are then comparedwith the sensory goal so thet corrections can be made. A potential problemwith peripheral closed-loc- control is that the corrective process requirestime (at least one cycle around the corrective loop). .However, if the
adjustment to novel conditions is indeed immediate--thus excluding the needfor trial and error methods--then a closed-loop mechanism tied to the
peripheral motor system fails to capture the phenomenon of interest.
An alternative account favored by Lindblom and colleagues (e.g., Lindblomet al., 1979) replaces the peripheral feedback loop by a central simulationprocess that derives the expected sensory consequences from a simulated set ofmotor commands before the actual efferent signals are sent to the periphery.An internal comparison between the simulated and 'target' semiory consequencesyields an error signal on the basis of which new (and correct) commands can beemitted. In this manner, adjustments to changes in context can be made in theinternal. simulation without incurring erroneous effects at the periphery.
It is important to note that the _models discussed thus far make the
explicit assumption that reliable peripheral information about the articula-tors' initial conditions is available before motor commands (simulated oractual) are generated. In the peripheral closed-loop model, for example;
44
sensory input must be compared to the internal referent before the output of
command signals. In the internal loop model, simulated motor commands aregenerated for the initial conditions that currently exist (Lindblom et
al. 1979). It is not clear in the latter formulation what would happen ifcontextual conditions changed between the time that simulated and actual motor
commands were generated. A more efficient system would be continuously
sensitive to, and be capable of modulation by, contextual conditions. For the
sake of argument, however, let us assume with Lindblom et al. that one benefitof the internal loop is its speed of correction; possibly the loop is so fastthat appropriate output can be generated before contextual conditions have-hanged.
In any case, for both closed-loop models, elimination or reduction ofperipheral information about initial conditions should drastically affect thesystem's ability to adjust to the novel situation created by a bite block.There are very limited data on this point. Gay and Turvey (1979) found that asingle subject (a phonetician) made several attempts before producing:normal'formant frequencies for the vowel /i/ under conditions in which a bite block
\was combined with topical anaesthesia of the oral mudosa and bilateral nervelockage of Vile temporomandibular joint. Although this result has suggested
tb, some (cf. Perkell, 1979) that joint and tactile information is used to
establish an "orosensory frame of reference," we believe there are grounds for
caution. One problem is that it is unclear how-.l.given the considerable
reduction of peripheral information--Gay and Turvey's subject was capable of
adaptive adjustment at all. One possibility,'which we consider here, is thatauditory information may have played a potentiating role. Although acoustic
information does not appear to be a necessary condition for compensatoryarticulation (e.g., Lindblom et al., 1979), the Gay-Turvey experiment does notpreclude an auditory contribution in "recalibrating" the speech system when
0 information from motor structures is rendered unreliable.
The present experiment was designed to examine the role of peripheralinformation (auditory and somesthetic) in accounts of "immediate adjustment"
by asking naive subjects to produce vowels under normal conditions and underbite-block conditions in which. somatosensory information was drastically
reduced (if not eliminated) and audition was masked by white noise. In
addition we address the question of whether the so-called "steady-state"
paradigm for bite-block vowels reflects normal dynamic speech motor processes.By examining the production of vowels embedded in a dynamic speech context as
well as in isolation, we can discover what differences there are, if any, inobserved acoustic patterns. As we shall see, the availability of peripheralinformation from neither auditory nor peripheral motor structures appears to
be crucial to immediate adjustment. We take this result as non-supportive forextant models of the phenomenon., In their place, we offdr a class of model--emerging in other areas of motor control (Bizzi, 1980; Fel'dman, <1966, 1980;
Kelso, 1977; Kelso & Holt, 1980; Kelso, Holt, Kugler, & Turvey, 1980; Polit.8
Bizzi, 1978) as well as in the recent speech productio/ literature
(cf. Fowler, 1977;1 Fowler, Rubin, Remez, & Turvey, 1980)--that iden.ifies
functional groupings -of muscles as exhibiting properties qualitatively similar
to a nonlinear oscillatory system. The bottom line of this model and of the
present paper is that the equifinalitycharacteristic of vowel production maynot be prescribed 'by closed-loop servomechanisms of the peripheral or central
kind. Rather, we argue that it may be a consequence of the parameterization
45

of a dynamical system whose design is intrinsically self-equilibrating. That
is,, a design in which equilibrium pointi are a natural by-product Of thestiffnebs and damping specifications for the vowel-producing system.
Sub ects. Four female volunteers were paid .to participate in thisexperiment. All were naive to the purpose of the experiment. A fifth subject(male) who was phonetically trained and had prior experience in a similarexperirmt (see Gay & Purvey, 1979) was also included.
Stimuli. The subjects' task was to say the point vowels /1, a, u/ inisolation and in a /p/-vowel-/p/ context. The /pVp/ syllables were spoken inthe carrier phrase "A again." Utterances were produced in three groupi ofthree tokens of a particular vowel or phrase. The subjects were instructed toproduce all tokens of a given utterance in exactly the same fashion, with aclear pause after each token. They were also told not totalk betweenexperimental conditions or to practice the production task.
Conditions. The bits block used was a small acrylic cylinder with wedges
carved out of each end so that it could fit snugly between the. teeth. A 5. mm
bite block was used to restrict the normally low jaw position for productionof/a/ and /pap/. Either a 17 mm or a 23 mm bite block was used (depending on
the individual subject's oral dimensions) for production of 13, u, pip, pup/,whith normally involve a high jaw position.
Al? anaesthetic procedures werepia:Tamed by Dr. Robert Gross, a special-
ist in oral and maxillofacial surgery who had collaborated with us in earlier
work (Tuller, Harris, & Gross, 1981). Tactile information from the oralmucosa was reduced by spraying the surface of the tongue and oral cavity with
a 2% Xylocaine solution. The effectiveness of the topical anaesthesia, was
tested by pricking the surfaces with a needle until the subject no longerreported sensation. A few catch trials were also included in an attempt toinsure honest reporting on the part of the subject. _Information from
mechanoreceptors in--the jaw was reduced by injecting percutaneously a 2%
Xylocaine solution directly into left and right temporomandibular jointcapsules to achieve auriculotemporal nerve blockage. Chemical blc:,kage of
this nerve drastically impairs perception of joint position and movement(cf. Thilander, 1961). This condition will be referred to as the TMJ block.
In order to restrict the availability of auditory information, white
noise was presented to the subject over headphones at approximately 90 dB.The subject was told to monitor the amplitude of her or his productions by
watching a VU meter and to restrict the excursion of the needle to approxi-mately 55 dB or under.
All subjects spoke .ith and without the bite block prior to the
application of anaesthesia and under all experimental conditions. Two of the
four naive subjects received the TMJ block before the topical anaesthesia, and
the other two subjects underwent topical anaesthesia first. In each of these,
pairs, one subject spoke under conditions of auditory masking and the other
subject was allowed normal auditory information. The' phohetically trained
subject received topical anaesthesia'before the TMJ block and, spoke with
masking noise in combination with these two procedures.
46
52

Measurement procedure. Individual utterances were input through a Ubi-
quitous spectrum analyzer to a Honeywell DDP-224 computer, using a 12.8 cosec
window and 40 Hz frequency resolution. The first and second formants of each
utterance were measured from a spectral section display. As in previous
experiments (e.g., Lindblom et al., 1979; Fowler & Purvey, 1980), acoustic
measures of the isolated vowels were made at the first glottal pulse. For
many English speakers the isolated vowels may, not be truly static, that is,
#they may show some art' ulatory movement and thus some shifting of form-Lt
frequencies; neverthel , the adopted procedure was to measure. forPaP
frequencies at the firs glottal pulse.' For the /p/-vowel-/p/' syllables, 71and F2 values were taken from the point within the vowel at which F2 was mostextreme. This point was chosen as the closest approximation to the "target"vowel formants.
Resumes. The main interest of the present experiment rests on a
comparison of speech under normal conditions and conditions of 'reduced
peripheral information. Figure 1 shows the mean values for F1 and F2 for each
-,subject. The top half shows the mean formant values for the isolated vowels,
and the bottom half the mean formant values for the /p/-vowel-/p/ syllables.
Tne conditions of speaking are coded as 'follows: "M" means the subject
produced the utterances under conditions of masking noise, "J" is the TMJ
block, "T" corresponds to topical anaesthesia, and "BB" is the bite block.Each subject's nine normal productions of a given 'utterance were compared
using t-tests with his or her productions under the most extreme condition of
sensory deprivation. None of the subjects (except subject 1) .showed any
differences in fornant frequency values between normal and. deprived
tions. Such was thp case regardless of whether vowels were spoken in
isolation or in a consonantal frame; t(8) values ranged from .05 to 1.79, ..ps
>.1. For Subject 1, a significant mean difference occurred between the normal
and most deprived- condition only for F1 and F2 of the vowel /u/. We are hard
put to account for these anomalies: The,effect on /u/, though substantial (a
97 Hz difference for F1 and a difference of 363 Hz for F2) is in the direction
opposite to expectation. Specifically, the presence of a bite block might be
expected to raise all formant frequencies when producing /u/ because of
possible structural limitations on lip protrusion and constriction. In
contrast, howe'ver, this subject's productions of, " /u/ with a bite bloCk
actually showed lower F1 and F2 frequencies than when there was no bite block.
Neither can the effect be attributed only to masking. (which might implicate
higher formant frequencies). Notice that the formant values for combined
sensory deprivation conditions are very similar with and without masking. It
is also worth remarking that S5 in Figure 1 is the phonetically trainedsubject whose.results conform to the general pattern shown by naive subjects.
Before concluding that these results reflect immediate adjustment in the
deprived condition, it is necessary to exclude the possibility that systematic
_changes in formant values occurred over trials. Figure 2 shows the Fl and F2
values for individual tokens, in order, for the vowel /i/ prqduced by one
subject under the most extreme conditions (i.e. topical anaesthesia, TMJ
block, a 23 mm bite block and masking noise). Also .shown are the mean F1 and
F2 value's for thi, combined"condition, and the-.mean value of the subjects'
"normal" formants. The slepe of the line formed by tokens one through ninedoes not differ aignificantly from the line formed in the (non-bite block)
control condition. Evidently, there does not appear to be a systematic
47

..
,
is
%v
issisted Wings$1
99111, i
e
F3Old40, NW
0to II 0.46 . ,
pVp SAW**'""pip. 4
mos.
F2011) pup10011. a
12
$
La
$3 4.1 16.
Normal
c N.I.T.IIIdi AT,M1.11.a.
'dk
I . I
F, (Hz)
OK
-.4-../.--A-- & ..a0 SOO 1000 U00 SOO 1000 MO ,"0 ION 1900 1100
N 9pc ,071 F10414
1
Figure 1. , Mean values of F1 Yx-axis) and F2 (y-axis) for nine repetitions ofthe indicated utterances. Data for the five subjects are presentedseparately. Top: Isolated vowels. Bottom: /pVp/ syllables.
$ = masking noise, J = TMJ block, T = topical anaesthesia,BB F.bite block.
0
,
54.
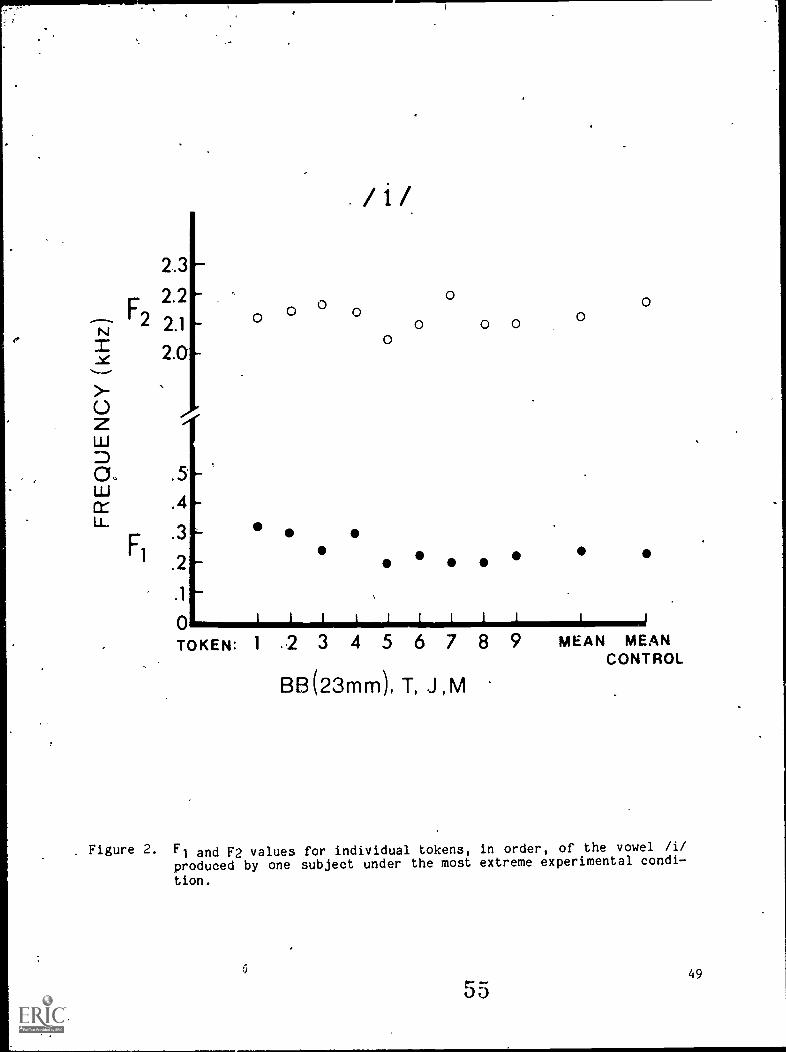
2.3
2.2
r2 2.1
Y 2.0
>_
C)2!UJ
.5.
cc .4LL
F1
0 0
.3
/1/
0
0
0 0 0 00
.2
.1
0TOKEN: 1 . 3 4 5 6 7 8 9 MEAN MEAN
CONTROL
BB(23mm), T, J , M
Figure 2. F1 and F2 values for individual tokens, in order, of the vowel /i/produced by one subject under the most extreme experimental condi
tion.
(.1
J549

learning effect occurring over trials. We confirmed this statistically forall subjects by performing linear regression analyses across trials of eachsubject's productions under normal and deprived conditions. Correlations wereconverted to z-scores and t-tests performed to determine whether the slopesdiffered between the two conditions. Of the sixty analyses performed (5
subjects by 6 utterance types by 2 foments), not a single one showed a
difference in slope; t(7) values ranged from .00 to .84, is >.1.
DISCUSSION
The present data are not easily explained by current models of movementcontrol that have been proposed to account for the remarkable contextsensitivity of the speech production system. Closed-loop models - -of the
central or peripheral kind - -both entail an availability of reliable sensoryinformation about the initial conditions of the articulators. However, ourexperiment shows that acoustically normal vowels oan be produced not only whenthe normal relationships among the articulators are changed by a bite block,but also when sensory information from auditory, joint, and tactile sources isdrastically reduced as well. Furthermore, 'and as other recent work alsosuggests (cf. Fowler and Turvey, 1980), "articulatory compensation" appears tobe achieved immediately and with little or no practice; none of our naivesubjects' data provided any evidence of short-term adaptation. In support of
the latter claim, the data displayed in Figure 2 are actually from the samesubject that apppeared to display motor learning effects .n an earlier study(Gay & Turvey, 1979).1
Before offering an alternative interpretation of our data in terms otherthan closed -loop models, two caveats may be in order. The first is that our
results do not necessarily refute closed-loop control when the system is inits normal mode, that is, when all sources of information are available. The
second is that our paradigm in all likelihood does not completely eliminateperipheral information, and hence a closed-loop simulation model cannot beruled out completely. Nevertheless, given the drastic reduction in
propriospecific information we (and surely the proponents of closed-loop,,
models) might have expected much more severe distortion of the acoustics than
was observed here.
In spite of these caveats, we believe that a molt& parsimonious account of
the :Phenomenon can be forwarded, though it is less well known in speechresearch than the servoengineering model. The account that we shall 'consider
does not, in fact, depend on whether sensory input about the initial positions
of articulators is available or-not. Thus there is no requirement for onemodel when sensory afference is available and another quite different model
when it is absent.
The view that we shall express for the present oats has been laid out in
some detail elsewhere (Fowler et al., 1980; 'Kelso, Holt, Kugler, & Turvey,
1980). In brief, it argues that functional groupings of muscles--sometimescalled synergies (Cf. Gelfand, Gurfinkel, Tsetlin, & Shik, 1971) or
coordinative structures (cf. 'Purvey, Shaw, & Mace, 1978)--exhibit behavior
qualitatively similar to a (nonlinear) mass-spring system. Such systems arc
intrinsically self-equilibrating in the sense that the "end-point" of th(
56

system, or its "target," is achieved regardless of initial conditions. Thus
in normal and deafferented animals (Bizzi, Dev, Morasso, & Polit, 1978), it
can be shown that desired limb positions are attainable_without startingposition information, and even when the limb is perturbed on its path to the
target. Similarly, the localization ability of functionally deafferented
humans (Kelso,: 1977; Kelso & Holt, 1980) and individuals with the
metacarpophalangeal joint capsule surgically removed (Kelso, Holt, & Flatt,1980) is not affected by altered initial conditions or unexpected
perturbations. These data have led to the view that the "target" of thesystem is not achieved by means of conventional closed-loop control; rather itis a consequence of the system's dynamic parameters (maps, stiffness,
damping). In such a model, the only parameters that need be specified forvoluntary movement are stiffness and resting length: Kinematic variations indisplacement, velocity, and acceleration are consequences of the parametersspecified, rather than controlled variables, and sensory "feedback"--at leastin the conventional computational sense--is not required (cf. Fitch & Turvey,1978; Kelso, Holt, & Flatt, 1980; Kelso, Holt, Kugler, & Turvey, 1980).
It is worth noting that the view expressed above is equally applicable todisruptions' that are static and anticipated (as in the present bite block
experiment), and those that are time varying and unanticipated. For example,
recent studies of the latter kind have' shown that "compensatory responses" of
short latency are observed in perturbed articulators as well as in others that
contribute to the same "vocal tract goal" (cf. Abbs, 1979, for review).
Current theorizing, however, offers two distinct mechanisms to explain the
system's reaction to perturbation: A predictive simulation mechanism for
anticipated disruptions (Lindblom et al., 1979) and a closed-loop peripheral
feedback mechanisth for unanticipated disruptions (Abbs, 1979).
The analysis offered here views such a distinction vs redundant.
Immediate adjustment to either type of perturbation is a predictable outcomeof a d.ynamical system in- which muscles function cooperatively as a single
unit. If the operation of certain variables is fixed, as in the bite block,
or unexpectedly altered, as in online perturbation, linked variables willautomatically assume values appropriate to the constraint relation (as long as
biomechanical limitations are not violated). In short. dynamical systems (of
which speech is a member) always operate in a mode that one can describe as
"compensatory."
Although we cannot offer a detailed description of the muscles of the
vocal tract in terms of the style of control outlinad above, we believe there
are some grounds for optimism. Fujimura and Kakita (1979), for example, haveperformed a three-dimensional simulation of the tongue that uses quantitative
control of contractile forces of the muscles actually involved. By treating
the tongue muscles (in this case the posterior and anterior portions of
genioglossus) as a cooperative unit and maintaining the relative magnitude ofcontractile inputs to each muscle, it can be shown that the acoustic pattern
for the vowel /i/ is obtainable with a wide variety of absolute force values.
Thus, as long as the contractile balance among linked muscles is preserved,
the exact magnitude of muscle contraction (beyond a critical value) does not
matter (see also Kakita & Fujimura, 1977). The generality of this model is
limited, at this time, to a single point vowel. Nevertheless, the nonlinear
relationship between muscle forcee and acoustic pattern allows, or rather
51
57

provides for, a context-conditioned production system. As'in recent accountsof limb localization, invariant "targets" can be attained with differentstiffness specifications, as long as the balance in stiffness among relevantmuscles is preserved.
As a final point, the analysis offered here suggests a commonality infunction between the system capable of producing vowels and that involved inthe attainment and maintenance of limb postures. Both systems are materiallydistinct from each other but share behaviors qualitatively like a nonlinearmass, spring.-- The nontrivial claim, then, is that speech and limb movementsare dynamically alike in sharing a common solution to the equifinalityproblem.
REFERENCES
Abbs, J. Speech motor equivalence: The need for a-multilevel control model.
Proceedings of the Ninth International Congress of Phonetic Sciences,
1979, 2, 318-324.Bertalanffy, L. von. General system theory. Hammondsworth, England: Penguin
UniveFsity Press, 1973.Bizzi, E. Central and peripheral mechanisms in motor control. In
G. E. Stelmach & J. Requin (Eds.), Tutorials in motor behavior.
Amsterdam: North-Holland Publishing Company, 1980.
Bizzi, E., Dev, P., Morasso, P., & Polit, A. Effects of load disturbance
during centrally initiated movements. Journal of Neurophysiology, 1978,
41, 542-556.Feldman, A. G. Functional tuning of the nervous system with control of
movement or maintenance of a steady posture--II. Contyollable parameters
of the muscles. Biophysics, 1966, 11, 565-578.
Feldman, A. G. Superposition of motor programs. I. Rhythmic forearm move-'
ments in man. Neuroscience, 1980, 5, 81-90.
,Fitch, H., & TurVey, M. T. On the control of activity: Some remarks from an
ecological point of-view. In Christina (Ed.), Psychology of motorbehavior and sports. Urbana, Il_ Human Kinetics, 1978.
Fowler, C. Timing control in speech production. Bloomington, Ind.: Indiana
University Linguistics Club, 1977.Fowler, C. A., Rubin, P. Remez, R. E., ftc Turvey, M. T. Implications for
speech production of a general theory of action. In B. Butterworth
(Ed.), Language production. New York: Ar;ademic Press, 1980.
Fowler, C. A., & Turvey, M. T. Immediate compensation in bite-block speech.
Phonetica, 1980, 37, 306-326.Fujimura, 0., & Kakita, Y. Remarks on quantitative description of the lingual
articulation. In B. Lindblom & S. Ohman (Eds.), Frontiers of speechcommunication research. London: Academic Press, 1979.
Gay, T., Lindblom, B., & Lubker, J. Production of bite block
vowels: Acoustic equivalence by selective compensation. Journal of the
Acoustical Society of America, 1981, 69, 802-810.Gay, T. J., & Turvey, M. T. Effects of efferent and afferent interference on
speech production: Implications for a generative theory of speech motor
control. Proceedings of the Ninth International Congress of PhoneticSciences, 1979, 2, 344-350.
52

Gelfand, I. M., Gurfinkel, V. S., Tsetlin, M. L., & Shik, M. L. Some problems
in the analysis of movements. In I. M. Gelfand, V. S. Gurfinkel,
S. V. Fomin, & M. L. Tsetlin (Eds.), Models of the structural-functional
organization of certain biological systems. Cambridge, Mass.: MIT
Press, 1971.Hebb, D. O. The organization of behavior. New York: Wiley, 1949.
Kakita, Y., 8' Fujih :ura, O. A computational model of the tongue: A revised
version. Journal of.the Acoustical Society of America, 1977, 62, S15.
(Abstract)
Kelso, J. A. S. Motor control mechanisms underlying human movement reproduc-
tion. Journal of Experimental Psychology: Human Perception and
Performance, 1977, 3, 529-543.Kelso, J. A. S., & Holt, K. G. Exploring a vibratory systems analysis of
human movement production.,. Journal of Neurophysiology, 1980, 43, 1183-
1196.
Kelso, J. A. S., Ho4-t, K. G., & Flatt, A. E. The role of proprioception in
the perception and 'control of human movement: Toward a theoretical
reassessment. Perception & Psychophysics, 1980, 28, 45-52.
Kelso, J. A. S., Holt, K. G., Kugler, P. N. & Turvey, M. T. On the concept
of coordinative structures as dissipative structures: II. Empirical
lines of convergence. In G. E. Stelmach (Ed.), Tutorials in motor
behavior. New York: North-Holland Publishing Co., 1980.
Ladefoged, P., DeClerk, J., Lindau, M., & Pap9un, G. An auditory-motor theory
of speech production. UCLA Working Papers in Phonetics, 1972, 22, 48-75.
Lindblom, 3., Lubker, J., & Gay, T. Formant frequencies of some 'fixed-
manlible vowels and a model of speech motor :programming by predictive
simulation. Journal of Phonetics, 1979, 7, 147-161.
Lindblom, B., & Sundberg, J. Acoustical consequences of lip, tongue, jaw, and
larynx movement. Journal of the Acoustical Society of America, 1971, 50,
1166-1179.
Lubker, J. F. Tne reorganization times of bite-block vowels. Phonetica,
1979, 36, 273-293.MacNeilage, P. F. Motor control of serial ordering of speech. Psychological
Review, .1970, 77, 182-196.MacNeilage, P. F. Distinctive properties of speech control. In
G. E. Stelmach & J. Requin (Eds.), Tutorials in motor behavior.
Amsterdam: North-Holland, 1980.Perkell, J. S. On the use of sensory feedback: An interpretation of
compensatory articulation experiments. Proceedings of the Ninth
International Congress of Phonetic Sciences, 1979, 2, 358-364.
Polit, A., & Bizzi, E. Processes controlling arm movements in monkeys.
Science, 1978, 201, 1235-1237.
Raibert, M. H. A model for sensurimotor control and learning. Biological
Cybernetics, 1978, 29, :9-36.
Thilander, B. Innervation of 0,c temporo-mandibular joint capsule in man.
Trans. Roy. Sch. Dent. Stockholm and Umea, 1961, 7, 9-67.
Tuller, B., Harris, K. S., & Gross, B. Electromyographic study of the jaw
- muscles during speech. Journal of Phonetics, 1981, 9, 175-188.
Turvey, M. T., Shaw, R. E., & Mace, W. Issues in the theory of action:
Degrees of freedom, '2oordinative structures and coalitions. In J. Requin
(Ed.), Attention and performance VII. Hillsdale, N.J.: Lawrence Erl-
baum, 1978.

FOOTNOTE
lIndeed it was after observing the bite block performance of our naive!subjects under reduced information conditions' that this person offered to
participate in the present experiment. This was a magnanimous gesture forwhich we express our gratitude.
54

THE STREAM OF SPEECH*
Robert E. Remez+ and Philip E. Rubin
Abstract. The use of sinusoidal replicas of speech signals reveals
that listeners can perceive speech solely from temporally coherentspectral variation of nonspeech acoustic elements. This sensitivity
to coherent change in acoustic stimulation is analogous to the
sensitivity to change in configurations of visual stimuli, as
detailed by Johansson. The similarities and potential diffe,encesbetween these two kinds of perceptual functions are describef..
Studies have shown that the continuously changing stream of speech can be
approximated by a kind of acoustic animation, at the theoretical heart ofwhich is an idealization of the human vocal tract as a resonar,t horn (e.g,,
Chiba & Kajiyama, 1941; Fant, 1956, 1960; Stevens & House, 1955). The 'details
of the acoustics of speech can thereby be explained by noting that the vocal
horn cam-be constricted at different places along its length, that it may be
multiply excited, and, especially, that its shape can _be changed rapidly. Ia
practical situations, such as speech synthesis, the assumption of the hornlike
properties is tacit, presupposed; the synthesizer speaks by the excitation of
a lumped-circuit resonator (or its digital equivalent), which is itself
approximate to horns of many types, including vocal tracts.
Although the term "speech stream" is often used to refer to the acousticproducts of human vocalization, speech has commonly been studied by conceivingthis metaphoric stream as an imbrication of more or less isolable elements,
such as steady-state or transitional formant patterns, plosive bursts, band-
limited noise, and stretches of silence. In our perceptual accounts, then,
the exclusive attention to perceptual effects of specific elements in the
acoustic pattern has led us to undervalue the coherence of the speech stream.
In contrast to theoretical characterizations of the speech stream emphasizing
structural con 'tinuicy (Liberman, 1970), experimenters find it quite agreeable
in practice to treat the perceptually relevant acoustic structure as if it
consisted of distinct elements. Within this framework, properties of change
in the speech signal figure primarily as a problem; from a dynamic array, the
listener must somehow extract static elements or cues, perhaps even by means,
of a specialized decoding device. However, research continually reveals that
*Also Scandinavian Journal of Psychology, in press.+Department of Psychology, Barnard College, Columbia University.
Acknowledgment. This research was supported by grants HD 15672 (to
R. E. Remez) and HD 01944 (to Haskins Laboratories) from the National
Institute of Child Health and Human Development. We gratefully acknowledge
the advice of Alvin Liberman, Ignatius Mattingly, David B. Pisoni, Frank
Restle, and Michael Studdert-Kennedy.
[HASKINS LABORATORIES: Status Report on Speech Research SR-69 (1982)]
55

B
C
at+
-4011r.
4 I I a.
3-
2
1
.
.**
.
. . . . . . . ................ .
. . .
.0'e...
1.6 1.8 2.0 2.2
TIME IN SECONDS
2.41
.4 216 2.8
Figure 1. A) The English sentence, "My deg Bingo ran around the wall." The signal was producedby a natural talker and was quantified by a spectrum analyzer employing a bank of
acoustic filters. B) The same sentence is represented here as a sequence of centerfrequency values of the first three formants. The method of Linear Prediction wasused to prepare this series of spectral sections at 10 msec intervals. C) The same.
sentence is realized here in a signal composed of three timevarying sinusoids. The
pattern of relatively continuous change of the natural signal is retained, while thebroadband formants and harmonic structure of the natural speech signal are eliminated.
62

perceivers care very little'about the momentary attributes of speech signals.
Even under direct test, and in highly favorable conditions, listeners seem
unable to report acoustic properties of the stimulation on which their
phonetic percepts are reliably based (Best, Morrongiello, & Robson, 1981;
Pisoni, 1971; Mattingly, Liberman, Syrdal, & Halwes, 1971).
To describe the speech stimulus in a manner appropriate for perception,
we must therefore characterize the timevarying spectrum of the acoustic
pattern. In doing so, we elaborate the acoustic coherence of the speech
stream, and avoid reducing it to a sequence of static acoustic moments
irrelevant to the operating principles of the perceptual system. Only in this
fashion may we gain a clue about the "smart" perceptual processes (Runeson,
-1977) applied-to speech stimuli. In addition, the success of the discretecue
approximations of speech would then be explained by observing that a sequence
of cues, however it reconstitutes properties of coherent change in the speech
stream, is perceptible because it conserves the important properties .of
acoustic variation, rather than because it conserves appropriate shorttime
spectra or discrete acoustic elements.
RECENT EVIDENCE
Although similar notions have been expressed from time to time in speech
research (e.g., Liberman, 1970), several recent expetiments especially promote
these speculations about the importance of spectrum variation in speech
perception (Remez, Rubin, & Carrell, 1981; Remez, Rubin, Pisoni,''& Carrell,
1981). In these studies, listeners perceived phonetic segments from acoustic
stimuli consisting solely of two or three sinusoids. Frequency and amplitude
variations of the sinusoids imitated the changes of Lhe vocal resonances found
in natural speech signals (see Figure 1). Specifically, each sinusoidal tone
was matched in amplitude and frequency to one of the formants,.or resonances,
of a natural utterance that served as a model. Matching' values were
determined lfor successive 10 msec sections of the natural utterances, and
these values were used to control a sinusoidal synthesizer.
None of the acoustic cues typically believed to underlie phonetic
perception was present in the sinusoidal patterns,: neither formant transi
tions ,nor ,steady state formantsi because there were no broadband vocal
resonances inwere
threetone signal; nor fundamental frequency, because the
threetones were not harmonically related; nor bandlimited noise, because the
signal had only three periodically uhrelated components. Thus, the shorttime
spectra of the signals did not satisfy the amplitude and frequency require
ments of the spectral templates that are sometimes claimed to be useful in
analyzing the acoustic pattern into phonetic units (Stevens & Blumstein,
1981). Despite this absence of vocally producible constituents, the overall
pattern of frequency and amplitude variation imitated natural acoustic pat
terns. Listeners who-found these sinewave replicas of speech to be intelligi
ble evidently disregarded the inappropriate momentary acoustic structure, and
were untroubled by the lack of traditional acoustic cues. Rather, they must
have attended to the coherence of the timevariation of the tones, which
betrays the vocal origin of the signal, and, at the same time, specifies an
impossible sounding voice.
57
63

Unlike vocal resonances that share the same laryngeal source, each
sinusoid is acoustically independent, and listeners readily reported thisdistinctness. Accordingly, it was rare, that naive listeners spontaneouslyattended to phonetic information in this grossly unnatural phonetic carrier.Listeners, told nothing in adyance about the three-tone signals, heard themsimply as three simultaneous tones, modulated asynchronously as if in three-part counterpoint. However, the simple instruction to listen for a sentenceenabled almost 70%.t of naive listeners to detect a sizable chunk of themessage, if not its entirety. In other words, listeners made use'of phoneticinformation that was exclusively time-varying in nature, in the absence ofshort-time spectra charaCteristic of vocalization.
AN ANALOGY WITH VISUAL'EVENT PERCEPTION
The analogy is readily apparent between our experiments on phoneticperbeption from sinusoids, and Johansson's (e.g., 1975) experiments on theperception of locomo:oryand other movements from point-light displays. In
both cases, it appead ,hat the pattern of,coherent change in the stimulationconveys information a; out the dent in progress. In Johansson's case, visualdisplays are made by videotaping a human figure moving in the dark, illuminat-ed only at the joints of the articulating limbs. Although it is impossible toidentify the content of the dot display from the single snapshots, the movingdots pT light convey a wide range of subtle locomotory information. It isthis organized change in the constellation of lights that carries ,informationabout the walking actor, despite the absence of static information to revealwhich light belongs to which joint. Our sinewave element is like a 'speechfoment in the same way that Johansson's light spot is like a,radiocarpaljoint--the value of each element is established only ky virtue of the coherentconfiguration to which it belongs.
The analogy is not perfect, though. The distal object for Johansson'ssubject was a walker who seemed to,mean nothing by his walking. In contrast,
the distal dbject for our subjects was a message spoken by a strange talker.Our subjects perceived a highly structured message, and Johansson's did not.But, this may merely be a superficial methodological discrepancy if the visualobserver can perceive whether the person in the display is performing,a tangoor a fox trot; or'whether the person is using body "language" or American SignLanguage, and what the message is (Poizner, Bellugi, & Lutes-Driscoll, 1981).In each case, then, the perceiver identifies a person (one talking, one
dancing), a structured transformation (one linguistic, one terpsichoric), and
a strange medium (one sinuisoidal, one dotty).
There is an additional discrepancy between Johadsson's paradigm and ours:Subjects seem to find the information in the moving dot displays to be moreaccessible than the information in the sinusoidal displays. We do not
understand this very well, but the fact that so many naive subjects hearsinusoids phonetically when instructed to do so may reduce the significance ofthis difference between the visual and linguistic'cases.
58

4
A POTENTIAL FORMAL DIFFE"ENCE
In view of the, similarity, it seems appropriate to distinguish formally
some properties of visual motion perception and speech-perception. Faced with
the task 'of describing the geometry of optical flow, Johansson writes, "the
self - motion component in the proximal flow (is combined with). tremendously
'complex object motion flow. The result is from a mathematical point of view'
like a chaos or is at least mathematically complex to absurdity"(Note 1, page
6). Of course, the perceiver often disentangles the'various components easily
despite the limitations we otherwise experience' as,descriptkve geometers.Acoustic change in the case of speech may not prove quite so elusive todescribe, though. In principle, the physical limits of the variation ofspeech sounds are far naribwerrconstrained anatomically and linguistically- -than are the physical limits of optical flow, which appear to be set, after
all, by mechanics. And, we have a tremendous head, start of forty years of
"ecological acoustics" of the vocal tract. In any event, we suggest that
studying the coherence of the- speech stimulusdescribing the stream of
speech -- requires a change of emphasis that brings research on phonetic
perception closer to the approach established by Johansson for studying the
visual perception of events.
REFERENCE NOTE
1. Johansson, G. Abou't visual event _perception. Perception of motion,
dynamics and biological events. Paper presented at the First Internation-
al Conference on Event Perception, Storrs, Connecticut, 1981.
REFERENCES
Best, C. T., Morrongiello, B., & Robson,' R. Perceptual equivalence of
acoustic cues in speech and nonspeech perception. Perception &
Psychophysics, 1981, 29, 191-211.
Chiba, T., & Kajiyama, M. The vowel: Its nature and structure. Tokyo:
Tokyo-Kaiseikan, 1941.Fant, C. G. M. On the predictability of formant levels and,spectrum envelopes
from formant,frequencies. In M. Halle, H. Lunt, & H. MacLean (Eds.), For
Roman Jakobson, The Hague: Mouton, 1956, 109-120.
Fant, C. G. M. The acoustic theory of speech production. Tne Hague: Mouton,
1960.
Johansson, G. Visual motion perception. Scientific American, 1975, 232(6),
76-89.Liberman, A. M. The grammars of speech and language. C,ognitive Psychology,
1970, 1, 301-323.
Mattingly, I. G., Liberman, A. M., Syrdal, A. K., & Halwes, T. G.
Discrimination in speech and nonspeech modes. Cognitive Psychology,
1971, 2, 131-157.Pisoni, D. B. On the nature of categorical perception of speech sounds.
Haskins Laboratories Status Report on Speech Research, Supplement, No-
vember, 1971.Poizner, H., Fellugi, U., & Lutes-Driscoll, V. Perception of American Sign
Language in dynamic point-light displays. Journal of Experimental
59

Psychology: Human Perception and Performance, 1981, 7, 430 -440.
Remez, R. E., Rubin, P. E., & Carrell, T. D. Phonetic perception of sinusoi-
dal signals: Effects of amplitude variation. Journal of the Acoustical
Society of America, 1981, 69, S114.Remez, R. E., Rubin, P. E., Pisoni, D. B., & Carrell, T. D. Speech perception
without traditional speech cues. Science, 1981, 212, 947-950.
Runeson, S. On the possibility of "smart" perceptual mechanisms.
Scandinavian Journal.of t4chology, 1977; 18, 172-179. .
Stevens, K. N., & Blumstein, S. E. The search .Por invariant acoustic corre-lates of phonetic features. In P. D. Eimas J. L. Miller (Eds.),
Perspectives in the study of speech. Hillsdale, N.J.: Erlbaum, 1981, 1-
38.Stevens, K. N., & House, A. S. Development of a quantitative description of
vowel articulation. Journal of the Acoustical Society of America, 1955.
27, 484-493.
60

I
USING' THE ACOUSTIC SIGNAL TO MAKE INFERENCES ABOUT PLACE AND DURATION OF
TONGUE- PALATE CONTACT
P. J. Price+..
al
Abstract. Productions of /t/ and /d/ in various intervocalic
contexts by four native speakers of American English were examined.
Closure duration was measured from the acoustic signal and 'from
dynamic palatography data. Place of contact was observed from the
palatographic signal, and formant frequency measurements in the
closure interval were made. Measurements were averaged over six
productions of each stimulus by each talker. Duration measurements
by the two techniques correlated well, except (as expected) in
instances in which, the second vowel had a glottal onset; in waich
cease the duration measurements in the acoustic domain were longerthan the durations measured palatographically. Place of contact
correlated well with F3 measurements.. Normalization across talkers
was achieved by dividing each F3 measurement by the talker's mean'
F2.
INTRODUCTION
Dynamic palatography provides an excellent means to observe tong-a-palate
cont c2 This technique is more direct than computing area functions or
relying on articulatory introspection. On the other hand, dynamic palatogra-:
phy is less widely available than area function algorithms or introspective
data. Dynamic palatography is, thus, of interest both in making direct
measurement 'and in providing a reliability measure for analyses that can be
carried out with a wider range of subjects and conditions. The latter is the
subject of the present report.
Both closure duration (duration of tongue-palate contact here) and place
of constriction are impOrtant in the classification of speech sounds. Closure
durations can distinguish flap from stop articulations (see, e.g,, Port, 1976;
+Nod at Massachusetts Institute of Technology, Cambridge, Mass.
Acknowledgment. This research was supported by NICHD grant HD-01994 to
Haskins Laboratories. I thank Arthur Abramson, Leigh Lisker, and Michael
Studdert-Kennedy for helpful comments on earlier versions. I also thank Tom
Baer and Dave Zeichner for their help with the apparatus, and Joe Perkell of
M.I.T. for the loan of the RION recording adaptor. An earlier version of
this paper was presented at the 101st meeting of the Acoustical Society of
America in Ottawa, May 1981 (Journal of the Acoustical Society of America,
1981, 69 (Supplement 1), S56 -57). Some of the data also appear in Price
(1981).
(HASKINS LABORATORIES: Status Report on Speech Research SR-69 (1982)]61
67

Zue & Laferriere, 1979), voiced. stops from voiceless stops (see Lisker, 1957),
and fricatives from affricates (see Dorman, Raphael, & Liberman, 1979). Place
of articulation is built more directly, into our classification system:
Consonants are classified as labial, palatal, or velar depending on where thetongue'makes contact with the palate. The artificial palates used wrmitanalysis of articulations from just behind the front-teeth to just before thesoft palate. Thus, the method is best suited for, articulations in the
alveolar to the palatal region. Place resolution is to within about 4.5 mm;time resolution is to within 16 msec.
METHOD
Subjects
The study employed four talkers (TB, FB, 'LL,.LR), all native,speakers of
American English. FB is female; the others are nali. FB'aneTB are practiced
talkers with the artificial palate; LL and LR u.. d their artificial -palatesFor the first time in this experiment.
,Stimulus Materials
The stimulus times (shown is Figure 1) were read from a randomized list.This list includes items in which It), [d], and flap [1] occur inintervocalicposition. Other items appeared in the liSt but will not be discussed, here.The items are grouped by stress environment and by likelihood ,' occurrence of
flap rather than stop articulationI. Flaps can be defined articulatorily bythe quick gesture of the tongue tip in the direction of the alveolar ridgeassociated with them. In American English., flaps typically occur "latter"
and "ladder," but not in "adorn" or "atone." In some contexts, flaps may
alternate with stops. These items, therefore, occur twice in the list; they
ar.e., distinguished by parentheses. Each talker prodUced six examples of each
item:
Measurement Procedures
The artificial palate used in dynamic palatography is about 1.5 mm thickand fits over the hard palate of the talker. It is embedded with 63 gold
electrodes configured as in Figures 2a and 2b. Sampling occurs every 15.6
msec. These data can be stored and played back for a frame -by -frame analysis
by means of the RION Model DP-01 electropalatograph. The electrodes are about
4 to 5 mm apart, depending on the size of the talker's palate (4.5 mm is usedas an estimate here).
Measurements related to closure duration and place of contact were made
both acoustically and palatographically. For the purposes of this study,
duration and place of closure were defined as follows. Complete closure was
defined oy contact with at least one electrode in 10 of the 11 columns labeled
in Figure 2a. The definition of completeness of closure was flexible sincethe 15.6 msec sampling interval of the palatograph was somewhat long relative
to flap durations (see, e.g., Fisher & Hirsh, 1976; Lisker & Price, 972;
Port, 1916; Zue & Laferriere, 1979), and since the electrodes 1..! tuned agwa
group rather than individually. Closure duration as measured from the palate,
62

TEST ITEMS
WORD LIST
FLAPPING ENVIROMENTS
post- stress heating , heedingheater, heeder, heat'er, heed 'erhotter, solder, water(Toto), (dodo)butter(dodo)addict (noun)potty, toddy
pre - stress at A, ad Aat Ive
NON - FLAPPING ENVIROMENTS
post -stress tutu (tado)(Toto), (dodo)
pre-stress atone, a tone, adornto d6, todaa dive
addict (verb)a day
OTHER ITEMS
halter, all day, saunter, center, sender,party, tardy, hearing, healing, hearer, healer,horror, holler, sorrow, solo, guru, zulu,hurry, holly, array, allay, a roan, &one
Figure 1. Word list.
69

64
"COLUMNS" OF THE PALATOGRAPH
ROW Io ROW 2
0 o oirovAr.....,o0 ROW 3oOoh o o o 0o ° 0 0 0 ° 0 ROW 4o 00000,00 0
o° 0 00043 °ooo00
0
"ROWS" OF THE PALATOGRAPH
Figure 2. Configuration of the electropalatograph. a. Columns. b. Rows.
1
4:!

then, was the number of frames of complete closure (as defined above)
multiplied by the 15.6 msec frame duration. Closure duration was measured in
the acoustic domain by demarcating visually the amplitude dip in the waveform
and Fl excitation in the spectral analysis. Place of contact was measured
from the palate by taking the mean of the front-most and rear-most rows
touched, where "rows" are defined as in Figure 2b. In order to estimate place
of contact from the acoustic analysis, frequency measurements of the second,
third, and fourth formants were made from spectral cross-sections taken at the
end of the acoustically defined closure interval neighboring the stressed
vowel.
RESULTS
Duration of Contact
Figure 3 plots the duration measurements made from the palatograph as a
function of those made from the acoustic analysis. For items that were
pronounced with flaps in all six productions by a given talker or with stops
in all six productions, each point represents an average over those six
productions by each talker. For items in which flaps alternated with stops in
a given lexical item, two points occur, one for the flap articulations and one
for the stops. In these cases, the points represent averages over fewer than
six productions. The dashed straight line indicates where all points would
fall if the two measurements were in perfect agreement.
The triangles in Figure 3 represent the set of tokens judged auditorily
to have been produced with a glottal attack on the second vowel. All of these
tokens occurred in the V-V environment. It is reasonable that acoustic
analyses should yield longer closure duration measurements than the palato-
graptAc measurements since the low amplitude of the waveform and the lack of
strong F1 may result either from closure of the upper vocal tract or from
glottal control. The perceptual salience of the glottal attack indicates that
the glottis is involved. This figure indicates that some of the flaps may be
"glottalized"; note the group of circles with waveform durations of 20 to 40
msec and palate durations of 0 to 20 msec. Very short durations are
problematic since the palatograph samples only every 15.6 msec. The averaging
over six tokens should, however, moderate this limitation, and, further, some
of the differences in the two measurements are larger than the expected
maximum difference of about 15 msec. What is more, the amplitude dip in these
tokens is somewhat greater than would be expected if upper vocal tract closure
were the only mechanism responsible. Thus, it is likely that at least some
flaps produced by these talkers involve some glottal control.
There is some indication that the artificial palate may interfere
somewhat with articulation (see Hamlet & Stone, 1978). Thus, some caution
must be used in interpreting data collected palatographically: Items that
sound unnatural may be made with articulations representing more usual habits,
while those that sound natural may be made with articulations that reflect
adaptive strategies. That the palates used are only 1.5 mm thick minimized
but did not eliminate this problem. However, the primary purpose of the
present experiment is to map out some acoustic correlates of certain articula-
tions, and for these purposes the limitation is not so crucial as it would be
if naturalness were required.
71
65

Q
1207.-,0N- 100rzw2 80wcrDC/)
W60w
2UI 04a.acc
81--4...,.1cl.
20
0
DURATION OF CLOSURE
r r2ALL ITEMS .7657 .54362 o V
WITHOUT A ITEMS .9391 .8817 0 o /i // o
oo /0 CD 4 0
0 000/0 /
0 0 04 0/ 000 //00 //0 /
0
/ 0
0 7/e/000 0
0 0 A(1)// 0 A
P6 o oOD 0
/ 00 0 1/0 6,00 00 0
0
A
A
/ 0 0 0 A, o 8 o o
00
0
0
A
20 40 60 80 100 120
WAVEFORM MEASUREMENTS (msec)
Figure 3. Correlation of duration measurements from waveform with those frompalatograph. Each circle is an average over six items produced bya given talker, except in cases where flaps alternate with stops.The dashed line indicates where all points would fall if the twomeasurements were in perfect agreement. Triangles represent theglottalized items.
66
72

In sum, though one must be aware of the limitations of the method, it is
possible to make fairly good closure duration estimates from acoustic ana-
lyses. This method accounts for 59% of the variance. Further, if the tokens
that are perceived as strongly glottalized are removed, 88% of the variance is
accounted for.
Place of Contact
Via characterization of retroflex sounds by lowering of the third andfourth formants has been noted (Fent, 1973; Ladefoged, 1975). That American
English flap has not typically been described as retroflexed may be due more
to its phonological role (its alternates with [t] and [d]) than to its
perceptual or acoustic qualities. Similarities of American English flap withsounds that are described as retroflex have been pointed out (see Monnot &Freeman, 1972, for a comparison with Spanish single-tap /r/; see Mori, 1929,for a comparison with Japanese flap /r/; see Price, 1981, for a more general
discussion). Since the flap production's collezted for the present study were
acoustically similar to the descriptions in the above-mentioned Ladefoged andFant references, and since there was corroboration of at least a more
posterior place of contact than for [t] or [d), it seemed reasonable to
measure F3 and F4 as a potential measure of degree of retroflexion.
The glottalized tokens were omitted in this analysis, since the place of
contact and the point at which F3 and F4 measurements were taken do not line
up temporally. The stop articulations ([t] or [d]) were also omitted, sincethe first electrode of the palate was not front enough to measure place of
contact accurately: recall that the technique involved the average of front-most and rear-most contact, and stops are produced with a wide area of contact
that spreads to the teeth where no electrodes are located. The analysis,
thus, concerns the set of all flap articulations.
Figure 4 shows the palatographic place measurements plotted as a function
of the third and fourth formant frequency measurements for the practiced
talkers (FB and TB). Both F3 and F4 for both talkers correlate rather well
with place of articulation as measured from the palatograph: 72-74% of the
variance is acunted for in each case. F3 was selected for future measure-ments, however, since it is easier to track and measure than F4.
These data show that reasonable place estimates can be made for a given
talker based on formant frequency measurements. Is it possible, though, to
make comparisons across talkers? Absolute frqeuency will not do, for example,
since an F3 measurement in the 2000 to 2500 Hz range represents the front-most
articulation for talker TB; the rear-most for talker FB. Multiplying these
frequency measurements by any constant that represents a given'talker's
formant frequency range might make normalization possible. Mean F2 was used
here and appears to have worked fairly well.
Figure 5 shows how well this normalization worked for all flap produc-
tions by all four talkers. Note that the female talker's productions are now
within the range of those of the three male talkers. The cluster of points
above 1.5 along the x-axis are flaps in the environment of front vowel /i/.
Again, the limitation of the placement of the front-most electrode probably
makes these articulations appear further back than they are. The correlation
67
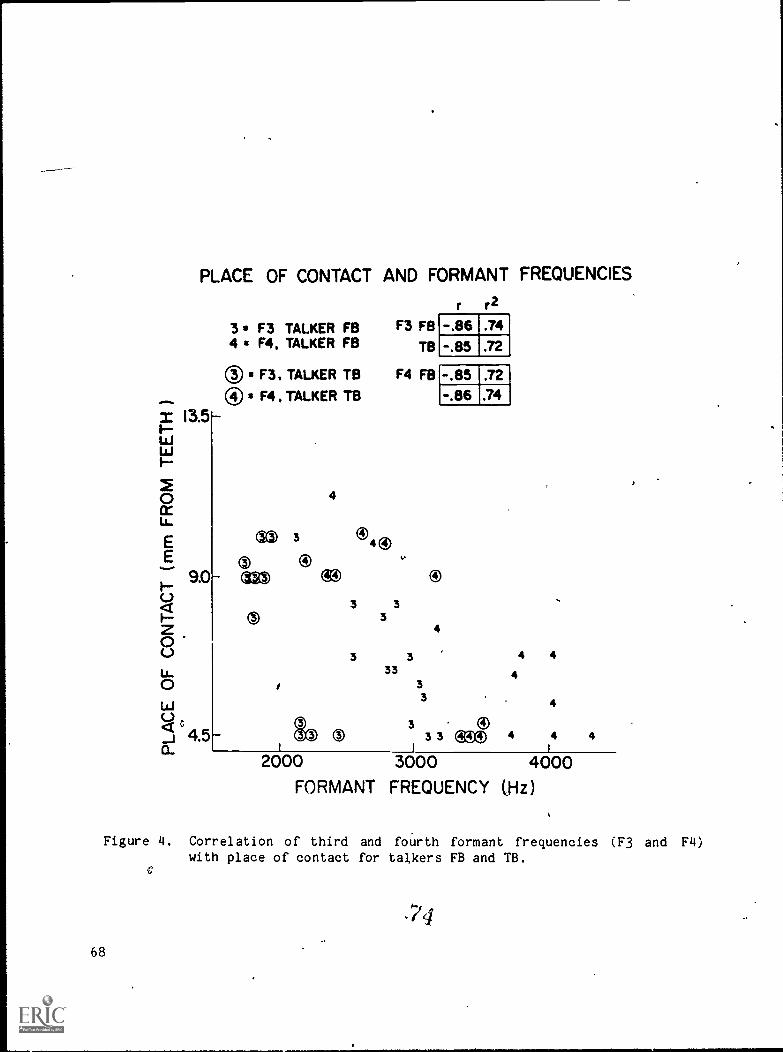
PLACE OF CONTACT AND FORMANT FREQUENCIES
13.51-w
0W
E9.0
FQ-
0u.0(.)
4.5C.
3* F3 TALKER FB4 * F4, TALKER FB
® = F3. TALKER TB® = F4, TALKER TB
4
O4®
r r2
F3 FB -.86 .74
TB -.85 .72
F4 FB -.85 .72
-.86 .74
'go O
3 33
4
3 3 4 433 4
33 4
3 ®33 ®® 4
1
4 4
2000 3000 4000FORMANT FREQUENCY (Hz)
Figure 4. Correlation of third and fourth formant frequencies (F3 and F4)
with place of contact for talkers FB and TB.
:7468

,
NORMALIZED F3 AND PLACEALL
FB TB LL LR TALKERS1 TALKER FB2= TALKER TO3* TALKER LR
13.5- 4* TALKER LL3
R1--ww1-
2c)ccto-
E2E
9.0- . 22 2 4
0I-- 4
IZ0 4C.)
rr2
-J32 -.85 -.884 4:82
.67 .72 .7? :67
3
3 33
32 2 3
14 . 142 1
U.0WU4Ja.
4.5-
1.0 1.1 1.2 1.3 14 1.5 1.6
'NORMALIZED' F3 (F3/MEANS F2)
4
-.78
.61
3 4
3 33 31 3 3 A
1
3 144 44 4
2 1 44
2 21 I 42
-,
Figure 5. "Normalized" F3 and place of contact. Correlation of F3 divided by
each talker's mean F2 with place of contact. All four talkers areplotted here.
69
75

coefficients are somewhat higher for the individuals than for the entiregroup. Yet the group coeffthient of -.78 (accounting for 61% of the variance)shows that fairly accurate place estimates can be made from acoustic analysis.
CONCLUSIONS
Subject to the limitations already mentioned, measurements in the acous-tic domain can be used to infer both place and duration!of tongue-palatecontact.
REFERENCES
Dorman, M. F., Raphael, L. J., & Liberman, A. M. Some experiments on the
sound of silence in phonetic perception. Journal of the AcousticalSociety of America, 1979, 65, 1518-1532.
Fant, G. Descriptive analysis of the acoustic aspects of speech. Speech
sounds and features (Chapter 2). Cambridge, Mass.: M.I.T. Press, 1973.
Fisher, W., & Hirsh, I. Intervocalic flapping in English. Chicago Linguistic
Society, 1976, 12, 18-198.Hamlet, S. L., & Stone, M. Compensatory alveolar consonant production induced
by wearing a dental prosthesis. Journal of Phonetics, 1978,,6, 227-248.
Ladefoged, P. A course in acoustic phonetics. New York: Harcourt Brace
Jovanovich, 1975.Lisker L. Closure duration and the voiced-voiceless distinction .in English.
Language, 1957, 33, 42-49.Lisker, L., & Price, P. J. Context-determined effects of varying closure
duration. In J. J. Wolf & D. H. Klatt (Eds.), Speech communication
papers presented at the 97th meeting of the Acoustical Society of
America. New York: Acoustical Society of America, 1979, 45-48.
Monnot, M., & Freeman, M. A comparison of Spanish single-tap In with
American /t/ and /d/ in post-stress intervocalic position. In A. Valdman
(Ed.), Papers to the memory_of Pierre Delattre. The Hague: Mouton,
1972.
Mori, M. The pronunciation of Japanese. Tokyo: The Herald-Sha, 1929.
Port, R. F. The influence of speaking tempo on the duration of stressed vowel
and medial stop in English trochee words. Unpublished doctoral disserta-
tion, University of Connecticut, 1976.
Price, P. A cross-linguistic study of flaps in Japanese and in American
English. Unpublished doctoral dissertation, University of Pennsylvania,
1981.
Zue, V., & Laferriere, M. Acoustic study of medial /t,d/ in American English.
Journal of the Acoustical Society of America, 1979, 66, 1039-1050.
'?6
70

PATTERNS OF HUMAN INTERLIMB COORDINATION EMERGE FROM THE PROPERTIES
OF NON-LINEAR LIMIT CYCLE OSCILLATORY PROCESSES: THEORY AND DATA*
J. A. Scott Kelso+, Kenneth G. Holt, Philip Rubin, and Peter N. Kugler
Abstact. The present article represents an initial attempt to
offer a principled solution to a fundamental problem of movementidentified by Bernstein (1967), namely, how the degrees of freedom
of the motor system are regulated. Conventional views of movement
control focus on motor programs or closed-loop devices and have
little or nothing to say on this matter. As an appropriate
conceptual framework we offer the physical theory of homeokineticsof Iberall and, his colleagues elaborated for matters of movement by
Kugler, Kelso, and Turv.ey (1980). Homeokinetic theory characterizes
biological systems as ensembles of non-linear oscillatory processes,
coupled and mutually 'entrained at all levels of organization.
Patterns of interlimb coordination may be predicted from the proper-
ties of non-linear limit cycle oscillators. -In a set of experiments
and formal demonstrations we show that cyclical, two-handed move-
ments maintain fixed amplitude and frequency (a stable limit cycle
organization) under the following conditions: (a) when brief and
constantly applied load perturbations are imposed on one hand or the
other, (b) regardless of the presence or absence of fixed mechanical
constraints, and (c) in the face of a range of external driving
frequencies from a visual source. In addition, we observe a tight
phasic relationship between the hands before and after perturbations
(quantified by cross-correlation techniques), a tendency of one limb
to entrain the other (mutual entrainment) and that limbs cycling at
different frequencies reveal non-arbitrary, sub-harmonic relation-
ships (small integer, subharmonic entrainment). In short, all the
above patterns of interlimb coordination fall out of a non-linear
oscillatory design. Discussion focuses on the compatibility of
these results with past and present neurobiological work, and the
theoretical insights into problems of movement offered by homeoki-
netic physics. Among these are, we think, the beginnings of a
principled solution to the degrees of freedom problem, and the
tentative claim that coordination and control are emergent conse-
*Also in Journal of Motor Behavior, in press.+Alsc Departments of Biobehavioral Sciences and Psychology, University of
Connecticut, Storrs.Acknowledgment. We wish to thank Katherine Harris, David Goodman, Betty
Tuller, Richard Schmidt, Ronald Marteniuk, and Michael Turvey for their
comments on an earlier version of this paper. The research was
supported by NIH Grants AM-25814, NS-13617 and Biomedical Research
Support Grant RR05596.
[HASnINS LABORATORIES: Status Report on Speech Research SR-69 (1982)]
71
77

quences of dynamical interactions among non-linear, limit cycleoscillatory processes.
0,
1. INTRODUCTION
The beginning of the 1970s brought about a remarkable change in the
approach of psychology and related disciplines to the area of movementbehavior. This sot-called prodpet to process shift that many have remarked on(e.g., Pew, 1974; Schmidt; 1975) evolved from emerging models of human
information processingand empirical attempts to discover the nature of amyriad of hypothetical processes--stimulus detection, memory retrieval,' re-sponse selection (to name but a few)--thought to be involved in behavioralaction. Even more significant was the embracing by,.psychologists of control-theoretic and cybernetic concepts; amove that led to models of motor skilllearning (Adams, 1971; Schmidt, 1975) and memory (cf. Laabs, 1973; Stelmach,1974) and a great deal of laboratory activity (for updates and developments ofclosed-loop theory, see Adams, 1977; for updates on schema theory, see Shapiro& Schmidt, 1982).
At the beginning of the 1980s it seems timely tb remark that our theoriesand models (like many of the theories and models in biology and the socialsciences) are flawed by a deep-seated anthropomorphism that extends back tothe time of Descartes: acting humans are compared to machines (computers andservomechanisms) provided with means of control and self-regulation. Motor
control theories are peppered with anthropomorphic concepts--perceptualtraces, reDerence mechanisms, comparators, schemas, programs, and so forth- -
created to "explain" data. Although these concepts have been, and probablywill remain, useful for developing an intuitive idea of the way motor systemswork, we believe it is now time to consider a dynamical account of movementbehavior--one that is consonant with the newly emerging physics of livingsystems (cf. Kelso, 1981; Kelso, Holt, Kugler, & Turvey, 1980; Kugler, Kelso,& Turvey, 1980, 1982; Turvey, 1980)--even if it is at the expetse of someabstraction. The theoretical approach offered here is in its infancy, but theneed for it and the types of experiments motivated by it (some of which wereport here) can be clarified when we consider further some of the shortcom-ings of existing theory.
2. SOME LIMITATIONS OF CURRENT THEORY1
The problem--aptly understated- -that has not received as much theoretical
attention in the movement domain as it warrants, is one shared by all livingsystems; namely, how the internal degrees of. freedom of the system are
regulated (cf. Bernstein, 1967; Iberall & McCulloch, 1969). Recently we andothers have addressed this problem in some detail (e.g., Fowler, Rubin, Remez,& Turvey, 1980; Greene, 1972, 1978; Kelso, 1981; Kelso & Holt, 1980; Kelso etal., 1980; Kugler et al., 1980, 1982; Turvey, 1977, 1980; Turvey, Shaw, &
Mace, 1978). One suspects that a main deterrent to a biologically motivatedsolution to the degrees of freedom problem lies in the view--shared by many- -that humans, like computers, are simply information processing devices
(cf. Berlinski, 1976). Theoretically, so the argument goes, computers canperform any calculable task that humans perform. Thus it should be possible
Cf

to retrace the putative sequential steps that a human takes in solving a
problem and instantiate them in program form. The physical realization of
"such a program would exhibit behavior that was artificially intelligent in the
sense that such behavior would be indistinguishable from human performance.
But, as Berlinski (1976) emphasizes, such a claim rests on a fundamental
error. Just because computers can simulate certain types of human performance
is hardly evidence that humans actually do employ such programs. Searle
(1980) takes a similar stance in noting that the feature that seemed so
attractive to people_ in artificial intelligence, namely the distinction
between the program cnd its realization, proves fatal to the claim that
simulation qualifies as auplication. This in Searle's (1980) terms:
The same program could be realized by an electronic machine,
Cartesian mental substance or a Hegelian world spirit... If mental
operations consist of computational operations on formal symbols,
then it follows that they have no interesting connection with the
brain (for) the brain just happens to be one of the indefinitely
many types of machine capable of instantiating the program. This
form of dualism...is Cartesian in the sense that it insists thatwhat is specifically mental about the mind has no intrinsic connec-
tion with the actual properties of the brain (pp. 423-424).
A second and related point is that both programming and cybernetical
solutions to the degrees of freedom problem vastly undermine,thedynamics of
the structure to be controlled. They fail, as Yates, Marsh, and Iberall
(1972) remark, the "test of matching": in order to couple a control device to
the system being controlled there, must be some match between scales of energy
or mass for efficient operation to ensue. In short, computational or
algorithmic solutions place their emphasis on the small signal, information
aspects of the system but undervalue the equally important energy-converting
machinery (the power fluxes, Yates et al., 1972). A viable account of the
dissipation of degrees of freedom' for motor systems should recognize the
mutuality between informational and power sources.
Much of current theorizing on motor'behaviyor perpetuates a conceptual
chasm between the brain as the source of signals for coordination and control
and the high power, energy-converting muscular system that is the putative
recipient of such messages. For example, in neurophysiological and behavioral
studies of movement, it is common for investigators to assume that the
products of 'motor fLnction are isomorphic with the underlying (brain)
processes from which those products derived. If the movement of an animal
terminates at some spatial location, within a set period of time, for example,
that spatial location and duration are said to be contained or represented in
the animal's motor program. The motor program then is viewed as causally
responsible for generating the spatial position of a limb and metering out the
ime it,takes for the limb to get there.
However, we suspect in real biological systems--unlike formal systems- -
there may be no need to represent explicitly every detail in the behavioral
sequence. Rather, sequential organization may be due primarily to dynamical
laws and the existence of constraints that serve to guide those dynamics
(cf. Pattee, 1977). If this view is correct, then the order and regularity in
movement behavior that we observe will not be dae to an a priori prescription--
73

in terms of programs or reference levels- that is independent of and causallyantecedent to the motor activity in question. Nor will it be an isomorphic
representation of the behavior to be- explained. Rather, spatiotemporal
organization--the dissipation of degrees of freedom--will arise as an a
posteriori fact, an emergent property that is a consequence of, and concomi-tant with the dynamical behavior of the system (cf. Fowler, 1977).
3. THE DYNAMIC ALTERNATIVE
The answer to what Bellman (1961) called "the curse of dimensionality"--the problem of understanding the relation'ship between informational and powerprocesses--is offered in a recourse to dynamics, defined as the physics of
motion and -4-.ange. If, 'as we assume, living systems obey the laws of physics
(though they are not readily reducible to them) then, given that formal
machine concepts may provide an inadequate basis for complex behavior, whatcan a dynamical, explanation offer in their ,place? To provide a reasonable
answer _to this question we have to be armed with certain physical concepts
that apply to active living systems.
In the past, a physical description of biological processes has been
deemed inappropriate because dynamics has dealt almost exclusively with the
behavior of closed, entropic systems (i.e., systems tending towards randomness
and disorder). Thermodynamic law states that in a closed system the tendency
toward entropy will increase to a maximal value, and that the process is
irreversible. In contrast to closed, physical systems, living systems are
"open," by virtue of their ability to capture, degrade, and 'dissipate free
energy. As Schroedinger (1945) remarked, living systems "accumulate negentro-
py" and in so doing maintain their structure and function.
It is only recently that an adequate physics has developed to accommodate
the facts of biological systems. Following the lead of Prigogine (1976;
Prigogine & Nicolis, 1971) and Katchalsky and Curran (1967), Morowitz (1979)
has provided argument that continuous energy flow through a living system
constitutes its chief distinguishing feature. In order to prevent the drift
towards static equilibrium, biological systems must perform work. Since an
isolated, closed system cannot do steady work, it must be connected with a
source and a sink; and it is the flow of energy from the source to the sink
that constitutes work. Energy flow, per se, is the chief organizing factor of
iliving system3 (cf. Morowitz, 1979).
All this may seem far removed from a theory of movement, but it leads us
re to one fundamentally important principle that follows from Morowitz's (1979);1 main Theorem (p. 33): the flow of energy through the system from a source to
a sink will lead to at least one cycle in the system. It is the notion that
cyclicty provides a dynamic basis for investigating (and understanding) motor
systems that we turn our attention to next.
V074

4. CYCLICITY, WITH SPECIAL REFERENCE TO HOMEOKINETIC PHYSICS
(Iberall, 1977, 1978; Iberall, SoOdak, & Hassler, 1978,
Soodak & Iberall, 1978; Yates, 1980;Yates & Iberall, 1973).
Persistent cyclicity in biological systems is a non-linear phenomenon; if
it mere not, the strictures of thermodynmics would ensure a steadily decaying
function. Consider, for example, simple mechanical systems such as a mass, -
spring, in which the equation of motion describes a trajectory towards an
equilibrium state. Such systems may be described by a second order differen-
tial equation as follows:
mi + ci + kx = 0 (1)
In Equation 1, oscillatory motion will decay at a rate proportional to the
magnitude of the viscous (frictional) term c. This fact is predicated upon
the second law of thermodynamics- -time flows in the direction of entropy. Yet
as we have noted above, living systems are characterized by sustained motion
and persistence; they are not statically stable; rather they maintain their
form and function by virtue of their dynamic stability. How then, can we
ensure sustained motion without violating thermodynamic law?
Consider again the familiar mass-spring equation, but this time with a
forcing function F(0):
+ ci + kx F(0) (2)
It is not enough to supply energy to the system described in Equation 2. It
must also be supplied at the right place and time in the oscillation.
Moreover, the forcing function must exactly offset the energy lost in each
cycle for sustained performance to occur (i.e., to satisfy thermodynamic
strictures). Many real systems meet this requirement by employing a
mechanism--called an escapement--that releases exactly the energy needed to
compensate for dissipative losses.2 The escapement.consists of a non-linear
element that taps energy from a high potential source--as long as it lasts--to
overcome local thermodynamic losses. Thus 'a pulse or' squirt" of energy is
released into the system via the escapement such that, averaged over cycles,
the left hand side of Equation 2 equals the right hand side, thereby ensuring
sustained motion. Such cycles are called limit cycles because they are
capable of returning to a stable mode regardless of disturbances that may
speed up or slow down the cycle (see below for further details of limit cycle
properties) .
Real clocks are nori-linear ltmit.cycle oscillators, that once started,
have self-sustaining properties (cf. Andranov & Chaiken, 1949). Many investi-
gators of movement have hypothesized the existence of "clocks" or "metronomes"
for purposes of timing (see Keele, 1981, for most recent review) and the
rhythmic structure of many biological systems is beyond question (cf. Aschoff,
1979; & Goodwin", 1971) as is the existence of social-cultural rhythms
(e.g., Bazelton, Koslowski, & Main, 1974). However, neither in the field of
chronobiolo nor in the motor systems area are such hypotheses based firmly
in physical heory. Cyclicity (clock-like behavior) in a system arises as a
consequence f the transfer of energy from a high potential source to a low
75

potential sink. Cyclic,ty is ubiquitous in all complex systems, as Yates
(1980) has emphatically remarked, because it is an "obligatory manifestationof a universal design principle for autonomous systems."
What does a physicallybased theory of periodic phenomena buy us in termsof a principled approach to the coordination and control of movement? The
histot.ical antecedent to modern models of the regulation of behavior is theBernardCannon principle of homeostasis. That is, the int: -nal states of anorganism are preserved at 1.1.!.quilibrium despite changes in the external
environment. Modern feedback theories (mbdeled on quasilinearservomechanisms) extend the notion of a reference signalasgoal state to onethat can be achieved and adjusted through processes of detection, comparison,and error correction3 (cf. Adams, 1971, 1977; Schmidt, 1975). In sharpcontrast, the physical scheme tat we outline here is homeokinetic (Iberall,
1970). It is the operating conditions of a configuration of interacting, nonlinear _limit cycle oscillatory processes that determine the stability (orregulated state) of the organism. According to Iberall and his .colleagues
(Iberall, 1977, 1978; Iberall et al., 1978; Yates & Iberall, 1973) stability
in selforganizing autonomous systems (the living kind) .arises when manycyclical processes become entrained. Thus we can conceive of systemic
behavior as being established by'an ensemble of nonlinear components that areentrained Into a coherent configuration.
Elsewhere we have reviewed and presented evidence for the notion--
stemming L'rom Bern3tein's (1947) initial insights- -that a group of. muscles,functioning as a unit, exhibits properties qualitatively like that of a- nonlinear oscillatory system (of. Asatryan & Fel'dman, 1965; Fowler et al., 1980;
Kelso, 1977; Kelso & Holt, 1980; Kelso, Holt, & Flatt, 1980; Kelso et al.,
1980, for review). Brief. we have shown that limb movements may be
terminated accurately despite unexpected changes in initial conditions, unpre'
dictable load disturbances during the movement trajectory, functional deafferentation, and all of these in combination. These results have been widely
accepted both in animal and human work (e.g., Cooke, 1980; Polit.& Bizzi,
1978; Schmidt, 1980) and are interpreted--to .,..a first approximation--as evi
dence for a massspring system (see alsaitalerbacn, 1980, for expansion of
this view to cursive handwriting). But linear massspring systems cannot
exhibit homeokinetic properties even though they are capable .2f displaying
periodicity. That is to say,. the only cycles that meet the nonlinear andselfsustaining criteria of biological, systems are limit cycles (cf. Goodwin,
1970; Yates, 1980; Yates A, Iberall, 1973). A brief discuiSion of limit cycle
properties is thus in .order, since it is these that provide a deductive
framework for the present experiments.
5. PROPERTIES OF (NONLINEAR) LIMIT CYCLES
(cf. Minorsky, 1962; 'Pavlidis, 1973; Solrberger, 1965)
To reiterate, briefly, the central feature of homeokinetic physics is the
dynamic regulation of a system's internal degrees of freedom by means of
coupled ensembles of limit cycle oscillatory processes. In contrast to
program and cybernetical conceptions, homeokinetic physics views the existence
of active, interacting components and large numbers of degrees of freedom as a
76 82

necessary and desirable attribute of complex systems. Homeokinetics predicts
the discovery of numerous cyclicities and evidence for their interaction. But
what is the nature of these cyclicities and what form does their interactiontake?
An important caveat at the outset (though it shall not deter us here;
instead it is the impetus for the present work) is that the mathematicalanalysis of nonlinear oscillators has hardly begun (cf. Pavlidis, 1973). In
contrast, for linear systems, motion in time is relatively easily described,even though the formula describing motion, x = f(t), can be quite complicated.Such functions are conceived of as a system of derivatives, from zero order(the position itself, x) to high order, expressed by a differentia) equationwhose degree is given by the exponential number of the highest differential.In linear-systems, motion is regarded as a linearly additive system of firstdegree differentials whose coefficients may be constants or functions of t,but not functions of x. The family of functions described by lineardifferential equations are open to solution by various methods of integration.
In sharp contrast, there are no general solutions for nonlinear differential equations of motion. For example, in the famous van der Pol equation:
mx + k( 1x2y + bx = 0
where x = displacemedt
k = stiffnessb = damping
m = mass
( 3 )
the stiffness coefficient k is itself a function of the dependent variable x,
giving rise to the nonlinearity and thus negating a unique solution.
Fruitful insights into nonlinear systems are obtained by graphical methodscalled phase plane techniques, which plot the first differential, velocity xagainst displace, ent x. A set of simple examples is given in Figure 1.
Consider a linear differential equation, Z + w2x = C. When integrated, theequation yields a set of phase ellipses of tue form (x)2 + (wx)2 = c. One
such ellipse is shown in Figure 1A and represents the relation between
velocity and position in a simple oscillation. The curves themselves arecalled phase plane trajectories; it is clear in Figure 1A that the phase planerepresents a stable, periodic motion since velocity and position repeatedlyreturn to a certain value (for further details, see figure caption). The
spiral trajectory shown in Figure 1B represents an oscillation with continu
ously decreasing amplitude until it reaches a standstill. A spiral inwards
constitutes a damped oscillation; if the direction were outwards (not shown) ,
the oscillation would be unstable with increasing amplitude.
The important point to realize about the phase trajectories illustratedin Figure 1A and 1B is that they are based or linear systems. A change in any
parameter, such as the damping coefficient, drastically changes the form of
the solution (and thus the phase trajectory). There is then, no preferred
solution or set of solutions in a linear system. This is not the case in non
linear systems in which all trajectories tend asymptotically toward a singlelimit cycle despite quantitative changes in parameter values (see Figure 1C).
Thus, a highly important property of limit cycles is their structural
77
8i
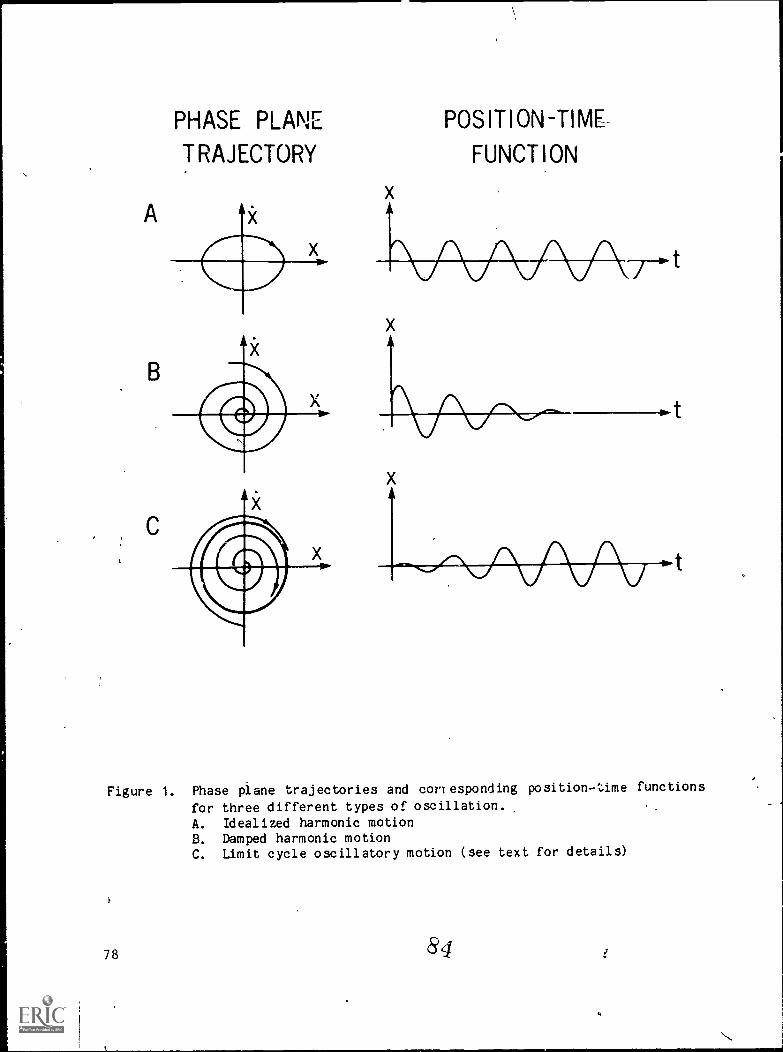
A
B
PHASE PLANE
TRAJECTORY
POSITION-TIME
FUNCTION
Figure 1. Phase plane trajectories and con esponding position-time functions
for three different types of oscillation.
A. Idealized harmonic motionB. Damped harmonic motionC. Limit cycle oscillatory motion (see text for details)
i
78
t
84 J
..
stability in the face of variations in parameter values. That is to say,
limit cycles exhibit a tendency to maintain a fixed amplitude and frequency (a
stable, orbital trajectory) no matter how perturbed (cf. Hanson, 1978; Minor-
sky, 1962; Oatley & Goodwin, 1971; Pavlidis, 1973). Furthermore, in order for
non-linear oscillators to offset precisely the energy lost during each cycle
(in the drift towards equilibrium) they must degrade a large amount of free
energy (cf. Hanson, 1978; Yates & Iberall, 1973). Because of high energy
exchange, non-linear oscillators are quickly resettable following external
perturbations. As we shall see, the rapid return of limit cycles to their
preferred frequency and amplitude following experimentally imposed perturba-
tions is a pre.,-Ainant feature of the data in the present experiments.
As we have already hinted, and as Pavlidis (1973) further emphasizes,
coordination in biological systems arises from cooperative relationships among
non-linear oscillator ensembles. In sharp contrast, linear oscillators do not
interact among themselves--a fact that is based on the superposition principle
in the theory of oscillations (Minorsky, 1962). As defined, the superposition
principle says that oscillation in a system of several degrees of freedom
consists of a number of component oscillations, each independent of the other.-
An essential property of nog-linear oscillatory systems, though, is that
they always exhibit interaction. Perhaps the chief mwie of cooperation among
self-sustaining oscillators (and germane to the present experiments) is that
of entrainment or synchronization.4 Apparently, the entrainment phenomenon was
first observed by Huygens in the 17th century (cited by Minorsky, 1962).
Huygens noted that two clocks whose "ticks" (oscilliions) were out of step
became synchronized when attached to a thick wooden board. Some two hundred
years later, physicists studying electrical circuits and acoustics
rediscovered the .synchronization' effect. When an electrical force of
frequency W is applied to an electron-tube oscillator (frequency = yo), the
"beats" of both frequencies are apparent. As the frequencies get closer
together the beats diminish' until" at certain difference value W-Wog they,
disappear entirely and a single frequency, W1, remains, Similarly when two or
more oscillators interact, mutual entrainment occurs (the "magnet effect" of
von Holst, 1973) with only a small detuning of their frequencies (Minorsky,
1962). Also, if the frequency of one oscillator is an integer multiple of
another to which it is coupled, then subharmonic entrainment--another form of
mutual interaction--takes place (also called frequency demultiplicaton).
In sum, entrainment is an emergent property of a system of aon-linear
oscillators; it is truly a self-organizing process in the sense that a
collection of mutually entrained oscillators functions as a single unit. If
indeed biological systems are composed of limit cycle oscillatory processes,
then the so-called "degrees of freedom problem"--apparent- in much of the
current theorizing orr'movement control--may be minimized through recourse to
the entrainment property of non-linear systems. Moreover, entrainment ensures
that the degrees of. freedom may be dissipated with maximum efficiency-and
minimum energy cost,. Let us consider how this dynamical view interfaces with
behavioral experiments.
79

6. THE PRESENT EXPERIMENTS
There is a, rich empirical background in support of the presemttheoretical perspective. But little of the work is on human subjects (seeCohen, 1970; and Schepelmann, 1979, for exceptions), and none of it isphysically (dynamicarly) founded. Rhythmical phenomena abound at allphylogehetic levels and in many different activities (see Delcomyn, 1980, andStein, 1976 for reviews). Some of the early work on interlimb phase controlby von Holst during the 1930's is classical in this respect, although it isnot well known (see von Holst, 1973, for English translation). In hisexperiments on fish fin movements for example, von Holst identified two maintypes of coordination. The first of these he termed absolute coordination--a1:1 correspondence between cyclicities of different structures (i.e., wherephase and period are the Same). The second--much less common interactivestate--was called relative coordination. Here the fins exhibited differentfrequencies although at least one of the hases.usualfy corresponded to thatobserved during the absolute coordination state.
Relative and absolute coordination bear a close similarity to the
entrainment properties of non-linear oscillators that we have addressed in theprevious section. More recently, Stein (1976, 1977) has elaborated on vonHolst's work using the mathematics of coupled oscillators to predict interlimbphase relationships based on the activity patterns of "coordinating neurons"in cockroach and crayfish (see also Graham, 1977). As Stein (1977) notes, theoscillator theoretic approach to neural contr.,: is in an embryonic/tate. Butan important first step (which we attempt to take here) is to examine thequalitative predictions of the theory.
For 'present purposes, there are two Nnpirical antecedents to the
following set of experiments. The first is the finding, discussed earlierthat muscles acting at a joint exhibit ,properties that, to a firstapproximation, are qualitatively' like a mass-spring system. The importantpoint to realize is that such a system is intrinsically rhythmic or cycliceven though it does not have to behave rhythmically or cyclically. Thus,-depending on its parameterization, a mass-spring system may or may notoscillate. Discrete and cyclical behaviors may therefore arise as differentmanifestations of the same underlying organization (cf. Fel'dman, 1966; Fowleret al., 1980; Hollerbach, 1980; Kelso & Holt, 1980). The present experimentsare continuous with this theme and examine cyblical.movements per se.
The second antecedent for the current work comes from earlier studies ofhuman interlimb' coordination (cf. Kelso, Southard, & Goodman, 1979a, 1979b).
When subjects perform movements of the two limbs to different sized targets atdifferent distances from a home position, they do so almost simultaneously.Moreover, the limbs reach peak'velocity and peak acceleration at practicallythe same time during the movements (see also Marteliuk & MacKenzie, 1980). If
subjects are. required to move both limbs to separate targets, but one limbmust hurdle an obstruction on the way, the other unobstructed hand describes asimilar ?rc - -at least on the first few trials (Kelso, Putnam, & Goodman, Note1). When simultaneity is disrupted by instructing the subject to strike onetarget before the other, there is a sizable cost (either in initiation time ormovement errors) compared to temporally compatible, simultaneous conditions(Goodman & Kelso, Note 2; Kelso et al., 1979a; see also Klapp, 1979).
UO
86

The ubiquity of.tim1lig constraints in movement is consistent with the
clock-like behavior of mutually entrained oscillators (see Keele, 1981, for
further examples, but a different interpretation), which, as we have
empcasized, has a firm dynamic basis.5 It remains now for us to examine (and
to illustrate) in a more direct manner some of the interlimb relationships
predicted by the properties of limit cycles. One of ::.he dominant techniques
used to establish the autonomy of rhythms is to perturb the system away from
its steady state behavior and observe the manner in which the system
reorganizes itself (for example, this procedure is paradigmatic of circadian
rhythm research, see Menaker, 1976). Only a system of non=linear oscillatorswill exhibit maintenance of frequency and amplitude (i.e., a bounded phase
trajectory or limit cycle, see Figure 1C) despite perturbations. Thus in the
first four experiments reported here (Series A), we examine the foregoing
prediction in a simple way'. As the fingers' of the two hands perform cyclical
movements, one or'another is unexpeftedly perturbed by tne injection of a
brief torque load or a constantly applied load supplied by D.C. torque motors.
Our interest is to define the qualitative features of the system's response to
perturbations as revealed in phase,' amplitude, and frequency characteristics
lot' each hand. t
The, remaining aspects of non-linear .oscillatory systems that we shall
pursue here focus on resonance and entrainment properties. First, non-linear
oscillators (unlike linear ones) do not exhibit resonance--an amplitude
increase -when driv.en at their preferred frequency. As noted by Iberall and
McCulloch (1969), a fundamental observation about human motor behavior is that
externally it does not appear to have a strong metric, but interally it must
have. Complex humans operating homeokinetcally are self-timed and not tied
(in any stimulus-response manner) to external cue constraints. Thus the
stability_ properties of limit cycles predict that their orbit should remain
fixed over a fairly wide range of driving frequencies. Second, non-]inear
oscillators that:are coupled together will exhibit (a) mutual entrainment if
allowed to function at their preferred frequency and (b) subharmonic (small-
integer) entrainment if one is driyen at a different rate from the other. As
weshall see, the data from the remaining experiments (Series B and C) are a
testimony to the powerful entrainment feature of non-linear (limit cycle)
oscillators.
GENERAL METHODS AND PROCEDURE
The apparatus used in all the experiments to be reported here consisted
of a finger positioning device and associated programming electronics, the
details of which are described in an earlier paper (Kelso & Holt, 1980).
E3sentiaily the apparatus_ consisted of two freely rotating supports that
allowed flexion and extension of the index fingers about the
metacarpophalangeal joint in the horizontal plane. Situated above the center
of rotation of each support were programmable D.C. torque motors. An
electron:cs control package permitted programming of torque motor output with
respect to movement of the finger:fin either direction. Thus, in some of the
experiments (1 to 4; Series A) perturbations of either digit could be applied
for a short duration (termed "brief ,load") or for a prolonged period
("constant load"). Potentiometers mounted over the axes or motion provided
analog signals from which digital representations were obtained via analog-to-
81
87

digital conversion at a sampling rate of 200 Hz. Additional onset and offset
of load perturbation (Series A) and a metronome timing signal (Series C) were
specified by analog impulses. A package,of conversion routines--implementedon a PDP-11/45 computer- -was used to convert the digital signals and displaythem as timedomain displacement tracings. Additional programs provided meanamplitude, frequency,'duration and phase information (cf. Goodman, Rubin, &
Kelso, Note 3).
On entering the laboratory, subjects were familiarized with the movementapparatus and seated in a dental chair so that both arms and hands could becomfortably secured in the positioning_device. The procedures were describedto the subject and any questions answered. The task throughout all
experiments was to move the index fingers of one or both hands in a cyclical(flexionextension) manner from the onset of an auditory start signal to astop signal. For the twohanded task, the movements were always symmetrical,i.e., flexion (extension) of one hand was accompanied by flexion (extension)of the other, Instructions in all the experiments were to move the finger(s)continuously over a 10 sec trial in a way that felt most comfortable andrequired least effort.
A. PERTURBATION EXPERIMENTS (1 THROUGH 4)
Specific Methods and Procedures
The subjects were righthanded male and female volunteers who were -paidfor their services. Two groups of subjects were used--a singlehand group(N16), that completed the experialents using the index finger of only one hand,and a bimanual group (N=6) that used the index fingers of both the left andright hand simultaneously. In the bimanual group, trials were randomized scthat the subject received either nor perturbation, a perturbation of the leftindex fingep, or a perturbation of the right index finger. Four trials were
given in each of the three conditions, a total of 12 trials for eachexperiment. In the singlehand group, subjects were told which finger to moveand a given trial was either perturbed or not perturbed.6
In Experiments 1 and 2, clamps were placed on-the protractor arm of theapparatus, the purpose of which was to constrain movements to a 50 degreerange (40-90 degree extension). In Experiment 1, the perturbing torque wasset, at 50% of maximum torque output available (40.8 ozin) for a duration of.100 msec, and was introduced approximately midway through the 10 sec trial.
The perturbation was injected in a flexion direction as the finger movedthrough the extension phase of the cycle. In Experiment 2, the torque loadwas reduced to 25% of maximum (20.4 ozin) and was introduced about half waythrough the trial and maintained until completion of the trial. The constant
torque load was applied in the direction of limb flexion. Thus, during
extension of the index finger the load opposed movement; during finger flexionthe load acted in the same direction.
Experiments 3 and 4 were replications of 1 and 2 with the exception thatthe constraints were removed, allowing subjects to select both amplitude and
frequency of movement.
82

Data Analysis
Measurements of movement amplitude and frequency were obtained from
converted digital signals. This procedure relied upon a computerbaseddetermination of displacement maxima and minima per cycle in order to arrive
at cycle amplitude. Mean values of amplitude and frequency were obtained only
for those cycles before and after the perturbation cycle, and appropriate
comparisons made using paired ttests.
To examine the phasic relationships between the two limbs (in the
bimanual group), two analyses were employed. The first involved a computer
generated display in which the displacement tracings were superimposed such
that any phasic lag or difference between them could be immediately observed.
For example, the lower tracing on Figure 2 shows an almost perfect
superimpcsition of the upper individual tracings from each individual hand.
In order to quantify phasic relationships, a second method compared the
two traces using crosscorrelation techniques. The crosscorrelation function
for two sets of timedomain data describes the general -deeendence of the
values of one set of data on another. For example, if u(t) corresponds to the
signal for the right index finger and v(t +I ) corresponds to the signal for
the left index finger delayed by the interval 't(tau), an estimate of the
crosscorrelation function for a given tau may be obtained by taking the
average product of the two values over the observation time T. The resulting
average product will approach' an exact crosscorrelation as T approaches
infinity. In -thil way the actual phase lag or tau between the waveforms of
each hand and the correlation at that lag were calculated for all cycles
before and after the perturbation on each trial.
Results .
(a) Frequency between and within limbs: The pre and postperturbation
analysis for the frequency data in the' bimanpal group across all four
experiments is shown in Table 1. Clearly, the results of this analysis point
to a very tight periodic relationship between pre and postperturbation
cycles within each limb. It may be noted that the frequency changes following
a brief perturbation range from. 0 to .03 cycles per sec. Similarly, the
frequency of a limb that, subsequently receives a constant load remains
virtually unchanged (0 to .05 cycles per sec). None of the pre versus post
differences in frequency attained statistical significance (p > .05).
In the single, hand experiments, it can be seen again that frequency
changes, following brief perturbation and the addition of a constant load are
small, although they tend to be a little higher than in the bimanual case (.01
to .07 cycles per second, see Table 2). Again, none of the differences
attained statistical significance (p > .05), nor is there any systematic
directional bias in the small frequency changes that are observed.

v
CONSTRAINED CYCLICAL MOVEMENTS
0
PERTURBATIONONSET
1 2 3 4 5 6TIME (SECONDS)
7 8 9 10
Figure 2. Twohanded cyclical movements between physical constraints. The
right index finger was deflected in the direction of flexion as it
was extended. In the lower tracing, the two upper tracings aresuperimposed. The almost perfect overlap reflects- the tight periodand phase linkage between the fingers. It is interesting to notethat the two fingers regained their phasic relationship within thesame trial as the'perturbation occurred.
84

Table 1
Means and Standard Deviations of Frequency for
Cyclical Movements of Two Hands
Experiment 1: Amplitude constrained, brief perturbation
PRE-PERT POST-PERT
Right perturbed:
Left perturbed:
Condition Na
right hand' 23
left hand 23
right hand 25
left hand 25
Meanb. SD Mean SD t
1.39 0.40
1.49 0.56
1.45 0.50
1.45 0.47
4 '
1.)0 ,
1.46
1.43
1.47
Experiment 2: Amplitude constrained, constant perturbation
Right perturbed:
Left perturbed:
right handleft hand
right handleft hand
2222
2525
Experiment 3: Free, brief perturbation
Right perturbed:
Left pertdrbed:
right hand 19
left hand 19 ,
right hand 19
left 'land 19
Experiment 4: Free, constant load
Right perturbed:
Left perturbed:
right hand 19
left hand 19
right hand 19
left hand, 19
1Number of data pairs
bFrequency in Hertz (cycles per second)
1.37 0.29 1.34
1.33 0.30 1.28
1.25 0.31 1.24
1.25 0.29 1.22
1.68 0.18 1.69
1.69 0.20 1.71
1.72 * 0.19 1.74
1.72 0.17 1.73
1.79 0.19 1.78
1.79 0.18 1.79
1.82 0.16 1.84
1.81 0.16 1.82
0.44 -0.63
0.49 0.84
0.47 1.98
0.47 -1.26
0.27 1.12
0.27 1.72
0.29 0.580.26 1.73
0.16 -0.780.16 -0.53
0.18 -1.270.14 -0.29
0.13 . 0.270.13 0.25
44
0.19 -0.680.21 -0.19
91

Table 2
Means and Standard Deviations of Frequency forCyclical Movements of One Hand
a. FREQUENCYa CONDITION Nb
PRE-PERT
Mean SD
POST-PERT
Mean SD
'Expt. 1: Left; hand alone 18 1.56 G.43 1.53 0.39 1.52
'Right hand alone 17 1.48 0.38 1.49 0.47 0.35
Expt. 2: Left hand alone 18 1.57 0.48 1.56 0.48 0.67
Right hand alone 17 1.58 0'.43 1.49 0.31 1.83
Expt. 3: Left hand alone 19 1.82 0.52 1.77 0.54 2.05
Right hand alone 18 1.90 0.80 1.88 0.51 0.66
-Expt. 4! Left hand alone 19 1.88 0.57 1.95 0.63 -2.93
Right hand alone 19 2.01 0.50 1.99 0.55 0.44
aIn Hertz
bNumber of data pairs
(b) Phase relationships between limbs: The tight periodic relationshipin the pre- and post-perturbation cycles within a limb is matched by a tightperiodic and phase relationship between the hands. In Figures 2, 3, and 4
examples of the superimposed displacement curves for each experiment are
shown. It is clear that desPi e the imposition of different perturbations, atight phasic link between the two fingers is preserved. Quantification of
these data using cross-correlation techniques-verified the extremely closeperiod and phase of the two fingers. The mean tau values and the correlationsat those values averaged across trials for each subject are shown in Tables 3
and 4. Absolute values of phase lag (T) both pre- and post-perturbation aresmall, and correlations (with only a few exceptions) are extremely high.
(c) Am litudes between and within limbs:
for the bimanual and single-handed groups is
respectively. In general, amplitudes tended to
of anomalous findings (se,., for example,
Experiments 1 and 2, Table 6).
86
92
Analysis of.the amplitude dataprovided in Tables 5 and 6,remain constant with a coupleExperiment 4, Table 5, and

FREE CYCLICAL MOVEMENTS
0
50
5d
EXTENSION
PERTURBATLY1
ONSET
5O EXTENSION I
-4-I h*-
I I " I I I I 1100rtesee i 1 1
0 1 2 3 4 5 6 7 8TIME (SECONDS)
r.,
4.
Figure 3. Two-handed cyclical movements without constraints on movement
amplitude. Note that the right hand showed a greater range offlexion-extension than the left, with a greater'velocity. Phase
and period of the two hands are again tightly limited and
reentrained within the same cycle after brief perturbation of the
right index. /e
<t 87

FREE CYCLICAL MOVEMENTS
6-1 1 ,.4
+it
FLEXION
EXTENSION LEFT INDEX
I PEhTURBATIONV ONSET
Figure
83
4 5 6TIME (SECONDS)
4. Two- handed cyclical movements without constraints on movement
amplitude. A constant load was added to the left index finger inthe direction of flexion, while the subject moved in extension.The result on the first cycle was a dramatic decrease in velocityand amplitude. In the remaining cycles, compensation occurred suchthat not only were phase and period relationships maintained, butalso the kinematics--velocity and ,amplitude.
9,1

Table 3
Cross- correlation Analysis of Pre-PerturbationCycles (Two Hands)
EXPERIMENT 1 EXPERIMENT 2
Subject
Correlation
Mean SD;----;
TAU,(msec)
Mean
a .
SD
Correlation
Mean SD_
TAU (msec
Mean
)
SD
1 .94 .17 5.71 3.20 .95 .02 4.29 3.192 .97 .02 11. 43 4.40 . .98 .01 0.00 . 0.003 .99 .01 10.00 9.58 ,.98 .01 10.63 8.084 .98 .01 14.00 4.90 .97 .01 13.75 6.005 .97 .01 12.50 8.54 .97 .01 12.50 6.126 .97 .04 5.00 5 . 35 .94 .05 13.75 8.93
4
i
q EXPERIMENT 3(
EXPERIMENT 4
. Correlation _TAU(msec) l. , Correlation TAU (msec )
.,
Subject Mean SD Mean SD Mean SD Mean SD
.1 .98 .0 6.25 4.84 . 95 .04 15.00 1 1.02
2 .99 .01 5.80 3. 21 .95 .02 1 7. 05 2.503 - .98 .01 5.63 6. 34 .91 .07 15.63 10.74
4 .97 .0.1 12.50` 2.50 .96 .02 13.13 4.29
5 .96 .01 11.43 6.93 .96 .03 11.50 9.276 .94 .04 14 . 38 17.40 .94 .04 1 6. 43 13.02
aphase lag with resolution to 5 msec
:.` 95
I.
..1
1 89

ONI11=1
Table 4
Cross-correlation Analysis of Post-PerturbationCycles (Two Hands)
EXPERIMENT 1 EXPERIMENT 2
Subject
Collation
, !
Mean, SD
TAU(msec)a
Mean SD
Correlation
Mean SD
/
1 .931
.04 8.57 5.80 .87 .06
2 .97 ' .01 C..43 3.50 *
3 99 .01 10.71 4.95 .89 .06
4 .98 .00 23.00 9.80 .87 .04,
5 .98 .02 7.50 5.59 .84 .05
EXPERIMENT 3
TAU(msec).
Mean SD.
4.29 6.39
11.25 7.4043.5:.! ',0.31
15.63 9.50
\ EXPERIMENT 4
Correlation TAU(msec) Correlation TAU(msec)
Subject Mean SD Mean SD Mean SD Mean SD*---- ____
10.71 6.78
22.50 13.46
10.00 8.66
21.88 1.2110.29 1083
1 .97 .02 __,13.75 8.93 .84 .06
2 .99 00 i 7.36 2.61 *
3 .98 .01 4.38 4.64 .72 .07
4, .96 .17 14.38 7.26 .76 .26
5 .96 .02 14.29 11.16 .89 .06
6 .90 .09 21.88 20.76 .89 .05
'insufficient data
aphase lag with resolution 'to 5 wee
9690
1

eTable 5
Means and -Standard Deviations of Amplitude for
Cyclical Movements of Two Hands
Experiment 1: Amplitude constrained, brief perturbation
PRE-FERTb POST-PERT
Condition
Right perturbed: right handleft hand
Left perturbed: right handleft hand
Na Mean SD
23 50.92 2.24
23 50;80 -2.16
25 51.16 2.34
25 51.93 1.80
Mean
51.5048.84
50.2751.31
Experiment 2: Amplitude constrained, constant perturbation
Right perturbed:
Left perturbed:
right handleft hand
right handleft hand
22 52.27. 3.34 51.27
g2 52.64 6.21 51.24
25 51.31 1.77 48.54
25 51.29 1.81 49.92
Experiment 3: Free, brief perturbation
Right perturbed:,
- Left perturbed:
right hand 19 69.76 16.38 67.38
left hand 19 66.29 15.19 64.58
right hand 19 65.25 14.82 66.35
left hand 19 70.52 20.70 70.27
Experiment 4: Free, constant load
Right perturbed: right handleft hand
19 71.77 25.43 75.91
19 67.15 16.50 68.00
Left perturbed: right hand 19 65.40 18.01 74.05
left-hand 19 64.50 18.50 60.72
aNumber of data pairsbAmplitude in degrees*p < .05
**p .01
SD . t
4.81 -0.78
5.89 1.78
5.47 0.86
3.02 1.16
4.13 1.62
3.39 1.03
8.08 1.69
4.35 1.52
18.27 1.28
14.35 1.34
16.42 -0.9821.86 0.20
30.49 -2.26*
13.79 -0.86'
20.38 -4.44**
21.28 -1.98
97
91

Table 6
Means and Standard Deviations of Amplitude for
Cyclical Movements of One 'lane
b. AMPLITUDEa CONDITION N Mean SD Mean SD
Expt. 1: Left hand alone 18 50.56 2.73 50.71 2.86 -1.53
Right hand alone 17 55.05 3.70 56.77 5.6 -2.88*
Expt. 2: Left hand alone 18 51.68 2.71 52.25 2.35 -3.35*Right hand alone 17 57.96 4.71 58.80 5.70 -1.15
Expt. 3: Left hand alone 19 60.13 24.33 61.15 23.63 -0.81
Right hand alone 18 63.10 25.29 60.49 21.94 1.59
Expt. 4: Left hand alone 19 58.43 22.75 60.35 13.53 -0.60
Right hand alone 19 53.88 12.95 51.46 13.66 1.51
ain degrees
.05
However, in several of the analyses of free bimanual movements,
(unconstrained), it is clear that the amplitude differences almost reached
significance and, given .greater power, may have, done so. Of course the
foregoing analysis is quite global .in the sense that it clouds potentialamplitude adjustments that may have occurred on individual cycles before or
after perturbations. With this in mind, we compared amplitudes of individual
cycles in Experiments 3 and 4- (single and bimanual groups) on those trials in
Which at least five cycles preceded. and followed the perturbed cycle (P).
Table 7 provides a summary of those cycles reaching significance (p < .05).
Out of a peesible number of 28 significant differences within each cell, it
can be seen that the maximum number to reach significance is only eight.
Furthermore, there does not appear to be any systematic pattern among those
cycles that is statistically different from any other. Thus, if subjects were
adjusting amplitude over several cycles following the perturbation, we might
have expected a larger number of differences between those cycles immediately
preceding perturbation onset (P-1, P=L) and those,cycles.immediaterk following
the perturbation (P+1, P+2). Although there was a greater number of pre- postdifferences in amplitude overall, there was nothing' to suggest--even in the
individual amplitude- data--any progressive recalibration on the first or
second post-perturbation cycle back topre-perturbation values.
92
9
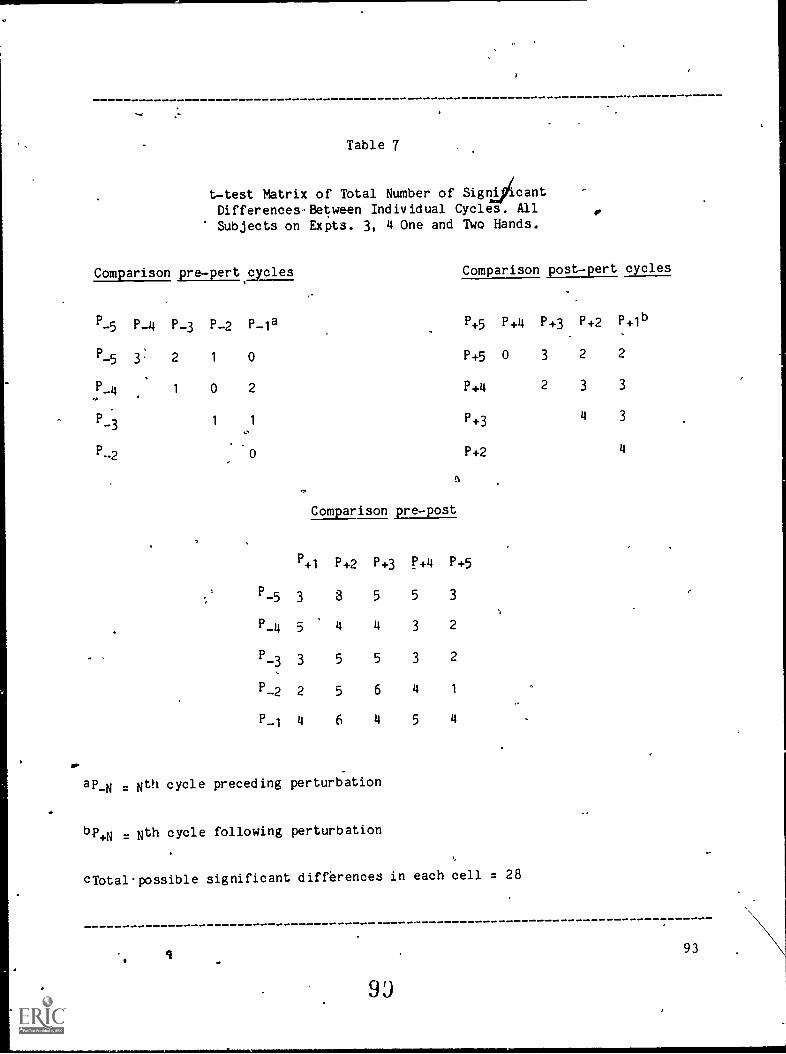
Table 7
ttest Matrix of Total Number of SigncantDifferences-Between Individual Cycles. AllSubjects on Expts. 3, 4 One and Two Hands.
Comparison pre pert cycles Comparison postpert cycles
P-5 P-4 P-3 P-2 P-1a
P-53 2 1 0
P-4 1 0 2
P-3 1 1
P+5
P+5
P+4
P +3
P+2
a
Comparison prepost
P+1 P +2 P+3 P+4 P+5
P-5 3 8 5 5 3
P-4 5 4 4 3 2
13_3 3 5 5 3 2
P-2 2 5 6 4 1
P_1 4 6 4 5 4
ap_N . Nth cycle preceding perturbation
bp+N Nth cycle following perturbation
13+4 P+3 P+2 P+lb
0 3 2 2
2 3 3
4 3
4
eibtalpossible significant differences in each cell = 28
9O

DiscusSion
The finding that frequency (period) within a finger remains constantdespite the addition of brief and constant loads strongly supports the viewthat the limbs behave in a manner qualitatively like limit cycle oscillators.The first criterion for limit cycle processes--that frequency (period). andamplitude tend to be maintained despite perturbations--receives good supportin our data. Further support for the limit cycle account is evident in thetight phase and peridd relationships between the fingers of the two hands.
Perhaps the crucial test of the' entrainment property of non-linearoscillators is the perturbation experiment;. It is clear in all four
4 experiments reported here that, quickly after the perturbation of one finger,both fingers become re-entrained within one or two cycles; there is neither aphase lag nor a difference in periodicity between the two fingers. Thisresult is reminiscent of work in animal locomotion. Thus Shik and Orlovskii(1965) temporarily prevented one of the limbs of a locomoting cat frominitiating the transfer phase of its step cycle--a procedure that necessarily 6
disrupted the phase relations among all four limbs. Within a few full cycles,however, the limbs returned to their previously established phaserelationships, as in the present experiments.
The general finding that amplitude tends to be preerved in both limbs inspite of load perturbations applied to one, provides additional support forthe limit cycle oscillator view and extends previous work on single trajectorymovements (e.g., Fel'dman, 1966a, 1966b; Kelso & Holt, 1980; Polit & Bizzi,1978) to voluntary cyclical movements (see also Fel'dman, 1980). A noteworthyfeature of the data is the kinematic differences within and between limbs whenthe system is perturbed. For example, in Figure 4, even though frequency ismaintained in the constant load condition, velocity (as reflected in slopedifferences) and amplitude differ for the two limbs. This finding draws ourattention to a fundamental point that we have made in earlier Papers; observedkinematic details are consequences of the system's dynamics (e.g., mass,stiffness, damping) and are determined by those dynamics..(cf. Fowler et al.,1980; Kelso & Holt, 1980).
B. FURTHER DEMONSTRATIONS OF ENTRAINMENT
There are two additional properties of non-linear, limit cycleoscillators that we shall consider under the heading of entrainment. The
first is that when coupled, oscillators of slightly different frequencies willtend to entrain at some intermediate frequency. As von Hdlst (1937/1973)remarked, the striking feature of coordinated movements is their "accordancein tempo." He called this frequency detuning or mutual entrainment property"the magnet effect": simply a tendency of one rhythm to impose i.' s tempo onanother. A second form of mutual interaction among oscillators occurs if thefrequency of one is an integer multiple of another to which it is coupled, a.property termed subharmonic entrainment or frequency ciemultiplication. In thefollowing experimental demonstrations, both types of oscillatory interaction,mutual and subharmonic entrainment, are clearly evident.
94 100

1. Mutual Entrainment
The basic tack on this issQe was first to determine the preferred
frequency of each limb in isolation' and then 'examine possible interactions
between" the limbs when they perform together. The procedure was similar to
that employed in the previous experiments. Each of six, right-handed subjects
(none of whom parLicipated in any of the previous Studies) completed four
trials with the left hand only, the right hand only and both'hands combined.
The twelve trisubject was i
amplitude thatimposed at an
ach lasting 10 sec, were randomized for all subjects. The
ted to move the finger(s) cyclically at a frequency and
It most comfortable. No constraints or perturbations were
the trial.
Mea amplitude and frecriency data for each trial were again obtained from
the converted digital signals. The means for all subjects are shown in Table
8% The frequency data meet the predictions of-limit cycle oscillators in that
the left hand is "attracted" to the right hand, which in turn shows only a
very small and statistically insignificant frequenc modulation. Clearly the
overall effect is modest, as one would expect in an experiment using simple
cyclical movements of the two hands. There are obvious ways to amplify the
extent to which one limb "nposes its rhythm on another by changing, for
example, limb dynamics (e.g., mass, lever arm) or by fatiguing limb or the
other. Our intent here, however, has been simply to demonstrate the mutual
entrainment effect. That the right hand does exert aneflattracting force" on
the left's in right-handed subjects illustrates another- mode of cooperation
among oscillators. This finding is also a testimony to the difficulty
subjects have in performing two different rhythms at the same ,time.
Entrainment, we suspect, represents a major limitation on what activities can
actually be performed. As von Holst (1937/1973, 1939/1973) remarked, it
appears to be an important principle of central order. Yet entrainment has
received little or no attention in theories of how skills are acquired, or how
movements are controlled.
Table 8
Means and Standard Deviations of,Preferred Frequency
and Amplitudes in One-handed and Two-handed Cases (N=6)
One hand
Left Right
FREQUENCYa Mean 1.973
SD 0.03
AMPLITUDEt Mean 62.93SD 4.31
ain Hertzbin degrees
Two hands
Left Right Combined
2.001 1.996 1.995 1.996
0.05 0.03 0.03 0.03
66.91 57.57 65,84 61.71
3.59 9.17 3.84 4.01
10195

L
2. Subharmonis Entrainment
There is at least one situation in which individuals do not experiencedifficulty in performing separate rhythms with the hands, and that is whenthey both share .a common time base. Recently Klapp (1979) has shown
"interference" between the two hands in a repetitive key pressing task whenthe periodicity of each is different, as measured by the 'subject's ability tomatch a pacing tone. When the periodicities share common timing, even though
shifted in phase, no such interference occurs. These results may be accounted
for by another property of oscillator interaction, namely, low integer
subharmonic entrainment. This form of entrainment is such an overwhelming
phenomenon in human motor activity that we simply illustrate it here (see- Figure 5). - Subjects were asked to move one finger at their preferred
frequency and to move the Ather finger at a different frequency. We show two
examples of one subject's performance, As illustrated in Figure 5, the
oscillation of the limb moving at slower frequency exactly coincides with theappropriate oscillation at the faster frequency -.-one is a simple (2:1, 3:2)0
subharmonic of the other.? The example also illustrates the interestingproperty of amplitude modulation (von.Holst's superimposition effect). Thus,
on some coinciding cycles, a "beat" phenomenon can be observed (particularly
in the 2:1 ratio) in which the amplitude of the higher frequency hand
increases on the occasion that, the lower frequency osc4lation takes place.Note also that in the lower frequency oscillation the finger is never
completely still. Although its amplitude is much smaller, it is clear that
.,'there is a small oscillation, especially in the 2:1 ratio condition. In
P 'effect, both fingers are cycling at the same frequency--only the amplitude orforce distribution to each finger varies. The foregoing result fits, nicely
with recent work by Shaffer (1980) on highly skilled pianists. Shaffer shpw0that the pianist's right hand carrying the melody plays with more "weight"
than the,left; and that gradual and sudden changes in both hands .can be made
without disrupting timing. It is tempting to suppose that Shaffer's pianistis displaying (admittedly in a more refined way) the basic superimposition
principle for combining the outputs of coupled oscillators (see also
Gallistel, 1980, and Kelso, 1981, for additional examples).
It is worth noting that the entrainment properties demonstrated above are
nct restricted to movements of the fingers but are also apparent in systemsthat share little or no anatomical similarity. In an analysis of the
interrelationships 'between speaking and m&nual activity (Kelso, Tuner, &Harris, in press), we have shown that subjects, when asked to repeat a simple
syllable (the word "sto'.k ") at a different rate from their preferred finger
rate, do so by employing low integer subharmonics. The situation is reversed
(though not necessarily symmetrically) when subjects are instructed to move
their-.hands at a rate different from their preferred speaking rate. Again,
the ratios nhosen are alwa :'s simple ones (e.g., 2:1). We interpret these
preferred relationships as emergent characteristics of a non-linear ocillator
ensemble; the collection of entrained oscillators functions in a single
unitary way. Entrainment therefore ensures a stable resolution of
Simultaneous temporal processes throughout the whole system. Moreover, the
form of entrainment is limited to a relatively restricted range of preferred
relationsnips--a feature captu-ed in liberal' and McCulloch's (1959) phrase as
an "orbital constellation."
96102

RIGHT. INDEX
FREQUENCY 5
RATIO ;3:2 e
FREQUENCY 5°'RATIO= 2:1 cr
4_
TIME (SECONDS)
Figure 5 An example of /a subject's response to instructions to move the
fingers at different frequencies. Beats in the lower frequency
hand tended to coincide with the beats of the higher frequency
hand. On soMe coinciding cycles, a "beat" phenomenon can be
observed in /which the amplitude of the higher freqt.--..cy hand
increases in/ relation to noncoincident cycles (see especially the
2:1 ratio). 1In addition, slight movement during the "quiet" phase
of the low frequency rhythm is indicative of the hignly constrained
nature of the twohand linkage.
97

C. NON=RESONANCE PROPERTIES
A characteristic of a linear oscillator, but not of the non- linear limit
cycle oscillator under is that when driven at itsfundamental frequency it will diSpl sonance--a behavior that results in anincrease in amplitude of oscillation. A final experiment examined whetheramplitude changes would be observed when the limb was driven by an externalrhythmic source at its preferred frequency, and at other frequencies higherand lower than the preferred frequency.
Four paid volunteers, none of whom had participated in the earlier, work,took part in this study. The procedures were very similar to those alreadydiscussed, with the following exceptions. Before the experiment proper, thepreferred frequency for each individual subject was obtained by ,finding themean and standard deviation of five trials (10 sec each) in which the subjectchose his/her rate and amplitude. Our prevous work indicated that this wasmore than enough time to achieve stable measures. These data were then used
as the basis for driving frequency manipulations effected via a visual
metronome. Seven frequency conditions were used (F0, the subject's preferredfrequency Fo 2 SD, Fo + 4 SD, Fo + 6 SD). For example, if a subject had ameasured prefFrredirequencyZT 1.5 Hz with a standard deviation of 0.075Hz,he/she would be asked to produce one flexion-extension cycle to each metronomebeat .under the following conditions: 1.5 Hz, 1.5 + .15 Hz., 1.5..+ .30 Hz.,
(a 1.5 + .45 Hz. Five trials were given in each of the seven conditions thatwere randomized for each subject, and movements were two-handed in all cases.
The mean amplitude and frequency are displayed in Table 9 for all seven
driving frequency conditions. These data were analyzed in a 2 x 7 x 5 (hands[left/right] x driving frequency x trials) within, subjects analysis of
variance. None of the amplitude comparisons was statistically significant,but there were definite effects on frequency in response to the drqving
stimulus conditions, F(6, 18) = 19.28, < .01. None of the subjects had any
difficulty performing the task in any of the driving conditions, as confirmedby scanning the graphical output of metronome and disNaceMent waveforms. ,Onesuch example illustrating a fixed main,enance of amplitude across the mostextreme driving conditions is shown in Figure 6.
Nevertheless it is apparent from the mean data that there are tendencies
for amplitude and frequency to be linearly related particularly at faster
driving frequencies. Paradoxically, and if we were dealing with linear
oscillators, amplitude should increase with slower driving frequencies--aprediction not borne out by the present data.
In short, the responses of the limbs to different driving frequencies
seem to display both linear and non-linear characteristics. This is not
particularly surprising for non-linear systems are capable of exhibitinglinear behavior over a range of parameter values. The distinguishing feature
of non-linear oscillators is that their behavior can be dramatically altered
in terms of phase and amplitude when driven at certain frequencies. Much more
needs to be done to determine if, and under What conditions, amplitude (and/or
phase) changes occur as "saltatory jumps" at certain frequencies; that is,
when one stable orbit is forsaken for another.8
98 :I .

Table 9
Means and Standard-Deviations of Frequency and Amplitudeof Two Hands When Driven b1 Light Pulses at
Different Frequencies (Nr.6)
,t1 FOc F0+2 SD FO-2 SD F0+4 SD FO-4 SD F0+6 SD FO-6 SD
FREQUENCYe Mean 1.82 1.92 1.74 2.11 1.61' 2.34 1.53
Left
SD 0.02 0.02 0.03 0.02 0.03 0.03 0.06
Mean 1.82 1.92 1.74 2.11 1.61 2.33- 1.55
.
Right
SD. 0.03 0.02 0,04 0.03 0.04 0,03 0.04
AMPLITUDEb -Mean 44.69 48.40 47.06 40.29 40.85 37.28 44.17
Left
SD A'S...65 5.03 3.64 1.75 3.35 2.54 4.43
Mean 52.38 49.98 50.84 45.55 46.25 40.10 49.71
Right
SD 3.01 5.86 3.18 2.41 3.04 1,66 4.44A
ain Hertz
bin degrees
breflects mean preferred frequency
105
99

4.:
OP
,- 4
)
FooscH..812cps# i_
S
METRONOME
IUGHT INDEX16
:FLEXION
EXTENSION,LEFT :INDEX
r
0 1 2 3
T !ME' (SECONDS)
4 5
,,,
Figure 6-. Tracings indicate a constant amplitude in the two hands when drivenat different frequencies by a visual metronome Ca pulsing LED).The onset of a light pulse inmost cases was synchronized with. thepoint of maximum extension or flexion. Slight deviation's of thefinger oscillations from the metronome period can be observed in
some cycles.100.
1U6,
.
1,
7
..
A .
The point that should not be lost here is that oscillatory systems can
behave in a linear manner yet still be .non-linear in nature. Consider the
intuitive example of dolphin locomotion. At low speeds,,dolphins cruise withlittle;energy.cost because of their strealit-liped grape; water flow over their
body surface is laminar. AVhigher swimming speeds, however, the creation of
turbulence can increase energy costs by an order of magnitude (see Brookhart &
Stein, ,71980). As the relationship between velocity and energy costs beComes
non-linear, the dolphin divorbes the swimming mode for its novel and more
economical "running",mode. In shdrt, scale changes reveal tile non-linearities
inthe system and are capable cf effecting qualitative changes in behavior. A
major enterprise then fora science of movement becomes one of identifyiAg the
necessary conditions under which such bifurcations or.phase transitions occur
(for clues, see/Yates, in press; Yates et al., 1972)..
GENERAL DISCUSSION
In- previous papers apd in the introduction 'to, .this one, we have
considered ways in which the motor system might solve the degrees of freedom
problem, first identified by Bernstein (1967). &r approach is double-edged:
first, we have sought to identify and analyze rigorously functional groupings
of muscles--synergies or coordinative' structures--constrained -to act in a
unitary way; and second, we have attempted 'to establish the 'language of
dynamics as the appropriate vocabulary upon which to rationalize the
properties of coordinative structures. More specifically, we have provided
theoretical grounds suggesting that a group of muscles' organized as \ single
functional unit possesz,0 behavioral properties qualitatively simit,to a'
non-linear' oscillator. -That constrained collectives of muscles exhibit a
likeness to oscillatory mechanisms was., intuited many years ago by Bernstein=
(1947) (see. Greene, 1978) and advanced on empirical grounds by Fel'dman's
mecnanographib analysis of arm movements (Asatryan & Fel'dmzn, 1965; Fel'dman,.
1966a, 1966b), More recent data (see Section 4) have borne out Fel'dm
work, in detail, and led to an elaboration of the potential advantages tha
such a view offers 'in terms of economy of neural control (cf. Greene. 1978;
Kelso & Holt, 1980).
The present research is continuous with the above cited work, which
suggests that muscles acting at a joint--to a first approximationexhibit
behavior qualitatively similar to a mass-spring system. But it also
recognizes the° universal fact that biological devices must necessarily
incorporate non-linear features, if local thermodynamic losses are to be
compensated for and behavior sustained. She mathematical description for
persistent cyclical operation is known as the limit cycle, and the present
experiments have shown that patterns of coordination between, the limbs (and
within a single limb) can be accurately predicted from limit cycle properties.
To summarize briefly, we have shown atlear-cut tendency for cycling limbs to
maintain fixed eaMplitude and frequency, under a Variety of experimental
conditions (brief and constantly-applied load perturbations, the presence and
absence of fixed mechanical constraints, different external driving
frequencies). In addition, the tight phasic apd timing relationships observed
before and after imposed perturbations, as well as the demonstration that
limbs cycling at different frequencies 'reveal non - arbitrary subharmonic
relationships, attests strongly to the entrainment property of non-linear,
limit cycle oscillators.
107
.101
-Z

Though motivated by Aukte different concerns, the present experimentalresults fit rather well with Fel'dman's most recent work (cf. Fel'dman, 1980),in which subjects performed rhythmic movements of the right elbow joint atdifferent frequencies. and under irarious loading conditions. Like us, Fel'dmanfound that after unloading, rhythmic movement was preserved without visiblechange of either phase or frequency (see Fel'dman, 1980, Figure 5). According.
to Feldman, this result indicates that the "central generator" is independentof afferent influences created by the unloading. The latter conclusion iscompatible with new data on phasic movements of the ankle joint (cf.. Gottlieb&,--AgarWal, in press). When torques were applied .at various points duringmovement initiati'n and execution, both early, myotatic (40-100 msec) and
later, post-myotatc (100-300 msec) reflex rernonses to load changes weresuppressed. Such was the case regardless of whether the phasic Movements wereof a slow, ramp nature or a fast, ballistic nature. Gottlieb and Agarwal (in.
press") suggest that there is substantial "preprogramming" of both types ofmovements and that phasic movements in general are not assisted by effectivelopd-compensating reflex mechanisms.
While the ndurophysiological findings of Fel'dman and Gottlieb and
Agarwal provide encouraging support for the present work, their focus is onthe details of the neuromuscular response to externally imposed loads on asingle joint. In contrast, the present experiments used load perturbations(among other manipulations) as a tool to discover patterns of coupling betweenthe limbs. predictable from the properties of non-linear oscillators (see also
Yamanishi, Kawato, & Suzuki, 1979, 1980,.who use discrete vi sal, verbal, or
manual events to perturb cyclic finger tapping). Of the latter, we haveargued that the property of. entrainment may be most significant for a viabletheory of coordination.9
As an example, entrainment (often under a different name, see Section 6),
may well account for the 'stable phase and timing relationships that
characterize the various gaits of animal locomotion (for an excellentsee Gallistel, 1980). It now appears that. interneurons--at least in the
central nervous' systems of crayfish and cocteroach--carry Coupling or
entraining signals that enable one limb to coordinate with another
(cf. Delcomyn, 1980; Stein, 1976). The role of such "coordinating neurons" is
currently being explored within a conceptual framework provided by themathematical theory of coupled oscillators (Stein, 976, 1977).
While we are sympathetic to the foregoing enterprise, we are also
reminded of Davis' (1976) warning that properties of command, oscillation,coordination, and so on are not invested in any specific neuron. Coordination
and oscillation are functions that reflect the interaction of cells, and aremost correctly thought of as emergent properties. Davis (1.976) provides
several examples in which a particular function arises from a npuronalnetworkeven though no single neuron within the network possesses that function.
The theme that functions like coordination are emergent, a posteriori
consequences of systematic interactions among cells (or muscles), as opposedto a priori prescriptions invested in a single cell (or program), is consonantwith the dynamical perspective offered here (see' also Fentress, 1976, for a
similar "relational dynamics" perspective). For the physical theory of livingsystems (homeokinetics), entrainment is the chief mode of cooperati'n among'
102
1U'

4
self-sustaining oscillators; it is an emergent, self-organizing process in the
sense that a collection of mutually entrained oscillators functions as a
single unit. Therein lies its appeal, of course, for a principled solution to
the degrees of freedom problem.
A further, and by now self-evident consequence of the homeokinetic view
concerns the role of oscillation. It has long been recognized that cyclicity
lies at the heart of biological functioning (of. Goodwin, 1970, p. 8). Yet in
the domain of movement, it has been commonplace (with certain notable
exceptions) to consider fluctuating events as mere nuisances--as unwantedsources of variability. It has been easier to model control in terms of
quasilinear servosystems than to search for ways in which oscillation may be
exploited. In closed-loop servomechanisms, oscillation is undesirable because
it means that there is a discrepancy between the input and'the reference level
or set point, and hence the system is unstable. However', a more important
role for oscillatory processes is indon-linear systems that do not possess
reference levels but that attain stability by virtue of entrainment.
The present studies and our preliminary work on the interaction of speech
and gesture (Kelso, Tuner, & Harris, in press) are motivated by the latter
theme. Relatedly, the approach to understanding motor control pursued in
these experiments follows precisely the line of research proposed recently by
Delcomyn (1980) following an extensive review of the neural basis for rhythmic
behaviof' i0 lower 'phyla. Delcomyn (1980) identifies three problem areas.
answers to which "...will bring neuroscientists <much 'closer to the ultimate'
goal of understanding how nervous systems function" (p. 497). These are:
u(i) the nature of an.oscillator, (ii) the interaction of oscillators, (iii)
the wpy in which sensory inputs interact with oscillators and their output to
shape the final motor output" (p. 497). The arguments proposed herein suggest
that principled solutions to the foregoing problems may lie in physical
biology; particularly in Homeokinetics and Dissipative Structure theory (see
Kugler et al., 1982; Prigogine, Note 4; Yates, in press, for comparisons and
contrasts).
In our, concluding remarks, we wish to make explic\t one further contrast
(that may already be apparent) between the present view and current concepts
in the motor behavior area. As we noted at the beginning of this article, the
conventional view attributes the regularities we observe in movement; to an
explicit, a priori prescription. But in an oscillator ensemble, there are no
fixed dominance relationships in the sense that a program or reference level
stands in a fixed, autocratic relation to the muscles responsible for
implementation. There are different modes of interaction (e.g., frequency and
amplitude modulation) and t
1
ere may be "preferred" phase relationships under
conditions of maximum coupl ng. A wide variety of behavioral patterns emerge
from these interactions; there is structure and presumably a complex network
of neuronal interconnections to suppoit such cooperative phenomena, but
strictly speaking, there is no dominance relation. If this view is corn .:t,
coordination is not prescribed by anything; it is more proparly viewed as an
emergent consequence of the dynamical behavior of a system whose design is
fundamentally periodic.
103

REFERENCE NOTES
1. Kelso, J. A. S., Putnam, C. A., & Goodman, D. Human interlimb
coordination. 1. A kinematic analysis. Manuscript in preparation, 1982.2. Goodman, D., & Kelso, J. A. S. Human interlimb coordination.
2. Temporal effects on initiation. Manuscript in preparation, 1982.
3. Goodman, D., Rubin, P., & Kelso, J. A. S. A generalized system for thecapture and analysis of movement data. Invited paper presented at theworkshop on The Use of Minicomputers in Motor Behavior Research, NorthAmerican Society for the Psychology of Sport and Physical Activity,
Boulder, Colorado, 1980.4. Prigogine, I. Multiple time perspectives in dissipatiVeStructures.
Paper presented at the annual meeting of the American Psychological
Association, Montreal, September, 1980.
5. Kelso, J. A. S. On the oscillatory basis of movement. Paper presented at
Psychonomic Society, Philadelphia, November, 1981. Also in Bulletin ofthe Psychonomic Society, 1981, 18, 63.
6. Schmidt, R. A. Personal communication, December, 1980.
REFERENCES
Adams, J. A. A closed-loop theory of motor learning. Journal of Motor
Behavior, 1971, 3, 111-;50.
Adams, J. A. Feedback .theory of how joint receptors regulate the timing and
positioning of a limb. Psychological Review, 1977, 84, 504-523.
Andronov, A., & Chaiken, C. E. Theory of oscillations. Princeton, N.J.:
Princeton University Press, 1949.Asatryan, D. G., .8c Fel'dman, A. G. Functional tuning of the nervous system
with control of movement or maintenance of a steady posture 7 I.
Mechanographic analysis on the work of the joint on execution .of a
postural task. Biophysics, 1965, 10, 925-935.
Aschoff, J. Circadian rhythms: General features and endocrinological
aspects. In D. Krieger (Ed.), Endocrine rhythms. New York: Raven
Press, 1979.Bellman, R. E. Adaptive control processes: A guided tour. Princeton, N.J.:
Princeton University Press, 1961.Berlinski, D. On systems. Boston:' MIT Press, 1976.
Bernstein, N. A. On the construction of movements. Moscow: Medgiz, 1947..
(Nionigraph: In Russian)Bernstein, N. A. The coordination and regulation of movements. London:
Pergamon Press, 1967.Brazelton, T. B., Loslowski, B., & Main, M. The origin. of reciprocity:. The
early mother-infant interaction. In M. Lewis & L. Rosenblum (Eds.), The
effect of the infant on its caregiver. New York: John Wiley, 1974.
Brookhart, J. M., & Stein, P. S. G. Locomotion. Quincy, Mass.: Grass
Instrument Company, 1980.
Cohen, L. Interaction between limbs during bimanual voluntary activity.
Brain, 1970, 93, A9-272.Cooke, T. D. The organization of simple, skilled movements. In
G. E. Stelmach & J. Requin (Eds.) , Tutorials in motor behavior.
Amsterdam: North Holland, 1980.
104 110

Davis, G. Organizational concepts in the central motor networks of
invertebrates. In R. M. Herman, S. Grillner, P. S. G. Stein, &
D. G. Stuart (Eds.), Neural control of locomotion. New York: Plenum,
1976.Delcomyn, F. Neural basis of rhythmic behavior in animals. Science, 1980,
210, 492-498.Feldman. A. G. Fnctional tuning of the nervous system with control of
movement or maintenance of a steady posture. II. Controllable
parameters of the muscles. Biophysics, 1966, 11, 565-578. (a)
Feldman, A. G. Functional tuning of the nervous system with control ofmovement or maintenance of a steady posture. III. Mechanographic
analysis of execution by man of the simplest motor tasks. Biophysics,
1966, 11, 766-775. (b)
Fel'dman, A. G. Superposition of motor programs--II. Rapid forearm flexion
in man. Neuroscience, 1980, 5, 91-95.Fentress, J. C. Dynamic boundaries of patterned behavior: Interaction and
self-organization. In P. P. G. Bateson & R. A. Hinde (Eds.) , Growing
points in ethology. Cambridge: Cambridge University Press, 1976.
Fowler, C. Timing control in speech production. Bloomington, Ind.: Indiana
University Linguistics Club, 1977.
Fowler, C. A., Rubin, P., Remez, R. E., & .Turvey, M. T. Implications for
speech production of a general theory of action. In B. Butterworth
(Ed.), Language production. New York: Academic Press, 1980.
Gallistel, C. R. The organization of action: A new synthesis. New York:
Erlbaun, 1980.Goodwin, B. Biological sta")ility. In C. H. Waddington (Ed.), Towards a
theoretical biology. Chicago: Aldine, 1970.
Gottlieb, G. L., & Agarwal, G. C. Response to sudden torques aboUt the ankle
in man: 1II. Suppression of stretch-evoked responses during phasic
contraction. Journal of Neurophysiology, in press.
Graham, D. A model for the control of coordinated leg movements in free
walking insects. Biological Cybernetics, 1977, 26, 187-198.
Greene, P. H. Problems of organization of motor systems. In R. Rosen &
F. Snell (Eds.), Progress in theoretical biology (Vol. 2). New York:
Academic Press, 1972.
Greene, P. H. Technical Report (78-12). Illinois Institute of Technology:
Department of Computer Science, 1978.Hanson, F. E. Comparative studies of firefly pacemakers. Federation
Proceedings, 1978, 37, 2158-2164.
Hollerbach, J. J. An oscillation theory of handwriting. Cambridge, Mass.:
MIT Artificial Intelligence Laboratory, 1980.
Hoist, E. von. On the nature of order in the central nervous system (1937).
In The behavioral physiology of animals and man: The collected papers of
Erich von Holst. Coral Gables: University of Miami Press, 1973. -
Holst, E. von. Relative coordination as a phenomenon and as a method of
analysis of central nervous functions (1939). In The behavioral
physiology of animals and man: The collected papers of Erich von Hoist.
Coral Gables: University of Miki Press, 1973.
Holst, E. von. The behavioral physiology of animals and man. Coral Gables:
University of Miami Press, 1973.
Iberall, A. Periodic phenomena in organisms seen as non-linear systems,.
Theoria to theory, 1970, 4, 40-53
105
111

Iberall, A. S. A field and ..i.rcuit thermodynamics for integrative physiology:
I. Introduction c to general notions. American Journal of
Physiology/Regulatory, Integrative, & Comparative Physiology, 1977 2,
R171-R180.Iberall, A3 S. A field and circuit thermodynamics for integrativ' physiology:
III. Keeping the books - a general experimental method. American
J1/4,urnal of Physiology/Regulatory-,--Integrative, & Comparative Physiology,
1978, 3, R85-R97.Iberall, A. S., & McCulloch, W. S. The organizing principle of complex living
systems. Transactions of the American Society of Mechanical Engineers,June, 1969, 290-294.
A. S., Soodak, H., & Hassler, F. A field'and circuit thermodynamics
for integrative physiology: II. Power and communicational spectroscopy
in biology. American Journal of physiolayffiet. Integrative, &
Comparative Physiology, 1978, 3, R3-R19.
Katchalsky, A., & Curran, P. F. Nonequilibrium thermodynamics. Cambridge,
Mass.: Harvard University Press, 1967.
Keele, S. W. A behavioral analysis of motor control. In V.^Brooks (Ed.),
Handbook of physiology: Motor control. Washington D.C.: American
Psychological Society, 1981.
Kelso, J. A. S. Motor control mechanisms underlying -human- -mov_ement_
reproduction. Journal of Experimental Psychology, 1977, 3, 529-543.
Kelso, J. A. S. Contrasting perspectives in order and regulation in movement.
In J. Long & A. Baddeley (Eds.), Attention and performance IX.
Hillsdale, N.J.: Erlbaum, 1981.Kelso, J. A. S., & Holt, K. G. Exploring a vibratory systems analysis of
human movement production. Journal of Neurophysiology, 1980, 43, 1183-
1196.Kelso, J. A. S., Holt, K. G., & Flatt, A. E. The role of proprioception in
the perception and control of human movement: Toward a theoretical
reassessment. Perception & Psychophysics, 1980, 28, 45-52.
Kelso, J. A. S., Holt, K. G., Kugler, P. N., & Turvey, M. T. On the concept
of coordinative structures, in dissipative structures: II. Empirical
lines of convergence. In G. E. Stelmach (Ed.), Tutorials in motor
behavior. New York: North-Holland Publishing Co., 1980.
Kelso, J. A. S., Southard, D. L., & Goodm'an, D. On the nature of human
interlimb coordination. Science, 1979, 203, 1029-1031. (a)
Kelso, J. A. S., Southard, D. L., & Goodman, D. On the coordination of two-
handed movements. Journal of Experimental Psychology: Human Perception
and Performance, 1979, 5, 229-238. (b)
Kelso, J. A. S., Tuller, B. H., & Harris, K. S, A 'dynamic pattern'
perspective on the control and coordination of movement. In
P. MacNeilage (Ed.), Motor control of speech- production. New York:
Springer-Verlag, in press.
Klapp, S. T. Doing two things at once: The role of temporal compatibility.
Memory & Cognition, 1979, 7, 375-381.
Klima, E. S., & Bellugi, U. The signs of language. Cambridge, Mass.:
Harvard University Press, 1979.
Kugler, P. N. K., Kel.so, J. A. S., & Turvey, M. T. On the concept of
coordinative structures as dissipative structures: I. Theoretical lines
of convergence. In G. E. Stelmach & J. Requin (Eds.), Tutorials in motor
behavior. New York: North-Holland Publishing Co., 1980, 1-47.
106
112
Kugler, P. N., Kelso, J. A. S., & Turvey, M. T. On coordination and control
in naturally developing systems. In J. A. Scott Kelso J. C. Clark
(Eds.), The development of movement control and coordination. New York,
London: John Wiley, 1982.Laabs, G. J. Retention characteristics df different cues in motor shortterm
memory. Journal of Experimental Psychology, 1973, 100. 168-177.
Marteniuk, R. G., & MacKenzie, C. L. A preliminary theory of twohanded
coordinated control. In G. E. Stelmach & J. Requin (Eds.), Tutorials in
motor behavior. Amsterdam: North Holland, 1980.
Menaker, M. Physiological and biochemical aspects of circadian rhythms.
Federation Proceedings, 1976, 35, 2325.
Minorsky, N. Nonlinear oscillations. Princeton, N.J.: Van Nostrand, 1962.
Morowitz, H. J. Energy flow in biology: Biological organization as a problem
in thermal physics. New York: Academia Press, 1968.
Morowitz, H. J. Energy flow in biology. Woodbridge, Conn.: Oxbow PreSs,
1979.Oatley, K., & Goodwin, B. W. The explanation and investigation of biological
rhythms. In W. P. Colquhoun (Ed.), Biological rhythms and human
performance. New York: Academic Press, 1971.
Pattee, H. H. Dynamic and linguistic modes of ditiffipler systems. International
Journal of General Syste-Ms,
Pavlidis, T. Biological oscillators: Their mathematical analysis. New York:
Academic Press, 1973.Pew, R. W. Human perceptual motorperformance. In B. H. Kantowitz (Ed.),
Human information processing: Tutorials in performance and cognition.
New York: Lawrence Erlbaum Associates, 1974.
Polit, A., & Bizzi, E. Processes controlling arm movements in monkeys.
Science, 1978, 201, 1235-1237.Prigogine, I. Order through fluctuation: Selforganization and social
systems. In E. Jantsch & C. H. Waddington (Eds.), Evolution and
consciousness: Human systems in transition. Reading, Mass.: Addison
Wesley, 1976.Prigogine, I., & Nicolis, G. Biological order, structure and instabilities.
Quarterly Reviews of Biophysics, 1971, 4, 107-148.
Saunders, P. T. An introduction to catastrophe theory. Cambridge: Cambridge
University Press, 1980.
Schepelmann, F. Rhythmic patterns of motor activity after lesions of the
central nervous system in man. Acta Neurochirurgica, 1979, 69, 153-189.
Schmidt, R. A. A schema theory of discrete motor skill learning.
Psychological Review, 1975, 82, 225-260.
Schmidt, R. A. On the theoretical status of time in motor program
representations. In G. E. Stelmach & J. Requin (Eds.), Tutorials in
motor behavior. Amsterdam: North Holland, 1980.
Schroedinger, .E. What is life? London and New York: Cambridge University
Press, 1945.Searle, J. R. Minds, brains and programs. The Behavioral and Brain Sciectee,
1980, 3, 417-457.
Shaffer, L. H. Analyzing piano performance: A study of concert pianists. In
G. E. Stelmach & J. Requin (Eds.), Tutorials in motor behavior.
Amsterdam: North Holland, 1980.
Shapiro, D. C., & Schmidt, R. A. Schema theory: Recent evidence and
developmental implications. In J. A. S. Kelso & J. E. Clark (Eds.), The
development of movement control and coordination. London: John Wiley,
1982.101
1.13

Shik, M. L., & Orlovskii, G. N. Coordination of the limbs during running ofthe dog. Biophysics, 1965, 10, 1148-1159.
Sollberger, A. Biological rhythm research. Amsterdam: Elsevier, 1965.
Soodak, H., & Iberall, A. S. Homeokinetics: A physical science for complexsystems. Science, 1978, 201, 579-582.
Stein, P. S. G. Mechanisms` of interlimb phase control. In R. M. Herman,
S. Grillher, P. S. G. Stein, & D. G. Stuart (Eds.), Neural control oflocomotion. , New York: Plenum, 1976.
Stein, P. S. G. Application of the mathematics of coupled oscillator systemsto the analysis of the neural control of locomotion. FederationProceedings, 1977, 36, 2056-2059.
Stelmach, G. E. Retention of motor skills. Exercise and sports sciences
reviews (Vol. 2). New York: Academic Press, 1974.Thom, R. In D. H. Fowler' (Trans.), Structur-1 stability and morphogenesis.
Reading, Mass.: Benjamin, Inc., 1975.Turveyr M. T. Preliminaries to a theory of action with reference to vision.
In R. Shaw & J. Bransford (Eds.), Perceiving, acting and knowing: Toward
an ecological psychology. Hillsdale, N.J.: Erlbaum, 1977,
Turvey; M. T. Clues from the organization of motor systems. In U. Bellugi &
M..Studdert-Kennedy (Eds.), Signed and spoken language: Biological
__constraints on linguistic form. Basel: Verlag Chemie, 1980.
Shaw R. E., & Mace, W. Issues in the theory of action:
Degrees of freedom, coordinative structures and coaritions. In J Requin
(Ed.), Attention and performance VII. Hillsdale, N.J.: Lawrence
Erlbaum, 1978.Wiener, N. Perspectives in cybernetics. In N. Wiener & J. P. Schade (Eds.),
Cybernetics of the nervous system. Amsterdam: Elsevier, 1965.
Yamanishi, J., Kawato, M., & Suzuki, R. Studies on human finger tapping
neural networks by phase transition curves. Biological Cybernetics,
1979, 33, 199-208.Yamanishi, J., Kawato, M., & Suzuki, R. Two coupled oscillators as a model
for coordinated finger tapping of both hands. Biological Cybernetics,
1980, 37, 219-225.
Yates, F. E. Physical biology: A basis for modeling living systems. Journal
of Cybernetics and Information Science, in press.
Yates, F. C. Physical causality and brain theories. American Journal of
Physiolay, 1980, 238, R277-R290.Yates, F. E. & Iberall, A. S. Temporal and hierarchical. organization_ in
biosys'ems. In J. Urquart & F. E. Yates (Eds.) , Temporal aspects of
therapeutics. New York: Plenum, 1973, 17-34.
Yates, F. E., Marsh, D. J., & Iberall, A. S. Integration of the whole
organism: A foundation for a theoretical biology. In J. A. Behnke
(Ed.), Challenging biological problems: Directions towards their
solution. New York: Oxford University Press, 1972, 110-132.
108

FOOTNOTES
1A11 current theories of regulation and control--mathematical systems
theory, automata theory, cybernetics--though different in detail are alike in
likening man to a machine; it is to this issue that we address limitations.
2Examples of biological escapements can be found in numerous metabolic
processes such as the Krebs cycle where release of ATP is triggered by the
metabolic demands of the cell.
3Strictly speaking, regulators and servomechanisms are different conceptseven though it is common in the motor control area to hear them used
synonymously. In the fOrmer, the reference value remains constant; in the
latter, the reference value varies continually.
4Synchronization and entrainment area often used synonymously in the
literature. Strictly speaking, synchronization is that state that occurs when
both interval and phase of coupled oscillators are matched exactly;
entrainment refers to the matching of intervals, but one oscillator may lead
or lag the other.
5interestingly, in American Sign Language (Klima & Bellugi, 1979) the
amstraintsobserved in -the--Xelsa_et al. experiments are omnipresent.
According to Klima and Bellugi (1979): "If both hands move indeP6ffdently
during a sign's articulation, then the two hands must exhibit identical hand
configurations; the points of articulation are severely constrained with
respect to one another (they must be in the same location or on the same
horizontal or vertical plane); and the movements of the two hands must be the
same (whether performed simultaneously or in alternation) . The symmetry
constraint thus specifies that in a two-handed sign, if both hands move and
are active, they must perform roughly the same motor acts" (p. 64).
60n very few occasions, due to malfunctions in analog-to-digital
conversion, a subject's data could not be registered for future analysis. As
the Tables indicate however, we still had a sizable number of observations on
which to base statistical comparisons.
7Two things should be emphasized in this section. The first is that
we offer here is a demonstration of a phenomenon that is coherent with the
theoretical picture. A more formal analysis of sub-harmonic entrainment is
being undertaken -nd some preliminary results have been presented (Kelso, Note
5). Second, as pointed out by R. A. Schmidt (Note 6) the pattern classified
as 3:2 in Figure 5 is not 3:2 in the musical sense. In fact the. "3" part, is
really a blank-move-move, which is the same as the "2" part. Again, this
analysis attests to the difficulty subjects have in performing independent
rhythms with the hands.
81n fact, more recent work (reported in Kelso,,Nbte 5) indicates that if
the two limbi operating out-of-phase (flexion in one and extension in the
other) are driven at a certain critical frequency, they will change phase
abruptly (in less than a cycle period) to an "in-phase" pattern. The 180
degree transition in phase brought about by a scalar increase in driving
frequency is perhaps .the principal feature of one of the simplest non-linear
109
1.15

systems modelled by the Duffing equation. Thus, through a continuous changein one variable (e.g., frequency), a discontinuous change in another (e.g.,phase) can be observed. That is, an elementary cusp catastrophe or
bifurcation ,occurs (Saunders, 1980; Thom, 1975). Importantly, there is no a
priori prescription for the changed mode of organization anywhere.
9 Norbert Wiener (1965), in a lecture prepared posthumously, discussesthe benefits of entrainment as a non-linear, self - organizing phenomenon inbiology and engineering. There are indications in this paper that Wiener wasseeking solutions to nervous system organization in the dynamics of non-linearoscillators--with Atrainment as a major feature. This view, "as we have
argued here, is rather different from the closed-loop, cybernetic theory thatWiener popularized.
110
116

MOTOR CONTROL: WHICH THEMES DO WE ORCHESTRATE?'
J. A. S. Kelso+ and E. L. Saltzman
When we are confronted with a living system, whose design is mysterious'and whose optimizations are obscure, it-is no easy task--as Professor Steinreminds us--to arrive at an answer tothe question he has posed in this paper.Stein's target article is an important contribution for two main reasons. The
first, which we shall mention only in passing, is that it is likely to providemuch debate on what the controlled variables might be; moreover, it will force
those who find this a burning issue to put their cards on the table. The
second, and we feel more important reason, is that tne paper poses a
questiOn--"What muscle variable(s) does the nervous system control...?"--whose
very' nature raises questions about the strategies neuroscience uses to
investigate problems of control and coordination of movement. In our commen
tary we will focus on some of the (not so) implicit assumptions behind the
question posed by Stein; if nothing else we hope to heighten sensitivity to
some of the issues involved and (perhaps) to force the neuroscientist to
consider his/her epistemology.
There are a couple of questionaole assumptions in Stein's approach--at
least as reflected in this article.. The first is that control is the province
of the nervous system; the second is that it is muscle variable(s) that are
controlled. We shall examine each assumption in turn and their consequent
ramifications for elucidating principles of coordination and control. In
addition, we shall point to one notable omission in the author's list of
candidates for control, and in our final remarks take up Stein's invitation to
advance, albeit briefly, an alternative position. to the control theoretic
stance that he advocates here. Although it may, for the author, seem
,..natural to assess performance...in similan terms to those applied to
motors or other devices which produce movement,'.! we assert that there are
certain fundamental differences between living systems and machines (apart
from structure) that render such a strategy not unly dubious but highly'
unnatural. Most socalled "machine theories" regard biological control as a
technical or engineering problem in which the many degries of freedom to 4e
regulated are a "curse" (Bellman, 1961). In contrast, there are contemporary
'physical\theories yet to be explored.fully in the domain of mov.ement that
An invited comnientary on R. B. Stein "What muscle variable(s) does the
nervous system control?" The Behavioral and Brain Sciences, in press.
° +Also Departments ofNPychology and Biobehavioral Sciences, University of
'Connecticut, Storrs. 'NN
Acknowledgment. Preparatiorkof this paper and some of the research discussed
herein were supported by NINGDS Grant NS-13617, BRS Grant RR -05596 and a PHS
PostDoctoral fellowshipHD0567 to Elliot L. Saltzman.
(HASKINS LABORATORIES: Status Report'op Speech Research'SR-69 (1982)]

consider many degrees of freedom and non-linearities to be a requisite (not asource of "complication") for the emergence of coherent phenomena. The
physical strategies being uncovered (principally in the form of Iberall-andcolleagues' Homeokinetic Theory, Prignine and colleagues' Dissipative Struc-ture Theory, Haken's Synergetics and Morowitz's Bioenergetics; see the finalpart of this commentary foe references, and Kugler, Kelso, and Turvey, 1982,for contrasts among these theories and their application to control' andcoordination) stress autonomy, self-organization and evolution of function assystem attributes -- attributes, that already appeal to some neuroscientists(cf. Katchalsky, Rowland, & Blumenthal, 1974; Llinas & IberalI,, 1977; Szenta-gothai, 1978). Though' we can classify ourselves as, at best, informed
amateurs in this area, we believe these system attributes will prove difficultfor the student of movement to ignore. A consideration cf the assumptionsbehind the question posed by Stein may allow us to ground this claim morefirmly.
Control as the Province of. the Nervous System
It was surely one of Bernstein's (1967) most significant contributions(and he made many that have still to be appreciates) that control and'coordination are not reducible to the orchestration of neural signals to andfrom the motor apparatus. Stein appears to recognize this fact in several
places (e.g., in his discussions of stiffness, and his awareness of thepoAsibility that energy fluxes may shape control), but the paper as a wholeshows little appreciation of it. In fact, the predominant methodology in thestudies cited by the author dictates that the organism and its parts arequiescent until mechanically or electrically stimulated. Obviously, we do not
wish to be interpreted as saying that such a methodology has not proved useful
in many cases or that the effects observed are not real. But control involves
more than reactivity, and its analysis goes far beyond the deterministicinput-output approach espoused in Stein's paper. One wonders to what extent
the results of the studies, cited by. Stein, many of which involve singlemuscles, in non-intact preparations, can be generalized to normal movements in
organisms continually interacting with their environments. There are a number
of grounds for expressing skepticism on this issue (cf. bernstein, 1967). To
be blunt, an unequivocal. relation between neural impulses to muscles andresulting movement does not, and cannot exist (see Benati, Gaglio, Morasso,Tagliasco, & Zaccaria, 1980; Boylls, 1975; Kelso & Holt, 1980; Saltzman, 1979;
Turvey, Shaw, & Mace, 1978, for anatomical, mechanical, and physiological
sources of functional non-univocality or indeterminacy).
Consider, for example, the task of maintaining the elbow at a steady
state angle of 180 degrees (i.e., the elbow in full extension). The
orientation of the arm in the gravity field determines not only the relative
contributions of muscle and gravity torques at the;desired elbow angle, but
also the stability properties of this equilibriud configuration. When the arm
is in a downward, vertical orientation, the elbbw angle is stable; if the elbow
is perturbed (flexed), it will return to equilibrium due to the stab]
restoring torque of gravity. No muscle activity is required in this caste
If, however, the arm is in an upward vertical orientation, the elbow angle is
unstable since gravity plays a destabilizing role in this configuration. If
the equilibrium angle is to be restored, muscle activity is required to
proviJe the stabilizing restorative torque. Thus, the relative contributions
112
118

of gravity and muscle stiffnesses for a stable equilibrium angle vary with the
arm's orientation in ,the gravity' field. In short, the nervous system
"controls" only to the extent that it complements the force field of the
environment. Its role is better envisaged as. exploitative rather than
injunctive.
On the Selection of Analytic Units
In the target article, Stein has attempted to pinpoint the variables.usedby the nervous system to control muscular activity during the performance of
sensorimotor tasks. Such tasks might involve a limb that moved, remained
stationary, or exerted forces and torques at the limbenvironments interface.It is important to recognize, however, that such controlled VariabLes aredefined only in the context.of the or6nizational structure(s) comprising the
systemtobecontrolled. These organizational structures are defined functionalLy at a higher level of .description than that of single muscles or
joints. Specifically, they are defined at the relatively abstract task level
and, as mentimed in the section above, span the dynamic system composed of
both organism and environment. In solving the problem posed by a task, the
nervous_system is the indispensable medium through which the'requisite limb
organization can emerge. The limbs (or any set of articulators) thus becomedifferent types of functionally defined, special purpose devi.ce§ for different
types of tasks.
Although the immediately preceding statements may seem trivial at first
glance, they reveal a perspective that has decidedly non trivial implications
fo' how we approach the problem of controlled variables. More specifically,
this perspective leads us to place significant constraints on our selection of
analytic units of behavior. Professor Stein, for example, limits his analysis
to "...simple physical variables appropriate to single muscles or groups of
muscles acting normally'lround a joint." Few scientists would disagree that
some decomposition of the system is.necessary for analytic purposes. However,
the unit of analysisshould not be casually or arbitrarily chosen, at least if
the ultimate goal is to understand control in animals (not simply in a single
joint). Our pointcan be made through an example, from physics (cf. Rosen,
1973).
It is well known that the threeAbody problem defies an analytic solution
in closed form: Whether the earthsunmoon system is truly stable is an open
question. Although it is possible to decompose the system into onebody and
two body' subsystems that are completely tractable analytically, such a strate
gy does not faeilitate obtaining a solution to the threebody problem. The
reason is that the physical decompopition itself destroys the original
dynamics. In order to solve the threebody problem, a new set of analytic
units must be discovered that are defined by new observables, such that the
partitioning of the system does'not annihilate the original dynamics. As
Rosen (197d) remarks, this partitioning will seem strange to us because We are
used selecting socalled "simple" units that correspondstO some physical
fractionation of tne system. The point is. that when we reduce or decompose
the system, the greatest care must be taken in selecting the 'proper unit .of
analysis. It is most likely, that "simplicity". (a term with an exceedingly
slippery definiti n) will be neither the only, nor the chief criterion
involved.
113
IP

Returnibg to the domain of movement, the identification of appropriateunits of analysis has long been a thorny issue, going back, at least' to
Sherrington's reference to the reflex as "...a simple, if not a probablefictionT (Sherrington, 1906). More recently, Greene (1971) in echoing NicolaiBernstein has remarked that much of our confusidnoin studying problems ofcoordination has arisen "frOm our limited ability'to recognize the significantinformational units of movement." Hdwever, there are signs (although onlyconsidered in passing in the target article) that some consensus may bedrawing near. There has been a growing, appreciation that individual muscles(or muscle variables) are not the proper units of analysis for discussinggoordihated movements; rather, such movements are partitioned more naturallyinto collective functional units defined over groups of muscles and joints,within which component elements vary relatedly and autonomously (e.g., Boylls,1975; Fowler, 1977;. Kelso, Southard, & Goodman, 1979; Lestienne, 1979;
Nashner, 1977; Saltzman, 1979; Szentagothai & Arbib, 1974; Talbott, 1979;
'survey, 1977). The Soviet school (e.g., Bernstein, 1967; Gelfand & Tsetlin,1971; Shik & Orlovskii, 1976) refers to such muscle-joint groupings as
linkages or synergies. These terms reflect an appreciation of the fundamentalproblem of control and coordination, namely that of constraining a complexsystem with many degrees of 'freedom to behave in a regular 'and orderly manner.
Synergies (or coordinative structures, cf. Easton, 1972; Kelso et al.,1979; .Turvey et al., 1978) by definition are functionally specific unitsdefined over groups of muscles and joints, which constrain the componentelements to act. together in a manner appropriate to the task at hand. Suchmuscle collectives are thOught to share common efferent and afferent
_organization and are deployable as relatively autonomous units in sensorimotortasks (e.g., Boylls, 1975; Gelfand, Gurfinkel, Tsetlin, & Shik, 1971).
Coordinative structures as functional units of control are currently undergo-ing rigorous analysis in a number of laboratories; they have been identifiedin various tasks and at different levels of analysis (cf. Kelso, 1981; Kelso,Tuller, & Harris, in press; Kugler, Kelso, & Turvey, 198J, for recent
' examples). Their chief feature rests in a mutable partitioning of componentvariables into those that preserve the structural ("topological") organizationof movement (e.g., the relative timing and relative force properties of
muscular events) and those that are capable of effecting scalar transforma-tions on these qualitative structures. A theoretical rationale for coordina-tive structures has been offered (cf. Kelso, 1981; Kugler et al., 1980, 1982),focusing on those properties that distinguish movement patterns that exhibitstructural stability from those that'do not.
There are indications in the target article that Professor Stein prefersto sidestep the issue of functionally specific units of movement as notgermane to his interests, and as one that pertains only to "multijoint
Movements" or the "large behavioral literature dm complex patterned
movement." However, he does not hesitate to negate arguments for length andstiffness control on the basis of "complex patterned movements" like speech or.piano playing in the case of'length, and walking in the case of stiffness. We
welcome the functional argument in each case, although we note that for Steinit involves jumping 'rather precariously between muscle-joint levels (e.g.,
stiffness and length) and task levels of analysis (such as skiing and r.leedle-threading). Though aware of the problem, Stein seems .to apply a single
muscle-joint unit of analysis generally, to all types of complex multijoint
6114
1 2 0

tasks. Such an approach is at the same time too powerful and too arbitrary.
It is too powerful because it allows descriptions of movement control thatfail to distinguish between those acts that do occur and those acts that arephysically possible but never occur. It is too arbitrary because single joint
3 actions will rarely relate unequivocally to particular task functions. In
short, when we deal with coonAnated activity, we are defiling with taskspecific functional units whose degrees of freedom are constrained accordingto task demands, or more generally, to the mutual relationship between
organism and environment.
Contrasting Views on the Origins of Order
Whenever we ob'Ste a regular and orderly phenomenon, it is' always a
temptation to a3sign responsibility to some device that is antecedent to, and
causally responsible for, he,said phenomenon. The device has availai,le to it"representations"' that have cha acteristics very much like the phenomenon we.are trying to'understand. As phi sophers have often told us, "representa-
- tions" require users with goals and terests (much like the animal itself)and so, when we assume their presence, we, ake out a loan on intelligence thatmust ultimately be. paid back .(cf. Dennett: 8: Searle, 1980). 'We can bury
our heads in the sand on this issue or we ca ,approach the problem in a
different way: one that asks not how control can be explained according tosome a priori prescription for the system (suchas the central representationsand the cybernetic, negative feedback. paradigms favored by Stein), but ratherhow control arises as an a posteriori.consequence of the system's dynamicalorganization. ,
For example, imagine adopting the former, prescriptive strategy to a
coherent biological phenomenon such as the schooling of fish. What we obServe,
ate individual fish behaving collectively in a highly coordinated manner. The
"systW in this case has many degrees of freedom and exhikits an organized,seemingly wholisti,.: structure. Adopting a prescriptive strategy, we might'
search the system for a "reference value" or a "central representation"- thatregulates the individual fish or the collective of fish, but it would makelittle sense to do so. These would be special mechanisms introduced by the
unknowing observer to account for a poorly understood phenomenon. In fact,the highly coherent behavior of fish schooling can be accounted for with afairly small set of key variables, such as "density" defined through the
metric of fish length. When the average distance between nearest neighbors isless than One fish length (note that the metric is "intrinsic" and system-scaled; cf. Warren & Shaw, 1981), spacing between fish is schooled not random
(cf. Okubo, 1980, for an in-depth analysis),
__Although the details of collective fish behavior may seem far removedfrom the issues .-aised by Stein, there is, we think, an important message for
the neuroscientist or psychologist. It is that an under'standing of a complex,
organizational phenomenon such as fish schooling rests with articulating the
necessary and sufficient conditions for that organization to occur. More
generally this approach entails a strategy that rejects the introduction ofspecial mechanisms--as sources of explanation--before dynamics has been fully
explored. Put another way, what can we, as students of, movement, explain "for
free" before we burden the nervous system with the onus of control?
115'
121

ti
In this regard, it is puzzling to us that Stein chooses to ignore a modelwhose dynamics obviate (or at least significantly reduce) the requirement forongoing, computational control. If recent work is a guide, much may be gainedthrough the identification. of functional units of movement with nonlinearmass-spring systems. Although the model has received an uneven interpreta-tion, its "-import for us s that it allows one to. see the qualitativesimilarities between certain aspects of movement control (such as the abilityto reach the same desired spatial location, with different trajectories andfrom variable initial conditions)_ and the behavibr of a mass-spring system.Following our arguments expressed above, the beauty of the mass-spring modellies not in the literal parallel between a single muscle and a spring, but inthe recognition that particular behaviors shane:--to a first approximation--thesameabstract functional organization as a mass-springrzystem.
The intuition that a muscle-joint system is dynamiCally similar to amass-spring system with controllable equilibrium length is due to Fel'dman(cf. Fel'dman, 1966, p. 771), and has undergone appropriate extension by anumber of .authors (e.g., Bizzi, Polit, & Morasso, 1976; Kelso, 1977; Kelso &Holt, 1980; Polit & 1978; Schmidt &.McGown, 1980). The basic idea s"that a given joint angle may be" specified according to a set of muscleequilibrium lengths. Once these. are specified, the joint will achieve andmaintain a desired final angle at which the torques generatt by the muscles
sum to zero. Such a system 'exhibits the property of equifinality in that
desired positions may be reached from varioas initial angles, and'in spite ofunforeseen perturbations encountered during. the motion trajectory (see Kelso,Holt, Kugler, & Turvey, 1980 for review; but also Saltzman, 1979, for some
cautionary notes). Fel'dman (.1961, 1980) has further noted thot stiffness ata joint may be specified in ,terms of agonist and antagonist equilibriumlengths even if the stiffness of these muscles is not itself controllable. In
the Fel'dman model, joint stiffness covaries with the degree of agonist-antagonist co- contraction.
Two points9for Stein emerge from this discussion. One concerns a sin of
omission in that he includes the spring.property of stiffness as a possiblecontrol variable, but neglects the related variable of equilibrium length.The other, perhaps more important issue warrants a little further development;because of its theoretical.consequences. It is that in likening (to a firstapproximation) a constrained collective of muscles to a mass-spring system,the need to introduce externally imposedsmeasurement, comparison, and controloperations is reduced. Though we could describe a dynamical system like amass-spring in terms of externally imposed reference jevels and though wecould mathematize it into canonical feedback form, little would be gained bydoing so (cf. Yates, in press). A muscle collective aua spring system isintrinsically self-equilibrating: conserved values such as the equilibrium
point emerge from the system's parameterization. More emphatically, in mass-spring systems (like schools of fish and functional groupings of muscles?)there no need to introduce a "representation" anywhere'.
Toward an Alternative Control Scheme
In our finaleicomments we take up--in rather condensed fashion because ofspace limitations--Professor Stein's invitation to his critics to offer an
alternative scheme to the one that he has put forward so authoritatively. We
.116
122
2.

-
6.
refer to an emerging theoretical view of movement control and coordinationthat has been expressed in'two recent papers (Kugler et al., 1980, 1982) and
that has also undergone some, as yet limited, empirical scrutiny (Kelso, Holt,Kugler, & Turvey; 1980; Kelso, Holt, Rubin, & Kugler, in press). Its origins
(and to a large extent its appeal) lie in a unified treatment of cooperative
,phenomena at all scales of magniSude (cf. Haken, 1977). Hence it speaks tothe important issue raised by 'Sein at the beginning of his article, namelythat of relating levels of analysis. Moreover, the, perspective is consonant
.with some-of the themes introduced above and also may interface with evolvingoscillator theoretic views of neural control not considered by Stein in thetarget article (e.g., Delcomyn, 1980).
A chief distinguishing feature of the view expressed here lies in the
recognition that first and foremost, living systems belong to a class of
physical systems that are,open to fluxes of energy and matter (in ,contrast,
cybernetic systems are. closed to energy and matter exchange with their
surrounds). The. principal theories addressing such systems are Iberall's
HOmeokinetic Theory (e.g., Iberall, 1977; 1978 Soodak & Iberall, 1978; Yates& Iberall, 1973) and Prigogine's Dissipative Structure Theory (e.g., licolis &
Prigogine, 1977; Pcigogine, 1989). The former,- in particular, addresses
systemic phenomena in biology and elaborates, among other things, the condi-
-7--tions- for persistence of function, autonomy, and self-organization. It
represents a concerted effort to apply irreversible thermodynamics to living
,:systems. A fundamental tenet is that in steady-state systems the flow of
eritrgy, through the system plays an organizing role and that, following
Morowitz's trieorep, cenergy flow from a potential source to a lower order sink
will lead to at least one cyclg in the system (cf. Morowitz, 1968):
Homeokinetic theory builds on the Barnard-Cannon principle of homeostasis
(which containedno mechanism for preservation of conserved states); in the
homeokinetic -yield, control is dynamically effected, by means of coupled
ensembles of limit cycle oscillatory prdcesses. Limit cycles represent the
'only temporal stability for non-conservative, nonlinear systems; they resemble
"squirt" systems that, by virtue of their design, are capable of making up for
dissipative losses that occur in the drift toward equilibrium (see Yates &
Iberall, 1973). The system's conserved values or equilibrium operating points
are thought to be specified in the loose coupling of limit cycle processes.
Limit cycles are manifestations of.thermodynamic engines and quantize action
(formally, the product of energy and time; cf. Iberall, 1978) at every level
in the system.
As functional units of movement, ensembles of nonlinear limit cycle
oscillators offer a nuper of attractive features for a principled account of
coordination and .control. -Among these are their self-sustaining properties,
their ability to operate independently of initial conditions, their stability
in the face of moderate perturbations,-and, perhaps most important for the
theorist of movement,.the properties of mutual entrainment and synchronization
(cf. Minorsky, 1962; Winfree, 1980).
With respect to the issues raised by Stein\ it iId worth emphasizing that
limit cycles are not special mechanisms per 'se. To 'observe spectrally
disttibuted limit cycle regimes anefor new spatiotemporal organizations to
'emerlge,certain necessary conditions must exist. Among these are the presence
of many interacting degrees of freedom, nonlinearities, a'relatively constant
117

source of potential energy and the requirement that energy be dissipated.
Given such conditions and subject to critical scaling influences, constraintsemerge that are capable of marshalling the free variables into coherentfunctions. Quadruped gait may be an example: When one stable movement
.pattern is driven beyond a critical value on a system-sensitive parameter, abifurcation occurs and a new spatiotemporal pattern--a new stability--arises.In such a view, no explicit "gait selection" process is required (e.g.,
iGallistel, 1980).
To reiterate our main point, however, in the perspective offered here,order (control and coordination)' is functionally specified in the system'sdynamics. The radical claim, as Gibson (1979) once remarked, is that behavioris regular but there are no regulators. A less radical statement. would be an
affirmative answer to Yates' (1980) question to the readers of the AmericanJournal of Physiology: Do [you] know of a serious effort to discharge thehomunculus?
The spirit of the foregoing discussion leads us to raise one final issue.It is the growing intuition--stemming from theoretical considerations raised'
he-e and elsewhere (cf. Anderson, 1972)- -that the problem of order in natural
systems might be attacked more effectively by seeking out a single set of
physical principles that can apply at all levels, rather than by positing
different units of analysis `at each level. One assumes nature operates with
ancient themes. In this commentary we have tried to provide a flavor for the
ones that neuroscience in general, and the field of motor control in
particular, might consider, worth orchestrating.
REFERENCES
Anderson, P. W. More is different. Science, 1972, 177, 393-396.
Bellman, R. E. Adaptive control processes: A guided tour. Princeton, N.J.:
Princeton University Press, 1961.Benati, M., Gaglio, S., Morasso, P., Tagliasco, y., & Zaccaria, R.
Anthropomorphic robotics. II. Analysis of manipulator dynamics and the
output motor impedance. Biological Cybernetics, 1980, 38, 141-150.
Bernstein, N. A. The coordination and regulation of movements. London:
Pergamon Press, 1967.
Bizzi, E., Polit, A., & Morasso, P. Mechanisms underlying achievement of
final head position. Journal of Neurophysio2ogy, 1979, 39, 435-444.
Boylls, C. C. A theory of cerebellar functioh with applications to locomo-
tion. The relation of anterior lobe climbing fiber function to
locomotor behavior in the cat. COINS Technical Report 76-1, Department
-of Computer and Information Science, UnTI,7&iiiTof Massachdsetts, 1975.
Delcomyn, F. Neural basis of rhythmic behavior in animals. Science, 1980,
210, 492-498.Dennett, D. C. Brainstorms:, Philosophical essays on mind and psychology.
'Montgomery, VT: Bradford Books, 1978.
Easton, T. A. On the normal use of reflexes. American Scientist, 1972, 60,
591-599.
Feldman, A. G. Functional tuning of the nervous system with control of
movement or maintenance of a steady posture. III. Mechanographic
analysis of execution by man of the simplest motor tasks. Biophysics,
'118
124

1966, 11, 766-775.
Fel'dman, A. Superposition of motor programsII. Rapid forearm flexion
in man. Neuroscience, 1980, 5, 91-95.Fowler, C. Timing control in speech production. Bloomington, Ind.: Indiana
University Linguistics Club, 1977.
Gallistel, C. R. The organization of action: A new synthesis. New York:
Erlbaum,-1980.Gelfand, I. M., Gurfinkel, V. S., Tsetlin, M. L., & Shik, M., L. Some problems
in the analysis of 'movements. In I. M. Gelfarid, V. S. Gurfinkel,S. V. Fomin, & M. L. Tsetlin (Eds.), Models of the structural-functionalorganization of certain biological systems. Cambridge, Mass.: MIT
Press, 1971.Gelfand, I. M., & Tsetlin, M. L. Mathematical modeling of mechanisms of the
central nervous system. In I. M. Gelfand, V. S. Gurfinkel, S. V. Fomin,
& M. L. Tsetlin (Eds.), Models of the structuralpfunctional organizationof certain biological systems. Cambridge, Mass.: MIT Press, 1971.
Gibson, J. J. The ecological approach to visual perceptions. Boston:
Houghton-Mifflin, 1979.Greene, P. H. Introduction. In I. M. Gelfand, V. S. Gurfinkel, S. V. Fomin,
& M. L. Tsetlin (Eds.), Models of the structural-functional organization
of certain biological systems. Cambridge, Mass.: MIT Press, 1971.
Haken, H. Synergetics: An introduction. New York: Springer-Verlag, 1977.
Iberall, A. S. A field and circuit thermodynamics for integrative physiology:
I. Introduction to general notions. American Journal of
Physiology/Regulatory, Integrative & Comparative Physiology, 1977, 2,
R171-R180.
Iberall, A. S. A field and circuit thermodynamics for integrative physiology:
III. Keeping the books - a general experimental method. American
Journal of Physiology/Regulatory, Integrative, & Comparative Physiology,
1978, 3, R85-R97.Katchalsky, A. K., Rowland, V., & Blumenthal, R. Dynamic patterns of brain
cell assemblies. Neurosciences Research Program Bulletin, 1974, 12(1).
Kelso, J. A. S. Motor control mechanisms underlying human movement reproduc-tion. Journal of Experimental Psychology: Human Perception and
Performance, 1977, 3, 529-543.
Kelso, J. A. S. Contrasting perspectives on order and regulation in movement.
In J. Long '& A. Baddeley (Eds.), Attention and performance IX.
Hillsdale, N.J.: Erlbaum, 1981.
Kelso, J. A. S., & Holt, K. G. Exploring a vibratory systems analysis ofhuman movement production. Journal of Neurophysiology, 1980, 43, 1183-
1196.
Kelso, J. A. S., Holt, K. G., Kugler, P. N., & Turvey, M. T. On the concept
of coordinative structures as dissipative structures: II. Empirical
lines of convergence. In G. E. Stelmach & J. Requin (Eds.), Tutorials ln
motor behavior. New York: North-Holland Publishing Co., 1980.
Kelso, J. A. S., Holt, K. G., Rubin, P., & Kugler, P. N. Patterns of human
interlimb coordination emerge from the propertiesof non-linear limit
cycle oscillatory processes: Theory and data. Journal of Motor
Behavior, in press.
Kelso, J. A. S., Southard, D. L., & Goodman, D. On the nature of human
interlimb coordination. Science, 1979, 203, 1029-1031.
Kelso, J. A. S., Tuller, B. H., & Harris, K. S. A 'dynamic pattern' perspec-
tive on the control and coordination of movement: In P. MacNeilage
125
119.
(Ed.), Motor.control of speech production. New Yorkl Springer-Verlag,
in press.Kugler, P. N., Kelso, J. A. S., & Turvey, M. T. On the concept oC coordina-
tive structures as dissipative structures: I, Theoretical lines of
convergence. In G. E. Stelmach & J. Requin (Eds.), Tutorials in motor
behavior. New York: North-Holland Publishing Co., 1980.
Kugler, P. N., Kels6, J. A.,S., & Turvey, M. T. On coordination and control
in naturally developing systems. In J. A. Scott *els() & J. C. Clark
(Eds.), The development of human movement control and coordination. New
York: John Wiley, 1982.Lestienne, F. Effects of inertial load and velocity on the braking process of
voluntary limb movements, Experimental Brain Research, 1979, 35, 407-
418.
Llinas, R. R., & Iberall, A. A global model of /levronal command-control
systems. Biosystems, 1977, 8, 233-235.
Minorsky, N. Nonlinear oscillations. Princeton, N.J.: Van Nostrand, 1962.
Morowitz, H.' J. Energy flow.in biology: Biological organization as a problem
in thermal physics. New York: Academic Press, 1968.
Nashner, L, M. Fixed patterns of rapid postural, responses among leg muscles
during stance. Experimental Brain Research, 1977, 30, 13-24.
Nicolis,.G., & Prigogine, I. Self-organization in nonequilibrium systems:From dissipative structures to order through fluctuations. New York:
Wiley-Interscience, 1977.
Okubo, A. Diffu 'qr. and ecological problems: Mathematic models. Berlin:
Springer-Verlag, 1980.Polit, A., & Bizzi, E. Processes controlling arm movements in monkeys.
Science, 1978, 201, 1235-1237.Prigogine, I. From being to becoming: Time and complexity in the physical
sciences. San Francisco: W. H. Freeman & Co., 1980.
Rosen, R. Fundamentals of measurement and representation of natural systems.
New York: North-Holland, 1978.
Saltzman, Levels of sensorimotor representation. Journal of Mathematical
Psychology, 1979, 20, 91-163.Schmidt, R. A., & McGown, C. Terminal accuracy of unexpectedly loaded rapid
movements: Evidence for a mass-spring mechanism in programming. Journal
of Motor Behavior, 1980, 12, 149-161.
Searle, J. 'Minds, brains and programs. The Behavioral and Brain Sciences,
1980, 3', 417-457.
Sherrington, C. S. The integrative action of the nervous system. London:
Constable, 1906.Shik, M. L., & Orlovskii, G. N. Neurophysiology of locometor automatism.
Physiological Reviews, 1976, 56, 465-501.
Soodak, H., Iberall, A. S. Homeokinetics: A physical science for complex
systems' Science, 1978, 201, 579-582.
Szentagothai, J. A false alternative: Commentary on Pucetti and Dykes. The
Behavioral and Brain Sciences, 1978, 3, 367-368..
-Szentagothai, J., & Arbib, M. A. (Eds.). Conceptual models of cieural organi-
zation. Neurosciences Research Program Bulletin, 1974, 12(3).
Talbott, R. E. Ferrier, the synergy concept, and the study of posture and
movement. In R. E. Talbott & D. R. Humphrey (Eds.), Posture and
movement. New York: Raven Pre'ss, 1979.
Turvey, M. T. Preliminaries to a theory of action with reference to vision.
In R. Shaw & J. Bransford (Eds.), Perceiving, acting and knowing: Toward-
120
126

an ecological psychology. Hillsdale, N.J.: Erlbaum, 1977.
Turvey, M. T., Shaw, R. E., & Mace, W. Issues in the theory of action:
Degrees of freedom, coordinative structures and coalitions. In J. Reguin
(Ed.), Attention and performance VII. Hillsdale, N.J.: Lawrence Erl
baum, 1978.Warren, W. H., & Shaw, R. E. Psychophysics and ecometrics. The Behavioral
and Brain Sciences, 1981, 4, 209-210.Winfree, A. T. The geometry_ofbiological time. New York: SpringerVerlag,
1980.
'Yates, F. E. Getting the homunculus out of the head. American Journal of
Physiology, 1980, 239, R363-364.
Yates, F. E. Systems analysis Of hormone action: Principles and strategies.
In Q R. F. Goldberger (Ed.), Biological regulation and development,
Vol. III Hormone action. New York: Plenum, in press.
Yates, F. E., & Iberall, A. S. Temporal and hierarchical organization in
biosystems. In J. Urquhart & F. E. Yates (Eds.), Temporal aspects of
therapeutics. New York: Plenum, 1973.
121
l47

EXPLORING THE NkTURE OF MOTOR CONTROL IN DOWN'S SYNDROME*
Walter E. Davis- and J. A. Sent Kelso++C
Abstract. Following Asatryan and Fel'dman (1965), two 'experiments
were conducted to describe the so-called invariant mechanicalproperties underlying movement control in Down's syndrome and normalsubjects. The invariant characteristic is a curve on a graph ofjoint torque versus joint angle. The task required subjects to
maintain a steady joint angle against an external load (torque).Torque was systematically changed via partial unloading in order toobtain torque by length (joint angle) functions at three separate
initial joint angles. Instructions required subjects "not to
intervene" when unloading occurred in Experiment 1 and to "tense"
their muscles prior to unloading in Experiment 2. Both normal and
Down's syndrome groups revealed systematic torque by length
functions that might be expected according to a simple mass-spring
system model. Although the gross organization of movement in Down'ssyndrome subjects was nearly the same as normals, important
differences between the two groups were found. Down's syndrome
subjects revealed underdamped motions relative to ncrmals. (as shown
by differences in the degree of oscillation stout the final
equilibrium position) and were less able to regulate stiffness (as
shown by differences in slope of the torque by angle functions inExperiment 2).' We promote the notion that damping and stiffness maybe sensitive indices of hypotonia--the most common description ofneuromuscular deficiency in Down's syndrome.
There is very little research on the control and coordination of movement
,in Down's syndrome subjects. The few studies that do exist reveal that this
population exhibits abnormal gait (James, 1974), slow movement responses
(Berkson, 1960; Lange, 1970) and is less accurate on certain motor tasks
-(Frith & Frith, 1974) than their normal counterparts. However, questions
concerning the underlying organization of motor control in Down's syndrome
subjects remain unanswered.
*To appear in Journal of Motor Behavior, in press.+The Motoi Development Center, Kent State University, Kent, Ohio.
++Also Departments of Biobehavioral Sciences and Psychologyi University of
Connecticut, Storrs.Acknowledgments. Portions of this paper represent a doctoral dissertation
submitted to the University of Connecticut by Walter E. Davis, who is
presently at The Motor Development Center, Kent State University, Kent,
Ohio 44242. The work was supported by NIH grants AM 25814 and NS-13617,
and BRS Grant RR-05596 to Haskins Laboratories. We thank Michael Turvey for
sharing his insights with us on this problem and also for reviewing an
earlier version. We are grateful to Philip Rubin who developed the "action"
computer software for analyzing some of the data reported here.
[HASKINS LABORATORIES: Status Report on Speech Research SR-69 (1981)]
128123

The most often implicated motor deficiency in Down's syndrome subjects is
hypotonia, a decrease or absence of muscle tone. Indeed, nearly all Down's
syndrome infants are born with hypotonia, a condition that may contributegreatly to their delay in reaching motor milestones (cf. Cowie, 1970).
However, no definitive statement can be made about hypotonia in Down's
syndrome individuals beyond infancy cf. Knight, Atkinson, & Hyman, 1967;
Owens, Dawson, & Losin, 1971). To complicate things, the exact relationshipbetween hypotonia and motor control is, as yet, unclear (cf. Neilson & Lance,1978).
One model--for which there is accumulating empirical evidence--and which
may allow us to understand movement organization in Down's syndrome, draws the
analogy between the i,ehavior of muscle collectives and a vibratory system(cf. Turvey, 1977). For example, Asatryan and Fel'dman (1965), in a now
classic experiment had subjects establish steady-state joint angles against an
external load. On each occasion, when the load was systematically reduced andthe subjects instructed not to intervene, the joint angle changed. Resulting
torque by length (joint angle) functions generated from different initial
positions were parallel and non-intersecting as would be expected from a mass-spring model.
Additional evidence supporting a vibratory system model comes from
research demonstrating equifinality in the muscle-joint systems of humansubjects (e.g., Bizzi, 1980; Fel'dman, 1966b; Kelso, 1977; Kelso & Holt, 1980:
Schmidt & McGowan, 1980, for reviews) and trained monkeys (Bizzi, Dev,
Morasso, & Polit, 1978; Bizzi, Polit, & Morasso, 1976). Equifinality, as
defined, refers to a system's ability to equilibrate based solely on its
parameters and independent of initial conditions (von Bertalanffy, 1973).1
Following Asatryan and Fel'dman's (1965) analysis, the present study
sought to describe the static mechanical properties of the muscle joint systemof Down's syndrome subjects using a simple mass-spring equation: F = -K (1-
10) , where F is an external force, -K is stiffness, 1 is the current length ofthe spring and 10 is the length of the spring when no forces are acting on it.Experiment 1 was designed to determine the so-called invariant characteristics(cf. Fel'dman, 1980a) of the muscle-joint system of Down's syndrome subjects.This was achieved by examining the relationship between change in joint angleunder conditions of partial unlbading when subjects were instructed not to
intervene voluntarily against the unloading, thereby holding the parameters of
stiffness and zero length relatively constant. Under these conditions, any
change in joint angle should be systematic with the change in the load
(torque).
A second experiment examined the extent to which Down's syndrome subjects
were capable if regulating stiffness by requiring subjects to tense their
muscles voluntarily` at particular joint angles prior to unloading. Asatryan
and Fel'dman (1965) demonstrated that normal subjects could voluntarily
increase the stiffness of the muscle-joint system as reflected by increases inthe slope of the torque by length function. It is not known whether stiffness
can be regulated voluntarily by Down's syndrome subjects. Qualitatively
speaking, the Down's syndrome population is characterized by hypotonia
(flaccidity), which may relate to muscle stiffness or to damping. Damping is
the internal frictional force present in the system and is indicated by the
124
129

e *tent of overshoot or oscillation about the equilibrium point. As this study
shows, both stiffness and damping appear to be sensitive indices of the
impaired performance of Down's syndrome subjects.
EXPERIMENT 1
Method
Sub iects
The subjects in this study were seven Down's syndrome male students
between 14 and 21 years of age who attended Celentano School for the
developmentally handicapped in New Haven, Connecticut. These subjects were
selected from among 30 subjects who participated in a previous study that
employed limb localization movements (Davis & Kelso, Note 1). The subjects
were selected on the basis of their ability to complete the task. The
Celentano School administration reported an IQ range'of 25-60 for the subjects
involved in this study. A'control group consisted of six normal male subjects
selected from the subject pool listed at Haskins Laboratories in New Haven who
were paid for their services...v
Apparatus
The apparatus consisted of a 593c finger positioning device along with an
associated electronics control package (see Kelso & Holt, 1980, for a
description). The main parts of the apparatus were two, movable arms each
attached to a separate metal shaft mounted vertically on the top of an open
box frame. Only the right hand was used in these experiments. The frame was
mounted on a table 78.5 cm hih.
The movements allowed by the positioning device were flexion and
extension of the index finger about the metacarpophalangeal joint. The distal
end of the moving finger was fitted with a plastic collar that slipped into an
open-ended cylindrical support attached to the movable arm. The movable arm
consisted of two parallel bars fitted perpendicularly into the metal shaft. A
pointer was attached to the end of the movable arm and moved along a
protractor calibrated in degrees. The apparatus was also equipped with padded
adjustable braces with which -to secure the subjects' wrist, hand, and
remaining fingers and thumb during the movements.
The gear arrangement driven by a torque motor provided resistance (load)
t9 the movable arm (and hence to the finger when placed in the cylinder
attached to the arm) when current was supplied to the motor. The electronics
control tiox allowed for regulation of the current supply and could be set in
either of two modes. While in the first mode, which shall be referred to as
"servo-torque control," a resistance (torque) acted on the finger whenever the
finger deviated from the set servo-position. When the finger was in the
servo-position, no resistance acted upon it. When in the second mode,
referred to as "torque control," a constant resistance could be applied to the
finger (settable in either direction). The amount of resistance (torque) was
adjustable and could be set anywhere from 0 to 100% of the maximum torque
available from the motor (81.6 ounce-inches).
1_30)
125

IM
Procedure 0
Procedures-for.the normal and Down's syndrome subjects were identical.The normal subjects were tested at Haskins Laboratories and the Down'ssyndrome subjects were tested at Celentano Schcol over a four-day period.Each subject was scheduled for'a 15-minute session each day. As a consequenceof the difference in venue, Down's syndrome subjects' movements were analyzedvia visicorder tracings (Honeywell, 1508C) while normal subjects' movementswere fed directly into a PDP 11/45 for later computer analysis. For bothtypes of recordings, ,a set number of degrees of movement corresponded to acalibrated voltage.
Each subject sat comfortably facing the apparatus with his right fingerplaced securely into the cylinder attached to the arm. Upon a signal from the
experimenter, the subject moved to a specified steady-state joint angle(target) acting against a load supplied by the torque motor. The target
angles for Experiment 1 were as follows: S1 = 155 deg, S2 = 165 deg, and S3 =
175 deg. When the subject's finger pointed straight ahead, the position wasequal to 180 deg. The subject reached the target angle with a flexion
movement from a starting position of 192 deg. The target angle was set by the
subject by matching a line on the oscilloscope. When the angle was set, thesubject closed his eyes and the oscilloscope was turned away. Within 0.5 to
2.0 sec after the target angle was achieved, a proportion of the load was
released. The subject was instructed to maintain a steady resistance againsttne load--as indexed by the stable achievement of initial angle--and not to
interfere voluntarily with the movement of the finger if the load was
released.
For this study, partial unloading was achieved in the following manner.
The control was set in servo-torque mode at the specified servo-positioncorresponding to the starting position as noted above. After the subject
moved his finger to a specified joint angle, counteracting the resistance
(100% torque) exactly, part of the load was released by switching from servo-torque control to torque control. This was achieved by the experimentermoving the manual switch on the control box. The amount of load released was
regulated by setting the percentage of torque load. In order to obtainnegative load release, the torque load was set, at 5 and 10 percent but thedirection of the resistance was reversed to act in the direction of flexiln
(i.e., in the direction that the finger was moving).
The measurements taken were changes in joint angle and changes in the
amount of resistance acting on the finger. Measurements of joint angle change
were taken by hand from visicorder tracings of finger displacement and
' measured to the nearest .5 cm, or obtained directly following A-to-D
conversion (200 Hz) on the PDP 11/45. The criterion for determining the newsteady-state joint angle was the point at which movement ceased (as shown bythe movement tracings) for at least 500 msec (.5 cm on the tracing) following
unlo.ding.
A series of partial unloadings was conducted with each subject at each of
three initial joint angles, S1, S2, and S3. For each series, seven separate
unloading:; were conducted (60%, 40%, 25%, 10%, 0%, -5%, and -10%),
representing (a percentage of maximum torque. The seven separate unloadings
126
,
131

provided a sufficient amount of data to describe the torque by joint angle
functions.
For each of the unloadings at least four trials were carried out. In
dll, more than 184 trials were conducted with each subject. The order inwhich the ti als were given within each series, -)r the different unloadings,
was randomly assigned. -Series 1, 2, and 3 were presented to each subject in a
predetermined balanced order.
Design
The data obtained from both Down's syndrome and normal subjects were
graphed to determine if the torque by joint angle functions were parallel andnon-intersecting as might be expected from the static equation, F = -K (1-10).The algebraic error data were analyzed using a 2 (groups) x 3 (series) x 7
(unloadings) analysis of variance with repeated measures on the last two
factors. A similar analysis was performed on variable error. In addition,
tests of linearity (Wine, 1964) were also performed on the curves.
Results
Three sets of torque by joint angle functions were obtained as a result
of partial unloading. The joint angle change in this case represents a
deviation from the initial angle and conforms to stcndard measures of meanalgebraic (constant) error. The results for the normal and Down's syndrome
subjects are shown in Figure 1. The curves obtained for both normal and
Down's syndrome subjects are indeed parallel and non-intersecting. It is
clear from the figure that the two groups are nearly identical, and this wasborne out by statistical analysis, F (1,11) = .20, > .05. As expected,
there was a significant torque change effect, F (6,132) = 173.8, .2 < .001, as
well as a significant series effect, F (2,15) = 6.23, .2 < .01. There was
also a significant series by torque interaction, F (12,132) = 2.65, < .01.
Analysis of this interaction revealed that for the three greatest unloadings(0%, -5%, and -10%), the joint angle change was larger between series 3 and 2as well as series 3 and 1. Series 2 also revealed larger joint angle changes
than series i at these unloading values.
Analysis of variable error, like constant error, reflected a high degree
of similarity between Down's syndrome and normal groups. Only the torque
effect was significant, F (6,132) = 25.67, < .001. For the seven different
unloadings (from 60% to -10%) variability in angle change appeared to increase
systematically (1.0, 1.7,2.4, 3.2, 3.8, 4.4, and 4.1 deg). No other main
effect or interaction was significant for variable error.
A trend analysis of the F by 1 function obtained from each of the threeseries of unloadings for Down's syndrome and normal subjects was performed.
The results revealed that the functions for both groups were essentially
linear. For example, for the Down's syndrome group the proportion of varianceaccounted for by linearity in series 1, 2, and 3 was 94%, 93%, and 92%,
respectively.
127
132

FIGURE 1. ANGLE CHANGE AS A FUNCTIONOF TORQUE CHANGE
EXPERIMENT 1
100
99
80 NORMAL SUBJECTS ---- -
SZ DOWN SYNDROME
2<
70SUBJECTS
L.L.
0 60e....w 50
<0I 40LLJD 30CC
200}--
123
10
-10
S.e
SERIES SERIES SERIES1 2 3
So
95 105 115 125 135 145 155 165
ANGLE CHANGE (IN DEGREES)
133
.175

Examination of the individual movement tracings, however, revealed someinteresting differences. Representative movement traci gs of individual
esubjects are presented in Figure 2A (normal subject S ) and 2B (Down's
syndrome subject BV). The three movement tracings for e h subject were
recorded during unloadings of 60%, 10%, and -10% in Expbriment 1.
Qualitatively speaking, movements of'normal subjects from the initial position
to the target angle we're, on the whole, more direct than the Down's syndromesubjects whose movements were more step-like or discontinuous (e.g., Brooks,1974) and less stable. Although movement speed was not specified to the
subjects beforehand, a rather interesting finding is that Down's syndromesubjects took significantly longer to reach the target angle. A random sampleof 136 trials from Down's syndrome subjects was compared to the same number oftrials for normal subjects. The mean movement time for the Down's syndromegroup was 2.0 sec and the standard deviation was .4 sec compared to the meanand standard deviation of .8 sec and .1 sec for., normal subjects. These
movement times were significantly differenAtTrom each other (p < .001 ).
Down's syndrome subjects also differed from their normal peers in terms
of oscillatory behavior at the newly established equilibrium position (i.e.,following unlbading, see Figure 2). Overshoot was measured to the nearest .5degree for each of the trials and was analyzed using a group by series bytorque analysis of variance with repeated measures on the last two factors.
As shown in Table 1 a significantly greater amount of overshoot was found for
Down's syndrome than for normal subjects, F (1,11) = 21.38, .2 < .001. There
was also. a significant series main effect, F (2,132) = 6.32, .p < .01 and
torque main effect, F (6,132) = 58.67, 2 < .001. The mean overshoot for each
series was 4.87, 5.48, and 6.91 deg, respectively. As the amount of unloading
increased (and thus angle 'hange increased), the amount of overshoot
increased. This finding hol,Is for both groups but is magnified in the Down'ssyndrome group as evident in a group by torque interaction, F (1,132) = 17.27,
< .001 (see Table 1).
Discussion
The results of Experiment 1 support the notion'that when muscles are
constrained to act as a 'wit in controlling movement about a joint, that unitbehaves qualitatively like a mass-spring system. The three sets of torque byjoint angle function's obtained for both normal and Down's syndrome subjectswere parallel and non-intersecting, and concur with the findings of Asatryan
and Felldman (1965). It may be reasoned that, for the subjects in this study,
the -K and lo parameters were established in counterbalancing the externalforce to maintain the specified joint angle. A .-systematic angle change
accompanied the systematic torque change. Thus, it appears that the
parameters of -K and 10 remained relatively constant during unloading.
Furthermore, when the subjects were asked, on different occasions, to reach
new joint angles, new zero angles were established. The change in zero length
resulted in parallel and non-intersecting functions.
Of course the significant resulttorque by joint angle functions forgroup were practically identical (seethe underlying movement organization,
of the present experiment 7.s that the
Down's syndrome subjects'and a normal
Figure 1). It appears therefore thatat least under static conditions, is
134
129

L- FIGURE 2. TRACINGS OF FINGER MOVEMENT0
. EXPERIMENT 1
A) NORMAL SUBJECT SK B) DOWN SYNDROME SUBJECT BV
a)
b) 16.
L\. . f
i c) -.
I
1
,.KEY ,.
f Unloading ) Overshot)! % of unloading
Scale Target angle a) 40%
ik New equilibrium b) 90%DO° 1 Sec. ". .
fr.__.f point c) 110%
Movement directiori
135
if
a)
-..
a
}
+
)
AB
--,
AB
4.
AB
A = Finger movementB = Torque motor tracingf Start of movement4. Unloading
Scale
120° .2 Sec.. 1----1
Oh

basically similar in both populations. 'From amass spring perspective, Down's
syndrome subjects, like normals, appear capable of "specifying system
parameters--stiffness and equilibrium length - -that may determine movement at
the joint.
Although the curves appear graphically nonlinear, the torque by joint
angle functions were characterized by a statistically linear trend. ThUs, the
nonlinear component in this study is somewhat less than might be expected
based on the findings and qualitative analysis of Asatryan and Fel'dman
(1965). However, these authors did not subject their obtained functions to
any statistical analysis as we have done here.
One way of interpreting the present findings is that the nervous system
.(in both Down's syndrome and normal populations) is able to "tune" the muscle
joint system by adjusting the lengthtension relationships of the muscles
involved. In the,simple case, agonistantagbnist pairs can be represented, by
parallel lengthtension curves whose slopes correspond to muscle stiffness. A
change in innervation rate to one muscle or the other will shift the
equilibrium 'point of, the system (cf. Bizzi., 1980;. Cooke, 1980; Fel'dnian,
. 1966b, 1980a, 1980b; Kelso & Holt, 1980). In this view, supported by the
. ability of deafferented MonkeYs-(Bizzi et al., 1978; .Bizzi et al., 1976) and
humans without intact joint and cutaneous reception (Kelso, 1977; Kelso &
Holt, 1980) to localize limbs abcurately, stiffness is set prior to movement
and -is a control parameter. On the other hand, Houk (1978) has presented
evidence in favor of a view in which a combination of muscle spindle and
tendon proprioceptors provides feedback about muscle stiffness. In this view;
stiffness is a regulated variable of the system. Regardless of which view one
adopts, both are consonant with the perspective offered here (but see the
General Discussion for possible quplifications on this view, and also Cooke,
1980, for a model of how mechanical and reflex variables may interact). It is
the specification of dynamic variables (e.g., stiffness, damping) rather than
kinematic variables (e.g., displacement, 'velocity) that appropriately
characterize the neuromuscular 'organization of the musclejoint system.
There were, however, qualitative differences among the movement patterns
of Down's syndrome and normal subjects. There were-clear differences between
the graphs in the trajectories toward the target angle, (see Figure 2).
Moreover, Down's syndrome subjects were less able, after reaching the target,
to maintain a steady position. One possible explanation for the Latter
finding is that once the target was reached, visual guidance was removed. In
, a previous study (Davis & Kelso, Note 1), it was round that Down's syndrome
subjects were less able than normal subjects to reproduce movements accurately
without visual guidance. However, the movements of:Down's syndrome subjects
in the present study were also less smooth and accurate when visual guidance
was available. In the present study, movements were made by matching a cursor
to a fixed line target on an oscilloscope screen. Visual guidance from an
oscilloscope may not be the same as direct visual guidance of the finger.
Nevertheless, under the present conditiOns of visual guidance to a target as
well as maintaining a set joint angle with visual information absent, Down's
syndrome subjects.were not as accurate as their normal peers.
Second, significantly greater overshoot or fluctuation 'about the
equilibrium point was found in Down's syndrome subjects following unloading.
137 A
131
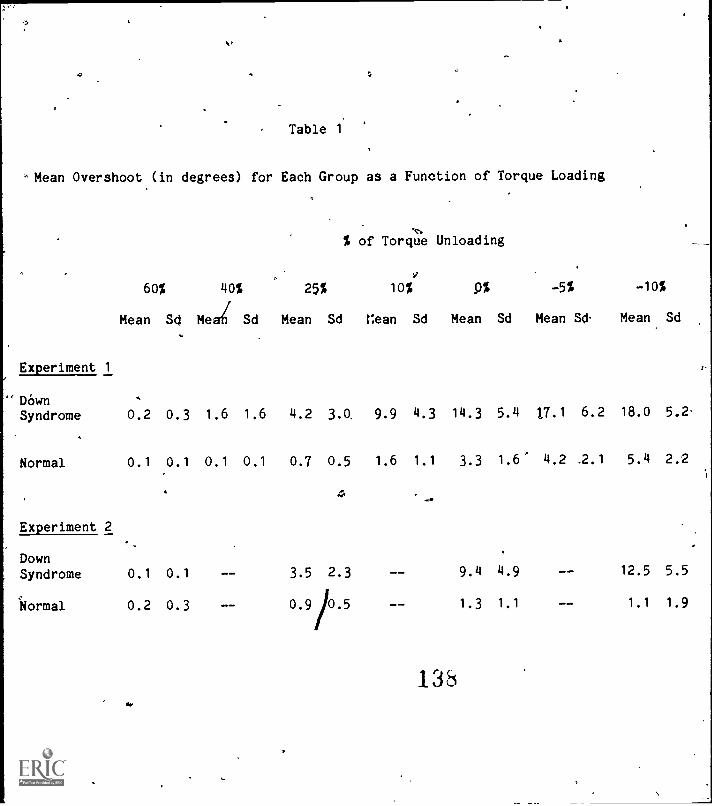
k?
. . ..
Table 1'
'Mean Overshoot (in degrees) for Each Group as a Function of Torque Loading
\-.
% of Torque Unloading
Experiment 1
60%
Mean Sd
40%
Meah Sd
25%
Mean Sd
10%
nean
y
Sd
9%
Mean Sd
-5%
Mean SO.
-10%
Mean Sd
DownSyndrome 0.2 0.3 1.6 1.6 4.2 3.0. 9.9 4.3 14.3 5.4 17.1 6.2 18.0 5.2.
Normal 0.1 0.1 0.1 0.1 0.7 0.5 1.6 1.1 3.3 1.6' 4.2 _2.1 5.4 2.2
Experiment 2
DownSyndrome 0.1 0.1 3.5 2.3 9.4 4.9 12.5 5.5
Normal 0.2 0.3 0.910.5 -- 1.3 1.1 1.1 1.9
1384
\

Overshoot may be taken as an index of the damping parameter. For example, an
underdamped system will fluctuate about the equilibrium position and, for most
purposes, is unstable. On the other hand, an overdamped system exhibits
slowed movement speed and no oscillation about the equilibrium point.' A
critically damped system is one in which the movement will reach the
equilibrium position in the fastest possible time. Most human muscle joint
systems appear to be damped just under critical (cf. Kelso & Holt, 1980;
Neilson & Neil,Oon, 1978). Neilson and Neilson (1978), for example, found
their normal subjects did not exceed fiye percent of the movement arc in
overshoot during a rapid voluntary movement.
The results of our Experiment 1 conform to the above, figure; overshoot'
was found to be 8.4% of% the total movement arc for all normal subjects'
movements. Different amounts of overshoot may be due to the differences in
the movement. conditions between the present study and that of Neilson and
Neilson (1978). Overshoot was measured ifi the Neilson and Neilson study
following a rapid voluntary movement. In our study, however, overshoot w ,as
measured following unloading durigg which an active halting of the limb was
assumed not to have occurred. It seems reasonable, therefore, to expect some
difference in oveKshoot between the normal subjects in our Study and those in
the Neilson and NAlson (1978) study.' Perhaps the more important finding is
that Down's syndrome subjects, in sharp contrast to normal subjects, appear to
behave in an underdamped manner, as suggested by the 27.4% of overshoot`foUnd
-forth.14146
Although the results of Experiwnt 1 revealed that the torque by joint
angle functions were near-identical for Down's syndrome and normal subjects, a
question remains as to whether both populations can alter the slope of the
functions (specify stiffness) to a similar degree. Following Asatryan and
Fel'dman (1965), one wdy to examine this question is to require subjects'to
tense the muscles voluntarily prior to unloading. "Stiffening" the muscle-
joint system in this manner should reduce the amount of absolute jointangle
change, thus increasing the slope of the torque-joint angle functions. In
Experiment 2, the foregoing strategy was employed to determine whether DoWn's
esyndrome individuals could control stiffness as effectively as normal
subjects.
EXPERIMENT 2
Method
The subjects, methods, and procedures in Experiment 2 were the same as in
Experiment 1 except that subjects were instructed to tense (cocontract) their
muscles in an effort to maintain the joint angle against the perturbation.
Each subject was given some practice prior to the experiment proper to ensure
that the instructions' were understood. In the experimental trials, on
reaching the target angle, subjects were asked to "stiffen their muscles" in
order to maintain the joint angle.
Only four separate unloadings (60%, 25%, 0%, and -10%) were used for
Experiment 2. These four unloadings provided a sufficient description of the
133
139

FIGURE 3. ANGLE CHANGE AS A FUNCTIONOF TORQUE CHANGE
EXPERIMENT 2
134
100
90,
80. NORMAL SUBJECTS-DOWN SYNDROMESUBJECTS
. 70
60
50
40
30
20
10
-10
SERIES SERIES SERIES1 2 3
0
I;
1
I:i
ID
eo
e.
il.
i I : i
95 105 115 125 135 145 155
ANGLE CHANGE (IN DEGREES)
140
165 175

torque by. joint angle function without inducing undue fatigue. For each of
the unloadings, at least four trials were carried out and more than 48 trials
were conducted for each subject..
Data were graphed as in Experiment 1 and analyzed as before using a 2
group) x 3 (series) x 4 (unloadings) analysis of variance with repeated r
measures on the last two factors.
Results
Changes in joint angle under "muscle stiffening" conditions are shown in
Figure 3, for normal and Down's syndrome subjects. Visual inspection of the
figure suggests some potential difference in the torquejoint angle functions
of normal and Down's syndrome subjects. Although overall differences between
the groups just failed to reach significance, F (1,11) = 4.35, k > .05, there
was a significant torque effect, F (3,66) = 69.86, .2 < .001, and group by
torque interaction, F (3,66) = 4.61, P < .01. Inspection of the means shows
that joint angle increases as a function of the magnitude of unloading, and
that this effect is greater for Down's syndrome subjects (see Table 1): The
mean angle changes for each unloading for Down's syndrome subjects were 1.42,
12.40, 23.49, and 29.52 deg and 1.29, 8.08, 14.66, and 17.84 deg for normal
subjects.
A series by torque interaction was also found, F (3,66) = 3.13, 2 < .01.
Ai in Experiment '1, at the higher levels of unloading (the last two in
Experiment 2) the magnitude of angle change increased between series 1 and 2
and between 2 and 3.
There were no significant differences between the groups in the standard
deviation of mean angle change, F (1,11)'= 3.18, 2 > .05. However, there was
a significant torque effect, F (3,66) = 20.62, 2 < .001 and a significant
torque by series interaction, F (6,66) = 4.76, 2 < .001. Variability
increased as-the magnitude of the unloading increased but was significant only
in series 1 and 3.
Representative movement tracings from Down's syndrome and normal subjects
in Experiment 2 are shown in Figure 4. Qualitatively, the movements of the
subjects are similar to those in Experiment 1. Down's syndrome subjects
appeared less capable of reaching and maintaining the target angle (compare
Figures 2 and 4).
Likewise, overshoot or oscillation about tha equilibrium poirt following
unloading was amplified in Down's syndrome subjects (see Table 1) and,was
revealed in a group main effect, F (1,11) = 8.08, P < .05. The mai' effects
of series, F (2,66) = 5.96, 2 < .01 and torque, F (3,66) = 1.82, 2 < .001,
were also significant. Increases in overshoot occurred from series 1 to 2 and
from 2 to 3, and were also evident as the magnitude of unloading in ;ceased.
Increases in overshoot held for each series in Down's syndrome subjc*.i but
not normals, and resulted in a significant group x series interaction, F
(2,66) =.4.39, 2 < .05. Significant group x torque, F (3,66) = 8.3, a < .001,
and series by torque, F (6,66) = 3.95, 2 < .01, interactions were also found.
As the unloading increased, the degree of overshoot increased; this effect was
135
141

L- 'FIGURE 4. TRACINGS OF THE FINGER MOVEMENT
EXPERIMENT 2
A) NORMAL SUBJECTS
KL AND JW
'A.rr-
+ UnloadingScale
120° 1 Sec.I -1
142
B) DOWN SYNDROMESUBJECTS SS AND AC
A
KEY
} Overshoot A = Finger movement
-4- Target angle B = Torque motor tracing
x New equilibrium 4, Start of movement
point + Unloading
Movement direCtion Scale
120° 2 Sec.1--1
.4
% of unloading110% .
t
143

magnified for Down's syndrome subjects and for series and 3 (see Table 1,
Experiment 2).
Discussion
In the second experiment it was demonstrated that Down's syndrome
subjects were able to increase the stiffness parameter voluntarily when askedto tense their muscles against the load change. This capability,is shown bythe increase in slope of the torque by joint angle functions from Experiment 1to Experiment 2 (compare Figures 1 and 3). It is well known that an increasein activation of motoneurons increases the stiffness property of the muscle(Agarwal & Gottlieb, 1977; Andreeva & Shafranova, 1975; Barmack, 1976; Houk,Singer, & Goldman, 1970; Rack, 1969; Safronov, 1970). An increase in
stiffness can occur without an increase in force or without a change in joint
angle.
Normal subjects were also capable of increasing stiffness and apparently
to a somewhat greater extent than Down's syndrome subjects. The mean slopes
of the functions generated in both experiments were 1.77 and 3.56,
respectively, for Down's syndrome subjects and 1.83 and 4.67 for normal
subjects. There was no statistically significant difference between groups onoverall angle change in Experiment 2; however, at higher levels of torque
change, significant differences between groups did exist as revealed in the
significant group by torque interaction.
There were also some noteworthy differences among individual subjects
that warrant some discussion. For example, Down's syndrome subject LM'sstiffness characteristics were closer to that found for normal subjects (see.
Figure 5) and, in fact, exceeded some of the normal subjects. Likewise, one
normal subject, GA, displayed muscle stiffness more aligned to the Down's
*syndrome group than to the normal group (see Figure 5). If these extremes are
excluded from the groups, the difference between Down's syndrome and normal
subjects is magnified. That wide individual differences among subjects exist
within both groups is expected. It is known that stiffness varies between and
within normal individuals (Safronov, 1970). Also, extreme individual
differences among Down's syndrome subjects on a number of psychological and
physical variables have been found (James, 1974; LaVeck & Brehm, 1978). It
can be reasoned that stiffness, as with many other variables, operates on a
continuum rather than strictly dichotomizing the populations observed.
Finally, there is some indirect evidence that suggests Down's syndrome
subjects have reduced capacity of muscle activation that might be associated
with the ability to regulate muscle stiffness. Most Down's syndrome infants
are deficient in the amino acid 5-hydroxytryptophan (Coleman, 1973; Koch & de
la Cruz, 1975),' which is thought to play an important role in neural
transmission (McCoy, Segal, & Strynadka, 1975) and muscle contraction (Ahlman,
Grinner, & Udo, 1971) The,finding that:Down's syndrome subjects have slower
movement response times (Lange, 1970) may support the idea that Down's
syndrome subjects are less able to activate their muscles.. If, as some have
claimed (cf. Lestienne, Polit, & Bizzi, 1980), integrated electromyography
reflects a2tive stiffness in muscles, then it seems worthwhile to subject the
foregoing speculations regarding stiffness to further experimental test.
137
144.

FIGURE 5. ANGLE CHANGE AS A FUNCTIONOF TORQUE CHANGE
A) DOWN SYNDROME SUBJECT LM
100 -
90 a
80-
70 a
60 a
50 -
40
30
20
10
U
-10
95
EXPERIMENT 1
EXPERIMENT 2
SERIES SERIES SERIES1 2 3
r----1105 115 125 135 145 155 165 175
ANGLE CHANGE (IN DEGREES)
145
100 a
90 a
80 a
70 a
60 a
50 -
40-
30 i20 -
10-
0 -
-10
B ) NORMAL SUBJECT GA
EXPERIMENT 1
EXPERIMENT 2 .
SERIES SERIES SERIES1 2 3
t95 105 11I5 1215 : 135 45 155
ANGLE CHANGE (IN DEGREES)
146
,165 175

GENERAL DISCUSSION
A major finding in this study is that the gross underlying organization
of motor control in Down's syndrome subjects is qualitatively similar tonormal subjects and can be described, to a first approximation, in terms of a
vibratory system. We have found that the torque by joint angle curves,described as invariant characteristics of the system by Asatryan and Fel'dman(1965) (see also Fel'dman, 1980a, 1980b), are obtainable from Down's syndromesubjects under two conditions of maintaining a steady joint angle against aload. In one condition the subjects did not voluntarily intervene duringpartial unloading. In the other condition the subjects voluntarily tensedtheir muscles, which resulted in an increase in the active stiffness of thesystem. The Importance of obtaining the invariant characteristics (static
muscle torque versus angle) in this special Down's syndrome population is
magnified by the recent findings of Fel'dman (1980a, 1980b). With normal
subjects, Feldman has shown that the Invariant Ch7racteristic (IC) may
haracterize the behavior, of musclejoint systems not only during the
maintenance 'of a steady posture (Asatryan & Fel'dman, '065) but also during
rh thmic (Felidipn, 1980a) and discrete movements (Fel'dman, ,1980b). For
exa le, in order to maintain a steady angle against changing loads, the
syst-u' need only shift from one IC to another. Referring to Figure 1, it can
be se that in order to maintain a 150 deg joint angle against a 60% load,
the IC of series,14is used. In order to maintain the 150'deg angle when theload changes to 25%, a shift from the IC of series 1.to the IC of series 2 isrequired." This transition from one IC to another appears to be effectedthrough a change of the threshold angle at which motor units are recruited(Fel'dman, 1966a, 1980b; see also Crago, Houk, &.Hasan, 1976).
By the same token, movements may be accomplished by shifts along the form
of the invariant characteristics, that is, by shifts of the equilibrium point
of the muscle load system and by changes in the form of the IC (Fel'dman,
1974a, 1974b). The latter is shown by the set of ICs obtained in Experiment 1
(Figure 1) and the set obtained in Experiment 2 (Figure 3). Through
cocontraction of the antagonist muscles, 'the stiffness of the muscle load
system may be increased and this is associated with increases in slope of the
IC. It may be assumed that during movement, transformation from one set ofcurves to another is possible (Fel'dman,11980a, 1980b). Thus, movements may
be achieved ;through simple changes in the parameters of the muscleload
syStem. According' to this view, amplitude of movement (position) may beregulated through changes in zero length, and velocity and acceleration
through changes in stiffness (cf. Kelso & Holt, 1980).
A cautionary point worth emphasizing here is that the majority of
experiments (including ours), and their consequent interpretation, deal with
movements in a very restrained environment (e.g., sitting down with shoulder
or wrist poSition fixed). New data reveal that the pattern of stiffnesschanges at a joint (say, the arm) is mutable, depending in a significant way
on the postural status of the subject (Nashnet, Note 2). Some modification
(or even rejection) of the type of model proposed here for rather fixedactions at a joint may well be in order when more reallife situations are
examined (e.g., a standing subject supported to varying degrees).
139
14'7

Although there appear to be overall similarities in the gross
organization of motor control of Down's syndrome and normal subjects, thereare notable differences in the precision with which Down's syndrome subjectsattain target positions (see Figures 2 and 4). As shown by individualmovement tracings and subsequent analysis, the movement patterns were
qualitatively different between Down's syndrome and normal subjects in bothExperiments 1 and 2. The findings here are consistent with other studies thatshow Down's syndrome subjects to be less accurate in controlling movementsthan their normal peers (e.g., Davis & Kelso, Note 1).
Relatedly, and perhaps most important, Down's syndrome subjects differedfrom their normal peers in oscillatory behavior about the newly establishedequilibrium position (i.e., following unloading, see Figures 2 and 4).
Oscillatory behavior is taken as an index of the damping parameter. As
previously noted, the finding that underdamping characterizes the muscle -jointsystem of Down's syndrome subjects is consistent'with the finding that thesesubjects are less accurate in movement than normal subjects. It is the
underdamping characteristic, in addition to stiffness, that may distinguishDown's syndrome from normal subjects. In this regard, it is important to notethat although individual subjects 'GA (normal) and LM (Down's syndrome) were
unlike their respective groups with respect to stiffness, they did not deviatefror group performance cn measures of damping. Mean overshoot for GA was 2.56deg compared to the overall mean of 2.2 for the normal group. Likewise the
means for LM and the Down's syndrome group were 9.35 and 9.J1, respectively.
It is not known whether Down's syndrome subjects are able to modify thedamping parameter through training. Other studies have suggested that normal
subjects can be Lrained to regulate damping during voluntary movement (e.g.,Neilson & Lance, 1978). But further investigations are needed to determine towhat extent Down's syndrome subjects have this capacity. .;
Overall, a number of findings concerning the motor control of Down's°
syndrome subjects are provided in this study and several avenues of researchare suggested. We found_ that the Down's syndrome subjects in this study arenot readily distinguishable from normal subjects in terms of gross movementorganization; systematic torque by joint angle functions were obtained forboth groups. Apparently, muscles are constrained to act as a unit in bothnormal and Down's syndrome subjects and this unit exhibits behavior--tofirst approximation--qualitatively similar to a mass-spring system (cf. Kelso,
Holt, Kugler, & Turvey, 1980,"for review). Where the groups differ, however,
is in.the specification of stiffness, especially at high values of torqueunloading and in the damping characteristic. It is interesting in this regard
that a recent analog model--similar to the one under ,:onsideration here- -characterizes hypotonia in terms of decreases in resting stiffness (Cooke,
1980). If our interpretation is reasonable, we may advance the hypothesis
that it is a deficiency in setting damping and stiffness parameters that bestcharacterizes the motor, behavior of people with Down's syndrome--at least insimple, discrete movements. This view promotes a trend away from more
descriptive terms, like hypotonia, that have been used np,to now.
140
14;

I'
1
REFERENCE NOTES
,
Ahlman, H., Grillner, S., & Udo, M. The effect of 5-HTP on the static
postural task. Biophysics', 1965, 10, 925-935.Barmack,. N. H. Measurements of stiffness of extraocular muscle of theyabbit.
Bizzi; E. Central .and peripheral mechanisms in motor control. In
Bizzi, E., 'Dev, P.,' Morasso, P., & Polit, A. Effects of load disturbance
Agarwal, G. C., & Gottlieb, G. L. Oscillation of the human' ankle joint in
Andreeva, E. A., & Shafranova, E. I. Muscular activity control, systems for
Asatryan, D. G., & Fel'dman, A. G.' Functional tuning of the 'nervous system.
Berkson, G. An analysis.of reaction time in normal and mentally deficient
2.
1.
fusimotor activity and the tonic stretch reflex of an extensor musoke.
., Brain Research, 1971, 27, 393-396.
,
subjects. Unpublished study, Haskins Laboratories, 1479..
February, 1981.
Davis, W. E. & Kelso, J. A. S. Limb, localization in Down's syndrome
Nashnar, L. M. Central and peripheral components of a mode? for the
coordination of balance. Paper presented at the Sloane Foundation Confer-ence on Coordination of Action, University .of California; San Diego,
41, 542-556.
Journal of Mental Deficiency Research, 1960,.4, 69-77:
G. E. Stelmach & J., Requin (Eds.), TUtorials in motor behavior.
during centrally initiated movements. Journal of Neurophysiology_, 1978,
with control of movement or maintenance of a steady posture - I.
Mechanographic analysis-on- the work of the joint on execution of a
Journal of Neurophysiology, 1976, 39, 1009-1019.
Amsterdam: North-Holland Publishing Company,.1980.
Physiology, 1977, 268, 151-176.
young men, III. Variation of stimulus and of response complexity.
response to applied sinusoidal torque on the foot. Journal , of
Parkinson's_ disease. Automation and Remote Control, 1975, 36, 596-605.
Air
..,....
REFERENCES
.
Bizzi, E., Polit, A., & Morasso, P. Mechanisms underlying achiciyement of
final head position. Journal of Neurophysiology, 1976, 39, 435-444.
Brooks, V. B. Some examples of programmed limb movements. Brain Research,
1974, 71, 299-308.Coleman, M. Serotonin in Down syndrome. New York: American Elsevier
Publishing Company, 1973.
Cooke, J. D. - The organization of simple, skilled movements. In
G. E. Stelmach & J. Requin (Eds.), Tutorials in motor behavior.
Amsterdam: North-Holland Publishing ,:ompany, 1980.
Cowie, V. A. A study of the early development of Mongols. Oxford: Pergamon
Press, 1970.Crago, P. E., Houk, J. C., & Hasan, Z. Regulatory action of the human stretch
reflex. Journal of Neurophysiology, 176',' 39, 925-935. ,
Fel'dman, .A. G. Functional tuning of the nervous system .with control' of
movement or maintenance of a steady posture-II: Controllable parameters
of the muscle. Biophysics, 1966, 11, 766-775. (a)
Fel)dman, A. G. Functional tuning of the nervous system with control ofmovementor maintenance of a steady posture-III. Mechanographic analysis
141
14)

of execution by man of the simplest motor-tasks. .Biophysics, 1966f 41,
766 -775. (b)
FeDdian, A. G. Changes in the length of the muscle as a consequence of ashift in equilibrium in the muscle-load system. Biophysics, 1974, 19,
534-538. (a)
Fel'dmail, A. G. Control in the length of a muscle. Biophysics, 1974, 19,
766-711. (b)
Fel'dman, A. G. -Superposition of motor li-ograms.)
I. Rhythmic forearm move-
, ments in man. Neuroscience, 1980, 5, 81-90. (a)
Feldman, A. G. Superposition of motor programs--II. Rapid forearm flexion,in man. Neuroscience, 1980, 5, 91-95. (b)
Frith, U., & Frith, C. D. Specific motor disabilities in Down syndrome.-Journal of Child Psychology and Psychiatry, 1974, 15, 293-301.
Houk, J. D. Participation of reflex mechanisms and reaction time processes in
compensatory adjustments to mechanical disturbances. In, Je Desmedt(Ed.), Cerebral motor control In man: Long loop mechanisms. Basel:
karger, 1978.
Houk, J. C., Singer, J. J., & Goldman, M. R. 46 evaluation of length andforce feedback to soleus muscle of decerebrate cats. Journal of
Neurophysiology, 1970, 33, 784-811,
James, R. J. Multivariate analysis of the walking behavior in
institutionalized Downrs syndrome males. Unpublished doctoral disserta-
tion, 4)niversity of Wisconsin, 1974.
Kelso, J. A..S. Motor control mechanisms underlying human movement reproduc-tion. Journal of Experimental Psychology, 1977, 8, 429-443.
Kelso, J. A. S., & Holt, K. G. Explofing a vibratory systems analysis of
human movement prodiction. Journal of Neurophysiology, 1980, 43, 1183-
1196,Kelso, J..A. S., Holt.K. G., & Flatt, A. E. The role of proprioception in
the perception and control of hunTn movement: Toward a theoretical
reassessment. Perception & Psychophysics, 1980, 28, 45-52.Kelso, J. A. S., Holt, K. G., Kugler, P. N., & Turvey, M. T., On the concept
of coordinative structure as dissipative ptructure--II. Empirical lines
of convergence. In G. E- Stelmach & J. Requin (Eds.), Tutorials-in motor
behavior. Amsterdam: N1Srth Holland, 1980.
Knight, R. M., Atkinson, B! R., & Hyman, J. A. Tactual discrimination andmotor skills in mongoloid and non-mongoloid retarded and normal children.
American.Journal of Mental Deficiency, 1967, 71, 894-900.
Koch, R., &. de la Cruz, F. F. Down's syndrome (Mongolism): Research,
prevention and management. New York: Brunner/Mazel, 1975.
Lange, E. K. A comparison of the response times of mongoloid children and
normal children. Unpublished doctoral dissertation, University of New
Mexico, 1970.LaVeck, B., & Brehm, S. S. Individual variation among children with Down
syndrome. Mental Retardation, 1978, 16, 135-137.
Lestienne, F., Polit, A., & Bizzi, E. From movement to posture. Ins
C. H. Nadeau, K. M. Newell, G. C. Roberts, & H. 1!. Halliwell (Eds.), The
skillfulness in movement: Theory and application. Champaign, Ill.:
Human Kinetics Press, 1980.McCoy, E. E., Segal, D. J., & Strynadka, I. Decreased ATPase; increased NA+
and decreased K+ in Down's syndrome platelets. In R. Koch & F. F. de .a
Cruz (Eds.), Down's syndrome (Mongolism): Research, prevention, and
management. New York: Brunner/Mazel, 1975.
14215 0

D.,Neilson, P. D., & Lance, J, W. Reflex transmission characteristics during
voluntary activity in normal man and patients with movement disorders.
do J. E. Desmedt- (Ed.), Cerebral motor control 'in man: Long loop
mechanisms: Progress in clinical neUrophysiology (Vol. 4). Karger:
Basel, 1978.Neilson, P. D., & Neilson, M. D. The role of action reflexes in the damping
of mechanical oscillations. Brain Research, 1978, 142, 439-453.Owens, D., Dawson, J. C., & Losin, S. Alzheimer's disease in Down's 'syndrome.
American Journal of Mental Deficiency, 1971, 75, 606-612.
'Pont, A., & Bizzi, E. Processes controlling arm movements in monkeys.
Science, 1978, 201, 1235-1237.Rack, P. M. H. The significance of mechanical properties of muscle in the
reflex control of posture. In P. Anderson & A. K. S. Jansen (Eds.),
Excitatory synaptic mechanisms. Bergen, Tromio: Universitetsforlaget,
Oslo,, 1969.Safronov, V. A. Problem of the regulation of muecle"tone.- Biophysics, 1970,
15, 1145-1154.
Schmidt, R. A., & McGown, C. Terminal accuracy of unexpectedly_ loaded rapid
movements: Evidence for a mass-spring mechanism in programming. Journal
of Motor Behavior, 1980, 12, 149-161.
Turvey, M. T. Preliminaries to a theory of action with reference to vision.
In R. Shaw & J. Bransford (Eds.), Perceiving, acting-and knowing: Toward
in ecological psychology. Hillsdale, N.J.: Erlbaum, 1977.
von Bertalanffy, L. General system theora. London: Penguin University
Books, 1973.Wine, R. L. Statistics for scientists and enjineers. Englewoo'3 Cliffs, N.J.:
Prentice-Hall, Inc.,,1964.
FOOTNOTES
1Note that equifinality can be disrupted in deafferented but not normal
:animals when the postural relations between an.Latal and apparatus are changed
(Polit &, Bizzi, 1978). When the latter are fixed, however, deafferented
monkeys and functionally deafferented humans (Kelso & Holt, 1980; Kelso, Holt,
& Flatt, 1980) exhibit equifinality when the initial position of the limb is
altered unexpectedly.
143
15;

PERIODICITY AND AUDITORY MEMORY: A PILOT STUDY
Janet May and Bruno H. Repp
Abstract. Band-limited periodic and aperiodic nonspeech stimuli
varying in center frequency but having similar spectral envelopeswere presented in same-different tasks at two interstimulus inter-vals (.5 and 2 sec). Discriminability decreased as a function ofinterval, but there was no difference between the types of stimuli,suggesting that periodic and aperiodic stimuli are equally wellretained° in auditory memory.
Studies of categorical , perception have sometimes found unexplained
differences between stimulus sets. For example, May '(1979) tested Egyptianlisteners' discrimination of vowel-fricative-vowel syllables drawn from con-tinua spanning two Arabic fricative contrasts,,/^ -S/ and /x -i%/, that differfrom each other only in voicing, having equivalent places of articulation.The SUblects in that study found the stimuli from the voiced fricativecontinuum easier to discriminate than those from the voiceless continuum.Although the two continua differed along several acoustic dimensions, the mostconspicuous of these was the periodicity present during the fricatiPn portionsof,the,voiced continuum and absent on the voiceless continuum. The stimuli of
another recent study of categorical perception (Healy & Repp, 1982) included
vowels from an /i-I/ continuum and isolated fricative noises from a /s-j/
continuum. When- listeners were asked to categorize stimuli from either
continuum presented in pairs, the contrastive effect exerted by one member of
the pair on the labeling of the other member was much larger for vowels than
for fricative noises, even when differences in discriminability were takeninto account. Once again, presence versus absence of periodicity seemed themost salient feature distinguishing the two types of stimuli, althdugh there
were several other differences as well.
At least two reasons could be proposed why periodicity might make a
difference in auditory memP-y. On one hand, it seems possible that the
recurrence of signal, portions with similar structure--i.e., of the successive
pitch periods-=strengthens the auditory trace, in the way repetitions of a
stimulus generally do. According to this hypothesis, the auditory traces of
aperiodic stimuli would not have the benefit of such reinforcement- y-
repetition and, therefore, would be-weaker then those of periodic stimuli. On
the other hand, the repetitive structure of periodic stimuli may also be seen
as a disadvantage. Aperiodic stimuli, by virtue of their randomly changing
waveform, may have more idiosyncratic features to be remembered by, and
therefore may enjoy an advantage in auditory memory. These hypotheses may be
Acknowledgment. This research was supported by NICHD Grant HD01994 and BRS
Grant RR05596.
[HASKINS LABORATORIES: Status Report on Speech Research SR-69 (1982)]
145
152

called the engraving hypothesis and the redundancy hypothesis, respectively.Of course, both hypotheses could easily be wrong, and there may be no
difference at all between periodic and aperiodic stimuli in memory. In that
case, the differences between different stimulus sets in the studies citedabove must have rested on stimulus properties other than periodicity.
We conducted a pilot study to compare stimuli that differ only iri the
presence versus absence of periodicity and are matched in all other respects.For that purpose, we generated band-limited complex nonspeech sounds by
exciting the second-formant filter of a parallel-resonance speech synthesizerwith either a periodic or an aperiodic source. The resulting stimuli werewell matched in spectral shape and amplitude. The center frequency of theformant was varied in several steps, and the stimuli were presented in a
fixed-standard same-different pitch discrimination task at two different
interstimulus intervals. Differences between the two stimulus sets could
emerge either as a difference in overall discrimination accuracy or as a
difference in the effect of increasing the interstimulus interval (i.e., in
the decay rate of auditory memory).1
Method
Subjects. The subjects were paid volunteers recruited by advertisementson Yale campus. After a number of them had been tested, it became eviaent
that several listeners made hardly any errors. These listeners (4 in all)
were replaced with new subjects until a total of 12 had been run.
Stimuli. The stimuli were generated on the Haskins Laboratories parallel
resonance synthesizer. Only the second-formant circuit was used. v For the
periodic stimuli, the "buzz" source was employed, and for the aperiodic
stimuli, the "hiss" source. The fundamental frequency of the buzz was 100 Hz.
Each set c,nc,ained five stimuli with different center frequencies; nominally,
they were 1611, 1688, 1764, 1840, and 1917 Hz. The nominal bandwidth was 90
Hz. To control for possible idiosyncrasies of the aperiodic stimuli due to
the random noise source, three different tokens of each of the five aperiodic
stimuli were synthesized. Amplitude parameters were set so as to yield equal
amplitudes for periodic and aperiodic stimuli at output.
All stimuli were synthesized at a duration of 65 msec. Subsequently,
they were digitized at 10 kHz using the Haskins Laboratories pulse code
modulation system. The digitized waveforms were trimmed to a duration of 50
msec. This was done to eliminate artifacts at stimulus onset produced by
starting the synthesizer at full amplitude. The periodic stimuli were reduced
by eliminating the first pitch period and a portion from the end, so that
exactly 5 complete, equal-amplitude pitch periods remained. The aperiodic
stimuli were cut at corresponding points. To avoid transients, all cuts were
made at the nearest zero-crossing.
Before recording the experimental tapes, the stimuli were analyzed using
both standard spectrograms and spectral cross-sections generated by a Federal
Scientific UA-6A spectrum analyzer. The spectral envelopes of periodic and
aperiodic stimuli with the same center frequency were closely matched. We
noted that the actual center frequencies did not always match the intended
ones, but these discrepancies (which may have been due, in part, to inaccuracy
146
153
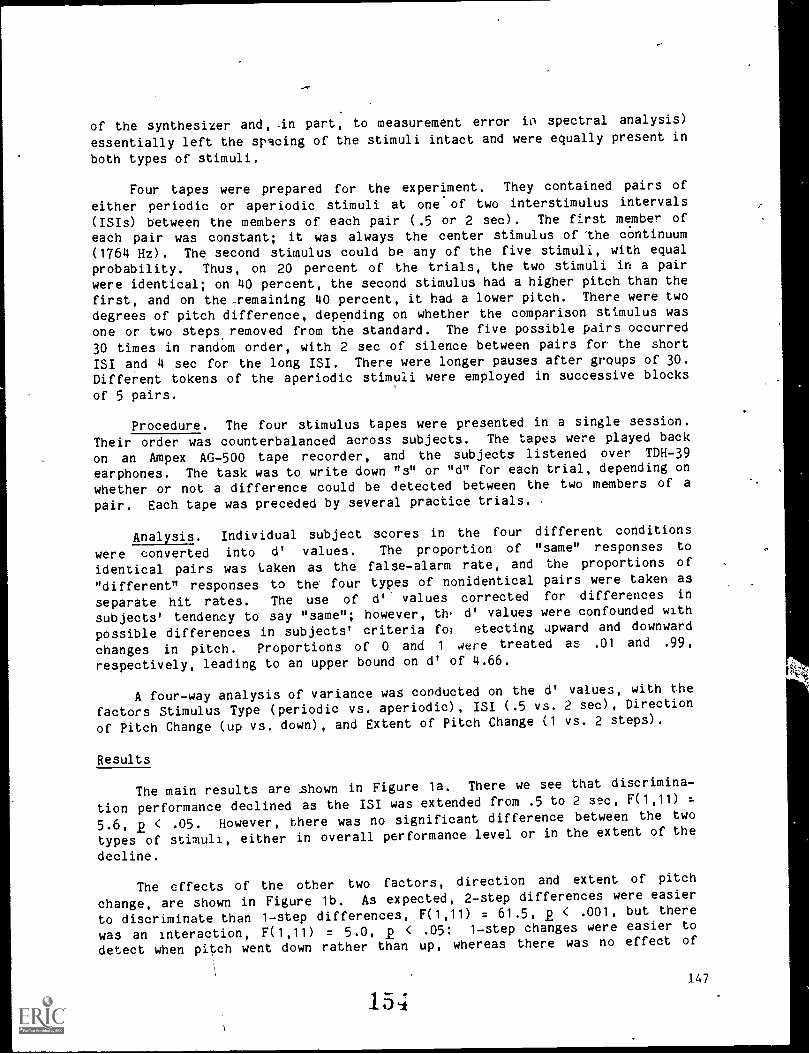
of the synthesizer and, n part, to measurement error io spectral analysis)
essentially left the spacing of the stimuli intact and were equally present in
both types of stimuli.
Four tapes were prepared for the experiment. They contained pairs of
either periodic or aperiodic stimuli at one-of two interstimulus intervals
(ISIs) between the members of each pair (.5 or 2 sec). The first member of
each pair was constant; it was always the center stimulus of 'the continuum
(1764 Hz). The second stimulus could be any of the five stimuli, with equalprobability. Thus, on 20 percent of the trials, the two stimuli in a pairwere identical; on 40 percent, the second stimulus had a higher pitch than the
first, and on the,. emaining 40 percent, it had a lower pitch. There were two
degrees of pitch difference, depending on whether the comparison stimulus wasone or two steps removed from the standard. The five possible pairs occurred
30 times in random order, with 2 sec of silence between pairs for the short
ISI and 4 sec for the long ISI. There were longer pauses after groups of 30.
Different tokens of the aperiodic stimuli were employed in successive blocks
of 5 pairs.
Procedure. The four stimulus tapes were presented in a single session.
Their order was counterbalanced across subjects. The tapes were played back
on an Ampex AG-500 tape recorder, and the subjects listened over TDH-39
earphones. The task was to write down "s" or "d" for each trial, depending on
whether or not a difference could be detected between the two members of a
pair. Each tape was preceded by several practice trials.
Analysis. Individual subject scores in the four different conditions
were converted into d' values. The proportion of "same" responses to
identical pairs was taken as the falsealarm rate, and the proportions of
"different" responses to the four types of nonidentical pairs were taken as
separate hit rates. The use of d' values corrected for differences in
subjects' tendency to say "same"; however, th, d' values were confounded with
possible differences in subjects' criteria for etecting upward and downward
changes in pitch. Proportions of 0 and 1 were treated as .01 and .99,
respectively, leading to an upper bound on d' of 4.66.
A fourway analysis of variance was conducted on the d' values, with the
factors Stimulus Type (periodic vs. aperiodic), ISI (.5 vs. 2 sec), Direction
of Pitch Change (up vs. down), and Extent of Pitch Change (1 vs. 2 steps).
Results
The main results are shown in Figure la. There we see that discrimina
tion performance declined as the ISI was extended from .5 to 2 sec, F(1,11)
5.6, 2 < .05. However, there was no significant difference between the two
types of stimuli, either in overall performance level or in the extent of the
decline.
The effects of the other two factors, direction and extent of pitch
change, are shown in Figure lb. As expected, 2step differences were easier
to discriminate than 1step differences, F(1,11) = 61.5, 2 < .001, but there
was an interaction, F(1,11) = 5.0, 2 < .05: 1step changes were easier to
detect when pitch went down rather than up, whereas there was no effect of
147
154..±

3.4-
3.0-d/
2.6-
(a)
periodic10 Periodic
1Ef-.111
/ DownUp
.5 2 1 2
181 (sec) STEP SIZEFigure 1. (a) Effect of ISI on memory for periodic and aperiodic stimuli.
(b) Effects of magnitude (in steps) and direction of change onpitch discrimination.
155

direction in 2step changes. This interaction may, in part, derive from a
ceiling effect for 2step pairs. The main effect of direction fell short of
siG.lificance, F(1,11) = 4.5, P > .05. Note that better discrimipation ofdownward changes&would be expected on the basis of Weber's law.
One additional effect was significant in the analysis of variance. This
was tf-A threeway interaction between Stimulus Type, ISI, and Direction ofChange, F(1,11) = 5.0, 2 < .05. The performance decline with ISI was largerfor downward than for upward changes in aperiodic stimuli, but larger forupward than for downward changes in periodic stimuli. The reason for thispattern is not clear.
Discussion
Our results suggest that periodic and aperiodic stimuli are about equallywell retained in auditory memory. However, we cannot prove the null hypothesis. It is possible that our experimental design did not provide the bestopportunity for differences between the two types of,stimuli to emerge. At
least three reasons could be envisioned. First, the stimuli were relativelyeasy to discriminate--so much so that the best subjects had to be replaced.
Thus, the data derive only from subjects with average or belowaveragediscriminatory capabilities--an undesirable state of affairs. Second, the
stimuli were rather brief, 'and it may be argued that their duration was too
short for any specific advantage of periodic stimuli to arise. In other
words, five pitch periods may not be enough to produce a sufficient amount ofreinforcementthroughrepetition, the process assumed by the "engraving hypothesis." Third, by using a fixedstandard paradigm, we may have reduced thesubjects' reliance on auditory memory. In principle, subjects could haveadopted the strategy of ignoring the standard altogether (i.e., by relying ona longterm memory representation of it) and of arriving at a "samedifferent"
decision by an absolute judgment of the comparisod stimulus. That this
strategy was not used exclusively is suggested'by the significant effect ofincreasing the ISI-. Nevertheless, it may well be true that we did not forcethe listeners sufficiently to rely on auditory memory.
Thus, our pilot study did not put the engraving/redundancy hypotheses toa very strong test, and further research will be neceszary to decide whether
either of them has any validity. However, before further experiments areundertaken, we should perhaps wait for a more compelling reason to expect any
effect of periodicity on auditory memory. . The present results have not
increased our confidence that such effects exist.
REFERENCES
Healy, A. F., & Repp, B. H. Context sensitivity and phonetic mediation in
categorical perception. Journal of Experimental Psychology: Human
Perception and Performance, 1982, 8, 68-80.May, J. The perception of Egyptian Arabic fricatives. Unpublished doctoral
dissertation, University of Connecticut, 1979.
149
1 '5 6

READING SKILL AND LANGUAGE SKILL
Virginia A. Mann+
Abstract. To learn to read is to acquire a visual language skill
that systematically maps onto extant spoken language skills. Some
children perform this task quite adeptly, while others encountermuch difficulty, and it has become a question of both scientific andpractical merit to ask why there exists such a range of success inlearning to read. Obviously, learning to read places a complex
burden on many emerging capacities, and in principle, at least,
reading disability could arise at any level from genera' cogniticnto visual perception. Yet since reading is parasitic on spoken
language, the possibility also exists that reading disability isderived from some subtle difficulty in the language domain. In this
article, my intent is to review some of the many studies that haveexplored the association between reading skill and spoken language
skill. These reveal that when certain spoken-language skills ofgood and poor beginning readers are critically examined, consider-
ably many, though perhaps not all, poor readers prove to possesssubtle deficiencies that correlate with their problems in learning
to read.
LINGUISTIC SHORT-TERM MEMORY DIFFERENTIATES
GOOD AND POOR BEGINNING hEADERS
One of the more compelling reasons to view reading defidiency as the
derivative of a language deficiency is that success at learning to read is
associated with the adequacy of certain linguistic short-term memory skills.
In our work at Haskins Laboratories, my colleagues and I have found clear
indications of this association in a varietytof different studies of good and
poor beginning readers. For the moment, however, let me put aside a
discussion of those studies in order to consider first the short-term storage
requirements of normal language processing, and to summarize some recent
findings as to how these requirements are met by the mature language user.
These considerations pertain to both written and spoken language and provide a
+Also Bryn Mawr College.
Acknowledgment. Much of the work described in this paper, along with
preparation of the manuscript itself, was supported by NICHD Grant HD-01994
and BRS Grant RR-05596 to Haskins Laboratories. I am grateful to the many
members of the reading research group at Haskins, particularly to Isabelle
Liberman and Donald Shankweiler for their comments on earlier drafts of this
paper, and to Alvin Liberman and Ignatius Mattingly for their insights into
the psychology of language.
[HASKINS LABORATORIES: Status Report on Speech Research SR-69 (1982))
157
151

necessary introduction to any discussion of linguistic short-term memory among,beginning readers.
An adequate short-term memory is essential to language comprehensionsimply because the component words of a phrase or sentence must often be held
temporarily, pending extraction of the meaning of the whole phrase or sentence(Baddeley, 1978). It is for precisely this reason that many current models ofsentence processing explicitly include some form of short-term memory bufferas a part of their parsing device (cf. Frazier & Fodor, 1978; Kimball, 1975;Marcus, 1980). Some consideration has been given to the form of memoryrepresentation that mediates human parsing. Current psychological theory hasit that some level of phonetic representation is likely to be involved, thisbeing an abstract representation of the articulatory gestures that constitutethe material being parsed (Liberman, Mattingly, & TurVey, 1972). There aremany experimental findings to corroborate this view. On the one hand, adultsubjects have given evidence of relying on phonetic representation whileperforming such ecologically invalid tasks as recalling a string of ietters ora string of words (Conrad, 1964; Drewnowski, 1980). More importantly, thereis evidence that phonetic representation is also involved during comprehensionof both written and spoken sentences (cf. Baddeley, 1978; Daneman & Carpenter,1980; Kleiman, 1975; Levy, 1977; Slowiaczek & Clifton, 1980; Tzeng, Hung, &Wang, 1977).
It is, of course, not inconceivable that, in reading, some nonlingni.5tic
representation of written words might be employed in lieu of a phonetic one(cf: Kleiman, 1975; Meyer, Schvaneveldt, & Ruddy, 1974). There is, after all,much evidence to suggest that access to the mental lexicon for printed wordsmay not necessarily require reliance on phonetic representation (cf. Baron,1973; Kleiman, 1975; Meyer et al., 1974). Nonetheless, it is important toemphasize that reading typically involves more than mere lexical access alone.A successful reader must often go beyond the lexicon and place reliance on thegrammatical structure of the material being read. In contrast to experimentsinvolving lexical-access, those experiments concerned with reading situationswhere, sentence structure is at stake have consistently given evidence of theinvolvement of phonetic representation (Daneman & Crpenter, 1980; Kleiman,1975; Levy, 1977; Slowiaczek & Clifton, 1980). Even readers of Chinese
logography, an orthography in which access to the lexicon is necessarilymediated by non-phonetic representation, appear to make use of phoneticrepresentation when their task involves recovering the meaning of written`sentences and not simply words alone (Tzeng et al., 1977).
For adult subjects, phonetic representation is clearly involved in bothwritten and oral language comprehension. Having made this point, let mereturn to the primary concern of this paper, which is a review of some recentstudies of good and poor beginning readers. Th'ese provide another form ofsupport for the involvement of phonetic representation in all languageprocessing, by revealing that effective use of phonetic representation isassociated with, and may even presage success in, learning to read. I intendto review some of the many findings that support this conclusion; however, itmight be useful first to provide some basic inforpption about the populationof beginning readers,whom my colleagues and I have studied, since they haveprovided much of the data to which I will refer.
152 153

Most frequently our subjects have been first, second, and third graders
who attend public schools. All of them are native speakers of English whosuffer front no known neurological impairment. They are identified by their
teachers as being "good," "average," or "poor" readers, a status that weconfirm by administering standard reading tests to each child (typically the
Word Attack and Word Recognition Subtests of the Woodcock Reading MasteryTests, Woodcock, 1973; or the Word Recognition Subtests of the Wide RangeAchievement Test, Jastak, Bijou, & Jastak, 1965). Administration of these
tests has typically revealed the "good" readers'to be reading at a level oneor more years above their grade placement, whereas the "average" readers arereading at a level between one year above and one-half year below placement.The "poor" readers tend to be reading at a level one-half year or more belowgrade placement. Aside from administering standard reading tests, we have
also usually given our subjects intelligence tests (either the Peabody PictureVocabulary Test, Dunn, 1959; or the Slosson Intelligence Test for children,
Slosson, 1963; or the WISC-R), and have excluded those children in either
reading group who score below 90 or above 145.
One of the more general findings to emerge from our work is that good and
poor readers may differ in temporary memory for some types of material, but
not for other types (Katz', Shankweiler, & Liberman, in press; Liberman, Mann,
Shankweiler, & Werfelman, in press; Mann & Liberman, in press). An example of
this trend may be seen in the results of a study that assessed recognition
memory skill among good and poor beginning readers (Liberman et al., in
press). The subjects were second graders who differed in reading ability, but
not in mean age or mean IQ. They participated in an experiment that employed
the recurring recognition memory paradigm of Kimura (1963) as a means of
evaluating memory for several different types of material. The material we
studied included two /ion-linguistic materials--photographs Of unfamiliar faces
and nonsense "doodle" draWings--and one linguistic material--printed nonsense
syllables. For each of these, the children inspected a set ofstimuli and
proceeded to indicate any of the inspection items that recurred in a
subsequent recognition set. As may be seen in Figure 1, the poor readers were
equivalent to the good readers in memory for faces and even somewhat better
than the good readers (although not significantly so) in memory for the
nonsense drawings. However, they were significantly inferior to good readers
in memory for the nonsense syllables. Thus there is an interaction between
reading ability and the type of item being remembered;, an interaction that
prevailed in an analysis of covariance adjusting for any effects of age or IQ
differences.
Clearly, this experiment cannot support a conclusion that poor readers
suffer from some general memory difficulty. Rather, they appear deficient
only in the ability to remember linguistic material. Many findings that
concern short-term memory lend further support to this conclusion. Good
readers typically surpass poor readers in short-term memory for printed
strings of letters or printed words (cf. Shankweiler, Liberman, Mark, Fowler,
& Fischer, 1979;" Mark, Shankweiler, Liberman, & Fowler, 1977) as well as for
printed nonsense syllables. However, good readers also excel at recall of
spoken strings of letters (Shankweiler et al., 1979), spoken strings of words
(Bauer, 1977; Byrne & Shea, 1979; Katz & Deutsch, 1964; Mann, Liberman, &
Shankweiler. 1980; Mann & Liberman, in press), and even spoken sentences (Mann
et al., 1980; Perfetti & Goldman, 1976; Wiig & Roach, 1975; Weinstein &
153
15i

co 100wa)z0,cL 90wcc
I-0w 80cccc00u_ 700w0<1 60zw0ccw.0_ 50
0 OM MEIN OE IMO EL LE IPA
1110.111111111111111.111.11.11.111111111111.1.
iiP GOOD READERSo...0 POOR READERS
NonsenseDesigns
Figure 1. Good and poor readers'nonsense designs, faces,
Faces NonsenseSyllables
mean percentage of correct responses onand nonsense syllables.
I 0

Rabinovitch, 1971). At this point it is important to note that, since the
advantage of good readers holds for both written and spoken material, it must
extend beyond processes involved in reading, as such, to the br'oader realm of
language processing.
To account for the linguistic memory distinctions between good and poor
readers, some of my colleagues (Liberman & Shankweiler, 1979; Shankweiler et
al., 1979) offered the hypothesis that poor readers have some difficulty that
specifically compromises effective use of phonetic representation. Therefore,
they used a modification of Conrad's (1964) procedure for examining the
involvement of phonetic representation in memory for written letter strings,
to test a group of good, average, and poor readers from a second-grade
population that was homogeneous 'with respect to age and IQ. As was the case
in Conrad's procedure, the children were asked to recall strings of five
consonants that were of two basic types.oAHalf of the strings were composed of
consonants with phonetically Confusable (i.e., rhyming) names, -whereas the
other half contained letters with phonetically nonconfusable (i.e., nonrhym-
ing) names. During testing,the children saw a letter string with all of itsletters printed in upper case on a single line in the center of the visual
field. After a three-sec inspection period, when the letters could no-longer v
be seen, they wrote down any letters that could be remembered, preserving the
_
sequence as closely as pdssible.
On the basis of Conrad's findings, Liberman, Shankweiler, and their
colleagues predicted that nonrhyming letter names would generate fewer phonet-
ic confusions than rhyming ones, and thus facilitate recall in subjects who
rely on phonetic representation as a means of retaining etters in short-term
memory.. It was felt that if a subject's level of performance failed to profit
from reduced phonetic confusability, then that subject might have made less
effective use of phonetic representation as a mnemonic device. The perfor-
mance of good, average, and poor readers on the two types of letter strings is
compared in the top section of Figure 2. Good readers, in general, made fewer
errors than poor readers, and the average readers fell in between. The
performance of the'good readers, however, was also more significantly affected
by the manipulation' of rhyme than was that of the average or poor readers. In
fact, tne advantage of the superior readers was virtually eliminated when the
letter strings contained letters with phonetically confusable names. In other
words, phonetic confusability penalized the better readers to a greater extent
than children in the other two reading groups.
These findings were extended by two subsequent experiments involving the
same group of subjects and the same set of letter strings. In the first of
these, the letters of each string were presented visually, but successively
rather than simultaneously. In the second experiment, the letters were
presented successively, but auditorily rather than visually. The results of
these experiments are also displayed in Figure 2, where it may be seen that,
once again, the interaction betwen reading ability and the effect of phonetic
confusability was upheld. Indeed, it prevailed even when the letters were
heard instead of seen. It is important to underscore the fact that reading
ability was the only variable that interacted with the effect of phonetic
confusability on letter recall. The children with higher IQ scores did tend
to perform at a higher level than those with lower scores; however, the extent
of their superiority was the same regardless of whether the comparison
155
161

.-10
cu
ED
0
40
30
20
1.
0
40
111---411 Superior ReadersA A Marginal Readers
Poor ReadersVISUAL -SIMULTANEOUS
VISUAL-SUCCESSIVE
30/20 -
10
0
......
AUDITORY-SUCCESSIVE
40
30.......
--..... ............20 .....A
10
0Confusable Nonconfusable
Figure 2. Mean errors of superior and good readers on recall of letter'strings, summed over 'serial positions. (Means from delay andnondelay conditions are averaged. Maximum = 40.)
156 1 6 ")

involved p riAically confusable letter strings or phonetically nonconfusable
ones. sr the interaction between reading ability and the effect of
pho , confusability was unaltered when the analysis of the data covaried
for any effects of IQ.
To strengthen these findings about pcior readers' ineffective use of
phonetic representation, my colleagues and I followed the study of letter,-
string recall with a study of the role of,phonetic representation in recall of
other, more ecologically valid material such as spoken word strings and spoken:
sentences (Mann et al., 1980). In that study, the subjects were again good
and poor readers from a second-grade classroom. This time,, however, the good
readers had a slightly higher mean IQ than the poor readers. The experiment,,...
involved having the children in each group repeat strings of five spoken
words, and also the words of 13-word sentences that were eithe.r meaningful or
semantically anomalous. The material's included many different items of each
type, but, for word strings and both types of sentences, half of the items
contained a high density of phonetically confusable (i.e., rhyming) words,
whereasnalf contained phonetically nonconfusable words instead. Children's
performance on the word strings is compared in Figure 3, and thaton sentences
is compared in Figure 4. As can be seen_in those figures, for word strings,
as well as for both meaningful and semantically anomalous sentences, good
readers made fewer errors than poor' readers as long as the. material as
phonetically nonconfusable. For all three types of material, however, they
fell to the level of the poor readers when the material contained a high
density of phonetically confusable words. In this experiment, although good
readers tended to have higher IQ's, a significant interaction between reading
ability and the effect of phoneticconfusability was obtained when the results
were subjected, to an analysis of Covariance that adjustedffor any differenceY
in IQ, Ogee again, intelligence alone was not the source of the good readers'
more effective use of phonetic representation.
Thus, whether the material is -apprehended by ear or by eye, and wnether
it involves letter strings or meaningful sentences, the performance of good
readers tends to be both' superior to that of poor readers and also _more
strongly affected by m ipulations of phonetic confusability. For most good
readers, as for most dults, phoneticconfusability'of the material to be
recalled makes relianc on phonetic representation a liability rather than an
asset. In contra , phonetic confusability has little effect on the memory
performance of most poor readdrs, a fatt that, we interpret as evidence that
they are, for same reason, encQunteing difficulty with phonetic representa-
tion.
CLARIFYING THE BASIS OF .POOR READERS' ,PROBLEMS
WITH LINGUISTIC SHORT-TERM MEMORY
At this point, it bdcomes appropriate to consider ihy good and poor
readers might differ in performance on tasks that involve reliance on phonetic
representation. We can lay aside the possibility that memorial representa- r
tion, in general, is a problem, since if this were so, poor readers would have.
been inferior on other tests o-f temporary memory and not merely on those that
involve reliance on phonetic representation. A'general cognitive deficiency
would also seem an unlikely basis, given our findings that IQ scores are not
163
157

..,
3
,
non Good Readers
non Poor Readers.
0 ' I
Nonrhyming Rhyming
1
Figure 3 Mean error scores, of good and poor readers on recall of wordstrings, in nonrhyming and rhyming conditions. (Maximum = 5.)
158
1 6 i
Is


significantly associated with sensitivity to manipulations of phonetic. confu-
sability. Two other possibilities seem more plausible. On the one hand, poor
readers might not resort to phonetic representation at all, relying instead on
visual or semantic modes of representation. However, it is likewise possible
that they do attempt to employ phonetic representation, but for some reason
their representationiare less effective.
One piece of evidence that is relevant to this issue is provided by the
results of an experiment in which I extended Liberman and Shankweiler's study
of letter string memory to a population of second- and third-grade children
who were learning to read Dutch. The subjects were the ten best readers and
the ten worst readers in each grade; their mean ages and reading abilities are
given in Table 1. The procedure was the same as in the first experiment of
Table 1
Age and Reading Ability Among Beginning Readers of Dutch
Second Graders:
good readerspoor readers
Third Graders:
good readerspoor readers
Mean Age
in Years
Mean Grade-equivalentReading Ability*
7.4 4.1
7.3 1.1
8.2 5.5
8.5 2.3
*Grade-equivalent scores measured by the Ein-Minuten Test; Berkhout, 1972.
Shankweiler et al. (1979) with one innovation. In constructing the letter
strings, I separately manipulated phonetic and visual confusability, since
this was more feasible in Dutch than in English. Thus it was possible to
examine recall of three different types of upper-case consonant strings:
strings of letters that were phonetically confusable but not visually
confusable; strings of letters that were visually confusable but not phoneti-
160
16f,

cally confusable, and strings of letters that were minimally confusable along
both the visual and phonetic dimension. In all cases, the measure of phonetic
confusability was the density of letters with rhyming names, since that
measure had been employed by the Conrad (1964) study on which the Shankweiler
et al. (1979) study had been based. The measure of visual confusability was
derived from the upper-case letter confusion matrix compiled by Townsend
(1971), and was the summed probability of visual confusion for each possible
pair of letters in a given string. Computed in this way, the mean confusabil-
ity for the ten visually confusable strings was 0.81, and was significantly
greater than that for either the ten phonetically confusable or the ten
minimally confusable strings (0.27 and 0.31, respectively, t(18)=3.1, p<.01,
and t(18)=2.8, p<.01, respectively).
As no children's IQ test was available in Dutch, I controlled for
nonlinguistic short-term memory rather than for general intellectual ability.
The test of nonlinguistic memory that I administered was the Corsi test
(Corsi, 1972). The materials for that test consist of a set of nine wooden
cubes attached in a random fashion to a flat wooden base. The entire
apparatus is painted black; there are identifying numbers on the rear surface
of the cubes that can be seen by the experimenter although not by the subject.
During testing, the subject watches the examiner tap out a sequence of blocks
and then attempts to reproduce that sequence. Practice sequences of two and
three blocks are given first, followed by eight test sequences of four and
eight of five blocks each. The suitability of this test as a measure of
nonlinguistic short-term memory is indicated by clinical studies revealing
that whereas performance on linguistic short-term memory tests is selectively
impaired by damage to the left or language-dominant hemisphere, that on the
Corsi blocks shows the opposite pattern of selective impairment as a conse-
quence of damage to the right, or language-nondominant hemisphere (Corsi,
1972; Milner, 1972).
Because of my experience with American children, which had revealed no
significant relation between reading ability and non-linguistic memory, I did
not anticipate finding that good and poor beginning readers of Dutch would
differ in performance on the Corsi test. There seemed to be no reason to
anticipate that children in the two reading groups would differ in nonlinguis-
tic abilities. It did seem possible, however, that poor readers would do less
well than good readers on the letter-string memory test, and that they might
also be differently affected by the manipulations of phonetic and visual
confusability. Proceeding from the fact that phonetic confusability penalizes
recall in subjects who rely on phonetic representation, I speculated that if
poor readers rely on visual representation, than they might be inordinately
affected by the manipulation of visual confusability.
The results of the study are given in Table 2, where all memory test
scores are error scores that include errors of item omission and substitution,
as well as of incorrect order. In that table, it may be seen that despite any
differences in the Dutch and English languages or in the educational practices
by which they are taught, the memory profiles of good and poor readers in the
two countries prove quite similar. As we have found to be the case for
American children, Dutch children who are poor readers are equivalent to good
readers in performance on the nonlinguistic short-term memory test:
F(1,39)=1.6, p>.10, although older children tend to do better than younger
161
16

ones: F(1,39)=4.9, p<.05. Older children also tended to do better on the
letter string test: F(1,39)=11.8, p<.005. More importantly, the good beginning readers of Dutch tended to surpass the poor readers in memory forconsonant strings, and they did so at both age levels tested: F(1,39)=45.0,
p<.0001.
Table 2
Results Obtained with Beginning Readers of outch
Second grade:
CORSI
BLOCKS
good readers 20.5
poor readers 24.5
Third grade:
good readers 15.9
poor readers 18.2
LETTER STRINGS
Phonetically Visually NonConfusable Confusable confusable
15.4
29.8
11.0
24.5
23.4 16.4
29.8 30.9
20.7 8.5
26.9 26.2
(Max. = 72) (Max. = 50) (Max. = 50) (Max. = 5C)
In these data, there is, further, the anticipated interaction between
reading ability and the effect of the various manipulations of letter
confusability: F(2,72)=28.3, p<.0001. The better readers surpassed the
poorer ones in memory for the minimally confusable letter strings, this being
true for both second: t(18)=4.8, p<.001, and third graders: t(18)=10.3,
p<.001. However, the good readers at both ages fell to the level of poor
readers when they attempted to recall phonetically confusable strings. A
further twist to these data involves the effect of visual confusability, orrather, its noneffect. Neither good nor poor readers were affected by the
presence of a higher density of visual confusability. That is to say, for
both groups of subjects at both age levels, performance on the visually
confusable strings was no different from that on the nonconfusable ones. This
gives u :; no reason to believe that in this task the poor readers opted for a
purely visual representation of the letter strings. Either they relied on
some as yet undetermined form of representation, or they relied on phonetic
representation and for some reason failed to profit from reduced phonetic
similar:ty adlong the letttn. names.
162 165

Some direct evidence in support of the possibility that poor readers do
sometimes rely on phonetic representation may be found in the pattern of
errors these children make when they attempt to recall a phonetically
confusable string of spoken words. Some of my colleagues and I recently
analyzed the responses made by good and poor readers who were attempting to
recall such a string (Brady, Shankweiler, & Mann, 1982). The subjects were
participating in an experiment that will be described in more detail below;
they were good and poor readers from a third-grade classroom and they did not
significantly differ in IQ. They were asked to repeat strings of five words
that were either phonetically confusable or phonetically nonconfusable. As in
the past, the good readers tended to excel with respect to the poor readers,
but also tended to be more greatly affected by the manipulation of phonetic
confusability. We also found, however, that although children in both reading
groups made many substitution errors, the poor readers tended to make more of
these than, the good readers. We therefore turned to analyzing the composition
of the substitution errors and their relation to the words of the original
string.
Our analysis revealed that the pattern of substitution errors was the
same for good and poor readers alike. Almost no substitutions were semantic
associates of the words in the string being recalled; instead, the majority
were composed of a subset of the phonemes that had constituted the words of
the string being remembered. For example, a great proportion of the errors
contained an appropriate initial consonant and even more contained an appro-
priate vowel or final consonant. Thus it seemed as if the children in bbth
reading groups had remembered many of the phonemes they had heard. The poor
readers, for some reason, had merely made more errors in recalling the
original word strings, perhaps because their phonetic representations were
less well formed, or perhaps because their representations decayed more
rapidly tnan those of the good readers.
Thus, in at least some circumstances, it seems that poor readers may rely
on pho'retic representation to some extent; otherwie they would- not have
tended to make substitution errors that preserve phonetic aspects of the
original word string. Before leaving this topic, it would be pertinent to
mention the possibilit_ tnat problems with phonetic representation may force
the poor readers to rely on smentic representation during certain memory
tasks. Although my colleagues and I have seen almost no semantically-based
substitution errors among either good or poor readers, this has not been the
case in another study done by \Byrne and Shea (1979). These investigators
compared the performance of good and poor beginning readers on a spoken-word
recognition memory test, and found that, in general, good readers performed at
a higher level than poor readers. They also discovered that children in the
two groups tended to make different types of errors. Whereas poor readers
made proportionately more false recognition errors on semantic associates of
the correct items, good readers tended to make more such errors on words that
were phonetic associates. For example, when asked to remember and subsequent-
ly recognize "home," poor readers tended erroneously to recogni7e "house," but
good readers, "comb." Yet when the task was to remember nonsense syllables
instead of words, children in both reading groups made many errors on phonetic
foils. Once again, however, good readers somehow made more effective use of
phonetic -epresentation, as evidenced by their tendency to make fewer errors,
in general., coupled with their tendency to make disproportionately many errors
on phonetically-similar foils.163
I 6

Turning now to the question of why the phonetic representations of'poorreaders may be less effective than those of good readers, let me return to theabove-mentioned study by Brady et al. (1982). In that study an approach tothe problem of phonetic representation was inspired by the finding that, whenspeech perception is stressed by the presence of background noise, short-termmemory span is inordinately affected (Rabbitt, 1968). This finding led us toconsider the possibility that the short-term memory difficulties of poorreaders might be associated with some difficulties in encoding speech.Therefore, we designed an experiment to compare the ability of good and poorreaders to identify spoken words that were partially masked by white noise.
The third graders who were subjects of this study did not differ in ageor IQ, but did differ in reading ability, and also in memory for strings ofspoken words. Their performance showed the usual interaction between readingability and the effect of phonetic confusability. They were asked to identifya pre-recorded set of spoken words that contained an equal number of high andlow frequency words and was balanced for phonetic constituents and syllabicstructure. Each child heard the words under two different conditions: first
partially masked by signal-correlated white noise, and later under moreoptimal listening conditions.
The results revealed that although the poor readers were not significant-ly different from good readers in performance under the optimal conditions,they made about 35% more errors when the words were partially masked. That
this problem could not be attributed to some basic vocabulary deficiency couldbe seen from the fact that differences between children in the two readinggroup: obtained equally for high and low frequency words, and also from thefact that the subjects of our study had performed at the same level on thePeabody Picture Vocabulary Test (Dunn, 1959). It is also consistent with this
observation that an interaction between reading ability and the effect ofpartial-masking was obtained with an analysis that covaried for the effects of
age and IQ.
To determine whether the findings of this experiment were specific tospeech perception, as opposed to being an attribute of general auditory
perception, we conducted a second experiment. In it, the same subjects wereasked to identify a set of environmental sounds taken from a standard clinicaltest, including such sounds as a cat meowing and a door slamming. The
procedure was analagous to that in the previous experiment with spoken words;the subjects first identified the sound when partially masked by white noise,and later when presented under more optimal listening conditions. The pattern
of results for this second experiment proved distinct from that obtained inthe first one. Many of the poor readers were actually better than the goodreaders at identifying the partially-masked sounds, although this differenceis not significant. An analysis of covariance that adjusted for age and IQ
effects reveals that, although the noise penalized the overall level of
performance, there was neither an effect of reading ability nor an interaction
between reading ability and the penalizing effects of the noise masking.
Thus it would appear that any deficiency in auditory perception on thepart of the poor readers is limited to the realm of speech perception.Although more research is needed to clarify the relation between this speechperception deficiency and poor readers' problems with phonetic representation,
164

the fact of its existence is certainly provocative and most pertinent to the
view that reading skill is associated with language skill.
LINGUISTIC SHORT-TERM MEMORY SKILL MAY PRESAGE READING SUCCESS
Having made a link between reading skill and effective use of phoneticrepresentation in linguistic shoft-term memory tasks, and having reviewed someof the evidence as to why poor readers may have difficulty with phoneticrepresentation, I will now concentrate on some ramifications of this difficul-ty. According to the view introduced in the beginning sections of this paper,phonetic representation is crucially involved in all normal language process-ing. Since spoken language antedates written language, and insofar as
phonetic representation is involved in spoken language process'ng, difficultywith phonetic representation should often be found as an antecedent of reading
failure.
A study completed only a short time ago speaks to this point, revealingthat those kindergarten-aged children who make less effective use of phoneticrepresentation in a word-string recall task are likely to become the poorer
readers of their first-grade classrooms (Mann & Liberman, in press). The
'subjects for that study were a population of kindergarteners whom we followedlongitudinally for one year. During May of the kindergarten year we assessed
their memory for spoken strings of phonetilally confusable and nonconfusable
words, their memory for nonlinguistic material (the Corsi block sequences),
and their awareness of the syllabic structure of spoken words. The following
year, as first graders, these same children again received all of the memory
tests, and a standard reading test. At this time they were rated by theirteachers as "good," "average," or "poor" in reading ability.
The findings for the two years of the study are given in Table 3. Note
first that the children in the three reading groups had equivalent IQ scares;
we found no correlation between IQ scores and our measures of reading
achievement. The children in the three groups also performed, equivalently on
the Corsi test of nonlinguistic memory; neither their kindergarten nor their
first grade scores on this test were correlated with our reading measure. In
contrast, however, both of our linguistic measures proved able to distinguish
between children in the three different reading groups. Elsewhere we have
discussed,the relation between success at learning to read and the ability to
realize the syllabic structure of spoken words (see, for example, Liberman &
Mann, in press; or Mann & Liberman, in press). Here I will focus on the
relation between effective use of phonetic coding and reading skill. It can
be seen in Table 3 that children in the three reading groups were strongly and
significantly differentiated oy their performance on the phonetically non-
confusable word strings. As first graders, children's performance on this
type of word string was significantly correlated with their reading ability-7
more importantly, a significant correlation also existed between their kinder-
garten performance on the phonetically nonconfusable word strings, and their
first-grade reading ability. Note further that both as kindergarteners and as
first graders, the poorer readers tended not only to perform at the lower
levels on the word string memory test, but also to be among those least
affectec by the manipulation of phonetic confusability. Thus, their ineffec-
tive use of phonetic representation not only associated with their difficulty
in learring to read, but actually presaged ,t. 165
171

TABLE 3
Mean error scores of good, average and poor readers on memory tasksA longitudinal study (10 determined in kindergarten, readingachievement in first grade)
READINGABILITY
GRADELEVEL
VERBAL-MEMORYMax =32
NONVERBAL MEMORYMax =32
SYLLABLE SEGMENTATIONTASK
NonrhymingWord Strings
RhymingWord Strings Corsi Blocks (Percent passed in Kdgn.)
. .
GOOD READERS
KDGN 8.1 13.4 8.485%
N=26
10114.7 1st GRADE 5.5 12.1 8.7
AVERAGE READERS
N=19 KDGN 12.8 15.4 9.056%
10 114.7 1st GRADE 9.2 11.3 8.1 .
POOR READERS
N=17 KDGN 13.2 15.0 10.124%
10 115.5 1st GRADE 13.7 12.7 10.1 .
1t

READING SKILL, LINGUISTIC SHORT-TERM MEMORY AND ORAL COMPREHENSION
The finding that effective use of phonetic representation can be a
precursor of reading success is consistent with the view that reading skill
derives from language skill, given the position that effective language
comprehension, is linked to effective phonetic representation, and the presump-tion that successful comprehension is essential to learning to read well.
Clearly, one final demonstration is called for. If poor readers tend to make
less effective use of phonetic representation than good readers, and conse-quently encounter difficulty retaining the words of sentences, then we may be
able to demonstrate that they are less able to comprehend spoken sentences,
especially if comprehension demand. reliance on an effective short-term memory
store.
Together with some of my colleagues (Donald Shankweiler and Suzanne
Smith) I am currently analyzing the results of a study that asks whether there
exists a three-way link between reading skill, effective use of phonetic
representation, and spoken language comprehension. Clearly the existence of
such an association would further support the view that reading skill is a
product of language skill. The subjects of this most recent study are good
and poor readers from a third grade population that cis homogeneous with
respect to age md IQ. They have been given a test of memory for strings of
phonetically nonconfasable words, and several different tests of oral language
comprehension, including two tests of our own design and one standardized
clinical test. Thus far, we have only completed our analysis of the results
of the standardized tests, a test called the Token Test (DeRenzi & Vignolo,
1962).
In the Token Test, subjects receive a series of oral instructions that
specify how they are to manipulate a set of small colored "tokens." It has
enjoyed considerable success as a reliable indicator of disorders of oral
comprehension both among patients with acquired language deficits (DeRenzi &
Nignolo, 1962) and children With developmental language disorders (LaPointe,
1976). We chose to use it because it forces reliance on the grammatical
structure of a sentence rather than on common-sense knowledge or extralinguis-
tic cees, and also because it poses an obvious stress on short-term memory.
The test itself consists of five basic parts that are graded in
complexity. For the first four parts, all of the instructions are simple
imperative sentences that contain a constant verb and either one or two noun-
phrase objects. The instructions systematically increase from part to part in
the number of objects involved and in the adjectival content (one or two
adjectives) of the noun phrase. For the fifth part, the instructions contain
as many words or more than those in the third and fourth parts, but further
contain a series of different verbs and differ\ent noun phrase structures in
the predicate. Thus the first four parts of the test involve a systematic
increase! in the number of Pbjects and attributes that the subject must
remember, whereas the fifth involves not only a substantial memory load Put
also an increase in syntactic complexity.
fl
173
167

In general, the results of our study of Token Test performance haverevealed that 'poor readers tend to do less well than good readers. In
particular, we find that they do as well as good readers on the first threeparts of the test, 114t fall behind on the last two parts. We had anticipated
that the fourth and fifth parts might pose relatively more difficulty for thepoor readers, simply because they contain the longest instructions. However,
we recognize that .difficulty on .the fifth part of the test could also be a
consequence of a more specific difficulty with recovering syntactic structure,aside from a shOrt-term mgdory deficiency. Thus, while we have indeed
established a relation between reading ability and oral comprehension ofsentences, it remains to be determined whether ineffective use of phoneticrepresentation can account for this relatid4 in any direct way. We have someindication that for the children whom we tested, performance on the Token Testwas at least moderately correlated with word - string memory performance. It
also appears possible that for both the good and poor readers, the errors madeon part five may have been direct consequences of the memory demands posed bycertain instructions. We hope to continue to gain more insight into this
issue as we analyze the results of our other two comprehension tests.
As we pursue this and other research, my colleagues and I are entertain-
ing several possible outcomes. On the one hand, ineffective phonetic repre-sentation could not only compromise ongoing sentence processing, but also
limit the development of linguistic competence. It. is also within the realm
of possibility that poor readers possess a comprehension deficit that is notso mush a consequence as a concomitant of difficulty with phonetic representa-
tion. Perhaps reading disability, ineffective phonetic representation, andcomprehension deficiencies are all manifestations' of some more general
language impairment that we have only begun to characterize. Surely thecharacterization of that impairment will be a productive research objective,since it may both illuminate our understanding of the psychology of reading,and clarify our approach to the current epidemic oS reading failure.
REFERENCES
Baddeley, A. D. The trouble with levels: A reexamination of Craik and
Lockhart's framework for memory research. Psychological Review, 1978,
85, 139-152.
Baron, J. Phonemic staging not necessary for reading. Quarterly Journal ofExperimental Psychology, 1973, 25, 241-246.
Bauer, R. Memory processes in children with learning disabilities. Journal
of Experimental Child Psychology, 1977, 24, 415-430.Brady, S., Shankweiler. P., & Mann, V. Speech perception and memory coding in
relation to reading ability. Haskins Laboratories Status Report on
Speech Research, 1982, SR-69, this volume.Byrne, B., & Shea, P.. Semantic and phonetic memory codes in beginning
readers. Memory & Cognition, 1979, 7, 333-338.
Conrad, R. Acoustic confusions in immediate memory. British Journal of
Psychology, 1964, 55, 75-84.P Corsi., P. M. Human memory and the medial temporal region of the brain.
Unpublished doctoral dissertation, McGill University, 1972.
Daneman, M., & Carpenter, P. A. Individual differences in working memory.
Journal of Verbal Learning & Verbal Behavior, 1980, 19, 450-466.
168
1 74

DeRenzi, E., & Faglioni, P. Normative data and screening power of a shortenedversion 'of the Token Test. Cortex, 1978, 14, 41-49.
DeRenzi, E., & Vignolo, L. A. The Token Test: A sensitive test to detectreceptive disturbances in aphasia. Brain, 1962, 85, 665-678.
Drewnowksi, A. Memory, functions for vowels and consonants: A reinterpreta-tion of acoustic similarity effects. Journal of Verbal Learning andVerbal Behavior, 1980, 19, 176-193.
Dunn, L. L. Peabody picture vocabulary test. Circle Pines', Minn.: AmericanGuidatice Services, 1959.
Frazier, L., & Fodor, J.'D. The sausage machine: A new two-stage parsingModel. Cognition, 1978, 6, 291-325.
Jastak, J.,. Bijou, S. W., & Jastak, S. R. Wide range achievement test.Wilmington, Del.: Guidance Associates, 1965.
Katz, P. A., & Deutsch; M. Modality of stimulus presentation in serial
learning for retarded and normal readers. Perceptual and Motor Skills,1964, 19, 627-633.
Katz, R., Shankweiler, D., & Liberman, I. Y. Memory for item order and
phonetic coding in the beginning reader. Journal of Experimental
Psychology, in press.Kimball, J. Predictive analysis and over-the-top parsing. In J. Kimball
(Ed.), Syntax and semantics (Vol. 4). New York: Academic Press, 1975.,
Kimura, D. Right temporal lobe damage. Archives of Neurology, 1963, 8, 264-271.
Kleiman, G. M. Speech recoding in reading. Journal of Verbal Learning and
Verbal Behavior, 1975, 14, 323-339. ,
LaPointe, C. M. Token test performances by learning-disabled and achievingadolescents. British Journal of Disorders of Communication, 1976, 11,
. 121-133.Levy, B. A. Reading: Speech and meaning processes. Journal of Verbal
Learning and Verbal Behavior, 1977, 16, 623-638.Liberman, A. M., Mattingly, I. G., & lurvey, M. Language codes and memory
codes. In A. W. Melton & E. Martin (Eds.), Coding processes and humanmemory. Washington, D.C.: Winston and Sons, 1972.
Liberman, I. Y., & Mann, V. A.' Should reading remediation vary with the sexof the child? Bulletin of the Orton Society, in press.
Liberman, I. Y., Mann, V. A., Shankweiler, D., & Werfelman, M. Children's
memory for recurring linguistic and non-linguistic material on relationability. Cortex, in press.
Liberman, I. Y., & Shankweiler, D. Speech, the alphabet and teaching to read.
In L. B. Resnik' & P. A. Weaver (Eds.), Theory and practice of earlyreading (Vol. 2). Hillsdale, N.J.: Lawrence Erlbaum Associates, 1979,
109-134.Liberman. I. Y.", Shankweiler, D., Liberman, A. M., Fowler, C., & Fischer,
F :. Phonetic segmentation and recoding in the beginning reader. In
A . Reber & D. L. Scarborough (Eds.), Toward a psychology of reading:1. proceedings of the CONY Conferences. Hillsdale, N.J.: Erlbaum,
1(5*/(, 207-225.
1 76 169

Mann, V. A., & Liberman, I. Y. Phonological awareness and verbal short-term
memory: Can they presage early reading problems. To appear in
F. H. DLAffy & N. Geschwind (Eds.), Dyslexia: Current status and future
directions.Mann, V. A., Liberman, I. Y., & Shankweiler, D. Children's memory for
sentences and word strings in relation to reading ability. Memory &
Cognition, 1980, 8, 329-335.Marcus, M. P. A theory of syntactic recognition for natural language.
Cambridge, Mass.: M.I.T. Press, 1980.Mark, L. S., Shankweiler, D., Liberman, I. Y., & Fowler, C. A. Phonetic
recoding and reading difficulty in beginning readers. Memory &
Cognition, 1977, 5, 623-629.Meyer, D. E., Schvaneveldt, R. W., &'Ruddy, M. G. Functions of graphemic and
phonemic codes in visual word-recognition. Memory & Cognition, 1974, 2,
309-321.Milner, B. Disorders of learning and memory after temporal-lobe lesions in
man. Clinical Neurosurgery., 1972, 19, 421-446.
Morrison, F. J., Giordani, B., & Nagy, J. Reading disability: An information
processing analysis. Science, 1977, 196, 77-79.
Perfetti, C. A., & Goldman, S. Discourse memory and reading comprehension
skill. Journal of Verbal Learning and Verbal Behavior, 1976, 14, 33-42.
Rabbitt, P. M. A. Channel-capacity, intelligibility and immediate memory.
Quarterly Journal of Experimental Psychology, 1968, 20, 241-248.
Shankweiler, D., Liberman, I. Y., Mark, L. S., Fowler, C. A., & Fischer, F. W.
The speech code and learning to read. Journal of Experimental
Psychology: Human Learning and Memory, 1979, 5, 531-545.
e Slosson, R. Slosson Intelligence Test for children and adults. East
Aurora, N.Y.: Slosson Educational Publications, 1963.
Slowiaczek, M. C., & Clifton, C. Subvocalization and reading for meaning.
Journal 2S Verbal Learning and Verbal Behavior, 1980, 19, 573-582.
Townsend,' J. T. Theoretical analysis of an alphabet confusion matrix.
Perception & Psychophysics, 1971, 9, 40-50.
Tzeng, 0. J. L., Hung, D. L., & Wang, W. S-Y. Speech recoding in reading
Chinese characters. Journal of Experimental Psychology: Human Learning
and Memory, 1977, 3, 621-630.
Weinstein, R., & Rabinovitch, M. S. Sentence structure and retention in good
and poor readers. Journal of Educational Psychology, 1971, 62, 25-30.
Wiig, E. H., & Roach, M. A. Immediate recall of semantically varied sentences
by learning disabled readers. Perceptual and Motor Skills, 1975, 40,
119-125.dcock, R. W. Woodcock reading mastery tests. Circle Pines, Minn.:
American Guidance Services, 1973.
r?
1
70

ON IRE ROLE OF SIGN ORDER AND MORPHOLOGICAL STRUCTURE IN MEMORY FOR AMERICAN
SIGN LANGUAGE SENTENCES
Vicki L. Hanson and Ursula Bellugi+
Abstract. Sentence processing in a visual/gestural language was
investigated by testing signers' recognition for American Sign .
Language (ASL) sentences. Using a continuous recognition paradigm,
sign order and structural changes that altered the meaning of a
sentence were noticed at both immediate and delayed (45 seconds)
test intervals. Sign order and structural changes that resulted ina paraphrase of an earlier-occurring sentence were noticed only with
immediate testing. These results indicate that signers decompose acomplex sign into its lexical and inflectional components duringsentence comprehension and remember the meaning expressed by these
components rather than remembering the exact sign structure.
In the past decade, it has become clear that there are primary gestural
systems, passed down from one generation of deaf people to the next, that have
taken their own course of development as autonomous languages. American Sign
Language (ASL) is the common form of communication used by deaf native signers
among themselves across the United States and parts of Canada. ASL is a
primary visual-gestural system, not based on, nor derived from, any form of
English, having its own lexicon and grammar (Klima & Bellugi, 1979): Because
of the radical difference in the transmission medium for signed languages as
opposed to spoken languages, ASL affords an opportunity to examine a question
not easily investigated in other ways: namely, to what extent is language
processing shaped by the production modality?
Research on American Sign Language shows that this visual-gestural sy,tem
exhibits formal structuring at the same two levels as spoken languages:. a
sublexical level of structure internal to the sign (the phonological level in
spoken languages) and a level Of structure that specifies the wayi signs are
+The Salk Institute for Biologinal Studies.
Acknowledgment. We wish to thank Malinda Williams, Ben Bahan, and Sandra
Fields for their help on this study. Apprectation is also extended to Nancy
Frishberg, Horace Reynolds, and Dennis Schemenauer who made arrangements for
facilities and participants. The cooperation of the following institutions
made this research possible: Gallaudet College, New York University, and
California State University, Northridge. Illustrations were drawn by Frank
A. Paul. Helpful comments on an earlier draft of this manuscript were
provided by Deborah Wilkenfeld. This research was conducted while the first
author was a postdoctoral fellow at The Salk Institute. The research and
writing of this paper were supported in part by National Institute of Health
Research Service Award NS-06109, National Science Foundation Grant BNS 79-
16423, and by NICHD Grant HD-01994.
[HASKINS LABORATORIES: Status Report on Speech Research SR-69 (1982)]
171
177

bound together into sentences (the grammatical level). ASL thus shares
underlying principles of organization with spoken languages, but the formaldevices that appear arise from the very different possibilities afforded bythe visualgestural modality. In spoken languages, the structuring of lexicalitems and morphological processes, is essentially sequential. Words are
composed of sequentially produced sounds; morphological processes commonlyinvolve affixation of phonemic segments sequentially ordered in the soundstream. In ASL, however, signs are composed of contrasting formationalparameters, co-occurring throughout the sign, and the morphological processesof ASL involve embedding the sign stem in superimposed contours of movements.Sign rid inflectidnal marker thus cooccur in time (Bellugi, 1980).
:n relation to the structure of the signs themselves, it has been
deter-tined that signs are not just holistic and iconic, but rather are
composed of a limited number of arbitrary formational components that combinein regular and constrained ways in the signs of the language (Battison, 1974;Stokoe, Casteriine, & Croneberg, 1965). These parameters (handshape, location, and movement) have been found not only to be formal linguistic
descriptions 3f signs, but .so to be psychologically real in the sense thatsigners rely on these parameters in sign processing. In studies of shortterm
memory for signs, signers characte'ristically make errors based on these
formational parameters (Bellugi, Klima, & Siple, 1975; Frumkin & Anisfeld,
1977Y. Similarly, "slips of the hand" involve exchanges of these components(Newkirk, Klima, Pedersen, & Bellugi, 1980).
ASL differs dramatically from spoken languages in the form of its
morpholoilical processes. As a visualgestural language, its morphologicaldevices embed sign stems in superimposed changes of space and movement.
Figure 1, for example, shows the sigr. PREACH under a variety of morphologicaloperations [e.g., PREACH (basic sign), 'preach to them,' preach to each of
them,' preach regularly,' etc.].1
The wide variety of semantic distinctions that are obligatorily marked
morphologically in ASL sentences are often indicated in English either
lexically or phrasally. ASL verb signs, for example, undergo obligatoryinflections for referential indexing, indicating subject and/or object of the
verb; for reciprocity; for grammatical number, marking distinctions such as
dual and multiple; for tenporal aspect, indicating distinctidhs such as
'regularly,' over and ovor again,' for a long time,' gradually1; for
distributional aspect 'to ecch,"to any,' all over,' to certain ones.'
There are also a large number of derivational processes such as those that.
derive nouns from verbs, that derive predicates from nouns, and that signal
figurative or extended meanings. The elaborate system of formal inflectionaldevices, their widespread use to vary the form of signs, and the variety of
fine distinctions they systematically convey suggest that ASL, like Latin and
Navajo, is one of the inflective languages of the world (Klima & Bellugi,
1979).
The present research examines', for the first time whether these formal
linguistic descriptions of ASL morphological structure correspond to psycho
logical representations that signers use in the interpretation and retention
of sentences.
172

Several experiments with English have been conducted to test whether
linguistic descriptions of the language can be applied to describe the way in
which readers/listeners process sentences. These experiments, taken as a
whole, provide evidence that while descriptions of grammatical structure are
psychologically real in the sense that they are used in sentence comprehen-
sion, these structures are not used as a basis for sentence representation in
memory.
In a seminal study, Sachs (1967) presented data strongly supporting the
hypothesis that after the meaning of a sentence is comprehended, the exactwording and the syntactic structure are forgotten. Sachs had passages of text
Bread to normally-hearing college students and, after various intervals ofinterpolated-material, tested the students' recognition memory for sentences
of the text: The test sentences could be different from an earlier-occuring
sentence in one of the following three ways: (1) different by a semantic
change; (2) different by an active/passive change; or (3) different ty a
formal change (e.g., "He called up Mary" vs. "He called Mary up"). For
immediate testing, performance was quite accurate for all sentence change
qonditions. But after the presentation of as little as 27 sec. of interpolat-
ed material following the target sentence, only the semantic changes were
noticed. These results have been replicated in later studies using both
spoken and printed sentences and text witheults (Anderson, 1974; Begg, 1971;
Begg & Wickelgren, 1974; Brewer, 1975; Fillenbaum, 1966; Johnson-Laird &
Stevenson, 1970; Sachs, 1974; Wanner, 1974) and with children (Trembath,
1972).
An experiment by Bransford and Franks (1971) clearly demonstrates the
tendency of subjects to recall the meaning rather than the form of sentences.
Subjects in that study were presented semantically-related study sentences
that contained one, two, or three propositions. In a recognition test,
subjects tended to falsely recognize four-proposition sentences that they had
never seen before, but eihich were semantically consistent with the integration
of propositions across the study sentences.
The present research is concerned with whether signers similarly abstract
the meaning of ASL sentences and then retain this meaning independent of the
sentence structure. Atone level this experiment tests retention of sign
order. The work with English readers/listeners has indicated that there is
little retention of the exact word order of sentences for anything but
immediate testing. It is similarly expected here that signers will not retain
information about the sign order of ASL sentences in long-term memory. Work
with English sentences has also shown that following sentence comprehension,
readers/listeners do not retain information about the exact lexical composi-
tion of sentences. The morphological processes of ASL afford the opportunity
to provide a more stringent test than is possible with English of the tendency
of language users to remember the meaning of sentences independent of the
lexical composition. The morphological processes of ASL, by superimposing
movement patterns on basic lexical signs, strikingly alter the dynamic visual
form of the sign. Of interest here is whether signers will remember the
global form of a sign or whether they will decompcse the complex sign into its
lexical and inflectional components and remember only the meaning expressed by
these components.
173
17J

REFERENTIAL INDEXING
puhco(Indemlc: 2nd pers.)
'preach to you'
PRLICS (Reciprocal)
'preach to each other'
UNINFLECTED
PREACH (basic)
pRucH(Indexlc: 1st pers.'
'preach to me'
GRAMMATICAL NUMBER
PREACH(Dual)'preach to both'
promm(Indoxlcs 3rd pars.)
'preach to him'
PallACN(NbitiP14)'preach to others'
Figure 1. The uninflected sign PREACH and its form 'under a variety of
inflections.
174

TEMPORAL ASPECT
puhalliabitual)
'preach regularly'
DISTRIBUTIONAL ASPECT
pummiExhaustive)'preach to each of them'
pRzAcH(Iterativel
'preach over and over again'
enAcHlApportionitive Internal)
'preach all over,
pu.011Allocative DeEerminate)
'preach to certain Onelt.
PREACH(Cont%nuative)
'preach for a long time'
PREACH(ApporixonAtIve External)
'preach among :wooers of agroup'
PREACHIAllocative Indeterminate)
'preach to any and all'
Figure 1, continued.
1.81.

The paradigm to be used is one adapted from work on memory for sentences
in both 'written and spoken English (Begg, 1971; Begg & Wickelgren, 1974). In
these paradigms, subjects are presented with several sentences. Aftser various
intervals, a test sentence is presented. Subjects are asked if that sentence
is identical to an earlieroccurring one. In the present experiment, a test
sentence can be changed from the target in one of four ways: Two of these
changes (Formal and Lexical changes) will be paraphrases of the target
sentence, preserving meaning. The other two changes (Inflection and Semantic
changes) will have different meanings than the target.
METHOD
Stimulus Materials and Design
Stimuli were ASL sentences. The sentences were independent of each other
in terms of grammatical structure and content. They were not related in a
story context. 'There were three different kinds of sentences: Original,
test, and fi,ller sentences. Original sentences were the first presentation of
an experimental sentence. Test sentences were the second presentation of an
experimental sentence.
Fifty experimental sentence pairs were used in five testing conditions.
In one condition, the original and test sentences were identical. Eighteen
pairs of experimental sentences were included in this condition. The other 32
sentence pains were equally divided among four conditions in which the test
sentence was changed from the original sentence. There were -eight ,sentence
pairs in each of the following four change conditicns:
a) Formal:' Formal changes involved a change in sign order with 'no
resultant change in meaning. An example of a Formal change is given below.
Both the ASL gloss and the English translation are presented,
Original: DOCTOR NO LX:'to me') EAT CHEESE MILK ETC. THATt
.Englishtranslation: The doctor told me not to eat dairy products.
(1) Test: CEEESE MILK ETC. THAT DOCTOR NO (X:'-to me'] EAT
Englishtranslation: Dairy products are the food the doctor told me not to
eat.
b) Lexical: Lexical changes involved pairs of sentences that had the
same meaning expressed in two different ways. Thus in one sentence a
particular meaningwas carried by two lexical signs while in the other the
same meaning was conveyed by a single inflected sign. An example of such a
sentence pair is thefollowing:
176

t
Original:
English, translation:
(2) Test;
English
translation:
SUPPOSE WINTER (MY) FRIEND tiD:'chum'] SURE OFTEN SICK
PITY [X:'him'].
If it's winter my chum will surely get sick often, poor
thing.
SUPPOSE WINTER (MY) FRIEND (iD:5chum5] SURE SICK
[M:Frequentative] PITY EX:'him'].
. r
If it's winter my chum will surely get sick often, poor
thing.
. .
The difference in form between the phrase OFTEN SICK and the modulated
SICKEM:Frequentative], both of which nave the same meaning, is shown in
Figure 2.
1 c) Inflection: Inflection changes involved pairs of sentences that were
.different in meaning. The original sentence included inflected signs; in
the te;t, sentence, the inflections were transposed, but the order of the
sign stetds was maintained, resulting in a different meaning. The following
sentence pair is an example in which the inflections on GIVE and INFORM are
exchanged. Figure'3 illustrites this change.
Original: MARY, JANE PAPER GIVEN:Reciprocal], BUT NEVER
INFORKI:Multiple] THEIR WORK.
_English
translation: Mary and Jane give each other papers, but never inform_
others about their work.
(3) Test:
Englishtranslation:
MARY, JANE PAPER GIVE[N:Multiple] BUT NEVER
INFAKI:Reciprocal] THEIR WORK.
Mary and Jane give others papers, but never inform each
other about their work.
d) Semantic: For Semantic changes, the meaning of the test and original
sentences was altered by a change in sign order in which two signs
exchanged positions, often across clauses. An example of such a Semantic
change is given here, where MATH and MUSIC are interchanged.
Original: MY WIFE TEACH [M:Continuative] MATH ALLMORNING,
AFTERNOONS TEACH [M:Habitual] MUSIC.
Englishtranslation: My wife works hard teaching math all morning, and in the
afternoons she generally teaches music.
(4) Test: MY WIFE TEACH [M:Continuative] MUSIC ALLMORNING,
AFTERNOONS TEACH [M:Habitual] MATH.
Englishtranslation: My wife works hard teaching music all morning, and in the
afternoons she generally teaches math.
177

OFTEN SICK (Basic)
ti
SICK (M:Frequentativel
meaning 'often sick'
Figure 2. An example of a Lexical change. In the top panel, the meaning
'often sick' is expressed by two lexical signs: OFTEN and SICK.In the lower panel, the same meshing is expressed by the inflected
178,sign SICK[M:Frequentative].
184

GIVEER:Reciprocal)meaning 'give each other'
INFORMENIMnitiple)meaning 'inform others'
GIVEN:Multiple)meaning 'give others'
INFORMER:Reciprocal)meaning 'inform each other'
Figure 3. An example of an Inflection change. In the top panel, the signs
GIVE and INFORM are inflected with the reciprocal and multiple
inflections respectively. In the bottom panel, the same signs
occur but with transpos6d inflections, resulting in differeht
meaning.
179
185

There were thus five different experimental conditions as defined by the
different relationships between original and test sentence pairs. In addition, there were two different time intervals tested:. an immediate test and a45 second delayed test. Sentences in the five experimental conditions weretested half the time at each interval.
Stimulus Tape
Stimulus sentences were signed by a native signer of ASL and wererecorded on videotape for use during testing. Natural facial expression wasi.noluded in all sentences. The hands of the signer were restored to a neutralposition between sentences to indicate the end of one sentence and thebeginning of another. The first three sentences presented were fillersentences.
Test sentences were indicated by a star that appeared in the upper lefthand corner of the screen at the onset of each such sentence. Following each
test sentence, a blank interval lasting approximately five seconds was
included to be used as a response interval.
For the immediate test, the test sentence followed the original sentence.For the delayed test, four sentences always intervened between original andtest sentences. These four intervening sentences included original and test
sentences as well as filler sentences. In many cases, there was also oneresponse interval between original and test sentences. This difference in
events between original and test sentences was caused by the variance inlength of sentences used in the experiment. The number of interveningsentences was held constant, however, and the time of the delay interval washeld constant at 45 seconds.
Instructions, signed in ASL, were recorded on the beginning of the
videotape.
Procedure
Subjects were instructed that they would see several ASL sentences and
that they were to pay careful attention to each. At various times testsentences would be presented and would be indicated by a star in the upperlefthand corner of the screen. For each, subjects were to-decide if the testsentence was exactly the same as a sentence that had been presented previous
ly. They were to circle YES on their answer sheet if the test sentence wasthe same as an earlieroccurring sentence and to circle NO if the test
sentence was not exactly the same as an earlier one. Subjects were instructed
that "exactly the same" meant the same signs and same sign order as well as
the same meaning.
In addition, subjects were asked to make a confidence judgment about each
sentence. They were to circle whether they were "VERY SURE," "SORT OF SURE,"
or "GUE3SING" about their decision as to whether the original and test
sentences were the same.
The stimulus sentences were preceded by a practice session that included
four practice -test.sentences. All sentences included in the practice phase
180
1S6

were simple sentences designed to illustrate clearly the nature of the
procedure and to indicate that the structure as well as the meaning of the
sentences would be important in the experiment. During this practice,
subjects' answers were checked after each response. If a subject had answered
incorrectly, the original and test sentences were shown to the subject again.
Subjects
Subjects were ten deaf volunteers recruited through the Center on
Deafness at California State University, Northridge. line of the subjects had
deaf parents and had learned ASL as a first language. The other person had
grown up signing and was considered by native signers to be a skilled ASL
user. There were five women and five men, meaage 24.2 years.
RESULTS
The percentage of trials on which the subjects responded that the test
sentence was "different" from the original sentence is given in Table 1. For
Table 1
Mean percentage responses in which subjects responded that the test sentence
was different from the original sentence. Also shown is the difference in
such responses at the two time intervals. (A negative number as the
difference indicates that there was more tendency to respond that the test
sentence was different for delayed than for immediate testing.)
Immediatetest
Delayedtest
Difference
Formal 97.5% 59.2% 38.3% *
Lexical 92.5% 67.5% 25.0% *
Inflection 90.0% 81.7% 8.3%
Semantic 90.0% 95.0% 5.0%
Identical 28.4% 37.3% -8.9%
(*p<.05)
181
187


all but the Identical sentences this percentage indicates percentage correct
responses. For Identical sentences there was no difference in subjects'
accuracy at the two response intervals, t(9)=1.48, p>.05.
The percentage of "different" responses for the Identical sentences may
be taken as an index of subjects' bias to respond that a test sentence is not
the same as the original. Following Sachs, "chance" is therefore defined here
as the percentage of "different" responses for Identical sentences. The
results are graphed in Figure 4 as the percentage of "different" responsesgreater than "(`-lance."
Analyzing the percentage of "different" responses for the four change
conditions, with immediate testing it was found that subjects were equally
likely to respond that the test sentence was different from the orlg'nal for
all four sentence types, F(3,27)=1.00, MSe=125.00, E >.05. Subjt..:ts were
therefore able to notice all four types of sentence changes equally well with
immediate testing. They did not, however, notice the different types .of
sentence changes equally well with delayed testing. An analysis of variance
on the four types of change conditions by intervals indicated main effects of
both condition, F(3,27)=4.22, ne=195.30, p<.025, and interval, F(1,9)=16.35,
MSe=339.56, p<.01, that were qualified by an interaction of interval by--
condition, F(127)=10.20, MSe=176.02, p.001. Thus, while performance was
generally better with the immeciate test than with the delayed the
degree to which the time interval adversely affected performance was dependent
upon the condition being tested. Results of a Tukey (hsd) post hoc analysis
indicated that there were significant differences between the immediate and
delayed testing only for Formal and Lexical changes (those that preserved
meaning) (j <.05). Inflection and Semantic changes, both of which changed
meaning, were noticed as well with the delayed as with the i-:mediate test
(p>.05).
A one-way analysis of variance was performed on accuracy in the five
delayed test conditions. The main effect of condition was significant,
F(4,36)=19.49, ne=248.47, . p<.01. Post hoc analyses were undertaken to
determine the basis for this effect. Results of these tests indicated that
the percentage of ,'different" responses was greater than "chance for all four
change conic,' ons (Dunnett's t statistic, 2 <.05). Additional analyses indi-
cated a distinction between meaning-preserving and meaning-changing sentence
pairs: For both the Inflection and Semantic changes, subjects were more
likely to respond that the test' sentence was "different" than they were to
respond "different" for the Formal and Lexical changes (Newman-Keuls, p<.05).
Th.tre was no difference in the percentage of "different" responses between
Semantic and Inflection changes'(Newman-Keuls, p.05) nor between Formal and
Lexical changes (Newman-Keuls, 2 >.05). These results indicate that while
subjects responded more accurately than .would be expected by chance for all
four types of sentence changes, their ability to notice the sentence changes
was dependent on the type of change: changes of meaning (Inflectional and
Semantic changes) were noticed more consistently than were meaning-preserving
changes (Formal and Lexical changes).
To obtain a score for the confidence rating, subjects' responses were
assigned .the following numerical, values: VERY SURE=3, SORT /OF SURE=2,
GUESSIN0r1. If the subject responded that the test and original seritendes
133TI

k
were identical, their confidence rating was multipliedrby -1. If the subject
responded that the test and original sentences were not the same, their
-response was given a score equal to the confidence rating. Subjects' scores
on this confidence rating were then analyzed. Mean confidence ratings are
shown in Table 2.
Table 2
Mean confidence ratings at both immediate and delayed testing. A positive
number indicates a tendency to respond that the original and test sentenceswere.different. A negative number indicates a tendency to respond that theoriginal and test sentences were identical. The scoring procedure is
explained in the text.
Immediate
test
Delayedtest
Difference
Formal 2.88 .56 2.32 *
. Lexical 2.57 .97 1.60 *
: ,Inflection 2.30 1.77 .53
Semantic 2.40 2.67 -.27
Identical -1.24 -.73 -.51
A t-test-was performed-on subjects', confidence in responding that the
Identical test sentences were the same as an earlier-occurring sentence at the
two response intervals. The nonsignificant results, t(9)=1.69, 2>.05, indi-
cated that for Identical sentences there was no. difference in subjects'
confidence of their responses at the'two time intervals.
Scores for immediate test in the four change conditions showed no
difference in,confidence for the different conditions, F(3,27)=1.71, MSe=.372,
p>.05. Scores were then subjected to an analysis of variance on condition by
interval. Results indicated main effects of both condition, F(3,27)=5.25,
ne=.533, p<.01, and interval, F(1,9)=25.02, MSe=.871, p<.01, that were
134
.7
qualified by an interaction of the two variables, F(3,27)=11.16, MSe..587,p<.001, Again, a post hoc Tukey (hsd) analysis indicated the difference in
performance at the two intervals was apparent only for the Formal and theLexical changes (2<.C5). This pattern of results reflected the fact that withdelayed testing, subjects were not confident of responding that the testsentences were different from the original sentences for the Formal and
Lexical changes although they were confident of responding that the testsentences were different fr'om the original sentences for the Inflection andSemaptic changes.
In this experiment, therefore, subjects were both accurate and confidentin noticing Inflection and Semantic changes even with 45 seconds intervening
between original and test sentences. In contrast, sentence changes that
preserved meaning (the Formal and Lexical 'changes) were accurately and
confiJently noticed only with immediate testing.
DISCUSSION
This experiment represents one of the first attempts to study ASL
sentence processing. It was found that signers use syntactic structure tocomprehend sentences but represent the meaning of ASL sentences in long-termmemory independently of the sign order and the holistic sign structure.
As in studies with English, paraphrases were not noticed well with
anything but immediate testing. This does not mean that only sentence meaningwas retained. -Sachs (1957) also noted this fact, stating that subjects "did
have some ability to recognize the form of the sentence but that it was quite
low and contrasted greatly with their memory for the semantic content of the
sentence" (p. 441). The present finding that all four types of sentence
changes are recognized bgtter than "chance" is consistent with this cohclu-
sion. In particular, research has shown that when subjects know in advancethat their memory. for sentences is being te,,ed Gas in the case of the presentstudy), additional information about the sur.-Jce form of sentences is retained
(Anderson, 1974: Begg & Wickelgren, 1974;* Johnson-Lairde& Stevenson, 1970).
This is similar to work showing that people can remember,such "trivia" as the
typography of words wheh reading (Kolers & Ostry, 1974). Thus, it is
apparently the case that people can remember many types of information about
the sentences they process: However, there is strong evidence that the
primary information remembered about sentences is the semantic interpretation
for written and spoken sentences and, as shown here, for signed ASL sentences.I
One type of paraphrase in the p esens, study involved a -change in word
order. These Formal changes were of noticed with delayed testing even
though, as shown in sentence pair ( ), the sign order changes generally
involved a topicalization change. Sent nces in ASL often follow what has been
referred to as a topic-chimment structure. This means that the topic of the \
sedtence, marked by a specific facial expression, occurs _first, and is/
followed by',a comment on 'that topic. For example,_ in the .test sentence of
sentence pair (1), the topic "dairy products." The comment is that "thie
doctor told me not to eat,(them).," In the criginal-sentence for that pair, the
topic of the sentence was that "the doctor told me not to,(do something)" and
the comment explains that the prohibited activity is eating dairy products.
185
191

Sentence topicalization in ASL is marked by an eyebrow raise and an upwardhead tilt (Liddell, 1977). The beginning of the comment is signaled by arelaxation of head and eyebrow position. A topicalization change was present
for three of the four test sentences at each delay. The fact is that subjectsdid not notice even these Formal changes.
Semantic changes in this experiment, as well as Formal changes, were
caused by changes in sign order. But when the sign order change also caused ameaning change, the change was noticed.; Thus, it is not the sign order, perse, that was remembered, but rather it was the semantic content that wasremembered.
One impoktant aspect of the present results is that signers were shown to
be representing "'the meaning of a signed sentence independently of its
morphological comkosition. This was shown strikingly by the results of the
Lexical chanLe condition. Subjects rehiembered the meaning of the sentence but
after a brief delay did not remember the form in which the meaning wAs
conveyed. Thu41 for example, subjects' remembered the meaning 'frequently
sick' but did. not remember if the actual sentike contained a Lwosign phrase
OFTEN SICK or a single inflected sign, SICK[M 1, equentative].
This finding agrees nicely with work by Poizner, Newkirk, Bellugi,Klima (1981) on shortterm memory for lists of inflected signs. In that
study, subjects saw snort lists of inflected signs and w(,-e asked to recall
the list by signing the items immediately after each list. Recall errors
revealed that subjects recalled the base sign and its inflection independent
ly. Thus, signers decomposed the sign into its meaning components and did not
retain the exact form of the sign.
Notice, however, a striking- difference in this work on sentence memory
and the results from the shortterm Memory paradigm of Poizner et al-. (1981).
For the lists of inflected signs in their study, -- subjects confused which
inflections were superimposed on which basic signs. But t!-,is was not true
when the inflected signs were put in the meaningful sentence context of the
present experiment. The high recognition accuracy for Inflection changes,
even at longer intervals, indicates that people did not make this confusion.
Results from the Lexical change condition further show that this lack ofconfusion was not a result of signers remembering the exact form of the sign
presented. Rather, this accurate performance in the Inflection change condition'can be attributed to the fact that switching tl inflections changed the
meaning of the test sentence.f Thus, signers wer able to'. reject the test
sentences for Inflection changes, not uecause they noticed that the sign forms
were changed but because they noticed that the meanings of the test sentences
were changed.
In recent years 'a picture has been emerging in which basic cognitive
processes constrain the structure of signed and spoken languages so that
underlying structure fbr languages inclocth modalities exhibit many similari
ties (Bellugi, 1980). The present rk on sentence memory- suggests that in
signed language as in spoken lang ges, the meanini, of a sentence is
abstracted and the structural mechanism by which this meaning is conveyed is
not retained in the longterm memory representation of the sentence.
186 19 %
ti
a

REFERENCES
Anderson, J. R. Verbatim and propositional representation of sentences in
immediate and long-term memory. Journal of Verbal Learning and Verbal
Behavior, 1974, 13, 149-162.
Battison, R. Phonological deletion in AmericanSign Language. Sign Language
Studies, -1974, 5, 1-19.
Begg I. Recognition memory for sentence meaning and wording. Journal Of
Verbal Learning and Verbal Behavior, 1971, 10, 176-181.
Begg, I., & Wickelgren, W. A. Retention functions for syntactic and lexical
vs. semantic information in sentence recognition memory. Memory &
Cognition, 1974, 2, 353-359.
Bellugi, U. Clues from the structural similarity of sign and spoken language.
In U. Bellugi & M. Studdert-Kennedy (Eds.), Signed and spoken language:
Biological constraints on linguistic form. Weinheim: VerlaW CIemie,
1980.
Bellugi, U., Klima, E. S., & Siple, P. Remembering in signs. Cognition,
1975, 3, 93-125.Bransford, J. & Franks, J. J. The abstraction of linguistic ideas.
,. Cognitive Psychology, 1971, 2, 331 -350.
Brewer, W. F. Memory for ideas: Synonym subgtitution. Memory & Cognition,
1975, 3, 458-464.Fillenbaum, S. Memory for gist: Some relevant variables. Language and
Speech, 1966, 9, 217-227.
Frumkin, B., & Anisfeld, M. Semantic and surface codes in the memory of deaf
children, Cognitive Psychology, 1977, 9, 475-493.
Johnson-Laird, P. N., & Stevenson, R. Memory for syntax. Nature, 1970, 227,
412.Klima, E., Sc. Bellugi, U. The signs of language. Cambridge, Mass.: Harvard
University Press, 1979.
Kolers, P. A.., & Ostry, D. J. Time course of loss of information regarding
pattern analyzing operations. Journal of Verbal Learning and Verbal
Behavior, 1974, 13, 599-612.Liddell, S. K. An investigation into the syntactic structure of American.Sign
Language. Unpublished doctoral dissertation, University of California,
San Diego, 1977.Newkirk, D., Klima, E. S., Pedersen, C. C., & Bellugi, U. Linguistic evidence
from slips of the hand. In V. Fromkin (Ed.), Errors in linguistic
performance: Slips of the tongue, ear, pen, and hand. New York:
Academic Press, 1980.
Poizner, H., Newkirk, D., Bellugi, U., & Klima, E. S. Representation of
inflected signs from American Sign Language in short-term memory Memo
& Cognition, 1981, 9, 121-131.
Sachs, J. S. Recognition memory for syntactic and semantic aspects of
connected discourse. .Perception & Psychophysics, 1967, 2, 437-442.
Sachs, J. S. Memory in reading and listening to discourse. Memory &
Cognition, 1974, 2, 95-100.
Stokoe, W. C., Jr., Casterline, D., & Croneberg, C. A dictionary of American
Sign Language. Washington, D.C.: Gallaudet College Press, 1965.
Trembath, A. A. Comparison of-j sensitivity to the surface and deep structure
of sentences in child-en. Language and Speech, 1972, 15,51-57.
Wanner, E. W. On remembering, forgetting, and understanding sentences. The
Hague: Mouton, 1974.
153
187

O
FOOTNOTE
1Words in capital letters represent English glosses for ASL signs. Thegloss represents- the meaning of the basic uninflected form of a sign. Abracketed symbol following a sign gloss indicates the grammatical process thesign has undergone (X: for referential indexing; M: foI modulation for temporal aspect or focus; N: for numerosity inflection; D: for derivationalprocess; iD: for, idiomatic derivative). The symbol may be followed by aspecification of the inflectional process or by the meaning of the inflectedform. For ex'ampla, GIVE[N:Exhaustive] and GIVE[N:'to each'] are alternativeways of representing the same inflectional process. The solid bar abovespecific parts of a sentence indicates sentence topicalization.
194
188
9

PERCEPTIft OF NASAL CONSONANTS WITH SPECIAL REFERENCE TO CATALAN
Daniel Recasens+
1. INTRODUCTION
In this paper I study the role that different place cues play in the
recognition of nasal stops. I claim that their perceptual relevance isstrongly dependent on how they are related et the articulatory and acoustic
levels 'and, essentially, on the nature of the process of speech perpeption
itself. I 'show that this is the case by investigating experimentally
interactive perceptual effects between transitions and murmurs in the recogni-
tion of final unreleased alveolar [n], palatall.p.] and velar [7].afterlaj in
Catalan, using synthetic speech stimuli.1 Special emphasis is given to the
cues for the palatal nasal.
I proceed first to investigate what acoustic properties of the signal can.,
be shown to convef-place information by -looking at a large amount of
production and perceptual data on nasal murmurs and formant transitions. The
role of releases in the process of place identification for nasals is also
taken into account. 'A consideration of other cues besides formant transitions
seems highly advisable. In an early perciptual experiment with synthetic
speech (Liberman, Delattre, Cooper, & Gerstman, 1954) it was found that, in
contrast with initial non-nasal stops, final nasal consonants ([m], Ln], DO)
after different vowels were properly identified only 55% of the time for
stimuli with appropriate transition endpoints and a cross-category fixed nasal
murmur. Results from more recent' experiments, both with synthetic (Garcia,
1966, 1967a, 1967b; Hecker, 1962; House, 1957; Nakata, 1959) and with natural
(Henderson, Note y; Maldbo:4, 1956; Nord, 1976) speech stimuli have shown thatnot only formant transitions but also murmurs and relqases are cues to.place
of articulation for nasal consonants. As will be shown, experimental data
from the literature on speech perception suggest that all these cues for
nasals ought to be considered as interdependent and, therefore, need to be
taken into account in models of the perceptual evaluation of plane cues.
+Also University of Connecticut, Storrs.
Acknowledgment. I acknowledge very gratefully the assistance of _Ignatius G.
Matingly at all stages of this investigation and, especially, in the
preparation of the manuscript. I would also like to thank Arthur
S. Abramson, Louis Goldstein, Alvin Liberman, Bruno Repp, and the Faculty of
the Department of Linguistics of the University of Connecticut fcr their
relevant comments. The research was supported by NICHD Grant hD0199A a9,BRS
Grant RR05596 to Haskins Laboratories. Au abstract of this piper was
presented at the 101st Meeting of the Acoustical Society of America (Journal
of theAcoustical Society of America, 1981, 69, S83). I am also appeciative
of Margo Carter s help with the figures.
EHASKINS LABORATORIES: Status Report on Speech Research SR-69 (1982,j
139
195

One must also consider the place cues for [k] within the overall nasalset. It will be pointed out in what way their being taken into' considerationat the analysis and synthesis levels affects theoretical considerations aboutperceptual relevance of transition patterns advanced by other scholars inearlier experiments that did not account for [Ju].
The allophonic system of Catalan nasals in absolute final position isadequate to test these hypotheses with synthetic speech experiments. It
consists of unreleased [m], [n], [7] and .allows analysis of the
perceptual effects of transitions vs. murmurs with special reference to placecues for [r]. In my experimental paradigm, which differs from approachesipaken previously by other investigators, complete ,patterns of synthetic
transitions and murmurs are directly .based on real speech utterances andcombinee reciprocally in, perceptual continua for all the different placecategories. Perceptual results are related to production data on nasals
collected from Catalan sPeakera and speakers of other, languages, and discussedin the light of the literature. Evidence -for a complementary perceptual
influence of transitions and murmurs consistent with parallel effects observ-able for both cues at the acoustic level is reported. This and other.findingS
argue for, some form of motor theory (Liberman, Cooper,' Shankweiler, &
Studdert-Kennedy, 1967) that refers to the unitary articulatory gesture toaccount for the perceptual processing, of dynamic acoustic cues in syllablesending with nasal stops. An integration model 'similar to that of Dorinan,
Studdert-Kennedy, and Raphael (1977) for non-nasal stops is proposed to
account for the perception of nasals after [a] as well as other" vocalic
nuclei.
Data for nasal consonants in syllable-final position are taken intc
consideration because of the fact that the perceptual effeetiveriess of murmurs -in place recognition in this position is known to be considerably higher than
in syllable-initial position (MaldCot, 1956; Nord, 1976). Open vowels [a],
[2] have been chosen for analysis and discussion since the perception of
consonantal nasalization improves with [al vs. [i], lul (Ali, Gallagher,
Goldstein, & Daniloff, 1971; MSrtony, 1964; Zee, ,1981).. Also [9], which
happens to be harder to identify, in general, than other nasal Consonants(Garcia, 1966, 1967a,b; MaleCot, 1956; Ohala, 1975), can be recognized with
[a] quite easily when synthesized (Hecker, 1962) or presented in natural
speech (Wang & Fillmore, 1961), but rather poorly when it happens to be
o contiguqps to [i], [u]. In section 4, I will also refer to the interactive
effects of nasal cues and other vowel nuclei.
2. CUES FOR NASAL CONSONANTS: PERCEPTUAL RELEVANCE,ARTICULATORY AND ACOUSTIC CHARACTERISTICS
2.1. Manner Cues
Certain well-defined spectral characteristics ofnasal murmurs mark nasalconsonants as a class, independent of place of articulation and the adjacent
nasalized vowels (Delattre, 1958, 1968; Fant, 1960; Fujimura, 1962; Fujimura &
Lindqvist, 1970; Hattori, Yamamoto, & Fujimura, 1958; Mattingly, 1968).
Formant transitions, on the other hkid, are essentially place markers; in
'fact, as shown below, only the first formant transition contributes effective-
190 19)

ly to manner identification. In ,the following paragraphs I refer to those
spectral characteristics; 'their general articulatory correlates and perceptual
relevance, in preparation for discussing not only differences in murmur
patterns for nasals of different place of articulation but also those
experimental paradigms concerned with place identification that make use of
limed or slightly variable murmurs:
a. First formant (N1), at around 250-300 Hz, with higher intensity thanthe upper spectral regions, dependent on a large internal cavity size (pharynx
and nasal subsystems) behind .the tongue constriction because cif nasal cou-
pling. According to Delattre (1958), the intensity level of N1 and the- other
spectral regions of the murmur is around 6 dB (N1) and 15 dB (N2, N3, N4....)
lower than for a, normal non-nasalized vowel. It seems to be the most
important class, cue for nasal consonants, in contrast with the negligible
perceptual role of the frequencies of higher nasal formants (Delattre, 1968).
b.' Presence of an antiformant (NZ), varying in frequency. with place,
according to the. size of the mouth cavity behind the tongue .constriction,
which acts as a shunt. It'seems to convey mainly Place, information.
c. Concentration of formants (N2, N3, N4...) between, 500-4000 Hz, with
large bandwidth (BW) values, mainly due to the large surface, rea of the nasal
cavities and the dissipative energy losses originated within them. The small
perceptual *significance of those formants seems to result not only from their
low intensity level with respect to N1 (especially N2,. often absent, as
reported by Fant, 1962, and Weinstein, McCandless,'Mondshein, & Zue, 1975) but
also from their spectral variability. In synthetic speech experiments, the
following ranges of fixed frequency values have been found effective'in
realizing the nasal murmur when place is Yield constant: 112: around 1000-1150
Hz; N3: around 200072560 Hz (Delattre, 1954; Liberman et al., 1954; Massone,
1980, for Argentinian Spanish; Miller & Eimas, 1977).
The value for N2 has been proved to be dependent on the size of the
narrow velar passage. to the, nasal cavity (Bjuggren & Fant, 1964). The
significance of an N3 around a "typical" 2200 Hz area has also been pointed
out, by Fant (1962); this resonance seems to be chiefly dependent on .the.
characteristics of the pharynx cavity (Fant, 1960; Fujimura, 1962). In line
with these observations, De Mori, Gubrynowicz, and Laface (1979) have recently
proposed the automatic interpretation of any frequency concentration between
2000-2800 Hz as N3 and of the first nasal formant below it as N2 as a speech
recognition rule for identification of nasal consonants.
There are also available data on optimal formant bandwidth values for
consonantal nasality. Thus Mdrtony (1964) has stressed the perceptual rele-
vande of an N2 bandwidth value around 250 Hz. giVen an optimal N1 value at
around 100-150 Hz. Such an N2 bandwidth is close to frequencies chosen as the
most favorable for nasal perception by Nakata (1959) (N2: 200 Hz; N1: 300
Hz)°and Pickett (1965) (Ni., N2, N3: 180 Hz; N4: 300 Hz).-
d. Overall lower intensity level than vowels. House (1957) assigned to
the murmur an intensity 8 dB lower than that appropriate for [i].
191
19

r.
Other manner cues besides nasal murmurs need to be accounted for:
r. Vowel nasalization, taken into consideration in 'experiments withsynthetic speech for a 100 msec (Haskins Laboratories QPR 13, 1954, 'Appendix2) and 20 msec (Miller & Eimas, 1977) overlapping period between vowel andconsonant. It can be simulated by replacing F1 by two formants (N1, Fl) andan antiformant (NZ) and by increasing gradually 'and monotonically N1 and NZvalues from 0 (absence of oronasal coupling) to 600 Hz for N1 and 650 Hz forNZ (Fujimura & Lindqvist, 1970, Figure 13) or 660 Hz for N1 and 700 Hz for NZ(Fant, 1960) (presence of a small degree oforonasal coupling). It would bedesirable to reproduce the effect of higher extra pole-zero concentrations ofthe nasalized vowel and to reach a better Understanding of the configurationof frequency continuities and discontinuities between murmur and vowel for-mants at the closure onset in order to find out to what extent ,they help toidentify consonantal nasality. A continuity between vowel formants'and nasalpoles (F1-N1, F2-N3, F3-N4...) (Fant, 1960) is confirmed by my considerationson analysis and synthesis of nasals (section 3.2.)._ Moreover, Takeuchi,
Kasuya, and Kido (1975) have shown that an uninterrupted pole excursionbetween vowel and nasal consonant, with the addition of some nasalityparameter,that represents the amount of spectral difference between nasal andvowel spectra, can be regarded as a valid cue for detection of nasals as aclass.
b. Nasalized releases following the nasal murmur, different from non-nOtal stop releases in,presenting low-frequency masking (Blur1stein & St-. ens,0g9).
c. F1 transitions, gene'rallY negative but less so than for non-nasal
stops. This differential acoustic cue has perceptual relevance for nasals1Sa class (Fant, 1967; Mattingly, 1968; Miller & Eimas, 1977).
2.2. Place Cues
A. Nasal murmur.
, .
It has been suggested that 'nasal murmurs also play a relevant role in
identification of different 'places of artigulation. Thus, experimenters atHaskins Laboratoriessemphasized very early the, polyvalent nature of formanttransitions and nasal Murmur characteristics iii the process of place discrimi-
nation among nasal consonants (Cooper, Delattre, Liberman, Borst,'& Gerstmiin,1952). As Fent (1980) has proposed recently: "The base rule stating thatstationary segments signal the manner and transitions the place of articula-tion has more exceptions than one might expect. Thus the nasal murmur of [m],
[n], and,[1] may contain strong place cues..." (p. 14). In the light of such
,observations, I will argue for consistent place cues in the nasal murmurportion by comparing relevant production and perceptual data.
Table 1 presents mean and extreme frequency values for N1, N2, N3, N4 and
NZ in production data from male speakers of different languages (Czech,German, English, Hungarian, Polish, Russian, and Swedish)' reported by several
authors. A summary of the results, included at the bottom part of Table 1,
]]
shows that formant patterns for Lja and [7] are very similar except in thecase. of N4, which is higher for L7 than for [Ju]; [m] and. [n] present lower
.,
192
1 98

t.
Table 1
Pole-ssro analysis frequency values (in Ns) Corrsspniing to thenasal murmurs of-Ca), IQ, [r], [91 in Zsech (9), Giruan (9).
Inglis!" (4), Hunigarian (8), Polish (1, 5, 6, 7), Russian (2, 9)and amdish (3) (sale speakers). A susaary of values is also included.
[n]
[T)
1 7 l
. 0
11.300-340250 0
100-350 ,
280 - 290
100-400
300300
310-430-2501 00-300300100 -400330320
310-430-250100 -400345340
320-440300100 -500250-400100 - 400350350
82 n 84 NZ
850-900 1150 -1500 1700-2000
800 1000 2000 550
875-1303 2000-2500 , 1
950-980 1360 1950 750-12541_
800-1200 2150-2500 2800-3000 Ti ,
750 1300 2000 800 -
850 1300 1850 1100
850 2000-2600600-800 1300-1900 1800-2900
900-1000 1500-1800 1900 -2350
800 ------1200 -2000 -13301000-1750 2400-29001000 1450 Moo T450-27001700-2000 2150 -2.500 2800-30001200 1750 2050 1450900 1500 205Q 1750
1 000-1 600 2050830 1900 2200
1000 =1200 1500-1600 2000 -2300800
2200-2500 2800-300011212005
1900 2600 2200
2100 2750 27501000 41650 2180 24001500-2000900-11 00 2200-2500 2850
900 -1300 1500-2200 2000-25501000 2200 29001000 -1250 1625 -2400 3200-4000950 -1150 1700 -2200 2300-3000 above 3000900-1100 2200-2500 2800-30001100 , 1900 '2750 above 38001050 1800 2450 -750-1 500 2300-2600800 2000 2b00
Referinoes.
(1 )Dukievics (1967)(2)Pant (1960)
(3)Pant (1973)il4)7vjtsura (1962)
5)Jasese (1964)(6)Jasomm (1973) 1(7)Kaaprovski (4963)
114dicis
((89))1tomprtl
(1969)(1973)
(1)
-(2)-3
(5)
(6)
(7)
8)(..1Ne
(9)
(1)(2}(5)(6)
&41(9)
(1:(2)
(3?(4)(5)
(6)(7),(8)(9)
Suntan,
(.3 100-400285
600-1300795
1000-260016 10
1700-30002090
550-1250860
(Extremes)(Mean)
In3 100-430 600-2000 1200 -2900 1900-3000 1450-2700 (Eilctressa)300 1115 1790 2190 1770 (4ean)
(1.-3 100-430 800-2000 1500-2500 2000-3000 2200-2400 (Extremes)320 1140 1920 2450 2450 (Mean)
r 3 100-500/ 750-1500 1500-2600 2000-4000 above 3000-3830 (Extra's.)
330 1060 2015 2650 above 3400 (Mean)...*
199193

formant values, those for [A] being even lower than those for [n]. Data on N1
frequency values present a succession [9]>[k]>[n]>[m) presumably related tocross-category differences in size of the coupling section at the velar
pharyngegl passage'and pharyngonas4atract size; although the differences inthose frequency values are small, ler'should be pointed out that they can be'found in data reported by some researchers in Table 1.2 Data on NZ frequencyvalues give an arrangement [9]>I316]>[n]>[m] that is consistent with 9Z depen-dence on the oral cavity size', behind the tongue constriction. (Also forJapanese [m] vs. [n], see Hattori et al., 1958). The summary also shOws
frequency proximity of NZ and some specific formant, depending on placecategory: [m] (N2), In] (N3), [r] (N4), [7] (higher than N4) (Fujimura,1963). A way to look at the distinctive role af NZ is by considering itsposition with respect to two adjacent i.ormants (a pole-zero cluster) at
different frequency regions according to nasal categories of different place.-of articulation (Fujimura, 1963). According to data in Table 1, when valuedreported by different investigators are accounted for, such a classificationprocedure can be said to hold strictly for [n] (N3 between N4) and [2] (abovethe general low formant structure, even above N6, according to Kacprowski &Mikiel, 1965), but not for [m], whose antiresonance can lie between N1 and N2or N2 and NJ, nor [v, whose antiresonance can lie between N3 and N4 or N4 andN5. This variability seems to be partly related to differences in vowel
context..
Information about perceptual relevance of released vs. unreleased murmursas place cues is provided by experiments inwhich they were presented foridentification alone or directly attached to the vocalic pofttion with no
'formant transitions or release. I refer to results obtained for open vowels
[a), Die] with labial, alveolar, palatal, and velar nasal murmurs'in final
position.3
In experiments with natural English speech, released murmur segmentd for
[m] were-bategorized quite accurately (80%-100%) whether presented in isola-tion or following without formant transitions (Maldeot, 1956). Henderson
(Note 1) found for .the c:?rall vocalic 'set 'a higher accuracy in plaCe
identification for [m] without transition or release (about 75%) than for [n],[7] .(65%-75%); following [a], in the absence of formant transitions, the 6"ml
murmur identification was always higher than 90%, independently of the
-presence or absence of release. Identification scores for synthetic -Cm]
murmurs in isolation. with American. English subjectd are reasonably consistent
with results with natural speech (65%-85%) (House, 1957; Nakata, 1959).
Moreover, Manrique de, Gurlekian, and Massone (1980) report in experimentswith natural Argentinian Spanish speech that not only isolated [m] murmurs butalso isolated [n] murmurs give'a higher percentage of [m] than [n] ibentific'a-tions.
The syllable [an], with no transitions or release, is identified 50%-60%of the time (Henderson, Note 1); with release, the average rises to 97% inHenderson's experiment but not in Maldeot's (50%). Both naturally-spoken(Maldeor 1956).and synthetic (House, 1957; Nakata, 1959) In] murmurs present-ed in isolation give the same 50%-60% effect. [n] murmurs not heard as [n]
tend to be heard as [m], as in'Manrique,de et al. (1980).
Dukiewicz (1967) has shown that [p.] murmurs presented in isolation to
Polish speakers elicit no [k] judgments. Correct recognition.,of [JN] improves
30% when murmur is presented with its corresponding onset.
194
2U
z
s.
Isolated [,] murmurs are Tess well identified than those for [n] and f m]cMalcot, 1956: 12%; House, 1957: 62% Nakata, 1959: 41%); they tend to beinterpreted mainly as [m] but also as [ni. _According to Mal4ot, released Peimurmur without transitions is Very poorly identified (34%) and confused mainly
/with [1t.n]. Henderson also finds 19.1 -murmur to be a poor indicator with vowel[E] (45%);_ however, for [a9] ,without transitions, responses rise to 74%'(unreleased Murmur) and 92% (released thurmur)
Frequency valueb chosen in synthetic speech experiments (English, 4Itadti-an, Polish) with fixed and variable- murmur patterns are another usefulindirect source-pf reference in the investigation of murmur structures fornasals of different place of articulation (Table 2). While' experiments withfixed patterns account exclusively for class properties ofcpnsonantal nasali-
ty (section, 2.1.c.), these variable pattern* capture N1 and :gZ' ctyxiamicsoorrectly..to simulate different place properties but reproduce .only -'to somedegree the complex formant structure observed for different nasal consonants(gee Table 1). A good approximation to NZ can be obtained by replacing it,'together with the two surrounding poles, by a single formant having an
appropriate bandwid th. This method -may 'explain good perceptual resultsobtained by Nakata (1959) and Kacprowski and Mikiel (1,965) with initialsynthesis- vaa ues--1-isted in- Table .
A comparison of the- iiroduction.and perception data given above allows usto -infer presumable place cues for nasal consonants. Thus, the remarkableimportance of released or unreleaied [m] murmur in place identification can berelated to the particUlarlow N1 and NZ frequency values within an overall lowmurmur spectrum.- Such spectral configuration has been reported to differconsistently and strikingly frbm that of the other members of the nasal setTable 1; Malercot,1956; Romportl, 1973). The perceptual importance of NZ for
Lm] vs. [n] has been reported :bir De Mori et' al. (1979) and that of a stronglow spactftm: component abotit ;1000-1500 Hz in the cltse of [m] 'vs. a highconcentration about 2300 Hz for [n], _19] Delattre (1 958).
Intraspeaker, and interspeaker inconsistency for murmurs other thafr [m]has been noted in different languages (Malecot, 1956; Delattre, 1958; Rom-portl, 1973). As already stated,carry very little place informaimportant place information -, in th
car. [a] and [z], 'while [] murmur seems toion, [9] murmur and [n] murmur proiid,eunreleased case and are identified quite
consistently' when released. The" perceptual distinctipn petween,[9] vs. [n]could be well cued by,h4sh vs: low N1 and absence vs. presence of NZ at thecentral region of the spectrum. Accordingly, a higher N1 value for [9] (240Hz) than for [m], n] (180 Hz) was reported to help perceptual placeidentification (Haskins Laboratories QPR 11, 1954). NZ's being 'above 3000-Hzor absent in the case of [9] is consistent with Ohala's (1975), observationthat its perceptual effectiveness is presuhably severely attenuated because ofthat high frequency location. High perceptual distinctiveness and, at thesame time, similarity of murmur spectra (high N1 and NZ, similar N2-N3-N4configuration) between [1] ane [31-] accord well with the strong role_of [3t-]
transitions in [3] identification (section 2.2.B.).
With respect to acoustic aspects other than spectral frequency, it hasbeen found that N1, N3 bandwidths for [9] are greater than those for [m] [n]and that [n] presents a very high degree of N2 damping with respect to m
201
195
ti
a

0
Table4
Pole-zero frewency values in 'Hz) corresponding to the nasalmurmurs of [ad, [n]; [r], 7], assigned to synthetic speechstimuli in experiments with English (1, 2, 3)-, Italian (5)
N1
[th] 250180200200
-I - J 300..... I ,
c
. [ n] 250240
- 200- 200
300 '
[ ] 200 .
400
. [1 ] 330' 200
260
and Polish,
N2
-1360100011001100
1100
(4)..
N3
2200225025002500
2000
.,,, 200-02300
= 250028002800
28003000'
-I
2200'2500
' 2300
A summary of values is
N4 NZ-
1..., -- 1550-r.--
. 750 ,._._. ti'
- flip---7 ___.
0003500
_above .
also included. 6
-.
References
_2-
1
(1 )HeCker (192)(2)House (1957) .1(3 )11alcata (1959)(4 )Kacprobrski
& Mikiel cl 965):i5).7rrero et
al. (1977)
(1)(2)(3)(4)(5)
(4) .
(5)-
(1 )(2)(3 )
1300"1100
17001700
, 1800.I
23002300
1300.2300900
7
5000
SumnLaa (Extremes)
[m] 180-300 1000-1360 2000-2500 750-1550-a-,
[n] 200-300 1100-1800-2000-2800
] 200 -4.00 2300 2800-3000
3500-4000ti
a
[2] 200-330 900 -2300 2200-2500 above 5000
196 202
c.
A -
- (Fujinura, 1962). High N1 damping Mr [7] has also biN reported by ott,_25,-
investigators (Fant, 1973; AKacpranfki, 1965). No evidence, about the,perceptJ-
el significance of these tifflerentiFiN- aV4ilable. The perceptual influence
of,coarti(!ulOionerreats'due'to the'adjacent46wels upon place identification
of .a.<1"Rp'saff.conson'ani has been shown in experiments bn' automatic speech
ehognition, (De Mori et al:, 1979); such influence is to be expected fr.om
. - significant,Oriations of the pole-zero structure of the'-rasal, murmur accord-
. 'ring 'to the vocallb environment. 'Moreover, the perceptual importance of
relative amplitude levels at',different spectral area shoulprle investigated.
In this respect it is highly plausible that, according to-data,reported by Eek
(1972, energy minima at,typical NZ frequency zones (Section 2.2.A:) convey
relevant perceptual information in distinguishing nasal categories of differ-
'ent place of artialllatiod.
B. Formant TTansiti,:ns
In Table ,3 I present analysis frequency values for' 17243 transition
endpoints as well as positive (+), steady (=) and negative (-) transition
ranges according to-data on syllables with [a) and [m], tn], [7], 19] reported
by several authors.4 The four languages that have [jr,) have peen chosen are
Hungarian, Italian, Polish, and Russian.
AcCOrding to the summary presented_ at the bottom of Table 3, F2 for [1
does not overlap in frequency with ottiee categories and shows a constant
.(positive) transition direction. In fact, a250 Hz separatio6 minimum between
F2 values for (n) and [julis a good indication of high F2 distinctiveness for
Sucha difference was also found fore Czech and Russian by Roniport'.
(1973) (h):' 11001300 Hz; [J]: '1600-1800 Hz).O
On the other hand, F2 transition values for (9) overlap stgnificantly
with those for-other nasals, namely [m) and In), being in the central part, of
the overall 'range of endpoint frequency values .fOr the consonantal set.
Variability of F2 transition values with [al from slightly rising to steady
and slightly palling has also been noted for the velar non -nasal Correlates
[g], [kl (Fisther-J6rgensen, 1954; Halle, Hughes, & Radley, 1957; Potter,
Kopp, & Green, 1947). See, however, Dalby & Roit, 1989, who found quite
strongly positive.F2 ranges)... Flat transitions were found for English (09) by
Green (1959).
Predictions of acoustic theory of speech production support F2-F.'3 values
reported in Table 3. Thus, a comparison with one of Fant's nomograms (1960,
p. 84). shows ttiati, while given frequencies for labial and alveolar nasals
match well with constriction .pointi located near the lip opening area, formant
frequencies for (9) Correspond to a constriction place at about 9 cm from lip
opening and 'those for (714,to a' constriction at about 4 cm. Negative
transitions for tml are due to a complete, labial constriction. On the 'other
hand, a more forward constriction.point for [n), [1 than' for [9) causes F2.
and F3 values for [a) to- increase as a result of a decrease in front cavity
Size. Higher frequency for palatals than alveplars is presumably related to a
greater increase in .the conductivity index of the internal resonator neck:
palaographic evidence for in different languages, often shows alveolar
contact, as for plus several degrees of prepalatal and/or dorsopalatal
contact.
. 203' \

)
"I
9
Table
Analysis frequency values (in Hsi corresponding to 1,2-ntransitions ih syllables with (8 and [sib [a], [7]
in Hungarian (3),'Italiai (5, 6), Phlish (1, 2) and Russian (4).A susery'of values is also included.
Endpoints Ame4
F2 n r2
0 [a] 1000r 2850-
,1100- 3050
1050 1695
800 2150-./ 1200 2340_
[n] 1250- 2800-1500 . 2900
-50/-250
-380-500-200
50/.200
* Direction References
F3 ,..72 F3
50/ (1)Dukiewics (1967)/00
(2)Jassse (1962,1964)-500 (3)Magdics (1969)-50 (4)Yant (1960)-140 .(5 )Vagges it
al. (1978)
-150/ 4 (1)-.200
T550 , .7650 7f20 =5'4o
2-.__---1400- 2250 0 -50
15001425 2665 55 401450- 2650 i 50 -50 /..1500,
...
. 4.) 1900- 2500- 500/ '450/ /-/" -(1)2300 43160 109O .550
. . (2)To 2032 , 495 % :1-95` (3)2 50 2850 550/ 550 (4)
6502140 2990 825 475 -. (5)
2200 3200 050 350 t (6). .
g3(4 )
(5)
(6)Ferero ital. (1979)
[7 ] 900-'1400
'2900- -50/ -100/ -' 3200 , -200 600
-/.
Po
(a] 800-1 200
- /-
-/ (1) .
(2)(3 )
Suatqa
1695- -50/ -500/ -( -)
3050 e500 .100
[n] 1250- 1650- 0/ -540/ (wY1,693 4e:2900- 220 200
- (+
(1.] 1. 2300
900-
.198
2030- 495/. -450/3200 -3.+1004 550
6 [7 900- 2900- -50/ 410 -100/ - ('1400 3200 -200 00 )
.204-
1:4AM.

5
Besides conveying- manner information, F1 transition values seem to
contribute to place identification. Thus, while the 41.] transition is
extremely negative (Fant,.1960; Vagges, Ferrero, CaldognettoMagno, & Lavagno
li, 1978), that for [9] is usually only slightly negative and can even be
positive (Dukiewicz, 1967). For [a] followed by ir], the negativity is due to
an important increase of back cavity size and a noticeable increase of vocal
tract constriction (Delattre, 1951; Faht, 1960). The slightly negative F1
excursion between [a] and [9] is related to a smaller increase in pharynx
cavity size.
Available data on perceptual experiments with natural, speech and synthet
ic speech give information about the relevance of formant -transitions in place
recognition. According to Henderson (Note 1), sequences of \a] followed by a
nasal consonant, without nasal murmur and with or without fi al release, give
60% of [n] responses when presented with -[m] .transitions and 80% of [n]
responses with [n] transitions but only 15%-30$ of *.respohes with [9]transitions in favor of a majority of [an] judgments. For [10, with natural
Polish speech, Dukiewicz (1967) found that transitions compensated for the
negligible place information conveyed by murmurs (section 2.2.A.).
4 In Table 4 I present transition frequency values reported in perceptual
tests with Englishspeaki,ng,subjects for synthetic [m], [n], [9] and vowels
[a], ,ble]. Unlike the murmurs,'there is much available perceptual data on
transition cues; .A comparison of-yalues for [a] in Tables 3 and 4 shows that
F2 frequency vanes categorized as [9] in synthetic speech experiments (1920
2300"Hz) correspond exactly to analysis values for F2 of [J.] while analysis
values for F2 of [9] correspond to values' categorized as [m] and [n] in
experim6nts with synthetic speech. It also suggests that, in the absence of
N as a labeling category,,theE2 difference of 250 Hz (1650-1900 Hz) between
transition frequency values appropriate for [n] and [7] (Table '3) was
interpreted exclusively as [J] by English listeners (Table 4). On these,
grounds, it seems clear that stimuli with [J] like transitions were interpret
. ed as [9] by .English listeners but might well have been categorized as [1,1 by,
speakers of other languages, while stimuli with [9]like transitions, in the
Absence c( an appropriate negative F3 and some [9] like murmur spectrum, were
interpreted as [m] or [n]. This view is supported by observations reported in
the litetrature. Thus experimenters at Haskins Laboratories stated that while,
with no F3, "a.large plus F2-transition is heard as N... rather than [9],
with a 3 transition'positive F2 transitions are now heard clearly as [9]"
(Haskins Laboratories QPR 8, 1953, pp. 21-22). Direct evidence about the,
effect of a strongly rising F2 in cueing palatals is also provided by Derkach,
Fant, and SerpaLeitg' (1970) for Russian palatalized consonants. Thus, they
found this F2 transition type to be the most relevant perceptual.palataliza
tion cue with vowel [a]. Consistently with the contrast in formant transition
patterns for N and [p], important improvements in identification of the non
nasal stop [g] without F3 transition (Liberman et al., 1954) were found to be
dependeneon the presence of an optimal 480 F3 (Harris, Hoffman, Liberman,
Delattre, & Cooper, 19581. In' studies on 'speech analysis listed in Table 3,
the direction of F3 mas found to be predominantly negative as well.
In the light of previous comments, there are reasons. to .believe that
degrees of F1 excursion should be included as variable parameters in perceptu
al continua of place identification for 'nasals. Thus, as shown on other
205
199

[m]
[n]
[ 9
[m]
[n]
Table 4
Frequency values (in Hz) correspondinKto F2-F3 transitions insyllables with [a], * and [4;4 ln], 1.17] obtained from synthesis
experiments with English. A summary of values is also included.
Endpoints
F3
____
2000-'2300
-7-
2400-3000___
___
,
2200-2400
,
Ranges
F3
_
-200/+100
....._
+360
4 2 00/+800_-360
0/+200
-200/+100
+200/+800
-360/+200
Direction References
F2
ar.700(Locus)900-1450ar.1 300
1000-1300920-1300
ar . 1800
(Lo cus)1450-1 690ar.180C1300-1.9201300-1700
] ar. 3000(Locus)1 92 0-23002000
F2
___.
-1 90/+3 60
-200
-500
-310/+70
____
+560/+800
+300
-500/+120+70/+470
_+830/+1 210
4-200 - --+120/+500
Summary
F2
-
-1+
-
-1+
+
+
+
4+
+
+
+
+
+
- (+
+ (-
+
)
)
F3
(1 )Liberman etal. (1 954 ) ([x] )
(2 )Naka ta(1 959)([4] )
___ (3)Hecker
(1962)(X)- (4 )Garcia (1966,
1967a,b)([7C])(5 )Miller & Eimas
(1 977 ) ( [a] )
+ (1 )
_ (2)
(3 )_+ (4)
_ (5)
(1 )
_ (2 )
(3 )77= (4)
..11.
- (+ )
+
4, ..,
-(=,:+ )
1 92 0-23C3
900-1 450
1300-1 890
] 1 92 0-2300
-500/+3 60
0500/+800
+120/+1 210
200
2U6

grounds by Derkach et al. (1970), a strongly negative F1 transition is to be
considered a relevant palatalization cue. The perceptual 'releyance of a
higher F1 starting-ending point in identification of a non-nasal velar [g] vs.
[d], [b] has been pointed out by Fujimura (1971).
Individual and overall duration of formant transitions can be shown to
differ among place categories. It is significant that details about this
aspect (longer transitions for [9], shorter transitions for [m] and (n)) have
been taken into consideration in works on speech synthesis (Hecker, 1962;
Mattingly, 1968; Nakata, 1959). One must point out that such observationsabout relative transition duration for different categories mean little unless
vocalic context is kept constant. In such ciicumstances, duration of F2
transition was found to be a rather important cue for the identification of
different Polish nasal-vowel sequences (Kacprowski & Mikiel, 1965),.
C. Interaction of Cues
In sections 2.2.A. and 2.2.B. I have taken into consideration how formant
transitions and nasal murmurs- contribute separately to the identification of
nasal consonants of different place of articulation and what acoustic traits
make transitions and murmurs perceptually relevant in such an identification
process. Results show that:
(1) either [m] transitions or [m] murmur are sufficient place identifi-
cation cues for [m]. The strong perceptual role of [m] murmur in [li], [a]
environments is to be particWarly emphasized (Carlson, GranstrOm, & Pauli,
1972; Henderson, Note 1; Malecot, 1956);
(2) [n) transitions are more powerful place cues than [n] murmur for [n]
identification;
(3) [9] cues, transitions, murmur, and release, are needed for a
satisfactory [9] identification with vowels NO, Eel but not with.[a]. In
this case [9] murmur is a stronger cue than [9] transitions;
(4) [:,p-] transitions but not [jm murmurs are sufficient place identifica-
tion cues for [..N.
The arrangement of cues in running speech suggests that place cues for
nasals ought to be explored interdependently instead of in an isolated way.
Any attempt to detect them, should focus primarilyon the interactive role of
transitior/f, murmurs, and releases. Results reported by experiments with
natural and synthetic speech, already discussed, can'be said to adduce some
valuable (although indirect) -information to this issue. Such experiments
presented murmurs in isolation for identification (Dukiewicz, 1967; House,
19571 Mal(cot, 1956; Manrique de et al., 1980; Nakata, 1959) or murmurs or
transitions combined with-the vocalic° steady state 'portion, with or without
final release (Malecot, 1956; Henderson, Note 1). But, none of such attempts
succeeded in combining all cues reciprocally to detect possible cross-category
effects. A more realistic approach is reported by Malecot (1956) who, in
addition to the experiments mentioned- above, compared the cue value of
transitions and released murmurs extracted from natural speech utterances with
Dga and [M], [n], [1,7]; stimuli were tested with American English subjects.
201
207
a
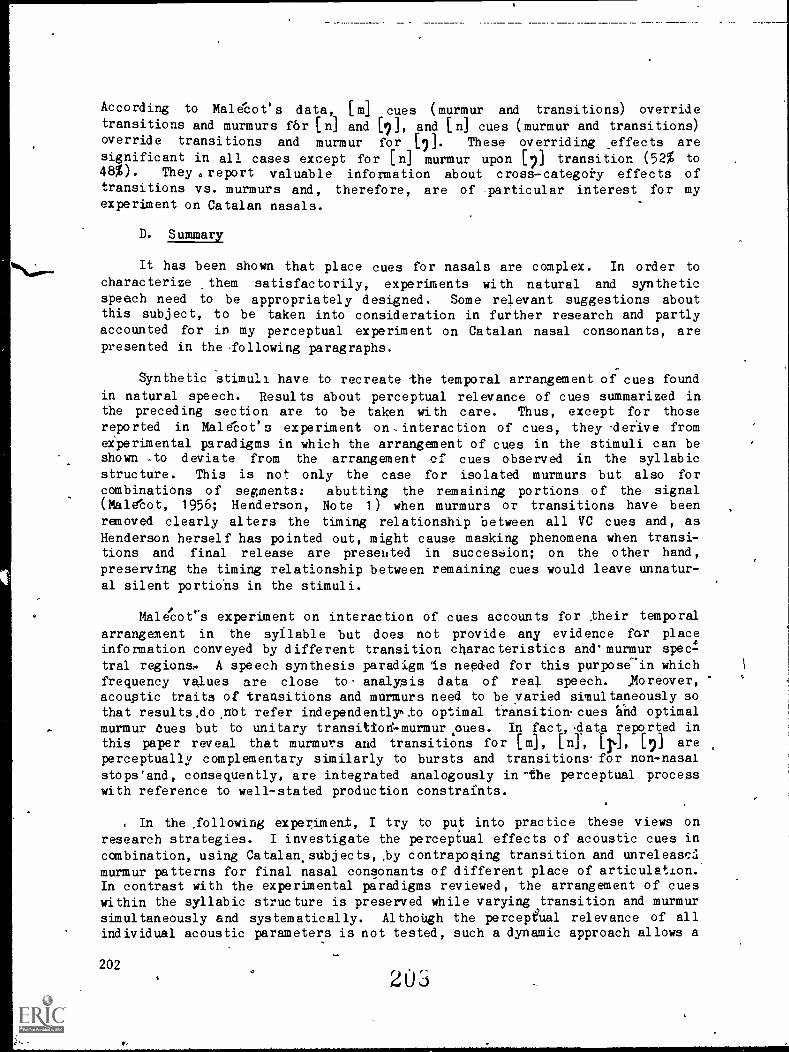
According to Malicot's data, [m] cues (murmur and transitions) overridetransitions and murmurs for [n] and [9], and [n] cues (murmur and transitions)override transitions and murmur for [7]. These overriding effects aresignificant in all cases except for [n] murmur upon [7] transition. (52% to48%). They . report valuable information about cross-categoi7 effects oftransitions vs. murmurs and, therefore, are of -particular interest for myexperiment on Catalan nasals.
D. Summary
It has been shown that place cues for nasals are complex. In order tocharacterize them satisfactorily, experiments with natural and syntheticspeech need to be appropriately designed. Some relevant suggestions aboutthis subject, to be taken into consideration in further research and partlyaccounted for in my perceptual experiment on Catalan nasal consonants, arepresented in the -following paragraphs.
Synthetic stimuli have to recreate the temporal arrangement of cues foundin natural speech. Results about perceptual relevance of cues summarized inthe preceding section are to be taken with care. Thus, except for thosereported in Maletot's experiment on- interaction of cues, they -derive fromexperimental paradigms in which the arrangement of cues in the stimuli can beshown -to deviate from the arrangement of cues observed in the syllabicstructure. This is not only the case for isolated murmurs but also for
combinations of segments: abutting the remaining portions of the signal(Maletot, 1956; Henderson, Note 1) when murmurs or transitions have beenremoved clearly alters the timing relationship between all VC cues and, asHenderson herself has pointed out, might cause masking phenomena when transi-tions and final release are presented in succession; on the other hand,preserving the timing relationship between remaining cues would leave unnatur-al silent portions in the stimuli.
Malecot's experiment on interaction of cues accounts for their temporalarrangement in the syllable but does not provide any evidence for placeinformation conveyed by different transition characteristics and murmur spec-tral regions, A speech synthesis paradigm is needed for this purpose-in whichfrequency values are close to analysis data of real speech. Moreover,acoustic traits of transitions and murmurs need to be varied simultaneously sothat results,do not refer independently' to optimal transition cues and optimalmurmur cues but to unitary transition- murmur soues. In fact, data reported inthis paper reveal that murmurs and transitions for [m], [n], tr], [9] are
perceptually complementary similarly to bursts and transitions for non-nasalstops'and, consequently, are integrated analogously in -the perceptual processwith reference to well-stated production constraints.
In the ,following experiment, I try to put into practice these views onresearch strategies. I investigate the perceptual effects of acoustic cues incombination, using Catalan. subjects, .by contrapoaing transition and unreleasF...z1
murmur patterns for final nasal consonants of different place of articulation.In contrast with the experimental paradigms reviewed, the arrangement of cueswithin the syllabic structure is preserved while varying transition and murmursimultaneously and systematically. AlthoUgh the perceptual relevance of allindividual acoustic parameters is not tested, such a dynamic approach allows a
202
203

better understanding of their role within, the overall transition and murmur
patterns as well as the VC structure. Analysis data that have been'reviewed
and theoretical issues that have been raised as well as additional informationobtained from Catalan speakers are taken into consideration.
3. AN EXPERIMENTAL STUDY ON CATALAN NASAL CONSONANTS
1. Phonetic and Phonological Description n
ri ri I-,In Eastern Catalan phones Lmj, Lni, [p], L9j appear in absolute final
position. [m], [n], LT.] also appear intervocalically and correspond to
underlying /m/, In!, /y./. [9] is found word - internally only immediately
before [k] and, in final position, occasionally in free variation with [7k1depending on the speaker and the lexical item. These phonetic facts argue for
[7.1 being an allophone of underlying In/ before a velar stop, generated by thefollowing. phonological derivation (see also Maseard, 1978):
"Underlying form" /sang/ /bank/
Regressive Assimilation P 9Optional Deletion (0) (0)
Devoicing (k)
"Surface form" sat)( k) j [1:49( k) ] ,
'blood' 'bench' .
The presence of underlying /g/ and /k/ accords well with the phonetic
realization of derived formations such as [sa9gi'nari] 'bloodthirsty' ,
[sZ9gu' nos] 'bloody' , [bag' kg.t?r, low bench' . Other minimal pairs with
contrasti,tif; nasal stops in final position can be found. Thus 'hun$ef'l
[fan] (they) do' , [fay] 'mud' ; [barn] 'Aux. we go' , ,[banj 'edict' , Lbasiq
`bath' [by] 'bench' .
Final [m], [n], Lit], [9] are weakly released or unreleased according to
individual speakers. Given the occurrence of the full set of nasals of
different place of articulation and the unreleased murmur condition, it is
possible, then, in Eastern Catalan, to investigate the role that transitions
and unreleased murmurs play in the process of identification of different
final place categories.
2. Production Study
Analysis values corresponding to production data from a single male
Catalan speaker were chosen as reference points for the, patterns to be used in1synthetic speech experiments. Several samples of monosyllabic minimal pair''were analyzed by means of a Voice Identification sound spectrograph, a digital"0-a-c
spectrographic analyzer and a linear prediction model analysis. To see to
what extent acoustic patterns found, in production data on nasal's from this
reference speaker were in accordance with those of other Catalan informants,
data on the same minimal pairs embedded in a neutral sentence were also
collected from 12 other.male Catalan speakers and analyzed spectrographically.
Frequency values for the refetence speaker as well as range of frequency
203
209
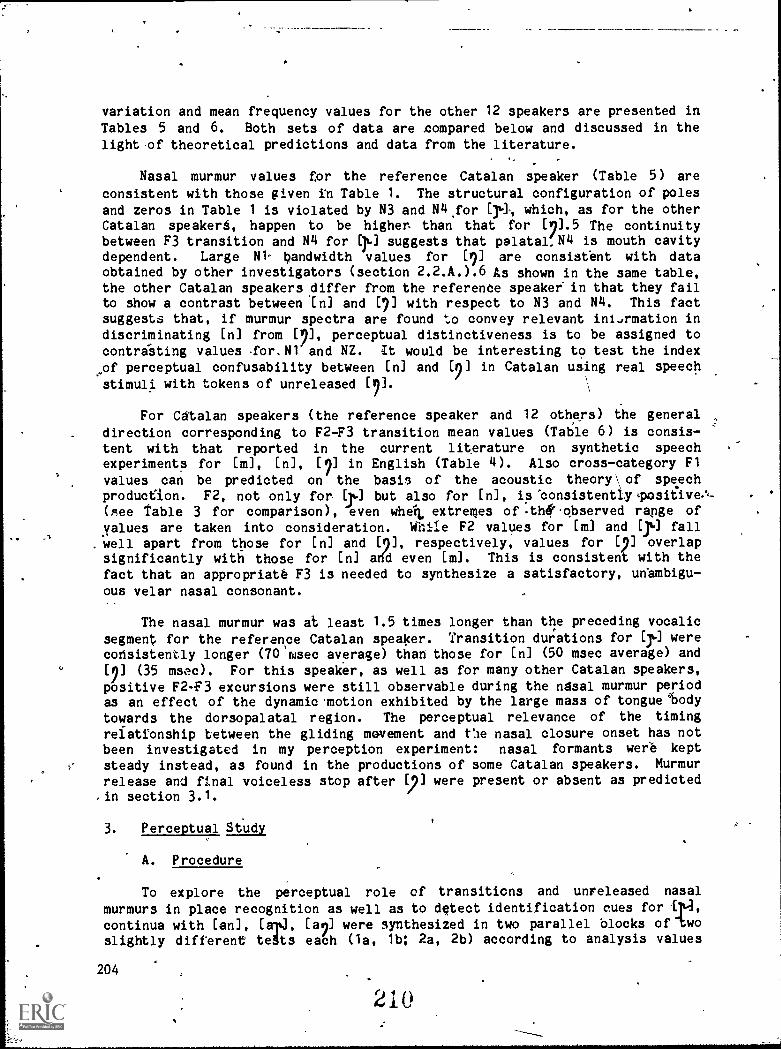
variation and mean frequency values for the other 12 speakers are presented in
Tables 5 and 6. Both sets of data are 4ompared below and discussed in thelightof theoretical predictions and data from the literature.
,
Nasal murmur values for the reference Catalan speaker (Table 5) are
consistent with those given in Table 1. The structural configuration of poles
and zeros in Table 1 is violated by N3 and N4.for 17, which, as for the otherCatalan speakers, happen to be highe than that for [9].5 The continuitybetween F3 transition and N4 for qo suggests that palatal, N4 is mouth cavitydependent. Large N1 bandwidth values for [9] are consistent with dataobtained by other investigators (section 2.2.A.).6 As shown in the same table,the other Catalan speakers differ from the reference speaker in that they failto show a contrast between [n] and [9] with respect to N3 and N4. This factsuggests that, if murmur spectra are found to convey relevant intarmation indiscriminating [n] from [9], perceptual distinctiveness is to be assigned tocontrasting values or.N1 and NZ. It would be interesting to test the indexof perceptual confusability between [n] and [9] in Catalan using real speechstimuli with tokens of unreleased [9].
For Catalan speakers (the reference speaker and 12 others) the generaldirection corresponding to F2-F3 transition mean values (Table 6) is consis-tent with that reported in the current literature on synthetic speechexperiments for [m], [n], [9] in English (Table 4). Also cross-category Fl
values can be predicted on the basis of the acoustic theory\ of speech
production. F2, not only for- [16] but also for [n], is 'consistently.positiveA-(ee table 3 for comparison), even whet extremes of thetobserved range ofvalues are taken into consideration. While F2 values for [m] and [r.] fall
. well apart from those for [n] and [9], respectively, values for [9] overlapsignificantly with those for [n] and even [m]. This is consistent with thefact that an appropriatt F3 is needed to synthesize a satisfactory, unambigu-ous velar nasal consonant.
The nasal murmur was at least 1.5 times longer than the preceding vocalic
segment for the reference Catalan speaker. Transition durations for [:16] were
consistently longer (70 msec average) than those for [n] (50 msec average) and[9] (35 msec). For this speaker, as well as for many other Catalan speakers,
positive F2-F3 excursions were still observable during the nasal murmur periodas an effect of the dynamic motion exhibited by the large mass of tongue 'body
towards the dorsopalatal region. The perceptual relevance of the timing
relationship between the gliding movement and t'le nasal closure onset has notbeen investigated in my perception experiment: nasal formants were keptsteady instead, as found in the productions of some Catalan speakers. Murmur
release and final voiceless stop after [;2] were present or absent as predictedin section 3.1.
3. Perceptual Study
A. Procedure
To explore the perceptual role of transitions and unreleased nasal
murmurs in place recognition as well as to detect identification cues for IA,continua with [an], [7], [a9] were synthesized in two parallel blocks of wo
slightly different to is each (la, lb; 2a, 2b) according to analysis values
204
210

Table 5
Analysis frequency values (ranges and means) (in Hz) for murmurs
in VC syllables [Am], [in], [at], [a9] according to data from a
single Catalan speaker and 12 other Catalan subjects.
N1
[m] 200
170-
320255
.,-
[n]'.200-.
300BW:180225-
N2
1120
910-
11051 1015
N3
1360
1120-
15101300
-
.
N4
2100
1370-18001565
,
NZ
__.
_
Subjects
Mangle subject(2)12 subjects(range values)(3)12 subjects(.mean values)
800- 1460- 1950- 1780 (1)
900 1650 _ 2100
BW:330 BW:235880- 1440- 1775- (2)
1135 1640 2600
1035' 1515 2130 (3)
900- 2000- 2900- 236,0- (1)
1150 2200 3350 3000
BW:220 BW:140 BW:140
800- 1365- 1740- (2)
1180 2335 3000
1055 1760 2265 (3)
1150- 1860- 2430- 2900- (1 )
1240 2200 2650 3400
BW:200 BW:300 BW:250
900 1375- 1960- (2)
1240 1640 2730___
1060 1530 2160....._
(3)
325
285
180-
230BW:150200-
340295
[9 ] 300-400BW:275
225-360
295.
211

[a]
Table 6
Analysis frequency values ( ranges and means) (in Hs) for transitionsin VC syllables [sad , [sr-], [al] according to data frog
A single Catalan speaker "add 2 other Catalan subjects
V steady-state
1P1 P2
920 '1435630- 1110-/25 1 580725 1 290
[a] 920
570-. 805
715
1535
1 200-.15101 325
920
685-875755
1535
1200-1 5701400
121 920
685-900770
1535
1285-,16801440
[a]
Ranges
1,1
-120-155/-25-70
P2-285-270/+30-75
[s] -145
-90/0-30
-5/+95+115/+300+235
]-370-425/+50-120
+305./+445+200/+630+460
0
[2 ] 40 -135/
-100/ -75/+10 +450
1P3
'Endpoints Subjects
PS Pt P3. -
2420 800 1150 2420 (1 )Single subject1940- 525- 980- 1880- (2)12 subjects2250 765 1 560 2250 ( range values)
-2130 655 A215 2075 (3)12 subjects
(mean values)
2520 775 1 540- 2600 (1 )1 630
1955- . 525- t350- ,1 95521 (2 )
261 0 760 1660 261 02300 685'' 1560 2365 (3 )
02520 450- . 1 840- 2750-(1 )
550 1980 28501975- 405- 1'625- 2025-(2)2700 805 2050 29252315 635 1 860 2440 (3).
2520 . 900 1400 - 2125- (1 )1640 2500
1995- 645- 1 310- 1860- _(2 )
2700 900 2025 24752255 740 1550 2140 (3)
Direction
'3 P1 1P2 1P3
0 (1)-110/ -( ', -( ) (2)0 )-55
+80 +(-) (1 )
-190/ (- ) (-, -) (2)+285+65 (3)
+230/ (1 )
+330-285/ -(, -) (-, -) (2)+435+125 .
(3)
-395/ - / +/- (t )-20-315/ -(-) +( -) -(+, -) (2)+90-65 (34

C.
[
for the Catalan reference speaker displayed in Tables 5 and 6: Theisynthetic
stimuli were prepared using a software serial formant synthesizer (SYNTH) at
Haskins Laboratories with variable BW parameters, an extra pole (used as N2)
and an extra zero (used as NZ) (Mattingly, Pollock, Levas,'Scully,1 & Levitt,1981).
In tests la and lb a series of variable F2 -F3 transition endpoints was.
. .
combined with three fixed murmur patterns believed to be optimal for [n], [31],
[1]; in tests 2a and 2b a series of variable murmur value6 was co binee withthree' fixed-, optimal transition patterns. In contrast with previdus experi-
mental studies, these two conditions allow us to determine idehtificationfrequency ranges across place categories for transitions and murmurs as wellas to investigate more adequately the interaction of the two acoustic cues
within a syllable structure recreated from that of natural speech utterances.., Actual values are given in Figures 1 and 2. Poles, of the murmur pattern are
represented by.single lines and zeros by double lines. Test la dliffers from
lb and 2a from 2b in vowel steady state and transition endpoint va1ues. Two°
versions' of the same experimental design were given simply to\ test the
perceptual effect of a larger variety of F2-F3. transition Ira ues and,
therefore, lo be able to determine _identification cross-over poipts with
higher precision. I give some details about the variable transition endpoints(Figure 1) and variable murmur structures (Figure 2), which will be taken intoconsideration in the discussion section on perceptual data obtained from
Catalan informants:
a. F2 transition end points:
Test la: From 1430 Hz (-70) 'to 1920 Hz (+420) in 7 steps of 70 Hz;
Test lb: From 1600 Hz (0) to 2000 Hz (+400) in 8 steps of 50 Hz.
b. F3 transition endpoints:
Test la: From 2340 Hz (-160) to 2900 Hz (+400) in 7 s ps of 80 Hz;
Test lb: From 2300 Hz 4-300) to 3100 Hz (+500) in steps of 100 Hz.
c. Nasal murmur structures:o
N1: From 250 Hz (6 steps) to 350 Hz in 5 steps of 20 Hz;
N2: From 900 Hz to 1200 Hz in 11 steps of 30 Hz;
N3: From 1600 Hz to 2100 Hz (6 steps) in 5 steps of 100-Hz;
N4: From 2500 Hz to 3000 Hz and vice versa in 5 steps of 100 Hz;
'NZ: From 1800 Hz to 3200 Hz in 11 steps of 140,Hz;
Formant bandwidth values were also varied across stimuli according to
frequencies incl ed in Figures 1 and 2. A constant value of 900 Hz for Fl
was chosen. Prece ing [a] was nasalized from vowel onset to transition
endpoint by means of progressive frequency rise of a single low pole (500 .to
-600 Hz) - zero (500 to tOQ Hz) pair. Each stimulus was 560 msec long, having
a vowel steady state of 2 msec, a transition of 60 msec and amTArmur-partion
of 300 msec. There was a pro essive 10 dB decrease -from vowel to murmur and
an FO lowering slope between vor 1 onset (120 Hz) and murmur offset (80 Hz).
213
207
V.

t.
Frequency(in Hz) Transitions
2200
11100
(lb)(1a)
1400
1000
000
200
J
Murmurs
ink Cr)
150
° 250 250
150 300
300
200200
200
-300130 100
Figure 1.- Synthesis patterns for taste to and lb. (fixed murmur conditions)with inclusion of bandwidth values (In Hz) for murmur torments.
214.

Frequency -(in Hz) Transitions
9000
2800
Murmurs ,
. 3....,
170 150 170^
INIIIIIIM
2=
190. , led .--.. .
' 210250 23° .
11111
.
/,
2, 10 23o250 4. .
....
=130 180 210 240 ioo27o180=lint
......
210_270
300 240
--........200200 200 200 200 200200200 200200 200
--- -100 142 154 188 178 190 212 234 23°273300
Figure 2: Synthesis patterns for tests 2a and 2b (fixed transition condition)with inclusion of bandwidth values (In Hi) for murmur formants.
., 215

Every test was administered using several stimuli per s'ep and the
overall set of stimuli randomized before presentation for identification.Overall, test la was composed of 144 tokens (6 per step), test 1)) of 162 ('6
per step), test 2a of 165 5 per step) and test. 2b of 176 (4 per step).Intervals of-4 sec were included between successive stimuli and longer 10 msecintervals after ever/ ten stimuli. Twe'niy-four paid Catalan subjects took
each of the four tests twiceand.were asked to identify orthographically thefinal nasal stop as [n], [1.1u] or [9]., 'They were all students who had- had no
previous experience with synthetic speech and did not know the purpose of the
experiment. Thirteen took the tests binaurally through headphones; the rest^listened to stimuli reproduced through' a* loudspeaker because of problems
connected with taking the tests in the 'field. To find out whether suchdifferent listening conditions could have had some strong effect on subjects'responses, I listened to stimuli under both conditions and obtained almostidentical cross-over points and response distributions.
B. Results
Table 7 shows category judgments for each test in all variable
conditions; data from all subjects and from the most consistent 14 labelers
are reproduced separately. Results for variable-condition have been
displayed in Figures 3, 4, 5, and 6. Figures 3 and 4 give perceptual dataobtained from tests la and lb, and Figures 5 and 6 give data from tests 2a and
2b. Figures 3 and 5 give data from all 24 Catalan subjects an' in Figures 4.
and 6 data from the most consistent labelers (14 selected subjects). Each
subplot in Figures 3 and 4 represents judgments for a particular murmur;
stimulus numbers for different F2-F3 transition values lie on the abscissa.
Each subplot in Figures 5 and 6 represents judgments for a particular F2-F3
transition set; stimulus numbers for different murmur values lie on the
abscissa. Among all subjects those who identified the stimuli with most
consistency were chosen as "best" labelers. A comparison of identificationcurves obtained from these 14 selected infonnants with those obtained from all
24 shows that, as expected, the best labelers categorized stimuli more
-,distinctively. Thus, the folloWing summary on perbeptual data about [n], [iu],
[71 identification will refer mainly to responses obtained from the most
consistent Catalan subjects.
/
a. Table 6.-A comparison of percentages of category identification
between murmurs and transitions shows that the labeling of appropriate
transitions is always more consistent than that of appropriate murmurs. The
effect of transitions vs. murmurs- in both sets of tests (1a-2a, lb-2b) is much
higher for y] (2.5-2.8 ratio) than for [n], [9], and for [n] (1.4-1.7Nratio)
than for [9 (1.1-1.6 ratio).
Tests la and lb show that an optimal [j.] murmur dOes not favor the
identification of one or another of the ,place categories._ An optimal [n]
murmur sliptly favors identification of [nj, [q vs. [9] (see test lb). An
optimal [9j murmur favors significantly [9] vs. n] responses (1.5-1.9 ratio).
Tests 2a and 2b show that the presence of optimal [)] transitions
correlatei significantly with [7] vs. [nj responses (1.1-2.1 ratio) while that
of ofilimea bij-trani-tions-aor-relates__significantly with [n] vs. [1) responses
(1.1-2.1 ratio), independently of identificitibh. Appropriate_ pi transi-
tions contribute exclusively to Eiu identification in a range of 90.9%-457%.--
210
216

Table 7
Test la
k Category judgments for ea-h test (percentage). Data fwm all24 subjects and ,the best 14 labelers are displayed pepgi-ately.
murmur
murmur
murmur
Test 1b
murmur
murmur
murmur
. ir est 2a
[9] transtions
[n] transitions
[iu] transitions
Test 2b
[ 'j] transitions
[n] transitions
['I.] transitions
.1 Ln1 LJ'1 'Subjects
40.8 26.6 32.6 (1 )till 24 subjects
42.7 24.9 , 32.2', (2)Best. 14 labellers
30.3 32.9- 36.8 (1)
.' 28.4 34.5 37 (2) -
33 . 31.2 35.8 (1)
«32.3 34.4 33.3 (2)
44.1 23.6 32.3 (1)
45.1 22.6 32..2 (2)
26.7 37.1 36.1 (1)
23:3 40.4 36.3 (2)
32.5 31.5 36 (1)
32.3 34.7 33. (2)
63.8 35.3 0.4
68.4 31.1 0.5
46 51.2 2.8
39 60.4 0.4
1.5 2.8- 95.70.6 4.3 95.1
53 45.4 1.6 (1)
54 45.9 0.2
37.9 54:8 7.1 (1)
30.4 65.7 3.9 (2)
2.8 4.1 93..1 (1)
2.6 6.5 90.9 (2)
11.
( )(2)
(1)
(2)
(1)(2)
211

O
z
.4
I (9) (n)
GO (n)
G e 2 4 2 8
Figure 3.- Porciptual results for tests to (above) and lb (below) (all 24 Catalan subject.).Ordlnati:percentage of responses with Indicated label; abscIssa:stImuN.
218
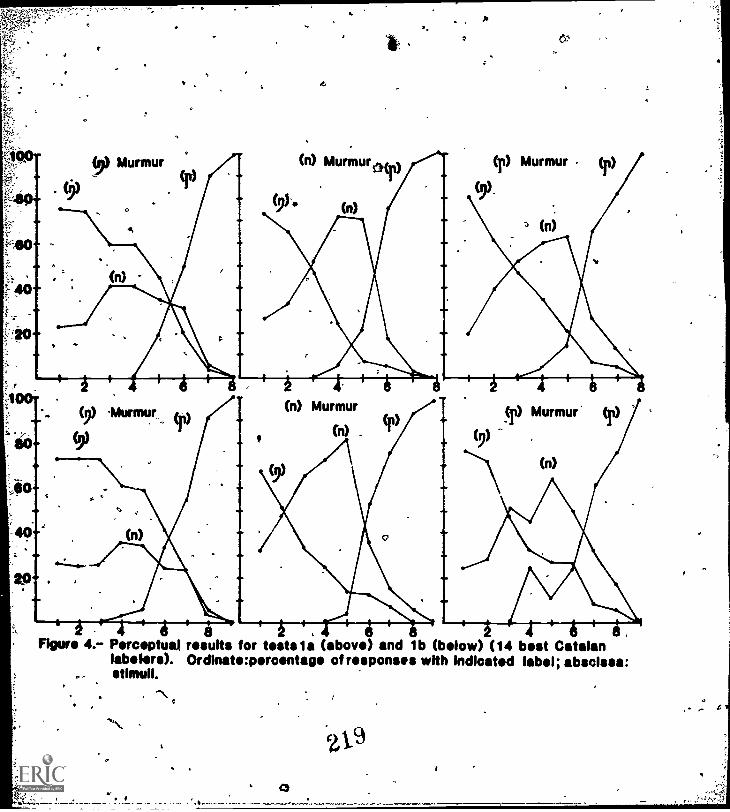
(9) Murmur
Q
(n) Murmuroy)
(n)
6,
(p) Murmur
(9)
(n)
NOP
4.
(n) Murmur
(n)(r) Murmur'
y
8 8,4. Perceptual results for teste1a (above) and lb (below) (14 best Catalan
!simian). Ordlnate:prcentage of responses with Indicated label; abscissa:stimuli.
'0
a -1;41,
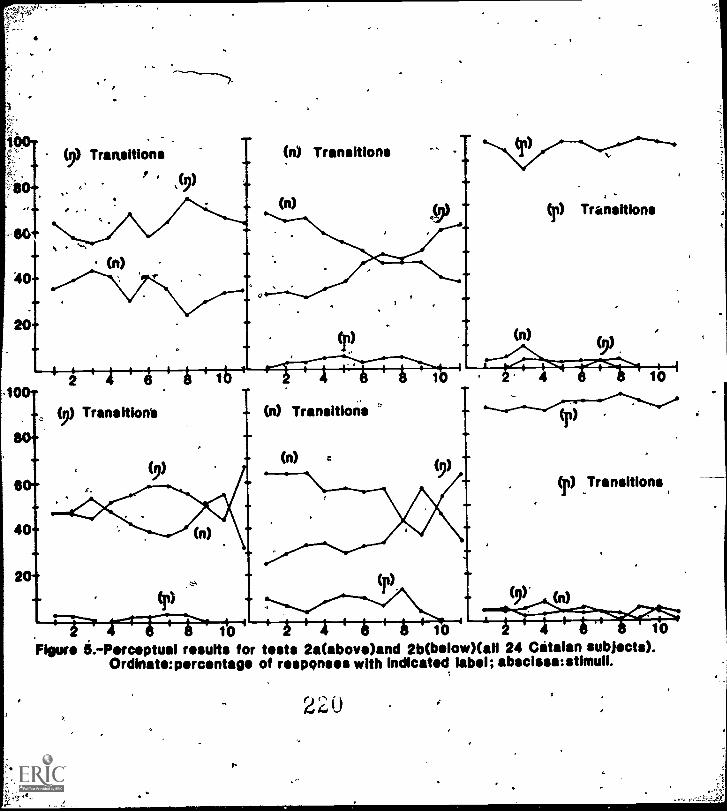
100-(9) Transitions
.
(n) Transitions
(n)
(n)
(r) Transitions
(9)
2 10 4 10
(9) Transition's (n) Transitions
(n) c
40
20 (p)
(1) Transitions
(n)
10 4 I $ 10 10
Figur* li.-Percoptual moults for toots 2a(abovo)and 2b(bolow)(all 24 Catalan subjects).Ordinatc porcontago of responses with indicated label; abscissa:stimuli.
220

80
40
20
100
80
Transitions (n) Transitions
(9)
(n)
. (p) Transitions
2 4 8 8 10 2 4 6 8 10 2 4 8 8 10
Transitions9) Transitions
(n)
(9)
(r) (n)(9)e#,/
2 4 8 8 10 2 4' 4 4 ' 10. 2 4 .8 10
Figure O.-Perceptual results for testa 2a (above) and 2b (below) (14 best Catalan labelers).Ordlnate:percentage of responses with indicated label ; abscissa:stimuli.
(r) Transitions
221

b. Tests la, lb (Figures 4 and 5)-Identification peaks show that
category judgments cannot be predicted.on the basis of appropriate murmurs butof appropriate transitions, especially for the [n] and [7] murmur conditions.I characterize below an optimal set of F2-F3 transition directions and rangevalues (in Hz) for each place category, according to perceptual data reportedby all Catalan speakers with special reference to the most consistent
labelers: .
[9] F2: slighty negative to slightly positive
F3: strongly negative to steady
[n] F2: positiveF3: steady to positive -
[3t.] F2: strongly positiveF3: strongly positive
(-70 to 410)
(-300 to 0 )
(+140 to +250)
( 0 to +200)
( +280 to +420)
(+200 to +500)
Murmurs appropriate for different categories have no effect, upon optimal
transition values for [9] and [r]. While [y.] murmur has no effect uponoptimal [n]- transitions, a significantly higher average of [9] than [n]
judgments is,obtained for typical [n] formant values (F2: up to +260; F3: up
to +230) followed by [9] murmur.
b. Tests 2a, 2b (Figures 5 and 6)-Identification peaks show thatcategory judgments can be highly predicted on the basis of appropriatetransitions. This is clearly the case for the [34 ,transition condition:
while no optimal [1u] murmur can be found along different murmur continua,optimal [j'] transitions override completely [n] and [9] murmurs. Therefore,Ign optimal set of murmur values (in Hz) for [9] and [n] is to be exclusivelyfound in the case of the [9] and [n] transition conditions:
[)] N1: 350 N2: 1200 N3: 2100
[n] Ni: 250 N2: 960 N3: 1800
N4: 2500 NZ 3230
N4: 2700 NZ: 208C
The perceptual effect of these optimal murmur values is obvioud: "for tp]
and [n] transitions the percentage of [9] responses increases as the optimal[9] murmur (stilulus 11) is approached and that of [n] responses also rises
towards the optimal [n] murmur (stimulus 3). It is the case that optimal
murmurs for [9] and [n] are shown to be dependent upon [n] and [9] transitions
respectively:', thus, the percentage of [9] responses for the optimal [9]
murmur is significantly lower with [n] than vi transitions and that of [n]-
responses 'for theoptimal [n] murmur is significantly lower with [y than [n]transitions. Mo eover, it must be noticed that, while [n] transitions neveroverride optimal [9] murmurs, [9] transitions are shown to override optimal[n] murmurs in test 2a (Figure (J.
C. °Summary and Discussion
Perlleptual data from Catalan subjects indidate that, overall, for vowel[a], transitions provide more effective cues for nasal consonants of different
place of articulation than murmurs. Thid is consistent with results obtainedin previous 'experiments with synthetic speech tested with American English
216.
222

speakers. In agreement with Henderson's (Note 1) results, it has beer showd,
however, that the contribution. of murmurs in place identification is muchhigher than that suggested by data reported in most of those experiments, andcategory-dependent as well. In fact, my results confirm that a bettercharacterization of place cues, for nasals must be strongly related to a
considerable, improvement in the construction of the experimental paradigmselected for perceptual testing. I draw next a summary of the perceptualresults on Catalan and evaluate them in the light of material reviewed inSection 2.2.
' While, as stated, transitions are more powerful cues than murmurs in the
process of identification of nasals, important cross-category differences can
be established. This effect is highly relevant for [r], and more relevant for[n] than [9]. dieciprocally, [9] murmurs contribute more to place identifica-
tion than other murmurs. This contrast in perceptual relevance of cues isconsistent with the tendency of [9] murmur to prevail over [n] transitions and
not vice versa in what may be called an inter-category trading relation ascharacterized below in this discussion section. On the other,hand, while [y]
transitions override murmurs appropriate for other nasal categories, optimal[T] murmurs have been shown to convey no place information. This negative
effect may have been maximized by not having taken into consideration, in the
synthetic reproduction of murmurs, the characteristic [y.] glide component
during., murmur. Spectrographic analysis reveals that, while very little
movement can be detected for nasal formants during the closure period in the
case of [n] and [9], those for [7] sHow a continuation of positive excursionwith respect to 142-F3 transitions. Since F-transitions result from articula-
tory dynamics, we have, apparently, a continuation of tongue movement during
lingual, closure and complete oronasal coupling. All these findings aboutrelevance of transitions and murmurs in the identification of different place
categories are significantly consistent with the summary of interactive
perceptual effects included in section 2.2.C., based upon production and
perception data from other languages.
Optimal cues obtained for [9] indicate that transition direction for F2-
is not perceptually relevant as long as it remains close to the vowel steady
state frequency; however, F3 transition must be negative for a satisfactory
[9] identification. Optimal [9] murmur, on the other hand, ,is characterizedby a high N1 and the absence of NZ at the central part of the spectrum.
Identification of [n] is mainly dependent upon a constantly positive F2, for a
steady or positive FY. Optimal alveolar murmurs have a low N1 and an NZ
between N3 and, N4. .These results for [9] and [n] conform well with, indications about perceptually relevant acoustic cues in sections 2.2.A. and
2.2.B. according to data, from other languages. [r] has been found to be
exclusively dependent on strongly positive F2-F3 trans.tions in agreement with
,reported perceptual data from Polish and cues for Russian palatalized non-nasal consonants. This powerful transition effect also confirms suggestions
made' in section 2.2.B. about the possibility of a [r] identification for a
strongly positive F2 transi in the absence of appropriate [9] cues by
ttrispeakers of languages with II, . Moreover, the fact that no erceptual effect
follows the contrast in N3-N4 values between [3%.] murmur and Ln], [9] murmurs
(Figure 1) is consistent with the irrelevance of high formants at the murmurportion in place identification of nasal murmurs and, therefore, with the
perceptual significance of N1 and NZ values.. In this summary of cues one must
2236
217

point out that the inclusion in the experimental paradigm of different Fltransitions for contrasting nasal categories might have added some relevant
infoniation about place identification.
Data in Figure 7 show to what extent the perceptual results areconsistent with production measurements gathered from Catalan. speakers.
Crosses along both diagonal lines point to values for F2-F3 transition rangescorresponding to synthetic stimuli ot tests la and lb. Phonetic symbolsrecorded on these lines indicate prevailing' interstimuli category judgmentsfor transition continua in all different murmur conditions. Dots stand forF2XF3 transition range values corresponding to productions of [m], [n], [T][9] by single Catalan speakers summarized in Table 6; they are grouped intoproduction spaces for each nasal category. Transition range values for thereference Catalan speaker chosen to prepare the synthetic speech stimuli arerepresented by encircled dots. Such a graph has been found to accord morewith perceptual processing of nasals than one that relates stimulus points toproduction data on transition endpoint values: A comparison of results fromtests la and -lb has shown that, in .categorizing stimuli, listeners were infact attending to F2-F3 transition ranges relative to the vowel steady statevalue and not to absolute transition endpoints. A satisfactory coincidence isfound between perceptual category judgments and category. production spaces for
different nasals, thus confirming the fact that transitions are good identifi-cation place cues. While this is clearly the case for the perceptual contrastbetween [ n] and [1.11.],7 it can be seen that murmur structures ([2] murmur for[7] identification; [n], [14.] murmurs for [n] identification) are used byCatalan speakers as identification cues for F2-F3_ range values that liesomewhere between or on the edges of [9] and [n] production spaces. This
finding argues for the existence of a trading relation between acoustic traitsspread over time in the process of [9] vs. [n] identification, and shows thatacoustic cues are integrated into a unitary phonetic percept in the process of
dynamic perception. Thus, perceptual complementarity between transitions andmurmurs accords with the fact that, given an ambiguous set of F2-F3 formanttransitions between [7] and [n] production spaces, listeners report /9/ or Inijudglents de rending on whether the following murmur structure is appropriateDor 1.9] or Ln], respectively. Moreover, consistent with reported obserVa-tions, [0 murmur appears to have greater perceptual weight than tn1 murmur,since the perceptual range for [2] affects more considerably the n produc-
tion space than that forIn] thell] production space.
4. CONCLUSIONS -
In the previous sections I have investigated the .interactive role offormant transitions and unreleased murmurs in the process of identification of[n], [10, [9] with [a] in VC syllables using synthetic speech stimuli.Perceptual results from Catalan speakers strongly suggest that syllabic cuessuch as transitions and murmurs are simultaneously processed in a phoneticmode. As $tuddert- Kennedy (1977) has made clear, dynamic acoustic events "arejointly shaped by the timing mechanise of motor control and by the demands ofthe auditory system for perceptual contrast and compression" (p.17). As
exemplified below, production and perception data reported in this paper show
that there is evidence for both related strategies in the process ofidentificdon of place for nasals, namely, reference to articulatory
constraints and to constraints imposed by the auditory system.
218 224

,
%
-.-
(11) production space ,,
I
(9)
armproductlovv space
+300.
4200-
.1.00_
Tootlb
-100-
-200,
Toot11
(m)productionspans
-(n)--productionapse*
-350 -250 -150 -50 +50 +150 +250 +350 +450
Figura 7.- Comparison of perception (Figures 4,8) and production(TABLE I) date for Catalan sublocts with special referenceto formant transitions.Ordinats: F2 'lingo* (in Hz);abscissa:F3 range! (In Hz).
r
4+
225219

Reference to psychoacoustic constraints imposed by the auditory system is
presumably needed to account for specific acoustic cues that make transitionsand murmurs perceptually relevant. On the one hand, it would argue for thecorrelation between amount of F2 transition range and perceptual relevance ofF2 transition found to be true for nasals with respect to the arrangement [r.]>
[n]> [7]. An explanation for this effect is suggested by Klatt and Shattuck(1975). They found in experiments with non-speech stimuli that the perceptualimportance of an F2-like chirp with respect to an F3-like chirp is positivelycorrelated with its frequency height. That is, the effect would increase with
an F2 transition such as that for [T] (strongly positive) with respect to [n];
[7] and such as that for [n] (moderately positive) with respect to [,,j
(slightly positive but also slightly negative or steady). No auditory
constraint is known that can handle perceptually distinctive cues of [y] vs.
[n] murmurs.
An auditory analysis of that sort is compatible with a perceptual
processing mechanism of relevant acoustic cues that keeps track of the
underlying unitary articulatory gesture. In fact, it is to be thought thatconstraints imposed by the auditory mechanism in the interpretation of cuesare integrated at a more central stage with reference to a dynamic and
continuous set of coarticulation strategies. Evidence for such related events
can be derived from Figure 7: according to data displayed there, nasals areperceived with reference to well-established category spaces and essentially
processed, at least for [a], upon F2-F3 transition _range values and upon
murmur characteristics for potentially "ambiguous" transition configurations.Reference to the continuous production event is also needed to account for the
perceptual decoding of syllabic spread cues: thus, as shown, transitions and
murmurs (and, presumably, releases) are evaluated ,simultaneously and
complementarily in a way that a cross-category maximum to minimum perceptual
effect for transitions ([Td>[n]> 7]) corresponds invariably to a minimum to
imaximum effect for murmurs ( T]<[11]<[9]). Such reciprocal correlation
conforms to the existence of a trading relation between transitions and
murmurs. for [7] and [11] with [a] in Catalan (section 3.3.C.) and a defined
compensatory effect between strongly positive [T] transitions and perceptually.
irrelevant Liu] murmur. Further evidence for simultaneol-e processing of nasal
cues at the syllabic level according to vowel quality has been reported to be
true for [9] preceded by [IC, [E] (section 2.2.0.).
A perceptual model that allows this sort of auditory analysis of
transition ranges to occur presupposes reference to a basic set of articulato-
ry gestures but is not compatible with a feature recognition model based upon
the auditory detection of invariant short-term spectral properties. Blumstein
1
and Stevens 1979) report properties of this sort at a 6 msec window release
period of [m (diffuse-falling frequency-amplitude template) vs. [n] (diffuse-
rising frequency-amplitude template) in initial position. Frequency-amplitude
spectral characteristics at the release can be hardly thought to be "primary
place cues" since unreleased nasals are equally common and occurring releases
may be perceptually weak, almost indistinguishable; moreover, murmur spectra
can hardly provide such cues, given their low amplitude component, high
variability and particular pole-zero structure. In fact, transitions havebeen'found in my experiment to be the best place cues in combination with
appropriate murmurs: overall, gliding F2-F3 transitions have given more than
95% of [I] judgments and optimal transition-murmur combinations 80% of [n] and
220
226

[7] responses. While, in order to handle these aspects, the perceptual model
proposed by Stevens and his. coworkers can be shown to be too simple andlimited, it becomes too complex and complicated on other grounds. Thus,
contrary to what has been suggested by SteVens (1975), examination of longstretches of acoustic data (presumably hundreds of cosec long) before phonetic
feature decoding begins is nJt needed in the case of diphthoa,-like spectral
nuclei such as palatal and palatalized articulations: short pre-closuretransitions are satisfactory cues for [1.1] with [a] and can be processed in the
same way as those for [n] and [7]
I have argued for a perceptual process of nasals based upon the
simultaneous integration of acoustic cues according to demands imposed by the
production and auditory systems. But, given [a] and other possible vocalicenvironments, what is the articulatory basis for this integration proeees?Little perceptual data on the identification of nasals of different pleces ofarticulation in different vocalic environments is available. The only system-
atic approach is that of Henderson (Note 1). Henderson's data and evidence
provided in this paper support the view that the perceptual interpretation of
transitions and murmurs for nasals preceded different vo*als is similar tothe integration of burst and transitions for ion-nasal stops of the same placeof articulation in CV environments (Dorman et al;" 0977). Thus [7 ] murmurs
are optimal cues and [7] transitions very weak cue's for [i], [a], 2], [o],
Lei--butfor [e], [f.] the role of transitions becomes more relevant, while for
Le --but not for [E.]- -that of the murmur decreases. For [n], transitions are
very effective cues with back vowels but very weak with [i] and [e] chilemurmur is, complementarily, a better cue for Li], in accordance with earlier
findings (Hecker, 1962; Nakata, 1959; Ohala, 1975). General effects for [n]
are to be expected also for [16] and ought to be correlated with longtransition duration with back vowels vs. short transition duration and little
excursion range with high vowels (see, for Polish, Jassam, 1964).
While the perceptual relevance of vowel-to-consonant transition rangesfor nasals accords well with data from Dorman at al. (1977), that of murmurs
is only consistent for [9] with all vowels but [I.] and for [n] with [i].
Differently from alveolar bursts, for [n], strong murmur effect is found in
the case of [o], [c], [u] and less for [a], [e], [2]. Such findings about the
category identification role of _murmurs in different vocalic environments
suggest that the interpretation strategy used by liSteners in associatingmurmur and articulatory event differs from that proposed by Dorman et al. for
burst, and front cavity size. 'In the case of final nasals, different
articulatory conditions, argue for different integration strategies: no burst
is present and release is weak and unnecessary; spectral continuity cannot beexpected between oral transition endpoints and oro -nasal murmur concentrationsCharacterized, moreover, by a low perceptual relevance of the mid spectralregions; finally, energy concentration and crucial place information in nasalmurmurs are dependent on the size characteristics of the oro-nasal system-
behind the tongue constriction point (back cavity); A plausible integration
model 'or Henderson',s data would' associate the back cavity for the nasal
consonant with the overall front-back cavity system for the vowel so that the
perceptual effectiveness of the murmur would depend on the degree of similari-ty between back nasal cavity and front or back cavity size appropriate for the
vowel. Such a model would predict perceptual relevance for [9j murmur with
the back cavity size of coarticulated back and front vowels, for [m] murmurs
'221
227

with the considerable front cavity size of back vowels, and for [ 31.] murmur
with the wide pharyngeal pass of palatal vowels. For [n] murmur there would
'be integration with the overall tract systei of a mid vowel and the frontcavity of (i). Obviously, more experimental evidence is needed. In any case,
data from Henc.son (Note 1) and experiments reported in this paper, show thattransitions and murmurs, analogously to bursts and transitions, are equivalentand complementary.
REFERENCE NOTE
1. Henderson, J. On the perception of nasal consonants. Unpublished Gener-
als Examination paper, University of Connecticut, 197,8.
REFERENCES
Ali, A., Gallagher, T.-, Goldstein, J., & Daniloff, R. Perception of coarticu-
lated nasality. Journal of the Acoustical Socitty, of America, 1971, 49,
538-540.Bjuggren, G., & Fant, G. The nasal cavity structures. Royal Institute of
STL-QPSR, 1964, 4, 5-7.
Blumstein, S. E., & Stevens, K. N. Acoustic invariance in speech production:
Evidence from measurements of the spectral characteristics of stop
consonants. Journal of the Acoustical Society of America, 1979, 66,
1001-1017.Carlson, R., Granstram, B., & Pauli, S. Perceptive evaluation of segmental
cues. Royal Institute of Technology, STL-QPSR, 1972, 1, 18-24,
Cooper, F; S., Delattre, P. C., Liberman, A. M., Borst, J. M., & Gerstman,
L. J. Some experiments on the perception of synthetic speech sounds.
Journal of the Acoustical Society of America, 1952, 24, 597-606.
Deny, J., & Port, R. Radial trajectories in F2XF3 plane as place invariants.
Research in Phonetics, 1980, 1, 201-216.Delattre, P. The physiological interpretation of sound spectrograms.
Publications of the Modern Language Association of America, 191, 66,
864-875.Delattre, P. Les attribute acoustiques de la nasalite'vocalique et consonan-
tique. Studia Linguistica, 1954, 8, 103-109.Delattre, P. Les indices acoustiques de la parole. Phonetica, 1958, 2, 226-
251.Delattre, 'P. Divergences entre nasalit6 \vocalique et consonantique en,
francais. Word, 1968, 24,De Mori, 1., Gubrynowicz, R,, & Lafade, P. Inference of a knowledge source
for the recognition of nasals in continuous speech. IEEE Transactions on
Acoustics, Speech and Signal Prodessing, 1979,\ASSP-27, 5, 538-549.
Derkach, M., Fant, G., & Serpa-Leita, A. de Phoneme 'coarticulation in Russian
hard and soft VCV-utterances with voiceless fricatives. Royal Institute
of Technology, STL-QPSR, 1970, 2-3, 1-7.Dorman, M. F., Slpuddert-Kennedy M., & Raphael, L. J., Stop-consonant recogni-
tion: Release burst and formant transitions as functionally equivalent,
context-dependent cues. Perception & Psychophysics, 1977, 22, 109-122.
Dukiewicz, L. Polskie tloski nosowe (Analiza akustyczna). Warsaw: Polska
Akademia NiaTIR7.
222 4
228
Eek, A. Acoustipdl description of, the Estonian sodoraat types. Estonian
Papers in Phonetics, 1972, 9-35.Fant, G. Acoustic theory of speech production. The Hague: Mouton, 1960.
Fant,,G. Descriptive analysis ofacoustic aspects of speech. Logos, 1962, 5;
Fant", G. Auditory patterns of speech. In W. Wathen-Dunn (Ed.), Model* for
the perception of speech and visual form. Cambridge, Mass.: MIT Press,
561, 111-125.Fant, G. Acoustic description and, classification of phonetic units. Speech
sounds and features. Cambridge, Mass.: MIT Press,1973, 32-83.Fant, G. Perspectives in speech research. Royal Institute of Technology,
STL-QPSR, 1980, 25.3, 1-16.
Ferrero, F., Genre, A., Boa, L. J. & Contini, M. Nozioni di Fonetica
Acustica. Torino: Edizioni Omega, 1979.
Ferrero, F., Vagges, K., Righini, G., & Pelamatti, G. M. Un sistema di
,sintesi dell'italiano: primi risultatti. Rivista Italiana di Acustica,
1977, 1, 33-48.Fischer-Jdrgensen, E. Acoustic analysis of stop consonants. Miscellanea
Phonetica, 1954, 2, 42-59.Fujimura, O. Analysis of nasal consonants. Journal of the Acoustical Society
of America, 1962, 34, 1865-1875.Fujimura, Oe Formant-antiformant structure of nasal murmurs. Proceedings of
the Speech Communication Seminar (1962). Vol. I. Stockholm: Royal
Institute of Technology, Speech Transmission Laboratory, 1963, 1-9.Fujimura, O. Remarks on stop consonants. Synthesis experiments and acoustic
cues. In L. L. Hammerich, R. Jakobson, & E. Zwirner (Eds.), Form andsubstance. Denmark: Akademisk Forlag, 1971, 221-232.
Fujimura, 0., & Liaeqvist, J. Sweep-tone measurements of vocal-tract charac-
teristics. Journal of the Acoustical Society of America, 1970, 49, 541 -K
557.
Garcia, E. The identification and discrimination of synthetic nasals.
Haskins Laboratories Status Report. on Speech Research, 1966, SR-7/8, 3.-,
3.16.
Garcia, E. Labelling of synthetic nasals. Haskins Laboratories Status Reporton Speech 'Research, 1967, SR-9, 4.1 -4.17. (a)
Garcia, E. Discrimination of three-formant nasal-vowel syllables. Haskins.
Laboratories Status Report on Speech Usee;p0V1967, SR-12, 1431153. (b),
Green, P. S. Consonant-vowel transitions. A spectrographic study. Studia
Linguistica, 1959, .13, 57-105.,
Halle, M., Hughes, G. W. & Radley, J.-P. A. Acoustic prdperties of stop
consonants. Journal of the Acoustical Society of America, 1957, 29, 107-116.
Harris, 'K. S., Hoffman, H. S., Liberman, A. M., Delattre, P. C., & Cooper,
F. S. Effect of third-formant transitions on the perception of thevoiced stop consonants. 'Journal of the Acoustical Society of America,1958, 50, 122-126.
Haskins Laboratories Quarterly Progress Report. Research Study on
Reinforcement of Speech. Number: Eight (1953). Haskins Laboratories.
Haskins Laboratories Quarterly Progress Report. Research Study on
Reinforcement of Speech. Number: Eleven (1954). Haskind Laboratories.
Haskins Laboratories Quarterly- Progr4ss Report. Research Study on
Reinforcement of Speech. Number: Thirteen (1954). Haskins Laborato-
ries.
22j
41.
223

14ttori, S., Yamamoto, K., Fujimura, 0. Nasalization of,voweis in .relationto nasals. Journal of the Acoustical Society of America, 1958, 30, 267-274.
Hecker, M.H. Studies Of nasal consonants with an articulatory speech synthe-sizer. Journal of :11e Acoustical Society of America, 1962, 34,, 179-188.
House, A. S. Analog studies of nasal consonants. Journal of Seech andHearing Disorders, 1957, 22, 190-204.
Jassem, W. The acoustics of consonants. In A. Sovijgryi & P. Aalto (Eds.),Proceedings of the Fourth International Congress.'of Phonetic Sciences.The Hague: Mouton, 1962, pp. 50-72.
Jassem,. W. A spectrographic study of Polish speech sounds. In
D: Abercrombie, D. B. Fry, P. A. D. MacCarthy, N. L. Scott, &
J. L. M. Trim (Eds.), In nonour of Daniel Jones. London: Longmans,Green, 1964, 334-348.
Jassem, W. Podstawy fRatati akustycznej. Warsaw: Polska Akademia Nauk,1973.
Kagpranski, R. P. Spectral analysis of Ger%Ah nasal consonants. Phonetica,
1965, 12, 165-170:Kacprowoki, J.; & Mikiel, W. Simpl ified rules for parametric synthesis of
nasal and stop consonants in C-V syllables by means of the 'terminal-\
analog" speech synthesizer. Acoustica, 1965, 16, 356-364.
Klatt, D. H., & Shattuck, S. R. Perception of brief stimuli that resemblerapid fomant transitions. In G. Fant & M. A. A. Tatham (Eds.); Auditory
analysis and perception of Speech. New York: Academic Press, 1975, 293- .
301,Liberman, A. M., Cooper, F. S., Shankweiler, D. P., & Studdert-Kennedy, M.
Perception, of the speech code. Psychological Revibw, 1967, 74, 431-461.Liberman, A. M., Delattre, P. C., Cooper, F. S., & Gerstman, L. J. The role
of consonant-vowel transitions in the perception of the stop and nasalconsonants. Psychologicai Monographs, 1954, 68, No. 8.
Magdics, K. Studies in the acoustic characteristics of Hungarian speechsounds. Indiana University Publications, Uralic and Altaic Slries,PT
97.
-0;
Malebot, A. Acoustic sues for nasal consonants: An, experimental study
involving a tape-splicing technique. Language, 1956, 32, 274-284.
Manrique, A. M. B. de, Guilekian, J. A., & Massone, M. I.. ?uncial de laspropiedades acusticas en el,reconocimiento de las consonantes.nasales ylfquidas espariblas. Iriforme XIII del Laboratorio de InvestigacionesSensoriales. Buenos Aires, 1980, 13, 6.
Martony, J. The role of formantemaplitudes in synthesis of nasal consonants.Ro al Institute of Technology, STL -QPSR, 1964, 3, 28-31
Mascaro, J. Catalaa phonology end the phonological cycle. Bloomington:
Indiana University Linguistics Club, 1978.Massone, M. I. Estudio acdstico de las consonantes Sspaffolas nasales y
lfquidas. Infbrme XIII del Laboratorio de Investigaciones Sensoriales.
Buenos Aires, 1980, 13, 5.Mattingly, I. 'Synthesis by rule of General American English. Supplement to
Haskins Laboratories Status Report on Speech Research, 1968.
Mattingly, I., Pollock, S., Levaa, A., Scully, W., & Levitt, A. Software,
synthesizer for phonetic research. Journal.of the Acoustical Society of
America, 1981, 69, S83. (Abstract)
Miller, J. L., & Eimas, P. D. Studies on the perception of place and, mannerof articulation: A comparison of the labial-alveolar and nasal-stop
224 2j()
e

distinctions.- Journal of the Acoustical Society of America, 1977, 61,835-845.
,Nakata, K. Synthesis and perception of nasal consonants. Journal of theAcoustical Society of America, 1959, 31, 661-666.
Nord, L. Perceptual experiments with nasals. -Royal Institute of Technology,STL-QPSR,. 1976, 2-3, 5-8.
Ohala, J.. J. Phonetic -explarlations' for nasal sound patterns. In Ch. A.Ferguson, L. 14. Hymgn, & J. J. Ohala (Eds.), Nasalfest, 1975, 289-316.
Pickett, J. M. Some `acoustic cues for synthesis of n-d/ distinction.Journal of ILI Acoustical ;ocietir of kierica,-1965, 35,, 474-477.
.,Potter., R. K., Kopp,, G. A.,. & Green, H. C. Visible speech. New York: D.
Van Nostrand Inc., 1947. -
Romportl, 14. Zur akustischen analyse and Klassifizierung der nasale. Studiesin Phonetics. The Hague: 'Mouton, 1973, 78-83.
Stevens, K. N. Feature detection and auditory segmentation: Consonant per-ception., ..In G. Fant & 14. A. A. Tatham (Eds..), Auditory analysis andperception of speech. New York: Academic Pr'ess, 1975, 191-L95
St ddert-Kennedy, M. Universals in phonetic structure and their role inlinguistic commaticEttil$4. In T. H. Bullock (Ed.), Recognition of complex_acoustic signals. Berlin: Dahlem Konfereuzen, 1977, 37-48. .
7 keuchi, S. , Kasuya, H., & Kido, K. A method for extraction of the spectral. cues of nasal consonants. Journal of the Acoustical Society of Japan,
1975, 31, 739-740.V gges, K., Ferrero, F. E., Caldognetto-Magnd, E., & Lavagnoli, C. Some
of acoustic characteristics, of Italian consonants., Journal of ItalianLinguistics, 1978,3, ,i6985.
ang, W. S.-Y., & Fillmore, Ch. J.' Intrinsic cues and consonant perception.'f Journal of Speech and Hearing Research, 1961, 4, 130-136.
einstein, C. J., McCanTiess, .S. S., Mondshein,, L. F., & Zue, V,. W. A systemfor acoustic-phonetic analysis of continuous speech. IEEE Transactionson Acoustics, Speech and Signal Processing., 1975, ASSP-23, 1, 54-67.
/Zee, E. Effect of vowel quality fan perception: of post-vocalic nasal conso-"t Journalin noise: of Phonetics, 1981,-5, 35-48. a
- -
FOOTNOTES
1I represent with [ly] palatal as well as palatalized nasal stops. Velarnasal stops are consistently"iepresented With_ [9] independently of theirphonological status.
6 2Res,earch is to be' done, on the felative differences in pharynx cavitysize and size of velum opening among nasals of different place of articula-tion: It deserves to be seen to what extent the acoustic structure and theperCeptual .role -off' their murmur formants are affected by those differences.
3The reliability of,the results remains open ,to the objections raised inction 3.3C. Furthermore,- possible bias effects can be related to the fact
that all experiments were' forcedrchoice. Arsd, the fact that-American Englishsubjects in Malercnt's experiment gave 80% of [9.] responses- for original [9]while 100% of [m] and [n.1 responses for original. [m] and [n], .respectiVely,suggests response bias effects against. the velar correlate. That AmericanEnglish speakers identify [7] after [a] very reliably nas been shown with
225
231

origins) natural speech stimuli by Henderson (Note 1) (100%) and Zee (1981)
(96%).
41 call transition range value the amount of frequency contrast betweensteady state vowel and starting point or endpoint value of an adjacent formant
transition. It is expressed in Hz and can be positive (+), negative (-), ornull (m).
5Acoustic measurements Of zeros were inferi.ed from frequency areas thatshow a major reduction in the magnitude of the energy envelope as observed inspectrographic spectral sections. A final decision about zero frequencyvalues ,to be included in the synthetic speech patterns used for- perceptualtesting was also reached 'on, the basis of -measurements reported in theliterature.as well as well-accepted observations on formant-antiformaat spec-tral characteristics of nasal murmurs corresponding to different place catego-ries (see Sections 2.1.8. and 2.2.A., and Table 1).
,
6 Bandwidth van4swere estimated by measuring the distance between.4d)points att, the right and left side of the spectrum envelope; equally located3d8 below the peak level
7The mismatch between perceptual stimuli and frequency values correspond-ing to the (310 production space (Figure,7) did not affect the quality of 1JJudgments, thus suggesting-that subjects perceive a positive F2 transition asa palatal cue when, pointing to a critical high locus.
to.

-
II
SPEEati PRODUCTION CHiRACTERISTICS OFIHE HEARING, IMPAIRED*0
Mary Joe OSberger+ and Nancy S. McGarr+..
I.INTRODUCTION .
rOne of the most devastating effects of congenital hearing loss is that
,normal, develppnient of speech is often disrupted. As a conseqUence, mosthearing-impaired children must be taught the swech skills that normal-hearing,ch%1.drek,readtly4.ac4uireAuring the first few years of life. Although some
nearing-impaired ,thildren develop. intelligible speech, many do not. For many
year, it was believed that profoundly hearing-impaired ohildren were incape-
'-blelof learning to teak. Carrying this belie td the extreme, Froeschels,(1932) even suggested that all deaf children exhibited some behavfor problems%
*due t6 .0e fact that the profdae motor release connected with speech is
impossible in their caae" (p.17). 3
Within the last decade, advances have been made in ,studying the speech of
the hearing-mnaired. ,This is largely due to the development of sophisticated
processing and analysis techniques in speech science, electrical engineering,
and computer science; that have increased- our knowledge of normal., speech
production. In turn; these technological advances have been applied to the
analysis of the speech of the hearing impaired, and also to the development of
clinical. assessment and training procedures.
Theioral communication skills of hearing impaired children haVe long been
of concern to educatOrs of the hearing impaired, speech pathologists, and
audiologists because theadequacy of such skills can influence the social,
educational,, and career opportunities available' to these individuals. Since
the introduction of m 94-142 and the emphasis on mainstreaming, there is an
even greater likelihood that many professionals will need to-learn about, or
upgrade their-knowledge of, the speech of hearing-impaire children. The
'intent of, this chapter is to provide the clinician, studen , and researcher
with a ,comprehensive description of ;the speech characyeistics of this
*To appear in N.ILass"(Ed.), Speech and language: Advances in basic research
and practice (Vol'. 8). New York: Academic Press. 1
+Human Communication Research' Laboratories, The Boya Town Institute for
Communication Disorders in Children, Omaha, Nebraska.'
++AlsO Communication Sciences Laboratory, City University of New York.
Acknowledgement. Preparation of this manuscript was supported in part by
NINCDS Grant NS-1.6247 and by NIH Bdomedical Research Support Grant
01SO7RR05834 to Boys Town Institute for Communication Disorders in Children;
and NINCDS Grants NS-13617 aneNS-13870, and NIH Biomedical Research Support
Grant RR-05596 to Haskins Laboratories. The authors wish to thank
Drs. Katherine Harris, Ray Kent and Charles 'Watson for their helpful
comments. ...
[HASKINS LABORATORIES: Status Report-on Speech Research SR-69 (1982)]
233
227
A
population. It is assumed that the reader has some familiarity with theeffects of-congenital hearing loss on speech and language development, and hassome exposure to acoustic and articulatory phonetics. It should be noted 'thatmost of the information available about the hearing impaired is concerned withchildren with severe and profound sensorineural hearing losses (losses.of 70'dB.HTL or greater). In coMparison, relatively little is known about thespeech of hOd-of-hearing children (losses less than 70 _dB HTL). It for
this reason that most of the chapter is devoted to children who are severely'and profoundlythearing impaired.
In order to present an in-depth coverage of speech production processes,we have opted to discuss language skills only in 'those instances where thereis no clear-cut separation between language and speech. Likewise, the
auditory skills of the hearing impaired will be discussed only to the extent
that factors such as 'hearing level and auditory capabilities affect speechproduction skills. The emphasis on speech production is not meant to suggestthat an aural/oral teaching method is the only appropriate educational planfor hearing-impaired children. The issues involving educational methodologiesare not of primary concern here. Bather, it is the belief of the authors thatevery hearing-impaired child is entitled to speech training services, even ifa realistic goal of such training may be only the.development of functional(survival)_ speech skills. _Before optimal teaching strategies can be selected,however,rteachers and clihicians must have a thorough understbnding of thenature of-the problems they are tying to remediate.
II. DEVELOPMENTAL ASPECTS OF THE SPEECH OF THE HEARING IMPAIRED..
A. Vocalization Patterns
For many years, it was believed that the vocalization development ofhearing and hearing-impaired infants was the same, at least through thebabbling stage. After this period, hearing-impaired infants were reported tostop babbling. This notion was based Ofimarily on Mavilya's (1968) data,which showed a= marked.decrease in the number of vocalizations produced bythree congenitally hearing-impaired infants (12-16 weeks old at the start ofthe study) over a three-month period. Recent data obtained by Stark (in
press) do not support the findings of Mavilya. For a group of hearing-
impaired infants 15-24 months old, Stark observed an overall increase in rateof vocal output with age, The mean number of vocalizations was also observed
to increase as progressively igher levels of vocal output were attained by
the infants. In general, the stages of. vocalization behavior of the '15- to2'4- month -old hearing-impaired infants were similar to those Of a group ofnormal - hearing infants 9-48 weeks of age. An important point that should be
made is that the speech behavior of the infants in both the Stark and Mavilyastudies was recorded before the children /fad been fitted with hearing aids.Stark found that the level of vocal development reached by the children beforethey were .fitted with amplification did not appear to predict their later.progress in ,learning Speech. The vocal devel)pment of some children pro-.
gressed rapidly after they were given hearing aids, while the vocal develop-
ment of others aid not.
228
234

Although Stark found no difference in rate of vocal output between the
.normal-hearing and hearing-impaired infants, differences in the phonemic
repertoire were found between normal infants and hearing-impaired infants who
were judged to be atthe same level of vocal development. Syllable shape
(e.g., CV, VC, CVC, etc.) was similar among the children, but the inventory of
vowel- or consonant-like sounds was more limited in the samples and tended to
be more stereotyped than those of hearing infants of the same age. Mavilya
also observed the the phonemic aspects-of the-vocalizations-of-the-nearing-
impaired infants in her study were different from those reported for infants
with normal hearing. Specifically, Mavilya observed a severe delay in the
development of consonant sounds in the vocalizations of the hearing-impaired
infants, with vowels produced more often than consonants..
In an earlier study, Stark (1967) analyzed the phonemic aspects of the
vocalizations of six congenitally hearing-impaired children betweerr the ages
of 16 and 19 months before they were fitted with hearing aids. Analysis of
the infants' vocalizations revealed that the following sounds,were used by all
six babiei: (1) a low front vowel; such as MU; (2) a teutral mid-vowel or
schwa; (3) an aspirant /h/, which could precede or follow vowel sounds; (4) a
syllabic nasal conApnant usually identified as /m/, and (5) 'a glottal stop.
An interesting obAcyation made during this study was that the emotive
vocalizations of the hearing-impaired infants, such as whimpering, sighing,
crying, and laughing, did not sound deviant, and therefore this aspect of
vocal behavior did not provide diagnostic information about the hearing status
of infants.
In summary, the results of Stark's (1967, in press) research do not
support the belief that hearing-impaired infants simply cease vocalizing after
the babbling stage. Differences between the vocalizations of normal-hearing
and .hearing- impaired infants do emerge at an early age, but the differences
are seen in phonemic production rather than quantity of vocal output as
suggested by Mavilya (1968).
B. I-nventor-i-es---------
D Fhonetic inventories have been obtained from the spontaneous samples, of
hearing-impaired children ranging from eleven months to seven years of age
(Carr, 1953; Lach, Ling, Ling, & Ship, 1970; Stark, in press; Sykes, 1940;
West & Weber, 1973). Although these studies report differences in the
frequency of specific vowel sounds in the samples of hearing-impaired children
studied, the pattern of vowel production is remarkably'similar. The vowels.
most commonly used by young hearing-impaired children include the ,central
vowels /A, a / and the low front vowels /E,ate/. The extreme high vowels /i, u/
occurred relatively infrequently in the children's samples. The exception to
this pattern was reported by Carr (19531), whose five- year-old hearing-impaired
subjects used a wider range of vowels than noted above. There is some
evidence that this patterd of vowel usage Changes over time., For example,
Lach et al. (1970) found that over a one-year period, young hearing-impaired
children. 11-32 months of age, who were enrolled in a preschool program,
tended to shift from the frequent use of the schwa vowel to other vowels, with
the greatest increase in usage observed for /I/. Carr (1953) also compared
the relative frequency of each vowel type in the speech of five-year-old
hearing-impaired children to that of hearing children and noted that. the
229
2,35

,k
hearing impaired children used vowels in a manner and degree similar to
hearing infants of 11 to 12 months of age. The hearing impaired children werealso found to use vowel. sounds more often than consonant sounds. In,anotherstudy, Sykes (1940) found that 4 to 7yearold hearingimpaired childrenproduced almost half of their vowel sounds in isola,;ion and not in combinationwith a consonant.
,Analyses of consonant production haveshown- thatyoung hearingiripairedchildren produce front consonants /b, p, m, w/ more often than they produceback consonants (Carr, 1953; Lach et al., 1970; Sykes, 1940), and they havebeen found to use front consonants with greater frequency than do hearing
. children (Carr, 1953). In a longitudinal study, Lach et al. (197G) analyzedconsonant usage, by manner of productions. Before the children. began a
preschool program, 66% a all consonants produced were glottal sounds, andapproximately 25% of the sounds were nasal consonants. After one year in theprogram, the glottal sounds were used only 44% of the time. There was also alarge increase in the usage of plosives and semi vowels, due primarily to an
increased Use of /b/ and /w/. 'Fricatives and affricates were used onlyrarely, even' after one year of training. With only one exception, all
children produced a significantly greater number of consonants and vowelsafter .one year of training, with a concomitant increase in the consonanttoVowel ratio.
C. Phonemic and Phonologic Skills
A limitation of the simple soundtype inventories, which were discussedabove, is that no information is provided on the phonological usage of thesp.:ech segments. A tally of consonants and vowels does not reveal whether ornot the phonemes were used appropriately. To overcome this limitation,
investigators have begun to perform phonemic, phonological, and linguisticanalyses of hearingimpaired children's speech (Oiler, Jensen, & Lafayette,
1978; 011er & Kelly, 1974; StoelGammon, in press; West & Weber,1973).
Recently, a comprehensive study was performed by StoelGammon (in press)in which crosssectional and longitudinal data were obtained on phonologicalacquisition by hearing children, 1.5 to 3.10 years of age,' and hearingimpaired children, 2.4 to 7.3 years of age. The crosssectional data showedthat, in large part, the patterns of -development were similar for the twogroups of children, although the rate of development was considerably slowerfor the hearingimpaired children than for the hearing children. Similar
patterns of correct production and error types were present for both groups of
children. The set of substitution patterns common to both groups includedvoicing of initial stops, devoicing of final stops, fricatives, and affricates, and substitution of homorganic stops for fricatives. When errors were
common to both groups, they were more frequent in the speech of the hearingimpaired than in the speech of the normalhearing children..
Some differences in the pattern of development between the normal hearingand hearingimpaired children were also observed in the above study. Errors
found to be present only in the hearingimpaired children's speech were:substitution of a glottal stop for the target phoneme, Substitution of thepalatal fricative /S/ for the affricates /tS and d3/, and substitution ofconsonants /h, k, g/ for other nonlabial consonants. The only substitution
230
073

that Stdel-Gammon found to occur in the normal children's productions that did
not occur in those of the hearing-impaired was depalatization of /S, tS, d3/,
resulting in a substitution' of /s/ for /S/ or /ts/ for /tS, q3/. The data
also showed that the substitutions of the hearing - impaired' children deviated
farther froth the target phoneme with respect to manner and place of production
than id the substitutions of the normal children. In addition, the errors of
e hearing-impaired subjects also tended to show a larger range of substitu-
tion types, for example, /k, g/ for /tj/, than those made by the hearing,
children.
The longitudinal data obtained by Stoel-Gammon revealed that the hearing-
impaired children progressed toward correct production of target phonemes at a
much slower rate than the normal- hearing children and that there was a much
greater range and variation of response 'types, both within and across
subjects. The preliminary data suggested that the hearing-impaired children.
passed through three developmental stages. In the first stage, the child
produced a wide variety of substitutions for the target phoneme. In the
second stage, there was a narrowing of the range of substitutions, followed by
substitutions with a single sound. In the third stage, the phoneme was
produced correctly. Of course, not all hearing-impaired children progressthrough the third stage, as evidenced by numerous phonetic errors that remain
in the speech of many hearing-impaire persons even throughout their adult
life.
Additional research is needed in order to delineate the stages of speech
acquisition in hearing-impaired children. This information is essential to
help us better understand why some children develop intelligible speech and
others do not. Although there are data suggesting that hearing-impaired
children are simply delayed in phonemic acquisition (011er et al., 1978: 011er
& Kelly, 1974; Stoel-Gammon, in press), we also know that there are differ-
ences in the phonology used by hearing children and hearing-impaired children.
In fact, there are noticeable differences between the production' patterns of
the two groups of children at a very early age, ane the speech of some
hearing-impaired children never progresses beyond the very early stages of
development. As we shall see in the following section, the speech production
patterns of older. hearing-impaired children show many similarities to the
patterns of the younger hearing-impaired children. It will also become
evident that although in many cases, hearing-impaired children fail to follow
rules'typical of normal speech, the deviations in their speech show systematic
patterns, indicating that they are using a set of phonological rules, even
though these rules may differ from those used by normal speakers.
III. ARTICULATORY PATTERNS IN THE SPEECH OF SEVERELY AND
PROFOUNDLY HEARING-IMPAIRED CHILDREN
A. Production of Consonants
1. Overview
Perhaps of all the speech production errors characteristic of the
severely and profoundly hearing impaired, the area that has received the
231
237

greatest attention is that involving 'the articulation of consonants, vowels,and diphthongs. Numerous independent investigations (Hudgins & Numbers, 1942;
Markides, 1970; Smith, 1975; McGarr, 1980) have been remarkably consistent inidentifying typical articulatory errors in the speech of hearing-impairedchildren who were trained in many different programs. Most of these investi-gations are of a descriptive nature; that ins, either listener judgments orphonetic transcriptions were used to obtain measurements of intelligibility orto describe the articulatory characteristics of the speech. However, someinvestigators (Calvert, 1961; Monsen, 1974, 1976b, 1976c; Rothman, 1976) havebegun to de;:ail some of the acoustic characteristics of the speech of thehearing impaired (e.g., voice onset time, closure duration, formant frequen-cies). Acoustic analysis of hearing-impaired speech-permits a finer-grainedconsideration of some aspects of both correct and incorrect productions thanwould be possible using methods applied in.the descriptive literature.
For purposes of organization we will consider the prodUction of supraseg-
mentals as well as other factors that affect the intelligibility of speechlater in this chapter. This section will present information only on thesegmental aspects of hearing-impaired children's speech. We will first
consider the error patterns detailed in the descriptive literature and then ,
discuss the releyant acoustic data for production of consonants and vowels byhearing-impaired speakers.
2. Consonant Errors
Any comprehensive analysis of the articulatory skills of hearing-impaired
children must begin with the classic work of Hudgins and Numbers (1942).
These authors studied 192 subjects between the ages of 8-20 years whose
hearing losses ranged from moderate to profound. The students read simple
sentences. From recordings, teachers of the deaf later evaluated the
students' ptoductions for proficiency articulation as well as rate and
rhythm. Error categories were established for consonants, vowels and
diphthongs, and an attempt was made to relate these patterns to speechintelligibility.
Briefly, the articulatory errors were divided into substitutions, omis-sions, and severe distortions of the intended phoneme as, well as the additionof adventitious phonemes or syllables. Among the more common error types
involving consonants were confusion of the voiced and voiceless sounds,
substitution of one consonant for another, added nasality, misarticulation ofconsonant blends, misarticulation of abutting consonants, and omission of word
initial or word final consonants. This overall pattern of consonant errorshas been replicated in numerous studies (Brannon, 1966; Geffner, 1980; Gold,1978; Levitt, Smith, & Stromberg, 1976; Markides,- 1970;,. Nober, 1967; Smith,
1975), although the actual percentage of errorsin any category may varysomewhat from study to study.
a. Voicing errors. Errors of voicing were 'one of the most frequenttypes of consonant errors found by Hudgins and Numbers (1942). In subsequent
studies, the direction of this error has sometimes been reported as occurring
to the voiced member of the pair (Carr, 1953; Heider,, Heider, & Sykes, 1941;
Millin, 1971; Smith, 1975), and at other times, to the voiceless cognate
'('Mangan, 1961; KarkideS, 1970; Nober, 1967).
232
238

Smith's (1975) study of 40 severe to profoundly hearing-impaired childrenenrolled in an oral school for the deaf has been among the most comprehensive
since Hudgins and Numbers. The 40 children read sentences containing keywords that incorporated the most frequent English phonemes with transition to
and from the vowels /i/, ANY, and /u/ for all places of articulation. Voicing
errors were common for these children and most often involved substitutions of
the voiced for voiceless member of.the pair. Studies by Heider et al. (1941)
and Carr (1953) have also reported a tendency for hearing-impaired children to
use more voiced than voiceless sounds in their spontaneous speech. Indeed,
Millin (1971)' suggested that one manifestation-. of the voiced for voiceless
problem is inappropriate phonation evidenced at the beginning or end of an
utterance.
. This error pattern, 'voiced for voiceless substitution, is opposite to
that found by Markides (1970) who studied 110 British hard-of-hearing and deaf
children. The children produced words as part of an articulation test. A
common error was substitution of the voiceless cognate for the voiced. Using
the Templin-Darley Test of Articulation,,Nober (1967) analyzed production of
phonemes by 46 severe and profoundly hearing-impaired children. He reported
that voiceless phonemes were produced correctly more often,.than voiced
phonemes. Data obtained by Mangan (1961) can also be interpreted to show the
difficulty hearing-impaired children have with voicing contrasts. Subjects in
this study were reported to devoice final voiced consonants.. .
Taken together, these studies suggest that coordination of the articula-
tors necessary for voicing contrast is an exceedingly difficult task for
hearing-impaired speakers. Recently, some investigators (McGarr & L8fqvist,
in press; Whitehead & Barefoot, 1980, among others) have begun to, examine the
physiological manifestations of some typical errors in the speech of the
hearing impaired. Their data suggest that the nature of the voicing error may
be far more complex than is suggested by the descriptive literature. In fact,
some hearing-impaired speakers fail to coordinate the timing of respiration,
phonation, and articulation in attempting to produce voicing contrasts. More
will be said about these findings in a later section.
b. Substitution errors: Place of articulation. Another common articu-
latory error in the speech of the hearing impaired involves the substitution
of one phoneme for another. Frequently, the substitution is tc a phoneme with
a similar place of articulation. There is general agreement that phonemesproduced in the front of the mouth are more often produced correctly than are
phonemes produced in the back of the mouth. This makes sense when one
considers that the relative visibility of articulatory gestures should be
important to hearing-impaired persons for whom there is reduced auditory
information. .
Substitution errors involving the same place of articulation have been
noted in several studies. Nober(1967) analyzed correctly articulated conso-
nants according to place of articulation and then ranked them from highest to
lowest scores as follows: bilabials, 59%; labiodentals, 48%; gloLtals, 34%;
linguadentals, 32%; lingua alveolars, 23%; linguapalatals, 18%; and lingua
velars, 12%. Similar patterns of correct production have been reported by
Smith (1975) and Gold (1978) except these investigators found that sounds
produced in the middle of the mouth were more prone to error than were sounds
produced in the back of the mouth. 233
23rJ

This general trend--better production for more visible phonemes--has been
found not only for production of isolated words and sentences (Huntington,Harris, & Sholes, 1968; Geffner & Freeman, 1980; Levitt et al., 1976; Levitt,Stromberg, Smith, & Gold, 1980; Smith, 1975), but also for spontaneous speech(Carr, 1953; Geffner, 1980; Heider et al., 1941).
Some caution should be exercised, however, in interpreting the importanceof visibility in and of itself as a key factor in production. Some
articulators, such as the lips, although quite visible, are also relativelymore constrained and thus permit fewer possibilities for errors than otherarticulators such as the tongue. ,Later we shall discuss some physiologicaldata obtained by Huntington et al. (1968) and McGarr and Harris (1980), whichis pertinent to this issue.
c. Substitution errors: Manner of articulation. A common observationarises from an analysis-of consonant errors according to place of articula-tion. Hearing - impaired speakers tend to position their articulators fairly
accurately, especially for those places of articulation that are highlyvisible, but fail to coordinate properly the movement of the articulators
(Huntington et al., 1968; Levitt et al., 1976). The type of consonant
substitution that occurs in these cases is often described as one resultingfrom ,incorrect timing. These errors are also described as involving aninappropriate manner of articulation.
One example of a common error is the nasal-oral substitution. According
.to Hudgins and Numbers (1942), errors in nasality may be considered to be asegmental problem and also a problem affecting voice quality, although here weare interested primarily in the former. Non-nasal phonemes were reported by
Hudgins and Numbers to be nasalized, and nasal consonants were often produced
as stops. Similar findings have Also been noted by Markides (1970), Smith(1975), and Stevens, Nickerson, Boothroyd, and Rollins (1976).
Other errors in manner of articulation have also been noted. Smith's
hearing-impaired children made most errors producing the following:- palatal
plosives, fricatives, affricates, and the nasal /d/. Glottils were frequently
substituted for stops.' Fricatives showed a high rate of substitution to, butnot from, the plosives. Affricates were never substituted for other conso-nants, but tended to be substituted by one of their components, usually the
plosive component. However, bilabial plosives, the glides, and the fricatives
/f/ and /v/ were often produced correctly. Nober's (1967) results also
. followed the generpl pattern reported by Smith. Glides were most often
correct, followed 'by stops, nasals, and fricatives. Similar findings were
obtained, by Geffner and Freeman (1980) for 67 six-year-old severe and
profoundly hearing-impaired children attending schools for the deaf throughout
New York State. ,
The articulatory movements for both alveolar and velar sounds are
visually obscure. One reason why alveolar sounds may be more prone to errorthan velar sounds is that moe sounds are produced in the middle than in the
back of the mouth. Because of this, precise positioning of the articulators
is necessary in order to differentiate correctly all the sounds with a medial
place of articulation,. Thus, greater variability in articulatory placementcan be tolerated before the velar sounds are misperceived by the listener. In
234
24U

any event, a consistent finding is that hearingimpaired children correctly
produce the highly visible phonemes (i.e., those produced in the front of the
mouth) more often than those phonemes that are not articulated with a high
degree of visibility (i.e., those "produced in the middle or back of the
mouth).
d. Omission errors. By far the single most frequently.reported error in
the speech production of the severely and profoundly hearing impaired is the
omission of a phoneme (Hudgins & Numbers, 1942; Markides, 1970; Smith, 1975).
Omission of consonants may occur in the initial and/or final position of
words, also reported as non-function of releasing or arresting consonants,
respectively.
Hudgins and Numbers reported that omission of initial consonants was more
common than omission of final consonants. The consonants most frequently
omitted from the initial position of words included /h, 1, r, y, th, 5/.
Turning to final consonants, the authors describe several error patterns:
dropping of the consonant completely, releasing the consonants into the
following syllable, or incomplete production whereby the phoneme loses its
dynamic properties and becomes merely a passive gesture. Among the final
consonants most frequently omitted in the study by Hudgins and Numbers were
/1, t, s, z, d, g, k/. These results are in agreement with thdse reported by
Geffner (1980), who analyzed the spontaneous speech samples of young hearing-
impaired children.
Others (Nooer, 1967; Markides, 1970; Smith, 1975) have also observed the
omission of similar consonants from the speech of hearing-impaired children.
In contrast to Hudgins and Numbers, however,.these studies reported a greater
number of consonants omitted from the final position of words than from_either
the initial or medial positions.
e.' Consonant-cluster errors. Not many investigators have reported data
for production of consonant blends. This is surprising since Hudgins and
Numbers suggested that these errors had an important and deleterious effect on
intelligibility. In their study, these errors involved two forms: one or
more components of the cluster were dropped, or an adventitious phoneme,
usually the /a /, was added between the elements. This latter error may lie
particularly detrimental to the timing or rate and rhythm of speech. Brannon
(1966) also fouyd that misarticulation of consonant blends was a significant
erro- in the speech of, hearing-impaired children. Smith (1975) tested
consonant blends /p, t, k/ and /s/ In the speech production of older hearing-
impaired children (13-15 years old). Here again, there was frequent omission
of one Or more elements of the cluster. In fact, a phoneme in the blend
environment was more likely to b omitted than the same phoneme occurring in a
nc-blend environment.
B. Acoustic Characteristics of Consonant Production
We now turn to a discussion of the acoustic patterns of consonant
production. While these consonantal features have been much studied in normal
and also in synthetic speech (cf. Borden & Harris, 1980; Pickett, 1980, for a
review of this work), there..have been far fewer studies of the acoustic
241
235

characteristics of consonants produced by hearing-impaired speakers. This isin part because spectral measurements of hearing-impaired speech are particu-
larly difficult to make, either because of the mismatch between spectrographfilter and fundamental frequency (cf. Huggins, 1980), or because of sourcefunction abnormalities.
.
In normal speech production, the acoustic consequences of consonantproduction are complex and spread over _a period of time. They involvedifferences in the sound source And the spectral composition ofT the signal.For example, in the production of a voicelesi friCative in a vocalic
environment (e.g., VCV, "I see"), the sound source is changed from a periodicto an aperiodic one, and then back to the periodic, source. Similarly, avoiceless aspirated stop in a similar VCV environment (e.g., "a pie") is
associated with the following sequence of source changes: periodic voicing
during the preceding vowel, silence during the consonantal "osure, transientnoise, aspiration noise, and periodic voicing during the vc 1. In addition
to being spread across time, the acoustic attributes of many consonants often
involve short-term spectral changes, where high frequency components play animportant role.' Examples of such attributes are release bursts and formanttransitions for stop consonants, ,and spectra and transition for fricatives.These characteristics provide considerable information on the identity of
segments. In the speech of the hearing impaired, acoustic analysis of
consonant production has been made only for voice-onset-time (VOT), formant.
transition, or closure and constriction duration, and these patterns give
ample evidence of the great perceptual difficulty that listeners to the speech
of the hearing-impaired experience.
1. Voiced-Voiceless Distinction
At the acoustic level, contrasts .such as "voiced" versus "voiceless" or
"aspirated" versus "unaspirated" sre manifested as complexes of acoustic cues
(Slis & Cohen,61969). In the classic study of Lisker and Abramson (1964),*
release,,of the oral occlusion relative to the onset of glottal pulsing (i.e.,
voice- onset -time or VOT) was the saltent cue that distinguished voiced from
voiceless stops. As was previously discussed, errors in voicing are common in,
the 'speech of the hearing impaired. Some acoustic studies of their speech_provide evidence that a lack of voice-onset-time contributes to the perception
of the voiced-voiceless7confusion.
Perhaps the most careful study in this area has been conducted by Monsen
(1976b). Spectrographic measurements of VOT were made of word-initial stops
/p, t, k/ and /b, d, g/, produced by 36 profoundly hearing-impaired children.
Some of the children distinguished the cognates in the normal manner. VOT
values were longer for the voiceless than voiced segments and VOT contrasts
were longer for velars than ler alveolars and bilabials, respectively.
However, most of the hearing-impaired speakers did not observe the voiced-
voiceless distinction and deviated from normal speakers in a similar way.
Typically, voice-onset-time values for voiceless segments were lower than
those for voiced, and also overlapped with the measurements for voiced. This
pattern was noted for /p-b/ and /t-d/, although measurements for tk -g/ were
more complex. Furthermore, CleSe subjects did not distinguish VOT among stops
based on place of articulation. Hearing-impaired speakers who observed the
voiced-vciceless 'distinction typically had high speech intelligibility, prob-
236
242

ably 4ecause they-were capable of producing other aspects of speech normally
as well. Hearihg-impaired speakers who did not observe these contrasts tended
to collapse the voiced-voiceless categories, producing Most segments as
voiced. These speakers were considerably less intelligible than those who
produced the voicing distinction.
Findings similar to\Monsen's have been reported in .the earlier work of
Calvert (1961) and Irvih and Wilson (1973), and more recently as part of
measurements made in studying the acoustic and articulatory correlates of the
speech of the hearing impaired (Mahshie, 1980; McGarr & L8fqvist, in press;
Stein, 1980). In the McGarr and L8fqvist study, the authors noted that VOT
values for some of their hearing-impaired speakers fell in the range of 20-30
msec, which is cldse to the perceptual boundary where shifts in'the perception
of voicing have been shown to occur. This may be one reason why listeners to
he speech of the hearing impaired have difficulty making judgments of
pi ticular phonetic segments. We will return to these physiological studies
lat r.
2. ormant Pattern of Transition
Hea ing-impaired speakers have often been-described as having difficulty
in moving their articulators correctly from one phoneme to the next (Calvert,
1961; John & Howarth, 1965; Martony, 1966; Smith, 1975). One manifestation of
this problem at the acoustic level is distortion of formant frequency,
transitions. \
Chanies in the formant frequencies, particularly the direction, extent,
and duration of the second formant transition, have been shown to be important,
acoustic cues for\the place of articulation (Delattre, Liberman, & Cooper,
1955; Liberman, Dglattre, Gerstman, & Cooper, 1956). As discussed above,
hearing -- impaired speakers characteristically produce many errors involving the
place of articulation.
While there have been only a few acoustic analyses of formant transition,
of hearing-impaired speakers, these studies are nonetheless in general agree-
ment (Martony, 1966; Monsen, 1976c; Rothman, 1976). In general, this work
showed that formants were exceedingly short in duration or missing altogether,
that the extent of the frequency range of the transitions. was limited in part
because the formant frequencies for vowels were greatly neutralized, and that
transition's varied little with respect to phonetic context. Also, the slope
of the transitions frequently remained' fairly flat when either a rising or
falling pattern was dictated. Thus, F2 transitions in the speech of the
hearfhg-impaired may be reduced in both duration and frequency range. These
patterns, together with deviations in the steady state formant frequencies for
vowels (to be discussed later), suggest that hearing-impaired speakers have
reduced articulatory movement and ah absence of the coarticuatory effects
observed in the speech or normals.
O
237

1
C. 'Production of Vowels and Diphthongs
Overview
Hudgins and Numbers (1942) were again among the first investigators to
study the production of vowels and diphthongs systematically in the speech ofthe hearing impaired. They classified the errors according to five majortypes:
1. Substitution of one vowel for another2. Neutralization of vowels3. Diphthongization of vowels4. Nasalization of vowels5.' Errors involving diphthongs: either the diphthong was split into two
distinctive components, or the final member of the diphthong wasdropped.
In this study, substitutions and neutralization of vowels, and difficultywith the production of diphthongs were among the most comnon errors..
Essentially the same pattern has been replicated in other studies if hearing-impaired speakers regardless of whether the vowel was produced in a CVCframework (Angelocci, Kopp, & Holbrook, 1964; Calvert, 1961), in :est words
(Geffner, 1980; Mangan, 1961; Markides, 1970; Nober, 1967), or in sentences
(Smith, 1975). ,
There .is also agreement concerning the frequency of vowel versus conso-nant errors. Overall, fewer errors in vowel production have been reported,although it should be noted that this finding may be influenced by variablesin both speaker production and listener perception. For example, Brannon(1966) claimed that vowels were in fact easier for heafing-impaired speakers
-to produce than consonants, since vowels were supposed to require less precisearticulatory position. Perceptually, Hudgins and Numbers (1942) and iateiMonsen (1976c) suggested_that listeners toleratea--greater_degree of distor-tion in vowels than in consonants, hence the report of fewer _Vowel errors..FurthermoFe, acoustic information conveyed in the vocalic position of thePstimulus also provides :information of oonsonants, and thus, if erroneous (aswe will discuss later), may directly affect the perception of the consonant.In general, it should also be noted that fewer.vowels.than consonants areproduced in running speech, thus there is less opportunity for error.
2. Vowel Errors
)Traditional classification schemes fore voweli employ such categories as
tongue position (high-low,,front-uack)., tongue tension (tense-lax), and degree
of lip rounding. These refer to arti, glatory events and are importanIt to oursubsequent discussion of the acoustic characteristics of vowels. In general,hearing-impaired speakers have been found to produce back vowels correctlymore often than front vowels (Boone, 1966; Geffner, 198 Mangan, 1961; Nober,1967; Smith, 1975) and low vowels correctly more often than those with mid or'high tongue position's (Geffner, 1980; Nober, 1967; Smith, 1975)4 In ;fact,
Boone (1966) suggested that hearing=ampaired speakers tend to keep theirtongue retracted in a low back position. In contrast, Stein's (1980)
cinefluographic study of v.rwels produced by hearing-impaired speakers showed"fronting" of back vowels.
238
244

. With respect to errors of substitution, hearing-impaired speakers often
fail to make the tense-lax distinction (Mangan, 1961; Monsen, 1974 Smith,
1975), although there is evidence to the contrary (Hudgins & Numbers, 1942;
Markides, 1970)., The commonly observed error of neutralization, a problem
akin to substitution, has been noted in the desCriptive literature (Heider et
al., 1941; Markides,. 1970; Smith, 1975) as well as in "acoustic studies
(Angelocci et al., 1964; Monsen, 1976a, 1976). This work suggests that the
hearing-impaird speaker tend to produce vowels with a pattern appropriate
for the neutral vowel AV.- s error has implications at the segmental as
well as the puprasegmental 1 el since, in the latter case, the syllable isshortened and often not given the appropriate stress.
Other commorily.reported errors in vowel production include inappropriate
nasalization of vowels.(Martony, 1966; Stevens et al., 1976) and diphthongiza-
tion of pure vowels (Boone, 1966; Markides, 1970; Smith, 1975). With the
exception of Hudgins and Numbers (1942), very little additional data have been
collected on production of diphthongs, the error patterns reported being
essentially the same (Levitt et al., 1980; Nober, 1967).
D. ACoustic Characteristics of Vowels
The acoustic characteristics of vowels and diphthong production have been
studied in great detail in normal speech production, 6utraé
ajpen there is little
in the speech of the hearing impaired. We will concentra here primarily on
studies of vowel foririants, leaving a discussion of timing characteristics
(i.e., duration) and segmental influences on fundamental frequency until later
in the chapter.
The formant frequendies, especially the first (F1 ) and secon F2)
formants, are traditionally used to provide an acoustic description of.-vow ls.
Usually,__these formant ,value are plotted_against each other, and the ata
points for each vowel cluster into fairly distinctive regions (cf. Peterso I
Barney, 1952). Interestingly, the acoustic vowel plot of F1 and F2 cYosely
resemble the articulatory vowel map. Although the relationship between).
acoustic and articulatory correspondence is riot simple, it has been suggested
that Fr (which increases and then decreases as the vowels go from /i/ to-/u/)
represents tongue height, and that F2 (which decreases from /i/ to /u/)
represents the constriction of the tongue-ir, the front-back plane. Ocourse,
events such as degree of lip rounding, pharyngeal constriction, as ,well as
individual speaker differences must also be considered.
Analysisof spectlams of this polYulation is not without problems. In
many cases there are ra harmonics and are fundamental frequency (Fo) of
hearing-impaired speakers-may often be quite high. This may create a mismatch
between the source and the bandwidth of the spectrogram _filter used in
analyzing the acoustic signal. This- problem is similar to that faced in the
spectrographic analysis of young hearing children's 'speech (cf. Huggins,
1980). Spectrographic analysis of the speech of the hearing impaired is
further complicated by pertuuations in the source, inappropriate management of
intensity, and/or inappropriate nasalization that introduces zeros into the
frequency domain. This often' precludes easy ana straightforward analysis.
Some of these problems may be circumvented by the use of digital analysis
24 5
239

1'
techniques suchdetermination of
ear Predictive Coding (LPC). Even with the use of up,mant frequency location may still be difficult.
There have been several studies examining the-acoustic charcteristics ofvowels produced by hearing-impaired children using spectrographic analysis,( Angelocci' et al., 1964; Monsen, 1974, 1978), and one study in which thespeech was digitized and subjeuted to LPC analysis (Osberger, Levitt, &Slosberg, 1979). Besides instrumentation differences, these studies alsodiffer in that the latter work includes only productions perceived as correctin hearing-impaired children's speech, while the Other studies are not clearwith respect to this point. Nonetheless, the results of these studies showthat the formant frequencies of deaf children's vowels tend toward that of theneutral- vowel /a/. This result is of further interest since the hearing -impaired subjects in both the Monsen and the Osberger et al. studies. produced
vowels in sentence context, while subjects in Angelocci et al. produced vowelsin CVC monosyllables. The data from these studies are interpreted 'to suggestthat hearing-impaired speakers use a restricted amount of4tongue movement to
achieve vowel differentiation. Indeed, several investigators (Angelocci et
al., 1964; Martony, 1968) have suggested that differences in vowels producedby hearing-impairedIspeakers are achieved primarily by means of variation in
fundamental frequency.
' In addition to reduced phonological space for all vowels and extensiveoverlapping of vowel areas, Monsen (1 -976a) also noted that the second formantof vowels remained around 1800 Hz rather than varying as different vowels werearticulated. This "immobility of F211 not only deleteriously affects percep-tion of the vowel' but also interferes with transmission of consonantalinformation. The difficulty with F2 is not surprising, since many hearing-impaired speakers have residual hearing only in.the.frequency range of F1 and
not in the range of F2. Another Doctor is that the fror'-back tongue movementassociated with second formanta is impossible for a deue student to observe. 1 .
Articulatory movements such as jaw movementiassociated with F1 change arecertainly - - more visible.
'Very little is known about/the acoustic aspects of diphthong productionin the hearing impaired. Monsen (1976d), using.spectrogr'aphic.measurenents ofthe diphthong /aI/, has classified deviant acoustic patterns on the basis offrequency change duringtprodOction of the diphthong. One deviant pattern ischaracterized by.a large change in the.frequency of F1 with an immobility cfF2. Monsen hypothesized that this pattern results when the appropriate jawmovement is not accompanied by appropriate movement of the tongue. Minimal
movement of both F1 and F2 was, another pattern observed, which Monsenattributed to a.generally stable vocal tract throughout production of thediphthong with minimal jaw movement,:A third pattern was a reversal of the
direction of movement of F2 with respect to normal. Monsen hypothesized this'to be the acoustic consequence of the diphthong being produced with the tonguelowered and retracted.
240
t;

NON-SEGMENTAL PATTERNS IN THE SPEECH OF\SEVERELY AND
PROFOUNDLY HEARING-IMPAIRED SPEAKERS
This section will present information on the non-articulatory aspects of
hearing-impaired children's speech. These patterns are also referred to assuprasegmental because they involve characteristics of speech, that extend over
units composed of more than one phonetic segment. Included in this category
are characteristics such as timing, intonation, and stress assignments. These,
areas, as well as the acoustic correlate of pitch (fundamental frequency) and
factors affecting 'perceived voice quality will be described in this section.
A. Timing Patterns
Overall 'Speaking Rate
With few exceptions, the,speech of the severely and profoundly hearing
impaired is perceived as being too slow and sounding very labored. Physical
measures of speaking rate have shown that profoundly hearing-_impaired speak-
ers, on the average, take 1.5 to 2.0 times longer to produce the
utterance as do normal- hearing; speakers (Boone, 1966; Heidinger, 1972;, Hood,
1966; John & Howarth, 1965; Voelker,_1935, 1938). The reduced speaking rate
is due to the excessive prolongation of speech segment3 and the insertion of
pauses.
Prolongation of speech segments may be present in the production of
phonemes, syllables, and words. Calvert (1961) was among the first to obtain
objective measurements of- phonemic duration in the speech of the. hearing
impaired by spectrographic analysis of bisyllabic words. The results of this
study showed that hearing-impaired speakers extended the, duration of vowels,
fricatives, and the .closure period of plosives up to five times the average
duration filr normal speakers. In a later study, Osberger and Levitt (1979)
Observed that syllable prolongation in the speech of the hearing impaired was
due primarily to prolongation of vowels.
Figure 1 shows data obtained by Osberger (1978) on mean syllable duration
in a sentence 'produced by six' normally-hearing and six 'profoundly hearing-
impaired children. The data show a distinctive pattern of syllable durations
for the two groups of speakers. The line connecting the data points of the
hearing-impaired speakers lies above and is approximately parallel to that of
the hearing children. The exception to this is the sixth syllable where the
mean syllable duration is shorter for the hearing-impaired than the normal
speakers. This was due to the omission of some of the phonemes in the
syllable by the hearing-impaired speakers, making the duration of the syllable
shorter than would be expected if all of the intended segments had been
produced. The size of the standard deviations, shown by the vertical bar's,
indicates that there is greater variability in syllable duration among the
,hearing-impaired than among the normal speakers.
Profoundly hearing-impaired speakers typically insert more pauses, and
pauses of longer duration, than do speakers with normal hearing (Boone, 1966;
Boothroyd, Nickerson, & Stevens, 1974; Heidinger, 1972; Hood, 1966; John &
Howarth, 1965; Stevens, Nickerson, & Rollins, 1978). Pauses may be inserted
at syntactically inappropriate boundaries such as between two syllables in a
e.;
247
241

600, 4 Normals I "S. D.
500 Deaf I S. D.A Stressed Syllable
>
Z 400 T10 . I
T1:17
7i Al T I
---,,44I
AIcc- 30-0 _so- s
1
\ . s 1 T\'e' _L \ I
D I \. ,.. Ail' . 1
. .\ 7 \ Al
Z 200 -a- V . ,s I
4 I -L
W I
2100
\2 3 4 5
SYLLABLE
Figure 1. Mean duration (msec) for syllables in the sentence "I wish I could
read that book" produced by six normal-hearing children and sixhearing-impaired children. The standard deviation is representedby the vertical bars (after Osberger, 1978).
242 243

bisylrabic word or within phrases. The greatest difference between normal and
hearing-impaired speakers has been observed in the durations of inter- and
intraphrase pausei (Stevens et al., 1978). The results of Hudgins (1934,
1937. 1946) suggested that the frequent pauses observed in the speech of the
hearing impaired may be the result of poor respiratory contrcl. Specifically,
Hudgins found that deaf children used short, irregular breath groups often
with only one or two words, and breath pauses that interrupted the flow of
speech at inappropriate places. In addition there was excessive expenditure
of breath on single syllables, false groupings of syllables, and Misplacements
of accents. Later, we shall discuss the propensity of hearing-impaired
speakers to use inappropriate breath groups.
2. Segmental Timing Effects
Acoustic analyses of normal speech have shown that the duration of vowels
is systematically influenced by effects operating at the level of phonetic
segments. Since vowels form the nuclei of the larger segments of speech,
these differences in vowel duration exert substantial effects on both the
production and perception of the temporal and segmental aspects of speech.
Vowels have been described as having an intrinsic duration (Peterson &
Lehiste, 1960) and, in comparable contexts, some vowels are consistently
shorter than other vowels (House, 1961). Hearing-impaired speakers with
severe and profouJ losses have been found to distort this relationship
between the vowels. For example, Monsen (1974) observed that /i/ was
relatively longer than,/I/ in monosyllabic words in the speech of normal-
hearing subjects, but in, the speech of profoundly hearing-impaired children,
there was a tendency for these vowels to occupy mutually exclusive duration
ranges. McGarr and Harris (1980), on the other hand, found that the
profoundly hearing-impaired speaker in their study did not show consistent
differences in intrinsic vowel duration.
There is substantial literatbre showing that the average duration of
vowels also varies markedly as a function of phonetic context in normal
speech. When different phonetic contexts are considered, the voicing charac-
teristic of the following consonant has been shown to hale a consistent effect
on preceding vowel duration; for normal speakers, the duration of a vowel
preceding a voiceless consonant is less than the vowel du tion preceding a
voiced consonant in stressed, syllables (Denes, 1955; House, 1961; House &
Fairbanks, 1953; Peterson & Lehiste, 1960). This systematic change In vowel
duration has been found to be a significant perceptual cue to \the voicing
characteristic of the following consonant or consonant clusterNjRaphael,
the hearing impaired fail to produce the appropriate modifications in owel1972). Results obtained by Calvert (1961) and Monsen (1974) have snowyhat
duration as a function of the voicing characteristics of the following
consonant. Thus, the frequent voiced-voiceless confusions observed in the`
speech of the deaf may actually be due to vowel duration errors (Calvert,
1961).
3. Suorasegmental Timing Effects
Th,a duration of segments is also influenced by effects operating at the
level of syllables, words, and phrases. In English, changes in contrastive
stress have been found to produce systematic changes in vowel duration. When
243
243

vowels are stressed, they are longer in duration than when the same vowels are'unstressed (Parmenter & Trevino, 1936). This durational variation has also
been found to be an important cue for the perception of stress (Fry, 1955,1958).
Several investigations have shown that, while hearing-impaired speakersmake the duration of unstressed syllables shorter than that of the stressedsyllables, the proportional shortening is smaller, on the average, in the
speech of the hearing impaired than in the speech of normal subjects-(Osberger& Levitt, 1979; Stevens et al., -1978). In contrast to this, Reilly'(1979)foUnd larger than normal duration differences between vowels in primary- and
weak-stress syllables produced by a group of profoundly hearing-impairedchildren. These data are shown in Figure 2. In this figure, duration has
been calculated for the vowels /i, I, u/ produced in both primary- and weak-
stress syllables by hearing and hearing-impaired children. For /i/ and /u/,longer average durations were measured for greater stress for both grpups,with the hearing impaired durations being longer overall, and the differencebetween the primary and, weak syllables being more extreme than in the samplesproduced by the hearing children. There was almost no difference in duration
between the primary and weak /I/ in the normal children's samples, whereas thehearing-impaired speakers produced longer durations of /I/ in weak syllables
than primary stress syllables.
Exactly how a hearing-impaired speaker uses temporal manipulations to
convey differences in syllabic stress pattern is not clear. In" a recent
study, McGarr and Harris (1980) found that even though intended stressed
vowels were always longer than unstressed vowels in the speech of one
'profoundly hearing-impaired speaker, the intended stress pattern was not
always perceived correctly by a listener. Thus, the hearing-impaired speaker
was using some other suprasegmental feature to convey contrastive stress.Variation in fundamental frequency would be a likely alternative, but McGarr
and Harris also found that while the hearing-impaired speaker produced the
systematic changes in fundamental frequency associated with syllable stress,
perceptual confusions involving stress pattern wer still observed.
Anothe; suprasegmental temporal effect occurring in normal speech is
prepausal lengthening. When a syllable occurs before a pause that marks a
major syntactic boundary, it is longer in duration than when it occurs in
other positions in a phrase (Klatt, 1975). It has been observed that hearing-
impaired speakers do not always lengthen the duration of phrase-final syll-
ables relative to the duration of the other syllables in the phrase. Stevens
et al. (1978) observed that when there was evidence of prepausal lengthening
in the speech of profoundly hearing-impaired talkers, the increase in the
duration of the final syllable was much smaller, on the average, for the
hearing-impaired than for the normal-hearing speakers. In contrast to this,
Reilly (1979) found that the profoundly hearing-impaired speakers in her study
used duration to differentiate prepausal and non-prepausal syllables. As was
the case for primary- and weak-stress syllables, discussed above, Reilly
observed a larger than normal difference between the duration of syllables in
the prepausal and non-prepausal position in the samples produced by the
hearing-impaired children.
244

A
300,-
200c.)
$E
z01:--
crn13 100
Z<U.1
.
hearing mean
deaf mean
"-----------*/i/
4,primary weak primary weak
STRESS
Figure 2. Mean ,owel duration (msec) in primary- and weak-stress syllables
produced by a group of normal-hearing and a group of profoundly
hearing-impaired children (after Reilly, 1979).
251
245

The information presented above_ clearly shows that profoundly hearing-,
impaired speakers distort many temporal aspects of speech. These,distortions,
such as excessively prolonged speech segments, and the insertion. orbothfrequent and lengthy 'pauses, are perceptually prominent and disrupt therhythmic aspects of speech. In spite of these deviancies, there is evidence
'suggesting that hearing - impaired talkers manipulate some aspects of duration,such as those involving relative duration, in a manner similar to that ofspeakers with normal hearing.
B. Fundamental Frequency Patterns
Average Fundamental Frequency
Among the most noticeable speech disorders of the hearing impaired arethose involving fundamental frequency (Fo). In normal speech e. there are
differences in average fundamental frequency depending on the sex and age of
the speaker. Reported fundamental frequency values range from 100-175 Hz foradult males and from 175-250 Hz for adult females AFairbanks, 1940; Fairbanks,Wiley, & Lassman, 1949; Fairbanks, Herbert, & Hammond, 1949; Hollien & Paul,
1969): Recent data (Hasek, Singh, & Murry, 1981) suggest that a significantdifference between the average Fo of preadolescent male and female childrenwith normal hearing begins to emerge by seven or eight years of age, with the
sex difference attributable to a reduction in Fo for male children only,beginning around age seven. No significant preadolescent age-related changein Fo in females was observed.
If there is a problem with a hearing-impaired speaker's average fundamen-
tal frequency, more often the voice pitch is characterized as too high rather
than too low (Angelocci et al., 1964; Boone, 1966; -Martony, 1968). Some
differences in average Fo have been found as a> function of the age or sex of
the hearing-impaired speaker. The results of several studies have shown that
there are no significant differences in average Fo between yOung hearing and
hearing-impaired children in the 6-12 year age ,range .(Boone; 1966; Green',
1956; Monsen, 1979). Differences have been reported between groups of older
children but it is not clear if pitch deviation is greater for hearing-
impaired females or males. Boone (1966) found a higher average Fo for 17-18
year old males than females. Osberger (1981) round that the differencein Fo
between hearing and hearing-impaired speakers in the 1J-15 year age range was
greater for females than for males. This finding is illustrated in Figure 3,
which shows ths: Fo values averaged across sentences for six normal-hearing and
ten hearing-impaired subjects. As can be seen,,the Fo for the female hearing -
impaired speakers ranged between 250-300 Hz. This value is about 75 Hz higher
than that observed for the normal-hearing females. The average Fo value of
the utterances of the male hearing-impaired speakers is slightly lower than
that of the hearing males for the first part of the utterance. The Fo ,values
for the hearing and hearing-impaired male speakers overlap for the last half
of the utterance. Bush (1981) observed excessive segmental variations in Fo
for a small group of profoundly hearing-impaired females in the same age range
as those in the Osberger study. Age-related factors such as laryngeal growth
accompanied by adolescent voice change or similarities in speech training were
suggestei by Bush as reasons for the problems of the females in controlling
Fo.
246

4 5SYLLABLE
Figure 3. Fundamental frequency values in Hz, measured at the center of the
vowel in .ch syllable in the sentence "I like happy movies better"
for groups of normalhearing and profoundly hearingimpaired males
and females.
247
253

Up to this point, we have limited our discussion to physical measures offundamental ,frequency. In a clinical or schopl situation, the examiner willnot, in most cases, have the equipment necessary to make ,such measurements.In these settings, the clinician will have to rely on his or tier perceptualabilities to evaluate the appropriateness of the child's pitch. The pitchdeviancy of profoundly hearing-impaired children has been evaluated perceptu-ally by McGarr and Osberger (1978), Using a five-point rating scale. The
Prlpfile rating of pitch register (Subtelny, 1975) and the descriptors areshown in Table 1. The scale was used with approximately 50 children 10-11years cf age. The results of this study showed that, a large number of thechildren received pitch ratings that were either appropriate for their age and
sex or differed only slightly from optimal level. Thirty-two of the children
received an average rating higher than 4.0. There Mast however, a Small group
of children who could not sustain phonation and whose speech was characterized
by pitch breaks or large fluctuations in.pitch. On the whole, these findingsare- in agreement with earlier studies indicating that the pitch o' manypreadolescent hearing-impaired children is within the normal range. It is not
clear to what extent the average Fo of a hearing-impaired child's, speech candiffer from that of a normal child before it is perceived as deviant andhence, remedial training is indicated.
ProfileRatinE
2.
3.
4.
5.
Table 1
Rating Scale Used to Evaluate Pitch (from Subtelny, 1975)
Functional Descriptor
Cannot sustain phonation
Much above (+) or much below (-) optimal level
Moderately above (+) or below (-) optimal level
Slightly above (+) or below (-) optimal level
Appropriate for age and sex
243

2. Intonation Patterns
Intonation is the perceived pattern of change in fundamental frequency
within a phrase. or sentence. Reference is made, even in the very early
literature, to the difficulties that hearing-impaired speakers experience in
controlling this aspect of speech. Haycock (1933), Rawlings (1935), Russell
(1929), Scripture (1913), and Story (1917) all describe the speech of
congenitally deaf persons as "monotonous" and "devoid of melody." Later
investigations showed that hearing-impaired speakers did produce pitch varia-
tions, but the average range was more reduced than those of speakers with
normal hearing (Green, 1956; Hood, 1966; Voelker, 1935).
-Some hearing-iipaired speakers may demonstrate an intonation problem in
the form -of, excessive and inappropriate changes in fundamental frequency.
These speakers may raise or lower' Fo 100 Hz or more within.the same utterance.
Often, after a sharp rise in fundamental frequency, the hearing-impaired
'speaker loses all-phonatory control, and there is a complete cessation of
phonation (Monsen, 1979; Smith, 1975; Stevens et al.; 1978).
Figure 4 shows the intonation contour of a simple, declarative sentence
spoken by a normal, 14-year-old female. There is a 'rise in Fo at the
beginning of the sentence with a peak on the first stressed syllable (the
second `syllable in the sentence). As the sentence is produced, there is a
gradual reduction in Fo, known as declination. The sharp drop that occurs in
Fo at the end of the sentence is referred to as the terminal fall. Figure 5
shows 'the contour of t.ne same sentence spoken" by a hearing-impaired male
speaker, 14 years of age, judged to haye insufficient variation in intonation.
Note that the extent of the change in the Fo throughout the utterance is more
restricted than that observed for the child with normal speech in Figure .4.
In contrast to this pattern, Figure 6 shows contours for two females, 14 years
old, who-produced the sentence with excessive and inappropriate changes in Fo.
Speaker 1 produced the first part of the sentence with a sharp rise in Fo,
followed by a sharp fall in F6 over the last half of the utterance. Speaker 2
produced inappropriate fluctuations in Fo throughout the entire utterance.
There have been few'attempts to arrive at a quantitative classification
of intonation contours produced by hearing-impaired children. Monsen (1979)
has described the following four types of contours that he found to occur in
the production of CV syllables by 3- to 6-year-old hearing-impaired children:
(1) a falling contour, characterized by a smooth decline in Fo at an average
rate greater than 10 Hz per 100 msec; (2) a short-falling contour, occurring
on words of short duration--the Fo fall may be more than 10 Hz per 100 msec
but the total change may be small; (3) a falling-flat contour, characterized
by a rapid change in frequency at the beginning of a word, followed by a
relatively unchanging, flat portion; (4) a changing contour, characterized by
a change in frequency, the duration of which appears uncontrolled, and extends
over relatively large segments.
Monsen (1979) found that the type of contour appeared to be an important
characteristic in separating the better from the poorer hearing-impaired
speakers. His classification scheme represents a substantial step forward in
describirg the intonation patterns of the hearing impaired. It remains to be
determined if such a classification scheme can be used to describe objectively
the intonation patterns of entire sentences as well as isolated syllables.249
2 55

350
300
250
200o
150
C
t
NEM
100 - . -
0 1 2 3 4 5 6 7
SYLLABLE
Figure 4. The intonation contour of the simple declarative sentence, "I likehappy movies better," spoken by a normalhearing child. Each data
point is the fundamental frequency value in He, measured at thecenter-of the vowel in each syllable in the sentence.
250
2 56
No

350
300
250
200U.
150
100
MUD
O
=NI
awl
=MN
sm.
1 2 3 4 5 6 7 8
SYLLABLE
qr
Figure 5. The intonation contour of the sentence "I like happy movies better"
'spoken by a profoundly hearing-impaired speaker judged to produce
insufficient variation in intonation. Each data point is the
fundamental frequency value in Hz, measured at the center of the
vowel. in each syllable of the sentence.
257

too
450 -
400r4i
350 -o
300
250
Speaker 1._Speaker 2
0 1 2 3 4 5
SYLLABLE
I .1
6 7J8
Figure 6. The intonation contour of the sentence "I like happy movies better"spoken by two profoundly hearing - impaired females judged to proddceexcessive and inappropriate,changes in fundamental frequency. Each
data point is the fundamental frequency value in Hz, measured atthe center of the vowel in each syllable of the sentence.
252_
25S
One factor that strongly influences Fo changes is the degree of stress
placed on syllables within a breath group. Typically, stressed syllables are
spoken with a higher fundamental frequency than are unstressed syllables (Fry,
1955). Thus, the contour consists' of peaks (riSes)'and valleys (falls) in Fo
that correspond to the stressed and unstressed syllable pattern of, the
sentence. This pattern has been observed to be distorted in the speech of the
hearing impaired. An example of this distortion pis apparent. in the Fo
contours of the two speakers in Figure 6.
3. Segmental Influences on Fundamental-Frequency Control .
A common clinical observation is that some hearing-impaired children
produce the vowels /i, I, u/ on a higher Fo than the other vowels of English. .
It has been sham that there is a systematic relationship between vowel and Fo
in normal speech. High vowels are produced on a higher Fo than,,4low vowel,
resulting in an inverse relationship between Fo,and the frequency location of
the first formant of the vowel (House & Fairbanks, 1953; :'eterson & Barney,
1952). Angelocci et al. (1964) first examined some of the vowel changes in Fo
in the speech of the hearing impaired. Their results showed that the average
Fo and amplitude for all vowels Was considerably higher for the hearing-.
impaired than for the normal subjects. In contrast, the,range Orfrequency
and amplitude values for the vowel formants was greater for the'normal-hearing
than for the hearing-impaired speakers. This finding, combined with the, high
Fo and large, amplitude values, led Angelocci et al. to suggest that the
hearing-impaired' subjects attempted to differentiate vowels by excessive
laryngeal variation rather than with articulatory maneuvers as do normal-
hearing speakers.
"goo-A recent study by Bush (1981) does not support a simple trade-off between
Fo variability and articulatory skill. Bush observed 'a close relationship
between vowel-related variability in. Fo- and articulatory skill for the
majority of profoundly hearing-impaired subjects. in her study. In general,
greater Fo variability was observed for the hearing-impaired speakers who
produced a wide range of vowel sounds (in terms of F1 and:F2 values) and who
were more intelligible than speakers whose articulator); skills were more
limited. Bush also noted that although the amount of Fo variation with vowelS
used by the hearing-impaired speakers was.greater, on the average, than that
used by the hearing speakers, the direction in which Fo varied as a.function
of vowel height was similar for the two groups of speakers.
On the basis of these observations, Bush concluded that the vowel-to-
vowel variations produced'by the hearing-impaired speakers were, in some way,
a consequence of the same articulatory maneuver used by normal speakers in
vowel production. These data are disalssed in terms of Honda's (Note' 1)
account of vowel-related variations in Fo for normal speakers. Briefly,
Honda's mechanism assumed that moving the tongue root forward for the
production of high vowels causes the thyroid bone to move forward, tilting the
cartilage anteriorly. As a result of these maneuvers, there is increased
"tension on the vocal folds, resulting in an increase in Fo. Bush has
postulated that because of.the non-linear nature of the stress-strain,rela-'
tionship for vocal-fold tissue, increases in vocall-fold tension may be greater
in magnitude when the tension on the vocal folds is already relatively high
(as is the case with hearing-impaired speakers), resulting in somewhat larger
increases in Fo during the articulation of high vowels. '251
2.53

In summary, as was. observed for some of the temporal patterns of speech,it appears that profoundly hearing-impaired speakers encode and organize someaspects of fundamental frequency with respect to syntactic considerations inmuch the,same manner as do normal speakers. There are obvious deviancies infundamental frequency control in the speech of the hearing impaired, but thereis, evidence to suggest that they know and use some 'of the same rules appliedby normal-hearing speakers.
fC. Production Patterns Affecting Voice Quality
1. Voice Quality
It is not unusual, to find people who, after working with the. profoundl
hearing impaired, claim that the speech of. this population has a distinctivequalici that differentiates it -from other speakers. 'Calvert (3961)` found, thatteachxs of the hearing impaired could reliably differentiaterthe voices ofprofpundly hearing-impaired speakers from normal speakepteprovided the speechsample's contained articulatory movement, such ,as -that required for the
production of a diphttOng or a CVC syllable. Peodutions with negligiblearticulatory movements, such as sustained vowels, failed to provide' the
experienced listeners with the necessary information for the correct identifi-cation of speakers. On the basis of these findings, Calvert concluded thatthe distinguishing characteristics of the -speech of the profoundly hearingimpaired are associated with articulatory movement over time, rather than withvoice quality per se.
In the same study, Calvert (1961) also found that there wag a great dealof variability among teachers in choosing the characteristics ,they felt
described most closely the voice quality of the hearing impaired. Thus,
although the deviant voice quality of the hearing impaired can ile,recognizedeasil), the characteristics that contribute to the perceived 'deviation aredifficult to characterize.
In a recent study, Monsen (1979) quantified some of these characteris-tics. Acoustic analysis, of duration, fundamental frequercy, and phonatorycontrol were correlated with ratings of voice quality for monosyllablesproduced by young hearing-impaired children. The results of this study showed
that the fundamental frequency contour appeared to be the most general
acoustic characteristic differentiating the children with ,tter voices from
those with poorer voices. Children with good voice-quality ra.,ings had
,fundamental, frequency contours that fell within an appropriate range and that
varied over time in an appropriate manner. In contrast, children with poorvoice quality produced intonation contours that .were excessively flat or
excessively changing. Monsen (1979) concluded that while other de-:iations
such as poor vowel quality, breathiness, and duration errors may exert astrong influence on perceived voice quality in individual cases, they do not
appear to be the major factors in determining the quality of the voice. From
the results of this study and those of Calvert (1961), it appears that thedistinctive voice quality of the hearing .impaired may be due to both poorarticulatory timing control and inadequate control of source funCtion.
254 2,

2. Nasalization
Proper control of the velopharynx has been recognized as a source of
difficulty for hearingimpaired speakers for many years (Hudgins, 1934). If
the velopharyngeal port is opened when it should be closed, the speech may be
perceived as hypernasal; if it is closed when it should be opened, hyponasali
ty will result. Problems in nasalization control are often described as
affecting voice quality because hyper or hyponasality affects the resonant
properties of speech. Improper velopharyngeal control , may also result in
articulatory errors, a problem addressed earlier in this chapter.
In a clinical setting, the evaluation of velopharyngeal control is
usually made on the basis of qualitative judgments, which are often difficult
to assess because they may be influenced by the presence of other deviancies.
Stevens etc- al. (1976) have attempted to overcome this problem by developing a
_procedure to quantify the degree' of nasalization for nasal and nonnasal
sounds in the speech of hearingimpaired children. Measurements of Rasaliza
tion have been obtained with an accelerometer attached to the surface of the
nose. The accelerometer picks up vibrations of the nose when there is
velopharyngeal opening during a voiced sound. Stevens et al. have evaluated
adequacy of velar control by comparing the amplitude of the accelerometer
signal (in decibels) for nasal consonants to the amplitude of vowel sounds
that should be produced without nasalization. ',For normalhearing speakers,
the amplitude difference between these measures is in the range of 10-20 dB.
Using amplitude difference as an index of nasalization, Stevens et al. found
that 76X of the profoundly hearingimpaired children studied had excessive
nasalization in at least half of the vowels produced in monosyllabic words.
Excessive nasalization on at least 8 of the 10 vowels studied was observed for
36% of the children. The greatest difficulty in velopharyngeal control was
evidenced in the hearingimpaired children's production of nasalstop clus
ters, which required closely coordinated movements of the velopharynx and oral
articulators. Almost half of the hearingimpaired children made an error on
at least one word with a nasalstop cluster.
3. Breathy Voice and Glottalization
These problems are caused by improper adjustment of the vocal folds.
Breathiness occurs when there is excessive airflow during voicing, resulting
in generation of turbrlence noise at the glottis. The vocal folds do not come
together rapidly, which affects the shape of the volumevelocity waveform,
resulting in an acoustic waveform with enhanced energy in the low frequencies
and deficient energy in the high frequencies (Stevens et al., 1978).
Glottalization involves the insertion of the glottal stop between syll
ables or words. It is caused by tightly adducting the glottal folds and then
abruptly releasing them. Profoundly hearingimpaired children often substi,
tute glottal stops for consonants produced in the center and back of the mouth
(Levitt et al., 1976). There is a tendency for hearingimpaired children who
_insert many glottalizations in their speech to have lower intelligibility than
those who do not (Stevens et al., 1978).
255
'2 6 i

V. PRODUCTION PATTERNS IN THE SPEECH OF HARD-OF-HEARING CHILDREN
A. Articulatory Patterns
Until only recently, attention has been paid to the speech of thehard-of-hearing child. This is probably largely due to the fact that themajority of these children are integrated into regular schools and they arenot as accessible --for-studyas the students attending day schools for thedeaf. In addition, researchers traditionally have viewed the communicationand education problems of the profoundly hearing impaired as more serious thanthose, of the hard 'of hearing and, thus, the majority of research effort hasbeen devoted to the children who appeared to have the greatest need. We nowknow that the presence of even a mild hearing loss can affect speech andlanguage development and interfere with academic performance. Often, hard-of-hearing children are neglected in the public school system. They frequentlyfail to receive the support services froth appropriately trained professionals
that they require in order to, perform successfully in a regular class. (Davis,1977).
The majority of information available on the speech of hard-ofhearingchildren involves' analyses of articulatory skills. Relatively few studieshave quantified suprasegmental production patterns and, for this reason, onlythe segmental aspects of the speech of Ihandof-hearing children will bediscussed.
i
I
If it is assumed that the major difference between hard-of-hearing andprofoundly hearing-impaired children is the degree of hearing loss, it is tobe expected that hard-of-hearing children would have better speech skills thanchildren with profound tmring losses. his notion has, in fact, beensupported by the results of several studies showing that, on the average,there is a lower frequency of vowel and c nsonant errors in the speech ofhard-of-hearing children than in the speec of profoundly hearing-impairedchildren (Gold, 1978; Hudgins & Numbers, 1942;\ 'Markides, 1970; Nober, 1967).
Probably the most comprehensive study on the speech of hard-of-hearingchildren has been completed by Gold (1978). p this study, the articulatoryerrors made by mainstreamed heard-of-hearing (Pare Tone Average of 80 dB HTLor less)
I
And deaf (PTA of 80 dB HTL or greater) children were compared.Phonemic (transcriptions were made of sentences\ read by the children thatcontainedall the phonemes of English. The data were analyzed to determine if
__ the types of articulatory errors were the same fork the two groups of children.The results in terms of overall error rate revealed, not unexpectedly, thatthe deaf group had significantly more segmental errors than the hard-of-hearing group. The data further revealed that \the types of errors weresimilar for the two groups of children. These data are summarized in Table 2.Two calculations were made for each of the eight error types for both groupsof children. The first calculation, error type as t e proportion of intendedphonemes for each of the two groups (shown in the first column of Table 2),was derived from the frequency of the error type relative to the total numberof phonemes in'the sample. The second calculation, error type as a proportionof all of the errors (shown in the second column), wasperformed to take intoaccount the higher error rate of the deaf group. Thus, the proportion of
'256 i

Table 2
Relative Frequency of Articulatory Errors for Hard-of
Hearing and Deaf Children (from Gold, 1978).
Hard-of-Hearing Deaf
Type of Error
Proportion
of IntendedPhonemes
Proportion
ofErrors
'Proportion
of IntendedPhonemes
Proportionof
Errors
Omissions .076 ( .392) .116 ( .405)
Vowel-VowelSubstitutions .050 ( .258) .065 ( .227)
Consonant- ,
ConsonantSubstitutions .035 ( .180) .060 ( .210)
RecognizableDistortions .019 ( .098) .023 ( .080)
UnrecognizableDistortions .007 ( .036) .013 ( .045)
Non-EnglishSubstitutions .002 ( .010) .004 ( .014)
DiphthongErrors .004 ( .021) .004 ( .014)
Other .001 ( .005) .001 ( .007)
TotalProportion
of Error .194 (1.000) .286 (1.000)
263
257
errors was based on the relative frequency of the error type out of the totalproportion of errors made by the group. Once the overall rate was taken into
account, the data showed striking similarities in the frequency of an errortype for the hard-of-hearing and deaf children. For example, the most
frequent type of error for both groups was that of omission. As the data
show, differences between the two groups were not substantial.
The results of the Gold study showed that although profoundly hearing-impaired children produce more segmental errors than hard-of-hearing children,the relative proportion of errors for each error type is similar for bothgroups of children. Only a small number of phonemes showed any significantdifferences in the pattern of confusions between groups. Gold has concluded,
at least for children in the same type of educational setting, that the degreeof the hearing loss is more strongly related to the overall frequency of
errors than to the kinds of errors that will be made.
B. Pattern of Speech Errors of Different Populations of Children
From the preceding discussion, it becomes evident that the pattern of
articulatory errors is remarkably similar in the speech of different
populations of hearing-impaired children. Two studies, those of Smith (1975)
and Gold (1978), lend themselves to cross-population comparison because thesame test materials and procedures were used by the two investigators. The
major difference between the studies is the groups of children studied: Smith
examined the segmental errors in the speech of profoundly hearing-impaired
children in an oral day school for the deaf; Gold, as mentioned above,
examined the segmental errors in mainstreamed hard-of-hearing and profoundly
hearing-impaired children. Some of the data from these two studies have been
plotted in Figure 7. In this figure, correct production of consonants is
plotted as a function of place of production for the three groups of hearing-
impaired children. Comparison of the data shows distinct patterns acrossgroups of children. As might be expected, the hard-of-hearing children most
often produced the consonants correctly, followed by the mainstreamed
profoundly hearing-impaired children; the children in the school for the deaf
produced the consonants correctly the least often. Note also that sounds
produced in the front of the mouth were most often correct, followed by the
back sounds; sounds produced in the middle of the mouth were most prone to
error, a finding discussed earlier in this chapter.
Gold did find some significant differences in the pattern of confusions
made by the mainstreamed hearing-impaired children and the children in the
school for the deaf. The children in the school for the deaf used more
neutral vowel substitutions and omitted more consonants than did the
mainstreamed children. They also substituted the glottal stop for /t/ and
/k/, and /b/ for labial sounds more often than the profoundly hearing-impiared
children who were mainstreamed.
The results of Gold's (1978) study show that although the nature of the
confusions did not differ significantly between the hard-of-hearing and deaf
children in the same educational setting, there were significant differencei
between the deaf children in schools for the deaf and those in the regular
public schools. Similarities in segmental error pattern were also apparent
across ;roups of children. It should be mentioned that although the
258

100
80
60
40
20Hard of Hearing (Gold, 1978)
0 Deaf - Integrated (Gold, 1978)A Deaf - School for Deaf (Smith, 1975)
Bilabial Labio- Lingua- Lingua- Lingua- Lingua-Dental Dental Alveolar Palatal Velar
PLACE OF PRODUCTION
Figure 7. Percent correct production of consonants plotted as a function of
place,of production for three groups of hearingimpaired children(after Snith, 1975 and Gold\, 1978).
265

mainstreamed children had better speech skills than the children in the school
for the deaf, a causal relationship between speech skills and school settingcannot be concluded. Although it is possible that a hearing-impiared
--speech may improve as a result of daily exposure to hearing children, the
children in Gold's study may have been mainstreamed because of their goodspeech skills.
7.
VI. MECHANISMS OF PRODUCTION CONTROL
As we have described above, speech production skills of the hearing
impaired have been examined using listener judgments, phonetic transcriptions,and acoustic analyses. While the descriptive literature is fairly detailed,there have been few physiological studies on the speech of the hearing
impaired. This is surprising since technology is available and also becausespeech production skills in normals have been studied fairly extensively.Indeed, close to 50 years ago, researchers attempted objective measurements ofhearing-impaired speech production in such areas as breath control (Hudgins,
1936; Rawlings, 1935; Scuri, 1935), voice production (Hudgins, 1937; Voelker,1938), and articulation (Brehm, 1922; Hudgins, 1934). Although by today's
technological standards the instrumentation in these studies was not verysophisticated, these researchers deserve our admiration for their ingenuity
and creative insight. Their intuition and Observations are clearly not dated.
Consider the following:
"The most obvious fault in the speech-breathing of deaf children is
that they have little or no control over the breath supply so that a
great deal more breath than is necessary is allowed to escape on
each syllable. They do not speak with normal chest-abdominal
action. They have not learned to group their syllables into breath
groups and phrases. Instead, they often expend an entire breath on
a single word. The reasons for this excessive use of breath is two-
fold: The inco-ordinated (sic) movements of the breathing muscles
and the maladjusted glottis" (Hudgins, 1937, p. 348).
The observations of Hudgins and his contemporaries might be taken today
as evidence for a breakdown in interarticulator coordination. That is,
hearing-impaired speakers fail to coordinate the complex ,activity of respira-
tion, phonation, and articulation, and the resultant errors in timing occur, at
the segmental and suprasegmental levels of speech production.
Admittedly, there has been a long hiatus between the early research'efforts and contemporary rekindled interest in speech physiology of the deaf.
Whether the time lapse represents a period of preoccupied interest with that
of describing the error patterns of hearing-impaired talkers, or reflects a
lag in applying the technology and ideas of speech production in normals to
speech production of the hearing impaired can only be conjecture. There may
be some truth in each, but in any event, we now turn to some recent studies on
the physioldtical characteristics of deaf speech.
260

A. Respiration
Studies on the respiratory patterns of profoundly hearing-impaired speak-
ers have shown that they evidence at least two kinds of problems. The first
is that iAley initiate phonation at too low a level of vital capacity, and also
that they produce a reduced number of syllables per breath (Forner & Hixon,
1977; Whitehead, in press). The second problem is that they mismanage the
volume of air by inappropriate valving at the laryngeal level.
Recently, Hixon and his associates have provided some objective data on
respiratory behavior both in normal (Hixon, Goldman, & Mead, 1973; Hixon,
Mead, & Goldman, 1976) and also in,hearing-impaired speakers (Forner & Hixon,
1977). In these studies, magnetometers were used to measure changes in the
anterior-posterior dimension5 of the chest wall during respiratory maneuvers
and also speech. Hearing-impaired speakers were found to be like hearing
speakers in some respects bUt not in others. For example, respiratory
activity for non-speech activities such as tidal breathing was similar to
normal. This has also been noted for other non-speech respiratory activities
such as coordinative demands on the breathing mechanism for athletics. Also,
Forner and Hixon (1977) showed that the mechanical adjustments of the
respiratory mechanism in preparing to speak (i.e., the relative postureof the
rib, cage versus the abdomeh) were often correct. These findings do not
support the suggestions of the early researchers that hearing-impaired speak-
ers evidence inappropriate,posture problems such as rib cage-abdominal asyn-
chronization. However, like the early researchers, Forner-and Hixon reported
that hearing-impaired speakers paused at inappropriate linguistic boundaries
either to inspire or alternatively to waste air, and thus they produced fewer
syllables per breath unit. Hearing-impaired speakers were also found to
initiate phonation at inappropriate lung volumes and to speak within a fairly
restricted lung volume range.
These results have been confirmed by Whitehead '(in press), who has
extended the findings of Hixon by examining different respiratory patterns
with respect to the speech intelligibility of hearing-impaired talkers. Not
surprisingly, Whitehead showed that profoundly hearing-impaired speakers who
were more intelligible had respiratory patterns similar to those of normal
speakers. For example, both groups initiated speech well above functional
residual capacity (FRC) and terminated production within the mid-volume range.
In contrast, hearing-impaired speakers who were characterized as semi-
intelligible initiated speech at substantially lower lung volumes arm
continued speaking well below FRC. Speech attempted at such reduced lung
volumes is exceedingly difficult because the speaker is working against the
natural recoil forces of the respiratory mechanism. Furthermore, this
aberrant respiratory pattern will also directly affect phonation.
Control of the expiratory cycle for,speech is crucial for phonation and
is particularly important in producing events such as changes in vocal
intensity, accommodating different aerodynamic patterns associated with conso-
nant production, as well as linguistic phrasing. To achieve such speech
events, the volume of expired air must be appropriately managed, and this
usually occurs at the laryngeal level. Thus, during speech production, one
might"think of the relationship of the larynx to the respiratory mechanism as
analogous to that of an air valve, where the valve must be open at certain
261
267

times to let the air escape (e.g., when producing a voiceless segment), and
must be closed at the other times to preserve the breathstream.
There are data suggesting that hearing-impaired speakers have difficultyin coordinating the events of respiration and laryngeal valving. For example,
consider some aerodynamic studies of consonants produced by hearing-impairedspeakers (Hutchinson & Smith, 1976; Whitehead, in press; Whitehead & Barefoot,1980). The method of data collection in these studies was similar; air flowwas measured using a face mask coupled to a pneumotachograph. Air flowmeasurements are taken to reflect .the relative open or closed state of thevocal tract. For normals, voiceless plosives would be produced with greaterpeak airflow than their voiced cognates; fricatives would be produced withgreater airflow than plosives. Overall, Whitehead and others cited above haveshown that hearing-impaired speakers do produce, although inconsistently,
plosives and fricatives with normal airflow patterns, suggesting that at leastsome hearing-impaired speakers are relatively successful in coordinating
respiration and laryngeal valving. Not surprising, these speakers were among
the more intelligible in the Whitehead study. Less intelligible' hearing-impaired speakers were often quite variable in management of airflow, and theydid not differentiate voiced and voiceless cognates aerodynamically. Data
from these subjects suggest inappropriate laryngeal gestures that could reduceairflow or, in other words, an inability of some hearing-impaired speakers to,coordinate respiration and laryngeal valving.
Another example of laryngeal valving problems can be gleaned from a study
of laryngeal-supralaryngeal coordination in the speech of the hearing impaired
(McGarr & L8fqvist, in press). In this experiment, laryngeal activity wasmonitored by means of, transillumination, wherein a flexible fiberscope is usedto illuminate the larynx, and a phototransistor, placed on the surface of the
subject's neck below the cricoid cartilage, senses the light passing betweenthe vocal folds. Figure 8 shows selected tokens of an utterance produced byone profoundly hearing- impaired speaker. Information about laryngeal abduc-
tion/adduction is shown in the transillumination records. Evidence of inap-propriate glottal abduction/adduction gestures is noted preceding each testword, and also between words in the carrier phrase. Figure 9 shows represen-
tative samples from a second profoundly hearing-impaired speaker's productionof the same test words. Similar inappropriate glottal gestures between words
are again observed. Leaving interarticulator timing for a later di-scussion,
this pattern supports the notion of valving problems at the laryngeal level
consistont, with previous discussions. During pauses between words, these
hearing-impaired speakers inappropriately opened the glottis, a pattern never
observed in the production of hearing speakers. Whether these hearing-impaired speakers actually took a breath or simply wasted air cannot be
directly ascertained from these data since simultaneous monitoring of respire-.
tory activity was not done. However, the authOrs argue that the latter ismore likely since the glottal abduction gesture was smaller and shorter in
duration between' words than between utterances. This pattern of aberrant
laryngeal valving differs from one hypothesized by Stevens, Nickerson, and
Rollins (in press). Based on a spectrographic study of deaf children's
productions, these authors hypothesized that the glottis is closed during
pauses between-words.
262

ORAL ARTICULATION
haT RA NSILLUMINATION
AUDIO ENVELOPE
peal
A
A
Ap
. a ,
200msee
beak
A
A
bj .. ..
Figure 8. Records of a profoundly hearing-impaired speaker's production ofthe utterance "Say peal again" (left) and "Say beak again" (right).
Curves represent oral articulation (top), transillumination(middle), and audio envelope (bottom). Onset of labial closure forthe word initial stops in "peal" and "beak" is marked At release of
oral closure by ; 4, marks peak glottal opening. Examples ofinappropriate abduction/adduction gestures are noted .in the
transillumination record by v.
260
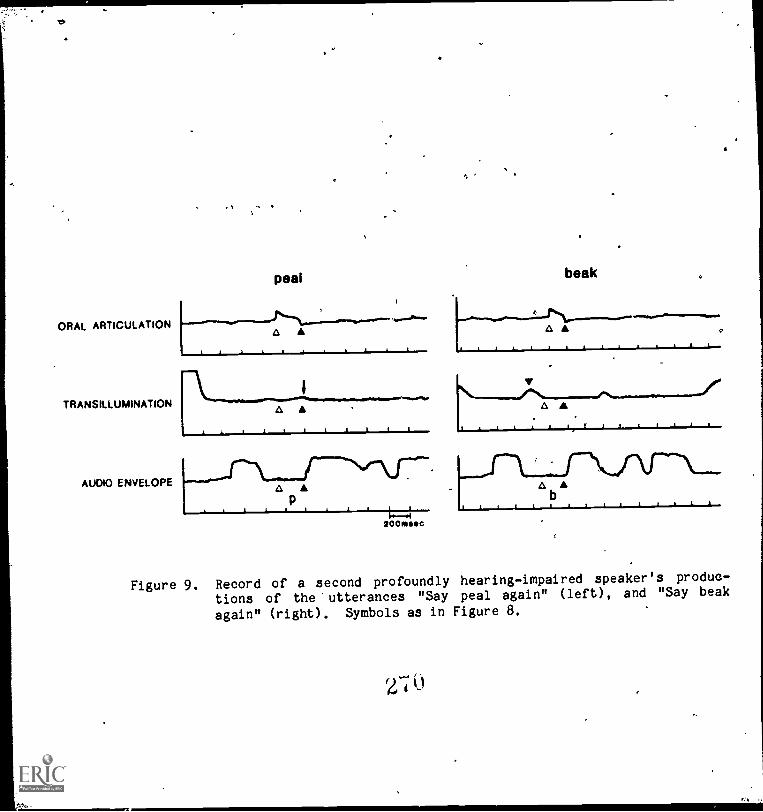
v.
ORAL ARTICULATION
TRANSILLUMINATION
AUDIO ENVELOPE
peal
''.........".'.."'"....................)"..'"..'..",.A iii
Li
beak
No.....................
\----...-.07".----......./N....-................---/A
.
4P
i i
200111190C
Figure 9. Record of a second profoundly hearingimpaired speaker's produc
tions of the'utterances "Say peal again" (left), and "Say beak
again" (right). Symbols as in Figure 8.
ri 0

B. Phonation
The larynx serves as the primary source of acoustic energy for speech and
plays an integral role in changes of stress and intonation, and also voicing
information. While we have ,noted earlier in this chapter that hearing-
impaired speakers exhibit great difficulty in controlling these phonatory
parameters, there are few physiological studies of laryngeal, function in the
hearing impaired. For convenience of discussion, we will divide laryngeal
function into two areas: phonatory and articulatory.
To date, there are few studies that have examined the basic phonatory
mechanism in hearing-impaired speakers. One study (Monsen, Engebretson, &
Vemula, 1978) examined the glottal volume-velocity waveforms of hearing -
impaired speakers using a reflectionless (Sondhi) tube. In this procedure,
the subject phonates a neutral vowel into the tube, and a microphone
positioned in the tube records a'pressure waveform that is considered to be an
approximate of the glottal waveform. It should be noted that the use of the
Sondhi tube presents some problems in the study of both normal and pathologi-
cal voice production.. In order to 'provide an accurate estimate of the source
waveform, several conditions must be met. For example, the vocal tract itself
must have a uniform area function and not contain any side resonators such as
the nasal passages. Since inappropriate nasal resonance is a common problem
in the speech of the hearing impaired, data obtained using this measurement
technique should be interpreted cautiously. Monsen et al. (1978) reported
that an individual glottal pulse,for a hearing-impaired speaker was not
abnormal per se, but that differences between hearing-impaired and hearing
subjects were seen for successive 'changes of the glottal waveform from one
period to another. Glottal waveforms of hearing-impaired speakers also showed
evidence of diplophonia and creaky voice. Thus, the authors hypothesized that
hearing-impaired speakers have difficulty controlling overall tension of the
vocal folds and also sub-glottal pressure.
Secondly, high-speed laryngeal films have also provided evidence orabnormal laryngeal function in hearing-impaired speakers (Metz, Whitehead, &
Mahshie, 1982). Films of several profoundly hearing-impaired speakers show
evidence of inappropriate plositioning of the vocal folds prior to the orset of
phonation and subsequent Imtterns of abnormal vocal fold vibration. For
example, an abnormally high amount of medial compression on the arytenoid
cartilages was observed in the films of one hearing-impaired speaker, and only
the anterior one-third of the folds vibrated freely. The analysis of these
film3 also revealed that some hearing- impaired speakers do not use appropriate
abduction/adduction gestures' in producing VCV utterances where C was a
voicele. consonant. These data speak to the point of difficulty in laryngeal
articul on, that is, the production of segments requiring control and
coordin Nn of the larynx.
Laryngeal articulation in :the speech of the hearing impaired has been
examinea in two physiological studies; the first a fiberoptic study of voiced
and voiceless segments (Mahshie, 1980) and the second a 'transillumination
study of obstruent production described previously (McGarr &L8fqvist, in
press). We have noted in other sections of this chapter that there is
considerable evidence from the descriptive and acoustic literature to suggest
that hearing-impaired speakers have great difficulty coordinating laryngeal
265

"
and oral- articulatory gestures. One common problem that illustrates thisdifficulty-is confusion of the voiced voiceless- distinction.
Let us consider what is required in the production of a voiceless
obstr-uent (a plosive, fricative or affricative) in the speech of normals. In
addition to the supralaryngeal' adjustments used to make the closure or
constriction, a laryngeal abduction'adduction gesture normally occurs to stopglottal vibration and assist in the buildup of oral pressure. Production ofthese segments -thus involves simultaneous activity at both laryngeal andsupralaryngeal levels, and the laryngeal and oral articulations must becqordinated in time. Variations in this timing are used in a wide variety oflanguages to produce contrasts of voicing and 'aspiration (cf. L8fqvist &Yoshioka, 1981).
An example of how this interarticulator timing might be manifested in thespeech of a heartng subject' is shown in Figure 10. Data are taken from thetransillujnination study of ,McGarr and L8fqvist described above. At this
time, we focus on the temporal relationship between the oral and laryngealevents. Peak glottal opening for the voiceless /p/ in "peal," shown in thetransillumination signal (middle record) occurs at about the same time as the
end of lip closure (top record) and the burstrelease in the acoustic envelope(bottom record). The pattern for this plosive is essentially the same as thatobtained for other hearing speakers' production of obstruents in different andunrelated languages (L8fqvist & Yoshioka, 1981). For production of thevoiced /b/ in "beak," there is no evidence of glottal opening in the
transillumination signal as would be expected for a correct production of this
segment. I.
, .
i
Figure 11 isan example of a common voiced for voiceless substitution inthe speech of a hearingimpaired talker. In this example, the error is due toinappropriate positioning of the vocal folds. For production of the /p/, thetransillumination signal shows no evidence of a glottal opening following the
onset of lip closure, or any evidence of a burstrelease in the acoustic
signal. Indeed; i.isteners judged this production to be a /b/ for /p/
substitution. McGarr and L8fqvist reported that hearingimpaired speakersdiffered from normal by either omitting the glottal gesture entirely asillustrated above, or by produCing a glottal gesture when none was required(see also above, Figures 8 and 9). In fact, one speaker consistently
differentiated plosives from fricatives by producing the former' without a
glotta gesture, but the latter with an opening gesture. However, even when
an ap opriate laryngeal gesture was made by the hearingimpaired -subjects,the timing relative to the oral articulatory events was not normal. Similar
observations on the nature of laryngeal articulation have been made by Mahshie(198 . The data from these two studies suggest that hearingimpaired
speai
rs have difficulty in coordinating the temporal and spatial demands of
difffikent articulators. We now turn to some evidence that shows that this,difficulty in coordination also occurs at the articulatory level.
C. Articulation
Articulatory errors in the speech of the hearingimpaired have been
re iewed above. The error patterns described in the literature suggest
se eral Hypotheses concerning the physiological "underpinnings" of articula-
2616
272

ORAL ARTICULATION
TRANSILLUMINATKIN
AUDIO ENVELOPE
peal,
A1I
I''''-N..---/%.,../+. .."''
A
____r..s.r\r"aii-..._AP
I Il.1200onsee
Figure 10. Records of a hearing speaker's productions of the utterances "Saypeal again" (left) and "Say'beak again" (right). Symbols as in
Figure 8. (After McGarr & Lofqvist, in press). ,--
....-...

ORAL ARTICULATION
TRAIiSILLUMINATION
AUDIO ENVELOPE
peal
....... .1\ f-\ r
6. A
A A, A 'P
elOmsoc
Figure 11. Records of a third profoundly hearingimpaired ;speaker's productien
of the utterances "Saj peal again" (left), and "Say beak again"
(right). Symbols as in Figure 8. . This example illustrates the
common b/p substitution. (After McGarr & L8fqvist, in press).
ti

tion in the hearing impaired. One hypothesis, derived primarily from studies
of consonant production, suggests that hearing-impaired speakers place their
articulators fairly accurately but fail to coordinate interarticulator move-:
menu. These errors may be broadly characterized as errors in timing.
Another hypothesis primarily concerned with vowel articulation is that hearing-
impaired speakers move their articulators through a relatively restricted
range, thereby "neutralizing" vowels. Again, there have been relatively few
physiological studies of articulation in hearing-impaired speakers, three
electromyographic investigations (Huntington et al., 1968; McGarr & Harris,
1980; Rothman, 1977), and two cinefluorographic studies (Stein, 1980; Zimmer-man & Rettaliata, 1981). These investigations provide some insight into the
complel nature of articulatory errors in the hearing impaired.
For example, electromyographic studies of the speech of hearing-impaired
persons give ample evidence of instability of production and failure to
achieve the tight temporal coupling in articulatory muscles. McGarr and
Harris (1980) have shown that for normal speakers, tke relationship between
two articulator ._ t_ he lips (orbicularis oris) and the tongue (genioglossus),
is closely coordinated in time, and that even changes in stress from one
syllable to another do not disrupt this temporal relationship. Indeed, this
closely timed interarticulator relationship seems to be characteristic of
normal speech production and is evidenced in many articulatory_ muscles across
changes in stress as well as speaking rate (Tuller, Harris, & Kelso, 1981).
Figure 12, taken from electromyographic records of a hearing speaker in
the McGarr and Harris experiment, illustrates this temporal relationship.
These productions are contrasted in Figure 13 with several examples taken from
the records of a hearing-impaired speaker. Clearly, these tokens demonstrate
considerable variability on the part of the hearing-impaired speaker in
coordinating the activity of the tongue with the lips. Occasionally, tongue
activity was timed relatively correctly with respect to lip activity. Most
often, the hearing-impaired speaker initiated this tongue activity either too
early or too late relative to the lips. These samplAs suggest that the
hearing-impaired speaker does not produce a "wrong" pattern in a stereotypic
way; rather, productions are variable from token to token not only for
utterances perceived as correct, but also for utterances perceived as incor-
rect. It is interesting that this variability in production is observed
primarily in the lingual rather than the labial component, that is, it is the
less visible aspect of articulation that varies. Similar observations have
been made regarding phoneme visibility in earlier EMG studies (Huntington et
al., 1968; Rothman, 1977). However, observations on the variability in both
perceptually correct and incorrect productions clearly provide new insights
into the organization of the speech of hearing-impaired talkers..
Cinefluorographic studies (Stein, 1980; Zimmerman & Rettalipta, 1981)
provide additional informati,h on upper articulatory movements in hearing-
s impaired speakers. These X-ray films have been analyzed for an adventitiously
hearing-impaired speaker in the former study, and also for five pre-lingually
hearing-impaired adults in the latter work. Despite differences in onset of
hearing 1053, these subjects showed patterns of articulatory dynamics similar
to each other, and not unlike normals in many respects. This is not
surprising since all of the hearing-impaired speakers were at least partially
intellig)ble. Some of'the differences between normal and hearing-impaired
269
7 5

i
1
pV
HEARING SPEAKER(FBB)
a'papip]
b.
\-600
[apepip]
msec
7600I
0 msec
Figure 12. Ensemble average of the EMG potentials for genioglossus (GG) andorbicularis-oris (00) for the utterance (apapip) produced by ahearing speaker. Stress occurs on V1 in 5a, or V2 in 5b,respectively. The vertical line indicates the acoustic release of
)
the /p/ closure. Peak genioglossus activity for the vowel occursat about the same time as the acoustic burst release (after McGarr---,
& Harris, 1980).
270
27t;
J...
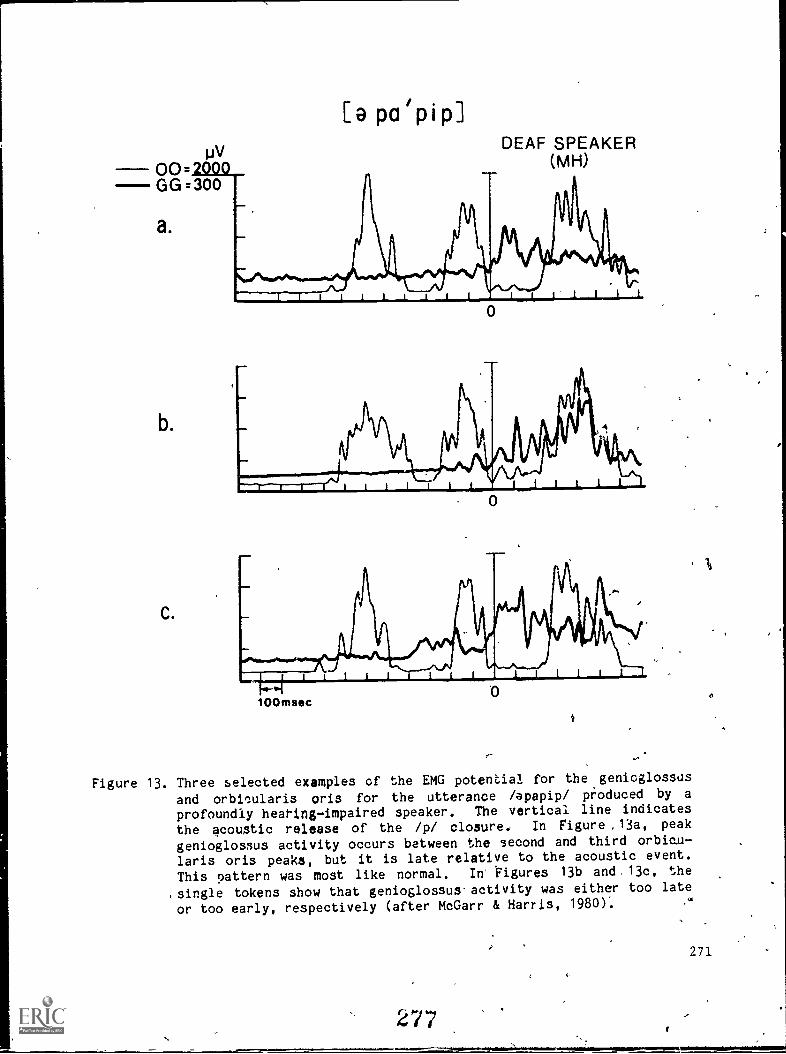
pV00=2000GG.300
a.
b.
C.
[a pa/pip]DEAF SPEAKER
(MH)
0
f""
i
Figure 13. Three selected examples of the EMG potential for the genicglossus
and orbicularis oris for the utterance /apapip/ produced by a
profoundly heating-impaired speaker. The vertical line indicates
the acoustic release of the /p/ closure, In Figure ,13a, peak
genioglossus activity occurs between the second and third orbicu-
laris oris peaks, but it is late relative to the acoustic event.
This pattern was most like normal. In Figures 13b and.13c, the
,single tokens show that genioglossus.activity was either too late
or too early, respectively (after McGarr & Harris, 1980): "
277.......................gy.......... IN.................,
271

speakers were as follows. Hearingimpaired speakers frequently exhibitedfaster articulatory speeds for lip, tongue, and jaw movements, and articulatory displacements were often of greater magnitude than for normal§. Vowel
height differentiation was achieved primarily by jaw movements, and deviantpositioning of the tongue, with primarily "fronting" of back vowels noted. A
consistent 'finding of these .studies was that onset and offset' voicing in
consonant production was frequently too long. These physiological data agreewith descriptive studies on voicing errors, particularly that of Millin(1971). These results reaffirm the notion that interarti,culator coordinationis poorly controlled.by hearingimpaired speakers.
D., Summary
Taken tqgether, these studies suggest that the physiological correlatesof segmental and suprasegmental errors in the speechof the hearing impairedare exceedingly complex. Our knowledge of the physiology of speech productionby the hearing impaired is still in the germinal stages. While the research
described above has included only relatively few hearingimpaired speakers,and caution must'be taken not to overgeneralize results, several interestingmechanismt.of production are beginning to emerge..
One is that certain physiological characteristics of the production ofhearingimpaired speech may span an entire utterance, and thus cannot be
accurately ascribed to either segmental or suprasegmental attributes' of
speech. .These have- been termed postbral characteristics by Stevens and hiscol'.eagues (Stevens, Nickerson, & Rollins, 1978, in press). Examples of
postural errors-would include inappropriate respiratory control, glottal
abduction/adduction gestures, vocal fold tension and mass, tongue position andurge of movements, velopharyngeal posture and movements. These postural
characteristics include tiot only the preparatory state for speaking, but alsothe configuration of thecspeech production mechanism ove time. We have noted
several examples in the preceding discussion that' suggest that hearingimpaired,speakers evidence such inappropriate postures.
The importance of postural characteristics has also been highlighted
recently in studies of speech production in normals. Parallels betwedn
coordinated nonspeech and speech activities have been drawn. For .example, a
nonspeech activity such as locomotion is said to be like speech in that bothmay be thought of as having a series of rapid; rhythmic, and highly coordinatemovements superimposed on a broad posture base. We might think then of speech
as a complex and rapidly changing articulatoryphonatory process overlayed ona slowly changing respiratory base. Thus, the hearing-impaired speaker whoadopts an inappropriate respiratory posture for whatever reason may precludethe coordination and control of movement elsewhere in th, speech production
mechanism. An inappropriate respiratory posture may be furner exacerbated bya inappropriate glottal gestures, or inappropriate tongue position, and so on.
A second problem etidenced by many hearingimpaired speakers is .great
difficulty in coordinating: respiration, phonation, and articulation. In
normal 'speech production, the .tight temporal coordination of these events
constitutes an important component in any theory of speech production. In the
speech voduction of -the hearing impaired, we have ample evidence for a
breakdown in interarticulator coordination, for example, iii the studies of
272
27J

aerodynamics, laryngeal-supralaryngeal coordination, and articulation cited
above. These data suggest not only difficulty accommodating the demands of
speech in space and time,.but also substantial variation in production from
utterance to 'utterance. Without such coordination, intelligible speech is
impossible and taken together, these factors suggest some reasons why listeners find the speech of the hearing impaired so difficult to understand.
Neither problems of postural characteristics nor those of interarticula-
tory coordination are mutually exclusive. Physiological research focusing on
several level's of speech production may prove fruitful in clarifying many of
the errors documented in the descriptive literature. A better understanding
of these problems at the phYsiological level will' hopefully lead to the
development of, amore effective assessment techniques and training programs for
hearing-impaired speakers.
VII. SPEECH INTELLIGIBILITY
. ,.
Itie shall use the term "speech intelligibility" to refer to how much of
what- a. child says can be understood by a listener. On the average, the
intelligibility of profoundly hearing-impaired children's speech is very'poor.
Only about one'in every five words they say can he understood by a listener
who is unfamiliar with the speech of this group (Brannon, 1966; John &
Howarth, 1965; Markides,' 1970; McGarr, 1978; Smith, 1975).
Before we proceed to a discussion of factors that have been fciund to
affect intelligiblity, some comments on analysis techniques are necessary.
First, intelligibility measures in most studies have been based only on a
listener's auditory judgments of a child's productions. While this approach,
may be the most appropriate for quantifying the intelligibility of speech, it
does not necessarily 'provide an accurate assessment of a child's ability to
communicate in a face-to-face situation.
A second point that should be made is that the majority of investigators
who have attempted to determine the effect of specific variables on intelligi-
bility have done so using a correlational analysis, a-statistical analysis of
the association between the factor of interest and the reduction in intelligi-
bility. Correlations should be interpreted carefully because a cause and
effect relationship cannot be inferred from the results. Several studies that
have been performed will'be presented in some detail in this section.
A. Hearing Level
A review of the literature indicates that an important factor .in
determining the intelligibility of a hearing-impaired child's speech is the
degree of the child's hearing loss (Boothroyd, 1969; Elliot, 1967; Markides,
1970; Montgomery, 1967; Smith, 1975). Boothroyd (1969) found a correlation
between percent intelligibility scores.and 'hearing level at all frequencies,
particularly at 1000 Hz and 2000 3z, for a population of hearing-impaired
children from the Clarke School ,for the Deaf. In fact, the data formed a
bimodal distribution: the children with good speech intelligibility (intelli-
gibility score of 70% or more) had. considerable hearing, while those children
with poor intelligibility (70%.or less) had little residual hearing. The
273
2 73

0
median hearing level of the group with good speech intelligibility was 90 dBand, as the herring loss exceeded 90 d3 at 1000 Hz, the median Speech scoresfell rapidly. In another study that analyzed the speech intelligibility ofprofoundly hearingimpaired children, Smith (1975) observed a systematicdecrease in intelligibility with poorer hearing level to a level of about 85dB HTL, after which the relationship was not clear. Monsen (1978) found thatall the children he stugied.with hearing losses of 95 dB HTL or less hadintelligible speech, but children with losses greater than 95 dB HTL did notalways have poor or unintelligible speech. These data indicate that eventhough a child has a profound hearing loss, he or she still has the potentialto develop functional speech skills.
Two studies of interest are those by Smith (1975) and Gold (1978), whichwere described in the preceding section. Recall that the same test materials
and procedures were used in the two studies to assess the speech of differentpopulations of hearingimpaired children. The average intelligibility of theprofoundly hearingimpaired children's speech in an Oral day school for the
deaf was repbrted by Smith to be about 19%. Gold (1978) reported an average
intelligibility score af 39% for the mainstreamed profoundly hearingimpairedchildren assessed in her study. Thus, children with similk hearing levels indifferent educational settings showed an average difference of 20% in theirintelligibility scores. Not unexpectedly, research has shown that the intelligibility of hardofhearing children!s speech is substantially higher thanthat of profoundly hearingimpaired children. Average intelligibility scores
of 70 -76'% have been reported for the hard of hearing (Gold, 1978; Markides,
1970).
Higher intelligibility scores than those mentioned above haye been
reported by Monsep (1978). His results revealed an average intelligibility
score of 91% for severely hearingimpaired children, and a score of 76% for0
the profoundly hearingimpaired children in his study. Monsen (1978) ha,
attributed the difference in intelligibility scores between his and otherstudies to differences in the speech material that the children were required
to produce. According to Monsen (1978), the sentences in his study wereshorter, contained a more familiar vocabulary, and were syntactically less
complex than those used by other investigators. In fact, McGarr (1980) has
shown that intelligibility scores for hearingimpaired speakers may varyconsiderably depending on speech material (sentences or words), amount ofcontext, phonetic composition, and, of course, experience of the listener.
The above studies indicate that although the degree of hearing loss is an
important variable, this measure alone cannot reliably predict the intelligi
bility of a child's speech. In fact, in a study by Smith (1975), hearinglevel was found to be only a fair predictor of the speech intelligibility of
profoundly hearingimpaired children. The hearing measure found to be mostclosely correlated with speech intelligibility was performance on an auditoryphoneme recognition test. This finding suggests,that it is not hearing level
per se that -is most important for the development of intelligible speech, but
rather the ability of the hearingimpaired child to make use of the acoustic
cues that are available to him or her.
274

B. Segmental Errors
It has generally been found that as the overall frequency of segmental or
phonemic errors increases in the speech of the hearing impaired, intelligibil-
ity decreases (Brannon, 1966; Gold, 1978; Hudgins & Numbers, 1942; Markides,
1970; Smith, 1975). However, the lumber of segmental errors alone cannot
account for reduced intelligibility. Smith (1975), for example, observed that
some of the subjects in her study who had approximately the same frequency of
segmental errors had speech intelligibility scores differing by as much as 30"
percent. Smith hypothesized that these differences appeared to be related, in
part, to certain suprasegmental errors that interacted in a complex manner
with the segmental errors to reduce intelligibility.
The relationship'between specific types of segmental errors and intelli-
gibility has been examined to some extent by Hudgins and Numbers (1942) and
later by,,Smith (1975). In their classic study, Hudgins and Numbers found a
nigh negative correlation between intelligibility and total number of vowel
errors (-.61) and total number of consonant errors (-.70). Similar "esults
were reported by Smith, except that she found a slightly higher correlation
between vowel errors and intelligibility than did Hudgins and Numbers.
Of the seven consonant error categories considered in the Hudgins and
Numbers (1942) study,. three categories (omission of initial consonants,
voiced-voiceless confusions, and errors involving compound consonants) had the"
most significant effect on intelligibility. The other four categories
considered (substitution errors, nasality errors, omission of final
consonants, and errors involving abutting consonants) had a lower correlation
with intelligibility and contributed to a much lesser extent to the reduced
intelligibility of hearing-impaired children's speech;
In a recent study, Monsen (1978) examined the relationship between
intelligibility and four acou§tically measured variables of consonant produc-
tion, three acoustic variables of vowel production, and two measures of
prosody. A multiple regression analysis showed that three variables had a
high multiple correlation (.85) with intelligibility and thus accounted for
73% of the variance: (1) the difference in voice-onset time between /t/ and
/d/; (2 the difference in second foment location between /i/ and /I /,Wand
(3) acoustic characteristics of the nasal and liquid consonants. The first
two variables accounted for almost 69% of the variance.
Other segmental errors that have been observed to have a significant
negative correlation with intelligibility are: omission of phonemes in the
word-initial and medial position; consonant substitutions involving a change
in the manner of articulation; substitutions of non-English phonemes such.as
the glottal stop, and unidentifiable or gross distortions of the intended
phoneme (Levitt et al., 1980).
C. Suprasegmental Errors
The suprasegmental errors examined most extensively in relation to
intelligibility have been those involving timing. One of tne earliest
attempts to determine the rel.Ationship between deviant timing patterns and
intelligibility is found in the study by Hudgins and Numbers (1942). Although
275
281k

they correlated rhythm errors with intelligibility, many X these errors
appear to be due to poor timing control. They found that sentences spoken
with correct rhythm were substantially more intelligible than those that werenot. The correlation between speech rhythm and intelligibility was .73,
which was similar to the correlation between total consonant errors and
intelligibility, and higher than the correlation found between vowel errorsand intelligibility.
*
The results of other correlational studies have typically shown a
moderate negative correlation between excessive prolongation of speech seg-ments and intelligibility (Monsen & Leiter, 1975; Parkhurst & Levitt, 1978).
In a recent study, Reilly (1979) found that relative duration
(stressed:unstressed syllable nuclei duration ratio) demonstrated a systematicrelationship with intelligibility. Reilly ('1979) suggested that the better
able the profoundly hearing-impaired speaker was to produce the segmental,lexical, and syntactic structure of the utterance, the more intelligible theutterance was likely to be. Data reported by Parkhurst and .Lerdtt (1978)
indicate that another type of timing error, the insertion of short pauses atsyntactically appropriate boundaries, had a positive effect on
intelligibility; the presence of these pauses actually helped to improveintelligibility.
Studies that have attempted to determine the cause and effect relation-
ship between speech errors and intelligibility have dealt primarily withtiming. These causal studies can be sub-divided into two major categories:studies in which heariiig-impaired children receive intensive training for thecorrection of timing errors, and studies in which timing errors are correctedin hearing-impaired children's recorded speech samples using modern signal-processing techniques.
The classic training study that attempted to determine the causal
relationship between timing errors and intelligibility was conducted by Johnand Howarth (1965). These investigators reported a significant improvement inthe intelligibility of profoundly hearing-impaired children's speech after thechildren had received intensive training focusing only on the correction oftiming errors. In contrast to this, Houde (Note 2) observed a decrement inintelligibility when timing errors of hearing-impaired speakers were correct-ed, and the results of a similar study by Boothroyd et al. (1974) were
equivocal.
A major problem with the training studies is that the training may result
in changes in the child's speech other than those of interest. Recent
investigations have attempted to eliminate this confounding variable by using
computer processing techniques. In these studies, speech is either synthe-
sized with timing distortions, or synthesized versions of the speech of the
hearing impaired are modified so that timing errors are corrected. Lang
(1975) used an analysis-synthesis approach to correct timing errors in thespeech samples produced by hearing-impaired speakers, and also to introduce
timing distortions in the samples of normal speakers. Minimal improvements in
intelligibility were observed for the speech of the hearing impaired, andminimal decrements in intelligibility were observed for the normal speakers.
Bernsteia (1977), however, found no reduction in the intelligibility of speech
samples)roduced by a normal speaker when synthesized with timing errors., On
276

the other hand, Huggins (1978) found that when normal speech was synthesized
with the durational relationship between stressed and unstressed syllables
reversed, there was a substantial reduction in intelligibility. Even greater
reductions in intelligibility occurred when the stress assignments for both
pitch andduration were incorrect.
In an attempt to resolve some of the conflicting information in this
area, Osberger and Levitt (1979) quantified the relative effect of timing
errors on intelligibility by means of computer simulation. Speech samples
produced by hearingimpaired children were modified to correct timing errors
only, leaving all other aspects of the speech unchanged. Three types of
correction were performed: relative timing, absolute syllable duration, and
pauses. Each error was corrected alone and together with one of the other
timing errors. An average improvement in .intelligibility was observed only
when relative timing errors alone-were corrected. The improvement, however,
was very small (4%). Since the timing modifications for, tW s condition
involved only the correction of the duration, ratio for stressedtounstressed
vowels, the overall durations of the vowels (and syllables) were still longer
than the corresponding durations in normal speech. These data indicate'hat
the prolongation of syllables and vowels, which is one of the most obvious
deviancies of the speech of the hearing impaired,, does noein itself have a
detrimental effect on intelligibility.
Attempts have also been made to determine the relationship between errors
involving fundamental frequency (Fo) control and intelligibility. Monsen
(1978) found thgt there was no clearcut relationship between mean Fo and mean
-amount of Fo change and intelligibility. In their study, McGarr and Osberger
(1978) found that, for the majority of the children studied, there- seemed to
be no simple relationship between pitch deviancy and intelligibility. Some
children whose pitch was judged appropriate for their age and. sex had
intelligible speech, while others did not. The exception to this pattern were
the children who were unable to sustain phonation and whose speech contained
numerous pitch breaks. Their speech was consistently judged to be unintelli
gible. anibh (1975) also found tha:-. errors involving poor phonatory control
(intermittent phonation, spasmodic variations of pitch and, loudness, and
excessive variability of intonation) had a high correlation with intelligibil
ity.
Data obtained by Parkhurst and Levitt (1978) also suggest that excessive
variations in pitch may reduce intelligibility. In this study, a multiple
linear regression analysis was performed: relating intelligibility to various
prosodic distortions judged to occur in the speech of hearingimpaired
children.. Breaks in pitch were one of the prosodic errors showing a
significant negative regression with intelligibility. The effect of the less
deviant patterns, such as elevated Fo, has not been clearly established,
although preliminary data suggest that these problems will not have a serious
effect on intelligibility.
In summary, we have relatively little information regarding the effect of
errors, or combination of errors, on the intelligibility of hearingimpaired
children's speecn, nor are we able to predict reliably if a child has the
potential to develop intelligible speech. Some background variables appear to
be important, such as the hearing status of the parent, while others, such as
277
283

age of identification of hearing impairment,. hearing aid use, start of special
education; IQ, and the hearing status of siblings show little cr no correla-tion with speech intelligibility (Smith, 1975).
VII. CONCLUDING COMMENTS
We shall now summarize some of the major points discussed in the chapter,and discuss the implications of the available data for the development ofassessment and training techniques. On the basis of the data presented, thefollowing statements can be made regarding the speech production skills ofhearing - impaired children:
1. Rate of vocal output cannot be used to describe accurately the
differences in the vocalization behavior between hearing and hearing - impairedinfants. Striking differences between the vocalizations of normal-hearing andhearing=dmpaired infants do emerge at an early age, but the differences areseen :n phonemic production rather than rate of vocal output. Specifically,
hearing-impaired infants tend to produce stereotypic vocalization patternswith a .educed phonemic repertoire relative to hearing infants.
2. The developmental stages of speech acquisition in the hearing im-paired appear to be similar to those of normal-hearing children in some
respects but not in others. Also, the speech production patterns of olderhearing-impaired children show many similarities to the patterns of theyounger hearing-impaired children.
3. Segmental errors, as determined by phonetic transcriptions of hearing-impaired children's speech can be classified by the following two categories:
a) Omission Errors: This type of error most often involves consonants,particularly those in the word-final position. Omission of vowels is
infrequent and usually does not occur unless the entire syllable hasbeen omitted.
b) Substitution Errors: Frequent errors in%
this category involve confu-sion between voicea-voieeless cognates, substitution of a consonantwith the same place of production but a different manner of produc-tion as the intended consonant. (and vice versa), and substitution ofnon - English sounds, particularly the glottal stop for the intendedphoneme. Vowel errors in this category typically involve tense-laxsubstitutions, substitutions toward a vowel that is more central thanthe target vowel, and substitution of the schwa vowel for the
intended vowel. Diphthong errors frequently involve substitutions of
one of the elements of a closely related vowel.
4. Errors-are less frequent for consonant phonemes produced at the front
of the mouth (the labial and'labio-dental'consonants) as compared to phonemeswith a place of articulation at the middle or back of the 'mouth.
Traditicnally, this pattern of production has been attributed to the greater.kte
visibility of phonemes produced in th# front of the mouth. Other articulatory
considerations, such as the relatively constrained movements of the mostvisible articulators, the lips, may also account for this production pattern.
278
2S4

5. Similar error patterns have been found to Occur in the speech of
different groups of hearingimpaired children. The largest difference between
children is in the frequency of errors; type of error may also vary, but to a
lesser extent than frequency of errors.
6. At the suprasegmental level of production, poor timing control
produces the following deviations:
a) Prolongation of speech segments
b) Distortion of temporal relationship between speech segments
c) Insertion of frequent and lengthy pauses often at syntactically
inappropriate boundaries
d) Distortion of phonetic context effects
e) Insertion of adventitious phonemes.
Poor control of fundamental frequency can result in problems such as:
a) Average pitch level too high
b) Intonation with insufficient variability
c) Intonation with excessive variability.
Abnormal voice characteristics such as harshness, breathiness,_hyper and
hyponasality may also be present.
7. Acoustic analyses have shown manifestations of the above perceptual
errors in the distortion of voiceonsettime, formant frequency transitions,
frequency location of the formants, and segmental durations.
8. Recent studies have begun to detail the physiological correlates of
segmental and suprasegmental errors. These studies show that the underlying
causes of error patterns are more complex. than has been ziluded to in the
descriptive literature. Some of the production mechanisms responsible for the
perceptual and acoustic distortions are poor respiratory control, evidenced by
initiation of phonation-at too low a level of vital capacity and production of
a reduced number of syllables per breath abnormal laryngeal function,
eviderced by laryngeal valving problems and failure to coordinate, laryngeal
and respiratory events, and a breakdown in interarticulator programming,
evidenced by poor control and coordination of articulatory gestures,- both at
the laryngeal' and supralaryngeal levels of. production. Improper postural
characteristics of the speech mechanism may affect many aspects of sp'eech
production and result in segmental and suprasegmental misperceptions.
9. Although there are many deviations in the speech of the hearing
impaired, these deviations do not generally occur in a random way. There is
evidence that many of the deviations are phonetically and phonologically
consistelt albeit the systems may not be the same as those used by/normal
hearing calkers. However, the use of a deviant phonological system will still
285
279

pose problems for the listener who must decode the intended message. Data are
also available suggesting that hearing-impaired talkers manipulate some seg-
mental, lexical, and syntactic aspects of speech in the same manner asnormals.
10. The intelligibility of the speech of children with profound hearinglosses in day schools for the hearing impaired has been reported to be about20%. This figure is based on the percentage of words correctly understoodthrough audition alone by persons who are unfamiliar with the speech of thehearing impaired. Under the same conditions, the intelligibility of the
speech of children with profound losses who are mainstreamed has been found tobe about 40%. The intelligibility of the speech of hard-of-hearing childrenis substantially higher than thatof severely and profoundly hearing-impairedchildren.
17. The intelligibility of hearing-impaired children's speech has beenfound to be influenced by the degree of linguistic context and the experience
of,the listener with the speech of the hearing-impaired. -
12. The relationship between specific error types ancL4intelligibility
has not been clearly established. Correlational studies show a high degree of
association between the frequency of segmental__. errors and reduction in
intelligibility. Of the various error types that have been studied, the
highest correlations havebeen reported for overall frequency- of phonemic
errors, errors of omission in the word-initial and .medial position, substitu-
tions-involving a change in the manner of articulation, substitution of non-
English phonemes, and unidentifiable or other gross distortions of, the
intended phonemes. . At the suprasegmental level, timing errors and errorsinvolving poor phonatory control have been found to have a negative effect on
Although our knowledge about the speech of the hearing impaired is far
from complete trainingstrategiescanbe-1gleaned from the aforementioned findings. First, hearing-impaired childrenshow distinct error patterni, and un)/ess appropriate assessment instrumentsare used; -some errors may go undetected. . Second, in addition to assessingspeech structures, clinicians and teachers must attempt evaluate the
adequacy of respiratory, laryngeal, and articuldtory maneuvers essential for
normal speech production. By this, we do not mean to imply that physiologicalmeasures should be performed routinely in the clinic. Rather, through
clinical observation and perceptual measures, inferencesican be made about theunderlying speech production mechanism. ,Third, a phonological analysis of anindividual child's sound system will enablethe clinician to determine if achild's speech deviates from normal-in a systematib way, or if the errors arerandom.
Following the evaluation, the clinician or teacher should raise pertinent
questions regarding each child's error patterns and productiop skills. Such
questions include the following:
280 2f;A
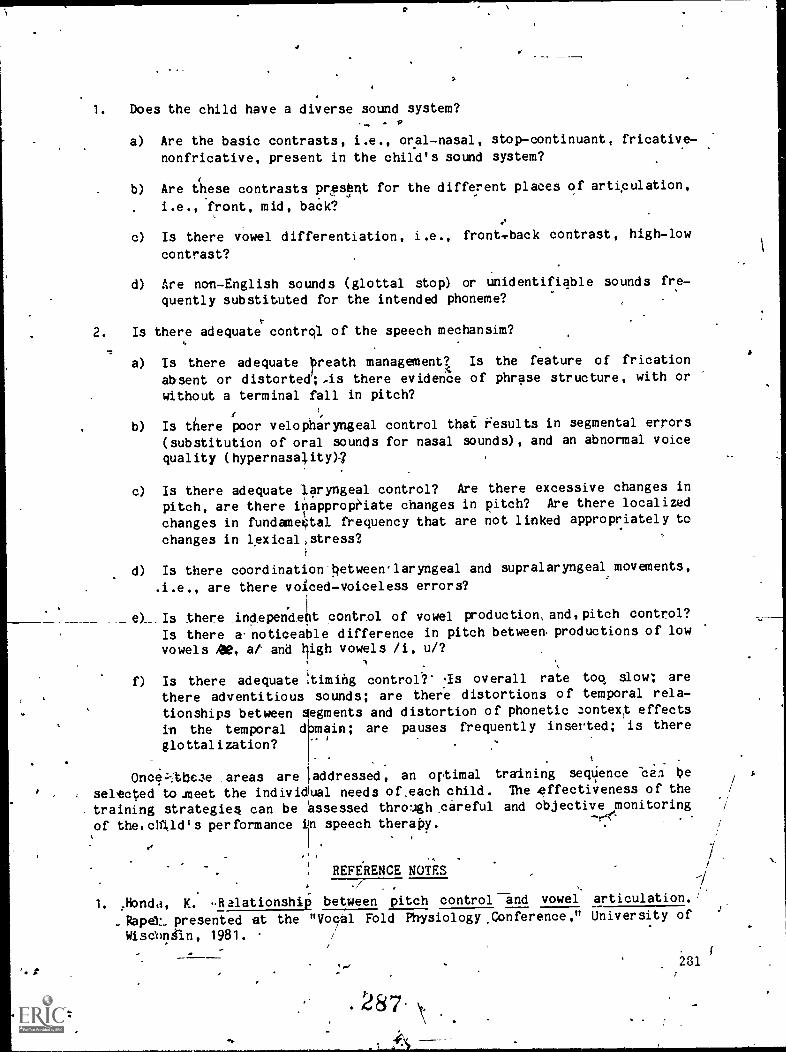
1. Does the child have a diverse sound system?
a) Are the basic contrasts, i.e., oral-nasal, stop-continuant,nonfricative, present in the child's sound system?
b) Are these contrasts prestnt for the different places of articulation,
i.e., front, mid, back?
c) Is there vowel differentiation, i.e., front,.back contrast, high-low
contrast? ti
d) Are non-English sounds (glottal stop) or unidentifiable sounds fre-quently substituted for the intended phoneme?
2. Is there adequate control of the speech mechansim?
a) Is there adequate preath management? Is the feature of fricationabsent or distorted; -is there evidence of phrase structure, with or
without a terminal fall in pitch?
b) Is there poor velopharyngeal control that 'results in segmental errors
(substitution of oral sounds for nasal wounds), and an abnormal voicequality (hypernasa)ity).7
c) Is there adequate laryngeal control? Are there excessive changes in
pitch, are there inappropriate changes in pitch? Are there localized
changes in fundame4a1 frequency that are not linked appropriately to
changes in 1exical,stress2
d) Is there coordination-between'laryngeal and supralaryngeal movements,
.i.e., are there voiced-voiceless errors?
e) Is there_independent control_ of vowel production, and, pitch control?
Is there a noticeable difference in pitch between, productions of low
vowels me, at and high vowels /i, u/?
f) Is there adequate !timing control?' s overall rate tog slow; arethere adventitious sounds; are there distortions of temporal rela-
tionships between segments and distortion of phonetic aontext effects
in the temporal d main; are pauses frequently inserted; is there- I
glottalization?1-
Once;:theze _areas are laddressed, an oi'timal training seqUence "ben be
selected to meet the individual needs of ,each child. The .effectiveness of the
training strategies can be assessed throLoghcareful and objective monitoring
of the.chIld's performance in speech therapy.
REFERENCE NOTES
1. ,_Fonda, K. -Relationship between pitch control and vowel articulation.
Rapet presented at the "Vocal Fold Physiology, Conference," University of
Wiseohiln, 1981.
.287.
I
2811

to
411.11!"-....W1/Mr*.
.,2% Houde, R. A. Instantaneous visual feedback in speech training for the
deaf. Paper presented pt the American Speech and Hearing AssociationConvention, 1973
REFERENCES
Angelocci, A., Kopp, G., & Holbrook, A. Theivowel_forbants_of_deaf and normal
hearing eleven to fourteen year old boys. Journal of Speech and Hearing
Disorders, 1964, 29, 156-170.Bernstein, J. Intelligibility and simulated deaf-like speech. Conference
Record, IEEE Int rnational Conference on Acoustics, Speech, and SignalProcessing, Hart rd, CT, 1977.
Boone,D. R. Modific tion of the voices of deaf children. The Volta Review,
1966, 68, 666-694.Boothroyd,,A, DistrOution of hearing levels in the student population of the
Clarke School f the Deaf. Northampton, Mass.: Clarke School for the
Deaf, 1969.Boothroyd, A., Nickerson, R., & Stevens, K. TemplNal patterns in the speech
of the deaf: A study in remedial training. Northampton, Mass.: Clarke
School for the Deaf, 1974. .
Boeden,,G. J, & Harris, K. S. Speech science primer: Physiology, 'acoustics
-and perception of speech. Baltimore: Williams & Wilkins, 1980./
-- Brannon, J. B. The speech production and spoken language of the deaf.Language and Speech, 1966, 9, 127-136.
Brehm, F. E. Speech correction. American Annals of the Deaf, 1922, 67, 361-.
370.Bush, M. Vowel articulation and laryngeal control in the speech of the deaf.
Unpublished doctoral dissertation, Massachusetts Institute of Technology,
1981.
Calvert, D. R. Some acoustic characteristics of the speeval of profoundly deaf
individuals. Unpublisheddoctoraldissertation, Stanford University,
1961.
_ Caer,J. An investigation of -the spontaneous speech sounds of five-year-old
deaf-born children. Journal of Speech and Hearing Disorders, 1953, 18,
22-29.
Davis, J. Personnel and services. In J. Davis (Ed.), Our forgotten children:
Hard-of-hearing _pupils in- the- schools. Minneapolis, Minn.: National
Support Systems, 1977, 27-42.Delattre, P. C., Libeeman, A. M., & Cooper, F. S. Acoustic loci and transi-
tional cues for consonants. Journal of the Acoustical Society of
America, 1955, 27, 769-773.Denes, P. Effect of duration on the perception of voicing. Journal of the
Acoustical Society of Aid-erica; 1955, 27, 761-764.
Elliot, L. L. Descriptive analysis of audiometric and psychometric scores of
students at a school for the deaf. Journal of Speech and HearingResearch, 1967, 10, 2r-40.
Fairbanks, G. Recent experimental investigations of vocal pitch in speech.Journal of the Acoustical Society of America, 1940, 11, 457-466.
Fairbanks, G:, Herbert,'E. L., & Hammond, J. M. An acoustical study of vocal
/pitch in seven and eight year old girls. Child Development, 1949, 20,
71-78.
282

4,
Fairbanks, G., Wiley, J. H., & Lassman, F. M. An acoustical study of vocal
pitch in seven and eight year old boys. Child Development, 1949, 20, 33-
69.Forner, L., & Hixon, T. Respira ry kinematics in profoundly hearing-impaired
speakers. Journal of Speech a Hearing Research, 1977, 20, 373-408.
Froeschels, E. Psychological elem nts in speech. Boston: Expression Co.,
1932.
Fry, D. B. Duration and intensity as physical correlates of linguistic
stress. Journal of the Acoustical Society of America, 1955, 27, 765-768.
Fry, D. B. Experiments in the perception of stress. Language and Speech,
1958, 1, 126-152.
Geffner, D. Feature characteristics of spontaneous speech production in young
deaf children. Journal of Communication Disorders, 1980, 13, 443-454.
Geffner, D., & Freeman, L. Speech assessment at the primer/ level:
Interpretation relative to speech training._ In J. Subtelny (Ed.), Speech
assessment and speech improvement for the hearing impaired. Washington,
D.C.: A. G. Bell Association, 1980, 1-17.
Gold, T. Speech and hearing skills: A comparison between hard-of-hearing and
deaf children. Unpublished doctoral dissertation, City University of New
York, 1978.
Green, D. S. Fundamental frequency of the speech of profoundly deaf
individuals. Unpublished doctoral dissertation, Purdue University, 1956.
Hasek, C., Singh, S., & Murry, T. Acoustic attributes of pre-adolescent
voices. Journal of the Acoustical Society of America, 1981, 68, 1262-
1265.
Haycock, G. S. The teaching of speech. Stoke-on-Trent, Eng.: Hill and
Ainsworth. Lta., 1933.Heider, F., header, G., & Sykes, J. A study of the spontaneous vocalizations
of fourteen deaf children. The Volta Review, 1941, 43, 10-14.
Heidinger, V. A. An exploratory study of procedures for improving temporal
features in the speech of deaf children. Unpublished Ed.D. Thesis,
Teachers College, Columbia University. 1972.
Hixon, T., Goldman. M., & Mead, J. Kinematics of the chest wall during speech
production: Volume displacements. of the rib cage, abdomen, and lung.
Journal of Speech and Hearing Research, 1973, 16, 78-115.
Hixon, T., Mead, J., & Goldman, M. Dynamics of the chest wall during speech
production: Function of the thorax, rib cage, diaphragm, and abdomen.
Journal of Speech and Hearin Research, 1976, 19, 297-356.
Hollien, H., & Paul, P. A second evaluation of the speaking fundamental
frequency and chronological age in males. Language and Speech, 1969, 12,
119-124.
Hood, R. B. Some physical concomitants of thvperceotion of speech rhythm of
the deaf. Unpublished doctoral dissertation, Stanfoki University, 1966.
House. A. S. On vowel duration in English. Journal of the Acoustical Society.
of America, 1961, 33, 1174-1178.House, A. S., & Fairbanks, G. The influence of consonant environment upon the
seestndary acoustical characteristics of vowels. Journal of the
Kcoustical Society of America, 1953, 25, 105-113.
Hudgins, C. V. A comparative study of the speech coordinations of deaf and
normal-hearing sutjects. 'Journal of Genetic Psychology, 193.1, 44, 3-46.
Hudgins, C. V. A study of respiration and speech. The Volta Review, 1936,
38, 341-343, 347.
233

c
Hudgins, C. V. Voice production and breath control in the speechksof the deaf.
American Annals of the Deaf, 1937, 82, 338-363.
Hudgins, C. V. Speech breathing and speech intelligibility. The Volta
Review, 1946, 48, 642-644.Hudgins, C. V., & Numbers, F. C. An investigation of the intelligibility of
the speech of the deaf. Genetic Psychology Monographs, 1942, 25, 289-
392.Huggins, A. W. F. Speech timing and intelligibility. In J. Requin (Ed.),
Attention and performance VII. Hillsdale. N.J.: Lawrence Eribaum Asso-
ciates, 1978, 279-298.Huggins, A. W. F. Better spectrograms from children's speech. Journal of
Speech and Hearing Research, 1980, 23, 1,9-27.Huntington, D., Harris, K. S., &.Sholes, G. An electromyographic study of
consonant articulation in hearing-impaired and normal speakers. Journal
of Speech and Hearin& Research, 1968, 11, 147-158.Hutchinson, J. M., & Smith, L. Aerodynamic functioning in consonant produc-
tion by hearing - impaired adults. Audiology and HearinE Fducation, 1976,
2, 16-19, 22 - ?5, 34.
Irvin, B., & Wilson, L. The voiced-unvoiced distinction in deaf speech.American Annals of the Deaf, 1973, 118, 43-45.
John, J. E. J., & Howarth, J. N. The effect of time distortions on the
intelligibility of deaf children's speech. Language and Speech, 1965, 8,
127-134.
Klatt, D. H. Vowel lengOsening is syntactically determined in a connected
discourse. Journal of Phonetics, 1975, 3, 129-140.
Lach, R., Ling,'D., Ling, A., & Ship, N. Early speech development in deaf
infants. American Annals of the Deaf, 1970, 115, 522-526.Lang, H. G. A computer-based analysis of the effects Of rhythm modification
on the intelligibility of the speech of hearing and deaf subjects.
Unpublished masters thesis, Rochester Institute of Technology, 1975.
Levitt, H., Smith, C. R., & Stromberg, H. Acoustic, articulatory, and
perceptual characteristics of the speech of deaf children. In G. Fant
(Ed.), Proceedings of the Speech Communication Seminar Stockholm. New
York: Wiley, 1974, 129-139.Levitt, H., Stromberg, H., Smith, C., & Gold, T. The structure of segmental
errors in the speech of deaf children. Journal of Communication
Disorders, 1980, 13, 419-442.Liberman, A. M., Delattre, P. C., Gerstman, L. C., & Cooper, F. S. Tempo of
frequency change as a cue for distinguishing classes of speech sounds.Journal of Experimental Psychology, 1956, 52, 127-137.
Lisker, L., & Abramson, A. A cross-language study of voicing in initial
stops: Acousticarmeasurements. Word, 1964, 20, 384-422.
Lafqvist, A., & Yoshioka, H. Interarticulator programming in obstruent
production. Phonetica, 1981, 38, 21-34.
Mahshie, J. Laryngeal behavior in hearing-impaired speakers. Unpublished
doctoral dissertation, Syracuse University, 1980.
Mangan, K. Speech improvement through articulation testing. American Annals
of the Deaf, 1961, 106, 391-396.Markides, A. The speedh of deaf and partially hearing children with special
reference to factors affecting intelligibility. British Journal of
Disorders of Communication, 1970, 5, 126-140.
234
Martony, 3'. StUdies on speech of the deaf. Quarterly Progress and Status
Report (Speech Transmission Laboratory, Royal Institute of Technology,
Stockholm, Sweden), 1966, 16-24.
Martony, J. On the correction of the voice pitch level for severely hard ofhearing subjects. American Annals of the Deaf, 1968, 113, 1957202...
Mavflya, M. P. Spontaneous vocalization and babbling in hearing impaired
infants. In G. Fant (Ed.), International symposium on speech
communication abilities and profound deafness. Washington, D.C.:
A. C. Bell Association, 1968.McGarr, N. S. The differences between experienced and inexperienced listeners
in understanding the speech of the deaf. Unpublished doctoral disserta-
tion, The City University of New York, 1978.McGarr, N. S. Evaluation of speech in intermediate school-aged deaf children.
In J. Subtelny (Ed.), Special assessment and speech improvement for the
hearin im aired. Washington, D.C.: Alexander Graham Bell Association,
19 0, 5- .
McGarr, N. S., & Harris, K. S. Articulatory control in a deaf speaker.
Haskins Laboratories Status Report on Speech Research, 1980, SR-63/64,
309-332.
McGarr, N. S.,, & L8fqvist, A. Obstruent production in hearing-impaired
speakers: Interarticulator timing and acoustics. Journal of the
Acoustical Society of America, in press.
McGarr, N. S., & Osberger, M. J. Pitch deviancy and the intelligibility of
deaf children's speech. - Journal of Communication Disorders, 1978, 11,
237-248.Metz, D., Whitehead, R., & Mahshie, J. Physiological correlates of the speech
of the deaf. In D. Sims (Ed.), Deafness and communication: Assassment
and training. Baltimore, Md.: Williams and Wilkins, 1982.
Millin, J. Therapy for reduction of continuous phonation in the hard-of-
hearing population. Journal of Speech and Hearing Disorders, 1971, 36,
496-498.Monsen, R. B. Durational aspects of vowel production in the speech of deaf
thildren. Journal of Speech and Hearing Research, 1974, 17, 386-398.
Monsen, R. B. Normal and reduced-phonological space: The production of
English vowels by deaf adolescents. Journal of Phonetics, 1976, 4, 189-
198. (a)
Monsen, R. B.- The production of English stop consonants in the speech of deaf
children. Journal of Phonetics, 1976, 4, 29-4. (b)
Monsen, R. B. Second formant transitions of selected consonant -vowel combina-
tions in the speech of deaf and normal-hearing children. Journal of
Speech and Hearing Research, 1976, 19, 279-289. (c)
Monsen, R. B. A taxonomic study of diphthong production in the speech of deaf
children. In S. K. Hirsh, D. H. Eldredge, I S. Hirsh, & S. R. Silverman
(Eds.), Hearing and Davis: Essays honoring Hallowell Davis. St. Louis,
Mo.: Washington University Press, 1976, 281-290. (d)
Monsen, R. B. Toward measuring how well hearing-impaired children speak.
Journal'of Speech and Hearing Research, 1978,, 21, 197-219.
Monseu,. R. B. Acoustic qualities of phonation in young hearing-impaired
children. Journal of Speech and Hearing Research, 1979, 22, 270-288.
Monsen, R. B., Engebretson, A. M., & Vemula, N. Some effects of deafness of
the generation of voice. Journal of the Acoustical Society of America,
1978, 66, 1680-1690.
285
2i

0
Monsen, R. B., & Leiter, E. Comparison of intelligibility with duration and
pitch control in the speech of deaf children. Journal of the Acoustical
Society of America, 1975, 57, 569. (Abstract)
Montgomery, G. W. G. Analysis of pure tone audiometric responses in relationto speech development in the profoundly deaf. Journal of the Acoustical
Society of America, 1967, 41, 53-59.Nober, H. Articulation of the deaf. Exceptional Children, 1967, 33, 611-621.
011er, D. K., Jensen, H., & Lafayette, R. The relatedness of phonological
processes of a hearing-impaired child. Journal of Communication
Disorders, 1978, 11, 96-106.
011er, D. K., & Kelly, C. A. Phonological substitutions, of a hard-of-hearing
child. Journal of-Speech and Hearing Disorders, 1974, 39, 65-74.Osberger, M. J. The effect of timing errors on the intelligibility of deaf
children's speech. Unpublished doctoral dissertation, The City Universi-
ty of New York, 1978.Osberger, M. J. Fundamental frequency chiracteristics of the speech of the
hearing impaired. Journal of the Acoustical Society of America, 1981,
69, S69. (Abstract)Osberger, M. J., & Levitt, H. The effect of timing errors on the intelligi-
bility of deaf children's speech. Journal of the Acoustical Society of
. America, 1979, 66, 1316-1324.Osberger, M. J., Levitt, H., & Slosberg, P. Acoustic characteristics of
correctly produced vowels. Journal of the Acoustical Society of America,
1979, 66, S13. (Abstract)Parkhurst, B., & Levitt, H. The effect of selected prosodic errors on the
intelligibility of deaf speech. Journal of Communication Disorders,
1978, 11, 249-256.Parmenter, C. .E., & Trevino, S. N. Relative durations of stressed to un-
stressed vowels. American Speech, 1936, 10, 129-136.
Peterson, G. E., & Barney, H. L. Control methods used in a study of vowels.'
Journal of the Acoustical Society of America, 1952, 24, 175-184.
`Peterson, G. E., & Lehiste, I. Duration of syllable nuclei in English.
Journal of the Acoustical Society of America, 1960, 32, 693-703.
Pibkett, J. M. The sounds of speech communication. -Baltimore, Md.:
University Park Press, 1980.
Raphael, L. J. Preceding vowel duration as a cue to the perception of thevoicing characteristics of word-final consonants in American English.
Journal of the Acoustical Society of America, 1972, 51, 1296-1303.
Rawlings, C. A comparative study of the movements of'the breathing muscles in
speech and quiet breathing of deaf and normal subjects. American Annals
of the Deaf, 1935, 80, 147-156.
Reilly, A. P. Syllabic nucleus duration in the speech of hearing and deafchildren. Unpublished doctoral dissertation, The 'iTy University of New
York, 1979.
Rothman, H., A spectrographic investigation of consonant-vowel transitions in
the speech of deaf adults. Journal of Phonetics, 1976, 4, 129-136.
Rothman, H. An electromyographic investigation of articulation and phonation
patterns in the speech of deaf adults. Journal of Phonetics, 1977, 5,
369-376.Russell, G. Normal speech pitch patterns for the deaf. A new approach.
Oralism and Auralism, 1929, 8, 1 -17.
Scuri, D. Restirazione e fonazione nei sordomute. Rassegna di Educazione e
fonetica biologica, 1935, 14, 82-113.
286
292
Scripture, E. W. The voices of the deaf. The Volta Review, 1913, 15, 77-80.
Slis, I. H., & Cohen, A. On the complex regulating the voiced-voiceless
distinction I, II. Language and Speech, 1969, 12, 80-102, 137-155.
Smith, C. R. Residual hearing and speech production in deaf children.
Journal of Speech and Hearing Research, 1975, 18, 795-811,
Stark, R. E. Vocalizations of the pre-school deaf child. Progress Re ort.
Baltimore, Md.: The Johns Hopkins School of Medicine, 1967.
Stark, R. E. Phonatory development in young normally-hearing and hearing-
impaired children. In I.'Hochberg, H. Levitt, & M. J. Osberger (Eds.),
Speech of the hearing impaired: Research, training, and personnel
preparation. Baltimore, Md.: University Park Fress, in press.
Steil, D. A study of articulatory characteristics of deaf talkers.
Unpublished doctoral dissertation, University of Iowa; 1980.
Stevens, K., Nickerson, R., 'Boothroyd, A., '1 Rollins, A. Assessment of
nasalization in the speech of deaf children. Journal of,. Speech and
Hearing Research, 1976, 19, 393-416.Stevens, K. N., Nickerson,,R. S., & Rollins, A. M. On describing the supra-
segmental properties of the speech of deaf children. In D. McPherson &
M. Davids (Eds.), Advances' in prosthetic devices for the deaf: A
technical workshop. hochester, N.Y.: National Technical Institute for
the Deaf, 1978. 134-155.Stevens, K. N., Nickerson, R. S.r-& Rollins, A. Suprasegmental and posture
aspects of speech production and their effect on articulatory skills and
intelligibility. In I. Hochberg, H. Levitt, & M. Osberger (Eds.),
Speech of the hearing impairod: Research, training, and personnel
preparation. Baltimore, Md.: University Park Press, in press.
Stoel-Gammon, C. The acquisition of segmental phonology by normal-hearing and
hearing-impaired children. In I. Hochberg, H. Levitt, & M. J. Osberger
(Eds.), Speech of the hearing impaired: Research, training, and
personnel preparation. Baltimore, Md.: University Parx Press, in press.
Story, A. 4. Talks to'young teachers of speech: The development of voice for
speaking. 'he Volta Review, 1917, 19, 68-70.
Subtelny, J. D. 'Speech assessment of the deaf adult. Journal of the Academy
of Rehabilitative Audiology, 1975, 8, 110-116.
Sykes, J. L. A study of the spontaneous vacalizations of young deaf children.
Psychological Monograph, 1940, 32, 104-123.Tuller, B., Harris, K. S., & Kelso, J. A. S. Articulatory motor events as 4
function of speaking rate and stress. Haskins Laboratories Status Report
on Speech Research, 1981, SR-65, 33-62.
Voelker, C. H. k preliminary strobophotoscopio study of the speech of the
deaf. American Annals of the Deaf, 1935, 80, 243-259.
Vo lker, C. H. An experimental study of the comparative rate of utterance of
deaf and normal-hearing speakers. American Annals of the Deaf, 1938, 83,
274-284.West, J., & Weber, J. A phonological analysis of the spontaneous language of
a four year old, hard of hearing child. Journal of Speech and Hearin&
Disorders, 1973, 38, 25-35.
Whitehead, R. Some respiratory and aerodynamic patterns in the speech of the
hearing impaired. In I. Hochberg, H. Levitt, & M. J. Osberger (Eds.),
Speech of the hearing impaired: Research, training, and personnel
preparation. Baltimore, Md.: University Park Press. in press.
Whitehead, R., & Barefoot, S. Some aerodynamic characteristics of plosive
consonants produced by hearing-impaired speakers. American Annals of the
Deaf, 1980, 125, 366-373.
29,3287

Zimmerman, G., & Rettaliata, P. Articulatory patterns of `an adventitiously
deaf speaker: Implications for the role of auditory infortation in
speech production. Journal of Speech and Hearin Research, 1981, 24,
169-178.
,

289
295
II. PUBLI, .TIONS
III. APPENDIX
o'

SR -69 (1982)
PUBLICATIONS
Baer, T. Investigation of the phonatory mechanism. In C. L. LUdlow &
M. 0. Hart (Eds.), ASHA Reports: Proceedings of the Conference on theAssessment of Vocal Pathology, 1981, 11, 38-46.
Bell-Berti, F., & Harris, K. S. Temporal patternd of coarticulation: Lip
rounding. Journal of the Acoustical Society of America, 1982, 71, 449-454.
Best, C. T. Developmental neuropsychology: Hemispheric specialization and
integration (Conference Abstracts). International Journal of
Neuroscience, in press.
Best, C. T., Hoffman, H., & Glanville, B. B. Development of infant ear
. asymmetries for speech and music. Perception & Psychophysicd, 1982, 31,
75-85.Brady, S., Shankweiler, D., & Mann, V. Speech perception and memory Coding 111
relation to reading ability. Journal of Experimental Child psychology,in press. -
c Crowder, R. G. The role of auditory memory in speech perception and discrimi-
nation. In T. Meyers, J. Laver, & J. Anderson (Eds.), The cognitiverepresentation of speech. Amsterdam: North-Holland Publishing Co.,
1981.
Crowder, R. G. Decay of information in, auditory memory. Journal of
Experimental Psychology: Human Learning and Memory, 1982, 8, 153-162.
Crowder, R. G. General forgetting theory and the locus of amnesia. In
L. Cermak (Ed.), Human memory and amnesia. Hillsdale, N.J.: Lawrence
Erlbaum:Associates, 1982.Fowler, C. Some aspects of language perception by eye. In O. Tzeng
H. Singer (Eds.), 4erception of print.- Hillsdale, Lawrence Erl-
baum Associates, 1981, 171-196.Fowler, C., Wolford, G., Slade, R., & Tassinary, L. Lexical access with and
without awareness. Journal of Experimental Psychology: General, 1981,
110, 341-362.Harris, K. S. Electromyography as a technique for laryngeal investigation.
In C. L. Ludlow & M. O. Hart (Eds.), ASHA Reports: Proceedings of the
Conference on the Assessment of Vocal Pathology, 1981, 11, 70_84.
Healy, A. F. Cognitive processes in reading text. Cognition, 1981, 10, 119-
126.
Healy, A. F. The effects of visual similarity on proofreading for misdpel-
lings. Memory_ & Cognition, 1981, 9, 453-460.
ilealy, A. F., & Repp, B. H. Context independence and phonetic mediation in
categorical perception. Journal of Experimental Psychology: Human
Perception and Performance, 1982, 8, 68-80.
Katz, L., & Feldman, L. B. The relationship between pronunciation and
recognition of printed words in shallow and deep orthographies. Journal
of Experimental Psychology:, Learning, Memory, and Cognition, in press.
Katz, R. B., Shankweiler, D., & Liberman, I. Y. Memory for item order andphonetic recoding in the beginning reader. Journal of Experimental Child
Psychology, 1981, 32, 474-484.
291
296

Kay, B. A., Knstic, A., & Katz, L. Decomposition and grammatical priming in
. lexical decision. Paper presented at the 53rd 'annual meeting of theEastern Psychological Association, Baltimore, Md., April 1981.
Kelso, J. A. S. Coitrasting perspectives dn'order and regulation in movement.In J. Long & A. Baddeley (Eds.), Attention and performance IX). .
Hillsdale, N.J..: Erlbaum, 1981.Kelso, J. A. S., & Clark, J. E. (Eds.) the development of movement control and
coordination. 'Chichester: John Wiley,- 1982.
Kelso, J. A. S., Holt, K. G., Rubin, P., & Kugler, P. N. Patterns of human
interlimb coordination emerge from the properties of nonlinear limit
cycle oscinatory processes: Theory. and -data. Journal of Motor
Behavior, 1981'k
Kelso, J. A. S., & Saltzman, E. L. Motor control: Which themes do we
orchestrate? The Behavioral and Brain Sciences, in.press.
Kugler, Pr N., Kelso, J. A. S., & Turvey, M. T. On the'coordination andcontrol of naturally developing systems...In J. A. S. Kelso & J. E. Clark'
q (Eds.), The development of movement control and coordination.
Chichester: John. Wiley, 1982.
Lame, G. D. Is there phonology after universal phonetic interpretation?
Texas Linguistic Forum, 1981, 17, 45-62.'Liberman", A. M. On finding that speech is special. American Psychologist,
1982, 37, 148-167.L8fqvist, A., Baer, T., & Yoshioka, H. Scaling of glottal opening.
Phonetica, 1981, 38, 265-276.
MacKain, K. S., Best, C. T., & Strange, W. Categorical perception of English
In and /1/ by Jananese bilinguals. Applied Psycholinguistics, 1981, 2,
369-390:kRepp, B. H. Phonetic trading relations and context effects: New evidence for
a phonetic mode of perception. Psychological Bulletin, in press.
Repp, B. H.', & Mann, V. A. Fricative-stop coarticulation: Acoustic and
perceptual evidence. Journal of the Acoustical Society of America, inpresg,
Saltzman, E. L., & Kelso, J. A. S. Toward a dynamical account of motor memory
and control. In R. Magill (Ed.), Memory and control in motor behavior.Amsterdam: North Holland, inpress.
Shankweiler, D., Liberman, I. Y., & Mark, L. S. Phonetic coding in dyslexics
and normal readers, by Hall, Ewing, Tinzmann, and Wilson: A reply.
Bulletin of the Psychonomic Society, 1982, 19, 78-79.
292
29

. SR-69 (1982)
(January- March),II
APPENDIX
DTIC (Defense TechnicalInformation Center)
Status Report.
Informatibon Center)
numbers:
January- June 197dJuly.- September 1970October - December 1970January -.June 1971July - September 1971October - December 1971January - June 1972July- December 1972January - March 1973April - June 1973
and ERIC (Educational 8esource4
DTIC ERIC
SR-21/22
SR-23
SR-240SR-25/26SR-27
SR-28SR-29/30SR-31/32SR-33SR-34
AD 719382AD 723586AD 727616AD 730013AD 749339AD 742140
10950001AD 757954AD 762373AD 766178
ED 044-679
ED 052-654ED 052-663ED 056-560ED 071-533ED 061-837ED 071-484ED 077-285ED 081-263ED 081-295
'SR-35/36 July - December 1973 AD 774799 ED 094-444
SR -37 /38 January - June 1974 AD 783548 ED 094-445
- SR-39/40 July --December 1974 AD A007342 ED 102-633
SR-41 January - March 1975 AD A013325 ED 109-722
SR.-42/43 ° April - September 1975 AD A018369 ED 117-770
SR-44 October - December 1975 AD A023059 ED 119-273
SR-45/46 January - June 1976 AD A026196 ED 123-678
SR-47 July - September 1976 AD A031789 ED 128-870
SR-48 October - December 1976 AD A036735 ED 135-028
SR-49 January - March 1977 AD A041460 ED 141-864
SR-50 April - June 1977 AD .A044820 ED 144-138
SR-51/52 July - December 1977 AD A049215 ED 147-892
SR-53 January - March 1978 AD A055853 ED 155-760
SR-54 April - June 1978 AD A067070 ED 161-096
SR-55/56 July - December 1978 AR A065575 ED 166-757
SR57 - January March 1979 AD A083179 ED 170-823
SR-58 April - June 1979 AD A077663 ED 178-967
SR-59/60 July - December 1979 AD A082034 ED 181-525
SR-61 January - March 1980 AD A085320 ED 185-636
,SR-62 April - June 1980 AD A095062 ED 196-099
SR-63/64 July - December'1980 AD A095860 ED 197-416
SR-65 January - March 1981 AD A099958 ED 201-022
SR-66 April - June 1981 AD A105090 ED 206-038
SR-6(/68 July - December 1981
SR-69 January - March 1982 40
Information on ordering any of these issues may be found on the following page.
**DTIC and/or ERIC order numbers not yet assigned.
298
293
v

a .
AD numbers May be ordered from;
U.S. Department orCommerceNational Technical Information Service5285 Port Royal RoadSpringfield, Virginia 22151'
t
Haskins Laboratories Status Repott on Speech
and. Language Behavior AbstraOts P.O.92122.
A'
294-
41-
1.
293
ED numbers may be ordered from:
ERIOPDocuMent Reproduction Service
Computer Microfilm InternationalCorp. (CMIC)
P.O. Box 190Arlington, Virginia 22210
Research is abstracted in Language
Box 22206, San Dieko, California
11.
2
S'

"TN
1c
4.%
UNCLASSIFIED,,,ros l IA.. ..: 0
c DOCUMENT CONTROL DATA . R & D .
,,,, :.,, ,, afrnn of ,fie IS I I rtai I tot) ondettn,...nnnt.*n n . ,,.? $ entered 1% l%'n r he 0 le Ia.! 1 r rn / /.../fre/1c.).. 2, NC. C' . ( orporate 4.ithot
Haskins Laboratories.
270 Crown Street, -,New Haven, 'CT 06)10
zi, qf ropy si_cv ` , ,Sit J^ ',,),
Unclassifiez., Gout
N/A
,l REPORT ,IT..E. - /Haskins Laboratories Status Report on Speech Research, ,SR-69, January-harch,
1962.
%.........-1.
OECIIIPTtvE NOTES (i)pe of repott,an....ancfu<4 dates)Interim Scientific Report .A.DT.40.1tS) /Fief name. middle mstal. last name)
4.
Staff of Haskins laboratories, Alvin M. Liberman, P. .
.
.
REPORT Oa tE . .
March, 1982
TO..at. N Or PGCS306
rh No or (I 1 r S
583 -
--.85. coNTIIC TOR C.1.1N T NO
'' HD-01994 NS13870
HD-16591 NS13617
NO1-HD-1-2420 NS18010
RR-05596PRF-800614/;
BNS-8111470
3a, opsGINa TOWS REPORT Nu.EIEFICS)
SR-69 (1982)
GIL, oT..ER REPOF I NOIS1 f Any other numbers that may h sIanedthis report)
Node
10 OtSTIII0uTION STATEMENT
Distribution of this document is unlimited*
,1 ,SUPPLEMENTPer NOTES. .
N/A
I., sisONSOMiNG.MiLl I a's/ V CTivi" r.
See No. 8
I f tISTHCT
This report (1 January-31'March) is one of-a regular series on the status and
progress of studies on the nature of speech, instrumentation for its investi-.
gat/ion-, and practical applicatidns. Manuscripts cover the following topics:
--Speech perception and memory coding in relation to reading ability
--The use .of orthographic structure by deaf adults: Recognition of finger -
spelled .letters--Exploring tne information support for speech
--The stream of speech .
.
--Using the acoustic signal to make inferences about place and duration of
tongue-palate contact--P tterns* or human interlimb coordination emerge from the properties of non-
9 li ear limit Cycle oscillatory processes: Theory and data
--Motor control: Which themes do we orchestrate?
--Exploring the nature of motor con.rol in Down's syndrome
--Periodicity and auditory memory: A pilot study.
.
--Reading skill and language skill . .
--On the role of sign order and morphological structure in memory for American
Sign Language sentences ,
--Perception df nasal consonants with soecial reference to Catalan
--Speech production characteristics of theshearing impaired .
.,
F ar,.....1473 (PAGE I) UNCLASSIFIED
SIN °I°I;P°7-68/1*This document contains no informa-Security GIAFsslication
tion not freely available to the general public.
It is distributed primarily for library use.
A-31408

a
UNCLASSIFIED
Security ClastftrattonI KEY WORDS
LINK V LINK 13 LINK C
ROLE WT ROLE WY ROLE WY
N.
Speech Perception: 1
memory codingaudio memory, periodicityplace of articulation, contact durarionnasal consonants, Catalantemporal coherence, sinewave synthesis
Speech Articulation:
point vowels, proprioception, jaw
Reading:
. memory codingorthography, use by deaf, fingerspellingsymbolic order, morphology, American Sign
Languageshort-term memory, comprehension
Motor Coritrof: k
f
:
DOwn's syndromes_..interlimb spordinatiori, limit cycle
,oscillation
- many-variable problem
J,..
b.
'
/
. .
(.
.
.
.
,
. .
-,
.
. ,
. . ,
..
/.,
.
. .
.
'
)
.
.
.
. -
.
.
.
.
'-'...
.
.
t.
DD I ov.,147 (BACK)
5/N 4101 0 7.6921'
344 .
, UNCLASSIFIED4ecurtty Classtficatton , -31409
`,