document resume author adelman, clifford; daniel, bruce; berkovits
TRANSCRIPT

DOCUMENT RESUME
ED 480 959 HE 036 178
AUTHOR Adelman, Clifford; Daniel, Bruce; Berkovits, Ilona TITLE
INSTITUTION
REPORT NO PUB DATE NOTE AVAILABLE FROM
PUB TYPE EDRS PRICE DESCRIPTORS
IDENTIFIERS
Postsecondary Attainment, Attendance, Curriculum, and Performance: Selected Results from the NELS:88/2000 Postsecondary Education Transcript Study (PETS), 2000. E.D. Tabs. National Center for Education Statistics (ED), Washington, DC . NCES-2003-394 2003-09-00 80p.; Project Officer, Jeffrey Owings. ED Pubs, P . O . Box 1398, Jessup, MD 20794-1398. Tel: 877-433- 7827 (Toll Free); Fax: 301-470-1244; e-mail: [email protected]. For full text: http://nces.ed.gov/pubs2003/2003394.pdf. Numerical/Quantitative Data (110) -- Reports - Research (143) EDRS Price MFOl/PC04 Plus Postage. Academic Degrees; *College Graduates; *Educational Attainment; *High School Students; High Schools; *Higher Education; Longitudinal Studies; National Surveys; *Young Adults *National Education Longitudinal Study 1988
ABSTRACT This report presents selected results from the National
Education Longitudinal Study of 1988 (NELS:88/2000). Most of the participants in this study were eighth graders in 1988, graduates from high school in 1992, and at the time of the postsecondary transcript data collection in the year 2000 were around the age of 26 or 27. Of all likely postsecondary participants, 45% earned a bachelor's degree of higher by age 26 or 27. Of those who earned more than 10 college credits, 51% earned a bachelor's degree or higher by age 26 or 27. Sixty-seven percent of those who earned more than 10 college credits and attended a four-year college at any time received a bachelor's degree or higher by age 26 or 37. Of all undergraduates who earned more than 10 credits, 20% attended institutions in more than one state as undergraduates. More than half of Hispanic/Latino students began their postsecondary careers in commun,ity colleges, in contrast to 37% of White students and 41% of Black students. Most undergraduates attended school in summer terms. The higher the mathematics attainment in high school, the more likely the student was to complete a bachelor's degree. Data also show that students who attended more selective colleges had higher grade point averages. Other data are provided about student characteristics. Two appendixes contain summary tables and technical notes. (Contains 29 tables and 7 references.) (SLD)
Reproductions supplied by EDRS are the best that can be made from the original document.


National Center for Education Statistics
U.S. Department of Education Institute of Education Sciences NCES 2003-394
Postsecondary Attain men t, Aitenda nce, Curriculum, and Performance Selected Results From the NELS:88/2000 Postsecondary Education Transcript Study (PETS), 2000
E.D.Tabs
September 2003
Clifford Adelman Institute of Education Sciences
Bruce Daniel Pin kerton
Ilona Berkovits National Center for Education Statistics
Jeffrey Owings Project Officer National Center for Education Statistics
3

U.S. Department of Education Rod Paige Secretary
Institute of Education Sciences Grover J.Whitehurst Director
National Center for Education Statistics Val Plisko Associate Commissioner
The National Center for Education Statistics (NCES) is the primary federal entity for collecting, analyzing, and reporting data related to education in the United States and other nations. It fulfills a congressional mandate to collect, collate, analyze, and report full and complete statistics on the condition of education in the United States: conduct and publish reports and specialized analyses of the meaning and significance of such statistics: assist state and local education agencies in improving their statistical systems: and review and report on education activities in foreign countries.
NCES activities are designed to address high priority education data needs: provide consistent, reliable, complete, and accurate indicators of education status and trends: and report timely, useful, and high quality data to the US. Department of Education, the Congress, the states, other education policymakers, practitioners, data users, and the general'public.
We strive to make our products available in a variety of formats and in language that is appropriate to a variety of audiences.You, as our customer, are the best judge of our success in communicating information effectively. If you have any comments or suggestions about this or any other NCES product or report, we would like to hear from you. Please direct your comments to:
National Center for Education Statistics Institute of Education Sciences U.S. Department of Education 1990 K Street NW Washington, DC 20006-5651
September 2003
The NCES World Wide Web Home Page address is: hftp://nces.ed.gov The NCES World Wide Web Electronic Catalog is: hftp://nces,ed,gov/pubsearch
Suggested Citation
US. Department of Education, National Center for Edudation Statistics. Postsecondary Aftainment, Aftendance, Curriculum, and Performance: Selected Results From the NELS:88/2000 Postsecondary Education Transcript Study (PRS), 2000, NCES 2003-394, by Clifford Adelman, Bruce Daniel, and Ilona Berkovits. Project Officer: Jeffrey Owings. Washington, DC: 2003.
For ordering information on this report, write:
US. Department of Education ED Pubs PO. Box 1398 Jessup, MD 20794-1 398
Call toll free 1 -877-4ED-Pubs; or order online at hftp://www.edpubs.org
Content Contact: Clifford Adelman
Clifford. [email protected] (202) 21 9-2251
NCES Contact: Jeffrey Owings
Jeffrey. [email protected] (202) 502-7423
4 BEST COPY AVABMBLE
Acknowledgments
Special thanks to the American Association of Collegiate Registrars and Admissions Officers (AACRAO) for hosting the year-long process of data entry for the NELS:88/2000 Postsecondary Transcript Files, and especially to Janie Barnett, Associate Executive Director of AACRAO, for assisting in the hunt for missing transcripts and resolving difficult questions with dozens of registrars.
Special thanks, too, to Tracy Hunt-White of the National Center for Education Statistics (NCES), who, while employed at the Education Statistics Services Institute (ESSI), assisted in line-by-line reading of student records, online catalog searches, and serving as the second judge in the creation of hand-and-eye variables. Also, special thanks to Sally Dillow, Robin Gurley, David Miller, Mike Planty, and Jennifer Thompson of ESSI for assistance with technical reviewing, editing, and production of the report, and to Kristy David and k i n a Ulman of ESSI for assisting in formatting the document. Thanks to all reviewers of the report, including: Albert0 F. Cabrera of the University of Wisconsin-Madison; Dennis Carroll and John Wirt of NCES; Daniel Goldenberg of the Planning and Evaluation Service, U.S. Department of Education; Steven Ingels of RTI International; Claudette Kaba of the Office for Civil Rights, U.S. Department of Education; Carolyn S. Lee of the Office of Vocational and Adult Education, U.S. Department of Education; and Jon Oberg of the Institute of Education Sciences, U.S. Department of Education. Finally, special thanks for the efforts of Jeffrey Owings and Marilyn Seastrom of NCES.
Appreciation is also extended to the Office of Vocational and Adult Education of the U.S. Department of Education, the Division of Science Resource Studies of the National Science Foundation, the College Board, the Education Commission of the States, the American College Testing Service, the State Higher Education Executive Officers Network, the Association for Institutional Research, the American Association of Colleges and Universities, the Spencer Foundation, and the Mellon Foundation for providing indirect assistance, advice, and/or forums at which the frameworks and coding rules for the postsecondary transcript files could be tested as they were being constructed.
The comments and suggestions of 30 external reviewers in 6 panels during the formative stages of the NELS:88/2000 Postsecondary Transcript Files construction are gratefully acknowledged. With institutional affiliation at the time of their service, they were:
Ashok Agrawal Luz Barreras '
Mildred Boyd May K.C. Chen Jerald Dallam Arthur Ellis Dwaine Eubanks Thomas Gething Carmine Gibaldi Ross Gittell Lloyd Griffiths
St. Louis Community College New Mexico Institute of Mining and Technology Greater Baltimore Advanced Technology Center Los Angeles Trade-Technical College University of Iowa University of Wisconsin-Madison Clemson University National Foreign Language Center S t . John's University (NY) University of New Hampshire George Mason University
... 5 111

Michael Harsh Richard Hendrix Douglas Hesse Janet Holdsworth William Kelly William Keyhoe William Lauffer Dennis Lehman Paul Lennard Katherine Lewis Jose Mestre Myrtle Mitchell James Mortensen Linda Pratt Gene Scheiber Eric Sheppard Jerry Smith Jane Voos John Weese
Hagerstown Community College University of Pennsylvania Illinois State University University of Minnesota Catholic University of America University of Virginia Prince George’s Community College Harold Washington College (IL) Emory University Brown University University of Massachusetts-Amherst Seattle Central Community College Pennsylvania State University University of Nebraska Kansas City-Metro Community College National Science Foundation University of Texas-Arlington William Paterson University (NJ) Texas A&M University
iv 6

Highlights
This report uses postsecondary transcript data collected as part of the National Education Longitudinal Study of 1988 (NELS:88/2000). Most of the participants in this study were eighth-graders in 1988, graduated from high school in 1992, and at the time of the postsecondary transcript data collection in the year 2000 were around the age of 26 or 27. The data reported are for those participants who were in the 12th grade in 1992. Highlights include the following:
Attainment
0 Of all likely postsecondary participants, 45 percent earned a bachelor’s degree or higher by age 26 or 27 (table 1). Of those who earned more than 10 college credits, 51 percent earned a bachelor’s degree or higher by age 26 or 27 (table 2). Of those who earned more than 10 college credits and attended a 4-year college at any time, 67 percent earned a bachelor’s degree or higher by age 26 or 27 (table 3). Eleven percent of postsecondary participants earned 10 or fewer credits by age 26 or 27 (table 4).
0
0
0
Attendance
0 Of all undergraduates who earned more than 10 credits, 20 percent attended institutions in more than one state as undergraduates. Also, 24 percent of bachelor’s degree recipients attended institutions in more than one state as undergraduates (table 7). More than half of HispanicLatino students (vs. 37 percent of White students and 41 percent of Black students)’ began their postsecondary careers in community colleges (table 8). A majority of undergraduates attended school during summer terms (table 10).
Curriculum
Students whose highest level of mathematics in high school was at the trigonometry, precalculus, or calculus level had bachelor’s degree completion rates above 60 percent; for students who completed a calculus course in high school, the bachelor’s degree completion rate was 83 percent (table 11). Bachelor’s degree majors in business fields earned a higher mean number of credits in computer- related coursework than those in any other fields except mathematics/computer science and engineering; bachelor’s degree majors in engineering earned a higher mean number of credits in computer science than bachelor’s degree majors in any other fields except mathematics/computer science (table 12). Bachelor’s degree majors in the social sciences earned a higher mean number of credits in foreign language and international studies combined than bachelor’s degrees majors in any other fields except the humanities (table 13).
‘Race categories exclude Hispanic origin unless specified.
V
7

Performance
Students whose true institution of first attendance* was “selective” or “highly selective” had higher undergraduate grade point averages than those who attended less selective institutions (except for institutions that were not ratable) (table 16). A majority of students who started out in community colleges took one or more remedial courses, compared with 19 percent of students who started in doctoral degree-granting institutions and 30 percent of those who started in other types of 4-year institutions (table 17).
%rue institution of first attendance excludes postsecondary institutions attended while the student was still in high school, institutions attended in the summer between high school graduation and fall semester entry (unless the institution was the same for both periods), and “false starts” (i.e., when the student withdraws without earning any additive credits from the ostensible first postsecondary’institution in the first term of attendance but enrolls in another institution and earns credits at that institution at a later date).
vi r . 8

Table of Contents Paae
... Acknowledgments ...................................................................................................................................... 111
Highlights .................................................................................................................................................... v
... List of Tables ............................................................................................................................................ viii
Introduction .................................................................................................................................................. 1
Section I: Postsecondary Attainment ........................................................................................................... 3
Section II: Postsecondary Attendance ......................................................................................................... 9
Section 111: Postsecondary Curriculum ...................................................................................................... 17
Section IV: Postsecondary Academic Performance .................................................................................. 25
References .................................................................................................................................................. 33
Appendix A: Summary Tables .................................................................................................................. 35
Appendix B: Technical Notes .................................................................................................................... 45
1 . Overview of the National Education Longitudinal Study of 1988 (NELS:88) ............................... 47
2 . Introduction to the NELS:88/2000 Postsecondary Education Transcript Study ............................. 47
3 . NELS:88/2000 Postsecondary Education Transcript Study Data Collection .................................. 48
4 . Sample Design and Weighting ........................................................................................................ 52
5 . Postsecondary Education Participants: Selection of the Samples for This E.D. Tab ...................... 62
6 . Constructing the Data Files ............................................................................................................ 62
7 . Suggestions for Further Exploration ............................................................................................... 63
8 . Weights Used for Each Table .......................................................................................................... 65
9 . Software Used to Construct Tables ................................................................................................. 65
10 . Definitions of Variables Used in This E.D. Tabs Presentation ..................................................... 65
1 1 . For Further Information ................................................................................................................ 73
vii 9

List of Tables
Postsecondan Attainment Paae Table 1. Percentage distribution of the highest postsecondary attainment of 1992 12th-
graders who were likely postsecondary participants, by race/ethnicity, sex, and socioeconomic status: 1992-2000 ..................................................................................... 5
Table 2. Percentage distribution of the highest postsecondary attainment of 1992 12th- graders who earned more than 10 postsecondary credits, by race/ethnicity, sex, and socioeconomic status: 1992-2000 ..................................................................................... 6
Table 3. Percentage distribution of the highest postsecondary attainment of 1992 12th- graders who earned more than 10 postsecondary credits and any credits from 4-year colleges, by race/ethnicity, sex, and socioeconomic status: 1992-2000 ........................... 7
Table 4. Percentage distribution of 1992 12th-graders’ postsecondary attainment by degree status, and, if no degree, credits earned, by race/ethnicity, sex, and socioeconomic status: 1992-2000 .............................................................................................................. 8
Postsecondary Attendance
Table 5.
Table 6.
Table 7.
Table 8.
Table 9.
Table 10.
Among 1972,1982, and 1992 12th-graders who earned more than 10 postsecondary credits, percentage who attended more than one postsecondary institution as undergraduates ................................................................................................................. 10
Percentage distribution of the number of postsecondary institutions attended by stu- dents who were 12th-graders in 1992, as undergraduates, by extent of postsecondary education: 1992-2000 ...................................................................................................... 12
Percentage distribution of the number of states in which 1992 12th-graders were enrolled as undergraduates, by amount of postsecondary education and number of institutions attended: 1992-2000 ..................................................................................... 13
Percentage distribution of the type of postsecondary institution first attended by 1992 12th-graders, by selected student characteristics: 1992-2000 ......................................... 14
Percentage distribution of the average number of credits earned at community colleges by 1992 12th-graders who earned bachelor’s degrees, and the percentage of those who earned a bachelor’s degree whose first institution was a community college, by undergraduate majodfield of study: 1992-2000 .............................................................. 15
Percentage distribution of postsecondary credits earned in summer terms by 1992 12th- graders who earned more than 10 postsecondary credits, by types of postsecondary institution(s) attended: 1992-2000 .................................................................................. 16
... V l l l
f Q

Postsecondary Curriculum
Table 11. Percentage distribution of the highest postsecondary degree, the number of college credits completed in calculus and advanced mathematics, and the number of postsecondary remedial mathematics courses taken by 1992 12th-graders, by highest level of mathematics completed in high school: 1992-2000 ........................................... 19
Table 12. Mean number of computer science and computer-related credits earned by 1992 12th- graders who earned bachelor’s degrees, by majorlfield of study: 1992-2000 ................ 20
Table 13. Mean number of foreign language and international studies credits earned by 1992 12th- graders who earned bachelor’s degrees, by majodfield of study: 1992-2000 ................ 21
Table 14. Percentage distribution of postsecondary attainment by 1992 12th-graders who became postsecondary students on the engineering path, by sex: 1992-2000 ............................ 22
Table 15. Bachelor’s degree attainment for 1992 12th-graders who became postsecondary stu- dents on the engineering path in 4-year colleges, by sex: 1992-2000 ............................. 23
Postsecondary Academic Performance
Table 16. Mean undergraduate grade point average (GPA) of 1992 12th-graders who entered postsecondary education, by sex, attainment level, and selectivity of the student’s first institution of attendance: 1992-2000 ....................................................................... 27
Table 17. Percentage distribution of the number of remedial courses taken after entering postsecondary education by 1992 12th-graders, by attainment, high school academic curriculum intensity, and true institution of first postsecondary attendance: 1992-2000 ....................................................................................................................... 28
Table 18. Percentage distribution of credits earned by 1992 12th-graders in the first year of their postsecondary schooling, by high school background performance indicators: 1992-2000 ....................................................................................................................... 29
Table 19. Percentage of postsecondary credits earned to credits attempted by 1992 12th-graders in their first postsecondary year, by high school background performance indicators: 1992-2000 ....................................................................................................................... 30
Table 20. Percentage distribution of first-postsecondary-year grade point average (GPA) of 1992 12th-graders, by high school background performance indicators: 1992-2000 .............. 3 1

Appendix A: Summary Tables Paae Table A- 1.
Table A-2.
Table A-3.
Table A-4.
Table A-5.
Table A-6.
Table A-7.
Percentage distribution of the universes used in this E.D. Tabs, by selected character- istics of 12th-graders: 1992-2000 ................................................................................... 37
Percentage distribution of 1992 12th-graders who earned more than 10 postsecondary credits, by type of postsecondary institution(s) attended: 1992-2000 ............................. 38
Percentage distribution of highest level of mathematics completed in high school by 1992 12th-graders: 1992-2000 ........................................................................................ 39
Percentage distribution of 1992 12th-graders who earned bachelor’s degrees, by majodfield of study: 1992-2000 ..................................................................................... 40
Percentage distribution of 1992 12th-graders who entered postsecondary education, by attainment level and selectivity of the student’s first institution of attendance: 1992-2000 (refers to table 15) ......................................................................................... 41
Percentage distribution of 1992 12th-graders, by selected student and school characteristics: 1992-2000 (refers to table16) ................................................................. 42
Percentage distribution of students in the first year of their postsecondary schooling, by high school background performance indicators: 1992-2000 .................................... 43
Apuendix B: Technical Notes
Table B-1 . Number of fourth follow-up study respondents with postsecondary experience during the NELS:88 third and fourth follow-up studies, by the number of institutions each attended: 1994 and 2000 .................................................................................................. 50
Table B-2. Final institutions targeted for the NELS:88 postsecondary transcript study, and the population of postsecondary institutions included in the Integrated Postsecondary Education Data System: 2000 .......................................................................................... 5 1
X I2

Introduction
Overview
This report uses postsecondary transcript data collected as part of the National Education Longitudinal Study of 1988 (NELS:88/2000) to examine aspects of the (1) postsecondary attainment, (2) postsecondary attendance patterns, (3) postsecondary curriculum, and (4) postsecondary performance of a cohort of approximately 9,500’ individuals (ages 26-27) who were in the 12th grade in 1992 and attended institutions of postsecondary education2 during the period 1992-2000. Most of these individuals were 8th- graders in 1988 and graduated from high school in 1992.3 All tables in this report follow their histories through December 3 1,2000.
In addition to the postsecondary variables that were built from data recorded from postsecondary transcripts, this report uses data collected from previous waves of NELS:88, including high school transcript data. Thus, it is possible to examine the relationship between postsecondary histories and outcomes and earlier high school experiences, attainment, and coursetaking.
The evidence of student records as set forth in postsecondary transcript information offers cogent documentation of precisely what college students study, when and where they study it, and how well they perform in each course. It is important to note that transcript records do not do anything more than that. They do not tell us how much students have learned, whether the learning is retained, or what classroom experiences, teaching methods, or delivery systems produced the best results. For any one student, they provide only an outline of educational history, but an outline that suggests productive paths to analysis.
This collection of tables is designed to illustrate some of the range and analytical promise of the NELS:88/2000 Postsecondary Transcript Files. The NCES restricted data file from which these tables are constructed includes 482 student-level variables, of which
293 are drawn wholly from the NELS:88/2000 Postsecondary Transcript Files; 40 are drawn wholly from the NELS:88 High School Transcript Files, edited with reference to postsecondary transcript information; 76 are drawn from interviews/surveys of students across all waves of NELS (1988, 1990, 1992, 1994, and 2000) and of their parents in 1988 and 1992;
‘Of the approximately 12,100 students in the NELS:88/2000 panel, about 9,600 (75.2 percent, weighted) reported having attended at least one postsecondary institution. Based on received in-scope transcripts and, when transcripts were not received, other corroborating information (from National Student Loan Data Systems files, Advanced Placement and College Entrance Examination Board tests,’and other student responses), about 9,400 (71.2 percent, weighted) were judged as “likely participants.” Based only on received in-scope transcripts, about 8,900 (66.8 percent, weighted) were “known participants.” See discussion of the determination of likely participation in section I (Postsecondary Attainment) and its elaboration in appendix B, section 5.1.
Postsecondary institutions” include not only 4-year colleges and universities, 2-year colleges, and other degree-granting 2“
institutions but also noncollegiate institutions awarding less-than-2-year certificates.
30f the high school graduates in the NELS cohort, 3.3 percent had received a diploma or GED by December of 1991, and 1 percent of those who entered postsecondary education had done so by the same date. The tables in this report use the bracketing dates of 1992-2000 to mark the modal year of high school graduation and date of postsecondary entry (1992). By confining the universe to those survey participants who were in the 12th grade in 1992, early high school graduates, dropouts, students who had been retained in grade, and those who were not in school in 1992 are excluded. The populations under study are thus skewed toward higher levels of academic preparation and performance.
BESTCOPY AVAOMBLE 1 1 3
29 are derived from combinations of information on postsecondary transcripts, interviews/survey responses, and high school transcripts; 13 are drawn from an augmented test-score file4 that drew, in part, on postsecondary transcript information; and 30 consist of weights, participation flags, and high school characteristics.
In addition, the restricted file provides hierarchical, nested Course, Transcript, Institution, and Crosswalk Files that allow analysts to create new student-level variables or to modify the existing variables, or both.
The student-level variables are arranged in the Electronic Code Book for the NELS:88/2000 Postsecondary Transcript Files by topic, in the following order:
a
a
a
a
a
a
a
a
a
a
Postsecondary attendance patterns and characteristics Time issues in postsecondary histories Postsecondary academic performance and attainment Postsecondary curriculum Conditions of postsecondary attendance Personal activities in 2000 and geographic mobility Economic and labor force histories High school background Demographic variables Tools (weights, flags, IDS)
For a brief account of the construction of these files, see appendix B (Technical Notes), section 6 .
This E.D. Tabs presentation focuses on academic performance and attainment, postsecondary attendance patterns, and postsecondary curriculum. It also draws on high school background variables and demography.
The Technical Nature of E.D. Tabs
E.D. Tabs are simple descriptions: cross-tabulations and means. The included tables provide standard errors of measurement (required by the complex nature of the survey design), so that analysts can perform standard t-tests and arrive at conclusions about statistical significance. Some reported standard errors appear large relative to the size of the estimate, indicating that the estimates are unreliable. The larger standard errors tend to be a function of smaller cell sample sizes-particularly for the American IndidAlaska Native group and for some aggregate variables consisting of widely varying groups (e.g., the I-year, 2-year, and sub-baccalaureate category in the “Type of institution(s) attended” variable).
? h e core of the test-score file was drawn from (1) the second follow-up (1992) high school transcript file and (2) a special examination of general leamed abilities that was administered to participants in the 12th grade. This file was supplemented by test scores recorded on postsecondary transcripts. See discussion of Senior Test Quintile in appendix B, section 10.
1% 2

Section I: Postsecondary Attainment
Students who participated in NELS:88/2000 were interviewed between January and June of 2000. Transcripts from institutions they reported attending were requested in August 2000, and were received between September 2000 and March 2001.
The four tables in this section present the transcript-based educational attainment of postsecondary participants in the NELS:88/2000 cohort as of December 31,2000, which was set as the concluding date of the study.
If analysts compare the student’s account of highest degree earned by December 2000 to the transcript evidence, they will find disagreements in both directions. That is, there are (1) some cases in which the transcript evidence shows a degree that is higher than that reported by the student and, conversely, (2) other cases in which the student reported a higher degree than the transcript evidence documents. The first type of discrepancy is usually the result of the difference between the date the student was interviewed and the date the transcript was received. For example, a student in the final year of law school was interviewed in March 2000 and indicated the bachelor’s degree as the highest degree received. The student received the J.D. in June 2000, and the law school transcript was received in September-with the J.D., which is then the transcript-based highest degree. The second type of discrepancy includes students whose transcript records are incomplete;’ some of these students may, in fact, have earned the degrees they reported.
Table 1 presents attainment for “all likely postsecondary participants” in the NELS cohort. The universe of “likely participants” consists of more than those for whom transcripts were received. It also includes those for whom transcripts were requested and not received, but for whom other evidence in the NELS:88/2000 files strongly supports the student’s report of participation. The other evidence consulted for this classification included (1) the student’s presence in the National Student Loan Data System files, (2) Advanced Placement and College Entrance Examination Board (CEEB) Achievement Test scores taken from high school and college transcripts, and (3) student responses to a series of questions about postsecondary experiences asked in the third follow-up survey (1994) and the fourth follow-up survey (2000). For example, a student who reported in 1994 that her parents borrowed money to pay tuition and that she held a college work-study position, and who reported in 2000 that she had changed majors and attended more than one school at the same time, was judged to be a likely postsecondary participant even though no transcripts were received (see the more detailed description of “Likely Participants” in appendix B, section 5.1). Forty-five percent of all likely postsecondary participants earned a bachelor’s degree by age 26 or 27.
Table 2 narrows this universe to all known participants who earned more than 10 credits in their postsecondary careers, thus removing incidental students, 40 percent of whom did not enroll in credential- granting postsecondary programs.6 Fifty-one percent of this group earned a bachelor’s degree by age 26 or 27.
%ranscript records are incomplete when an institution said i t had no record of the student or that it could not find the transcript and there was no other evidence-for example, another transcript with transfer credits-from which to construct the othenvise- missing record.
60f the incidental student population (weighted N=319,000), 11 percent took only one course in their postsecondary careers, 3 percent were continuing-education-only students, 15 percent took nothing but remedial courses, 22 percent took more than one course but attempted 10 or fewer credits, and 5 percent were wholly vocational students at only one school.
3 15 BEST COPY AVAl WBbE

Table 3 adds earned credits from 4-year colleges to the criteria, thus restricting the universe to those who had the opportunity to earn a bachelor’s degree by virtue of attending at least one institution that awarded bachelor’s degrees. Sixty-seven percent of those who earned more than 10 postsecondary credits and any credits from bachelor’s degree-granting institutions also earned a bachelor’s degree by age 26 or 27:
Each ratcheting-up of the threshold changes the denominator for the calculations and sets the conditions closer to those under which degrees are likely to be earned. It also changes the percentile distribution of the independent variables, socioeconomic status (SES) quintile,’ and race/ethnicity (e.g., the narrower the universe, the more the SES distribution is skewed toward the upper end).
Some findings that are evident in tables 1-3 include the following:
Focusing on the column indicating no degree (“None”), no matter which universe one chooses, men are less likely to earn any credential than are women.9 With reference to the proportion of students who earned no degree, the overall attainment gap between the highest and lowest SES quintiles resulted in a significant difference in all three renditions of the attainment table. At the same time, no differences were detected in the three midrange quintiles among students who earned more than 10 credits and among those who earned more than 10 credits and any credits from 4-year colleges. Except when the sample is limited to those who earned any credits from 4-year colleges, those in the lowest SES quintile were more likely to earn a certificate as their highest postsecondary degree than those in the upper three SES quintiles.
Table 4 is a different portrait of attainment than the conventional accounting presented in tables 1, 2, and 3. It consolidates all degrees at the bachelor’s level and higher, and disaggregates the universe of students who earned no credential by the number of credits they earned by the concluding date of the study. The rationale behind this presentation is to offer the reader both the summary benchmarks of degree completion and an additional understanding that credits earned are a form of attainment, and that many students were still enrolled at the end of the longitudinal study period. For example, of the nearly 10 percent of those who entered postsecondary education and earned 60 or more credits but no degree, 37 percent were still in school in the year 2000-a threshold indication of their potential for completing a credential. Eleven percent of postsecondary participants earned 10 or fewer credits by age 26 or 27.
’Of those students with a known birth year and who participated in both the base year (1988) and fourth follow-up (2000) surveys, 31.9 percent were born in 1973 and 61.4 percent were born in 1974 (using the F4BYPNWT). Of those students with a known birth year and who participated in the second follow-up (1992), the third follow-up (1994), and the fourth follow-up (2000), 31.8 percent were born in 1973 and 61.1 percent were born in 1974 (using the F4F2PNWT). For this reason, the cohort age in 2000 is referred to throughout this document as “26 or 27.”
‘Socioeconomic status quintile was computed only once for the entire NELS:88/2000 population.
%is and all subsequent comparisons and statements of trends have been tested for statistical significance at the 0.05 level, with adjustments made for multiple comparisons. See discussion of statistical tests in appendix B, section 4.4.
4 BESTCOPY AVAILABLE

Table 1. Percentage distribution of the highest postsecondary attainment of 1992 12th-graders who were likely postsecondary participants, by racdethnicity, sex, and socioeconomic status: 1992-2000
Highest postsecondary attainment Some post-
baccalaureate Selected characteristics None Certificate Associate’s Bachelor’s enrollment’ Graduate2
Total 42.1 (0.99) 4.9 (0.42) 8.1 (0.49) 31.0 (0.86) 8.2 (0.42) 5.7 (0.38)
Race/ethnicity3 White 37.3 (1.00) 4.9 (0.49) 8.5 (0.57) 33.8 (0.95) 9.0 (0.50) 6.4 (0.46) Black 59.2 (3.64) 5.3 (1.23) 4.9 (1.13) 24.1 (3.02) 4.4 (0.99) 2.1 (0.52) HispanicLatino 63.1 (2.97) 5.0 (0.82) 8.2 (1.67) 15.1 (1.64) 6.0 (1.58) 2.5 (0.54) Asiaflacific Islander 36.5 (3.62) 4.5 (1.57) 7.6 (2.99) 33.6 (3.32) 9.7 (1.35) 8.1 (2.25) American IndiadAlaska Native 77.4 (5.91) 1.2 (0.93) 6.1 (2.98) 10.5 (4.35) 3.1 (1.71) 1.7 (1.56)
Sex Male Female
47.6 (1.51) 3.8 (0.44) 7.4 (0.69) 29.3 (1.25) 7.3 (0.64) 4.6 (0.48) 37.2 (1.19) 5.9 (0.69) 8.7 (0.69) 32.5 (1.10) 9.1 (0.56) 6.7 (0.54)
Socioeconomic status quintile 81st-100th percentile (high) 22.6 (1.41) 1.5 (0.41) 3.7 (0.57) 46.2 (1.53) 14.1 (0.87) 11.9 (0.93) 6lst-80“ percentile 44.6 (1.97) 3.9 (0.88) 7.0 (0.93) 33.0 (1.69) 6.8 (0.78) 4.6 (0.60) 41 st-60” percentile 48.6 (1.91) 5.5 (0.78) 12.0 (1.27) 24.6 (1.65) 6.3 (0.68) 3.0 (0.46) 2 1 s t 4 “ percentile 54.3 (2.03) 6.8 (1.26) 11.5 (1.32) 20.2 (1.45) 4.9 (1.19) 2.4 (0.42) 1 st-20th percentile (low) 59.5 (2.87) 12.9 (2.00) 11.4 (1.98) 11.9 (1.39) 3.7 (1.16) 0.6 (0.25)
‘“Some postbaccalaureate enrollment” includes both incomplete graduate degrees and nondegree postbaccalaureate coursework.
*“Graduate” includes master’s, first-professional, and doctoral degrees.
3Race categories exclude Hispanic origin unless specified.
NOTE: “All likely postsecondary articipants” include (1) those for whom transcripts were received; and (2) those for whom transcripts were requested but not received, and for whom otier evidence in the NELS files supports the student’s report of ostsecond attendance (see expanded description in
SOURCE: U.S. Department of Education, National Center for Education Statistics, National Education Longitudinal Study of 1988 (NELS:88/2000), “Fourth Follow-up, Postsecondary Education Transcript Study (PETS), 2000.”
appendix B, section 5.1). Weighted N=1.9 million. Detail may not sum to totals because of roun&g. Standar ”1y errors appear in parentheses.

Table 2. Percentage distribution of the highest postsecondary attainment of 1992 12th-graders who earned more than 10 postsecondary credits, by racdethnicity, sex, and socioeconomic status: 1992-2000
Highest postsecondary attainment Some post-
baccalaureaty Selected characteristics None Certificate Associate’s Bachelor’s enrollment Graduate2
Total
Race/ethnicity3 White Black HispanicLatino AsianPacific Islander American IndiadAlaska Native
Sex Male Female
Socioeconomic status quintile 81st-100th percentile (high) 61 st-80th percentile 41st-60th percentile 2lst-40th percentile 1st-20” Dercentile (low)
34.3 (1.02)
30.5 (1.03) 48.5 (4.09) 53.5 (3.59) 28.6 (3.77) 63.9 (9.41)
40.0 (1.63) 29.3 (1.14)
20.1 (1.43) 37.4 (2.09) 39.2 (1.98) 43.0 (2.37)
5.4 (0.48)
5.2 (0.55) 6.6 (1.54) 6.1 (1.52) 4.9 (1.70) 1.9 (1.48)
4.3 (0.52) 6.4 (0.78)
1.5 (0.44) 4.4 (0.98) 6.0 (0.87) 8.3 (1.62)
9.2 (0.57) 35.2 (0.94)
9.5 (0.64) 37.6 (1.04) 6.1 (1.39) 30.6 (3.53)
10.4 (2.17) 19.1 (2.09) 8.7 (3.52) 37.9 (3.55) 9.7 (4.36) 17.1 (7.03)
8.5 (0.81) 33.6 (1.41) 9.9 (0.79) 36.7 (1.20)
3.9 (0.60) 47.7 (1.56) 7.9 (1 .08) 37.4 (1.90)
14.4 (1.52) 29.4 (1.90) 14.2 (1.62) 25.1 (1.86)
9.4 (0.48)
10.0 (0.56) 5.5 (1.21) 7.8 (2.09)
10.8 (1.46) 4.8 (2.93)
8.4 (0.75) 10.2 (0.64)
14.4 (0.91) 7.7 (0.89) 7.5 (0.80) 6.2 (1.53)
6.4 (0.43)
7.1 (0.52) 2.6 (0.65) 3.1 (0.68) 9.1 (2.56) 2.6 (2.45)
5.2 (0.56) 7.5 (0.60)
12.4 (0.98) 5.2 (0.70) 3.5 (0.53) 3.0 (0.53)
14.1 (2.43) 14.9 (1.76) 49.8 (3.20) 15.7 (2.44) . , \ I \ I \ I \ I 4.8 (1.55) 0.7 (0.30)
‘“Some postbaccalaureate enrollment” includes both incomplete graduate degrees and nondegree postbaccalaureate coursework.
’“Graduate” includes master’s, first-professional, and doctoral degrees.
3Race categories exclude Hispanic origin unless specified.
NOTE: The criterion of more than 10 credits excludes incidental students. Evidence for credits earned comes from received transcripts. Weighted N=l.8 million. Detail may not sum to totals because of rounding. Standard errors appear in parentheses.
SOURCE: U.S. Department of Education, National Center for Education Statistics, National Education Longitudinal Study of 1988 (NELS:88/2000), “Fourth Follow-up, Postsecondary Education Transcript Study (PETS), 2000.”

Table 3. Percentage distribution of the highest postsecondary attainment of 1992 12th-graders who earned more than 10 postsecondary credits and any credits from 4-year colleges, by racdethnicity, sex, and socioeconomic status: 1992-2000
Highest postsecondary attainment Some post-
baccalaureat? Selected characteristics None Certificate Associate’s Bachelor’s enrollment Graduate2
Total 25.0 (0.94) 1.8 (0.39) 5.9 (0.55) 46.5 (1.02) 12.3 (0.62) 8.5 (0.55)
Race/ethnicity3 White 22.9 (1.03) 1.8 (0.47) 5.4 (0.55) 48.1 (1.14) 12.8 (0.69) 9.1 (0.65) Black 35.5 (3.68 3.7 (1.55) 4.5 (1.30) 44.5 (4.09) 7.9 (1.71) 3.8 (0.91) HispanicLatino 38.4 (4.19) 1.7 (0.54) 10.1 (2.88) 31.8 (3.09) 13.0 (3.20) 5.1 (1.09) Asiaflacific Islander 21.2 (4.08) 0.2 (0.17) 9.3 (4.14) 45.5 (4.18) 12.9 (1.77) 10.9 (3.04) American IndiadAlaskaNative 31.0 (8.21) 1.7 (1.74) 14.0 (8.55) 37.2 (10.6) 10.4 (5.46) 5.7 (5.18)
Sex Male Female
30.6 (1.59) 1.2 (0.34) 5.8 (0.78) 44.4 (1.58) 11.1 (0.97) 6.9 (0.73) 20.0 (1.04) 2.4 (0.67) 6.0 (0.77) 48.3 (1.35) 13.4 (0.82) 9.9 (0.78)
Socioeconomic status quintile 8 1 st-100th percentile (high) 16.7 (1.42) 0.3 (0.15) 2.8 (0.60) 51.3 (1.58) 15.5 (0.98) 13.3 (1.05) 61 st-80th percentile 28.5 (2.13) 2.7 (1.16) 4.4 (0.85) 48.0 (2.21) 9.8 (1.12) 6.7 (0.89) 41 st-60th percentile 28.6 (2.04) 2.6 (0.88) 10.6 (1.64) 42.3 (2.37) 10.9 (1.15) 5.0 (0.77) 2 1 st-40th percentile 32.9 (2.63) 0.8 (0.31) 9.6 (2.05) 41.4 (2.77) 10.3 (2.43) 5.0 (0.88) 1 st-20th percentile (low) 36.8 (3.78) 8.4 (3.12) 12.7 (3.27) 30.7 (3.35) 10.0 (3.07) 1.4 (0.62)
“‘Some postbaccalaureate enrollment” includes both incomplete graduate degrees and nondegree postbaccalaureate coursework.
Graduate” includes master’s, first-professional, and doctoral degrees. 2“
%ace categories exciude Hispanic origin unless specified.
NOTE: The criterion of more than 10 credits excludes incidental students. Evidence for credits earned comes from received transcripts. Weighted N=1.4 million. Detail may not sum to totals because of rounding. Standard errors appear in parentheses.
SOURCE: U.S. Department of Education, National Center for Education Statistics, National Education Longitudinal Study of 1988 (NELS:88/2000), “Fourth Follow-up, Postsecondary Education Transcript Study (PETS), 2000.”

Table 4. Percentage distribution of 1992 12th-graders’ postsecondary attainment by degree status, and, if no degree, credits earned, by racdethnicity, sex, and socioeconomic status: 1992-2000
Postsecondary attainment
No degree, credits earned Highest degree earned Certificate Associate’s Bachelor’s
Selected characteristics 0-10 1 1-29 30-59 60 or more as highest as highest or higher
No degree, credits earned Highest degree earned Certificate Associate’s Bachelor’s
Selected characteristics 0-10 1 1-29 30-59 60 or more as highest as highest or higher
Total 11.4(0.67) 11.3 (0.66) 9.0(0.57) 10.1 (0.56)
Race/ethnicity ’ White 9.0 (0.61) Black 18.9 (3.55) HispanicLatino 19.5 (2.29) AsianPacific Islander 11.2 (3.13) American IndiadAlaska
Native 31.1 (11.1)
Sex
9.8 (0.64) 8.4 (0.56) 9.6 (0.59) 8.0 (3.35) 10.9 (2.47) 1 0 3 1.89) 9.1 (2.58) 12.2 (2.15) 11.7 (2.40) 5.9 (1.18) 5.2 (1.10) 14.3 (3.68)
1.1 (3.46) 25.4 (1 1.1) 7.5 (3.98)
Male Female
12.0 (1.05) 12.5 (1.07) 9.8 (0.90) 12.8 (0.98) 10.9 (0.84) 10.2 (0.72) 8.2 (0.68) 7.7 (0.59)
Socioeconomic status quintile 81st-100th percentile
(high) 3.0 (0.45) 4.6 (0.76) 4.7 (0.59) 10.1 (1.11) 61st-80th percentile 10.4 (1.48) 11.4 (1.32) 10.2 (1.19) 11.9 (1.29) 41st-60th percentile 15.4 (1.67) 14.0 (1.52) 9.3 (0.87) 9.7 (1.08) 2 1 st40th percentile 19.0 (1.67) 14.0 (1.63) 11.4 (1.46) 9.4 (0.88)
5.0 (0.43)
5.0 (0.50) 5.4 (1.25) 5.1 (1.27) 4.4 (1.5 1)
1.3 (1.03)
3.9 (0.47) 5.9 (0.70)
1.5 (0.42) 3.9 (0.88) 5.5 (0.80) 6.9 (1.33)
8.2 (0.50)
8.6 (0.59) 5.0 (1.13) 8.3 (1.76) 7.7 (3.05)
6.7 (3.29)
7.4 (0.71) 8.8 (0.71)
3.8 (0.58) 7.1 (0.97)
12.1 (1.31) 11.5 (1.34)
45.1 (1.08)
49.7 (1.13) 3 1.4 (3.36) 24.1 (2.57) 51.3 (4.33)
16.8 (5.41)
41.5 (1.50) 48.3 (1.31)
72.2 (1.57) 45.0 (1.90) 34.0 (1.80) 27.8 (1.79) 16.6 (1.97) 1st-20th percentile (low) 17.8 (2.90) 20.2 (2.51) 13.2 (2.49) 7.4 (1.16) 13.3 (2.06) 11.5 (2.04) \ I
‘Race categories exclude Hispanic origin unless specified.
NOTE: The universe consists of all known postsecondary participants. Weighted N=2.0 million. Detail may not sum to totals because of rounding. Standard errors appear in parentheses.
SOURCE: U.S. Department of Education, National Center for Education Statistics, National Education Longitudinal Study of 1988 (NJZLS:88/2000), “Fourth Follow-up, Postsecondary Education Transcript Study (PETS), 2000.”
8 20

Section 11: Postsecondary Attendance
One of the most striking features of the postsecondary history of the NELS:88/2000 cohort is the complexity of its attendance patterns. Four illustrative issues concerning attendance patterns are featured in this E.D. Tabs.
The first issue is student mobility, or the extent to which students attend more than one institution in the course of their undergraduate careers. Tables 6 and 7 answer two specific questions concerning student mobility:
0
0
What proportion of undergraduates attend more than one institution? What proportion of undergraduates attend institutions in more than one state?
The answers to these questions are presented for three populations of 1992 12th-graders: (1) all postsecondary attendees, (2) those who earned more than 10 credits (thus excluding incidental students), and (3) those who earned bachelor’s degrees. The key findings are as follows:
0 Among all postsecondary students, 32.3 percent attended two institutions and another 18.9 percent attended more than two (table 6). Among those who attended two institutions, 71.8 percent attended the two institutions in the same state and 28.2 percent attended institutions in two states (table 7). Twenty percent of all undergraduates who earned more than 10 credits attended institutions in more than one state as undergraduates. Also, 24 percent of bachelor’s degree recipients attended institutions in more than one state as undergraduates (table 7).
To provide some historical perspective on multi-institutional attendance, it is helpful to examine the results for 12th-graders who subsequently earned more than 10 postsecondary credits in three separate longitudinal studies that included postsecondary transcripts. These results are shown in table 5. The rate of multi-institutional attendance among traditional age postsecondary students has increased from cohort to cohort.
A simple accounting of the number of schools attended does not address the nature, extent, or sequence of attendance. For those features of the mobility story, the analyst can draw on other variables in the restricted NELS:88/2000 Postsecondary Transcript Files.

Table 5. Among 1972,1982, and 1992 12th-graders who earned more than 10 postsecondary credits, percentage who attended more than one postsecondary institution as undergraduates
Percent of undergraduates attending
Longitudinal study Years of cohort history more than one institution
National Longitudinal Study of the High School Class of 1972 (NLS:72/86) 1972-84 (1 2 years) 50.6 (0.59) High School and Beyond Longitudinal Study of 1980 Sophomores (HS&B-So:PETS) 1982-92 (1 0 years) 53.1 (0.82) National Education Longitudinal Study of 1988 (NELS:88/2000) 1992’-2000 (8 years) 56.7 (1.04)
‘For those students who were in both the base year survey (1988) and the fourth follow-up survey (2000) and who received a high school diploma of any kind, the modal year of graduation was 1992 (89.2 percent, using the F4BYP“). For those from this group for whom the date of first entry to postsecondary education could be determined, 1992 was also the modal first year (79.5 percent) for those who entered postsecondary education.
SOURCE: U.S. Department of Education, National Center for Education Statistics: National Longitudinal Study of the High School Class of 1972, “Fifth Follow-up” (NLS:72/86); High School and Beyond Longitudinal Study of 1980 Sophomores, “Postsecondary Education Transcript Study” (HS&B-So:PETS); and National Education Longitudinal Study of 1988 (NELS:88/2000), “Fourth Follow-up, Postsecondary Education Transcript Study (PETS), 2000.”
The second issue, illustrated in table 8, concerns the question: What kind of institution was the “true” institution of first attendance for different population groups? To determine the true institution of first attendance, colleges and community colleges attended prior to high school graduation were excluded, as were those attended in the summer term between high school graduation and fall enrollment (unless the institution for both summer and fall terms was the same). Also excluded were false starts-that is, cases where students enrolled at an institution but withdrew in the first term of attendance only to enter and earn credits in another institution at a later point in time. In this model, it is the second institution that becomes the true first institution.
The key findings are as follows:
HispanicsLatinos are more likely to begin their postsecondary careers in community colleges than students in other racidethnic groups (though no difference was detected between HispanicsLatinos and American IndiandAlaska Natives).” Men are more likely to begin in community colleges than women. There is a positive relationship between both the SES quintiles and highest mathematics studied in high school and the student’s likelihood of first entering a doctoral degree-granting institution.
‘%roughout this report, race categories exclude Hispanic origin unless specified.
10 22

The third issue confines the population to those who earned bachelor’s degrees, and concerns two questions about their attendance at community colleges: (1) how many credits did these students earn from community colleges? and (2) for what percentage of students was the community college the true institution of first attendance? This issue is of particular interest to state systems that are seeking better articulation between their community colleges and 4-year institutions. The results are presented in table 9 by bachelor’s degree major.
The last issue informs the challenges of enrollment management when students cross sectoral lines in postsecondary education and make use of the full calendar year. Table 10 displays the distribution of credits earned in summer terms by students attending different combinations of institutions. The universe is set to those students who earned more than 10 undergraduate credits so that the students have a sufficient history for analyses of both multi-institutional attendance and use of the full calendar year terms. Overall, 62 percent of undergraduates attended school during summer terms.
11
2 3

Table 6. Percentage distribution of the number of postsecondary institutions attended by students who were 12th-graders in 1992, as undergraduates, by extent of postsecondary education: 1992-2000
Number of institutions attended as an undergraduate Amount of postsecondary education One Two More than two
All postsecondary students 48.7 (0.96) 32.3 (0.86) 18.9 (0.81)
Students who earned more than 10 credits 43.3 (1.01) 35.2 (0.91) 2 1.5 (0.84) Students who earned a bachelor’s degree 40.7 (1.29) 36.6 (1.18) 22.6 (1.12)
NOTE: The universe consists of (1) “all likely participants” in postsecondary education, weighted N=2.0 million; (2) those who earned more than 10 postsecondary credits, weighted N=1.7 million; or (3) those who earned bachelor’s degrees, weighted N=0.9 million. Detail may not sum to totals because of rounding. Standard errors appear in parentheses. For full description of “likely participants,” see appendix B, section 5.1.
SOURCE: U.S. Department of Education, National Center for Education Statistics, National Education Longitudinal Study of 1988 (NELS:88/2000), “Fourth Follow-up, Postsecondary Education Transcript Study (PETS), 2000.”
24 12

Table 7. Percentage distribution of the number of states in which 1992 12th-graders were enrolled as undergraduates, by amount of postsecondary education and number of institutions attended: 1992-2000
Amount of postsecondary education and number of institutions attended One Two More than two
Number of states
All students 82.0 (0.73) 15.8 (0.70) 2.2 (0.18)
One institution Two institutions More than two institutions
100.0 (0) t t 71.8 (1.47) 28.2 (1.47) t 53.1 (2.50) 35.4 (2.29) 1 1.4 (0.98)
Students who earned more than 10 credits 79.6 (0.82) 17.8 (0.79) 2.6 (0.21) One institution 100.0 (0) t t Two institutions 71.8 (1.51) 28.2 (1.51) t More than two institutions 5 1.5 (2.27) 36.4 (2.18) 12.0 (0.99)
Students who earned a bachelor’s degree 76.5 (1.12) 20.5 (1.08) 3.0 (0.32) One institution 100.0 (0) t t Two institutions 68.2 (1.89) 31.8 (1.89) t More than two institutions 47.7 (2.80) 39.0 (2.79) 13.3 (1.41)
tNot applicable.
NOTE: The universe consists of (1) all “likely participants” in postsecondary education, weighted N=2.0 million; (2) those who earned more than 10 postsecondary credits, weighted N=1.7 million; or (3) those who earned bachelor’s degrees, weighted N=0.9 million. Detail may not sum to totals because of rounding. Standard errors appear in parentheses. For full description of “likely participants,” see appendix B, section 5.1.
SOURCE: U.S. Department of Education, National Center for Education Statistics, National Education Longitudinal Study of 1988 (NELS:88/2000), “Fourth Follow-up, Postsecondary Education Transcript Study (PETS), 2000.”
25 13

Table 8. Percentage distribution of the type of postsecondary institution first attended by 1992 12th- graders, by selected student characteristics: 1992-2000
Type of institution first attended Other Community Other
Selected student characteristics Doctoral 4-year college sub-baccalaureate’
Total
Sex Male Female
Race/ethnicity* White Black HispanicLatino Asiaflacific Islander American Indian/ Alaska Native
Socioeconomic status quintile 81st-100th percentile (high) 6 1 st-80th percentile 41st-60th percentile 2 1 st-40th percentile 1 st-20th percentile
Highest math in high school Calculus Precalculus Trigonometry Algebra 2 Geometry Algebra 1 Less than algebra 1
24.5 (0.92)
24.5 (1.18) 24.6 (1.14)
26.0 (1.02) 17.6 (2.33) 16.3 (2.42) 33.1 (3.80) 15.7 (6.10)
43.3 (1.69) 22.1 (1.38) 15.5 (1.22) 13.9 (1.22) 9.8 (1.67)
56.4 (2.59) 41.9 (2.75) 30.3 (2.95) 17.7 (1.47) 10.0 (1.39) 3.5 (1.22)
31.3 (0.89)
29.8 (1.27) 32.7 (1.18)
32.3 (1.01) 36.0 (3.32) 22.7 (2.95) 26.0 (3.37) 20.3 (7.76)
34.9 (1.47) 33.5 (1.87) 31.3 (1.81) 26.0 (1.84) 24.1 (2.95)
36.5 (2.64) 41.7 (2.63) 36.1 (2.98) 34.7 (2.17) 22.8 (2.41) 18.0 (4.65) 8.4 (2.34’1
39.6 (1.10)
42.3 (1.51) 37.2 (1.37)
37.4 (1.19) 40.8 (4.1 1) 54.8 (3.40) 37.1 (3.87) 57.5 (10.1)
20.0 (1.62) 41.1 (1.96) 48.7 (2.12) 52.9 (2.12) 54.7 (3.53)
6.3 (0.93) 15.2 (2.07) 32.1 (3.95) 43.3 (2.62) 60.5 (2.90) 64.3 (4.33)
4.5 (0.35)
3.5 (0.39) 5.4 (0.55)
4.2 (0.37) 5.6 (1.10) 6.2 (1.68) 3.7 (1.46) 6.5 (2.60)
1.7 (0.49) 3.3 (0.44) 4.6 (0.61) 7.2 (0.96)
11.4 (2.01)
0.8 (0.46) 1.2 (0.42) 1.5 (0.37) 4.3 (0.86) 6.8 (1.08)
14.3 (2.36) ‘2 0.4 (0.43) % I 73.6 (4.40) 17.5 (3.65)
’“Other sub-baccalaureate” includes 2-year institutions other than community colleges and nondegree-granting schools.
*Race categories exclude Hispanic origin unless specified.
NOTE: Data refer to individuals’ true institution of first attendance, which excludes postsecondary institutions attended while the student was still in high school, institutions attended in the summer between hi h school graduation and fall semester entry (unless the institution was the same for both periods), and “false starts” (i.e., when the stufent withdraws without earning any additive credits from the ostensible first postsecondary institution in the first term of attendance but enrolls in another institution and earns credits at that institution at a later date). Universe consists of all for whom a true postsecondary institution of first attendance could be determined. Weighted N=2.0 million. Detail may not sum to totals because of rounding. Standard errors appear in parentheses.
SOURCE: U.S. De artment of Education, National Center for Education Statistics, National Education Longitudinal Stud of 1988 (NELS:88/92/2000!: “Second Follow-up, High School Transcript Study, 1992”; and “Fourth Follow-up, Postsecondary Elucation Transcript Study (PETS), 2000.”
14

Table 9. Percentage distribution of the average number of credits earned at community colleges by 1992 12th-graders who earned bachelor’s degrees, and the percentage of those who earned a bachelor’s degree whose first institution was a community college, by undergraduate majodfield of study: 1992-2000
Percent whose first Number of credits earned at community colleges Undergraduate majodfield of institution was a More than study community college None 1-10 11-30 30
Business
Education
Engineering
Physical sciences
Math and computer science
Life sciences
Health sciences and services’
Humanities
Fine and performing arts
Social sciences
Applied social sciences2
17.2 (2.58)
13.7 (2.00)
10.0 (1.96)
7.5 (3.31)
8.3 (2.39)
13.7 (3.26)
20.9 (3.42)
12.4 (3.66)
12.6 (2.90)
19.2 (3.13)
15.7 (2.59)
64.8 (3.00)
68.4 (3.48)
69.2 (4.42)
79.6 (5.99)
70.2 (8.87)
70.2 (3.49)
63.4 (3.65)
73.9 (4.94)
72.8 (4.09)
64.4 (3.10)
63.3 (3.81)
10.5 (1.92)
6.6 (1.43)
12.7 (3.35)
10.4 (4.40)
18.5 (9.55)
10.3 (1.80)
12.8 (2.19)
7.8 (3.41)
11.3 (2.99)
11.5 (2.44)
11.2 (3.02)
8.2 (1.68)
4.2 (1.25)
8.8 (3.23)
0.6(0.62)
4.8 (1.92)
5.4 (1.34)
7.2 (1.55)
6.8 (1.84)
3.8 (1.17)
5.3 (0.90)
10.4(3.10)
16.5 (2.63)
20.8 (3.30)
9.2 (1.93)
9.4 (3.83)
6.4 (2.09)
14.1 (3.24)
16.6 (3.24)
11.5 (3.60)
12.0 (2.84)
18.8 (2.75)
15.2 (2.09)
Other3 24.4 (7.18) 67.1 (7.64) 6.2 (3.02) 3.1 (2.22) 23.7 (7.17) I . . - - “Health sciences and services’’ includes nursing, allied health, physical therapy, etc.
administration, social work, humadcommunity services, child study, and family and community studies.
transportation, and culinary arts.
Applied social sciences” includes communications, clinicdcounseling psychology, recreation and leisure studies, criminal justice, public
Other” includes business and medical office support, communications technologies, generaVliberal studies, theology, Bible studies, air
2‘4
3‘6
NOTE: The universe consists of all students who earned bachelor’s degrees and whose transcript records were complete. Weighted N=0.9 million. Detail may not sum to totals because of rounding. Standard errors appear in parentheses.
SOURCE: U.S. Department of Education, National Center for Education Statistics, National Education Longitudinal Study of 1988 (NELS:88/2000), “Fourth Follow-up, Postsecondary Education Transcript Study (PETS), 2000.”
BESTCOPY AVAILABLE
27 15

Table 10. Percentage distribution of postsecondary credits earned in summer terms by 1992 12th-graders who earned more than 10 postsecondary credits, by types of postsecondary institution(s) attended: 1992- 2000
Number of credits earned in summer terms Types of institution(s) attended None 1-4 5-8 9-12 13 or more
Total
4-year only
4-year, then 2-year
2-year, then 4-year
Alternating 2/4-year
4-year with incidental 2-year
4-year and sub-baccalaureate’
2-year only
2-year and sub-baccalaureate’
Sub-baccalaureate only’
38.2 (0.93)
42.4 (1.34)
42.3 (5.05)
22.6 (2.33)
16.8 (2.49)
11.6 (2.23)
45.2 (1 1.5)
54.9 (2.32)
40.9 (5.72)
34.9 (6.14)
12.9 (0.61)
12.5 (0.81)
14.9 (3.05)
13.4 (1.50)
15.0 (3.28)
1 1.4 (1.63)
13.3 (3.39)
13.7 (1.68)
16.3 (6.26)
2.0 (1.17)
13.8 (0.63)
14.3 (0.86)
15.2 (3.93)
14.6 (1.72)
14.9 (3.01)
16.0 (2.26)
8.8 (3.61)
11.7 (1.46)
9.0(2.62)
17.1 (7.42)
12.1 (0.55)
12.1 (0.75)
11.8 (2.95)
13.9 (1.69)
12.5 (2.1 1)
20.1 (3.64)
6.1 (2.77)
8.2 (0.97)
13.6 (3.81)
13.8 (5.23)
23.0 (0.89)
18.7 (1.01)
15.7 (2.41)
35.5 (3.19)
40.8 (3.88)
41.0 (3.92)
26.6 (10.3)
11.5 (1.38)
20.2 (5.04)
32.2 (7.42)
4-year, 2-year, and sub-baccalaureate’ 37.9 (1 1.6) 5.0 (2.79) 1.3 (1.34) 11.3 (4.75) 44.4 (10.5)
“‘Sub-baccalaureate” indicates nondegree-granting institutions (principally proprietary and public vocational schools),
NOTE: Universe consists of all students who earned more than 10 credits and for whom summer-term information was available. Weighted N=l.8 million. Detail may not sum to totals because of rounding. Standard errors appear in parentheses.
SOURCE: U.S. Department of Education, National Center for Education Statistics, National Education Longitudinal Study of 1988 (NELS:88/2000), “Fourth Follow-up, Postsecondary Education Transcript Study (PETS), 2000.”
28
16

Section 111: Postsecondary Curriculum
The NELS:88/2000 Postsecondary Transcript Files include variables derived from both postsecondary and high school curricular information. The vast majority of the postsecondary variables describe the number of credits earned in specific disciplinary configurations; for example, upper level laboratory science courses, media studies, non-Western cultures and societies, and ethics. With the exception of variables accounting for Advanced Placement work in specific subjects, the metric for the high school curriculum variables is the Carnegie Unit (after some editorial adjustments on the high school transcript file). The Advanced Placement variables were derived from both postsecondary transcript entries and test scores noted on high school transcripts, and each is expressed as number of courses.
The topics addressed in this section’s tables cut across high school and postsecondary academic history. Table 11 displays the relationships between the highest level of mathematics the student completed in high school and (1) the highest postsecondary degree earned, (2) credits in calculus and advanced mathematics courses (including advanced statistics) earned in college, and (3) the extent of remedial work in mathematics at the postsecondary level. There is a positive relationship between the level of mathematics completed in high school and (1) the highest postsecondary degree and (2) the number of credits earned in calculus and advanced mathematics in college. For example, students whose highest level of mathematics in high school was at the trigonometry, precalculus, or calculus levels had bachelor’s degree completion rates above 60 percent; for students who completed a calculus course in high school, the bachelor’s degree completion rate was 83 percent. Considering the gaps in the acquisition of college credits in calculus and advanced mathematics, researchers may wish to examine more closely the STEM (science, technology, engineering, and mathematics) paths of those students whose highest level of high school mathematics was precalculus to determine the proportion of students that continued mathematics study along noncalculus-based lines (finite/discrete mathematics, statistics, or both).
Table 12 distinguishes between core computer science coursework and the broader category of computer- related coursework (including computer applications) in the experience of bachelor’s degree recipients in the NELS cohort, by major.” Apart from mathematics/computer science majors, engineering majors earned a higher mean number of computer science credits than all other majors, and business majors earned a higher mean number of computer-related credits than all other majors except engineering.
Table 13 uses the same universe and format as table 12, but shifts the subject to the study of languages other than English and the combination of language and international studies completed among undergraduates.I2 Table 13 is intended to help identify the prevalence of language study beyond humanities majors, and to provide a curriculum-based look at the extent to which bachelor’s degree recipients from different majors might be prepared to participate in a global economy. As such, the table
“In previous taxonomies of postsecondary courses (e.g., Adelman 1999), computer applications courses were positioned in the chapter for Computer Science. Given the increase in volume of coursetaking in these areas, as well as the diversification of fields in which computer applications curricula were offered, the 2001 external faculty review group that focused on engineering, engineering technologies, and computer science recommended that (1) computer applications courses in specific disciplines (e.g., agriculture, engineering technologies, graphic arts) be listed under those disciplines, and (2) generalized applications courses and training courses in office software packages be given a separate chapter in the taxonomy. These recommendations were followed in course coding. For a brief description of the taxonomy used for coding postsecondary courses in NELS:88/2000 and the process of its development, see appendix B, section 3.2.2.
‘*With the exception of a small percentage of 81h-graders in the base year (1988) of the study who were excluded from the sample because of limited English proficiency, the NELS:88/2000 Postsecondary Transcript Files also allow analysts to track students from non-English-dominant households through high school curriculum (using English as a Second Language [ESL] and other coursework to determine who was truly bilingual) to college curriculum (including “heritage language” study).
l7 29

shows that majors in the social sciences (as well as those in the humanities) have acquired the most credits in foreign language and international studies.
Tables 14 and 15 outline the final attainment (as of the final date of the NELS:88/2000 Postsecondary Transcript Files, December 31,2000) of all students who crossed a curricular thre~hold'~ that indicates a potential major in engineering, engineering technology, or architecture. Table 14 also includes students whose careers were spent principally in 2-year institutions in pre-engineering or technology programs. Compared to the attainment of all students who attended 4-year colleges (see table 3), a high bachelor's degree completion rate (86 percent) is evident for students on the engineering path in 4-year college contexts, as is the fact that, of the students who leave the engineering path and complete bachelor's degrees, nearly half do so in other science and technology fields. Men constituted 82.6 percent of students on the engineering path and women made up 17.4 percent (data not shown in tables).
' ? h e threshold consists of successful completion of (1) mathematics at the level of precalculus or higher; (2) a course in introduction to engineering, basic engineering design, introduction to any engineering specialty (electrical, mechanical, etc.), or introduction to architecture; and (3) computer applications in engineeringlengineering technology/architecture and/or engineering graphics/CAD (see Adelman 1998).

Table 11. Percentage distribution of the highest postsecondary degree, the number of college credits completed in calculus and advanced mathematics, and the number of postsecondary remedial mathematics courses taken by 1992 12th-graders, by highest level of mathematics completed in high school: 1992-2000
Highest postsecondary degree Highest high school Incomplete Graduate math course None Certificate Associate’s Bachelor’s graduate degree degree
Calculus 13.3 (1.83) 0.3 (0.20) 3.7 (1.96) 49.3 (2.64) 16.6 (1.46) 16.8 (1.90) Precalculus 19.0 (2.28) 0.9 (0.35) 5.2 (0.81) 51.5 (2.61) 12.9 (1.43) 10.5 (1.65) Trigonometry 29.7 (3.07) 2.6 (0.53) 5.6 (1.13) 45.7 (3.36) 9.2 (1.28) 7.2 (1.38) Algebra 2 42.5 (2.39) 6.1 (1.78) ll.l(l.19) 31.5 (2.11) 5.7 (0.69) 3.1 (0.40) Geometry 55.0 (3.1 1) 9.0 (1.71) 13.8(2.23) 17.1 (2.02) 3.9 (0.90) 1.2 (0.48) Algebra 1 67.0(3.11) 11.8 (1.86) 11.0 (1.71) 8.3 (2.02) 1.2 (0.45) 0.7 (0.51) Less than algebra 1 68.9 (4.75) 18.1 (3.60) 8.9 (3.03) 3.8 (1.51) 0.3 (0.29) #
Highest high school Number of college credits in calculus and advanced math math course None 1-4 5-12 13 or more
Calculus 35.2 (2.52) 25.2 (2.49) 19.8 (1.77) 19.8 (1.91) Precalculus 61.8 (2.40) 20.5 (1 32) 10.5 (1.26) 7.2 (1.66) Trigonometry 73.7 (2.58) 13.6 (1.80) 7.6 (1.67) 5.0 (1.41) Algebra 2 89.0 (1.07) 7.2 (0.78) 2.2 (0.45) 1.5 (0.58) Geometry 95.3 (0.82) 2.8 (0.58) 1.5 (0.46) 0.4 (0.21)
Less than algebra 1 97.5 (1.30) 0.6 (0.61) 1.1 (0.75) 0.9 (0.86) Algebra 1 98.3 (0.53) 1.2 (0.47) 0.5 (0.25) #
Highest high school math course None One PJvo Mors than two
Number of remedial math courses
Calculus 99.3 (0.30) 0.7 (0.30) # # Precalculus 91.9 (1.96) 6.1 (1.74) 1.8 (0.97) 0. l(O.10) Trigonometry 84.1 (2.44) 10.8 (1.97) 3.7 (1.34) 1.4 (0.57) Algebra 2 68.4 (2.59) 21.7 (2.51) 6.2 (0.89) 3.7 (0.88) Geometry 50.2 (3.13) 25.7 (2.72) 1 1.2 (1.52) 12.8 (3.13) Algebra 1 46.7 (3.92) 24.4 (2.79) 14.9 (2.27) 14.0 (2.33) Less than algebra 1 35.8 (5.05) 22.3 (3.99) 22.4 (7.55) 19.5 (3.91)
#Rounds to zero.
NOTE: The universe consists of all known postsecondary participants for whom the highest level of mathematics completed in high school could be determined. Weighted N=2.0 million. Detail may not sum to totals because of rounding. Standard errors appear in parentheses.
SOURCE: U.S. Department of Education, National Center for Education Statistics, National Education Longitudinal Study of 1988 (NELS:88/92/2000): “Second Follow-up, High School Transcript Study, 1992”; and “Fourth Follow-up, Postsecondary Education Transcript Study (PETS), 2000.”
19 31 BESTCOPY AVAILABLE

Table 12. Mean number of computer science and computer-related credits earned by 1992 12th-graders who earned bachelor’s degrees, by major/field of study: 1992-2000
Mean number of credits earned All computer science anq
Undergraduate majodfield of study Computer science computer-related
Business 1.3 (0.17) 6.4 (0.29)
Education 0.4 (0.08) 2.7 (0.17)
Engineering 4.7 (0.56) 6.7 (0.69)
Physical sciences 2.3 (0.78) 2.6 (0.85)
Math and computer science 25.9 (2.75) 32.3 (2.41)
Life sciences 0.6 (0.1 1) 1.5 (0.14)
Health sciences and services2 0.5 (0.10) 1.9 (0.15)
Humanities 0.5 (0.13) 1.6 (0.19)
Fine and performing arts 0.4 (0.11) 2.3 (0.40)
Social sciences 0.7 (0.08) 2.2 (0.16)
Applied social sciences3 0.5 (0.13) 2.3 (0.19)
‘Computer applications courses (as distinct from computer science) include management and accounting information systems, office software packages, statistical software, graphics/design/desktop publishing software, and discipline-specific applications.
’“Health sciences and services” includes nursing, allied health, physical therapy, etc.
Applied social sciences” includes communications, clinicalkounseling psychology, recreation and leisure 3 r r
studies, public administration, criminal justice, social work, humadcommunity services, child study, and family and community studies.
Other” includes business and medical office support, communications technologies, generaYlibera1 studies, theology, Bible studies, air transportation, and culinary arts.
NOTE: The universe consists of all who earned bachelor’s degrees. Weighted N=0.9 million. Detail may not sum to totals because of rounding. Standard errors appear in parentheses.
SOURCE: U S . Department of Education, National Center for Education Statistics, National Education Longitudinal Study of 1988 (NELS:88/2000), “Fourth Follow-up, Postsecondary Education Transcript Study (PETS), 2000.”
4“
20 32

Table 13. Mean number of foreign language and international studies credits earned by 1992 12th-graders who earned bachelor’s degrees, by major/field of study: 1992-2000
Credits earned Undergraduate major/ Foreign language’ Foreign language’ an! field of study only international studies
Business
Education
Engineering
Physical sciences
Math and computer science
Life sciences
Health sciences and services’
Humanities
Fine and performing arts
Social sciences
Applied social sciences4
3.5
3.2
1.6
6.3
3.0
4.7
2.4
16.3
4.5
7.8
5.8
(0.30)
(0.33)
(0.46)
(2.05)
(0.57)
(0.42)
(0.32)
(2.80)
(0.43)
(0.42)
(0.66)
( 1 .OO)
6.0
3.9
2.4
7.4
4.0
5.7
2.8
20.0
5.4
12.5
7.1
6.2
(0.37)
(0.35)
(0.46)
(1.89)
(0.65)
(0.49)
(0.36)
(4.02)
(0.54)
(0.65)
(0.73)
’Foreign language credits include all languages other than English at all levels (introductory, intermediate, advanced, literature).
*International studies credits include those in all area studies, international business/marketing/agriculture/ - economicsfiaw/environment/communication, national security studies, geography of world issues, diplomacy, international relations, international political economy, and others.
“‘Health sciences and services” includes nursing, allied health, physical therapy, etc.
‘“Applied social sciences” includes communications, clinicallcounseling psychology, recreation and leisure studies, public administration, criminal justice, social work, humadcommunity services, child study, and family and community studies.
’“Other” includes business and medical office support, communications technologies, generaVliberal studies, theology, Bible studies, air transportation, and culinary arts.
NOTE: The universe consists of all who earned bachelor’s degrees. Weighted N=0.9 million. Detail may not sum to totals because of rounding. Standard errors appear in parentheses.
SOURCE: U.S. Department of Education, National Center for Education Statistics, National Education Longitudinal Study of 1988 (NELS:88/2000), “Fourth Follow-up, Postsecondary Education Transcript Study (PETS), 2000.”
21 33

Table 14. Percentage distribution of postsecondary attainment by 1992 12th-graders who became postsecondary students on the engineering path, by sex: 1992-2000
Outcome on engineering path Total Male Female
Total students who started on engineering path
Threshold courses only or still enrolled in engineering or architecture program in 2000
Beyond threshold; switched to other science/technology field
Beyond threshold; switched to nonscience/technology field
Earned bachelor’s in engineering, engineering technology, or architecture; continued to graduate school
Earned bachelor’s in engineering, engineering technology, or architecture; no graduate school
Pre-engineering in less-than-4-year institution; stopped with associate’s degree
100.0
22.3 (2.93)
5.9 (1.51)
2.9 (1.34)
9.3 (1.66)
36.8 (3.36)
11.6 (2.51)
100.0
22.7 (3.18)
6.2 (1.77)
3.2 (1.60)
9.4 (1 .90)
32.9 (3.44)
12.5 (2.94)
13.1 (2.38)
100.0
20.1 (7.41)
4.5 (1.90)
1.8 (1.30)
8.7 (2.80)
55.1 (8.36)
7.2 (3.24)
Pre-engineering in less-than-4-year institution; stopped without associate’s degree 11.3 (1.99) , , 2.6 (1.36)
NOTE: The universe consists of (1) those students who crossed the threshold of the engineering path (with earned credits in precalculus or higher math, the introductory engineering design course and/or introduction to an engineering subfield, and computer applications in engineering and/or engineering graphics/computer-assisted design [CAD]), and attended a 4-year college; and (2) those who pursued a pre-engineering curriculum in 2-year colleges only and who earned credits in college algebra or a higher level of mathematics. Weighted N=0.2 million. Detail may not sum to totals because of rounding. Standard errors appear in parentheses. For elaboration of each level of the engineering path, see Adelman, C. (1998). Men and Women of the Engineering Path: A Model for Analyses of Undergraduate Careers. Washington, DC: U S . Department of Education and National Institute for Science Education.
SOURCE: U.S. Department of Education, National Center for Education Statistics, National Education Longitudinal Study of 1988 (NELS:88/92/2000): “Second Follow-up, High School Transcript File, 1992”; and “Fourth Follow-up, “Postsecondary Education Transcript Study (PETS), 2000.”
34 22

Table 15. Bachelor’s degree attainment for 1992 12th-graders who became postsecondary students on the engineering path in 4-year colleges, by sex: 1992-2000
Students who reached the threshold level of the engineering path
Total Male Female
Did not earn bachelor’s degree 14.4 (3.08) 16.1 (3.69) 7.8 (3.04)
Earned bachelor’s in engineering/ engineering technology/architecture 58.8 (3.78) 55.8 (4.15) 70.5 (8.55)
Earned bachelor’s in another science/ technology field 12.5 (2.13) 13.8 (2.52) 7.5 (2.71)
Earned bachelor’s in a nonscience field 14.3 (2.84) 14.4 (2.96) 14.2 (8.09)
NOTE: The universe consists of (1) those students who crossed the threshold of the engineering path (with earned credits in precalculus or higher math, the introductory engineering design course and/or introduction to an engineering subfield, and computer applications in engineering and/or engineering graphics/computer-assisted design [CAD]); and (2) those who attended a 4-year college. Weighted N=123,000; men=98,000; women=25,000. Detail may not sum to total because of rounding. Standard errors appear in parentheses.
SOURCE: U.S. Department of Education, National Center for Education Statistics, National Education Longitudinal Study of 1988 (NELS:88/92/2000): “Second Follow-up, High School Transcript File, 1992”; and “Fourth Follow-up, Postsecondary Education Transcript Study (PETS), 2000.”
35 23

Section IV: Postsecondary Academic Performance
Postsecondary academic performance is represented through a variety of metrics in the NELS:88/2000 Postsecondary Transcript Files. The metrics include the following:
degrees earned, and, for each degree (including no degree), the characteristics of the institution attended (Carnegie type, aggregate Carnegie type, selectivity, special mission). earned additive credits (undergraduate credits, postbaccalaureate/graduate credits, credits by examination, credits earned in the first calendar year of attendance, and others). ratios of earned to attempted credits. grade point averages (GPAs), both general undergraduate (by institutional selectivity and special mission) and in specific curricular areas (e.g., engineering, history, statistics, education). Analysts can also create variables describing trends in GPA within a student’s career by using markers for GPA after 1 calendar year of attendance, after 2 calendar years, and so forth. Such markers are useful for event-history renderings of student progress (e.g., see DesJardins, McCall, Ahlburg, and Moye 2002). the nature and extent of remediation in postsecondary contexts. Since most institutions do not award additive credits for remedial work, the remediation variables are presented in terms of numbers of courses taken (in reading, mathematics, and total) and by a ratio of the number of remedial courses to the number of all courses in which the student enrolled.
0
0
Table 16 presents undergraduate GPA by postsecondary attainment. In general, the higher the student’s attainment, the higher the GPA (certificates, most of which are awarded in short-term occupational programs, are an exception to this hypothesis). In addition, at the levels of a bachelor’s degree or higher, an associate’s degree, and no degree but more than 60 earned credits, women’s GPAs were higher than those of men. Table 16 also presents GPA by the general selectivity level14 of the student’s first institution of attendance. While the first institution of attendance is not necessarily the student’s only or final institution of attendance, excluding the “not-ratable’’ category, those who started in “selective” or “highly selective” institutions had higher undergraduate GPAs than those who started in less selective institutions
Table 17 includes the total nixnher nf remedial courses ir? the student’s record reported by three benchmarks. The first benchmark is a rendition of attainment first by credentials earned and then, for those who earned no credentials, by number of credits earned. Those who earned at least a bachelor’s degree took fewer remedial courses than those who did not.
The second benchmark in table 17 refers back to the academic intensity and quality of the student’s high school curriculum, a metric set forth as “Academic Intensity Quintile” (see appendix B, section 10, for a description of the academic intensity of the high school curriculum). Those in the highest quintile of secondary school coursework were less likely to take remedial courses in college. Lastly, table 17 accounts for the extent of remedial work by the type of institution first attended by the student: the community college delivers remedial coursework to a higher proportion of incoming students (61 percent) than other types of institutions.
‘’ITh. . e institutional selectivity variable, used in NCES postsecondary transcript studies since the NLS:72, is a very broad measure, which is based on the selectivity cell clusters of the Cooperative Institutional Research Project’s annual publication The American Freshman. Open-door institutions consist principally of community colleges. “Not-ratable” institutions include specialized schools in admusiddrama, theological seminaries, and nearly all sub-baccalaureate institutions awarding less than the associate’s degree.
25 36

Tables 18-20 focus on three indicators of performance during the student's first full calendar year of postsecondary attendance: credits earned (table l8), the ratio of credits earned to credits attempted (table 19), and GPA quintiles (table 20).15 Each of these indicators is set out in terms of three core measures of high school performance: curriculum, class ranWGPA, and test score.I6
In all three tables, the ranges that show relationships between the dependent and independent variables are at the extremes: high and low (no differences were detected elsewhere). In table 18, for example, there is a positive relationship between all three indicators and the highest number of credits earned (30 or more) during the first year of study, but the relationship between the quintile indicators and lower numbers of credits earned is less clear. In table 19, the High School Class RanWGPA Quintile shows a relationship between the percentage of credits earned to credits attempted during the first year of study, but only at the lowest range of the ratio (0-10 percent). In table 20, the Senior Test Score Quintile shows a relationship to first-year GPA only for the lowest quintile. To clarify the complex relationships between these core measures of high school performance, first-year postsecondary performance indicators, and degree completion requires multivariate analyses that lie beyond the scope and purposes of this document.
"The dividing lines for the GPA quintiles are (in ascending order): 2.0,2.49,2.92, and 3.33.
"NELS students, like their longitudinal studies predecessors in the NLS:72 and HS&B cohorts, were given a 90-minute test of general learned abilities in the 12th grade. For those who took the exam, scores were first arrayed in percentiles. Then, for those who did not take the exam but who took either the SAT or ACT, the SAT and ACT scores were first equated by the equipercentile concordance method suggested by ACT, and then converted to senior test percentiles using the same approach. In this manner, 74 percent of those in the NELS:88/2000 Postsecondary Transcript Files wound up with a senior test score indicator.
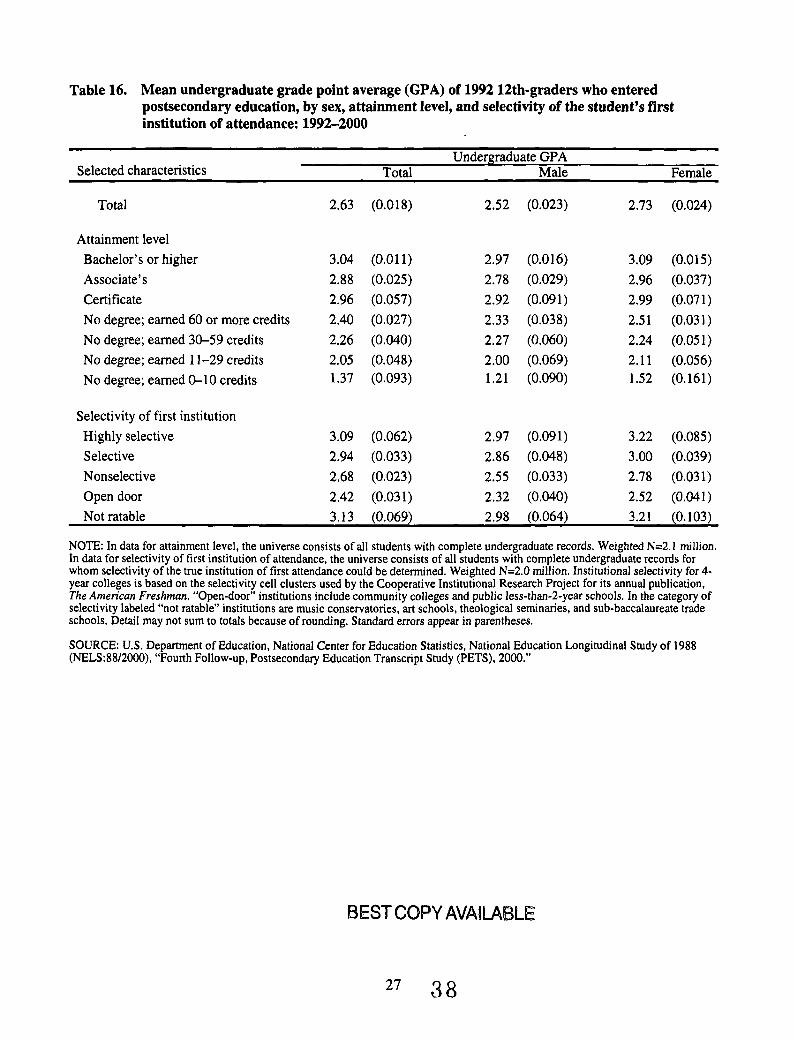
Table 16. Mean undergraduate grade point average (GPA) of 1992 12th-graders who entered postsecondary education, by sex, attainment level, and selectivity of the student’s first institution of attendance: 1992-2000
Undergraduate GPA Selected characteristics Total Male Female
Total 2.63 (0.018) 2.52 (0.023) 2.73 (0.024)
Attainment level Bachelor’s or higher 3.04 (0.011) 2.97 (0.016) 3.09 (0.015) Associate’s 2.88 (0.025) 2.78 (0.029) 2.96 (0.037) Certificate 2.96 (0.057) 2.92 (0.091) 2.99 (0.071) No degree; earned 60 or more credits 2.40 (0.027) 2.33 (0.038) 2.51 (0.031) No degree; earned 30-59 credits 2.26 (0.040) 2.27 (0.060) 2.24 (0.051) No degree; earned 11-29 credits 2.05 (0.048) 2.00 (0.069) 2.11 (0.056) No degree; earned 0-10 credits 1.37 (0.093) 1.21 (0.090) 1.52 (0.161)
Selectivity of first institution Highly selective 3.09 (0.062) 2.97 (0.091) 3.22 (0.085)
3.00 (0.039) Selective 2.94 (0.033) 2.86 (0.048) Nonselective 2.68 (0.023) 2.55 (0.033) 2.78 (0.031) Open door 2.42 (0.031) 2.32 (0.040) 2.52 (0.041) Not ratable 3.13 (0.069) 2.98 (0.064) 3.21 (0.103)
NOTE: In data for attainment level, the universe consists of all students with complete undergraduate records. Weighted N=2.1 miilion. In data for selectivity of first institution of attendance, the universe consists of all students with complete undergraduate records for whom selectivity of the true institution of first attendance could be determined. Weighted N=2.0 million. Institutional selectivity for 4- year colleges is based on the selectivity cell clusters used by the Cooperative Institutional Research Project for its annual publication, The American Freshman. “Open-door” institutions include community colleges and public less-than-2-year schools. In the category of selectivity labeled “not ratable” institutions are music conservatories, art schools, theological seminaries, and sub-baccalaureate trade schools. Detail may not sum to totals because of rounding. Standard errors appear in parentheses.
SOURCE: U.S. Department of Education, National Center for Education Statistics, National Education Longitudinal Study of 1988 (NELS:88/2000), “Fourth Follow-up, Postsecondary Education Transcript Study (PETS), 2000.”
27 38

Table 17. Percentage distribution of the number of remedial courses taken after entering postsecondary education by 1992 12th-ga-aders, by attainment, high school academic curriculum intensity, and true institution of first postsecondary attendance: 1992-2000
Number of remedial courses taken Selected characteristics None One Two or three Four or more
Total 59.9 (1.34) 15.8 (0.97) 15.3 (0.93) 9.0 (0.89)
Postsecondary attainment Bachelor’s or higher 77.5 (1.17) 12.3 (0.94) 7.8 (0.72) 2.4 (0.37) Associate’s 47.9 (3.18) 18.4 (1.75) 21.3 (2.81) 12.4 (2.16) Certificate 46.9 (4.46) 18.5 (3.23) 21.6 (3.62) 13.0 (2.49)
30-59 credits; no degree 49.5 (3.17) 17.5 (1.90) 19.4 (2.34) 13.6 (2.14) 11-29 credits; no degree 36.0 (2.66) 20.7 (2.59) 24.1 (2.70) 19.2 (3.00) 0-10 credits; no degree 39.2 (2.99) 19.4 (2.24) 27.5 (2.97) 13.9 (2.09)
60 or more credits; no degree 49.3 (2.76) 17.9 (1.85) 17.4 (1.76) 15.4 (3.13)
High school academic intensity Highest quintile 85.3 (1.67) 9.8 (1.52) 3.6 (0.64) 1.2 (0.56) 2nd quintile 64.1 (3.22) 16.3 (2.25) 14.2 (2.60) 5.4 (1.92)
4th quintile 46.7 (3.26) 16.2 (1.57) 23.0 (2.21) 14.1 (2.59) Lowest quintile 33.2 (2.77) 20.8 (2.01) 26.4 (2.83) 19.5 (2.57)
3rd quintile 46.0 (2.23) 19.8 (1.42) 19.8 (1.62) 14.3 (1.93)
True institution of first attendance’ 10.5 (0.82) 6.6 (0.83) 2.1 (0.58) Doctoral 80.8 (1.29)
Other 4-year 70.3 (1.45) 14.0 (1.05) 10.1 (0.82) 5.6 (0.93) Community college 38.8 (1.63) 20.5 (1.33) 24.0 (1.38) 16.7 (1.43) Other sub-baccalaureate* 52.7 (3.85) 17.5 (2.57) 21.7 (3.64) 8.1 (2.44)
‘True institution of first attendance excludes postsecondary institutions attended while the student was still in high school, institutions attended in the summer between high school graduation and fall semester entry (unless the institution was the same for both periods), and “false starts” (i.e., when the student withdraws from the ostensible first postsecondary institution in the first term of attendance but enrolls in another institution without withdrawal at a later date).
Other sub-baccalaureate” includes 2-year institutions other than community colleges and nondegree-granting schools. 2“
NOTE: The universe consists of all 1992 12th-graders who became postsecondary participants (weighted N=l.99 million). For students whose first institution of attendance could be determined, weighted N=1.97 million. Detail may not sum to totals because of rounding. Standard errors appear in parentheses. For elaboration of high school Academic Intensity Quintile, see appendix B, section 10.
SOURCE: U.S. Department of Education, National Center for Education Statistics, National Education Longitudinal Study of 1988 (NELS:88/92/2000): “Second Follow-up, High School Transcript Study, 1992”; and “Fourth Follow-up, Postsecondary Education Transcript Study (PETS), 2000.”
39 28

Table 18. Percentage distribution of credits earned by 1992 12th-graders in the first year of their postsecondary schooling, by high school background performance indicators: 1992-2000
Number of credits earned’ Performance indicators None 1-10 11-20 21-29 30 or more
Total 5.3 (0.63) 14.1 (0.89) 19.7 (1.17) 30.3 (1.04) 30.6 (1.05)
High school academic intensity Highest quintile 1 .O (0.34) 3.6 (0.65) 9.0 (1.49) 35.8 (1.80) 50.6 (1.97) 2nd quintile 2.8 (0.76) 11.3 (2.39) 19.0 (3.21) 35.2 (2.56) 31.8 (2.06)
20.0 (1.48) 3rd quintile 7.1 (1.32) 20.6 (1 36) 24.1 (1.67) 28.3 (1.90) 4th quintile 10.4 (2.60) 19.3 (1.98) 26.4 (2.90) 23.4 (2.06) 20.5 (2.80) Lowest quintile 9.8 (1.48) 27.2 (2.48) 28.2 (2.89) 20.4 (2.33) 14.4 (2.07)
High school class rank/GPA Highest quintile 0.7 (0.30) 2.7 (0.72) 7.0 (1 .OO) 35 .O (1.96) 54.7 (2.16) 2nd quintile 1.6 (0.40) 7.7 (1.48) 17.2 (1.89) 39.6 (2.47) 33.9 (2.09) 3d quintile 3.6 (0.75) 14.8 (1.39) 26.5 (2.88) 31.3 (2.11) 23.9 (1.99) 4th quintile 8.5 ( I .72) 23.3 (3.14) 28.8 (3.72) 25.0 (2.26) 14.4 (1.59) Lowest quintile 17.8 (3.47) 32.7 (3.00) 22.9 (2.19) 16.2 (1.79) 10.4 (1.35)
Senior test score Highest quintile 1.6 (0.49) 5.6 (1.17) 9.1 (1.26) 33.0 (2.06) 50.7 (1.99) 2nd quintile 5.8 (1.98) 11.1 (1.46) 15.2 (1.35) 34.9 (1.93) 33.1 (1.97) 3rd quintile 5.2 (0.81) 12.2 (1.71) 3 1.4 (3.86) 29.8 (2.42) 2 1.4 (2.47)
17.1 (2.25) 4th quintile 5.6 (1.11) 20.6 (1 $7) 26.2 (2.34) 30.5 (2.50) 35.7 (5.18) 28.9 (3.63) 12.5 (1.92) 9.8 (2.00) Lowest quintile 13.0 (2.87)
’The first year of postsecondary schooling consists of the 1 I-month period following the first-term date at the student’s true institution of first attendance. “True institution of first attendance” excludes postsecondary institutions attended while the student was still in high school, institutions attended in the summer between high school graduation and fall semester entry (unless the institution was the same for both periods), and “false starts” (i.e., when the student withdraws without earning any additive credits from the ostensible first postsecondary institution in the first term of attendance but enrolls in another institution and earns credits at that institution at a later date).
NOTE: The universe consists of all 1992 12th-graders who became postsecondary participants and for whom first-year credits could be determined. Weighted N=l.99 million. Detail may not sum to totals because of rounding. Standard errors appear in parentheses. For definitions and elaborations of high school Academic Intensity Quintile and high school Class Rank/GPA Quintile, see appendix B, section 10.
SOURCE: U.S. Department of Education, National Center for Education Statistics, National Education Longitudinal Study of 1988 (NELS:88/92/2000): “Second Follow-up, High School Transcript Study, 1992”; and “Fourth Follow-up, “Postsecondary Education Transcript Study (PETS), 2000.”
29

Table 19. Percentage of postsecondary credits earned to credits attempted by 1992 12th-graders in their first postsecondary year, by high school background performance indicators: 1992-2000
Percentage of credits earned to those attempted’ 91-100
Performance indicators 0-10 percent 11-50 percent 51-75 percent 76-90 percent percent
Total 5.6 (0.63) 7.1 (0.70) 8.8 (0.70) 16.0 (0.73) 62.5 (1.16)
High school academic intensity Highest quintile 1.1 (0.35) 2.2 (0.40) 4.6 (0.76) 14.1 (1.12) 78.0 (1 3) 2nd quintile 3.0 (0.76) 6.3 (2.12) 8.9 (2.23) 15.1 (1.48) 66.7 (2.81) 3rd quintile 7.3 (1.32) 10.8 (1.63) 10.2 (1.15) 18.0 (1.36) 53.7 (2.17) 4th quintile 10.8 (2.59) 8.8 (1.32) 10.7 (1.23) 17.2 (2.07) 52.4 (2.98) Lowest quintile 10.1 (1.50) 11.9 (1.73) 13.4 (1.87) 16.9 (2.88) 47.6 (3.01)
High school class ranWGPA Highest quintile 0.8 (0.31) 1.8 (0.69) 3.5 (0.58) 2nd quintile 1.7 (0.40) 4.9 (1 SO) 9.3 (2.52) 3rd quintile 3.9 (0.76) 6.6 (0.98) 10.8 (1.20) 4th quintile 8.9 (1.72) 11.6 (2.78) 10.6 (1.67) Lowest quintile
2.7 (1.35) 8 1.2 (1 S7) 6.6 (1.34) 67.5 (2.55) 9.6 (1.96) 59.0 (2.40) 8.9 (1.97) 50.0 (3.43)
18.3 (3.45) 15.2 (2.22) 13.3 (1.76) 13.0 (1.67) 39.9 (2.98)
Senior test score Highest quintile 1.7 (0.50) 4.2 (1.14) 6.5 (1.97) 13.5 (1.27) 74.0 (2.22) 2nd quintile 6.0 (1.98) 6.0 (1.17) 7.6 (0.81) 16.9 (1.26) 63.4 (2.11) 3rd quintile 5.4 (0.82) 5.2 (0.91) 10.3 (1.47) 17.3 (1.92) 61.8 (2.74) 4th quintile 6.0 (1.13) 9.0 (1.21) 11.2 (1.57) 18.0 (1.86) 55.8 (2.70) Lowest quintile 13.5 (2.87) 21.1 (5.28) 10.9 (1.82) 17.2 (2.91) 37.3 (3.74)
‘The first postsecondary year consists of the 1 1-month period following the first-term date at the student’s true institution of first attendance. ‘True institution of first institution” excludes postsecondary institutions attended while the student was still in high school, institutions attended in the summer between high school graduation and fall semester entry (unless the institution was the same for both periods), and “false starts” (i.e., when the student withdraws without earning any additive credits from the ostensible first postsecondary institution in the first term of attendance but enrolls in another institution and earns credits at that institution at a later date).
NOTE: The universe consists of all 1992 12th-graders for whom a true first date of postsecondary attendance could be determined and who attempted any credits within the calendar year following that date. Weighted N=l.98 million. Detail may not sum to totals because of rounding. Standard errors appear in parentheses. For elaboration of high school Academic Intensity Quintile and high school Class RanIdGPA Quintile, see appendix B, section 10.
SOURCE: US. Department of Education, National Center for Education Statistics, National Education Longitudinal Study of 1988 (NELS:88/92/2000): “Second Follow-up, High School Transcript Survey, 1992”; and “Fourth Follow-up, “Postsecondary Education Transcript Study (PETS), 2000.”
BESTCOPY AVAILABLE
41 30

Table 20. Percentage distribution of first-postsecondary-year grade point average (GPA) of 1992 12th- graders, by high school background performance indicators: 1992-2000
First-year GPA, in quintiles’ Performance indicators Highest quintile 2nd quintile 3rd quintile 4th quintile Lowest quintile
Total
High school academic intensity Highest quintile 2nd quintile 3rd quintile 4th quintile Lowest quintile
High school class rank/GPA Highest quintile 2nd quintile 3rd quintile 4th quintile Lowest quintile
Senior test score Highest quintile 2nd quintile 3rd quintile 4th quintile Lowest auintile
20.1 (0.81)
29.0 (1.71) 19.7 (1.75) 12.6 (1.14) 16.9 (1.93) 16.2 (2.26)
39.5 (1.97) 17.0 (1.39) 12.9 (1.49) 10.5 (1.70) 10.5 (2.10)
35.4 (1.78) 16.7 (1.49) 13.3 (1.66) 10.3 (1.34) 9.1 (2.14)
19.7 (1.00) 22.4 (1.13)
21.4 (1.70) 23.6 (1.89) 21.4 (2.53) 22.7 (2.48) 18.1 (1.83) 21.4 (1.63) 16.7 (1.91) 23.9 (3.68) 18.9 (2.55) 17.1 (3.08)
25.7 (1.87) 17.9 (1.43) 20.9 (1.71) 29.2 (2.80) 15.8 (1.63) 27.3 (2.89) 16.6 (2.54) 18.8 (2.41) 11.6 (1.68) 15.0 (1.57)
23.8 (1.70) 19.5 (2.07) 21.1 (1.51) 21.9 (1.65) 16.2 (3.01) 29.9 (3.35) 17.7 (2.11) 22.9 (2.64) 10.4 (2.41) 15.6 (2.54)
19.6 (0.96)
15.4 (1.35) 19.9 (2.60) 22.5 (1.75) 20.8 (2.03) 22.7 (2.65)
10.5 (1.27) 18.4 (1.67) 24.7 (1.87) 27.2 (3.75) 24.4 (2.82)
1 1 .O (1.06) 21.1 (1.55) 23.5 (3.12) 24.2 (2.20)
18.2 (0.93)
10.6 (1.11) 16.3 (2.33) 25.4 (2.04) 21.8 (2.07) 25.1 (2.57)
6.5 (1.10) 14.5 (1.82) 19.2 (1.52) 26.9 (3.24) 38.5 (3.08)
10.3 (1.38)
17.2 (1.64) 24.9 (2.23)
18.2 (1.65).
\- I ,- I , 22.7 (2.96) 42.2 (5.20)
‘The first postsecondary year consists of the 1 1-month period following the first-term date at the student’s true institution of first attendance. ‘True institution of first attendance” excludes postsecondary institutions attended while the student was still in high school, institutions attended in the summer between high school graduation and fall semester entry (unless the institution was the same for both periods), and “false starts” (Lee, when the student withdraws without earning additive credits from the ostensible first postsecondary institution in the first term of attendance but enrolls in another institution and earns additive credits at that institution at a later date).
NOTE: The universe consists of all 1992 12th-graders for whom a true first date of postsecondary attendance could be determined and who attempted any credits within the calendar year following that date. Weighted N=l.98 million. Detail may not sum to totals because of rounding. Standard errors appear in parentheses. For elaboration on high school Academic Intensity Quintile and high school Class Rank/GPA Quintile, see appendix B, section 10.
SOURCE: U.S. Department of Education, National Center for Education Statistics, National Education Longitudinal Study of 1988 (NELS:88/92/2000): “Second Follow-up, High School Transcript Study, 1992”; and “Fourth Follow-up, Postsecondary Education Transcript Study (PETS), 2000.”
BESTCOPY AVAILABLE
42 31
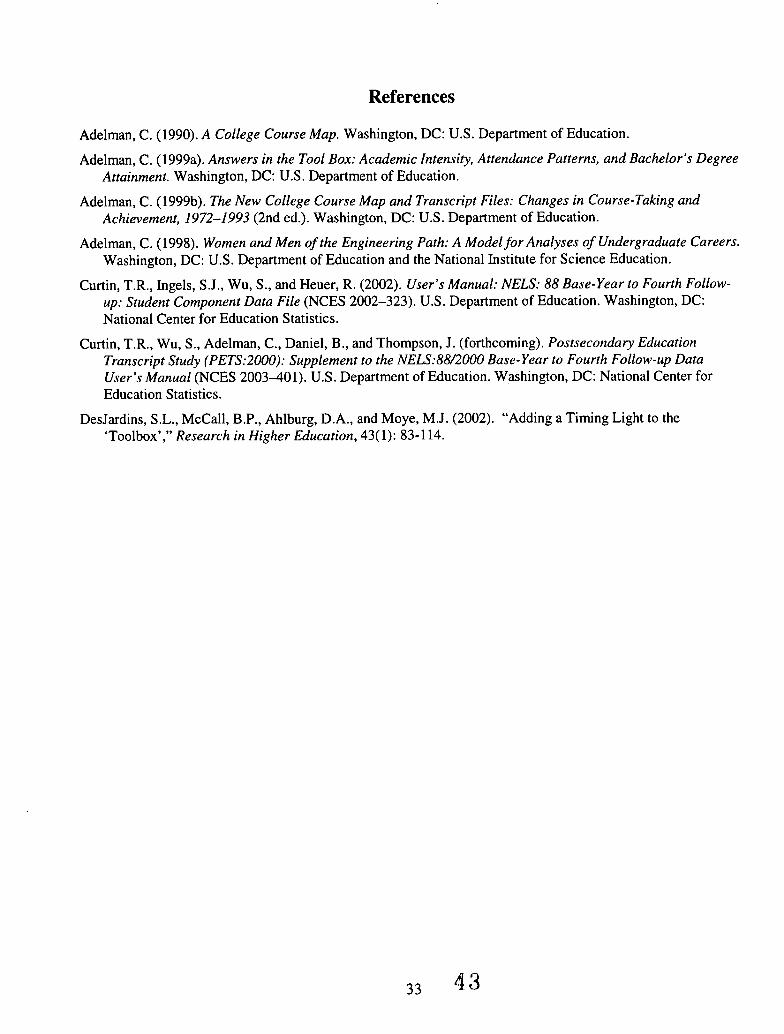
References
Adelman, C. (1990). A College Course Map. Washington, DC: U.S. Department of Education.
Adelman, C. (1999a). Answers in the Tool Box: Academic Intensity, Attendance Patterns, and Bachelor’s Degree Attainment. Washington, DC: U.S. Department of Education.
Adelman, C. (1999b). The New College Course Map and Transcript Files: Changes in Course-Taking and Achievement, 1972-1993 (2nd ed.). Washington, DC: U.S. Department of Education.
Adelman, C. (1998). Women and Men of the Engineering Path: A Model for Analyses of Undergraduate Careers. Washington, DC: U.S. Department of Education and the National Institute for Science Education.
Curtin, T.R., Ingels, S.J., Wu, S . , and Heuer, R. (2002). User’s Manual: NELS: 88 Base-Year to Fourth Follow- up: Student Component Data File (NCES 2002-323). U.S. Department of Education. Washington, DC: National Center for Education Statistics.
Transcript Study (PETS:2000): Supplement to the NELS:88/2000 Base-Year to Fourth Follow-up Data User’s Manual (NCES 2003-401). U.S. Department of Education. Washington, DC: National Center for Education Statistics.
Curtin, T.R., Wu, S . , Adelman, C., Daniel, B., and Thompson, J. (forthcoming). Postsecondary Education
DesJardins, S.L., McCall, B.P., Ahlburg, D.A., and Moye, M.J. (2002). “Adding a Timing Light to the ‘Toolbox’,” Research in Higher Education, 43( 1): 83-1 14.
33 4 3

Appendix A: Summary Tables
35 4 4

Table A-1. Percentage distribution of the universes used in this E.D. Tabs, by selected characteristics of 12th-graders: 1992-2000
All likely Earned more Earned more than 10 All known postsecondary than 10 credits and any credits postsecondary
Selected characteristics participants’ credits2 from 4-year colleges3 participants4
Race/ethnicity’ White 74.0 (1.28) 76.1 (1.28) 78.4 (1.18) 74.1 (1.32) Black 10.6 (0.91) 9.6 (0.89) 8.7 (0.87) 10.5 (0.91) HispanicLatino 9.4 (0.86) 8.5 (0.85) 6.8 (0.71) 9.4 (0.89) AsianPacific Islander 5.0 (0.45) 5.1 (0.46) 5.6 (0.54) 5.1 (0.48) American IndiadAlaska Native 0.9 (0.25) 0.7 (0.18) 0.4 (0.11) 0.9 (0.26)
Sex Male Female
47.3 (0.87) 46.9 (0.97) 46.8 (1.06) 47.2 (0.92) 52.7 (0.87) 53.1 (0.97) 53.2 (1.06) 52.8 (0.92)
Socioeconomic status quintile 81 st-100th percentile (high) 28.6 (1.06) 32.2 (1.16) 39.4 (1.29) 29.4 (1.09) 61 st-80th percentile 24.7 (0.78) 25.4 (0.89) 26.1 (0.99) 25.1 (0.85) 41 st-60th percentile 20.6 (0.76) 19.2 (0.74) 17.5 (0.79) 20.2 (0.73) 2 1 st-40th percentile 15.8 (0.60) 14.3 (0.63) 11.4 (0.63) 15.6 (0.62) 1 st-20th percentile (low) 10.2 (0.69) 8.9 (0.69) 5.6 (0.50) 9.7 (0.73)
‘Universe used for table 1: “All likely postsecondary participants” include (1) those for whom transcripts were received, and (2) those for whom transcripts were requested but not received and for whom other evidence in the NELS files supports the student’s report of postsecondary attendance. Weighted N=l.9 million.
’Universe used for table 2: The criterion of more than 10 credits excludes incidental students. Evidence for credits earned comes from received transcripts. Weighted N=l.8 million.
3Universe used for table 3: The criterion of more than 10 credits excludes incidental students. Evidence for credits earned comes from received transcripts. Weighted N=l.4 million.
4Universe used for tables 4 and 8: The universe consists of all known postsecondary participants. Weighted N=2.0 million.
’Race categories exclude Hispanic origin unless specified.
NOTE: Detail may not sum to totals because of rounding. Standard errors appear in parentheses.
SOURCE: U.S. Department of Education, National Center for Education Statistics, National Education Longitudinal Study of 1988 (NELS:88/2000), “Fourth Follow-up, Postsecondary Education Transcript Study (PETS), 2000.”
37 45

Table A-2. Percentage distribution of 1992 12th-graders who earned more than 10 postsecondary credits, by type of postsecondary institution(s) attended: 1992-2000
~ ~~ ~~ ~ ~~~~~
Type of institution(s) attended All students
Total 100.0
4-year only 42.7 (1.16)
4-year then 2-year 4.7 (0.46)
2-year then 4-year 12.3 (0.69)
Alternating 214-year 7.5 (0.59)
4-year with incidental 2-year 7.4 (0.56)
4-year and sub-baccalaureate’ 0.9 (0.20)
2-year only 20.7 (0.92)
2-year and sub-baccalaureate’ 1.3 (0.16)
Sub-baccalaureate only’ 1.5 (0.22)
4-year, 2-year, and sub-baccalaureate’ 0.8 (0.18)
“‘Sub-baccalaureate” indicates nondegree-granting institutions (principally proprietary and public vocational schools).
NOTE: Universe used for table 10: Consists of all students who earned more than 10 credits and for whom summer-term information was available. Weighted N=l.8 million. Detail may not sum to totals because of rounding. Standard errors appear in parentheses.
SOURCE: U.S. Department of Education, National Center for Education Statistics, National Education Longitudinal Study of 1988 (NELS:88/2000), “Fourth Follow-up, Postsecondary Education Transcript Study (PETS), 2000.”
46 38

Table A-3. Percentage distribution of highest level of mathematics completed in high school by 1992 12th-graders: 1992-2000
Highest high school math course All students
Calculus 12.9 (0.69) Precalculus 13.5 (0.83) Trigonometry 14.6 (1.07) Algebra 2 32.6 (1.27) Geometry 13.8 (0.81) Algebra 1 10.2 (0.76) Less than algebra 1 2.4 (0.28)
NOTE: Universe used for table 11: All known postsecondary participants for whom the highest level of mathematics completed in high school could be determined. Weighted N=2.0 million. Detail may not sum to totals because of rounding. Standard errors appear in parentheses.
SOURCE: US. Department of Education, National Center for Education Statistics, National Education Longitudinal Study of 1988 (NELS:88/92/2000): “Second Follow-up, High School Transcript Study, 1992”; and “Fourth Follow-up, Postsecondary Education Transcript Study (PETS), 2000.”
47 39

Table A-4. Percentage distribution of 1992 12th-graders who earned bachelor’s degrees, by majodfield of study: 1992-2000
Percentage distribution of all recipients Undergraduate majodfield of study
Business 17.0 (0.86)
Education 8.7 (0.59)
Engineering 8.0 (0.76)
Physical sciences 1.6 (0.3 1)
Math and computer science 4.0 (0.57)
Life sciences
Health sciences and services’
Humanities
Fine and performing arts
Social sciences
Applied social sciences2
8.3 (0.56)
7.6 (0.58)
7.0 (0.75)
5.6 (0.56)
9.4 (1.01)
1.2 (0.76)
Other) 1.7 (0.27)
‘“Health sciences and services” includes nursing, allied health, physical therapy, etc.
’“Applied social sciences” includes communications, clinicakounseling psychology, recreation and leisure studies, public administration, criminal justice, social work, humadcommunity services, child study, and family and community studies.
Other” includes business and medical office support, communications technologies, genefallliberal studies, 3“
theology, Bible studies, air transportation, and culinary arts.
NOTE: Universe used for tables 12 and 13: Consists of all students who earned bachelor’s degrees. Weighted N=0.9 million. Detail may not sum to totals because of rounding. Standard errors appear in parentheses.
SOURCE: U.S. Department of Education, National Center for Education Statistics, National Education Longitudinal Study of 1988 (NELS:88/2000), “Fourth Follow-up, Postsecondary Education Transcript Study (PETS), 2000.”
40
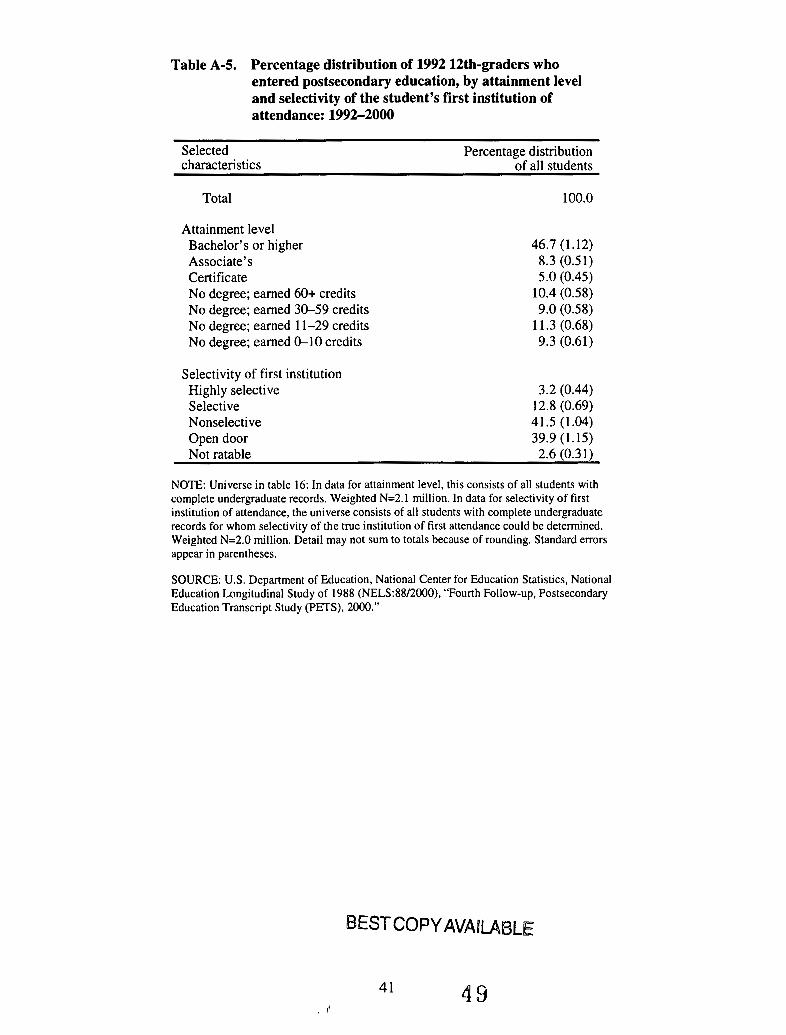
Table A-5. Percentage distribution of 1992 12th-graders who entered postsecondary education, by attainment level and selectivity of the student’s first institution of attendance: 1992-2000
Selected Percentage distribution characteristics of all students
Total 100.0
Attainment level Bachelor’s or higher Associate’s Certificate No degree; earned 60+ credits No degree; earned 30-59 credits No degree; earned 11-29 credits No degree; earned 0-10 credits
46.7 (1.12) 8.3 (0.51) 5.0 (0.45)
10.4 (0.58) 9.0 (0.58)
11.3 (0.68) 9.3 (0.61)
Selectivity of first institution Highly selective 3.2 (0.44) Selective 12.8 (0.69) Nonselective 41.5 (1.04) Open door 39.9 (1.15) Not ratable 2.6 (0.31)
NOTE: Universe in table 16: In data for attainment level, this consists of all students with complete undergraduate records. Weighted N=2.1 million. In data for selectivity of first institution of attendance, the universe consists of all students with complete undergraduate records for whom selectivity of the true institution of first attendance could be determined. Weighted N=2.0 million. Detail may not sum to totals because of rounding. Standard errors appear in parentheses.
SOURCE: U.S. Department of Education, National Center for Education Statistics, National Education Longitudinal Study of 1988 (NELS:88/2000), “Fourth Follow-up, Postsecondary Education Transcript Study (PETS), 2000.”
41 0’
49

Table A-6. Percentage distribution of 1992 12th-graders, by selected student and school characteristics: 1992- 2000
Selected characteristics All students
Total 100.0
Attainment level Bachelor’s or higher Associate’s Certificate 60 or more credits; no degree 30-59 credits; no degree 11-29 credits; no degree 0-10 credits; no degree
High school academic intensity Highest quintile 2nd quintile 3rd quintile 4th quintile Lowest quintile
45.1 (1.08) 8.2 (0.50) 5.0 (0.43)
10.1 (0.56) 9.0 (0.57)
11.3 (0.66) 1 1.4 (0.67)
26.4 (1.12) 25.9 (1.25) 19.9 (0.85) 18.6 (1.05) 9.2 (0.58)
True institution of first attendance’ Doctoral 24.5 (0.92) Other 4-year 31.3 (0.89) Community college 39.6 (1.10) Other sub-baccalaureate2 4.5 (0.35)
‘True institution of first attendance excludes postsecondary institutions attended while the student was still in high school, institutions attended in the summer between high school graduation and fall semester entry (unless the institution was the same for both periods), and “false starts” (i.e., when the student withdraws from the ostensible first postsecondary institution in the first term of attendance but enrolls in another institution without withdrawal at a later date).
’“Other sub-baccalaureate” includes 2-year institutions other than community colleges and nondegree-granting schools.
NOTE: Universe in table 17: Consists of all 1992 12th-graders who became postsecondary participants (weighted N=l.99 million). For students whose first institution of attendance could be determined, weighted N=1.97 million. Detail may not sum to totals because of rounding. Standard errors appear in parentheses.
SOURCE: U.S. Department of Education, National Center for Education Statistics, National Education Longitudinal Study of 1988 (NELS:88/92/2000): “Second Follow-up, Nigh School Transcript Study, 1992”; and “Fourth Follow-up, Postsecondary Education Transcript Study (PETS), 2000.”
50 42

Table A-7. Percentage distribution of students in the first year of their postsecondary schooling, by high school background performance indicators: 1992-2000
Performance indicators All students
Total 100.0
High school academic intensity Highest quintile 2nd quintile 3rd quintile 4th quintile Lowest quintile
High school class ranWGPA Highest quintile 2nd quintile 3rd quintile 4th quintile Lowest quintile
26.4 (1.12) 25.9 (1.25) 19.9 (0.85) 18.6 (1.05) 9.2 (0.58)
26.0 (0.99) 22.6 (0.97) 19.4 (0.92) 18.3 (1.11) 13.7 (0.81)
Senior test score Highest quintile 29.2 (1.08) 2nd quintile 26.3 (0.98) 3rd quintile 23.0 (1.30) 4th quintile 12.8 (0.70) Lowest quintile 8.7 (0.78)
NOTE: The first year of postsecondary schooling consists of the 1 1-month period following the first-term date at the student’s true institution of first attendance, ‘True institution of first attendance” excludes postsecondary institutions attended while the student was still in high school, institutions attended in the summer between high school graduation and fall semester entry (unless the institution was the same for both periods), and “false starts” (Lee, when the student withdraws from the ostensible first postsecondary institution in the first term of attendance but enrolls in another institution without withdrawal at a later date).
Universe in tables 18, 19, and 20: Consists of all 1992 12th-graders who became postsecondary participants and for whom first-year credits could be determined. Weighted N=1.99 million. Detail may not sum to totals because of rounding, Standard errors appear in parentheses.
SOURCE: U.S. Department of Education, National Center for Education Statistics, National Education Longitudinal Study of 1988 (NELS:88/92/2000): “Second Follow-up, High School Transcript Study, 1992”; and “Fourth Follow-up, Postsecondary Education Transcript Study (PETS), 2000.”
43

Appendix B: Technical Notes
45 52

These technical notes describe the procedures used to collect postsecondary education transcripts for responding sample members from the National Education Longitudinal Study of 1988 (NELS:88) who reported participating in postsecondary education after leaving high school. More detailed information is available in Curtin, et al. (forthcoming).
1. Overview of the National Education Longitudinal Study of 1988 (NELS:88)
The following section describes the National Education Longitudinal Study of 1988 (NELS:88) and, in particular, the postsecondary education transcript study that was conducted at the conclusion of the NELS:88 fourth follow-up study. NELS:88 is a major longitudinal study sponsored by the U.S. Department of Education, National Center for Education Statistics (NCES). It was designed to provide information about the critical transitions experienced by young people as they develop, attend school, develop careers, and form families. NELS:88 provides information on how school policies, family involvement, teacher practices, educational environments, intensity of coursetaking activities, and postsecondary education experiences affect student outcomes such as academic achievement, persistence in high school and college, and labor market experiences.
Since 1988, when the NELS:88 respondents were enrolled in 8th-grade classrooms in public and private schools across the United States, this sample population has been surveyed five times across 12 years. The first data collection was the base-year 1988 survey, followed by the first follow-up study during 1990 when most participants were 10th-grade students (NELS:88/90) and the second follow-up study 2 years later when most participants were high school seniors (NELS:88/92). This sample was surveyed again in 1994 and 2000 (the third and fourth follow-up studies, NELS:88/94 and NELS:88/2000, respectively), when most of the sample members were 2 and 8 years removed from their high school graduations.
In addition to surveys with the students from the 8th-grade class of 1988 (including those who subsequently dropped out of school), NELS:88 also collected extensive information from surveys of their parents or guardians in 1988 and 1992, and of their teachers and school administrators in 1988, 1990, and 1992. In addition, most sample members completed cognitive tests in 1988, 1990, and 1992. The study also collected high school transcripts for the study participants in 1992, following the graduations of most of the students. The postsecondary transcript data used in this report was collected in the year 2000 and supplements the postsecondary education information collected from the NELS:88/94 and NELS:88/2000 interviews by adding richness and depth to the academic data. Data coiiection for the iL'ELS:88/2000 Postsecondary Education Transcript Study (PETS) targeted the transcripts from all postsecondary institutions attended after high school by the NELS:88 fourth follow-up study's respondent population.
2. Introduction to the NELS:88/2000 Postsecondary Education Transcript Study
Since student interviews do not always produce complete data on college enrollment, coursetaking, and degree completion, a careful extraction of information directly from school-maintained transcript records ensures that errors of memory and reporting are minimized. For this purpose, the NELS:88/2000 PETS was designed. Official records from academic and vocational postsecondary institutions were obtained.
Data files created for the transcript study include detailed information about the types of degree programs, periods of enrollment, majors or fields of study for instructional programs, specific courses taken, grades and credits attained, and credentials earned. In addition to providing a data resource for the analysis of educational activities and their impacts, the transcript data may be used as an objective standard against which student self-reports may be compared and evaluated, thus guiding the design of future studies. It should be noted that there is a potential for institutions to make administrative errors. However, the type, frequency, and magnitude of such errors are not knowable from this data collection.
53 47

On their own, these transcript data can inform public policy discussions on, for example, community college curricula, public university graduation rates, and statewide postsecondary attainment. Taken with the 12-year accumulation of data available for NELS:88 participants, transcript information can begin to shape discussions on successful high school to college transitions, college coursetaking following high school success or failure, and nontraditional routes through the postsecondary education system, among many other topics.
I
Data collection for the NELS:88/2000 PETS, conducted from September of 2000 through March of 2001, included transcript requests to over 3,000 postsecondary institutions that respondents to the NELS:88 fourth follow-up study reported attending during either the third or fourth follow-up studies to NELS:88. The transcript study collected and processed postsecondary education transcripts using a transcript control system developed specifically for this purpose. Specially trained research personnel then coded and tabulated these academic documents, sampling statisticians developed nonresponse-adjusted analysis weights for the transcript data files, and other staff developed and documented a data file for the transcript study.
3. NELS:88/2000 Postsecondary Education Transcript Study Data Collection
3.1 Overview of the NELS:88/2000 Postsecondary Education Transcript Study Data Collection
The NELS:88/2000 PETS was carried out at the conclusion of data collection for the fourth follow-up study. The data collection for this specialized transcript study for NELS:88 began on September 5, 2000, and over the next 5 months project staff requested transcripts from approximately 3,200 postsecondary institutions in the United States that the NELS:88 fourth follow-up study respondents reported attending during either the NELS:88 third follow-up study in 1994 (NELS:88/94) or the fourth follow-up study in 2000 (NELS: 88/2000). Thus, the possible enrollment period for student-reported postsecondary participation for the NELS:88 respondents covered 8 years-from the end of data collection for the second follow-up study (December 1992) to the end of data collection for the fourth follow-up study (September 2000). The dates on the received transcripts themselves included coursework completed in postsecondary institutions prior to high school graduation, as early as the fall term of 1988, and through the end of the fall semester of 2000. The transcript study was designed to provide reliable and objective information about the types and patterns of postsecondary courses taken by NELS:88 sample members, and to supplement the large NELS:88 database of factors that may predict or explain student postsecondary education and economic outcomes.
3.2 Institution and Student Target Populations for the Transcript Study
Data collection for the NELS:88 fourth follow-up study ended in September 2000, providing a final respondent population of approximately 12,100 individuals. During the fourth follow-up study's interview, these sample members were asked about their experiences with postsecondary education. For the fourth follow-up study respondents who were also respondents to the third follow-up interview in 1994, the question assessed their postsecondary experiences since the previous NELS:88 interview in 1994. For the approximately 90 fourth follow-up respondents who were nonrespondents in 1994, the question asked about their postsecondary experiences "since leaving high school." Forty-five percent of the NELS:88/2000 respondents (5,500 sample members, overall) reported some level of postsecondary experience on this item; thus, this subgroup of the fourth follow-up study sample members became the preliminary target population for the transcript study.'
'Approximately 20 fourth follow-up respondents refused to answer the item, did not know the answer, or completed partial interviews that did include this interview item. They were excluded from the transcript study.
48 5%

Fourth follow-up study respondents with postsecondary education experience since the third follow-up interview were then asked about the institution or institutions they had attended, the locations of these institutions, and information about degrees earned, fields of study, and dates of enrollment and degrees. In addition to this information, the telephone and field interviewers also attempted to identify, with the sample member’s assistance, unit identification numbers for each of the postsecondary institutions using the Integrated Postsecondary Education Data System (IPEDS),’ the NCES core postsecondary institution data collection program. IPEDS is a single comprehensive system that encompasses all institutions in the United States whose primary purpose is to provide postsecondary education. The data system provides postsecondary education institutional data at the institutional, state, and national levels.
3.2.1 Universe of Postsecondary Institutions Attended
During the fourth follow-up interview, the names of up to eight postsecondary institutions- nonduplicative with the institutions identified in 1994 during the third follow-up study-at which the respondent indicated attendance were collected. These new institutions supplemented the schools previously identified during the third follow-up interview, when up to five institutions were recorded. Thus, fourth follow-up study respondents were able to report a maximum number of 13 postsecondary institutions that they had attended at any time since high school. Table B-1 provides, for both the third and fourth follow-up studies, the number of student respondents with postsecondary experience and the number of institutions each of the sample members attended during that period. A total of approximately 9,600 fourth follow-up study respondents (79 percent of the overall respondent population) reported postsecondary experience since high school. Approximately 2 I percent of the NELS: 88 respondent population did not participate in postsecondary education.
When institutions could not be coded during the interview, the interviewers collected the name, city, state, level, and control of 2
the institution, and the institution was coded later, when possible, by a coding specialist.

Institutions attended
0 1 2 3 4 5 6 to 8
Students reporting'
Number Percent 2,500 5,000 3,000 1,200 300 70 10
20.9
41.1 25.3 9.7 2.3 0.6 0.1
'About 9,600 of the approximately 12,100 fourth follow-up study respondents reported attending postsecondary education after high school. This number is based on about 5,900 fourth follow-up respondents reporting new institutions in 2000 (F4EANY = yes), as well as third follow-up respondents with no additional schools reported in 2000 (WEANY = no), but with schools reported during the 1994 interview.
NOTE: Postsecondary institutions included IPEDS-coded postsecondary institutions, as well as foreign and other institutions that were not assigned valid IPEDS unit identification numbers. Detail may not sum to totals because of rounding.
SOURCE: U.S. Department of Education, National Center for Education Statistics, National Education Longitudinal Study of 1988 (NELS:88/94/2000): "Third Follow-up, Postsecondary Education Transcript Study (PETS), 1994"; and Fourth Follow-up, Postsecondary Education Transcript Study (PETS), 2000."
The transcript data collection for the NELS:88 transcript study, however, further limited the target population of students and the postsecondary institutions they attended. To streamline transcript request procedures, only the postsecondary institutions identified in the IPEDS institutional characteristics file were included in the final institution target population. Thus, postsecondary information from foreign institutions, nondegree-granting programs (e.g., military training programs), and noncredit-granting institutions (e.g., institutions that offer only short-term training or continuing education programs) were not included in the NELS:88/2000 PETS as they were not included in IPEDS. Thus, the final count of postsecondary institutions selected for the target group of institutions was 3,200, and only students attending those schools are included in the transcript studya3
Table B-2 describes this final target group of postsecondary institutions included in the transcript study. The table partitions the final target group by the level of the institutions' educational offerings (e.g., less- than 2-year, 2-year, and 4-and-more-year degree programs), control (public, private nonprofit, and private for-profit), and special school type (e.g., historically Black colleges and universities and American Indian tribal colleges).
'A small supplement to the transcript study was also camed out with approximately 400 students in 300 postsecondary institutions that were not reported by the student respondents during the NELS:88 fourth follow-up study interview. (The enrollment was noted in other institution transcripts for the student.) Ninety-two percent of these transcripts were subsequently collected using procedures comparable to those outlined in this section.
50

Sampling strata
Control of institution
Public Private nonprofit Private for-profit
Transcript study institutions IPEDS institutions’ Number Percent2
Level of institution 4 or-more-year 2-year Less-than-2-year
Special classification Historically Black
American Indian tribal college
colleges/universities
2,300 1,500 66.5
2,900 1,000 33.8
4,900 700 14.5
2,900 1,500 51.5 2,900 1,200 42.2 4,300 500 11.4
100 80 73.8
30 10 20.7
‘Institution totals are from the 1996-97 IPEDS institution characteristics file, the version of IPEDS available during preparations for the NELS:88 fourth follow-up study.
’Row percentage of postsecondary institutions indicates the percentage of IPEDS institutions by type attended by the NELS:88 respondents.
NOTE: Detail may not sum to totals because of rounding.
SOURCE: U.S. Department of Education, National Center for Education Statistics, National Education Longitudinal Study of 1988 (NELS:88/2000), “Fourth Follow-up, Postsecondary Education Transcript Study (PETS), 2000”; and 1996 Integrated Postsecondary Education Data System, “Institutional Characteristics Survey” (IPEDS-IC:9697).
As shown in the table, the NELS:88 respondent population attended approximately two-thirds of U.S. public postsecondary institutions and half of the nation’s 4-or-more-year institutions during the period covered by the NELS:88 transcript study (July 1992-December 2000).
3.2.2 Taxonomy Used for Coding Courses in the NELS:88/2000 Postsecondary Transcript Sample
There are 1,178 codes for the courses on the NELS:88/2000 Postsecondary Transcript File. The codes, along with the generic title of each course category (e.g., International Relations, Animal BehaviorEthology, Shakespeare, etc.), are available on CD-ROM (“NELS: 1988-2000 PETS 4th Follow- Up,” NCES 2003402).
The initial coding of courses was based on the taxonomy used for the High School and BeyondBophomore Cohort and previously published in The New College Course Map and Transcript Files: Changes in Course-Taking and Achievement (Adelman 1999b). The taxonomy of this document, in turn, was based on that derived from the first of the postsecondary transcript-based longitudinal studies, the NLS:72, and published in A College Course Map (Adelman 1990).
Each iteration of the taxonomy is reviewed by panels of faculty from the disciplines along with panels of registrars and institutional research officers. The panels are presented with the existing taxonomy, and computer printouts of course titles and allied data (type of institution, local course numbering, student major, number of credits) from the transcript files reflecting initial coding decisions. Decision rules for placing courses in different categories are then either maintained, elaborated, or modified.
For the NELS:88/2000-based version of the taxonomy, faculty reviewers were asked to examine the 1999 taxonomy in their fields (and allied fields) prior to the review sessions and to consider the viability of the existing codes, potential modifications, and issues the panel should address. Their responses shaped the background for the review sessions.
The NELS:88/2000 review panels made corrections, recommended new categories (e.g., for courses under history on The Holocaust, Vietnam, and World War 11) and disaggregations of existing categories (e.g., what was formerly a single code for Linguistics is now four codes indicating subfields), and marked specific cases for catalog searches. As a result of the discussions of the review panel covering engineering and computer science, a completely new chapter in the taxonomy for computer applications courses was created.
The taxonomy is empirically driven by the coursework indicated on the transcripts. For a course category to be retained from one iteration to the next in the taxonomy requires a minimum number of cases of coursetaking that differs slightly depending on the size of the database. The process of empirical modification of the taxonomy from its 1999 to 2003 version involved dropping 38 codes due to low coursetaking volume, and adding 157. In addition, a new section of 20 codes covering credit-by- examination (Advanced Placement, College-Level Examination Program [CLEP], and departmental examinations) was created and included.
There were 370,000 courses coded in the NELS:88/2000 transcript files. The coding of some 7,000 titles, covering approximately 40,000 entries, was resolved with catalog searches.
4. Sample Design and Weighting
This section of the technical appendix provides a brief overview of the sample design used for the NELS:88/2000 PETS. It is important to note that the transcript study attempted to collect and process the postsecondary institution records for all NELS:88 fourth follow-up study respondents who reported participating in postsecondary education following high school. No respondent subsampling was employed.
4.1 Objectives of the NELS:88 Sample Design
As noted above, the sample design for the NEiLS:88 postsecondary transcript study was based on the sample design employed during the fourth follow-up study in 2000 (NELS:88/2000). The design for the fourth follow-up study was built upon the sampling foundation employed during the earlier study waves. Data users are referred to the NELS:88 user manuals for more information on the survey sampling design.

4.2 Analysis Weights for the NELS:88 Transcript Study
The general purpose of weighting survey data is to compensate for unequal probabilities of selection and to adjust for the effects of nonresponse. Weights are often calculated in two main steps. In the first step, unadjusted weights are calculated as the inverse of the probabilities of selection, taking into account all stages of the sample selection process. In the second step, these initial weights are adjusted to compensate for nonresponse; such nonresponse adjustments are typically carried out separately within multiple weighting cells. Consistent with earlier rounds of NELS:88, the fourth follow-up study weights and the postsecondary education transcript study weights were modified, where possible, to compensate for nonresponse and to provide point estimates of population totals that were consistent across rounds. (Readers who wish to review additional descriptions of the process for developing raw or unadjusted weights and then adjusting them for nonresponse should review sections 3.8.4.2-3.8.4.5 of the User’s Manual: NELS: 88 Base-Year to Fourth Follow-up: Student Component Data File (Curtin et al. 2002) for a detailed discussion of the NELS:88 weight calculations and nonresponse and poststratification adjustments .)
4.2.1 Postsecondary Education Transcript Study Weights
Building on the weighting structure for the fourth follow-up study’s questionnaire design weight (F4QWT), 10 additional weights were developed for the postsecondary education transcript study data. These weights describe three distinct transcript respondent populations. PI weights, a general postsecondary education participation weight, can be used to describe the NELS:88 population that participated in some type of postsecondary education after high school, including GED, basic skills, and single-course programs. Participation was based on either the availability of a collected transcript or on information available from secondary sources (e.g., from information on transfer credits contained in another school’s transcript or from information contained in the U.S. Department of Education’s National Student Loan Data System4). The populations described by P2 and P3 weights are more restrictive. For example, the P3 weights are based on the NELS:88 population with returned transcripts at levels higher than GED and basic skills, and for subjects for whom the transcript record was complete or likely complete. Descriptions of these weights follow.
F4F2PI WT: PANEL WEIGHT, F2, F3, F4: LIKELY PSE PARTICIPANT (approximately 9,200 subjects have nonzero weights on F4F2PZ wr).
Postsecondary education (PSE) participation weight for 12th-grade freshened panel (F2, F3, and F4 panel).
This postsecondary education weight applies to the 12th-grade freshened panel who responded in 1992, 1994, and 2000 (F2, F3, and F4) and who had credible claims of participation in postsecondary education by the return of a postsecondary transcript, transfer credit noted on another institution’s transcript, or support for postsecondary attendance provided by other sources (e.g., the NSLDS or accounts of the respondent’s occupation, income, and high school background). Qualification for the weight was based on values of NELSSTAT = 1 through 7. (See also the description for NELSSTAT.) In other words, F4F2PlWT is a postsecondary education participation weight for students from the NELS:88/2000 respondent population who were “likely participants” in postsecondary education. Students are included
4Financial aid information came from the U.S. Department of Education’s National Student Loan Data System (NSLDS), a central database for student aid. NSLDS receives data from external institutions (e.g., schools, agencies that guaranty loans, Pell Grant program) and provides a centralized, integrated view of Title IV loans and Pell grants through their entire cycle, from aid approval through closure.
59

who have GED-level, basic skills, and single-course transcripts, as well as imputed transcripts, and those with credible claims of postsecondary education participation but for whom no postsecondary education transcripts were recorded.
The target population for this weight is students who were 12th-graders in the spring semester of 1992 and who participated in some type of postsecondary education thereafter. Excluded from the target population are individuals who were ineligible for the 1992, 1994, and 2000 NELS:88 follow-up studies (e.g., individuals who were deceased, incapacitated, or no longer resided in the United States).
CAUTION: The postsecondary participation weight for the 12th-grade freshened panel (F4F2PlWT) should be used sparingly and only for general analyses of attainment and selected aspects of attendance that do not depend on a received transcript. The recommended weight for attendance patterns and time analyses with this longitudinal panel is F4F2P2WT. The recommended weight for curriculum and academic performance analyses relating to credits earned or GPA for the 12th-grade freshened panel is F4F2P3WT.
Applies to: Panel members with reported postsecondary experience.
SOURCE: National Education Longitudinal Study of 1988 (NELS:88/2000), “Fourth Follow-up, Postsecondary Education Transcript Study (PETS), 2000.”
F4F2P2WT: PANEL WEIGHT, F2, F3, F4: KNOWN PSE PARTICIPANT (approximately 8,700 subjects have nonzero weights on F4F2P2wT).
PSE participation weight for 12th-grade freshened panel members (F2, F3, and F4 panel) with returned or imputed postsecondary transcripts.
This postsecondary education weight applies to the 12th-grade freshened panel for whom NCES collected transcripts (or imputed transcripts based on transfer credits reported in another institution’s transcript). Qualification for the weight was based on values of NELSSTAT = 1 through 3. (See also the description for NELSSTAT.) In other words, F4F2P2WT is a postsecondary education transcript weight for the NELS:88/2000 respondent population with documented participation in postsecondary education. These are cases where (1) at least one PSE transcript was returned (including transcripts for GED/basic skills), or (2) an imputed transcript was developed based on a returned graduate transcript or an institutional refusalhnability to return the transcript when supporting evidence of PSE attendance experience was available.
The target population for this weight is students who were 12th-graders in the spring semester of 1992 and subsequently participated in some type of postsecondary education thereafter, excluding those who attended only a single course or attempted fewer than 5 credits. These students were excluded from this population (and not given a positive weight) if they had a NELSSTAT = 4 (individuals whose requested and received records show a single transcript with either only one course or one term of attendance with fewer than 5 attempted credits of any kind). The decision was made to exclude these cases since a single- course record is not adequate for analyses of attendance patterns, time, curriculum, or performance variables, the algorithms for which assume more than one course entry. Also excluded from the target population are individuals who were ineligible for the 1992, 1994, and 2000 NELS:88 follow-up studies (e.g., individuals who were deceased, incapacitated, or no longer resided in the United States).

CAUTION: F4F2P2WT is the recommended postsecondary education transcript weight for attendance patterns and time analyses with the 12th-grade freshened panel. The recommended weight for cumculum and academic performance analyses relating to credits or GPA for the longitudinal panel is F4F2P3W.
SOURCE: National Education Longitudinal Study of 1988 (NELS:88/2000), “Fourth Follow-up, Postsecondary Education Transcript Study (PETS), 2000.”
F4F2P3 WT: PANEL WEIGHT, F2, F3, F4: COMPLETE PSE TRANSCRIPT (approximately 8,300 subjects have nonzero weights on F4F2P3W7).
PSE participation weight for 12th-grade freshened panel members (F2, F3, and F4 panel) ‘with complete postsecondary transcript records.
This postsecondary education weight applies to the 12th-grade freshened panel respondents from the NELS:88/2000 population who participated in postsecondary education and had complete transcript records. Qualification for the weight was based on values of NELSSTAT = 1 and COMPLETE = 1 or 2. (See also the description for NELSSTAT and COMPLETE.) In other words, F4F2P3WT is a postsecondary education transcript weight for the NELS:88/2000 respondent population with complete postsecondary transcript documentation. These are cases where the fourth follow-up respondent received one or more PSE transcripts, at least one of which was NOT either a GED-levelhasic skills transcript or a one-course transcript, and where the PSE transcript record was complete or likely complete (i.e., what was missing was deemed incidental). Respondents with imputed PSE transcripts are excluded.
The target population for this weight is students who were 12th-graders in the spring semester of 1992 and subsequently participated in some form of postsecondary education, excluding those who enrolled in GED or basic skills programs, attended only a single course, or attempted fewer than 5 credits. The decision was made to exclude these cases since a single-course record is not adequate for analyses of attendance patterns, time, curriculum, or performance variables, the algorithms for which assume more than one course entry. Also excluded from the target population are individuals who were ineligible for the 1992, 1994, and 2000 NELS:88 follow-up studies (e.g., individuals who were deceased, incapacitated, or no longer resided in the United States).
CAUTION: Analyses of curriculum and academic performance (e.g., course credits and GPA) with NELS:88 respondents. with incomplete records may distort or bias analyses. Since F4F2P3WT includes students with complete records only, it is the recommended weight for these types of analyses, including questions relating to undergraduate credit production, credit aggregates in course configurations (e.g., CRSAGGRT), or GPA.
Applies to: Panel members with reported postsecondary experience.
SOURCE: National Education Longitudinal Study of 1988 (NELS:88/2000), “Fourth Follow-up, Postsecondary Education Transcript Study (PETS), 2000.”
F4FIP3 WT: PANEL WEIGHT. Fl-F4: COMPLETE PSE TRANSCRIPT (approximately 8,000 subjects have nonzero weights on F4Fl P3WT).
(PSE participation weight for 10th-grade freshened panel members (Fl, F2, F3, and F4) with complete postsecondary transcript records.

This postsecondary education weight applies to the 10th-grade freshened panel respondents who participated in postsecondary education and had complete postsecondary transcript records. Qualification for the weight was based on values of NELSSTAT = 1 and COMPLETE = 1 or 2. (See also the description for NELSSTAT and COMPLETE.) In other words, F4FlP3WT is a postsecondary education transcript weight for the NEiLS:88/2000 respondent population with complete postsecondary transcript documentation. These are cases where the fourth follow-up respondent received one or more PSE transcripts, at least one of which was NOT either a GED-levelhasic skills transcript or a one-course transcript, and where the PSE transcript record was complete or likely complete (i.e., what was missing was deemed incidental). Respondents with imputed PSE transcripts are excluded.
The target population for this weight is students who were 10th-graders in the spring semester of 1990 and subsequently participated in some form of postsecondary education, excluding those who enrolled in GED or basic skills programs, attended only a single course, or attempted fewer than 5 credits. The decision was made to exclude these cases since a single-course record is not adequate for analyses of attendance patterns, time, curriculum, or performance variables, the algorithms for which assume more than one course entry. Also excluded from the target population are individuals who were ineligible for the 1990, 1992, 1994, and 2000 NELS:88 follow-up studies (e.g., individuals who were deceased, incapacitated, or no longer resided in the United States).
CAUTION: Analyses of curriculum and academic performance (e.g., course credits and GPA) with NELS:88 respondents with incomplete records may distort or bias analyses. Since F4FlP3WT includes students with complete records only, it is the recommended weight for these types of analyses, including questions relating to undergraduate credit production, credit aggregates in course configurations (e.g., CRSAGGRT), or GPA.
Applies to: Panel members with reported postsecondary experience.
SOURCE: National Education Longitudinal Study of 1988 (NELS:88/2000), “Fourth Follow-up, Postsecondary Education Transcript Study (PETS), 2000.”
F4BYP3WT: BY AND F4 PANEL WEIGHT: COMPLETE PSE TRANSCRIPT (approximately 8,000 subjects have nonzero weights on F4BYP3WT).
PSE participation weight for base-year (BY) and F4 respondents (1988 and 2000 only) with complete postsecondary transcript records.
This postsecondary education weight applies to sample members who completed a base-year questionnaire as an eighth-grader in 1988, who completed an interview during the fourth follow-up study in 2000, and who had complete postsecondary transcript records. (Response status during the first, second, and third follow-up studies in 1990, 1992, and 1994 is not considered.) Qualification for the weight was based on values of NELSSTAT = 1 and COMPLETE = 1 or 2. (See also the description for NELSSTAT and COMPLETE.) In other words, F4BYP3WT is a postsecondary education transcript weight for the NELS:88/2000 respondent population with complete postsecondary transcript documentation. These are cases where the fourth follow-up respondent received one or more PSE transcripts, at least one of which was NOT either a GED-levelhasic skills transcript or a one-course transcript, and where the PSE transcript record was complete or likely complete (i.e., what was missing was deemed incidental). Respondents with imputed PSE transcripts are excluded.
The target population for this weight is the population of 1988 eighth-graders who participated in some form of postsecondary education thereafter, excluding those who enrolled in GED or basic skills
56 , G.2

programs, attended only a single course, or attempted fewer than 5 credits. The decision was made to exclude these cases since a single-course record is not adequate for analyses of attendance patterns, time, curriculum, or performance variables, the algorithms for which assume more than one course entry. Also excluded from the target population are individuals who were ineligible for base-year or fourth follow-up studies (e.g., individuals who were deceased, incapacitated, or no longer resided in the United States).
CAUTION: Analyses of curriculum and academic performance (e.g., course credits and GPA) with NELS:88 respondents with incomplete records may distort or bias analyses. Since F4BYP3WT includes students with complete records only, it is the recommended weight for these types of analyses, including questions relating to undergraduate credit production, credit aggregates in course configurations (e.g., CRSAGGRT), or GPA.
Applies to: Panel members with reported postsecondary experience.
SOURCE: National Education Longitudinal Study of 1988 (NELS:88/2000), “Fourth Follow-up, Postsecondary Education Transcript Study (PETS), 2000.”
F4PNP3 WT: FULL PANEL WEIGHT: COMPLETE PSE TRANSCRIPT (approximately 7,700 subjects have nonzero weights on F4PNP3wT).
(PSE participation weight for full longitudinal panel members (BY, F1, F2, F3, and F4) with complete postsecondary transcript records.
This postsecondary education weight applies to the full panel respondents (BY, F1, F2, F3, F4, inclusive) who participated in postsecondary education and had complete postsecondary transcript records. Qualification for the weight was based on values of NELSSTAT = 1 and COMPLETE = 1 or 2. (See also the description for NELSSTAT and COMPLETE.) In other words, F4PNP3WT is a postsecondary education transcript weight for the NELS:88/2000 respondent population with complete postsecondary transcript documentation. These are cases where the fourth follow-up respondent received one or more PSE transcripts, at least one of which was NOT either a GED-levelhasic skills transcript or a one-course transcript, and where the PSE transcript record was complete or likely complete (i.e., what was missing was deemed incidental). Respondents with imputed PSE transcripts are excluded.
The target population for this weight is the population of 1988 eighth-graders who participated in some form of postsecondary education thereafter, excluding those who enrolled in GED or basic skills programs, attended only a single course, or attempted fewer than 5 credits. The decision was made to exclude these cases since a single-course record is not adequate for analyses of attendance patterns, time, curriculum, or performance variables, the algorithms for which assume more than one course entry. Also excluded from the target population are individuals who were ineligible for any of the follow-up studies (e.g., individuals who were deceased, incapacitated, or no longer resided in the United States).
CAUTION: Analyses of curriculum and academic performance (e.g., course credits and GPA) with NELS:88 respondents with incomplete records may distort or bias analyses. Since F4PNP3WT includes students with complete records only, it is the recommended weight for these types of analyses with this panel, including questions relating to undergraduate credit production, credit aggregates in course configurations (e.g., CRSAGGRT), or GPA.
Applies to: Panel members with reported postsecondary experience.

SOURCE: National Education Longitudinal Study of 1988 (NELS:88/2000), “Fourth Follow-up, Postsecondary Education Transcript Study (PETS), 2000.”
F4PHPZ W E FULL PANEL HS TRANSCRIPT WGT: LIKELY PSE PARTICIPANT (approximately 7,600 subjects have nonzero weights on F4PHPI wr).
PSE participation weight for the full longitudinal panel with high school (HS) transcripts.
This postsecondary education weight applies to the full fourth follow-up study longitudinal panel respondents (BY, F1, F2, F3, and F4) with high school transcript information who made credible claims of participation in postsecondary education by the return of a postsecondary transcript, transfer credit noted on another institution’s transcript, or support for postsecondary attendance provided by other sources (e.g., the NSLDS or accounts of the respondent’s occupation, income, and high school background). Qualification for the weight was based on values of NELSSTAT = 1 through 7. (See also the description for NELSSTAT.) In other words, F4PHPlWT is a postsecondary education participation weight for students from the NELS:88/2000 respondent population with high school transcript information who were also “likely participants” in some type of postsecondary education. Students are included who have GED-level, basic skill, and single-course transcripts, as well as imputed transcripts, and those with credible claims of postsecondary education participation but for whom no postsecondary education transcripts were recorded.
The target population for this weight is the population of 1988 eighth-graders who participated in some form of postsecondary education thereafter. Excluded from the target population are individuals who were ineligible for any of the follow-up studies (e.g., individuals who were deceased, incapacitated, or no longer resided in the United States).
CAUTION: The postsecondary participation weight for the full longitudinal panel with high school transcripts (F4PHPlWT) should be used sparingly and only for general analyses of attainment and selected aspects of attendance that do not depend on a received transcript. The recommended weight for attendance patterns and time analyses with this longitudinal panel is F4PHP2WT. The recommended weight for cumculum and academic performance analyses relating to credits earned or GPA for this longitudinal panel is F4PHP3WT.
Applies to: Panel members with reported postsecondary experience and high school transcript information.
SOURCE: National Education Longitudinal Study of 1988 (NELS:88/2000), “Fourth Follow-up, Postsecondary Education Transcript Study (PETS), 2000.”
F4PHP2WE FULL PANEL HS TRANSCRIPT WGT: KNOWN PSE PARTICIPANT (approximately 7,200 subjects have nonzero weights on F4PHP2WT).
PSE participation weight for full longitudinal panel members with high school transcript records and retumed or imputed postsecondary transcripts.
This postsecondary education weight applies to the full fourth follow-up study longitudinal panel respondents (BY, F1, F2, F3, and F4) with high school transcript information who also have returned postsecondary transcripts (or imputed transcripts based on transfer credits reported in another institution’s transcript). Qualification for the weight was based on values of NELSSTAT = 1 through 3. (See also the

description for NELSSTAT.) Students are included who have GED-level, basic skill, and single-course transcripts, as well as imputed transcripts, and those with credible claims of postsecondary education participation but for whom no postsecondary education transcripts were recorded. In other words, F4PHp2WT is a postsecondary education transcript weight for the NELS:88/2000 respondent population with high school transcripts and documented participation in postsecondary education. These are cases where (1) at least one PSE transcript was returned (including transcripts for GEDhasic skills), or (2) an imputed transcript was developed based on a returned graduate transcript or an institutional refusdinability to return the transcript when supporting evidence of PSE attendance experience was available.
The target population for this weight is the population of 1988 eighth-graders who participated in some form of postsecondary education thereafter, excluding those who attended only a single course or attempted fewer than 5 credits. Students were excluded from this population (and not given a positive weight) if they had NELSSTAT = 4 (individuals whose requested and received records show a single transcript with either only one course or one term of attendance with fewer than 5 attempted credits of any kind). The decision was made to exclude these cases since a single-course record is not adequate for analyses of attendance patterns, time, curriculum, or performance variables, the algorithms for which assume more than one course entry. Also excluded from the target population are individuals who were ineligible for any of the follow-up studies (e.g., individuals who were deceased, incapacitated, or no longer resided in the United States).
CAUTION: F4PHP2WT is the recommended postsecondary education transcript weight for attendance patterns and time analyses with the full longitudinal panel with high school transcripts. The recommended weight for curriculum and academic performance analyses relating to credits or GPA for the longitudinal panel is F4PHP3WT.
Applies to: Panel members with reported postsecondary experience and high school transcript information.
SOURCE: National Education Longitudinal Study of 1988 (NELS:88/2000), “Fourth Follow-up, Postsecondary Education Transcript Study (PETS), 2000.”
F4PHP3WT FULL PANEL HS TRANSCRIPT WGT: COMPLETE PSE TRANSCRIPTS (approximately 6,900 subjects have nonzero weights on F4PHP3WT).
PSE participation weight for full longitudinal panel members (BY, F1, F2, F3, and F4) with high school transcripts and complete postsecondary records.
This postsecondary education weight applies to the full fourth follow-up study longitudinal panel respondents (BY, Fl, F2, F3, and F4) with high school transcript information who have complete postsecondary transcript records. Qualification for the weight was based on values of NELSSTAT = 1 and COMPLETE = 1 or 2. (See also the description for NELSSTAT and COMPLETE.) In other words, F4PHP3WT is a postsecondary education transcript weight for the NELS:88/2000 respondent population with high school transcript records and complete postsecondary transcript documentation. These are cases where the fourth follow-up respondent received one or more PSE transcripts, at least one of which was NOT either a GED-levelhasic skills transcript or a one-course transcript, and where the PSE transcript record was complete or likely complete (i.e., what was missing was deemed incidental). Respondents with imputed PSE transcripts are excluded.
59 65

The target population for this weight is the population of 1988 eighth-graders who subsequently participated in some form of postsecondary education, excluding those who enrolled in GED or basic skills programs, attended only a single course, or attempted fewer than 5 credits. The decision was made to exclude these cases since a single-course record is not adequate for analyses of attendance patterns, time, curriculum, or performance variables, the algorithms for which assume more than one course entry. Also excluded from the target population are individuals who were ineligible for any of the follow-up studies (e.g., individuals who were deceased, incapacitated, or no longer resided in the United States).
CAUTION: Analyses of curriculum and academic performance ( e g , course credits and GPA) with NELS:88 respondents with incomplete records may distort or bias analyses. Since F4PHP3WT includes students with complete records only, it is the recommended weight for these types of analyses, including questions relating to undergraduate credit production, credit aggregates in course configurations (e.g., CRSAGGRT), or GPA.
Applies to: Panel members with reported postsecondary experience.
SOURCE: National Education Longitudinal Study of 1988 (NELS:88/2000), “Fourth Follow-up, Postsecondary Education Transcript Study (PETS), 2000.”
F4F2HP3W HS TRANSCRIPT PANEL WEIGHT F2-F4: COMPLETE PSE TRANSCRIPTS (approximately 7,300 subjects have nonzero weights on F4F2HP3W).
PSE participation weight for 12th-grade freshened panel members (F2, F3, and F4) with high school transcripts and complete postsecondary transcript records.
This postsecondary education weight applies to the 12th-grade freshened panel respondents with high school transcripts who have complete postsecondary transcript records. Qualification for the weight was based on values of NELSSTAT = 1 and COMPLETE = 1 or 2. (See also the description for NELSSTAT and COMPLETE.) In other words, F4F2HP3W is a postsecondary education transcript weight for the NELS:88/2000 respondent population with both high school and postsecondary transcript information. These are cases where the fourth follow-up respondent received one or more PSE transcripts, at least one of which was NOT either a GED-levelhasic skills transcript or a one-course transcript, and where the PSE transcript record was complete or likely complete (i.e., what was missing was deemed incidental). Respondents with imputed PSE transcripts are excluded.
The target population for this weight is students who were 12th-graders in the spring semester of 1992 and subsequently participated in some form of postsecondary education, excluding those who enrolled in GED or basic skills programs, attended only a single course, or attempted fewer than 5 credits. The decision was made to exclude these cases since a single-course record is not adequate for analyses of attendance patterns, time, curriculum, or performance variables, the algorithms for which assume more than one course entry. Also excluded from the target population are individuals who were ineligible for the 1992, 1994, and 2000 NELS:88 follow-up studies (e.g., individuals who were deceased, incapacitated, or no longer resided in the United States).
CAUTION: Analyses of curriculum and academic performance (e.g., course credits and GPA) with NELS:88 respondents with incomplete records may distort or bias analyses. Since F4F2HP3W includes students with complete records only, it is the recommended weight for these types of analyses, including questions relating to undergraduate credit production, credit aggregates in course configurations (e.g., CRSAGGRT), or GPA.
60 66

Applies to: Panel members with reported postsecondary experience.
SOURCE: National Education Longitudinal Study of 1988 (NELS:88/2000), “Fourth Follow-up, Postsecondary Education Transcript Study (PETS), 2000.”
4.3 Survey Standard Errors
Because the NELS:88 sample design involved stratification, the disproportionate sampling of certain strata, and clustered (i.e., multistage) probability sampling, the resulting statistics are more variable than they would have been had they been based on data from a simple random sample of the same size. The calculation of exact standard errors for survey estimates can be difficult. Several procedures are available for calculating precise estimates of sampling errors for complex samples. Procedures such as Taylor Series approximations, Balanced Repeated Replication (BRR), and Jackknife Repeated Replication (JRR), which can be found in advanced statistical programs like SUDAAN or WESVAR, produce similar results. The NELS:88/2000 analyses included in this report used the Taylor Series procedure to calculate standard errors as generated by AM statistical software (httu://www.am.air.org).
4.4 Statistical Tests
Differences Between Means
Comparisons that have been drawn in the text of this report have been tested for statistical significance to ensure that the differences are larger than those that might be expected due to sampling variation. The statistical comparisons in this report were based on the f statistic. Whether the statistical test is considered significant or not is determined by calculating a f value for the difference between a pair of means or proportions and comparing this value to published tables of values, called critical values (cv). The alpha level is an a priori statement of the probability that a difference exists in fact rather than by chance.
The f statistic between estimates from various subgroups presented in the tables can by computed by using the following formula:
E l - E2
t=J-’ where El and E2 are the estimates to be compared (e.g., the means of sample members in two groups) and sel and se2 are their corresponding standard errors.
To guard against errors of inference based upon multiple comparisons, the Bonferroni procedure5 adjusts significance tests for multiple contrasts. This method corrects the significance (or alpha) level for the total number of contrasts made with a particular classification variable. For each classification variable, there are (K*(K-1))/2 possible contrasts (or nonredundant pairwise comparisons), where K is the number of categories. For example, if a classification variable such as race has 6 categories, K=6 and there are (6*5)/2=15 possible comparisons between the categories. The Bonferroni procedure divides the alpha- level for a single t-test (in this case, 0.05) by the number of possible pairwise comparisons (15) to derive a new alpha corrected for the fact that multiple contrasts are being made. For all of the tables in this report, the Bonferroni adjustment is applied on a classification variable by classification variable basis, adjusting
’For a detailed discussion, see, for example, W.L. Hays, Statistics (4th ed.), New York: Holt, Rinehart, and Winston, 1988.
61 67

for the number of possible comparisons among the subgroups defined by a single row variable and a single column variable.
5. Postsecondary Education Participants: Selection of the Samples for This E.D. Tab
5.1 The Sample of “Likely Participants” in Postsecondary Education
Of the approximately 12,100 students in the NELS:88/2000 panel, about 9,600 reported attending at least one postsecondary institution. Based on received in-scope transcripts and (when not received) other corroborating information, about 9,400 were judged as “likely participants.” However, a small number of these reported attending foreign institutions for which no transcript was requested and have been given a weight of zero on weights based on the response type, PSEWTl (weights with “PZ”). These cases are not included with the NELS:88/2000 sample members who are the basis for the analyses of “likely participants” in these tabulations.
The universe of likely postsecondary participants in the NELS:88/2000 transcript-based files consists of (1) all students for whom at least one in-scope transcript was received (weighted N=1.95m) and (2) students for whom transcripts were requested but not received (weighted N=115k), yet who met one of the following criteria (in order of selection): loan disbursement records were found in the NSDLS files; in 1994, the student provided an account of the methods used to finance postsecondary education in combination with identifying institutions attended; the student’s high school record was equal to or higher than the mean for known 4-year college attendees in class ranWGPA, academic curriculum intensity, number of Advanced Placement courses, and combined SAT/ACT test scores; the student’s 2000 account of his/her postsecondary history included multi-institutional attendance, simultaneous enrollment, enrollment in the year 2000, and credential earned; the student’s 2000 account of hisher postsecondary history included change of major, full-time/part-time status, and stopout periods; and, in 2000, the student provided academic, financial, family, or job-related reasons for leaving postsecondary education without earning a credential.
5.2 The Sample of “Known Participants” in Postsecondary Education
Based only on received in-scope transcripts, about 8,900 NELS:88/2000 sample members have documented participation in postsecondary education. As the transcript response type PSEWT2 (used to create weights with “P2”) was developed to include those who have more than a cursory experience with postsecondary education, only about 8,800 of these sample members, with more than 1 course and more than 5 credits of postsecondary education, were included in the analyses for “Known Participants” in these tabulations.
6. Constructing the Data Files
The process of constructing the core NELS:88/2000 Postsecondary Transcript Files consumed over 2 years of work, conducted first at the offices of the American Association of Collegiate Registrars and Admissions Officers (AACRAO) and then at the Education Statistics Services Institute (ESSI). Over 60,000 pieces of paper from about 2,800 institutions, ranging from state universities presenting transcript information in traditional formats to experimental colleges for which transcripts consisted of essay evaluations of student projects to trade schools where transcripts were handwritten, were processed. All of this information was converted into standardized records, with decision rules reviewed by an external panel of registrars and institutional research officers. Approximately 370,000 courses were coded in a taxonomy of 1,178 categories (based on the taxonomy in Adelman 1999b) with the advice of six external faculty review teams covering fields ranging from the humanities to engineering to office occupations.
G8 62

The next step in the process involved reassembling all the paper and records by student, followed by the construction of Beta analysis files, testing, and re-examination of the transcript documents to resolve ambiguities and contradictions. These tasks necessitated (1) three line-by-line readings for the approximately 8,900 students for whom in-scope transcripts were received, (2) catalog and Web-based catalog readings of course descriptions covering approximately 40,000 coding cases, (3) dozens of phone calls to registrars, and 4) the construction of transcripts from schools that students did not tell interviewers they had attended, but from which transfer credits appeared on other transcripts.
The postsecondary transcripts also contained information previously recorded in the NELS files as missing (e.g., test scores, Advanced Placement credits, high school location, and high school graduation date and status). In some cases, the postsecondary transcripts contradicted the extant electronic record of students’ secondary school histories. This information spilled over into the editing of the NELS high
’
school files.
After the penultimate files were constructed, they were passed to an external contractor, who checked every piece of data for consistency and formatting, as well as the logic for every variable. This rigorous quality control process extended for nearly 5 months.
7. Suggestions for Further Exploration
The tables in this E.D. Tabs suggest many other topics for further exploration by independent researchers. These include the following (with reference to the tables above):
Tables 1-3 exhibit the highest degree earned by 1992 12th-graders who entered postsecondary education., but do not deal with the broader issue of access and participation. A presentation of the extent of postsecondary access and participation by all 1992 NELS participants (some who were in 12th grade, some who had graduated early from high school, some who were out of grade sequence, and some who had dropped out of school) would provide a broader portrait. Tables 1-3 also do not engage the question of how much time it took students to earn undergraduate degrees. Once that question is raised, the factors associated with time-to-degree could be explored, including number of institutions attended, credits-by- examination, use of summer terms, academic performance, remediation, and others.
Transcripts provide evidence of program completion, but because they were received at different times and because institutions observe different schedules in updating student records, the transcript record may understate student attainment in some cases. For this reason, two variables were created for the NELS:88/2000 Postsecondary Transcript Files that flag students who, on the basis of academic and credit momentum, would likely have been degree recipients by December of 2001-a year after the concluding date of the study.6 These variables, called BALIKELY and ASSOELIG, are not used in the E.D. Tabs tables, but researchers can consider them when building their own analysis files and confronting the topic of highest degree earned.
Table 4 and its account of students who earned no degrees in terms of the range of credits they did earn by the concluding date of the study invites explication of two subgroups: the incidental students who earned 10 or fewer credits and long-term noncompleters who earned 60 or more credits but no degree.
bTne threshold criteria for BALIKELY were enrollment in a 4-year college in 2000 with (la) more than 90 earned additive credits, (2) a GPA more than 2.75, and (3) a true major indicated on the transcript of the student’s current institution. The threshold criteria for ASSOELIG were enrollment in a community college with (1) more than 65 credits; (2) earned additive credits in the humanities, social sciences, and sciences; (3) a passing grade in English composition; (4) a passing grade in a college-level mathematics course; and (5) an overall GPA more than 2.5.
63 6 9 BESTCOPY AVAPUBLE

Tables 6 and 7 open up the issue of geographic mobility of postsecondary populations. Did students migrate to another state for postsecondary education and stay there? Did they move somewhere else? Did they return to the state of their high school? Or did they stay in state for their postsecondary education? The NELS:88/2000 files offer the possibility of mapping such movements at four points in time.
Tables 9 and 10 implicitly explore the question of the extent of transfer from community colleges to 4- year institutions and the success of transfer students. Are transfer students who earn associate’s degrees from community colleges prior to transfer more likely to complete bachelor’s degrees than those who do not? To what extent do those students who alternate attendance between 2-year and 4-year colleges eventually transfer and earn degrees?
Table 11 is concerned with the relationship between high school and college coursetaking in mathematics. The same form of exposition can be applied to the sciences and, coupled with survey data on the intensity of students’ interest in science, intended college major, and actual college major.
Tables 12 and 13 bring bachelor’s degree major into focus. This topic calls for an account of major by race/ethnicity and gender, with comparisons to previous grade-cohort longitudinal studies. These tables use four curriculum clusters (computer science, computer related, foreign languages, and international studies), but there are dozens of other clusters available for analysis in the NELS:88/2000 (e.g., upper- level laboratory science, ethics, fine and performing arts, history, and graphic arts and design).
Table 13 does not indicate the degree of competence in one or more languages other than English that may have been attained by students in a number of ways (including home language background). For that, researchers are referred to another composite variable in the NELS:88/2000 Postsecondary Transcript Files, LOTECOMP, which builds on a number of proxy measures of competence-for example, the number of credits earned in advanced courses in a given language and/or passing language competence examinations (the restricted file includes codes for Advanced Placement, CLEP, and institutional language exams).
Table 16 provides information on the mean undergraduate GPA by selectivity of the first institution of attendance, but does not do so by selectivity of the institution awarding the degree or the distribution of letter grades by institutional selectivity, topics that are much discussed in the general media and trade press.
Analysts might wish to probe beneath the surface of table 17 to determine what kind of remedial work was at issue and whether the student also took remedial courses in high school.
Following previous U.S. Department of Education analyses (e.g., see Adelman 1999a), and in addition to the three high school performance measures presented in tables 18-20, researchers may wish to consider other precollege student characteristics variables in the NELS:88/2000 Postsecondary Transcript Files, such as socioeconomic status quintile (SESQUINT), whether the student became a parent by the modal senior year of high school (CHLD92), and consistency and level of the student’s educational goals (EDUANTIC), among others. In addition to the three indicators of first-year performance that are the subjects of tables 18-20, researchers may also wish to consider such matriculation and postmatriculation variables as the extent of delay of entry into postsecondary education (DELAYTRI), the nature of the true first institution of attendance in terms of Carnegie type (REFITYPE) and selectivity (REFSELCT), and continuity of enrollment (CONTIN), among others.
64

8. Weights Used for Each Table
Table # Weights used
1 F4F2P 1 WT 2 F4F2P2WT 3 F4F2P2WT 4 F4F2P2WT 6 F4F2P2WT 7 F4F2P2WT 8 F4F2P2WT and F4F2HP3W 9 F4F2P3WT 10 F4F2P2WT 11 F4F2HP3 W 12 F4F2P2WT 13 F4F2P2WT 14 F4F2P2WT 15 F4F2P2WT 16 F4F2P3WT 17 18 19 20
F4F2P2WT and F4F2HP3W F4F2HP3 W F4F2HP3 W F4F2HP3 W
9. Software Used to Construct Tables
All tabular results in this report were produced with AM statistical software, a product of the American Institutes for Research (httD://am.air.org). This software computed the table estimates and standard errors using Taylor series methods, based on the weight (as designated in this table), as well as the cluster (PSUFU4) and stratification (STRATFU4) variables for each analysis.
10. Definitions of Variables Used in This E.D. Tabs Presentation
Selection Variables:
Likely Participants
Based on the variable NELSSTAT. Includes all students for whom at least one in-scope transcript was received, plus the following three groups: (1) transcripts requested, none received, but student is a likely participant based on loan disbursement records in the NSLDS (National Student Loan Data System) file; (2) transcripts requested, none received, but student is a likely postsecondary participant based on hisher account of attendance, postsecondary experiences, attainment, occupation, income, financing of postsecondary education, and high school background (including Advanced Placement coursework and test scores); and (3) student claimed postsecondary
65
71

attendance but transcript was not requested (principally because the institution the student claimed to have attended was outside the United States); nonetheless, the student is a likely postsecondary participant based on either a loan disbursement in the NSDLS file or account of attendance, attainment, etc.
Participants Who Earned More Than 10 Postsecondary Education Credits
Students were selected using the criteria of greater than 10 total postsecondary education credits (TCREDB710).
Bachelor’s Degree Recipients
Bachelor’s degree recipients were selected using the criteria of a bachelor’s degree indicated on at least one transcript (DEG4=1).
First Postsecondary Year Analyses
Analyses were conducted using the students for whom the following criteria were met: a true first date of attendance could be determined at the student’s true institution of first attendance and the student attempted any credits within the calendar year following that date. The dependent variables used in these tables (credits earned in first postsecondary year [TCREDG], ratio of earned to attempted credits in first postsecondary year [CRDRATI], and grade point average quintile in first postsecondary year [GPAIQ], respectively) are only determined for students who fulfill these criteria; thus, no further selection other than those who have valid values on these variables is necessary.
Variables Used in Tables:
Academic Intensity Quintile
Derived from the NELS:88 High School Transcript Files (1992). The procedure starts with the highest observed level of curriculum across each of its major components (highest level of math, total mathematics credits, total Advanced Placement courses, total English credits, total foreign language credits, total science credits, total core laboratory science credits, total social science credits, total computer science credits), setting the floor for that configuration at the first of what becomes a 32-descending-step variable that is then rendered in quintiles to smooth out otherwise occasional lumpy distributions. ACCURHSQ.
Further elaboration of academic intensity in high school curriculum is as follows:
For the NELS:88/2000,32 levels of academic intensity of a student’s high school curriculum were determined, following the procedure and paralleling similar levels defined for the High School and BeyondSophomore Cohort (see Adelman 1999a).
The determination of academic intensity is confined to those students with complete high school records for grades 10, 11, and 12, and, when local high school transcript practice did not distinguish grade levels, those students with summary records.
The methodology calls for starting with the highest observed level of curriculum across each of its major components (mathematics credits, level of mathematics, total number of Advanced Placement courses,
66
7.2

English credits, foreign language credits, science credits, core laboratory science credits, social science credits, and computer science credits). The highest observed levels were highest mathematics at the calculus, precalculus, or trigonometry level; more than one Advanced Placement course; any Carnegie units in computer science; 3.75 or more Carnegie units each in mathematics and English; more than 2 Carnegie units each in science, foreign languages, and social sciences; and no remedial courses (mathematics, reading, or English) This configuration was set as Level 1 of the 32 levels of academic intensity. Level 2 drops the computer science criterion and lowers the Advanced Placement threshold to one course.
Distributions of units earned, by component, were set forth and placed in parallel columns so that clear breaks (e.g., between 2.5 and 2.0 units of science credits) could be observed and matched. A descending set of intensity levels was then marked. This version was tested for the lumpy distribution it produces, and then modified to reduce distortions. For example, at a level in the distribution where all students show the highest level of mathematics at algebra 2, no Advanced Placement units, 3 or more units of English, 2 or more units of core laboratory science, 2 or more units of foreign language, 2 or more units of social science, and no computer science, one level might bulge to nearly 10 percent of the sample while the next level in the descending sequence might yield only 2 percent of the sample. By adding a requirement for more than 1/2 unit of computer science to the first level, the lump was deflated and students moved down to subsequent levels so that the distribution was less distorted. After 20 iterations of this process, 32 clear levels of curriculum units earned were established. These were then arrayed in quintiles to smooth out even more of the statistical noise that inevitably arises.
The quintile versions of the academic intensity levels are used in this document. The elaboration of each of the 32-level version of academic intensity can be found on CD-ROM (“NELS: 1988-2000 PETS 4th Follow-Up,” NCES 2003402) in a supplementary folder containing the SAS programs that produced high school-related variables.
Bachelor’s Degree Major
From the NELS:88/2000 Postsecondary Transcript Files. Students who earned bachelor’s degrees: 100 major codes are aggregated into 12 categories. BAMJR.
Calculus & Advanced Math Credits
Computed from the NELS:88/2000 Postsecondary Transcript Files. All earned credits in course codes for calculus, calculus for business/life science, brief calculudcalculus survey, differential equations, advanced statistics, and advanced mathematics topics (e.g., abstract algebra). MTHCRD3.
Class RanWGPA Quintile
Derived from the NELS:88 High School Transcript Files (1992). Class rank percentile was computed only for those cases where (1) both class rank and class size were available, (2) where class size was greater than 10, and (3) where the student had received a standard high school diploma. Where class rank was missing but high school GPA was available, both variables were set on ascending percentile scales, observing where the quintile breaks occurred and applying the quintile brackets to those cases where class rank was missing but GPA was a positive value. CLSSRNKQ.
7 3 67

Combination of Institutions Attended
Derived from the NELS:88/2000 Postsecondary Transcript Files, in combination with the NELS:88 third follow-up file (1994) and fourth follow-up file (2000). Schools are classified as 4-year, 2-year, and other sub-baccalaureate. All transcripts requested, excluding those received but out-of-scope, were used in the construction of the variable. INSTCOMB.
Computer-Related Credits
Computed from the NELS:88/2000 Postsecondary Transcript Files. Includes applications courses taught in disciplines other than computer science (e.g., graphics and design, agriculture, and business), general software package applications courses, computer science, computer engineering, introduction to computing, computer/information technologies, management information systems, and basic computer literacy. CRELCRD
Computer Science Credits
Computed from the NELS:88/2000 Postsecondary Transcript Files. The course codes for computer science included only those that were core to the field and its majors plus computer applications in engineering. Other applications courses and general computer literacy courses were excluded from the core. COMPSCRD.
Consolidated Highest Degree Earned
Derived from both the NELS:88/2000 Postsecondary Transcript Files and the NELS:88 fourth follow-up survey (2000). The variable (1) distinguishes among different kinds of incomplete graduate degrees, (2) indicates where a student’s report of a degree cannot be validated by the evidence of the transcript files, and (3) includes cases in which, while no transcripts were received for the student, other evidence from the student’s history supports the report of earning a degree. CONSDEG.
Continuity of Enrollment
Derived from the NELS:88/2000 Postsecondary Transcript Files. In an 8.5-year transcript history, the judgment of “noncontinuous” requires a break of more than one semester or two quarters, or their equivalent, not including summer terms. If this break occurred after 3 full years of continuous enrollment following the first date of postsecondary entry after high school, then judgment of “late discontinuity” was applied. In addition, a student who dropped all courses in a given term was not considered enrolled for that term. CONTIN.
Credits Attempted in First Calendar Year
Computed from the NELS:88/2000 Postsecondary Transcript Files. All additive credits attempted during the 11 months following the first true date of enrollment in any postsecondary institution. Excluded from the definition are remedial courses and credits- by-examination. TCRDATTl .
68 7$

Credits Earned in Community Colleges
Additive credits earned in all community colleges attended by the student. Derived from the NELS:88/2000 Postsecondary Transcript Files. TCREDCCL
Credits Earned in First Calendar Year
Computed from the NELS:88/2000 Postsecondary Transcript Files. All earned additive credits during the 11 months following the first true month of enrollment in any postsecondary institution. Credits-by-examination are excluded. TCREDG.
Doctoral Institution
Any postsecondary institution that confers a Ph.D. Tables 8 and 17 report frequencies for the first institution attended, and the category of “doctoral institution” uses the value REFITYPE = 1. (REFITYPE is the student-level variable based on the transcript-level variable ITYPE. ITYPE is a variable that consolidates 35 modified Carnegie Class types of institutions into 7. The Carnegie Classification used was that which was in effect when the majority of NELS students entered postsecondary education (1992). “Doctoral institutions” cover Carnegie Classes 11, 12, 13, and 14.)
Engineering Path
Derived from the NELS:88/2000 Postsecondary Transcript Files. There are 12 values that describe the histories of 4-year college students (who may also have attended other types of institutions) who reached a curricular threshold consisting of at least (1) precalculus, (2) an introductory engineering design course, (3) an introductory course in an engineering specialty (chemical, civil, mechanical, etc.), and/or (4) computer applications in engineering or engineering graphics/ computer-assisted design (CAD). The factors included in the values combine academic performance, whether the student left engineering (for another science/technology discipline or a nonscience/technology field), degree completion, and (for bachelor’s degree recipients) continuation to graduate school in a science/technology or other type of field. In addition, there are 3 values describing the histories of pre-engineering students whose postsecondary careers were spent principally in 2-year institutions. The engineering path categories in table 14 recoded the variable EPATH into seven categories using this scheme: { 1=100,600,230; 2=210, 310; 3=220,320; 4=411,412; 5410,420,430; 6=520; and 7=500,510} EPATH.
First True Institution of Attendance
Derived from the NELS:88/2000 Postsecondary Transcript Files. Excludes attendance at postsecondary institutions in which the student was enrolled (1) while still in high school and (2) in the summer between high school graduation and fall college entry (unless the student enrolled in the same institution in the fall), as well as “false starts” (i.e., when a student dropped all courses and left in the ostensible first term of enrollment, only to return at another time in another institution). REFINST.
75 69

Foreign Language Credits
Computed from the NELS:88/2000 Postsecondary Transcript Files, includes earned credits in all languages other than English at all levels (introductory, intermediate, advanced, literature). FLANCR3.
Grade Point Average (Undergraduate)
From the NELS:88/2000 Postsecondary Transcript Files. All grades on transcripts, whether letter or numerical, were converted to a 4-point scale, with special designations for grades indicating in-process status, audits, no-penalty withdrawals, and no-grade pass. At the same time, all nontransfer term credits were standardized on a semester metric, and a passflag was created to indicate all courses for which the conditions for earning credits were met. Then a GPA flag was created for all courses and credits subject to inclusion in the computation of a GPA of any kind. For undergraduate GPA, all credits and grades earned either prior to the date at which the bachelor’s degree was awarded or, if no bachelor’s degree was earned, the last term date of attendance, were included. GPA.
Grade Point Average Quintile in First Year
From the NELS:88/2000 Postsecondary Transcript Files. Each student’s record was marked with a “REFDATE,” the first month of the first term of attendance at the first true institution of attendance (see REFINST). All courses, credits, and grades between that month and 11 months following were included in the computation of a first-year GPA, which was then set on a percentile scale and subdivided by quintiles. GPAlQ.
Highest Degree Earned
Derived from the NELS:88/2000 Postsecondary Transcript Files, with values ranging from 1 (no degree) to 9 (Ph.D.). Two values (5 and 6) describe different kinds of postbaccalaureate activity: coursework (value 5 ) and incomplete graduate degrees of any kind (value 6). HDEG.
Highest Math in High School
Derived from high school transcripts collected and coded as part of the NELS:88 second follow-up (1992), edited with reference to Advanced Placement test scores and first-term postsecondary mathematics coursetaking indicated on the college transcripts. HIGHMATH.
International Studies Credits
Derived from the NELS:88/2000 Postsecondary Transcript Files, includes earned credits in all area studies, international business/marketing/agriculture/ economics/law/environment/communication, national security studies, geography of world issues, diplomacy, international relations, international political economy, and others. INTLCRD.
70

Other 4-Year College
From the NELS:88/2000 Postsecondary Transcript Files. Four-year colleges other than doctoral institutions. Tables 8 and 17 report frequencies for the first institution attended, and the category of “other 4-year college” uses the values REFITYPE = 2 and REFITYPE = 3. (REFlTYPE is the student-level variable based on the transcript-level variable ITYPE.) RYPE = 2 (comprehensive colleges), ITYPE = 3 (baccalaureate colleges), and ITYPE = 4 (specialized 4-year colleges, such as colleges of addesign). The institutional-type classifications are based on the Carnegie Class system in effect in the year when the majority of NELS students entered postsecondary education (1992). “Other 4-Year college” covers Carnegie Classes 2 1,22, 3 1’32, and, for analyses of undergraduate careers only, Carnegie Classes 50-59 institutions (specialized, 4-year),
Other Sub-Baccalaureate
From the NELS:88/2000 Postsecondary Transcript Files. Institutions other than community colleges that confer certificates or associate’s degrees. Tables 8 and 17 report frequencies for the first institution attended, and the category of “other sub- baccalaureate” uses the values REFITYPE = 6 and REFITYPE = 7. (REFITYPE is the student-level variable based on the transcript-level variable ITYPE.) ITYPE = 6 (private not-for-profit and private for-profit associate’s degree-granting) and ITYPE = 7 (less- than-2-year institutions).
Parents’ Highest Level of Education
Derived from the NELS:88 Parent Interview File (1992). Highest level of education reported by any of the student’s parents at the time of the interview. PARED.
Ratio of Credits EarnedKredits Attempted in First Calendar Year
Computed from the NELS:88/2000 Postsecondary Transcript Fiies. Tie ratio of TCREDG to TCRDATTl. CRDRATI.
Remedial Course
Derived from the NELS:88/2000 Postsecondary Transcript Files. In the taxonomy of 1,178 course categories used for coding, courses classified as remedial included all precollegiate mathematics (5 codes), remedial reading, English as a Second Language, remedial writing and communications courses that carried nonadditive credits (credits that do not count toward a degree), remedial science, precollege chemistry, general basic skills, and GED preparation. Because nearly all of these courses do not carry credits, the metric of counting course cases is used. REMCRSE.
Remedial Mathematics Courses
From the NELS:88/2000 Postsecondary Transcript Files. Five of the 1,178 codes used for course-coding were flagged as indicating precollegiate mathematics: general develop- mental math, arithmetic, plane geometry, algebra 1, and arithmetic-based business mathematics. Intermediate algebdalgebra 2 was included only if the institution granted
71 77
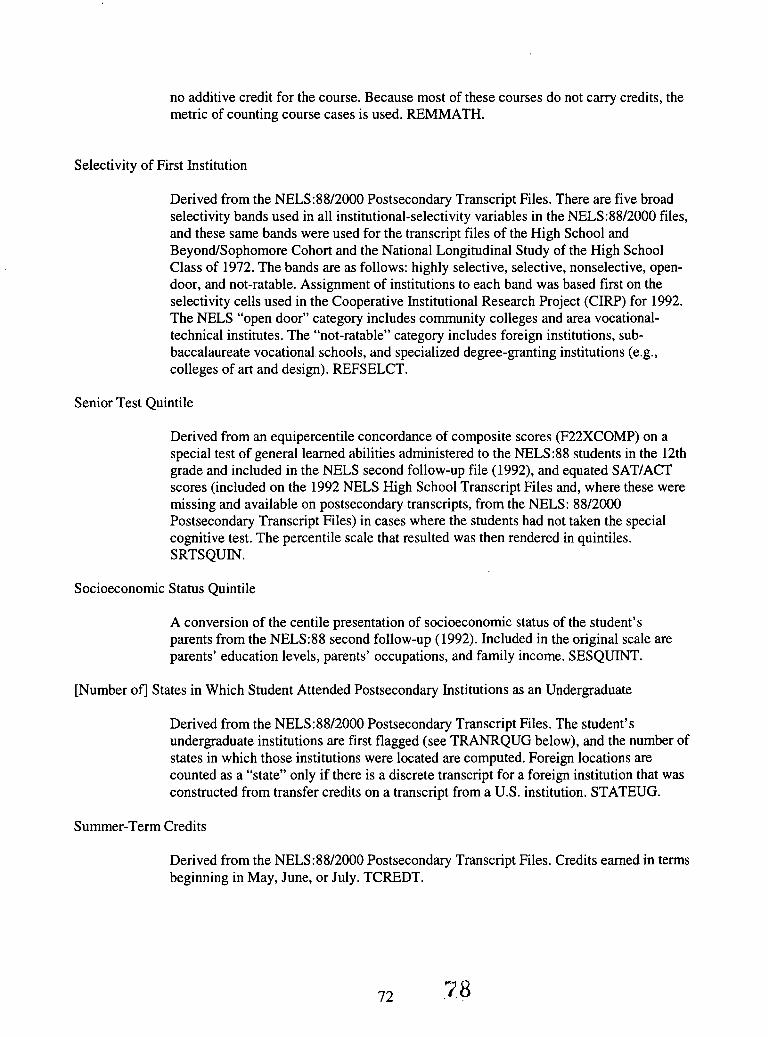
no additive credit for the course. Because most of these courses do not carry credits, the metric of counting course cases is used. REMMATH.
Selectivity of First Institution
Derived from the NELS:88/2000 Postsecondary Transcript Files. There are five broad selectivity bands used in all institutional-selectivity variables in the NELS:88/2000 files, and these same bands were used for the transcript files of the High School and BeyondISophomore Cohort and the National Longitudinal Study of the High School Class of 1972. The bands are as follows: highly selective, selective, nonselective, open- door, and not-ratable. Assignment of institutions to each band was based first on the selectivity cells used in the Cooperative Institutional Research Project (CIRP) for 1992. The NELS “open door” category includes community colleges and area vocational- technical institutes. The “not-ratable” category includes foreign institutions, sub- baccalaureate vocational schools, and specialized degree-granting institutions (e.g., colleges of art and design). REFSELCT.
Senior Test Quintile
Derived from an equipercentile concordance of composite scores (F22XCOMP) on a special test of general learned abilities administered to the NELS:88 students in the 12th grade and included in the NELS second follow-up file (1992), and equated SAT/ACT scores (included on the 1992 NELS High School Transcript Files and, where these were missing and available on postsecondary transcripts, from the NELS: 88/2000 Postsecondary Transcript Files) in cases where the students had not taken the special cognitive test. The percentile scale that resulted was then rendered in quintiles. SRTSQUIN.
Socioeconomic Status Quintile
A conversion of the centile presentation of socioeconomic status of the student’s parents from the NELS:88 second follow-up (1992). Included in the original scale are parents’ education levels, parents’ occupations, and family income. SESQUINT.
[Number of] States in Which Student Attended Postsecondary Institutions as an Undergraduate
Derived from the NELS:88/2000 Postsecondary Transcript Files. The student’s undergraduate institutions are first flagged (see TRANRQUG below), and the number of states in which those institutions were located are computed. Foreign locations are counted as a “state” only if there is a discrete transcript for a foreign institution that was constructed from transfer credits on a transcript from a U.S. institution. STATEUG.
Summer-Term Credits
Derived from the NELS:88/2000 Postsecondary Transcript Files. Credits earned in terms beginning in May, June, or July. TCREDT.
72 .% 8

[Number of] Undergraduate Institutions
Derived from the NELS:88/2000 Postsecondary Transcript Files. Within each student’s history, all requested transcripts were first classified by degree level. Only those that were not flagged as exclusively graduate-level are counted here, and all institutions from which these transcripts were requested are included in the count. TRANRQUG.
11. For Further Information
Electronic links to some reports can be found on the NCES web site (http://nces.ed.gov/survevs/nels88/) or through the U.S. Government Printing Office (http://www.mo.gov/). Most of these publications are also available through the ERIC system (http://www.askeric,org for the electronic catalog to the ERIC database). In addition to methodological documents, many research publications have been developed using NELS:88 data. For a comprehensive list of these publications, see the NELS:88 annotated bibliography on the NCES web site.
NCES has collected longitudinal data for about 30 years. Starting in 1972 with the National Longitudinal Study of the High School Class of 1972 (NLS:72) and continuing to the most recent study, the Education Longitudinal Study of 2002 (ELS:2002), NCES provides longitudinal data to education policymakers and researchers that link secondary school educational experiences with important outcomes such as labor market experiences and postsecondary education enrollment and attainment. For more information about these studies and available public-use or restricted-use data files, including the data file used in this report, contact Jeffrey Owings, NCES, at (202) 502-7423. Specific questions about the transcript data collected in NELS:88/2000 and the contents of this report should be directed to Clifford Adelman, Institute of Education Sciences, at (202) 219-2251.
79 73

U.S. Department of Education ED Pubs 8242-8 Sandy Court Jessup, MD 20794-1 398
Official Business Penalty for Private Use, $300
U.S. POSTAGE PAID U.S. DEPARTMENT OF EDUCATION
PERMIT NO. G 1 7
80

U S . Department of Education Office of Educational Research and Improvement (OERI)
Nafional Library of Education (NLE) Educational Resources /n formation Center (ERIC)
NOTICE
Reproduction Basis
This document is covered by a signed "Reproduction Release (Blanket)" form (on file within the ERIC system), encompassing all or classes of documents from its source organization and, therefore, does not require a "Specific Document" Release form.
This document is Federally-funded, or carries its own permission to reproduce, or is otherwise in the public domain and, therefore, may be reproduced by ERIC without a signed Reproduction Release form (either "Specific Document" or "Blanket").
EFF-089 (312000)