document resume a cost-effectiveness analysis … of the machine processing center of the department...
TRANSCRIPT
DOCUMENT RESUME
ED 073 303 VT 019` 087
TITLE A Cost-Effectiveness Analysis of the VocationalEducation Program in Puerto Rico.
INSTITUTION Peat, Marwick, Mitchell and Co., New York, N.Y.SPONS AGENCY Office of Education (DREW), Washington, D.C.; Puerto
Rico State Dept. of Education, Hato Rey. Area forVocational and Technical Education.
PUB DATE 71NOTE 151p.
EDRS PRICE MF-$0.65 HC- $6.68-DESCRIPTORS *Cost Effectiveness; *Educational Programs; Post
Secondary Education; *Program Budgeting; ProgramCosts; Program Evaluation; Program Planning; *UnitCosts; *Vocational Education; Vocational Schools;Vocational Training Centers
IDENTIFIERS *Puerto Rico
ABSTRACTTo assist decision makers in appropriating funds
wisely for vocational school programs, this study was undertaken to:(1) conduct a cost effectiveness analysis of vocational programsadministered by the Department of Education, (2) determine variationsin unit costs of programs and curricula, (3) identify factorscontributing to variations in unit costs, and (4) array programs fromthe highest rated utility function to the lowest. Some of the majorconclusions reached from the cost-analysis technique were: (1) Thereare considerable cost variations among the districts, (2) Costvariation depends heavily on the number of graduates by districts aswell as on the number of courses offered under a program oroccupation, (4) Scientific-technical courses increase the absolutecost of a program as opposed to nontechnical courses, and (5) Costsare affected by the level of courses offered. In regard to thecost-benefit analysis, it was concluded that: (1) technical coursesgenerally bring about a higher level of learnings than donontechnical courses, and (2) benefits are seriously affected by thenumber of graduates joining the labor force and finding employment ona full and/or part-time basis. :Author/SN)
FILMED FROM BEST AVAILABLE COPY I
rrNCDre'N A COST-EFFECTIVENESS ANALYSIS OF THEre.N.- VOCATIONAL EDUCATION PROGRAM0ca IN PUERTO RICOui
PUERTO RICO DEPARTMENT OF EDUCATION
AREA OF VCCATIONAL AND TECHNICAL
EDUCATION
1971
U S DEPARTMENT OF HEALTH.EDUCATION & WELFAREOFFICE OF EDUCATION
T415 DOCUMENT HAS SUN REPRODUCED EXACTLY AS RECEIVED FROMTHE PERSON OR ORGANIZATION ORIG-INATING IT POINTS OF VIEW OR OWNIONS STATED 00 NOT NECESSARGYREPRESENT OFFICIAL OFFICE OF EDU-C .TION POSITION OR POUCY
A COST-EFFECTIVENESS ANALYSIS OF THEVOCATIONAL EDUCATION PROGRAM
IN PUERTO RICO
PUERTO RICO DEPARTMENT OF EDUCATION
AREA OF VOCATIONAL AND TECHNICAL
EDUCATION
1971
CO Peat. Marwick. Mitchell & Co.

The research reported herein was performed pursuant to a grant under theVocational Education Arendments of 1968. Contractors undertakin3 suchprojects under Government Sponsorship are encouraged to express freelytheir professional juk:T.ent in,the conduct of the project. Points of viewor opinions do not, therefore, necessarily represent official Office ofEducation position or policy.

PREFATORY NOTE
The purposes of this study are: (1) to conduct and-document a
cost-effectiveness analysis of the vocational-technical education programs
administered by the Department of Education; (2) to determine, to the extent
possible, variations in unit costs of the vocational-technical education
programs and curricula; (3) to identify factors contributing to variations
in unit costs; and (4) to array programs from the highest rated utility
function to the lowest.
The study also includes an analysis of the conceptual and method-
ological aspects of cost effectiveness and discusses the sources of data
for measuring costs and benefits by programs, occupations, schools, and
districts. A set of general recommendations is included at the end of
Chapter I.
In the preparation of this study, data made available from the
Departments of Education and Labor were used and a computer program, which
is described in the study, was utilized to tabulate the data into a mean-
ingful format.
Peat, Marwick, Mitchell & Co. would like to express deep apprecia-
tion for the guidance and support it has received from Dra. Maria Socorro
Lacot, Assistant Secretary for the Area of Vocational-Technical Education
of the Puerto Rico Department of Education. Conceived by Dra. Lacot, this
study is a pioneering one in Puerto Rico and is expected to have a broad
impact on a number of government programs.
Peat, Marwick, Mitchell & Co. also wishes to thank Mr. Rafael
Ortiz, Mrs. Ana Reyes de Martfnez, and Mr. IvSn Vega of the Area of
Vocational-Technical Education. Without their enthusiastic cooperation

this study would not have been possible. Thanks are likewise extended to
officials of the Machine Processing Center of the Department of Education.
To the Commonwealth Vocational Education Board, Peat, Marwick,
Mitchell & Co. wishes to express appreciation for the financing of the study.
A COST-EFFECTIVENESS ANALYSIS OF THEVOCATIONAL EDUCATION PROGRAM IN PUERTO RICO
Puerto Rico Department of EducationArea of Vocational and Technical Education
Table of Contents
Page
INTRODUCTION, SUMMARY OF CONCLUSIONSAND RECOMMENDATIONS 1
Introduction 1Purpose of the Study 2Concept and Methodology 3Utilization of this Report 6Conclusions 8Vocational Education and Government RevenuesPrivate and Social Benefits by Programs 8Cost of Vocational Education by Program 9Benefit:Cost Ratio by Programs 9Benefit:Cost Ratios of Selected Occupations 9Ratio of Benefit to Cost by Selected Districts 10Ratio of Benefit to Cost of Selected Schools 10Benefit:Cost Ratio of Dropouts 12Nonmonetary Benefits 12Vocational Education and Employment 13
Recommendations 13
GENERAL BACKGROUND 15
Broad Benefits of Education 15Function of a Vocational Program 15The Function of a Cost-Effectiveness Approach 17
Achieving Specific Demand Goals 19System for Decision-making 19System for Resolving Problems and Bottlenecks 20
CONCEPT OF COST-EFFECTIVENESS ANALYSIS 22
METHODOLOGICAL ASPECTS OF BENEFIT AND COST DATA 25
Methodological Aspects of Benefits DataBenefits to the Industry 3iBenefits to Government from Vocational Training .72
Vocational School Program and Gross Product 35Determination of Costs 36Depreciation 40

Table of Contents, Continued
COST AND BENEFITS OF VOCATIONAL
Pale
EDUCATION BY PROGRAMS 41
System of Vocational Education in Puerto Rico 42Cost of Vocational Education 45Benefits 48Unit Benefits and Costs 54Multiplier Effects of Benefits from Vocational
Education 57Total Social Benefits and Unit Cost Ratio 59Value of Discounted Future Benefits 59Government Revenues and Vocational Education 64Individual Benefits and Tax Revenues 68Benefits Attributable to Vocational Education
and Government Revenues 68Other Benefits from Vocational EducationPrograms 70
Limitations of Cost Benefit Analysis 72
COST BENEFIT ANALYSIS OF SELECTED OCCUPATIONS 74
Brief Analysis of Selected Occupations 82Draftsman 82Medical Assistant 83Electronic Technician 84Floral Designer 85Engineering and Scientific Programmer 86Secretary 87Stenographer 88Clerk Typist 88Bookkeeper II 89Baker 89Cosmetologist 90Farmer General 92Auto Mechanic -93Cabinet Maker 94Radio and T.V. Service Repairman 95Dressmaker 96Electrician 97Carpenter 97Plumber 98
BENEFITS AND COSTS OF VOCATIONAL EDUCATION BYSELECTED DISTRICTS 104
Ratio of Benefit to Cost 106Benefits by Districts 106Cost by Districts 109
Table of Contents, Continued
COST AND BENEFIT ANALYSIS BY VOCATIONAL SCHOOLS
Page
111
BENEFIT-COST ANALYSIS OF DROPOUTS 114
Dropouts by Districts 118Dropouts by Program 119Technical 122Home Economics 123Human Resources 123Dropouts by Type of School 124
APPENDIX
Computer Processing of Data ofVocational Education 1
Overall Design 2Input 2Data Conversion and Validation 3Processing 3
Bibliography
1
I - INTRODUCTION, SUM/MY OF CONCLUS IS AND RE COADIENDAT I ONS
INTRODUCTION
The goal of vocational-technical education is to produce a body of
skilled workers and technologists for employment; the goal of general educa-
tion is to produce more mature and psychologically well developed individuals
(i.e., better citizens). It is difficult to apply a cost-benefit analysis
to such a complex goal as that of general education. Cost-benefit analysis
is more applicable for an economic assessment of vocational-technical educa-
tion than it is to general education.
1/James Bryant Conant thinks that youngsters who are about to enter
the labor market need salable skills, and that their educational experiences
should fit their subsequent employment experiences. Vocational education
tends to give the student an opportunity to learn salable skills, create
feelings of usefulness and self-respect, develop initiative and dependabil-
ity and increase interest in school. Vocational education attempts to
realize these formidable characteristics in the framework of values cherished
by young people.
As with many public social programs, vocational education is being
subjected to rigorous economic. analysis which requires that costs and
benefits, both monetary and nonmonetary, be quantified. Analyses are being
used to see that vocational-technical education meets the tests of economic
efficiency, that program alternatives can be identified for achieving the
objectives of vocational education and that costs and benefits of the alter-
natives can be compared. The concern of the decision makers is that existing
1/ See David C. Gumpper, Social and Psychological Aspects of SchoolWithdrawal: A Review of thq Literature, The Pennsylvania StateUniversity, p. 10.
2
resources allocated to vocational education are efficiently used and that new
and additional resources committed to vocational education are efficiently
used for accomplishing the objectives.
Since vocational education is directed at specific types of jobs and
levels of earnings, it is imperative that costs of vocational programs be
justified on the basis of outcome. Indirect measures of the economic ef-
ficiency of vocational education program such as number of graduates, per-
centage of graduates employed, and percentage of graduates working in oc-
cupations for which they were prepared, are inadequate assessments of the
economic benefits of this type of education. For the purposes of making
decisions pertaining to resource allocation for vocational education, there is
need for more analytical information.
PURPOSE OF THE STUDY
A major purpose of this study is to assist the decision makers in
the allocation of funds for vocational school programs. The relevance of
such a study stems from increased pressures on the agencies of the
Government of Puerto Rico to justify their programs by the use of benefit -
cost analysis.
P)IM&Co. was asked to (1) "conduct and document a cost-effectiveness
analysis of the vocational-technical education programs administered by the
Department of Education," (2) "determine, to the extent possible, variations
in unit costs of the vocational and technical education programs and curric-
ula being offered by the Department," (3) "prepare and analysis of each
fattor that contributes to variations in unit costs," and (4) "array all
programs from the highest rated utility function to the lowest."

3
CONCEPT AND NETHODOLOGY
Our efforts in this study have been concentrated on cost-
effectiveness analysis. This type of analysis provides a framework for
making numerical estimates of the vocational training activities on selected
outputs available and for estimating the costs of obtaining these effects.
While concentrating on cost-effectiveness analysis, this study has
also made sufficient use of the cost- benefit analysis technique. This
technique helps to relate total value of benefits of a program to the total
costs of the program. However, the technique, when applied to vocational-
technical programs, has certain limitations, i.e., (1) a number of benefits
cannot be measured in monetary terms, (2) the utility derived from the sane
benefit differs among different individuals, and (3) it is difficult to.
measure benefits which might be accruing outside a particular community.
In cost-effectiveness analysis outputs or effects need not be
economic in nature and do not necessarily have to be expressed in monetary
terms. The most imp..rtant variables in cost-effectiveness analysis relate
to the vocational graduates' performance in the labor market. Such variables
are: employability of the graduate, annual earnings (hourly earnings and
annual hours worked), labor force participation, etc. Other output variables
are the vocational trainees' knowledge, skills and motivations. An obvious
advantage of cost-effectiveness analysis as a technique for evaluating
vocational-technical education is that is avoids the restriction which re-
quires that all benefits be quantified in monetary terms.
If data are responsive to output-oriented analysis, the costs are
not difficult to establish. However, present accounting of the Department
of Education, following the norms establit.hed by the Department of the
Treasury, is responsive to expenditures by objects. Thus, any analysis
oriented toward output must get to the raw data to identify costs by courses,
objects, schools, districts, occupations, and programs. The cost data was
classified by direct expenditures and indirect expenditures.
To measure benefits, the starting p ,a- tne data on enrollment,
dropouts and graduates of the vocational-technical program. The graduates
then were identified by their status of employment - whether full-time
employed, part-time employed, unemployed, or continuing studies. The employ-
ment data in conjunction with hourly earnings by occupation was used to
establish direct benefits. With the help of the multiplier effect, total
social benefits were established. Net benefits of vocational education were
established by deducting from total earnings the earnings attributable to
nonvocational education, Since benefits accrue over a period of.years while
costs are incurred in the present, future benefits must be discounted to
make them comparable to present costs. This was done with the help of an
index based on growth of earnings and the discount rate. Since monetary
benefits to individua-a and society are subject to various taxes, the
Government revem.ls were estimated with the help of effective rates estab-
lished by an unpublished study conducted by the Commo.alth Department of
the Treasury. Nonmonetary benefits have also been spelled out in this study.
This study, concomitant with the objective, assumes that economic
improvement is a primary objective of vocational-technical education.
Therefore, vocational courses and programs are considered to have effects
leading directly or indirectly to advances in the standard of living. These
advances are measured in terms of the net economic gains they produce, both
immediately and over the years of a person's working life. This assumption
implies that changing the number of enrollees and graduates (outputs) are
intermediate objectives, whose value in the free enterprise society depends
4

5
on the degree to which they lead to subsequent economic improvements of
i 1.viluals, society, industry, and government. This assumption also implies
that improvements in knowledge, skills, motivations and discipline are
immediate objectives, which are eventually reflected in economic improvements
and reductions in antisocial behavior as measured by type two crimes, that
is, minor crimes.
In order to isolate the net effects of the vocational-technical
education, we have estimated, with the help of the Department of Labor, the
hourly wage for individuals similar to the trainees who have not had
vocational training. The net vocational-technical training effect is the
difference between the change in earnings from before training and after
training. It must -be noted that the validity of the net effect depends on
the degree of match achieved between the trainees' earnings and nontrainees'
earnings.
Both total social benefits and net benefits from vocational-technical
education were projected into the future for six years to obtain a stream of
benefits. The empirical basis for making the projection, that is, measuring
the discounted benefits, is explained in the study.
It is assumed that future improvements in the employment data, wage
rates and hours worked per year, of the vocational graduate, would not change
the absolute total difference credited to his vocational training. Although
the number of vocational school graduates working would change due to at-
trition by death, disability, sickness, etc., the study assumes no such
changes.
The study computes the unit cost of vocational education on the
basis of number of graduates and total expenditures in 1969-70. It is
believed that an input of a certain amount of expenditures produces an output

6
of a certain number of graduates, plus a number of dropouts. Thus, the
training cost of nongraduating students is transferred to graduates. The
"graduates" constitute for the analysis of the study a measurement of "final
output."
In the processing of the data on costs and benefits for this study,
we used the computer facilities of the Department of Education. The data
processing system developed for this study is expected to serve as a tool
for future analyses of this nature. The system and computer programs have
been made available to the Department of Education.
UTILIZATION OF THIS REPORT
This report may be utilized for several purposes, both internally
within the Department of Education and externally by other agencies within
the Commonwealth Government.
Department of Education
1. This report may serve as the basis for justification of plannedexpenditures within the vocational educational program during the prepara-tion of the annual budget. Each dollar spent on a specific vocationalprogram may be shown to yield specific dollar benefits to the Puerto Ricancommunity.
2. This report may serve as a means for allocating vocationalfunds among alternative courses, geographic regions, and individual schools.Ideally, with an unlimited source of funds, additional funds could beexpended in each program and geographical region until the cost to benefitratios were all equal to unity. However, this is not the case since we havelimited funds which must be allocated among various alternatives in the mosteffective possible manner. The benefit to cost ratios developed in thisstudy may be combined in a linear or nonlinear programming model with givenconstraints upon the vocational system in order to optimize the alloceion ofavailable funds among the available alternatives. Our benefit to cost ratiosmay also serve as a quick rule of thumb to aid the Department in decidingbetween two or more alternatives--funds should be expended on the alternative.with the highest benefit to cost ratio.
3. This report may be utilized to begin an internal cost reductionsystem for the vocational educational program. Those vocational programswith above average unit costs (i.e., cost per graduate) should be examinedcarefully to determine whether the cost could be reduced by consolidatingthe number of course offerings, reducing the number of schools offering thesame program within the same geographic region at the same time, or a
combination of both. The Department of Education may also expand upon thereport by collecting and identifying cost information for each of its schoolsoffering vocational programs. The methodology and computer programs developedby PMM&Co. for this study will facilitate their collection and analysis ofadditional data. Costs could be compared by program, school, and by schoolwithin a given district. The difference among the unit costs per school wouldserve as an effective tool for determining relative efficiency within thesystem as well as serving as a basis for determining potential areas ofreduction--either in the number of course offerings at a given school or inthe consolidation of courses offered on a regional basis. In addition, theDepartment of Education would be able to compare its unit cost per programto figures for similar programs in other states. Although the derivation ofthe unit cost figures may differ, along with the quality of instruction, thecomparison may nonetheless prove valuable.
Other Governmental Agencies
1. Budget Bureau - Governor's Office:
This report may serve as an example of cost-benefit analysis being
used within certain segments of the government to provide a rationale for
expenditures on projects based upon their expected return to the Puerto Rico
community. In addition, this type of analysis may be utilized to allocate
available government funds among competing alternatives based upon their
cost-benefit ratios.
2. Legislature
The Legislature may use this report as a basis for deciding on
appropriations for vocational education programs and expenditures in other
areas. At the very least, the Legislature would be able to determine the
return for additional expenditures on vocational projects.
3. All agencies:
All other governmental agencies may examine this type of analysis
for their own internal use in control and budgeting. When cost-benefit
analysis is applied successfully to one agency's problems, it may then be
utilized by other agencies.
7
8
CONCLUSIONS
Vocational Education andGovernment Revenues
1. One of the major conclus4ons emerging from the study is that ifthe opportunity cost of the vocational-technical trainees is considered to bezero, the return to the Government in the form of tax and nontax revenues is69.7 per cent of the total expenditures incurred on the job-oriented vocationalprograms of the Department of Education. The Government of Puerto Ricoincurred $23.5 million of expenditures in connection with vocational-technicaleducation programs in 1969-70. The program produced 26,500 graduates, whowithin one year of work created private benefits of $58.4 million and socialbenefits of $116.9 million. These social benefits brought back to theGovernment of Puerto Rico $16.4 million. This means that the social benefitsderived over a period of about 17 months reimbursed the Government ofPuerto Rico for the total expenditures incurred by job-oriented vocational-technical education for the preceding 12 months.
2. From the revenue standpoint the most lucrative vocationalprograms were Distribution, Human Resources, Industrial Arts, Trade andIndustry, and Office Occupations. The return to the Government from theprograms of Agriculture, Health, Technical and Cooperative IndustryOccupations was low due mainly to the fact that the social benefits generatedby these programs were low.
Private and Social Benefits by Programs
3. Total private benefits to graduates amounted to $58.4 millionwithin a period of 12 months of their commencing work. With the multipliereffect of 1:1, the total social benefits are estimated to amount $116.9million, or 3.2 per cent of the 1970 net income of Puerto Rico.
4. Private benefits to graduates, per program, can be arranged fromthe highest to the lowc4t as follows: Distribution - $22.4 million, Trade andIndustry - $15.3 million, Office Occupations - $6.8 million, Human Resources,Industrial Arts - $5.4 million, Home Economics $3.6 million, Health - $1.9million, Agriculture $1.1 million, and Cooperative Industry Education -$0.7 million.
5. Unit benefit was the highest in the case of the Technical p-ogram,followed by Health, Human Resources, Industrial Arts and Distribution. Lnitbeaefits were low in the cases of Agriculture, Home Economics and OfficeOccupations.
6. The present value of a stream of social benefits, projected fiveyears into the future, attributed to vocational-technical education, was highin the case of the technical program at $11,363, Health $9,493, Distribution$9,348, Human Resources, Industrial Arts $8,785. On the other hand, suchbenefits from Home Economics, Agriculture, and Trade and Industry were low.
9
Cost of Vocational Education by Programs
7. Total cost of job-oriented vocational-technical educationamounted to $23.5 million, of which 26.1 per cent was spent on Trade andindustry, 13.5 per cent on Home Economics, 12.5 per cent on OfficeOccupations, 10.9 per cent on Health, 8.8 per cent on Agriculture, 8.4 percent on Technical, 7.2 per cent on Cooperative Industry Education, 6.4 percent on Distribution, and 6.0 per cent on Human Resources and Industrial Arts.
8. The largest: percentage of total expenditures was incurred bysalaries, with a total of 48.8 per cent, followed by Administrative expen-ditures at 14.8 per cent, building and improvement 5.7 per cent, books andmaterials 4.1 per cent, maintenance 3.7 per cent, equipment and furniture7.6 per cent, overhead 10.5 per cent, and miscellaneous expenditures 4.8 percent. The individual programs, however, had significant variations in themix of expenditures. For example, the Trade and Industry program absorbed63.7 per cent in the form of salaries and wages of the total expenditures onthe program, as compared to 28.7 per cent for the Technical program.
9. Unit cost varied markedly from program to program. The Technicalprogram had a unit cost per graduate of $5,298 and the Distribution programhad a unit cost of $175. The unit cost of the Agricultural program was highat $4,240 and Office Occupation program was as low as $725.
Benefit:Cost Ratio by Programs
10. There were a number of programs where the benefit:cost ratioexceeded unity. Human Resources and Industrial Arts had a benefit cost ratioof 3.8:1, Trade and Industry 2.5:1, Office Occupations 2.3:1, Home Economics1.1:1. The highest benefit:cost ratio was for the Distribution program at14:1. In the case of the Agricultural program, benefit:cost ratio was low at0.54:1. As a general rule when the benefit:cost ratio exceeds unity, thecorresponding activity is economically superior to an alternative activitywith a lower-than-unity benefit:cost ratio. If purely economic criteria areto be used in determining vocational expenditures, then the programs chosenshould be those having the highest benefit:cost ratios. However, the decisionmakers may elect to consider additional criteria of a noneconomic nature(such as "keep the kids off the street") in the decision-making process.
10.a. In deriving the preceding conclusion, the study used only oneyear as the source of benefit to the individual. However, if two years areused, the benefit:cost ratio in almost all the programs will be more thanunity. It may be noted that the working life of a vocational graduate isabout forty-five years and the benefits will accrue over all those years.
11. When the present value of the 04 five future-year stream of socialbenefits per graduate attributed to vocational education is compared with theunit cost, all the programs have benefit:cost ratios above unity. The ratiosare in the range from 1.3:1 in the case of the Agricultural prograa to53.4:1 in the case of the Distribution program.
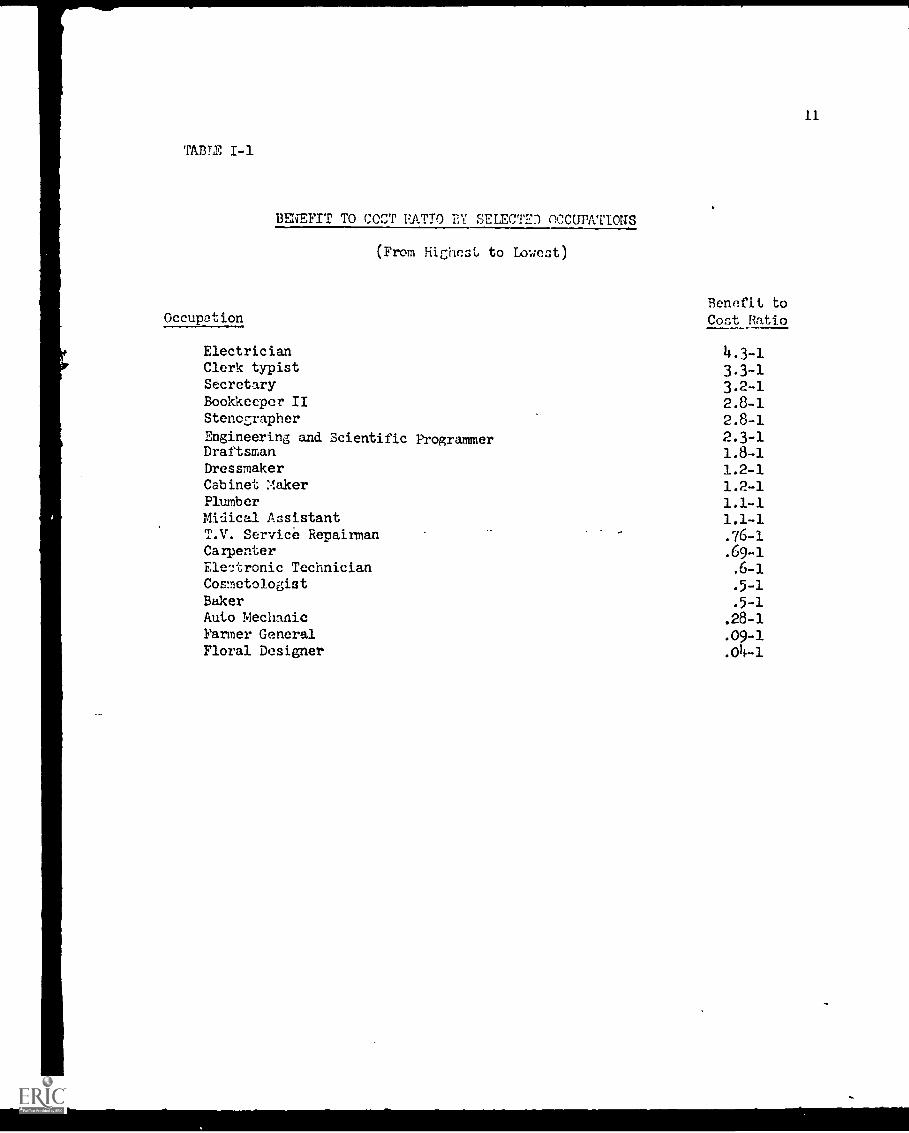
Benefit:Cost Ratios of Selected Occupations
12. A nucleus of courses or a combination of courses is required fora trainee to enter a particular trade or occupation. One part of the study
10
compared specific costs of courses to specific benefits from specific oc-cupations. Since the Department of Education gives hundreds of courses toprepared trainees for hundreds of occupations, the study selected only19 occupations for detailed analysis. Benefit:cost ratios for the selectedoccupations are arrayed from the highest to the lowest as shown in theattached table. It may be noted that each one of the l9 occupations isdiscussed in Section VI of this study.
13. Variations in benefit:cost ratios depended very heavily onvariations in costs, and to some extent on unit benefits. Unit benefitsdepended on hourly wage rates and on the ratios of full-time and part-timeemployed graduates to unemployed graduates. The unit cost were above averagefor the occupations of auto-mechanic, farmer general, electronic technician,carpenter, cosmetologist, baker and medical assistant. The costs were higherdue to: (1) small number of graduates (e.g., electronic technician, floraldesigner, engineering and scientific programmer and T. V. service repairman);(2) too many schools offering the same course with a small number of graduatesper school (e.g., medical assistant, cosmetologist, farmer general, auto-mechanic, cabinet maker, T.V. service repairman); (3) high original investment(e.g., medical assistant, electronic technician, floral designer, engineeringand scientific programmer, cal-inet maker, T.V. service repairman), and(4) high administrative costs (e.g., electronic technician, engineering andscientific programmer, baker, dressmaker, etc.).
Ratio of Benefit to Cost by Selected Districts
14. Among the eight selected districts, the ratio of benefit:costaveraged 3.33:1, with ratios of 4.75:1 in Mayaguez and 1.56:1 in Cayey. Theratio of benefit:cost was low in the districts of Fajardo (2.08:1) andQuebradillas (1.85:1). In addition, the districts of Camuy, Ponce, San Juanand Humacao were analyzed.
15. Major conclusions emerging from the cost side of the analysisare: (a) that .there are considerable cost variations among the districts;(b) that cost variations depend heavily on the number of graduates bydistricts; (c) that cost variations also depend on the number of courses of-fered under a program or occupation; (d) that scientific-technical coursesincrease the absolute cost of a program, as compared with nontechnical typeof courses; and (e) that costs are affected by the level of courses offered -whether at the senior high school level or at the junior high school level.
16. On the benefit side of the analysis, major conclusions emergingare: (a) that technical courses generally bring about a higher level ofearnings as compared with nontechnical courses, and (b) that benefits areseriously affected by the number of graduates joining the labor force, andfinding full-time or part-time jobs.
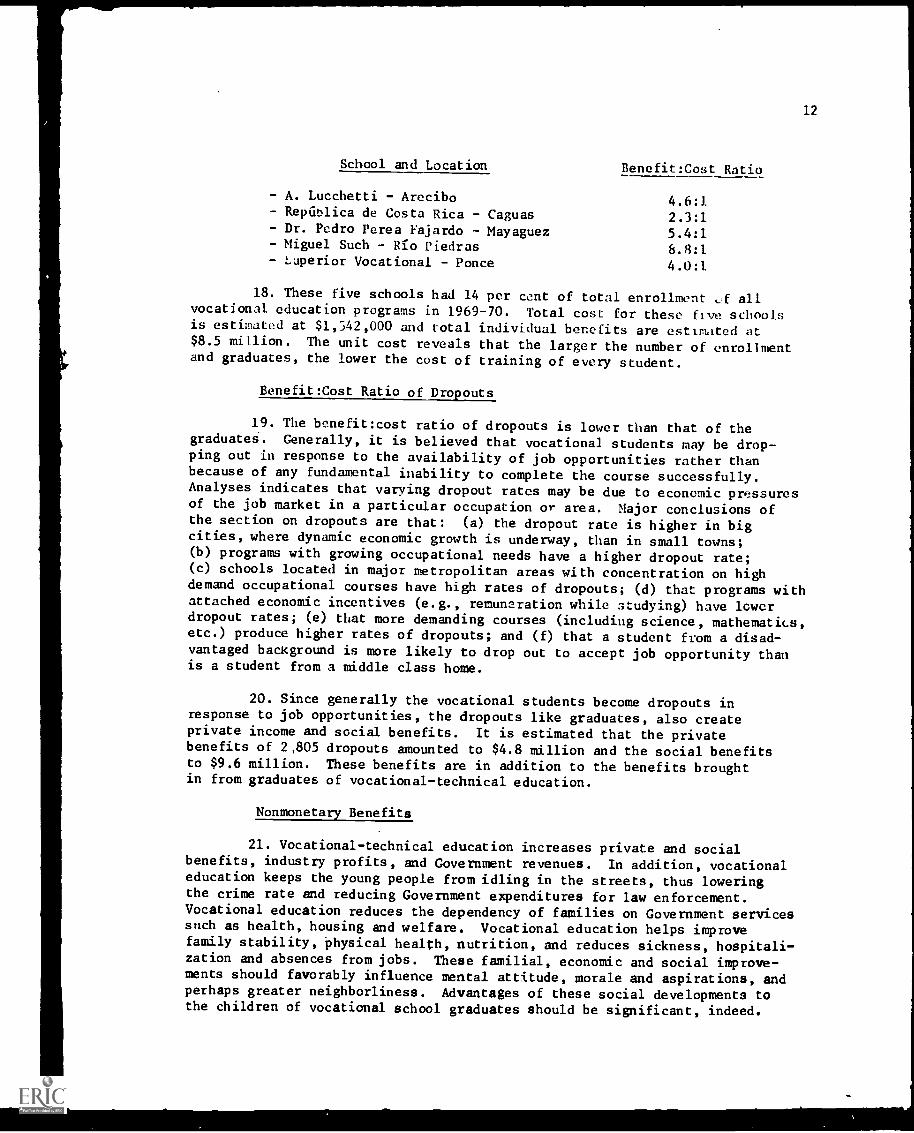
Ratio of Benefit to Cost of Selected Schools
17. Among the eight vocational school districts discussed, thefollowing five schools were selected for cost-benefit Lnalysis. Theirbenefit:cost ratios are given on the next page.
11
TABLE I-1
BENEFIT TO CCCT RATIO EY SELECTED nccurATIous
(From Highest to Lowest)
OccupationBenefit toCost Ratio
Electrician 4.3-1Clerk typist 3.3-1Secretary 3.2-1Bookkeeper II 2.8-1Stenographer 2.8-1Engineering and Scientific Programmer 2.3-1Draftsman 1.8-1Dressmaker 1.2-1Cabinet :!aker 1.2-1Plumber 1.1-1Midical Assistant 1.1-1T.V. Service Repairman .76-1Carpenter .69-1Ele'2tronic Technician .6-1Cosmetologist .5-1Baker .5-1Auto Mechanic .28-1Farmer General .09-1Floral Designer .04-1
12
School and Location Benefit:Cost Ratio
- A. Lucchetti - Arecibo 4.6:1Regiblica de Costa Rica - Caguas 2.3:1
- Dr. Pedro Perea Fajardo - Mayaguez 5.4:1- Miguel Such - Rio Piedras 8.8:1- superior Vocational - Ponce 4.0:1
18. These five schools had 14 per cent of total enrollment ,4 allvocational education programs in 1969-70. Total cost for these five schoolsis estimated at $1,342,000 and total individual benefits are estimated at$8.5 million. The unit cost reveals that the larger the number of enrollmentand graduates, the lower the cost of training of every student.
Benefit:Cost Ratio of Dropouts
19. The benefit:cost ratio of dropouts is lower than that of thegraduates. Generally, it is believed that vocational students may be drop-ping out in response to the availability of job opportunities rather thanbecause of any fundamental inability to complete the course successfully.Analyses indicates that varying dropout rates may be due to economic pressuresof the job market in a particular occupation or area. Major conclusions ofthe section on dropouts are that: (a) the dropout rate is higher in bigcities, where dynamic economic growth is underway, than in small towns;(b) programs with growing occupational needs have a higher dropout rate;(c) schools located in major metropolitan areas with concentration on highdemand occupational courses have high rates of dropouts; (d) that programs withattached economic incentives (e.g., remuneration while studying) have lowerdropout rates; (e) that more demanding courses (including science, mathematics,etc.) produce higher rates of dropouts; and (f) that a student from a disad-vantaged background is more likely to drop out to accept job opportunity thanis a student from a middle class home.
20. Since generally the vocational students become dropouts inresponse to job opportunities, the dropouts like graduates, also createprivate income and social benefits. It is estimated that the privatebenefits of 2,805 dropouts amounted to $4.8 million and the social benefitsto $9.6 million. These benefits are in addition to the benefits broughtin from graduates of vocational-technical education.
Nonmonetary Benefits
21. Vocational-technical education increases private and socialbenefits, industry profits, and Government revenues. In addition, vocationaleducation keeps the young people from idling in the streets, thus loweringthe crime rate and reducing Government expenditures for law enforcement.Vocational education reduces the dependency of families on Government servicessuch as health, housing and welfare. Vocational education helps improvefamily stability, physical health, nutrition, and reduces sickness, hospitali-zation and absences from jobs. These familial, economic and social improve-ments should favorably influence mental attitude, morale and aspirations, andperhaps greater neighborliness. Advantages of these social developments tothe children of vocational school graduates should be significant, indeed.
13
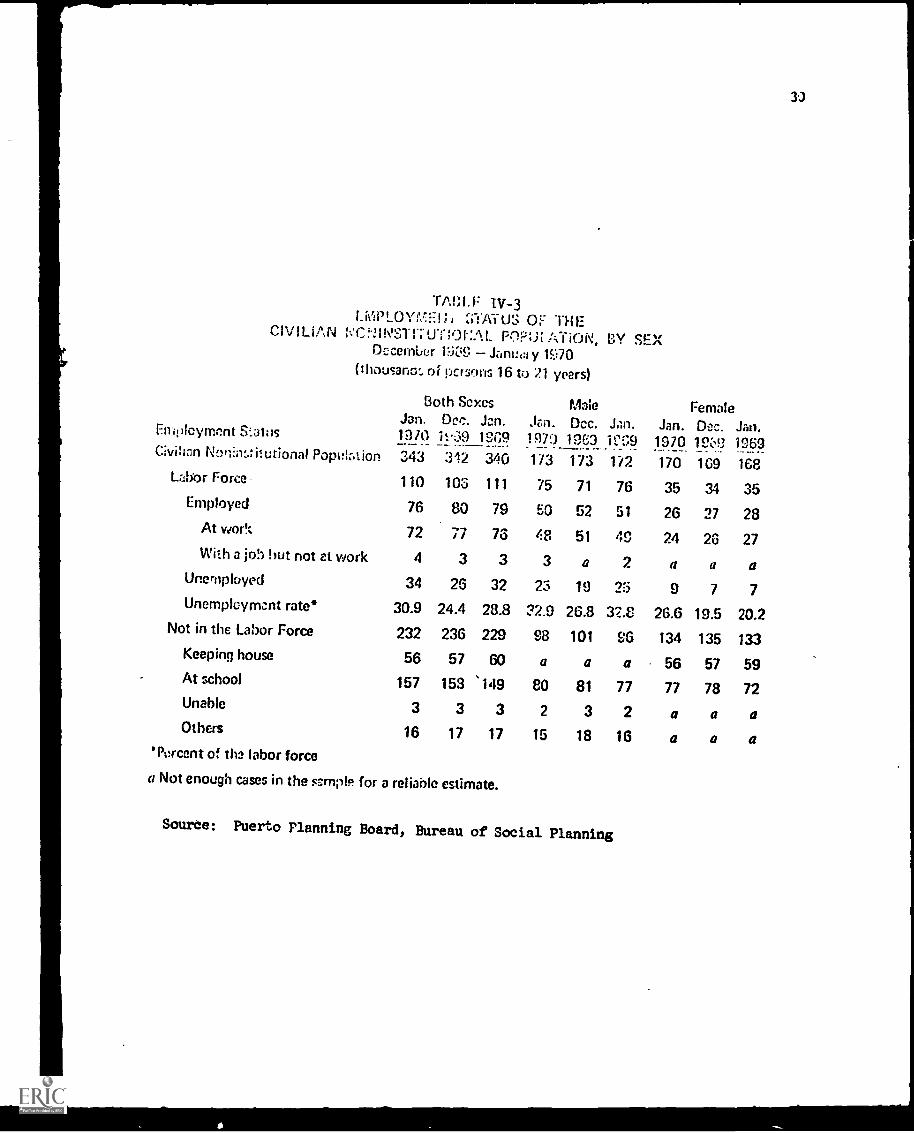
Vocational Education and Employment
22. The 1970 follow-up survey conducted by the Department of Educationreveals that about 16 per cent of the vocational graduates were unemployedin January 1970. A survey conducted at the same time by the Puerto RicoPlanning Board shows that 30.9 por cent of 110,000 young people in the agegroup of 16-21 were unemployed. This 30.9 percentage covers both vocationalgraduates and nonvocational youth. It is estimated that nonvocationalyouth had an unemployment rate of 36 per cent as compared to the rate of 16per cent for the vocational graduates.
23. Since the rate of unemployment among nonvocational youth was veryhigh, earnings foregone by vocational enrollees did not represent a net socialcost. Absence of vocational enrollees from the labor market did not leavevacant the jobs they would have filled. Thus, earnings foregone or opportunitycost for enrollees' time was small.
RECOMMENDATIONS
1. From the analysis conducted by this study, it is clear thatvocational-technical education is an economically and socially worthwhileinvestment for the Government of Puerto Rico, for the society as a whole, andfor individual trainees. The findings of this study become more meaningfuland relevant when we look at the requirements of the labor market. In themodernizing and industrializing of Puerto Rico, the technology likely to beused no longer requires a high proportion of unskilled and untrained workers.When benefits to the society, government, and individuals are higher than thecosts incurred and there is a substantial need for skilled workers, theinevitable conclusion is that additional public funds should be spent on thevocational-technical programs of the Department of Education.
2. This study provides an instrument in the area of optimum al-location of public resources in vocational-technical education. This studymeasures both costs and benefits. As shown in the various sections of thestudy, costs alone cannot be taken as an indication of quality or costliness,nor can benefits be evaluated without taking account of the costs. Thus, thestudy recommends that in the allocation of funds, both costs and benefits,ought to be taken into account in reaching decisions.
3. Statistical analysis of costs as well as benefits show that thereis a need for considerable refinement in the area of availability of data. Itis recommended that the Department of Education keep adequate and up-to-datecost records. This requires the maintenance of current and historical datain consistent and relevant classifications. Such data should correspond tothe school, curriculum and course level. Equally important would be togather data on long-term benefits through follow-up surveys. We reiterate therecommendations made by a number of studies that the Department of Educationshould establish a Management Information System at the earliest possibletime for the Area of Vocational and Technical Education. The informationsystem which could be establihsed should respond to the decision-makingfunction and responsibilities of the Department of Education.
14
4. Cost-benefit ratios by programs, occupation, schools, anddistrict provided in this study suggest that further efforts should be madeto determine the degree to which various vocational-technical programs are
being efficiently operated, independent of the question of optimum allocationof resources between alternative vocational-technical programs. This impliesthat the Department of Education should undertake an analysi., of productionand cost functions of vocational-technical programs. It should be possiblefrom such an analysis to arrive at decisions which could lead to eliminationof some courses and/or consolidation of curricula.
15
II - GENERAL BACKGROUND
BROAD BENEFITS OF EDUCATION
The effects of education on society take various forms which have
been described as investment, consumption, waste, or drag.
When one considers how improved intellectual skills (e.g., improved
reading abilities) might contribute to an individual's future productivity,
it is easy to see that education is an investment by society. That is, if
individual productivity improves, the productivity of society as a whole will
be improved. Furthermore, with youth constructively occupied, losses in out-
put due to delinquency, unemployment, or underemployment will be reduced; and
when students are eager for more knowledge, education will become a consump-
tion good.
At the same time, educational efforts can be wasteful if they
provide neither satisfaction to individuals nor increased productivity of
goods and services. Finally, education can be a drag on both the society and
the individual if it is misdirected in terms of society's needs or of workers'
aptitudes
FUNCTION OF A VOCATIONAL PROGRAM
Vocational education, in particular, is specifically geared to sup-
plying the needs of an expanding industrial - manufacturing sector for the
multi-skilled or semi-skilled services generated by a growing economy such as
Puerto Rico. Specifically, vocational education produces positive effects on
the quality of labor which are of special relevance to an economy in the process
of promoting rapid growth:
1. Better working habits, increased labor effort, and greaterreliability.
2. Improved skills, better understanding of a job's requirements,and increased efficiency in performing the job.
3. Better health through improved diet and sanitary living conditions.
16
4. Greater and speedier adaptability to momentary changes, especiallyin jobs which require work evaluation of new information, and in general, morerapid reactions.
5. Increased chances for promotion to more complex occupations whenopportunities arise.
While it is true that all levels of education may contribute to
improving the quality of labor, this study focuses on the contributions of
vocational education to particular program goals, as well as to the general
economic development of Puerto Rico. It is clear, for example, that there is
a broad need for many skills in Puerto Rico, with shortages of skilled or semi-
skilled manpower in nearly every field. The manufacturing sector, especially,
can be severely inhibited in maintaining its dynamic expansion programs if
there is a serious lack of skilled personnel to carry them out. Thus, such
limitations in personnel can seriously affect productivity levels, in turn
raising costs and preventing industry from competing effectively in the
highly competitive markets into which many Puerto Rican commodities must move.
A dynamic vocational education program can make a significantly high
return contribution to Puerto Rico's growth and welfare by supplying, on a
systematic basis, the ongoing and changing skill requirements of tne economy.
Secondly, a dynamic vocational training program can, in a limited
time span, make a significant contribution in reducting unemployment,
particularly among the younger members of the labor force in Puerto Rico.
Thirdly, a rapidly growing economy faces the problem of absorbing
those workers who have migrated to the city from the country. If there is
to be a minimum of social unrest in the growing urban centers, a steady
supply of job opportunities must be provided. By upgrading and broadening
the capacities of workers, an effective vocational education program can make
a significant and readily apparent contribution toward the urban unemployment
problem while satisfying the. needs of enterprise and social services.
17
Fourth, must be added the need to reduce the underutilization of
latent talent, which imposes an enormous waste of human resources on
Puerto Rico's economy. No modernizing economy can, whatever its size or
status, afford such waste of its productive capacity.
Fifth, it is also important in an economy linked so closely to that
of the United States to generate the optimum growth of productivity, so that
Puerto Rico maintains its competitive position in the complex markets of the
United States.
By adding a continuous flow of more skilled individuals to the
economy of Puerto Rico, the vocational education programs will not only
contribute to more stable growth and social well being, but will also make a
special contribution to more stable industrial relations, as laborers recognize
the advantages of sharing in the economy's growth process.
Finally, and indicative of the points just elaborated, there is con-
siderable statistical evidence to indicate that vocational-technical student
graduates have shown highly favorable earnings and employment duration
experience. This indicates that the need for student graduates in the more
academic curricula is matched by a strong, and in Puerto Rico possibly by an
even stronger need for student graduates of vocational-technical schools or
training programs.
THE FUNCTION OF A COST-EFFECTIVENESSAPPROACH
An effective cost-benefit analysis requires collec:ion of a wide
variety of data inputs. However, it must be said at the outset that. the dif-
ficulties of data collection present very serious obstacles to implementing
a workable cost-effectiveness approach to decision-making, It is vital,
however, that the ground work be laid now for the gradual accumulation of
the data necessary for evaluating the contributions of vocational education
to the growth process of Puerto Rico. Ultimately, costs and benefits may be
18
identified in terms of the physical inputs and outputs of the programs, in
terms of the monetary inputs and gains, or in terms of a combination of the
two; and it is to this latter complex combination of measures and utility
functions that this study addresses itself.
The costs and benefits from education are often summarized in the
following categories:
A. Explicit costs incurred by students or their families (t4.1-te andmoney outlays).
B. Implicit costs incurred by students or their families (chieflytime and earnings foregone).
C. Explicit costs incurred by the Government or third parties(physical facilities or money outlays).
D. Implicit costs incurred by the public or third parties (chieflyearning:: or tax revenues foregone).
E. Monetary benefits accruing to the educated or Lo their families(earnings in money or in kind).
F. Nonmonetary benefits accruing to the educated or their families(satisfactions, psychic well being).
G. Monetary benefits accruing to the public or to third parties(money incomes or tax revenues).
H. Nonmonetary benefits accruing to third parties or the public(increased skills in labor force, reduction in the waste of resources causedby unemployment or underemployment, individual satisfactions, psychic incomes).
For the costs side, data c- be collected on the nonmonetary inputs
and on budgetary outlays by the Government for various requirements of the
vocational education program. Cu the benefits side, data can be collected
on the numbers of newly trained employees in various occupations and their
level of earnings as a result of their training. 2stimates can also be made
regarding tax revenue increments resulting from the higher income levels of
vocational graduates as compared with the earnings of unskilled labor or even
graduating students who have not received vocational training.

I.
19
A dynamic rather than static vocational program requires the follow-,
ing: (a) a system for gauging probable demand goals in specific skilled
categories; (b) an effectivS,system for decision-making, (c) an effective
jstem for resolving immedi ?te, intermediate, and long-term problems and
bottlenecks and estimating the long-term needs of Puerto Rican labor and the
economy as a whole. Such systems will give the decision maker an orderly and
continuous purview of the needs, costs and effectiveness of the vocational
education programs.
(a) Achieving Specific Demand Goals
Data should be collected, organized, and analyzed in order to deter-
mine the demand fcr skills in various categories of work. At the same time,
the administrative system should be prepared to adjust to changing demands
resulting from fairly rapid technological advances. Normally, a system for
forecasting both short-term and long-term skill needs in the economy would
be necessary. The system would provide a knowledgeable appreciation of new
technology, which may permeate certain industrial sectors and which could
completely change the demand structure for skill requirements. There must
also be an awareness of new forms of investment in the industrial, commercial
or services sectors which could lead to requirements for new skills. On the
basis of a syste-matic knowledge of the short, intermediate, and long-term
demand for various skill requirements in the economy, the administrative
responsibility and function may turn to planning for meeting these demands
and implementing a program with appropriate phasing profiles which would
satisfy the needs ascertained from the data accumulated and evaluated.
(b) System for Decision-making
Given the knowledge of demand and the targets for fulfilling the
demand for skills in the short, intermediate, and long-terms, the
cost-effectiveness procedure should provide a framework for asking the
critical administrative questions on:
. How to proceed to fulfill the demand requirements;
. Which categories have highest priority;
. What curriculum is relevant or should the cur-riculum be changed to meet the new requirements;
. What are the capital outlay requirements formeeting the demands;
. Who should pay for the expansion in specific
skill categories and how will these be financed;
. How shall the expansion be administered;
. What means will be devised for recruiting teacherswho are the essential inputs for developing thebest in new applicants for the program.
The cost-effectiveness program proposed by Peat, Marwick, Mitchell
& Co. will provide a system for decision-making on all of these issues. It
will also provide a framework for answering the question of how administra-
tive responsibilities could best be delegated - by function or by geographic
region.
(c) System for Resolving Problemsand Bottlenecks
This system should encompass:
. A thorough knowledge,of the orientation of PuertoRico's development program;
. A clear appreciation of the demand structure forvarious categories of skills in the short,intermediate, and long-term;
. A method for identifying the priorities of issuesawaiting decision-making in accordance with theirrelative importance and urgency;
. An appreciation of the need for strategy to resolvethe hierarchy of problems defined above;
. And a system for projecting future requirements forvocational education programs and their relatedcosts.
20

The information provided in this study makes a significant beginning
toward formalizing the data categories required for assessing the cost-
effectiveness of Puerto Rico's vocational education program. By comparing
the physical and monetary cost elements of the program with its physical
accomplisLments and growth factors, the monetary advantages to individuals
involved in the training programs, the indirect benefits to Puerto Rico's
fiscal needs, and the need for steadily increasing productivity of Puerto
Rico's goods and services, decision-makers can thus, have available to them
more effective and rational criteria for establishing priorities, developing
new programs, and supporting the budgetary requirements of the total
vocational education program in Puerto Rico.
21
22
III - CONCEPT OF COST-EFFECTIVENESS ANALYSIS
Cost-effectiveness analysis relates the cost of a particular program
to how well it has met its objectives and goals. The decision-maker compares
possible or alternative programs on the basis least cost and probable
greatest effectiveness, always seeking to minimize dollar costs while
maximizing the physical output within budget limitations.
Using cost-effectiveness analysis, comparisons of alternative programs
are prepared systematically in qualitative and quantitative terms by using a
logical sequence of steps that can be retraced, verified and evaluated by
others. The cost-effectiveness analysis concept requires the ranking of
various alternatives, or courses of action available, in order of preference;
and criterion for ranking preferences is the relationship of cost to the
anticipated performance or output of each alternative.
The difference between cost-effectiveness analysis and cost-benefit
concepts is that under cost-effectiveness, nonquantitative measurements are
permitted, whereas in cost-benefit analysis, only quantitative measures are
used.
Vocational education can benefit greatly by the application of cost-
benefit analysis, provided the emphasis is placed on effectiveness rather
than cost. In vocational education as well as any other type of education,
costs can be measured rather accurately whereas the benefits do not easily
lend themselves to appropriate types of quantifications. Although educa-
tional costs are incurred over a short period, educational benefits are
realized over the course of a working life which may last from 40 to 50 years.
There are various types of costs: current costs, capital costs
average costs, and marginal costs. The current costs concept generally includes
salaries and wages, books and materials, maintenance, administration, etc.

Capital expenditures are investment costs incurred for the purchase of equip-
ment and construction of buildings. Marginal costs refers to those additional
costs that are to be incurred if a particular program is to be expanded. The
concept of average cost per hour deals with the total universe.
Similarly, benefits, both direct and indirect, are of different types
and accrue to different groups in the society. From the vocational education
program, benefits accrue to the individual receiving training in the form of
increasing earnings. Benefits accruing to the industry and employers who
employ such trainees include reduced costs of training for specific jobs.
Benefits accrue to society through the multiplier effect of gross product, net
income and ,,ersonal income. Benefits to the Government accrue in the form of
reduced expenditures on welfare payments and by increased tax revenues. Since
the income of both individuals and industry is subject to a variety of taxes,
including personal income tax, corporate income tax, excise tax and property
tax. The individual trainee likewise passes on the benefits cf his education
to his family in very direct ways, for example, by enhanced ability to enjoy
a variety of recreational activities.
Measuring and computing educational benefits in cost-benefit analysis
can be very difficult. For example, an individual may decidedly improve his
character and personality by means of his education; but measuring such
improvements in character can be problematic. For this reason, cost-
effectiveness analysis, rather than cost-benefit analysis, is more broadly
applicable since all of its components are quantifiable.
One of the greatest advantages of cost-effectiveness analysis is
that, while cost-benefit analysis may yield a single decisive ratio, cost-
effectiveness analysis results in a number of criteria or different defini-
. tions of objectives for a program. Secondly, most of the analyses currently
23

24
being prepared give too much emphasis to cost: such as cost of educating
an elementary student per year, or cost of educating a secondary student per
year, or cost of educating a student in auto mechanics per year. Over-
emphasis on cost does not permit the determination of the effectiveness of
dollar expenditure on different levels of education. For example, if a
student is taught for two years at the 11th and 12th grade levels and after
education he remains unemployed for a number of years, obviously, the benefits
accruing to the society from such an educational expense are not significant.
On the other hand, if a student is trained in auto mechanics, for which there
is an increasing demand, it is true that a high training cost will be incurred,
yet his early employment at high wages should reimburse the society, the
individual, the industry and the Government within a reasonably short period
of the individual's working life.
In the measurement of costs and benefits, accuracy of data is a very
important element. Equally important is the use of appropriate techniques
for analysis and computations of benefits and costs. The methodology for the
compilation of data and analysis is discussed in the next section.
25
IV - METHODOLOGICAL ASPECTS OF BENEFIT AND COST DA1A
This section of the study discusses the methodology used in deter-
mining benefits and costs for the vocational school programs. It should be
clear that the methodology used for the study is tailored to ideal conceptual
aspects of cost-effectiveness analysis and availability of data.
Generally, it is believed that in conceptual terms benefits are more
difficult to measure than costs. For the methodology used in this study,
however, the benefit data turned out to be less of a problem than the cost
data. Resolving shortcomings in the data, absorbed a major part of our time;
nevertheless, despite difficulties, the costs and benefits have been prepared
for all the vocational programs, selected occupations, selected educational
districts, selected schools, and dropout students.
In the processing of the data for this study, we used the computer
facilities of the Department of Education, whose Data Processing Division
was extremely helpful. The data processing system developed for this study
is ultimately envisioned as a tool to aid in the continuous analysis of costs
and benefits. Both the system and the computer programs have been made
available to the Department of Education.11
METHODOLOGICAL ASPECTS OFBENEFITS DATA
This section of the report briefly presents the methodology used for
measuring social benefits accruing to society and private benefits accruing
to an individual from the vocational-technical education prog:am. While some
of the benefits are measurable, a number of benefits are not subject to the
rigid discipline of economic analysis.
1/ See a note on computer processing in the Appendix of the study.

26
The science of economics measures only those benefits and costs
which generally occur within the market mechanism. If benefits and costs
accrue outside the market mechanism they are generally excluded from this type
of study, even when they are measurable. The benefits accruing outside the
market mechanism obviously will result from external economies or diseconomies.
However, stretching the analysis to encompass external economies will not
have any logical end, and also, there is a danger of double counting, as dif-
ferent aspects of any action begin to have overlapping effects.
Since earnings and employment are adequate indices of economic
efficiency and economic welfare, this study tries to measure benefits with
the help of employment, partial employment, and unemployment data. Necessary
figures on monetary earnings can be obtained from the employment data since
the data includes number of hours employed, earnings per hour, and total
earnings.
The employment data is based on follow-up surveys prepared by the
Department of Education, which, through its Vocational School Program,
conducts follow-up surveys to investigate the employment status of vocational
school graduates. This data provides information as to whether a graduate
entered the armed forces, continued full-time school, or for any other reason
is not in the labor force, his status of employment, and whether he has
entered an occupation for which he was trained or a related occupation. Also,
the data provides the necessary information on graduates who are employed
part-time and on the number of graduates unemployed.
The data presented by the Department of Education in the early part
of January, 1970, estimated that during the fiscal year ending June 30, 1969,
there were 1,692 graduates who had completed post-secondary vocational

27
school requirements and were sent questionnaires to determine their employ-
ment status. Of the 1,692, the status of 483 was not known, 867 were full-
time employees in the occupation for which they were trained or in a related
occupation, 81 graduates were employed part-time and 165 were unemployed.
This data also estimated that during the same year, there were 8,366
graduates who had completed secondary vocational school requirements and were
sent questionnaires to determine their employment status. Of the 8,366, the
status of 2,594 was not known, 113 has entered the armed forces, ],802 had
continued full-time school, and 184 did not join the labor force for other
reasons. Of the remainder, 2,052 were full-time employees in the occupations
for which they were trained or in a related occupation, 653 graduates were
part-time employees and 968 were unemployed. Details of the data by programs
for 1970 are given in Table IV-1 and Table IV-2.
These data were used to determine the total universe, the number
employed graduates, unemployed, partially employed, etc.
The second variable to be ascertained was earnings of the fully
employed graduates and partially employed graduates. We consulted with the
Department of Labor for the data on earnings of workers with specific skills
which are generally acquired through the vocational school programs of the
Department of Education. The hourly earnings then were multiplied by the
number of hours which a full-time worker would be working in a full year. For
the part-time workers we assumed that they worked one-half the number of hours
worked by the full-time employed graduate. Thus, in the determination of data
on earnings, the following variables were taken into account: (1) type of
employment, (2) percentage of graduates employed full-time or part-time,
(3) wage rates per hour, (4) number of hours, (5) increases in income,
(6) total benefits, (7) type of employment before vocational school training,
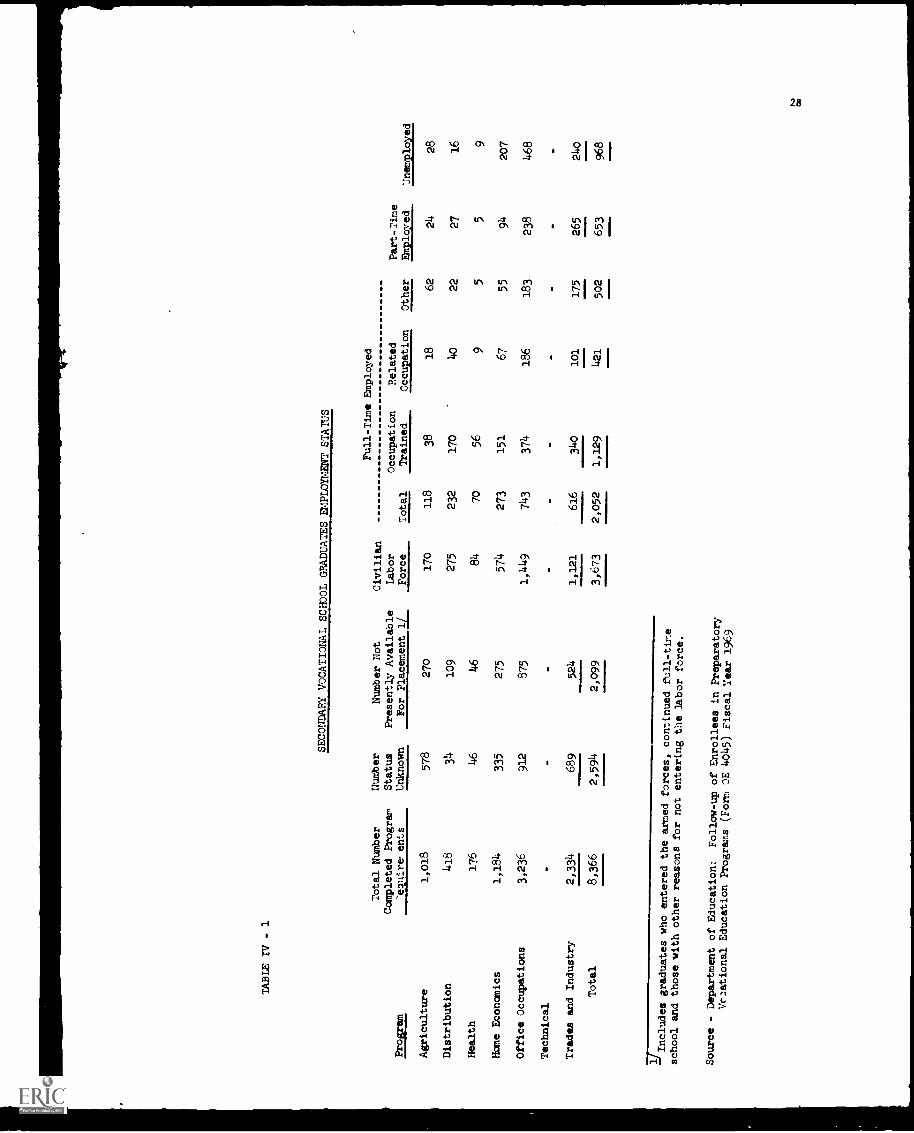
TABLE IV - 1
SECONDARY VOCATIONAL SCHOOL GRADUATES EMPLOYMENT STATUS
Program
Total Number
Completed Program
-elhlre ents
Number
Status
Unknown
Number Not
Presently Available
For Placement 1L.
Civilian
Labor
Force
Total
Full-Time Employed
Occupation
Related
Trained
Occupation
Other
Part-Time
Employed
Unemployed
Agriculture
1,018
578
270
170
118
38
18
62
24
28
Distribution
418
34
109
275
232
170
40
22
27
16
Health
176
46
46
84
70
56
95
59
Home Economics
1,184
335
275
574
273
151
67
55
94
207
Office Occupations
3,236
912
875
1,449
743
374
186
183
238
468
Technical
Trades and Industry
2,334
689
524
1,121
616
340
101
175
265
_--
24o
---
Total
8,366
2,594
2,099
3,673
2,052
1,129
___
421
502
653
968
Includes graduates who entered the armed forces,continued full-time
school and those with other reasons for not
entering the labor force.
Source - Department of Education:
Follow-up of Enrollees in Preparatory
Vc2ational Education Programs (Form OE 4045)Fiscal Year 1969
CO
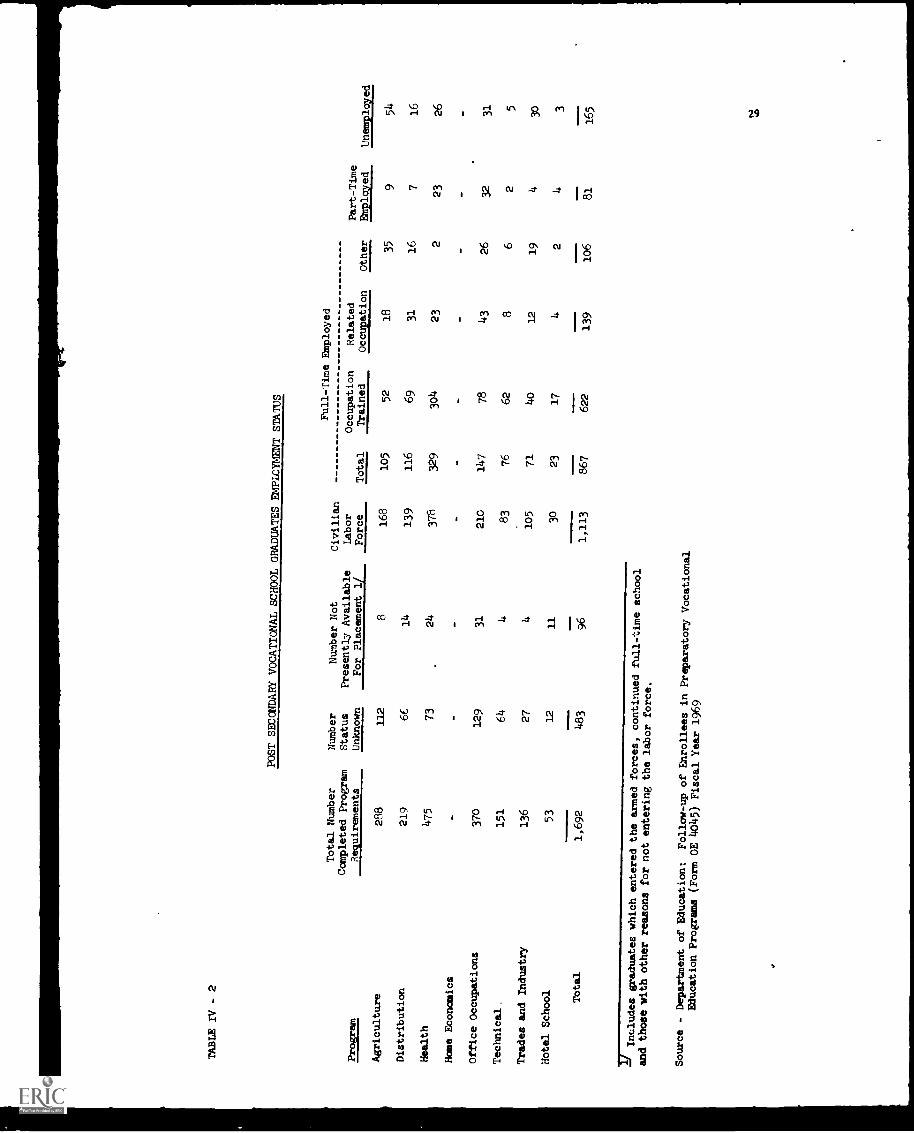
TABLE IV - 2
POST SECONDARY VOCATIONAL SCHOOL GRADUATESEMPLOYMENT STATUS
Total Number
Completed Program
Number
Status
Number Not
Presently Available
Civilian
Labor
Full-Time Employed
Occupation
Related
Part-Time
Program
Requirements
Unknown
For Placement 1/
Force
Total
Trained
Occupation
Other
Employed
Unemployed
Agriculture
288
112
8168
105
52
18
35
954
Distribution
219
66
14
139
116
69
31
16
716
Health
475
73
24
376
329
304
23
223
26
He Economics
--
-
Office Occupations
370
129
31
210
147
78
43
26
32
31
Technical.
151
64
483
76
62
86
25
Trades and Industry
136
27
4105
71
40
12
19
430
Hotel School
53
12
IME
ME
MO
11
30
23
17
42
43
Total
1,692
483
96
1,113
=M
M..
867
MO
M..
622
wW
OO
WE
139
i06
81
165
2/
Includes graduates which entered the armed forces, continuedfull-time school
and those with other reasons for not entering the
labor force.
Source - Department of Education:
Follow-up of Enrollees in Preparatory Vocational
Education Programs (Form OE 4045) Fiscal Year 1969
N
33
TM; I .1: IV-3ATUS OF THE
CIVILIAN 1.:C!-!lM:31-1;t:Il0E.'\.1_ POPUl BY SEXDecernlier 1:k9 Januet y 1N0
(ihousanof., of persons 16 to 21 years)
Both SexesJan. Dec. 1:11. Jan.
MaleDec. Jan.
FemaleJan. Dec. Jan.En-ipleyment S'.31:15 1970 1t.39 19(39 197.3 1953 1970 1ea3 1969
CiviNan Non:a:A. Populz.tion 343 312 340 173 173 172 170 169 168Ldior Force 110 10:3 111 75 71 76 35 34 35
Employed 76 80 79 50 52 51 26 27 28At wor!: 72 77 76 48 51 40 24 26 27With a job but not at work 4 3 3 3a 2 a a a
Unemployed 34 26 32 23 10 2 6 9 7 7Unemployment rate* 30.9 24.4 28.8 22.9 26.8 32.8 26.6 19.5 20.2
Not in the Labor Force 232 236 229 98 101 96 134 135 133Keeping house 56 57 60 a a a 56 57 59At school 157 153 '149 80 81 77 77 78 72Unable 3 3 3 2 3 2 a a aOthers 16 17 17 15 18 16 a a a
'Porcent of the labor force
a Not enough cases in the ssmplf! for a reliable estimate.
Source: Puerto Planning Board, Bureau of Social Planning
(8) hourly earnings before vocational school training, (9) total earnings
before vocational school training, (10) total net earnings or total earnings
after vocational training minus total earnings before vocational school
training.
We have not taken into consideration the earnings of graduates who
joined the military armed forces. In our analysis we have included only
those benefits accruing to a person who is in the civilian labor force.
Generally, we have assumed that graduates with vocational school
training will have higher earnings and more stable employment than individuals
without such training. By higher earnings and stable employment a worker is
assumed to have greater job satisfaction and better morale, which in turn
represents an increase in the total utility to be gained from the training
course which the graduate received at the vocational school.
BENEFITS TO THE INDUSTRY
A vocationally trained graduate is employable within a short train-
ing period of few months. Nonvocationally trained graduates, however, require
much lengthier training for the same job. Thus, in shortening significantly
the training period for which the employer pays, the vocational training
program reduces the employer's cost thus increasing his production and
profits. In addition, it may be noted that a vocationally trained graduate
not only has specialized training for a specific occupation, but should also
have better discipline and work habits, thus reducing nonproductive behavior,
e.g., misuse of machinery.
Vocational school training furnishes an individual the basis for a
wider range of job possibilities, thus increasing his occupational mobility.
The greater the occupational mobility and adaptability, the more efficient
will be the adjustment of demand and supply for skills; by implication there
will be greater employment st&Ality for the vocationally trained person as
31

32
compared to the nonvocationally trained person. Thus, vocational training4,
increases industry's income and improves the employee's income stability.
BENEFITS TO GOVERNMENT FROMVOCATIONAL TRAINING
Benefits to the Government from vocational training accrue in the
following two ways: (1) increase in tax and nontax revenues, (2) reduction
in welfare payments and related expenditures. A vocationally trained person,
as pointed out above, has higher income and greater stability of job as
compared to a nonvocationally trained person.
The income of the vocationally trained person is subject to all
the taxes in the fiscal system of the Governmeni: of Puerto Rico: personal
income tax, excise taxes, customs duties, property taxes, etc. The income
of the vocationally trained graduate in many cases may not be sufficiently
high to be subject to personal income tax. However, the "ocationally trained
graduate must pay taxes on goods and services which he consumes in a
particular year. Like any other citizen, if he smokes, drinks beer or rum,
or uses electrical appliances, he must pay excise taxes. If he uses an
autcmobile, he must pay the automobile excise tax and tax on gasoline. If
he uses a foreign automobile, he must pay import duty to the Federal
Government which is turned over to the Government of Puerto Rico. If he
owns a house, he may have co pay property tax.
It has been estimated by the Department of the Treasury of the
Government of Puerto Rico that the burden of taxes on different income
brackets differs considerably from one income bracket to another. Generally,
young people with vocational school training entering the labor market, have
incomes of $1,300 to $6,000, a range subject to a tax of 10 to 13 per cent.
Secondly, the vocationally trained graduate helps to increase
industrial income, which is subject tw corporate or personal income tax,
depending on the business. If the business is exempt from income tax, it
does not contribute during an exempt period to tie Government of Puerto Rico.
However, most businesses in Puerto Rico do pay taxes, including income tax,
property tax, patmts, etc.
Thirdly, each job occupie v a vocationally trained graduate
creates another job Orough the multiplier effect of income. The vocation-
ally trained graduate receives salaries and wages and when he spends this
income for purchasing food, clothing, shoes, electrical appliances and other
necessities of life, he creates an additional job. This job in turn increases
income and generates revenues to the Government.
Fourthly, when a vocationally trained graduate completes his training
he has greater chances of getting a job. According to the January survey,
of the 6,940 vocationally trained students in thr4 labor force, 84 per cent were
full -time or part-time employed and about 16 per cent were unemployed.
As indicated earlier, there is a very high rate of unemployment
among the young without vocational school training. On the other hand, there
is a tremendous shortage of workers in certain skilled occupations.
A report entitled "Comprehensive Manpower Plan - Fiscal year 1971,
Part A," provides information on occupational shortages in Puerto Rico,
most of which exist in areas included in the curricula of the Vocational
School Program.
The report says that "these occupations continued to be in demand
in the Commonwealth during fiscal 1970: Comptroller specialized in data
processing, Chemist, Commercial Education Teacher, Social Worker, Engineer,
Electrician, Automobile-Body Repairman, Sheet-Metal Worker, Forelady Sewing

34
Room, Sewing Machine Operator, Television-Serviceman and Repairman, Cabinet-
maker, Offset Pressman, Embroidery-Machine Operator, Tool-and-Die Maker,
Alteration Tailor, Machine Cutter, Applique Cutter, Furniture Upholsterer,
Diamond Cutter, Plater, Stone Setter, Sewing-Machine Repairman, Maintenance
Mechanics, Ornamental-Metal Worker, Wax Molder, Baker, Meat Cutter, Waitress,
Live-in-Maid, Salesperson (hardware and automobile parts), Saleslady for
exclusive stores with special requirer--ts, Reservation Clerk with experience
and bilingual college education level for airline ticket agencies, Insurance
Salesman on a commission basis, Bookkeeper, Dictaphone Operators, Teletype
Operators and Secretaries in the high and intermediate level.
"In the health field: Medical Laboratory Assistant, Dental Laboratory
Technician, Dental Hygienist, Radiologic Technologist, X-Ray Developing
Machine Operator, Surgical Technician, X-Ray Equipment Tester, Orthopedic
Cast Specialist, Orthopedic Technician, Inhalation Therapist, X-Ray Technician,
Medical Records Librarian, Medical Secretary, Dental Assistant, Physiotherapist
and Physioterapist Assistant, Health Educator, Pharmacist, and Registered and
Practical Nurse.
"Workers are being sought to staff existing social welfare, health,
education, training agricultural, and other programs. The continued shortage
of qualified personnel endangers the success of some programs and complicates
the organization of new ones such as those that deal with manpower problems,
urban growth, rural areas, and economic development. The critical occupations
as reported by the Office of Personnel are: Biologist, Food Technologist,
Bacteriologist, Chemist, Communication Technician, Cytotechnologist, Dentist,
Draftsman Architectural, Engineers (all kinds), Dietitian, Economist, Mental
Health Educator, Electrician, Hearing and Speech Therapist, Illustrator,
Laboratory Technician, Nurse, Nutritionist, Pharmacist, Physical Therapist,
Physician, Plumber, Radio Operator, Social Worker, Sociologist, Statistician,
15
Surveyor, Systems Programmer, and Urban, Social, Regional and Economic
Planner. Around 30 occupations in the graphic arts field were also critically
short. These included Proofreader, Bookbinder, Stenotypist, Photoengraver
and Linotypist."
Thus, it can be seen that the vocationally trained graduate has a
higher probability of finding a job compared to the nonvocationally trained
graduate, particularly when there are shortages in occupations for which
vocational school curricula especially prepares young entering the job market.
Higher rates of employment reduce the expenditures of the
Government on social services, welfare payments, police and maintenance of
law and order. The Government incurs millions of dollars of expenditures on
welfare payments; it provides health services for destitute families and
provides housing facilities to families with relatively low incomes. Thus,
by creating skills which are employable, vocational school training programs
make a person less dependent on the Government and more self-sufficient.
Elsewhere, the studies which have been conducted show that an
employed person is less likely to engage in activities which could classify
him as antisocial. For example, he is less likely to commit auto thefts or use
drugs. To the extent that nonsocial activities are reduced by the voca-
tioael training school program, the program helps to reduce the expenditure
of police, courts and jails. For example, it has been estimated for the
United Kingdom that each crime costs the Government approximately $8,000 a
year in time spent by various agencies dealing with law and order. This
amount is probably equal or even larger in Puerto Rico.
VOCATIONAL SCHOOL PROGRAMAND GROSS PRODUCT
The income of individuals and the income of industry are part of
the gross product of Puerto Rico. Such income generates a multiplier effect
36
of one to one every year. Thus, the direct and indirect income generated
by the vocational school training program is income which accrues to the
society of Puerto Rico at large.
DETERMINATION OF COSTS
Data for 1969-70 in this report pertain to actual expenditures,
which in turn were divided into direct costs and indirect costs.
Direct costs are defined as the costs which can be directly identified
with a particular course, such as salaries, equipment, buildings and main-
tenance. When expenditures could be identified for a specific program they
were included as direct cost.
Indirect costs are defined as expenses incurred on a particular
program. When such data was available it had to be broken down by courses.
Such indirect costs may include salaries and wages, purchase of equipment,
buildings, maintenance, furniture and fixtures, administration, etc.
Overhead expenditure is defined as that which directly or indirectly
can be attributed to either a program or a course. Example of such an
expense would be the salaries and expenses of the Office of the Assistant
Secretary of Vocational School Programs, plus a proportion of the
expenditures of the Department of Education, such as rental of buildings,
maintenance, administrative cost of the accounting office, etc.
Direct and indirect cost data was provided to us by the Evaluation
and Statistics Division of the Vocational Education Program and by the
Budget Office of the Department of Education. The Division of Property
furnished information on furniture, equipment, machinery, etc. and the
Department of the Treasury furnished the data on buildings, construction and
improvements.
The Vocational School Program itself has individual budgets for only
three programs: Home Economics, Health, and Technical.
37
The Office of the Budget of the Department of Education has computer
tabulations which include data on various programs and items of expenditure
by program. From these data it was possible to deduce the direct cost of dif-
ferent programs. The direct cost was then attributed to courses. The data
available from the Office of the Budget permits us to assign a specific item
of expenditure to a specific course. The data so collected by item and
course was then processed by the Computer Division of the Department of
Education. By this method the cost by courses was properly identified, and
the data on direct expenditures by courses was then used to arrive at the
direct cost by program.
C data on direct costs by schools was identified with the help of
Itcldata availa on items of expenditures by courses and by schools within the
Office of the Budget of the Department of Education. However, the Office of
the Budget provided data only on current costs and did not have data on
capital costs. The data on capital costs was obtained from the files of
the Department of the Treasury.
The cost data on courses and schools was then used to ascertain the
cost data by districts. Individual school data pertaining to current and
capital expenditures was collected manually. Data by courses covering both
current and capital costs was fed into the computer, with the results provid-
ing direct capital cost by schools and distributed manually by courses in
the following manner: determination of sessions per course, number of class-
rooms and number of teachers. A weighted proportion of these three factors
was applied to the total direct capital cost. To each session was given a
weight of 1, to each teacher a weight of .5 and to the number of classrooms
utilized per session a weight of 1.- A session is the time used by a teacher
in a specific course, which may happen more than once in a day, and may last
one hour or three hours und the hours may be continuous or at intervals.

38
We had the data available on number of teachers, number of class-
rooms and number of sessions. These data were used to cetermine the total
number of weights. On the basis of these weights, the direct cost data
bearing on salaries and wages, books and materials, maintenance, buildings
and improvements, etc., were distributed to find out the total direct cost
per course. However, it may be noted that the weights were not used to the
following items of expenses: buildings, equipment, furniture, and fixtures.
There are two types of courses being conducted by the Vocational
School of the Department of Education. First, are courses oriented toward
preparing the students to perform specific skilled jobs when they leave
school. Secondly, are courses -Mich can be defined as nonoccupationally-
oriented. These are essentially designed to improve the level of living of
the families or of individuals so that relationships at home can become more
congenial and stable. Such courses are more of a sociological than an
economic nature, since they are essentially geared to upgrading the quality
of life of the student, his relatives, and the community at large. It may
be noted that nonoccupationally-oriented vocational courses were predominant
in the programs of Home Economics and Industrial Arts. However, such courses
were also used extensively in the program of Health.
Expenditures are incurred in occupationally-oriented courses and
nonoccupationally-oriented courses. The data available from the Vocational
School Program permits the classification of costs for these two types of
vocational courses, under the headings of useful and gainful. Useful is co-
related with occupation-oriented courses and gainful is identified with the
nonoccupation-oriented courses.
The basis for determination of cost data by occupation-oriented
and nonoccupation-oriented stems from the Annual Report structure submitted

39
by the Vocational and Technical Training Division to the Office of Education
in Washington - NEW. This data is broken down thru the individual expen-
diture report submitted for each program, and is kept on file by the Office
of the Budget of the Department of Education.
Capital expenditures were incurred on the construction of a number
of schools to provide educational facilities to vocational students, as well
as to nonvocational students. Vocational students were given a certain
number of courses and thus a number of classrooms were used. On the basis of
ratio of classrooms designated for vocational school programs and for non-
vocational school programs, the capital costs were allocated between
vocational education and nonvocational education.
Although it was difficult to identify indirect cost by courses,
indirect cost data was available at the program level. Then, to identify
indirect costs by courses we used the raw data which was available in a sum-
marized form by program, such as: salaries,equipment, administration, books
and materials. A formula was designed to allocate program costs by courses.
The formula is as follows:
Direct cost by Subject Total Direct Cost by Program x Total
Overhead = Overhead by Program.
For example, overhead costs were distributed first by programs and
then the data obtained by programs was distributed by courses.
To the overhead total by program we applied the first formula
described above and the results was the distribution of indirect cost over-
head by courses.
The proportion of indirect cost to direct cost is unusually high
because of the detail into which program budgets are broken down within the
Department of Education and Vocational Education Program, factor which
prevents refined analysis of all cost data.

DEPRECIATION
Essentially, a straight-line method was used to ascertain the capital
expenditure on buildings and other equipment which could be allocated to
1969-70. For example: Concrete-constructed schools were given a life of 30
years and wooden schools were given a life of 10 years. All the schools which
were not written off under the above two assumptions in 1969-70, were subjected
to a necessary ratio with a view to find out the depreciation weights. It may
172 noted that most of these ratios correspond to the ratios being used by
the Commonwealth Bureau of Income Tax and Federal Internal Revenue Service.
41
V - COST AND BENEFITS OF VOCATIONAL EDUCATION BY PROGRAMS
The particular socio-economic conditions of Puerto Rico require
that various skills and human resources be provided in order for economic
growth to continue and social justice to improve. Skills provided through
the vocational education system affect the individual trainee, the Government
and the society. For an individual, an important function performed by
vocational education is that it makes him an economically productive person,
the direct evidence of which is reflected in his earnings and ability to be
employed. An improvement in wage and salary rates of an individual increases
the tax base and tax revenues. Improved skills reduce the likelihood that
the individual will be in need of welfare payments or other forms of assist-
ance such as low cost housing or hospitalization for indigent population. A
stable source of employment helps reduce unemployment and the need for
services for the unemployed.
Increase in tax revenues and reduction in welfare services and pay-
ments have very positive effects for the society of Puerto Rico and the
Government. The positive effects are drawn from the real economic benefits,
in the form of increased goods and services to the society. From the
positive economic effects, the Government derives revenues and reduces
expenditures, which in turn offset any additional costs of vocational
education programs.
Vocational education programs provide training to young people, who
in turn supply the necessary skills for industry, commerce and finance. With-
out the availability of such skills, businesses would not be able to operate
efficiently in an economic sense.
42
The society of Puerto Rico is rapidly changing, with one of the
highest economic growth rates in the world. Old industries are becoming
obsolescent as new industries operating with modern technology are expanding.
Some skills are becoming obsolete while other are in increasing demand. The
vocational education )rogram is necessary to provide personnel to answer the
demands of advancing technology since the vocational school system provides
facilities for training and retraining personnel.
SYSTEM OF VOCATIONAL EDUCATIONIN PUERTO RICO
Vocational education programs of the Department of Education are
designed to equip young people and adults with salable skills. The system
consists of seven secondary vocational schools. eight superior schools with
vocational departments, 376 secondary schools with vocational programs, and
two technological institutes. In addition, under the system a number of
training centers have been established in various municipalities.
The system of vocational educations has the following subprograms:
. Vocational Agriculture
. Distribution and Marketing
. Home Economics
. Office Occupation
. Trade and Industry
. Cooperative Industry Occupation
. Technical Education
. Human Resources and Industrial Arts
. Health
These programs provide two types of training:
1. Training designed to improve the way of living.
2. Training designed to improve skills and as a consequencestandards of living.
43
In this report, the first type of training has not been discussed.
However, all the programs designed to improve salable skills have been
thoroughly analyzed.
There were 59,007 students enrolled under the salable skills
programs of the vocational educaticn system in 1969-70. Of these, 26,500
graduated by May, 1970. There were 2,805 dropouts and the remainder continued
their training programs. The details of enrollment, dropouts and graduates
by programs are shown in Table V-1.
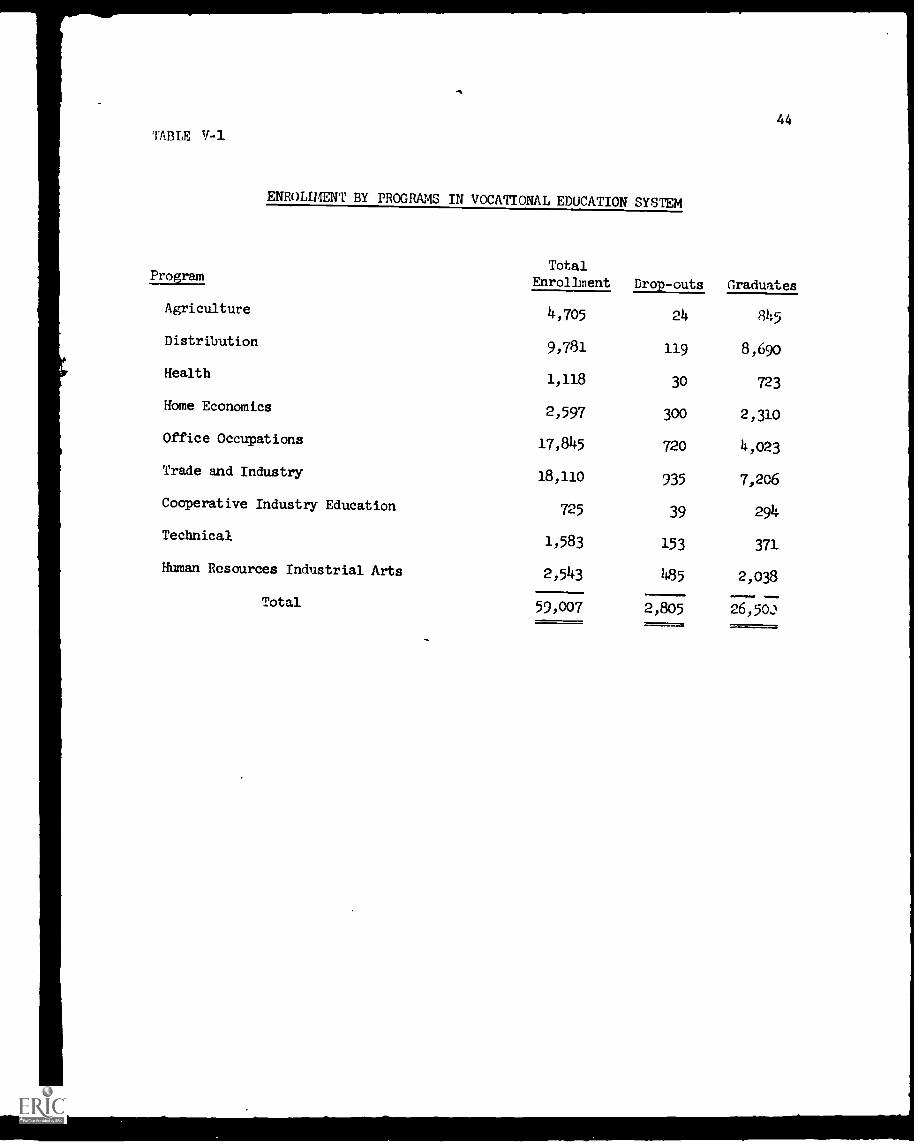
TABLE V-1
ENROLLMENT BY PROGRAMS IN VOCATIONAL EDUCATION SYSTEM
44
TotalProgram Enrollment Drop-outs Graduates
Agriculture 4,705 24 845
Distribution 9,781 119 8,690
Health 1,118 30 723
Home Economics2,597 300 2,310
Office Occupations 17,845 720 4,023
Trade and Industry 18,110 935 7,206
Cooperative Industry Education 725 39 294
Technical 1,583 153 371
Human Resources Industrial Arts 2,543 485 2,038
Total 59,007 2,805 26,500
45
COST OF VOCATIONAL EDUCATION
In 1969-70 the expenditure on training programs for salable skills
amounted to $23.5 million and, approximately $4 million for programs designed
to improve the way of living. The expenditures for subprograms are given in
Table V-2.
The table shows that the largest expenditures were incurred in Trade
and Industry programs and the smallest were incurred in Human Resources and
Industrial Arts programs. The Home Economics program was allocated 13.5 per
cent of total expenditures and Office Occupations program was 12.5 per cent of
the total expenditures.
Analysis of program expenditures by objects shows that the largest
percentage of expenditures was incurred on salaries, with 48.8 per cent, or
almost one-half, of the total expenditures. Administrative expenditures were
approximately 14.8 per cent of total expenditures; books and materials - 4.1
per cent; maintenance - 3.7 per cent; building and improvements - 5.7 per cent;
expenditures on overhead were 10.5 per cent.
While these are the overall averages of expenditures by objects,
individual programs had significant variations in the combination of
expenditures. For example, Trade and Industry allocated 63.7 per cent of its
total expenditures for salaries and wages while the Technical program allodated
28.7 per cent of total expenditures for this same purpose. While the Cooperative
Industry Education program spent 7.1 per cent of its allocation on books and
materials, the Technical program spent only 1.1 per cent on books and materials.
Administrative expenditures on the Technical programs were very high at
34.2 per cent as compared to 5.4 per cent allocated to the programs of Office
Occupations and Trade and Industry. Similarly, there was a significant
variation in expenditures allocated to equipment, furniture and fixtures.
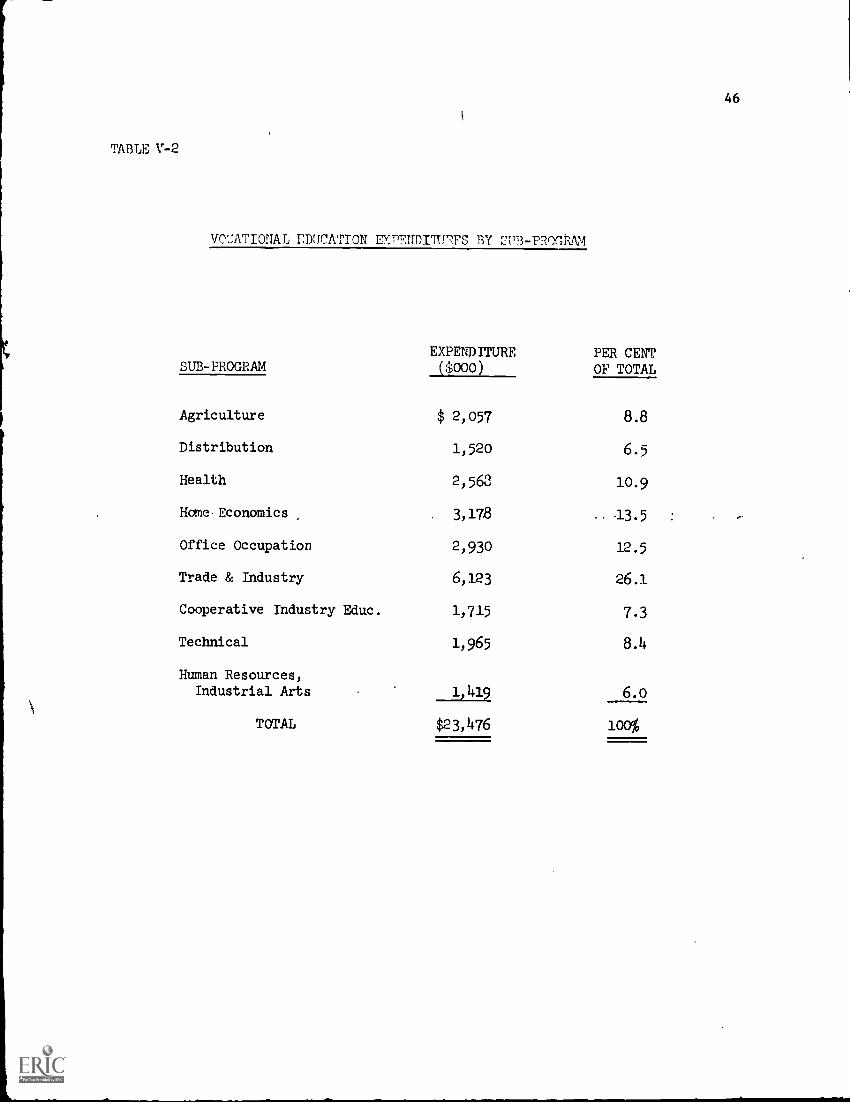
TABLE V-2
VO:;ATIONAL EDUCATION EXPENDITUTTS BY 2UB-PROGI;AM
SUB-PROGRAMEXPENDITURE PER CENT($000) OF TOTAL
Agriculture $ 2,057 8.8
Distribution 1,520 6.5
Health 2,563 10.9
Home. Economics. 3,17.8 .. .13.5 :
Office Occupation 2,930 12.5
Trade & Industry 6,123 26.1
Cooperative Industry Educ. 1,715 7.3
Technical 1,965 8.4
Human Resources,Industrial Arts
TOTAL
1,419
$23,476
6.o
46
47
While the Health program spent 2.4 per cent of the allocation on equipment,
furniture and fixtures, 23 per cent of the Cooperative Industry allocation
was for this purpose. The details are shown in Table V-3.
One of the very significant difficulties in analyzing the expendi-
tures was defining direct costs and indirect costs. The direct costs, as
pointed out elsewhere, were defined as the costs directly identified for a
particular course, such as salaries, equipment, buildings, maintenance, etc.
This means that when an expenditure could be idendified for a specific course,
it was included under direct costs. On the other hand, when costs were
incurred on programs in the form of overhead or central administration and
could not be assigned to a particular course, they were defined as indirect
costs. In many cases such indirect costs included salaries and wages,
purchases of equipment, furniture and fixtures, maintenance and improvement
of buildings, and overall administration.
It has been estimated that of the $23.5 million dollars of expendi-
tures incurred in 1969-70, only $5.8 million could be identified as direct
expenditures. On the other hand, indirect expenditures amounted to $15.2
million and in addition, overhead expenditures amounted to $2.5 million.
For this reason, uncertainty arises regarding the costs of various
programs--since individual program costs cannot be identified exactly and
can only be classified as indirect cost expenditures, it is difficult to
know how exact the estimates of individual program costs are. In the
absence of exact data, estimates have been made using a number of
assumptions. While we utilized the best methods available in estimating
indirect costs by courses, there is no doubt that there is room for improve-
ment in this area, particularly when indirect costs amounted to almost
2/3 of the total cost. This type of expenditure requires a better format
48
for identification and classification. Since the type of information system
which provides exact data on programs or courses is not generally available,
it is recommended that such a system be produced under the Management
Information System concept and designed for the vocational school program
of the Department of Education.
Indirect costs varied sharply from program to program. While
Distribution and Marketing program had 50.3 per cent of total costs in the
form of direct expenditures, the Health program had only 5.5 per cent. On
the other hand, indirect costs were very high in the case of the Health
program where they amounted to 77.5 per cent of total expenditures. While
there is uncertainty and inexactness in the direct and indirect cost data,
this does not mean that data cannot be used for appropriate analysis.
BENEFITS
There are two types of benefits: individual benefits accrue to the
vocational school graduates and social benefits accrue to the society at
large, industry, and business. Benefits accrue to an individual and to
society in the future, while most of the costs are incurred presently. To
the extent that benefits accrue in future years, they must be made core arable
to the costs. Such a comparison is possible by adjusting the future benefits
and translating them to the present value with the help of the discount rate.
Individual benefits accrue because vocational school training
permits an individual to earn higher wages and salaries than would be
possible without such training. With the help of the Department of Labor
data, supplemented by a survey conducted by the Department of Education, we
have arrived at the conclusion that wage rates vary significantly from oc-
cupation to occupation and from one type of program to another type of
program. In the area of farming, wages are low at 95i per hour. On the
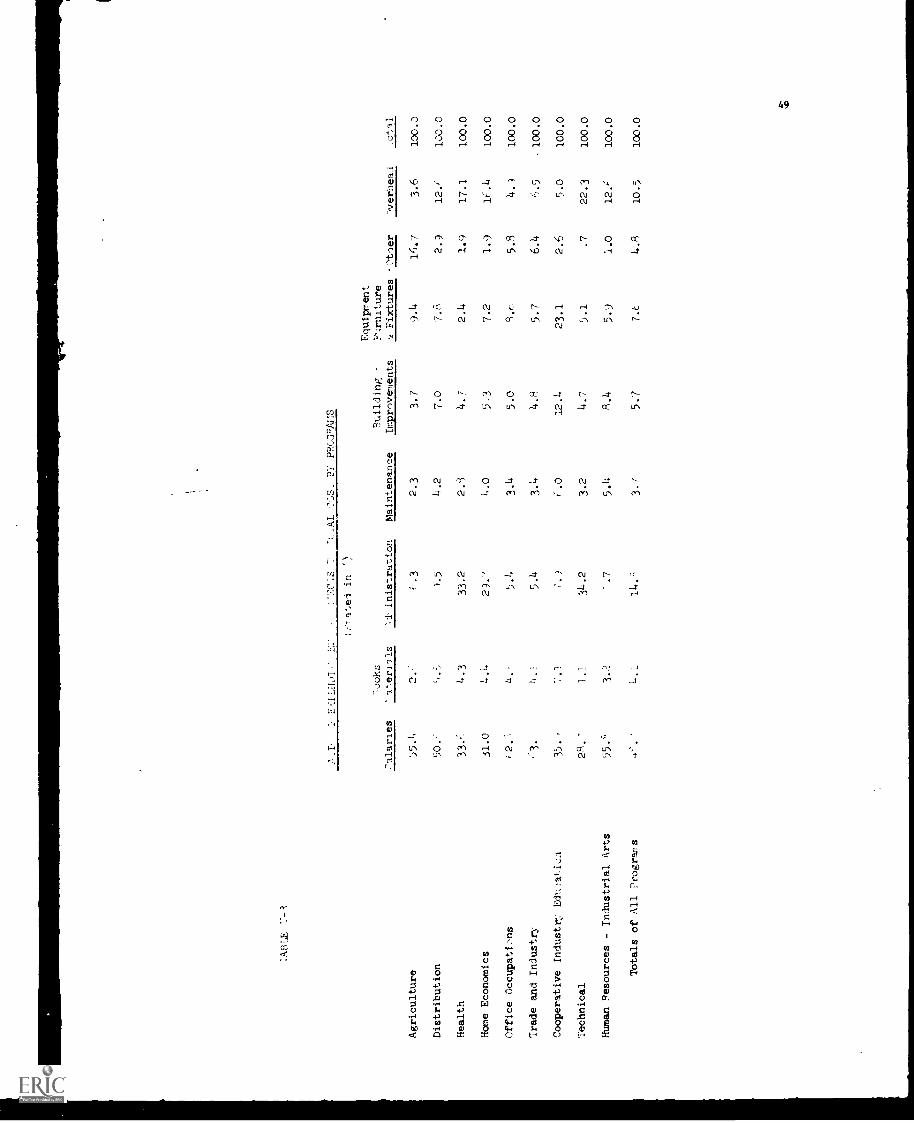
',ABLE
LI'
E.
',7:,.(71S
"(_,AL
Equiprent
F-zrniture
..., FixturesOtaer
_ verheaJ
.otal
:alaries
Joks
'aterlals
(.-'1f.ei in
f)
-1, inistration
Maintenance
Building
Improvements
Agriculture
1)5.4
(.3
2.3
3.7
9.4
16.7
3.6
100.0
Distribution
50.--
).5
4.2
7.0
7.6
2.)
12.a
100.0
Health
33'1
4.3
33.2
2.3
4.7
2.4
1.9
17.1
100.0
Home Economics
31.0
4.
2).'
4.0
5.3
7.2
1.9
14.4
100.0
Office Occupations
a 2."
4.i
5.4
3.4
5.0
9.t,
5.6
4.)
100.0
Trade and Industry
"3.
4.1
5.4
3.4
4.8
5.7
6.4
6.5
100.0
Cooperative Industry
du:ati,:a
35.
,T
. i(.
012.4
23.1
2.6
5.0
100.0
Technical
26.-
1.2
34.2
3.2
4.7
5.1
.7
22.3
100.0
Human Resources - Industrial Arts
55.`'
3.2
.7
5.4
6.4
5.9
1.0
12.0
100.0
Totals of All Prograns
14.Q
3.-7
5.7
7.E
4.9
10.5
100.0
50
other hand, wages for programmers are $3 per hour. The details of earnings
by different occupations are given in Table V-5.
This table also includes the full-tire or part -time earnings by
occupations, 2,080 hours per year being considered full -time and 1,040 hours
part-time. Thus, a person working in agriculture on the basis of 2,080 hours
per year would be earning $1,976 and a person working as a programmer would
be earning $6,240. It may be noted that wages of an agricultural worker may
be somewhat overstated in the table due to the fact that agriculture has
seasonal employment which generally lasts from 4 to 6 months of the year. The
rest of the months the worker is either unemployed or engaged in urban
occupations.
In order to find out how much a vocational school graduate earns
under the program of Agriculture or other programs, we selected a number of
occupations and used the corresponding wage rates to determine earnings of a
worker during the twelve-month period.
It has been estimated that total benefits received by 1969-70
graduates from salaries and wages amounted to $58.4 million on a twelve-month
basis. The single most important program contributing to total individual
benefits was the program of Distribution at $22.4 million and the second most
important program was Trade and Industry which contributed $15.3 million. The
program of Agriculture contributed the lowest amount, at $1.1 million.
Substantial benefits accrue to full-time employed individuals, and
only to a minor extent to the part-time employed vocational school graduates.
The number of part-time graduates is much lower than full-time graduates and
earnings of part-time graduates are assumed to be 50% of full-time graduates.
Full-time and part-time benefits by programs are shown in Table V-6.

iA4LE V-4
DIrECT,
'WfliEEAD ELPENDITURES B1 SUB-PP0i1RAMS, 1969-70
tub-Prowram
,ot1
.'lrect
of Arect
to -otal
Indirect
of Indirect
to total
Cvernead
70 of Overhead
to Total
Afrric-.11ture
2.)6,31
.:
444,440
21.6
1,536,679
,'4.7
75,713
3.7
Distribution
,.;20.,:t12
(..3, 57
,0.3
564,(44
3(.1
1)2,111
12.6
wealth
2. )
t .t 5.'
13907)
5.5
1,939,3)5
77.5
43'-',,282
17.0
Home Economics
3,11, 350
428,2,4
13.5
2,228,556
70.1
521,528
1(.4
Zffice .7,ccupations
,), 2 ),t 95
73,827
24.4
2,073,506
70.9
142,3r2
4.3
Trade and Industry
, ,123,100
1,J(,292
31.3
3,806,619
62.2
400,189
(.5
Cooperative Industry FAuclti-Jn
1.715,4"
764,34f
44.6
865,039
50.4
36,o33
5.0
Technical
1, ),
5 .')
')t1.
4,i
19,+.4
1,362,57E
(9.3
43P,3(,2
22.3
,!uman Peso,xces, Industrial
its
1,41.'3',
427,815
30.2
811,343
57.2
1 ,,,),( (,-)
22.c
'total_
23.475,05
:5,/c3,04,)
24.t
:15,235,4)/
t,4.1
2,474.259
10.5
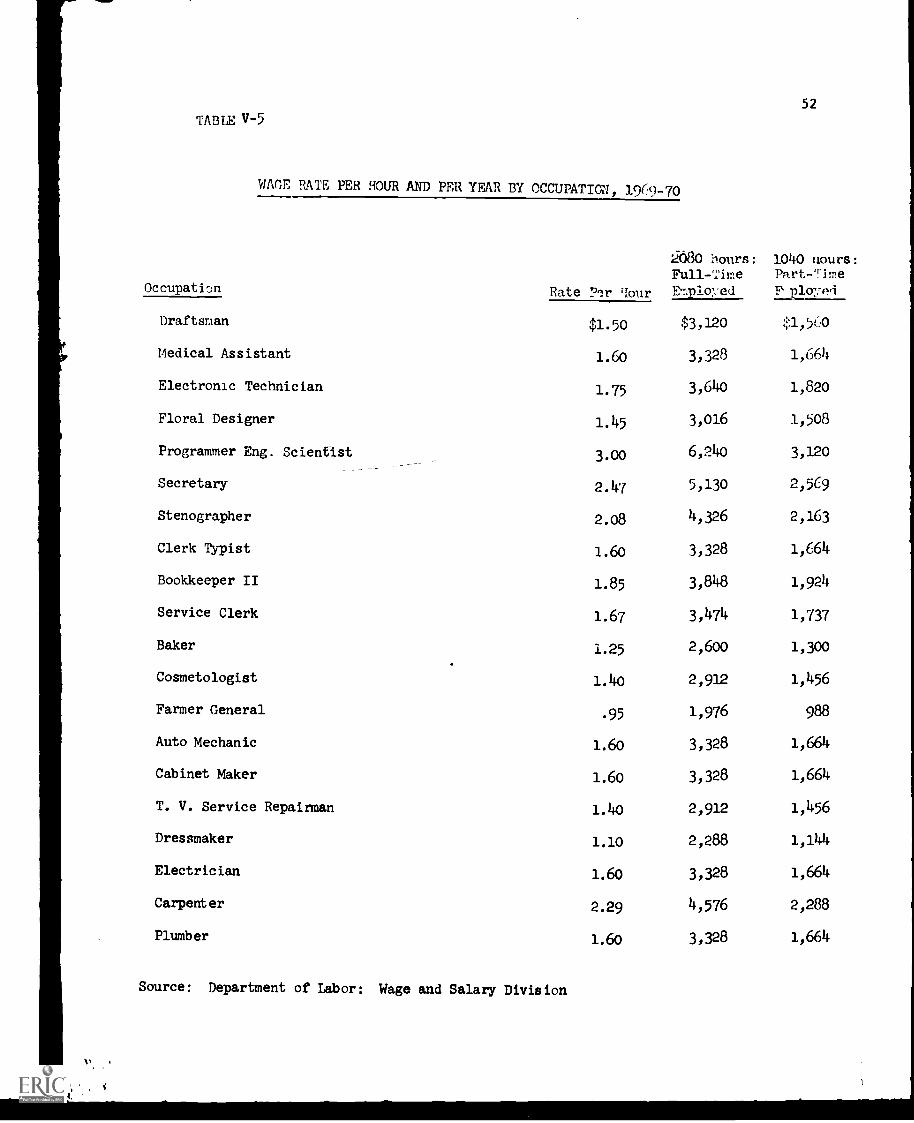
52
TABLE V-5
WA(E RATE PER HOUR AND PER YEAR BY OCCUPATION, 1969-70
Occupation Rate 711r rtour
..1680 hours:
Full-TimeDeployed
1040 nours:Part-Time
F'ployPi
Draftsman $1.50 $3,120 $1,560
Medical Assistant 1.60 3,328 1,664
Electronic Technician 1.75 3,640 1,820
Floral Designer 1.45 3,016 1,508
Programmer Eng. Scientist 3.00 6,240 3,120
Secretary 2.47 5,130 2,569
Stenographer 2.08 4,326 2,163
Clerk Typist 1.60 3,328 1,664
Bookkeeper II 1.85 3,848 1,924
Service Clerk 1.67 3,474 1,737
Baker 1.25 2,600 1,300
Cosmetologist 1.40 2,912 1,456
Farmer General .95 1,976 988
Auto Mechanic 1.60 3,328 1,664
Cabinet Maker 1.60 3,328 1,664
T. V. Service Repairman 1.40 2,912 1,456
Dressmaker 1.10 2,288 1,144
Electrician 1.60 3,328 1,664
Carpenter 2.29 4,576 2,288
Plumber 1.60 3,328 1,664
Source: Department of Labor: Wage and Salary Division
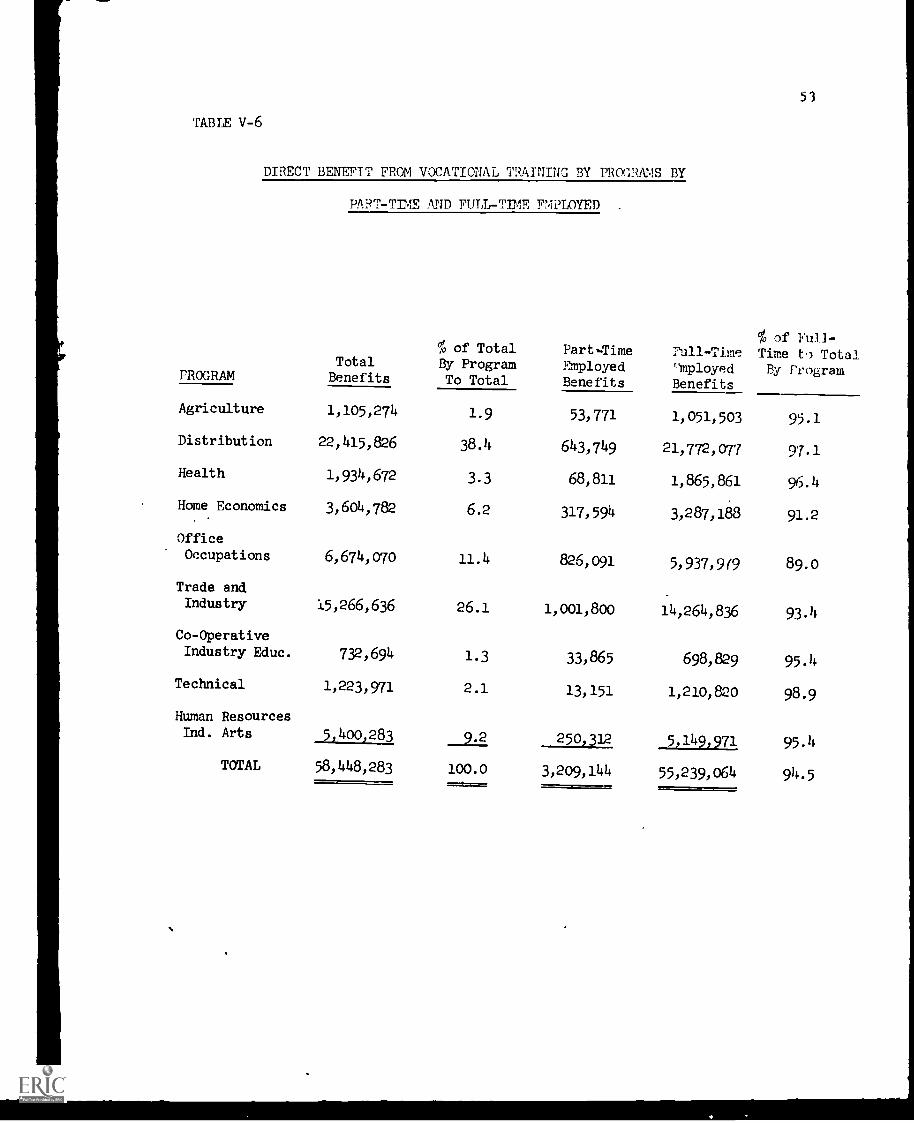
TABLE v-6
DIRECT BENEFIT FROM VOCATIONAL TRAINING BY PROGRAMS BY
PART -TIME AND FULL-TIME EMPLOYED
53
Totalof Total
By ProgramPart-TimeEmployed
Full-Timemployed
% of Full-Time t') TotalBy ProgramPROGRAM Benefits To Total Benefits Benefits
Agriculture 1,105,274 1.9 53,771 1,051,503 95.1
Distribution 22,415,826 38.4 643,749 21,772,077 97.1
Health 1,934,672 3.3 68,811 1,865,861 96.4
Home Economics 3,604,782 6.2 317,594 3,287,188 91.2
Office
Occupations 6,674,070 11.4 826,091 5,937,9(9 89.0
Trade andIndustry 15,266,636 26.1 1,001,800 14,264,836 93.4
Co-OperativeIndustry Educ. 732,694 1.3 33,865 698,829 95.4
Technical 1,223,971 2.1 13,151 1,210,820 98.9
Human ResourcesInd. Arts 5,400,283 9.2 121111 5,149,971 95.4
TOTAL 58,448,283 100.0 3,209,144 55,239,064 94.5

54
UNIT BENEFITS AND COSTS
In previous sections, we have provided analysis and data on benefits
and costs by programs. If we divide the data on benefits and costs by the
corresponding number of graduates, we can obtain unit benefits and unit costs
by programs.
The unit benefit cost data given in Table V-7 was used to obtain
benefit:cost ratio. The benefit:cost ratio equals the present value of
benefits divided by the present value of cost. As a general rule, when the
benefit:cost ratio exceeds unity, the corresponding activity is economically
superior to an alternative activity with a lower benefit:cost ratio. If
purely economic criteria are to be used in determining the decision on voca-
tional expenditures, then the programs chosen first should be those having
the highest benefit cost ratio. Similarly, some researchers, such as Bruce
Davie;1/
are of the opinion that programs having a benefit ratio less than
one should not be undertaken. In addition to Davie, Mr. Einar Hardin-2/
cautioned that the decision-maker may elect to consider additional criteria
of a noneconomic nature in the decision-making process.
1/ Davie, Bruce F. "Benefit/Cost Analysis of Vocational Education: a Survey."In Arnold Kotz (Ed.), Occupational Education: Planning and Programming.Volume Two. Menlo Park, Calif.: Stanford Research Institute, September,1967, Pp. 309-330.
Davie, Bruce F. "Cost-benefit Analysis of Vocational Education: A Survey."In Hearings Before The General Subcommittee on Education of the Committeeon Education and Labor, House of Representatives Ninetieth Congress, FirstSession, on H.R. 8525 and Related Bills, A Bill to Amend the VocationalEducation Act of 1963. Part 1. Washington, D.C.: U.S. Government PrintingOffice, 1968, Pp. 105-117.
2' Aardin, Einar. "Summary Guide for Effectiveness/Cost and Benefit/CostAnalyses of Vocational and Technical Education: A Report of the Conference."In Arnold Kotz (Ed.), Occupational Education: Planning and Programming.Volume Two. Menlo, Calif.: Stanford Research Institute, September, 1967,Pp. 379-386.
55
Benefit:cost ratio is more than unity for the programs of
Distribution and Marketing, Home Economics, Office Occupations, Trade and
Industry program, and Human Resources and Industrial Arts. For Cooperative
Industry Education, Technical programs, Agriculture, and Health, benefit:cost
ratios are less than unity. The reason that four programs have benefit:cost
ratio less than unity is that only one year is being used as the source of
benefit to the individual. However, if about two years are used, ;:hen
benefit:cost ratio in almost all the programs will be more than unity. It
may be noted that it is not realistic to use one or two years as source of
benefits to individual as stated elsewhere. Generally, a vocational school
graduate leaves the school when he is about 20 years old. Presently, the
working life of an individual generally is up to the age of 65. This means
that he has a working life of 45 years and thus the benefits to him as well
as to the society will accrue over all these years. The future benefits,
however, are discounted to give them a present value.

TABLE V-7
RATIO OF BENEFIT TO COST BY PROGRAMS
56
Total Total Unit UnitFrogram Graduates Benefits Costs Benefits Costs Renefit:Cost
Agriculture 845 1,105,274 2,056,831 2,284 4,240 .54:1
Distribution 8,690 22,415,826 1,520,312 2,579 175 14:1
Health 723 1,934,672 2,567,656 2,676 3,551 .75:1
Home
Economics 2,310 3,604,782 3,178,350 1,560 1,376 1.1:1
Office
Occupations 4,023 6,764,070 2,929,695 1,681 728 2 . 3:1Trade andIndustry 7,206 15,266,636 6,123,100 2,118 850 2.5:1
Cooperative
Industry Education 294 732,694 1,715,468 2,492 5,835 .42:1
Technical 371 1,223,971 1,965,556 3,299 5,298 .62:1
Human Resources,Industrial Arts 2,038 5,400,283 1,418,837 2,650 696 3.8:1
MULTIPLIER EFFECTS OF BENEFITSFROM VOCATIONAL EDUCATION
In an earlier section we have estimated the total benefits and
benefits by programs from vocational education. These estimated benefits are
considered to be the direct benefits. These are the benefits which accrue
only to an individual trainee himself and do not include all the benefits
accruing to society at large.
It has been estimated that total benefits to individual graduates
from the vocational school program amounted to $58.4 million within 12 months
of the graduates' employment. Using the multiplier effect it is estimated
that total benefits accruing to the society at large amounted to $116.9
million. This sam of $116.9 million includes both direct benefits and
indirect benefits. The indirect benefits accrue to the society by the fact
that each dollar of income accruing to a technical vocational graduate when
spent on different goods and services creates another job and another dollar
of income for the workers who are part of the labor force of Puerto Rico.
This ratio of direct to indirect benefit of 1:1 is the standard ratio used
by the Puerto Rico Planning Board and the Economic Development Administration
in the estimation of income and jobs. The details of direct benefits and
total social benefits including the multiplier effect are shown in Table V-8.
It may be noted that the sum of $116.9 million represents 3.2 per cent of the
1970 net income of Puerto Rico.
57
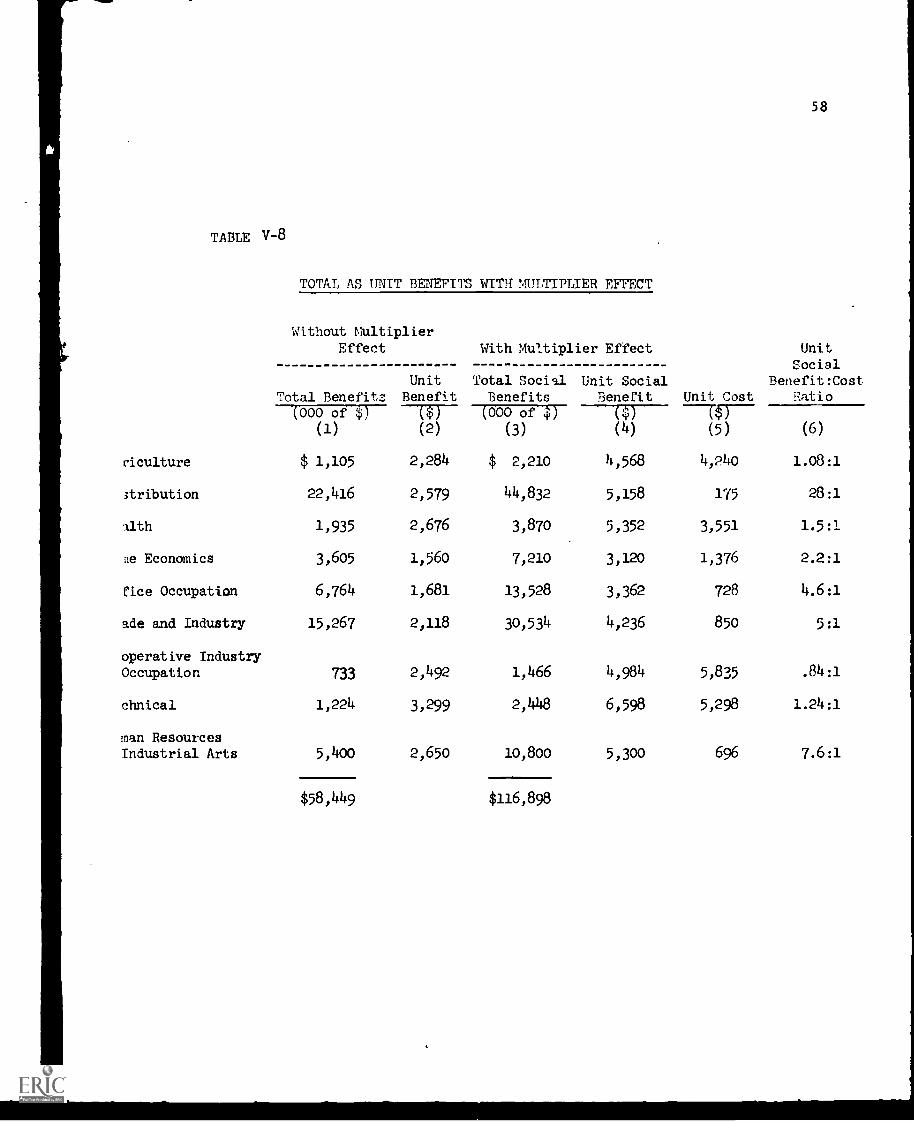
TABLE v-8
TOTAL AS UNIT BENEFITS WITH MULTIPLIER ElthCT
58
Without MultiplierEffect With Multiplier Effect Unit
SocialUnit Total Social Unit Social Benefit:Cost
Total Benefits Benefit Benefits Benefit Unit Cost Ratio(000 of $)
(1)($)(2)
(000 of $)
(3)
($)(4)
---T$)(5) (6)
riculture $ 1,105 2,284 $ 2,210 4,568 4,240 1.08:1
stribution 22,416 2,579 44,832 5,158 175 28:1
alth 1,935 2,676 3,870 5,352 3,551 1.5:1
ne Economics 3,605 1,560 7,210 3,120 1,376 2.2:1
rice Occupation 6,764 1,681 13,528 3,362 728 4.6:1
ade and Industry
operative Industry
15,267 2,118 30,534 4,236 850 5:1
Occupation 733 2,492 1,466 4,984 5,835 .84:1
clinical
man Resources
1,224 3,299 2,448 6,598 5,298 1.24:1
Industrial Arts 5,400 2,650 10,800 5,300 696 7.6:1
$581449 $116,898
59
TOTAL SOCIAL BENEFITS ANDUNIT COST RATIO
Table V-8 provides the data on unit costs which vary from $175 in
the case of a graduate of the Distribution program to $5,835 under the
Cooperative Industry occupation program. The unit costs for other programs
are given in Table V-8, which also provides the data on unit social benefits.
The unit social benefits are defined as the summation of direct and indirect
benefits, divided by the number of graduates. The unit social benefits varied
from $3,120 in the case of Home Economics to $6,598 in the Technical program.
The unit social benefits for other programs are within this range.
A comparison of ratio of unit social benefits to unit cost, is given
in Column 6 of Table V-8. It may be seen from this table that the ratios are
as high as 28:1 and as /ow as .84:1. It may be noted that it is only in the
case of the Cooperative Industry occupation program that the ratio of benefit
to cost is less than unity. In all other cases, the ratio of benefits to cost
is higher than one and in the case of Distribution, Office Occupations, Trade
and Industry and the program of Human Resources and Industrial Arts, the
benefits ratio is significantly higher than one. Even in the case of the
Agriculture program where wage rates are lower than in those occupations
generally associated with urban economic and social activity, the ratio of
unit social benefit to cost is higher than unity. It should be emphasized
that these ratios are computed from benefits accruing over a period of only
12 months of work. When computed over an individual's 45 working years,
obviously, the benefits will be much higher than the cost.
VALUE OF DISCOUNTEDFUTURE BENEFITS
While the costs are incurred presently, the benefits from voca-
tional school programs accrue to an individual and the society over a number

60
of years. The problem exists in the need to express streams of future
benefits to comparable present values. As a whole, both the individual and
the society acting collectively place a higher value on present benefits
than on future benefits, or on the present cost of future benefits. Students
of economics have devoted considerable time and effort in determining the ap-
propriate social time preference discount rate which could be applied in cost
benefit analysis. While the problem has not been resolved to the sstisfac-
tion of all, one solution has been sought using an interest rate which an
individual has to pay to borrow a certain amount of money from the commercial
banking system. Some economists have felt that the discount interest rate
should be equate to what the Government paid for its public debt, and others
have argued for some combination of both the private rate of interest and the
Government rate of interest. We have combined the private rate of interest
and the public rate of interest and, therefore, have used an interest rate of
7 per cent per year to discount benefits which will accrue in the future years.
Benefits to the society and to an individual will accrue correspond-
ingly to the wage rates for different occupations and skills. During the
past five years, wage rates have been rising at the rate of 10 per cent per
year. We assume that these wage rates will continue to increase at that rate
over the next five years. Thus, an occupation receiving a wage of $1 per hour
in the current year will receive a benefit of $1.10 next year and $1.61 in the
5th future year.
Based on increase of wage rates and discount rates, we have developed
an index of present value of discounted future benefits. This index is based
on 10 per cent increase in wages and salaries per year and 7 per cent discount
for reducing future benefits to present value. The index is given in Table V-10.
Thus, based on these two variables of wages and discount rates we have arrrived
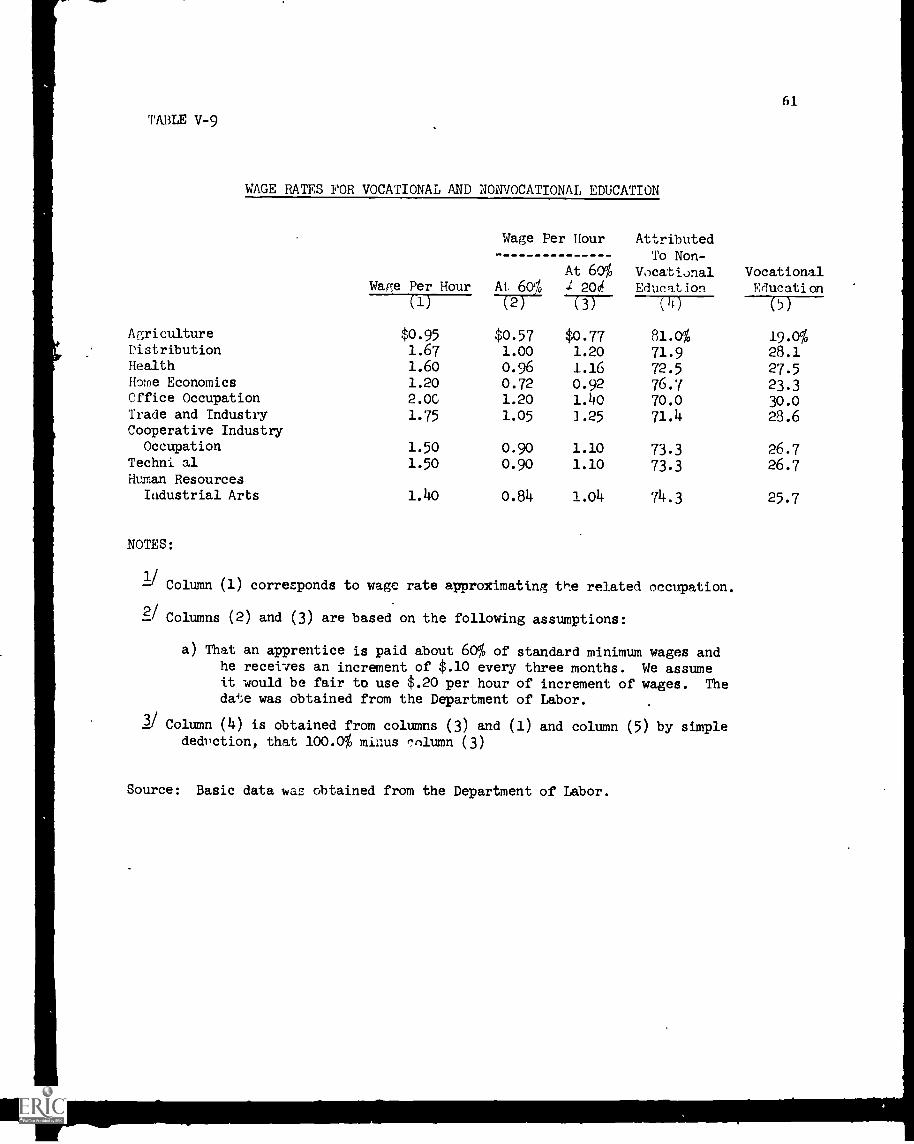
TABLE V-9
WAGE RATES FOR VOCATIONAL AND NONVOCATIONAL EDUCATION
61
Wage Per Hour
Wage Per Hour
At 60%At 60% 1 20d
AttributedTo Non-
VocationalEducation
VocationalMucation
(1) (3) (Jr)(5)
Agriculture $0.95 $0.57 $0.77 81.o% 19.0%Distribution 1.67 1.00 1.20 71.9 28.1Health 1.60 0.96 1.16 72.5 27.5Home Economics 1.20 0.72 0.92 76.7 23.3Office Occupation 2.0C 1.20 1.40 70.0 30.0Trade and Industry 1.75 1.05 3.25 71.4 28.6Cooperative IndustryOccupation 1.50 0.90 1.10 73.3 26.7
Techni al 1.50 0.90 1.10 73.3 26.7Human Resources
Industrial Arts 1.40 0.84 1.04 74.3 25.7
NOTES:
2/ Column (1) corresponds to wage rate approximating the related occupation.
2/ Columns (2) and (3) are based on the following assumptions:
a) That an apprentice is paid about 60% of standard minimum wages andhe receives an increment of $.10 every three months. We assumeit would be fair to use $.20 per hour of increment of wages. Thedate was obtained from the Department of Labor.
2/ Column (4) is obtained from columns (3) and (1) and column (5) by simplededuction, that 100.0% minus nolumn (3)
Source: Basic data was obtained from the Department of Labor.
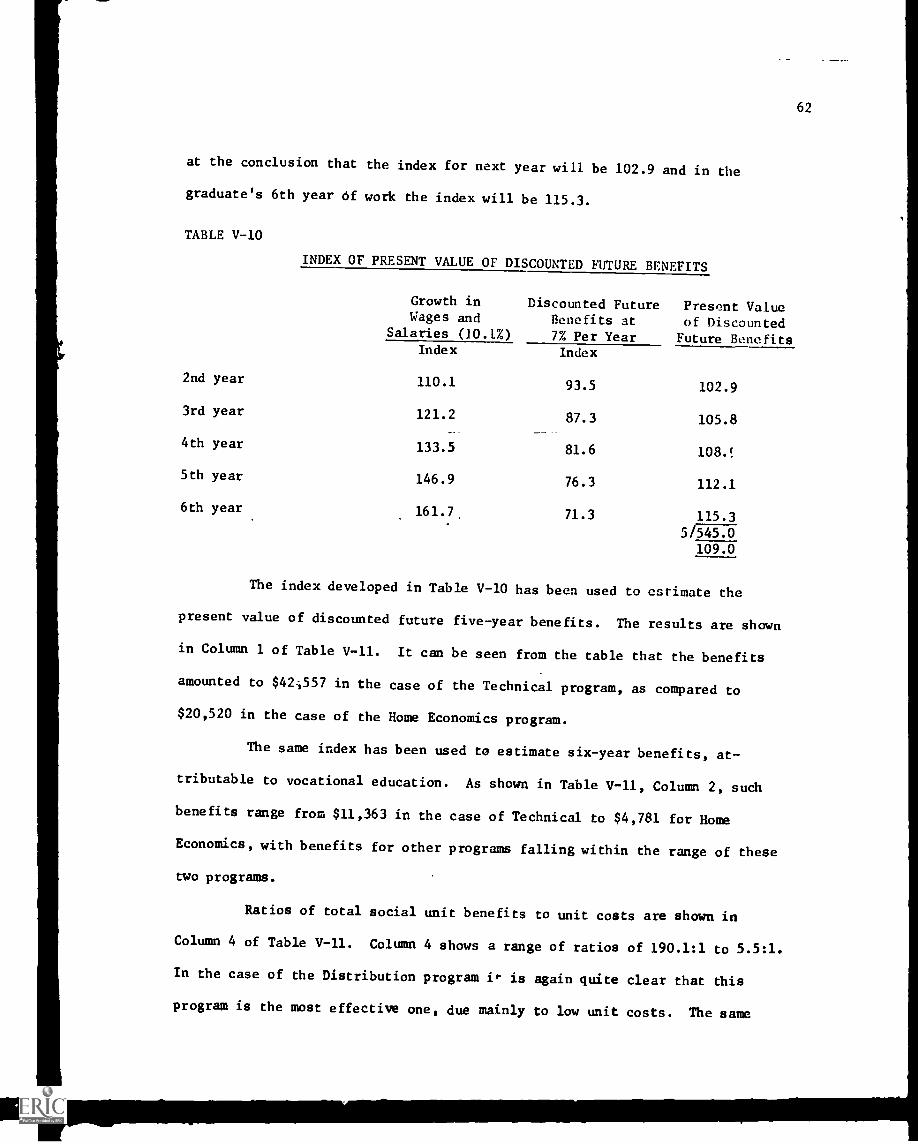
62
at the conclusion that the index for next year will be 102.9 and in the
graduate's 6th year Of work the index will be 115.3.
TABLE V-10
INDEX OF PRESENT VALUE OF DISCOUNTED FUTURE BENEFITS
Growth inWages and
Salaries (10.1%)
Discounted FutureBenefits at7% Per Year
Present Valueof DiscountedFuture Benefits
Index Index
2nd year 110.1 93.5 102.9
3rd year 121.2 87.3 105.8
4th year 133.5 81.6 108.!
5th year 146.9 76.3 112.1
6th year 161.7. 71.3 115.3
5/545.0109.0
The index developed in Table V-10 has been used to estimate the
present value of discounted future five-year benefits. The results are shown
in Column 1 of Table V-11. It can be seen from the table that the benefits
amounted to $423557 in the case of the Technical program, as compared to
$20,520 in the case of the Home Economics program.
The same index has been used to estimate six-year benefits, at-
tributable to vocational education. As shown in Table V-11, Column 2, such
benefits range from $11,363 in the case of Technical to $4,781 for Home
Economics, with benefits for other programs falling within the range of these
two programs.
Ratios of total social unit benefits to unit costs are shown in
Column 4 of Table V-11. Column 4 shows a range of ratios of 190.1:1 to 5.5:1.
In the case of the Distribution program if- is again quite clear that this
program is the most effective one, due mainly to low unit costs. The same
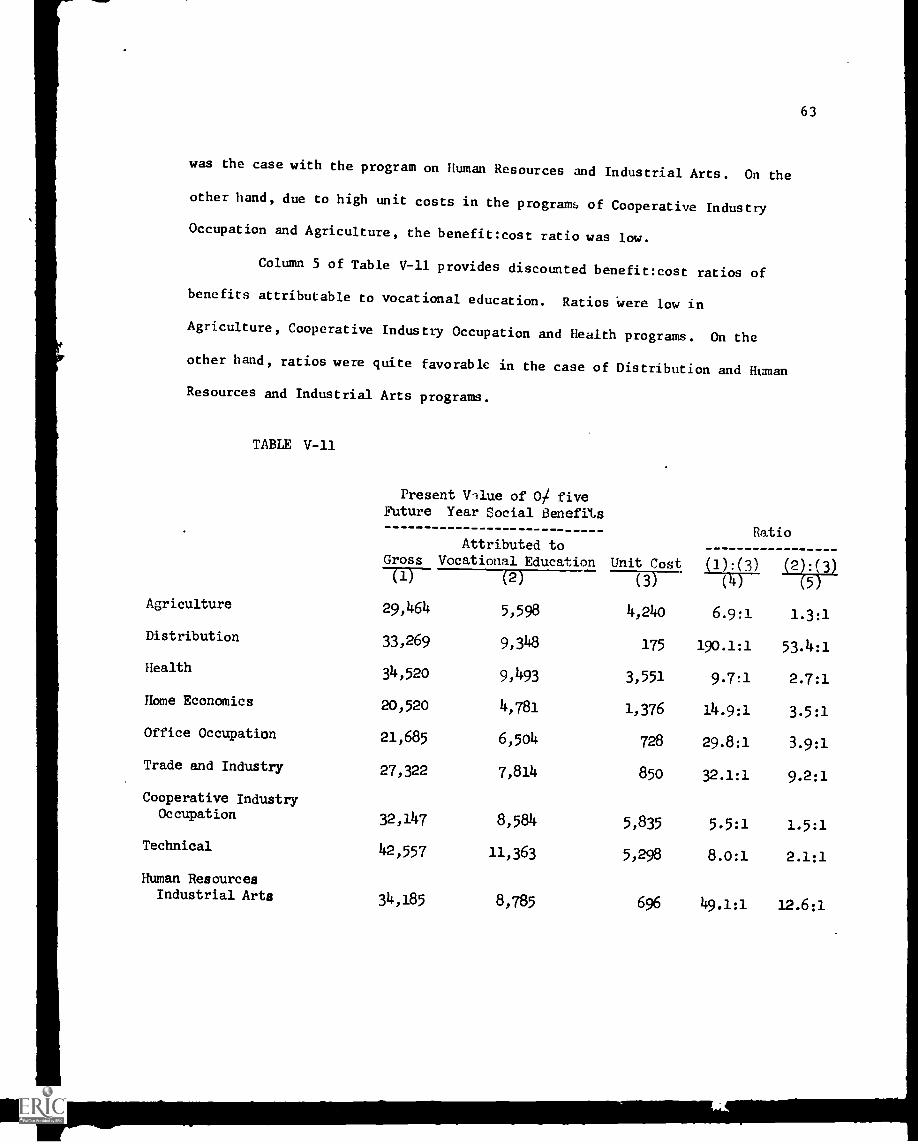
63
was the case with the program on Human Resources and Industrial Arts. On the
other hand, due to high unit costs in the programs of Cooperative Industry
Occupation and Agriculture, the benefit:cost ratio was low.
Column 5 of Table V-11 provides discounted benefit:cost ratios of
benefits attributable to vocational education. Ratios were low in
Agriculture, Cooperative Industry Occupation and Health programs. On the
other hand, ratios were quite favorable in the case of Distribution and Human
Resources and Industrial Arts programs.
TABLE V-11
Present Vilue of 0/ fiveFuture Year Social Benefits
Attributed toGross Vocational Education Unit Cost
Ratio
(1):(3) (2):(3)(1) (2) ---rff--- (4) (5
Agriculture 29,464 5,598 4,240 6.9:1 1.3:1
Distribution 33,269 9,3118 175 190.1:1 53.4:1
Health 34,520 9,493 3,551 9.7:1 2.7:1
Home Economics 20,520 4,781 1,376 14.9:1 3.5:1
Office Occupation 21,685 6,504 728 29.8:1 3.9:1
Trade and Industry 27,322 7,814 850 32.1:1 9.2:1
Cooperative IndustryOccupation 32,147 8,584 5,835 5.5:1 1.5:1
Technical 42,557 11,363 5,298 8.0:1 2.1:1
Human ResourcesIndustrial Arts 34,185 8,785 696 49.1:1 12.6:1

64
GOVERNMENT REVENUES ANDVOCATIONAL EDUCATION
Vocational education programs help a person to find a job which
otherwise might not be available to him. When there is a scarcity of trained
persornel, vocational education programs help to fill the need. In both
cases, vocational education programs increase the benefits to the economy
of the society of Puerto Rico.
Elsewhere, we have estimated that vocational education programs
directly created benefits of $58.4 million. As explained before, these
benefits, with the multiplier effect, increased to $116.9 million. It is
the income which is subject to the Commonwealth's system of taxes. The system
of taxes of the Government of Puerto Rico includes taxes such as: personal
: income tax, corporate tax, property tax, excise tax, licenses, etc. In ad-
dition, the Federal Government imposes a number of taxes on imports in
Puerto Rico which are reimbursed to the Government of Puerto Rico.
It has been estimated by the Department of the Treasury of the
Commonwealth of Puerto Rico that different income brackets pay different
rates of taxes, the details of which are given in Table V-12.
If we assume that the $116.9 million of benefits bear the burden
of an average 14 per cent tax rate, then Government revenues amount to $16.4
million. Elsewhere, we have estimated that the Department of Education spent
$23.5 million on vocational education in 1969-70. This means that the
Government of Puerto Rico received 69.8 per cent of the vocational school
expenditures in the form of tax and nontax revenues. Thus, within a period of
17 months of graduation the Government of Puerto Rico received back from the
salaries of the vocational schools' 1969-70 graduates the entire amount
expended for their training program.
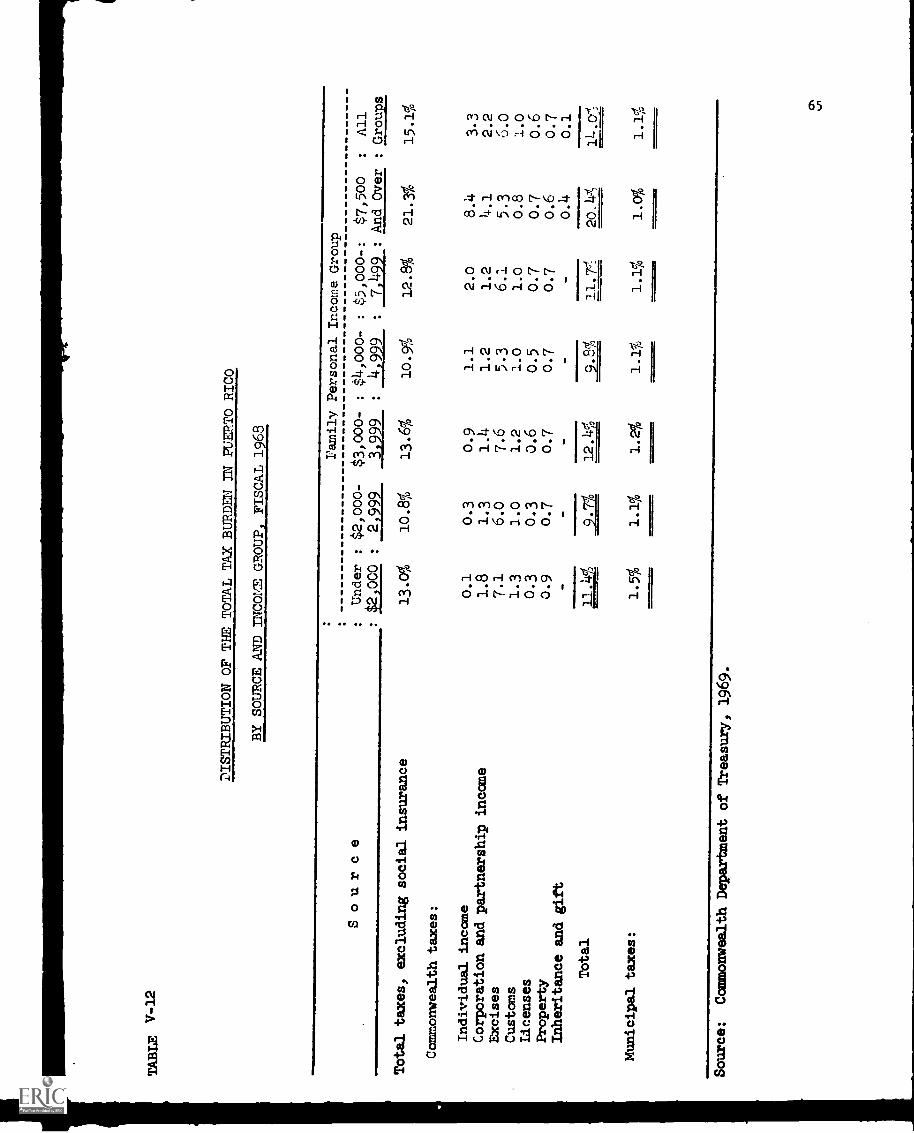
TABLE V-12
DISTRIBUTION OF THE TOTAL TAX BURDEN IN PUERTO RICO
BY SOURCE AND INCOME GROUP, FISCAL 1968
Family Personal Income Group
Source
:Under
:$2,000-
$3,000-
:$4,000-
:$5,000-:
$7,500
:All
:$2,000
:2,999
3,999
:4,999
:7,499
: And Over
: Groups
Total taxes, excluding social insurance
13.0%
10.8%
13.6%
10.9%
12.8%
21.3%
15.1%
Commonwealth taxes:
Individual income
0.1
0.3
0.9
1.1
2.0
8.4
3.3
Corporation and partnership income
1.8
1.3
1.4
1.2
1.2
4.1
2.2
Excises
7.1
6.o
7.6
5.3
6.1
5.3
6.0
Customs
1.3
1.0
1.2
1.0
1.0
0.8
1.0
Licenses
0.3
0.3
0.6
0.5
0.7
0.7
0.6
Property
0.9
0.7
0.7
0.7
0.7
0.6
0.7
Inheritance and gift
0.4
0.1
Total
2246
2421
22.12e.:2
_24L
11.7e
20.4
1,
Municipal taxes:
1.5%
1.1%
1.2%
1.1%
1.1%
1.0%
1.1%
Source:
Commonwealth Department of Treasury, 1969.

TABLE V-13
A CC ARISON OF VOCATIONAL PROGRAM EXPENDITURE
WITH GOVEAMENT 1,E VENUES
66
($000)
Vocational ProgramExpenditures
1969-70
GovernmentRevenues in12 months
(2) as
of (1)(1) (2)
Agriculture $ 2,057 $ 309 15.0%
Distribution 1,520 6,276 412.8
Health 2,568 542
Home Economics 3,178 1,009 31.7
Office Occupation 2,930 1,894 64.6
Trade and Industry 6,123 4,275 69.8
Cooperation IndustryOccupation 1,715 205 11.9
Technical 1,966 343 17.4
Human Resources Industrial Arts 11319 1L512 106.5Total
416,3-65 69.7f
67
By programs, however, the results appear to be different. Among
the nine programs analyzed in the study, there were two programs - Office
Occupations and Trade and Industry - whose percentages of revenues to costs
approximated the overall average. The other seven programs were not very
close to the overall percentage. The program of Distribution brought a
return of more than four times the costs incurred by the Government.
Similarly, the program of Human Resources and Industrial Arts brought a
rate of return of over 100 per cent to the Government of Puerto Rico in the
form of tax and nontax revenues. But the programs of Agriculture, Cooperative
Industries occupations, Health and Technical brought revenues which were in
the range of 11.9 per cent for Cooperative Industry and 31.7 per cent for
Home Economics. The details of Government revenues by programs are shown in
Table V-13.
68
INDIVIDUAL BENEFITSAND TAX REVENUES
As shown in Table V-14, the benefits accruing to individuals under
different programs vary sharply. On the one hand, the Technical program
brought to an average student a return of approximately $3,300, while the
program of Home Economics brought to an individual a return of only $1,560.
These incomes, as stated previously, are subject to different effective tax
rates. It has been estimated by the Commonwealth Department of the Treasury
that incomes below $2,000 pay an effective tax rate of 11.4 per cent; incomes
in the range of $2,000 to $2,999 pay an effective tax rate of 9.7 per cent,
and incomes of $3,000 to $3,999 pay an effective tax rate of 12.4 per cent.
In the second column of Table V-14, the effective rates are shown for each
program. When the effective tax rates are applied to individual incomes
corresponding to different programs, we obtain taxes paid by individuals.
These taxes are shown in Column 5 of Table V-14. The taxes paid by a student
from a Technical program amounted to $409, as compared to $178 in the case of
a student from a Home Economics program. Column 5 of Table V-14 should be
seen with a view to determining the taxes paid by graduates under diTferent
programs.
BENEFITS ATTRIBUTABLE TO VOCATIONALEDUCATION AND GOVERNMENT REVENUES
Elsewhere, we have shown that no benefits accruing to an individual
due to vocational education are less than the total benefits accruing to
an individual without vocational education. By this we mean that only those
benefits are attributed to vocational education which a graduate would not
be able to receive without it. Such benefits would generally ac an
individual over his lifetime, since generally, a vocational school graduate
leaves the school system at the age of 20 and continues to work up to the age
of 65. This means that most likely the benefits would accrue to him over the
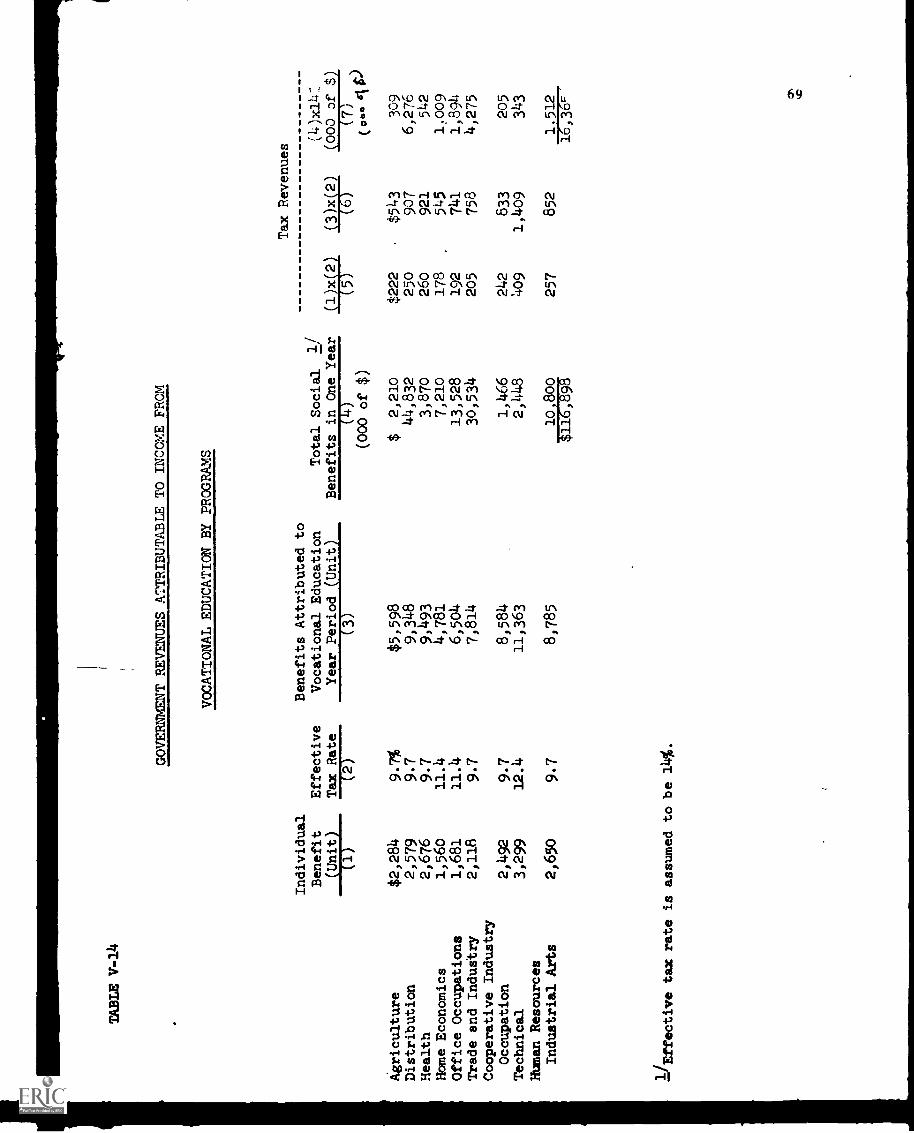
TOLE V-14
GOVERNMENT REVENUES ATTRIBUTABLE TO INCOME FROM
VOCATIONAL EDUCATION BY PROGRAMS
Individual
Benefit
Effective
(Unit)
Tax Rate
(1)
-727-
Benefits Attributed to
Vocational Education
Year Period (Unit)
(3)
Total Social
1/
Benefits in One Year
(4)
(000 of $)
Agriculture
$2,284
9.7%
$5,598
$2,210
Distribution
2,579
9.7
9,348
44,832
Health
2,676
9.7
9,493
3,870
Home Economics
1,560
11.4
4,781
7,210
Office Occupations
1,681
11.4
6,504
13,528
Trade and Industry
2,118
9.7
7,814
30,534
Cooperative Industry
Occupation
2,492
9.7
8,584
1,466
Technical
3,299
12.4
11,363
2,448
Human Resources
Industrial Arts
2,650
9.7
8,785
10,800
$116,898
1/Effective
tax rate is assumed to be 14%.
Tax Revenues
(4)x14
(1)x(2)
(3)x(2)
(000 of 8)
(5)
(7)
(00.
ow
$222
.$543
309
250
907
6,276
260
921
542
178
545
1.009
192
741
1,894
205
758
4,275
242
833
205
4o9
1,409
343
257
852
1,512
16,36'
70
period of his working life of 45 years. While we have not estimated in the
study the benefits accruing to an 4idividual over his lifetime, we have
estimated the present value of benefits accruing to an individual over a period
of five future years. These benefits are shown in Column 3 of Table V-14. The
benefits differ from $11,363 to $4,781. For other programs, net benefits
may be seen in Column 3 of Table V-14 also. Effective tax rates applicable
to these incomes are shown in Column 2 of Table V-14. To obtain the
Government revenues over a period of six years, we apply the data given in
Column 3 by the effective rate given in Column 2. Column 6 of the Table
shows that the Government would receive from such incomes to individuals,
revenues in the range of $543 for a student in the Agriculture program and
$1,409 for a student in the Technical program. Further details of revenues
are shown in Table V-14.
OTHER BENEFTTS FROM VOCATIONALEDUCATION PROGRAMS
In the previous sections we have discussed benefits emerging from
vocational education in the form of increased wages and salaries. Not only
do salaries and wages increase but more jobs are also available. Likewise,
availability of skilled labor is a very significant incentive for manufactur-
ing plants to locate in Puerto Rico.
Vocational education increases the gross product of Puerto Rico.
Increased salaries and wages through the multiplier effect increases the
demand for goods and services, the supply of which requires more investment,
employment of workers and social infrastructure.
A trained labor force increases productivity, reduces capital
expenditures, and increases returns on investment. Higher profitability
is one of the most effective stimulants for investment.
Increases in salaries, wages and gross product raises tax and non-
tax revenues substantially. Also, vocational education improves skills and
job opportunities and it keeps the young people from idling in the stree s.
A significant number of crimes, particularly of Type II are committed in
Puerto Rico by young people who are neither employed nor attending ache as.
Each crime committed requires deputation of police resources, patrolling,
investigation, apprehension, appearance in court and escort to jail; each
requires the time of courts and jail staff; and each crime may cost the
Government thousands of dollars additionally through loss of worKing time to
a private citizen (i.e., the victim of the crime). To the extent vocational
education provides employment to young people otherwise unemployed, it reduces
Government expenditures and improves the quality of services that can be made
available to the public.
Higher wages and salaries tend to reduce dependency on the
Government for services such as health, housing, and welfare. Quantification
of affected services is difficult at this stage of knowledge; nevertheless,
it is quite obvious that people with incomes would be less inclined to seek
Government assisZance than people without incomes.
Higher wages and salaries could help improve family stability,
improve physical health and nutrition, reduce sickness, hospitalization and
thus absences from jobs. These familiar, economic and social improvements
should markedly affect mental attitude, morale and aspirations and ultimately
lead to more harmonious community relations. Advantages of these social
developments to the children of vocational school graduates, should be
significant, indeed.
71
72
LIMITATIONS OF COSTBENEFIT ANALYSIS
One of the major limitations in cost benefit analysis is that the
available cost data are highly inadequate. This inadequacy has been found not
only in Puerto Rico but elsewhere as well. Studies conducted by Jacob Kaufman
and Richard Dueker have concluded that the variable cost data does not readily
lend itself to coherent analysis and that cost data pertaining to vocational
education is not adequate for rigorous analytic and evaluative purposes. In
addition to the inadequacy of cost data, there are difficulties in estimating
the effects of training for a particular program. The effects of training
and output variables cannot be estimated quantitatively with a great deal of
accuracy unless a control design is used in the analysis. The best design is
to compare the output variables of training with those of comparable non-
training. However, to create this type of control group is a difficult
proposition since different trainees have different social and demographic
characteristics, different values, moti'ations, and other characteristics
affecting their salable market experience after completion of a vocational
education program.
Also, it should be noted that there are a number of benefits which
cannot be measured in returns, and thus will have to be analyzed
qualitatively which, of course, will be influenced very heavily by the varied
judgment of the analyst. Even the comparison of benefits among different
individuals assumes that different individuals draw equal oenefits from a
dollar of earnings. In the theory of economics this proposition is not
generally accepted. It is said that a person without any income will cherish
an earning of $1 much more than a person with an income of $5,000 per year.
Furthermore, it is pointed out that the vocational school programs
not only benefit the community which prepares thz graduates but also the
community which eventually receives them as workers. Thus, if a number of
graduates from the vocational school program leave Puerto Rico in order to
work in other cities of the United States, their social ,,?.nefit effect is
lost in Puerto Rico, particularly when there are shortages among skillet
workers. However, it cannot be denied that when there is unemployment in a
particular skill such an out- migration can benefit the society of Puerto Rico
in the form of reduced welfare payments and increased incomes to society,
since the migrants tend to send part of their incomes back home to their
families in what is described as transfer payments.
73
74
VI - COST BENEFIT ANALYSIS OF SELECTPD OCCUPATIONS
The Department of Education offers hundreds of courses in sub-
programs of the vocational education program. A course or a nucleus of courses
is required for a trainee to enter a particular trade or occupation. This
section of the report relates to specific courses to specific occupations,
matches costs of specific courses to benefits of specific occupations, and
analyzes ratios of unit costs to unit benefits.
Since there are hundreds of courses given to prepare trainees for
hundreds of occupations, it would be impossible to prepare meaningful analysis
of costs of all the courses or benefits of all occupations. Thus, in this
study, 19 selected occupations have been analyzed.
.
In the selection of occupations, 35 occupations were idenfitied at
random from total occupations offered by the Vocational Education Program.
The randomly selected occupations welP reduced to 19 occupations with the
help of the following factors:
1. Occupations related to a large number of courses;
". Significant demand for occupations in developing Puerto Ricaneconomy; and
3. Different occupations have varying number of graduates.
The following occupations are analyzed in detail:
Occupaciin Title
Draftsman
Medical Assistant
Electronic Technician
Floral Designer
Programnpr Engineer Scientist
Secretary
Stenographer
Clerk Typist
Bookkeeper II
Baker
Cosmetologist
Farmer General
Auto Mechanics
Cabinet Maker
T.V. Service Repairman
Dressmaker
Electrician
Carpenter
Plumber
Matching of courses with benefits is shown in Table VI-1 columns
(1) and (2). The table provides data on enrollment, dropouts and graduates
by courses and occupations. For the selected courses-occupations, it may be
seen that th-. enrollment varied from 13 to 4,096 and number of graduates
varied from 1 to 1,923. Benefits from occupations were in the ran...! of
$2,001 - $3,006,000 and costs courses were in the range of $51,000 -
$3,285,000. Variations in course size or occupation should provide some
explanation on cost economies of scale.
Table VI-' and Table VI-2 provide data on unit benefits, unit costs
and ratio of benefit to cost. Average unit (graduate) benefit varied from
$639 for a farm worker to $5,317 for an engineering and scientific programmer. .
It may be noted that unit benefit is derived by dividing total benefits by
the number of graduates b) occupations. Total benefits are derived by sum-
mation of benefits accruing to full-time employed and part-time emploied.
75

76
Of course, a number of graduates were unemployed. Thus, unit benefit is not
equal to earnings of either full-time employed or part-time employed. It is
equal to:
Unit benefit = Total benefits 1, number of graduates
Total benefits = Full-time employed benefits 4 part-timeemployed benefits
Full-time employed benefit = Hourly wage rate x 2,080 xnumber of graduates full-ti..eemployed
Part-time employed benefit = Hourly wage rate x 1,040 xnumber of graduates part-tineemployed
Number of graduates = Ful7-time employed 4 part-time employed
4 unemployed
Table VI-2 also provides data on unit cost. Unit cost among the
selected 19 occupations varies from $462 to $52,225. Unit cost in clerk
typist occupations with 1,923 graduates was $479, and the unit cost for
floral designer with one graduate was $52,225. Very exhorbitant cost for a
floral desig...:r emerges because the methodology used in the report is biased
toward number of graduates, rather than total enrollment. However, if enroll-
ment is used as denominator to determine unit cost, even then the cost for a
floral designer is high at $4,017.
The unit costs of training were above average for the occupations
of auto-mechanic, farm general, electronic technician, carpenter,
cosmetologist, baker, and medical assistant. On the other hand, unit costs
were significantly low for the occupations of secretary, stenographer, clerk
typist, bookkeeper II, dressmaker and electrician.
The unit costs of providing training for a number of occupations
is high due to: (1) small number of graduates (e.g., electronic technician,
floral designer, engineering programmer and T.V. service repairman); (2) too
many schools offering the sane course with a small number of graduates from
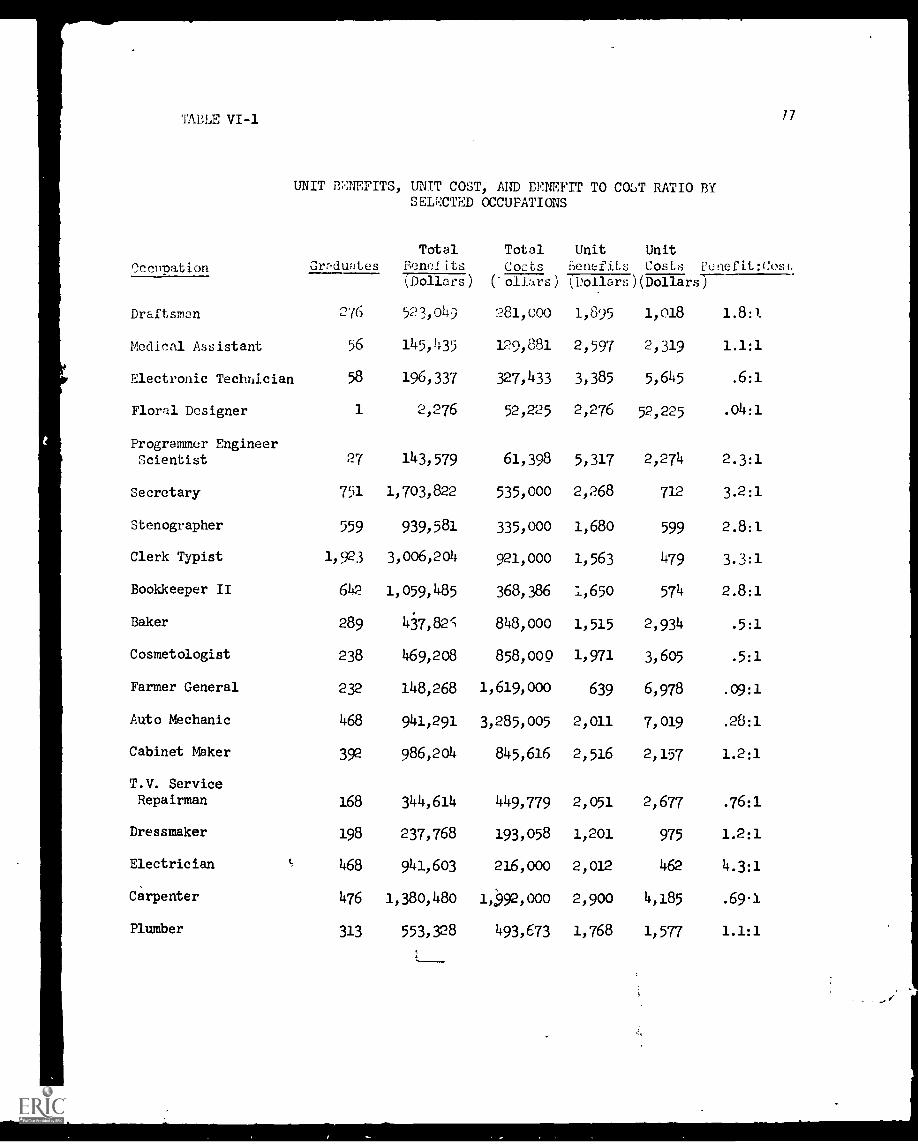
t
TABLE VI-1
UNIT BENEFITS, UNIT COST, AND BENEFIT TO COLA' RATIO BYSELECTED OCCUPATIONS
/7
Total Total Unit Unit
Occupation Orr,dmtes Benefits Costs fienefits Costs rt.2nefit:Cos4
(Dollars) (-ollars) (Dollars)(Dollars)
Draftsman 276 523,04) 281,000 1,895 1,018 1.8:1
Medical Assistant 56 145,435 129,881 2,597 2,319 1.1:1
Electronic Technician 58 196,337 327,433 3,385 5,645 .6:1
Floral Designer 1 2,276 52,225 2,276 52,225 .04:1
Programmer EngineerScientist 27 143,579 61,398 5,317 2,274 2.3:1
Secretary 751 1,703,822 535,000 2,268 712 3.2:1
Stenographer 559 939,581 335,000 1,680 599 2.8:1
Clerk Typist 1,923 3,006,204 921,000 1,563 479 3.3:1
Bookkeeper II 642 1,059,485 368,386 1,650 574 2.8:1
Baker 289 437,82 848,000 1,515 2,934 .5:1
Cosmetologist 238 469,208 858,000 1,971 3,605 .5:1
Farmer General 232 148,268 1,619,000 639 6,978 .09:1
Auto Mechanic 468 941,291 3,285,005 2,011 7,019 .28:1
Cabinet Maker 392 986,204 845,616 2,516 2,157 1.2:1
T.V. ServiceRepairman 168 344,614 449,779 2,051 2,677 .76:1
Dressmaker 198 237,768 193,058 1,201 975 1.2:1
Electrician 468 941,603 216,000 2,012 462 4.3:1
Carpenter 476 1,380,480 1,992,000 2,900 4,185 .69-1
Plumber 313 553,328 493,673 1,768 1,577 1.1:1
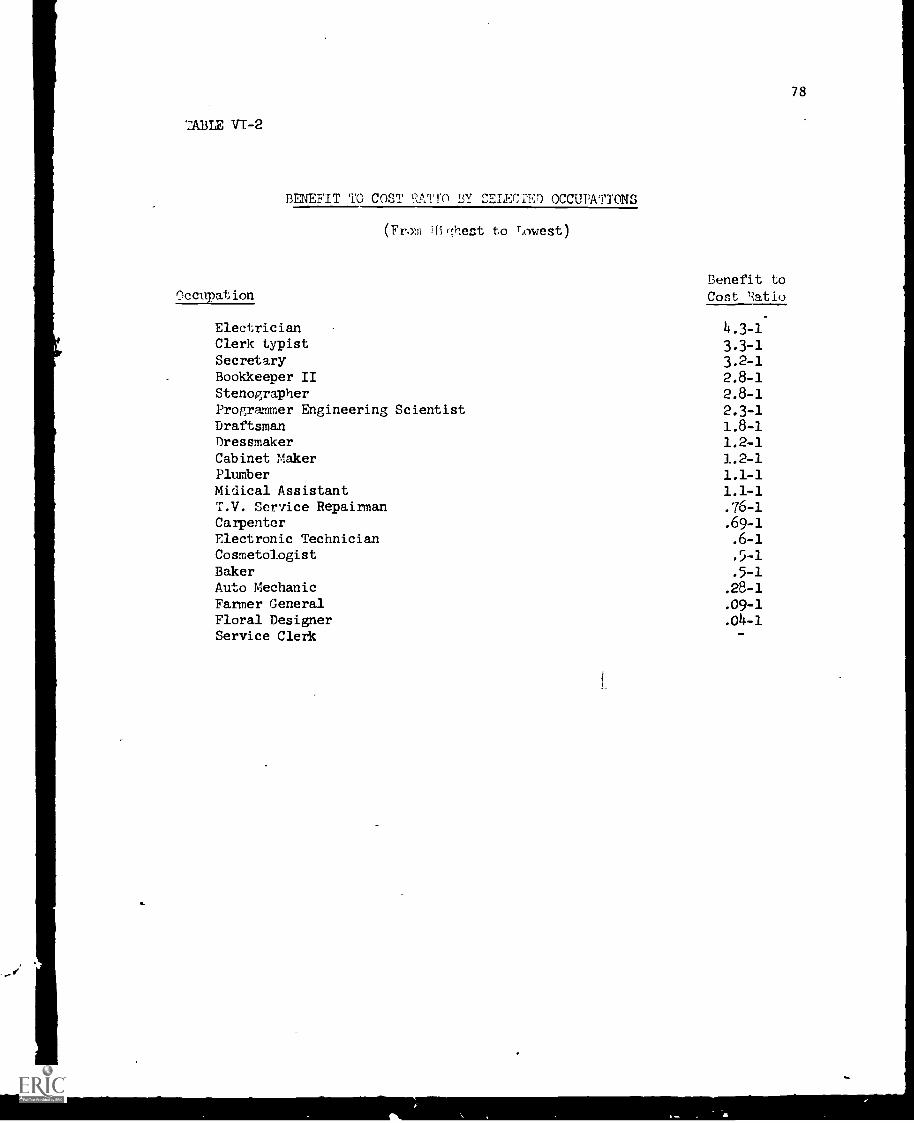
78
BENEFIT TO COST RATIO !3Y SELECTS) OCCUPATTONS
(From ifi,,;hest to Lowest)
OccupationBenefit to
Cost liatio
Electrician 4.3-1Clerk typist 3.3-1Secretary 3.2-1Bookkeeper II 2.8-1Stenographer 2.8-1Programmer Engineering Scientist 2.3-1Draftsman 1.8-1Dressmaker 1.2-1Cabinet Maker 1.2-1Plumber 1.1-1Miiical Assistant 1.1-1T.V. Service Repairman .76-1Carpenter .69-1Electronic Technician .6-1Cosmetologist .5-1Baker .5-1
Auto Mechanic .28-1Farmer General .09-1Floral Designer .04-1Service Clerk
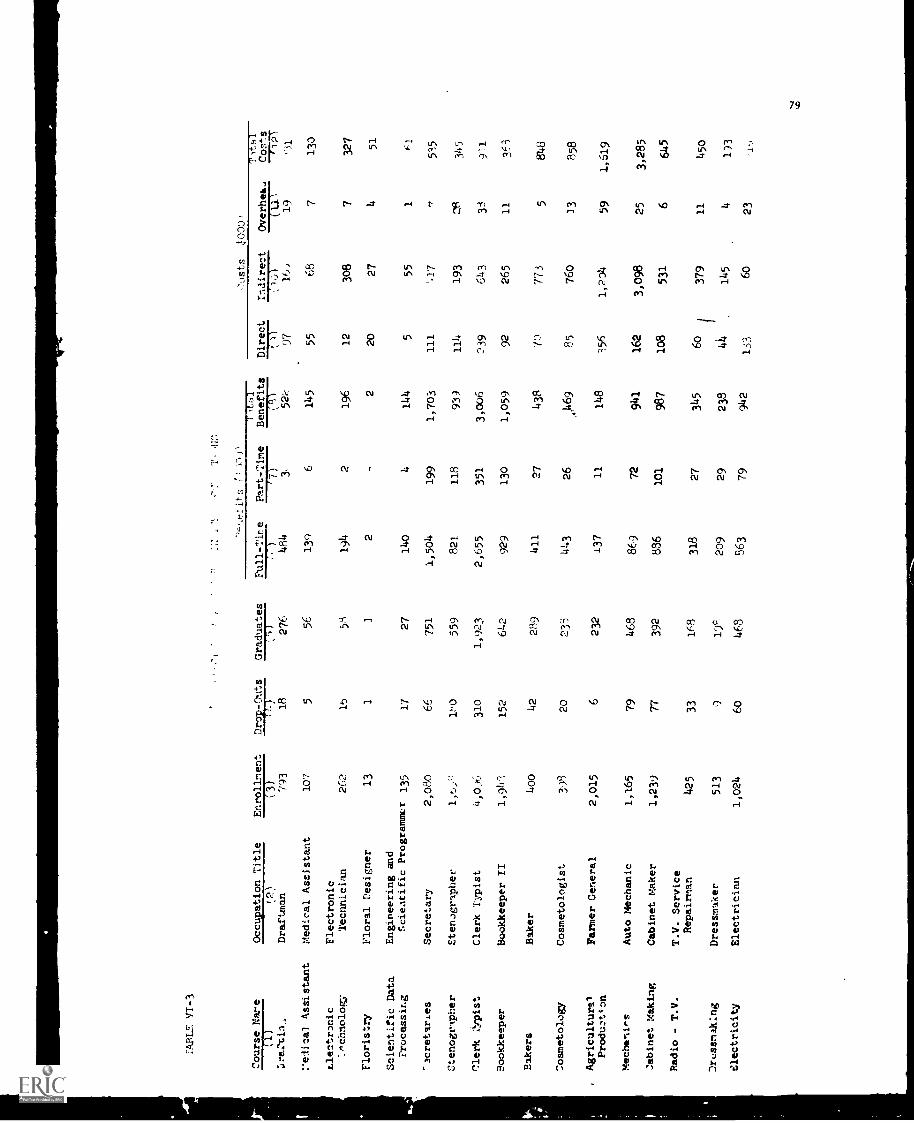
APIE V1-3
Course bare
Occupation Title
Enrollment
Drop-Outs
Graduates
(:V),3'
Full -Tine
Part-Time
Lltal
Benefits
Direct
(3)
r!.)
Dz-a,Ctin,
Draftman
793
18
276
484
397
Assistant
Medical Assistant
107
556
139
6145
55
Llectranic
Electronic
_+°c: solos
Technician
262
58
194
2196
12
Floristry
Floral Designer
13
22
20
Scientific Data
Engineering and
Processing
ncieatific Programacr 135
17
27
140
4144
5
-2cretaries
Secretary
2,080
64
751
1,504
199
1,703
111
Stenographer
Stenographer
559
821
118
93)
114
clerk
Clerk Typist
4,0)6
310
1,923
2,655
351
3,006
239
Bookkeeper
Bookkeeper II
1,94".
152
642
929
130
1,059
92
Bakers
Baker
400
42
289
411
27
438
70
Cosmetology
Cosmetologist
398
20
239
443
26
4)469
85
Agricultural
Production
Farmer General
2,015
6232
137
11
148
356
MechoeUes
Auto Mechanic
1,165
79
468
869
72
941
162
cabinet Making
Cabinet Maker
1,239
77
392
886
101
987
108
Radio - T.V.
T.V. Service
Repairman
425
33
168
318
27
345
6o
Dressmaking
Dressmaker
513
91)
0209
29
238
44
Electricity
Electrician
1,024
60
468
963
79
942
133
Costs
,t000'
Indirect
-7777---
Overhea-
1,t8
1Costs
777
if
I19
'31
68
713
3
308
7327
27
451
55
1oe:
2535
193
345
643
33
265
11
36i
773
5848
760
23
858
1,204
59
1,619
3,098
25
3,285
531
6645
379
11
450
145
4193
60
23
-1.,

ART,E 71-3 ('Iontinue1
Benefits -10001
C,,sts (1000)
Tntal
TotaT
Course Name
Cccupaicn Title
Enrollment
Droc-O
iuts
Cradates
Full-Time
Part-rime
Benefits
Direct
Indirect
over.ea
:cs--..s
(2)
Pi)
(5)
(`,)
-777----
(9)
(10)
cm-- -rErr
Carpentry
Carpenter
1,026
154
476
1,284
97
1,,,,8o _
1,'r',""),
24
1,92
Plumber - Pipe
Plumber
772
47
313
503
51
553
67
417
94 ,-,
*Graduates are not shown because of the nature of the course.
No benefits, since benefits are based on graduates.
Note:
Occupations were chosen at random by the consultant choosing the ones
wan tht
greatest number of courses offered and which were more common.
See methodology
for choosing the sample in the test.

81.
each school (e.g., medical assistants, cosmetologists, farm general, auto-
mechanics, cabinet maker, T.V. service repairman); (3) the original invest-
ment is high (e.g., medical assistant, electronic technician, floral designer,
engineering and scientific programmer, cabinet maker, T.V. service repairman);
and (4) administrative costs are high (e.g., electronic technicians, engine-
ering and scientific programmer, baker, dressmaker, etc.).
The unit benefit cost ratio equals the present value of benefits
divided by the costs. The general rule in benefit:cost ratio evaluation is
that when the benefit:cost ratio exceeds unity, the corresponding occupation
is economically superior to an alternative occupation with a lower benefit:
cost ratio. From purely economic efficiency criteria,,in times of scarcity
of funds the occupations or programs chosen for a necessary action are those
having the lowest benefit:cost ratios. In times of program expansions, the
occupations chosen for necessary action should be those having the highest
benefit:cost ratios. There is no doubt, however, that the decision maker
would almcst certainly consider additional criteria of a noneconomic nature in
the decision making process. The 19 occupations, listed from the highest to
the lowest benefit: cost ratio, are given in Table 3.
The benefit:cost ratios calculated in this section are for individual
participants in the vocational education program. The benefits to the society
in general and the Government have not been calculated for the pixposes in
this section since the benefits to society and Government are of macro nature
and must cover the total universe of occupations rather than selected
occupations.
Each of the 19 occupations is analyzed in the following pages.
It may be noted that for general demand analysis, we consulted the Social
Services Research Center study on Puerto Rico's Present and Prospective

82
Technical, Skilled and Clerical Manpower and Training Needs, Vol. 1, and for
scope of training for each occupation we consulted the Dictionary of
Occupational Titles, 1965, Vol. I, of the U.S. Department of Labor.
BRIEF ANALYSIS OF
SELECTED OCCUPATIONS
Draftsman
For the occupation of draftsman, the ratio of benefit to cost is more
than unity. Annual unit benefit is estimated at $1,895, unit cost $1,018 and
ratio of benefit:cost 1.8:1.
The work of a draftsman is to prepare from sketches, notes, specifica-
tions, or instructions, complete or partial drawings using established drafts-
man standards. A draftsman can specialize it various fields, namely:
architectural, engineering, construction, structural, electrical or mechanical.
In 1968 the supply of draftsmen did not meet the demand. We notes that
a scarcity of trained personnel is more noticeable when the talent we refer
to is of a specialized nature.
The figures prepared by the Social Science Research Center show the
demand for draftsmen in 1968, 1970 and 1975:
Total employment as of September, 1968 3,564
Anticipated employment in 1975 4,748
Anticipated change 1,184 33.2% change
Average Anticipated Additional Employmentfor 1970
169
Of the total cost, direct cost constitutes 34 per cent, indirect
cost-59 per cent and overhead 7 per cent.
Direct cost$ 94,000
Indi :ct cpst 165,000
Overhead 19.000
$ 22111121
The cost of $1,018 for training a draftsman is considerably lower
than for most selected occupations, for the following reasons:
. low investment in equipment per student
. learning is not dependent on the instructor but onthe skill of the student, therefore, larger groupscan be taught with less supervision
. depreciation of equipment is minimal and its expectedlife duration is longer
. administration expense is lower than for a number ofother occupations
. a large percentage of the graduates am employed full-time in the labor force
Medical Assistant
For the occupation of medical assistant, annual benefit was more
_han unity 1.1:1, with $2,597 as unit benefit and $2,319 as unit cost.
A medical assistant aids a doctor in nontechnical or routine work.
His duties include:
. preparing the patient for doctdr's examination;
. taking temperature, weight, height, pulse, respira-tion and blood pressure and other minor test asdirected by the doctor;
. collecting and observing specimens for laboratorytests;
. performing emergency treatments if necessary;
sources:
. assisting the doctor with examinations, treatments,etc.;
. maintaining charts and files of patients;
. acting as receptionist and secretary of the doctor'soffice or unit in the hospital.
The necessity for this type of personnel stems basically from two
. doctors completing their studies and opening privateoffices;
83
84
. new hospitals opening or augmenting their servicesor capacity.
It may be noted that the number of graduates average about 2.7 per
course offered. That is, in order to graduate 56 medical assistants in 1970,
the Vocational Education Program offered 21 courses throughout the Island for
a total cost of $129,881 or an average unit cost of about $2,319 per graduate.
This average unit cost is mainly composed of salaries, which account
for about 38 per cent of total cost; buildings and improvements, which account
for 11 per cent; and equipment, furniture and fixtures which account for 22 per
cent.
The high cost and short life expectancy of such equipment are the
key factors which make training costs high in this occupation. Howerer, the
benefit cost rat4.o is not correspondingly affocted since the earnings per
hour are high and the rate of employment is considerably higher than in most
occupations analyzed.
Electronic Technician
The ratio of benefits to cost for thr occupation of electronic
technician is below unity. The unit benefit is estimated at $3,385, the unit
cost is estimated at $5,645, and the benefit:cost ratio is 0.6:1. Although the
ratio of benefit to cost of this occupation is lower than unity on the basis
of one-year benefits, the ratio would be greater than unity if more than one
year of bene:its were taken into account. Since the working life of a trainee
is probably between 40-45 years, the actual benefits will be much larger than
indicated in these estimates.
One of the reasons fur benefit:cow- ratio being less than unity is
that equipment costs for this type of training are very high, as are the
maintenance costs. Moreover, obsolescence of equipment is probably greater
than in most of the other courses, with perhaps a few exceptions such as the
engineering and scientific programmer, a program which is similar in nature
to that of electronic technician.
The employment rate among graduates of the electronic technician
program is one of the highest. Of the 58 graduates completing the program in
1969-70, 91 per cent had full-time or part-time jobs within the six months of
leaving school.
An electronic technician is taught the behavior and use of the
electron, the results of producing and controlling electrons, and the unique
properties of electrons. He is familiar with the science that deals with
electronic action in vacuumF and gases and with the use of vacuum tubes,
transistors and photoelectric cells. The training offered is designed for a
student with 10 years' schooling although with no previous academic knowledge
of electronics or advanced physics.
Therefore, the course is designed to teach the fundamentals of
electronics leaving any field of specialization to post-high school studies.
Floral Designer
The course of floral design provides the student with the skills
necessary to prepare floral arrangements with natural or artificial flowers.
The formal education required for a floral designer to join the labor force
is completion of high school.
From the eight courses given for the occupation of floral designer,
there was only one graduate out of 13 students enrolled. If this graduate
were to go to the labor force to obtain a full-time job, he would earn ap-
proximately $2,300 per year. The same graduate costs the Vocational Education
Program approximately $42,200,.creating the lowest benefit:cost ratio
determined in this study.
85
ha.
86
We estimated that the breaL-even point for unit cest to unit benefit
would be 24 graduates. Therefore, to improve the situation of ._his course,
we suggest that:
. more students be enrolled in this occupationalcourse; and that
. fewer courses be offered in order to reduce thecost by graduate.
Engineering and Scientific Programmer
Ratio of benefit:cost for this occupation was more than unity -,
2.3:1, signifying that for every dollar of cost, the annual benefit was $2.30.
The training for this occupation is expensive. Its unit cost is
$2,274, the tenth highest in the sample taken. However, the employment rate
of 85 per cent plus a high rate of income per hour ($3.00) are the main
reasons for a low cost:benefit ratio. In this occupation initial earnings are
high and salary increases are rapid, provided the graduate.had access to
retraining, which in most cases is provided by the employer.
The follow-up study of 1969 shows that out of 27 graduates, 22 were
full-time employed and one was part-time employed; that is, 81 per cent were
employed full-time, and 4 per cent employed part-time. However, this combined
85 per cent does not include those who continued their studies. We estimate
the unemployment rate for this occupation as probably very low.
An engineering and scientific programmer converts scientific, engine-
ering, other technical problems and formulations into a format processable
by computer; resolves symbolic formulations, prepares logical flowcharts
and block diagrams, and encodes resolvent equations for processing by ap-
plication of advanced mathematics, such as differential equations and
numerical analysis, and understanding of computer capacities and limitations;
resolves problems of intent inaccuracy or feasibility of computer processing;
learns how to operate computers, how to analyze and correct programming and
87
coding errors, and reviews results of computer runs to determine necessity
for modifications and reruns. This person must be thoroughly trained in the
area of data processing and computer utilization.
Secretary
One of the most important occupations under the Office Education
programs is that of secretary. The ratio of benefit:cost for this occupation
is estimated at 3.2:1. The cost of training a secretary is low at $712, of
which 75 per cent is for salaries. The direct benefit to a graduate of this
program is estimated on the average at $2,268.
A secretary trained in tLe Vocational Education Irogram is supposed
to be capable of performing the following duties:
a. schedules appointments for employer, gives informa-tion to callers, and generally relieves officialsof clerical work and minor administrative andbusiness details;
b. reads and routes incoming mail;
c. locates and attaches appropriate file to correspon-dence to be answered by employer, takes dictationin shorthand or on stenotype machine and transcribesnotes on typewriter or transcribes from voice
recordings, composes and types routine correspondence;
d. files correspondence and other records;
e. answers telephone and gives appropriate information,routes calls to appropriate officials and placesoutgoing calls;
f. greets visitors, ascertains nature of business andconducts visitors to employer or appropriate person;
g. comp-'es and types statistical reports.
From the follow-up studies and demand analysis, it appears that the
present program in terms of numbers is adequate. However, there might be a
need for the diversification of secretarial skills so that specialized
training can be provided for legal and medical secretaries.
88
Stenographer
Another significant occupation under the program of Office of
Education is that of stenographer. The ratio of benefit to cost is high at
2.8:1, whereas, the cost of training is low. The direct benefit is somewhat
lower than that of the secretarial occupation.
The work of a stenographer is to take dictation ; Thorthand of
correspondence, reports, and other matters, and transcribe the dictated
material. She performs a variety of clerical duties, except when working in
a stenographic pool, and may transcribe material from sound recordings.
The benefit:cost ratio in this occupation is high due to:
a. very low investment in equipment necessary to trainstudents, especially when this equipment has a longlife of about fifteen years, and
b. the number of graduates is significantly high.
Clerk Typist
Because the training cost of an average clerk typist is low, the
ratio of benefit to cost is high at 3.1:1, the cost being $479 and benefit
$1,563.
The clerk typist occupation was taught in 104 schools throughout
the Island. These 104 schools graduated 1,923 students for an approximate
average of 18 students per course. We estimate that a higher number of
students can be enrolled in each one of these courses, so as to graduate a
larger number of students with fewer courses. Thus, the salary expenses
incurred for these courses would go down, further lowering the unit cost.
Due to the large number of graduates, the ratio of unit cost to
benefit represents the second highest in the sample taken. There is a very
low investment in equipment, which can be used for two other occupations as
well - secretary and stenographer. Clerk typist, secretary and steno-
grapher rank 2, 3 and 4 in the benefit:cost ratio in the sample taken.
89
Bookkeeper II
Once again, due to low cost, the ratio of benefit to cost is high.
For every dollar of cost there is an annual return of $2.80. Investment in
equipment is low and the number of graduates per course offered is relatively
Many of the students enrolled use it as a preparatory course for a
university education.
The bookkeeper is trained to keep a set of financial records. The
course teaches how to keep records of the financial transactions of different
types of establishments; how to verify ano enter details of transactions in
chronological order such as sales slips, invoices, check stubs, inventory
records, and requisitions; how to summarize detail and separate ledgers using
adding machines and/or bookkeeping machines and transfer data to the general
ledger; how to balance books and compile records to show statistics ich as
cash receipts and expenditures, accounts payable and receivable, profit and
loss, and other items pertinent to the operation of business.
Baker
Because hourly wage rates are low in this occupation and cost of
training is high, the benefit:cost ratio is low at 0.5:1. The unit benefit
is estimated at S1,515 and unit cost at $2,934.
In the training of a baker the cost of equipment is high, which is
supplemented by the need for materials and supplies for training purposes.
Another factor for high cost is that 289 baker graduates are trained in 27
schools, or 11 graduates per school. Such a dispersal might be affecting
the economies of scale.
A very significant reason for low benefit:cost ratio, as mentioned
before, is that wage rates in this industry are low. The wage rates are low
because the productivity is low. Productivity depends heavily on the capital
90
structure, skills of workers, the relationship between capacity and production,
and the size of operae_ons. The factors related to capital and organization
probably do not lend themselves to high productivity.
A vocational education student is taught how to mix and bake
ingredients following recipes and how to produce breads, pastries and other
baked goods. He is taught how to measure flour, sugar, shortening and other
ingredients for batters, fillings, and icings, using scale and graduated
containers. Among his duties he has to dump ingredients into mixing machine
bowls or steam kettles to mix or cook them according to specifications; roll,
cup and shape to form sweet rolls, pie crust, tarts, cookies, and related
products preparatory to baking; place dough in pans, molds, or on sheets and
bake in oven or in grills.
Usually, a student graduated from a vocational course does not enter
the labor force as a full-fledged pastry man or baker, but undergoes a short
on-the-job training in order to get acquainted with the local kitchen
facilities which he will be utilizing. However, since most students are very
well prepared, they can undertake the responsibilities of a baker within a
relatively short time.
Bakers may specialize as biscuit bakers, bread bakers, cake bakers,
doughnut bakers, as well as cake decorators and pastry men. Some of these
specializations are already included in the curriculum of the Vocational
Education Program to train high school students.
Cosmetologist
Ratio of benefit to cost is low, due mainly to high cost of training.
Benefit:cost ratio was 0.5:1, will benefit to an average graduate of $1,971
and unit cost of $3,605. One of the factors contributing to the high cost was
that number of students graduating per school was low at 7.
91
The cosmetology course prepares a student to provide beauty services
for customers. The services taught are the following: (a) suggest hairstyles
according to physical features of patron and current styles, or determine a
hairstyle from the instruction of patron; (b) style hair by cutting, trimming,
and tapering, using clipper, scissor and razor; (c) shampoo hair and scalp
with water, liquid soap, dry powder or egg, and rinse hair with vinegar,
water, lemon, or prepared rinses; (d) apply water or waving solutions to hair
and set hair on rollers, in pin curls or in finger wages; (e) apply bleach,
dye, or tint using hands or cotton pads to color customers' hair, first ap-
plying solution to portion of customers skin to determine if customer is al-
lergic to solution; (f) suggest cosmetics for conditions such as dry or oily
skin; (g) apply lotions and creams to customer's face and neck to soften skin
and lubricate tissues; (h) massage skull and-give other hair and scalp
conditioning treatments for hygienic or remedial purposes; (i) perform other
beauty services, such as massaging face or neck, shaping and coloring eye-
brows, or eyt: lashes, removing unwanted hair, applying solutions that
straighten hair or retain curls or waves in hair, and waving or curling hair;
(j) clean,, shape and polish fiugernails and toenails. Areas of specializa-
tion are very frequent in this occupation.
In the great majority of cases, the cosmetologists are self-employed.
A very minimal percentage of the labor force employed in cosmetology is
employed by the big beauty salons. It is almost customary that once the
person has taken the course in cosmetology, he or she will open his own
beauty salon. The original investment necessary to be self-employed in this
occupation is not significantly high. That is, one of the rooms of the
cosmetologist's house is utilized as the beauty parlor or beauty salon and
the rest of the house is where the person lives. Out of 238 graduates of the
1970 class, we estisate that 170 will be employed in this occupation or
92
related occupation; 152 will be full-time employed and 18 part-time employed.
These figures represent about 72 per cent of the graduates. The remaining
28 per cent will probably continue studying or leave the labor iirce. If a
cosmetologist is employed by a salon with more than one cosmetologist, his
income is low. It is estimated that the cosmetologist's rate per hour is about
$1.40. However, if the cosmetologist works in her own business, income if
substantially higher. For the purpose of this study we assume that a
cosmetologist earns an average of $1.40 per hour. This means that benefit:cost
ratio shown in this study is lower than what the actual ratio might be.
Farmer General
The ratio of benefit:cost is very low at 0.09:1 for this occupation
due mainly to the fact that many graduates do not join the occupation for
which they were trained. The wage rate at $0.95 per hour is the lowest among
all the occupations studied. To train an average graduate costs $6,979, while
annual unit benefit is only $639.
The farmer general occupational training teaches a scientific method
of raising plants and animals effectively within a tract of land. Among the
duties to be performed are planting, cultivating, harvesting crops, operating
farm equipment, and attending to livestock.
The outlook for agriculture in Puerto Rico is not good. Special
care should be taken in the designing of future farmer general courses since
the demand may not be large in the near future. The demand for such workers
in the U.S. mainland, however, should not be overlooked. Some reorientation
toward more mechanical skills may also pay off as the programs mechanizing
agriculture make progress.
Auto Mechanic
The benefit:cost ratio for this occupation was low at 0.28:1. The
cost of training an auto mechanic is very high - $7,019, and unit benefit is
d//estimated at $2,011.
93
In the analysis it is assumed that the hourly wage rate for an auto
mechanic is $1.60, although this may be an underestimate if an auto mechanic
is self-employed. If an auto mechanic has technical knowledge, his earnings
per hour could be two to three times higher than those trainees considered
here. There was no way in which we could confirm this data since self-employed
auto mechanics do not submit this type of information to the Labor Department.
An auto mechanic repairs automobiles. He is trained in the
characteristics, the parts and functions, mechanisms, and operation of an
automobile. He is trained to identify, change, repair, correct, or alter any
inefficient part. Auto mechanics usually specialize in a particular section
of a car, for example, tune-ups, transmission, engine, carburators, electro
mechanics, etc. Some of these specializations are taught in vocational educa-
tion program in the Department of Education.
This occupation is similar to that of cosmetologist in that initial
investment is very low, physical facilities are minimum and the customers
usually are the friends of the trained person. Thus, these characteristics
make it an occupation which is oriented more towards self - employment than to
being hired by an employer.
It is a growing occupation acquiring more customers every day, based
on the fact that more cars are being brought into the Island each year. It
is estimated by the Puerto Rico Planning Board that the number of automobiles
will reach the one million mark by 1980.
94
Cabinet maker
To train 3°2 graduates in the Island, the Department of Education's
vocational program offered 49 courses in cabinet making, costing the vo-
cational education program $485,000 or a unit cost of about $2,157 per
graduate. During the first year, the estimated 327 graduates earned ap-
proximately $986,000 or a unit benefit of $2,516 per graduate. The benefit
to cost ratio of this occupation was 1.2:1.
An average cabinet maker, according tu the figures obtained from
the Commonwealth Department of Labor, is estimated-to earn approximately
$1.60 per hour if enploye,d in the furniture industry. However, if the cabinet
maker works on his own, the $1.60 per hour wage would be a low estimate, as
would be the benefit:cost ratio of 1.2:1.
In cabinet making course offered by the vocational education program,
the student is taatot how to construct and repair wooden articles, such as
store fixturts, office equipment, cabinets, and high-grade furniture using
woodworking machines and hand tools; how to study blueprints or drawings of
articles to be made, mark outlines or dimensions of parts on paper or lumber
stock according to blueprint or drawings specifications; to match material
for color, grain, or texture; to set up and operate such woodworking machines
as power saw, jointer, mortiser, tenoner, moder, and shaper to cut and shape
part from stock. He receives special training for trimming component parts of
joints to make them fit snugly, using handtools such as planes, chisel, or wood
files; how to glue, fit and clamp parts and subassemblies together to form a
complete unit, using clamps or clamping machine. When he finishes the course,
he may be able to repair and refashion high-grade articles of furniture; coat
assembled articles with materials, such as stain, varnish, or paint, by dip-
ping, brushing, or spraying; may install hardware, such as hinges, catches,
and drawe pulls; may repair furniture, equipment, and fixtures.

95
Cabinet makers can specialize in different areas, such as regriger-
ator cabinet maker, maintenance cabinet maker, mounter cabinet assembler, etc.
If we cons:der that this occupation is of a specialized nature, that cabinet
makers can ylrk on their own, and that the constant remodeling in Puerto
Rican businesses and houses creates the demand for this type of skill, it
should be agreed that there is a good future for trained cabinet makers.
Radio and T.V. Service Repairman
The cost to the Gcvernment to train 168 radio and T.V. service
graduates was approximately $450,000, at a unit cost of about $2,677 per
graduate. However, the earnings derived during the first year of employment
were about $345,000, or a unit benefit of about $2,051 per graduate, represent-
ing a ratio of 0.76 benefits to one cost. This ratio of 0.76:1 is low probably
because the basis used for calculating the ratio was the salary paid by
employers to T.V. and service repairmen employed in their shops - $1.40 per
hour. Those self-employed repairmen, for whom systematic data is not avail-
able, probably earn more than $1.40 per hour. Thus, benefit:cost ratio for
this occupation may be higher. There is no doubt that benefit:cost ratio is
more than unity if two years of working life is used in the analysis, with
proper discounting of future benefits.
The courses offered by the vocational education program on radio and
television service and repair enable trainees to prepare and adjust radio and
television receivers using handtools and electronic testing instruments.
Graduates of this course are taught to: (a) tune receivers on all channels
and observe audio and video characteristics to locate source of trouble;
(b) adjust controls to obtain desired density, linearity, focus, and size of
picture; (c) examine the chassis for defects; (d) test voltages and resist-
ances of circuits to isolate defects following the schematic diagram and
using volmeter, oscilloscope, signal generator, and other electronic testing
96
instruments; (e) test and change tubes, solder loose conneztions and repair
or replace defective parts using handtools and soldering iron, and (f) repair
radios and other audio equipment.
The demand for this type of trained personnel is increasing in Puerto
Rico, since more families and businesses are owning and using this equipment.
The increasing number of radios and T.V.'s in Puerto Rico, as well as the
specialized use of short-wave radios, closed-circuit televisions and related
devices, creates a demand for the radio T.V. repairman.
The Vocational Education Program graduated 168 students in 27 courses
given throughout the Island, an average of about six graduates per course. Of
these 68 students, we calculate that 128, or 76 per cent will be full-tims,
or part -time employed. Of the remaining 24 per cent of the graduates, it is
expected that a great majority will continue studies at the university level
or pursue further specialized courses related to T.V. and service repair.
Dressmaker
While benefit:cost ratio for this occupation is more than unity -
1.20:0, the unit benefit seems to be small, due mainly to the fact that only
about 59 per cent of graduates get jobs, full or part -time. Unit benefit
amounted to $1,201 and unit cost amounted to $475.
In this course, the student is taught: (a) how to take measurements
of the customers to determine modification of the pattern; (b) how to position
and pin pattern sections and cut fabric with scissors following pattern edge;
(c) how to baste together fabric parts in preparation for final sewing;
(d) how to sew fabric parts by hand or operate single-needle sewing machine
that joins fabric parts to form garment; (e) how to sew falling stitch in
hems of garments by hand to conceal thread.
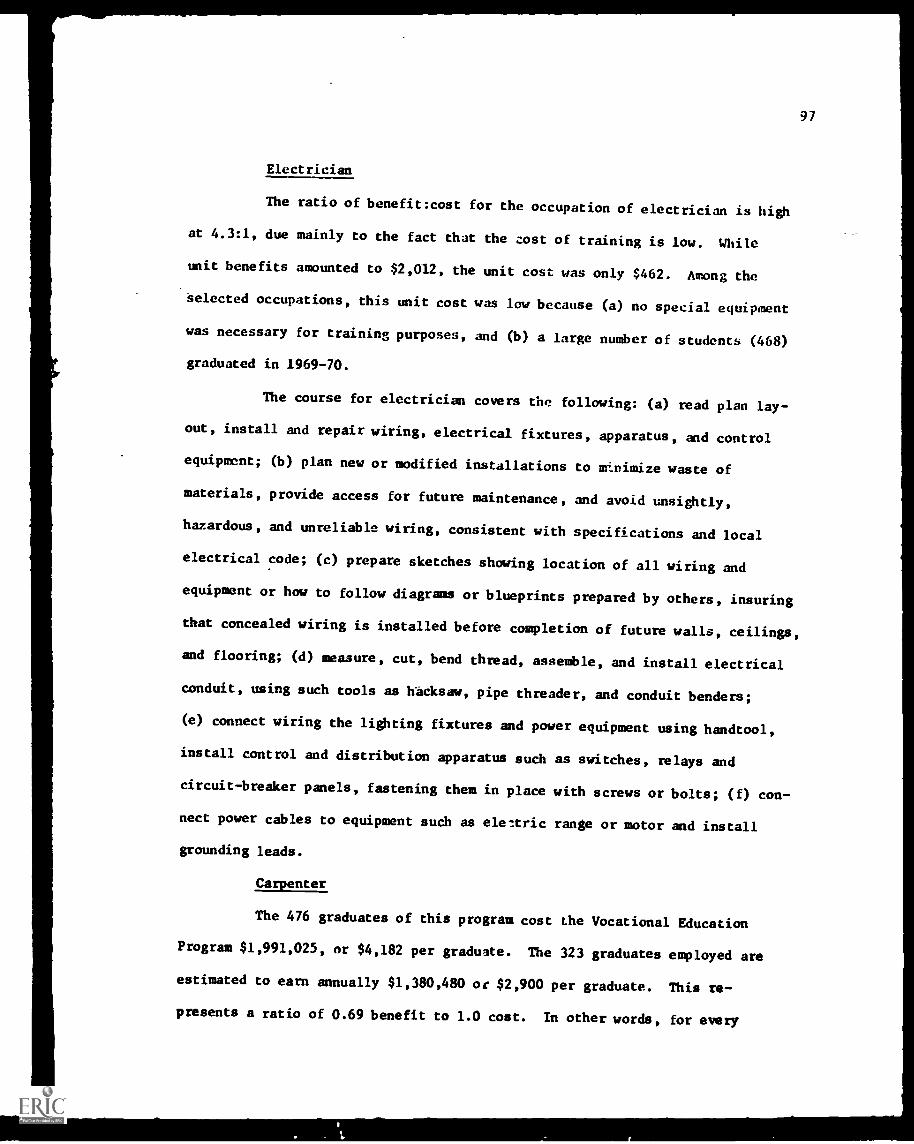
97
Electrician
The ratio of benefit:cost for the occupation of electrician is high
at 4.3:1, due mainly to the fact that the cost of training is low. While
unit benefits amounted to $2,012, the unit cost was only $462. Among the
selected occupations, this unit cost was low because (a) no special equipment
was necessary for training purposes, and (b) a large number of students (468)
graduated in 1969-70.
The course for electrician covers the following: (a) read plan lay-
out, install and repair wiring, electrical fixtures, apparatus, and control
equipment; (b) plan new or modified installations to minimize waste of
materials, provide access for future maintenance, and avoid unsightly,
hazardous, and unreliable wiring, consistent with specifications and local
electrical code; (c) prepare sketches showing location of all wiring and
equipment or how to follow diagrams or blueprints prepared by others, insuring
that concealed wiring is installed before completion of future walls, ceilings,
and flooring; (d) measure, cut, bend thread, assemble, and install electrical
conduit, using such tools as hacksaw, pipe threader, and conduit benders;
(e) connect wiring the lighting fixtures and power equipment using handtool,
install control and distribution apparatus such as switches, relays and
circuit-breaker panels, fastening them in place with screws or bolts; (f) con-
nect power cables to equipment such as ele.:tric range or motor and install
grounding leads.
Carpenter
The 476 graduates of this program cost the Vocational Education
Program $1,991,025, or $4,182 per graduate. The 323 graduates employed are
estimated to earn annually $1,380,480 or $2,900 per graduate. This re-
presents a ratio of 0.69 benefit to 1.0 cost. In other words, for every

98
dollar that the Department of Education spent in training this graduate, he
will earn $.69 during the first year in the labor market. This ratio of
0.69:1 is low, and probably one of the reasons is that 40 courses were otfered
in carpentry, with an average of about 12 graduates per course, increasing the
cost per student. The second reason for high cost is the fact that power-
tools and materials are expensive and the life span of these power tools is
not as long as the tools used in other occupations.
The carpentry courses offered by the Department of Education provides
basic techniques on how to construct, erect, install and repair structures
and fixtures of wood, plywood, and wallboard, using handtools and power tools,
and conforming to local building codes. Students are taught how to study
blueprints, sketches, or building plans to ascertain the type of material
required, such as lumber or fiberboard, and the dimensions of the structures
or fixtures to be fabricated. They are also taught how to assemble, cut, and
shape materials and faszer them together with nails, dowel pins, or glue.
The demand for carpenters in Puerto Rico is high and is expected to
increase as the construction industry, due to reduced interest rates, picks
up its old momentum. It seems that the number of graduates being trained by
the Vocational Education Program may not be enough to meet the demand. Should
the number be increased, the benefit:cost ratio must go up.
Plumber
On the occupation of plumber, the Department of Education spent
$493,673, or $1,577 per graduate. The 313 graduates are estimated to earn
$553,328 during their first year of work, at an average of $1,768 per
graduate, per year. If we compare the unit cost of training one plumber with
unit benefit, the ratio would be 1.1 benefit to 1 cost.
The course offered by the vocational education program trains the
student: (a) to work in assembling, installing and repairing pipe fittings
and fixtures of heating, water and drainage systems according to specifica-
tions and plumbing codes; (b) to study building plans and working drawings
to determine work aids required and sequence of installations; (c) to as-
semble and install valves, pipe fittings and pipe composed of metals, such
as iron, steel, brass, and lead, and nonmetals, such as glass, vitrified
clay, and plastic using handtools and power tools; (d) to join pipes by the
use of screws, bolts, fittings, solder, and calk joints; (e) to install and
repair plumbing fixtures such as sinks, commodes, bathtubs, water heaters,
hot water tanks, garbage disposal units, dishwashers, and water softeners.
The student is also taught how to repair and maintain plumbing by replacing
washers in leaky faucets, mending burst pipes, and opening clogged drains.
99
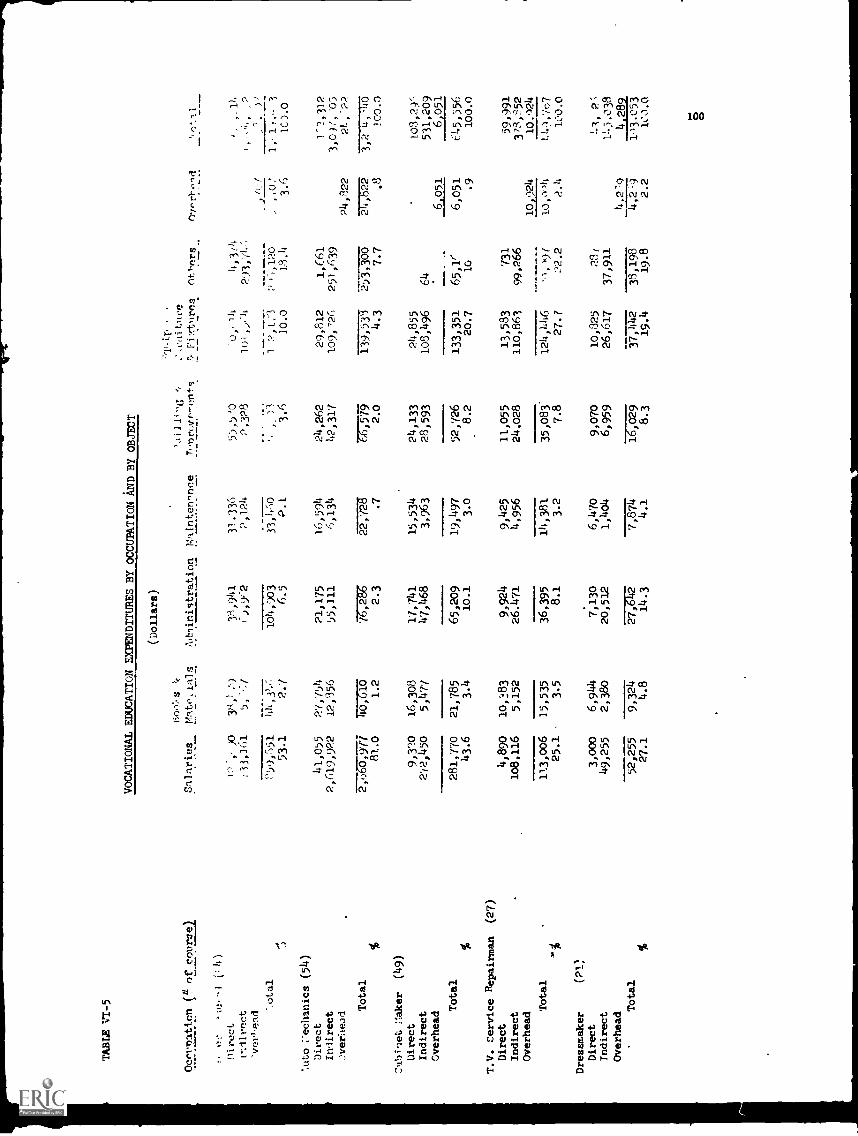
TABLE VI-5
VOCATIONAL EDUCATION EXPENDITURES BY OCCUPATION AND BY OBJECT
Ocerpatinn
n£ course)
Salaries
"-,' )0
:13,161
Ba.);.s
Matoials
38 ,I :9
5,';(
(Dollars)
All ministration
13,941
t),962
Nainten.mee
31.336
2,124
,Jillig
7,,nr(mp7entg
5),5'0
2,328
iu it
,
to':
Fixtltres
"0,,14
101,/4
othe
rs
4,3,4
293,7V
O-wsrl-old
w'
,-11.
,,-,4., ,2
tl.L
.1,1,,I C4)
pi. real.,
pliireet
"_otal
,4 d
159,r)51
53.1
44,31
2.7
104,903
6.5
33,1'''O
P .1
,.
,,
).., 1
3.6
12, i;
10.0
,,,120
13.4
,,0,
3.6
1,- 1 ?,-.
3
1C).0
%tit° ;-echanics (54)
Direct
41,055
27,754
21,175
16,594
24,262
29,812
1,C61
1 '?,312
Indirect
2,619,922
12,356
55,111
6,134
42,317
109,726
251,639
3,0)(, '05
2veritead
224i:1822:
21.,-,1?
Total
1757E5
1.2
76,286
2.3
07757 .7
1.7,7TT
4.3
Z3,300
7.7
-J7-7777
10o.o
2,t.)66,971
81.0
66,579
2.0
.8
C.Abinet [raker
(49)
Direct
9,3)0
16,308
17,741
15,534
24,133
24,855
103,29',
Indirect
212,450
5,477
47,468
3,963
28,593
108,496
64
531,209
Overhead
6,051
6 051
2___
Total
281,770
21,785
65,209
19,497
52,726
133,351
65,1(
6,051
645,556
43.6
3.4
10.1
3.o
8.2
20.7
10
.9
loom
T.V. Service Repairman
(27)
Direct
4,890
10,183
9,924
9,425
11,055
13,583
731
59,991
Indirect
108,116
5,152
26.471
4,956
24,028
110,863
99,266
373,52
Overhead
10,924
10..124
Total
113,006
15,535
36,395
14,381
35,083
124,446
'1. 9(
L10
,707
25.1
3.5
8.1
3.2
7.8
27.7
22.2
2.4
100.0
Dressmaker
(Ply
Direct
3,000
6,944
7,130
6,470
9,070
10,325
23,
=1, 2
Indirect
49,255
2,380
20,512
1,404
6,959
26,617
37,911
11.038
Overhead
.57,442
4.2'9
4,289
Total
52,255
9,324
27,642
7,874
16,029
38,198
4,2,9
113.053
%27.1
4.8
14.3
4.1
8.3
19.4
19.8
2.2
1C).0
0
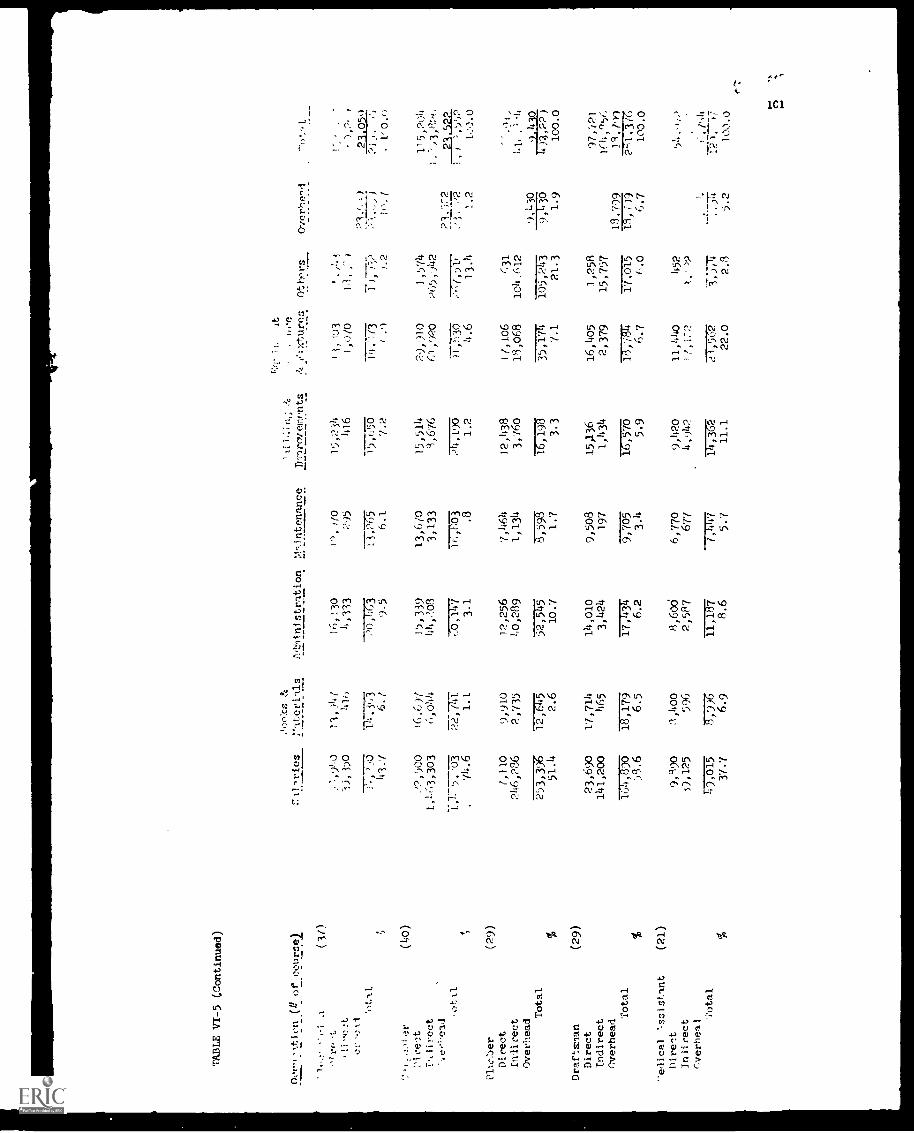
TABLE VI-5 (Continued)
nor,
. 2 -
0; i
on 1
.! o
rcolirsel
( 3 /)
211,rics
,00hs &
rltcriqls
Arlministration
ntenance
Dinrotements
r.:(t
1r,
it
;:rtures
Othor.s
Overhe'l
_._....
-t,i
,irf-t
;',,940
1304(
16,130
1'),410
1'4,234
1i, 1J3
' ):.1
11
,t
-I), 370
416
4,333
'35
416
1,010
13,
#),',
r
0:'..ni
'-'1.,.)
21,959
;, ))0
Ti,, 361
20,463
13,75
:''',.,)
1.1.1.
)5,050
14,':(3
H, l'..,)
1,
43.7
6./
9.5
6.1
7.2
( .1
4.2
in. (
,1:
0.()
:,,ter
(40)
7irect
.'7,500
16.611
1),339
13,6/0
15,514
29,910
3,574
115,204
T.,1irect
1,1d-,3,303
t-,,044
44,03
3,133
1,676
0,920
265,942
1.',3,
-,e,lel3
-.
23.2
21,522
. o t 11
7C)-
1,1.- 7
72,77.
7757
77,75
ATT55
31,77315
7757
7777
1, ,
,',,,2
.74.6
1.1
3.1
.8
1.2
4.6
13.4
1.2
120.0
ell,r1:)er
(29)
Direct
1,110
9,910
12,256
7,464
12,438
1/,106
(31
Indirect
246,236
2,735
1,0,289
1,134
3,760
18,068
104.612
41,
.' '4
Overhead
9,430
9,430
Total
253,396
12,645
7,74-
8,593
16,198
?--,7,17_7
105,243
75, '713
/4 )1,22 )
%51.4
2.6
10.7
1.7
3.3
7.1
21.3
1.9
100.0
Draftsman
(29)
Direct
23,690
17,714
14,010
9,508
15,136
16,405
1,258
97,121
Indirect
141,200
465
3,424
197
1,4314
2,379
15,757
1(4,"')6
Overhead
18,799
14 /99
Total
164,890
1 87713
17734
9,705
17575
13,'(84
17,015
77775
7177
%51.6
6.5
6.2
3.4
5.9
6.7
(0.0
6.7
100.0
''edical %ssistant
Diret
(21)
9,990
:1,400
8,600
6,770
9,1420
11,440
452
5!,..,,,,)
In I i rect
39,125
596
2,587
677
14,9
42(,
1:-:
?-.
.);.)
cverheal
.'.
1,(,,4
Total
.571515
8,))
6u-
---7
-7-(
,TPT
714,162
7TM'
31577
.. )4
7)7-17
M 1
*37.7
6.9
8.6
5.7
11.1
22.0
2.3
5.2
100.0
n
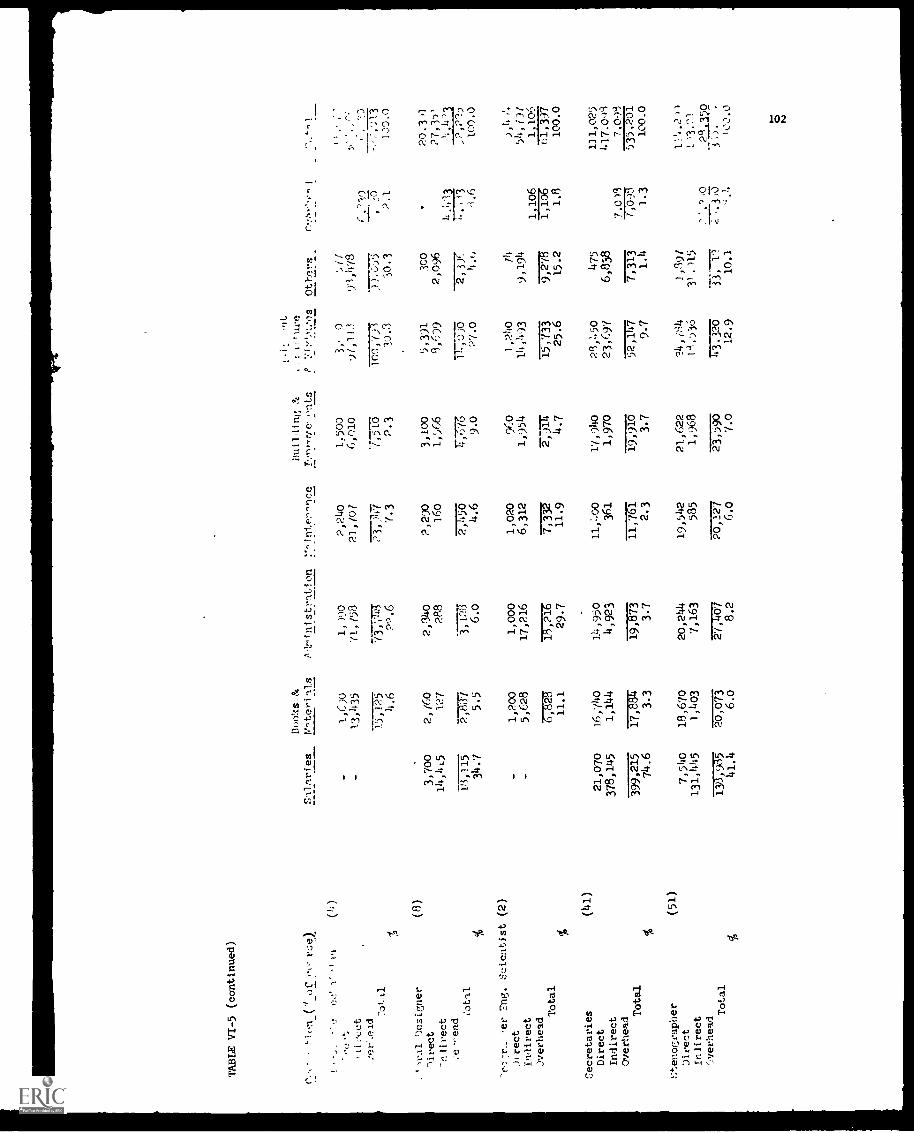
TABLE VI-5 (continued)
" 1cri (*/ )C
t:.;e)
! - ",!
1:1
(1!)
Books &
VntcHils
/1,17inistration
:"."inter'ce
P..11,,rle'ontS
Ii:.
..:111ure
PY17).,1...ls
._
Others
1,190
2,240
1,500
,licce.t
13,435
71,158
21,/07
6,010
(:' )13OA
..,...C.eld
-:otAl
7j,7177
77.-A7
65to
15,125
1c457777
)).3:)5
-4
4.6
22.6
7.3
2.3
30.3
30.3
_1.)rAl
esigner
(8)
vlirect
3,700
2,760
2,140
2,290
3,100
5,391
300
-nlirect
14,415
127
288
160
1,566
8,6)9
2,096
.-e-'ead
Cot-11
D, 1
15
2,83
7-j
;.727
s77-55
T77
7-17
7577
71,
34.7
5.5
6.0
4.6
9.0
27.0
4.6
-rc.:r_ ner !ng. Scientist (2)
Jirect
1,200
1,000
1,020
960
1,240
14
POIrect
5,628
17,216
6,312
1,954
14,493
9,194
3verheadTotal
6,828
18,216
7,332
T,7
51T
15,733
7)778
%11.1
29.7
11.9
4.7
25.6
15.2
Cecretaries
(41)
Direct
21,070
16,740
14,950
11,400
.11,9110
29,1,50
475
Indirect
378,145
1,144
4,923
361
1,970
23,647
6,838
OverheadTotal
399,215
17,884
75787-73
117767.
19,910
7.7177
7,313
enofLeapher
(51)
74.6
3.3
3.7
2.3
3.7
9.7
77Direct
7,540
18,670
20,244
19,542
21,622
?4,7S4
3,397
Indirect
131,14145
1,403
7,163
585
1,968
1,536
31.)15
OverheadTotal
138,985
20,073
7/74757
20,127
23,590
737-
320
TS,
1.2.
2
41.4
6.0
8.2
6.0
.0
12.9
10.1
',
)
r.
.7)
,o
- ....
2.1
100.0
20.3)1
?7,35'
403
7773
-'.6
1e0.0
),14 o',
54,7)1
1,106
1,10
6:
1,106
01,397
1.8
100.0
111,025
417.091
7.013
7.008
535,201
100.0
11'.2 »
_28.350
,. 3
031
,,T
0
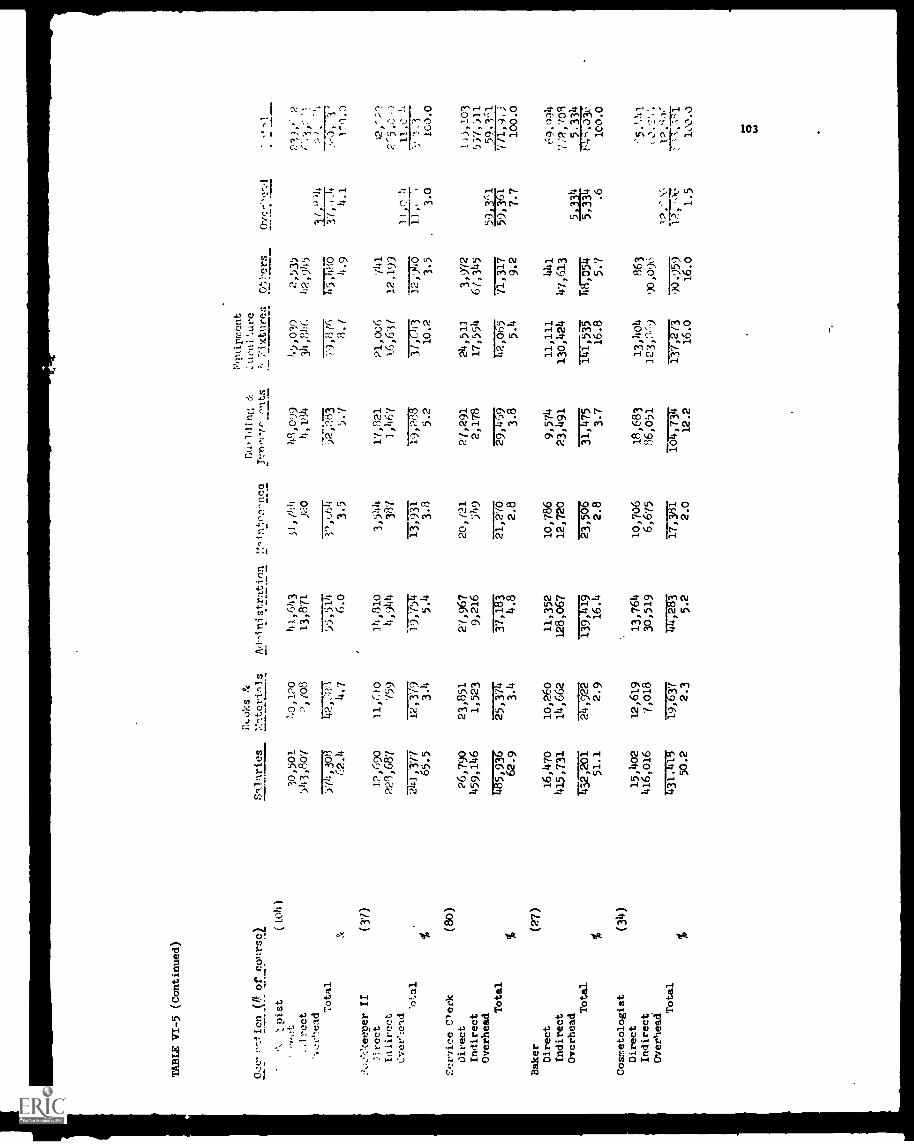
TABLE VI-5 (Continued)
Occ'r-:lion V of colIrsel
...---
.',
',.pist
( LO4 1
Snlaries
ELoks &
7.n.telinls
Ad -linistration
....
ton
!!nin-nce
----
flui1din4;
rnri-ro onts
Fri:ailment
:uvai%ure
L.7ixtures
Otl-ers_
07cf'e-.4
-,,_!t
30,501
?.0,120
41,643
31, (44
411,099
45,030
2,535
21),( 2
..irect
)43,801
2, (08
13,871
)20
4,184
34,646
42,945
1..3 ,
.1
.I:
V'e
ad3 r," qt
5.?,
Total
5'0,308
.41:1,,23
55,5T
3', _.6;
)27283
79,8(6
To7173
37,717
?,-3, V
&62.4
4.7
6.0
3.5
5.7
3. t
4.9
4.1
1..7o.o
:',:,..-%eeper II
(37)
nrect
12,690
11,110
14,810
3,4
17,821
21,006
741
41,-92
Ialirect
228,687
759
4,944
387
1,467
16,631
12,199
2'501.)
Cver:ead
11,0,4
11,C
btal
U41,377
12,379
-17777517
13,931
19,288
7773
TT,71--)io
1.) ,, 7
:-------7---
7,,i
%65.5
3.14
5.4
3.8
5.2
10.2
3.5
3.0
1C0.0
SerAce Clerk
(80)
Direct
26,790
23,851
27,967
20,721
27,291
24,51]
3,972
1,j,103
Indirect
459,146
1,523
9,216
549
2,178
17,554
67,345
557,511
Overhead
59,3(A.
59.1.'1.
Total
1+85,936
Y57174'
7,7/7183
21,270
577775
v277575
71,317
59,361
771,4,.3
%62.9
3.4
4.8
2.8
3.8
5.4
9.2
7.7
100.0
Baker
(27)
Direct
16,470
10,260
11,352
10,786
9,574
11,111
441
69.Lw*
indirect
415,731
14,662
128,067
12,720
23,491
130,424
47,613
7r2,709
Overhead
'3174-75
5,334
5.334
Total
.4.32,201
2 ,72
TIVE5
23,50 s
IT1,0
raT7577
5,334
777517
%51.1
2.9
16.4
2.8
3.7
16.8
5.7
.6
100.0
Cosmetologist
(34)
Direct
15,402
12,619
13,764
10,706
18,683
13,404
863
''5.',41
Indirect
416,016
7,018
30,519
6,675
86,051
323,8,19
90,096
: ...`,''',
Overhead
17.'\--
12.'V
Total
177-737
1.7737r
17,-37,
77771
431,419
44,283
iamw
137,2/3
90.955
%50.2
2.3
5.2
2.0
12.2
16.0
16.0
1.5
100.0
0
104
VII - BENEFITS AND COSTS OF VOCATIONALEDUCATION BY SELECTED DISTRICTS
For benefit-cost analysis purposes, eight districts have been
selected. They are Camuy, Mayaguez, Ponce, San Juan, Quebradillas, Cayey,
Fajardo, and Humacao.
In the selection of districts, we have attempted to ensure that the
selected districts be representative of the 80 school districts in Puerto
Rico. For this reason, the districts selected are of large, medium and small
sizes from the standpoint of population.
The selection of districts is considered appropriate and economical
since preparation of analyses for all 80 districts would be highly time
consuming, unwieldy and cumbersome.
Major conclusions emerging from the cost analysis are: (a) that there
are major cost variations among the eistricts; (b) that cost variations
depend heavily on the number of graduates by districts; (c) that cost varia-
tion also depends on the number of courses offered under a program or oc-
cupation; (d) that scientific-technical types of courses increase the
absolute cost of the program, as compared to nontechnical types of courses;
and (e) that costs are affected by the level of courses offered - whether at
the senior high school level or at the junior high school level.
On the benefit side of analysis, major conclusions emerging are:
(a) that technical courses generally bring about higher level of earnings, as
compared to the nontechnical courses, and (b) that benefits are seriously
affected by the number of graduates joining the labor force and getting full-
time or part -time jobs.
As in the previous chapters, the costs included in the analysis are
current and capital costs, defined in another chapter of this report.
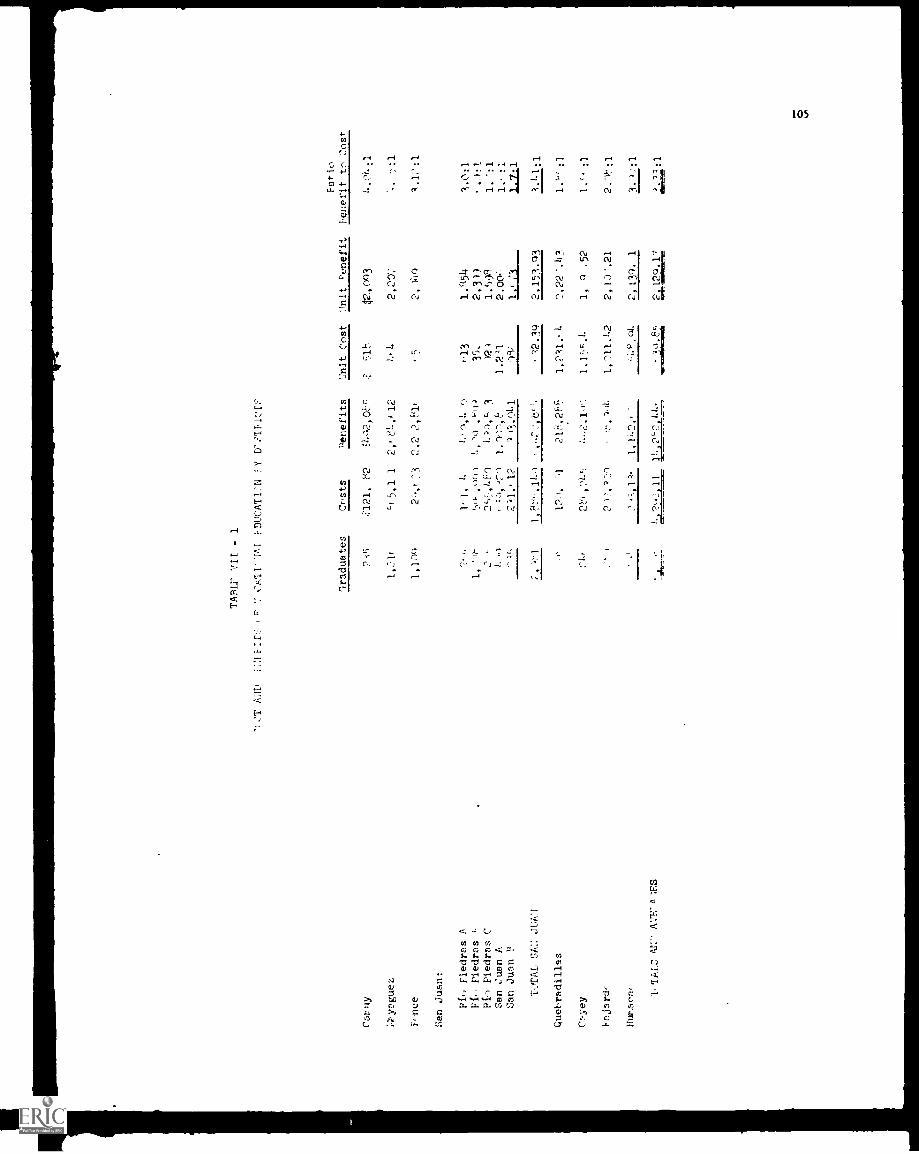
TA
BU
' VII
- 1
`:I
:'A
'i1t
FDU
CIT
1N T
YT
.
Car
r uy
T.;q
yrgu
ez
Fonc
e
San
Juan
: Fied
ras
1,14
, Pie
dras
Pied
ras
CSa
n Ju
an A
San
Juan
TIT
A1
Que
t,rad
illas
Cay
ey
Inja
rd,-
Itur
.aca
r 1, 'I
A I
C A
N.'
A V
1.7
=E
S
Irad
uate
sC
osts
,,ene
fits
Snit
Cos
tun
it t'e
nelit
l'ene
fit t
o C
ost
.';'
-sti
1,1r
1,1N
) I,
1,-
4'12
1,i4
211
.,)2,
0&5
'15,
1 1
2,'e
L.,1
2
2-4,
i :3
2,2
2,E
,1,
1,1,
I.1,
, :1,
'r)
0.14
)/4
2,-,
,20.
.e0
r,3
2)2
"44'
)1-1
.
4.51
±,
1..1
.
'5 ,13
35,
1.21
42.,
003
2,2X
2, )
1.(-
1
1,54
2,3)
)2.
0(V
,
4.0/
..:1
' ...;
:1
1., :
11.
211
1e,
Poi
2.15
3.'1
3
12,1
,-)
1
,?L
I, e
l
2 Q
.7,
,+).
1,
1,23
1.. 1
.
1. I
r.,'
/i
1, 'A
LL
?
co).
2,22
.113
1,ci
.52
2,13
.21
I 3c
)1
1.:1
1.o
:1
I 11
11.2
(-2
2 1.
,4Q
.A.7
esi=
er.
All these costs are incurred by the Commonwealth Department of Education.
The benefits referred to here are the monetary income, resulting from employ-
ment, of the graduates of the vocational courses. Benefits accruing to
industry, society and Government are not included in this section. Also not
included are the benefits which accrue due to the upgrading in the skills
and knowledge of the students who leave the courses and are classified as
dropouts.-1/
RATIO OF BENEFITTO COST
Among the eight selected districts, the ratio of benefit:cost
averaged 3.33:1, with ratio of 4.75:1 in Mayaguez and 1.56:1 in Cayey. The
unit cost in Mayaguez is estimated to be high. On the other hand, unit
benefit is estimated to be low in Cayey. The ratio of benefit to cost is low
in the districts of Fajardo (2.08:1) and Quebradillas (1.85:1).
BENEFITS BY DISTRICTS
This study revealed that the overall yearly unit benefit is $2,205.
Of the number of small, medium size and large districts selected for purposes
of analysis (see facing page) only one, the Cayey district, shows a unit
benefit below $2,000. Quebradillas, a district with only 98 graduates
presents a unit benefit of $2,227, the highest among the districts selected.
1/ The issues pertaining to dropouts are discussed in another section.
106

107
Mayaguez, a large district with 1,216 graduates of vocation
courses, shows unit benefits of $2,207, which is slightly higher than the
average for the Island. However, the ratio of unit benefits .to unit cost
for Mayaguez is 4.75:1, the highest. This is a result of its low unit cost.
The district with the lowest ratio of unit benefits to unit cost is Cayey,
with 1.56:1, reflecting its low unit benefit figure.
Three main factors influence the benefits per graduates; they are:
(1) the number of graduates who could find jobs; (2) the salaries they are
paid; and (3) the ratio of part-time to full-time employment. If more
graduates are employed full-time and paid higher salaries, they will generate
more income and will increase the benefits per graduate.
Figures indicate that 235 graduates from vocational education
courses in Camuy earned on an annual basis $492,085, or $2,094 per graduate.
Similarly, 2,981 graduates in the San Juan area increased their total yearly
income by $6.4 million, which amounts to $2,154 per graduate. Except for
Cayey ($1,797), all other districts selected for this analysis show average
earnings per graduate in excess of $2,000. Due to the dynamics of the economy
this additional income in the hands of the graduates constitutes a significant
boost for the overall economy of the respective districts.
Part-time employment is more common in large metropolitan areas than
in the smaller districts. While the study showed increase in income from
part-time employment to be 4.5 per cent for graduates of Quebradillas and
3.7 per cent for graduates of Camuy, the corresponding percentages for Ponce
and San Juan were 8.0 per cent and 6.9 per cent, respectively.

108
TABLE VII - 2
INDIVIDUAL BENEFITS OF VOCATIONAL EDUCATION BY DISTRICTS
Total Direct Income
Part-Time Full -time Total
Camay $ 18,151 $ 473,934 $ 492,085
Mayaguez 168,335 2,516,277 2,684,612
Ponce 181,825 2,090,991 2,272,816
San Juan-
Rio Piedras ARio Piedras BRio Piedras C
34,502245,305
35,745
454,968
3,852,588403,828
489,4704,097,893
439,573
San Juan A 88,345 912,532 1,000,877
San Juan B 41,738 351,303 393,041
Total San Juan 445,635 5,975,219 6,420,854
Quebradillas 9,916 208,372 218,288
Cayey 49,102 393,088 442,190
Fajardo 55,150 552,844 608,994
Humacao 79,090 1,063,517 1,142,607
109
COST BY DISTRICTS
A review of the unit costs of the districts shown on Table VII-1
reveals that the unit cost for Mayaguez is $464, the lowest of the districts
selected. The unit cost for Quebradillas is $1,231, or more than two and a
half times the unit cost frr Mayaguez. With a vocational high school
(Dr. Pedro Perea) located in Mayaguez, this district operates at far larger
volumes of students than Quebradillas with enrollment of only 189 students
in vocational courses. When the number of students is high several sessions
can be taught with only one classroom and the same equipment; this reduces
the cost substantially.
Two other districts bear unit cost exceeding $1,000. They are Cayey
with $1,155, and Fajardo with $1,001. There are some reasons for this.
Computer reports dealing with costs of vocational education by district
revealed that the salary figure for Quebradillas is extremely high and consti-
tutes 63.6 per cent of the total cost. Cayey is a similar case to
Quebradillas. For Fajardo the Administration and Equipment costs are sub-
stantially high and constitute 50.0 per cent of the total costs for the
district.
Costs of vocational education were segregated for this study into
several major objects of expenditure. These object classifications can
respond to six elements of cost bearing the greatest significance within the
Vocational Education Programs. Cost components of lesser significance or
magnitude were grouped together to form the seventh element of cost. These
elements are:
. Salaries
. Books and Materials
. Administration
. Maintenance
. Buildings and Improvements
. Equipment, furniture and fixtures
. Other
110
Salaries constitute 23.4 per cent of the total costs for all the
districts selected for benefit-cost analysis. It should be noted, however,
that salaries represent orly 6.2 per cent of the total costs for the
district of Fajardo while it represents 30.2 per cent of the total costs for
Ponce and 67.4 per cent for Cayey. This extremely high per cent for Cayey
accounts for the high cost per graduat., of $1,155 in this district. Similarly,
Quebradillas, with salaries amounting to 63.6 per cent of the total, has a
cost per graduate of $1,231, highest among the districts being analyzed.
The cost of books and materials averages 6.8 per cent of the total
cost for all the districts on the table. By individual districts the per-
centage ranges from 2.8 for Quebradillas to 9.9 for Rio Piedras A.
It should be noted that those two districts bearing the highest
percentage of salaries (Quebradillas and Cayey), show the lowest percentages
in books and materials.
The other elements of cost, except administration, are of a more
fixed nature than salaries aad books and materials. They appear within
reasonable limits for the aistricts comprising this analysis. Administration,
however, appears out of proportion with salaries, for the districts of Camuy,
Rio Piedras B, San Juan B, Fajardo and Humacao.
111
VIII - COST AND BENEFIT ANALYSIS BY VOCATIONAL SCHOOLS
Among the eight vocational schools, the following five schools with
different enrollment sizes and locations, were selected for cost:benefit
analysis:
School and Location
. A. Lucchetti - Arecibo
. RepUblica de Costa Rica -Caguas
. Dr. Pedro Perea Fajardo -Mayaguez
. Miguel Such - Rio Piedras
. Superior Vocacional - Ponce
These five schools had 8,294 trainees enrolled in 1969-70 or 14 per
cent of the total enrollment of all vocational education programs. Of these,
3,620 graduated. Total cost for these five schools is estimated at $1,542,000
and total individual benefits are estimated to amount $8.5 million. Overall
unit cost and benefit are estimated at $426 and $2,337, respectively.
The unit cost data reveals that the larger the number of enrollment
and graduates, the lower the cost of training of every student, and vice
versa. For example, the Miguel Such school had enrollment of 2,814 and
graduated 1,440, with a cost per student of $282. By contrast, the RepUblica
de Costa Rica had 905 enrollment, 246 graduates, and the unit cost was $831.
Although in a less significant way, the unit benefit data also
reveals that the larger the size of a school, the higher the benefits. Thus,
an average graduate of Miguel Such earned $2,490 on annual basis as compared
to $1,946 by a graduate of RepUblica de Costa Rica. Differences in benefits
depend on the extent to which the curriculum was technical. The higher the

technical elements in a curriculum, the higher the earnings and average
benefits. Benefits are also higher in a larger city as compared to a relatively
small city.
Since in these five schools the students were studying for beneficial
employment, the ratios of benefit:cost were much higher on the average than
those calculated for programs, occupations and districts. For Miguel Such,
the benefit:cost ratio was high at 8.8:1 and Reptiblica de Costa Rica was 2.3:1.
Table VIII-1 shows the details.
Benefits computed are on an annual basis. The working life of a
vocational school graduate is probably between 40-45 years and it is during
these working years that he would continuously and increasingly earn salaries
and wages. As pointed out elsewhere, for comparative purposes the future
benefits must be translated into present benefits with the discount approach.
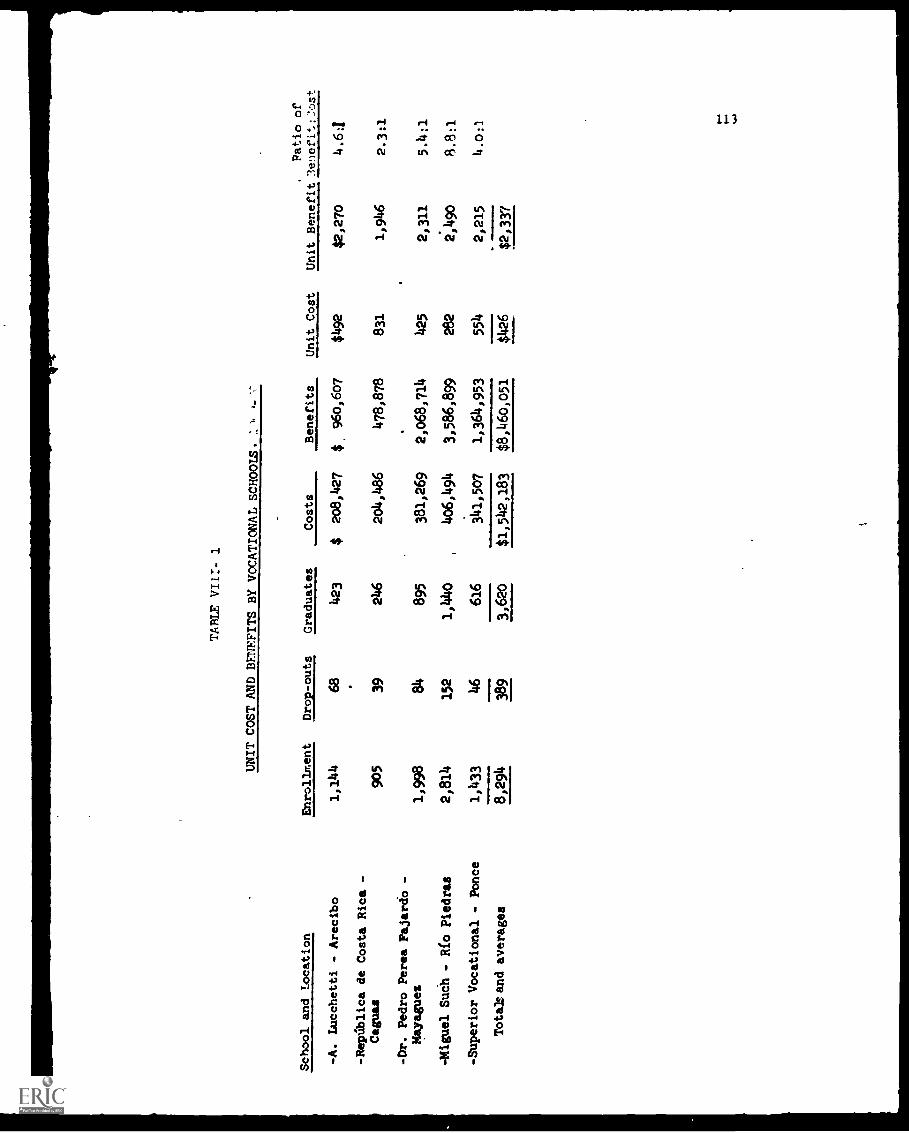
TABLE VIII- 1
UNIT COST AND BENEFITS BY VOCATIONAL SCHOOLS. 11.
School and Location
Enrollment
Drop-outs
Graduates
Costs
Benefits
Unit Cost
.Patio of
Unit Benefit 3enefit:I:Dst
-A. Lucchetti - Arecibo
1,144
68
423
$208,427
S. 960,607
$492
$2,270
4.6:1
-RepUblica de Costa Rica -
Caguas
905
39
246
204,486
478,878
831
1,946
2.3:1
-Dr. Pedro Perea Fajardo -
.
Ilayagues
1,998
84
895
381,269
2,068,714
425
2,311
5.4:1
-Miguel SuCh - Rio Piedras
2,814
152
1,4140
406,494
3,586,899
282
2,490
8.8:1
-Superior Vocational - Ponce
1,433
46
616
341,507
1,364,953
554
2,215
4.0:1
Totakand averages
8,294
389
3,620
$1,542,183
$8,460,051
$426
$2,337

114
IX - BENEFIT-COST ANALYSIS OF DROPOUTS
The benefit-cost ratio of dropouts is somewhat lower than the benefit-
cost ratio of graduates. In the case of dropout, it has been assumed that his
earnings on leaving the school are about 80 per cent of those of a graduate,
while the cost of training him are slightly lower, discounted by the cost of
books and consumable materials, a cost incurred on the basis of number of
students. A comparison of benefit:cost for dropouts
below:
and graduates is shown
Dropouts Graduates
Distribution 12.17:1 0.14:1
Health 0.64:1 0.75:1
Office Occupation 2.29:1 2.30:1
Trade and Industry 2.30:1 2.50:1
Cooperative IndustryOccupation 0.35:1 0.42:1
Technical G.72:1 0.62:1
home Economics 1.04:1 1.10:1
Human Resources and IndustrialArts 3.85:1 3.80:1
In the benefit:cost ratio of dropouts, the behavior of dropouts in
vocational education as compared to general education must be clearly under-
stood. The vocational students may be dropping out in response to job op-
portunities available and not because of any fundamental inability to complete
a high school curriculum successfully; in other words, they may not be drop-
ping out due to scholastic failure. This means that differential dropout rates
by programs, districts and schools may be due to economic pressures of the job
market in a particular occupation or area. Kaufman says, "one might even view
a perceived higher dropout rate for vocational-technical schools as a measure
115
of its success in training students in skills related to labor market needs."
He adds "that the level of school attendance and employment opportunities are1/
found to be inversely related.'
Table IX-1 provides data by programs on enrollment, dropouts, total
of dropouts and graduates, cost of dropouts, unit cost, benefits of dropouts,
unit benefit and ratio of benefit to cost. The unit cost of dropluts was
determined as follows:
- Unit cost of dropouts = total cost of dropouts tnumber of dropouts.
- Total cost of dropouts = total cost - (number ofdropouts and graduates) x number of dropouts -(expenditures on books and materials for graduates).
Expenditures on books and materials for dropouts =apply ratio of dropout to total of dropouts andgraduates to cost of books and materials by programs.
The unit benefit of dropouts was obtained by assuming that vocational
dropouts are leaving due to economic pressures and opportunities, and their
ability to find jobs is as high as that of graduates. However, they earn
wages and salaries at a rate of about 80 per cent of graduates. The unit
benefit, therefore, is 80 per cent that of a graduate. Total benefits were
obtained by multiplying the number of dropouts by unit benefit by programs.
The results on costs and benefits by program may be seen in Table IX-1.
Elsewhere it has been shown that young people with about ten years of
education earn about 70-80 per cent of vocational school graduates, depending
on the program. Since vocational dropouts have acquired salable skills, it is
assumed that they might earn more than general education students, although not
much more. Thus, in the absence of other data, upper limits of the general wage
data are considered relevant for the purposes of this study.
1/ J. J. Kaufman Dothen, A Cost-Effectiveness Study of Vocational Education,p. 199.
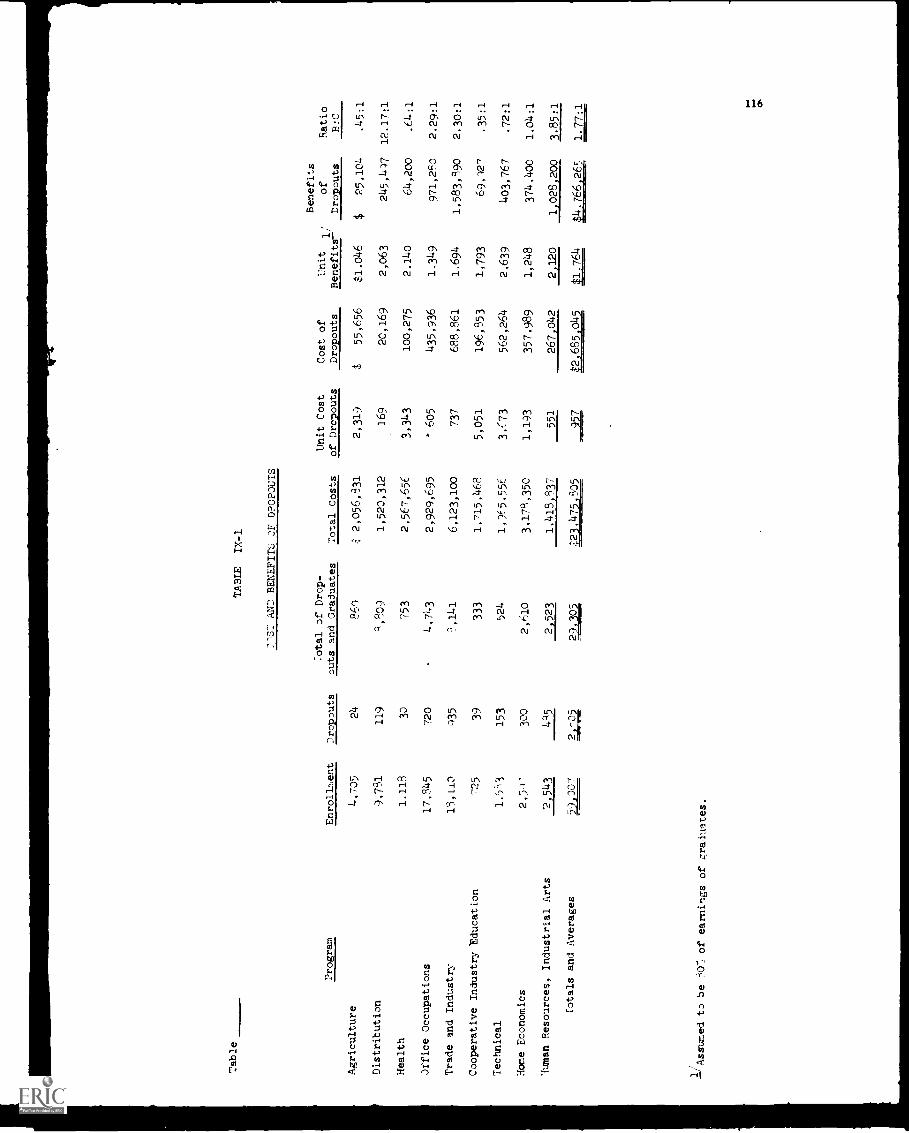
Table
TABLE
IX-1
C'ZT AND BENEFITS OF DROPOUTS
Program
Enrollment
Dropouts
Total of Drop-
outs and Graduates
Total Costs
Unit Cost
of Drcoouts
Cost of
Dropouts
Benefits
Unit
1/
of
Benefits-
Dropouts
Ratio
B:C
Agriculture
4,705
24
869
i: 2,056,931
2,319
$55,656
$1.046
$25,10!.
.45:1
Distribution
9,751
119
5,09
1,520,312
]69
2C,169
2,063
245,447
12.17:1
Health
1.113
30
753
2,567,656
3,343
100,275
2.140
64,200
.64:1
Office Occupations
17,545
720
4,743
2,929,695
' 605
435,936
1.349
971,250
2.29:1
Trade and Industry
19,113
935
8,141
6,123,100
737
688,861
1.694
1,583,990
2.30:1
Cooperative Industry 'Education
725
39
333
1,715,468
5,051
196,853
1,793
69,127
35:1
Technical
1.5-,3
153
524
199E5,556
3,(73
562,264
2,639
403,767
.72:1
Home Economics
2,34'
300
2,610
3,175,350
1,193
357,989
1,248
374.400
1.04:1
Taman Resources, Industrial Arts
2,543
455
2,523
1,418 837
551
267,042
2 120
1___
1a28:222
3.85:1
Totals and Averages
59,307
2z0
29,305
.1_23,475,305
_JJ2
.t$2,685045
$1.764
4,766 265
1.77:1
1/-Assumed to be
of earnings of graduates.
117
In the following pages, this study analyzes the distribution of drop-
outs by selected districts, programs, and schools. The analysis reveals:
(1) that the dropout rate is higher in big cities where dynamic economic growth
is underway as compared to small towns; (2) that programs with growing oc-
cpational needs have higher rates of dropouts; (3) that schools located in
major metropolitan areas with concentration in high demand occupational courses
have high rates of dropouts; (4) that programs with attached economic incen-
tives have lower rates of dropouts; (5) that more demanding courses (including
science, mathematics, etc.) produce higher rates of dropouts, and (6) that a
student from disadvantaged background is more likely to drop out due to job
opportunity than a student from a middle class home.
DROPOUTS BY DISTRICTS
The districts used for unit cost and benefit analysis in previous
sections of this report are used here for analysis of the level of dropouts
by districts. Again, it should be noted that the sample of districts comprises
small, medium, and large size districts repreSentative of different areas around
the Island. The dropouts data for these districts, presented below, is used as
the basis for this analysis. For the districts selected, dropouts constitute
4.2 per cent of the total enrollment. The paragraphs below reveal the salient
points of Table IX-2.
The district of Camuy has the lowest rate of dropouts with 1.6 per
cent, while Rio Piedras A, with a rate of 7.0 per cent has the highest rate of
dropouts. That is, the dropout rate in Rio Piedras A is more than four times
that of Camuy. There are significant differences between Camuy and Rio Piedras
in terms of industrialization, opportunities for employment, and courses taught.
Camuy-1/is
a small town located in an area of low industrialization.
Courses taught at Camuy are predominantly of the agriculture program. Naturally,
employment opportunities for nongraduates at Camuy ale less diversified and
appealing than the employment opportunities for a student enrolled in Trade
and Industry courses taught at or close to big industrial commercial areas.
Therefore, the students at Camuy will tend to pursue vocational-technical
training to graduation. Students at rapidly growing commercial-industrial areas
are more likely to drop out of the vocational-technical courses because of op-
portunities for immediate employment. Traveling from home to the training
center is less within a small district than the traveling required within a big
city or school district. This factor also favors Camuy in maintaining a low
rate of dropouts.
1/ Camay's population has declined since 1950. Under 1970 census, it was19,922, as compared to 20,900 in 1950. During the same period, Camuy townpopulation increased from 2,300 to 3,892.
Ponce, being a big city, shows a per cent of dropouts 3.3 per cent
lower than Mayaguez 4.9 per cent, Fajardo 4.8 per cent and most of the districts
within the San Juan area. There are a number of factors behind Ponce's low
dropout rate. Although it is a big city, its industrial growth occurred at a
slower pace than in other areas. The people themselves retain more of the
cultural elements associated with small towns than the people of other big
cities in the Island. An analysis of the occupations taught at Ponce reveals
that these occupations represent a balanced cross section of all the occupa-
tions comprising the Vocational Education Programs. Thus, entrants to
vocational programs can select from a large variety of courses the ones that
best fit their interests and capabilities. If the demand for the various
skills grows in reasonable proportion to the graduates, th.re would be no need
to hire nongraduates to do the jobs and the students will stay in school.
Sociological factors, such as patterns of living which call for closer control
by the parents, contribute to the low incidence of dropouts at Ponce.
DROPOUTS BY PROGRAM
The table presented below contains in summary form presents drop-
out data by Vocational program. The programs are listed in ascending sequence
by percentage of dropouts to enrollment. These percentages range from .5 per
cent for Agriculture program to a high 19.0 per cent for Human Resources,
Industrial Arts program.
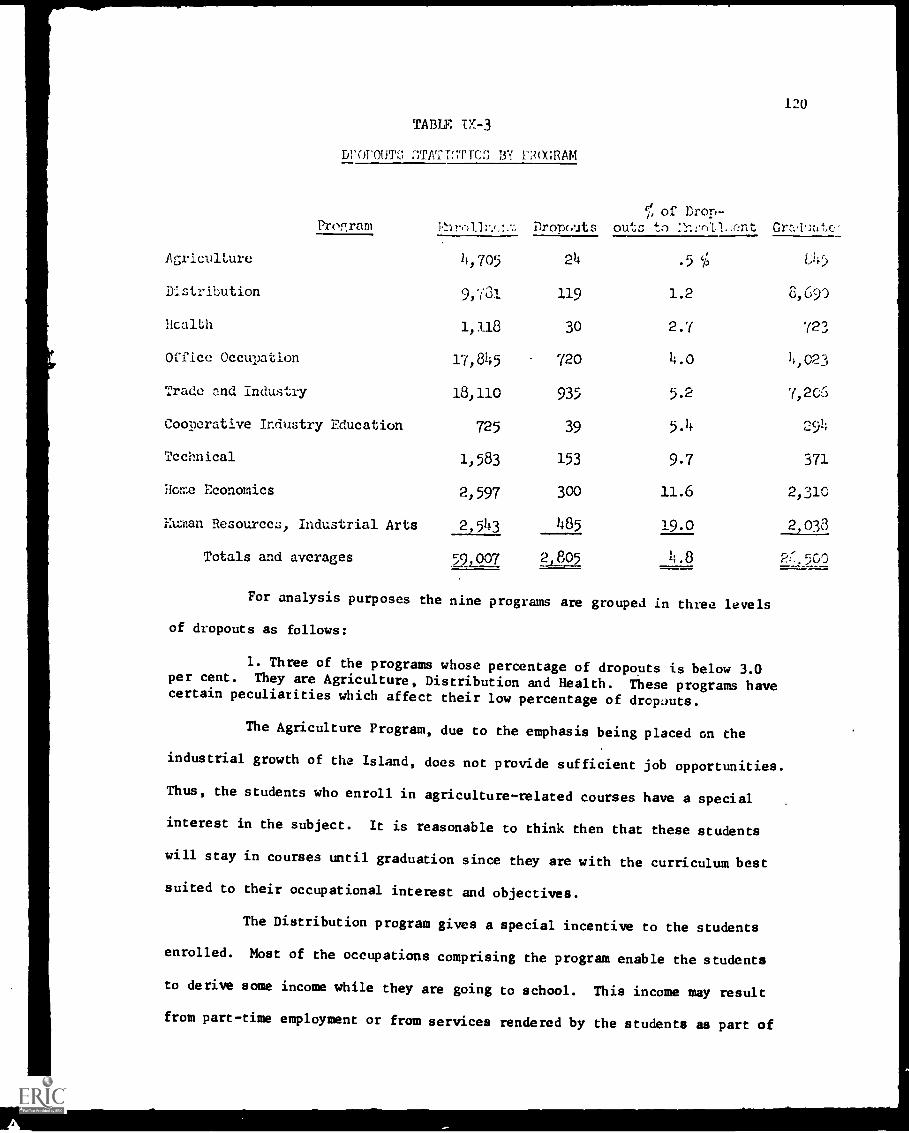
120
TABLE TX-3
Ll'OOUT:i ;;TATT:711-02 Bi 1-Pcx;RAM
cf, of Drop-
Proffram P.nr(alt.. Dropouts outs to nr.roIl..r:nt Gral.-
Agriculture 4,705 24 .5 V, L.45
Distribution 9,731 119 1.2 8,690
Health 1, u8 30 2.7 723
Office Occupation 17,845 720 4.0 4,023
Trade and industry 18,110 935 5.2 7,206
Cooperative Industry Education 725 39 5.4 ,_ )",
Technical 1,583 153 9.7 371
Home Economics 2,597 300 11.6 2,310
Human Resources, Industrial Arts 2,543 485 19.0 2 CP8....J___
Totals and averages 5.2z907 2 8,05 1;.8..-- c^nZ-..JUJ
For analysis purposes the nine programs are grouped in three levels
of dropouts as follows:
1. Three of the programs whose percentage of dropouts is below 3.0per cent. They are Agriculture, Distribution and Health. These programs havecertain peculiarities which affect their low percentage of dropouts.
The Agriculture Program, due to the emphasis being placed on the
industrial growth of the Island, does not provide sufficient job opportunities.
Thus, the students who enroll in agriculture-related courses have a special
interest in the subject. It is reasonable to think then that these students
will stay in courses until graduation since they are with the curriculum best
suited to their occupational interest and objectives.
The Distribution program gives a special incentive to the students
enrolled. Most of the occupations comprising the program enable the students
to derive some income while they are going to school. This income may result
from part-time employment or from services rendered by the students as part of
121
the training itself. Since the students are deriving some income while
pursuing their studies, they are less inclined to leave school for financial
reasons.
The Health program presents the same basic characteristics as the
Distribution program. Moreover, the program is especially attractive te
students because of the social prestige of the occupations comprising it.
These two factors would make the program attractive enough for the enrollees
not to drop out of the courses. However, there is another factor of substantial
importance: most of the occupations comprising the program grant a certificate
of title which is a prerequisite for those who want to practice the occupation.
In addition, some of the occupations, such as Dental Assistant, bear quasi-
professional status in the community. These factors emphasize the importance
of graduating and thus stimulate the students to stay in school.
2. Three of the programs, namely, Office Occupation, Trade and Industryand Cooperative Industry Education, show percentages of dropouts close to theoverall average of 4.8 per cent. These three programs influence the overallaverage heavily since their total enrollment represents 62.1 per cent of theoverall enrollment of the courses comprising this study. No special character-istics of these programs emerge from the detailed data analyzed in connectionwith the level of dropouts. However, it should be noted that the courses inthese curricula are taught throughout the Island with no indication of extremeconcentration in any given area.
The three programs together produced 11,523 graduates in the 1969-70
school year. This high number of graduates seeking jobs reduces the op-
portunities for employment of nongraduates. As a consequence, students stay
in school longer, since they do not receive offers from industry.
3. The other three programs: Technical with 9.7 per cent, HomeEconomics with 11.6 per cent and Human Resources, Industrial Arts with 19.0 percent, show percentages far higher than the overall average. Human Resourcesnot only bears the highest percentage of dropouts but also is 7.4 percentagepoints higher than the second highest, 11.6 per cent, of Home Economics.

122
Persons trained in any of these programs are in great demand in
Puerto Rico. Thus, students leaving school to accept jobs in industry and
commerce account for a substantial part of the dropouts of these programs.
Although the job opportunities are seen as the main reason for dropouts in
these programs, other factors were identified which tend to increase further
this figure or counteract the effects of the employment opportunities. These
factors are discussed below.
TECHNICAL
Courses within the Technical Education Program are demanding and
specialized. Courses such as Instructional Technology and Electronics
Technology require certain aptitudes, in addition to some knowledge about the
fields in which the technology is to be used. An Instructional Technology
Specialist must be able to communicate well with the Curriculum specialists.
An Electronics Technician is required to have working knowledge of tele
communications and other specialized fields. These factors put additional
strain on the students, forcing those who were motivated to enroll primarily
by the income potential to drop out of the course. Only those who are apt
and have a valid interest in the subject stay in the course and graduate.
Therefore, the more stringent requirements of the technical courses are in
many cases the reason for dropouts.
On the other hand, since occupations which form the Technical
Program almost invariably entails substantial income and social acceptance,
the number of students willing to enroll in the courses is always far greater
than the sessions and facilities can absorb. This enables a better selection
of the entrants and reduces to some extent the possibility of dropouts. The
fact that a diploma or certificate of completion is usually a prerequisite for
employment also deters students from dropping out of the courses.
L23
HOME ECONOMICS
Home Economies course are more popular among female students who
constitute a large majority of the total enrollment. This raises reasons for
dropping out uncommon to the rest of the programs, namely, marriage and
increased obligations at home due to sickness, pregnancy or other reasons.
Another factor contributing to the high percentage of dropouts in this program
is the fact that a certificate or diploma is seldom established by the employer
as a prerequisite for the job. However, the great demand for people trained in
all aspects of the program is the primary reason for dropouts.
HUMAN RESOURCES
This program has special characteristics which makes it different
from most of the other programs in several respects.
The program bears significant social import since it is aimed at
providing needed trainingiretraining, and basic education for persons who are
either unemployed or working substantially less than full-time, persons who
will be working less than full-time or will be unemployed because their
skill have become or are becoming obsolete, persons working below their skill
capabilities, or disadvantaged, out-of-school youth between 16 and 21
years of age in need of occupational training and further schooling.
Characteristics of the program clientele itself suggest a high per-
centage of dropouts because of the socio-economic circumstances which bring
the entrants into the program. Students are basically introduced into the
program not because of their interest and capabilities, but because of a
series of adverse circumstances, all bearing negative rather than positive
implications. They see the program as an alternative to a condition of un-
employment or minimum employment.
124
Some of the entrants are in the program trying to restart their
careers, after being displaced by the application of new technology to
industrial production. These are primarily adults with families and economic
obligations, who will be drawn out of the program to seek immediate income at
the earliest opportunity.
In summary, the causes of dropout found in other programs are
operative in the Human Resources Program to some extent. However, the reason
which pushes the dropout rate of this program to the highest among all the
programs, at 19.0 per cent, stems from the socio-economic factors affecting the
lives of the entrants.
DROPOUTS BY TYPE OF SCHOOL
The enrollment, graduates and dropout data presented on the next
page in Table IX-4 confirms some of the conclusions drawn previously in this
section. Since they have been discussed previously in detail, they are
discussed briefly here.
It could be clearly seen that the more demanding courses generate
higher rates of dropouts. The highest rate (11 per cent) of dropouts is that
of the Technical Institutes. The Technical Institutes expect students with
special aptitudes, interests and talents. High school and vocational curricula
together are more demanding than either of them alone. For combined courses
the dropout rate is higher at 5.1 per cent, as compared to secondary schools or
junior high schools where dropout rates are 4.0 per cent and 0.5 per cent,
respectively.
Another conclusion revealed by the table on the next page is that
the opportunity for employment of nongraduates is a major reason for students
to drop out of vocational-technical courses. The junior high school student
has little or no opportunity for employment and this category shows 0.5 per
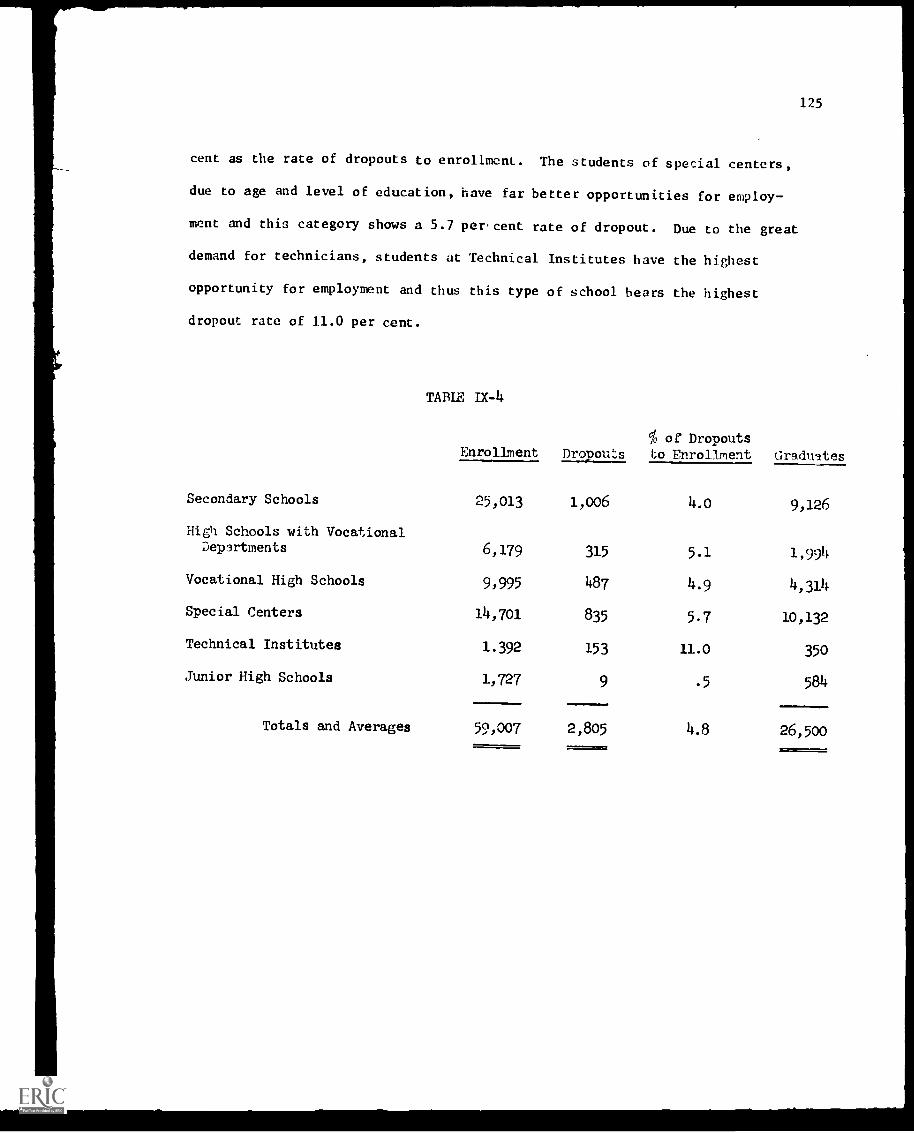
125
cent as the rate of dropouts to enrollment. The students of special centers,
due to age and level of education, have far better opportunities for employ-
ment and this category shows a 5.7 percent rate of dropout. Due to the great
demand for technicians, students at Technical Institutes have the highest
opportunity for employment and thus this type of school bears the highest
dropout rate of 11.0 per cent.
TABLE IX-4
Enrollment Dropouts% of Dropoutsto Enrollment Graduates
Secondary Schools 25,013 1,006 4.o 9,126
High Schools with VocationalDepartments 6,179 315 5.1 1,994
Vocational High Schools 9,995 487 4.9 4,314
Special Centers 14,701 835 5.7 10,132
Technical Institutes 1.392 153 11.0 350
Junior High Schools 1,727 9 .5 584
Totals and Averages 59,007 2,805 4.8 26,50o

APPENDIX
..,
Appendix APaze J of 6
COMPUTER PROCESSING OF DATAON VOCATIONAL EDUCATION
Data processing in essence is the computerizing, processing, storing
and subsequent retrieval of data. There are all kinds of ways and means of
processing data at different levels of sophistication. A number of methods are
presently available to management and technicians for solving a specific data
processing situation or problem. However, making the appropriate selection
among alternative processing approaches heavily determines the degree of
success of a given data processing project. The volume of data, complexity of
computations and processing, sorting requirements and the resources available
are factors to be taken into account in selecting the processing approach to
use in each case.
This project dealt with a significant amount of data which required
substantial resequencing in order to present the results in the proper grouping
and format as required for analysis. Although computations and processing were
not of a highly complex nature, their requirements exceeded the capabilities of
conventional processing methods. These circumstances suggested the use of
computers for processing the cost and benefit data of the Vocational Education
Programs. The development of the system, preparation of the computer programs
and actual processing of the data was accomplished through coordinated efforts
of the management of the Department, the consultants, and the data processing
staff of the Department of Education, who made significant contributions to
the project.
The methodology followed for producing the computer outputs contained
some elements of planning which will enable the Department of Education to use
the system for processing future years' data. In this sense the system is
envisioned to serve as a tool to aid in the continuous analysis of the cost
effectiveness of the Vocational Education Program. Future computer reports
Appendix APage 2 of
will be produced by feeding the new data to the computer system developed for
this project. The computer programs are available at the Departmeut of
Education Computer Center. The major processing steps comprising the system
are described below.
(a) Overall Design
The system utilizes magnetic tapes as the main data storage media
and punched cards as the input capturing medium. The system is composed of
computer programs bearing different functions. These functions are: transfer
of input data from the cards to magnetic tape, editing and validation of the
data, performing computations, sorting the data on tapes into different
sequences and printing the various reports. The operating instructions for
the system are contained in the computer programs' documentation maintainel .t
the computer center of the Department of Education.
The basic unit of information within the system if an occupation
taught at a given school. This unit of information may comprise one or more
sessions. Each such unit is considered as a separate case or observation and
assigned a unique number. This number is used throughout the system of identify
the individual case. The case number is used in the Vocational Cost
Effectiveness Analysis System as the employee number would be used in a
Payroll Sy; :-em.
(b) Input
Data input to the system is cAptured in several punched cards for
each individual case. These cards contain information on the location and
name of the school, enrollment and graduates, and the various elements of cost
and data to develop benefits figures. The system provides the mechanisms
whereby these pieces of data are linked together inside the computer to form

Appendix APage 3 of 6
a combined record for each case or observation. The case number facilitates
this process.
(c) Data Conversion and Validation
Once the input data is captured into computer readable form (punched
cacds) it is fed into the computer for its conversion to magnetic tape records
and validated. Dux_ this conversion and validation process the computer
checks the data fcr completeness, reasonableness and validity. That is, the
computer checks for human as well as mechanical errors on the data. It detects
missing data, amounts in excess or below the established limits and mispunches
of the card punching equipment.
The outputs of this stage of processing are: (1) a computer tape
containing all the records which have met the validation criterias and, (2) a
printed list of all those records found in error. The listed records are
flagged accordingly to indicate the type of error found. Examples of error
messages that could be found on the list are "cost data missing" or "Number
graduates exceeds enrollment." It can be seen that these errors could
occur at the stage when data is being gathered or when it is being punched.
(d) Processing
The prccessing which occurs inside the computer could not reasonably
be explained without the help of a number of technical concepts and term
which would require further explanation themselves. Such technical detail is
beyond the scope of this report. However, there are some fundamentals of the
system which merit some explanation to aid in the interpretation and analysis
of the printed computer outputs and some of the tables and exhibits of this
report derived therefrom. Overall processing of the various types of data
flowing through the system is summarized on the next page.
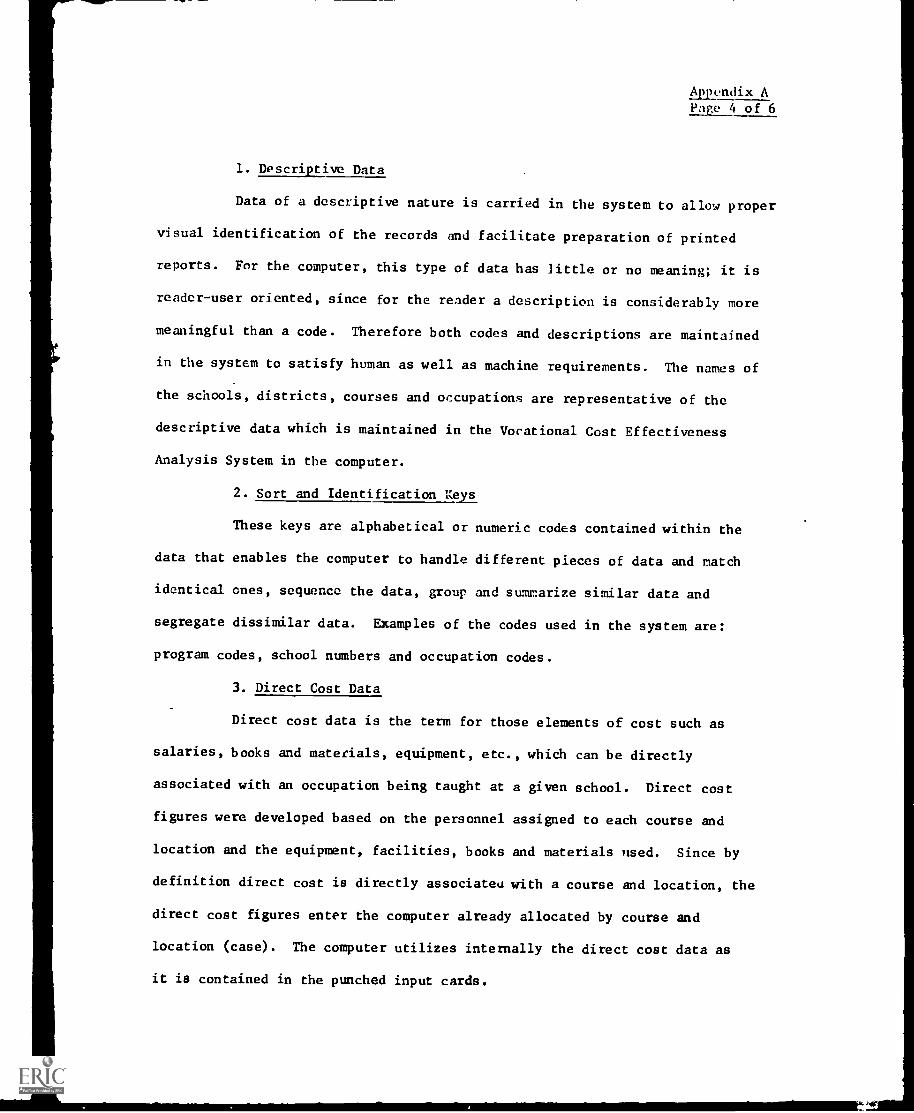
Appendix APage 4 of 6
1. Descriptive Data
Data of a descriptive nature is carried in the system to allow proper
visual identification of the records and facilitate preparation of printed
reports. For the computer, this type of data has little or no meaning; it is
reader-user oriented, since for the reader a description is considerably more
meaningful than a code. Therefore both codes and descriptions are maintained
in the system to satisfy human as well as machine requirements. The names of
the schools, districts, courses and occupations are representative of the
descriptive data which is maintained in the Vocational Cost Effectiveness
Analysis System in the computer.
2. Sort and Identification Keys
These keys are alphabetical or numeric codes contained within the
data that enables the computer to handle different pieces of data and match
identical ones, sequence the data, group and summarize similar data and
segregate dissimilar data. Examples of the codes used in the system are:
program codes, school numbers and occupation codes.
3. Direct Cost Data
Direct cost data is the term for those elements of cost such as
salaries, books and materials, equipment, etc., which can be directly
associated with an occupation being taught at a given school. Direct cost
figures were developed based on the personnel assigned to each course and
location and the equipment, facilities, books and materials used. Since by
definition direct cost is directly associateu with a course and location, the
direct cost figures enter the computer already allocated by course and
location (case). The computer utilizes internally the direct cost data as
it is contained in the punched input cards.
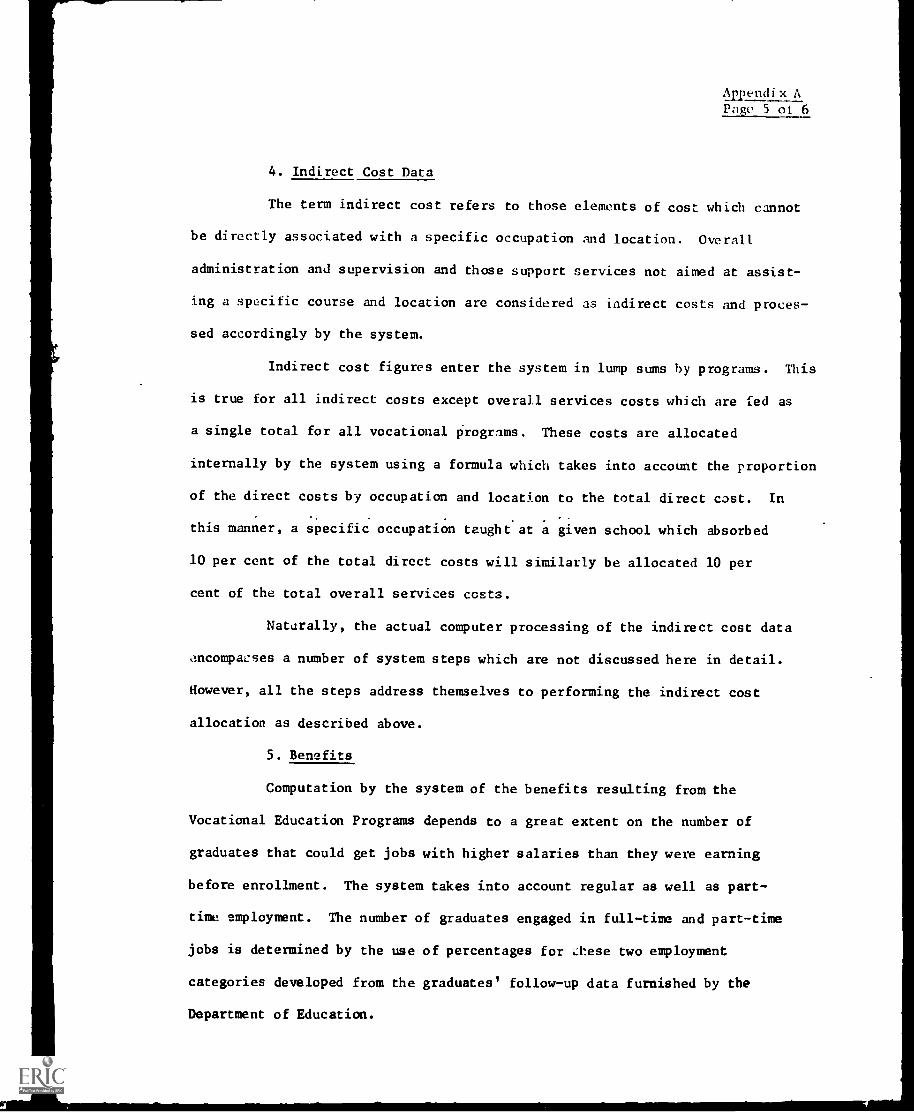
Ap2endi x A
Page 5 of 6
4. Indirect Cost Data
The term indirect cost refers to those elements of cost which cannot
be directly associated with a specific occupation and location. Overall
administration and supervision and those support services not aimed at assist-
ing a specific course and location are considered as indirect costs and proces-
sed accordingly by the system.
Indirect cost figures enter the system in lump sums by programs. This
is true for all indirect costs except overall services costs which are fed as
a single total for all vocational programs. These costs are allocated
internally by the system using a formula which takes into account the proportion
of the direct costs by occupation and location to the total direct cost. In
this manner, a specific occupation taught at a given school which absorbed
10 per cent of the total direct costs will similarly be allocated 10 per
cent of the total overall services costs.
Naturally, the actual computer processing of the indirect cost data
ancompacses a number of system steps which are not discussed here in detail.
However, all the steps address themselves to performing the indirect cost
allocation as described above.
5. Benefits
Computation by the system of the benefits resulting from the
Vocational Education Programs depends to a great extent on the number of
graduates that could get jobs with higher salaries than they were earning
before enrollment. The system takes into account regular as well as part-
time employment. The number of graduates engaged in full -time and part-time
jobs is determined by the use of percentages for aese two employment
categories developed from the graduates' follow-up data furnished by the
Department of Education.

Auendix APave 6 of 6
The number of graduates working, times the number of hours worked
during a year (1,040 hours for part-time and 2,080 for full-time) multiplied
by the average rate per hour for the specific job classification constitutes
the total benefits after training. To determine the net increase in benefits,
the yearly income of the employed graduates before the training is deducted
from the total benefits after the training.
The Vocational Cost Effectiveness Analysis System in the computer
deals only with monetary income derived by the graduates of the different
vocational courses. Other concepts of income are to be brought into the
analysis through other methods. This is done in other sections of this report.
6. Printed Outputs
Several printed reports are produced by the computer system described
in this section. All of these reports deal basically with the same types of
information described above. This information is sorted in various sequences
to present different points of view of the results of the study. Although
the computer files created by the system could be sorted in numerous ways,
the reports produced for this study present the cost and benefits information
in the following sequences:
. By program type
. By district
. By school code
. By course code
. By occupation
. By type of school
All the computer reports produced present the information in detail
and totals at different levels of summarization when applicable. The computer
outputs provided the basic information for the tables presented in this report.

BIBLIOGRAPHY

B I Bt. I OGRAPHY
Abt Associates, Inc. Des i Itri for an I:let:tent:try and1.duczt t ',3-611..e 1
r t , 'Liss ;Aht .1ssociates , Inc., June 1907, 165 pp. (a)
Abt Associates, Inv.. Des it:n for n 1.1enent.try andS onda ai _ !t- !:(-;-(Te 1Viiir 1 1.1t,e-il sr- uul(1,T. , s :Abt Associates, Inc. , June 1907, SS pp. (b)
Advisory Council on Vocitional Elucation. Vcc:ltionalEducation: The- lir Lev.een Man and Insh-o-fir.r.----P-iibrilrEt o u . t . a Ft-d--1-%-
rn i the ..17 i ;t1i115i I. P ro-:c au.r,t-ti-Orri
67-1Vo-3-1) Lib I a. .:'ded.Saco:icoaatton, Co-rata-i-t tee Caborand Public helfarc, United States Senate (90thCon,:ress, 2nd Session), :larch 1968, Pp. 1-56(a)
Advisory Council on Vocational Education. VocationalEducation: ihe Bridt,e Between Manft; r:i-n7I
Cqn cell; i the Ado i n zrzitic n rpror L"uationurr-
Tit tt e n I.duca at iun , Lou.1.1 ttj:c oa labor
and Public Welfare, United States Sen:ite (90thCongress, 2nd Session), March 1968, Pp. 57-402(b)
Anderson, Ernest F. Differential Costs of Curriculain Cor:prehensive Junior Colleges. Uitbana,
euredu errducational Research, Univer-sity of Illinois, 1966, 89 pp.
Austin, John J. and Sommerfeld, Donald A. An Evalua-tion of Vocational Education for DiiTAVII:ilagedTa7illi-77117-gre ti on , gra : The filri.c Schoors-6T-fhe City of Nuskegon, April 1967, 203 pp.
Becker, Gary S. Human Capital A Theoretical andE2kiricalTTS1s, wrfliSFZ-MITCTerencet6 : Co fun7175-UniversityPress, M747 187 pp.
Benson, Charles S. "Economics and Education." Reviewof Educational Research 37:96-102; February1967.
Besen, Stanley M.; Pechter, Alan Ii.; and Fisher,Anthony C. "Ccmt-Effectiveness Analysis forthe 'War or. Poverty'." In Thomas A. Goldman(Ed.), Cost-Effectiveness Analysis, NewApproadiF7i17 reT-1/ :racTIFFT:iria7 IbIrs11crs, 1967, Pp.140-154.
2
Blaug, M. it.ontoic: mi Iducation, A Sefe:te.: Annotated
190 pp.
Boggs, Gerald L. A Coliparative Analy :i,, of Ow Impactof Various lres=ofCnyi'll,111a VWational
(11Z.sii.SE111fef,----afY.: Okidlioma Stare University,1957, )00 pp.
floras, Michael E. "A Benefit-Cost Analysis of theEcoLomic Effectiveaess of f.ftrainin3 theU:1(-.p1oied." Yale ;.7ono:ic Fssays 4:371-429;Fall 1964.
Brandon, Cenrge L. and Evans, Rupert N. "Research inVocational Educatio-.." In 'felvin L. Barlow(Ld.) oLatiolial L,IncatiGn. Cnicago: NationalSociety (or :the Study 6TC.Jucation, 1965,Pp. 263-279.
Brazziel, Mliam F. "Effects of General Educ3tion inMannower ProgiaLs." Jeurnal of Human Resources1:39-44; Summer 1906.`---
Cain, Glen and Somers, Gerald. "Retraininj the Disad-van.tage.1 Lorker. In Cathleen Quirk and CarolSheehan tr.d.), Research in Vocational andTcchnical 14;.: CeFterfor StaUles in lecattonal and TechnicalEducation, University of :';isconsin, 1967,Pp. 27-41.January 1969
Carol, Aithur and Parry, Samuel. "The EconomicRationale of Occunational Choice." Indus-teial and Labor Relations Review 21:1-8196;Janualy-I968.
Carroll, Adger B. and. Ihnen, Loren A. Costs indReturns of Technical Education:--X-1'T1Wt5f5Ti7. -LasiungLou:-b. L.: JifiTiibi7MinpowerPOTY4, Evaluation and Research, U. S.Department of Labor, July 1966, 52 pp.
Carroll, Adger B. and Ihnen, Loren A. Costs andReturns for Investments in TLchiii-argcNoolingoy a Grout) of- -Ncrtif Larsltna tita School
ialscafTiTiPeport No. S.kafeigi% r\. C.: Department of Economics,North Carolina State University, December1967, 49 pp.
Case, C. Marston and Clark, Stephen. C. A Bibliogra-phical Guide to Operations Analysii oflaWCYFT657--Icchnicat KOteThuaer
D. C.: National Center forEducational Statistics, U. S. Office ofEducation, September 1967, 20 .pp.
Corazzini, A. J. Vocational Education, A Study ofBenefits and Costs (A Case Study orkorcesterMas-;acilusctrs-). PilliaToliVN. J.: Industiriltrentfiiiii775K7tion, Princeton University, 1966,126 pp.

3
Corazzini, A. J. "When Should Vocitional Lducationisegin?" In Cathleen Qutrl. and Carol :Meehan1:esuarco in VocattnnAl and Iecnnieal_
Iducation. Mad,:on, Center for Studieiin Vocational lechnscal Lducation, 0..iversity ofhisconsta, 19.'7, Pp. i1i :Ct. (\i 0J.; 518 for EDnumber see Januaty 19u V,:search so Lducation)
Coranzini, A. J. "The Decision to Invest in VocationalLducation: A Analysi5 of Costs and Benefits."Vocational Education. 's.upplencnt to lheJousna1(:C)iu-an_Besource.;, Vol. 3, 1'-s68, Pp.
Correa, Hector. "Measuring Education's Contributionto Eccncnic Grot.th." In Stnnley Elan and
P. Melon. (Ed.), Iducational Require-nents for the 1q70's
11:Ler,Ti;c1.sliddry--AnnreJcn. Lreuerick A. Or:4eger19ol, Pp. 151-213.
Cvancara, Joseph C. Innot.:Output_ Relationships AmonI nte1 1 cc t aTi 1- In% es.-.nc:n1,;"-.7-,1
-At!
tnesis. lInncapo'is:of :s.sinesola, 196, 127 pp.
Abstract: VISSortat!oll %,;tractS 20:845;1963.
Davie, Bruce F. UsingBenefit-Coct jriPlanhintandIA:ucati.:" A Paper
Prepared-J6r bavid S. busi:nal. Washington,D. C.: Bureau of Research, U. S. Office ofEducation. November 19:6, 19 pp.
Davie, Bruce F. "Benefit/Cost Analysis of VocationalEducation: A Survey." In Arnold Kotz (Ed.),Occupational Education: Planning and Program-ming.Mume :den to
Stanford Research Institute, Septe4ber 1967,Pp. 309-330.
Davie, Bruce F. "Cost-Benefit Analysis of VocationalEducation: A Survey." In I!earin' :; hefore theGeneral Subcom:dittee on LduCa OffheComnittee en Luucati-611 a;w (labor, 'Mouse of
IT 1 7iiiiTler;
-I'd 1 'it "cArifi-11iT AMT to Anenria7-Vocaflunai LOcation-Aotof--N =ThartUbvernment Printing Office, 1968, Pp. 10S-117.
Deitch, Kenneth M. and McLoone, Eugene P. The Economicsof American Education: A Eibliograet.Bloomington, 171(1771717116171F-Tlippa, Thc., 1966,67 pp.
Denison, Edward r. The Sources of Lcononic Growth inthe 11,-. i tc 1 (C,:riic.;-_:Th1-1-f.h-o- 11. (7)raUc.- tAii1,1:i tee Col i.conon.TC----bevelopment, 1962, 297 pp.
DeWitt, Nicholas. "Inve.;tment in Education aad EconomicDevelopmert." Phi Delta appan 17:197-199;December 1965.
Drouet, Pierre. "Vocational Training Costs: Resultsof a Pilot Study nnd an Es.,::y in Methodology."International Labour Review 97:115-113;Fe-di-7i a- b8.
Meker, Richard L. and Altnan, James W. An Analysisof Cost and Perl'ori2nce l-nctor
-AZT: :iLiTy "Sa du s Zan
Institutes tor Research, October 1967. 40 pp.
Duis, Harold and Sanders, George. "Employment ofVocational Program Graduates." American_Fiducctior !:29; February 1968.
Lninger, Max U . The Proce3.s and Praduct ofT ISchool Lovcl knca-ttoiial
PItt.,;ounCa, Pa.:1-n-sTifi -for Research, September,
1965.
Fein, Rashi. "Brookings Institution Conference onVocational Education: Introduction." VocationalEducation. Supplement to The Journal or HaanResources, Vol. 3, 1968, Pp.FITT--
Gibson, Charles H. "A Cost-Henefit Analysis of Vocational-Technical Education in. the Area Vocational Schoolsof Kentucky." Proposal for a Dissertation.Lexington: College of Education, Universityof Kentucky, November 1967, 20 pp.
Cough, Lowell A. and Rowe, Harold R. A Study of FactorsAssociated with Outcomes of '4DTA-1gricsaturalnucation rro)vcrs :n tne Somerset Area. (finalkeport. hexlugton, kY77Thntuay ResarchCoordinating Unit for Vocational Education,January 1968, 22 pp.
Ilanoch, Giora. "An Economic Analysis of Earnings andSchooling." Journal of Human Resources 2 :310-329; Summer 0177---

Hansen, W. Lee (rd.) "Symposium on Rates of Return toImestr...,,nt in I:di .7::tion." Journnl or HumanResources
_ .
Hansen, W. Lee and Weisbrol, Burton A. Seminar en theI cc:Ion o: . . :
.t ,;.T. Growth. n1; Con ,
b. C.: bureau ef 12,2seaiLh, U. S. Office ofLducation. August 1967, 350 pp.
Hardin, Einar. "Summary Guide for Effectieness/Costand Belie fi t /Co..; t Xnalyses of 1, oca t ional andTechn Ica Educa tir.n: A 1..:;:ort of the Confer-ence . " In Arnc not; t! ) , occul,a tionallaca on : P I ,a) int; ant. I' rc
1 Part., Calif . : P.searchInstitute, September 1967, Pp 379-336
Hat ry , Harry P. Criteria for Eva luatiou in PlanningState and -1.-67:-ar
i on ) , A StudySu'imitted by the Subcoonictee on Lltergovern-r.ent:,1 Relatiuns to the C'immitt'ee an Govern -
r.i'nt Op-:rations, July 2i, 1v67. 'Sashington,D. C.: U. S. Government Printing Office, 1967,42 pp.
Hatry, Harry P. and Cotton, John F. Priqram Planningfor S'ate County City. hqshin!;ton, O. et:George haiTian,;ton University, January 1967,72 pp.
Innes, Jon T.; Jacobson, Paul B.; and Pelligrin, RolandJ. The Ecoi.onic Returns to Education: ASurvey onrinuinp_s. Etp.:ene, Ore.: Center forfa Advanced Study of Educational Administration,University of Oregon, 1965, 45 pp.
James, H. Thomas. "Some Reflections on the PracticalApplications of PPBS." Paper presented atAmerican Educational Re..earch Association,Chicago, February 1968.
Johnson, Louise A. Follow-upoEMDTA Eand D ProjectConducted In Tu;I:Feee-Institute.--15WITigton,IT.- 1.77-burcau of sOTT5T-ST:lence Research,Inc., May 1967, 92 pp.
Karnes, Merle B. The Efficacy of a PrevocationalCurriculum-YaR- acre ices Iii Eiji ed toRehabilitate Slow Learners Who Are SchoolDiWout, allpacy, ankrITATTTiloymeTT-Fione.WiihiliiT6771. C. NE 5 co-Administration, Department of Health, Educationand Welfare, August 1966, 114 pp.

6
Kaufman, Jacob J. "fhe Role of Cost-Zepefit ANalysisin the Lvaluattoa (If tocaticnal ,nd technicalEducation." Paper piesented at A:,..cricanVccational A.:sociotton, Cleveland, Ohio,December 1967.
Kaufman, Jacob J. "Statemert or Prof. Jacob J. Kaufman,Director, Institute for Research naResources, Pennsylvania State Un.versity."In !:e faro the G.i.ioral S-"n itteeon. 1.(:11.::it
:
ÔT
.! :-.01--1:'"1 Is ,
Part VA -,71-7-
Ui-.1-iirient Printing Office, 196S, Pp. 666-896.
haufman Jacob J.; ',owls, Morlan V.; an Gummier, David
C. The School ynvireament.r..nd It: f!tiencc onEduc:FT6-::al Pra..tras tOr Dropouts.Interi-a Ualveisity Pail., Pa.:Institute for R.scarch on Human Resouices,Pennsylvania State University, January 1968.
Kaufman, Jacob J.; Scl,aefer, Carl J.; Lewis, Morgan V.;Stevens, David .A.; and House, Elaine W. TheRole or tie Sccandar:. Schools in the Prepara-tion Q C2U a :or nt.Taivrsityark,
for Re3ear-4-fa on hurn.n Resources,Pennsylvania State University. Febro-lry 1967.
Kaufman, Jacob J.; Strorsdorfer, Ernst W.; Pu, Teh-wei;and Lee, :law Lin. An Analysis of the Compara-tive Costs and Bent!TITT1.VF-caticill V-ersusACTIenic Edu:atien in Socondarl::(3-No415.Pi ii Report, FrojecfMo. O. L. 512.University Park, Pa.: Institute for Researchon human Resources, October 1967, 156 pp.
Kotz, Arnold (Ed.) Occunaticaal Education: Planning.and Prozrammrd7=15E-OTIO-7--genlo Para:,Cirri.: Stanford Research Institute, September1967. (a)
Kotz, Arnold (Ed.) Occupational Education: Flaringand Proe.ramming. Volume iho. Menlo Park,"ariT7 btanford Research Institute,September 1967. (b)
HC-18.92)
Kraft, Richard H. P. (Ed.) Education and EcoromicGrowth. Proceedings 6T-INFFirst7ThdETU--(76EfFience on the Economics of Education.'Tallahassee, Fla.: Educational SystemsDevelopment Center, florida State University,1968, 189 pp.
Lanham, Frank W. and Trytten, J. M. Review andSynthesis of ResearcE in Business and OfficeI:ducation. ColumLuF., Ohio: he Ccntcrnat:alai and lechnical Education, TheOhio State University, 1966, 128 pp.
Larson, Milton E. leviou an,:f;yntbet,ic_of Itesearchin lochnic,; oh ikl--The
:t ;J1.:1and tt_chnical Lducat ion,the Ohio State OLIversity, 1960, 69 pp.
Law, Gordon F. "Research Visibilit." AmericanA,,ur:ial 45: 33-tS; April 11-63.
London, H. H. How_Fre ')DTA Ex-te.tinee.:? In EjoircenFo:ic
rs".i.,.
I tersi oDeceml,er, 1)67, '.03 pp.
Main, Earl D. "A Nation,:ide Evaluation of M.D.T.A.Institutional Joh Trainin.4." Journal ofNu-tan kes-oSpringe.: .3:159-170; Spring 19GS.______
Mangum, Garth L. Ce!itributions and Cost.; of ManpowerDovelotment a11,1 .ArYor,
i,acr-TFTIndostrial :relations,Univoe ity of Michigan, December 1967, 35 pp.(a)
Mangum, Garth L. "Ei.aluating Vocational Education:Problems and Priorities." In Arnold Kotz
Oc:urational Education: 1'i. ring andP: !TIT17. U I 1.11;:e :AI C-77: iircl-51':TicCintr :k.::,:o7Tkertrch Institute, Sentmeer 1967.Pp. 6:-(30. (b)
Meyer, Wnren G. and Ln4an, William B. Review andSynthesis of Research in DistributWe=Fation.
Technical Education, The Ohio State University.1966, 212 pp.MC-59.24)
Miller, Robert W. and Zeller, Frederick A. SocialPsycholtnical Factors Asociateci wjth Responsesto kctrainini. RCSCUrCH !;eriFi-No. f.Aorgantown, W. Va.: The Institute for LaborStudies, West Virginia University, September1967, 58 pp.
Mood, Alexander M. and Powers, Richard. Cost-BenefitAnalysis of Education. Technical Sii-a-X757-77.hashingtonTb. C.: National Center forEducation Statistics, U. S. Office of Education,March 1967.
Page, David A. "Retraining Under the ManpowerDevelopment Act." In John D. Montgomeryand Arthur Smithies (lid.) Public Policy..Vol. 13. Cambridge, Mass. : WUniver-sity Press, 1964.
Pearman, Elizabeth H. Bibliollraphv.of Cost - BenefitAnalysis and Piankin5:ProiTE7t=tud-cyfing.MECoanT-Va.: lic.searcli-Alidlysn Corporation,February 1966, 44 pp.

Pe joyi ch , Svc toza r .1.14 Sul 1 i van , hill jam. The Roleof -lechatc7,L _Imnrsy: : itsand -i rn r. ; r
sLac itiilv. uifice or!lao!,ower Policy, tv:!luation an4U. S. Department of Labor, .ieptemocr 1966,19 pp.HC-51.04)
Persons, lid;;ar A. The Farmer and Mis rdncv:ionalInves t : :Jr.; t
this love;i t 1:ctor's:
:4innesotJ, t:i;tract: Ols.:erLationAbstracts 27:1622-A; 1960.
Persons, Edgar A. "Adult Educati)nDees It Pay?"I.gricultural Education 1:.;tazine 11:42-43;August .
Sharp, Laure M. and Krasnegor, Rebecca. The Use ofFollow-Ln:ltudteAin theLvaluation el
ilLie7iiTif-A-,ETence Research, Inc.,May 1966, 35 pp.
Silvernan, Leslie J. Follet:-un StuJy cf !:DTA E and I)Pro i:ct ,7e
_!n C
RcsParch, Inc., March 1967. 49 pp; (.41, 000 201)
Solie, Richard J. "Employment Effects of Retrainingthe Unemployed." Iaeustrial and LaborRelations Review Z17:111:75T:EilTi-61963.
Somers, Gerald G. "Retraining: An Evaluation ofGairs and Costs." In Arthur M. Ross (lid.)laployment Policy and the Labor Market.terkaey, Mil.: University otnaforniaPress, 1965, Pp. 271-298. (a)
Somers, Gerald G. "Training the Unemployed." JnJoseph M. Becker (Ed.) 11 Aid of the Unemployed.Baltimore, Maryland: 1T15,Pp. 227-251. (b)
Somers, Gerald G. "The Response of Vocational Educationto Labor girket Changes." Vocational Education.Supplement to The Journal erliti-Faii-FThrii--c-es,Vol. 3, 1968. -Pp. -3775S. (a)
Somers, Gerald G. (Ed.) Vocational Education. Reportof a Conference Sponsora-Uy thi-gralingsInstitution. Supplement to The Journal ofHuman Resources, Vol. 3, 1968. 140 pp. (b)
Somers, Gerald G. and Stromslorfer, Ernst T. A Benefit-Cost Analysis of Manpower Retraining.
CLF-1175cecTino OT-Thc ;;eventeenth AnnualMeeting, Industrial Relations Research Association,1964, 14 pp.

Sorkin, Alan L. "necupational LJrnins aid Iducation.":,Ionthly Labor RevIew 91:6-9; April 1968.
Spiegel man, Robert C. "A Lnefit/ost rameLork forEducation." In krro1,1 Kotz (Id.), ocomationalEducation: Pl.uu.i.itLi%d.Protti2,2..Idii..t. \uiUcie
talit.: tailiord ResearchInstitute, September 1967, Pp. 359-377.
Stromsdorfer, i'rnst W. "Iconomic Concepts ,ind Criteriafor Investment in Vocational Education." In
Arnold Kot: (Ld.), 0.:eup±t!on)1 !ducation:and pr( loJu;,2 11.o, ticnlo
Sta;.!ord i+ Pc-oaarch institute,September 1967, Pp. 331-357.
Stromsdorfer, Ernst W. "Determinants of EconomicSuccess In Retraininy, the UnemployeJ: Thetest Virizinia Experience." j,aurnal of HumanResources 3: 139-1:38; Spring 19th. _
Iausig, Mi,:haLl K. "An Economic Analysis of VocationalEducation in the New lorl. City High :t:l'ools."Vocational Education. Supplement to lhe Journalof Win.lri Iesource, Vol. .3, 1968. Pp. 39 -37.
Tuckman, Eruct W. and Schaefer, Carl J. aaview andSynthesis of Rese.iich in Trade
. nand Tecl .1cal :ucation. fhe Ohio
Slate University, 1966, 7b pp.
'Neeten, Luther C. The Role o: Education in2,11eviating.Rural Poverty. Al;ricultural EL:end:11c Report No.114. ;tashington, D. C.: Economic ResearchService, U. S. Department of Agriculture, June1967, 56 pp.
Warmbrod, J. Robert anti Phipps, Lloyd J. Review andSynthesis of Research in A9ricultufa1TiducaFion.Column us, unic: Cent-2r tcf-loLvtnal and-Technical Education, The Ohio State University,1966, 140 pp.
Weisbrod, Burton A. External Benefits of PublicEducation, An-L-ET:io-ETE-nU_IYM77-719.1iZeton,FT-3-:7----Fralus1751 lzc1ctions Section,Princeton University, 19b4, 144 pp.
Weisbrod, Burton A. "Preventing !Ugh School Dropouts."In Robert Dorfman (Ed.) !!esuring Benefits ofGovernment Investments. hTiThington, j7T.:The Broorings=it-irtion, 1965, Pp. 117-171.
Weisbrod, Burton A. "Conceptual Issues in EvaluatingTraining Programs.' Morthlv Labor ReviewS9:1091-1097; October 1966. CaT
Weisbrod, Burton A. "Investing in Human Capital."Journal of Human Resources 1:1-21; Summer
(b)

10
;101, (1.'1. ()nal I" inn int.:, .n;e (in iv
Alvier2od, c 110.7.1( Jeiti rd,.0-1:1nr-ononlic
1.(r.r2i;r;:mt., A:1'1in.: Co.,
Arc' inet)'
A rr f1 `.0
icr. in.1),)1
i"nr.:ni:n:;
rY (.0t. 1)(9
e.arnoy, 1:1° cont 2'2L111'14.D iaUh.D. Dicscatdo-.1., 1.1n1.v. or 1900.
i!oster, P110.111), "rTle 1.-1.1r.ly in nc..:vc1Gpatont
:).nd
UcCv. 92 .!)()3.
:Plasoa. 4c1-_: Colo ?1,1Ots r qd.
,,c
t:2-floon, "IA!..es of r:oturr. to Toc.s.,;,:1.2;:t in r,21-.00ling,".j2r.r.1 r:-)1 1 c-ps 1,-1 '0-2 A iY211 2061-0
Th. 1.111d:n112.511:; - T.
r)Ent Co iff.r.di York,19S.
K.Pannan, Jacob, and othcrz, A Cos. UCPtIvene3 VoczntonalECLucal.4.on, Inatilmte .'or .,!zea'ea n A.J=1Pnnc4vania c.i.aue Univ., Ouiversity tark, zennviivania,March 1969.
rY..ichlup Educc.tion and Economic Growth, Nebraska Univ.Press, Lincoln, 1970.
Mincer, Jr ob, "On-the-Wob Training: Costr;: Returns end Someo,trnal or 1.oli:;41. r.coacrry, October, 1962.
United Nations Research Institute for Social Development,Cost-onefit Analy;:is oe ?rojects: ilcuort of aMeeting of Experts Held in Rennes, 'France, Sept. 27 -Oltober 2, 1965, Geneva, 1966.
Williams: Lawrence, PModern Technology in the Changing World ofWork," The F.olc or University 5n 1.1.motin; Charm,Ithaca, Cornell Univ. eress, i9u2.