document resume · pdf file · 2014-06-30=1mid ===a1mem =immv. mr > a u st rali...
TRANSCRIPT

ED 423 415
TITLE
INSTITUTIONISSNPUB DATENOTEAVAILABLE FROM
PUB TYPE
EDRS PRICEDESCRIPTORS
IDENTIFIERS
ABSTRACT
DOCUMENT RESUME
CE 077 195
Australia's Vocational Education & Training System. AnnualNational Report. Volume 3: Vocational Education & TrainingPerformance.Australian National Training Authority, Brisbane.ISSN-1324-91851998-00-0092p.; For volumes 1-2, see CE 077 194.Australian National Training Authority, GPO Box 3120,Brisbane, Queensland 4001, Australia; Web site:,http://www.anta.gov.auNumerical/Quantitative Data (110) -- Reports - Research(143)
MF01/PC04 Plus Postage.Academic Achievement; Annual Reports; Data Analysis; DataCollection; *Delivery Systems; Disabilities; EconomicClimate; *Education Work Relationship; EducationalAttainment; Employer Attitudes; Financial Support; ForeignCountries; Indigenous Populations; Labor Market; NationalPrograms; Non English. Speaking; *Outcomes of Education;Participation; Performance Based Assessment; PostsecondaryEducation; *Program Development; *Program Effectiveness;Rural Areas; Rural Education; School Business Relationship;Secondary Education; Special Needs Students; Tables (Data);*Vocational Education; Womens Education*Australia; TAFE (Australia)
The state of vocational education and training onnl inAustralia in 1997 was evaluated by collecting data on the following keyperformance measures: participation and achievement in VET; employer views onVET; student outcomes from VET; VET's benefits for particular client groups(females, people from rural and remote areas, indigenous Australians, peoplefrom non-English speaking backgrounds, and disabled people); and publicinvestment in training Australians. The data were analyzed within the contextof information about Australia's economy and labor market. /t was discoveredthat, in 1997, nearly 1.5 million Australian students (68,000 more than in1996) participated in VET programs delivered through public funds combinedwith fee-for-service provision through public providers. More thanthree-fourths of participants undertook VET through technical and furthereducation (TAFE) institutions. Expenditures on VET in Australia in 1997 wereestimated at more than $8 billion, with governments and enterprises eachproviding 45% of that amount and individual investments accounting for theremaining 10%. Although employer, student, and graduate satisfaction with VETand TAPE was high, several areas of additional improvements in VET and TAPEdelivery were identified. (Appended are additional technical data and noteson the data collection and adjustment processes used. Also included are 107tables/figures.) 0410

U.S. DEPARTMENT OF EDUCATION
triceof Educational Research and Improvement
) UCATIONAL RESOURCES INFORMATIONCENTER (ERIC)
O This document has been reproduced asreceived from the person or organizationoriginating it.
O Minor changes have been made toimprove reproduction quality.
Points of view or opinions stated in thisdocument do not necessarily representofficial OERI position or policy.- _
PERMISSION TO REPRODUCE ANDDISSEMINATE THIS MATERIAL HAS
BEEN GRANTED BY
TO THE EDUCATIONAL RESOURCESINFORMATION CENTER (ERIC)
'innualationeRepor7Vocational Education
Volu m e
& Training Performance
=1MID===a1MEM=iMMVMR
>
A U ST RALI AN
NATIONAL TRAININGAUTHORITY
Measuring the performance ofAustralia's vocational education & training system

Enquiries should be directed to:Australian National Training Authority
GPO Box 3120Brisbane Qld 4001 Australia
@ Australian National Training Authoriry 1998ISSN. 1324 9185
Cover photographs: (from top left) Ms Georgiana Butt, 1997 Vocational Student of the Year;Mr Leroy Eggmolesse, 1997 Aboriginal and Torres Strait Islander Student of the Year;
Ms Anita Van Oene, 1997 Trainee ofee Year; Mr Jason Jones, 1997 Apprentice of the Year;and Regency Institute of TAFE SA, 1997 Training Provider of the Year.
3

BEST COPY AVALABLE I
Annual National Report
Measuring the Performance ofAustralia's Vocational Educationand Training Sector in 1997
Vocational Education & Training Performance

EXECUTIVE SUMMARY 1
A Background 31. Introduction 42. Vocational Education and Training in Australia 73. The Economy and the Labour Market 12
B Key Performance Measures 214. Participation and Achievement in Vocational Education and Training 225. Employer Views on Vocational Education and Training 356. Student Outcomes from Vocational Education and Training 41
7. What Vocational Education and Training Provides for Particular Client Groups 488. Public Investment in Training Australians 58
C Additional Notes Appendix 639. Additional Notes 64
5

Executive Summary
'VOCATIONAL EDUCATION ANDTRAINING IN 1997
In 1997, vocational education and training (VET) inAustralia is a large and diverse activity, encompassing at
its widest scope all vocational education and trainingundertaken within institutions of training, enterprises,through online and flexible delivery pathways, andfunded both publicly and privately. This report focuseson the performance of VET providers in receipt ofpublic funds.
Participants in vocational education and training in1997 include young people seeking to acquire skillsto enter the labour market as well as adults pursuingnew career paths and workers seeking to upgrade theirexisting skills. Whilst participation levels in 1997 have
remained relatively stable since 1995, the number ofapprentices and trainees, collectively now known as'New Apprentices', continued to increase in 1997,
albeit most significantly in older age groups.
Employer satisfaction with the services provided by
vocational education and training providers remainshigh with approximately three quarters of surveyedemployers expressing satisfaction with the VET system,
although levels of satisfaction vary across different
industry types and sectors. Similarly, in 1997 anincreasing proportion of employers are in agreementthat the VET system is providing graduates with skills
appropriate to employers' needs.
In 1997, the employment outcomes of graduates fromvocational education and training remains positive withalmost three quarters of surveyed graduates advising
that they were in employment after completion of theirstudies. Furthermore, of those who were unemployed
prior to the commencement of their vocationaleducation and training program, almost half werein employment after graduation.
The participation, achievement and outcomes of equity
client groups continues to merit attention. Althoughsome positive results have been achieved, a continuingemphasis to improve outcomes for people from these
client groups is warranted.
The quality and comparability of performance datareported in 1997 continues to improve over previousyears. Time series comparisons are becomingincreasingly available and the report considers and
assesses such information where possible.
INTERPRETING KEY PERFORMANCEMEASURES
The measures considered in this report generally providesummary information only and are therefore often onlya starting point for further analysis at the State/Territorylevel. The reasons for any differences in performance
need to be considered at the local level and may relateas much to the essential characteristics and features ofa region or provider as they do to any other factor.
HIGHLIGHTS IN 1997
In 1997:
Almost 1.5 million students were participatingin vocational education and training programsdelivered through public funds combined withfee for service provision through public providers.Growth of 68,000 above 1996 levels has been
estimated.
More than three quarters of participants undertookvocational education and training through TAFEinstitutions, while growing proportions wereenrolled with other registered training organisations.
Total expenditure on vocational education andtraining in Australia is estimated to amount to morethan $8 billion with 45% being expended equallyby both governments and enterprises. Theremaining 10% was invested by individuals.
6

AREAS OF ACHIEVEMENTAREAS FOR IMPROVEMENTWhilst numbers in vocational education
and training continued to increase, nationalparticipation rates were maintained atapproximately 10%, and national passand completion rates also maintained.
The level of unmet demand for a place in vocationaleducation and training declined during 1997,representing 3.3% of all people who participated invocational education and training during 1997.78% of employers who responded to the 1997Employer Satisfaction Survey expressed satisfactionwith vocational education and training, while anincreasing proportion of employers (65%) believedthat the vocational
education and training sectorwas providing graduates with skills that wereappropriate to employers' needs.
Almost 50% ofTAFE graduates who respondedto the 1997 GraduateDestination Survey and wereunemployed prior to the commencement of their
vocational education and training program, werein employment after graduation.
75% of TAFE graduates who had nominateda vocational objective as the main reason forundertaking vocational education and trainingbelieved that the completion of their course hadwholly or partly helped them to achieve theirobjective.
The participation rates of indigenousAustraliansand people from a non-English speaking
background was equal to or above theirproportional representation in the generalcommunity.
The national unit cost ofgovernment fundedvocational education and training provision was$11.4, a reduction of $0.4 over 1996 levels.
The achievement of the Finn Target forparticipation and attainment of 19 year olds inpost-compulsory education and training is at riskif the current trend persists.
The participation of indigenous Australians invocational education and training is skewed towardlower level programs with 28% of all such peopleenrolled in programs below AQF Certificate III.
Women participating in vocational educationand training remain under represented in tradecertificate programs and dominate enrolmentsin non-award programs.
The participation, achievement and outcomes ofpeople with a disability remains markedly belowthat attained by other people.
While the cost per successfulmodule completionfrom all training
programs declined marginally in1997, the cost per successful module completionin government funded training only, increasedover 1996 levels.

Annual CCINation Report'
Background
a
Part
A

This report considers the performance of Australia's
vocational education and training sector in 1997. It wascommissioned by the Board of the Australian NationalTraining Authority (ANTA) through its PerformanceReview Committee. It is the third national performancemeasurement report on the vocational education andtraining sector. Time series trends in performance areconsidered where information is available.
As with government-involved services generally, the
vocational education and training sector, through itsagencies at State, Territory and Commonwealth levels,
has moved increasingly to improve performance and todemonstrate accountability through monitoring andreporting of performance against Key PerformanceMeasures. With some $2.9 billion' of public fundsbeing allocated by Commonwealth and State/Territorygovernments in 1997 specifically for vocational
education and training activities, the need forperformance measures is undisputed. Equally importantis the need to develop and apply performance measures
that contribute toward quality improvement activity inAustralia's vocational education and training system.The availability of consistent and comparable data tosupport the agreed performance measures is alsoconsidered of paramount importance.
The Ministerial Council responsible for vocationaleducation and training (MINCO) endorsed an initialset of key performance measures (KPMs) in 1994 thatincluded enrolments, training hours, completions andexpenditure. Measures of employer satisfaction and thedestinations of graduates were added to the initial set ofKPMs in 1995. Comprehensive improvements tovocational education and training statistics have
progressively been made to the point where the sectorcan now have considerable confidence in the quality ofthe base data used in this report.
Outputs measures remain the weakest aspect whenreporting the sector's performance. The sector has cometo rely on measures of hours of training as a proxy foroutputs, in the absence of proper measures. Thisapproach has always been problematic and reliance onthis method has become increasingly unsatisfactory withthe shift to more flexible and diverse pathways in thedelivery of vocational education and training. Morerecently, the sector has also relied on the module andmodule completion rate as a partial measure of outputs.
Against this background, in 1997, the PerformanceReview Committee was charged with the identificationof longer term key performance measures against agreed
national objectives for vocational education andtraining. In May 1997, Ministers for vocational
education and training gave in principle approval to aset of four objectives against which the PRC developeda set of seven key performance measures. Since this
time, a fifth objective has been added "Increasinginvestment in training". The Performance ReviewCommittee plans to review the key performancemeasures by the end of 1998 in the light of the agreedfifth objective.
The graphic on the facing page shows the five objectives
for vocational education and training, lists the seven keyperformance measures endorsed by Ministers, anddescribes those aspects of the vocational education andtraining system that they assess.
'ANTA Agreement Government Funds as reported in Directions and Resource Allocations for 1997, Table 5-4.Additional government funding of approximately $900m is not included in this figure as it represents specific purposefunding additionally committed by governments to support, for example, labour market and adult migrant programs.
9

-OBJECTIVES FOR VET.'
1. Enhancing mobility in thelabour market
2. Equipping Australians forthe world of work
3. Achieving equitableoutcomes in VET
4. Maximising the value ofpublic VET expenditure
5. Increasing investment intraining
KPMs FOR VET
. .
1. Skill outptits pfOdikcecVannually within the
; I dornainioffoihally.recognised.
2. Stocks of VET skillsagainst desired levels
3. Employers' views on therelevance of skills acquiredthrough VET
outcomes and prospectsbefore and afterparticipation in VET
5. VET participation, outputsand outcomes achieved byclient groups
6. (Actual) public expenditureper publicly funded output
7. (Actual) public expenditureper total recognised output
8.A Key PerformanceMeasure is to be developedagainst this objective
BEST COPY AVAIARLE 1 0
_
ILWHAT7THEYA EASURfiti
,
Contribution of VET Systeni,to Australia's skills pool andto labour mobilifY.
Size of Australia's VET skillspool and how well industryneeds and those of theeconomy are being met bythe VET system
Relevance of training inworkplace
Employment outcomes forstudents
How well the VET system isservicing particular groups inthe Australian community
Efficiency of public dollarusage to generate skill output
Extent to which public fundsleverage private investmentsin training

The move recommended by the PRC toward greater
emphasis on comprehensive measures of outputs andoutcomes from the vocational education and trainingsystem, rather than a continued emphasis on activityand inputs, has been embraced by the sector. The newkey performance measures will be used to monitoroverall progress of the agreed National Strategy for
Vocational Education and Training 1998-2003. Thenew measures also underpin the National TrainingFramework that is currently being implemented tostreamline the regulation of vocational education andtraining provision and delivery, encourage flexibility
and diversity, and increase the focus on quality assuringtraining outputs in terms of specified units ofcompetency and qualifications.
The suite of key performance measures are a mix of newand enhanced, existing measures. The new outputmeasures will require further work prior toimplementation, while the existing outcome measureswill be extended to improve data coverage. This report,therefore, is aligned as far as is possible with the
reporting requirements specified in the measures agreedby Ministers and the Performance Review Committee(eg. by including the views of employers; employmentoutcomes for students; and participation, outputs andoutcomes for equity groups), but also necessarilyincludes information on pre-existing measures wherenew measures have yet to be fully developed (eg. outputs
measures). Full reporting against the suite of newmeasures will be possible after the Year 2000, when
enhanced measurement methodologies will have beenfully implemented.
REPORT STRUCTURE
The report comprises three parts.
Part A considers the context of vocational educationand training in Australia and sets the scene formeasuring the performance of the sector.
Part B provides a detailed analysis of the key
performance measures themselves, namely:
participation and achievement in vocationaleducation and training
what employers think about vocational educationand training
what students get out of vocational educationand training
what vocational education and training provides forparticular client groups
the public investment in training Australians, interms of:
- unit costs
actual and planned student load, and
- annual hours curriculum per 1000 population.
Part C contains an appendix of technical notes anddetail on specific issues that arise in relation to the useof data and the application of calculations/adjustmentsnecessary to enhance the comparability and consistencyof data.
11

2. Vocational Education and Training in Australia
THE VOCATIONAL EDUCATION ANDTRAINING SECTOR
The composition of the vocational education and training
sector in Australia is considered in this part of thereport to provide a context for the information on keyperformance measures contained in the rest of the report.
This chapter describes the size and diversity of thevocational education and training sector in Australia,including annual expenditure on vocational educationand training; who provides funding for vocationaleducation and training; the diversity of providersdelivering vocational education and training; and thenumber of clients who participate, the time theyspend in training and at what level they enrol.
SIZE AND COMPOSITION OF THEVOCATIONAL EDUCATION ANDTRAINING SECTOR
The vocational education and training sector inAustralia is large and diverse, encompassing at its widest
scope all vocational education and training undertakenwithin institutions of training, enterprises, throughonline and flexible delivery pathways, and funded bothpublicly and privately.
An estimate of the size and composition of thevocational education and training sector is providedby analysing yearly revenue and expenditure data
of training provider groups.
Figure 2.1 identifies the relative contribution tovocational education and training activity in Australiaby funding source. Of the estimated $8 billionexpended annually on vocational education and trainingin Australia, governments and enterprise each
contribute 45%, while individuals invest the remaining10%. (For an explanation of the derivation of theseestimates, refer to the additional notes chapter).
Figure 2.2 shows the distribution of vocationaleducation and training expenditure in Australia byprovider type. Publicly funded institutions (includingTAFE, ACE and VET in schools) account for thelargest component of expenditure (49%).
The data in Figures 2.1 and 2.2 covers the entiretyof Australia's vocational education and training system
whereas the data in the remainder of this report isrestricted to the 1997 national vocational education andtraining provider data collection co-ordinated by theNational Centre for Vocational Education Research(NCVER). The scope of the 1997 national providercollection includes publicly funded and fee for serviceprovision in TAFE, other government institutions andcommunity providers, and publicly funded activitythrough private providers. Occasionally, and exclusively
in the final chapter, information is presented onpublicly funded vocational education and trainingthrough the ANTA Agreement, a joint commitmentof Commonwealth and State/Territory governmentsto provide funding specifically for vocational educationand training.
Figure 2.1: Who Pays for Vocational Educationand Training
Distribution by Government, Enterprises, Individuals, 1997
Individuals10% Government
45%
Enterprises45%
Source: Derived by ANTA using the Allen ConsultingGroup 1994 methodology and using most recentavailable data.

Figure 2.2: Who Delivers Vocational Education and Training
Distribution of Expenditure by Provider Type, (Per Cent)
Enterprises23%
Supplier, equipmentmanufacturer
13%
Publicly funded VET, includingTAFE, ACE and VET in schools
49%
Non-profit trainingorganisations 6%
Commercial trainingbusinesses 6%
II- Industry skill centres 2%
Commercial colleges 1%
Source: Derived by ANTA using the Allen Consulting Group 1994 methodology and using most recent available data.
DIVERSITY IN VOCATIONALEDUCATION AND TRAINING
Within the scope of the national provider datacollection, some 1.46 million clients undertookvocational education and training during 1997. Thiscompares with 1.35 million clients in 1996 and 1.28million clients in 1995, representing an increase ofapproximately 13% over two years. Growth in clientnumbers is due to both an expansion in the scope of thedata collection and also because of real growth
occurring in the sector. The NCVER has estimated thatreal growth in 1997 amounted to an additional 68,000clients (approx.) or growth of 4.9%.
Clients within the vocational education and trainingsector engage in a wide range of training experiences
within different types of providers, across various
disciplines or areas of learning, and at differing levels of
skill acquisition. The length of time that individualsspend in training also varies considerably.
Provider Diversity
Students participate in vocational education andtraining in different places depending on theircircumstances. Private provision of publicly fundedvocational education and training has increased inrecent years along with overall growth in the sector.
Figure 2.3 shows the distribution of clients in vocationaleducation and training by provider type in both 1996and 1997, and illustrates the growing proportion ofclients who are undertaking training with registeredtraining organisations other than TAFE andcommunity providers.
Figure 2.3: Distribution of Vocational Education and Training Students
by Provider Type, Australia, (Per Cent), 1996-1997
1996Community
providers 15%
Other registeredproviders 2%
TAFE/othergovernment
83%
Communityproviders 15%
Other registeredproviders 6%
1997*
TAFE/othergovernment
79%
*1997 data includes some private provider and school data not within the scope of the 1996 collection
Source: NCVER 1996/1997 national VET collection 13

Area of Learning
While the total amount of vocational education andtraining delivered annually has increased over the period
from 1995 to 1997, the pattern of distribution of activitybetween learning areas has remained relatively unchanged.
The variety of learning areas in which students undertook
training in 1997 is shown in Figure 2.4. Across all learning
areas, the three learning areas that accounted for mostactivity were administration and business (accountingfor 18% of all module annual hours undertaken in1997), social, educational and employment skills
(16%), and engineering, processing (15%).
Figure 2.4: Module Annual Hours
by Area of Learning by Sex, Australia, 1997
(000)
Males 0 Females
50000
45000
40000
35000
30000
25000
20000
15000
10000
5000
0
There has been little change in the proportions ofmale/female activity within areas of learning from 1995to 1997. Male students still predominate in theengineering, processing area of learning while female
students are highly represented in the administration,business, economics, law, and the social, educational
and employment skills areas of learning.
1 2 3
Area of learning
4 5 6 7 8 9 10 11 12 13
1 Humanities 6 Visual/Performing Arts 11 Agric., Renewable resources
2 Social Studies 7 Engineering, Processing 12 Hospitality, Tourism & Personal services
3 Education 8 Health Sciences 13 Social, Educational & Employment skills
4 Sciences 9 Admin., Business, Eco., Law
5 Mathematics, Computing 10 Built Environment
Source: NCVER 1997 national collection

Type of Training Program
Clients within vocational education and training
undertake programs in support of a variety of
occupational and career aspirations. Government only
funded training provision is well spread across all
occupation types as demonstrated in Figure 2.5. The
largest area of training provision in 1997, as in the
previous two years, was delivered at the 'professional/
para-professionaf level. Increases in activity at the
'operative/clerical' level have occurred over the two years
to 1997 while training at the 'trades' and 'general
education' levels has remained stable or reduced slightly.
Figure 2.5: Government Funded Curriculum Annual Hours
by Training Level, Australia, 1995 to 1997'
Prof/para-professional
ltades
Operative/clerical
General/unspecified 0 19970 1996
1995
0 5 10 15
Source: State/Territory Training Profiles and VET Plans
Time Spent in Training
The length and intensity of time that students spend
undertaking vocational education and training varies
depending on a variety of factors such as level of
qualification, mode of delivery and the individual's rate
of progress through a program. Approximately half of
all students spent 100 hours or less in training during
1997, while 63% of students undertook training of less
20Percent
25 30 35 40
than 200 hours duration. Just over 10% of students
spent 500 hours or more in training in 1997. The
pattern of time spent in training is virtually unchanged
over the period 1995 to 1997. Short training programswhich focus on the provision of specific, employment-
related skills, for both the employed and the
unemployed, are one of the distinguishing features of
the vocational education and training sector.
'The training level categories used in Figure 2.5 are based on occupational classifications.
15

Figure 2.6: Length of Vocational Education and Training Programs
Percentage Distribution by Duration, (Hours) 1997
25
20
15
10
5
0<10 10 to
1920 to49
Source: NCVER 1997 national VET collection
Vocational Education and Trainingin Schools
50 to
As a response to high youth unemployment rates,the need for skilled workers, and the need to expandpathways for senior students, Commonwealth, Stateand Territory governments are increasingly focusing
on vocational education and training in schools.
1997 represented the first year of a four year vocational
education and training initiative that the ANTAMinisterial Council approved in September 1996 whichagreed that $20 million of ANTA funds be allocatedeach year to vocational education and training in schools.
Data on vocational education and training in schoolsactivity is currently collected at the school level. There
99100 to
199200 to
499500 to . 1000+
999
are differences between school systems across States and
Territories as to the extent and nature of recognised VETin schools activity. Data on recognised VET in schoolsactivity is reported by some jurisdictions in the nationalVET collection, while others are not yet collecting orreporting data in a manner which is consistent with theAVETMIS Standard (that underpins the national VETcollection). Work is to be carried out to ensure that thereis consistency in the manner in which VET in schoolsdata is collected and reported in future years. In relationto the 1997 data reported in this publication, VET inschools activity is generally omitted.

3. The Economy and the Labour Market
The state of the economy and the labour market arecritical influences on the vocational education andtraining sector as the demand for skills acquired
through vocational education and training emanatesfrom labour market requirements. The principaleconomic and labour market influences that affectedthe vocational education and training sector in 1997are discussed in this chapter.
THE ECONOMIC OUTLOOK FOR SKILLREQUIREMENTS
The Australian economy grew on average by 3.6%during 1997. Domestic demand was the maincontributor to growth during 1997 with contributionsfrom business investment, private consumption spendingand dwellings. Population growth, an importantinfluence on economic activity, was about 1.2% during1996-97 with growth being associated mainly withnatural increase, but also from immigration.
Net exports recorded only marginal growth after aslowing of export growth during 1996 and 1997,particularly to countries in north-east Asia. Servicesnow account for 23% of the value of Australia's exportscompared with 20% in 1990-91. Manufactured goodsas a proportion of the value of exports, have risen
consistently and accounted for 19% of export value in1996-97 compared with 14% at the start of the decade.By enabling continuous improvement in the skills baseof the workforce, vocational education and training canassist Australia's competitive position internationally.
The impact of the economic outlook differs acrossindustry sectors and consequently also across States,
Territories and regions. Differences in growth rates
across jurisdictions arise because of differences in theprofile of industries within each jurisdiction (see Table9.1 in Part C), and also because of differences in
industry productivity growth, government economicpolicies, settlement patterns of immigrants, and inter-jurisdictional migration. The differential economicgrowth rates (measured as changes in gross
State/Territory product) and the population growthrates of States/Territories are provided in Figure 9.1 in
Part C. Notwithstanding the mobility of skills resultingfrom inter-jurisdictional migration, the differences inthe economic profiles of States and Territories translate:
into differences in the nature of training needs acrossAustralia. Such differences need to be considered whenmaking an assessment of the relative demands forvocational education and training within eachjurisdiction.
Output Growth Across Industry Sectors
Output growth in some industries has limitedemployment and vocational education and trainingimplications, while growth in other industries will have
profound repercussions. A breakdown of recent growthin Gross Domestic Product (GDP) by industry sector isprovided in Table 3.1. This table illustrates both thevariation in growth across industry sectors and thefluctuations that have occurred within particularindustries over time. Over the past five years, the'communication services' and 'wholesale trade'industries have demonstrated the strongest growth,while 'education' has displayed the slowest growth,declining by 2.2% during 1996-97.
Industries with high rates of output growth (whereworkforces are expanding or improving their
productivity) are likely to have elevated levels ofdemand for skills acquired through vocational educatioiand training. Moreover, industries with expanding
workforces employ greater numbers of new entrants totheir labour force with specific skill acquisition needs,while those industries seeking productivity
improvements often include 'up-skilling' of theirexisting workforce within their productivityimprovement strategies.
In addition, the demand for vocational education andtraining may also increase if more skilled people are
required to operate modern equipment, if industriesupgrade existing processes and/or products, or require anenhanced level of skills across their workforce generally.
117

Table 3.1: Average Annual GDP Growth Rates
By Industry, Average 1989-90 Prices, (Per Cent)
-
lb
.One year period
1995-96 to 1996-97
Agriculture, forestry & fishing 2.8 13.8
Mining 2.9 3.1
Manufacturing 2.3 1.1
Electricity, gas & water supply 1.7 1.5
Construction 3.9 3.9
Wholesale trade 6.2 2.4
Retail trade 2.7 0.9
Accom., cafes & restaurants 3.9 -1.9
Transport & storage 4.4 1.8
Communication services 11.4 11.8
Finance & insurance 2.6 1.9
Property & business services 3.0 4.1
Government admin. & defence 2.5 -0.2
Education 1.3 -2.2
Health & community services 2.5 0.6
Cultural & recreational services 3.4 2.5
Personal & other services 3.6 3.0
All industries 3.3 2.6
Source: ABS Economic Indicators, cat. no. 1350, Apri 1997
Employment Growth by Industry
Over the year 1995-96 to 1996-97 a large variation inlabour market conditions was observed across industries
as shown in the average annual employment growth
rates reported in Table 3.2.
While private sector service industries generally
expanded their employment base over the period,reductions in employment were recorded in publicsector related industries, including 'electricity, gas andwater supply', 'government administration and defence'and 'education'. Employment reductions in theseindustries were due, in part, to privatisation of somegovernment activities. The service sector continues todominate the employment market accounting for most
of the employment growth over the past 10 years andnow providing for 80% of total employments.
As the vocational education and training sectorpredominantly trains people for employment in theprivate sector, as well as for several occupations in the
public sen;ices sector, the observed shifts in employmenthave implications for the provision of vocationaleducation and training.
Absolute employment growth suggests an expandingneed for vocational education and training by industry.However, other industries which have high rates oflabour turnover, or which are adopting new technologyetc. may also have increased training needs.
3 Industry Brief, Department of Industry Science d Tourism, August 1997.

Table 3.2: Average Annual Employment Growth Rate
By Indushy, (Per Cent)
Average annual rate of growth forthe one year period1995-96 to 1996-97
(Per cent)
Agriculture, forestry & fishing 1.2
Mining 1.6
Manufacturing 1.7
Electricity, gas & water supply -17.5Construction -2.3Wholesale trade -1.3Retail trade 0.9Accom., cafes & restaurants 4.9Transport & storage 2.0Communication services 3.3Finance & insurance 0.4Property & business services 4.0Government admin. & defence -2.5Education -0.5Health & community services 1.9
Cultural & recreational services 2.6Personal & other services 0.8All industries 0.9
Source: ABS cat. no. 1350.0
A comparison of the distribution of job vacancies acrossindustries with the distribution of employment acrossindustries indicates which industries are offeringexpanding employment opportunities and, accordingly,are likely to increase demand for vocational educationand training services (see Figure 3.1). The demand forvocational education and training is complicated by thenature of job vacancies in each industry, which are amixture of both full and part-time and varying levelsof skill requirement.

Figure 3.1: Percentage Distribution of Employment and Job Vacancies
by Indusny, (Per Cent)
Retail trade
Manufacturing
Property & business services
Health & community services
Construction
Education
Wholesale trade
Accom., cafes & restaurants
Thansport & storage
Government admin. & defence
Finance & insurance
Personal & other services
Cultural & recreational services
Communication services
Electrical, gas & water supply
Mining
1 1 1 i
_I
I
I I I
...I I I
_
0Share ofJob Vacancies
i
I I
I
I
I
Share ofEmployment
_
_I
iNIIIIIII I
0 2 4 6 8 10
Percent12 14 16
*The Agriculture, Forestry and Fisheries industry has been excluded because this industry is not covered in the jobvacancies series.
Source: ABS cat no. 6203.0 and 6354.0
In May 1997, 'property and business services', 'healthand community services', 'finance and insurance','wholesale trade' and 'accommodation, cafes andrestaurants' industry sectors had a higher share of jobvacancies than employment, suggesting that these areexpanding relative to other industries. 'Property andbusiness services' accounted for the largest share of job
vacancies, followed by 'retail trade' and 'health andcommunity services'.
18
Government funded VET provision has progressivelybeen shifting into growth areas of the economy asoutlined in ANTA's Directions and Resource AllocationsReport series. For 1997, the largest single increase intraining provision was planned to occur in the Servicessector (41.6% of total growth in annual hourscurriculum and 29.8% of the growth in enrolments).'Community Services, Health and Education' and'Tourism and Hospitality' continued to record thelargest increases in activity.

Employment Growth by Occupation
Employment share by occupational grouping in May1997, is shown in Figure 3.2. The largest occupationalcategories in the economy are 'professionals',
'intermediate clerical, sales and service workers' and
4tradespersons and related workers'. Government fundedtraining in 1997 (measured by curriculum annualhours) was consistent with this distribution ofoccupational employment (see Figure 2.5).
Figure 3.2: Occupational Employment Share
by Occupational Grouping, Australia, 1997
Advanced Clerical & Service Workers
Managers & Administrators
Intermediate Production& Itansport Workers
Labourers & Related Workers
Elementary Clerical, Sales& Service Workers
Associate Professionals
Tradespersons & Related Workers
Intermediate Clerical, Sales& Service Workers
Professionals
The Skilled Vacancy Index' provides an indication oflikely occupational expansion or contraction, and theconsequent possible increase or decrease in demand forvocational education and training. Over the yearJanuary 1997 to January 1998, the Skilled VacancySurvey Index rose by over 16 percentage points. The
`professionals' group increased by over 15%, `para-professionals' by 4.5% and `tradespersons' by 23.4%.
0 200 400 600
Source: ABS Labour Force, May 1997, cat. no. 6203.0
WHAT IS THE STATE OF THE LABOURMARKET?
Supply factors
For much of 1997, the national unemployment ratefluctuated around 8.5%, consistent with rates of thepast two years, and labour force participation was
declining marginally, reflecting a slight weakening in thedemand for labour. Between June 1996 and June 1997,the labour force participation rate of working age malesdeclined from 83.4% to 82.8%, while the labour forceparticipation rate for working age females declined onlymarginally from 64% to 63.8%.
800 1000(000s)
1200 1400 1600
Part-time and Casual Employment
Aggregate industry and occupation vacancy andemployment statistics should be considered alongside
the underlying structural changes taking place in thelabour market that bear upon the vocational educationand training system. In recent years there has been ashift in the mix of employment towards both part-timeand casual employment with females comprisingapproximately three-quarters of part-time employees.These structural changes are of some significance for thevocational education and training sector becauseemployers tend to undertake less training of part-timeand casual employees compared with permanentemployees'. Table 3.3 reports the shifts in full/part-timeemployment patterns and employment growth ratesobserved across industries since 1992.
Skilled Vacancy Survey, Department of Employment, Education, Training and Youth Affairs, January 1998.5 Employer Training Expenditure Australia, July to September 1996, AB$nno 6353.0.
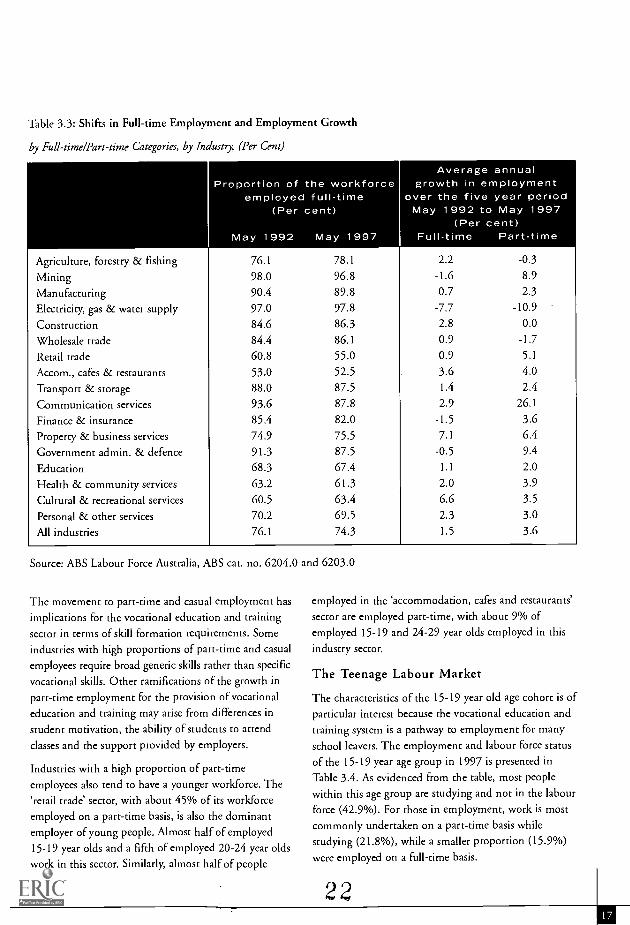
Table 3.3: Shifts in Full-time Employment and Employment Growth
by Full-time/Part-time Categories, by Industry, (Per Cent)
Agriculture, forestry & fishing 76.1 78.1 2.2 -0.3
Mining 98.0 96.8 -1.6 8.9
Manufacturing 90.4 89.8 0.7 2.3
Electricity, gas & water supply 97.0 97.8 -7.7 -10.9
Construction 84.6 86.3 2.8 0.0
Wholesale trade 84.4 86.1 0.9 -1.7
Retail trade 60.8 55.0 0.9 5.1
Accom., cafes & restaurants 53.0 52.5 3.6 4.0
Transport & storage 88.0 87.5 1.4 2.4
Communication services 93.6 87.8 2.9 26.1
Finance & insurance 85.4 82.0 -1.5 3.6
Property & business services 74.9 75.5 7.1 6.4
Government admin. & defence 91.3 87.5 -0.5 9.4
Education 68.3 67.4 1.1 2.0
Health & community services 63.2 61.3 2.0 3.9
Cultural & recreational services 60.5 63.4 6.6 3.5
Personal & other services 70.2 69.5 2.3 3.0
All industries 76.1 74.3 1.5 3.6
Source: ABS Labour Force Australia, ABS cat. no. 6204.0 and 6203.0
The movement to part-time and casual employment hasimplications for the vocational education and trainingsector in terms of skill formation requirements. Someindustries with high proportions of part-time and casualemployees require broad generic skills rather than specific
vocational skills. Other ramifications of the growth inpart-time employment for the provision of vocationaleducation and training may arise from differences instudent motivation, the ability of students to attendclasses and the support provided by employers.
Industries with a high proportion of part-timeemployees also tend to have a younger workforce. The
'retail trade' sector, with about 45% of its workforceemployed on a part-time basis, is also the dominantemployer of young people. Almost half of employed
15-19 year olds and a fifth of employed 20-24 year oldswork in this sector. Similarly, almost half of people
employed in the 'accommodation, cafes and restaurants'sector are employed part-time, with about 9% ofemployed 15-19 and 24-29 year olds employed in this
industry sector.
The Teenage Labour Market
The characteristics of the 15-19 year old age cohort is ofparticular interest because the vocational education andtraining system is a pathway to employment for manyschool leavers. The employment and labour force statusof the 15-19 year age group in 1997 is presented inTable 3.4. As evidenced from the table, most peoplewithin this age group are studying and not in the labourforce (42.9%). For those in employment, work is mostcommonly undertaken on a part-time basis whilestudying (21.8%), while a smaller proportion (15.9%)were employed on a full-time basis.
22

Table 3.4: Labour Force Status of 15-19 Year Olds
Per Cent of Popuhition, August 1997
UnemployedNon- Student Full-time
student
EmployedPart-time
non-student
Not in labour Force TotalPart-time Non- StudentStudent student
Males 6.4 4.3 20.1 4.3 17.8 3.3 43.8 100.0Females 4.7 5.2 11.5 6.3 25.9 4.4 42.0 100.0Persons 5.6 4.7 15.9 5.3 21.8 3.8 42.9 100.0
Source: ABS cat. no 6203.0, August 1997
Much of the employment undertaken by teenagers isalso of a transitional nature which has implications forskill formation in particular industries, most notably theretail industry, where a significant proportion of studentteenagers are employed part-time.
Young people's participation and attainment patterns invocational education and training during 1997 arediscussed in chapter 4 of this Report.
Age Profile of the Australian Workforce
The aging of the workforce has implications formaintaining skill levels in the workforce. The demand
for vocational education and training will change as theproportion of people in younger age groups with up-to-date skills increases over time, relative to older workers
whose skills may have become outmoded or redundant.
The vocational education and training sector needs to
be flexible to encourage lifelong learning and to allow
older workers the opportunity to upgrade skills. In thisrespect, an analysis of the age profile of VET clients in
1997 shows a peak of students aged 15 to 24 who arepredominantly undertaking entry level programs. Thereis also a cluster of people aged between 30 and 45 who
undertake retraining within VET. It is significant tonote that of the VET clients who report their labourforce status during enrolment, 66.2% were employed.
The age profile of the Australian workforce by industryis shown in Table 3.5. In May 1997, about 30% of theAustralian workforce was over 45 years of age with the'agriculture, forestry and fishing', 'electricity, gas and
water supply', 'transport and storage' and 'education'industries having more than a third of their respectiveworkforces in this age cohort.
23

Table 3.5: Age Profile of the Australian Workforce
Aged 15-64 Years, by Industry Sector, 1997
Agriculture, forestry & fishingMiningManufacturingElectricity, gas & water supplyConstructionWholesale tradeRetail tradeAccom., cafes & restaurantsTransport & storageCommunication servicesFinance & insuranceProperty & business servicesGovernment admin. & defenceEducationHealth & community servicesCultural & recreational servicesPersonal & other servicesAll industries
Age in Years (per cent)15-19 20-24 25-34 35-44 45-54 over 55 Total
4.92.94.20.64.43.7
23.912.6
1.91.92.13.91.71.82.28.56.76.9
6.97.9
11.45.3
11.013.216.020.8
7.79.0
13.911.57.06.48.8
16.411.711.6
17.430.627.725.228.027.519.923.425.627.536.826.727.120.223.430.729.525.9
23.927.326.934.127.525.917.721.126.128.726.325.830.533.031.022.025.425.8
22.322.220.227.421.220.316.115.426.027.516.221.524.829.024.614.516.320.9
24.59.19.67.68.09.46.46.8
12.75.54.7
10.78.99.59.98.0
10.49.6
100.0100.0100.0100.0100.0100.0100.0100.0100.0100.0100.0100.0100.0100.0100.0100.0100.0100.0
Source: ABS Labour Force Australia, ABS cat. no. 6203.0, May 1997
Qualification profile and internationalcomparisons
The qualification profile of the Australian workforce
as at May 1997, is shown in Figure 3.3. More than30% of the workforce held a vocational educationand training qualification while at least 20% in eachindustry held these qualifications. Half of all employees
in the 'construction' and 'electricity, gas and water
supply' industries hold a vocational education and
training qualification.
It is generally recognised that improved rates ofparticipation and attainment in vocational educationand training, in keeping with our internationalcompetitors, can potentially contribute to increasingAustralia's economic competitiveness.
Figure 3.3: Highest Educational Attainment of the Australian Workforce
by Industry, May 1997, (Per Cent)VET 0 Higher Education 0 No Post School Qualifications
ConstructionElectricity, gas & water supply
MiningPersonal & other services
ManufacturingWholesale trade
Health & community servicesTransport & storage
Property & business servicesCommunication services
Cultural & recreational servicesAccom., cafes & restaurants
Government admin. & defenceAgriculture, forestry & fishing
EducationRetail trade
Finance & insuranceAll industries
1==
0 20 40 60Percent
Source: ABS 1997, Transition from Education OWark Australia, May 1997, cat no. 6227.0
80 100
2 4

International comparative data on the 'highesteducational attainment of the labour force aged 25-64'is provided in Table 3.6. Notwithstanding differences indata definitions and collection methods that makecross-country comparisons problematic, the datapresented in Table 3.6 suggests that there may be a gap
Table 3.6: Highest Completed Level of Education: I
percentage of the Labour Force aged 25-64, 1997
between the current Australian skill base and the skillbase of overseas countries. The proportion of theworkforce with a post-compulsory school qualificationis considerably higher in countries such as France
(75%), Germany (88 %), Denmark (67%) and theNetherlands (70%) than Australia (59%).
nternational Comparisons
Country Less than UpperSecondary
Non-universitytertiary
education
University-level education
Total Post-Compulsory
School
Total
UpperSecondary
Australia 42 31 12 16 59 100Canada 19 29 32 19 80 100US 11 52 9 28 89 100NZ 36 37 16 12 65 100Denmark 33 44 7 16 67 100Finland 30 47 10 13 70 100France 25 54 9 12 75 100Germany 12 62 11 15 88 100Italy 56 33 11 44 100Netherlands 31 43 a 27 70 100Portugal 76 10 4 9 23 100Sweden 24 47 14 15 76 100UK 19 57 10 14 81 100Czech Republic 12 76 12 88 100Norway 15 53 12 20 85 100Switzerland 15 61 14 10 85 100Country mean' 35 42 10 15 67 100
a Data not applicable because the category does not apply.b the Country mean includes the following countries that are not reported in table:Korea, Austria, Belgium, Greece, Ireland, Luxembourg, Spain, Poland and Turkeyc Data included in another column of the table.d Includes vocational equivalents, such as apprenticeships and traineeships.
Source: Education at a Glance, OECD Indicators, 1997, table A2.4, p.42
To address the question of what is the desired level ofvocational education and training skills in Australia, anew key performance measure has been agreed: KPM 2
Stocks of vocational education and training skills against
desired levels. This key performance measure is designed
to be an analytical and diagnostic tool. The KPM willhelp determine the extent to which the vocationaleducation and training system is increasing Australia's
skills pool in ways relevant to Australian industry and
with respect to the development of the economy overallFurther work, in consultation with States/Territories,the Commonwealth and industry, is still required todevelop the methodology for measuring and reportingagainst KPM 2. The analytic work is to focus onexpressed Australian industry demand for VET skills aswell as the imputed demand to achieve internationallycompetitive VET skills.
25

AnnualnNationaq{J
1/Reporzt
Key PerformanceMeasures
26

4. Participation and Achievement in VET
This chapter discusses overall participation andachievement levels in vocational education and training
during 1997. Participation and outputs are investigatednationally, by jurisdiction and by age and sex and arecompared with final data reported in 1995 and 1996.Levels of unmet demand for vocational education andtraining, compared with higher education, are alsoinvestigated.
This chapter also contains updated data on progresstoward the Finn targets, which are those post-compulsory education and training participation andattainment targets for 19 and 22 year olds that wereestablished by the Finn Committee for achievement by2001. Participation by young people in vocationaleducation and training, relative to participation in theother main education sectors (schools and highereducation) is also considered.
The information provided in this chapter providesindicative information for the key performance measure,KPM 1- Skill outputs produced annually within the
domain of formally recognised vocational education and
training. This KPM is still being developed and isexpected to be reported in full for the first time for theyear 2000 in 2001.
The measure of annual outputs (KPM 1) has beenidentified as the most fundamental within the newsuite of KPMs. The amount of skills acquired each
year through participation in the VET system is a keymeasure of it's performance. Once fully developed,
KPM 1 will be measured primarily in terms of theamount of assessed and successfully completed unitsof competency and qualifications acquired within theNational Training Framework. Remaining modules
completed outside the domain of formally recognisedvocational education and training, but consideredfundamental to the sector, will also be reported.
WHAT ARE OVERALL PARTICIPATIONRATES IN 1997 AND HOW DO THEYCOMPARE WITH PRIOR YEARS?
Overall participation rates in vocational education andtraining delivered by providers covered by the 1997national data collection are shown in Table 4.1. Thisinformation is tabulated by jurisdiction and comparedwith data for 1995 and 1996. To enable meaningfulcomparisons, the 1997 data has been adjusted to thesame scope and boundary that applied to the earlieryears' data. Also shown in Table 4.1 is the unadjusted
overall participation rate for 1997 which is based on thecurrent scope of the collection.
Table 4.1: VET Participation Rates
By State/Territory, 15 to 64 year olds, 1995 to 1997, (Per Cent), adjusted scope and boundary
1995
1996'
1997'
By State/Territory, 15 to 64 year olds, 1997, (Per Cent), 1997 scope and boundary
19972 10.4 12.4 7.0 11.0 8.2 7.7 9.9 7.0 10.0
1996 and 1997 data adjusted to the same scope and boundary as 1995 data. 1996 data has been updated to includefinal SENA and activity data that was not available prior to publication of the 1996 Report.
21997 data not adjusted to the same scope and boundary as 1995 data.
Derived using NCVER data with 1996 and 1997 data further adjusted to the same scope and boundary for 1995data, and ABS Estimated Resident Population data.
27

Within the current scope and boundary of the nationaldata collection, the national figure for participation invocational education and training during 1997 was
10.0%. Time series analysis from 1995 to 1997 (usingdata that has been adjusted to the same scope andboundary) indicates that overall participation levels haveremained relatively stable at just below 10%. Over theperiod since 1995, significant population growth hasoccurred in a number of jurisdictions. Therefore,although the number of people participating invocational education and training has increasedsubstantially, participation rates have remained stable.
More detailed 1997 participation data by age, sex andState/Territory are provided in Part C.
UNMET STUDENT DEMAND FORVOCATIONAL EDUCATION ANDTRAINING
Demand for vocational education and training can beconsidered from a number of perspectives. Industrydemand for vocational education and training considersthe provision of trained people who have the necessary
workskills required by employers, while student demand
assesses the desired needs of individuals for vocationaleducation and training. This section discusses studentdemand for vocational education and training.
An analysis of the ABS survey, Transition from
Education to Work reveals that of the 2.4 millionpeople who applied for entry into a post-schooleducation and training program in 1997, about 75,000(3.1%) were unable to gain a place. Although it isrecognised that an analysis of unmet student demand isconceptually and methodologically complex, the resultsfrom this survey provide a reasonable indication of thelevel of unmet demand.
Table 4.2 reports unmet demand in Australia for allpost-school education and training programs over theperiod 1995 to 1997. Although the level of unmet demand
for vocational education and training has declined inrecent years, more than 48,000 people unsuccessfullyapplied for entry into vocational education and trainingduring 1997, representing 3.3% of all people whoengaged in such training during the period. This figureincludes a relatively small number of unsuccessful
applicants who did not meet entry requirements.
Table 4.2: Unmet Demand for Post-School Education and Training
By Provider sector, 1995-97 (Persons)
TAFE 60,700 48,300 35,300Other Vocational Education and Training* 13,600 13,800 12,800
Total Vocational Education and Training 74,300 62,100 48,100Higher Education 28,700 25,300 18,300
Other Education Institutions 13,700 19,000 8,700
Total 116,700 106,400 75,100
Source: ABS Survey - Transition for Education to Work Australia (cat. no. 6227.0)
Note: All figures have been rounded.
* includes persons wishing to enrol in a program which does not (of itself) result in a recognised qualification.Vocational education and training enrolments are on a module/unit of competency basis and many students enrolonly in the programs they need to enhance their skill levels.

WHAT IS A SUCCESSFUL OUTPUTFROM VOCATIONAL EDUCATIONAND TRAINING?
Successful outputs from the vocational education andtraining sector can be measured at a number of levels.In 1997, Ministers responsible for vocational educationand training endorsed three output measures for thesector, namely:
units of competency,
qualifications, and
modules outside of recognised training whichinclude for example, general education andpreparatory programs.
(For a definition of these output measures, refer to Part C).
Historically, the sector has reported on outputs at themodule level. With the introduction of the NationalTraining Framework and the associated developmentof national Training Packages, the sector will shift
progressively to measuring outputs in terms of unitsof competencies and qualifications acquired within theAustralian Qualifications Framework (AQF). Remainingmodules outside the domain of formally recognisedvocational education and training, but consideredfundamental to training, will also be reported (eg.general education and preparation programs). The sizeof this provision is expected to reduce over time asexisting provision is mapped against competencies andqualifications within the AQF wherever feasible. Ofcourse, modules will continue to provide a valuablestructural framework for the delivery of vocationaleducation and training programs.
In addition to these three outputs, a VET Skills Index isproposed to be reported that involves the aggregation ofall units of competence, appropriately weighted, to provide
a full count of primary vocational education andtraining outputs because not all units of competencerepresent the same level of skill or intensity of training.
Data that is compliant with, and able to report outputsunder the emerging new arrangements will not be
collected until 1999. This data can only be collectedaccording to the rate at which Training Packages are
developed, endorsed and implemented. Full reportingis anticipated from 2000 with data quality continuingto improve beyond this year.
For 1997, modules and the module load completionrate continue to be the key indicator of outputs andoutputs achievement. The latter measure examines thehours that lead to a satisfactory completion or output asa proportion of total hours.
WHAT ARE THE MODULE OUTCOMESIN 1997?
Module level enrolment data covers both full course/qualifications related activity and modules only activityin which people enrol to gain the immediate, specificskills they require. A full breakdown of 1997 modulehours and enrolments for each State and Territoryappears in the additional notes section for this chapterin Part C. Summary information is provided below.
Using module enrolment information it is possible todetermine an indicator of successful achievement of
competencies. In 1997:
61.6% of module enrolments delivered a successfulachievement of competencies
10.8% of module enrolments did not deliverachievement of competencies
19.8% of module enrolments were incomplete orto be continued.
By comparison, the level of successful achievement ofcompetencies in 1996 was 61.5%.
Table 4.3 provides a State/Territory breakdown by themodule outcomes associated with competenciesacquired. It should be noted however that there aresome jurisdictional variations in the reporting ofmodule outcomes, but that these do not materiallyaffect the results reported here. (See Part C for adiscussion on the mapping of module outcomes toskills acquisition).
29

Table 4.3: Module Enrolments Outcomes by Skills Acquired
by State/Territory, 1997 (Per cent)
NSW VIC QLD SA WA TAS NT ACT AUS
Competencies Achieved* 63.0 60.6 56.6 72.2 59.5 63.0 53.9 66.5 61.6
Competencies Not Achieved 15.0 12.3 3.6 5.5 4.9 11.3 15.6 16.6 10.8
Competencies Not Yet Achieved 14.9 20.8 23.6 16.6 31.4 20.6 30.3 15.5 19.8
Not Known 7.0 6.3 16.2 5.7 4.3 5.1 0.3 1.5 7.8
*Includes students who were assessed as competent as well as those who successfully completed class hours.
In many cases a successful completion of a module will
mean that the student has been tested (assessed) and hasbeen deemed competent against the industry standardsset for the module. However, in a range of areas,particularly language/literacy, preparatory studies and
creative studies, different considerations can apply. In such
programs, a successful outcome cannot necessarily be
readily measured in terms of examination pass rates orother approaches of this type. Against this background,this report provides two sets of statistics on module loadcompletions, namely, pass rates and completion rates.
Table 4.4: Vocational Education and Training Pass Rates
By State/Territory, by Sex, 1997 (Per Cent)
WHAT WERE PASS RATES FOR 1997?
The pass rate in Table 4.4 below is for assessed students
whose attendance was confirmed. This means that thestudents who passed the assessment are compared withall those who got a pass or a fail. Students whowithdrew from the unit without having a failurerecorded are excluded from the calculation. (See Part Cfor a full definition of the module load pass rate).
NSW VIC QLD SA WA TAS NT ACT AUS
Females 78.2 83.7 91.6 93.0 92.1 84.7 76.3 76.0 83.6Males 77.5 79.8 92.8 90.6 91.3 80.7 74.4 74.0 82.3
All persons 77.9 81.6 92.3 91.7 91.6 82.5 75.2 75.0 82.9
WHAT WERE COMPLETION RATESFOR 1997?
The completion rate compares students who completeda module, regardless of whether or not they undertook a
final assessment, with all students who commenced theunit and are no longer studying that unit.
Table 4.5: Vocational Education and Training Completion Rates
By State/Territory, by Sex, 1997 (Per Cent)
0
Females 80.8 81.4 83.3 91.6 88.1 89.0 78.7 81.0 82.7Males 80.4 79.7 83.8 89.8 89.0 87.6 77.9 80.1 82.1
All persons 80.6 80.5 83.6 90.6 88.6 88.3 78.2 80.6 82.4
(See Part C for a full definition of the module load corhpletion rate).

WHAT'S HAPPENED IN RECENT YEARS?
Module pass and completion rates in the years 1995 to1997 are reported below in Tables 4.6 and 4.7, respectively.
Over the period since 1996, national pass andcompletion rates achieved by students in vocationaleducation and training have remained relatively stable,while some variation has been observed across Statesand Territories.
Table 4.6: Pass Rates Comparisons
by State/Territory, 1995-97 (Per Cent)
The methodology for determining the completion ratespresented in this report has been revised from previousyears and applied to the rates reported for both 1996 and1997. Additionally, pass and completion rates in 1995are not comparable with later years due to a differingmethodology that was applied at this time. The datafor 1995 has, however, been included for completeness.
NSW VIC QLD SA WA TAS NT ACT AUS
1995 (Final) 80.1 84.3 81.1 93.9 85.0 80.7 83.4 75.1 82.61996 (Final) 78.9 80.0 88.6 91.7 90.3 81.8 83.1 75.0 82.21997 (Final) 77.9 81.6 92.3 91.7 91.6 82.5 75.2 75.0 82.9Variation 1996 to 1997 -1.1 +1.6 +3.7 0.0 +1.4 +0.7 -7.9 0.0 +0.7
The methodology for determining the completion rateshas been revised in 1997 and applied to completionrates reported in both 1996 and 1997. Completionrates in 1995 are not comparable with later years dueto a differing data adjustment methodology that was
Table 4.7: Completion Rates Comparisons
by State/Territory, 1995-97 (Per Cent)
applied at this time. The data for 1995 has, however,been included for completeness.
As can be seen in Table 4.7, national modulecompletion rates are similar in both 1996 and 1997,having declined 0.3% over the period.
NSW VIC QLD SA WA TAS NT ACT AUS
1995 (Final) 79.5 80.5 86.1 90.1 83.2 77.9 72.6 73.7 81.51996 (Final) 81.4 80.1 83.8 92.0 87.7 85.3 78.1 81.1 82.71997 (Final) 80.6 80.5 83.6 90.6 88.6 88.3 78.2 80.6 82.4Variation 1996 to 1997 -0.8 +0.4 -0.2 -1.4 +0.9 +3.0 +0.2 -0.6 -0.3
Note: 1995 completion rate adjustments have been applied on a different basis from 1996 and 1997 and aretherefore not directly comparable with more recent years. The 1996 completion rate differs from those published inthe 1996 Report due to the revised methodology applied in this year's Report.
OTHER SUCCESSFUL OUTPUTSRECOGNITION OF PRIOR LEARNINGFROM 1995 TO 1997
The recognition of prior learning (RPL) is accepted andencouraged as an appropriate pathway to obtaining asuccessful output from vocational education and
training activity. Table 4.8 reports module activity forRPL as a percentage of enrolments and curriculum hours.

Table 4.8: Percentage of Enrolments and Hours Associated with RPL
by State/Territory, 1995-1997, (Per cent)
NSW VIC QLD SA WA
1997
TAS NT ACT AUS
Enrolments
Hours
2.7
2.5
2.6
2.2
0.4
0.3
5.5
4.8
0.4
0.4
4.2
4.1
1.3
1.3
7.3
5.7
2.4
2.1
1996
Enrolments
Hours
2.5
2.3
1.9
1.6
na
na
3.6
3.3
0.6
0.7
4.0
3.6
0.8
0.9
9.9
8.9
2.4
2.2
1995
Enrolments
Hours
2.3
2.1
1.6
1.4
na
na
1.8
1.7
0.5
0.5
2.2
2.2
0.50.5
7.77.5
1.9
1.8
Comparable data for Queensland for the years 1996 and 1995 is not available.
Although the proportion of training hours associatedwith the recognition of prior learning (RPL) has onlygrown marginally since 1995, Table 4.9 (below) shows
Table 4.9: Annual Hours Curriculum Associated with RPL
by State/Territory,.1995-1997, ( '000 AHC)
that the actual number of RPL hours has increased overthe period.
NSW VIC QLD SA WA TAS NT ACT AUS
1997 2,561 1,933 159 901 99 283 44 334 6,314
1996 2,340 1,337 na 533 174 208 32 502 6,094
1995 2,056 1,062 na 261 124 112 16 405 4,787
Comparable data for Queensland for the years 1996 and 1995 is not available.
An explanation of these figures is provided in the additional notes (Part C).

ARE MORE YOUNG PEOPLEPARTICIPATING IN TRAINING?
In 1991, Ministers set targets for the participation ofyoung people in post-compulsory education andtraining which became known as the Finn targets afterBrian Finn AO, the Chair of the Committee that
produced the report. The technical definitions of theFinn targets are described below. The methodology for
monitoring progress towards achievement of the targets,adopted by MCEETYA in May 1995, is shown below.
Target One: By 2001, 95 per cent of 19 year olds:
are participating in Year 12; or
have completed Year 12; or
have completed Years 10 or II and are participating in some formally recognised education
and training; or
have completed Year 10 or 11 and have completed some formally recognised education and training.
Target Two: By 2001, 60 per cent of 22 year olds:
are participating in education and training programs which lead to level 3 awards; or
have attained level 3 Qualifications; or
have attained above level 3 Qualifications; or
are participating in, or have completed higher education studies such as degrees and diplomas.
Historical longitudinal participation data for 19 and 22year olds from 1990 to 1997 are provided in Figure 4.1.
Figure 4.1: Participation and Attainment in Post-Compulsory Education and Training
People aged 19 and 22, Finn Targets, 1990-97 (Per cent)
100
90
80
70
a)60
cf.
50
40
30
0 Age 19 A. Age 22
....................................................................
............... ................................
-4111-Age 19Target
IrAge 22Target
..............................
1990 1991 1992 1993 1994 1995 1996 1997 1998 1999 2000 2001
Source: Derived using data from the annual ABS Transition from Education to Work surveys.

Figure 4.1 shows that participation and attainment for22 year olds is increasing in line with the Finn targets
indicated by the arrow on the right-hand side of thefigure. Figure 4.1 also indicates that if the currentparticipation and attainment trends for 19 year oldscontinues, the achievement of the Finn target for thisage cohort by 2001, will be at risk. As can be seenfrom the figure, an extrapolation of the time seriesparticipation and attainment trend for 19 year olds doesnot meet the Finn target by 2001. The reduced retention
rate of students through to the completion of Year 12,observed since 1993, has contributed to this trend.
Figure 4.2 shows that for the 15 to 24 year old agecohort, males participate in vocational education andtraining at greater rates than females. At age 18 years,males are participating at the rate of 32% compared with25% of females. By the age of 24 years, participation forboth females and males dropped to below 15%.
Figure 4.2: Vocational Education and Training Participation
by Sex, aged 15 to 24, 1997 (Per cent)
35
30
25
20
15
10
6 Males
0
15
Females
16 17 18 19
Age (years)
20 21 22 23
Source: Derived using NCVER data for clients and ABS 1997 June Quarter Estimated Resident Population data
24

WHAT IS YOUNG PEOPLE'SPARTICIPATION IN VET RELATIVE TOOTHER EDUCATION SECTORS?
In relation to the 16 to 24 year old cohort, the schoolssector clearly accounts for the majority of personsparticipating in education up to and including the ageof 17 years. From age 18 to 24 years, there is a steadyincrease in the percentage not participating in educationfrom around 32% to around 78%.
Figure 4.3: Participation in Education and Training
By Sector, Aged 16 to 24, Australia, 1997
100
80
60ID
2
40
20
0
School" a VET a Higher Education 0 Not participating
From ages 17 to 22 years, participation in both thevocational education and training sector and the highereducation sector is similar. Participation in vocational
education and training exceeds higher educationparticipation for those at the extremes of the agerange cohort.
16 17 18 19 20Age (years)
21 22 23 24
Sources: ABS 1997 June Quarter Estimated Resident Population data, ABS Schools Australia, DEETYA SelectedHigher Education Student Statistics 1997, NCVER 1997 national collection (unpublished data)
*Higher Education 16 year old cohort also includes those aged under 16 years
**Schools 20 year old cohort also includes those aged over 20 years

WHAT ARE YOUNG PEOPLE SEEKINGTO ATTAIN?
Young people in vocational education and training areengaged in a variety of training programs. Within AQFprograms, young people are enrolled in the largestnumbers in programs at AQF level III. The increase inenrolments at AQF levels I and II is partially due tothere being no easily identifiable pre-existing programs
at this level.
Figure 4.4: Vocational Education and Training Enrolments
by Qualification Level, aged 15 to 24, 1995-1997 (Per cent)
1995 0 1996 0 1997
40
30
12'20
a)0.
10
0
'Other Certificates, Endorsements and Others' mayinclude some enrolments in courses equivalent to AQFlevels I and II thus the decline in this group may bebalanced out by the increase in enrolments in courses atAQF levels I and II. Young people are also participatingin relatively large numbers in sub-qualification programs
(ie. Statements of attainment and non-award courses).
Id2
Qualification Category
3
I Diplomas 5
2 AQF Certificate IV and equivalent 6
3 AQF Certificate III and equivalent 7
4 AQF Certificates I & II 8
4 5 6 7
Senior SecondaryOther Certificates, Endorsements and OthersStatements of attainmentNon award courses
VET clients enrolled in more than one course are counted more than once.Note: See Part C for the recoding of AVETMISS qualification codes into the above groups.
Recent developments in the vocational education andtraining sector have encouraged increased flexibility and
led to the enhanced availability of a wider range ofpathways through which vocational education andtraining can be undertaken. For example, theintroduction of vocational education and training into
8
the schools sector together with the recent introductionof the New Apprenticeships initiative is changing thepattern of participation of young people in vocationaleducation and training.

APPRENTICE AND TRAINEE TRAINING
Increasing interest has been placed on the progressiveimplementation of New Apprenticeships agreed to byMinisters in 1996. The apprenticeship and traineeshipsystem has recently been reformed to introduceflexibility and thereby encourage employers to offer
more jobs to young people. The historical distinctionbetween apprentices and trainees is no longer relevant.Information on apprentices and trainees will beprovided separately for the last time in this reportbecause separate data on apprentices and trainees willnot be collected from 1998. The new trainingarrangements (covering both apprentices and trainees)are collectively known as New Apprenticeships. The
arrangements provide new flexibility that includes:
school-based apprenticeships and traineeships
modernised training in traditional areas
new quality training opportunities in growth industries
such as information technology and multi media
new one-stop shop support services
user choice (clients can select their own trainingprovider and negotiate with providers on specificaspects of training)
varied duration for apprenticeships and traineeships
varied proportion of training and productive time
access to part-time arrangements.
Figure 4.5: Contracts of Training, 1995-1997, Australia
200000
160000
120000
80000
40000
0
Apprentices 0 Unknown 0 Ti'ainees
Once in a New Apprenticeship, trainees and apprenticesare covered by formal agreements with an employer,
known as either 'Training Agreements' or 'Contracts ofTraining', which outline the training, support andsupervision an employer will provide. Contracts oftraining data includes school based NewApprenticeships. The reforms to entry level training thathave been underway since 1996 are reflected in thetrends observed in the numbers of apprentices andtrainees. As illustrated in Figure 4.5, a substantialincrease in traineeships has been recorded since 1995,
with numbers rising to a record level of more than59,000 at the end of 1997. The numbers of apprenticesin training, on the other hand, has apparently declinedwhilst the number of people whose type of trainingcontract is unknown has increased. The latter is due tothere being increasing numbers of people in trainingcontracts whose apprentice or trainee categorisationcannot be determined from their occupation classification.
Sep 95 Dec 95 Mar 96 Jun 96 Sep 96 Dec 96 Mar 97 Jun 97 Sep 97 Dec 97

Overall, growth in total numbers of apprentices andtrainees has occurred in most occupational areas. The
total number in training by occupation (ASCO) groupover the period 1995 to 1997 at 30 June, is illustratedin Figure 4.6. As a group, apprentices and traineesincreased in all occupational areas with the exceptions
of the building and miscellaneous occupation areaswhere numbers declined overall, and the printing area,where numbers remained relatively unchanged.
Figure 4.6: Numbers of Apprentices and Trainees
by ASCO Groupings, 30 June 1995 to 1997
Professionals
0 1995
While traditional trade-based apprenticeshipcommencements appear to be lower in 1996-97 thanduring the previous two years, there are a considerable
number of trainees in these areas. Trade-basedtraineeships include automotive painting, fitting,telecommunications installation, slaughtering, printing,meat processing, carpet laying, panel beating and
engineering.
0 1996 1997
Managers & Administrators 619111129
Plant & Machine Operators & Drivers 121263
Printing =iggmeggo
Para-Professionals 6015211111161
Horticulture 5166659
Other Metal
Metal Fitt/Mach
Labourers & Related Workers
Clerks
Salespersons & Personal Services Workers
Electrical
Food
Miscellaneous
Vehicle
Building
0 5000 10000 15000 20000
Source: NCVER 1996, Australian training statistics, 1995-96, 1996-97 and 1997-98 Quarter 2
Note: As this data is of those in training, not commencements, it is point in time data.
33
25000 30000

The age of commencing apprentices and trainees over
the period 30 June 1995 to 30 June 1997 are shown in
Figures 4.7 and 4.8 respectively. Over the three year
period, the proportion of commencing apprentices aged
Figure 4.7: Commencing Apprentices
By age group, 30 June 1995, 1996, 1997 (Per cent)
1994195 0 1995196 0 1996/97
21 and over has increased marginally while the
proportional representation of younger people declined
slightly (see Figure 4.7).
Source: NCVER unpublished data
The proportion of commencing trainees aged 25 or
more increased dramatically over the three year period
to 30 June 1997. Approximately one third of
Figure 4.8: Commencing Trainees
By age group, 30 June 1995, 1996, 1997 (Per cent)
1994/95 0 1995196 0 1996197
commencing trainees were over 25 years of age at 30
June 1997, compared with less than 10% at 30 June
1995 (see Figure 4.8).
30
25
20
15
10_
15 or less 16 17 18 19 20 21 to 24 25 o
Source: NCVER unpublished data3

5. Employer Views on Vocational Education and Training
The performance of the vocational education andtraining system fundamentally depends upon the degreeof success that its students have in obtaining,maintaining or improving their employment situationthrough the acquisition of skills. Accordingly, the views
of employers about the appropriateness of thevocational education and training system in meetingtheir enterprise skill needs is a most crucial aspect when
assessing the system's performance.
Employers want vocational education and training toequip workers with the competencies they need tocontribute effectively to their business. Key performancemeasure, KPM 3 - Employers' views on the relevance of
skills acquired through vocational education and training,
focuses on this common objective.
In keeping with the reporting rationale recommended bythe Performance Review Committee and agreed to byMinisters, this key performance measure assesses the views
of employers on the relevance of the skills of vocational
education and training graduates as the lead indicator.
This chapter considers information that is available toassess this indicator in addition to a range ofcomplementary information including employers'overall level of satisfaction with the vocational education
and training system, employers' views on the relevance
of course content and their attitudes to vocational
education and training.
The data for this measure is obtained from the 1997National Employer Satisfaction Survey. Comparative
data from an earlier national 1995 EmployerSatisfaction Survey is also referenced where appropriate.
The National Employer Satisfaction Surveys encompassemployer views on training delivered by both TAFE
and other providers.
The Employer Satisfaction Survey draws on the
perceptions of a sample population of employers andtherefore care should be exercised when drawing
inferences with respect to the entire employerpopulation. The final sample included responses fromapproximately 2,600 employers. Survey results were
weighted to take into account the disproportionatesampling of establishments by size of enterprise,
State/Territory, and industry.
Refer to Part C for additional information.
4 0

OVERALL SATISFACTION WITH
VOCATIONAL EDUCATION AND
TRAINING
In the 1997 survey,employers were asked to rate on a
10-point scale from 'very dissatisfied' (1) to 'very
satisfied' (10), their overall satisfaction with the
vocational education and training provided. In 1997,
78% of employers of graduates from vocational
education and trainingresponded with a score of six or
more out of 10 as a measure of their overall satisfaction.
This value compares with 75% of employers who
responded similarly in the 1995 survey.
In 1997, some differences in employer satisfaction
across jurisdictions were also evident. Satisfaction was
highest among responding Victorian employers (88%),
whilst employers in the Northern Territory, though
generally positive, were relatively least satisfied (70%).
Table 5.1 below reports by jurisdiction, the proportion
of employers of graduates from vocational education
and training whoresponded with a score of six or mor
out of 10 as a measure of their overall satisfaction. Thi
table also reports the overall mean responserecorded i
each jurisdiction.
Table 5.1: Employer Satisfaction with Vocational Education and Training
by State/Territory, 19970 I IA
Percentage responding
six or higher
72 88 77 84 74 79 70 75 78
Mean score6.5 7.1 6.5 6.8 6.7 6.7 6.4 6.5 6.7
Figure 5.1 (below) reports the percentage distribution of corresponding valuerecorded in 1995 was 6.6,
employer responses acrossAustralia in 1997, where an indicating little change in the overall satisfaction o
overall mean score of 6.7 was recorded. Theemployers over the two-year period.
Figure 5.1: Employer Satisfaction with Vocational Education and Training, 1997
AUSTRALIA
3 0
30Mean 6.7
42
25
2017
1513
105
5
n1
1
3
2 3 4 5 6
Level of satisfaction
41
7 8 9

RELEVANCE OF TRAINING TOEMPLOYER NEEDS
The relevance of the skills of vocational education andtraining graduates to employers' needs has beenmeasured by analysing the level of employer agreement
with the statement, "The VET system is providinggraduates with skills appropriate to employers' needs".
In 1997, 65% of employer respondents from acrossAustralia agreed that the vocational education andtraining system is providing graduates with skills
appropriate to employers' needs while 19% disagreed.Employer satisfaction on this issue was significantly
higher in 1997 by comparison with the levels of
satisfaction reported in 1995, when 56% of employerrespondents agreed with the statement.
Table 5.2 (below) provides a breakdown by jurisdictionof employers' perceptions of the appropriateness of skillsacquired by graduates from vocational education andtraining in both 1995 and 1997. Among jurisdictions,Queensland had the highest proportion of respondingemployers who were in agreement with the statement(67%), while employers in the Australian CapitalTerritory reported the lowest proportion (58%).
Table 5.2: Employers' Views on the Appropriateness of VET Graduates' Skills
by State/Territog, 1995 and 1997 (Per Cent)
NSW VIC QLD SA WA TAS NT ACT AUS
Per cent that agreed/disagreed that the VET system is providinggraduates with skills appropriate to employers' needs
1995
Agree 56 54 54 59 54 66 50 55 56
Disagree 26 31 22 13 19 21 29 18 25
1997
Agree 65 63 67 65 66 64 61 58 65
Disagree 19 20 16 21 19 19 22 20 19
*Percentages do not total to 100 due to `can't say' and 'neutral' responses
Source: National Employer Satisfaction Survey 1997 and 1995
Relevance of Course Content
The relevance of course content to industry trainingneeds, as perceived by employers, is another measure of
employer satisfaction with vocational education andtraining. This performance aspect was measured byasking employers to rate the relevance of course contentfrom 'not relevant' through to 'leading edge'. 89% ofresponding employers thought that the trainingprovided by the vocational education and training
sector was at least 'mostly current and useable by theindustry'. Of these, 8% thought that course content was'at the leading edge of industry needs'.
Table 5.3 reports by jurisdiction, the level of employersatisfaction with regard to the relevance of course
content in 1997.
4 2

Table 5.3: Employers' Satisfaction with the Relevance of Course Content
by State/Territog, 1997 (Per Cent)
Not relevant to the
NSW VIC QLD SA WA TAS NT ACT AUS
industry's current needs 8 3 10 7 7 4 11 7 7Mostly current and useableby the industry 43 52 51 48 40 51 40 56 47Directly relevant to theneeds of the industry 35 32 30 37 41 41 37 25 34At the leading edge ofindustry needs 9 9 8 8 5 3 10 6 8Can't say 6 3 2 1 7 1 2 6 4
Total 100 100 100 100 100 100 100 100 100
Value of Training
In addition to aspects relating to the relevance of
training, employers were questioned on their attitude tothe vocational education and training system generallyincluding whether or not employers agreed with thestatements 'training pays for itself through increased
worker productivity', 'on-the-job skills are more useful
Table 5.4: Employers' Views on the Value of Training
Various Perspectives, By State/Territog, 1997 (Per Cent)
NSW VIC QLD SA
Agreed
Disagreed
than skills obtained through formal vocational
education' and 'it is more cost effective to recruit trainedpeople than to train people on the job'. Table 5.4(below) reports the degree of agreement with thesestatements from employers in each jurisdiction.
WA TAS NT ACT AUS'training pays for itself through increased worker productivity'
70 72 79 72 72 77 6815 12 12 18 18 13 20
67 7316 14
Agreed
Disagreed
'on-the-job skills are more useful than skills obtained through formal vocational education'
59 63 66 65 61 57 70 6710 15 16 18 13 18 15 9
62
13
Agreed
Disagreed
'it is more cost-effective to recruit trained people than to train people on the job'44 53 61 52 48 54 56 4637 26 25 28 28 29 34 36
51
30
*Percentages do not total to 100 due to 'can't say' and 'neutral' responses
4 3

In the 1997 survey, almost three quarters of respondingemployers (73%) agreed with the statement that'training pays for itself through increased workerproductivity'. By comparison, only 64% of employersagreed with this statement in the 1995 survey. The
statement 'it is more cost-effective to recruit trainedpeople than to train people on the job' received the leastsupport from employers in 1997 with 51% agreeingand 30% disagreeing. Despite the lower level ofagreement with this statement in 1997, the valuereported was higher than that recorded in 1995 (46%).In relation to the statement, 'on-the-job skills are moreuseful than skills obtained through formal vocationaleducation', 62% of employers who responded in 1997agreed with the statement while 13% disagreed. Nocomparative figures are available from the 1995 survey.
The above findings indicate that an increasing majorityof surveyed employers are recognising the productivity
benefits derived from vocational education and trainingand that a small majority prefer to recruit trainedpeople. Almost two-thirds of employer respondentsbelieve that training is more useful when conducted in
the workplace.
SIZE OF ENTERPRISE INFLUENCES
Employer perceptions and attitudes to vocational education
and training were found to vary marginally in relationto enterprise size, that is, between small enterprises (oneto 19 employees), medium enterprises (20 to 99employees) and large enterprises (over 99 employees).
In 1997, the overall satisfaction with vocationaleducation and training among employers within smallenterprises was 6.6, compared with 6.7 in mediumenterprises, and 6.7 among large enterprises. While thelevel of satisfaction reported by large employers had
declined from 1995 levels (7.6), employers frommedium sized businesses reported enhanced satisfactionlevels above those reported in 1995 (6.4). The level ofsatisfaction reported by small enterprises has remained
the same over the period.
Some differences were also evident in the level of
agreement employers indicated with respect to thestatement "The VET system is providing graduates withskills appropriate to employers' needs" (Figure 5.2).Employers from medium sized enterprises were themost positive about the VET system providing graduates
with skills appropriate to employers' needs with 70%agreeing and 13% disagreeing with the statement.Employers from small enterprises were the least satisfied
and recorded the lowest percentage agreeing (64%) andthe highest percentage disagreeing (20%).
Figure 5.2: Employers' Views on the Appropriateness of VET Graduates' Skills
by Enterprise Size, 1997 (Per Cent)
70
60
50
W., 40
a. 30
20
10
0
o Agree Disagree70
Small Medium
4 4
Large

Some differences in employers' satisfaction with the
relevance of course content were also revealed in relationto enterprise size. A higher proportion of respondingemployers from small enterprises (9%) considered
vocational education and training to be 'at the leadingedge of industry needs' compared with 5% and 4% ofemployers from medium and large enterprisesrespectively (see Table 5.5).
Table 5.5: Employers' Satisfaction with the Relevance of Course Content
by Enterprise Size, 1997 (Per Cent)
Not relevant to the industry's current needsMostly current and usable by the industryDirectly relevant to the needs of the industryAt the leading edge of industry needsCan't say
Total
By comparison with employers from medium and largeenterprises, a higher proportion of employers from smallenterprises considered course content as 'not relevant tothe industry's current needs' (8%).
4 5
It can be inferred from the above findings that amongall enterprises, small businesses have the widest range of
perceptions with regard to the relevance of coursecontent to their needs.

Figure 6.1: Labour Force Status of 1996 TAFE Graduates
Percentage Distribution Before and After TAFE Course
75
g 50
o.
25
0
o Before After
Employed Unemployed
Source: TAFE Graduate Destination Survey 1997, excluding nil responses
Figure 6.2 (below) provides a more detailed description
of the employment patterns of TAFE graduates prior to,
during, and after the completion of their studies. It
Figure 6.2: TAFE Graduate Work Patterns
Before, Dur ng and After 1996 TAFE Studies
Before Commencing Course(before 1996)
37% in full-time work
25% in part-time work
14% looking for full-timework
4% looking for part-timework
20% not looking for work
60,246 graduate?
Not in the labour force
should be noted that the proportion of those in full-timeemployment after graduation represent almost half of all
TAFE graduates who responded to the survey.
During Course(during 1996)
36% in full-time work
25% in part-time work
39% not working
59,848 graduate?
After Graduating(May 1997)
49% in full-time work
21% in part-time work
11% looking for full-timework
5% looking for part-tintework
14% not looking for work
58,262 graduate?
Source: Derived from data from the 1997 TAFE Graduate Destination Survey
*Numbers differ due to percentages being based on valid responses only for each question.

6. Student Outcomes from Vocational Education and Training
Vocational education and training provides participantswith the skills required to gain initial employment andto further improve their employment prospects
throughout their working life. The key performancemeasure, KPM 4 - Student employment outcomes and
prospects before and after participation in vocational
education and training focuses on measuring the extentto which the vocational education and trainingexperience contributes toward the achievement of anindividual's employment goals.
The performance measures reported in this chapter arederived from the responses to the 1997 TAFE GraduateDestination Survey; a census of students who graduatedfrom a TAFE course of at least 200 hours duration in1996 to which 55% of graduates responded. The surveysought to obtain information to measure TAFEgraduates' employment outcomes, their main reasonsfor undertaking their course, whether their coursehelped them to achieve these reasons, and otheropinions about their experience at TAFE. Time seriescomparisons, using data collected from a similar surveyconducted during 1995, are made at the end of thechapter as appropriate.
Although student outcomes performance information iscurrently limited to the employment outcomes of TAFE
graduates from Technical and Further Education(TAFE) institutions only, it is intended that futuremeasurement against KPM 4 will be expanded toinclude responses from a broader range of vocational
education and training participants including those whoundertake publicly funded training in community andprivate registered training organisations, and those whoparticipate in shorter training programs which do notnecessarily lead to a full qualification.
EMPLOYMENT OUTCOMES
The primary measure reported in this chapter relates tothe employment outcomes attained by vocationaleducation and training participants, referenced againsttheir employment situation prior to commencing theirtraining program. As at May 1997, 71% of TAFEgraduates who had completed their vocationaleducation and training during 1996 were inemployment. A further 15% were unemployed, while14% were not in the labour force. Table 6.1 (below)
reports by jurisdiction, the labour force status of 1996TAFE graduates as at May 1997. Although variations ingraduate employment outcomes are observed across
jurisdictions, the vast majority of graduates are found tobe in employment after the completion of theirvocational education and training.
Table 6.1: Labour Force Status of 1996 TAFF. Graduates in May 1997
by Labour Force Status and State/Territory, (Per Cent)
NSW VIC QLD SA WA TAS NT ACT AUS
Employed 71 70 67 79 69 81 74 67 71Unemployed 15 17 19 12 14 13 11 16 15Not in the Labour Force 15 13 14 9 17 7 15 17 14
Source: TAFE Graduate Destination Survey 1997, p14
Of those TAFE graduates who completed theirvocational education and training program during1996, 62% indicated that they were in employmentprior to commencing their vocational education andtraining program, 19% advised that they were
unemployed and 20% were not looking for work.Figure 6.2 (next page) illustrates the differences
observed in the employment status of 1996 TAFEgraduates prior to commencing, and after thecompletion of, their vocational education and training.
41x

It is also of some significance to note that of thosegraduates who were unemployed prior to thecommencement of their vocational education andtraining, almost half (46%) were in employment six
Table 6.2: Labour Force Status at 30 May 1997 of
commencing training
By Labour Force Status, (Per Cent)
months after graduation. Table 6.2 (below) illustratesthe employment outcomes for graduates who wereunemployed prior to the commencement of theirvocational education and training.
1996 TAFE Graduates who were unemployed prior to
Employed 45 46 41 57 49 63 44 33 46
Unemployed 40 40 45 32 36 29 30 48 40
Not in the Labour Force 15 14 14 11 16 8 26 19 14
Source: NCVER data derived from 1997 TAFE Graduate Destinations Survey
REASONS FOR UNDERTAKINGVOCATIONAL EDUCATION ANDTRAINING
Another perspective of performance against this keyperformance measure can be obtained from anassessment of the reasons provided by graduates forundertaking vocational education and training, and in
particular those reasons that are employment related.
The degree to which these objectives were fulfilledthrough participation in vocational education andtraining is also examined.
In the 1997 survey, graduates were asked to nominatetheir main reason for undertaking vocational education
and training. The largest single reason, which accountedfor 29% of responses, was 'to get a job (or ownbusiness)'. A total of 77% of all graduate respondents
indicated that they had undertaken vocationaleducation and training with the objective of changingand/or improving their existing employment situation.
Figure 6.3 shows the distribution of the main reasonsfor undertaking vocational education and training thatwere identified by all graduates across Australia.
Figure 6.3: TAFE Graduates' Main Reason for Doing Course
By Reason, Vocational / Non Vocational, (Per Cent)
28.830
25
20
2 15
EL10
5
0
Get a job or Extra skills for Different Better job or Requirementbusiness existing job career promotion of job
Source: TAFE Graduate Destination Survey 1997, p 47
4 3
Personal Entry to Otherinterest another course reason

Table 6.3 describes the proportional distribution ofmain reasons for undertaking vocational education andtraining identified by graduates in each jurisdiction in1997. A significantly higher percentage of Tasmanian
TAFE graduates listed vocational reasons as the mainbasis for deciding to undertake their TAFE course thandid graduates from most other jurisdictions.
Table 6.3: TAFE Graduates' Main Reason for Doing Course
By Vocational / Non Vocational Reason and State/Territory, (Per Cent)
NSW VIC QLD SA WA TAS NT ACT AUSVocational 75 78 79 84 72 89 75 74 77Non-Vocational 24 21 20 15 28 10 23 25 23
Source: TAFE Graduate Destination Survey 1997, p. 47
The degree to which participation in vocationaleducation and training actually assisted TAFE graduatesto realise their main reason for undertaking vocationaleducation and training is also of considerable
importance when assessing the effectiveness of the
vocational education and training sector in meetingthe needs of students.
Of those graduate respondents who identified a vocationalobjective as the main reason for undertaking vocational
education and training, 59% believed that completionof the course had wholly assisted them in achieving
their employment-related objective, while a further17% believed that the course had partly helped themto achieve their vocational objective (refer to Table 6.4).
Table 6.4: Whether TAFE Course Helped Achieve Main Reason for Doing Course
by Vocational / Non-Vocational Reason, 1997 (Per Cent)
Course helped Course partly Course did not
to achieve helped to achieve help to achieve
main reason main reason main reason Don't know yet Total
To get job (or own business) 48 18 15 19 100To try for a different career 48 20 12 20 100To get a better job or promotion 49 22 11 19 100It was a requirement of my job 89 6 2 2 100To get extra skills for my job 77 17 2 4 100Vocational reasons 59 17 10 14 100
To get into another course of study 76 12 3 8 100For interest or personal development 79 15 2 4 100Other reasons 57 22 8 13 100Non-Vocational reasons 76 15 3 6 100
Total 63 17 8 12 100
Source: Derived by the NCVER from TAFE Graduate Destination Survey 1997
4 9

Employment Advantages from VocationalEducation and Training
The labour force status of TAFE graduates, aftercompletion of their vocational education and training,cannot be readily correlated with the completion of theprogram. The perceptions of graduates with regard tothe employment advantages they received that were
directly attributed to doing a TAFE course, provide an
understanding of this relationship.
Graduates who were employed at 30 May 1997 wereasked to provide multiple responses to a list of four
employment advantages which they believed they had
received as a result of completing their TAFE course.Over half of respondents believed that at least one of
the listed improved employment outcomes was linkedto the completion of their vocational education andtraining. Furthermore, 28% of respondents indicated anincrease in earnings, 20% a promotion or increasedstatus at work, and 29% a change of job (or obtainingemployment) had resulted from the completion of a
TAFE course.
Table 6.5: TAFE Graduates' Perceived Employment Advantages from Doing a TAFE Course
Employed Graduates only, 1997 (Per Cent)
!
Males Females Persons
An increase in earnings 32 25 28
A promotion (or increased status at work) 23 17 20
Change of job (or got a job) 24 34 29
None of the above 41 44 43
Don't know 4 4 4
An increase in earningsA promotion (or increased status at work)
Change of job (or got a job)None of the aboveDon't know
RELEVANCE OF TRAINING TOEMPLOYMENT
Over three quarters of employed graduate respondents(77%) indicated that they thought their course washighly relevant or of some relevance to their main job,while 23% considered their course to be of very little or
no relevance. It should be noted that these figures relateto the overall view of employed graduates as to therelevance of their TAFE course to their current work.Accordingly, such figures include graduates who may have
undertaken a course relevant to their preferred futureemployment situation, rather than their current situation.
It is most likely that those graduates whose main reasonfor undertaking their course was either 'it was arequirement of my job' or 'to get extra skills for my job'would most want their course to be relevant to theiremployment. Of those for whom 'it was a requirementof my job' was the main reason, 93% thought theircourse to be of high or some relevance to theiremployment while 7% thought it to be of very little orno relevance. Of those for whom 'to get extra skills for
my job' was the main reason, 90% thought their courseto be of high or some relevance to their employment,while 10% thought it to be of very little or no relevance.
50

OCCUPATIONAL OUTCOMES OFGRADUATES
People employed as 'tradespersons' account for thelargest single occupational group among TAFE graduaterespondents to the 1997 Graduate Destination Survey,with approximately one-quarter of graduates beingemployed in this manner. A further 21% are employedas 'salespersons and personal service workers', while15% of respondents described themselves as beingemployed as `clerks'.
The three occupation categories where graduates weremost likely to be employed full-time were
Figure 6.4: Occupation of Employed TAFE Graduates
By Full/Part-time Status, 1997 (Number of Graduates)
Full-bme 0 Part-time
Labourers & Related Workers
'tradespersons' (with 93% being full-time), 'managersand administrators' (87%), and 'plant and machineoperators, drivers' (79%). The three occupationalcategories with the highest percentages of part-timeemployed were 'salespersons and personal service workers'(with 58% being part-time), 'labourers and relatedworkers' (55%), and clerks (31%). Figure 6.4 (below)reports the occupational distribution of TAFE graduaterespondents with respect to their employment status.
Plant & Machine Operators, & Drivers MN
Salespersons & Personal Service Workers
Clerks
Tiodespersons
Para-Professionals
Professionals
Managers & Administrators
0 2500
STUDENT OUTCOMES IN 1995AND 1997
This section provides a time series analysis of theemployment related outcomes achieved by graduates inboth 1995 and 1997.
The labour force status of graduates responding to the1997 TAFE Graduate Destination Survey before, duringand after their TAFE course was similar to the patternof employment reported in the 1995 TAFE GraduateDestination Survey. The largest differences occurred inrelation to the proportions of graduates who wereemployed full-time or part-time after their course.
5000 7500 10000Number of graduates
About 72% of respondents in 1995 were employed aftertheir course compared with 71% of respondents in1997. Some 53% of employed respondents from 1995were working full-time and 19% part-time, comparedwith 49% and 21% respectively in 1997. This outcome,which indicates a slight shift towards part-time work forrecent graduates over the period 1995 to 1997, isconsistent with employment trends observed generally.
51

The degree to which graduates believed that thecompletion of their vocational education and traininghelped them to achieve their main reason forundertaking such training has remained much the samebetween 1995 and 1997. The largest difference occurred
in relation to graduates whose main reason forundertaking the course was 'to get a job (or own
business)'. Here, 66% of respondents in 1997 thought
that their course had helped them or partly helped themto achieve this main reason for doing their coursecompared with 71% of respondents in 1995.
The percentage of employed graduates perceiving theircourse to be highly relevant or of some relevance to their
employment was also unchanged from 1995 to 1997.
Table 6.6: Main Reason for Doing TAFE Course
by Whether Course Helped to Achieve Main Reason, 1995 and 1997 (Per Cent)
Coursehelped
achievereason
1995
tomain
1997
Course partlyhelped toachieve
main reason
1995 1997
To get a job (or own business) 52 48 19 18
To try for a different career 49 48 20 20
To get a better job or promotion 52 49 22 22
It was a requirement of my job 89 89 7 6
To get extra skills for my job 76 77 17 17
To get into another course of study 78 76 11 12
For interest or personal development 80 79 14 15
Other reasons 60 57 19 22
Total 64 63 17 17
"
5 )

7. What VET Provides for Particular Client Groups
This chapter provides information on how well thevocational education and training system servicedparticular groups in the Australian community during1997. A key government objective of vocational
education and training is to provide equitableoutcomes. The key performance measure, KPM 5 -Vocational education and training participation, outputs
and outcomes achieved by client groups measures the
participation rates, completion rates and outcomes fordifferent vocational education and training equity clientgroups and compares these with those obtained by all
participants in vocational education and training. Inessence, the new KPM 5 is an assessment of several ofthe other KPMs for each particular client group.Previously, in both 1995 and 1996, the measure ofequity within the vocational education and trainingsystem was limited to participation by client group.
The following individual client groups are considered:
females
people from rural and remote areas
indigenous Australians
people from a non-English speaking background, and
people with a disability.
Data is presented on each of the these client groups byState and Territory. Firstly, for each group, participationand achievement (outputs) data is presented followed bya consideration of vocational education and trainingoutcomes realised.
It should be noted that attempts to monitor client groups
in vocational education and training rely on the self-identification of people as a member of these groups viatheir enrolment forms. As substantial numbers of peoplechoose not to answer questions on their enrolment formwhich identify their ethnicity, aboriginally or disability,the following data is indicative only. The participationdata should also be considered with care because thenormal practice of reporting participation rates asproportions in vocational education and trainingrelative to proportions in the wider community aged15-64 has not been applied. Instead, proportions of allages in the community has been used as a referencepoint because a breakdown of data by the 15-64 agecohort has not been available for all client groups.
PARTICIPATION AND ACHIEVEMENT
Female Clients
The rates of participation in vocational education andtraining by females and males for 1997 are shown inTable 7.1 nationally and for each State and Territory.These data show that male participation nationallycontinues to be higher than female participation,
although the reverse is true in some jurisdictions. This
finding should be considered within the context of thelevel and area of participation.
About 25% of all clients enrolled in vocational
programs nationally, were enrolled in the 'business,
administration, economics' field of study category in1997. A further 20% were enrolled in the 'TAFE multi-field education category' that includes pre-vocational/
pre-employment studies, English as a second language,functional literacy and numeracy, general secondary
education and qualifying education, general skills
development and school-tertiary education link courses.The next most popular field of study categories were'engineering, surveying' and 'services, hospitality andtransportation'. For males, the dominant field of studycategory in 1997 was 'engineering, surveying' whereas
the dominant field of study category for females was
'business, administration, economics'. As a proportionof the gender group, considerably more females areenrolled in 'TAFE multi-field education' than males.
Women are more likely than men to enrol in non-awardcourses. The range of vocational education and trainingprograms and industries in which women participate isrelatively narrow. Women in contracts of training(ie. apprentices and trainees) are predominantlyclustered in a small number of occupations andindustries and, while women are well represented in
many levels of qualifications, they remain poorlyrepresented in trade certificate courses.
5 3

Table 7.1: Vocational Education and Training Participation
by Sex and State/Territory, 1997 (Per cent)
Females (aged 15 to 64) 10.6 10.9 6.5 11.6 7.8 6.8 10.1 6.7 9.5
Males (aged 15 to 64) 10.1 14.0 7.4 10.4 8.7 8.7 9.7 7.3 10.4
All persons (aged 15 to 64) 10.4 12.4 7.0 11.0 8.2 7.7 9.9 7.0 10.0
All persons (all ages) 7.7 8.9 6.0 9.1 5.8 5.2 7.5 5.6 7.5
Source: Derived using NCVER data and ABS 1997 June Quarter Estimated Resident Population data
The pass and completion rates for female and malestudents in vocational education and training in 1997are shown in Tables 7.2 and 7.3. As evidenced in the
Table 7.2: Module Load Pass Rate
by Sex and State/Territory, 1997 (Per Cent)
tables, females across Australia achieved slightly better
pass and completion rates than males in 1997.
Female 78.2 83.7 91.6 93.0 92.1 84.7 76.3 76.0 83.6
Male 77.5 79.8 92.8 90.6 91.3 80.7 74.4 74.0 82.3
All persons 77.9 81.6 92.3 91.7 91.6 82.5 75.2 75.0 82.9
Table 7.3: Module Load Completion Rate
by Sex and State/Territory, 1997 (Per Cent)
Female 80.8 81.4 83.3 91.6 88.1 89.0 78.7 81.0 82.7
Male 80.4 79.7 83.8 89.8 89.0 87.6 77.9 80.1 82.1
All persons 80.6 80.5 83.6 90.6 88.6 88.3 78.2 80.6 82.4
People from Rural and Remote Areas
Participation rates in vocational education and trainingby region and State/Territory during 1997 are shown in
Table 7.4. The data show that national participation bypeople living in rural and remote regions is higher by0.7 percentage points than the participation rate for
Australians on average (For a definition of each region,
refer to Part C).
During 1997, the course enrolment profile of rural andremote clients was broadly comparable with thenational profile of all students.
5 4
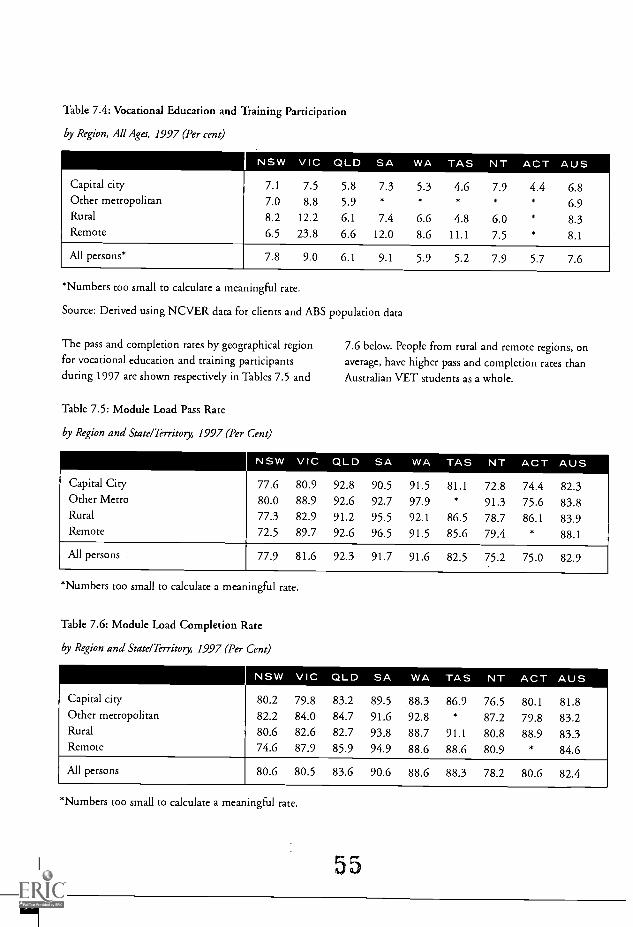
Table 7.4: Vocational Education and Training Participation
by Region, All Ages, 1997 (Per cent)
NSW VIC QLD SA WA TAS NT ACT AUS
Capital city 7.1 7.5 5.8 7.3 5.3 4.6 7.9 4.4 6.8Other metropolitan 7.0 8.8 5.9 * * * 6.9Rural 8.2 12.2 6.1 7.4 6.6 4.8 6.0 8.3Remote 6.5 23.8 6.6 12.0 8.6 11.1 75 8.1
All persons* 7.8 9.0 6.1 9.1 5.9 5.2 7.9 5.7 7.6
*Numbers too small to calculate a meaningful rate.
Source: Derived using NCVER data for clients and ABS population data
The pass and completion rates by geographical region 7.6 below. People from rural and remote regions, onfor vocational education and training participants average, have higher pass and completion rates thanduring 1997 are shown respectively in Tables 7.5 and Australian VET students as a whole.
Table 7.5: Module Load Pass Rate
by Region and State/Territory, 1997 (Per Cent)
Capital City 77.6 80.9 92.8 90.5 91.5 81.1 72.8 74.4 82.3Other Metro 80.0 88.9 92.6 92.7 97.9 91.3 75.6 83.8Rural 77.3 82.9 91.2 95.5 92.1 86.5 78.7 86.1 83.9Remote 72.5 89.7 92.6 96.5 91.5 85.6 79.4 88.1
All persons . 77.9 81.6 92.3 91.7 91.6 82.5 75.2 75.0 82.9
*Numbers too small to calculate a meaningful rate.
Table 7.6: Module Load Completion Rate
by Region and State/Territory, 1997 (Per Cent)
Capital city 80.2 79.8 83.2 89.5 88.3 86.9 76.5 80.1 81.8Other metropolitan 82.2 84.0 84.7 91.6 92.8 87.2 79.8 83.2Rural 80.6 82.6 82.7 93.8 88.7 91.1 80.8 88.9 83.3Remote 74.6 87.9 85.9 94.9 88.6 88.6 80.9 84.6
All persons 80.6 80.5 83.6 90.6 88.6 88.3 78.2 80.6 82.4
*Numbers too small to calculate a meaningful rate.
55

Indigenous Australians
The information provided in Table 7.7 indicates that a
minimum of 2.6% of vocational education and trainingparticipants identify as being an indigenous Australianwhich is higher than the corresponding figure of 2% forthe broader Australian population. Given that over 21%of vocational education and training clients did not
indicate whether they identified as indigenous or not, itwould be expected that the participation of indigenousAustralians is higher than 2.6%. Considering only thoseclients for which indigenous status identification wasreported, an estimate of overall participation is derived
as 3.4%.
Table 7.7: Vocational Education and Training Participation
By indigenous Australian identification and State/Territory, All Ages, 1997 (Per Cent)
NSW VIC QLD SA WA TAS NT ACT AUS
Students reported as indigenous 2.3 0.7 4.8 1.6 5.0 3.0 31.7 1.3 2.6
Students reported as non-indigenous 77.4 79.9 83.7 49.8 63.8 90.7 56.3 93.2 75.6
Students with client group not reported 20.3 19.4 11.5 48.6 31.2 6.3 12.0 5.5 21.8
Indigenous peoples as proportion
of total population 1.7 0.5 2.9 1.4 3.0 3.0 24.4 1.0 2.0
Source: Derived using NCVER data for clients and ABS
Although indigenous Australians may be wellrepresented in vocational education and training overall,they tend to be concentrated in lower level and shortercourses by comparison with the total vocationaleducation and training population, with half of allindigenous Australians being enrolled in the TAFE
multi-field education area. In 1997, about 28% ofindigenous Australian eniolments were undertakingAQF Certificate I and II courses (compared with 13%of all participants). About II% of indigenous Australian
Table 7.8: Module Load Pass Rate
1996 Census data
enrolments were in Diplomas and AQF Certificate IVand equivalent courses by comparison with about 23%
of all enrolments.
The pass and completion rates for indigenous Australianstudents in vocational education and training during1997 are shown in the Tables 7.8 and 7.9 below. Thepass and completion rates for indigenous Australians aresubstantially below those achieved by all participants invocational education and training.
By indigenous Australian identification and State/Territory, 1997 (Per Cent)
NSW VIC QLD SA WA TAS NT ACT AUS
Students reported as indigenous 63.4 70.8 80.7 89.4 82.2 81.7 68.9 64.2 72.4
Students reported as non-indigenous 78.6 81.5 93.1 92.4 92.9 82.6 78.0 75.2 83.2
Students with client group not reported 76.3 84.3 89.7 90.5 89.2 76.0 81.4 71.9 83.2
All persons 77.9 81.6 92.3 91.7 91.6 82.5 75.2 75.0 82.9
51ih., 7
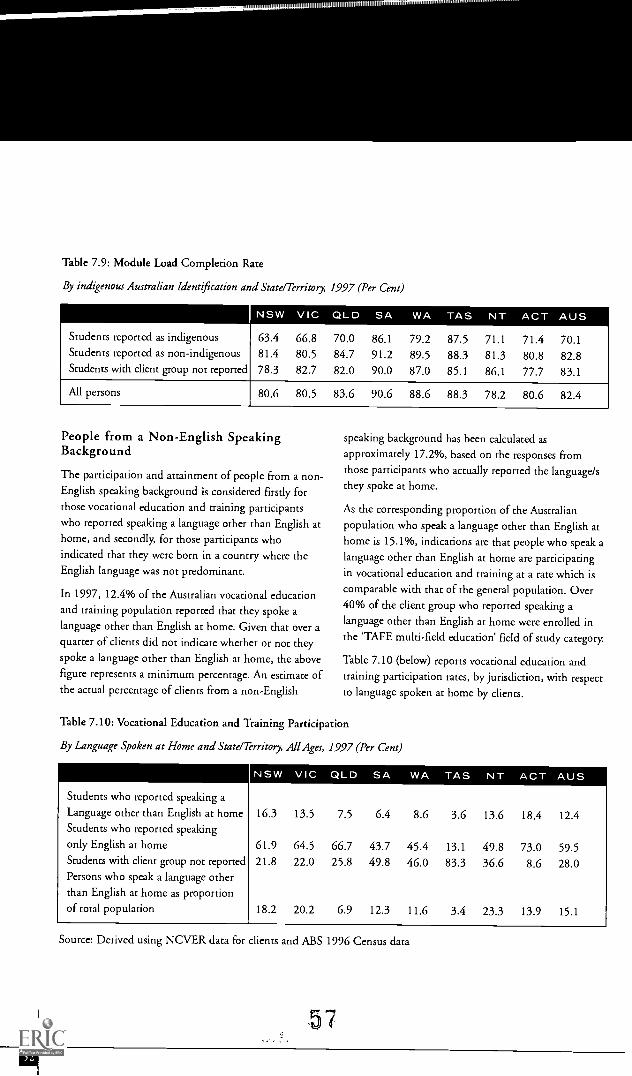
210111 111111MINIMMONdui 1111 1
Table 7.9: Module Load Completion Rate
By indigenous Australian Identification and State/Territory, 1997 (Per Cent)
NSW VIC QLO SA WA TAS NT ACT AUS
Students reported as indigenous 63.4 66.8 70.0 86.1 79.2 87.5 71.1 71.4 70.1Students reported as non-indigenous 81.4 80.5 84.7 91.2 89.5 88.3 81.3 80.8 82.8Students with client group not reported 78.3 82.7 82.0 90.0 87.0 85.1 86.1 77.7 83.1
All persons 80.6 80.5 83.6 90.6 88.6 88.3 78.2 80.6 82.4
People from a Non-English SpeakingBackground
The participation and attainment of people from a non-English speaking background is considered firstly forthose vocational education and training participantswho reported speaking a language other than English athome, and secondly, for those participants whoindicated that they were born in a country where theEnglish language was not predominant.
In 1997, 12.4% of the Australian vocational education
and training population reported that they spoke alanguage other than English at home. Given that over aquarter of clients did not indicate whether or not theyspoke a language other than English at home, the abovefigure represents a minimum percentage. An estimate ofthe actual percentage of clients from a non-English
speaking background has been calculated as
approximately 17.2%, based on the responses fromthose participants who actually reported the language/sthey spoke at home.
As the corresponding proportion of the Australianpopulation who speak a language other than English athome is 15.1%, indications are that people who speak alanguage other than English at home are participating
in vocational education and training at a rate which iscomparable with that of the general population. Over40% of the client group who reported speaking alanguage other than English at home were enrolled inthe TAFE multi-field education' field of study category.
Table 7.10 (below) reports vocational education andtraining participation rates, by jurisdiction, with respectto language spoken at home by clients.
Table 7.10: Vocational Education and Training Participation
By Language Spoken at Home and State/Territory, All Ages, 1997 (Per Cent)
Students who reported speaking aLanguage other than English at home 16.3 13.5 7.5 6.4 8.6 3.6 13.6 18.4 12.4Students who reported speakingonly English at home 61.9 64.5 66.7 43.7 45.4 13.1 49.8 73.0 59.5Students with client group not reported 21.8 22.0 25.8 49.8 46.0 83.3 36.6 8.6 28.0Persons who speak a language other
than English at home as proportionof total population 18.2 20.2 6.9 12.3 11.6 3.4 23.3 13.9 15.1
Source: Derived using NCVER data for clients and ABS 1996 Census data
57

Table 7.11 reports vocational education and trainingparticipation rates, by jurisdiction, with respect to theEnglish-speaking nature of each client's country ofbirth. An estimate of the actual percentage of vocationaleducation and training participants born in a non-English speaking country that approximates 16% maybe derived when data is limited to those clients whoreported their country of birth.
As 13.3% of the Australian population do not speakEnglish at home, indications are that people who were
born in a non-English speaking country areparticipating in vocational education and training at alevel at least equal to their representation in the generalpopulation. However, notwithstanding their overall levelof representation, such clients tend to be highlyrepresented in the lower skill level preparatory courses
and are not well represented in operatives, trades and
skilled level courses.
Table 7.11: Vocational Education and Training Participation
By English-speaking Country of Birth and StatelTerritory, All Ages, 1997 (Per Cent)
Students who reported being bornin a non-English speaking countryStudents who reported being bornin a main English speaking countryStudents with client group not reportedPersons born in a non-Englishspeaking Country as a proportion
of total Population
NSW VIC QLD SA WA TAS NT ACT AUS
14.8 13.5 9.6 7.5 8.9 6.0 6.1 17.6 12.3
64.2 65.1 81.2 45.5 45.3 92.2 61.3 74.4 64.3
21.0 21.3 9.2 46.9 45.8 1.7 32.6 8.0 23.3
15.8 17.1 7.3 10.6 11.8 3.9 8.1 13.8 13.3
Source: Derived using NCVE.R data for clients and ABS 1996 Census data
The pass and completion rates obtained by vocationaleducation and training students who reported speakinga language other than English at home in 1997 areshown in Tables 7.12 and 7.13 below. In general, students
who reported speaking a language other than Englishat home have lower pass and completion rates thanstudents who reported speaking only English at home.
Table 7.12: Module Load Pass Rate
By Language Spoken at Home and State/Territory, 1997 (Per Cent)
Students who reported speaking a
NSW VIC QLD SA WA TAS NT ACT AUS
language other than English at home 75.5 77.0 92.6 87.6 91.2 53.5 70.3 62.0 77.4
Students who reported speaking onlyEnglish at home 78.9 82.8 92.5 92.9 93.1 91.0 74.6 81.0 84.0
Students with client group not reported 76.7 83.7 91.4 90.8 89.9 83.7 79.6 62.9 84.6
All persons 77.9 81.6 92.3 91.7 91.6 82.5 75.2 75.0 82.9
cL4-
5 3

Table 7.13: Module Load Completion Rate
By Language Spoken at Home and State/Territory, 1997 (Per Cent)
Students who reported speaking a
NSW VIC QLD SA WA TAS NT ACT AUS
language other than English at home 78.8 76.3 78.7 89.7 87.9 68.1 72.6 71.3 78.3Students who reported speakingonly English at home 81.5 81.6 84.2 91.4 88.8 93.4 78.2 84.5 83.1Students with client group not reported 79.4 82.2 84.1 89.7 88.4 88.9 82.1 71.6 84.0
All persons 80.6 80.5 83.6 90.6 88.6 88.3 78.2 80.6 82.4
The pass and completion rates for VET students in1997 who reported being born in a mainly non-English
speaking country are shown in Tables 7.14 and 7.15below. On average, students who reported being born in
Table 7.14: Module Load Pass Rate
a non-English speaking country have lower pass andcompletion rates than students who reported being bornin an English speaking country.
By English-speaking Country of Birth and State/Territory, 1997 (Per Cent)
Students who reported being born in
NSW VIC QLD SA WA TAS NT ACT AUS
a non-English speaking country 75.2 77.8 93.4 87.8 90.9 59.3 71.6 59.7 78.1Students who reported being born ina mainly English speaking country 78.7 82.3 92.3 92.7 93.2 84.5 73.8 80.7 83.8Students with client group not reported 77.3 85.4 89.4 90.9 89.8 35.6 80.7 69.3 84.2
All persons 77.9 81.6 92.3 91.7 91.6 82.5 75.2 75.0 82.9
Table 7.15: Module Load Completion Rate
By English-speaking Country of Birth and StatelTerritory, 1997 (Per Cent)
Students who reported being born in
NSW VIC QLD SA WA TAS NT ACT AUS
a non-English speaking country 78.4 76.6 79.9 90.2 87.7 72.2 77.5 69.6 78.6Students who reported being born ina mainly English speaking country 81.3 81.3 84.2 91.2 88.9 89.4 76.9 84.3 83.0Students with client group not reported 79.9 83.8 82.9 89.7 88.4 53.2 82.4 75.7 84.2
All persons 80.6 80.5 83.6 90.6 88.6 88.3 78.2 80.6 82.4

People with a Disability
In 1997, only 3.3% of participants in vocationaleducation and training reported having a disability. Asfor other client groups, a high non response rate wasalso recorded. Differences in the definition of 'disability'used by the ABS and the AVETMISS data standard(used for the national vocational education and trainingcollection) have precluded the possibility of makingmeaningful comparisons of participation for persons
with a disability against their proportion in the generalpopulation. The AVETMISS standard classifies a
disability to be both significant and permanent whereasthe ABS defines a disability more broadly to encompassrestrictions or impairments which had lasted, or arelikely to last, for a period of six months or more. It isintended to align these standards in the future.
Table 7.16: Vocational Education and Training Participation
By Reported Disability and State/Territory, All Ages, 1997 (Per Cent)
NSW VIC QLD SA WA TAS NT ACT AUS
Students reported as having a disability 4.1 2.9 3.6 2.2 2.2 4.7 2.9 4.3 3.3
Students reported as not havinga disability 68.7 79.3 84.7 40.3 *96.7 86.1 66.2 79.5 73.9
Students with client group not reported 27.2 17.9 11.7 57.4 *1.1 9.2 30.8 16.2 22.7
Persons with a disability as a
proportion of total population 16.9 18.3 18.8 20.6 18.2 18.5 12.3 15.8 18.0
Source: Derived using NCVER data for clients and ABS population data*The 'Students with client group not reported' for Western Australia is understated due to a system default to
'Students reported as not having a disability'.
Relative to those clients not reporting a disability, theparticipation in vocational education and training ofthose persons who report a disability is skewed towardsthe lower skill level courses. Such clients also tend to be
over-represented in programs where there is low or
declining labour market demand. These patterns arelikely to contribute to poor employment outcomes afterprogram completion. Half of all people with a disability
Table 7.17: Module Load Pass Rate
By Reported Disability and State/Territory, 1997 (Per Cent)
undertaking a vocational education and training program
were enrolled in 'TAPE multi-field education' courses.
The pass and completion rates for vocational educationand training students who reported having a disabilityin 1997 are shown in Tables 7.17 and 7.18 below. Onaverage, students who reported having a disability havelower pass and completion rates than students whoreported as not having a disability.
NSW VIC QLD SA WA TAS NT ACT AUS
Students reported as having a disability 71.9 75.6 89.5 90.4 88.3 77.9 69.3 66.3 76.5
Students reported as not having
a disability 78.4 82.1 92.7 92.2 91.7 82.7 73.6 74.5 83.5
Students with client group not reported 76.7 80.0 88.0 91.0 92.8 83.1 81.5 78.9 81.0
All persons 77.9 81.6 92.3 91.7 91.6 82.5 75.2 75.0 82.9

Table 7.18: Module Load Completion Rate
By Reported Disability and State/Territory, 1997 (Per cent)
NSW VIC QLD SA WA TAS NT ACT AUS
Students reported as having a disability 76.6 75.9 78.6 89.4 84.9 84.1 74.4 74.9 77.6Students reported as not havinga disability 81.2 80.8 84.2 91.1 88.7 88.4 77.0 80.2 82.8Students with client group not reported 78.7 79.6 79.1 89.8 88.5 87.3 83.1 83.3 81.2
All persons 80.6 80.5 83.6 90.6 88.6 88.3 78.2 80.6 82.4
CLIENT GROUP OUTCOMES
Using the data available from the 1997 TAFE Graduate
Destination Survey, this section looks at the leadindicators of employment outcomes and whether or notgraduates perceived their course to have helped themachieve their main reason for doing the course, by theequity group identifiers indigenous Australians, non-
English speaking background persons, persons with adisability, and gender. Information is not available forclients of providers other than TAFE because the scope
Table 7.19: Labour Force Status of 1996 TAFE Graduates
By Client Group, 30 May 1997 (Per Cent)
of the 1997 Graduate Destination Survey includedTAFE clients only.
Employment Outcomes for Client Groups
As Table 7.19 shows, persons identifying with an
equity group have significantly lower percentages inemployment and higher percentages of unemploymentcompared with graduates overall.
Employed Unemployed Not in labour force Total
Indigenous Australians 52 22 26 100Non-Indigenous Australians 71 15 14 100
Speakers of languages other
than English 60 20 20 100Speakers of English only 76 13 11 100
Report a disability 50 24 26 100Report no disability 72 15 13 100
Females 66 17 18 100Males 78 13 9 100
Total 71 15 14 100
6

Were Client Group Reasons for StudyingAchieved?
Although employment outcomes are clearly not as
positive for graduates identifying with client groups as
for graduates overall, their perceptions of how muchtheir TAFE course helped them to achieve their mainreasons for undertaking the course were broadly in line
with all graduates (see Table 7.20). Those claiming to
have a disability were the least positive about thecontribution that completion of their vocationaleducation and training program had made toward theachievement of their main reason for undertaking the
program.
Table 7.20: Whether TAFE Course Helped to Achieve Main Reason
by Client Groups, 1997 (Per Cent)
Coursehelped to
Achieve mainreason
Course partlyhelped toachieve
main reason
Course didnot help to
achievemain reason
Don'tknowyet
Total
Indigenous Australians 63 17 8 12 100
Non-Indigenous Australians 65 16 7 12 100
Speakers of languages other
than English 58 18 9 15 100
Speakers of English only 65 16 8 11 100
Report a disability 54 18 12 16 100
Report no disability 63 17 8 12 100
Females 61 18 8 13 100
Males 65 15 8 12 100
Total 63 17 8 12 100
The percentages of graduates from each client groupreporting that their course helped them to achieve theirmain reason for undertaking it were consistently lowerthan for those not identifying with each client group.The largest differences here occurred with respect to
those identifying a disability (54% claiming the course
helped compared with 63% of those not identifyinga disability), or being of non-English speakingbackground (58% claiming the course helped compared
with 65% of those not identifying as being of non-English speaking background).
6 2.

8. Public Investment in Training Australians
This chapter focuses on the performance of that
component of vocational education and training that isjointly funded by State, Territory and Commonwealth
governments through the Australian National TrainingAuthority (ANTA) Agreement.
As part of the ANTA Agreement, Australian
governments at both the State/Territory andCommonwealth levels provided $2.9 billion forvocational education and training in 1997. Specificpurpose vocational education and training funds thatare additionally committed by governments to support,for example, labour market and adult migrantprograms, are excluded from consideration.
In 1997, approximately 1.1 million Australians
participated in vocational education and training thathad been directly funded by Australian governmentsunder the ANTA Agreement. This figure is derivedfrom the 1997 NCVER audit verification reports.
Three measures of the public investment in vocationaleducation and training are considered in this chapterincluding unit costs (which provide a measure ofefficiency), actual versus planned activity (which assess
the efficacy of State/Territory planning systems), and
Annual Hours Curriculum (AHC) activity per 1000population (which measures relative effort amongjurisdictions).
WHAT MEASURES OF UNIT COST ARECONSIDERED?
The vocational education and training system aimsto optimise its efficiency through maximising the
production of quality skill outputs from available
resources. Measures which relate to the efficient use ofthe public dollar are therefore of prime public interestand are considered essential in demonstrating value formoney and accountability.
63
The Key Performance Measures endorsed by Ministersin 1997 include two new measures of efficiency. Thenew measures are KPM 6 - (Actual) public expenditure
per publicly fiinded output, and KPM 7 (Actual) publicexpenditure per total recognised ouqmit. KPM 7
acknowledges the increasing public and private mix offunding invested in vocational education and trainingand is being developed because of public interest in theextent to which private investment in training iscontributing to total recognised training.
The new measures require the development andimplementation of two new data elements. The firstelement requires robust, accrual based financial data toprovide total government operating expenditure.Financial reporting in accrual accounting terms hascommenced in the VET sector against the financial
standard endorsed by vocational education and trainingMinisters. The second element is reliant on capturingthe outputs of the sector, in terms of units of competence,
as outlined earlier in the Report in relation to KPM 1.This process will commence from 1999 with fullreporting expected in the year 2001 for 2000.
Until such time as measures of output for the sectorare fully introduced, it has been agreed by vocationaleducation and training Ministers that governmentrecurrent expenditure per public annual curriculumhour (AHC) will remain the key performance measureused to assess the public cost of providing Australianswith vocational skills. In addition, the two additionalmeasures included in 1996 will be reported again in1997, namely
government recurrent expenditure per publicmodule load completion, and
government recurrent expenditure per total moduleload completion.

WHAT DO THE UNIT COSTS RELATE TO?
The unit costs presented in this report relate to thedelivery of mainstream government funded vocationaleducation and training programs. The costs capture
a 'whole of system' government cost of vocational
education and training provision.
Included within the 'whole of system' government
cost are those costs associated with each of three key
dimensions of vocational education and training forwhich State/Territory Ministers and their departments
are responsible, including:
the provision of training, which constitutes the
single largest expense
the regulation and quality assurance of training, and
the facilitation of training arrangements in industry.
WHAT INFLUENCES UNIT COSTS?
The 1996 Report in this series was based on acomprehensive review of the quality and comparabilityof data used to derive unit costs. It was found that onlyminor variations remain and thus comparability ofsource data does not account for unit cost differences
observed between jurisdictions. However, as reported
last year, while data comparability is now reasonable,there are many valid reasons why unit costs differ
between jurisdictions.
As the Performance Reports in previous years have
noted, key drivers of cost differences which have the
greatest impact on unit cost differences include:
training related cost drivers:
- class sizes;
- teaching salaries;teaching hours per full time equivalent staff member;
differences in the length of training programs of
similar types;
inter-jurisdictional differences;
socio-economic composition
- administrative scale
- dispersion- service delivery scale
VET policy differences
6 4
Training related and policy cost drivers are underreview. Under the revised ANTA agreement, endorsed
in November 1997 by Ministers and subsequently byState/Territory Cabinets, the Commonwealth has agreedto maintain current levels of funding for vocational
education and training in real terms. Jurisdictions haveagreed to identify efficiencies to assist in releasing funds
for growth and system enhancements.
Under the 'growth derived from efficiencies' framework,States and Territories are responsible for identifyingefficiency strategies and outcomes which are specific totheir individual circumstances and history of efficiency
improvement. A broad range of strategies have beenidentified in the first round of the 'growth derived fromefficiency' strategic plans, relating to initiatives of both
a short and medium to longer term nature.
Being conscious of the need to balance efficiency andeffectiveness issues, State/Territory strategic efficiency
agendas also incorporate quality enhancement strategiesand take account of a range of factors that mayconstrain the maximisation of their growth and
efficiency improvement objectives.
With regard to inter-jurisdictional differences, theCommonwealth Grants Commission (CGC) hasresponsibility for advising the Commonwealth on costdifferentials observed across States and Territories. The
Commission has a mandate to analyse why somejurisdictions spend less, and others more, than theCommission's assessment of what they need to spend to
provide a standard level of service at an average level of
efficiency. An outline of the current Commonwealth Grants
Commission's service delivery costs and cost factor
weightings appear in the additional notes section in PartC. The weightings have not changed since last year's report.
Most State/Territory governments have expressed some
degree of reservation about both the methodology and
outcomes of the Commonwealth Grant Commission's
analysis and so the unit costs presented in this chapter
are not adjusted for jurisdictional cost differences. However,
in the absence of a better alternative, it can be arguedthat the CGC weightings provide the most valid basis fornormalising jurisdictional differences. As shown in the
additional notes, the Commonwealth Grants Commissioncosts weightings indicate that there is only a modest
variation among jurisdictions, excluding the Northern
Territory, to which a significant 'disability' factor applies.

A review by the Commonwealth Grants Commission ofits cost weightings is currently underway with theinvolvement of the States, Territories and theCommonwealth. New costs weightings are expected tobe available later in 1998.
WHAT DATA ADJUSTMENTS HAVEBEEN MADE?
Invalid Enrolments
Enrolments in vocational education and training areconfirmed when the student attends class or submits atleast one piece of work. For the purpose of unit costcalculations here, the proportion of activity that isconfirmed as invalid through the activity audit reportshas been used to discount the overall reported activity.
Table 8.1: Cost Relativities Based on Course-Mix Weights
Effects of Course Mix on Costs
In deriving unit costs it is important to makeadjustments CO take into account different trainingdelivery profiles across jurisdictions. The course-mixweights outlined below have been derived frominformation provided by States and Territories, updateson which have been sought each year. A weight ofgreater than one indicates that the State or Territory isoffering relatively more expensive program deliverycompared with the overall national profile.
The weightings are used to adjust unit costs to accountfor training programs that are relatively more or lessexpensive. The course-mix weightings used in this reportare unchanged from those that were derived for use inthe 1996 Report. The index of course relativities, updatedusing 1997 activity information, is provided in Table 8.1.
NSW VIC QLD SA WA TAS NT ACT AUS0.97 1.01 1.01 1.01 1.03 1.03 0.98 0.97 1.00
Source: Derived by ANTA using 1997 estimated activity (from the 1998 State/Territory VET Plans) and unit costweightings provided by the Unit Cost Working Party
WHAT WERE UNIT COSTS IN 1997 AND HOWDO THEY COMPARE WITH PRIOR YEARS?
Table 8.2 (below) compares unit costs by jurisdictionover the period 1995 to 1997, adjusted to 1997 prices.Refer to Part C for further details. Across Australia, theunit cost of government recurrent funding in 1997 was$11.4 per Annual Hour Curriculum delivered. Thenational unit cost figure appears to have decreasedbetween 1996 and 1997 by $0.4.
The unit costs data calculated for the years 1996 and1997 have been derived using a similar methodologywhich accounted for both course mix and confirmed
Table 8.2: Comparison of Unit Costs
By State/Territory, 1995 to 1997 (in 1997 Prices), ($)
invalid module enrolment (IME) rate differencesamong States and Territories. In addition, 1996 and1997 financial data has been adjusted to providecomparability between States and Territories, whileactivity data includes RPL activity in both yearsaccording to an agreed formula. By comparison, the1995 data is based on a less rigorous approach to thedetermination of invalid module enrolments and doesnot include the financial and activity data adjustmentsmade in 1996 and 1997.
NSW VIC QLD SA WA TAS NT ACT AUS1995 (in 1997 prices) 11.1 9.2 11.2 13.4 13.0 15.8 19.9 16.0 11.21996 (in 1997 prices) 12.0 9.7 11.7 14.5 12.5 15.4 23.5 16.8 11.81997 12.0 8.9 11.7 12.8 12.4 14.6 26.5 15.6 11.4
Source: States and Territories provided financial and activity data. Audit reports on this data were preparedspecifically for ANTA. 1996 and 1997 data was prepared on a more refined basis than the data prepared in 1995.
6 5

Differences in unit costs between jurisdictions arisebecause of the factors noted earlier as well as the relative
effectiveness of the system. Taking into account theinter-jurisdictional factors considered by theCommonwealth Grants Commission, for example, the
1997 unit cost for the Northern Territory becomes $18.
WHAT ARE THE UNIT COSTS OFSUCCESSFUL MODULE COMPLETIONSIN 1997 COMPARED WITH 1996?
Table 8.3 provides figures on the costs of delivery to
produce a successful output in government funded
programs in both 1996 and 1997 (in 1997 prices).These figures are based on the expenditure and the total
amount of delivery in government funded programswhich results in a successful outcome or module loadcompletion (MLC). For an explanation of thecalculation of these figures see Part C.
Nationally, the cost of producing successful outputsfrom government funded programs appears to have
increased between 1996 and 1997.
Table 8.3: Government Recurrent Expenditure Per Hour of Successful Module Completion in Government-
Funded Programs, 1996 and 1997
NSW VIC QLD SA WA TAS NT ACT AUS
1996 (in 1997 prices) 15.4 13.6 13.7 16.8 17.6 21.1 45.0 20.5 15.3
1997 17.7 13.2 15.9 18.3 17.6 22.4 41.2 21.4 16.6
Source: NCVER National Provider Collection, 01 Government funding source activity and NCVER Maintenance
of Effort audits
As well as how much it costs to produce a successfuloutput in government funded programs, it is useful to
look at the ratio of government expenditure per totalamount of training delivered, through the NCVERnational provider collection, that resulted in a successful
outcome. These figures, for both 1996 and 1997,appear in Table 8.4. An explanation of the calculation
of these figures appears in Part C.
Nationally, a small reduction in the government cost ofproducing a successful output from all trainingprograms has been achieved in over the period 1996 to
1997. All training programs includes governmentfunded programs through the ANTA Agreement, plusgovernment funded specific purpose programs and fee
for service programs through public providers.
Table 8.4: Government Recurrent Expenditure Per Hour of Successful Module Completion in All Programs,
1996 and 1997
NSW VIC QLD SA WA TAS NT ACT AUS
1996 (in 1997 prices) 14.6 11.4 11.2 14.8 14.8 16.2 27.0 17.6 13.4
1997 14.9 10.0 12.5 14.5 14.1 13.3 29.8 16.6 13.1
Source: NCVER National Provider Collection, All activity and NCVER Maintenance of Effort audits
It should be noted that the measures outlined abovemask a wide divergence in the average hours taken to
complete a module between jurisdictions. However, it is
anticipated that a cost per standardised output will bepossible in future key performance measure reports.
6G

HOW DID 1997 PLANNEDGOVERNMENT FUNDED ACTIVITYCOMPARE WITH ACTUAL DELIVERY?
The measure of planned and actual activity levels hasmost value within each State/Territory for planningpurposes. Information on 1997 planned activity interms of Annual hours Curriculum (AHC) is takenfrom revised estimates provided in the 1998
State/Territory Vocational Education and Training Plans.
Table 8.5: Planned and Actual Activity (AHC) in 1997
By State/Territory, ( '000)
Table 8.5 compares total planned and actual hoursacross jurisdictions in 1997. Nationally, 243.3 million
curriculum hours were planned to be delivered. Actualdelivery of 245.9 million hours exceeded this figure by
1.07%. Significant variations between planned andactual activity levels were found within someStates/Territories.
N SW V I C Q L D SA WA TA S NT ACT AUSPlanned' 89,209 66,581 39,085 15,415 22,189 4,090 2,546 4,213 243,328Actual' 89,154 68,197 38,837 16,589 21,813 4,504 2,528 4,299 245,921
% Variation -0.06 +2.43 -0.63 +7.62 -1.70 +10.12 -0.70 2.04 +1.07
1. Revised 1997 estimates provided in 1998 State/Territory VET Plans2. Based on NVCER activity audit reports
When total activity levels are disaggregated by
occupational levels and training areas, differences in
patterns of delivery between States and Territories
become apparent. This information is provided in theadditional notes within Part C.
WHAT IS THE RELATIVE EFFORTACROSS JURISDICTIONS?
Relative effort monitors participation in vocationaleducation and training with respect to the totalpopulation within each State and Territory. The measurecompares Annual Hours Curriculum (AHC) withineach State/Territory with the corresponding population
share for the cohort aged 15 to 64. The informationshown in Figure 8.1 refers to government fundedactivity within the ANTA scope and boundary,
including AHC associated with Recognition of PriorLearning (RPL) according to the agreed formula andexcluding credit transfer and invalid module enrolments.
Figure 8.1 indicates that approximately 18,000
government funded AHC were delivered per 1000population (aged 15-64) in 1997. The highest relativeeffort was reported in Victoria and New South Wales,with Tasmania reporting the lowest level of relative effort.
Figure 8.1: Annual Hours Curriculum (AHC) per 1000 Population
By State/Territory aged 15 to 64, 1997 (Per Cent)
25,000
20,000
15,000
10,000
5,000
NSW VIC QLD SA WA
State/TerritoryTAS NT ACT AUS

<-Annual©lationad Repor
Appendix:Additional Notes
6a
This chapter deals with those technical aspects of thedata, its collection and adjustment processes undertakenin the course of compiling this report while alsoproviding further relevant information considered toodetailed for inclusion in the main body of the report.
Unless where otherwise specified in the report, the dataanalysed in this report relates to vocational programactivity only (that is, streams 2400 to 4500 or moduleonly enrolments) and excludes recreation and leisureprogram activity (stream 1000).
1 INTRODUCTION
Additional Notes
States and Territories were consulted using agreed protocols
in the preparation of the report. The working group ofthree State officials was again convened comprising:
Ms Chris Currey, NSW Department of Educationand Training
Dr Susan King, WA Department of Training, and
Dr Richard Watkins, Tasmanian Department ofVocational Education and Training.
The working group was supported by NCVER staffincluding Mr Chris Robinson, Managing Director,and Ms Jessie Borthwick, General Manager.
The main vehicle for State and Territory consultations
was the State/Territory reference group. The participantsin the State/Territory reference group were:
Mr Reean Sneddon, NT Employment and TrainingAuthority
Ms Robyn Bergin, DEETYA
Mr Graham Smith, Queensland Department ofTraining and Industrial Relations
Mr Peter May, Australian National Training Authority
Mr John Nagel, SA Department of Education,Training and Employment
Mr Mike Brough, Tasmanian Department ofVocational Education and Training
Mr Richard Strickland, WA Department of Training
Dr Robert Mawer, NSW Department of Educationand Training
Mr George McLean, Victorian Office of Trainingand Further Education
Mr Michael Dupe, ACT Vocational Education &Training Authority
Dr Ian Willis, ACT Vocational Education andTraining Authority
and rwo observe:rs, namely,
Mr Ben Goodsir, Industry Commission
Mr Walter 1vessa, Queensland Treasury Department.
2 VOCATIONAL EDUCATION ANDTRAINING IN AUSTRALIA
Data Source
Apart from data reported in Figures 2.1, 2.2 and 2.5,the analysis in this chapter is based upon data providedas part of the national vocational education and trainingprovider collection. Figure 2.5 reports governmentfunded activity under the ANTA Agreement and isbased upon data contained in State/Territory TrainingProfiles/VET Plans.
Derivation of Size and Composition of VET
Estimates of the size of major training provider groups(calculated by ANTA) are based on the methodology ofprevious work conducted in this area by the AllenConsulting Group in its report, Establishing an
Effective Australian Training Market (1994). While theAllen Consulting Group methodology derives a range ofexpenditure per provider type, the 1995 and 1996 VETPerformance Reports use the lower level estimate forcalculating sector size.
Estimates are derived from a variety ofsources as follows:
i) Publicly funded VET (including TAFE, ACE, andVET in schools): a direct estimate of size is possible
using the income and expenditure data contained in
Australian Vocational Education and Training statistics1996: financial data, a financial statistics collectionproduced by the NCVER.
ii) Enterprises: refers to enterprise internal training
spending and excludes salary cost while undertakingtraining. A direct estimate of size is available from the ABS
publication, Employer Training Expenditure, May 1996.
63

1996 data for deriving the size of all other sectors is
currently not available. This information will beupdated upon release of the ABS Survey of Educationand Training publication. As a proxy, 1992 employment
by sector estimates derived by the Allen ConsultingGroup are used. The lower level estimate is made bytaking the 1992 employment figure in each sector,multiplying it by an average employment cost as at1996, and adding an allowance for overhead costs. Thismethodology is consistent with that employed by theAllen Consulting Group in its original derivations.
3 THE ECONOMY AND THE LABOURMARKET
The interest rate sensitive areas of domestic demandcontributed strongly to growth after five reductions inofficial interest rates during 1996 and 1997. Businessinvestment was the largest contributor to economicgrowth during 1997 with strong rises in equipmentexpenditure and non-dwelling construction. Dwellingsexpenditure made a positive contribution to GDP forthe first time since 1994, with activity increasing by over11% during 1997, compared with a fall of 10% in 1996.
Table 9.1: Proportion of Gross State Product at Factor Cost - 1995-96
NSW VIC QLD SA WA TAS NT ACT AUS
Agriculture, forestry & fishing 2.6 3.4 4.1 6.0 6.2 6.7 4.9 0.1 3.7
Mining 2.2 2.9 5.1 2.5 17.6 2.9 11.7 0.1 4.6
Manufacturing 15.1 18.0 11.9 17.0 9.8 14.3 5.0 2.5 14.5
Electricity, gas & water supply 2.9 3.3 3.3 2.8 2.7 5.7 2.0 1.9 3.1
Construction 6.6 5.6 7.3 5.8 7.8 6.3 9.1 7.2 6.5
Wholesale trade 6.7 6.5 5.6 5.1 5.5 4.5 3.8 2.3 6.0
Retail trade 7.5 7.3 9.3 8.1 7.2 9.7 9.1 6.4 7.8
Accom., cafes & restaurants 2.5 1.9 3.4 2.0 1.7 2.9 3.7 2.1 2.4
Transport & storage 5.2 4.5 6.6 5.6 4.4 4.2 5.7 3.1 5.1
Communication services 3.0 3.4 2.9 2.4 2.5 2.0 2.6 2.5 3.0
Finance & insurance 5.0 4.2 3.0 3.4 2.0 2.1 3.0 3.0 3.9
Property & business services 10.6 9.9 6.7 8.1 7.8 5.2 6.7 11.2 9.2
Government admin & defence 3.2 2.9 4.1 2.8 2.6 4.7 7.5 26.9 3.8
Education 4.5 5.1 5.1 5.2 3.9 5.2 5.4 6.3 4.8
Health & community services 5.7 6.5 5.8 8.3 6.0 7.7 6.2 4.9 6.2
Cultural & recreational services 1.8 1.9 1.6 1.6 1.3 1.3 3.0 3.0 1.8
Personal & other services 2.2 2.1 2.4 2.8 2.2 2.2 2.8 3.0 2.3
Ownership of dwellings* 11.1 8.9 9.6 8.6 7.1 9.6 5.6 8.5 9.5
General government* 1.7 1.6 2.1 2.0 1.8 2.8 2.0 5.2 1.9
Total 100.0 100.0 100.0 100.0 100.0 100.0 100.0 100.0 100.0
*Gross Operating Surplus
Source: ABS Cat. No. 5220.0
7 0

Figure 9.1: Average Annual Rate of Growth of Gross State Product and Population
by State/Territory, 1991-92 to 1995-96
6
a) 3'2cl)
2
0 Gross State Product Resident Population
11.TAS
MISA NSW NT VIC
State/Territory
Source: ABS cat. no 5220.0 and 1350.0
4 PARTICIPATION AND ACHIEVEMENTIN VET
Data Source
ABS survey, census and population data, Finn targetdata supplied by ANTA. All other data used is sourcedfrom the national vocational education and trainingdata collection co-ordinated by the NCVER . NCVERdata used in this chapter relate only to participants invocational education and training who:
were enrolled in at least one vocational program
(that is, they had at least one course enrolment in astream 2100-4500 course or module only enrolments),
were participating in the VET sector from a"tuition" point of view (that is, have at least onemodule outcome which is not Recognition of PriorLearning (RPL) or Credit Transfer (CT)), and
excludes data on VET delivered in Schools collectedin 1997 (this is the first year this activity has beencollected and not all States/Territories are currentlyreporting this information).
Indigenous and speakers of languages other than
English at home population figures are sourced fromABS census data while the latest ABS disability
population figures available are from 1993.
ACT
IIIQLD WA
11AUS
Participation Data Adjustments
Participation data supplied from the national VETcollection has been adjusted for student enrolment noattendance (SENA), on information supplied by themaintenance-of-effort activity measures auditors at theNational Centre for Vocational Education Research.
The 1996 SENA is an estimate based on a stratifiedsample of module enrolments in each State andTerritory (the same sample as used for determininginvalid module enrolments) from which the NCVERauditors determined an estimate of the proportion ofnon-confirmed students. For 1996, participation rateshave been adjusted based on the 'confirmed + possibleinvalid' student rate.
1997 SENA rates have been determined from a sample
drawn from the AVETMISS client file that includedonly clients associated with the ANTA Agreement
delivery and incorporated a more complete estimate ofclients who could not have their attendance confirmed.
71

Table 9.2: 1996 and 1997 Adjustment Factors
Student Enrolment No Attendance (SENA) (Per Cent)
NSW VIC QLD SA WA TAS NT ACT
1996 I2.20 2.57 4.06 7.20 12.79 4.30 3.98 4.73
1997 4.00 1.60 4.79 1.75 5.51 7.30 12.16 6.22
Source: NCVER Audit Verification Reports
Table 9.3: Vocational Education and Training Participation Rates
Males by Age and State/Territory, 1997 (Per Cent)
Age NSW VIC QLD SA WA TAS NT ACT AUS
15 7.5 5.5 7.0 5.3 5.9 2.1 7.6 1.1 6.3
16 20.5 14.4 16.7 11.0 15.5 18.8 18.0 4.3 16.7
17 25.1 20.6 20.8 17.6 26.5 25.5 19.4 8.5 22.4
18 34.1 38.4 22.2 26.6 33.8 29.0 22.8 26.3 31.9
19 32.0 38.1 19.4 26.5 29.1 26.6 24.4 26.5 30.1
20 27.0 33.8 16.6 22.3 22.0 23.3 19.4 24.5 25.6
21 21.7 28.5 13.7 18.4 17.4 17.3 15.3 18.7 20.9
22 17.6 23.6 11.3 15.1 13.7 14.2 14.3 13.8 17.1
23 15.3 20.8 9.3 14.1 11.7 12.7 11.4 11.9 14.9
24 13.5 18.9 8.6 13.8 10.5 10.9 10.5 10.4 13.5
25-29 11.4 16.6 7.9 12.2 10.1 9.8 10.4 8.3 11.9
30-34 9.6 14.8 7.3 11.3 8.6 8.6 9.7 7.1 10.5
35-39 8.4 13.5 6.5 10.1 7.0 8.0 8.4 5.5 9.2
40-44 6.9 11.5 5.5 9.2 5.6 6.5 7.9 4.2 7.8
45-54 5.1 8.7 4.1 6.9 3.9 4.5 5.7 2.6 5.8
55-64 2.8 4.2 1.9 3.9 2.0 1.8 3.1 1.5 3.0
65+ 0.9 1.0 0.3 1.2 0.5 0.2 0.9 0.4 0.8
15-64 10.1 14.0 7.4 10.4 8.7 8.7 9.7 7.3 10.4
Source: Derived using NCVER data and ABS 1997 June Quarter Estimated Resident Population data by sex/age
:

Table 9.4: Vocational Education and Training Participation Rates
Females by Age and State/Territory, 1997 (Per Cent)
Age NSW VIC QLD SA WA TAS NT ACT AUS7.7 3.8 5.7 3.5 3.9 1.0 6.2 1.0 5.3
16. 19.4 8.2 12.7 7.2 8.9 14.5 15.2 3.3 12.917 21.3 11.1 16.0 12.3 18.9 17.5 14.5 7.6 16.418 28.9 27.8 16.6 21.8 25.3 21.8 20.0 23.3 25.019 24.1 27.1 13.6 20.1 19.1 17.4 19.3 21.8 21.820 19.7 21.6 11.2 18.9 14.9 13.6 13.9 17.5 17.821 17.4 18.0 9.9 18.0 12.8 11.9 13.5 12.4 15.422 15.3 16.4 8.9 15.8 11.2 10.4 12.3 10.3 13.723 14.8 15.3 8.3 15.1 10.8 8.9 10.9 10.0 13.024 13.5 14.8 7.6 14.6 9.8 8.2 11.5 9.1 12.2
25-29 11.7 12.0 6.6 13.4 8.4 7.3 10.5 7.6 10.530-34 10.7 10.7 6.1 12.7 7.8 6.7 9.8 6.5 9.535-39 10.5 11.5 6.5 13.0 7.7 6.9 10.3 6.2 9.740-44 9.7 11.2 6.4 12.5 7.0 6.9 9.5 5.5 9.345-54 7.2 8.3 4.6 10.1 4.8 4.3 7.7 3.5 6.955-64 3.3 3.8 1.6 5.0 2.1 1.1 3.9 1.3 3.165+ 0.7 1.1 0.2 1.2 0.4 0.1 1.2 0.2 0.7
15-64 10.6 10.9 6.5 11.6 7.8 6.8 10.1 6.7 9.5
Source: Derived using NCVER data and ABS 1997 June Quarter Estimated Resident Population data by sex/age
Table 9.5: Vocational Education and Training Participation Rates
All Persons by Age and State/Terrztory, 1997 (Per Cent)
Age NSW VIC QLD SA WA TAS NT ACT AUS15 7.7 4.7 6.4 4.4 4.9 1.5 6.9 1.0 5.916 20.2 11.4 14.8 9.1 12.3 16.7 16.7 3.8 14.917 23.5 16.0 18.4 15.0 22.8 21.6 17.1 8.1 19.618 32.0 33.3 19.5 24.3 29.6 25.5 21.5 24.8 28.719 28.4 32.7 16.6 23.4 24.3 22.2 22.0 24.2 26.120 23.7 27.8 14.0 20.6 18.5 18.5 16.9 21.1 21.821 19.7 23.3 11.8 18.2 15.1 14.7 14.5 15.6 18.322 16.6 20.1 10.2 15.5 12.5 12.3 13.3 12.1 15.523 15.2 18.1 8.9 14.6 11.3 10.8 11.2 11.0 14.024 13.6 16.9 8.1 14.2 10.2 9.5 11.0 9.8 12.9
25-29 11.6 14.2 7.3 12.8 9.3 8.5 10.4 8.0 11.230-34 10.2 12.8 6.7 12.0 8.2 7.6 9.7 6.8 10.035-39 9.5 12.5 6.5 11.6 7.4 7.4 9.3 5.9 9.540-44 8.3 11.3 6.0 10.9 6.3 6.7 8.6 4.9 8.545-54 6.2 8.5 4.3 8.5 4.3 4.4 6.6 3.0 6.355-64 3.0 4.0 1.8 4.4 2.0 1.4 3.4 1.4 3.065+ 0.8 1.1 0.3 1.2 0.4 0.2 1.0 0.3 0.7
15-64 10.4 12.4 7.0 11.0 8.2 7.7 9.9 7.0 10.0
Source: Derived using NCVER data and ABS 1997.June Quarter Est' ed Resident Population data by sex/age

Table 9.6: Vocational Education and Training Participation Rates
Males by Age and State/Territmy, 1996 (Per Cent)
Age NSW VIC QLD SA WA TAS NT ACT AUS
15 6.7 4.7 10.7 3.4 5.6 1.2 11.4 1.1 6.4
16 20.9 12.9 27.8 8.9 14.1 18.2 17.8 5.2 18.3
17 24.5 18.9 29.6 17.0 25.3 24.5 21.7 10.9 23.3
18 33.2 33.9 27.3 26.0 31.8 28.7 30.1 27.3 31.3
19 31.5 35.7 24.4 25.2 27.7 26.6 27.7 31.0 30.2
20 26.9 32.2 19.9 22.0 21.6 21.0 25.7 26.7 25.8
21 21.4 26.4 16.0 17.3 15.6 17.5 22.1 18.7 20.6
22 16.9 21.2 12.7 14.6 11.9 13.8 20.1 12.8 16.4
23 14.3 18.1 10.6 13.2 11.0 11.5 16.1 11.5 14.0
24 12.9 16.5 9.4 11.9 10.1 10.8 16.3 8.5 12.7
25-29 11.1 15.4 8.6 10.9 9.0 9.6 15.4 8.6 11.4
30-34 9.9 14.0 7.7 9.7 7.8 8.7 12.8 6.8 10.2
35-39 8.4 12.9 7.0 8.8 6.4 7.2 11.6 5.6 9.1
40-44 6.9 11.0 6.1 7.4 5.2 5.5 9.0 5.0 7.6
45-54 4.8 13.2 4.4 5.4 3.6 3.7 6.7 2.8 5.4
55-64 2.6 3.9 2.0 2.5 1.7 1.4 3.1 1.6 2.7
65+ 0.9 1.0 0.3 0.7 1.5 0.1 1.3 0.2 0.8
15-64 10.0 14.1 8.7 9.0 8.1 8.2 12.4 7.8 10.2
Source: Derived using NCVER data and ABS 1996 June Quarter Estimated Resident Population data by sex/age
Table 9.7: Vocational Education and Training Participation Rates
Females by Age and State/Territory, 1996 (Per Cent)
Age NSW VIC QLD SA WA TAS NT ACT AUS
15 6.6 3.3 10.9 3.0 3.5 0.6 6.5 2.5 5.8
16 19.6 7.7 25.0 5.9 8.4 11.0 15.6 3.7 15.0
17 21.3 9.9 23.8 13.4 17.9 15.9 21.9 8.2 17.7
18 27.6 23.3 20.3 20.2 23.1 19.8 26.7 24.1 23.8
19 23.8 22.9 16.2 18.2 18.5 15.9 19.2 23.6 20.9
20 19.7 19.3 12.9 16.8 14.6 13.8 19.3 16.7 17.3
21 17.0 16.9 10.8 14.6 12.2 12.1 16.8 12.8 14.9
22 15.5 15.2 9.7 13.6 10.8 11.1 14.8 11.6 13.5
23 14.0 14.3 8.9 13.3 10.0 9.4 13.0 9.0 12.5
24 13.5 13.0 7.9 11.9 8.9 7.6 13.1 8.2 11.5
25-29 11.6 11.4 6.9 10.5 7.9 6.8 12.6 7.7 10.1
30-34 10.7 10.5 6.2 9.6 7.3 6.4 11.6 6.1 9.2
35-39 10.6 11.4 6.3 9.7 7.2 6.9 10.5 6.4 9.5
40-44 9.6 10.7 5.9 9.3 6.4 6.8 9.7 5.5 8.7
45-54 7.0 7.9 4.2 6.8 4.4 3.9 7.7 3.7 6.3
55-64 3.2 3.8 1.5 2.9 1.8 1.1 3.4 1.5 2.8
65+ 0.7 1.2 0.3 0.7 1.0 0.1 1.5 0.3 0.7
15-64 10.5 10.3 7.2 8.9 7.3 6.4 11.2 7.0 9.2
Source: Derived using NCVER data and ABS j996 June Quarter Estimated Resident Population data by sex/age

Table 9.8: Vocational Education and Training Participation Rates
All Persons by Age and State/Territory, 1996 (Per Cent)
Age NSW VIC QLD SA WA TAS NT ACT AU
15 6.7 4.0 10.8 3.2 4.6 0.9 9.1 1.8 6.1
16 20.6 10.4 26.4 7.5 11.3 14.7 16.8 4.5 16.8
17 23.3 14.5 26.8 15.3 21.7 20.3 21.8 9.6 20.7
18 31.4 28.8 23.8 23.2 27.6 24.4 28.5 25.7 28.0
19 28.3 29.5 20.4 21.8 23.2 21.5 23.6 27.3 25.8
20 23.7 25.8 16.5 19.4 18.2 17.6 22.6 21.8 21.8
21 19.4 21.7 13.5 16.0 13.9 14.9 19.6 15.8 17.9
22 16.4 18.2 11.2 14.1 11.3 12.5 17.4 12.3 15.0
23 14.3 16.2 9.8 13.2 10.5 10.5 14.6 10.3 13.3
24 13.3 14.8 8.7 11.9 9.6 9.2 14.7 8.4 12.1
25-29 11.4 13.4 7.8 10.7 8.5 8.2 13.9 8.2 10.8
30-34 10.3 12.2 7.0 9.7 7.6 7.5 12.2 6.5 9.8
35-39 9.5 12.2 6.7 9.3 6.8 7.1 11.0 6.0 9.3
40-44 8.3 10.8 6.0 8.3 5.8 6.1 9.3 5.2 8.1
45-54 5.9 9.9 4.3 6.1 4.0 3.8 7.1 3.3 5.E
55-64 2.9 3.8 1.8 2.7 1.7 1.2 3.2 1.6 2.E
65+ 0.8 1.1 0.3 0.7 1.2 0.1 1.4 0.2 0.
15-64 10.3 12.1 8.0 9.0 7.7 7.3 11.8 7.4 9.;
Source: Derived using NCVER data and ABS 1996 June
'Qualifications', 'Modules' and 'Units ofCompetency' Definitions
Qualification
National qualifications are defined in accordance with
the Australian Qualifications Framework which provides
a single, coherent framework for all recognised
qualifications from senior secondary certification todoctorates. Within the vocational education and training
sector the following nationally recognised qualifications
may be issued: Certificate I, Certificate II, Certificate
III, Certificate IV, Diploma, and Advanced Diploma.
Under the AQF, qualifications issued in the VET sector
must lead to the achievement of a package of
competencies. Where they are endorsed nationalcompetencies, the AQF further requires that anyqualification issued must lead to the achievement of
these competencies.
Quarter Estimated Resident Population data by sex/age
Module
A 'module' is defined as a unit of training in which
a client may enrol and be formally assessed.
Unit of Competency
A 'unit of competency' is the basic unit in thecompetency standards framework. They are the small
components which can be assessed and recognised in
the VET system, successfully completed units of whi
can be considered an output of VET.
Module Outcomes
Module load completion rate (MLCR) calculations 2
based on the curriculum hours associated with themodule enrolment data submitted to the national VI
data collection at NCVER. Table 9.10 outlines themodule outcome codes currently reported to under
AVETMISS.

Module Outcomes by Enrolments by State/Territory, 1997 and 1996
Table 9.12: Module Outcomes (Enrolments)
By State/Territory, 1997
NSW VIC QLD SA WA TAS NT ACT AUS
01 Student assessed passed 1,780,570 1,372,823 808,080 407,747 430,024 127,374 55,192 102,655 5,084,465
02 Student assessed failed 124,644 226,436 6,375 23,828 22,016 5,151 16,146 7,216 431,812
03 Student assessed
result withheld 15,023 13,659 157,374 7,401 311 <5 24 1,812 195,605
04 No assessment
satisfactory Completion
of class hours 99,692 106,796 158,988 43,759 28,867 1,045 557 4,748 444,452
05 No assessment - studies
not yet Completed 43,308 189,514 17,871 37,084 114,269 18,530 13,992 5,317 439,885
06. Status (or credit) granted
through Recognition
of Prior Learning 78,186 60,357 5,813 33,354 2,935 9,012 1,338 12,612 203,607
09 Status (or credit) granted
through Credit Transfer
arrangements 190,247 39,127 646 2,072 42,301 17,978 6,076 9,251 307,698
10 Withdrew without failure 91,649 134,215 4,111 11,214 42,434 7,149 11,099 5,664 307,535
11 Withdrew failed 317,922 64,978 44,892 9,807 13,436 19,317 191 21,566 492,109
12 Withdrew transferred 176 7,387 197 0 <5 6 76 65 7,908
90 Not stated 131,528 148,023 233,326 34,737 31,045 9,283 263 2,556 590,761
Unknown 75,875 <5 0 0 <5 1,708 5 0 77,589
All outcomes 2,948,820 2,363,319 1,437,673 611,003 727,640 216,554 104,955 173,462 8,583,426
Non-01 Invalid Module
Enrolments adjustment factor 26.32 26.70 22.83 18.50 29.50 49.33 49.50 39.00 26.59
Invalid Module Enrolments
adjustment factor 7.15 8.89 8.29 3.58 10.44 15.40 21.50 10.34 8.99
Adjusted total 2,737,979 2,153,220 1,318,490 589,129 651,674 183,205 82,390 155,526 7,811,776
Source: NCVER 1997 national VET collection, streams 2 1 0 0-45 0 0 and module only enrolments, where modulehours between 10 and 400
7 7

Table 9.10: Module Outcomes Reported to Under AVETMISS
01 Student Assessed Passed 09 Status granted Credit Transfer
02 Student assessed failed 10 Withdrew without failure
03 Student assessed result withheld 11 Withdrew failed
04 No assessment satisfactory completion of class hours 12 Withdrew transferred
05 No assessment studies not yet completed 90 Not Stated blank information
06 Status Granted Recognition of Prior Learning not provided
Owing to small differences in business practices among
the States and Territories, the meaning of some module
outcome categories may vary slightly among
jurisdictions. The effect of these differences on module
load completion rate estimates is not material.
Hours Excluded
The following hours are excluded from all calculations
involving MLCR in this chapter, namely:
module curriculum hours associated with a course
reported as a stream 1000 (recreation, leisure and
personal enrichment) course,
hours from modules consisting of less than 10 or
greater than 400 curriculum hours, and
hours associated with VET delivered in schools
(this is the first year this activity has been collected
and not all States/Territories are currently reporting
this information).
Module Outcomes Data Adjustments
The total number of hours and enrolments reported
in 1995, 1996 and 1997 as part of the national
VET collection were adjusted for invalid module
enrolments using information supplied by the
maintenance-of-effort activity measures auditors
at the National Centre for Vocational Education
Research. For further information on these
adjustments see the data adjustments notes in
this appendix for chapter 8 on unit costs.
In 1995 and 1996 Queensland reported both
Recognition for Prior Learning (06) and Credit
Transfer (09) under Student Assessed Passed (01) .
The national ratios of 06 and 09 to 01 for TAFE
providers were used to adjust TAFE Queensland
hours for 01, 06 and 09 accordingly, and to
similarly recalculate MLCR for Queensland for 1995.
Additional Notes
Table 9.11: RPL and Credit Transfer Students Not in Tuition, 1997
Students excluding
RPL/CT 482,796 409,184 205,043 134,647 104,589 24,422 14,123 17,457 1,392,261
RPL/Credit Transfer
Students 5,580 1,601 209 1,682 789 243 94 102 10,300
Students including
RPL/CT 488,376 410,785 205,252 136,329 105,378 24,665 14,217 17,559 1,402,561

Table 9.13: Module Outcomes (Enrolments)
By State/Thrritory, 1996
NSW VIC OLD SA WA TAS NT ACT AUS
01 Student assessed - passed 1,661,078 1,133,263 661,784 372,342 381,750 104,379 55,092 84,378 4,454,066
02 Student assessed - failed 118,613 190,876 8,148 21,864 11,171 2,486 10,354 6,934 370,446
03 Student assessed
result withheld 9,177 9,420 129,030 8,202 759 17 335 379 157,319
04 No assessment
satisfactory
Completion of class hours 89,531 106,754 210,522 40,169 18,206 1,274 <5 2,623 469,082
05 No assessment studies
not yet Completed 55,649 182,592 1,397 47,139 97,632 17,966 17,275 4,766 424,416
06 Status (or credit) granted
through Recognition
of Prior Learning 64,684 38,007 30,160 19,412 4,294 7,322 850 15,285 180,014
09 Status (or credit) granted
through Credit Transfer
arrangements 150,749 31,930 47,514 7,257 17,822 14,724 7,227 7,520 284,743
10 Withdrew
without failure 82,408 150,672 1,540 9,306 46,106 5,703 9,314 7,509 312,558
11 Withdrew - failed 269,240 73,432 58,318 8,952 26,342 18,722 473 19,443 474,922
12 Withdrew transferred 171 7,112 0 0 0 <5 96 250 7,630
90 Not stated 32,089 99,029 87,544 4,605 61,339 <5 6,741 331 291,679
Unknown 84,891 0 0 2,428 0 9,633 9 5,073 102,034
All outcomes 2,618,280 2,023,087 1,236,670 541,676 665,421 182,228 107,769 154,491 7,529,622
Non-01 Invalid Module
Enrolments adjustment factor 25.10 35.70 29.10 32.40 36.20 36.30 31.10 45.10 31.37
Invalid Module Enrolments
adjustment factor 7.39 13.62 11.20 10.16 14.10 12.00 15.32 13.87 10.76
Adjusted total 2,424,789 1,747,644 1,098,163 486,636 571,597 160,361 91,259 133,062 6,719,422
Source: NCVER 1996 national VET collection, streams 2 1 0 0-45 0 0 and module only enrolments, where module
hours between 1 0 and 400

Module Outcomes by AHC by State/Territory, 1997 and 1996
Table 9.14: Module Outcomes (AHC)
By State/Territory, 1997
NSW VIC QLD SA WA TAS NT ACT AUS01 Student assessed passed 60,402,368 47,273,674 26,084,482 11,636,252 14,874,311 4,106,356 1,726,418 3,353,509 169,457,37002 Student assessed failed 4,731,075 8,137,188 376,478 726,232 820,501 176,597 562,692 327,409 15,858,17203 Student assessed result
withheld 458,406 634,591 5,412,847 230,577 16,656 156 1,490 63,474 6,818,19704 No assessment satisfactor
Completion of class hours 5,781,507 5,676,529 5,550,150 1,718,380 1,955,991 60,592 21,843 252,574 21,017,56605 No assessment studies
not yet Completed 1,720,855 7,531,325 471,200 1,096,579 4,095,474 536,551 483,700 172,487 16,108,17106 Status (or credit) granted
through Recognition
of Prior Learning 2,561,240 1,932,704 158,749 900,740 99,003 282,554 44,246 334,442 6,313,67809 Status (or credit) granted
- through Credit Transfer
arrangements 6,444,279 1,236,754 23,210 52,984 1,366,309 545,140 201,815 277,733 10,148,22410 Withdrew - without failure 3,504,102 5,436,003 124,086 372,943 1,606,988 215,577 381,358 201,936 11,842,99311 Withdrew - failed 12,446,382 2,511,363 1,799,891 323,174 535,131 694,150 6,700 790,668 19,107,45912 Withdrew transferred 7,024 261,626 7,247 45 248 4,074 3,728 283,99290 Not stated 3,211,816 5,312,415 6,546,989 1,787,047 1,244,670 227,852 5,818 51,334 18,387,941
Unknown 1,871,412 96 30 65,442 16 1,936,996
All outcomes 103,140,466 85,944,268 46,555,329 18,844,908 26,615,109 6,911,215 3,440,170 5,829,294 297,280,759
Non-01 Invalid Module
Enrolments adjustment factor 26.32 26.70 22.83 18.50 29.50 49.33 49.50 39.00 26.59
Invalid Module Enrolments
adjustment factor 7.15 8.89 8.29 3.58 10.44 15.40 21.50 10.34 8.99
Adjusted total 95,765,923 78,303,823 42,695,892 18,170,260 23,836,492 5,846,888 2,700,533 5,226,545 270,555,219
Source: NCVER 1997 national VET collection, streams 2100-4500 and module only enrolments, where modulehours between 10 and 400
7 3

Table 4.3 Additional Note: Competency Rate
The mapping of module outcomes to competencycategories appears in Table 9.16, using the moduleoutcome codes as described in Table 9.10.
Table 9.16: Mapping of Module Outcomes to SkillsAcquisition
Competency Achieved or Satisfactory Completion:01 & 06
Competency Not Achieved:02 & 11
Competency Not Yet Achieved:
03, 04, 05, 09, 10 & 12
Unknown:
90 & blank.
Formula for Module Load Pass Rate (Formula I)
The calculation of the module load pass rate is based onthe module curriculum hours associated with eachmodule outcome based on formula I in 1995 VETPerformance Report, namely:
Formula I = 01 x 100
01 + 02 + 11
Module Load Pass
Formula for Module Load Completion Rate(Formula III)
The calculation of the module load completion rate isbased on the module curriculum hours associated witheach module outcome based on formula III in 1995VET Performance Report, namely:
Formula III = 01 + 04 x 100All activity 05 06 09 90 blanks
01 + 04 x 10001 + 02 +03 + 04 + 10 + 11 + 12
Data adjustments for Module Load Completion Rates:
In the 1996 Report, 'Initial Confirmed InvalidModule Enrolment' rates were used to adjust thetotal hours "All activity".
For the 1997 report, all module outcome hoursexcept 01 are adjusted by a 'non-01 Invalid ModuleEnrolment' rate. This rate is calculated on the basisof confirmed and possible invalid moduleenrolments (see data adjustments notes in thisappendix for chapter 8 on unit costs).
1996 and 1997 Module Load Completion Rate(MLCR) are comparable using the adjustment of a'non-01 Invalid Module Enrolment' rate based onconfirmed plus possible invalid module enrolments.It is not possible to calculate a rate for 1995 basedon this methodology.
and Completion Rates for Government Funded Only Programs
Table 9.17: Pass Rate for Government Funded Only Programs
By State/Territory, 1997 (Per Cent)
Pass Rate
NSW VIC QLD SA WA TAS NT ACT AUS
77.3 81.5 92.2 92.1 92.3 81.4 75.3 80.9 82.8
Table 9.18: Completion Rate for Government Funded Only Programs
By State/Territory, 1997 (Per Cent)
Completion Rate
NSW VIC QLD SA WA TAS NT ACT AUS
80.1 80.0 84.2 90.6 88.7 86.9 77.9 84.5 82.1

Table 9.15: Module Outcomes (AHC)
By StatelTerritory, 1996
NSW VIC QLD SA WA TAS NT ACT AUS
01 Student assessed passed 58,854,593 42,061,390 21,922,662 10,927,181 13,862,381 3,216,474 1,728,509 3,052,816 155,626,006
02 Student assessed failed 4,647,094 7,418,775 466,709 679,726 519,229 94,006 334,753 273,837 14,434,129
03 Student assessed
- result withheld 351,048 402,508 4,655,777 249,698 29,698 921 12,447 11,327 5,713,424
04 No assessment
- satisfactory Completion
of class hours 5,959,349 5,453,533 8,073,606 1,635,762 1,357,226 157,417 90 175,071 22,812,054
05 No assessment - studies
not yet Completed 2,739,348 8,065,989 46,028 1,354,120 3,627,414 554,552 666,120 177,458 17,231,029
06 Status (or credit) granted
- through Recognition
of Prior Learning 2,340,308 1,336,504 969,481 532,672 173,627 208,452 31,652 501,729 6,094,425
09 Status (or credit) granted
- through Credit Transfer
arrangements 5,515,702 1,165,512 1,579,079 188,344 601,667 434,017 236,602 252,906 9,973,82910 Withdrew without failure 3,308,628 6,416,753 53,642 315,269 1,724,276 182,350 336,453 286,867 12,624,238
11 Withdrew failed 11,056,878 3,090,227 2,362,101 306,248 976,427 622,411 16,731 745,807 19,176,83012 Withdrew transferred 9,528 276,934 0 0 0 30 3,970 15,387 305,849
90 Not stated 3,091,510 5,554,178 3,100,512 79,268 2,651,843 41 216,956 9,930 14,704,238
Unknown 1,963,334 0 0 117,862 0 308,700 180 139,638 2,529,714
All outcomes 99,837,320 81,242,303 43,252,124 16,386,150 25,523,788 5,779,371 3,584,463 5,642,773 281,248,292
Non-01 Invalid Module
Enrolments adjustment factor 25.10 35.70 29.10 32.40 36.20 36.30 31.10 45.10 31.37
Invalid Module Enrolrnents
adjustment factor 7.39 13.62 11.20 10.16 14.10 12.00 15.32 13.87 10.76
Adjusted total 92,459,342 70,181,163 38,407,886 14,721,153 21,924,934 5,085,846 3,035,323 4,860,064 250,985,486
Source: NCVER 1996 national VET collection, streams 2100-4500 and module only enrolments, where modulehours between 10 and 400
8

Revision of 1995 Figures
The 1995 figures reported in the 1995 PerformanceReport have been revised to include:
final audit figures, as only preliminary data was
available at the time of publishing
adjustment to Queensland for both recognitionof prior learning (06) and credit transfer (09),which was reported under 'student assessed-passed'
(01) for 1995,
changes to formula III with module outcome 05 andblanks now also excluded from the denominator, and
module only activity included (that is moduleswithout corresponding course enrolments).
Revision of 1996 Figures
The 1996 figures reported in the 1996 PerformanceReport have been revised to include:
use of final audit figures for 1996, as only preliminary
data were available at the time of publishing,
change to adjustments made for invalid moduleenrolments for formula III (see above), and
the addition of 'possible' invalid module enrolments
for data adjustments.
Module Load Pass and Completion Ratesfor 1997 and 1996 Using the Same DataCollection Base as for 1995
Direct comparisons of 1995 and 1996 and 1997 dataare not possible for a number of reasons. There has been
a change in the scope of the data collected with the
introduction of private provider and publicly-fundedactivity along with increased reporting from communitybased providers. Module load pass and completion ratefigures for 1997 calculated on the same reporting basis
as for 1995 follow.
Table 9.19: Vocational Education and Training Pass Rates
By State/Territog, 1997 (Per Cent), same collection base as 1995
NSW VIC QLD SA
Pass Rate
WA TAS NT ACT AUS
77.7 81.0 92.2 91.7 91.6 78.6 74.1 74.4 82.6
Table 9.20: Vocational Education and Training Completion Rates
By State/Territog, 1997 (Per Cent), same collection base as 1995
NSW VIC QLD SA
Completion Rate
WA TAS NT ACT AUS
80.6 80.1 83.4 90.5 88.6 85.4 77.6 80.3 82.2

Figure 9.21: Recoding of Qualifications used in Figure 4.4
1 Diplomas 10 Diploma
20 Associate Diploma86 AQF - Diploma87 AQF - Advanced Diploma
2 AQF Certificate IV & Equivalent 31 Advanced Certificate
32 Advanced Certificate Other85 AQF Certificate IV
3 AQF Certificate III & Equivalent 41 Certificate - Trade84 AQF - Certificate III
4 AQF Certificates I & II 82 AQF - Certificate I
83 AQF Certificate II
5 Senior Secondary 81 AQF - Senior Secondary
6 Other Certificates, Endorsements and Other 42 Certificate - Not Elsewhere Classified70 Certificate of Competency80 Certificate of Proficiency
50 Endorsements to Certificates90 Other
7 Statements of Attainment 60 Statement of Attainment
8 Non Award Courses 99 Non Applicable (ie. Not an award course)
5 WHAT EMPLOYERS THINK ABOUT VET
Data Source
Data for this chapter was sourced from the 1997
National Employer Satisfaction Survey which surveyed
more than 2,600 employers nationally on their attitudestowards and satisfaction with the VET system. Thesurvey covered not only employers' views on VETproviders in receipt of public funds, but encompassedall providers of VET training. In-scope employers weredefined as those who had at least one employee who
had graduated from a VET course of at least 200 hoursduration within the last two years. Those surveyedtended to be human resource managers (or equivalent)in larger organisations and general managers (or
equivalent) in smaller establishments. Of the 76,860employers contacted for the 1997 National Employer
Satisfaction Survey, 16,602 (22%) were in-scope. In-scope employers included those who had employed
graduates from VET system-wide courses, not justTAFE courses, although 80% of respondents indicatedthat they had employed at least one recent TAFE graduate.
The response rate for in-scope employers was 16%.
6 WHAT STUDENTS GET OUT OF VET
Data Source
Data for this chapter was principally sourced from the
1997 TAFE Graduate Destination Survey (GDS) which,in May 1997, surveyed 110,409 TAFE students whohad completed a certificate, advanced certificate,
associate diploma, diploma or advanced diploma ofatleast 200 hours or one semester in duration at sometime during 1996. Some 60,746 such studentsresponded resulting in a national response rate of 55%.The survey is unweighted for non-responses and careshould be exercised when drawing inferences withrespect to the entire graduate population.

Additional Notes
The occupational outcomes of TAFE graduaterespondents provide only a partial representation of theoccupational outcomes achieved by all participants in
vocational education and training who completed aprogram during 1996. The occupational outcomes ofTAFE graduates who did not respond to the GraduateDestination Survey, together with the outcomes of those
who completed a program with a private trainingprovider are unknown and thereby not included in
this section.
7 WHAT VET PROVIDES FORPARTICULAR CLIENT GROUPS
Data Source
The principal data source was the NCVER's nationalcollection along with ABS population data and client
group data available from the 1997 TAFE Graduate
Destination Survey.
Table 9.22 reports the percentage change between 1996and 1997 in the proportion of students whose 'clientgroup was not reported'.
Table 9.22: Percentage Change in 'Students with Client Group Not Reported'
By Equity Client Group and State/Territory, All ages, 1996 to 1997 (Per Cent)
NSW VIC QLD SA WA TAS NT ACT AUS
Aboriginal and Torres Strait Islanders 0.8 -1.7 -13.0 12.9 -9.1 0.7 -16.6 -3.4 -1.6
NESB (Language Spoken at Home) 1.8 -1.7 -15.3 12.4 11.7 -0.2 -19.5 -0.1 -0.1
NESB (Country of Birth) 1.7 -1.2 -5.7 12.6 11.6 0.2 1.1 -0.5 1.7
People With a Disability -3.3 -10.2 -4.4 15.7 -2.4 -21.4 -3.5 -8.8
*The change between 1996 and 1997 for Western Australia is not reported due to a system default to 'Students
reported as not having a disability' in 1997.
Definition of Regions
The Geographic Region classification has been
developed to provide geographic location informationabout vocational education and training students. TheDepartment of Primary Industries and Energy (DPIE)and the Department of Employment, Education,Training and Youth Affairs (DEETYA), have developedgeographic classifications based on Statistical Local
Areas (SLAs). The four classifications listed below are
derived by mapping the student's residential postcode toa SLA and then grouping the appropriate DPIE orDEET geographic regions. These geographic regions
were produced at NCVER.
Capital City
Consists of:
ABS State and Territory Capital City StatisticalDivisions (Sydney, Melbourne, Brisbane, Adelaide,
Perth, Hobart, Darwin and Canberra).
DPIE rural, remote and metropolitan zonesclassification: Capital City
DEET rural/remote classification: Capital.
Other Metropolitan
Includes Statistical Divisions associated with urban
centres of population greater than 100,000(Geelong, Newcastle, Wollongong, Gold Coast and
Tweed, Townsville-Thuringowa and Queanbeyan).
DPIE rural, remote and metropolitan zonesclassification: Other Metropolitan
DEET rural/remote classification: Urban.
8 4

Rural
Consists of SLAs associated with Urban centres
of population 5,000 or more and not classified as
Remote (Albury-Wodonga,Dubbo, Lismore,
Orange, Port Macquarie, Tamworth, Wagga Wagga,
Ballarat, Bendigo, Shepparton-Mooroopna,
Bundaberg, Cairns, Mackay, Maroochydore-
Mooloolaba, Rockhampton,Toowoomba, Whyalla,
Bunbury, Launceston, Bathurst, Wangaratta,
Morwell, Gladstone, Mount Gambier, Mandurah,
Devonport, Blayney, Bairnsdale, Banana, Berri,
Busse lton, Scottsdale and Litchfield).
DPIE rural, remote and metropolitan zones
classification: Large Rural Centre, Small Rural
Centre, Other Rural Area
DEET rural/remote classification: Provincial,
Rural, Agricultural.
Remote
Contains urban centres with an Index of Remoteness
greater than 10.5 (Blackwater, Bowen, Emerald,
Mareeba, Moranbah, Mount Isa, Roma, Broome,
Carnarvon, East Pilbara, Esperance, Kalgoorlie/
Boulder, Karratha, Port Hedland, Alice Springs,
Katherine, Brewarrina,Walgett, Orbost, Bou lia,
Coober Pedy, Exmouth, Strahan and Jabiru). The
Index of Remoteness defines the boundary between
rural and remote areas of Australia and is based on
the distance and population density characteristics
of the area of interest.
DPIE rural, remote and metropolitan zones
classification: Large Remote Centre, Other
Remote Centre
DEET rural/remote classification: Remote, Isolated.
8 PUBLIC INVESTMENT IN TRAINING
AUSTRALIANS
Data Source
Unit cost estimates are based on maintenance-of-effort
financial and activity data supplied by ANTA. Both sets
of figures are audited.
Data Adjustments
When students undertake vocational education and
training programs they formally enrol in a set of
modules (subjects) which make up the program. This
process involvescompleting an enrolment form, gainin
approval from the provider, and paying the required
fees. This enrolment process usually happens sometinn
before classes actually start. For example, in TAFE
institutes most students enrol at the beginning of each
year or each semester, and they pay their fees at the
same time.
However, when classes commence, some students do
not start all of the modules for which they are enrollt
In a small proportion of cases they may decide not tc
study at all. However, more commonly, students whc
have enrolled in, say,four modules will opt to take o
two or three. The student record systems which VE-1
providers use are sometimes unable to exclude such
enrolments when the information required for the
national collection of VET data is reported to NCV
As a result, the data for each calendar year contain
small number ofsubject enrolments where the stud
has not attended any classes or submitted any work
where the enrolment has been created in error.
The NCVER conducts activity audits on an annua
basis as part of the maintenance-of-effort requirern
of the ANTAAgreement and addresses the robust,
of the data with respect to invalid module enrolm
(IME). The rate ofinvalid module enrolments is
outlined in Table 9.23 below. This table also outli
the 'non-01 invalidenrolment' rate, which is usec
in the calculation of module load completion ran
1997, module enrolments associated with an '01'
module outcome wereassumed to be valid, henc,
01' invalid enrolment rate can also be calculated .
used in the calculation of module load completic

Table 9.23: Adjustment Factors for Invalid Module Enrolments
By State/Territory 1996 and 1997 (Per cent)
NSW VIC QLD SA WA TAS NT ACT AUS
Final 1996 7.39 13.62 11.20 10.16 14.13 12.00 15.32 13.87 10.76
Final Non-01 1996 25.10 35.70 29.10 32.40 36.20 36.30 31.10 45.10 31.37
Final 1997 7.15 8.89 8.29 3.58 10.44 15.36 21.15 10.34 8.23
Final Non-01 1997 26.32 26.70 22.83 18.50 29.50 49.33 49.50 39.00 26.59
Source: ANTA
Financial Data
To promote the comparability of financial data amongthe States and Territories, the following adjustmentshave been made.
In Victoria, inclusion of the contribution made bythe Department of Education to the head office costsof the Office of Training and Further Education
In States/Territories which have the capacity toidentify specific amounts, removal of one-offpayments (redundancy and other).
Activity Data
To promote comparability of activity data, the followingadjustments have been made.
Total activity has been adjusted for invalid moduleenrolments (formerly known as 'module enrolments- no attendance') based on information supplied by
the NCVER maintenance-of-effort activitymeasures auditors.
The adjustment for invalid module enrolmentsincludes, where applicable, an adjustment forenrolments (such as 'missing marks' ) which havenot been reported by training organisations eventhough there has been some attendance orsubmission of work by the client.
For module enrolments reported with an outcomeof RPL (recognition of prior learning) hours havebeen counted using the formula of five hours plus10 per cent of module curriculum hours to amaximum of 10 hours (for modules of less than fivecurriculum hours, the full curriculum hours are used).
Additional Notes
The following national cost relativities, developed in1996, were used to determine the course-mix weightingsfor each State and Territory. Updated information wasnot able to be provided by all States and Territories.For 1997, some jurisdictions suggested their relatiYities
would, in all likelihood, not have changed significantlyfrom those provided in the previous year.
Next year however, course mix weightings will beupdated to take account of shifts in training areaprofiles that are due to the introduction of new ASCOcodes recently released by the ABS. The revisedweightings will be applied to 1997 final audited dataonwards that is based on the new ASCO codes.Currently available 1997 data is based on the old ASCOcodes to which the current relativities apply.
Table 9.24: Index of National VET Cost Relativities
By Training Area
Category A
Weight
Arts, Entertainment, Sports & Rec 1.03
Automotive 1.33
Building and Construction 1.16
Community Services, Health & Ed 0.91
Finance, Banking & Insurance 0.68
Food Processing 1.14
TCF and Furnishings 1.18
Communications 1.16
'Engineering and Mining 1.28
Primary Industry 1.12
Process Manufacturing 1.16
Sales and Personal Service 0.94
Tourism and Hospitality 1.10
Transport and Storage 1.20
Utilities 1.29
Category BBusiness and Clerical 0.79
Computing 0.84
Science, Technical and Other 1.06
Category CGeneral Education and Training 0.85
TOTAL 1.00
Source: Derived by ANTA from information provided
by the Unit Cost Working Party
8G

Comparison of Unit Costs from 1995 to 1997(in 1997 prices)
Detailed calculations of unit costs over the period1995 to 1997 are provided below. The information
for 1997 unit costs is sourced from interim audit
information. Final audited information in relation
Table 9.25: Unit Costs Calculations
By State/Territory, 1995 to 1997, (1997 prices)
to unit costs in both 1995 and 1996 has also been
reported. All years are adjusted for course-mix
weightings and reported in 1997 prices.
1995 NSW VIC QLD SA WA TAS NT ACT AUSTRecurrent Expenditure ($m)Recurrent Expenditure in1997 Prices ($m)AHC ( '000)Invalid enrolment (%)$ per Adjusted AHCCourse-mix weighting
895.93 509.63 333.11 184.80 228.50 57.16 45.99 55.79 2,310.93
938.94 534.09 349.11 193.68 239.47 59.91 48.20 58.47 2,421.8786,797 62,291 33,635 14,305 19,803 3,671 2,656 3,716 226,874
1.00 8.60 6.68 1.20 6.90 0.69 8.19 3.80 4.5810.93 9.38 11.12 13.70 12.99 16.43 19.77 16.36 11.190.98 1.02 0.99 1.02 1.00 1.04 0.99 1.02 1.00
$/Adjusted AHC(course-mix weighted) 11.1 9.2 11.2 13.4 13.0 15.8 19.9 16.0 11.2
1996 NSW VIC QLD SA WA TAS NT ACT AUSTRecurrent Expenditure ($m)Recurrent Expenditure in1997 Prices ($m)AHC ( '000)Invalid enrolment (%)VAdjusted AHCCourse-mix weighting
932.09 541.99 367.37 190.71 224.45 57.12 47.42 57.18 2,418.34
949.24 551.96 374.12 194.22 228.58 58.17 48.29 58.23 2,462.8286,932 65,072 35,785 14,688 21,463 4,140 2,414 3,999 234,494
7.39 13.62 11.20 10.16 14.13 12.00 15.32 13.87 10.7611.79 9.82 11.77 14.72 12.40 15.97 23.62 16.91 11.77
0.98 1.01 1.00 1.02 0.99 1.04 1.01 1.00 1.00VAdjusted AHC(course-mix weighted) 12.0 9.7 11.7 14.5 12.5 15.4 23.5 16.8 11.8
1997 NSW VIC QLD SA WA TAS NT ACT AUSTRecurrent Expenditure ($m)AHC ( '000)Invalid enrolment (%)$/Adjusted AHCCourse-mix weighting
977.33 562.62 419.97 199.44 249.61 58.40 51.71 59.10 2,578.1789,735 68,643 38,703 15,963 21,831 4,577 2,537 4,383 246,372
7.15 8.89 8.29 3.58 10.44 15.36 21.15 10.34 8.2311.73 9.00 11.83 12.96 12.77 15.08 25.85 15.04 11.400.97 1.01 1.01 1.01 1.03 1.03 0.98 0.97 1.00
$/Adjusted AHC(course-mix weighted) 12.0 8.9 11.7 12.8 12.4 14.6 26.5 15.6 11.4
Note: The ACT has asked that the following be noted:
The ACT reports Scheduled Hours and not Curriculum Hours in its Profile and Maintenance of Effort reportsto ANTA. Scheduled Hours are lower than Curriculum Hours. Replacing Scheduled Hours with CurriculumHours will reduce the reported ACT Unit Costs.
While the agreed methodology is to adjust hours according to the Invalid Module Enrolment Rate, the ACTbelieves that the Invalid Module Hours Rate should be used to adjust Annual Curriculum Hours. This was assessedin the 1997 ACT Audit Report at 8.43%. The lower Invalid Hours Rate of 8.43% compared to the Invalid ModuleEnrolment Rate of 10.34% is due to the systematic tendency for invalidmodule enrolments to occur in modulesof short duration. Adjusting the reported hours for the ACT by 8.34% will reduce the reported ACT Unit Costs.
The adjusted ACT Unit Cost addressing both bf these factors is $14.63, compared with the reported figureof $15.60, a reduction of 6%. This does not include any adjustments due to the Commonwealth GrantsCommission Disability Factor.
8 7

What are the unit costs of Successful Module Completions?
Table 9.26: Data Used to Calculate Government Recurrent Expenditure Per Hour of Successful ModuleCompletion in Government-Funded Programs
By State/Territog
NSW VIC QLD SA WA TAS NT ACT AUS
Student assessed
passed (01) 55,796,178 40,738,689 22,639,295 10,636,574 13,622,665 2,946,150 1,396,397 2,895,372 150,671,320
Student not assessed
- satisfactory
completion of
class hours (04) 4,951,830 3,820,546 3,847,627 665,570 772,891 15,121 1,425 205,554 14,280,564
Total
(01 Funding source) 96,432,711 72,695,261 39,328,940 16,687,788 22,741,423 5,383,499 2,756,925 4,757,432 260,783,979
True Total 89,734,546 68,642,945 38,702,514 15,963,422 21,831,497 4,576,650 2,537,139 4,382,939 246,371,652
Adjusted module
load Completion
(01+04) (to true total) 56,528,484 42,075,330 26,065,042 10,811,552 13,819,563 2,517,452 1,286,386 2,856,829 155,960,638
Course mix weighting 0.97 1.01 1.01 1.01 1.03 1.03 0.98 0.97 1.00
Adjusted module
load completion
(to true total plus
course mix) 55,076,900 42,546,668 26,345,873 10,909,421 14,183,250 2,603,179 1,255,242 2,760,952 155,676,485
Recurrent
expenditure ($m) 977.33 562.62 419.97 199.44 249.61 58.40 51.71 59.10 2,578.17
$ per Govt funded
MLC in 1997 prices
(course mix adjusted) 17.74 13.22 15.94 18.29 17.60 22.44 41.20 21.40 16.56
8 3

IIIIIIIIIIIIIIIIIIIIIIIIIIII
Table 9.27: Data Used to Calculate Government Recurrent Expenditure Per Hour of Successful ModuleCompletion in All Programs
By State/Territory
Student assessed
NSW VIC QLD SA WA TAS NT ACT AUS
- passed (01) 61,475,784 49,291,383 27,360,350 11,885,677 15,182,696 4,194,036 1,754,685 3,426,364 174,570,975
Student not assessed
satisfactory
completion of
class hours (04) 5,848,658 6,210,975 5,847,598 1,758,816 2,011,599 60,731 21,843 255,303 22,015,523
Total Module
Load Completion 105,231,272 90,570,555 48,743,324 19,790,648 27,497,286 7,058,633 3,482,042 5,944,824 308,318,584
Course mix weighting 0.97 1.01 1.01 1.01 1.03 1.03 0.98 0.97 1.00
Adjusted Moduk
load Completion
(course mix) 65,595,631 56,124,109 33,565,738 13,761,696 17,646,794 4,399,654 1,733,517 3,558,108 196,385,248
Recurrent
expenditure ($m) 977.33 562.62 419.97 199.44 249.61 58.40 51.71 59.10 2,578.17
$ per all MLC in
1997 prices (course
mix adjusted) 14.90 10.02 12.51 14.49 14.14 13.27 29.83 16.61 13.13
83

WHAT DOES THE COMMONWEALTHGRANTS COMMISSION SAY ABOUTINTERSTATE DIFFERENCES IN VET?
Commonwealth Grants Commission's Service DeliveryCosts: An Outline
The Commonwealth Grants Commission has theresponsibility to advise the Commonwealth Governmenton cost differentials across the States/Territories. The
Commission has a mandate to analyse why someStates/Territories spend less, and others more, thanthe Commission's assessment of what they need tospend to provide a standard level of service at an averagelevel of efficiency.
The Commission analyses the relative expenditure on abroad range of government goods and services and uses
a range of "disability" factors to weight State/Territory
grants. These are of two types: those factors which are
program cost related and those that are demand related.
The Commonwealth Grants Commission costfactors are:
Administrative scale
dispersion
service delivery scale
input costs
socio-economic composition
The Commonwealth Grants Commission demandfactors are:
relevant population
age/sex composition
urbanisation
cross border
economic environment
These weightings differ to those used in the VETsector. The VET weightings used in this report arecourse-mix weightings.
The VET cost factor weightings have been usedby ANTA in analysing inter-jurisdictional differences
in costs.
Table 9.28 shows the 1996 weightings for TAFE costfactors. Notwithstanding the comprehensive analysisundertaken by the Commission, the weightings indicatethat, excluding the Northern Territory, there is only amodest variation among jurisdictions.
Table 9.28: 1997 TAFE Cost Factors Using the Methodology Developed for the 1993 Review
By State/Territoy
NSW VIC QLD SA WA TAS NT ACT AUS
0.996 0.970 0.996 1.010 1.031 1.058 1.473 1.017 1.000
9 0

WHAT DID THE SECTOR PLAN TO DELIVER IN 1997?
Table 9.29: Distribution of Planned Activity (AHC) in 1997
By Occupational Level, By State/Territory, (Per Cent)
NSW VIC QLD SA WA TAS NT ACT AUS
Module Only Activity 0.0 0.0 0.0 16.7 0.0 1.5 0.0 0.0 1.1General / Unspecified 23.7 17.6 18.2 7.9 10.9 4.9 14.4 12.1 18.4Operative / Clerical 26.9 21.7 38.0 20.7 23.9 29.2 54.4 32.7 27.0Trades / Skilled 19.0 17.5 17.3 23.9 27.3 29.5 12.9 22.9 19.6Prof / Para-professional 30.4 43.1 26.5 30.7 37.9 34.8 18.3 32.3 33.9
Total 100.0 100.0 100.0 100.0 100.0 100.0 100.0 100.0 100.0
Table 9.30: Distribution of Planned Activity (AHC) in 1997
By Training Area, By State/Territory, (Per Cent)
Category A
NSW VIC QLD SA WA TAS NT ACT AUS
Arts, Entertainment, Sports & Rec 4.3 5.7 3.8 5.8 10.1 4.8 6.5 5.6 5.3Automotive 2.9 3.9 2.8 6.2 3.5 3.5 3.4 3.0 3.4Building and Construction 6.9 6.1 7.6 4.2 6.7 5.7 4.5 9.3 6.6Community Services, Health & Ed 7.8 10.2 11.3 8.5 11.9 11.1 13.3 8.7 9.6Finance, Banking & Insurance 1.7 1.1 0.6 1.1 1.0 0.8 0.2 0.3 1.2Food Processing 1.0 1.9 1.2 2.6 0.6 2.5 0.2 0.9 1.4TCF and Furnishings 1.5 2.0 2.2 3.2 2.7 3.5 1.7 2.3 2.0Communications 0.8 0.7 0.6 1.6 0.9 0.5 0.0 2.0 0.8Engineering and Mining 5.2 6.9 6.2 5.1 9.6 11.3 6.3 2.4 6.3Primary Industry 4.5 4.9 5.8 6.8 5.1 6.0 10.5 4.0 5.1Process Manufacturing 0.3 0.3 0.1 0.3 0.0 0.1 0.0 0.0 0.2Sales and Personal Service 2.3 3.0 4.9 3:8 2.1 4.8 2.3 2.4 3.0Tourism and Hospitality 6.6 7.9 9.5 6.7 7.3 8.9 10.7 11.2 7.7Transport and Storage 0.4 0.9 1.0 0.9 0.8 0.0 0.2 0.4 0.7Utilities 4.1 5.8 3.2 4.7 5.7 5.0 5.0 6.1 4.7Category B
Business and Clerical 21.0 15.5 14.7 17.8 13.5 15.5 12.7 15.6 17.3Computing 5.5 5.6 4.5 6.0 5.1 5.7 4.8 7.6 5.4Science, Technical and Other 3.6 3.7 8.6 1.6 2.5 4.3 0.0 4.6 4.2Category CGeneral Education and Training 19.6 13.8 11.3 13.2 10.9 5.9 14.4 9.2 15.0Unallocated 0.0 0.0 0.0 0.0 0.0 0.0 3.5 4.5 0.1
Total 100.0 100.0 100.0 100.0 100.0 100.0 100.0 100.0 100.0
91


4
AUSTRALIAN
NATIONAL TRAININGAUTHORITY
Australian National Training AuthorityAMP Place, 10 Eagle Street Brisbane 4000
GPO Box 3120 Brisbane 4000Telephone: (07) 3246 2300 Facsimile: (07) 3246 2490
Home Page: http://www.anta.gov.au
9 )

U.S. Department of EducationOffice of Educational Research and Improvement (OERI)
National Library of Education (NLE)Educationa/ Resources Information Center (ERIC)
NOTICE
REPRODUCTION BASIS
ERIC
This document is covered by a signed "Reproduction Release(Blanket) form (on file within the ERIC system), encompassing allor classes of documents from its source organization and, therefore,does not require a "Specific Document" Release form.
This document is Federally-funded, or carries its own permission toreproduce, or is otherwise in the public domain and, therefore, maybe reproduced by ERIC without a signed Reproduction Release form(either "Specific Document" or "Blanket").
EFF-089 (9/97)