document of the world bank · pdf filedocument of the world bank ... nuol national university...
TRANSCRIPT
Document of
The World Bank
Report No: ICR00003286
IMPLEMENTATION COMPLETION AND RESULTS REPORT
(TF-97384 TF-99625)
ON A
GRANT
IN THE AMOUNT OF US$30.0 MILLION AND
AUD 20,261,578
TO THE
LAO PEOPLE’S DEMOCRATIC REPUBLIC
FOR A
CATALYTIC FUND EFA/FTI PROGRAM
February 25, 2015
Education Global Practice
East Asia and Pacific Region
Pub
lic D
iscl
osur
e A
utho
rized
Pub
lic D
iscl
osur
e A
utho
rized
Pub
lic D
iscl
osur
e A
utho
rized
Pub
lic D
iscl
osur
e A
utho
rized
ii
CURRENCY EQUIVALENTS
(Exchange Rate Effective February 3, 2015)
Currency Unit = Kip
Kip 1,000.00 = US$0.125
US$1.00 = Kip 8,022
FISCAL YEAR
October 1 – September 30
ABBREVIATIONS AND ACRONYMS
APL Adaptable Program Loan
AusAID Australian Agency for International Development
AUD Australian Dollar
ASLO Assessment of Student Learning Outcomes
BEGP Basic Education for Girls’ Project
CAS Country Assistance Strategy
CBC Community Based Contracting
CBSRP Community Based School Readiness Program
CF Catalytic Fund
CG Community Grants
CPS Country Partnership Strategy
DA Designated Account
DESB District Education and Sports Bureau
DFAT Department of Foreign Affairs and Trade
DOI Department of Inspection
DPC Department of Planning and Cooperation
ECE Early Childhood Education
ECU ESDF Coordination Unit
EDPII Second Educational Development Project
EFA-FTI Education for All –Fast Track Initiative
EGDP Ethnic Group Development Plan
EGRA Early Grade Reading Assessment
EMIS Education Management Information System
EQS Education Quality Standards
ESDF Education Sector Development Framework
ESDP Education Sector Development Plan
ESWG Education Sector Working Group
FM Financial Management
GDP Gross Domestic Product
GER Gross Enrollment Rate
GOL Government of Lao PDR
GPE Global Partnership for Education
ICR Implementation Completion and Results
IDA International Development Association
IDF Institutional Development Fund
IMF International Monetary Fund
INT World Banks Institutional Integrity Unit
iii
IU Implementing Unit
MDGs Millennium Development Goals
MoES Ministry of Education and Sports
MoF Ministry of Finance
MTR Mid-term Review
NCCR National Center of Competence in Research
NER Net Enrollment Rate
NESRS National Education Sector Reform Strategy
NGPES National Growth and Poverty Eradication Strategy
NPEP National Poverty Eradication Program
NSEDP National Social and Economic Development Plan
NSMP National School Meal Program
NUOL National University of Laos
PAD Project Appraisal Document
PAF Performance Assessment Framework
PDO Project Development Objective
PES Provincial Education Service
PESS Provincial Education and Sports Services
PPF Project Preparation Facility
PTA Parent Teacher Association
QEA Quality at Entry Assessment
QER Quality Enhancement Review
QSA Quality of Supervision Assessment
RIES Research Institute for Education Science
RMES Results-Based Monitoring and Evaluation System
SBG School Block Grants
SBM School Based Management
SITCES Statistics and Information Technology Center of Education
and Sports
SOQ School of Quality Standards
SQAC School Quality Assurance Centre
SREAC Strategy Research Education Analysis Centre
UNICEF United Nations Children’s Fund
UPC Universal Primary Completion
VEDC Village Education Development Committee
WFP World Food Program
Vice President: Axel van Trotsenburg
Country Director: Ulrich Zachau
Practice Manager: Harry Patrinos
Project Team Leader: Omporn Regel
ICR Team Leader: Boun Oum Inthaxoum

iv
Lao People’s Democratic Republic
CATALYTIC FUND EFA/FTI PROGRAM
CONTENTS
Data Sheet
A. Basic Information
B. Key Dates
C. Ratings Summary
D. Sector and Theme Codes
E. Bank Staff
F. Results Framework Analysis
G. Ratings of Project Performance in ISRs
H. Restructuring
I. Disbursement Graph
1. Project Context, Development Objectives and Design ............................................... 1 2. Key Factors Affecting Implementation and Outcomes .............................................. 6 3. Assessment of Outcomes .......................................................................................... 17
4. Assessment of Risk to Development Outcome ......................................................... 24
5. Assessment of Bank and Borrower Performance ..................................................... 25 6. Lessons Learned ....................................................................................................... 27 7. Comments on Issues Raised by Grantee/Implementing Agencies/Donors .............. 28
Annex 1. Project Costs and Financing .......................................................................... 29 Annex 2. Outputs by Component ................................................................................. 31
Annex 3. Economic and Financial Analysis ................................................................. 44 Annex 4. Grant Preparation and Implementation Support/Supervision Processes ....... 54
Annex 5. Beneficiary Survey Results ........................................................................... 56 Annex 6. Stakeholder Workshop Report and Results ................................................... 57 Annex 7. Summary of Grantee's ICR and/or Comments on Draft ICR ........................ 58 Annex 8. Comments of Cofinanciers and Other Partners/Stakeholders ....................... 69 Annex 9. List of Supporting Documents ...................................................................... 70
MAP .............................................................................................................................. 71

v
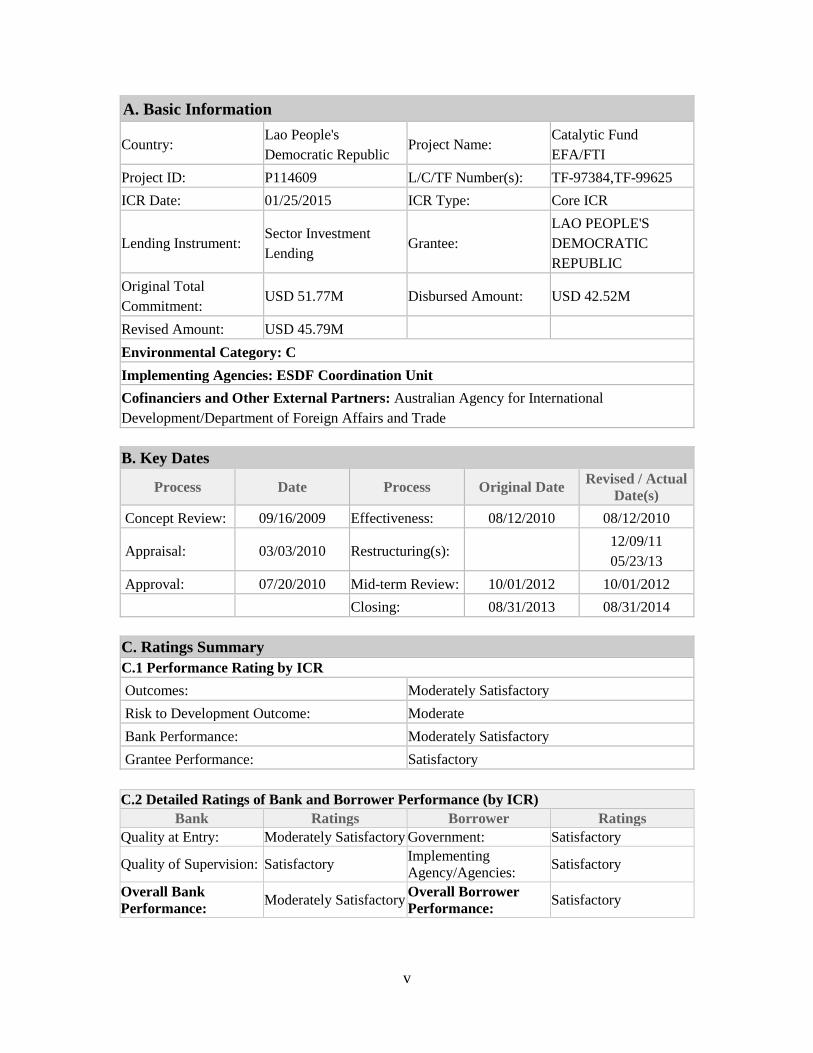
A. Basic Information
Country: Lao People's
Democratic Republic Project Name:
Catalytic Fund
EFA/FTI
Project ID: P114609 L/C/TF Number(s): TF-97384,TF-99625
ICR Date: 01/25/2015 ICR Type: Core ICR
Lending Instrument: Sector Investment
Lending Grantee:
LAO PEOPLE'S
DEMOCRATIC
REPUBLIC
Original Total
Commitment: USD 51.77M Disbursed Amount: USD 42.52M
Revised Amount: USD 45.79M
Environmental Category: C
Implementing Agencies: ESDF Coordination Unit
Cofinanciers and Other External Partners: Australian Agency for International
Development/Department of Foreign Affairs and Trade
B. Key Dates
Process Date Process Original Date Revised / Actual
Date(s)
Concept Review: 09/16/2009 Effectiveness: 08/12/2010 08/12/2010
Appraisal: 03/03/2010 Restructuring(s): 12/09/11
05/23/13
Approval: 07/20/2010 Mid-term Review: 10/01/2012 10/01/2012
Closing: 08/31/2013 08/31/2014
C. Ratings Summary
C.1 Performance Rating by ICR
Outcomes: Moderately Satisfactory
Risk to Development Outcome: Moderate
Bank Performance: Moderately Satisfactory
Grantee Performance: Satisfactory
C.2 Detailed Ratings of Bank and Borrower Performance (by ICR)
Bank Ratings Borrower Ratings
Quality at Entry: Moderately Satisfactory Government: Satisfactory
Quality of Supervision: Satisfactory Implementing
Agency/Agencies: Satisfactory
Overall Bank
Performance: Moderately Satisfactory
Overall Borrower
Performance: Satisfactory
vi
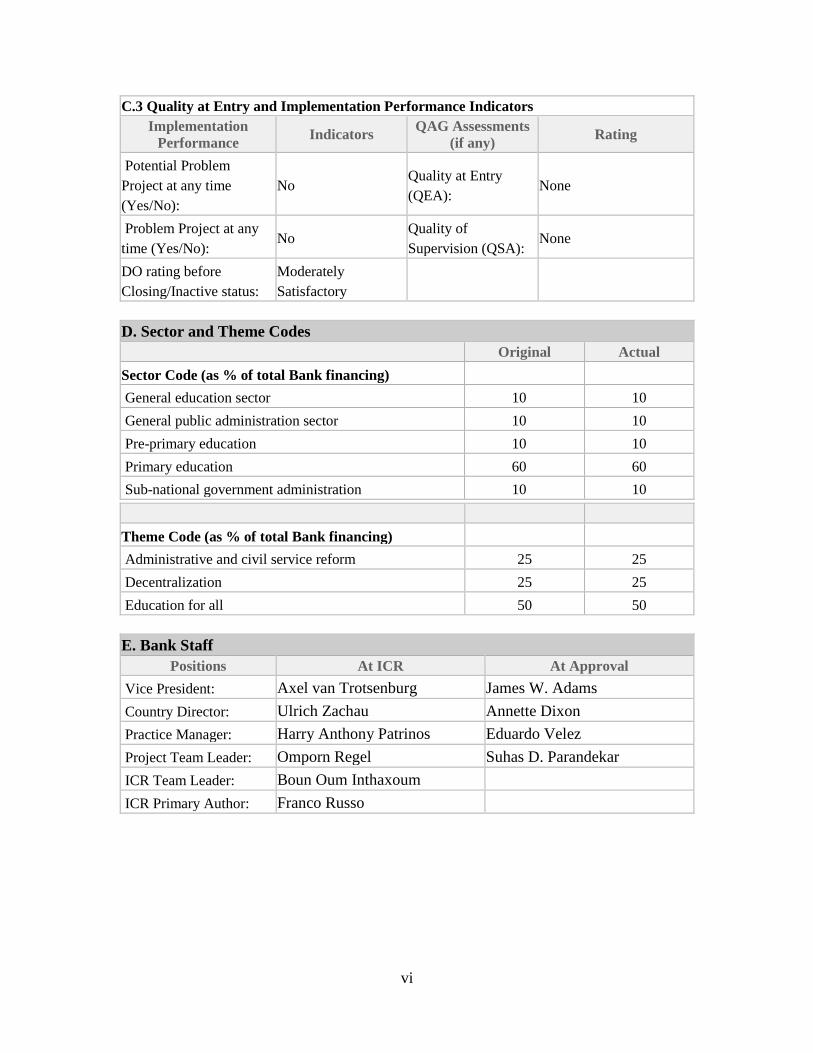
C.3 Quality at Entry and Implementation Performance Indicators
Implementation
Performance Indicators
QAG Assessments
(if any) Rating
Potential Problem
Project at any time
(Yes/No):
No Quality at Entry
(QEA): None
Problem Project at any
time (Yes/No): No
Quality of
Supervision (QSA): None
DO rating before
Closing/Inactive status:
Moderately
Satisfactory
D. Sector and Theme Codes
Original Actual
Sector Code (as % of total Bank financing)
General education sector 10 10
General public administration sector 10 10
Pre-primary education 10 10
Primary education 60 60
Sub-national government administration 10 10
Theme Code (as % of total Bank financing)
Administrative and civil service reform 25 25
Decentralization 25 25
Education for all 50 50
E. Bank Staff
Positions At ICR At Approval
Vice President: Axel van Trotsenburg James W. Adams
Country Director: Ulrich Zachau Annette Dixon
Practice Manager: Harry Anthony Patrinos Eduardo Velez
Project Team Leader: Omporn Regel Suhas D. Parandekar
ICR Team Leader: Boun Oum Inthaxoum
ICR Primary Author: Franco Russo
vii
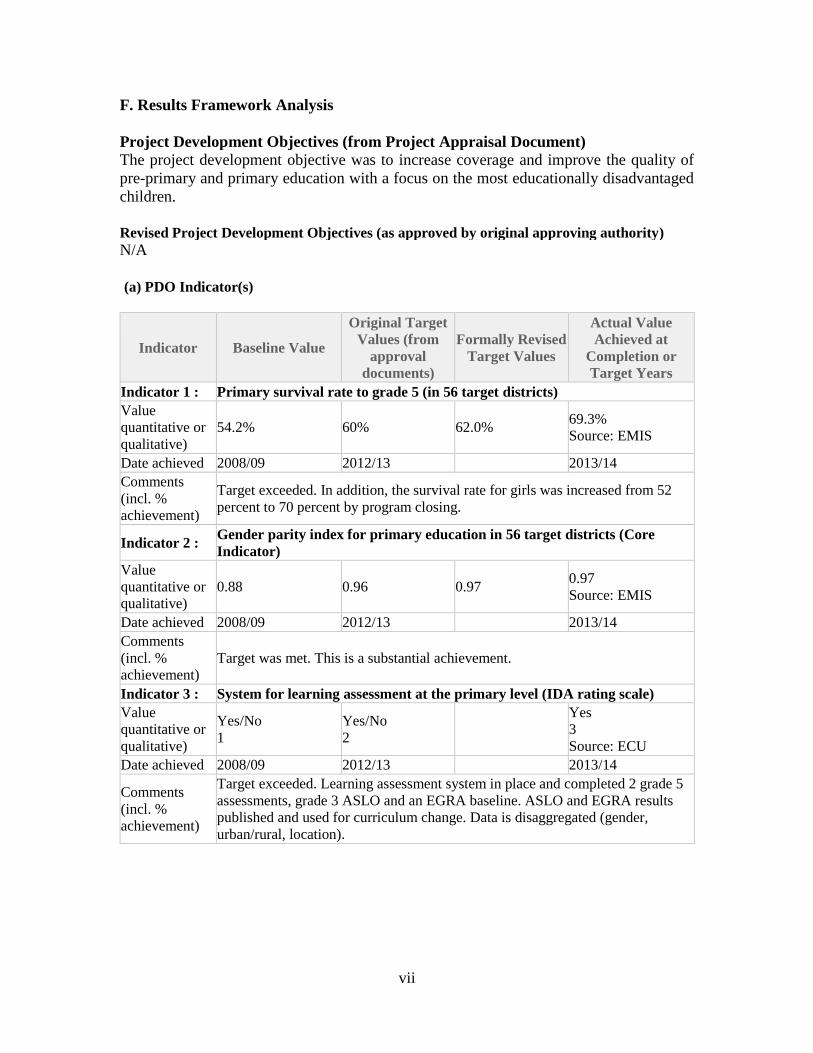
F. Results Framework Analysis
Project Development Objectives (from Project Appraisal Document) The project development objective was to increase coverage and improve the quality of
pre-primary and primary education with a focus on the most educationally disadvantaged
children.
Revised Project Development Objectives (as approved by original approving authority)
N/A
(a) PDO Indicator(s)
Indicator Baseline Value
Original Target
Values (from
approval
documents)
Formally Revised
Target Values
Actual Value
Achieved at
Completion or
Target Years
Indicator 1 : Primary survival rate to grade 5 (in 56 target districts)
Value
quantitative or
qualitative)
54.2% 60% 62.0% 69.3%
Source: EMIS
Date achieved 2008/09 2012/13 2013/14
Comments
(incl. %
achievement)
Target exceeded. In addition, the survival rate for girls was increased from 52
percent to 70 percent by program closing.
Indicator 2 : Gender parity index for primary education in 56 target districts (Core
Indicator)
Value
quantitative or
qualitative)
0.88 0.96 0.97 0.97
Source: EMIS
Date achieved 2008/09 2012/13 2013/14
Comments
(incl. %
achievement)
Target was met. This is a substantial achievement.
Indicator 3 : System for learning assessment at the primary level (IDA rating scale)
Value
quantitative or
qualitative)
Yes/No
1
Yes/No
2
Yes
3
Source: ECU
Date achieved 2008/09 2012/13 2013/14
Comments
(incl. %
achievement)
Target exceeded. Learning assessment system in place and completed 2 grade 5
assessments, grade 3 ASLO and an EGRA baseline. ASLO and EGRA results
published and used for curriculum change. Data is disaggregated (gender,
urban/rural, location).
viii
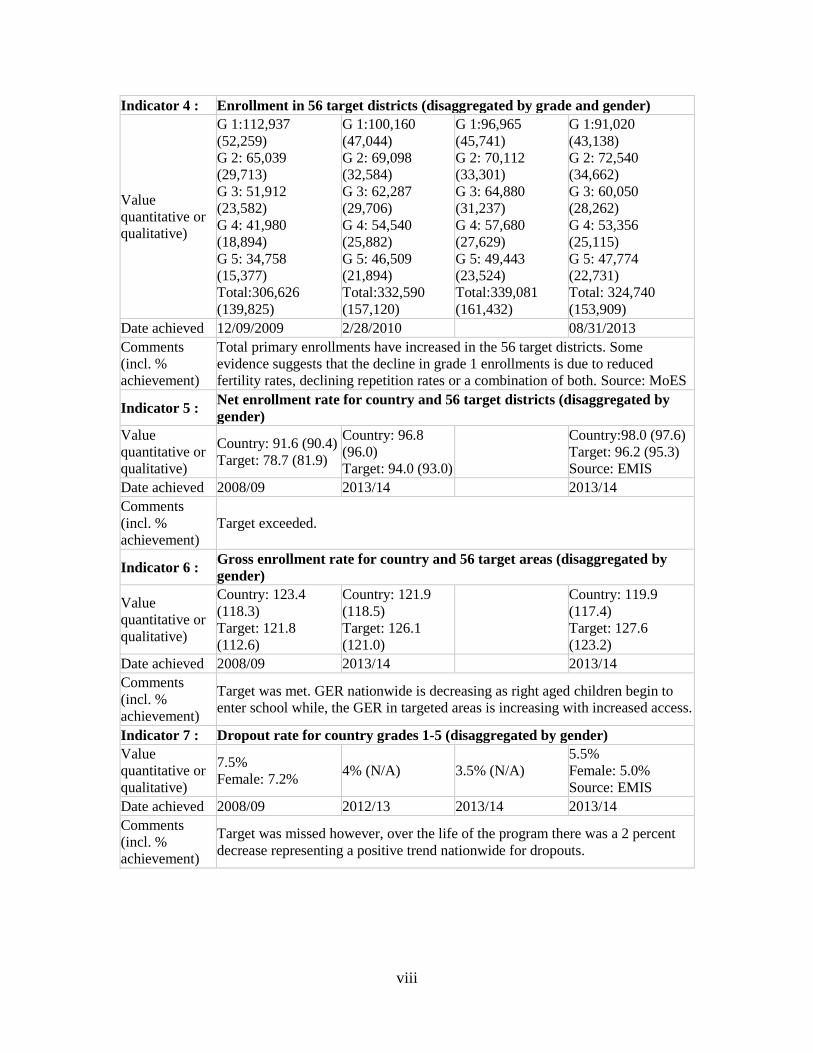
Indicator 4 : Enrollment in 56 target districts (disaggregated by grade and gender)
Value
quantitative or
qualitative)
G 1:112,937
(52,259)
G 2: 65,039
(29,713)
G 3: 51,912
(23,582)
G 4: 41,980
(18,894)
G 5: 34,758
(15,377)
Total:306,626
(139,825)
G 1:100,160
(47,044)
G 2: 69,098
(32,584)
G 3: 62,287
(29,706)
G 4: 54,540
(25,882)
G 5: 46,509
(21,894)
Total:332,590
(157,120)
G 1:96,965
(45,741)
G 2: 70,112
(33,301)
G 3: 64,880
(31,237)
G 4: 57,680
(27,629)
G 5: 49,443
(23,524)
Total:339,081
(161,432)
G 1:91,020
(43,138)
G 2: 72,540
(34,662)
G 3: 60,050
(28,262)
G 4: 53,356
(25,115)
G 5: 47,774
(22,731)
Total: 324,740
(153,909)
Date achieved 12/09/2009 2/28/2010 08/31/2013
Comments
(incl. %
achievement)
Total primary enrollments have increased in the 56 target districts. Some
evidence suggests that the decline in grade 1 enrollments is due to reduced
fertility rates, declining repetition rates or a combination of both. Source: MoES
Indicator 5 : Net enrollment rate for country and 56 target districts (disaggregated by
gender)
Value
quantitative or
qualitative)
Country: 91.6 (90.4)
Target: 78.7 (81.9)
Country: 96.8
(96.0)
Target: 94.0 (93.0)
Country:98.0 (97.6)
Target: 96.2 (95.3)
Source: EMIS
Date achieved 2008/09 2013/14 2013/14
Comments
(incl. %
achievement)
Target exceeded.
Indicator 6 : Gross enrollment rate for country and 56 target areas (disaggregated by
gender)
Value
quantitative or
qualitative)
Country: 123.4
(118.3)
Target: 121.8
(112.6)
Country: 121.9
(118.5)
Target: 126.1
(121.0)
Country: 119.9
(117.4)
Target: 127.6
(123.2)
Date achieved 2008/09 2013/14 2013/14
Comments
(incl. %
achievement)
Target was met. GER nationwide is decreasing as right aged children begin to
enter school while, the GER in targeted areas is increasing with increased access.
Indicator 7 : Dropout rate for country grades 1-5 (disaggregated by gender)
Value
quantitative or
qualitative)
7.5%
Female: 7.2% 4% (N/A) 3.5% (N/A)
5.5%
Female: 5.0%
Source: EMIS
Date achieved 2008/09 2012/13 2013/14 2013/14
Comments
(incl. %
achievement)
Target was missed however, over the life of the program there was a 2 percent
decrease representing a positive trend nationwide for dropouts.
ix
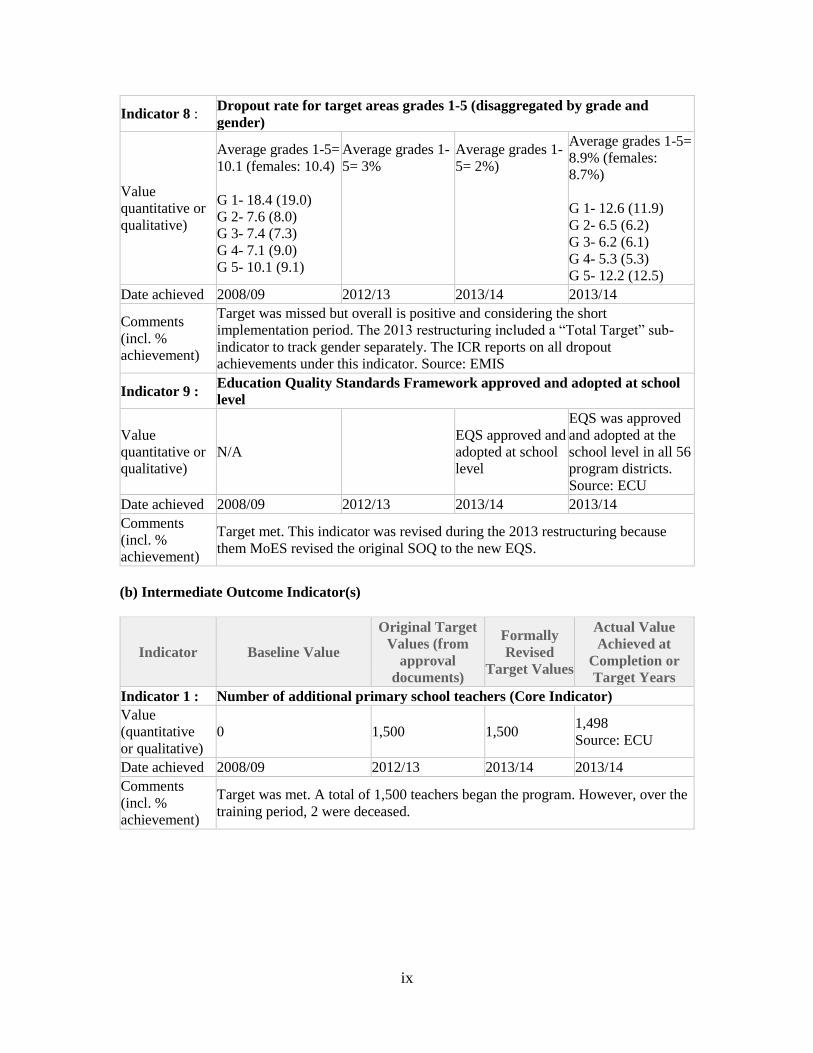
Indicator 8 : Dropout rate for target areas grades 1-5 (disaggregated by grade and
gender)
Value
quantitative or
qualitative)
Average grades 1-5=
10.1 (females: 10.4)
G 1- 18.4 (19.0)
G 2- 7.6 (8.0)
G 3- 7.4 (7.3)
G 4- 7.1 (9.0)
G 5- 10.1 (9.1)
Average grades 1-
5= 3%
Average grades 1-
5= 2%)
Average grades 1-5=
8.9% (females:
8.7%)
G 1- 12.6 (11.9)
G 2- 6.5 (6.2)
G 3- 6.2 (6.1)
G 4- 5.3 (5.3)
G 5- 12.2 (12.5)
Date achieved 2008/09 2012/13 2013/14 2013/14
Comments
(incl. %
achievement)
Target was missed but overall is positive and considering the short
implementation period. The 2013 restructuring included a “Total Target” sub-
indicator to track gender separately. The ICR reports on all dropout
achievements under this indicator. Source: EMIS
Indicator 9 : Education Quality Standards Framework approved and adopted at school
level
Value
quantitative or
qualitative)
N/A
EQS approved and
adopted at school
level
EQS was approved
and adopted at the
school level in all 56
program districts.
Source: ECU
Date achieved 2008/09 2012/13 2013/14 2013/14
Comments
(incl. %
achievement)
Target met. This indicator was revised during the 2013 restructuring because
them MoES revised the original SOQ to the new EQS.
(b) Intermediate Outcome Indicator(s)
Indicator Baseline Value
Original Target
Values (from
approval
documents)
Formally
Revised
Target Values
Actual Value
Achieved at
Completion or
Target Years
Indicator 1 : Number of additional primary school teachers (Core Indicator)
Value
(quantitative
or qualitative)
0 1,500 1,500 1,498
Source: ECU
Date achieved 2008/09 2012/13 2013/14 2013/14
Comments
(incl. %
achievement)
Target was met. A total of 1,500 teachers began the program. However, over the
training period, 2 were deceased.

x
Indicator 2 : Percentage of complete primary schools in target areas
Value
(quantitative
or qualitative)
38.6% 62% 72.6%
Source: ECU
Date achieved 2008/09 2012/13 2013/14
Comments
(incl. %
achievement)
Indicator revised in 2013 to better measure program impact in target areas.
Target exceeded: there are now 2,862 complete primary schools (72.6%) in the
target areas from a baseline of 1,391. This is a substantial increase.
Indicator 3 : Number of schools upgraded to meet quality standards in terms of physical
standards (i.e. water & sanitation)
Value
(quantitative
or qualitative)
0 741 412 253
Source: ECU
Date achieved 2008/09 2012/13 2013/14 2013/14
Comments
(incl. %
achievement)
Responsibility for this activity was given to UNICEF WASH. By program
closing, they had completed 253 and had secured funding to complete the
remaining 140 schools by end of 2015. See Footnote 7 for more details.
Indicator 4 : Number of schools with a functioning VEDC (including in their new M&E
role)
Value
(quantitative
or qualitative)
0 1,500 1,518
Source: ECU
Date achieved 2008/09 2013/14 2013/14
Comments
(incl. %
achievement)
Target exceeded.
Indicator 5 : Number of schools with teachers that received training on quality
Value
quantitative or
qualitative)
0 1,500 1,498
Source: ECU
Date achieved 2008/09 2013/14 2013/14
Comments
(incl. %
achievement)
Target met. A total of 1,500 teachers began the program. However, over the
training period, 2 were deceased
Indicator 6 : Number of schools with principals trained on their roles/duties.
Value
quantitative or
qualitative)
0 2,500 2,623
Source: ECU
Date achieved 2008/09 2013/14 2013/14
Comments
(incl. %
achievement)
Target exceeded.
xi
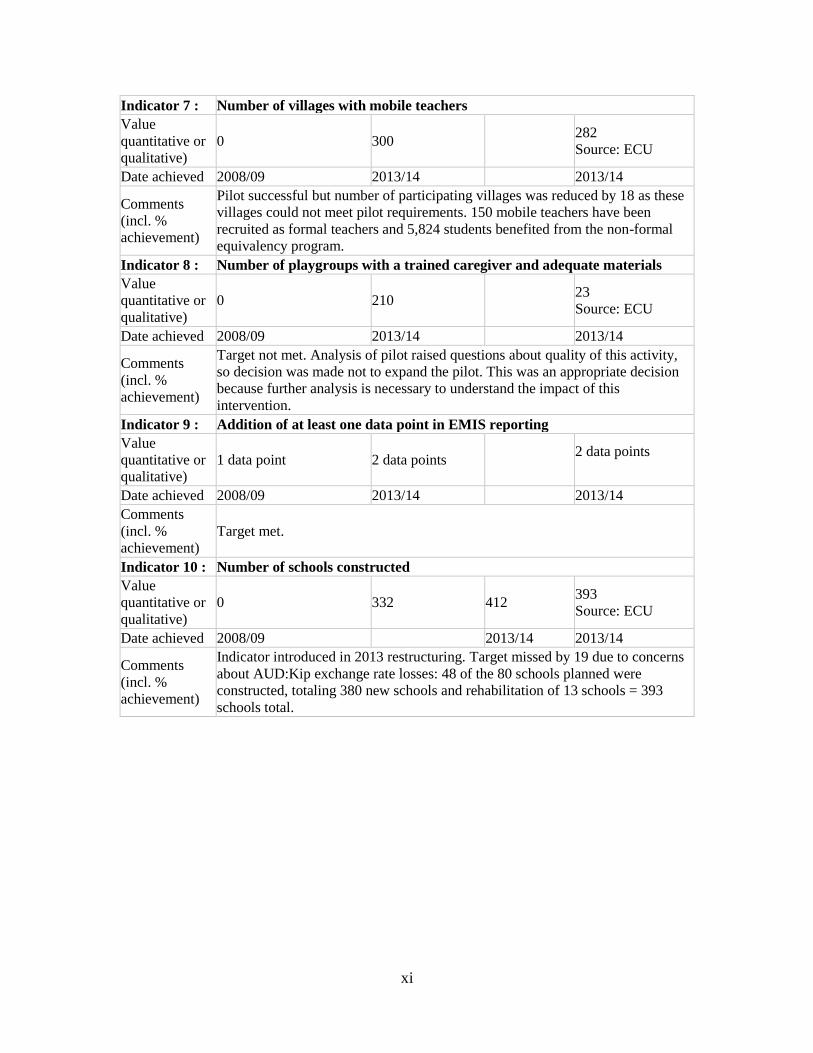
Indicator 7 : Number of villages with mobile teachers
Value
quantitative or
qualitative)
0 300 282
Source: ECU
Date achieved 2008/09 2013/14 2013/14
Comments
(incl. %
achievement)
Pilot successful but number of participating villages was reduced by 18 as these
villages could not meet pilot requirements. 150 mobile teachers have been
recruited as formal teachers and 5,824 students benefited from the non-formal
equivalency program.
Indicator 8 : Number of playgroups with a trained caregiver and adequate materials
Value
quantitative or
qualitative)
0 210 23
Source: ECU
Date achieved 2008/09 2013/14 2013/14
Comments
(incl. %
achievement)
Target not met. Analysis of pilot raised questions about quality of this activity,
so decision was made not to expand the pilot. This was an appropriate decision
because further analysis is necessary to understand the impact of this
intervention.
Indicator 9 : Addition of at least one data point in EMIS reporting
Value
quantitative or
qualitative)
1 data point 2 data points 2 data points
Date achieved 2008/09 2013/14 2013/14
Comments
(incl. %
achievement)
Target met.
Indicator 10 : Number of schools constructed
Value
quantitative or
qualitative)
0 332 412 393
Source: ECU
Date achieved 2008/09 2013/14 2013/14
Comments
(incl. %
achievement)
Indicator introduced in 2013 restructuring. Target missed by 19 due to concerns
about AUD:Kip exchange rate losses: 48 of the 80 schools planned were
constructed, totaling 380 new schools and rehabilitation of 13 schools = 393
schools total.
xii
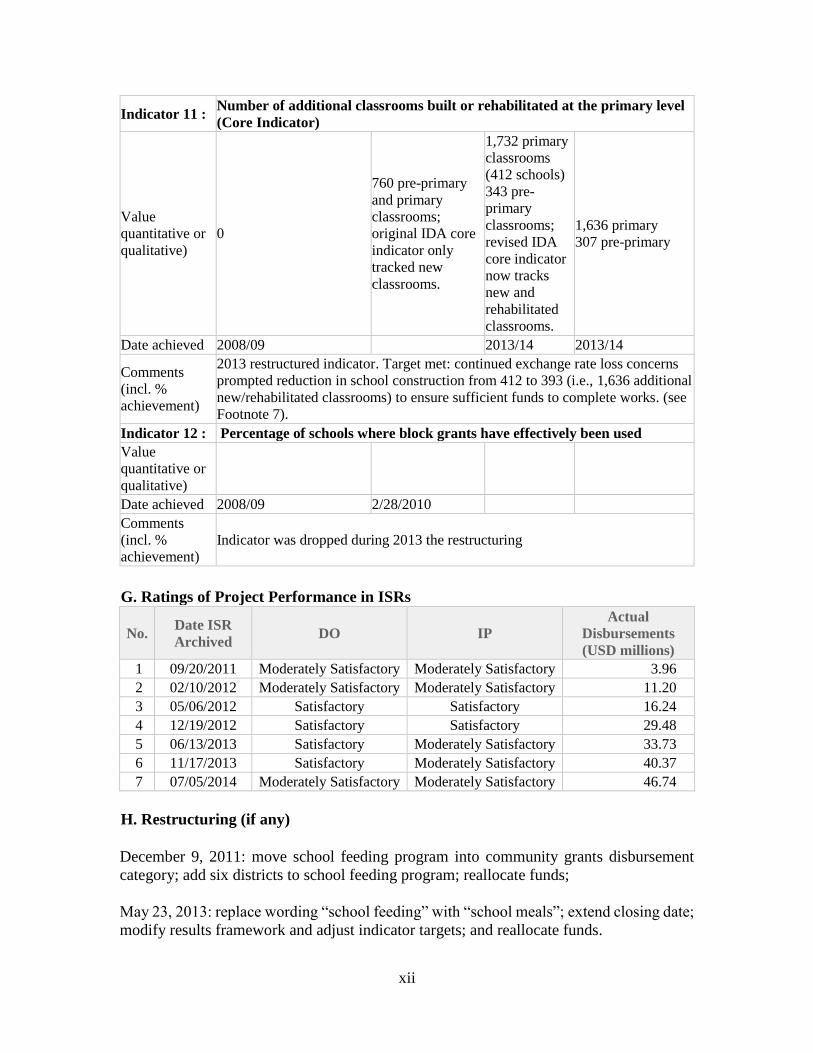
Indicator 11 : Number of additional classrooms built or rehabilitated at the primary level
(Core Indicator)
Value
quantitative or
qualitative)
0
760 pre-primary
and primary
classrooms;
original IDA core
indicator only
tracked new
classrooms.
1,732 primary
classrooms
(412 schools)
343 pre-
primary
classrooms;
revised IDA
core indicator
now tracks
new and
rehabilitated
classrooms.
1,636 primary
307 pre-primary
Date achieved 2008/09 2013/14 2013/14
Comments
(incl. %
achievement)
2013 restructured indicator. Target met: continued exchange rate loss concerns
prompted reduction in school construction from 412 to 393 (i.e., 1,636 additional
new/rehabilitated classrooms) to ensure sufficient funds to complete works. (see
Footnote 7).
Indicator 12 : Percentage of schools where block grants have effectively been used
Value
quantitative or
qualitative)
Date achieved 2008/09 2/28/2010
Comments
(incl. %
achievement)
Indicator was dropped during 2013 the restructuring
G. Ratings of Project Performance in ISRs
No. Date ISR
Archived DO IP
Actual
Disbursements
(USD millions)
1 09/20/2011 Moderately Satisfactory Moderately Satisfactory 3.96
2 02/10/2012 Moderately Satisfactory Moderately Satisfactory 11.20
3 05/06/2012 Satisfactory Satisfactory 16.24
4 12/19/2012 Satisfactory Satisfactory 29.48
5 06/13/2013 Satisfactory Moderately Satisfactory 33.73
6 11/17/2013 Satisfactory Moderately Satisfactory 40.37
7 07/05/2014 Moderately Satisfactory Moderately Satisfactory 46.74
H. Restructuring (if any)
December 9, 2011: move school feeding program into community grants disbursement
category; add six districts to school feeding program; reallocate funds;
May 23, 2013: replace wording “school feeding” with “school meals”; extend closing date;
modify results framework and adjust indicator targets; and reallocate funds.
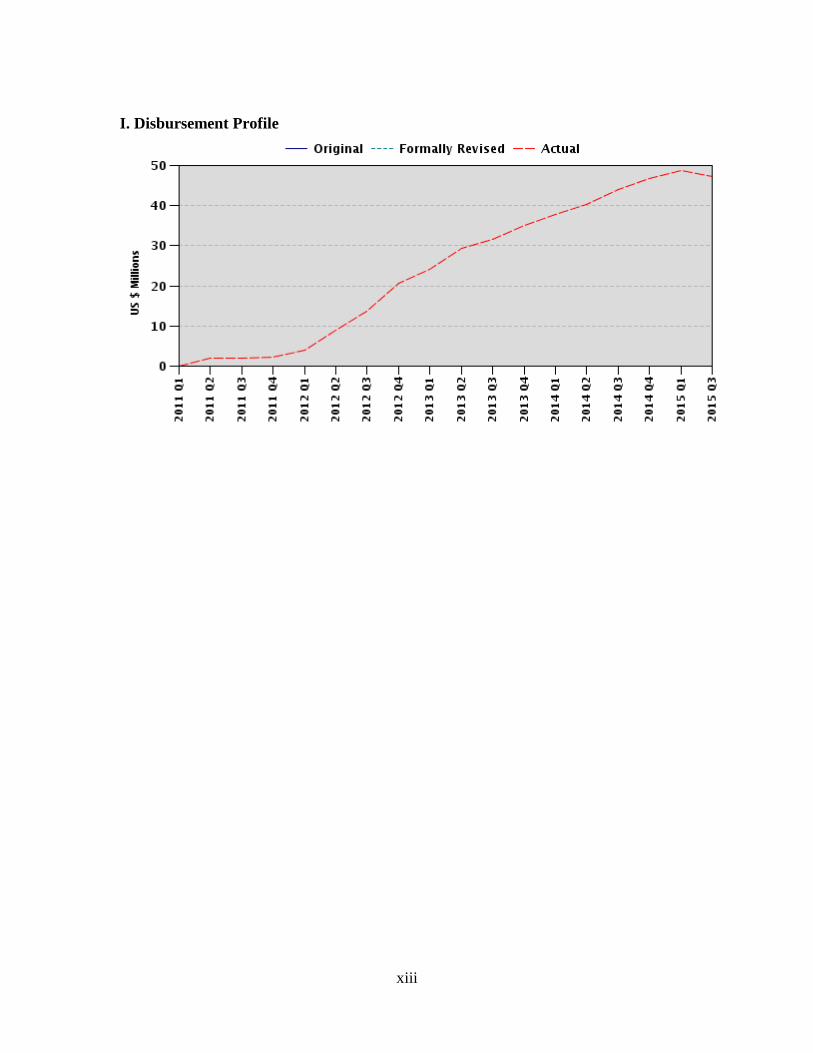
xiii
I. Disbursement Profile

1
1. Project Context, Development Objectives and Design
1.1 Context at Appraisal
1. Country context. Lao People’s Democratic Republic (Lao PDR) had a population
of approximately 5.6 million people with a poverty rate of 34 percent, and with one of the
poorest education indicators in Asia. Poverty in Lao PDR had a strong regional dimension,
with poverty being very high in parts of the North and South of the country with pockets
of poverty throughout the country.1 Poverty is associated with many factors but one of the
direct relationships of poverty concerns the educational status of the population, with low
education leading to continued poverty and further low education. Lao PDR is also an
ethnically diverse country, is predominantly rural and has nearly 75 percent of its
population living in rural areas with varying topography. The 10,500 villages in the country
were served by 8,500 primary schools.
2. Sectoral context. Despite progress in the past decade towards achieving Education
for All (EFA), the educational gap remained large and a concerted effort by the government
had to be made to meet the EFA Goals by 2015 and to attain the national objective of
leaving the status of Least Developed Country by 2020. Of the approximate 8,500 primary
schools in existence, approximately half were ‘incomplete’, meaning they did not offer
education up to grade 5. Of the existing schools, a very high percentage did not have
bathrooms or drinking water for children. In terms of pedagogical inputs, in-service
training to teachers was not regular and provision of textbooks had just begun on a
systematic basis. A characteristic feature of the rural areas in the Upland and Highlands
area was food insecurity and malnutrition, which contributed to poor educational outcomes.
3. In order to meet the EFA goals, an Education Sector Development Framework
(ESDF) 2009-20152 was prepared and officially adopted as the national education sector
1 The Geography of Poverty and Inequality in the Lao People’s Democratic Republic; Swiss National Center
of Competence in Research (NCCR) North-South, University of Bern, and International Food Policy
Research Institute (IFPRI), Bern: Geographica Bernensia, 2008. 2 The Education Sector Development Framework (ESDF) 2009 – 2015 was developed by the MoES with
technical support funded by development partners. It entails 6 focal areas: (i) ESDF strategy, program and
appraisal for basic education; (ii) ESDF strategy, program and appraisal for post-basic education; (iii)
financial and performance planning; (iv) governance and institutional reform; (v) human resource
management; and (vi) social development and inclusive education. The Performance Assessment Framework
(PAF) 2009, originally designed for ESDF, outlines an annual assessment process, a sector reporting
framework, and monitoring and evaluation matrix, and identifies an indicative table of key sector indicators.
The PAF conceptualizes assessment needs as both internal, relating to the educational outcomes of the
activities, and external, relating to the performance of the ESDF as a process guided by its principles. Thus,
it addresses a number of questions concerning ESDF outcomes and ESDF as a process. The Education Sector
Development Plan (ESDP) 2011 – 2015 was developed based on the ESDF 2009 – 2015 and the National
Education Sector Reform Strategy (NESRS) 2007 – 2015. It outlines goals; directions; objectives; targets;
resources and financial requirements together with monitoring requirements for the period 2011 to 2015. Its
associated ESDP 2011-2015 Policy Planning Matrix identifies 19 key policies, 96 strategies and 2015 targets
for ESDP implementation.
2
plan for Lao PDR. The ESDF defined the government policies and strategies to meet the
education goals, targets and outputs concerning key Millennium Development Goal
(MDGs). The ESDF formulation process enjoyed the full support of the government of Lao
PDR (GoL) and the donor community. The ESDF was subsequently endorsed by the
Global Partnership for Education (GPE) (formerly the Education for All – Fast Track
Initiative (EFA-FTI)) as a credible sector plan forming the basis of planning for the
government’s own resources and for external assistance, including financing from the GPE
and Department of Foreign Affairs and Trade (DFAT - formerly the Australian Agency for
International Development - AusAID). The ESDF detailed three main priorities for the
2009-2015 period: (i) ensuring equitable access to education services; (ii) improving the
quality and efficiency of education services; and (iii) improving education sector
governance and performance management. The aim of the EFA/FTI Program was to seek
financing for the main elements of the ESDF to be implemented with financing from the
GPE combined with financing from DFAT and to help the country meet the goals of
Education for All.
1.2 Original Project Development Objectives (PDO) and Key Indicators
4. The project development objective was to increase coverage and improve the
quality of pre-primary and primary education with a focus on the most educationally
disadvantaged children. The key indicators were: (i) primary completion rate; (ii) gender
parity index for primary education; (iii) decline in shortfall of qualified teachers at primary
level; (iv) decline in shortfall of classrooms at the pre-primary and primary level; and (v)
system for learning assessment (using a rating scale).
1.3 Revised PDO (as approved by original approving authority) and Key Indicators,
and reasons/justification
5. The PDO was not revised over the life of the project however, the results framework
was adjusted following the mid-term review (MTR). The reason for modifying some of the
key indicators was: (i) to ensure they contained realistic targets that could be met by the
revised program closing date; (ii) moving some more output-oriented indicators to the
“intermediate” level while including gross and net enrollment indicators at the “outcome”
level; and (iii) clarifying some indicators to make sure they were in line with the
government’s indicators.
6. The justification for the modifications were: (i) gross enrollment rate (GER) and
net enrollment rate (NER), disaggregated by gender, were added as PDO level indicators
to better measure increased coverage of the education system; (ii) primary completion rate
was revised to measure primary school survival rate because survival rate is the measure
used by the Ministry of Education and Sports (MoES); (iii) dropout rate was revised to
3
collect data by grade level and gender. Ethnicity and location were dropped because
districts do not collect dropout by ethnicity and all of the 56 program districts are located
in disadvantaged areas; and (iv) increased number of schools meeting the School of Quality
Standards (SOQ) was revised to Education Quality Standards (EQS) because MoES
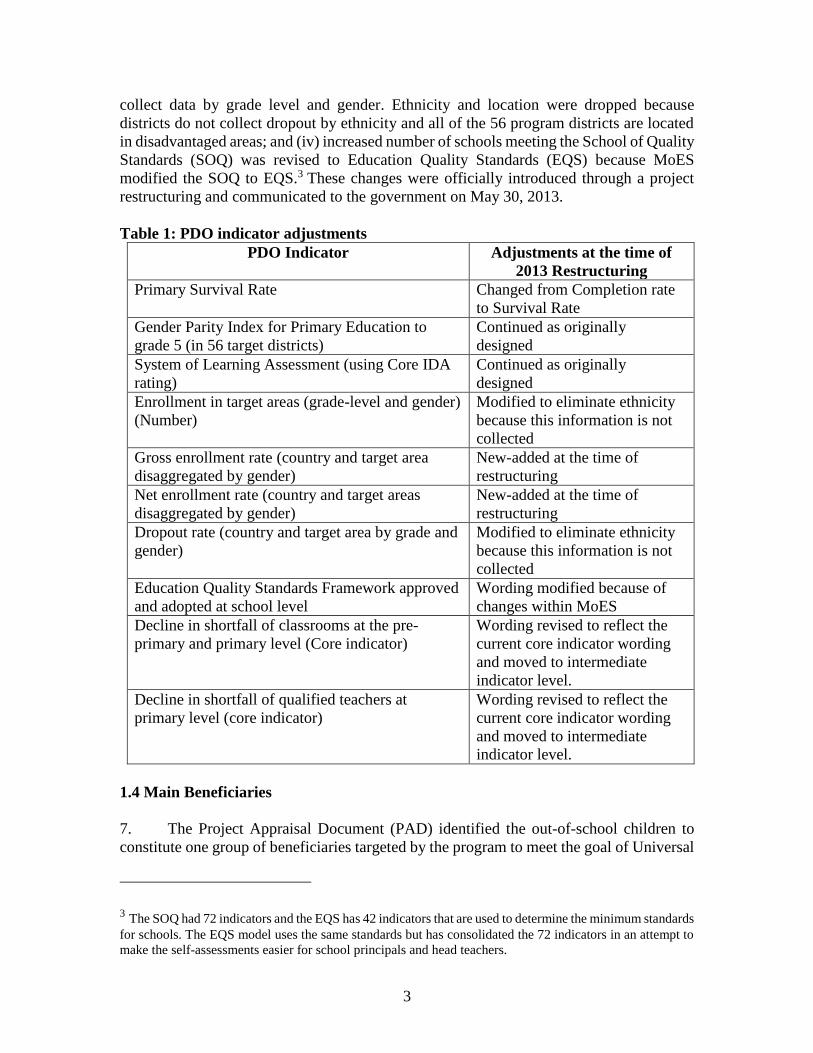
modified the SOQ to EQS.3 These changes were officially introduced through a project
restructuring and communicated to the government on May 30, 2013.
Table 1: PDO indicator adjustments
PDO Indicator Adjustments at the time of
2013 Restructuring
Primary Survival Rate Changed from Completion rate
to Survival Rate
Gender Parity Index for Primary Education to
grade 5 (in 56 target districts)
Continued as originally
designed
System of Learning Assessment (using Core IDA
rating)
Continued as originally
designed
Enrollment in target areas (grade-level and gender)
(Number)
Modified to eliminate ethnicity
because this information is not
collected
Gross enrollment rate (country and target area
disaggregated by gender)
New-added at the time of
restructuring
Net enrollment rate (country and target areas
disaggregated by gender)
New-added at the time of
restructuring
Dropout rate (country and target area by grade and
gender)
Modified to eliminate ethnicity
because this information is not
collected
Education Quality Standards Framework approved
and adopted at school level
Wording modified because of
changes within MoES
Decline in shortfall of classrooms at the pre-
primary and primary level (Core indicator)
Wording revised to reflect the
current core indicator wording
and moved to intermediate
indicator level.
Decline in shortfall of qualified teachers at
primary level (core indicator)
Wording revised to reflect the
current core indicator wording
and moved to intermediate
indicator level.
1.4 Main Beneficiaries
7. The Project Appraisal Document (PAD) identified the out-of-school children to
constitute one group of beneficiaries targeted by the program to meet the goal of Universal
3 The SOQ had 72 indicators and the EQS has 42 indicators that are used to determine the minimum standards
for schools. The EQS model uses the same standards but has consolidated the 72 indicators in an attempt to
make the self-assessments easier for school principals and head teachers.
4
Primary Completion (UPC). The other group of beneficiaries was children already in
school, who would benefit from an improved quality of education because of improved
infrastructure and didactic materials and better trained teachers. Lastly, Village Education
Development Committees (VEDCs) comprised a third group of beneficiaries. By focusing
on the 56 educationally most disadvantaged areas, the Program also focused particular
attention on providing benefits to ethnic minorities and girls. Direct project beneficiaries
having benefitted from project interventions reached approximately 330,000 of which
37.62 percent were female. This does not include the indirect beneficiaries such as parents
and decentralized ministry staff who benefitted from knowledge transfer and other forms
of capacity building activities.
1.5 Original Components
8. Component A: Access and Quality for Pre-Primary and Primary Education
(US$21.9 million-GPE; AUD 20.0 million DFAT) was to provide a set of interventions
that were directed towards ensuring that the greatest possible number of children of primary
school-going age in Lao PDR would be assured of having access to a minimum standard
of education.
9. Component A had the following sub-components: (i) Sub-Component A1:
Community-Based Contracting (CBC) for School Construction (US$12.1 million-GPE;
AUD 9.64 million-DFAT) that transferred grants-in-aid for community-based construction
of schools for communities within the 56 target districts; (ii) Sub-Component A2:
Community Grants (CG) (US$2.6 million-GPE; AUD 0.0 million-DFAT) to provide a
lump-sum grant every year to the VEDC to provide basic materials such as notebooks,
pencils, crayons and clothes for children’s use at school and at home; (iii) Sub-Component
A3: Quality Inputs (US$0.0 million-GPE and AUD 8.5 million-DFAT), which provided
six kinds of quality inputs to both pre-primary and primary education schools and to the
school communities, including teaching and learning materials, training of VEDCs and
decentralized MoES staff, training and/or upgrading of principals and teachers and
technical assistance; (iv) Sub-Component A4: School Feeding (US$7.2 million-GPE;
AUD0.0 million-DFAT) to provide school feeding to approximately 150,000 primary
school children and 8,000 pre-primary school children5; and (v) Sub-Component A5: Non-
Formal Education (US$0.0 million-GPE; AUD 1.8 million-DFAT) focused on providing
educational services for the six percent of children in Lao PDR who are estimated never to
attend school.
4 The PAD incorrectly mentions AUD 9.7 million to be allocated for CBC. Work- and budget plans
however have referred to AUD 9.6 million, which is the correct figure and is used for the purposes of ICR
analysis. 5 The school meal program was a pilot program in 9 project districts and 316 schools with the aim of
providing hot school lunches to primary school children and pre-primary school children through the
promotion of locally available foods, community participation and ownership and incorporates
complimentary interventions (such as integrated food production, food processing, personal hygiene and
environmental sanitation) to ensure a holistic and sustainable approach.

5
10. Component B: Stewardship of Education Sector at Local, Provincial and
Central Levels (US$8.1 million-GPE; AUD0.2 million-DFAT) was to provide financing
to strengthen the MoES’ policy framing and policy implementation capacity through all
levels of government.
11. Component B had the following sub-components: (i) Sub-Component B1:
Strengthen Policy Planning and Implementation Capacities at Central and Local Levels
(US$0.5 million-GPE; AUD 0.0 million-DFAT) aimed at providing financing for technical
assistance and training as well as acquisition of equipment and software to strengthen the
policy planning and implementation capabilities of the MoES; (ii) Sub-Component B2:
Strengthen Functioning of Educational Management Information Systems (US$3.5
million-GPE; AUD 0.0 million-DFAT) supported financing of the five elements of the
Education Management Information System (EMIS) Strategy developed by the MoES to
ensure the timely availability of reliable and accurate data; (iii) Sub-Component B3:
Student Assessment (US$1.0 million GPE; AUD 0.0 million-DFAT) which was comprised
of two activities - the Assessment of Student Learning Outcomes (ASLO) and Early Grade
Reading Assessment (EGRA); (iv) Sub-Component B4: Strengthen Monitoring and
Evaluation Capacity (US$0.6 million GPE; AUD 0.0 million-DFAT) to provide resources
for implementation of the Performance Assessment Framework (PAF) through
development of an annual cycle of activities that will produce annual reports on sector
development linked to ESDF policies; and (v) Sub-Component B5: Program Management
(US$2.5 million-GPE; AUD 0.2 million-DFAT) which aimed at financing the additional
or incremental costs associated with program management and support the ESDF
Coordination Unit (ECU).
1.6 Revised Components
12. The components were not revised over the life of the project, however some of the
targets were modified following the MTR, which were recorded in the 2013 project
restructuring.
1.7 Other Significant Changes
13. The grant agreement for AUD 20,261,5786 was signed on July 14, 2011 between
the GoL and the World Bank (acting as the administrator of the Australian Trust Fund) to
provide co-financing to specific components of the EFA/FTI Program.
14. On November 2, 2011, the Bank, at the request of the government, increased the
Designated Account (DA) ceiling from US$2 million to US$4 million to accommodate an
accelerated implementation place.
15. On December 9, 2011, the project was restructured to: (i) move school feeding into
the community grants disbursement category, because the original allocation under goods
was making it difficult to disburse against expenditures incurred from getting food to
6 The ICR uses “AUD 20,261,578” and “AUD 20.26 million” interchangeably for ease of reading.
6
schools; (ii) added six highly disadvantaged districts as part of the EFA/FTI school feeding
program; and (iii) reallocated US$2.7 million from Category 1 (goods, works, consultants’
services, incremental operating costs and training and workshops) to Category 3
(community grants). These changes were confirmed in a letter to the government on
December 16, 2011.
16. On May 23, 2013 the project was restructured to: (i) replace the reference to
“School Feeding” with “School Meal Program” to reflect the government’s new name for
the program; (ii) extend the project closing date from August 31, 2013 to August 31, 2014
for both sources of financing in order to complete all program activities, particularly the
new and innovative School Meal Program and the non-formal education programs; (iii)
modify selected results framework indicators to ensure realistic targets to be met by the
revised project closing date; (iv) reduce the number of schools constructed from the overly
ambitious original target of 1,500 to 412 7 based on a detailed analysis of the district’s
needs; (v) narrow the scope of the monitoring and evaluation component to focus on pre-
primary and primary sub-sectors, which are directly related to the project interventions;
and (vi) reallocate grant proceeds among the disbursement categories for both Trust Funds.
These changes were confirmed in a letter to the government on May 30, 2013.
2. Key Factors Affecting Implementation and Outcomes
2.1 Project Preparation, Design and Quality at Entry
17. Project preparation. Following Lao PDR’s accession to the “Fast-Track Initiative
– FTI” in March 2009, it began preparing an application for a FTI “Catalytic Fund - CF”
grant based on the 2009-2015 ESDF. At that time, the government had identified 56
disadvantaged districts least likely to achieve the EFA goals by 2015 and decided to use
the FTI grant to support program interventions in those districts. The Bank, acting as the
administrator for the CF, was also chosen to be the “supervising entity” and to assist the
MoES in the preparation of the application in close collaboration with UNICEF and DFAT
who was also the GPE Coordinating Agency in Lao PDR at that time.
7 The PAD states that “the program would upgrade or replace 1,500 primary schools and provide water
supply and latrines in approximately 2,100 primary schools” (p. 40). However, these targets were revised
and documented in subsequent aide-memoirs after the program became effective. Further analysis of district
needs revealed that the program areas needed new school construction rather than rehabilitation. Based on
this, the costs and number of schools were adjusted from upgrading and replacing 1,500 schools to
constructing 332 new schools, and not carry out any rehabilitation. By 2013, all 332 schools were completed
and there were enough funds to construct an additional 80 schools and rehabilitate 13. This was approved
through the 2013 restructuring and the target adjusted to 412. After the restructuring, and in light of the
weakening of the Australian dollar, the government and Bank teams agreed to be more conservative and only
construct 48 of the 80 planned schools, ensuring that all construction could be completed with the funds
available considering the strong possibility of further exchange rate losses. This brought the total number of
new schools to 380 and rehabilitation of 13 schools for a total of 393. This total comprised 206 schools
funded by GPE and 174 funded through DFAT. This also meant that fewer schools would be equipped with
water and sanitation stations: although the PAD’s text refers to 2,100 schools being equipped with water and
sanitation facilities, the results framework identified 741. This was reduced to 412 and formalized in the 2013
restructuring.
7
18. At the time of preparation, the team considered the complete pooling of all
education financing from external and internal sources under unified country systems
similar to a Sector Wide Approach (SWAp). However, some development partners faced
institutional constraints using this model, which led to the decision to use the Specific
Investment Loan instrument because it was more suitable for the targeted nature of program
interventions and tracking of funds. Although the program did not use pooled financing,
the development of the ESDF, which was used for planning, implementing and monitoring
of education activities of the MoES and donors, did improve coordination and contributed
to the gradual alignment of approaches and procedures. Program preparation also
benefitted from the use of an Institutional Development Fund (IDF), which aimed at
strengthening the ministry’s capacity to monitor and evaluate sectoral programs,8 and the
provision of technical assistance to consolidate 2006-2008 school census data.
19. The preparation team included several project activities based on lessons learned
from other education projects. These included: (i) CBC for school construction and CG,
which was initiated under the Bank-supported Second Educational Development Project
(EDPII), to help villages off-set education-related expenditures of poor students; (ii)
support ASLO9; and (iii) support for EMIS. The team also learned lessons from the World
Food Program’s school feeding activity as well as other donor experiences in the areas of
non-formal education and community empowerment10.
20. Project preparation benefited from the fact that it was prepared in parallel with the
Bank-supported EDPII additional financing. The parallel development of these
interventions helped avoid duplication and allowed the team to capitalize on synergies that
accelerated development of the: (i) Program Operational Manual; (ii) Financial
Management Manual; and (iii) CBC and CG operational manuals.
21. These experiences and lessons learned helped the teams prepare and appraise the
proposed program in seven months and meet GPE’s March 2009 submission deadline. GPE
approved the grant application on May 7, 2010 in the amount of US$30 million. The
detailed preparation also allowed the program to become effective three months later on
August 12, 2010. The financing agreement in the amount of AUD 20.26 million was signed
on July 14, 2011 between GoL and the Bank. Although these funds became available
approximately one year after the CF grant signing, the Australian grant had already been
incorporated into the original design and was clearly identified in each component cost,
8 The IDF Grant aimed to assist the MoES and its Department of Inspection to design and build a results-
based monitoring and evaluation system which would equip MoES to move towards a sector wide approach
to policy and program development; the Grant Agreement was countersigned on August 6, 2007, and closed
on August 6, 2010. 9 EDPII financed ASLO for Grade 5 Mathematics, Lao language and “the world around us” (i.e., general
science studies) 10 Non-formal education delivery through mobile teachers had been piloted in Lao PDR by “Save the
Children – Norway” while working with and empowering Village Education Development Committees –
VEDC was part of the Asian Development Bank’s “Access to Basic Education in Laos” and the Bank’s EDP
II projects.
8
making these funds an integral part of the project from the beginning. Program preparation
was thoughtful, collaborative and technically sound and benefitted from a deliberative
process between MoES, donor partners11 and the Bank. The Bank preparation and appraisal
teams consisted of technical experts that were appropriate for the development of the
program and included peer reviewers that provided sound guidance on the project design.
22. Project Design and Quality at Entry. The project design fit squarely into the
government’s Strategic Vision up to 202012 and the 2009-2015 ESDF, which had been
endorsed by GPE and the donor community and was seen as providing a credible platform
for sectoral planning and financing. The design was also fully aligned with the: (i) 2008-
2011 Country Assistance Strategy’s (CAS) Pillar 2 (Increased access of poor and
vulnerable groups to basic health and education services); (ii) 7th National Socio-Economic
Development Plan (NSEDP) 2011-2015, which marked education development as “high
priority” especially for disadvantaged groups and women; and (iii) the National Growth
and Poverty Eradication Strategy - NGPES (2006-2015). The overarching goals in terms
of the education sector were to: (i) meet the MDGs 2 “Universal Primary Education” and
3 “Gender equality and empowerment of women”; and (ii) achieving the Education for All
goals by 2015, all of which the Program supported. As mentioned previously, the program
design took into consideration comments from peer reviewers and donor partners provided
during the concept and appraisal review meetings.
23. The PDO was in line with the government’s priorities and was reflective of the
project’s activities. Originally, progress towards meeting the PDO was measured by eight
key indicators while nine intermediate indicators were selected to assist tracking overall
implementation progress. Indicator formulation was guided by the government’s own PAF,
which was developed to measure ESDF progress and served as the agreed-upon, sector-
wide monitoring mechanism. This ensured the alignment of the program’s results
framework with the government’s monitoring mechanism and further supported the move
towards a coordinated approach to education sector investments. The program results
framework included a combination of government and International Development Agency
(IDA) “core indicators13” to measure system-wide performance and progress towards
meeting the MDGs. It also included specific indicators to measure the program’s
performance and was careful to specify targets for the 56 target districts. The results
framework was appropriate for measuring program progress although some of the original
11 Donor partners consulted during Program preparation included: (i) AusAID; (ii) the Asian Development
Bank; (iii) the United Nations Educational, Scientific and Cultural Organization (UNESCO); (iv) the United
Nations Children's Fund (UNICEF); (v) the World Food Program (WFP); (vi) Japan International
Cooperation Agency (JICA); (vii) the Swedish International Development Cooperation (SIDA); (viii) the
European Commission (EC); (ix) Plan International (PI); and (x) Save the Children (SC). 12 The government’s Strategic Vision up to 2020 was expressed initially in the Five Year Development Plan
(2000-2005) and continued in subsequent five year development plans, as well as in the NGPES (2006-2015).
Priorities in the Vision included universalization of compulsory primary education, abolition of illiteracy,
expansion of vocational and higher education, development of science and technology, gradually raising
standards to international levels, and improving management. 13 “Core indicators” are a set of indicators introduced by the Bank in July 2009 to allow for the systematic
capture of results data at a country, sector, regional, and institutional level. These indicators are required for
operations of IDA-eligible countries.
9
targets could have been more realistic. This was recognized during the 2012 MTR, and it
was agreed with the government that the results framework would be adjusted through a
restructuring, which was finalized in June 2013 at which point: (i) seven indicators were
revised; (ii) five new indicators were added; and (iii) one was dropped. These changes were
made based on relevancy, availability of data and measurability. As mentioned above, these
indicators were appropriate for measuring system-wide as well as target area specific
performance.
24. Targeting of the program was also on the most educationally disadvantaged
districts. Selection of the 56 target districts (out of 143 nationwide) was made on the basis
of the net enrollment rate of females lower than the national average according the 2008
school census. Using this criteria, the targeted area contained 75 percent of out-of-school
children in Lao PDR. The remaining 87 districts contribute only to 25 percent of the
children not enrolled in primary school. Moreover, approximately 80 percent of the
population of the program target villages were from at least four of the country’s ethnic
groups. These were Mon-Khmer, Hmong-Mien, Lao-Tai and Sino-Tibetan. The targeting
of the program was an important and appropriate feature of the design since it covered such
a high percentage of the out-of-school children.
25. Building on EDPII experience, the program continued to mainstream project
management within the different MoES departments at the central, provincial and district
levels, and support the government’s move towards decentralization. MoES was the
executing agency, while the ECU was to manage the overall implementation activities,
guided by a Program Steering Committee (chaired by the Vice Minister of MoES) and a
Program Advisory Council, and supported by an Education Sector Working Group
(ESWG). At the technical level, the Program involved eight departments with
Implementing Units (IU)14 to implement specific component activities under the overall
management of the ECU and in close collaboration with Provincial Education and Sports
Services (PESS) and District Education and Sports Bureaus (DESB). This comprehensive
organizational structure was a new concept for the ministry and not without its initial
challenges due to a need to further clarify roles and responsibilities, and foster a stronger
collaboration. Ultimately, however, this structure proved to be appropriate and effective to
implement all planned activities.
14 IUs involved were: (i) Education Construction and Design Management Division (ECDM), Accounting
Division, Budget Division and Control Division of Department of Finance (DOF); (ii) Technology Center
of Education and Sports (SITCES – formerly Education Statistics and Information Technology Center -
ESITC), Strategy Research Education Analysis Centre (SREAC), Planning and Investment Division of
Department of Planning (DP); (iii) Pre-Service Division and In-service Division of Department of Teacher
Education (DTE); (iv) Upgrading Education Division and M&E Division of Department of Non-formal
Education (DNFE); (v) Pre-primary Division, Primary Division, Inclusive Education Center of Department
of Pre-Primary and Primary Education (DPPE); (vi) Evaluation Division (ASLO and EGRA) of Research
Institute for Educational Sciences (RIES); (vii) M&E Division of Department of Education Inspection (DOI);
and (viii) Department of Personnel.
10
26. The project design was comprised of two main components that focused on access
and quality of pre- and primary education and strengthening education policy planning,
implementation and management capacity at all levels of the system. Given the program’s
aim to tackle the most disadvantaged areas, a multi-pronged approach was chosen to
provide a combination of different but inter-related interventions. This design allowed
MoES to experiment with different and innovative approaches, such as the mobile teacher
activity, school meals program or the Community-based School Readiness Program
(CBSRP), as well as interventions that were already proven successful such as CBC and
CGs. Another important feature of the design was the inclusion of a number of
evaluations/assessments, such as the impact evaluation of the school block grants (SBG),
the school meal program, and ASLO and EGRA. While the designed was originally
considered to be complex, in retrospect, the program’s design was appropriate for the
purposes intended, and the ECU, IUs and other ministry departments at all levels showed
the increased capacity and collaboration needed to implement the program. This was a
substantial achievement.
2.2 Implementation
27. Program implementation was initially slow due to the need for capacity
development within MoES as well as the need to understand some of the new and
innovative activities included in the project. Slow implementation was mainly due to the
need to: (i) develop implementation plans for each sub-component, which was a new
concept for some IUs and required hiring additional staff; (ii) update some existing manuals
such as the CBC manual to incorporate improved safety standards for construction in the
56 remote areas; (iii) develop needed training materials and plans for training of the
VEDCs, principals and teachers; (iv) incorporate lessons learned from the provision of
school snacks, piloted by WFP in early 2011; and (v) develop materials for the mobile
teachers and CBSRP activities. Also, DFAT informed the government in a letter dated
March 24, 2010 that its funding contribution to the EFA/FTI Program would not become
available at the same time as the CF15 grant as originally planned. Therefore, quality input
activities only fully started implementation in year two after the grant agreement for DFAT
funds was signed in July 2011. At the time of the first implementation support mission in
October 2011, disbursements were approximately 8 percent.
28. Although implementation of some activities was initially slow, others were
progressing as planned. These included: (i) revision of the CG handbook as well as the
required training for 978 villagers from 326 villages; (ii) establishment of the School Meals
Unit within MoES’ Inclusive Education Center, which ensured full government
involvement and ownership of the activity; (iii) study tours that informed the CBSRP
activities and drafting of teaching and learning materials; (iv) training for EMIS staff on
development of an integrated EMIS system; (v) publication of the first Education Year
Book for 2008-2009 by the Statistics and Information Technology Center of Education and
15 The Administrative Agreement between the government of Australia and the Bank was signed on March
18, 2011; the Australia-funded grant agreement between the government of Lao PDR and the Bank was
signed on July 14, 2011.
11
Sports (SITCES – formerly Education Statistics and Information Technology Center –
ESITC); and (vi) ASLO and EGRA-related training and preparatory activities were
completed and implementation of these activities was on schedule. By the end of 2011,
there was a National School Meal Program (NSMP) manual and the mobile teacher
program was ready for implementation as designed.
29. As mentioned earlier, in December 2011, the Bank had approved a restructuring in
an effort to speed up implementation. This, in addition to concerted efforts by government
and Bank teams, led to a marked increase in disbursements, reaching 56.84 percent by the
end of 2012.
30. The 2012 MTR confirmed that the program remained relevant, the PDO was still
valid and achievable, and disbursements had caught up, averaging US$800,000 a month.
The MTR also recognized that some targets were ambitious and needed to be adjusted to
match the reality on the ground. It also confirmed the need to extend the closing date by
one year from August 31, 2013 to August 31, 2014 to allow for all original activities to be
completed given the slow start-up and the shorter-than-average implementation period.
These changes were approved in the June 2013 restructuring.
31. By the end of the program, MoES had implemented all original activities as
designed. This was a substantial achievement given some of the initial delays, remoteness
of the project areas and innovative nature of some components. When the project closed:
(i) schools were constructed through CBC with satisfactory quality and strong community
commitment/ownership; (ii) CGs and SBGs had been provided, which contributed to
improvements at the school level; and (iii) the NSMP was successfully completed and is
now a government-owned initiative under a national policy. The NSMP is seen by GPE as
a model program and was designated as one of their “Flagship” programs. Moreover, all
training activities related to teachers, principals, pedagogical advisors and VEDCs were
completed, benefitting more than 10,000 direct beneficiaries. The mobile teacher and
CBSRP programs were successfully piloted. Although the government may not continue
the mobile teacher and CBSRP programs because of questions related to their quality,
lessons learned were documented. These lessons have provided valuable information to
MoES as they continue to search for ways to provide non-formal education services. ASLO
and EGRA interventions were also completed with the results analyzed, published and used
by the government to inform future ASLO and EGRA interventions. The program also
contributed to the development of a results-based monitoring system that provides the link
between planning, budgeting and outcomes, and tracks “key indicators” that have been
identified by the government as a priority. Finally, the program raised the government’s
capacity to manage and implement complex projects and government programs. All of
these are substantial achievements.
32. There were also challenges during implementation. Early in program
implementation, DFAT commissioned a review of CBC schools to determine the quality
of the school construction. The study showed that some rehabilitated schools needed
latrines and water stations to conform to original design requirements and also suggested
that new CBC schools should include latrines and water stations. The review mentioned
12
that some communities may not have the required expertise to build more complex latrines
and/or water supply systems mostly due to the difficulties in building gravity-fed water
systems in the very remote program areas. In November 2011, it was decided to transfer
this responsibility the UNICEF’s WASH program because of their expertise in this area.
The WASH program activities were supported by DFAT through a separate grant. At the
time of project closing, UNICEF WASH had not completed all the latrine due to the global
rise in construction material prices and the remoteness of the program target schools. To
ensure completion of all the required latrines, WASH has provided a detailed plan to
complete all remaining works by the end of 2015, and DFAT has provided all the additional
resources required to complete this work. There were also some concerns regarding the
adequate application of safeguards checklists and screening tools, as well as sufficient
documentation of such compliance evidence. After this issue was brought to the attention
of the ECU, changes to the CBC manual were introduced and quality checks performed by
the ECU team prior to the completion of each school. The quality checks confirmed
compliance with relevant checklists and screening tools and attested to the quality of school
buildings. The other challenge for the project was financial management. The delays in
liquidating advances were the main factor in rating implementation progress as moderately
satisfactory four times during the life of the project. The ECU has taken steps to improve
this process and continues the capacity building efforts at the village, district and provincial
levels. These challenges, however, did not undermine the project’s ability to complete all
activities.
33. There were seven World Bank review and implementation support missions from
October 2011 through August 2014. The makeup of the Bank teams was consistently
appropriate and well balanced. Each team composition reflected the needs of the respective
mission and included specialists from the areas of education, financial management,
procurement, construction, environment, social, and monitoring and evaluation specialists
as necessary. In addition, implementation support missions consistently included
representatives from DFAT, UNICEF and others within the donor community who made
valuable contributions to project implementation. The task team leader during
implementation was based in Vientiane, which allowed for regular interaction between the
Bank, donor community and MoES. This also provided the needed continuity for
implementation of the program and the Bank’s ability to quickly respond to
issues/challenges as they arose, further contributing to the project’s success. There were
three Joint Sector Review missions which included participants from the donor community.
These missions reviewed the progress of the program in relation to the overall ESDP.
34. Due to the strengthening of the U.S. Dollar, there was a cancellation of
US$1,732,271 from the EFA/FTI grant, leading to a total disbursement of 94.23 percent.
On the other hand, 90.34 percent of Australian grant funds were disbursed, amounting to
US$14.26 million equivalent at the time of project closing. As mentioned previously, the
reduction in overall fund availability prompted the government and Bank teams to be more
conservative in terms of the number of schools to be constructed to ensure all construction
would be completed and within the available budget. Once the remaining Australian grant
balance could be determined with reasonable accuracy, there was not sufficient time to
start and complete any additional construction, and US$1,525,545 equivalent was
13
cancelled. The total project disbursements in US$ equivalent were approximately
US$42.52 million or 92.88 percent of the combined total of approximately US$45.79
million16 equivalent, and all activities were completed prior to August 31, 2014.
2.3 Monitoring and Evaluation (M&E) Design, Implementation and Utilization
35. Design. The M&E design was three-fold. First, the monitoring of the results
framework and project outputs was to be done by the ECU. Secondly, the program included
the development of an integrated monitoring system that would, for the first time, link
government policy goals to specific actions and targets nation-wide with associated
budgets, supporting MoES’ move more toward results-oriented performance monitoring.
The system monitoring was to be a collaborative effort that included the Department of
Inspection (DOI), SITCES, Strategy Research Education Analysis Centre (SREAC),
Research Institute for Educational Sciences (RIES) and School Quality Assurance Centre
(SQAC) and the monitoring and evaluation network at all level. This was a sizable
undertaking but also highlights MoES’ growing interest in and need for reliable data and
analysis. Finally, the program included a school block grant impact evaluation, an
independent evaluation of some of the program quality interventions17, a Grade 3 ASLO,
an EGRA activity, and a Literacy Assessment and Mapping Program (LAMP) activity in
cooperation with UNESCO. ASLO and EGRA were included to provide a baseline for
future activities. The SBG impact evaluation was conducted with the help of technical
assistance and proved highly relevant. The impact evaluation looked at different modalities
of grant transfers (i.e., through VEDCs versus directly to schools) and effects of different
amounts being transferred (i.e., Kip 20,000 versus Kip 40,000). It was an important design
feature for understanding the effectiveness of this intervention and is currently being used
by the government in deciding the modality to be chosen going forward. As indicated above,
the results framework was reviewed during the MTR and subsequently adjusted through
the 2013 restructuring to include targets that were relevant for PDO achievement,
adequately reflected the different activities being supported by the program and were
realistic. This was an appropriate decision to strengthen the results framework so that
program progress could be measured more accurately.
36. Implementation and Utilization. The ECU and MoES/EMIS regularly provided
Bank missions with data and information that allowed teams to make judgments on
progress toward achieving the PDO and the project’s overall implementation. This
information was consistently reported on by the Bank in aide-memoires and
Implementation Status and Results (ISRs) reports. The ECU also monitored the project
outputs and used the information to make the appropriate adjustments in its annual plans
16 This amount includes exchange rate losses due to the weakening of the AUD.
17Marshall, Jeffery H. (2014). EFA/FTI program Evaluation: An End-of-Project Update on Implementation
of Five Quality Sub-Components. The five quality activities included: (i) VEDC training; (ii) school principal
training; (iii) and the pre-primary 9+2 scholarship program; (iv) CBSRPs; and (v) mobile teachers. These
sub-components were evaluated on a sample basis using a range of analytical techniques, including
interviews with MoES staff, field visits comprising interviews, observations and questionnaires, and data
analysis using administrative information from EMIS.
14
and progress reports. The program-supported trainings, study tours and capacity building
activities have led to a stronger M&E mechanism, an increased awareness of the
importance of good and timely data, and a firmer commitment to moving forward with a
sector-wide monitoring system. At the decentralized level, capacity building efforts have
also led to more attention to details when collecting and reporting data, leading to some
improvement in data quality but more importantly, highlighting areas for improvement.
This will have long lasting effects in improving the efficiency in the use of resources,
especially schools and teachers, by promoting the use of data for planning at the district
level.
37. In an effort to harmonize and link different MoES reporting and tracking systems,
the government developed a results-based monitoring and evaluation system (RMES) in
order to operationalize the concepts that were developed as part of the ESDF, the PAF and
EQS. The RMES is comprised of a set of “key indicators” derived from the different
strategic documents. It is consistent with the output and outcome indicators of the ESDP
Results Matrix and focuses on: (i) quality; (ii) access; and (iii) management. The original
design was to develop the system for the entire education sector. However, during
implementation, it was decided that this was an ambitious goal and that the program would
focus on the primary sub-sector first. This was approved during the 2013 restructuring. The
program supported the government in developing tools to collect data at the central,
provincial, district and school levels for primary education, which will now be used to
establish output and outcome indicator baseline figures for school year 2014-2015. This is
a substantial achievement for a four year implementation period.
38. In addition to the RMES, the program supported the linking of the EMIS, PMIS
and FMIS. At the time the program closed, the EMIS and FMIS systems were already
linked, while the PMIS data was being cleaned before being connected. The government
has started to collect data for the pre-primary and primary sectors, which will be used to
validate information contained in the EMIS. Moreover, the SITCES has created an online
repository “LaoEduInfo”, where data is now routinely uploaded and made available to the
public. Although challenges remain for obtaining accurate and timely information, there
has been a marked improvement in MoES’s capacity to collect and analyze data, which has
facilitated overall access to and verification of information. Further improvements are
expected as the ministry continues to move forward with its monitoring and evaluation
capacity and data access reforms.
39. The 2012 EGRA was conducted and results showed that beginning readers struggle
to develop basic reading skills in Lao language. The EGRA results have been used to
inform the design of the Second GPE Project (GPEII), which will begin implementation in
2015 and includes an activity that will focus on promoting more evidence-based
approaches to teaching and learning of early grade reading in Lao language. The ASLO
results will be used as the MoES works to develop new curricula for grades 1-5 with
support from Australia.
40. Several independent evaluations were conducted related to M&E. These were
evaluations of the: (i) CBC activities; (ii) NSMP and its impact on the targeted areas related
15
to improved nutrition, enrollment, retention and dropout; (iii) quality intervention in a
sample area related to five program activities; (iv) SBGs and their impact on targeted areas;
and (v) LAMP. All of these evaluations provided valuable information for the development
of government and donor programs in Lao PDR: (i) the CBC has been institutionalized
within the MoES and has become the accepted method of constructing pre-primary and
primary school classrooms; (ii) NSMP is now a national program and support for this
program will continue under the Bank-supported Early Childhood Education (ECE)
project; (iii) improvements in teacher training activities are being incorporated into the
Australian government program with Laos and the scholarships for ethnic girls is being
continued under the ECE project; (iv) findings from the SBG impact evaluation have
informed the development of the GPEII project and will be continued by GPE and the Lao
Ministry of Finance; and (v) LAMP results will be used to further inform program to
improve literacy in Lao PDR.
2.4 Safeguard and Fiduciary Compliance
41. Environment and social aspects. The program was rated a Category “C” operation,
not requiring a separate assessment. The program’s compliance was rated “satisfactory”
throughout its life. In terms of environmental safeguards, the program applied the
experience gained from implementing CBC under EDPII and developed the Environmental
Framework for small community construction projects, which was included in the CBC
manual. There was no land acquisition since all works occurred on existing school grounds.
As mentioned earlier, there were occasions of not having fully followed and/or filed the
necessary environmental checklist. However, the quality check performed by the ECU and
Bank teams confirmed that no evidence of major, irreversible damage had been done as
part of school construction. To improve adherence to environmental safeguards guidelines
following the MTR, the CBC manual was updated, the environmental checklist translated
into Lao and refresher training to district engineers and VEDCs provided. A final review
of a sample of CBC schools was conducted prior to the closing date, which found that: (i)
schools were in general compliance with the environmental safeguards requirements; (ii)
relevant checklists had been translated and applied; and (iii) overall construction quality
and school environment safety was satisfactory. There was concern as part of EDP II school
construction about the ceiling materials possibly containing asbestos. Therefore, the ECU
went out and collected samples from 121 GPE schools and submitted them for testing to
an Australian company, which confirmed that all schools were asbestos-free.
42. There were no major social safeguards issues. As part of its continuing due
diligence, the Bank used the MTR as an opportunity review the application of the Ethnic
Group Development Plan (EGDP)18 and suggested a number of improvements. These
included: (i) translating the EGDP into Lao and making it available to the public; and (ii)
document the findings of the safeguards screening and disseminate them in subsequent
progress reports. The EGDP was deemed a useful tool by mobile teachers working in
remote/ethnic villages, while also guiding student assessment activities and supporting
training of village and school officials on inclusive education (including disability and
18 The EGDP had already been successfully used and applied as part of EDPII
16
ethnicity). The final review confirmed that these suggestions had been taken into account,
the EGDP was being applied and reporting was done on a six-month basis.
43. Financial management. Financial management remained moderately
satisfactory throughout the life of the project mainly due to delays in liquidating
outstanding advances due to records being kept at the local level per decentralized system,
initial delays in submitting unaudited interim financial reports (IFRs), record keeping
challenges and delays in flow of funds to decentralized structures. However, many of these
challenges were identified and addressed so that by the project’s mid-term, average
disbursements had reached US$800,000 per month and allowed the project to complete all
activities. Furthermore, the project’s accounting system “ACCPAC” was deemed
satisfactory and able to generate accurate reports, and audit reports consistently issued a
clean opinion throughout the life of the project. Steps taken to increase the flow of funds
and reporting included: (i) increasing the Special Account ceiling in November 2011 from
US$2 million to US$4 million; (ii) establishing an operating account that was managed by
the Department of Finance to finance small transactions (i.e., petty cash transactions); (iii)
installing a customized version of “ACCPAC” at the central and decentralized levels and
planned additional training; and (iv) providing intensive technical assistance by the Bank’s
financial management team. As a result, IFR submission significantly improved,
disbursements accelerated and outstanding advances were fully cleared before the end of
the grace period. Going forward, the government is in the process of finalizing the “Budget
Control System” to help the department better track expenditures, commitments and
balances and subsequently improve planning and budgeting. Furthermore, the government
is considering empowering the DOF’s “Administration Divisions” to lead the handling of
advances and liquidation tasks to avoid having large outstanding advances in the future19.
44. Procurement. Procurement was consistently rated satisfactory. Initial delays due
to quality of bidding documents were addressed so that the project was able to carry out its
activities. Procurement plans were prepared and routinely submitted for review by the Bank,
found to be acceptable and used as a basis to judge overall implementation progress. There
was also an increase of donor-funded projects that the ECU was managing, which led to
requests for clarification from the ECU as to which sources of funding to use for a given
procurement package. However, once these requests were clarified, the ECU consistently
used the proper resources to process bidding packages and award contracts. Bank
implementation support missions carried out ex-post reviews and also confirmed that the
project was in conformity with the applicable procurement guidelines.
2.5 Post-completion Operation/Next Phase
45. The community-based targeted programs have become the cornerstone of basic
education for the government. The EFA/FTI Program incorporated the EDPII community
activities, which in turn has informed the new IDA-supported ECE project and the new
GPEII project (which has been approved by the GPE Board in December 2014). Both
19 Both the ECE and GPE II project are supporting the use of the “Administration Divisions” to mitigate
encountering outstanding advance issues.
17
operations have included the community-based programs in their designs. Specifically,
these two operations, which have been developed with significant ownership by MoES,
will build on the success of the EFA/FTI Program and will: (i) continue to rely on the cost-
effective CBC method for construction of project classrooms in the most disadvantaged
districts; (ii) provide block grants that enable communities, through the VEDCs, to develop
teaching and learning materials for young children; (iii) provide scholarships to minority
girls to become teachers in their villages; (iv) continue to support the government through
the NSMP; (v) pilot school-based management (SBM) in the designated 56 disadvantaged
districts; (vi) provide support for another EGRA intervention; and (vii) continue the
integration of government monitoring systems and inclusion of early childhood indicators
to facilitate evidence-based policy making. These new operations have also incorporated
evaluation mechanisms into their designs based on the experience gained from
implementing such activities under the EFA/FTI Program.
3. Assessment of Outcomes
3.1 Relevance of Objectives, Design and Implementation
46. Relevance of Objectives. The project development objectives were highly
relevant to the country’s sectoral needs when the project was developed. The objectives
fit squarely into the government’s “Strategic Vision up to the year 2020”, the 2009-2015
ESDF and the Bank’s 2008-2011 CAS. They shared many common objectives, related to
increased access of poor and vulnerable groups to basic education services. The project
objectives continue to fit into the FY2012-16 Country Partnership Strategy (CPS) for Lao
PDR and the 7th NSEDP 2011–2016, both indicating that education is a national priority
and core part of the government’s overall development strategy. As mentioned previously,
the program objectives continue to be relevant for the achievement of the MDG Goals 2
and 3, as well as the EFA goals.
47. Relevance of Design. The project design was highly relevant and appropriately
aligned with the government’s “Strategic Vision up to the year 2020", focusing on the 56
most disadvantaged districts, which in turn was highly relevant for the NGPES as well as
the 7th NSEDP. Although initially deemed complex, the MoES was able to fully implement
all the activities as designed. This was achieved due to a substantial level of commitment
on the part of MoES at all levels. It also supported the work started under EDPII to
mainstream implementation into the MoES’ daily work and further strengthening their
capacity. The PDO was appropriate and, again, focused on the most disadvantaged districts
with the most educational challenges. As indicated, some of the original PDO indicators
and targets needed to be adjusted to fit changes in indicator at the national level as well as
the realities that were discovered during implementation review missions. This was done
after the MTR through another program restructuring. The lessons learned from
implementing EDPII were instrumental in the successful design of several program
activities such as CBC and SBG. This, combined with manuals that were prepared under
EDPII, allowed the project to become effective upon signing of the financing agreement.
In addition, the CBC and SBG activities have guided the development of the SBM pilot
under the new GPEII project.
18
48. Inclusion of the various evaluations in the program design was highly relevant. All
of the evaluations provided valuable information on the impact of several important
interventions. This information has been used to further improve the design of these
interventions as the government and other donors continue these activities. Moreover, the
focus of the design on developing a fully integrated M&E system has provided a strong
foundation that has been institutionalized with the formation of an M&E network team that
continues to work on the system integration. The inclusion of EGRA and ASLO activities
also proved highly relevant with the results from EGRA being used to develop activities
for the follow-on GPEII project as well as other donor activities. The project risks and
mitigation measures were also appropriate. As mentioned previously, the organizational
structure was initially challenging but MoES, the ECU and other departments eventually
overcame these challenges and were able to implement all planned activities in part because
of the chosen organizational structure design.
49. Relevance of Implementation. The relevance of project implementation is judged
to be high. As indicated above, the MoES was able to implement all project activities as
planned. Where the MoES and ECU encountered implementation challenges, such as with
financial management, they were able to work with Bank staff to find solutions and resolve
the issues. The lessons learned are now being incorporated into the ongoing work of the
MoES at the central and decentralized levels. Project implementation was also highly
relevant by supporting MoES’ efforts to operationalize the concepts that were developed
as part of the ESDP, the PAF and EQS through the RMES. Latest information available at
the time of ICR writing revealed that the ECU: (i) had been able to clear the liquidation
issues; and (ii) provide the needed data which recorded current evidence of the project’s
final achievements. These were positive developments and an indication of increased
capacity.
3.2 Achievement of Project Development Objectives
50. The project development objective was to increase coverage and improve the
quality of pre-primary and primary education with a focus on the most educationally
disadvantaged children. This section evaluates the outcomes against the PAD results
framework that was adjusted following the MTR through a formal restructuring. More
details on project outputs can be found in Annex 2.
51. Increased coverage was to be measured by the following PDO indicators: (i)
enrollment numbers in target areas by category (grade level and gender); (ii) gross
enrollment rate (disaggregated as country-wide and target areas [grade level and gender]);
(iii) net enrollment rate (disaggregated by country/gender, and target areas/gender; and (iv)
gender parity index for primary education (in 56 target districts).
52. There was considerable progress in these PDO level indicators. Overall enrollments
in target districts increased from 306,626 (of which 139,825 were female) in 2008/2009 to
324,740 in 2013/2014 (of which 153,909 were female) missing the target of 339,081
(161,432 females). Although the target was missed, total primary enrollment increased in
the 56 districts during the life of the project. Performance in regard to meeting individual
19
grade targets for grades 2-5 was mixed, although enrollments for these grades are higher
in 2013/2014 than they were in 2008/2009. There is some evidence that suggests that the
decline in grade 1 enrollments is due to reduced fertility rates, declining repetition rates or
a combination of both, which is being further analyzed within the MoES to better
understand the policy implications. (See Annex 2 for additional details on enrollment data.)
53. Gross enrollment rates in the 56 target districts increased from 121 percent in
2008/09 to 127.6 percent in 2013/14 surpassing the target of 125.6, and for girls from 112
in 2008/09 to 123.2 percent surpassing the target of 119.5. GER nationwide decreased from
123.4 percent in 2008/09 to 119.9 in 2013/13, and for girls from 118.3 in 2008/09 to 117.4
percent in 2013/14. GER nationwide is decreasing as right aged children begin to enter
school while, the GER in targeted areas is increasing with increased access. These are both
positive trends.
54. Overall net enrollment rates in the 56 program districts increased from 78.7 percent
in 2008/09 to 96.2 percent in 2013/14 surpassing the target of 94 percent and for girl’s 81.9
percent to 95.3 percent, again surpassing the target. Net enrollment rates in the country
increased from 91.6 percent in 2008/09 to 98 in 2013/14 surpassing the target of 96.8
percent. Nationwide, girls’ net enrollment rates increased from 90.4 percent in 2008/09 to
97.6 percent in 2013/14 surpassing the target of 96 percent. The gains achieved in the
targeted areas were substantial given that the program operated in very remote and
difficult-to-access areas.
55. Gender parity in the program districts showed a marked increase from 0.88 in
2008/2009 to 0.97 2013/2014, meeting the target. This shows a considerable improvement
during the life of the project.
56. Improved quality was to be measured by: (i) Education Quality Standards (EQS)
Framework approved and adopted at the school level; (ii) dropout rates (target areas [grade
and gender] and nation-wide by grade); (iii) system for learning assessment at the primary
level (and utility of the learning system assessment); and (iv) primary survival rate to grade
5 in target districts.
57. Impressive results were observed related to EQS20. There were 6,000 teachers that
participated in a 10-day in-service upgrading program that included training on EQS. In
addition, all target district schools have adopted the EQS framework and 11,313 school
personnel and VEDCs were trained in its application, thereby meeting the program end
target. The independent quality evaluation, in a sample area, confirmed that the training
included information on the EQS. The quality evaluation also showed that in the sample
areas: (i) 70 percent of principals were making annual plans and of these, 90 percent were
using school funds in accordance with their plans; (ii) 60 percent of principals conducted
classroom observations and provided feedback to teachers; and (iii) 83 percent of VEDCs
20 EQS has 42 indicators that are used to determine the minimum standards for schools. The EQS model uses
the indicators for school self-assessments by school principals and head teachers. This includes, but is not
limited to, training related to child rights, concept of EQS, gender roles, inclusive education and health
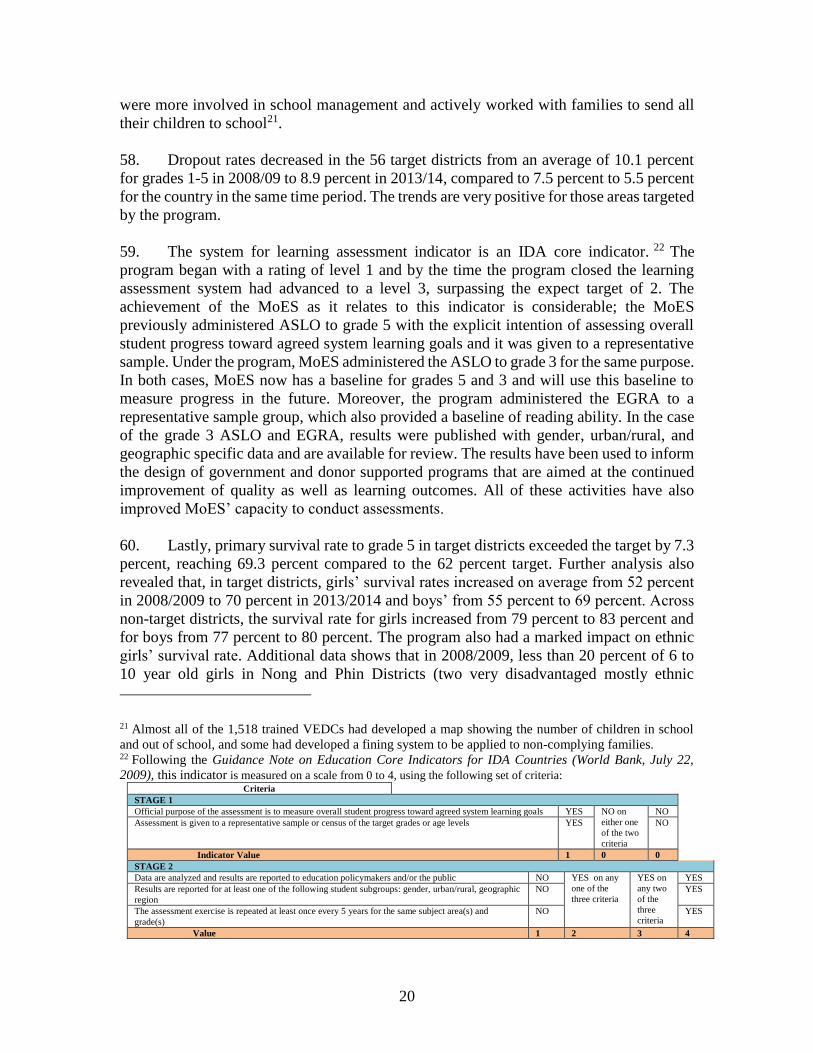
20
were more involved in school management and actively worked with families to send all
their children to school21.
58. Dropout rates decreased in the 56 target districts from an average of 10.1 percent
for grades 1-5 in 2008/09 to 8.9 percent in 2013/14, compared to 7.5 percent to 5.5 percent
for the country in the same time period. The trends are very positive for those areas targeted
by the program.
59. The system for learning assessment indicator is an IDA core indicator. 22 The
program began with a rating of level 1 and by the time the program closed the learning
assessment system had advanced to a level 3, surpassing the expect target of 2. The
achievement of the MoES as it relates to this indicator is considerable; the MoES
previously administered ASLO to grade 5 with the explicit intention of assessing overall
student progress toward agreed system learning goals and it was given to a representative
sample. Under the program, MoES administered the ASLO to grade 3 for the same purpose.
In both cases, MoES now has a baseline for grades 5 and 3 and will use this baseline to
measure progress in the future. Moreover, the program administered the EGRA to a
representative sample group, which also provided a baseline of reading ability. In the case
of the grade 3 ASLO and EGRA, results were published with gender, urban/rural, and
geographic specific data and are available for review. The results have been used to inform
the design of government and donor supported programs that are aimed at the continued
improvement of quality as well as learning outcomes. All of these activities have also
improved MoES’ capacity to conduct assessments.
60. Lastly, primary survival rate to grade 5 in target districts exceeded the target by 7.3
percent, reaching 69.3 percent compared to the 62 percent target. Further analysis also
revealed that, in target districts, girls’ survival rates increased on average from 52 percent
in 2008/2009 to 70 percent in 2013/2014 and boys’ from 55 percent to 69 percent. Across
non-target districts, the survival rate for girls increased from 79 percent to 83 percent and
for boys from 77 percent to 80 percent. The program also had a marked impact on ethnic
girls’ survival rate. Additional data shows that in 2008/2009, less than 20 percent of 6 to
10 year old girls in Nong and Phin Districts (two very disadvantaged mostly ethnic
21 Almost all of the 1,518 trained VEDCs had developed a map showing the number of children in school
and out of school, and some had developed a fining system to be applied to non-complying families. 22 Following the Guidance Note on Education Core Indicators for IDA Countries (World Bank, July 22,
2009), this indicator is measured on a scale from 0 to 4, using the following set of criteria: Criteria
STAGE 1
Official purpose of the assessment is to measure overall student progress toward agreed system learning goals YES NO on
either one
of the two
criteria
NO
Assessment is given to a representative sample or census of the target grades or age levels YES NO
Indicator Value 1 0 0
STAGE 2
Data are analyzed and results are reported to education policymakers and/or the public NO YES on any
one of the
three criteria
YES on
any two
of the
three
criteria
YES
Results are reported for at least one of the following student subgroups: gender, urban/rural, geographic
region
NO YES
The assessment exercise is repeated at least once every 5 years for the same subject area(s) and
grade(s)
NO YES
Value 1 2 3 4

21
districts) reached grade 5. In 2013/2014, this had increased to just over 55 percent.
Similarly, in Long District, another very disadvantaged mostly ethnic area, only 28 percent
of girls reached grade 5 in 2008/2009 but by 2013/2014, this had improved to 76 percent.
61. The independent evaluations provided more support for achievement of the PDO
as well as offer useful insights into the effects of some of the quality interventions, NSMP
and the CBC activity. The evaluation of the program quality activities found that in sample
areas: (i) learning was taking place as a result of the mobile teacher intervention; (ii)
enrollments had increased in grades 1-5 by 2.8 percent in districts where school principals
received program-supported trainings compared to a 7.4 percent decrease in enrollment in
districts where principals had not received training; and (iii) VEDCs were very active in
ensuring that all families sent their children to school. The NSMP evaluation also found
that the NSMP had a positive impact on education results in its 9 target districts: (i) NER
increased from 90.4 percent to 97.62 percent; (ii) completion rates increased from 74.60
percent to 78.30 percent; (iii) transition rates went from 81.37 percent to 87.6 percent; (iv)
repetition rates dropped by 3.45 percent to 16.4 percent; and (v) dropout rates also fell from
9.35 percent to 3.35 percent. Further analysis of MoES data in the 56 targeted districts
found impressive effects on girls’ participation in schooling: in two highly disadvantaged,
mostly ethnic districts in Savannakhet province, the percentage of girls reaching grade 5
went from only 20 percent to 55 percent. In another province, 76 percent reached grade 5
compared to only 28 percent prior to program intervention. Lastly, the project had a clear
impact on the number of complete schools (i.e., schools offering 5 grades) and the number
of schools with only one or two teachers: (i) the percentage of complete schools rose from
40 percent to 73 percent compared to an increase from 62 percent to 81 percent in non-
program districts; and (ii) the number of schools with only one or two teachers decreased
from 63 percent to 44 percent. These are substantial improvements.
3.3 Efficiency
62. This economic analysis shows that the program has achieved its objectives.
Enrollment and survival rates in target districts and schools have increased more than the
national average. The analysis also shows that this was done in a cost-effective manner,
especially the construction through community-based contracting. The program supported
important reforms and capacity improvements in: (i) school based management; and (ii)
the diagnostic of learning outcomes through the EGRA and ASLO. Improvements were
also noted in terms of the information system and building capacity for its use for policy
making. In terms of sustainability, the project has increased the operational budget needed
to continue the investment, mainly in the form of teachers for the additional classrooms
built and the school block grants for the increase in enrollment generated by the program.
However, relative to the overall budget, the increases in operational expenditure from the
project are small. (See Annex 3 for details.)
22
3.4 Justification of Overall Outcome Rating
Rating: Moderately Satisfactory
63. The overall outcome rating of the project is moderately satisfactory. The
relevance of design was high. The design focused on the government’s decentralization of
education with a recognition of the need to support local communities for the delivery of
education in remote schools and ultimately proved to be appropriate despite initial
challenges. It shifted the orientation of the MoES and sector to focus on the community
and provided a good entry point for a dialogue with government on the best delivery system
of quality education. It empowered VEDCs and teachers and presented a marked and
positive shift from the centralized structure of delivery. The community empowerment
approach with CBC and SBGs has also become a key feature of ongoing reforms within
MoES. The design was also instrumental in mainstreaming implementation of donor
supported projects within MoES, which has now been institutionalized. The relevance of
implementation was high. While there were challenges during implementation, the MoES
and ECU, working with the Bank team, made necessary adjustments to successfully
complete the activities or draw lessons for future interventions. They also continued to
focus considerable attention on strengthening capacity at local levels to ensure quality of
construction and improvements in the financial management system. In addition, the
NSMP was institutionalized through a government policy, and had a marked impact on the
schools and villages where it was piloted. Efficacy is rated satisfactory because the PDO
was achieved as measured by the achievement of the PDO indicators. Finally, the program
was implemented efficiently.
Table 2: Project Rating Original Project – 8/12/2010 – 5/30/ 2013 – 76.80 percent disbursement-net project funds1
Project Relevance Achievement of PDO (Efficacy) Efficiency Overall Rating
High Moderately Satisfactory Substantial Moderately Satisfactory
Original Project – 6/12/2013 – 12/31/2014 – 23.20 percent disbursement-net project funds1
Project Relevance Achievement of PDO (Efficacy) Efficiency Overall Rating
High Moderately Satisfactory Substantial Moderately Satisfactory
Overall Project Ratings – 92.88 percent disbursement of total grant as of 12/31/20143
Project Relevance Achievement of PDO (Efficacy) Efficiency Overall Rating
High Moderately Satisfactory Substantial Moderately
Satisfactory2
1The net amount for the total project is US$42.52 million.
2 Overall rating = (4)(.7680) +(4)(.2320) = 4 3 Due to the weakening of the Australian dollar, the total grant amount for the project was reduced from
US$51.77 million equivalent at the time of appraisal to US$45.79 million equivalent by the time of ICR
writing .
3.5 Overarching Themes, Other Outcomes and Impacts
(a) Poverty Impacts, Gender Aspects, and Social Development
64. The project has played an important role in increasing female participation within
the VEDCs. All 1,518 VEDCs had at least one woman representative and one
23
representative of local ethnic groups. This shows an increase compared to VEDC training
carried out under EDPII, where only 26 percent of VEDCs included female representatives.
This increase of female participation and diversification of VEDC members is a reflection
of the focus of the VEDC training, which was supported by the program, on the importance
of inclusive village and school development. As mentioned previously, the program
supported the schooling of ethnic girls from disadvantaged areas to become pre-primary
teachers. It also supported the training of 398 ethnic girls through a combination of a two-
year program or a 30-week in-service training (depending on their entry qualifications), all
of whom have returned to their village and are currently teaching. While it is recognized
that there are quality issues with the CBSRP, it provided important evidence for the need
for early childhood services and has provided lessons learned, which guided the
development of the Bank-supported ECE project.
65. Finally, the NSMP provided school lunches to pre-primary and primary school
children with a view to encourage school attendance of girls and boys in remote rural
communities as well as to provide better nutrition for students. The program’s innovative
‘home grown’ modality of resources supported the provision of lunches prepared by local
cooks, with locally grown and procured ingredients. As indicated, some of positive
outcomes were: (i) increased school attendance of girls and boys in remote rural
communities; (ii) provision of nutritious meals prepared with fresh local ingredients that
fit local tastes; (iii) shared responsibility and ownership of the program among parents,
teachers, and the community; and (iv) support for the local economy by creating jobs for
cooks and purchasing locally grown ingredients while reducing potential costs associated
with procurement and transportation of ingredients from elsewhere. Moreover, significant
improvements have been made in upgrading the nutritional value, diet diversity, and
training for cooks on food safety and hygiene. Based on its success, which is consistently
marked with popular reception and request from school, village, district, provincial and
central levels, the program has been expanded under the GPEII project.
(b) Institutional Change/Strengthening
66. The government has fully embraced the CBC, which has now become the norm for
the construction of pre-primary and primary classrooms in rural Lao and is being
considered as a construction modality by other donors. The project helped institutionalize
SBGs, which has had a positive impact on empowering the community and school
principals in managing schools and supplies, and which has now become the government’s
choice of supporting decentralized school management. The advances in the EMIS have
increased the amount of data available as well as the processes for data collection, data
entry and verification. Reporting has greatly improved: Data are collected yearly at the
beginning of the school year, and are available before the end of the natural year. The data
are also reported through a variety of formats including a Statistical Book, a CD, the
LaoEduInfo website and, notably, mobile apps. Another long-lasting contribution of the
program to the quality of the system was the institutionalization of the RMES, which now
provides the framework for cooperation and collaboration between the various MoES units
responsible for the overall M&E system. This has been a substantial achievement of the
project.
24
(c) Other Unintended Outcomes and Impacts (positive or negative)
67. An unintended outcome of the distribution of community grants, school block
grants and construction of primary schools was the demand for provision of pre-schools to
accommodate younger siblings of primary school pupils. This demand led to an increased
focus by MoES on early childhood education and the development of the Bank-supported
ECE project to improve the delivery of early childhood education.
3.6 Summary of Findings of Beneficiary Survey and/or Stakeholder Workshops
Not Applicable
4. Assessment of Risk to Development Outcome
Rating: Moderate
68. There were three issues identified as risks during the original project preparation
with an overall rating of moderate. The ratings were primarily related to: (i) barriers to
access due to poverty and ethnicity, (ii) technical/design risks; and (iii) capacity constraints
within MoES. The mitigation measures incorporated in the project, with the relevant
targeting, inclusion of technical assistance for all components, and capacity building in
every component, were appropriate and ultimately responsible for ensuring smooth project
implementation. The risks associated with financial management were identified as a
substantial risk. Going forward, the financial management risk is likely to be substantial
given the increased decentralization of financial responsibility that will require
considerable capacity building at the local level. The overall risks for maintaining
educational services should be moderate given the institutionalization of the ESDF within
MoES and the agreement between the donors and government to use the ESDF for
prioritizing both government and donor resources. All active donors in the education sector
are currently developing program support that fits squarely within the ESDF. These include,
but are not limited to, the Bank-support ECE project, GPEII, the Australian government’s
10–year BEQUAL program, and UNICEF program. All of these factors, along with the
increased capacity within MoES to implement education projects, point to a moderate
future risks rating.
25
5. Assessment of Bank and Borrower Performance
5.1 Bank Performance
(a) Bank Performance in Ensuring Quality at Entry
Rating: Moderately Satisfactory
69. The project preparation team ensured that the project design: (i) was closely aligned
with country’s sectoral needs; (ii) supported the government’s “Strategic Vision 2020”, the
2009-2015 ESDF and the 7th NSEDP 2011–2016; and (iii) was in line with the Bank’s
2008-2011 CAS and the FY2012-16 CPS. The preparation team also ensured that the
project supported Lao PDR’s aim of achieving the MDGs 2 and 3. As mentioned previously,
the design was deemed complex at different stages of implementation and it took longer
than anticipated for program activities to start up. However, the government was able to
implement the project and respond to the country’s varied needs. The PDO and the results
framework were appropriate to measure project impact by gender and location and progress
towards PDO achievement. The design was informed by comments received during the
concept note review stage, including comments from DFAT as the co-financer and others
in the donor community. This was important to avoid duplications with other donor
operations and capitalize on lessons learned. The design was also informed by EDPII
implementation experience, which also ensured alignment with the EDPII additional
financing being prepared during the same period.
70. The design team ensured that project management was structured to continue to
operate through the MoES (not an external management unit) and with an aim to further
the government’s decentralization approach. As mentioned previously, the preparation
team capitalized on ground work which had already been done through EDPII and the IDF,
leading to the program being declared effective within one year of preparation start-up.
The preparation team identified the appropriate risks such as the need to synchronize
implementation of the many sub-components and incorporated design features to mitigate
them and included the relevant technical specialists to develop the project. All-in-all, the
quality at entry for the EFA/FTI Program was moderately satisfactory.
(b) Quality of Supervision
Rating: Satisfactory
71. There were seven Bank implementation support missions (including a mid-term
review), which were conducted with the participation of donor partners. The Bank was
actively engaged in supporting the government in its efforts to implement the project. The
in-country presence of the task team leader allowed for continued interactions between the
government, the Bank and other donors through informal meetings and exchanges in
addition to implementation support and joint sector review missions. The government
repeatedly mentioned the country-based TTL as having been instrumental in facilitating
early identification of potential bottlenecks and mobilizing the necessary technical
expertise to resolve them. In addition to the task team leader, the in-country presence of
26
the fiduciary and safeguards teams further enhanced the Bank’s ability to promptly respond
to client and donor partner requests and resolve challenges (i.e., helped facilitate advance
liquidation, raising the designated account ceiling, proposed improvements to the
safeguards tools etc.). Furthermore, the Bank worked actively with the government to
ensure that, following the work done during the MTR, the results framework and its targets
were adequately revised, which strengthened the chance of achieving the project objectives.
The Bank team also supported the external mid-term review of the ESDP, which looked at
a wide range of issues like education financing, recurrent costs to issues affecting pre- and
primary education, as well as teacher training and deployment. This confirmed the
program’s objectives and interventions to focus on disadvantaged areas and implement
innovative approaches such as the CBSRP and mobile teachers. Whenever implementation
challenges arose, the Bank team worked with government to find solutions that would not
compromise the integrity of the design. The implementation support teams consistently
reported on financial management and procurement progress during missions and worked
with the ECU team to build their capacity in these areas. As already indicated, they also
systematically documented project progress in aide-memoires, back-to-office reports and
ISRs, all of which kept Bank management informed of progress and provided the
foundation for the ICR analysis.
(c) Justification of Rating for Overall Bank Performance
Rating: Moderately Satisfactory
72. Based on the implementation analysis above, overall Bank performance is rated
moderately satisfactory
5.2 Borrower Performance
(a) Government Performance
Rating: Satisfactory
73. At the time of preparation, the government was fully committed to the program.
MoES led the ESDF development exercise with the support of the ESWG and promptly
submitted an application for a CF grant. In consultation with other donors, the government
identified the Bank as the “supervising entity” and closely worked with the Bank team to
develop and successfully secure the US$30 million grant from the EFA/FTI CF program.
In addition, the MoES was actively working with DFAT to secure the AUD 20.26 million
trust fund to co-finance the EFA/FTI Program. All parties actively participated in the
program launch workshop and remained committed to the overall goals of the project. As
mentioned above, MoES has embraced the CBC, SBGs and NSMP of the EFA/FTI
Program design and institutionalized them as the government’s way of delivering pre-
primary and primary education in the most disadvantaged districts. MoES has also been
committed to improving overall M&E and expanding data collection and analysis capacity
at different levels, which has contributed to better information gathering and sharing, and
has helped better guide program implementation.
27
(b) Implementing Agency or Agencies Performance
Rating: Satisfactory
74. The ECU was responsible for coordinating all aspects of implementation. When
faced with implementation challenges, the ECU was able to work effectively with the other
MoES departments and the Bank to resolve them. The ECU was also instrumental in
ensuring training was being provided down to the community level and program
implementation was carried out in the appropriate sequence. This is a substantial
achievement and shows the increased capacity of the ECU. The liquidation of advances
was a consistent problem but this was mainly due to weak capacity at the local level. The
ECU continues to work to build local capacity and improve the liquidation of funds and to
this end, the government is considering empowering the DOF’s “Administration Divisions”
to lead the handling of advances and liquidation tasks. The project’s procurement
performance was also consistently rated satisfactory due to fact that procurement files were
in proper order and post-reviews revealed that procurement guidelines were followed.
Based on these aspects, the implementation agency performance is rated satisfactory.
(c) Justification of Rating for Overall Borrower Performance
Rating: Satisfactory
75. Based on the implementation analysis above, overall borrower performance is rated
satisfactory.
6. Lessons Learned
76. Lesson 1. Decentralization of school construction to remote rural communities
increases ownership and commitment to education. The program used CBC which
substantially lowered the cost of classroom construction and led to increased interest in
education in the program areas. The CBC evaluation showed that parents were more
willing to send their children to school when they participated in the CBC. It also showed
that CBC was more effective in the program villages rather than in villages where the
community based activities were mandated by the authorities, donors or development
partners.
77. Lesson 2. Mainstreaming implementation within government agencies
requires ongoing capacity building. The program was the largest Bank- and donor
supported program to mainstreamed implementation within MoES. The program supported
capacity building which has led to substantial skills upgrading within MoES for project
management. The horizontal cooperation between departments within MoES has also
improved particularly as it relates to M&E activities. The MoES continues to strengthen
the capacity of departments as well as improve the horizontal cooperation at all levels.
Mainstreaming of project management has institutionalized within MoES and is the
implementation method used by the Bank-supported ECE project and the new GPEII
project.

28
78. Lesson 3. Well-defined/well-targeted pilot activities can have a large impact
when providing governments with tangible evidence. Evidence-gathering activities
embedded within the NSMP pilot helped demonstrate that providing lunches had a positive
impact on enrollments, transition and survival rates, and reduce repetition and drop-out
rates. Based on the ability to provide such evidence, the NSMP pilot was embraced by the
government as a cost-effective and efficient way to support the achievement of MDG 2
(universal primary education). NSMP is now a government-owned program to which
donors provide technical and financial support.
79. Lesson 4. Inclusion of analytical studies as part of project design is essential
for providing guidance to decision makers on systemic reforms. The SBG and NSMP
impact evaluations have been used to inform the continuation and expansion of the
governments SBG and NSMP programs as well as donor support for these programs. The
EGRA, ASLO, LAMP results and assessment of quality interventions have also been used
to develop donor and government activities that will be used to improve learning outcomes
through curriculum reform, teacher training and community involvement.
80. Lesson 5. Strong financial management systems are critical for ensuring the
efficient use and accounting of resources. Lack of a fully functioning financial
management system led to delays in liquidation of advances throughout the project period
and reporting delays during the early implementation period. There was substantial
improvement in reporting during the implementation of the project. However, there is still
a need for improvement in the liquidation of advances. The MoES continues to use
technical assistance to support capacity building in this area and follow-on projects
continue to focus on improving the financial management system.
7. Comments on Issues Raised by Grantee/Implementing Agencies/Donors
(a) Grantee/Implementing agencies
See Annex 7 for borrower ICR.
(b) Cofinanciers/Donors
No donor comments were received.
(c) Other partners and stakeholders
Not Applicable.
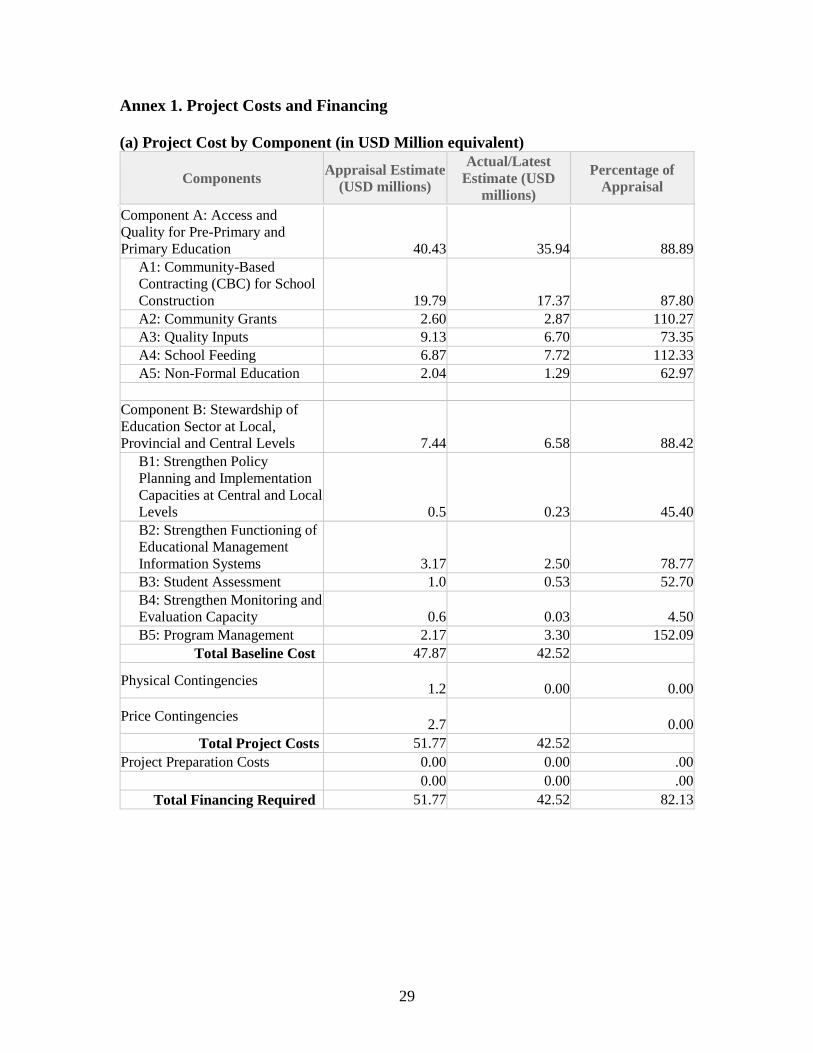
29
Annex 1. Project Costs and Financing
(a) Project Cost by Component (in USD Million equivalent)
Components Appraisal Estimate
(USD millions)
Actual/Latest
Estimate (USD
millions)
Percentage of
Appraisal
Component A: Access and
Quality for Pre-Primary and
Primary Education 40.43 35.94 88.89
A1: Community-Based
Contracting (CBC) for School
Construction 19.79 17.37 87.80
A2: Community Grants 2.60 2.87 110.27
A3: Quality Inputs 9.13 6.70 73.35
A4: School Feeding 6.87 7.72 112.33
A5: Non-Formal Education 2.04 1.29 62.97
Component B: Stewardship of
Education Sector at Local,
Provincial and Central Levels 7.44 6.58 88.42
B1: Strengthen Policy
Planning and Implementation
Capacities at Central and Local
Levels 0.5 0.23 45.40
B2: Strengthen Functioning of
Educational Management
Information Systems 3.17 2.50 78.77
B3: Student Assessment 1.0 0.53 52.70
B4: Strengthen Monitoring and
Evaluation Capacity 0.6 0.03 4.50
B5: Program Management 2.17 3.30 152.09
Total Baseline Cost 47.87 42.52
Physical Contingencies 1.2
0.00
0.00
Price Contingencies 2.7
0.00
Total Project Costs 51.77 42.52
Project Preparation Costs 0.00 0.00 .00
0.00 0.00 .00
Total Financing Required 51.77 42.52 82.13
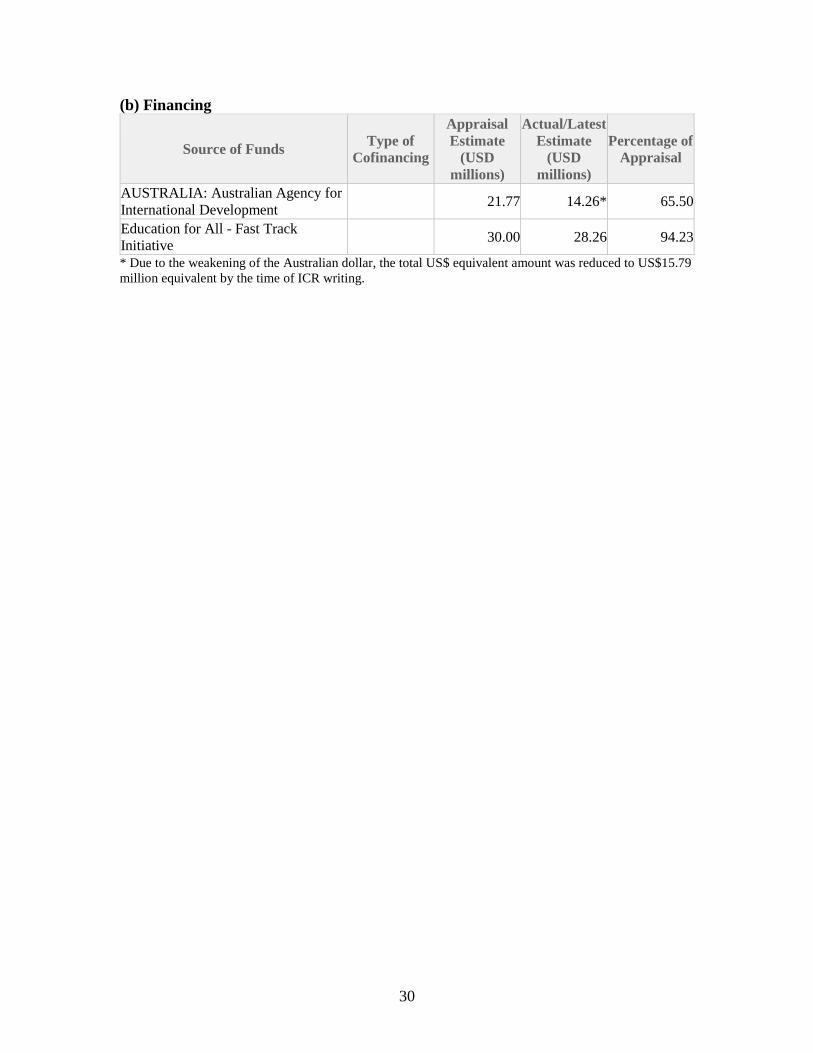
30
(b) Financing
Source of Funds Type of
Cofinancing
Appraisal
Estimate
(USD
millions)
Actual/Latest
Estimate
(USD
millions)
Percentage of
Appraisal
AUSTRALIA: Australian Agency for
International Development 21.77 14.26* 65.50
Education for All - Fast Track
Initiative 30.00 28.26 94.23
* Due to the weakening of the Australian dollar, the total US$ equivalent amount was reduced to US$15.79
million equivalent by the time of ICR writing.
31
Annex 2. Outputs by Component
81. Initial progress towards achieving project outcome and meeting output targets was
measured by eight PDO indicators and nine intermediate indicators. Following the 2013
restructuring the revised results framework included eight PDO and eleven intermediate
indicators. This annex uses the combined indicators as listed in the revised results
framework to assess output achievements.
Component A: Access and Quality for Pre-Primary and Primary Education (US$21.9
million - EFA-FTI; AUD 20.0 million - DFAT)
82. The aim of this component was to support minimum standards for pre-primary and
primary schools in six key operation areas derived from the GOL Schools of Quality
(SOQs). The six operational areas were: (i) inclusive education to provide children with a
safe inclusive school environment regardless of gender, disability, ethnic background or
level of poverty; (ii) promotion of gender equality through quality in enrollment and
achievement; (iii) quality of education through effective teaching and learning with
teachers that have a minimum level of qualifications; (iv) improved physical infrastructure
and school environment; (v) local ownership and participation with a focus on VEDCs
responsibilities for delivery of education services; and (vi) school management and
leadership using the VEDCs.
83. Sub-component A1: Community-Based Contracting (CBC) for School
Construction. (GPE US$12.1 million and DFAT AUD 9.6 million). This sub-component
was designed to improve the physical infrastructure and school environment through
transfer grants-in-aid for CBC for school construction for communities within the 56 target
districts. The original project design was to upgrade or replace 1,500 primary schools and
provide water supply and latrines for approximately 2,100 schools. However, when
implementation began, these targets were reduced based on district need. In terms of
schools, the target was reduced to 332 new construction, which the program met by the end
of the third year. At the time of the 2013 restructuring, it was agreed to increase the target
by 80 to 412 schools since the program implementation period was being extended by one
year and there were sufficient additional funds. Following the restructuring, plans to
construct the additional 80 schools were further revised due to exchange rate losses
following the weakening of the Australian Dollar. As a result, only 48 additional schools
were built. This brought the total number of new schools to 380 and rehabilitation of 13
schools for a total of 393. This total comprised 206 schools funded by the EFA/FTI
Program and 174 funded through DFAT.
84. In addition, in October 2011, the decision was made to transfer the water and
sanitation aspect of school construction to the UNICEF WASH program as well as reduce
the number of schools to match the construction targets. This decision was made due to the
fact that technical demands of providing water supply to the schools was challenging for
the villages and MoES and UNICEF WASH had the technical experience and was already
32
operating in these areas. To this end, the target was reduced from 741 facilities23 to 412
during the 2013 restructuring. At the time of project closing, UNICEF WASH had been
able to ensure that 253 project schools had water and sanitation facilities that meet the 2009
MoES standards24. The remaining 140 schools have water and sanitation however, they do
not meet the 2009 standards. UNICEF WASH, with funding from DFAT, has a detailed
plan for providing water and sanitation facilities that comply with the 2009 standards for
the remaining 140 schools by the end of 2015.
85. The project conducted a Safety and Quality Audit on CBC schools to determine if
local communities were providing quality construction of schools. The results showed that
overall quality of the EFA/FTI program schools was good and lessons learned related to
maintaining quality have now been incorporated into the daily work of district engineers
that support the villages. The audit also made recommendations on how to maintain the
quality of the CBC program, which was incorporated into the process.25 During project
implementation there were some concerns expressed regarding asbestos in the construction
materials that were used for 120 EDPII schools. DFAT provided a team to take samples
from all 120 schools and sent the samples to Australia for testing. The results found that
none of the school materials contained asbestos. There is also evidence that CBC was more
cost efficient than classrooms financed by other projects (see Annex 3 for details) as well
as highly effective for building schools in very remote areas.
86. Additional analysis of MoES data related to achievement of the PDO shows that
the proportion of schools offering all 5 grades across project supported districts increased
from approximately 40 percent in 2008/09 to approximately 73 percent in 2013/14
compared to non-project supported districts that increased from 62 percent 81 percent
during the same period. Additionally, the proportion of schools teaching only 1 grade
remained small (1 percent) across all districts. For program districts, the proportion of
schools offering only two grades decreased from 26 percent to 8 percent while among non-
program districts, it decreased from 14 percent to 6 percent which is a substantial
achievement. Total enrollments in the program districts also increased from 306,626 to
324,740.
87. Sub-component A.2: Community Grants (EFA-FTI US$2.6 million and DFAT
AUD 0.0 million). CGs were designed to support students in the poorest and most
educationally disadvantaged districts and the grants were to be provided to the same
23 See Footnote 7. Although the PAD (p. 40) mentions 2,100 schools to be provided with water supply and
latrines, the results framework had identified an original target of 741 schools. 24 The 2009 UNICEF standard for WASH in CBC schools is a 3 room latrine for each school. One room for
boys, one room for girls and one room for wheelchair access with a sit down toilet (used by teachers in
schools where there are no students who need to use the special room). Each latrine includes a water supply
from either gravity fed water (GFW) system or a hand pump well and hand washing facilities. 25 Steps taken to ensure the quality going forward were: (i) updating/clarifying the CBC operations manual
and roles/responsibilities of all actors involved in the quality assurance process; (ii) increasing the original
3-member VEDC to 5 or 7 members depending on the CBC and CG program demands; and (iii) strengthening
district and provincial education officials in supporting villages during the construction process and carrying
out regular supervision missions.
33
communities that received CBC grants. When the project was restructured in 2013, the
total number of communities that were to receive grants was reduced to 280 from the
original target of 332. The target used to measure success was to provide US$360 to the
280 communities for three years. The target was met and it is estimated that approximately
27,000 students benefited from the grants. During the project period the government
instituted its own SBG program that are capitations grants made available to all school in
Laos to help meet non-wage recurrent expenditure needs at the school level. As a result of
the SBG program the government will not continue CGs.
88. The project was also responsible for conducting an impact evaluation of two
different delivery methods of the SBG: sending money directly to schools or VEDCs. The
evaluation included 520 schools (320 schools covered under the EFA/FTI program) that
were assigned randomly to 4 treatment groups and 1 control group. A baseline was
collected in 2012, and an end-line was collected between April-June 2014 thereby meeting
the project target.
89. Sub-component A.3: Quality Inputs (EFA-FTI US$0.0 and DFAT-AUD 8.5
million). There were six kinds of quality inputs to both pre-primary and primary schools
and communities included in the sub-component. They were: (i) textbooks, teachers guides
and other reference materials; (ii) other pedagogical material; (iii) training for VEDCs, in
EQS; (iv) training for 9,500 teachers and school principals on EQS; (v) teacher upgrading
for 1,500 unqualified teachers to ensure they met minimum standards of 8+3 and 200
scholarships for girls from ethnic groups to be qualified pre-primary school teachers; and
(vi) training for pedagogical advisors. The start-up of the quality activities under the project
were delayed by one year due to some delays in the receiving funds from DFAT. Based on
the delay it was agreed that the target of training 9,500 teachers and principals on the EQS
would be reduced to 7,000. These new targets were reflected in the results framework under
the intermediate indicators. Prior to project closing, the project also undertook an
independent evaluation in 2014 of the quality inputs to the project. Related to this sub-
component, the evaluation looked at: (i) VEDC training; (ii) school principal training; and
(iii) the pre-primary 9+2 scholarship program. The results of the activities under the quality
inputs sub-component are as follows:
90. Teaching and Learning Materials. The program purchased 4,540 primary school
tool kits and all 4,540 were distributed to 988 primary schools. There were 1,000 tool kits
provided to pre-primary classrooms. The program also delivered 26 pre-primary tool kits
to the Community Based School Readiness pilot playgroups in Savannakhet. The tool kits
contain supplies and materials for the teachers to use in their daily teaching activities.
During supervision mission it was observed that the tool kits were being used and these
findings were verified during the 2014 project supported independent evaluation of the
quality inputs.
91. Training Activities and Results. All training targets were met or exceeded as
indicated in the table below. In addition to the achievement of target numbers, there were
other achievements that are discussed below. They are as follows:
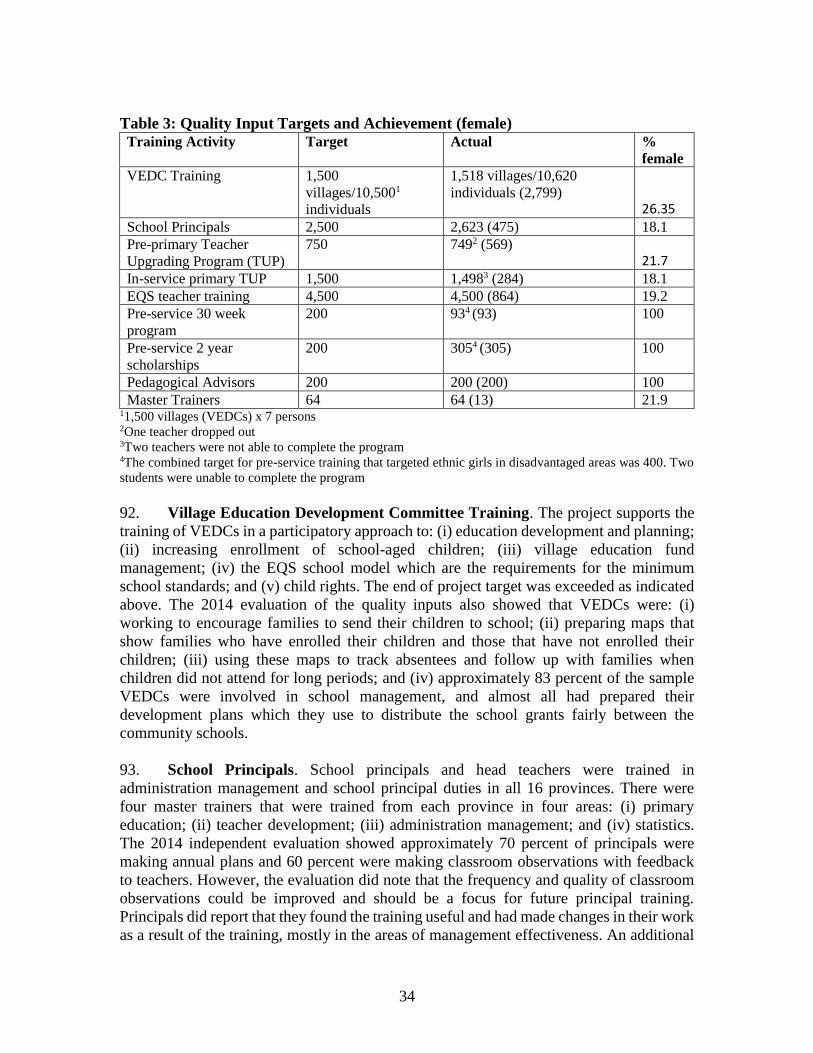
34
Table 3: Quality Input Targets and Achievement (female)
Training Activity Target Actual %
female
VEDC Training 1,500
villages/10,5001
individuals
1,518 villages/10,620
individuals (2,799) 26.35
School Principals 2,500 2,623 (475) 18.1
Pre-primary Teacher
Upgrading Program (TUP)
750 7492 (569) 21.7
In-service primary TUP 1,500 1,4983 (284) 18.1
EQS teacher training 4,500 4,500 (864) 19.2
Pre-service 30 week
program
200 934 (93) 100
Pre-service 2 year
scholarships
200 3054 (305) 100
Pedagogical Advisors 200 200 (200) 100
Master Trainers 64 64 (13) 21.9 11,500 villages (VEDCs) x 7 persons 2One teacher dropped out 3Two teachers were not able to complete the program 4The combined target for pre-service training that targeted ethnic girls in disadvantaged areas was 400. Two
students were unable to complete the program
92. Village Education Development Committee Training. The project supports the
training of VEDCs in a participatory approach to: (i) education development and planning;
(ii) increasing enrollment of school-aged children; (iii) village education fund
management; (iv) the EQS school model which are the requirements for the minimum
school standards; and (v) child rights. The end of project target was exceeded as indicated
above. The 2014 evaluation of the quality inputs also showed that VEDCs were: (i)
working to encourage families to send their children to school; (ii) preparing maps that
show families who have enrolled their children and those that have not enrolled their
children; (iii) using these maps to track absentees and follow up with families when
children did not attend for long periods; and (iv) approximately 83 percent of the sample
VEDCs were involved in school management, and almost all had prepared their
development plans which they use to distribute the school grants fairly between the
community schools.
93. School Principals. School principals and head teachers were trained in
administration management and school principal duties in all 16 provinces. There were
four master trainers that were trained from each province in four areas: (i) primary
education; (ii) teacher development; (iii) administration management; and (iv) statistics.
The 2014 independent evaluation showed approximately 70 percent of principals were
making annual plans and 60 percent were making classroom observations with feedback
to teachers. However, the evaluation did note that the frequency and quality of classroom
observations could be improved and should be a focus for future principal training.
Principals did report that they found the training useful and had made changes in their work
as a result of the training, mostly in the areas of management effectiveness. An additional
35
finding of the quality evaluation report was that there is evidence that school principal
training has led to increases in early grade enrollment. The findings show significantly
higher enrollment gains in schools with trained principals compared with non-trained
principal schools. The average change in grade 1-5 enrollment in the EFA/FTI program
districts was a 2.8 percent increased, compared with a 7.4 percent decrease in non-program
districts which relates to a 10.2 percent advantage for EFA/FTI program schools.
94. In-Service Training. This targeted activity was designed to provide in-service
teacher training for 4,500 teachers on the EQS training modules and 1,500 teachers in a 16
week course to upgrade teachers (TUP) to the minimum standard of 5+3 and 8+3. As
indicated in Table 2 above, the targets for the training were met. The other
accomplishments related to the in-service training are that the training modules and
manuals were developed by the Department of Teacher Education under the Asian
Development Bank-supported Education Quality Improvement Project (EQIPII) and were
revised for this project. In July 2011, a workshop for 64 provincial master trainers from
eight teacher training colleges took place to provide information on the use of the training
modules and manuals. In-service training also included multi-grade training so that
teachers in the project areas are now prepared for multi-grade teaching at the primary level.
95. Training for Primary Teachers to Become Pre-primary Teachers. The project
supported a 10-day training course for 749 qualified primary teachers to become pre-
primary teachers across targeted districts. The target was met and monitoring reports show
that the teachers are teaching pre-primary classes. The project also helped develop a pre-
primary teacher training manual that is being used by the teachers that participated in the
project as well as other pre-primary teachers.
96. Pre-service teacher training for disadvantaged groups. This targeted activity
was designed to reach females and ethnic disadvantaged target groups through a 2-pronged
approach consisting of: (i) the 30-week pre-primary training program 26 targeted at
ethnically disadvantaged communities with a PAD target of 200 students; and (ii) the 2-
year scholarship program27 for pre-primary training with a PAD target of 200 students.
However, during the initial implementation, the responsible IU recognized that there were
inadequate numbers of ethnic girls that met the minimum selection criteria for scholarships
under the 30-week program. Consequently, the numbers were revised to 307 teachers
trained under the 2-year program and 93 teachers under the 30-week in-service training.
As indicated above, the targets were met for this activity. A review of the program to recruit
ethnic girls to teach in their villages show that all 398 had returned to their villages and
that they were teaching (as mentioned previously, two teachers had passed away). The
sample group study under the quality activity evaluation showed that each teacher was
teaching an average of 26 students and that all teachers had lesson plans, learning corners
and some used special teaching for slow learners. All classrooms were decorated with
26 The 30 weeks of pre-primary in-service upgrading training was to be for individuals that had completed
upper secondary school (12 years of education). 27 The scholarships were for two years of pre-service training for individuals that had completed lower
secondary school (or 9 years of education)
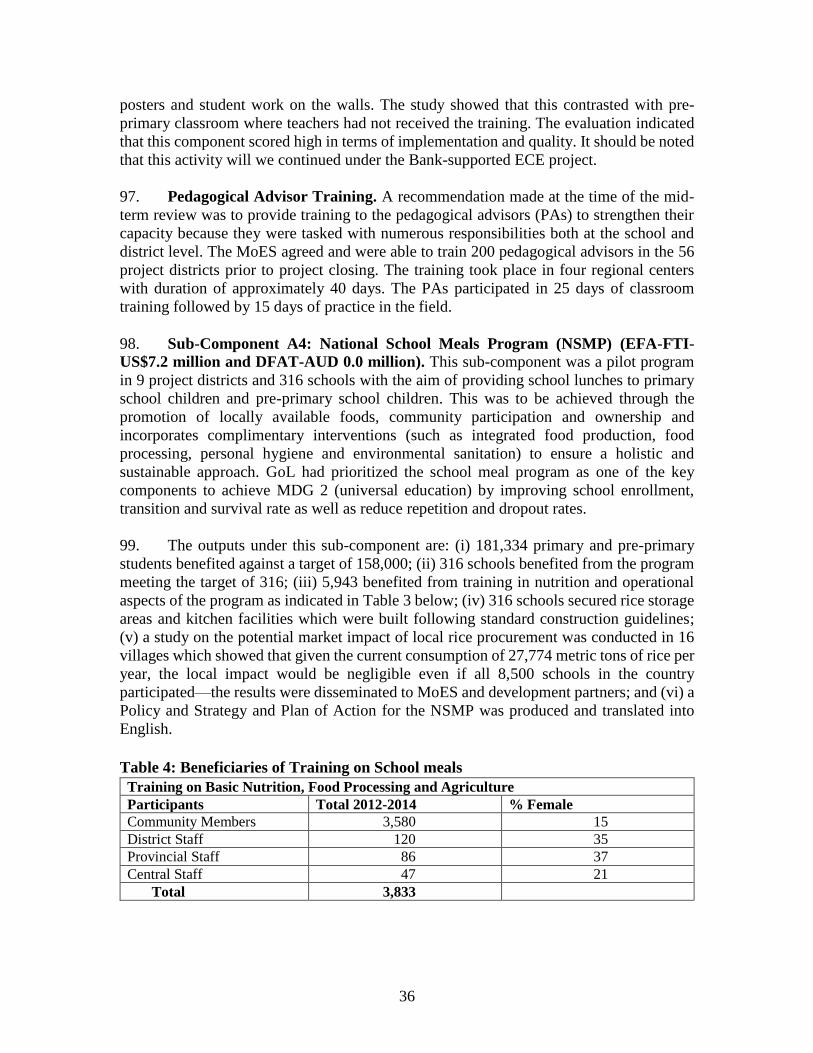
36
posters and student work on the walls. The study showed that this contrasted with pre-
primary classroom where teachers had not received the training. The evaluation indicated
that this component scored high in terms of implementation and quality. It should be noted
that this activity will we continued under the Bank-supported ECE project.
97. Pedagogical Advisor Training. A recommendation made at the time of the mid-
term review was to provide training to the pedagogical advisors (PAs) to strengthen their
capacity because they were tasked with numerous responsibilities both at the school and
district level. The MoES agreed and were able to train 200 pedagogical advisors in the 56
project districts prior to project closing. The training took place in four regional centers
with duration of approximately 40 days. The PAs participated in 25 days of classroom
training followed by 15 days of practice in the field.
98. Sub-Component A4: National School Meals Program (NSMP) (EFA-FTI-
US$7.2 million and DFAT-AUD 0.0 million). This sub-component was a pilot program
in 9 project districts and 316 schools with the aim of providing school lunches to primary
school children and pre-primary school children. This was to be achieved through the
promotion of locally available foods, community participation and ownership and
incorporates complimentary interventions (such as integrated food production, food
processing, personal hygiene and environmental sanitation) to ensure a holistic and
sustainable approach. GoL had prioritized the school meal program as one of the key
components to achieve MDG 2 (universal education) by improving school enrollment,
transition and survival rate as well as reduce repetition and dropout rates.
99. The outputs under this sub-component are: (i) 181,334 primary and pre-primary
students benefited against a target of 158,000; (ii) 316 schools benefited from the program
meeting the target of 316; (iii) 5,943 benefited from training in nutrition and operational
aspects of the program as indicated in Table 3 below; (iv) 316 schools secured rice storage
areas and kitchen facilities which were built following standard construction guidelines;
(v) a study on the potential market impact of local rice procurement was conducted in 16
villages which showed that given the current consumption of 27,774 metric tons of rice per
year, the local impact would be negligible even if all 8,500 schools in the country
participated—the results were disseminated to MoES and development partners; and (vi) a
Policy and Strategy and Plan of Action for the NSMP was produced and translated into
English.
Table 4: Beneficiaries of Training on School meals
Training on Basic Nutrition, Food Processing and Agriculture
Participants Total 2012-2014 % Female
Community Members 3,580 15
District Staff 120 35
Provincial Staff 86 37
Central Staff 47 21
Total 3,833
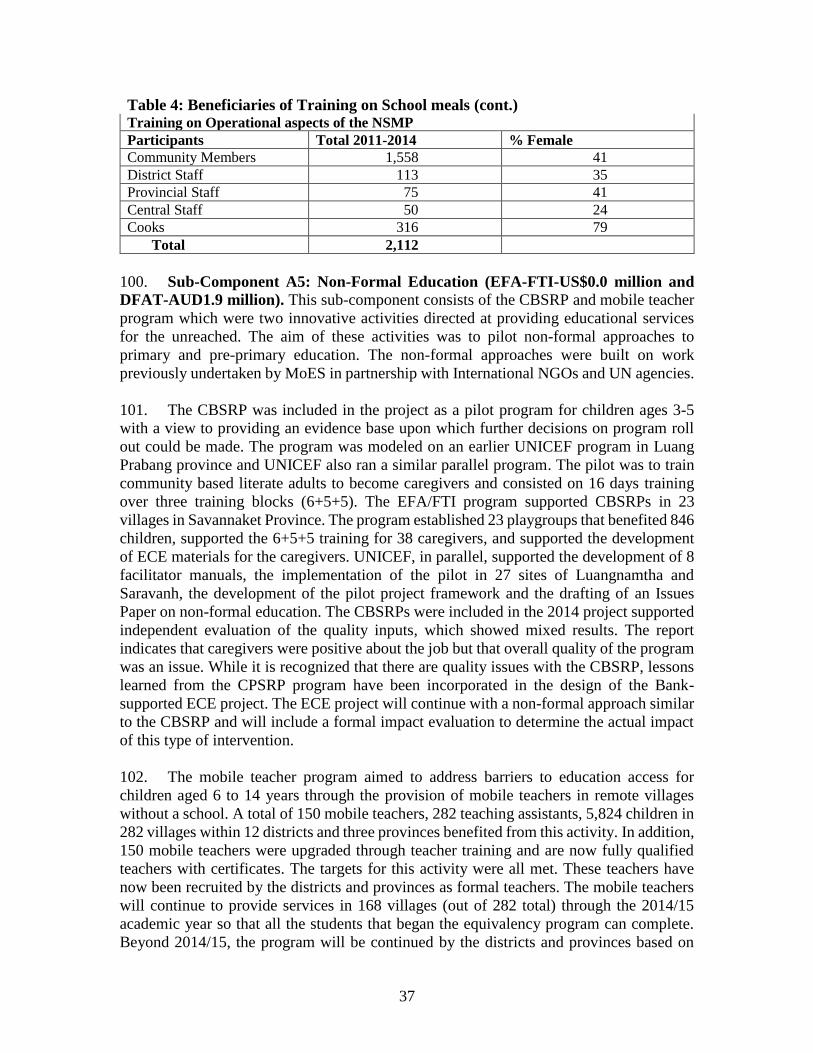
37
Table 4: Beneficiaries of Training on School meals (cont.) Training on Operational aspects of the NSMP
Participants Total 2011-2014 % Female
Community Members 1,558 41
District Staff 113 35
Provincial Staff 75 41
Central Staff 50 24
Cooks 316 79
Total 2,112
100. Sub-Component A5: Non-Formal Education (EFA-FTI-US$0.0 million and
DFAT-AUD1.9 million). This sub-component consists of the CBSRP and mobile teacher
program which were two innovative activities directed at providing educational services
for the unreached. The aim of these activities was to pilot non-formal approaches to
primary and pre-primary education. The non-formal approaches were built on work
previously undertaken by MoES in partnership with International NGOs and UN agencies.
101. The CBSRP was included in the project as a pilot program for children ages 3-5
with a view to providing an evidence base upon which further decisions on program roll
out could be made. The program was modeled on an earlier UNICEF program in Luang
Prabang province and UNICEF also ran a similar parallel program. The pilot was to train
community based literate adults to become caregivers and consisted on 16 days training
over three training blocks (6+5+5). The EFA/FTI program supported CBSRPs in 23
villages in Savannaket Province. The program established 23 playgroups that benefited 846
children, supported the 6+5+5 training for 38 caregivers, and supported the development
of ECE materials for the caregivers. UNICEF, in parallel, supported the development of 8
facilitator manuals, the implementation of the pilot in 27 sites of Luangnamtha and
Saravanh, the development of the pilot project framework and the drafting of an Issues
Paper on non-formal education. The CBSRPs were included in the 2014 project supported
independent evaluation of the quality inputs, which showed mixed results. The report
indicates that caregivers were positive about the job but that overall quality of the program
was an issue. While it is recognized that there are quality issues with the CBSRP, lessons
learned from the CPSRP program have been incorporated in the design of the Bank-
supported ECE project. The ECE project will continue with a non-formal approach similar
to the CBSRP and will include a formal impact evaluation to determine the actual impact
of this type of intervention.
102. The mobile teacher program aimed to address barriers to education access for
children aged 6 to 14 years through the provision of mobile teachers in remote villages
without a school. A total of 150 mobile teachers, 282 teaching assistants, 5,824 children in
282 villages within 12 districts and three provinces benefited from this activity. In addition,
150 mobile teachers were upgraded through teacher training and are now fully qualified
teachers with certificates. The targets for this activity were all met. These teachers have
now been recruited by the districts and provinces as formal teachers. The mobile teachers
will continue to provide services in 168 villages (out of 282 total) through the 2014/15
academic year so that all the students that began the equivalency program can complete.
Beyond 2014/15, the program will be continued by the districts and provinces based on
38
need. The MoES developed policies regarding the equivalency of the formal and non-
formal systems, in particular, entry examinations for non-formal students who wish to
mainstream into formal education at P3 after the first stage, or M1 of lower-secondary. The
policies were drafted and these are under review within the MoES.
103. In addition, the 2014 project supported independent evaluation showed that: (i)
teachers were positive about the upgrading; (ii) each teacher had basic materials (textbooks,
notebooks, pencils, teaching manuals and a curriculum guide) however, there was limited
use of lesson plans; and (iii) children were engaged and learning was definitely taking place.
This was determined based on a reading test given during the study which showed that
even in the most remote areas with mobile teachers, learning was taking place even if the
reading level was not high. The teaching assistants were positive about their role and job
and they did provide invaluable language support for the mobile teachers although, there
were questions about time on task when the mobile teachers were away.
Component B: Stewardship of Education Sector at Local, Provincial and Central
Level (EFA-FTI US$8.1 million and DFAT AUD 0.2 million).
104. The objectives of this component were to strengthen the MoES’ policy framing and
policy implementation capacity through all levels of the education system. It provided
support for the ECU to improve its capacity to implement the ESDF. There were five sub-
components developed to support these goals as outlined below.
105. Sub-Component B1: Strengthen Policy Planning and Implementation
Capacities at Central and Local Levels. This sub-component provided financing for
technical assistance and training as well as acquisition of equipment and software to
strengthen the policy planning and implementation capabilities of the MoES. Activities
included: (i) training of MoES staff in policy planning and budgeting; (ii) preparation of
three year rolling plan for implementation of the ESDF; (iii) preparation of annual
operational plan for the implementation of the ESDF; (iv) integration of ESDF Annual Plan
with Budget Cycle; (v) identification, monitoring, evaluation and reporting of priority
expenditure programs under Nam Teun 2 Revenue Management Arrangement (NT2
RMA); and (vi) strengthening PES and DEB in program management including the
financial management capacity and procurement system.
106. Inputs supported by the project: (i) central level workshops were conducted to
prepare guidelines for budgeting and planning; (ii) two short-term education policy and
planning training activities for the head of planning division at IIEP in Paris; (iii) three staff
were trained on micro-planning in Paris; (iv) training for program target districts on
preparation of the ESDP annual operating and monitoring plan; (v) workshops to
disseminate the 5-year Education Strategic Plan 2011-15 were conducted for program
districts; (vi) mid-term review workshops to review the ESDP and then to disseminate the
results for program districts; and (vii) study tour on budget planning, financial monitoring
and evaluation for eight MoES planning staff. Furthermore, the government has used
revenues from the Nam Teun II dam to periodically replace approximately 11 percent of
the overall textbooks to ensure that schools have an adequate supply. As a result of EDPII
39
implementation, the MoES’s Department of Inspection has developed a tool to facilitate
regular monitoring of Nam Teun II revenue being allocated for the education sector. This
tool was developed with government resources and underscores MoES’ commitment to
monitor and report on the dam’s revenue and education-related expenditures.
107. With the capacity development provided, and working closely with the
development partners through the established “Focal Group 3: Planning and Budgeting”,
substantial achievements resulting from the inputs are: (i) development of a planning and
budgeting manual that has led to more consistent planning from the bottom up; (ii)
improved process that allows for more realistic targets for achievement of education
outcomes; and (iii) finalization of the ESDP results matrix with indicators, targets,
activities and costing for 2014 and 2015. Moreover, there is now cooperation between the
Department of Planning and DOI to conduct workshops on education analysis and
diagnosis on the preparation of the eighth five-year EDSP 2016-2020. Related to this sub-
component and sub-component B4 on M&E, the MoES has formed an M&E network28
that meets quarterly. These departments meet on a formal basis quarterly and, when
necessary, informally which indicates increased horizontal cooperation between the
departments responsible for this integrated budgeting and monitoring system. The Bank-
supported ECE project and GPEII will provide ongoing financing to continue supporting
improvements in the planning, budgeting and M&E system at central and local levels. In
addition, other development partners and Focal Group 3 will continue supporting this effort.
108. Sub-component B2: Strengthen Functioning of Educational Management
Information Systems (GPE-US$3.5 million and DFAT-AUD 0.0 million). This sub-
component provided financing for the five elements of the EMIS Strategy developed by
the MoES to ensure the timely availability of reliable and accurate data, including data on
special needs students, about the educational system and the use of such data for decision
making: (i) statistical capacity development; (ii) maintenance of EMIS and improvement
of data quality; (iii) systematic information dissemination; (iv) expansion of the Statistics
and SITCES; and (v) networking equipment and computer hardware and software.
109. Project inputs included: (i) training as indicated in Table 4 below; (ii) 160 sets of
desktop computers and laptops pre-loaded with the Lao-EMIS software for 17 provinces
and 148 districts. In addition, school mapping software was installed for 148 districts in 17
provinces; and (iii) technical assistance and software development for linking EMIS, PMIS
and FMIS.
28 This team is comprised of
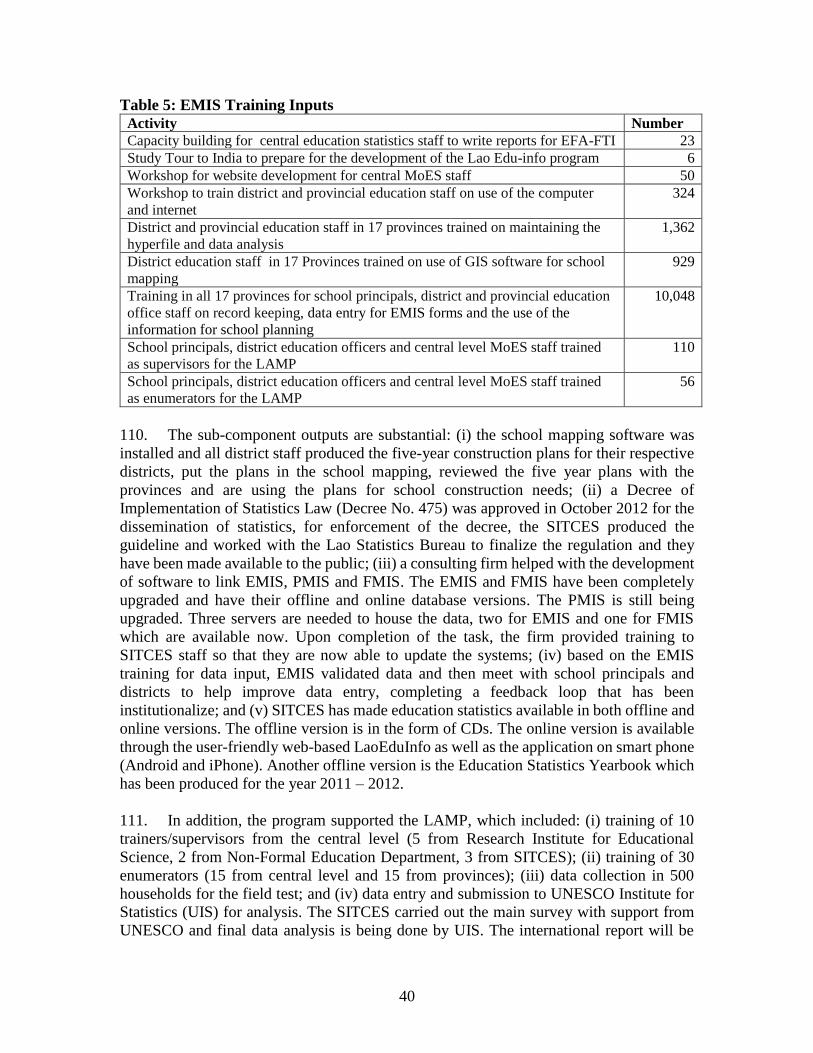
40
Table 5: EMIS Training Inputs
Activity Number
Capacity building for central education statistics staff to write reports for EFA-FTI 23
Study Tour to India to prepare for the development of the Lao Edu-info program 6
Workshop for website development for central MoES staff 50
Workshop to train district and provincial education staff on use of the computer
and internet
324
District and provincial education staff in 17 provinces trained on maintaining the
hyperfile and data analysis
1,362
District education staff in 17 Provinces trained on use of GIS software for school
mapping
929
Training in all 17 provinces for school principals, district and provincial education
office staff on record keeping, data entry for EMIS forms and the use of the
information for school planning
10,048
School principals, district education officers and central level MoES staff trained
as supervisors for the LAMP
110
School principals, district education officers and central level MoES staff trained
as enumerators for the LAMP
56
110. The sub-component outputs are substantial: (i) the school mapping software was
installed and all district staff produced the five-year construction plans for their respective
districts, put the plans in the school mapping, reviewed the five year plans with the
provinces and are using the plans for school construction needs; (ii) a Decree of
Implementation of Statistics Law (Decree No. 475) was approved in October 2012 for the
dissemination of statistics, for enforcement of the decree, the SITCES produced the
guideline and worked with the Lao Statistics Bureau to finalize the regulation and they
have been made available to the public; (iii) a consulting firm helped with the development
of software to link EMIS, PMIS and FMIS. The EMIS and FMIS have been completely
upgraded and have their offline and online database versions. The PMIS is still being
upgraded. Three servers are needed to house the data, two for EMIS and one for FMIS
which are available now. Upon completion of the task, the firm provided training to
SITCES staff so that they are now able to update the systems; (iv) based on the EMIS
training for data input, EMIS validated data and then meet with school principals and
districts to help improve data entry, completing a feedback loop that has been
institutionalize; and (v) SITCES has made education statistics available in both offline and
online versions. The offline version is in the form of CDs. The online version is available
through the user-friendly web-based LaoEduInfo as well as the application on smart phone
(Android and iPhone). Another offline version is the Education Statistics Yearbook which
has been produced for the year 2011 – 2012.
111. In addition, the program supported the LAMP, which included: (i) training of 10
trainers/supervisors from the central level (5 from Research Institute for Educational
Science, 2 from Non-Formal Education Department, 3 from SITCES); (ii) training of 30
enumerators (15 from central level and 15 from provinces); (iii) data collection in 500
households for the field test; and (iv) data entry and submission to UNESCO Institute for
Statistics (UIS) for analysis. The SITCES carried out the main survey with support from
UNESCO and final data analysis is being done by UIS. The international report will be
41
completed by UIS and is expected to be available for dissemination by March or April
2015.
112. Sub-component B3: Student Assessment (EFA-FTI US$1.0 million and DFAT-
AUD 0.0 million). This component consists of two activities, the ASLO and EGRA. ASLO
strengthens a system for national assessment of student learning outcomes. EGRA serves
as an instrument to monitor quality and to improve pedagogy in the classroom. It also
serves as a governance instrument as it helps parents monitor what is going on in the
classroom.
113. Progress of this sub-component was to be measured by the PDO indicator System
for Learning Assessment, which was met. The assessment system went from level 1 to
level 3 surpassing the target of 2. The project supported the administration of the grade 3
assessments which is defined as ASLO III and the administration of the EGRA in a sample
area. The project provided capacity development/training for a total of 795 (252 females)
staff on administration of both the ASLO and EGRA as well as technical assistance to
support both activities. The training included research design, development of the
assessment tools, coding for data entry, preparation of test papers and implementation of
the tests. At the central, 97 staff members were trained as enumerators and 12 staff
benefitted from a study tour on assessment systems. The outputs related to ASLO were: (i)
an ASLO report with a full analysis of the data; and (ii) dissemination of ASLO results for
RIES, central level MoES staff, provincial and district staff, school principals and teachers.
The outputs for EGRA were: (i) a follow-on case study in 9 schools from the EGRA using
Lao Snapshot of School Management Effectiveness (SSME) to better understand factors
that contribute to early grade students’ reading abilities; (ii) a dissemination workshop of
final EGRA results; (iii) training by the Bank to the core EGRA team on how to present
the EGRA and SSME results effectively; and (iv) the final EGRA and SSME report.
114. In addition to the outputs, RIES staff and MoES are using the analysis and findings
of both the ASLO and EGRA to further inform modifications to the curriculum and teacher
training. Specifically, the GPEII project will use the EGRA results to focus on promoting
more evidence-based approaches to the teaching and learning of early grade reading in Lao
language. This will be done through the piloting of a reading development intervention in
Lao language in grades 1 and 2. It also aims at producing research to inform policy and
programming decisions to support reading development approaches for ethnic students and
those with weak Lao language skills. The ASLO results will be used as the MoES works
to development new curricula for grades 1-5 with support from Australia. These are
substantial achievements.
115. Sub-Component B4: Strengthen Monitoring and Evaluation Capacity (GPE-
US$0.6 million and DFAT-AUD 0.0 million). This sub-component provided resources
for implementation of the PAF 29 which was the mutually agreed framework for all
29 The 2009 PAF implementation includes agreed functions, indicators and data needed, data classifications
by indicators, revised reporting format, collecting progress report/survey/researches, capacity building, data
and information collection, assessment of data and information, undertaking review and field assessment,
42
stakeholders to measure progress on the ESDF. The resources would be used to support
the development of an annual cycle of activities that would produce annual reports on
sector development linked to ESDF polices. Activities included: (i) finalization of an
agreed operational plan for the PAF including responsibilities of the DOI, ESITC, SREAC,
RIES and SQAC and the monitoring and evaluation network at all levels; (ii) printing and
dissemination of the Operation Plan for PAF implementation; and (iii) training of staff at
all levels in the implementation of the PAF annual cycle of activities.
116. The outputs for this sub-component were substantial. MoES developed, tested and
revised three sets of eight tools30 need for M&E. The three sets are: (i) RMES for primary
school data gathering which is ready for nationwide data collection; (ii) Table G core
indicators for school, district, province and central levels; and (iii) Table G core indicators
annual tracking for district, province and central levels. In addition to the tools, the MoES
(with program support): (i) prepared guidelines for master trainers, provided training and
piloted data collection for primary level in Luang Prabang, Champasak and Savannakhet
provinces and modified tools based on feedback; (ii) used the data collected as a baseline
and learning experience for planning sub-sector needs for the following years; (iii)
conducted training on RMES and M&E tools for central level master trainers and the M&E
network members; and (iv) conducted an M&E study tour for nine participants from DoI,
DP, ECU, EMIS and DPPE. Going forward, the MoES will use the eight tools to collect
nationwide data, which will: (i) form baseline figures for output and outcome indicators
for academic year 2014/15; and (ii) determine the targets for 2015/16 through 2020, which
will be the basis for the ESDP and results matrix 2016-2020 for the primary sub-sector. By
program closing, the MoES was planning the development of tools for the pre-primary,
secondary, and non-formal subsectors to be used in 2015 so that they could repeat the same
process as primary education to also include in the 2016-2020 results matrix.
117. Sub-Component B5: Program Management (GPE-US$2.5 million and DFAT-
AUD 0.2 million). The ECU, under the guidance of a steering committee, was tasked with
managing project implementation, coordination of activities with IUs, and all fiduciary and
safeguards aspects of project activities. The IUs implemented the aspects of the project for
which they were responsible and the ECU successfully carried out its mandate of
overseeing and monitoring overall project implementation, coordinating with internal
departments such as the departments of finance, planning and inspection, and organizing
joint donor review missions. The ECU, along with the IUs, was effective in identifying
implementation challenges and addressing them, and strengthening CBC implementation
oversight despite the remoteness of many project sights. Initial weak capacity of IUs to
carry out advanced planning led to some delays, which were addressed with targeted and
preview JSRM team findings and resolve interpretation differences, presentation of accepted findings and
discussion of results, agreement on a short and medium term remedial actions needed, submission of draft
final report to minister, subsequence discussion of final report and agreement on the list of actions to modify
the following year program, and lastly initiation of the annual planning cycle. In order to implement the PAF
actions mentioned above, certain tools need to be developed. However, these tools are not yet available 30 The tools are the simplified ESDP Results Matrix (Table G of PAF) with a clear set of output and
outcome indicators.
43
ongoing capacity building. The ECU also regularly collected performance indicator data
and reported on overall progress, and the procurement management process was
consistently rated satisfactory. Although financial management challenges related to the
advance liquidation process persisted, no major irregularities were identified and all audits
were unqualified.
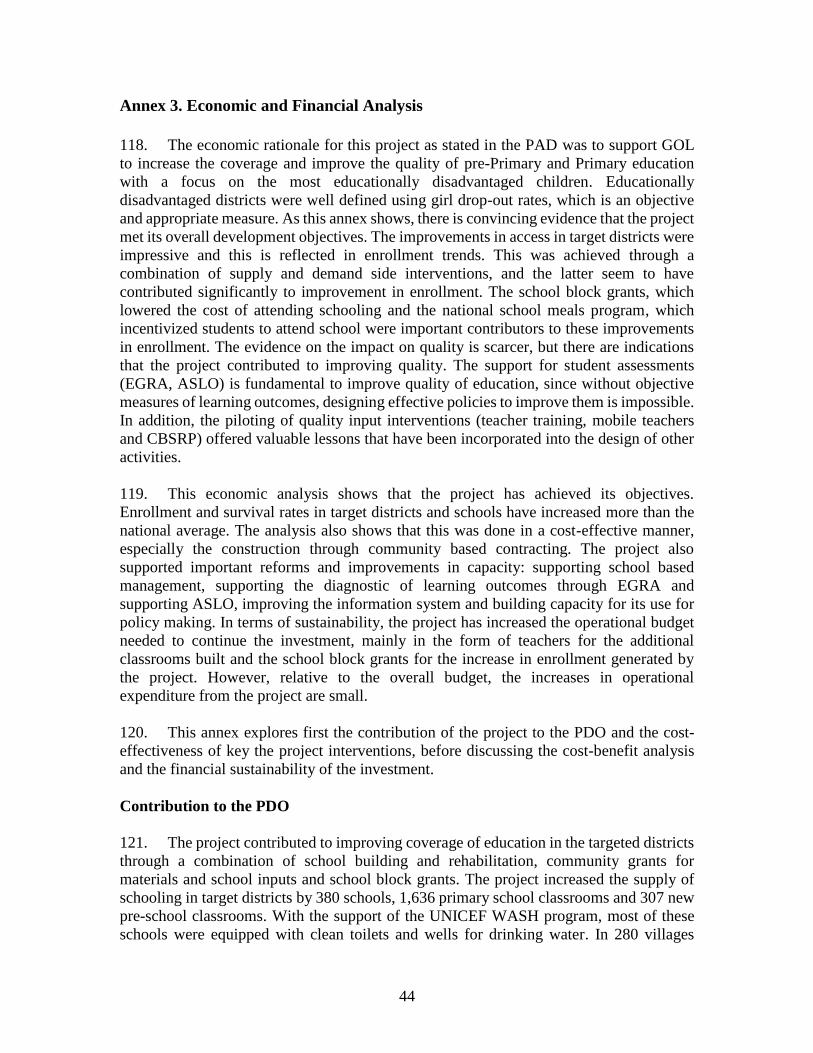
44
Annex 3. Economic and Financial Analysis
118. The economic rationale for this project as stated in the PAD was to support GOL
to increase the coverage and improve the quality of pre-Primary and Primary education
with a focus on the most educationally disadvantaged children. Educationally
disadvantaged districts were well defined using girl drop-out rates, which is an objective
and appropriate measure. As this annex shows, there is convincing evidence that the project
met its overall development objectives. The improvements in access in target districts were
impressive and this is reflected in enrollment trends. This was achieved through a
combination of supply and demand side interventions, and the latter seem to have
contributed significantly to improvement in enrollment. The school block grants, which
lowered the cost of attending schooling and the national school meals program, which
incentivized students to attend school were important contributors to these improvements
in enrollment. The evidence on the impact on quality is scarcer, but there are indications
that the project contributed to improving quality. The support for student assessments
(EGRA, ASLO) is fundamental to improve quality of education, since without objective
measures of learning outcomes, designing effective policies to improve them is impossible.
In addition, the piloting of quality input interventions (teacher training, mobile teachers
and CBSRP) offered valuable lessons that have been incorporated into the design of other
activities.
119. This economic analysis shows that the project has achieved its objectives.
Enrollment and survival rates in target districts and schools have increased more than the
national average. The analysis also shows that this was done in a cost-effective manner,
especially the construction through community based contracting. The project also
supported important reforms and improvements in capacity: supporting school based
management, supporting the diagnostic of learning outcomes through EGRA and
supporting ASLO, improving the information system and building capacity for its use for
policy making. In terms of sustainability, the project has increased the operational budget
needed to continue the investment, mainly in the form of teachers for the additional
classrooms built and the school block grants for the increase in enrollment generated by
the project. However, relative to the overall budget, the increases in operational
expenditure from the project are small.
120. This annex explores first the contribution of the project to the PDO and the cost-
effectiveness of key the project interventions, before discussing the cost-benefit analysis
and the financial sustainability of the investment.
Contribution to the PDO
121. The project contributed to improving coverage of education in the targeted districts
through a combination of school building and rehabilitation, community grants for
materials and school inputs and school block grants. The project increased the supply of
schooling in target districts by 380 schools, 1,636 primary school classrooms and 307 new
pre-school classrooms. With the support of the UNICEF WASH program, most of these
schools were equipped with clean toilets and wells for drinking water. In 280 villages
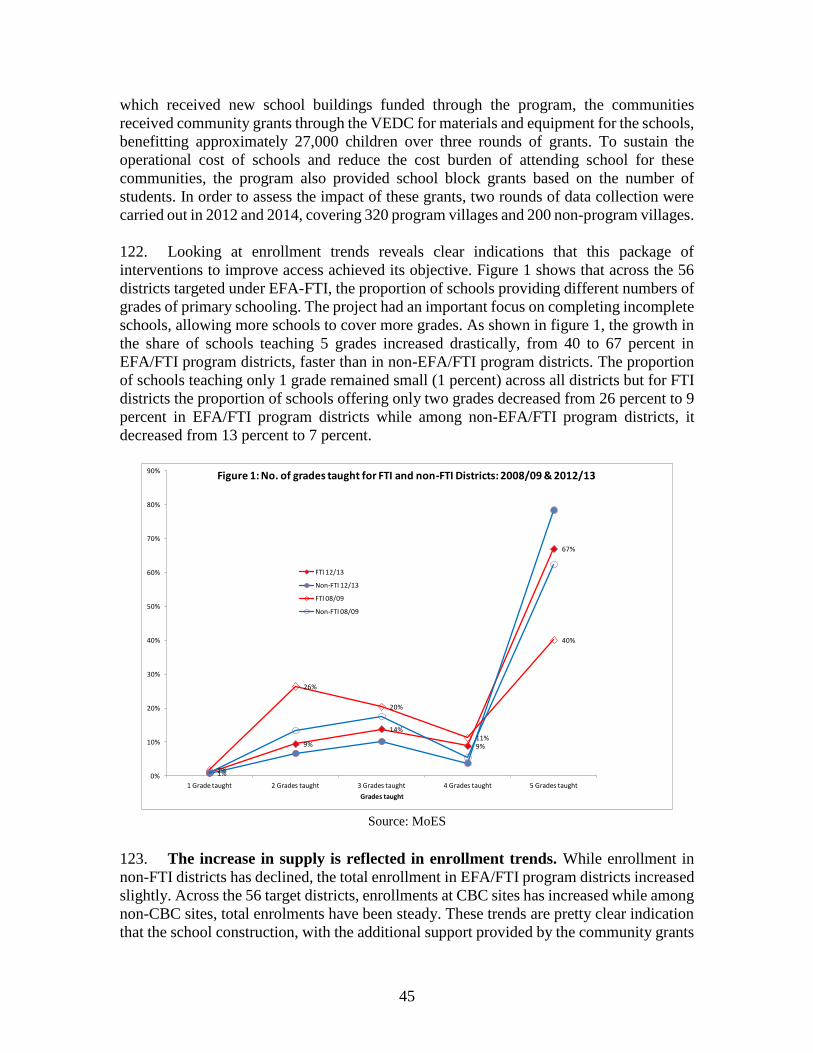
45
which received new school buildings funded through the program, the communities
received community grants through the VEDC for materials and equipment for the schools,
benefitting approximately 27,000 children over three rounds of grants. To sustain the
operational cost of schools and reduce the cost burden of attending school for these
communities, the program also provided school block grants based on the number of
students. In order to assess the impact of these grants, two rounds of data collection were
carried out in 2012 and 2014, covering 320 program villages and 200 non-program villages.
122. Looking at enrollment trends reveals clear indications that this package of
interventions to improve access achieved its objective. Figure 1 shows that across the 56
districts targeted under EFA-FTI, the proportion of schools providing different numbers of
grades of primary schooling. The project had an important focus on completing incomplete
schools, allowing more schools to cover more grades. As shown in figure 1, the growth in
the share of schools teaching 5 grades increased drastically, from 40 to 67 percent in
EFA/FTI program districts, faster than in non-EFA/FTI program districts. The proportion
of schools teaching only 1 grade remained small (1 percent) across all districts but for FTI
districts the proportion of schools offering only two grades decreased from 26 percent to 9
percent in EFA/FTI program districts while among non-EFA/FTI program districts, it
decreased from 13 percent to 7 percent.
Source: MoES
123. The increase in supply is reflected in enrollment trends. While enrollment in
non-FTI districts has declined, the total enrollment in EFA/FTI program districts increased
slightly. Across the 56 target districts, enrollments at CBC sites has increased while among
non-CBC sites, total enrolments have been steady. These trends are pretty clear indication
that the school construction, with the additional support provided by the community grants
1%
9%
14%
9%
67%
2%
26%
20%
11%
40%
0%
10%
20%
30%
40%
50%
60%
70%
80%
90%
1 Grade taught 2 Grades taught 3 Grades taught 4 Grades taught 5 Grades taught
Grades taught
Figure 1: No. of grades taught for FTI and non-FTI Districts: 2008/09 & 2012/13
FTI 12/13
Non-FTI 12/13
FTI 08/09
Non-FTI 08/09
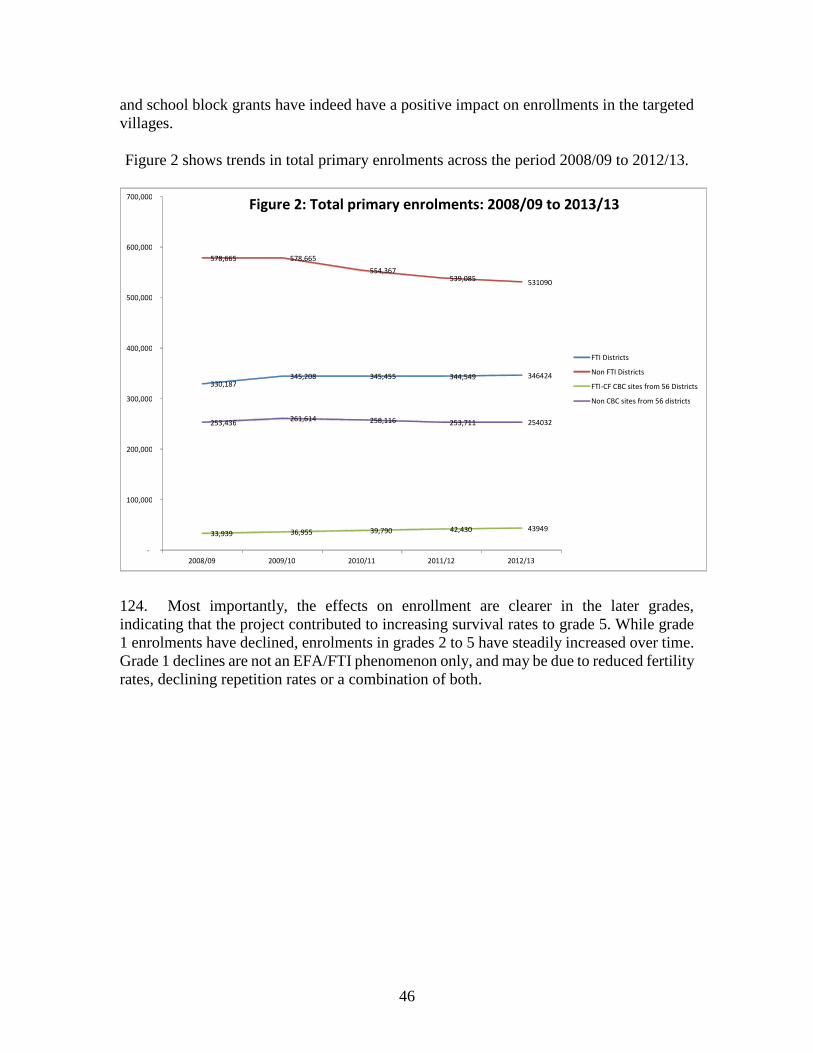
46
and school block grants have indeed have a positive impact on enrollments in the targeted
villages.
Figure 2 shows trends in total primary enrolments across the period 2008/09 to 2012/13.
124. Most importantly, the effects on enrollment are clearer in the later grades,
indicating that the project contributed to increasing survival rates to grade 5. While grade
1 enrolments have declined, enrolments in grades 2 to 5 have steadily increased over time.
Grade 1 declines are not an EFA/FTI phenomenon only, and may be due to reduced fertility
rates, declining repetition rates or a combination of both.
330,187 345,208 345,455 344,549 346424
578,665 578,665 554,367
539,085 531090
33,939 36,955 39,790 42,430 43949
253,436 261,614 258,116 253,711 254032
-
100,000
200,000
300,000
400,000
500,000
600,000
700,000
2008/09 2009/10 2010/11 2011/12 2012/13
Figure 2: Total primary enrolments: 2008/09 to 2013/13
FTI Districts Non FTI Districts FTI - CF CBC sites from 56 Districts Non CBC sites from 56 districts
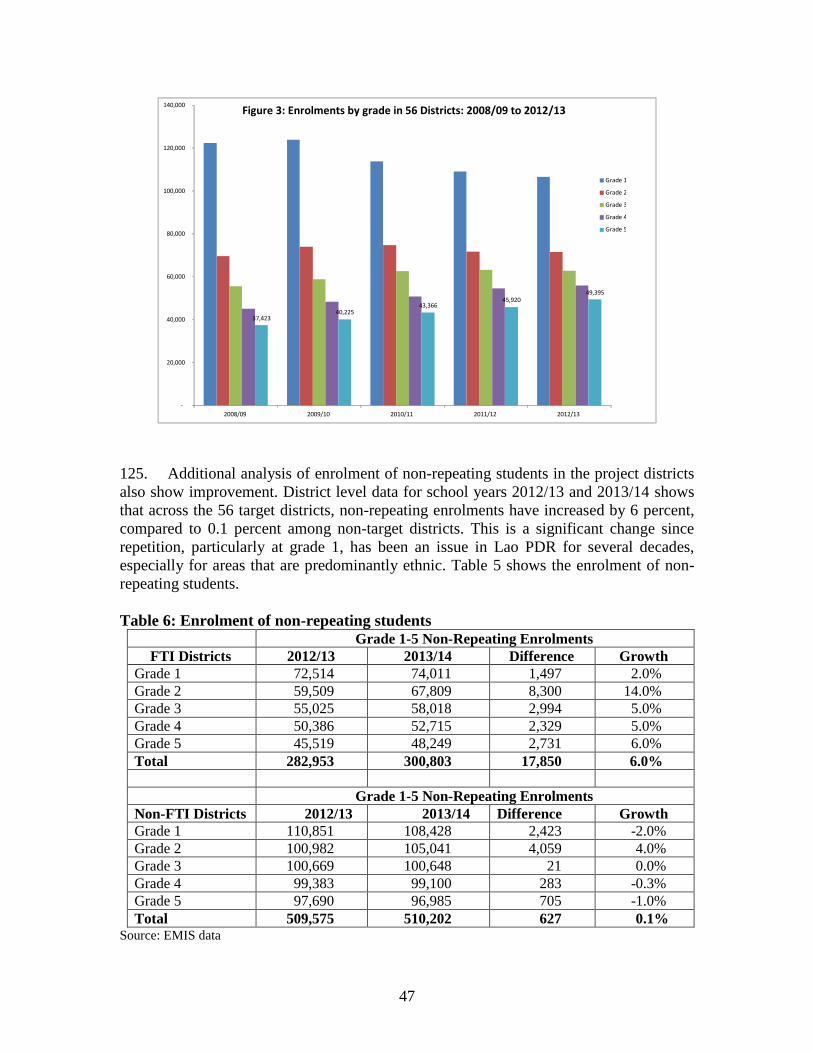
47
125. Additional analysis of enrolment of non-repeating students in the project districts
also show improvement. District level data for school years 2012/13 and 2013/14 shows
that across the 56 target districts, non-repeating enrolments have increased by 6 percent,
compared to 0.1 percent among non-target districts. This is a significant change since
repetition, particularly at grade 1, has been an issue in Lao PDR for several decades,
especially for areas that are predominantly ethnic. Table 5 shows the enrolment of non-
repeating students.
Table 6: Enrolment of non-repeating students
Grade 1-5 Non-Repeating Enrolments
FTI Districts 2012/13 2013/14 Difference Growth
Grade 1 72,514 74,011 1,497 2.0%
Grade 2 59,509 67,809 8,300 14.0%
Grade 3 55,025 58,018 2,994 5.0%
Grade 4 50,386 52,715 2,329 5.0%
Grade 5 45,519 48,249 2,731 6.0%
Total 282,953 300,803 17,850 6.0%
Grade 1-5 Non-Repeating Enrolments
Non-FTI Districts 2012/13 2013/14 Difference Growth
Grade 1 110,851 108,428 2,423 -2.0%
Grade 2 100,982 105,041 4,059 4.0%
Grade 3 100,669 100,648 21 0.0%
Grade 4 99,383 99,100 283 -0.3%
Grade 5 97,690 96,985 705 -1.0%
Total 509,575 510,202 627 0.1% Source: EMIS data
37,423 40,225 43,366 45,920 49,395
-
20,000
40,000
60,000
80,000
100,000
120,000
140,000
2008/09 2009/10 2010/11 2011/12 2012/13
Figure 3: Enrolments by grade in 56 Districts: 2008/09 to 2012/13
Grade 1 Grade 2 Grade 3 Grade 4 Grade 5
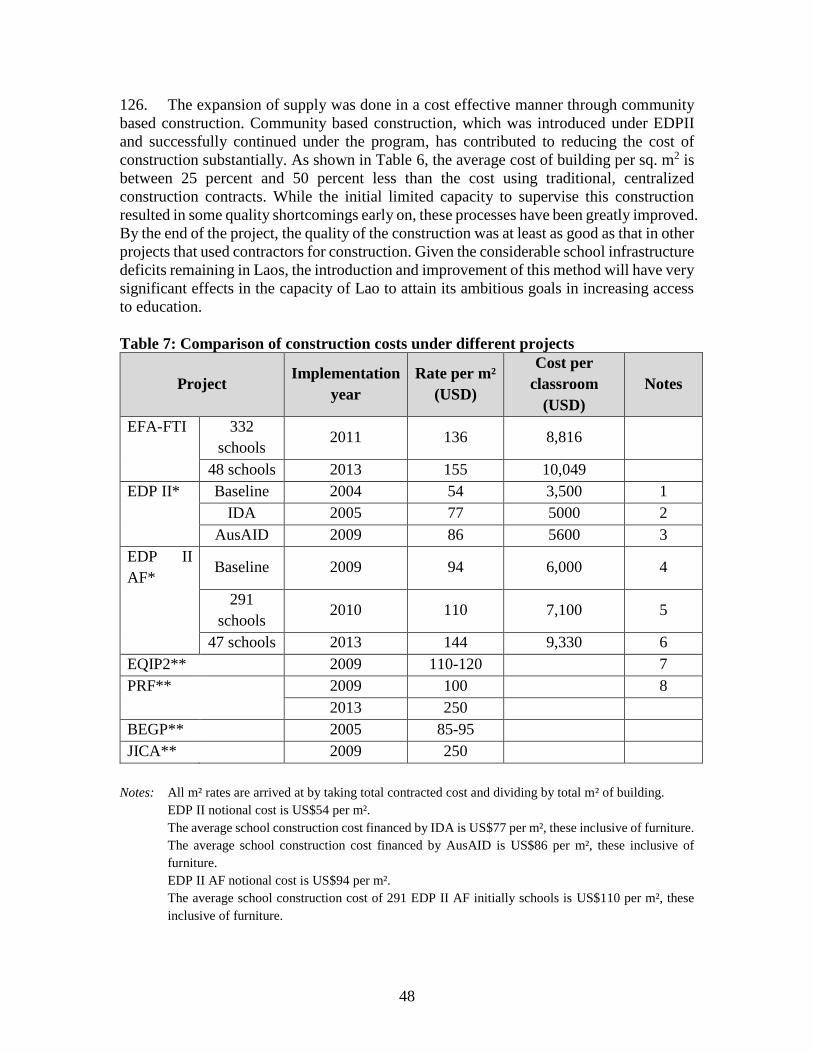
48
126. The expansion of supply was done in a cost effective manner through community
based construction. Community based construction, which was introduced under EDPII
and successfully continued under the program, has contributed to reducing the cost of
construction substantially. As shown in Table 6, the average cost of building per sq. m2 is
between 25 percent and 50 percent less than the cost using traditional, centralized
construction contracts. While the initial limited capacity to supervise this construction
resulted in some quality shortcomings early on, these processes have been greatly improved.
By the end of the project, the quality of the construction was at least as good as that in other
projects that used contractors for construction. Given the considerable school infrastructure
deficits remaining in Laos, the introduction and improvement of this method will have very
significant effects in the capacity of Lao to attain its ambitious goals in increasing access
to education.
Table 7: Comparison of construction costs under different projects
Project Implementation
year
Rate per m²
(USD)
Cost per
classroom
(USD)
Notes
EFA-FTI 332
schools 2011 136 8,816
48 schools 2013 155 10,049
EDP II* Baseline 2004 54 3,500 1
IDA 2005 77 5000 2
AusAID 2009 86 5600 3
EDP II
AF* Baseline 2009 94 6,000 4
291
schools 2010 110 7,100 5
47 schools 2013 144 9,330 6
EQIP2** 2009 110-120 7
PRF** 2009 100 8
2013 250
BEGP** 2005 85-95
JICA** 2009 250
Notes: All m² rates are arrived at by taking total contracted cost and dividing by total m² of building.
EDP II notional cost is US$54 per m².
The average school construction cost financed by IDA is US$77 per m², these inclusive of furniture.
The average school construction cost financed by AusAID is US$86 per m², these inclusive of
furniture.
EDP II AF notional cost is US$94 per m².
The average school construction cost of 291 EDP II AF initially schools is US$110 per m², these
inclusive of furniture.
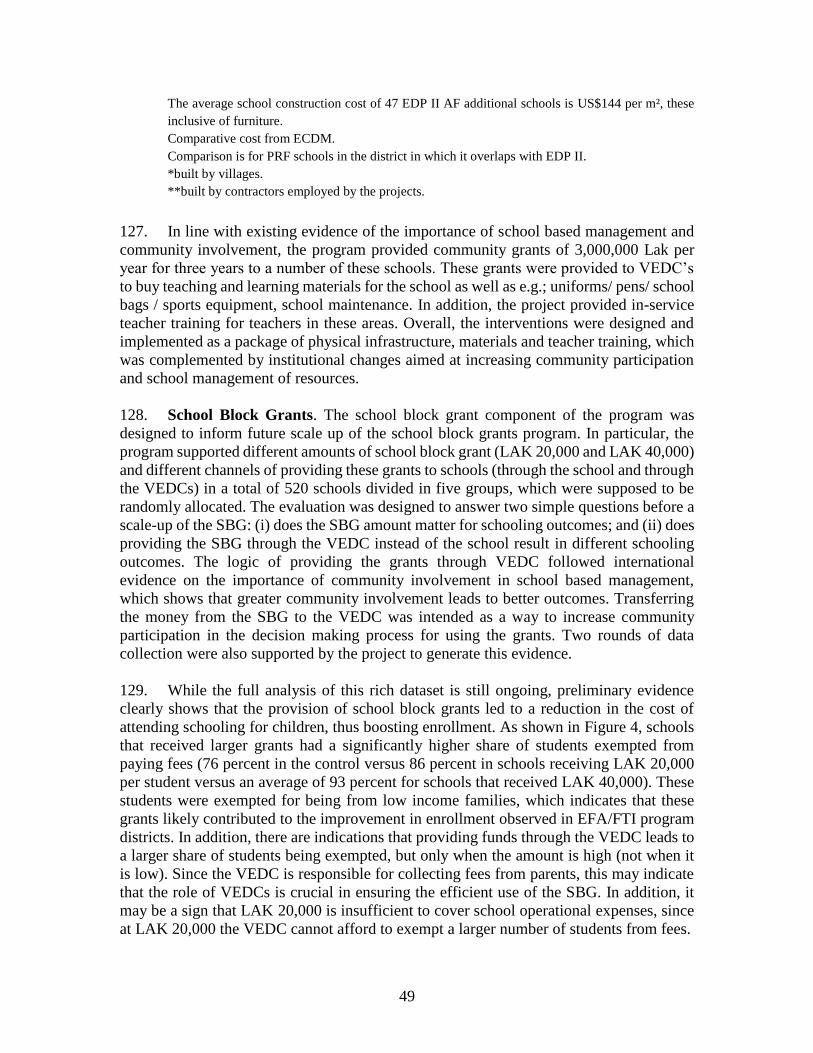
49
The average school construction cost of 47 EDP II AF additional schools is US$144 per m², these
inclusive of furniture.
Comparative cost from ECDM.
Comparison is for PRF schools in the district in which it overlaps with EDP II.
*built by villages.
**built by contractors employed by the projects.
127. In line with existing evidence of the importance of school based management and
community involvement, the program provided community grants of 3,000,000 Lak per
year for three years to a number of these schools. These grants were provided to VEDC’s
to buy teaching and learning materials for the school as well as e.g.; uniforms/ pens/ school
bags / sports equipment, school maintenance. In addition, the project provided in-service
teacher training for teachers in these areas. Overall, the interventions were designed and
implemented as a package of physical infrastructure, materials and teacher training, which
was complemented by institutional changes aimed at increasing community participation
and school management of resources.
128. School Block Grants. The school block grant component of the program was
designed to inform future scale up of the school block grants program. In particular, the
program supported different amounts of school block grant (LAK 20,000 and LAK 40,000)
and different channels of providing these grants to schools (through the school and through
the VEDCs) in a total of 520 schools divided in five groups, which were supposed to be
randomly allocated. The evaluation was designed to answer two simple questions before a
scale-up of the SBG: (i) does the SBG amount matter for schooling outcomes; and (ii) does
providing the SBG through the VEDC instead of the school result in different schooling
outcomes. The logic of providing the grants through VEDC followed international
evidence on the importance of community involvement in school based management,
which shows that greater community involvement leads to better outcomes. Transferring
the money from the SBG to the VEDC was intended as a way to increase community
participation in the decision making process for using the grants. Two rounds of data
collection were also supported by the project to generate this evidence.
129. While the full analysis of this rich dataset is still ongoing, preliminary evidence
clearly shows that the provision of school block grants led to a reduction in the cost of
attending schooling for children, thus boosting enrollment. As shown in Figure 4, schools
that received larger grants had a significantly higher share of students exempted from
paying fees (76 percent in the control versus 86 percent in schools receiving LAK 20,000
per student versus an average of 93 percent for schools that received LAK 40,000). These
students were exempted for being from low income families, which indicates that these
grants likely contributed to the improvement in enrollment observed in EFA/FTI program
districts. In addition, there are indications that providing funds through the VEDC leads to
a larger share of students being exempted, but only when the amount is high (not when it
is low). Since the VEDC is responsible for collecting fees from parents, this may indicate
that the role of VEDCs is crucial in ensuring the efficient use of the SBG. In addition, it
may be a sign that LAK 20,000 is insufficient to cover school operational expenses, since
at LAK 20,000 the VEDC cannot afford to exempt a larger number of students from fees.
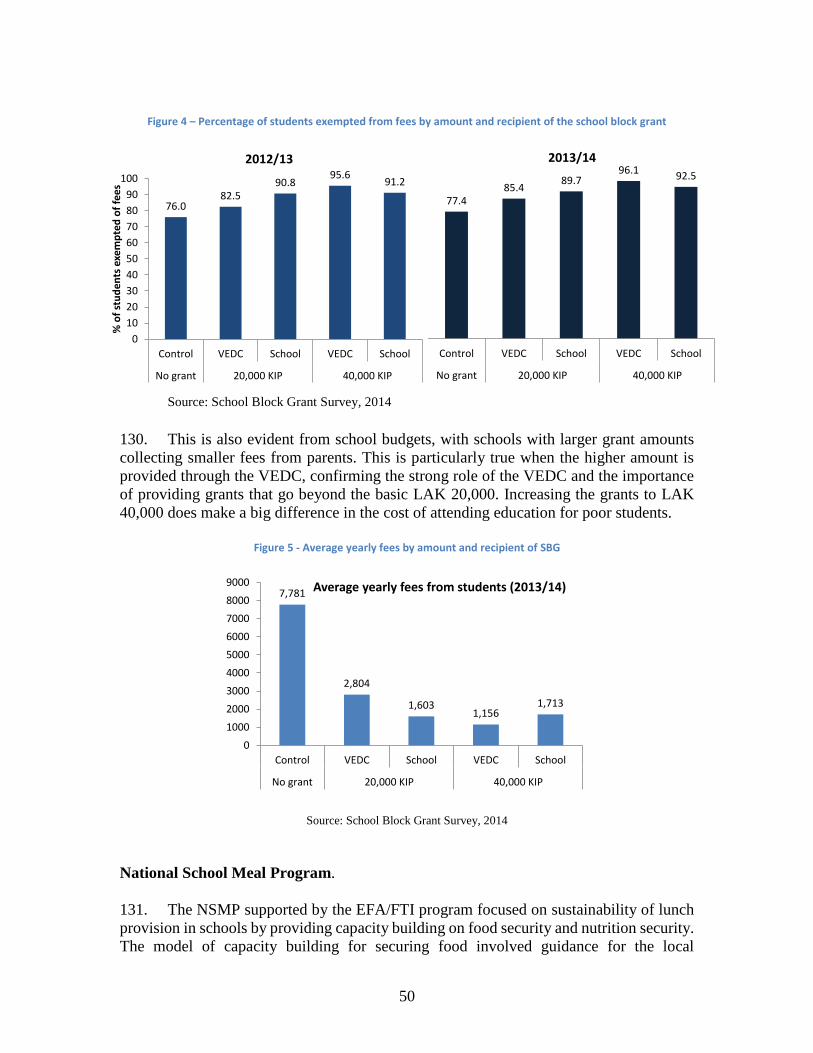
50
Figure 4 – Percentage of students exempted from fees by amount and recipient of the school block grant
Source: School Block Grant Survey, 2014
130. This is also evident from school budgets, with schools with larger grant amounts
collecting smaller fees from parents. This is particularly true when the higher amount is
provided through the VEDC, confirming the strong role of the VEDC and the importance
of providing grants that go beyond the basic LAK 20,000. Increasing the grants to LAK
40,000 does make a big difference in the cost of attending education for poor students.
Figure 5 - Average yearly fees by amount and recipient of SBG
Source: School Block Grant Survey, 2014
National School Meal Program.
131. The NSMP supported by the EFA/FTI program focused on sustainability of lunch
provision in schools by providing capacity building on food security and nutrition security.
The model of capacity building for securing food involved guidance for the local
76.082.5
90.895.6
91.2
0
10
20
30
40
50
60
70
80
90
100
Control VEDC School VEDC School
No grant 20,000 KIP 40,000 KIP
% o
f st
ud
ents
exe
mp
ted
of
fees
2012/13
77.485.4
89.796.1
92.5
Control VEDC School VEDC School
No grant 20,000 KIP 40,000 KIP
2013/14
7,781
2,804
1,6031,156
1,713
0
1000
2000
3000
4000
5000
6000
7000
8000
9000
Control VEDC School VEDC School
No grant 20,000 KIP 40,000 KIP
Average yearly fees from students (2013/14)
51
community to be self-reliant and able to produce food for schools and for themselves.
Provincial and district levels were given training on self-reliance and took the leading role
while getting support and ownership from the local communities for implementing the
NSMP. The program did not address procuring food locally but rather strengthening
ownership of the local communities and providing capacity building for sustainable
provisioning of lunch in schools. There is strong evidence that the target schools are
producing food based on the “home grown school feeding model” and that children are
getting a hot lunch on a regular basis. An analysis of the impact of the school meals
program on indicators related to MGD 2 in the 9 pilot districts specifically showed that: (i)
gross enrollment increased from 117.75 percent to 123.15 percent; (ii) net enrollments
increased by 7.22 percent from 90.40 percent to 97.62 percent; (iii) primary completion
rates increased from 74.6 percent to 78.3 percent; (iv) transition rates from 81.37 percent
to 87.6 percent; (iv) repetition rates declined from 19.85 percent to 16.4 percent; and (v)
dropout rates declined from 9.35 percent to 3.35 percent, all during the same period from
2011/12 to 2013/14. Moreover, the NSMP activity was featured as a GPE flagship program
due to the considerable impact of the program on improvements in education indicators in
the pilot areas. Due to the success of this pilot, the Bank-supported ECE project will
support the expansion of the program Impacts on learning outcomes have not been
identified in Lao PDR, but other similar programs have shown large impacts in low
enrollment and very disadvantaged contexts, which are the target areas for the NSMP
supported by the program.
132. Education Management Information System (EMIS). The advances in the
EMIS with the support of the project were impressive. They focused on building capacity
at the district and school levels for using and analyzing data. This built on successful
support from the previous Bank project (EDPII), which focused on developing the system.
This new ability of districts to use these data for planning purposes can bring a higher level
of efficiency in education spending, as districts can use this information to more effectively
develop teachers and consolidate or use schools more efficiently. EMIS has also developed
a Global Positioning System (GPS) to map schools, which districts have also been
capacitated to use. The qualitative impact on the system is potentially very large, but
measuring it objectively is very difficult.
133. Early Grade Reading Assessment. The project supported the EGRA in 2011,
which allowed for a detailed diagnostic of the progress on early grade literacy. This
diagnostic has had a fundamental effect on the education system. EGRA has helped shape
the focus on early grade literacy, and has sparked the inclusion of an early grade literacy
intervention as part of the GPEII project that is planned to be effective in June 2015.
Similarly to the EMIS intervention, the transformational effects of this support cannot
really be measured, but the refocus on quality and learning arising from this diagnostic can
bring large benefits to future generations of Lao children.
134. Quantifying the impact of these institutional changes is not possible, but the
contributions of this project to systemic changes are clear. The improvements in data
availability and use, institutionalization of learning outcome assessments, the increase in
52
community involvement in managing education resources are all characteristics of well-
performing systems.31
135. Program Operating Cost Analysis. The original program allocation for overall
operating costs for the MoES was approximately US$2.78 million or 5.37 percent of the
total program costs. By program closing, the actual operating cost expenditures were US$3.30 million or 7.76 percent of the total US$42.52 million program cost. Considering
that the program lost approximately 10 percent of the original program allocation of
US$51.77 due to currency fluctuation between the AUD and the Kip, the government was
able to implement the program efficiently.
Cost-benefit
136. The large increases in access to education will generate large economic returns for
this program. While the institutional investments of the program are hard to quantify, in
this section an attempt is made to provide an ex-post estimate of the cost-benefit analysis
of this program’s interventions. Because of the limitations in analyzing the benefits of
institutional reforms, the analysis focuses on the effect of increasing access to education,
mainly on construction. For the benefits, the analysis will only consider the income
associated with the increased educational attainment associated with increase enrollment
and completion brought about by the project supported investments. For the cost, the
analysis considers the total amount of the project and estimate a per student cost using the
number of beneficiaries in target schools. As a consequence, expected estimates are
probably lower-bound estimates of the actual benefit of the project, since the social returns
to education have been shown to outweigh private returns. In addition, the cost estimates
are likely to be high higher-of the per student cost, since we allocate all the cost of the
project to the beneficiaries in schools, whereas institutional reforms affect all students in
the country.
137. Even with these conservative assumptions, the ex-post cost-benefit analysis shows
that the benefits of the project greatly outweigh its costs. Considering: (i) the patterns of
enrollment in grades 4 and 5 as shown in the previous section; (ii) a simple assumption that
the project increased educational attainment of beneficiaries by one year; and (iii) that the
returns to education in these districts are half of the country average (which is about 10
percent32), the project will bring in US$1.3 for every dollar invested in the project.
138. The project investments were also financially sustainable, increasing the
operational budget of the MoES by a very small percentage. The education budget in Lao
suffers from insufficient resources for non-salary recurrent expenditures (only 7.3 percent
of recurrent spending in 2012/2013). It is therefore important to ensure that investments do
not increase the salary costs significantly, reducing even further the funds for non-
operational expenditures and crowding out important programs like the school block grants.
31 SABER Overview Report, World Bank. 32 STeP survey
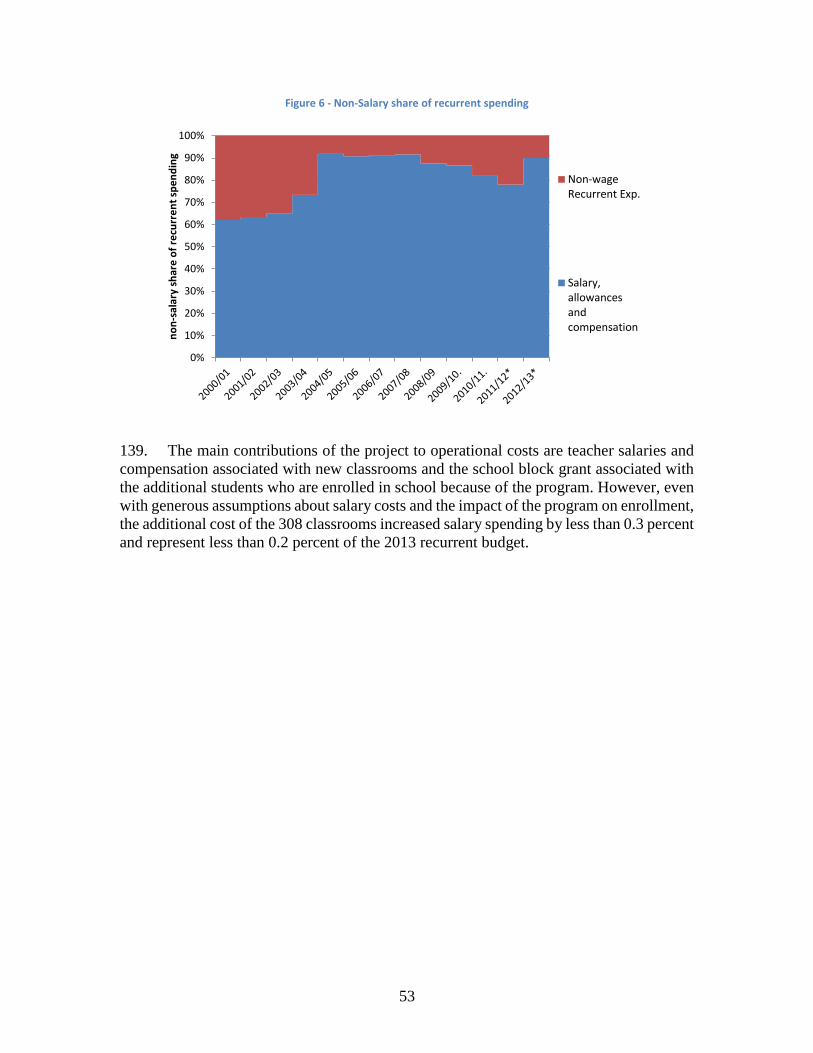
53
Figure 6 - Non-Salary share of recurrent spending
139. The main contributions of the project to operational costs are teacher salaries and
compensation associated with new classrooms and the school block grant associated with
the additional students who are enrolled in school because of the program. However, even
with generous assumptions about salary costs and the impact of the program on enrollment,
the additional cost of the 308 classrooms increased salary spending by less than 0.3 percent
and represent less than 0.2 percent of the 2013 recurrent budget.
0%
10%
20%
30%
40%
50%
60%
70%
80%
90%
100%
no
n-s
alar
y sh
are
of
recu
rre
nt
spe
nd
ing
Non-wageRecurrent Exp.
Salary,allowancesandcompensation
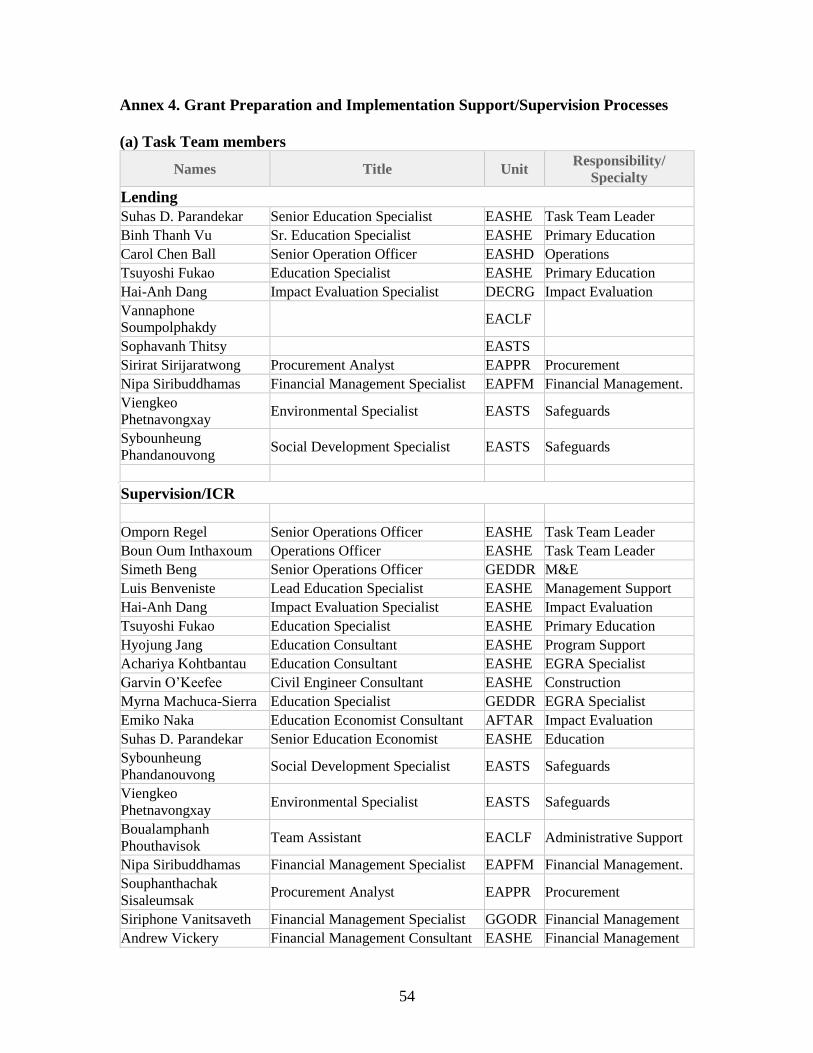
54
Annex 4. Grant Preparation and Implementation Support/Supervision Processes
(a) Task Team members
Names Title Unit Responsibility/
Specialty
Lending
Suhas D. Parandekar Senior Education Specialist EASHE Task Team Leader
Binh Thanh Vu Sr. Education Specialist EASHE Primary Education
Carol Chen Ball Senior Operation Officer EASHD Operations
Tsuyoshi Fukao Education Specialist EASHE Primary Education
Hai-Anh Dang Impact Evaluation Specialist DECRG Impact Evaluation
Vannaphone
Soumpolphakdy EACLF
Sophavanh Thitsy EASTS
Sirirat Sirijaratwong Procurement Analyst EAPPR Procurement
Nipa Siribuddhamas Financial Management Specialist EAPFM Financial Management.
Viengkeo
Phetnavongxay Environmental Specialist EASTS Safeguards
Sybounheung
Phandanouvong Social Development Specialist EASTS Safeguards
Supervision/ICR
Omporn Regel Senior Operations Officer EASHE Task Team Leader
Boun Oum Inthaxoum Operations Officer EASHE Task Team Leader
Simeth Beng Senior Operations Officer GEDDR M&E
Luis Benveniste Lead Education Specialist EASHE Management Support
Hai-Anh Dang Impact Evaluation Specialist EASHE Impact Evaluation
Tsuyoshi Fukao Education Specialist EASHE Primary Education
Hyojung Jang Education Consultant EASHE Program Support
Achariya Kohtbantau Education Consultant EASHE EGRA Specialist
Garvin O’Keefee Civil Engineer Consultant EASHE Construction
Myrna Machuca-Sierra Education Specialist GEDDR EGRA Specialist
Emiko Naka Education Economist Consultant AFTAR Impact Evaluation
Suhas D. Parandekar Senior Education Economist EASHE Education
Sybounheung
Phandanouvong Social Development Specialist EASTS Safeguards
Viengkeo
Phetnavongxay Environmental Specialist EASTS Safeguards
Boualamphanh
Phouthavisok Team Assistant EACLF Administrative Support
Nipa Siribuddhamas Financial Management Specialist EAPFM Financial Management.
Souphanthachak
Sisaleumsak Procurement Analyst EAPPR Procurement
Siriphone Vanitsaveth Financial Management Specialist GGODR Financial Management
Andrew Vickery Financial Management Consultant EASHE Financial Management
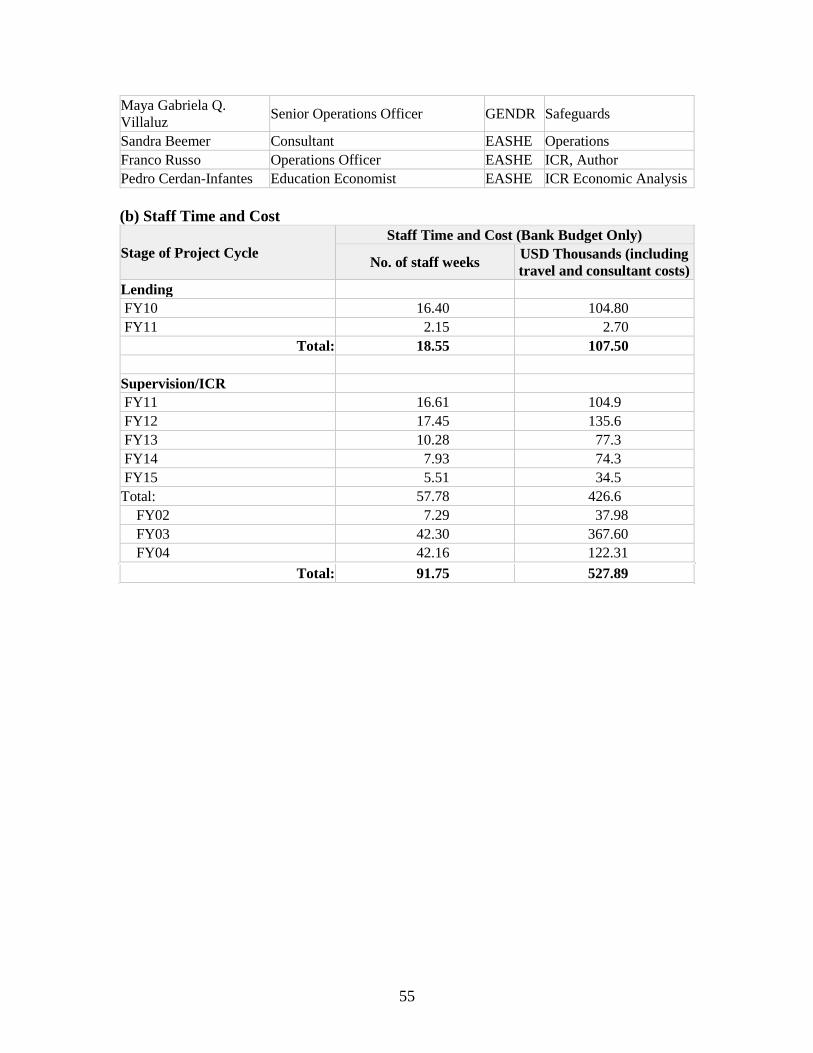
55
Maya Gabriela Q.
Villaluz Senior Operations Officer GENDR Safeguards
Sandra Beemer Consultant EASHE Operations
Franco Russo Operations Officer EASHE ICR, Author
Pedro Cerdan-Infantes Education Economist EASHE ICR Economic Analysis
(b) Staff Time and Cost
Stage of Project Cycle
Staff Time and Cost (Bank Budget Only)
No. of staff weeks USD Thousands (including
travel and consultant costs)
Lending
FY10 16.40 104.80
FY11 2.15 2.70
Total: 18.55 107.50
Supervision/ICR
FY11 16.61 104.9
FY12 17.45 135.6
FY13 10.28 77.3
FY14 7.93 74.3
FY15 5.51 34.5
Total: 57.78 426.6
FY02 7.29 37.98
FY03 42.30 367.60
FY04 42.16 122.31
Total: 91.75 527.89

56
Annex 5. Beneficiary Survey Results
Not Applicable
57
Annex 6. Stakeholder Workshop Report and Results
Not Applicable
58
Annex 7. Summary of Grantee's ICR and/or Comments on Draft ICR
Overview of the EFA/FTI program 2010-2014 including Australian Aid funding
I. Main beneficiaries:
140. The Grant Agreement clearly identified the expected beneficiaries through the
Program development objective which was to “support the GoL to increase the coverage
and improve the quality of Pre-Primary and Primary education with a focus on the most
educationally disadvantaged children.” Program implementation reflected the main
strategic goals of the Education Strategic Plan.
Component A: Access and Quality for Pre-primary and Primary Education
141. Sub-component A1: Community-Based Contracting for School Construction
(CBC): A total of 380 new schools from a revised target of 412: 1,636 primary school
classrooms and 308 new pre-school classrooms all with furniture, were constructed over
the life of the project. These new schools and classrooms were built in areas which are
identified as the poorest districts in the poorest provinces. As such they provide
incalculable benefit to the generations of young people who now have access to both pre-
school and primary school. As a further benefit, the schools are gradually being furnished
with clean toilets and wells for drinking water. The clean toilets will benefit the health of
both children and staff. Access to clean drinking water in close proximity to the village is
another uncountable key benefit to the community in terms of health and welfare.
142. Sub-component A2.1: Community Grants: Further benefits to the schools,
teachers and students were provided in the form of community grants to 280 villages which
received new school buildings funded through the EFA/FTI project. It is estimated that at
least 26,813 children benefited from the grant over the life of the program. VEDC members
also benefited from training on budget management and planning provided by the project.
Monitoring reports show that by the end of the Program 70 percent of VEDCs managing
the community grants could make satisfactory annual plans.
143. Sub-component A2.2: Block Grants: Round 1 disbursement was based on the
2009/10 enrollment figures. This benefited approximately 28,633 children against a target
of 28,561. The round two, transfer was made to 307 of the 320 target schools. The 13
missing schools, either closed or changed their locations. During round two 29,134 children
benefited from the grant. In September 2012 baseline data from 320 Program villages and
200 non Program villages, covering all 16 target provinces was collected by Indochina
Research for implementation of an impact evaluation. Completion of the end line data took
place April – June 2014. The cleaned data set was sent to the World Bank for analysis at
the end of July 2014. Additional funding made available in August 2014 was used to
disburse a third round of Block Grants, benefitting 307 schools.
144. Sub-component A3.1 School Principal Training: 2,623 principals (475 females)
benefited directly from the training. Students and teachers will continue to benefit from the
59
improved management skills. Monitoring reports show that by 2014 more than 70 percent
of principals were making annual plans and of these 90 percent were using funds according
to their plan. A total of 60 percent were making classroom observations and giving
feedback to teachers. Sixty four master trainers (13 females) also benefited from being
trained.
145. Sub-component A3.2: Training of VEDC, DEBS, PESS and MoES: The target
was to train 10,500 VEDC members in 1,500 VEDCs. The Program exceeded this target
by training 1,518 VEDCs and 10,620 VEDC members. Of these 2,799 were female. The
beneficiaries of this training were not limited to the VEDC members. Well trained VEDCs,
DESB and PESS staff were also able to support VEDCs to improve management of school
budgets, annual planning and work with families to ensure they sent their children to school.
School principals and head teachers also benefited.
146. Sub-component A3.3: Training of Pre- primary Teachers by the Primary and
Pre-Primary Department: A 10 day training course was designed and implemented for a
target group of 750 qualified primary teachers to become pre-primary teachers across target
districts in all provinces except Borkeo and Vientiane city. 750 teachers, (569 female) were
recruited to attend the training and all those trained continue to teach. A pre-primary
teacher training manual was developed to support the teachers. This manual will benefit
the children taught by the 749 teachers trained as well as other pre-primary teachers who
learn by example.
147. Sub-component A3.4: Teacher Upgrading: This sub-program benefited a total of
6,396 teachers as well as the countless students whose learning experience was improved
as a result of having well trained teachers. Of this number 33398 pre-service trainees against
a target of 400 were trained as pre-primary teachers through a combination of two-year
scholarship and 30-week training programs, and 5,998 in-service teachers were trained in
Education Quality Standards against a target of 6,000.
148. The independent evaluation carried out in 2014 noted that each class taught by a
project-trained pre-primary teacher contained an average of 26 children. Therefore in the
two years of teaching since the 30 week trained teachers qualified, an estimated 4,836
children had benefited from the intervention. A further estimated 7,930 children benefited
from the one year in which the 305 two year trained pre-primary teachers had been working.
149. The in-service 16 week program upgraded the qualifications of teachers from 5+3
to 8+3.34 A total of 1,498 teachers trained against the target of 1,500. All the teachers who
participated in the 16 week course to upgrade from 5+3 to 8+3, successfully completed
their course and were awarded their primary education teacher certificate from the Teacher
Training College in July 2013.
33 400 enrolled but two were not able to complete. Therefore the target was reached 34 1,500 enrolled but two were not able to complete. Therefore the target was reached
60
150. Sub-component A4 National Schools Meal Program: Meals for 181,334
Kindergarten, pre-primary and primary children were covered by the program between
2011/12 and 2013/14.
151. Between 2011/12 and 2013/14 a total of 3,580 community members (540 female),
120 District staff (44 female) 47 Provincial staff ( 10 female) and 2 female NSMP partners
benefited from training on Basic Nutrition, Food Processing and Agriculture. In addition
to this, between 2011/12 and 2013 /14, 1,558 (635 female) Community Members, 113
District staff (40 female), 75 Provincial staff (31 female) and 316 Cooks (250 female) were
trained on operational aspects of the program.
152. Sub-component A5.1 Community Based School Readiness Program: This was
designed as a pilot program, based on a UNICEF activity to provide educational services
in hard to reach remote communities. Twenty three playgroups with 38 caregivers in three
districts of Savannakhet with a total of 846 children (384 girls) have benefited from the
program.
153. Sub-component A5.2: Mobile Teachers and Teaching Assistants: A total of 150
mobile teachers, 282 teaching assistants and 5824 (2738 female) children in 282 villages
within 12 districts and three provinces benefited from this program. Phase II Expansion of
the program to the additional provinces of Khammuane and Sekong as well as additional
districts in Savannakhet began on 1 September 2013 after the mobile teachers had been
upgraded at Savannakhet teacher training college in July- August 2013.
Component B: Stewardship of Education Sector at Local, Provincial and Central
Levels
B1.Strengthen Policy Planning and Implementation Capacities at Central and Local
Levels
154. A total of 578 central and provincial level staff benefited from training on planning
and budgeting. A further 4 central level staff were trained at IIEP in Paris. Of these, three
staff were trained on micro-planning and one staff member was trained on Education Policy
and Planning.
155. B2. Strengthen Functioning of Management Information Systems: A total of
12,908 staff (463 female) benefited from training during the life of the program. This
included 1,362 district staff trained on maintaining the hyperfile and data analysis; 929
district staff trained on school mapping and GIS; 10,048 school principals, district and
provincial education office staff trained on record keeping for EMIS. This number
included all school heads and principals; 166 school principals, district education officers
and central level MoES staff trained as supervisors for the Literacy Assessment Mapping
Program (LAMP); 324 district and provincial staff trained on use of the computer and
internet; 50 central staff trained on website development; 6 staff who participated in a
study tour to India to prepare for the development of the Lao Edu-info program and 23
central staff who received training on education statistics.
61
156. B3.1 and 2. Student Assessment: ASLO and EGRA: A total of 795 staff (252
females) directly benefited from the capacity development activities. These included
research design, development of research tools, coding for data entry, and preparation of
the test papers and implementation of the test. The number includes 97 central level staff
who were trained as enumerators. 12 staff benefited from a study tour to Thailand and
Vietnam. Indirect beneficiaries are the generations of children whose learning experience
and achievement will be improved as issues in the curriculum or pedagogy begin to be
addressed based on the results of the tests.
157. B4. Strengthen Monitoring and Evaluation Capacity: A total of 1,882 staff (458
females) have benefited directly from capacity building as part of this sub-component.
Capacity building activities have included defining indicators, designing monitoring tools,
sector-wide integrated management information, recording and analysis of monitoring
results using results based management development of a Monitoring and Evaluation
operations manual for primary education level.
158. B5. Program Management: Over the life of the Program an estimated 576
provincial and district staff benefited from project management and implementation
training from the ECU. A further estimated 270 staff from finance and the IUs benefited
from training in procurement and financial management.
II. Key Factors Affecting Performance/Challenges:
159. On the whole the Program experienced very few barriers to achievement of original
goals. However, there were some areas where the Program did not meet the planned levels
of performance.
160. Community Based School Readiness: The original target was to establish a total
of 210 CBRS centers each with its own trained care-giver. Thirty centers were planned for
year two and expansion to a further 180 was planned for year three. By year three only
twenty three centers had been established. The MoES was committed to expansion and the
IU had clear expansion targets. However, in recognition of the short implementation period
and ambitious nature of the pilot program there were concerns about the quality and
sustainability of an expansion program since it would take place only in the final year of
the program. This would leave little time to determine lessons learned. It was therefore
deemed more prudent to concentrate on the pilot group of 23 centers and use the experience
gained in these centers to inform development of the new ECE Program where CBRS
activities would be expanded.
161. School Meal Program: The school meals program found that coordination with
VEDCs, school health and agriculture officials at local level was a challenge because these
officials changed very often and institutional memory was lost. This resulted in the need to
keep training new staff. In view of this, the NSMP team will develop capacity in basic
health and agriculture skills within their own NSMP team to support continuity at local
level.

62
162. Monitoring reports from the IU show that as at 2014 in the NSMP target areas, the
National School Meal Program has contributed to improved education achievement
indicators in the targeted areas. Between the 2nd semester of 2011/12 and the first semester
of 2013/14 gross enrolment increased from 117.75 percent to 123.15 percent. Net
enrolment rates rose from 90.4 percent to 97.62% over the same period. Primary
completion rate increased from 74.6 percent to 78.3 percent. Promotion rates also rose from
81.37 percent to 87.6 percent. Repetition rate reduced from 19.85 percent to 16.4 percent
and dropout rate has also reduced from 9.35 percent to 3.35 percent. An NSMP database
has been established to collect data on NSMP implementation for reporting, planning and
evaluation.
163. A Policy on Promoting School Lunch was adopted by the Government in May 2014
as a result of the NSMP work in the EFA/FTI program.
164. The first round of Block Grants met the target of 320 schools. However, during the
second and third round only 307 schools received a grant. The missing schools, in 6
Provinces either closed or changed locations as part of the government strategy on
resettlement.
165. The independent evaluation of the quality inputs which took place in 2014 noted
that the school support system is in early stages of development. Mobile teacher’s
classrooms held inadequate space for the number of children. Classroom observation
reports show that the teaching and learning environment was positive. A further challenge
was that the teaching assistants were not qualified to teach and many of them found it hard
to follow the Mobile teachers plan when the teacher was in the other village.
166. VEDCs operated well especially in their role to ensure all children attended school.
However the election cycle meant there was a high turnover of VEDC members. New
members required training and it was difficult to build synergy with those who had gone
before.
167. As mention previously, the original target for classrooms and sanitation facilities
was revised following project effectiveness. Based on District needs, the target was later
reduced to 332. The Program met this target by the end of the third year. However during
the restructuring as part of the mid-term review the target was increased to 412. Plans to
construct the additional 80 schools were further revised due to the weakening of the
Australian Dollar so that only 48 additional schools were built. This brought the total
number of new schools to 380. This total comprised 206 schools funded by EFA- FTI and
174 funded through DFAT.
168. Mobile Teachers: When the pilot was designed it was envisaged that 300 villages
would benefit from the program. However once the selection criteria were established it
was found that 18 villages did not meet the criteria. Therefore 282 villages were selected
with the corresponding number of 282 teaching assistants. The number of mobile teachers
met its target of 150.

63
169. Water and Sanitation: All schools constructed through the Program are to be
equipped with water wells and sanitary toilets. As shown in the aide-memoire of October
2011 Australia agreed to fund provision of water and sanitation facilities through the
UNICEF-WASH project instead of through the EFA/FTI project. However the WASH
project encountered delays. By the end of the project 253 project schools had water and
sanitation facilities which meet the June 2009 standards. This number includes those which
were previously without the facilities. The remaining 127 EFA/FTI schools have access to
water and sanitation as they are built in school grounds with existing facilities. However
the facilities do not meet the June 2009 standards. Installation of the remaining facilities is
planned to be completed in 2015.
170. Monitoring and Evaluation: During the 2013 restructuring it was agreed that due
to the ambitious nature of the program, the M+E sub-component would focus only on
primary education. M+E Tools as well as an M+E Manual have been developed and piloted.
III. Achievement of Program Development Objectives:
171. Inclusive Education. An independent evaluation carried out in 2014 stated that
VEDCs were very clear on their role to ensure all children attended school and that all
VEDCs visited had a school map showing which families had children in school and which
did not. Most also had contingencies to ensure that all children attended school.
172. Quality Education that provides effective teaching and learning relevant to
children’s lives. Note: All teachers trained were still teaching at the end of the program.
173. Teacher Upgrading: The independent evaluation report stated that most schools
reported multiple visits from PESS, DEBS or PA each semester. PA visits were the most
useful. All teachers were enthusiastic about their work and their classrooms were brightly
decorated. They had appreciated their training. Monitoring visit to the pre-primary schools
was mostly made by the principals of the primary school. All had lesson plans and were
using teaching and learning materials either provided by the Program or made by them.
This situation contrasted sharply with a visit to pre-school classes where the teacher had
not been trained. The teachers had no lesson plan, had not made any materials and the walls
were bare.
174. Access to Pre-school: Over the life of the Program the Primary and Pre-Primary
department trained a total of 749 pre-school teachers against a target of 750. 396 children
(190 girls) benefited from a pre-school education before attending primary school in
2012/13 and 450 children (194 girls) attended project pre-schools in 2013/14. In addition
to this, 93 schools in the target areas offered access to formal pre- school education from
2012 /13 to 2013/14 and a further 305 offered formal pre-school education in 2013/14.
Access to pre-school was increased by 1,147 pre-schools as a result of Program activity.
175. Teaching and learning materials: The Primary and Pre-Primary IU delivered
1,000 teaching and learning kits to assist pre-primary teachers to increase the quality and
64
relevance of their teaching and learning. A total of 4,540 tool kits were delivered to 988
primary schools. Monitoring reports show that both primary and pre-primary teachers used
the materials regularly in their teaching. This finding was also verified by the findings from
the independent evaluation.
176. National Assessments and Testing: While not directly contributing to increased
quality in the short term, national assessment of 5,903 Grade 3 student learning outcomes
in mathematics and Lao language in 2012 as well as the early grade reading assessments
of 4,320 children in grades 2,3 and 4 have established baselines. These are an essential
foundation for measurement against future assessments. The results will inform curriculum
development and teacher training which in turn will lead to improved performance. The
EGRA were designed to measure average reading levels at Grades 2, 3 and 4 to
complement the data from 2012 ASLO III test. 795 staff (252 females) directly benefited
from EGRA and ASLO activities. 4,320 children in 5 Provinces were assessed in 2012.
They were divided equally between Grades 2, 3 and 4 with equal numbers of boys and girls.
177. Strengthening of VEDC: Independent and IU monitoring reports show that by
2014 all VEDCs were working productively with the 1,518 schools. A survey carried out
by the IU showed that VEDC members in project target areas were fully aware of their
roles and could identify the improvements that had taken place in their schools. This
compared with VEDC members in non-target areas who were not clear about their roles
and had seen no improvements in their schools.
178. Additional Classrooms/Multi-Grade Teaching Capacity: The original target for
number of schools constructed over the life of the Program was 1,500. However due to
District demand this target was later reduced to 332 (186 funded by EFA-FTI and 174 by
Australia). This target was reached at the end of 2013. Construction of an additional 80
schools was planned during the mid-term review but this was revised to 48 due to
fluctuations in the Australia exchange rate. The total number of schools constructed under
the Program was 206 funded by EFA-FTI and 174 Australian funded. 902 primary school
classrooms and 170 pre-school classrooms were constructed using EFA-FTI funds.
Australia funded construction of 734 primary and 137 preschool classrooms. A further 13
schools and 40 classrooms were rehabilitated. The number of incomplete schools was
reduced from 159 to 53 as a result of community construction funded through the project.
179. All incomplete schools have multi-grade teachers trained by the Program as part of
the 10 day EQS training. Monitoring reports show that all teachers trained were still
teaching at the end of the project. There were no significant problems other than shortage
of materials and insufficient space to create learning corners.
180. School Principal Professional Development: The Program achieved the target to
train 2,623 school principals in 16 target provinces on the duties of a school principal and
the revised educational quality standards (EQS) of the MoES. A target to train of 64 master
trainers was also achieved. Monitoring reports show that by 2014 more than 70 percent of
principals were making annual plans and 60 percent were making classroom observations
with feedback to teachers.
65
181. Community Grants: During its life the Program disbursed 3 rounds of Community
Grants each to 280 villages. Monitoring reports show that the grants were being used for
the right purpose.
182. Equivalency Programs for Primary Education: 150 teachers qualified at 8+3
level were trained as mobile teachers responsible for 2 villages each. They were supported
at the village level by one teaching assistant per village (282 teaching assistants). Teaching
assistants (local literate adult with a minimum of five years primary schooling or
equivalent) stayed in their village and followed up teaching while mobile teachers were on
duty in other villages. Owing to its successful implementation and positive feedback from
stakeholders, the program was expanded to two additional provinces in 2013/14. At the
end of the Program all Mobile teachers were integrated into the mainstream system of the
MoES.
183. Expansion of community play-groups: School principals and VEDCs encouraged
the community to build shelters if they were not provided by the school. Monitoring reports
showed that by the end of the program 437 of the 450 children attending CBRS in 2013/14
were planning to enroll in their local primary school in school year 2014/15. The
independent evaluation report showed that children in pre-schools with trained care-givers
were more actively engaged in learning than in pre-schools where care-givers were not
trained through the project.
184. Information system renovation: The EMIS team has made good progress in
improving the quality of data collection over the life of the project. Development of the
LaoEDUInfo database containing basic statistics and development of short analysis reports
has made data more accessible. They have also finalized guidelines for the general public
who wish to request raw EMIS data and made it available for public use. However despite
these crucial achievements there is still a need for further development to enable IU’s to
obtain timely information as a basis for monitoring, evaluation and decision making.
IV. Overall Program Direction and Management of the EFA/FTI program:
185. The Program Director was supported by a Program Manager. At the start there was
considerable variation among the IU’s on their ability to plan efficient and effective
implementation and monitoring of the Program activities. The ECU therefore organized
practical workshops to help the IU’s complete their own implementation plans and the
teams quickly became organized. Over time, implementation of EFA/FTI program became
more efficient. Program management has been rated as satisfactory throughout the life of
the project. The experiences gained through management of these internationally funded
projects are steadily building capacity of the government staff to manage further projects
and potentially take broader role in the future.
186. Procurement: The Program has encountered no significant procurement issues and
procurement has been rated as satisfactory throughout the project.
66
187. Financial Management: All quarterly Financial Management Report (FMR’s)
have been approved as satisfactory by the Bank and all have been submitted on time. The
reports have encountered issues of variable quality throughout the Program lifetime,
particularly in the area of matching the physical progress report with expenditure. Support
from an International Financial management specialist helped the ECU to improve the
quality of the FMR’s and monthly reports.
V. Cross cutting themes:
188. Selection of the 56 target districts was made on the basis of net enrollment rate of
females lower than the national average according the latest available data set from the
School Census of 2008. Together they account for 75 percent of the children not enrolled
in primary school. The remaining 87 Districts contribute only 25 percent% of the children
not enrolled in primary school. Source: EMIS 2008-09.
189. Female representation: By 2013, 85 percent of VEDCs in target districts included
female representatives. During the final year of the EFA/FTI program 28 percent of all
VEDC members trained were female. Over the life of the program, girls in target districts
have consistently achieved similar enrollment and drop out performance indicators to boys.
190. Representation from Ethno-linguistic Groups: Approximately 80 percent of the
population of Program target villages were from at least four of the country’s ethnic groups.
These were Mon-Khmer, Hmong-Mien, Lao-Tai and Sino-Tibetan. Therefore, all Program
activities and results can be seen within the framework of supporting capacity development
and encouraging demand- led initiatives from non –Lao ethnic groups.
191. Environmental issues: Australia provided capacity building to program engineers
and conducted a safety audit. The audit concluded that safety had been a priority in school
construction and all schools were free of asbestos.
192. Good Governance and Transparency: The World Bank aide-memoire of the final
implementation support mission stated that the Bank was “pleased to have witnessed all
units working within the framework of transparency and good governance.”
193. Monitoring and Evaluation: Four basic sets of Monitoring and Evaluation
activities were carried out over the life of the project. These were: ECU monitoring of
official performance indicators; Evaluation of Program implementation progress towards
achievement of development objectives through World Bank implementation support
missions; Joint Sector Review Mission and two Independent evaluations. One of these was
Indochina Research which gathered data for an Impact Evaluation on block grants. The
other was an independent technical evaluation of the quality inputs.
VI. Sustainability:
194. The ECU has implemented strategies to ensure sustainability of the majority of
program activities. Newly constructed schools, pre-schools and classrooms, trained
67
teachers, school principals and VEDC members, block grants, strengthening policy
planning, EMIS, monitoring and evaluation, ASLO, EGRA and program management
skills are all sustainable in that the physical infrastructure and capacity developed as a
result of the project has become institutionalized. Capacity built through provision of
Community Grants will continue to be developed with the provision of block grants.
Training of VEDC members, provincial and district staff as well as capacity built and
lessons learned at all levels in the implementation of the CBSRP will also be further
developed in the new ECE project funded by the World Bank and future development
partner funded programs. The mobile teacher program in itself is not sustainable but the
MoES has absorbed the teachers as MoES staff. In addition to this, the teaching assistants
will have gained substantial experience and training. They may be able to continue to
support children’s learning in remote areas in the future depending on support and
ownership of the community.
VII. Summary of Lessons learned:
195. A program specific Quality Monitoring and evaluation framework should be
designed at the start of the next program or Program and staff should be trained to use it.
More focus on assisting IU’s to improve their own planning and budget management is
needed in any new project. This will help to ensure that the activities are planned in
conjunction with budget management and finance flow. Regular meetings with IU’s and
implementation staff help to ensure good communication and minimize misunderstandings.
Quality improvement and community based interventions have resulted in a significant rise
in enrollment and completion over the life of the project. EFA/FTI program systems are
integrated into the mainstream practices of the MoES.
VIII. Key enabling factors which contributed to the success of EFA-FTI included the
following:
196. The Program management team already had significant experience of working in
the previous World Bank funded EDPII project and other donor funded projects. This made
it easier for them to assist IUs and others in budgeting and planning as well as being
immediately familiar with World Bank guidelines. The World Bank, Australian Aid and
other development partner staff provided advice and support where needed. They made
regular visits to the Program sites in the provinces to clearly understand the issues. Strong,
committed, timely leadership and support from the MoES senior management, Program
Director and the World Bank Task Team Leader were key enabling factors. This was
strengthened by a country context where the development partners and MoES work
positively to create a clear strategic plan, clear development goals and a policy monitoring
framework against which to monitor achievements.
197. At local level there is an environment where communities support and appreciate
the development of education provision. Furthermore the program design is fully in line
with the Governments own Three Builds decentralization policy where the emphasis is
placed on accountability and ownership at local level.
68
198. Of these factors good leadership is perhaps the most important. A good leader
makes sure that everyone understands the issues, works towards achievement of common
goals, is not afraid to admit to problems and motivates staff to find positive ways to solve
them. The program was very fortunate to have these in staff and development partners at
all levels.
XI. Conclusion:
199. The EFA/FTI program successfully achieved the majority of the performance
indicators and was fully aligned with the Education Sector Development Plan. Success in
terms of program management is demonstrated in that the World Bank has approved a new
ECE Project and the Local Education Group has submitted a proposal for a second phase
GPE project using the same management and implementation teams as those involved in
the EFA/FTI program.
200. Furthermore, based on the achievements of the EFA/FTI program, Australia has
committed sizeable support to the new Education Sector Development Plan.
69
Annex 8. Comments of Cofinanciers and Other Partners/Stakeholders
No donor comments were received.
70
Annex 9. List of Supporting Documents
Project Appraisal Document, World Bank, 2011
Aides-memoire and Implementation Status Reports 2011 – 2014
World Bank Country Assistance Strategy 2008-20011.
Project Paper for a proposed restructuring, World Bank, 2013.
World Bank Country Partnership Strategy 2012-2016.
Marshall, Jeffery H. (2014). EFA/FTI program evaluation: An End-of-Project Update on
Implementation of Five Quality Sub-Components
Implementation Completion Report, Ministry of Education and Sports, 2014.
National Assessment of Student Learning Outcome (ASLOIII)-Grade 3, Ministry of
Education and Sports, Research Institute for Educational Sciences, June 2014.
71
MAP