pricing of bank lending and borrowing
DESCRIPTION
What factors lie behind the pricing of lending and borrowing rates by banksTRANSCRIPT
BIS WORKING PAPERS
No. 62 – March 1999
THE PRICING OF BANK LENDING AND BORROWING:
EVIDENCE FROM THE FEDERAL FUNDS MARKET
by
Craig H Furfine
BANK FOR INTERNATIONAL SETTLEMENTSMonetary and Economic Department
Basle, Switzerland

BIS Working Papers are written by members of the Monetary and Economic Department of the Bank forInternational Settlements, and from time to time by other economists, and are published by the Bank. The papersare on subjects of topical interest and are technical in character. The views expressed in them are those of theirauthors and not necessarily the views of the BIS.
Copies of publications are available from:
Bank for International SettlementsInformation, Press & Library ServicesCH-4002 Basle, Switzerland
Fax: +41 61 / 280 91 00 and +41 61 / 280 81 00
This publication is available on the BIS website (www.bis.org).
© Bank for International Settlements 1999.All rights reserved. Brief excerpts may be reproduced or translated provided the source is stated.
ISSN 1020-0959

BIS WORKING PAPERS
No. 62 – March 1999
THE PRICING OF BANK LENDING AND BORROWING:
EVIDENCE FROM THE FEDERAL FUNDS MARKET
by
Craig H Furfine*
Abstract
This paper examines the terms of bank lending and borrowing by exploring pricingin the federal funds market, the market in which financial institutions tradeovernight reserves. By exploiting a never-before-used dataset containing detailedinformation on every Fedwire transfer between financial institutions, interest ratesactually paid by institutions in the funds market are calculated. The size of thetrading institutions and their relative importance in the funds market are shown toaffect the rates charged for overnight borrowing, thereby providing insight into thenature of competition in the federal funds market. Proxies for creditworthiness arealso used to estimate the size and nature of very-short-horizon risk premia.Transaction volume and size-of-transaction effects are also explored, highlightingthe role of liquidity in interest rate determination. Evidence of relationshipbanking among banks and an intraday credit market is also found.
* The author wishes to thank David Marshall and seminar participants at the Bank for International Settlements and theFederal Reserve Board of Governors for helpful comments and Josh Weisbrod for invaluable research assistance. Theviews expressed are those of the author and do not necessarily reflect the views of the Bank for International Settlements.


Contents
1. Introduction ......................................................................................................................... 1
2. Pricing in the market for federal funds ................................................................................ 3
3. Federal funds transaction data ............................................................................................. 4
4. Empirical results ................................................................................................................. 6
5. Conclusions ......................................................................................................................... 20
References ..................................................................................................................................... 21


1
1. Introduction
Financial institutions play a crucial role in channeling funds from those who save to those who invest.
Academic research has therefore given much attention to studying the terms under which such
institutions both borrow and lend to fulfill this role as intermediary. With regard to lending, empirical
research has documented that the pricing of bank loans generally involves floating rates tied to an
underlying index rate (Booth and Chua (1995), Berger and Udell (1990)), collateral requirements
(Berger and Udell (1990)) and covenants (Booth and Chua (1995)), and are generally made under
commitment (Avery and Berger (1991)). In addition, the literature has shown that the bank’s market
power (Hannan (1997), Rhoades (1995), Fergus and Notahaft (1995)), its financial standing (Ho and
Saunders (1981), Angbazo (1997)), the existence of long-term relationships (Berger and Udell (1995),
Petersen and Rajan (1994)), and the nature of regulatory constraints (Duca and Rosenthal (1994),
Manage (1990)) affect these terms.1
The second half of the role of intermediary, namely the nature and terms of bank borrowing, has been
somewhat less studied.2 There has been empirical support for the role of market power in the pricing
of retail certificates of deposit (CDs) (Cooperman, Lee and Lesage (1990, 1991)). The riskiness of
financial institutions has also been shown to influence the rates paid by banks in the wholesale CD
market (Hannan and Hanweck (1988), Ellis and Flannery (1992)) and quite possibly in the market for
subordinate debt (Flannery and Sorescu (1996)).
These analyses of bank lending and borrowing are complicated by at least two difficulties. The first
difficulty is largely beyond the control of the researcher. Since most empirical studies of the nature of
bank lending and borrowing rely on contract or transaction-level data, the limited availability of such
data generally dictates the nature of the empirical work. Popular data sources in the literature include
the Federal Reserve’s survey of the terms of bank lending (Carey, Prowse, Rea and Udell (1993),
Berger and Udell (1990)), the National Survey of Small Business Finances (Berger and Udell (1995),
Petersen and Rajan (1994)), the Loan Pricing Corporation’s Dealscan database (Carey, Post and
Sharpe (1998)), and various filings from the Securities and Exchange Commission (Booth and Chua
(1995)).
1The theoretical literature has complimented this literature by deriving motivations for many of these features. Forinstance, the literature has suggested many theories to explain the common appearance of loan commitments (Thakor(1982), Boot, Thakor and Udell (1987), Kanatas (1987), Morgan (1994)), collateral (Barro (1976), Besanko and Thakor(1987)), fees (Berlin (1987), Thakor and Udell (1987)), and long-term relationships (Diamond (1984), Petersen and Rajan(1995), Boot and Thakor (1994), Sharpe (1990)), Greenbaum, Kanatas and Venezia (1989)). Additional research hasdescribed how the financial standing of the bank (Wong (1997), Ho and Saunders (1981)) and the regulatory environment(Madura and Zarruk (1992)) also influence the terms under which banks lend.
2Rather than passively lending given an exogenous supply of deposits and capital, banks generally operate by lending toborrowers that seem justified, and then funding these loans where possible (Stigum (1990)). Thus, the ability of banksand other intermediaries to successfully channel funds from savers to investors depends on the nature and terms of bankborrowing.

2
When using such data, the variables collected or the sample of institutions included generally impose
noticeable restrictions on the empirical work being conducted. For instance, such data typically only
provide information on the terms of the loan contract. Thus, the research questions that have typically
been addressed are those that ask questions regarding the nature of loan contracts. (What effect does
the presence of collateral have on loan pricing or loan riskiness? How does the length of a relationship
affect the loan interest rate? How does the market power of an institution affect the rate charged on
loans or the rate paid on deposits?) These questions have been typically one-sided. That is, they look
at the question of bank lending or borrowing from either the borrower’s or the lender’s perspective,
but rarely both.3 For instance, studies involving data on lending contracts typically do not include
variables to measure the creditworthiness of borrowers because such variables are typically not given
as part of the underlying survey.4 Studies on bank borrowing in either local deposit or national CD
markets typically only consider variables relating to the financial institution but not the supplier of
funds because, again, such data are almost impossible to come by.
The second difficulty in studying banks’ lending and borrowing behavior is the complicated nature of
financial contracts. As mentioned, collateral requirements, flexible payment schedules, commitments,
and other non-price terms make summarizing the details of a loan contract difficult to calculate, much
less explain. Empirical research typically summarizes various loan details with dummy variables
indicating their presence in the contract, even though economic theory predicts that the relationship
between contract features and contract pricing and riskiness are related in non-linear ways. For
example, two loan contracts involving collateral may have very different characteristics depending on
the degree of collateralization, the security used as collateral, and the terms under which collateral
would no longer be required. This typically makes it very difficult to empirically compare the terms of
any two given loan contracts.
This paper studies bank lending and borrowing in a way that minimizes these difficulties. To begin,
this research examines the pricing decisions of financial institutions active in the federal funds market,
the market where financial institutions both buy and sell reserves. These transactions are largely free
of the complicating factors present in other loan contracts. In particular, federal funds transactions are
by definition uncollateralized.5 These loans are characterized by a loan extended on one day with
principal and interest repaid the following business day. Thus, each of the loans has approximately the
same maturity, has maturity equal to its duration, and is free from complicating payment schedules.
3A notable exception to this statement is the extensive efficiency literature, which, by looking at bank profitability,necessarily looks at both the income from lending and the costs from borrowing simultaneously.
4The exceptions to this are the various studies examining discrimination in mortgage markets that look closely at borrowercharacteristics.
5Collateralized interbank lending would be considered a repurchase agreement and would not be a part of this database.
3
Thus, the data in this study isolate the interest rate decision from the other factors that typically
complicate loan contracts, giving a clean look at the nature of market pricing.
These data also allow simultaneous examination of the lending and borrowing activities of financial
institutions. This is because the federal funds market is where financial institutions lend to one
another. As a result, information regarding both the borrower and the lender for each individual
transaction is readily available, allowing a more complete analysis of the determination of interest
rates.
Due to the nature of these data, the results presented may not generalize to other lending and
borrowing markets. In particular, many of the complicated features of loan contracts that are found in
other markets may be the optimal bank response to uncertainties that do not exist in an overnight funds
market. Nevertheless, evidence is found that the importance of both the lender and the borrower plays
a significant role in the pricing of federal funds transactions. Banking relationships, too, seem to play a
role, especially when the borrowing institution is small. Perhaps surprisingly, proxies for credit risk
detect risk-based pricing, even for overnight claims. Finally, there is evidence of a subtle form of
private sector intraday credit, possibly suggesting that the fees charged by the Federal Reserve help
influence the market’s valuation of these short-term credit extensions.
The remainder of the paper is organized as follows. Section 2 briefly summarizes what is known about
pricing in the federal funds market. Section 3 describes the source, strengths, and weaknesses of the
transaction-level data. Section 4 presents the empirical findings. Section 5 concludes.
2. Pricing in the market for federal funds
The rate at which financial institutions trade reserves overnight, the federal funds rate, is arguably one
of the most watched financial market indicators because, over the business cycle, the funds rate
typically indicates the stance of monetary policy (Bernanke and Blinder (1992)). A common
misperception is that the Federal Reserve sets the rate at which financial institutions trade reserves
through its open market operations. While it is true that Fed action largely determines the aggregate
supply of bank reserves, it is the allocation of these reserves within the banking system that determines
the rate at which institutions agree to trade. A sampling of rates at which institutions trade federal
funds is then averaged (by value) for each day, with the resulting daily average rate being called the
“effective” federal funds rate. Current Fed policy uses a target for the effective federal funds rate as an
intermediate goal to guide monetary policy, and the Federal Open Market Desk intervenes almost
daily in the reserve market to attempt to achieve an effective funds rate for each day close to this
announced target. The Fed, however, is not concerned about hitting its target on a daily basis or about
determining the pricing of individual federal funds rate transactions. Thus, the cross-sectional

4
variation in transaction interest rates for a given day and the day-to-day variation in transaction rates
are largely determined by the financial institutions trading reserves. It is for this reason that the
effective federal funds rate deviates quite noticeably from its target on a daily basis (Spindt and
Hoffmeister (1988), Hamilton (1996)).
Most work examining the funds rate has relied on the published effective funds rate and therefore have
abstracted from the pricing of individual transactions. For example, observations of the daily effective
federal funds rate have been used to test theories of the term structure (Rudebusch (1995)), estimate
the Federal Reserve’s daily market interventions (Feinman (1993)), or explain anomalies in the
behavior of the rate itself (Furfine (1998a), Hamilton (1996), Spindt and Hoffmeister (1988)). In all of
these cases, the determination of the effective federal funds rate was derived from a model of a
representative financial institution or a representative buyer and seller in the funds market or has taken
the daily movements of the funds rate as given exogenously.
To date, the literature has only provided anecdotal evidence regarding the pricing of individual federal
funds transactions. Stigum (1990) discusses tiering in the market by which large institutions generally
get better terms than smaller institutions. Allen and Saunders (1986) report in a footnote that, based
upon conversations with market participants, non-money center banks generally pay between 1/8%
and 1/4% above the rate of their money center counterparts.
This paper studies the pricing of individual funds transactions that determine the daily effective federal
funds rate. This study takes monetary policy as exogenous. For the sample period, the first quarter of
1998, the target federal funds rate was unchanged at 5.5%. Thus, market forces are driving the
variation in the federal funds rate that is found in cross section and over time. The goal, therefore, is to
attempt to explain these variations in federal funds rate pricing using empirical measures of commonly
mentioned theoretical determinants of pricing.
3. Federal funds transaction data
Both large and small institutions wish to trade in the federal funds market. This is because all
institutions face some degree of unexpected inflows and outflows of reserves that they may wish to
undo through overnight borrowing or lending. Generally speaking, banks looking to sell funds contact
institutions wishing to buy funds and they agree on a mutually acceptable quantity, term (typically
overnight), and interest rate.6 The lender (seller) of funds generally transfers the funds on the day of
the sale to the borrower, and the borrower (buyer) of funds returns the borrowed amount, plus the
6Brokers may play a role in facilitating this process.

5
agreed interest to the lender the following business day. These two payments typically occur over
Fedwire, the large-value transfer system operated by the Federal Reserve.7
These Fedwire payments allow the identification of federal funds transactions analyzed in this study.8
For business reasons, the Federal Reserve temporarily maintains a record of each payment transaction
sent over Fedwire and, from this record, every Fedwire funds transfer made during the first quarter of
1998 was collected. Of the several hundred thousand transactions recorded each day, only a relatively
small number are related to the federal funds market. Stigum (1990) argues that federal funds
transactions are usually made in round lots of over $1 million. Based on this anecdotal evidence, the
sample of transactions was searched, and payments whose amounts were greater than $1 million,
ended in five zeros, and had a payment the following business day in the opposite direction in an
amount that could reasonably be construed as the initial payment plus interest were identified as
federal funds transactions.9 As interest rates charged vary across transactions, a range of values for
valid rates of interest were allowed. For the results below, a window of interest rates was allowed,
ranging from 50 basis points below the minimum of the 11 a.m. funds rate, the closing rate, the
effective rate, and the Fed’s target rate, to 50 basis points above the maximum of these four rates.
Potentially the greatest weakness of this approach to identifying federal funds transactions is that the
sending and receiving bank identified in the data need not be the actual parties to the transaction.
These banks could be acting either as correspondents or as brokers for the funds transactions of others,
or the transactions may represent overnight lending arrangements between non-financial firms
operating through different banks. It is also possible that there are transactions struck at a rate outside
the selection window, and of course these will be missed.10
Despite these caveats, the data present a unique opportunity to examine the determination of interest
rates with information available on both the borrower and the lender of funds. Measures of the
importance of the buyer and seller can be constructed. Proxies for credit risk for both the borrowing
and the lending institution can be used. In addition, the precise duration of the loan is available, as are
various measures of banking relationships. Finally, the data allow the exploration of the possible
influence of liquidity on interest rates.
7Small federal funds transactions between banks that have correspondent relationships may be arranged through booktransfers (accounting entries) and may not require any Fedwire payments.
8A more detailed description of the transaction identification process can be found in Furfine (1998b).
9Federal funds transactions where market participants return the principal separately from the interest were also identified.
10Enlarging the window had a negligible impact on the number of payments identified as federal funds transactions. Analternative selection criterion would be to utilize the Federal Reserve’s published values for the high and low value forthe funds rate each day. Because these measures are based only on a subset of the overall market, the transactions in thedataset used in this paper contain observations that lie outside the published ranges. Nevertheless, using this alternativeapproach had a negligible impact on the number of transactions and the results reported, but did add to the number of“outliers” present in the sample, especially those with extraordinarily high rates of interest.

6
4. Empirical results
The empirical analysis estimates the importance of various factors in determining the interest rates
paid for federal funds transactions. The variables chosen have been identified in the literature as
possible factors that determine the terms under which banks borrow or lend or have been argued to
influence pricing in the funds market in particular.11
The dependent variable for the analysis will be the interest rate on the given federal funds transaction.
This is measured at an annual rate and has been adjusted for holidays and weekends. To verify that the
underlying data are truly federal funds transactions, the weighted average interest rate for each day
was calculated and compared with the published effective federal funds rate. The average daily interest
rate in the sample is 5.527%, whereas the average effective federal funds rate during the first quarter
of 1998 was 5.519%, a difference of less than one basis point. The standard deviation of the sample
daily rate is 0.137, slightly below the published value of 0.147. Finally, the two series have a
correlation of 0.96. Thus, the sample appears to accurately reflect the federal funds market.
The first determinant of interest rates explored in this research is the relative importance of the two
participating institutions. This measure was constructed in three ways. First, the variable
Daily_Borrower_Share measures the share of a particular day’s aggregate borrowing that the given
institution is responsible for. That is, for institution X, this variable would be the amount borrowed by
institution X on day Y divided by aggregate borrowing on day Y. The variable Daily_Lender_Share is
defined analogously. Alternatively, the variables Aggregate_Borrower_Share and
Aggregate_Lender_Share were constructed, measuring the share of total sample borrowing and
lending by a given institution. These variables are unique to each institution but do not vary over time.
To account for a possible non-linear impact of importance on pricing, the squared levels of the above
variables were also included in some specifications. Whereas the previous measures account for the
participants’ importance to the funds market, pricing might also be related to the relative importance
of the financial institution as a whole. Dummy variables denoting five different categories for the size
of both the borrower and the lender attempted to account for this possibility. Size is defined as the
borrower and lender’s total assets as of 31 December 1997.
Another possible determinant of interest rates would be the borrower’s credit risk. Although the short-
term nature of the loan suggests limited scope for credit risk, the borrower’s leverage capital ratio,
Borrower_Leverage, was included in the estimation to account for this possibility. As bank capital
ratios are strongly inversely proportional to bank size, the dummy variables for bank size can also be
11Bank Call Reports were used for the variables that could not be constructed from the transaction database. Somevariables were not available for some institutions. In particular, reasonable capital data were not available for foreigninstitutions, and thus the final sample of 113,805 federal funds transactions is approximately 40% smaller than the full setof transactions that were identified using the process described above.

7
seen as control variables that allow the leverage measure to better approximate credit risk. The
variable Lender_Leverage was also included to explore whether these variables may be serving as
proxies for other factors. If the bank’s capital ratio were solely capturing the pricing impact of credit
risk, the variable Lender_Leverage would probably be insignificant.
The next factor examined is liquidity. Liquidity plays an important role in traditional bank lending.
For instance, some have argued that the ability to securitize single family mortgages and sell the
securities in deep liquid markets has lowered the cost of securing mortgage financing. Unlike more
traditional bank lending, the impact of liquidity on pricing in the funds market is more akin to the role
of liquidity in other financial markets such as stock and foreign exchange markets. However, the data
here do not allow for a volume-liquidity-pricing study of the kind that has become popular for other
markets.12 This is because the data available on timing relate to the time that the payments were
transferred over Fedwire and not the time that the original trade was made. Anywhere from a few
minutes to several hours may elapse between the time of a federal funds trade and the flow of money
over Fedwire. Nevertheless, one should expect payment times to be positively correlated with trading
times simply because the payments necessarily follow the underlying trade. Thus, one might use the
timing of payment flows to proxy for market liquidity. To explore this possibility, the analysis
includes the variable Liquidity, which measures the share of federal funds value that was delivered
over Fedwire during the half-hour period of the given transaction.
Liquidity may also be determined by the size of the transaction. For example, very large loans may
have both a limited supply and a limited demand. Dummy variables denoting transactions less than or
equal to $10 million, between $10 million and $100 million, and over $100 million were included in
the estimation. These categories identify 38.5%, 55.2% and 6.3% of the transactions respectively.
The timing of federal funds payments, in addition to possibly influencing liquidity, has a necessary
impact on the intraday reserve balance position of the counterparties involved. That is, a bank that
borrows $20 million in the funds market sees its intraday reserve balance rise by $20 million the
instant that the payment is processed over Fedwire.13 Many institutions that are significant buyers of
federal funds may be running an intraday overdraft in their reserve account. The timing of the delivery
and repayment of federal funds therefore affects the magnitude of a bank’s average overdraft. This
saves the bank the fee charged by the Federal Reserve for intraday overdrafts (Richards (1994)).
Abstracting from a bank’s allowable deductible, banks are charged 27 basis points at an annual rate for
intraday credit calculated on an average per minute basis. For example, suppose that a bank typically
12Bollerslev, Domowitz and Wang (1997), Peiers (1997) and Huang and Masulis (1996) study this relationship in foreignexchange markets. Stephan and Whaley (1990) and French and Roll (1986) examine the same in equity markets.
13Fedwire is a real-time gross settlement system, which means that institutions are debited and credited immediately andwith finality the moment the transaction has been processed by the system.

8
has an average per minute overdraft of $100 million. It would incur a fee of
0.0027x$100,000,000x(1/360) = $750. Suppose the institution delayed repaying a federal funds loan
of $20 million for one hour. Since Fedwire operates for 18 hours a day, this would lower its average
per minute overdraft to (17x$100m + 1x$80m) / 18 = $98.88m, or in other words by a factor of 1/18 or
equivalently 1.5 basis points at an annual rate. Thus, each additional hour that a borrowing bank
retains its funds saves it 1.5 basis points.
Since both the borrower and the lender are aware that the timing of payments influences the fees
charged by the Federal Reserve, the two counterparties may agree that the interest rate charged may
vary depending on the length of time between delivery of the loan and return of the principal. For this
reason, the variable Business_Hours_Duration, which measures the number of operating hours that the
loan was outstanding, has been included in the analysis. As Fedwire operates from 12:30 a.m. to
6:30 p.m., a loan delivered at 6 p.m. on Friday and returned at 11 a.m. on Monday will have a
Business_Hours_Duration value of 11.
Banking relationships may affect the pricing of federal funds transactions. The relationship banking
literature finds empirical evidence that small borrowers (presumed to be non-financial firms) benefit
by maintaining a relationship with a single bank or a small number of banks (e.g. Petersen and Rajan
(1994), Berger and Udell (1995)). In the case of the federal funds market, both the borrower and the
lender are financial institutions. Borrowing institutions may establish relationships with particular
institutions to establish that they are a good credit risk. By so doing, they may get a more attractive
interest rate.
Relationships were measured in two ways. The variable Number_Transactions_Pair is the total
number of federal funds transactions between a given borrower and a given lender during the entire
sample. As the relationship between the number of transactions and the strength of the underlying
relationship may be non-linear, the logarithm of the number of transactions was also used as an
explanatory variable. The second proxy for the strength of a relationship is Number_Days_Pair, which
measures the number of days that the given borrower has borrowed from the given lender during the
61 days in the sample. The logarithm of this variable, too, is explored. These measures of relationships
implicitly assume that the patterns observed during this quarter are indicative of the relationship
between the counterparties in the past. As the theories of relationship banking focus on small
borrowers, the above measures were interacted with a dummy variable indicating whether the
borrowing institution has less than $250 million in assets. Such small financial institutions may have a
particularly difficult time conveying to potential lenders that it is a good credit risk, and thus they may
particularly benefit from establishing a relationship.
Finally, dummy variables for each of the 61 business days in the sample were included. As
documented in Hamilton (1996) and elsewhere, the federal funds rate follows patterns during the two-

9
week reserve maintenance period as well as around holidays and quarter ends. To isolate the cross-
sectional variation in loan pricing, a complete set of dummy variables was used rather than attempting
to measure each calendar-related effect separately. To save space, the results for these variables are not
reported but are available separately.
Table 1
Definitions of variables used in this study
Daily borrower share The share of the day’s total borrowing of the given borrowing institution.
Daily lender share The share of the day’s total lending of the given lending institution.
Aggregate borrower share The share of the sample’s total borrowing of the given borrowing institution.
Aggregate lender share The share of the sample’s total lending of the given lending institution.
Borrower size
Less than $250 million$250 million - $1 billion$1 billion - $10 billion Indicator variables reflecting the total assets of the borrower on 31 Dec. 1997.$10 billion - $100 billionOver $100 billion
Lender size
Less than $250 million$250 million - $1 billion$1 billion - $10 billion Indicator variables reflecting the total assets of the lender on 31 Dec. 1997.$10 billion - $100 billionOver $100 billion
Borrower leverage The borrowing institution’s leverage capital ratio on 31 Dec. 1997.
Lender leverage The lending institution’s leverage capital ratio on 31 Dec. 1997.
Liquidity The share of the day’s total federal funds value that was delivered during thegiven transaction’s half-hour interval.
Business hours duration The number of Fedwire operating hours between delivery of the federal fundssold and return of the funds with interest.
Transaction size
Less than $10 million$10 - $100 million Indicator variables reflecting the size of the federal funds transaction.More than $100 million
Number of transactionsin pair’s relationship
The number of transactions involving the sale of funds from the given lenderto the given borrower during the entire sample period.
Log (number of transactionsin pair’s relationship)
The natural log of the number of transactions involving the sale of funds fromthe given lender to the given borrower during the entire sample period.
Number of daysin pair’s relationship
The number of days on which funds were sold from the given lender to thegiven borrower during the entire sample period.
Log (number of daysin pair’s relationship)
The natural log of the number of days on which funds were sold from thegiven lender to the given borrower during the entire sample period.

10
Before turning to the empirical results, Table 1 reviews the definitions of the various variables, and
Table 2 presents some summary statistics. As mentioned, the interest rate data replicate the effective
funds rate quite well, and it is therefore no surprise that the transaction-level average interest rate is
5.4996%, given that the target funds rate during the sample period was 5.5%. The summary statistics
also indicate a fair degree of skewness in the distribution of many variables. As is typically the case in
banking, a small number of institutions have characteristics quite different from most other
institutions. This sample is no different. Whereas the median observation on aggregate borrowing
shares is about 1.3%, the mean is 3.4%. This is reflective of a small number of institutions with
significant market share. One institution bought more than 15% of the total funds exchanged over the
entire quarter. A similar skewness is apparent in the size of the underlying institutions. The
participating institutions have a size ranging from a low of only $9 million in assets to a high of
$302 billion. Transaction size and measures of relationships are also skewed. For instance, the mean
transaction size is $38 million, but the median is only $18 million. With regard to proxies for
relationships, some banks sell funds to a given institution only once during the entire quarter. The
median number of transactions for a given pair of institutions is 51, although as many as 1,992
transactions occurred between a given buyer and seller.
Table 2
Summary of transaction data*
Mean Standarddeviation
Median Minimum Maximum
Interest rate 5.4996 0.2407 5.4687 3.5815 13.5000
Daily borrower share 0.0350 0.0500 0.0133 0.0000 0.2012
Daily lender share 0.0212 0.0355 0.0020 0.0000 0.1679
Aggregate borrower share 0.0342 0.0489 0.0127 0.0000 0.1515
Aggregate lender share 0.0206 0.0342 0.0019 0.0000 0.1203
Borrower size ($ millions) 88,000 104,000 37,600 9 302,000
Lender size ($ millions) 53,100 94,000 3,600 9 302,000
Borrower leverage 0.0692 0.0132 0.0693 0.0454 0.2498
Lender leverage 0.0801 0.0283 0.0742 0.0350 0.2498
Liquidity 0.1068 0.0645 0.1018 0.0000 0.2724
Business hours duration 15.3332 2.7832 15.7528 1.1669 34.6558
Transaction size ($ millions) 38.0 69.7 18.0 1 990
Number of transactionsin pair’s relationship
215.7894 453.9571 51 1 1,992
Number of daysin pair’s relationship
41.0793 19.2295 47 1 61
* Summary statistics in the federal funds transaction dataset, ranging from 2 January 1998 until 31 March 1998 andcontaining 113,805 observations over 61 business days.

11
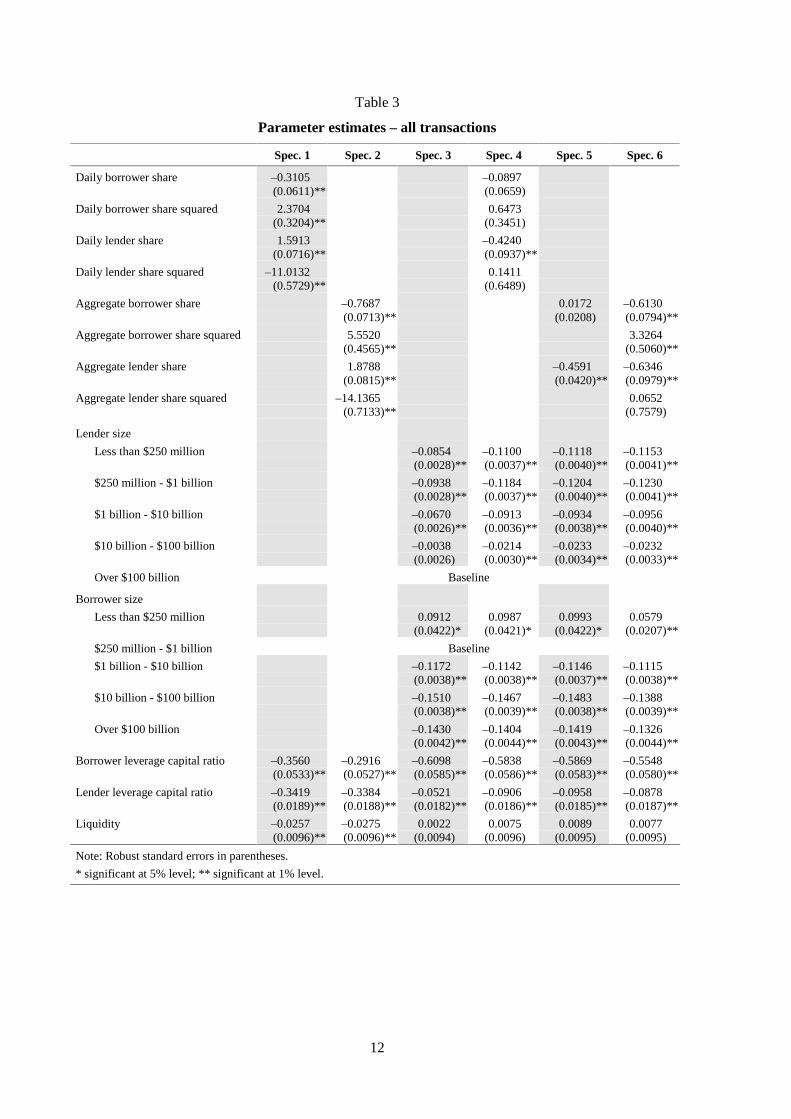
Table 3 presents the regression output of various specifications for the complete set of 113,805
observations for which the above empirical measures can be constructed. Overall, the variables
included in the regression explain about one-third of the cross-sectional variation in interest rates
charged. Looking first at the variables that measure the relative importance of the participating
institutions, measures of the share of borrowing by the borrower seem to be a significant factor in
pricing, particularly when the size of the participating institution is not controlled for. In the
circumstances where these variables enter significantly, the relationship between borrowing share and
pricing is found to be non-linear, with early levels of borrowing correlated with a decline in price and
higher levels of borrowing correlated with a rise in price. This is consistent with market power being
influential up to a point, but eventually (at around 7% of the market) additional market share in
borrowing actually raises the price paid, consistent with movement along a supply curve. The size of
this effect, however, is economically small. In any of the specifications where borrowing shares are
statistically significant, the marginal impact of a 1% change in borrowing share is generally less than
1 basis point, and predicts a decline in interest rates of around 0.5 basis points at the median level of
borrowing share.
The share of overall lending also reveals a non-linear relationship when institution size is not
controlled for. After controlling for size, however, a 1% increase in a bank’s lending share tends to be
linearly related to a decline in the transaction interest rate of between 0.4 and 0.6 basis points. This
result is consistent with any market power impact being dominated by movement along a demand
curve.
To some extent, the size and even the significance of the borrowing and lending share variables
change when the regressions also control for asset size. Regardless of the specification, however, the
economic size of the lending and borrowing shares is dominated by the impact of the participating
institutions’ asset size. Whereas the variation in bank lending and borrowing shares may be able to
explain cross-sectional differences in pricing of up to a few basis points, the magnitude of the impact
of bank size on pricing is much larger. For both the lending and the borrowing institution, additional
size improves the terms of the transaction. For example, an institution with over $100 billion in assets
typically pays 18 to 23 basis points less than an institution with less than $250 million in assets for
federal funds borrowed. These very large institutions also typically receive 8 to 11 basis points more
than the small institutions when they sell funds. It could be that these very large institutions benefit
from a good reputation in the market, and are able to translate this into better terms on their funds
transactions. Similarly, this effect may reflect market power in a way not captured by the borrowing
and lending shares. That the benefit of being big is greater when borrowing than when lending may
reflect a perception that the largest banks are too big to fail, and therefore these borrowers receive
even more favorable rates since lenders perceive little or no credit risk.
12
Table 3
Parameter estimates – all transactions
Spec. 1 Spec. 2 Spec. 3 Spec. 4 Spec. 5 Spec. 6
Daily borrower share –0.3105 –0.0897(0.0611)** (0.0659)
Daily borrower share squared 2.3704 0.6473(0.3204)** (0.3451)
Daily lender share 1.5913 –0.4240(0.0716)** (0.0937)**
Daily lender share squared –11.0132 0.1411(0.5729)** (0.6489)
Aggregate borrower share –0.7687 0.0172 –0.6130(0.0713)** (0.0208) (0.0794)**
Aggregate borrower share squared 5.5520 3.3264(0.4565)** (0.5060)**
Aggregate lender share 1.8788 –0.4591 –0.6346(0.0815)** (0.0420)** (0.0979)**
Aggregate lender share squared –14.1365 0.0652(0.7133)** (0.7579)
Lender size
Less than $250 million –0.0854 –0.1100 –0.1118 –0.1153(0.0028)** (0.0037)** (0.0040)** (0.0041)**
$250 million - $1 billion –0.0938 –0.1184 –0.1204 –0.1230(0.0028)** (0.0037)** (0.0040)** (0.0041)**
$1 billion - $10 billion –0.0670 –0.0913 –0.0934 –0.0956(0.0026)** (0.0036)** (0.0038)** (0.0040)**
$10 billion - $100 billion –0.0038 –0.0214 –0.0233 –0.0232(0.0026) (0.0030)** (0.0034)** (0.0033)**
Over $100 billion Baseline
Borrower size
Less than $250 million 0.0912 0.0987 0.0993 0.0579(0.0422)* (0.0421)* (0.0422)* (0.0207)**
$250 million - $1 billion Baseline
$1 billion - $10 billion –0.1172 –0.1142 –0.1146 –0.1115(0.0038)** (0.0038)** (0.0037)** (0.0038)**
$10 billion - $100 billion –0.1510 –0.1467 –0.1483 –0.1388(0.0038)** (0.0039)** (0.0038)** (0.0039)**
Over $100 billion –0.1430 –0.1404 –0.1419 –0.1326(0.0042)** (0.0044)** (0.0043)** (0.0044)**
Borrower leverage capital ratio –0.3560 –0.2916 –0.6098 –0.5838 –0.5869 –0.5548(0.0533)** (0.0527)** (0.0585)** (0.0586)** (0.0583)** (0.0580)**
Lender leverage capital ratio –0.3419 –0.3384 –0.0521 –0.0906 –0.0958 –0.0878(0.0189)** (0.0188)** (0.0182)** (0.0186)** (0.0185)** (0.0187)**
Liquidity –0.0257 –0.0275 0.0022 0.0075 0.0089 0.0077(0.0096)** (0.0096)** (0.0094) (0.0096) (0.0095) (0.0095)
Note: Robust standard errors in parentheses.
* significant at 5% level; ** significant at 1% level.

13
Table 3 (cont.)
Spec. 1 Spec. 2 Spec. 3 Spec. 4 Spec. 5 Spec. 6
Transaction size
Less than $10 million –0.0068 –0.0089 0.0060 –0.0004 0.0000 –0.0006(0.0030)* (0.0029)** (0.0030)* (0.0031) (0.0031) (0.0030)
$10 million - $100 million 0.0170 0.0149 0.0302 0.0248 0.0252 0.0244(0.0023)** (0.0023)** (0.0023)** (0.0024)** (0.0023)** (0.0023)**
Over $100 million Baseline
Business hours duration 0.0105 0.0106 0.0080 0.0080 0.0080 0.0081(0.0003)** (0.0003)** (0.0004)** (0.0004)** (0.0004)** (0.0004)**
Number of trans. in relationship 0.0000(0.0000)**
Log (no. of trans. in relationship) –0.0029 –0.0007 –0.0005(0.0007)** (0.0008) (0.0008)
Number of days in relationship –0.0006(0.0000)**
Log (no. of days in relationship) –0.0169(0.0011)**
For small borrowers:
Number of trans. in relationship –0.0014(0.0005)**
Log (no. of trans. in relationship) –0.0270 –0.0288 –0.0289(0.0135)* (0.0135)* (0.0135)*
Number of days in relationship 0.0024(0.0002)**
Log (no. of days in relationship) 0.0377(0.0023)**
Observations 113,805 113,805 113,805 113,805 113,805 113,805
R-squared 0.34 0.34 0.36 0.36 0.36 0.36
Due to the importance of bank size, the remaining discussion will focus on the specifications in which
size has been controlled for explicitly. In all of these specifications, a 1% increase in the borrowing
institution’s leverage capital ratio is correlated with a decline in the interest rate charged of
approximately 0.6 basis points. This significant effect is consistent with risk-based pricing, since an
institution with a higher capital level is presumably less likely to default on its federal funds loan. Part
of this measured correlation may be reflective of another influence of bank size. As bank capital ratios
are typically inversely related to bank size, the coefficient on the leverage capital ratio may be
reflecting the fact that institution size dummies are incomplete proxies for any size-related pricing
effect. Evidence that at least part of the coefficient may be reflective of factors other than credit risk is
seen in the coefficient on the lender’s leverage capital ratio. This variable is significantly different
from zero, albeit economically very small. The lender’s capital ratio should not affect the credit risk of
the transaction, and therefore it seems plausible that the observed coefficient is serving as a further
proxy for size.
After controlling for size, the coefficient on liquidity is not statistically different from zero. Thus, the
results seem to suggest that market liquidity as measured by the value of payment flow does not help

14
explain pricing. However, as mentioned, the timing of federal funds payments is not equivalent to the
timing of federal funds trades. It may be the case that this error in measurement is sufficient to mask a
true liquidity effect, or it may be the case that there is not a price/volume relationship in the funds
market as has been found elsewhere. Liquidity may also be a function of transaction size. According to
the results here, medium-sized transactions (i.e. those between $10 and $100 million) generally have
an interest rate about 2.5 basis points higher than both smaller and larger transactions. This inverted-
U-shaped pattern is found in all specifications.
The coefficient on the duration of the federal funds loan provides evidence of an intraday market for
funds. For specifications controlling for participant size, each hour of additional duration is correlated
with a 0.8 basis point increase in the transaction interest rate. This is very near to half the value of this
extra hour in terms of reduced intraday overdraft charges. This evidence suggests that institutions
trading funds “split the difference” and share the benefit of delaying the repayment of federal funds
loans. An alternative explanation is that the borrowing bank dictates the relationship between the
pricing of funds transactions and the duration of the loan, and that the borrowing bank assesses
roughly a 0.5 probability of running an overdraft at the time the loan will need to be repaid. Under
either hypothesis, such pricing is analogous to an intraday market for funds.
Results for the relationship proxies are consistent with the notion that banking relationships are
important in the funds market. This result is especially strong when the borrowing institution is small.
Referring to the results from the log specifications, a doubling of the number of transactions between
any two counterparties has an economically negligible effect on loan pricing. When the borrowing
institution has less than $250 million in assets, a doubling in the number of transactions is correlated
with nearly a 3 basis point reduction in the loan interest rate. As the number of transactions between a
given small borrower and a given lender ranges from one to 60, such a relationship can have a large
economic effect on the prevailing interest rate charged. Analogous specifications, using the number of
days for the measure of a relationship (not reported), give a similar finding. A doubling in the number
of days during which institutions trade funds is correlated with an interest rate that is lower by 0.6
basis points. When the borrowing institution is a small bank, the effect increases to about 2.3 basis
points.
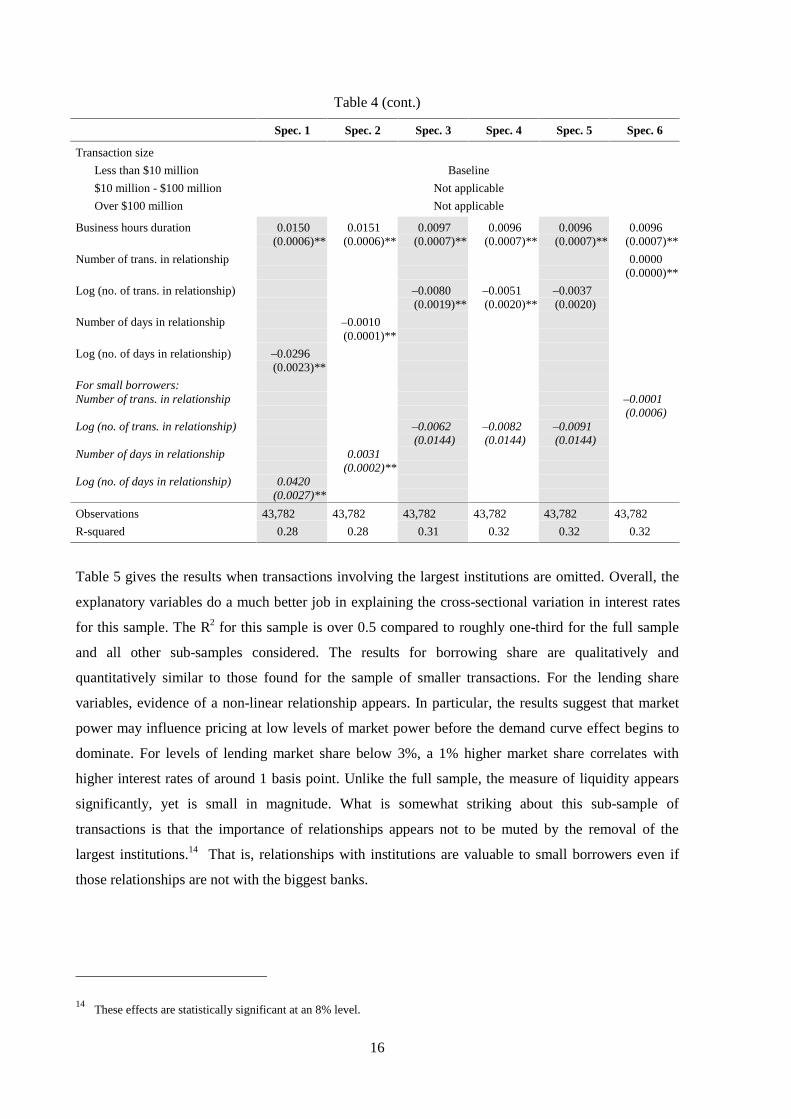
Tables 4, 5, and 6 show the output from the same regressions as in Table 3 except that the sample of
transactions has been limited. In Table 4, only transactions less than or equal to $10 million are
included. For such transactions, the importance of the participating institution generally seems more
important. The coefficients on measures of lending share are noticeably greater in magnitude than
those found in the results for the entire sample. Further, the size of the lending institution is correlated
with about twice the change in interest rates as was true for the entire sample. Borrower leverage also
appears more significant for these small transactions, with a 1% increase in the capital ratio correlated
with about a full basis point reduction in the loan interest rate. In contrast to the full sample, bank

15
relationships seem to affect loan pricing, but only when size is not explicitly accounted for does a
differential effect for smaller borrowers appear relevant. This could be because most of these
transactions involve relatively small borrowers anyway, so that the distinction of having less than
$250 million in assets is not marginally important.
Table 4
Parameter estimates – transactions less than or equal to $10 million
Spec. 1 Spec. 2 Spec. 3 Spec. 4 Spec. 5 Spec. 6
Daily borrower share –0.7888 0.0371(0.1292)** (0.1412)
Daily borrower share squared 5.3283 0.5477(0.6803)** (0.7363)
Daily lender share 3.6444 –0.9293(0.2455)** (0.3499)**
Daily lender share squared –27.3085 0.0776(2.5911)** (3.0153)
Aggregate borrower share –1.7194 0.1151 –0.8102(0.1648)** (0.0387)** (0.1946)**
Aggregate borrower share squared 11.4925 5.2733(1.0444)** (1.2009)**
Aggregate lender share 4.5801 –1.2531 –1.4745(0.2744)** (0.1486)** (0.4066)**
Aggregate lender share squared –38.8482 –0.8430(2.9674)** (3.6111)
Lender size
Less than $250 million –0.1594 –0.2157 –0.2347 –0.2362(0.0080)** (0.0111)** (0.0122)** (0.0125)**
$250 million - $1 billion –0.1651 –0.2208 –0.2398 –0.2407(0.0080)** (0.0112)** (0.0122)** (0.0125)**
$1 billion - $10 billion –0.1330 –0.1858 –0.2040 –0.2035(0.0085)** (0.0111)** (0.0122)** (0.0124)**
$10 billion - $100 billion –0.0136 –0.0529 –0.0659 –0.0665(0.0089) (0.0095)** (0.0109)** (0.0108)**
Over $100 billion Baseline
Borrower size
Less than $250 million 0.0784 0.0878 0.0923 0.0738(0.0434) (0.0432)* (0.0433)* (0.0213)**
$250 million - $1 billion Baseline
$1 billion - $10 billion –0.0891 –0.0809 –0.0786 –0.0776(0.0050)** (0.0053)** (0.0052)** (0.0052)**
$10 billion - $100 billion –0.1260 –0.1192 –0.1181 –0.1108(0.0053)** (0.0058)** (0.0054)** (0.0060)**
Over $100 billion –0.1200 –0.1212 –0.1200 –0.1120(0.0062)** (0.0071)** (0.0067)** (0.0072)**
Borrower leverage capital ratio –0.7628 –0.7778 –1.0636 –0.9997 –0.9929 –1.0297(0.0915)** (0.0951)** (0.1006)** (0.1010)** (0.1002)** (0.1017)**
Lender leverage capital ratio –0.4218 –0.4139 0.0674 0.0340 0.0223 0.0263(0.0386)** (0.0381)** (0.0358) (0.0361) (0.0362) (0.0361)
Liquidity 0.0227 0.0119 0.0448 0.0422 0.0430 0.0403(0.0188) (0.0189) (0.0183)* (0.0184)* (0.0182)* (0.0182)*
Note: Robust standard errors in parentheses.
* Significant at 5% level; ** significant at 1% level.
16
Table 4 (cont.)
Spec. 1 Spec. 2 Spec. 3 Spec. 4 Spec. 5 Spec. 6
Transaction size
Less than $10 million Baseline
$10 million - $100 million Not applicable
Over $100 million Not applicable
Business hours duration 0.0150 0.0151 0.0097 0.0096 0.0096 0.0096(0.0006)** (0.0006)** (0.0007)** (0.0007)** (0.0007)** (0.0007)**
Number of trans. in relationship 0.0000(0.0000)**
Log (no. of trans. in relationship) –0.0080 –0.0051 –0.0037(0.0019)** (0.0020)** (0.0020)
Number of days in relationship –0.0010(0.0001)**
Log (no. of days in relationship) –0.0296(0.0023)**
For small borrowers:Number of trans. in relationship –0.0001
(0.0006)Log (no. of trans. in relationship) –0.0062 –0.0082 –0.0091
(0.0144) (0.0144) (0.0144)Number of days in relationship 0.0031
(0.0002)**Log (no. of days in relationship) 0.0420
(0.0027)**
Observations 43,782 43,782 43,782 43,782 43,782 43,782
R-squared 0.28 0.28 0.31 0.32 0.32 0.32
Table 5 gives the results when transactions involving the largest institutions are omitted. Overall, the
explanatory variables do a much better job in explaining the cross-sectional variation in interest rates
for this sample. The R2 for this sample is over 0.5 compared to roughly one-third for the full sample
and all other sub-samples considered. The results for borrowing share are qualitatively and
quantitatively similar to those found for the sample of smaller transactions. For the lending share
variables, evidence of a non-linear relationship appears. In particular, the results suggest that market
power may influence pricing at low levels of market power before the demand curve effect begins to
dominate. For levels of lending market share below 3%, a 1% higher market share correlates with
higher interest rates of around 1 basis point. Unlike the full sample, the measure of liquidity appears
significantly, yet is small in magnitude. What is somewhat striking about this sub-sample of
transactions is that the importance of relationships appears not to be muted by the removal of the
largest institutions.14 That is, relationships with institutions are valuable to small borrowers even if
those relationships are not with the biggest banks.
14These effects are statistically significant at an 8% level.

17
Table 5
Parameter estimates – transactions not involving a large institution
Spec. 1 Spec. 2 Spec. 3 Spec. 4 Spec. 5 Spec. 6
Daily borrower share –2.1744 –0.5241(0.1146)** (0.1318)**
Daily borrower share squared 20.6508 4.2061(1.7315)** (1.9212)*
Daily lender share 3.2983 0.9876(0.1865)** (0.2039)**
Daily lender share squared –35.2470 –13.8331(2.0387)** (2.1218)**
Aggregate borrower share –2.6922 –0.2820 –0.9583(0.0923)** (0.0531)** (0.1064)**
Aggregate borrower share squared 26.7440 8.0928(1.2043)** (1.4549)**
Aggregate lender share 4.9426 –0.1325 1.3971(0.2275)** (0.0642)* (0.2531)**
Aggregate lender share squared –60.6154 –21.0392(2.9905)** (3.1791)**
Lender size
Less than $250 million –0.0666 –0.0658 –0.0719 –0.0692(0.0022)** (0.0026)** (0.0025)** (0.0027)**
$250 million - $1 billion –0.0723 –0.0718 –0.0777 –0.0747(0.0022)** (0.0026)** (0.0024)** (0.0027)**
$1 billion - $10 billion –0.0565 –0.0554 –0.0609 –0.0560(0.0021)** (0.0026)** (0.0024)** (0.0027)**
$10 billion - $100 billion Baseline
Over $100 billion Not applicable
Borrower size
Less than $250 million Baseline
$250 million - $1 billion –0.0788 –0.0819 –0.0850 –0.0537(0.0458) (0.0458) (0.0457) (0.0216)*
$1 billion - $10 billion –0.2060 –0.2065 –0.2097 –0.1770(0.0459)** (0.0460)** (0.0459)** (0.0216)**
$10 billion - $100 billion –0.2382 –0.2344 –0.2382 –0.2024(0.0457)** (0.0458)** (0.0457)** (0.0215)**
Over $100 billion Not applicable
Borrower leverage capital ratio –0.4233 –0.4445 –0.6326 –0.6397 –0.6229 –0.6312(0.0584)** (0.0592)** (0.0608)** (0.0610)** (0.0608)** (0.0602)**
Lender leverage capital ratio –0.2493 –0.2322 –0.0900 –0.0921 –0.0962 –0.0901(0.0156)** (0.0154)** (0.0147)** (0.0150)** (0.0147)** (0.0148)**
Liquidity 0.0120 0.0051 0.0175 0.0176 0.0182 0.0179(0.0085) (0.0085) (0.0080)* (0.0082)* (0.0081)* (0.0081)*
Note: Robust standard errors in parentheses.
* Significant at 5% level; ** significant at 1% level.

18
Table 5 (cont.)
Spec. 1 Spec. 2 Spec. 3 Spec. 4 Spec. 5 Spec. 6
Transaction size
Less than $10 million –0.0143 –0.0141 –0.0079 –0.0102 –0.0106 –0.0084(0.0032)** (0.0032)** (0.0031)* (0.0033)** (0.0033)** (0.0034)*
$10 million - $100 million 0.0125 0.0099 0.0296 0.0260 0.0268 0.0270(0.0028)** (0.0028)** (0.0026)** (0.0027)** (0.0028)** (0.0028)**
Over $100 billion Baseline
Business hours duration 0.0126 0.0124 0.0093 0.0094 0.0094 0.0093(0.0003)** (0.0003)** (0.0003)** (0.0003)** (0.0003)** (0.0003)**
Number of trans. in relationship 0.0000(0.0000)**
Log (no. of trans. in relationship) –0.0083 –0.0073 –0.0063(0.0008)** (0.0009)** (0.0009)**
Number of days in relationship –0.0007(0.0000)**
Log (no. of days in relationship) –0.0160(0.0010)**
For small borrowers:
Number of trans. in relationship –0.0014(0.0005)*
Log (no. of trans. in relationship) –0.0249 –0.0252 –0.0263(0.0148) (0.0148) (0.0147)
Number of days in relationship 0.0024(0.0002)**
Log (no. of days in relationship) 0.0348(0.0022)**
Observations 70,010 70,010 70,010 70,010 70,010 70,010
R-squared 0.50 0.50 0.53 0.53 0.53 0.53
Table 6 explores whether pricing in the federal funds market is noticeably different on reserve
settlement days. As described in Furfine (1998a), Hamilton (1996) and Spindt and Hoffmeister (1988),
such days are also those on which the effective funds rate tends to be higher. The results in Table 6
suggest, however, that no major differences in how transactions are priced can be found on settlement
days. In most specifications, the lending share of the participating bank is a less significant
determinant of pricing, although in economic terms the differences are slight. Relative to the full
sample, the size of the lender appears less important but the size of the borrower seems more
important. Borrower leverage, too, seems to be a less significant determinant of pricing, while duration
of the transaction seems to be marginally more important.
Given that only small changes are uncovered in the estimated impact of the economic variables on
pricing on settlement days, there must be an alternative explanation for the higher rates of interest on
such days. That is, if the pricing of a given transaction does not significantly change on settlement
days, the transactions themselves must change. In particular, the data show a noticeable difference in
the distribution of participants in the market on settlement days. In particular, the two largest
categories of banks are more active sellers on settlement days, and this, combined with the relatively

19
higher interest rates that such institutions get when selling funds, can produce a noticeably higher
value-weighted average interest rate on these days.
Table 6
Parameter estimates – all transactions on reserve settlement days
Spec. 1 Spec. 2 Spec. 3 Spec. 4 Spec. 5 Spec. 6
Daily borrower share –0.8630 –0.4117(0.1371)** (0.1501)**
Daily borrower share squared 5.4319 2.1322(0.8215)** (0.8763)*
Daily lender share 0.4764 –0.8835(0.1171)** (0.1650)**
Daily lender share squared –2.1341 4.9613(0.8558)* (0.9707)**
Aggregate borrower share –1.2342 –0.0333 –0.6604(0.1548)** (0.0418) (0.1595)**
Aggregate borrower share squared 7.9591 3.5318(0.9588)** (0.9903)**
Aggregate lender share 0.8526 –0.1388 –0.5707(0.1420)** (0.0817) (0.2012)**
Aggregate lender share squared –5.2509 3.0258(1.2132)** (1.3951)*
Lender size
Less than $250 million 0.0134 0.0130 0.0134 0.0130(0.0035)** (0.0035)** (0.0035)** (0.0034)**
$250 million - $1 billion Baseline
$1 billion - $10 billion 0.0254 0.0269 0.0256 0.0246(0.0040)** (0.0041)** (0.0041)** (0.0041)**
$10 billion - $100 billion 0.0622 0.0749 0.0648 0.0705(0.0052)** (0.0059)** (0.0055)** (0.0062)**
Over $100 billion 0.0571 0.0806 0.0647 0.0726(0.0056)** (0.0079)** (0.0080)** (0.0085)**
Borrower size
Less than $250 million 0.0777 0.0898 0.0814 0.0327(0.0439) (0.0442)* (0.0440) (0.0307)
$250 million - $1 billion Baseline
$1 billion - $10 billion –0.1401 –0.1349 –0.1391 –0.1333(0.0108)** (0.0108)** (0.0109)** (0.0108)**
$10 billion - $100 billion –0.1873 –0.1770 –0.1859 –0.1722(0.0105)** (0.0107)** (0.0105)** (0.0107)**
Over $100 billion –0.1841 –0.1725 –0.1814 –0.1675(0.0110)** (0.0113)** (0.0112)** (0.0113)**
Borrower leverage capital ratio –0.1629 –0.0938 –0.5109 –0.4868 –0.5161 –0.4768(0.1200) (0.1209) (0.1256)** (0.1265)** (0.1259)** (0.1277)**
Lender leverage capital ratio –0.3268 –0.2894 –0.0629 –0.1031 –0.0761 –0.0796(0.0483)** (0.0484)** (0.0469) (0.0478)* (0.0474) (0.0479)
Liquidity 0.0510 0.0497 0.0594 0.0650 0.0620 0.0619(0.0189)** (0.0190)** (0.0184)** (0.0184)** (0.0185)** (0.0184)**
Note: Robust standard errors in parentheses.
* Significant at 5% level; ** significant at 1% level.

20
Table 6 (cont.)
Spec. 1 Spec. 2 Spec. 3 Spec. 4 Spec. 5 Spec. 6
Transaction size
Less than $10 million –0.0235 –0.0232 –0.0175 –0.0210 –0.0200 –0.0202(0.0066)** (0.0067)** (0.0065)** (0.0067)** (0.0068)** (0.0068)**
$10 million - $100 million 0.0116 0.0108 0.0209 0.0184 0.0186 0.0185(0.0059) (0.0060) (0.0058)** (0.0060)** (0.0060)** (0.0061)**
Over $100 million Baseline
Business hours duration 0.0124 0.0124 0.0097 0.0099 0.0098 0.0100(0.0007)** (0.0007)** (0.0007)** (0.0007)** (0.0007)** (0.0007)**
Number of trans. in relationship 0.0000(0.0000)**
Log (no. of trans. in relationship) 0.0024 0.0064 0.0036(0.0014) (0.0017)** (0.0016)*
Number of days in relationship –0.0002(0.0001)**
Log (no. of days in relationship) –0.0052(0.0023)*
For small borrowers:
Number of trans. in relationship –0.0015(0.0007)*
Log (no. of trans. in relationship) –0.0314 –0.0344 –0.0322(0.0128)* (0.0129)** (0.0128)*
Number of days in relationship 0.0021(0.0004)**
Log (no. of days in relationship) 0.0350(0.0058)**
Observations 11,241 11,241 11,241 11,241 11,241 11,241
R-squared 0.31 0.31 0.35 0.36 0.35 0.36
5. Conclusions
The analysis of this paper demonstrates that individual loan pricing decisions are important, even
when the loan lasts only overnight and is to another financial institution. The evidence suggests that
the relative importance of the participating institution, in terms of both market share and asset size, is
related strongly to federal funds interest rates. Risk-based pricing was discovered, as was pricing
behavior effectively equivalent to an intraday interbank loan market. Finally, evidence of relationship
banking was found to be especially strong when a borrowing bank is relatively small.

21
References
Allen, Linda and Anthony Saunders (1986): “The Large-Small Bank Dichotomy in the Federal FundsMarket”. Journal of Banking and Finance, Vol. 10, pp. 219-30.
Angbazo, Lazarus A (1997): “Commercial Bank Net Interest Margins, Default Risk, Interest-RateRisk, and Off Balance Sheet Banking”. Journal of Banking and Finance, Vol. 21, pp. 55-87.
Avery, Robert B and Allen N Berger (1991): “Loan Commitments and Bank Risk Exposure”. Journalof Banking and Finance, Vol. 15, pp. 173-92.
Barro, Robert J (1976): “The Loan Market, Collateral and Rates of Interest”. Journal of Money,Credit, and Banking, Vol. 8, pp. 439-56.
Berger, Allen N and Gregory F Udell (1995): “Relationship Lending and Lines of Credit in SmallFirm Finance”. Journal of Business, Vol. 68, pp. 351-81.
Berger, Allen N and Gregory F Udell (1990): “Collateral, Loan Quality, and Bank Risk”. Journal ofMonetary Economics, Vol. 25, pp. 21-42.
Berlin, M (1987): “Loan Commitments: Insurance Contracts in a Risky World”. Federal Reserve Bankof Philadelphia Business Review, pp. 3-12.
Bernanke, Ben S and Alan S Blinder (1992): “The Federal Funds Rate and the Channels of MonetaryTransmission”. American Economic Review, Vol. 82, pp. 901-21.
Besanko, D and Anjan Thakor (1987): “Collateral and Rationing: Sorting Equilibria in Monopolisticand Competitive Credit Markets”. International Economic Review, Vol. 28, pp. 671-89.
Bollerslev, Tim, Ian Domowitz and Jianxin Wang (1997): “Order Flow and the Bid-Ask Spread: AnEmpirical Probability Model of Screen-Based Trading”. Journal of Economic Dynamics and Control,Vol. 21, pp. 1471-91.
Boot, Arnoud and Anjan V Thakor (1994): “Moral Hazard and Secured Lending in an InfinitelyRepeated Credit Market Game”. International Economic Review, Vol. 35, pp. 899-920.
Boot, Arnoud, Anjan V Thakor and Gregory F Udell (1987): “Competition, Risk Neutrality, and LoanCommitments”. Journal of Banking and Finance, Vol. 11, pp. 449-72.
Booth, James R and Lena Chua (1995): “Structure and Pricing of Large Bank Loans”. FederalReserve Bank of San Francisco Economic Review, No. 3, pp. 52-62.
Carey, Mark S, Mitch Post and Steven A Sharpe (1998): “Does Corporate Lending by Banks andFinance Companies Differ? Evidence on Specialization in Private Debt Contracting”. Journal ofFinance, 53, pp. 845-78.
Carey, Mark S, S Prowse, J Rea and G Udell (1993): “The Economics of Private Placements: A NewLook”. Financial Markets, Institutions, and Instruments, Vol. 2, pp. 1-66.
Cooperman, Elizabeth S, Winson B Lee and James P Lesage (1991): “Geographical Integration andthe Retail CD-Pricing Decisions of Large Depository Institutions”. The Review of Economics andStatistics, pp. 546-52.
Cooperman, Elizabeth S, Winson B Lee and James P Lesage (1990): “Commercial Bank and ThriftInterdependence and Local Market Competition for Retail Certificates of Deposit”. Journal ofFinancial Services Research, Vol. 4, pp. 37-51.
Diamond, Douglas W (1984): “Financial Intermediation and Delegated Monitoring”. Review ofEconomic Studies, Vol. 51, pp. 393-414.
Duca, John V and Stuart S Rosenthal (1994): “Do Mortgage Rates Vary Based on Household DefaultCharacteristics? Evidence on Rate Sorting and Credit Rationing”. Journal of Real Estate Finance andEconomics, Vol. 8, pp. 99-113.

22
Ellis, David M and Mark J Flannery (1992): “Does the Debt Market Assess Large Banks’ Risk? TimeSeries Evidence from Money Center CDs”. Journal of Monetary Economics, Vol. 30, pp. 481-502.
Feinman, Joshua (1993): “Estimating the Open Market Desk’s Daily Reaction Function”. Journal ofMoney, Credit, and Banking, Vol. 25, pp. 231-47.
Fergus, James T and Frank E Nothaft (1995): “Spatial Variation in Construction Loan Pricing atCommercial Banks”. Journal of Housing Economics, Vol. 4, pp. 118-35.
Flannery, Mark J and Sorin M Sorescu (1996): “Evidence of Bank Market Discipline in SubordinatedDebenture Yields: 1983-1991”. Journal of Finance, Vol. 51, pp. 1347-77.
French, Kenneth R and Richard Roll (1986): “Stock Return Variances: The Arrival of Information andthe Reaction of Traders”. Journal of Financial Economics, Vol. 17, pp. 5-26.
Furfine, Craig H (1998a): “Interbank Payments and the Daily Federal Funds Rate”. Federal ReserveBoard of Governors Finance and Economics Discussion Series No. 1998-31.
Furfine, Craig H (1998b): “The Microstructure of the Federal Funds Market”. Mimeo, Bank forInternational Settlements.
Greenbaum, Stuart I, George Kanatas and Itzhak Venezia (1989): “Equilibrium Loan Pricing Underthe Bank-Client Relationship”. Journal of Banking and Finance, Vol. 13, pp. 221-35.
Hamilton, James D (1996): “The Daily Market for Federal Funds”. Journal of Political Economy, Vol.104, pp. 26-56.
Hannan, Timothy H (1997): “Market Share Inequality, the Number of Competitors, and the HHI: AnExamination of Bank Pricing”. Review of Industrial Organization, Vol. 12, pp. 23-35.
Hannan, Timothy H and Gerald A Hanweck (1988): “Bank Insolvency Risk and the Market for LargeCertificates of Deposit”. Journal of Money, Credit, and Banking, Vol. 2, pp. 203-12.
Ho, Thomas S Y and Anthony Saunders (1981): “The Determinants of Bank Interest Margins: Theoryand Empirical Evidence”. Journal of Financial and Quantitative Analysis, Vol. 16, pp. 581-600.
Huang, Roger D and Ronald W Masulis (1996): “FX Spreads and Dealer Competition Across the 24Hour Trading Day”. Owen Graduate School of Management Vanderbilt University working paper.
Kanatas, George (1987): “Commercial Paper, Bank Reserve Requirements, and the Informational Roleof Loan Commitments”. Journal of Banking and Finance, Vol. 11, 3, pp. 425-48.
Madura, Jeff and Emilio R Zarruk (1992): “Optimal Bank Interest Margin under Capital Regulationand Deposit Insurance”. Journal of Financial and Quantitative Analysis, Vol. 27, pp. 143-9.
Magage, Neela D (1990): “Interest Rate Ceilings and the Role of Security and Collection Remedies inLoan Contracts”. Economic Inquiry, Vol. 28, pp. 317-34.
Morgan, Donald P (1994): “Bank Credit Commitments, Credit Rationing, and Monetary Policy”.Journal of Money, Credit, and Banking, Vol. 26, pp. 87-101.
Petersen, Mitchell A and Raghuram G Rajan (1994): “The Benefits of Lending Relationships:Evidence from Small Business Data”. Journal of Finance, Vol. 49, pp. 3-37.
Petersen, Mitchell A and Raghuram G Rajan (1995): “The Effect of Credit Market Competition onLending Relationships”. Quarterly Journal of Economics, Vol. 110, pp. 407-43.
Peiers, Bettina (1997): “Informed Traders, Intervention, and Price Leadership: A Deeper View of theMicrostructure of the Foreign Exchange Market”. Journal of Finance, Vol. 52, pp. 1589-614.
Rhoades, Stephen A (1995): “Market Share Inequality, the HHI, and other Measures of the FirmComposition of a Market”. Review of Industrial Organization, Vol. 10, pp. 657-74.
Richards, Heidi W (1995): “Daylight Overdraft Fees and the Federal Reserve’s Payment System RiskPolicy”. Federal Reserve Bulletin, Vol. 81, pp. 1065-77.

23
Rudebusch, Glenn D (1995): “Federal Reserve Interest Rate Targeting, Rational Expectations, and theTerm Structure”. Journal of Monetary Economics, Vol. 35, pp. 245-74.
Sharpe, Steven A (1990): “Asymmetric Information, Bank Lending, and Implicit Contracts: AStylized Model of Customer Relationships”. Journal of Finance, Vol. 45, pp. 1069-87.
Spindt, Paul A and J Ronald Hoffmeister (1988): “The Micromechanics of the Federal Funds Market:Implications for Day-of-the-Week Effects in Funds Rate Variability”. Journal of Financial andQuantitative Analysis, Vol. 23, pp. 401-16.
Stigum, Marcia (1990): The Money Market, 3rd ed., Dow Jones-Irwin, Homewood, Illinois.
Thakor, Anjan V and Gregory F Udell (1987): “An Economic Rationale for the Pricing Structure ofBank Loan Commitments”. Journal of Banking and Finance, Vol. 11, pp. 271-89.
Thakor, Anjan V (1982): “Toward a Theory of Bank Loan Commitments”. Journal of Banking andFinance, Vol. 6, pp. 55-84.
Wong, Kit Pong (1997): “On the Determinants of Bank Interest Margins Under Credit and InterestRate Risks”. Journal of Banking and Finance, Vol. 21, pp. 251-71.


Recent BIS Working Papers
No. Title Author
46September 1997
Global asset allocation in fixed income markets SrichanderRamaswamy
47September 1997
Financial asset prices and monetary policy: theory andevidence
Frank Smets
48September 1997
Some multi-country evidence on the effects of realexchange rates on output
Steven B Kaminand Marc Klau
49September 1997
Why does the yield curve predict economic activity?Dissecting the evidence for Germany and the United States
Frank Smets andKostas Tsatsaronis
50November 1997
The euro and the dollar Robert N McCauley
51November 1997
Forecast errors and financial developments Palle S Andersen
52January 1998
Inflation and disinflation in Iceland Palle S Andersen andMár Guðmundsson
53March 1998
Exchange rate regimes and inflation and output inSub-Saharan countries
Marc Klau
54June 1998
The coming transformation of continental Europeanbanking?
William R White
55June 1998
Spread overreaction in international bond markets Gregory D Sutton
56June 1998
Commercial banks in the securities business: a review João A C Santos
57July 1998
One-step prediction of financial time-series SrichanderRamaswamy
58November 1998
The importance of bank seniority for relationshiplending
Stanley D Longhoferand João A C Santos
59November 1998
Portfolio selection using fuzzy decision theory SrichanderRamaswamy
60November 1998
Output gap uncertainty: does it matter for the Taylorrule?
Frank Smets
61November 1998
Foreign direct investment and employment in theindustrial countries
P S Andersenand P Hainaut


ISSN 1020-0959