do social ties between external auditors and audit ... · pdf filedo social ties between...
TRANSCRIPT

Do social ties between external auditors and audit committee
members affect audit quality?*
Xianjie He School of Accountancy, Shanghai University of Finance and Economics
Jeffrey Pittman Faculty of Business Administration, Memorial University of Newfoundland
Oliver M. Rui China Europe International Business School (CEIBS)
Donghui Wu School of Accountancy, The Chinese University of Hong Kong
Abstract
We examine whether social ties between engagement auditors and audit committee members shape audit outcomes. Although these social ties can facilitate information transfer and help auditors mitigate management pressure to waive correction of detected misstatements, cozy interpersonal relations can undermine auditors’ monitoring of the financial reporting process. We measure social ties by alma mater connections and audit quality by the propensity to render modified audit opinions, earnings restatements, regulatory sanctions in the event of accounting irregularities, and firm valuation. Our evidence implies that school ties between engagement auditors and audit committee members impair audit quality. In evidence supporting another prediction, we generally find that this relation is concentrated where social ties⎯evident in a connected audit committee member chairing the committee, having an accounting background, or graduating from the same school/department as an engagement auditor⎯are more salient. Consistent with favoritism stemming from social networks, we also report evidence suggesting that audit fees are higher in the presence of social ties between an engagement auditor and the audit committee with this impact concentrated in firms with particularly close auditor-audit committee social links. Collectively, our analysis lends support to the narrative that the negative implications⎯namely, worse audit quality and higher audit fees⎯of these social ties outweigh any benefits.
Key words: Social ties, External auditors, Audit committee
* We would like to thank Ferdi Gul, Xijia Su, and workshop participants at Shanghai University of Finance and Economics, The University of Hong Kong, and Xiamen University for their very helpful comments and suggestions.

1
1. Introduction
A burgeoning literature documents that social networks influence economic agents’
behavior and, in turn, economic outcomes in the context of corporate governance. External
auditing has evolved into an important governance mechanism for reducing agency costs
(Watts and Zimmerman 1986). In selecting outside auditors and overseeing the external audit
function, the audit committee serves as a bridge between firm management and outside
auditors. In this paper, we examine the importance of social ties between an engagement
auditor and audit committee members to audit outcomes.1
As illustrated in Figure 1, firm management can affect external auditing by exerting
influence over connected external auditors via linkage A or audit committee members via
linkage B. A number of papers have investigated how the interpersonal links between firm
management and external auditors (linkage A) affect audit outcomes. Lennox (2005), Menon
and William (2004), and Baber et al. (2013) show that firm executives’ affiliation with CPA firms
stemming from their working experience impairs audit and earnings quality in the U.S.
However, some research implies that such revolving door hiring practices do not threaten
auditor independence and may even improve audit quality (Geiger et al. 2008; Naiker and
Sharma 2009; Naiker et al. 2013). Additionally, two recent studies focus on manager-auditor
ties formed by educational backgrounds, a more generic form of connection, but with mixed
evidence. Kwon and Yi (2012) document that CEO-partner school ties are associated with
better accrual quality and higher audit fees in Korea, whereas Guan et al. (2014) find that
common educational backgrounds of engagement auditors and client top executives generally
reduce audit quality in China.
Insert Figure 1 here.
Partly motivated by the regulatory concern that reduced audit committee independence
1 In this study, we use the term “engagement auditors” rather than “partners” to refer to the individual auditors who perform the audits and sign the audit reports. China diverges from most other countries in that the signatory auditors need not be partners. According to China’s Independent Auditing Standards No. 7 – Audit Report (MOF 1995a), engagement auditors should sign the audit reports in order to clarify the responsibility of the audits conducted by them. In practice, individual auditors are explicitly accountable for audit reports issued in their names. For example, regulatory sanctions for discovered audit failures are always imposed on the individual signatory auditors involved (Chen et al. 2010; Gul et al. 2013).
2
from management may negatively affect its effectiveness in monitoring the financial reporting
process, there is considerable research examining whether audit committee members’ formal
ties, typically defined as financial/familial ties, with management (linkage B) influence audit
committee oversight quality (e.g., Carcello and Neal 2000, 2003; Klein 2002; Bédard et al. 2004;
Agrawal and Chadha 2005; Krishnan 2005; and Lennox and Park 2007). Generally, this line of
research suggests that more independent audit committees are associated with better outcomes
such as more conservative audit reporting, better financial reporting quality, and fewer internal
control weaknesses. More recently, researchers have begun to examine how informal ties,
including social connections between firm management and audit committee members, shape
accounting transparency. Hwang and Kim (2012) and Bruynseels and Cardinaels (2013) report
that such links are negatively associated with audit or financial reporting quality, indicating
weaker oversight provided by audit committees in the presence of social network connections.
However, there is hardly any research on whether economic outcomes vary systematically
with how external engagement auditors interact with audit committee members (via linkage C
in Figure 1).2 This issue is interesting as both external auditing and the audit committee are
important governance structures intended to protect the integrity of firms’ accounting numbers.
Moreover, auditors may rely on information generated by audit committees in making audit
decisions. For example, the Public Company Accounting Oversight Board (PCAOB) Auditing
Standard No. 5 (AS5) encourages external auditors (EAs) to turn to the internal audit function
(IAF) when the internal audit activities meet certain criteria and the EAs would find efficiencies
in using their work (PCAOB 2007). This has been echoed by the PCAOB’s recent adoption of
Auditing Standard No. 16 (AS16), which further requires the auditor to obtain information
relevant to the audit from the audit committee (PCAOB 2012). The importance of this issue
has been reflected in a recent review article by Bame-Aldred et al. (2013: 253, emphasis in
original):
Research has begun answering several important questions related to the effects of EAs reliance on IAFs (e.g., litigation risk, audit efficiency, and audit fees). However, there is a
2 Poor data availability is at least partly behind research in this area remaining scarce. Data for the individual auditors handling the audit engagements and their demographic information are not publicly available in the U.S. or the vast majority of other countries. In this situation, data constraints prevent the identification of social networks between the engagement auditor and board members from public sources.

3
paucity of research concerning the effects of EAs reliance on IAF in terms of external audit quality. Given the criticality of this effect, and the PCAOB’s interest in determining the extent to which EAs reliance on IAF can either enhance or diminish audit quality, we encourage researchers to focus on this area in particular.
Similarly, in comprehensively surveying recent archival auditing research, DeFond and
Zhang (2013: 6) observe that prior studies seldom examine demand-side factors, and call for
more evidence on the role that auditor-audit committee interactions play in audit quality:
[W]hile there is a thriving literature on the economic characteristics of audit committees, relatively little is known about whether or how audit committees actually affect the client’s financial reporting function, or how they interact with the outside auditor.
Social ties between audit committee members and auditors could affect audit quality in one
of two competing ways. On one hand, social ties could impede audit committee members and
engagement auditors from exercising due diligence in their mutual monitoring during the
external audit process, translating into lower quality audits. Intimacy between engagement
auditors and audit committee members can also lead to auditors’ unwarranted trust in
information provided by audit committees, injecting unintentional bias into auditors’ judgment
and decision making. On the other hand, by enhancing the trust between audit committee
members and engagement auditors, social ties can facilitate information transfer between the
two parties and reduce errors in auditor judgment. In the presence of a supportive audit
committee, the auditor is in a better position to resist client pressure to waive corrections when
controversial issues in financial reporting arise, leading to better audits.
It follows that the question of whether audit quality would be enhanced or diminished by
social ties between audit committee members and external auditors has to be tackled
empirically. The Chinese market provides an opportune experimental setting to analyze this
issue for several reasons. First, a guanxi (relationship or social-network oriented) culture has
been prevalent in social life and business society throughout Chinese history (Hui and Green
1997; Tsang 1998). Accordingly, the role that social ties among individuals play in economic
activities can be particularly strong (Xin and Pearce 1996), increasing the power of our tests.
Second, engagement auditors are required to sign the audit report in China and are responsible
for decision-making on significant matters in the audit process. Extensive recent research
implies that audit outcomes are significantly influenced by the signing auditors in China (Chen
4
et al. 2010; Firth et al. 2012a; Gul et al. 2013; He et al. 2013). Consequently, Chinese public
firms provide a fertile testing ground for isolating whether social ties influence individual
auditors’ practices. Third, the biographic information on audit committee members is
disclosed publicly in corporate annual reports, and signing auditors’ names and their
demographic data can also be obtained from corporate annual reports and the China Institute of
Certified Public Accountants (CICPA), respectively. We can identify the social ties between
audit committee members and engagement auditors using their demographic data.
After recent research (e.g., Cohen et al. 2008, 2010; Hwang and Kim 2009; Fracassi and Tate
2012), we measure social ties with the alma mater links between engagement auditors and audit
committee (AC) members.3 Consistent with our first prediction, we find that AC-auditor
school ties reduce the auditors’ propensity to issue modified audit opinions (MAOs).
Although MAOs are a direct outcome of the audit process, we confront concerns surrounding
the validity of this audit quality measure by triangulating our analysis with two observable ex
post outcomes that reflect whether the auditor issued an unqualified opinion on materially
deficient financial statements: clients’ earnings restatements and regulatory sanctions in the
event of accounting irregularities.4 Moreover, we consider whether the capital markets reward
in the form of higher valuations firms that refrain from hiring auditors with social ties to the
audit committee. 5 Evidence from examining accounting restatements, frauds, and firm
3 In China, at least two individual auditors are required to sign the audit reports issued to public companies. We consider all signatory auditors of an audit report in measuring the AC-auditor school ties because all signatory auditors are accountable for audit reports issued. This measurement is also consistent with prior China studies analyzing individual auditor level data (e.g., Chen et al. 2010; Firth et al. 2012a; Gul et al. 2013; He et al. 2013). 4 In contrast to the auditor’s opinion formulation, earnings-based measures for our purposes may suffer from amounting to the joint product of management and auditor decisions (e.g., Francis 2011). Given that the general earnings management construct is very difficult to reliably measure (e.g., Dechow et al. 1995, 2010; Guay et al. 1996; Healy and Wahlen 1999; Hribar and Collins 2002), we follow Ball’s (2009) advice to avoid the limitations inherent in gauging earnings management with discretionary accruals by focusing on more extreme forms of corporate misreporting that violate generally accepted accounting principles (Miller 2006; Lennox et al. 2013). However, in an important downside, our three discrete dependent variables⎯namely, MAOs, restatements, and regulatory sanctions⎯may fail to reflect subtler within-GAAP variations in audit quality. In the other direction, the advantages of these proxies include that they more directly capture audit quality and admit only minimal measurement error (DeFond and Zhang 2013). 5 Consistent with strict external monitoring narrowing outside investors’ information asymmetry, prior research implies that firms that appoint high-quality auditors attract higher valuations (e.g., Fan and Wong 2005; Guedhami et al. 2014).

5
valuations corroborates our MAO results, reinforcing the inference that school ties between
engagement auditors and AC members undermine audit quality. In results lending support to
another prediction, we also generally find that the importance of these school ties to audit
quality is concentrated in firms with more salient links evident in a connected AC member
chairing the committee, having an accounting background, or having graduated from the same
department/school as an engagement auditor. Additionally, in evidence consistent with
favoritism triggered by the social network, we find that audit fee premiums are higher in the
presence of AC-auditor school ties, especially when a connected AC member chairs the
committee, has an accounting background, or receives their education from the same
department/school as an engagement auditor.
This study advances our understanding of the determinants of audit committee oversight
effectiveness. In some ways, the audit committee serves as a bridge between firm
management and the external auditors. There is ample evidence on one side of this bridge
with several papers focusing on the relation between the audit committee and management.
In sharp contrast, we are not aware of any archival research exploring how social networks
between engagement auditors and audit committee members operate on the other side of this
bridge. Beasley et al. (2009) conduct extensive interviews with 42 audit committee members to
examine their activities in six areas, including the external audit process. Complementing
Beasley et al.’s interview approach, we provide archival evidence on how social network
connections influence the interaction between audit committee members and engagement
auditors in the financial reporting process. Naiker and Sharma (2009) find that the presence of
former audit partners on the audit committee is associated with fewer internal control
weaknesses. Our research differs from theirs in two main respects. First, we evaluate how
the connection between a current engagement auditor and the audit committee impacts audit
quality whereas Naiker and Sharma’s (2009) analysis is based on potential connections between
former audit partners and current audit teams. Second, in Naiker and Sharma’s (2009) setting,
the connections are forged through audit committee members’ employment history in the audit
firm, meaning that the effect can be attributed to superior knowledge and expertise acquired
through these members’ work experience. Given that our evidence is based on a more generic
form of connection, school ties, it is constructive for isolating whether social links between
6
external auditors and audit committee members shape audit quality.6
Our analysis also contributes to the public policy discourse. Considerable regulatory
attention has been devoted to the importance of audit committee independence from firm
management. In comparison, the independence of the audit committee from the outside
auditor has largely been taken for granted in regulatory policy circles. Our large-sample
evidence suggests that the informal personal ties between the audit committee and engagement
auditors also matter.7 In theory, such informal ties could strengthen or weaken audit quality.
We show that, in terms of both audit quality and fees, the costs of social links between audit
committee members and engagement auditors outweigh their benefits. Reflecting its
first-order economic materiality, the presence of AC-auditor school ties translates into the
likelihood of receiving an MAO falling by about 33% according to our coefficient estimates.
These results are particularly relevant in light of auditing standard setters’ call for external
auditors’ reliance on information provided by audit committees (e.g., PCAOB 2007; 2012). Our
evidence also suggests that, apart from formal ties based on financial or familial affiliations,
disclosure of informal ties between engagement auditors and audit committee members would
benefit outside users in gauging the quality of audited financial reports.
From a policy standpoint, our research also coarsely informs the debate on whether
compelling audit firms to divulge the identity of the engagement auditor would improve
accounting transparency. For example, the PCAOB (2013) in the U.S. has proposed mandating
this disclosure, which is already required under the European Union’s Eighth Company Law
Directive (2006).8 Although it would be premature to draw firm policy conclusions at this
6 For example, our analysis avoids identification complications stemming from client knowledge of current audit strategies that can increase the likelihood that audits fail to detect misstatements. 7 Focusing on the individual auditor level may be highly relevant to protecting auditor independence. For example, even when there are no independence complications at the office or firm level, engagement auditors may experience independence threats (e.g., Chen et al. 2010). Similarly, a client may be material to the compensation or career concerns of an engagement auditor even when that client is immaterial from an office or firm level perspective (Cohen and Trompeter 1998; Moore et al. 2006; Nelson 2006). Additionally, prior research stresses that the close nature of their interactions can be conducive to clients inappropriately influencing engagement auditors’ judgments (Hackenbrack and Nelson 1996; Bazerman et al. 1997). Finally, the greater accountability that accompanies identifying the engagement auditor may lower the incidence of engagement auditors succumbing to client pressure in negotiations on proposed audit adjustments (DeZoort et al. 2006). 8 In reproposing amendments to its audit standards that would require audit firms to disclose the engagement partner’s identity, the PCAOB (2013) summarized its rationale. Linking to our focus on
7
early stage⎯particularly when relying on evidence from another country with, for example, far
different public and private enforcement institutions governing auditor discipline (e.g., Allen et
al. 2005; Chen et al. 2007; Jiang et al. 2010; He et al. 2013)⎯our results lend some initial support
to the intuition that revealing the identity of the engagement auditor would provide valuable
information to the capital markets.9
In response to calls for research on this issue (e.g., DeFond and Francis 2005; Nelson and
Tan 2005; Church et al. 2008; Francis 2011), recent evidence implies that audit outcomes hinge
on individual auditor characteristics (e.g., Carey and Simnett 2006; Chi et al. 2009; Zerni 2012;
Carcello and Li 2013; Gul et al. 2013; Knechel et al. 2013a, 2013b). Our analysis extends this
research to include the role of social connections between the engagement auditor and audit
committees, helping to empirically clarify whether audit quality varies with “the socioeconomic
characteristics of audit partners and audit team members” (DeFond and Zhang 2013: 85).10
This evidence may benefit audit firms eager to improve their performance by, for example,
reallocating their quality control resources to ensure that auditors with alma mater social ties to
audit committee members are reassigned to other clients (Francis and Michas 2013; Knechel et
al. 2013b).
The rest of this paper is organized as follows. In the next section, we develop the
motivation for our testable predictions. Section 3 describes the research methods. Section 4
covers the sample and data used in the analysis. Section 5 outlines the empirical evidence and
Section 6 concludes.
individuals’ social histories, Martin Baumann, PCAOB Chief Auditor and Director of Professional Standards, highlighted that: “Over time, investors will benefit from knowing the identity of the engagement partner and being able to obtain an understanding of an engagement partner’s history when evaluating the audit.” 9 Besides the potential policy implications for other jurisdictions, China’s experience with identifying engagement auditors is interesting in its own right given the importance of the country’s capital markets. 10 In additional motivation for our research questions, DeFond and Zhang (2013: 97) call for research that “[identifies] new audit committee characteristics that have important implications for audit quality. This would essentially build on the current literature that examines the personal and social characteristics of board members in the governance literature more generally.”
8
2. Hypothesis development
2.1 Social networks and economic efficiency
The embeddedness theory developed by Granovetter (1985) emphasizes the importance of
social relations in analyzing economic activities in modern industrial society. However, by
atomizing economic agents’ behavior, classical and neo-classical economics do not consider
these social relations in depth. Indeed, research on how social networks influence corporate
governance has only gained momentum in recent years. Generally, this line of the literature
suggests that social networks can enhance or jeopardize economic efficiency, depending on the
research setting.
Since much information about economic activities can be subtle and difficult to verify,
concrete social relations generate trust between people and encourage cooperation (Granovetter
2005). In the context of corporate governance, Engelberg et al. (2012) show that the presence of
interpersonal links between firm and bank managers leads to cheaper loan financing; moreover,
the connected deal is followed by better future firm performance, suggesting that social
networks improve monitoring by facilitating the exchange of information between lenders and
borrowers. Similarly, Schmidt (2009) finds that stronger social connections between CEOs and
independent board directors are associated with higher bidder announcement returns during
mergers and acquisitions when the company has greater demand for boards’ advisory services.
Reinforcing the presence of better information flow between socially connected individuals,
Cohen et al. (2008, 2010) document that Wall Street money managers and financial analysts
benefit from their social ties with managers of public firms.
Although social networks facilitate information sharing between economic agents, board
directors could exploit their information advantages to help firm management but at the
expense of shareholders, resulting in inferior corporate governance. For example, socially
connected boards tend to award CEOs higher compensation and to lower the pay- or
turnover-performance sensitivity (Subrahmanyam 2008; Hwang and Kim 2009; Nguyen 2012);
social ties between corporate executives and the board or audit committee members are
associated with worse earnings management (Krishnan et al. 2011; Hwang and Kim 2012) and
elevate the probability of engaging in financial misconduct (Chidambaran et al. 2012); and social
ties between CEOs and board directors lead to lower firm valuation and more value-destroying

9
investments (Fracassi and Tate 2012). Although Schmidt (2009) documents the benefits of a
friendly board during mergers and acquisitions, he also finds that, when there is a greater need
for board monitoring, firms with stronger CEO-board social connections make poor merger and
acquisition decisions. Relatedly, despite the superior performance of connected mutual fund
managers and financial analysts (Cohen et al. 2008, 2010), Cai et al. (2012) find that the transfer
of privileged information via social ties has an adverse impact on shareholder wealth in the
form of higher trading costs. Collectively, these studies suggest that board performance in
monitoring and disciplining the CEO falls in the presence of social ties.
2.2 Social networks between engagement auditors and audit committee members
Prior research on social networks implies that connections between engagement auditors
and audit committee members can have both positive and negative implications for audit
quality. This tension underlying whether these social ties are, on balance, better or worse for
audit quality helps motivate our research.
In one direction, social ties enhance trust and facilitate information flows between
individuals. In the audit setting, the audit committee possesses specific knowledge of the
company’s accounting system, internal control environment, and even possible violations of
laws or regulations. Although such knowledge would help the auditor to improve their
performance, the information could be sensitive and difficult to transmit. It is well recognized
in social science that social networks enable people to discuss sensitive issues that would
otherwise not be shared (e.g., Sias and Cahill 1998; Gibbons 2004). In the presence of personal
connections, audit committee members are likely to be candid with engagement auditors,
sharing and discussing significant matters related to the audit and the financial statements. In
a field study, Rennie et al. (2010) find that client management representative’s openness of
communication is essential to the efficient and effective conduct of an audit. In a similar vein,
the auditor’s trust in audit committee members who are socially connected with them would
enable the auditor to obtain the audit committee’s insights and information about important
transactions and managers’ incentives, leading to higher audit quality.
Another channel through which social networks may positively affect quality is the audit
committee’s support of the external auditor in the event that controversial issues in financial
reporting arise. Previous studies generally suggest that audit committees that are more

10
independent from management are associated with better audit or financial reporting quality.
One explanation is that an independent audit committee could help alleviate management
pressure by supporting the auditor’s position in proposing audit adjustments or issuing a
going-concern report (Carcello and Neal 2000). Since the audit committee is responsible for
appointing auditors, a more independent audit committee also shields auditors from dismissal
after making audit decisions that are unfavorable to management (Carcello and Neal 2003).
Conceivably, interpersonal links between audit committee members and engagement auditors
are likely to strengthen this positive impact. Mapping into DeAngelo’s (1981) theory
characterizing audit quality as the joint probability that the auditor will detect (competence)
and report (independence) material accounting omissions or misstatements, social connections
between the audit committee and engagement auditors may improve audit quality by
stimulating information flows and protecting auditor independence.
In the other direction, like a double-edged sword, cozy interpersonal relations can be
detrimental to monitoring and governance according to some prior social network research.
Extending this argument to the audit setting, the auditor’s personal attachment to the audit
committee may lead to a substandard audit for the following reasons.
First, the audit committee serves as the firm’s primary interface with the external auditor.
It is the committee’s duty to supervise the firm’s internal audit system, to review its internal
control system and financial reports, and to oversee the external audit. Being well acquainted
with audit committee members, an auditor could be reluctant⎯whether consciously or
unconsciously⎯to challenge internal audit or control procedures or financial reporting policies
since a negative opinion on these matters is likely to damage their social links. Likewise, social
pressures could also undermine the audit committee’s oversight over the external audit.
Although the negative effects of concessions will unfold gradually, the consequences of “not
being nice” to a friend are likely to be immediate. Psychology studies find that most people
are far more concerned about immediate effects of their actions (e.g., Loewenstein 1996),
suggesting that the auditor or audit committee are likely to refrain from challenging each other
when they are closely connected. Along these lines, Nelson (2006: 31) stresses: “From a social
perspective, auditors may feel pressure not to disappoint or harm clients (who may be friends
or former colleagues)…”
Second, when sharing a common social background, auditors and audit committee

11
members are more likely to develop homophily, i.e., an affinity for similar others. While
homophily fosters mutual understanding and communications between parties (Bhowmik and
Rogers 1971), it also engenders favoritism bias, i.e., a tendency to interpret similar people’s
actions or information in a favorable way (Uzzi 1996). Such a bias can lower the auditor’s
professional skepticism, resulting in them overly relying on audit evidence collected from
familiar individuals. Behavioral auditing research suggests that trust plays an important role
in the auditor’s judgment, although this may leave them vulnerable to becoming overly
sympathetic to clients.11 For example, auditor-subjects choose a less rigorous audit strategy
when manager-subjects exhibit more trust-attracting behavior (King 2002). Similarly, auditors
who are more trusting of others are less likely to pay attention to audit evidence suggesting
aggressive reporting (Rose 2007). In the audit process, the auditor obtains information from
the audit committee that could be critical to their judgment and opinion formation. The
favoritism bias arising from social ties can lead to auditors’ unwarranted trust in information
provided by audit committees, translating into unintentional bias in auditors’ judgment and
reporting decisions. Consequently, social ties with the audit committee could impede the
auditor from implementing a more rigorous audit process or conducting the audit with due
professional care.
2.3 Hypotheses
It remains an empirical question whether the positive or negative aspects of social
connections between engagement auditors and the audit committee dominate in shaping audit
quality.12 We largely for expositional convenience predict that these social ties translate into
lower audit quality, although some prior research on social networks implies that this relation
could run in the other direction (both hypotheses are stated in alternate form): 11 Relationships that foster a common identity between auditors and their clients may undermine the auditor’s independence. Psychology research on “minimal group paradigm” has shown that it is straightforward to develop a group identity that results in persons favoring their fellow group members (e.g., Tajfel and Turner 1986). Moreover, Thompson (1995) finds that even superficial affiliations with a partisan can translate into persons interpreting ambiguous information in a manner that supports the partisan’s interests. Indeed, Moore et al. (2006) stress that after auditors encode information from a partisan’s perspective, they tend to perceive ambiguous data in ways that are consistent with client preferences (see also Babcock et al. 1995 and Thompson and Loewenstein 1992). 12 Another perspective holds that social connections may be irrelevant to audit quality if the audit firm’s quality control structures, including training programs and policies designed to recruit and retain capable personnel, leave individual auditors with hardly any scope to exercise discretion (e.g., Gul et al. 2013).

12
H1: Audit quality is worse in the presence of social ties between engagement auditors and
audit committee members.
We operationalize the construct of social networks as school ties. People that select the
same schools are likely to have common interests or backgrounds, and the school education
could have further instilled some common thoughts or beliefs into their minds. They also have
opportunities to interact with each other through alumni activities. According to McPherson
et al. (2001), education is one of the strongest forces, next only to ethnicity, age, and religion,
that shapes people’s social worlds. It follows that educational background is an effective basis
for individuals to develop social networks and form homophily (Cohen et al. 2008). We test the
above hypothesis by examining whether the AC-auditor school ties influence audit quality
measures.
In a standard approach for improving identification (e.g., Rajan and Zingales 1998), we next
consider whether the role that social links between engagement auditors and the audit
committee plays in audit quality varies systematically with the importance of these ties. More
specifically, we expect to observe that the impact of social ties rises when a connected audit
committee member chairs the committee, has an accounting background, or graduated from the
same school or department as an engagement auditor. It follows that alma mater ties will
matter more to audit quality in these situations, leading to our second prediction:
H2: The negative audit quality impact of social ties between engagement auditors and audit
committee members will be larger when these ties are more salient.
3. Empirical methods
3.1 Social ties and auditor reporting behavior
To test the importance of social ties between audit committee members and engagement
auditors to audit quality, we examine auditors’ propensity to issue modified audit opinions to
clients. Compared with measures based on attributes of audited financial statements (e.g.,
abnormal accruals or earnings response coefficients), the audit opinion represents a more direct
measure of audit quality since it is directly under the auditor’s control (DeFond and Zhang
2013). Prior research suggests that MAOs have reasonable power to capture variation in audit

13
quality in various research settings in China.13 Accordingly, we follow this research by relying
on auditors’ propensity to render MAOs to gauge audit quality. China’s Independent
Auditing Standards specify four types of audit opinions⎯namely, unqualified, qualified,
disclaimer, and adverse⎯and stipulate that explanatory notes can be used with unqualified
opinions when necessary. We classify auditors’ reports into two categories: (i) clean reports;
and (ii) MAOs that comprise unqualified opinions with explanatory notes, qualified opinions,
and disclaimers.14
It is worth noting that our MAO measure differs from the going-concern modified opinions
(GCOs) typically used in the U.S. auditing literature. Focusing on financially distressed clients,
a GCO-based analysis examines how auditors evaluate whether there is doubt surrounding
their clients’ ability to continue as a going-concern. However, the bankruptcy risk for Chinese
public firms is virtually zero ⎯ since listing status is quite valuable, controlling shareholders
routinely bail out financially distressed listed firms before they reach insolvency (Peng et al.
2011). As far as we know, no Chinese public firm to date has filed for bankruptcy. Another
important difference between the U.S. and China is that a modified opinion due to GAAP
violations is permissible in China. In practice, MAOs could be issued to highly profitable firms
that have questionable accounting practices (see, e.g., Chen et al. 2001; Chen and Yuan 2004).
Consequently, audit opinions in China reflect not only auditors’ evaluation of clients’ financial
condition, but also their judgment on the fairness of the financial statements. It follows that
measuring audit quality with MAOs⎯we later report statistics supporting that there is ample
variation in this proxy⎯suits our research setting.
Audit quality jointly stems from an auditor’s competence and independence according to 13 This stream of empirical research examines the impact of: new auditing standards on auditor independence (DeFond et al. 2000); auditors’ response to clients’ earnings management behavior triggered by accounting-based regulations (Chen et al. 2001); local government ownership on auditors’ reporting decisions (Chan et al. 2006; Wang et al. 2008); improvement in the legal and institutional environment on audit reporting for economically important clients (Chen et al. 2010); changes in audit firm size due to mergers on auditor independence (Chan and Wu 2011); and audit firm organization legal form on auditors’ reporting behavior (Firth et al. 2012b). 14 No client firm in our sample has received an adverse opinion from their auditor. Although the CICPA interprets unqualified opinions with explanatory notes in a manner similar to the “emphasis of matter” in U.S. GAAS, this type of audit report is often issued in lieu of a qualified opinion in China, and previous China-based studies (cited in the preceding footnote) all consider it as a form of audit opinion modification. The CSRC also treats unqualified opinions with explanatory notes the same as qualified opinions in disclosure requirements.

14
DeAngelo’s (1981) theory. In our testing ground, issuing an MAO means that the auditor is
able to discover and report material accounting misstatements, implying that a higher
propensity to render a MAO can usually be interpreted as reflecting higher audit quality. As
stressed in the previous section, social ties between AC members and engagement auditors may
influence audit outcomes in one of two competing ways. On one hand, the closer relationship
suggests that AC members are more forthcoming in sharing information about the firm’s
accounting system with auditors. More efficient information transmission between AC and
auditors should enable the latter to detect irregularities or breaches in the audit process, leading
to a higher likelihood of issuing MAOs. Alternatively, auditors are better able to withstand
client pressure to issue a clean opinion when they are backed by a socially-connected AC. This
could be particularly important in the Chinese context since MAOs can be quite costly to client
management: the stock market reacts negatively to firms’ receipt of MAOs (Chen et al. 2000),
firm managers must explain the underlying reasons for an MAO in the annual report (CSRC
2001a), and the stock exchanges also consider the nature of audit opinions in their delisting
decisions.15 On the other hand, intimacy between engagement auditors and AC members
deters them from challenging each other’s work, reducing the prospect of discovering
irregularities or violations of laws/regulations. Connections can also foster auditors’
unwarranted trust with information provided by the AC, biasing auditors’ judgment and
decision making. As a result, an acquiescent auditor could issue a clean opinion when an
MAO is warranted.
In short, social connections between AC members and engagement auditors could affect
auditors’ propensity to issue MAOs through their impact on auditor competence or
independence, although the net impact remains an empirical question. To examine which
effect ultimately dominates, we estimate the following logistic regression model (client firm and
time subscripts are omitted for simplicity):
MAO = α + β1ACT + β2MGT_Chair/CEO + β3MGT_Other + γCi + δt + ζk + ε, (1)
where MAO is an indicator variable that is equal to one for a modified opinion, and zero
15 According to China’s Company Law and related regulations (CSRC 2001b), a listed firm that has incurred losses in the previous three years must report a profit with a clean audit opinion in the current year to avoid being delisted by the stock exchange.

15
otherwise; ACT is an indicator that is assigned the value one if at least one AC member has
school ties with at least one of the engagement auditors, and zero otherwise; MGT_Chair/CEO is
an indicator variable that is equal to one if the CEO or board chair has school ties with one of
the engagement auditors; MGT_Other is an indicator variable that is set to one if at least one of
the top managers (including board directors other than CEO, board chair, or audit committee
members) has school ties with one of the engagement auditors, and zero otherwise;16 Ci is a
vector of client and auditor characteristics that may affect audit quality; δt and ζk are year and
industry fixed effects, respectively; and ε is the regression error term.
After extensive prior social network research, we consider auditors to be socially connected
with committee members if they have a common college education background. Our key
experimental variable is ACT. Consistent with the above intuition, if auditor competence is
sufficiently enhanced through more effective communications and more efficient information
sharing between engagement auditors and AC members, then the coefficient on ACT would be
positive. In contrast, if auditor independence is sufficiently impaired due to the social
connections, then the coefficient on ACT would be negative. In all estimations, we control for
the school ties between engagement auditors and firms’ top managers and other board directors
given that Kwon and Yi (2012) and Guan et al. (2014) report that these social ties affect audit
quality. In our data, ACT is mildly positively correlated with both MGT_Chair/CEO (ρ = 0.122)
and MGT_Other (ρ = 0.212), likely reflecting the influence of educational networking among
firm managers, AC members, and auditors over the choice of auditors or formation of ACs.17
We therefore control for these two variables so that ACT captures the incremental effect of
auditors’ social connections with AC members.18
We focus on estimating the impact of observable AC-auditor social links on audit quality.
16 We define MGT_Other in this way so that this category and ACT are mutually exclusive. All AC members must sit on the board. If MGT_Other includes AC members that have educational networks with engagement auditors, this variable will be highly correlated with ACT, resulting in the regressions suffering from multicollinearity complications. 17 For example, Lennox and Park (2007) show that having an officer who is an alumnus of an audit firm greatly increases the probability of selecting the officer’s former audit firm over alternative audit firms. 18 ACT is a dichotomous variable. However, we also re-estimate the regressions with a continuous variable, defined as the number of committee members that have school ties with one of the engagement auditors. Untabulated results based on this alternative measure are consistent with those reported in the paper.

16
Consistent with previous research on social networks and governance, the ACT variable is
specified as exogenous in model (1). One concern is the potentially endogenous relation
between audit quality and the presence of socially connected auditors such as audit committees
tending to appoint low-quality but connected auditors. Although such an endogeneity
concern is valid for many auditing studies, it is worth noting that both the AC member and
auditors are hired by the company rather than by each other.19 Another difference is that
auditor selection by client companies occurs at the audit firm level whereas our analysis is
based on individual auditors who conduct the engagements. As far as we can tell, there is no
reason to expect audit firms to assign individual auditors with particular attributes (e.g., more
aggressive) to audit companies where AC-auditor school ties exist. Finally, and perhaps more
importantly, one advantage of school tie data is that the formation of interpersonal connections
via education predates the events being studied by a long time (Cohen et al. 2008, 2010;
Engelberg et al. 2012). Therefore, the observed school ties between AC members and
engagement auditors are largely pre-determined. For the above reasons, any bias stemming
from endogeneity is not likely to pose a material threat to our empirical evidence.
To analyze the impact of social ties with different types of AC members under the
prediction in H2, we also replace ACT with these test variables:
ACT_Chair = An indicator variable that is equal to one if the AC chair has school ties with one of the engagement auditors, and zero otherwise.
ACT_NChair = An indicator variable that is set to one if one of the AC members other than the chair has school ties with one of the engagement auditors, and zero otherwise.
ACT_ACC = An indicator variable that is equal to one if at least one of the AC members with accounting background (including accounting professors, public accountants, or CFOs from another firm) has school ties with one of the engagement auditors, and zero otherwise.
ACT_NACC = An indicator variable that takes the value one if at least one of the AC 19 According to the CSRC’s rules, the AC nominates the external auditor. However, the auditor appointment decision must be approved at the shareholder’s meeting. As the ownership of listed firms in China is concentrated, the appointment decision on auditors is effectively made by the large shareholder (who also typically manages the company). We confirm this through private communication with a practitioner who chairs the ACs of several listed firms in China. He also suggested that, in practice, AC members work closely with auditors on audit planning, audit adjustments, and other important audit matters.

17
members without an accounting background has school ties with one of the engagement auditors, and zero otherwise.
ACT_Dept = An indicator variable that is equal to one if at least one of the AC members and one of the engagement auditors are from the same department/school, and zero otherwise.
ACT_NDept = An indicator variable that is equal to one if at least one of the AC members have school ties with one of the engagement auditors, but none of them are from the same department/school, and zero otherwise.
Since an AC chair likely plays a more important role than other AC members in monitoring
the financial reporting process, we predict in H2 that the impact of social ties will be
concentrated in ACT_Chair. DeFond et al. (2005) document that AC members with accounting
expertise outperform other members in monitoring, suggesting that the audit quality impact
will be isolated in ACT_ACC relative to ACT_NACC.20 Finally, we consider whether there is
any overlap in the department/school attended by the AC members and engagement auditors.
By reinforcing the connections between AC members and engagement auditors, common
experience in the same department/school strengthens the importance of school ties. In
another way to examine the prediction in H2, we expect to observe that the role that alma mater
links play to be concentrated in ACT_Dept rather than ACT_NDept.
We follow prior Chinese auditing research by controlling for this set of client and audit
characteristics (e.g., DeFond et al. 2000; Chen et al. 2001): Big4 (an indicator variable for
observations that are audited by an international Big 4 auditor); Top10 (an indicator variable for
observations that are audited by a domestic top 10 auditor, ranked by the number of listed
clients in the year under study); LTA (the natural logarithm of client’s total assets at the fiscal
year end); Leverage (the ratio of total liabilities to total assets); Loss (an indicator variable for
negative net income); ROA (net income divided by total assets at the fiscal year end); Liquidity
(the ratio of current assets to current liabilities); REC (net accounts receivables divided by total
assets at the fiscal year end); and INV (inventories divided by total assets at the fiscal year end).
Since large auditors are usually more competent or more independent (DeAngelo 1981; DeFond
et al. 2000; Wang et al. 2008; Chan and Wu 2011), we expect coefficients on Big4 and Top10 to be 20 Other research implying that better audit outcomes accompany accounting-related financial expertise on the audit committee includes Krishnan (2005), Krishnan and Visvanathan (2008), and Dhaliwal et al. (2010).

18
positive. Since auditors are more likely to issue MAOs when clients have higher audit risks,
we expect the coefficients on Leverage, Loss, REC, and INV to be positive and those on LTA, ROA,
and Liquidity to be negative.
3.2 Social ties and ex post audit outcomes
Although a higher propensity to render non-clean opinions is typically interpreted as
evidence of high quality auditing in the literature, Fogel-Yaari and Zhang (2013) cast doubt on
this conclusion.21 Specifically, they show that the auditors who issue relatively more GCOs are
more likely to make Type I errors (a GCO for a client that does not file for bankruptcy after the
issuance of the audit opinion), whereas the auditors’ propensity to issue GCOs is not
significantly associated with the rates of Type II errors (a clean opinion issued to a client that
subsequently files for bankruptcy). In our setting, it is possible that social ties with AC
members enhance auditors’ trust of client’s financial reporting policies. As a result, auditors
are less likely to disagree with management over the application of accounting principles or
estimates. To the extent that management choice is appropriate, enhanced trust reduces Type I
errors.22 Alternatively, supported by the AC, socially tied auditors are in a better position to
persuade management to make audit adjustments in order to ensure that the financial
statements comply with GAAP. In either event, social connections reduce the need for an
auditor to issue an MAO. This suggests that the negative relationship between AC-auditor
social ties and the propensity to issue MAOs may not mean compromised auditor
independence.
The ex ante disagreements between auditors and client management over accounting issues
or audit adjustments cannot be observed from publically available data. However, we can
analyze two observable ex post outcomes: clients’ earnings restatements and regulatory
sanctions in the event of accounting irregularities. Prior research has shown that these two
21 In another upside stemming from focusing on Chinese public firms as our testing ground, we largely avoid identification complications in which a higher incidence of modified opinions reflects excessively conservative auditors protecting their interests by avoiding costly civil litigation, which may undermine audit quality (Thoman 1996; Deng et al. 2012; DeFond and Zhang 2013). 22 For example, management may have a lower estimate of bad debt allowance, which is appropriate given the debtor’s creditworthiness. If the auditor believes that bad debt allowance is underestimated and thus modifies the audit opinion and, ex post, accounts receivables are collected on time, a Type I error in auditing reporting occurs.

19
outcome variables are associated with auditor attributes. For example, Lennox and Pittman
(2010) find that Big N clients are less likely to commit fraudulent financial reporting and Francis
et al. (2013) document that larger Big N offices have fewer client restatements. Using Chinese
data, Gul et al. (2013) document that individual auditors with more aggressive styles are more
likely to be sanctioned by regulators for audit failure and financial statements originally audited
by aggressive individual auditors are more likely to be restated. An advantage of using these
ex post outcomes as audit quality metrics is that they unambiguously reflect accounting
problems and thus low-quality audits (Dechow et al. 2010).23 Most importantly, in our setting,
such an analysis helps to clarify whether the observed association between AC-auditor ties and
the propensity to issue MAOs reflects errors in auditor judgment and decision making.24
Specifically, there are six possible scenarios, as follows:
Ex ante association between school ties and MAOs
Positive Negative
Ex post association between
school ties and
restatements/frauds
Positive (1) Correct decision (2) Type II errors
No (3) Type I errors (4) Correct decision
Negative (5) Type I errors (6) Correct decision
In both scenarios (1) and (6), auditors have made correct decisions since the propensity to
issue MOAs is consistent with the ex post occurrence of restatements/frauds. The auditor’s
decision is also correct in scenario (4): given that rates of restatements or frauds are not higher
for audits done by connected auditors, fewer MAOs reduce the costs to both clients and
23 As stressed earlier, public firms in China virtually never go bankrupt. We have also examined the association between abnormal accruals and AC-auditor school ties but find no consistent evidence (results not tabulated). However, examining more extreme forms of irregularities such as restatements and frauds is consistent with practitioners’ view, as suggested by the PCAOB (2011: 37):
Information gathered through the Board’s oversight activities indicates that abnormal accruals do not appear to be a good measure of audit quality. Specifically, PCAOB staffs have found no direct statistical relationship between the size of an abnormal accrual and the probability that inspections staff would detect an audit failure.
Moreover, in their survey of public company CFOs in the U.S., Dichev et al. (2013: 17) report that these executives perceive that audit committees only become important in fairly extreme situations with one participant stressing: “the audit committee sets the general tone…They can ask some intelligent questions and my guess is that a well-functioning audit committee is going to keep the big collapse from happening. But I don’t think they can do much about small variations in earnings quality.” 24 Continuing the previous bad debt allowance example, if management’s estimate of allowance is appropriate from the ex post point of view, then the firm should be less likely to restate earnings or be sanctioned by regulators for problematic accounting in subsequent years.

20
auditors. We are particularly interested in scenario (2): if socially connected auditors less
frequently issue MAOs and, ex post, there are more restatements made by clients or frauds
detected by regulators for observations that are audited by such auditors, then the evidence
suggests Type II errors and supports impaired audit quality due to school ties between auditors
and AC members. As for scenarios (3) and (5), i.e., more MAOs issued by socially connected
auditors but the likelihood of restatements or frauds is not higher for audits performed by such
auditors, while it is theoretically possible, we believe it is far less likely to occur because
auditors are likely to lose the engagement by over-issuing MAOs inappropriately.
We employ the following logistics models to test whether restatements or accounting frauds
are related to the AC-auditor social connections:
Restatement = α + β1ACT + β2MGT_Chair/CEO + β3MGT_Other + γCi + δt + ζk + ε, and (2)
Fraud = α + β1ACT + β2MGT_Chair/CEO + β3MGT_Other + γCi + δt + ζk + ε, (3)
where Restatement is an indicator variable that is equal to one if earnings in the current year are
restated in subsequent years, and zero otherwise; Fraud is an indicator variable that is set to one
if the firm is subsequently sanctioned by the CSRC or MOF (the Ministry of Finance) due to
financial misrepresentation in the current year, and zero otherwise;25 ACT, MGT_Chair/CEO,
and MGT_Other are defined as before; Ci includes the following client and auditor
characteristics that may affect the incidence of restatements or accounting frauds: Big4, Top10,
LTA, Leverage, ROA, and Loss, all of which are defined as before; δt and ζk are year and industry
fixed effects, respectively; and ε is the regression error term.
Finally, we triangulate the above ex post audit outcomes with a valuation analysis. To the
extent that AC-auditor school ties undermine audit quality, it follows that the worse
information asymmetry accompanying these links will translate into a lower valuation. In
contrast, if AC-auditor school ties sufficiently enhance information sharing between AC
members and engagement auditors according to investor perceptions (i.e., information
asymmetry falls with these connections), then these ties should be positively reflected in the
25 Both the CSRC and the MOF have the authority to sanction firms for problematic accounting practices. The MOF is in charge of all accounting affairs in China, while the CSRC is empowered to handle accounting and disclosure issues related to publicly traded companies.

21
firm’s valuation. In exploring whether AC-auditor school ties affect firm value, we measure
firm value with Tobin’s Q after Fan and Wong (2005) in this model:
Tobin’s Q = α + β1ACT + β2MGT_Chair/CEO + β3MGT_Other + γCi + δt + ζk + ε, (4)
where Tobin’s Q is defined as the market value of common equity plus the book value of debt
divided by total assets at the end of the year; ACT, MGT_Chair/CEO, and MGT_Other are
defined as before; and Ci includes the following factors that may affect firm valuation: Big4,
Top10, LTA, ROA, Liquidity, and Leverage, all of which are defined as before. After recent
research (e.g., Jiang et al. 2010; Guedhami et al. 2014), we also include Growth and CAPEXP as
control variables. Growth is the difference between sales of the current and the prior year
divided by prior year sales and CAPEXP is the ratio of capital expenditures over total assets at
the end of year. δt and ζk are year and industry fixed effects, respectively, and ε is the
regression error term.
4. Sample and data
Our sample period covers 2004 to 2010. The practice of setting up audit committees among
Chinese listed firms largely began in 2002 when the China Securities Regulatory Commission
(CSRC, the equivalent of the U.S. SEC) promulgated the Code of Corporate Governance for Listed
Companies in August 2002. The Code suggests that corporate boards can form audit
committees following the resolutions of shareholders’ meetings. Although the proportion of
firms that have established audit committees has increased steadily since then, our sample
period starts in 2004 because the disclosure on the background information of their directors,
including the audit committee members, is quite sparse before 2004. Our primary data source
is the China Stock Market and Accounting Research Data Base (CSMAR). In total, there are
11,143 A-share firm-year observations between 2004 and 2010 in CSMAR.26 Among these
observations, we exclude: (i) 4,052 observations that do not have or do not disclose audit
26 A-shares in the Shanghai and Shenzhen stock exchanges refer to those issued to domestic investors. A total of 114 firms since 1992 have been authorized to issue B-shares to foreign investors. The B-share firms are not included in the sample because their regulatory environments are considerably different from those of A-share firms. For example, until 2007, B-share firms were required to prepare an additional set of financial statements for foreign investors according to International Accounting Standards, and to be audited by an international audit firm.
22
committees; and (ii) 93 observations that have missing values for financial statement variables
used in the multivariate regression analysis. After imposing these screens, our final sample
consists of 6,998 firm-year observations.
We downloaded the profiles of firms’ executives and board directors (this includes AC
members since only board directors are eligible to serve on the committee) from CSMAR.
From these profiles, we manually collected their school information for their junior college,
undergraduate, and postgraduate education. In cases in which there is no education
background information contained in an executive’s or a director’s profile, we assume that
he/she does not have any college education.
We retrieve data on regulatory sanctions from CSMAR against sample firms for misconduct.
CSMAR provides data on enforcement actions taken by the CSRC and MOF for corporate
misconduct. Consistent with Hung et al. (2013), we only retain enforcements related to
financial misrepresentation.27 Consequently, the nature of the frauds examined in the current
study is similar to that of those identified from the Accounting and Auditing Enforcement
Releases (AAERs) in the U.S.-based literature (e.g., Lennox and Pittman 2010). We hand collect
restatement data from firms’ annual reports. Specifically, we reviewed the “Material
Accounting Errors” section of footnotes to the financial statements and identified corrections for
earnings or shareholders’ equity in prior years. After Wang and Wu (2012) and Gul et al.
(2013), we excluded restatements arising from changes in accounting standards or government
tax rules, or mergers and acquisitions since such restatements are clearly not caused by
intentional errors. Since the footnote database in CSMAR ranges to 2011 when we
downloaded the data in August 2013, we follow Francis et al. (2013) by truncating the sample
period for the restatement analysis at year 2008, so that there is adequate time for the
restatements of prior financials to occur, ensuring that we can reliably classify restating and
non-restating firms.28,29
27 Specifically, we keep the following categories of corporate misconduct compiled by CSMAR: (1) fabricating profits; (2) overstating assets; (3) delaying disclosures; (4) false statements; (5) material omissions; (6) expropriation of corporate assets by the large shareholders; and (7) fraudulent IPOs. Misconduct such as market manipulation, inside trading, or violations of laws and regulations that are not directly related to financial presentation are excluded from our analysis. 28 The results are qualitatively identical if we focus on the 2004-2010 timeframe in this analysis. 29 We do not restrict the sample period for the fraud analysis because CSMAR updates the enforcement
23
As stipulated by China’s Independent Auditing Standards No. 7 – Audit Report and related
practice guidelines issued in 1995 (MOF 1995a and 1995b), engagement auditors must sign the
audit reports in order to clarify the responsibility for the audits performed. Typically, an audit
report is signed by two auditors: one is relatively junior and mainly administers the fieldwork,
and the other is relatively senior and mainly performs the review work. To improve the
transparency of the public accounting profession, the Chinese Institute of Certified Public
Accountants (CICPA) since 2009 has disclosed public accountants’ demographic information
through an on-line enquiry system at http://cmis.cicpa.org.cn. We collect signatory auditors’
education information from this system.
Table 1, Panel A shows the time-series distribution of our sample observations, partitioned
into two groups by ACT. In about 18% of sample firm-years, AC members are connected to
engagement auditors through a common education background. The relative frequencies of
observations with AC-auditor school ties range from 20.23% in 2008 to 16.59% in 2010. In
Panel B, we report the distribution of sample observations by industry and social ties.
Consistent with the CSRC industry classification scheme, we use the two-digit code for the
manufacturing sector and one-digit code for other sectors. The relative frequencies of
observations are fairly evenly spread between the two groups of observations partitioned by
ACT, suggesting that there is no major clustering of school ties between engagement auditors
and AC members in certain industries. In any event, we include year and industry fixed
effects in all estimations to control for their effects, if any, on the dependent variables.
Insert Table 1 here.
The descriptive statistics for the regression variables used in the study are reported in Table
2. To mitigate the undue influence of outlying observations and potential coding errors in, for
example, the CSMAR database, we winsorize the continuous variables at the 1st and 99th
percentiles. The statistics for ACT_Num suggest that the number of AC members that are
socially related to engagement auditors ranges from zero to five, and there is also meaningful
variation in the variables that partition ACT by the types of AC members (i.e., ACT_Chair,
data on a daily basis. We downloaded the data in December 2012 by which time most of the enforcements against misconducts in 2010 (the final year of our sample period) can be observed. Nonetheless, all of our core evidence is materially insensitive to excluding the 2010 observations from the analysis.
24
ACT_ACC, and ACT_Dept). Only about 1.2% of the observations are audited by engagement
auditors who have school ties with the firm’s CEO/Chair, evident in the mean of
MGT_Chair/CEO, while the percentage of observations in which engagement auditors are
socially tied to other top executives is much higher at 9.3%, as shown by the mean of
MGT_Other. The means of MAO, Restatement, and Fraud reveal that, for our sample, about 7.6%
of the observations have received MAOs from their auditors, 11.4% of the observations need to
correct their prior earnings or shareholders’ equity in subsequent periods, and 2.5% of the
observations are punished by regulators or stock exchanges because of financial
misrepresentation. Turning to the independent variables, the means of Big4 and Top10
indicate that about 6.3% and 43.4% of sample firms are audited by the international Big N and
domestic Top 10 auditors, respectively. The statistics for the other independent variables
suggest that they are reasonably distributed with some degrees of variation.
Insert Table 2 here.
5. Empirical results
5.1 Social ties and auditor reporting behavior
Table 3 reports the results of the MAO regressions. To correct for potential serial
correlation and heteroskedasticity in the pooled cross-sectional data, we use the Z/T-statistics
based on the Huber/White/sandwich estimator (clustered) for variance throughout the paper
(Wooldridge 2002). In the regressions reported in Columns (1) to (3), we separately include the
three variables measuring engagement auditors’ school ties with AC members, the Chair/CEO,
and other top managers, respectively. We find that the coefficients on ACT and
MGT_Chair/CEO are significantly negative at the 1% and 10% levels, respectively, while the
coefficient on MGT_Other fails to load. In other words, these results imply that a common
education background between the engagement auditors and AC members or CEO/Chair
reduces the likelihood of MAOs, although school ties between engagement auditors and other
top managers has no perceptible impact on the auditors’ reporting behavior. In Column (4),
we include all three social link variables in the same regression and find that the coefficient on
ACT continues to be significantly negative at the 1% level whereas the one on MGT_Other
remains statistically indistinguishable from zero. Moreover, the MGT_Chair/CEO coefficient

25
becomes insignificant at conventional levels after the inclusion of the other two social tie
variables, suggesting that the negative effect of MGT_Chair/CEO is subsumed by those of ACT
and/or MGT_Other. For the control variables, the coefficients all have the predicted signs
except that the coefficient on Liquidity does not load and the coefficient on INV is significantly
negative.30
Insert Table 3 here.
To evaluate the economic importance of the regression results, we consider the odds ratio
estimates for changing the independent variables by one unit, using the estimates from the fully
specified model in Column (4). For ACT, the odds ratio estimate is 0.665, suggesting that an
observation with AC-auditor school ties has nearly 67% of the chance of receiving a MAO as an
observation without such ties. From an economic standpoint, this impact is highly material.
The evidence in Table 3 implies that AC-auditor school ties lower the incidence of auditors’
issuing MAOs to clients. To analyze the prediction in H2 that the role that social ties play in
shaping audit quality varies with their importance, we replace ACT with a set of variables that
capture AC member types. The results are presented in Table 4. In Column (1), we focus on
whether anyone on the AC shares alma mater ties with an engagement auditor. We find that
the coefficient on ACT_Chair is significantly negative (at the 5% level) whereas the one on
ACT_NChair is insignificant. In examining whether having an accounting background matters
in Column (2), we estimate a negative and statistically significant (at the 1% level) coefficient on
ACT_ACC. In sharp contrast, ACT_NACC fails to load in this regression. DeFond et al. (2005)
observe that AC members with an accounting background are perceived to be better at
monitoring the financial reporting process. Our evidence lends support to the intuition that
the detrimental impact of school ties on audit quality is concentrated in AC members with an
accounting background. A likely reason is that AC members with an accounting background
have more say in committee deliberations; i.e., the influence of social networks on audit quality
mainly works through these AC members. Next, we isolate whether AC-auditor connections
play a more prominent role when an AC member and an engagement auditor attended the
same department/school during their college education. Reinforcing our other evidence on
30 Although the negative association between INV and MAO runs opposite to our prediction, this result is consistent with Wang et al. (2008) and Gul et al. (2013). One plausible explanation is that inventory build-up may convey positive signals to auditors if this is driven by an increase in customer demand.

26
the prediction in H2, the results tabulated in Column (3) include that only ACT_Dept enters
negatively (at the 5% level); ACT_NDept is irrelevant to the auditors’ propensity to render a
MAO according to this analysis.31 This evidence supports the argument that tighter social
connections evident in an overlap in the department/school attended by the AC members and
engagement auditors exert a larger impact on audit quality.32
Insert Table 4 here.
5.2 Social ties and ex post audit outcomes
Results in the prior section suggest that AC-auditor school ties reduce the incidence of
MAOs, especially when the AC members have more salient social ties to engagement auditors.
Although this evidence is more consistent with the impaired auditor independence narrative,
less frequent MAOs could also stem from lower rates of Type I errors due to the enhanced trust
between firm management and auditors. To explore this alternative explanation, we now turn
to the analysis of ex post audit quality measures based on accounting restatements and fraud.
Regression results involving earnings restatements are reported in Table 5. When the three
school tie variables⎯namely ACT, MGT_Chair/CEO, and MGT_Other⎯are sequentially
included in the regression models in Columns (1) to (3), we find that the coefficient on ACT
(MGT_Chair/CEO) is positive and statistically significant at the 1% (10%) level. However, only
the positive relation with ACT survives when all three school tie variables are included in the
same model in Column (4). We again derive the odds ratios, based on regression estimates in
Column (4), to evaluate economic impact according to the coefficient estimates. Reflecting its
first-order economic importance, the odds ratio of 1.357 for ACT indicates that the odds of
correcting earnings or shareholders’ equity in subsequent years for observations where
AC-auditor school ties are present are 0.357 times larger than those for observations where such
ties are absent. Turning to the control variables, the auditor size variable, Big4, is significantly
positive, which is consistent with prior theory and evidence implying that large brand-name 31 In Column (3), the sample size is smaller because we drop observations where we cannot identify engagement auditors’ or AC members’ department/school information. 32 Nevertheless, in untabulated F-tests, we find no significant difference between ACT_Chair and ACT_NChair (χ2 = 0.00, p = 0. 99) or between ACT_Dept and ACT_NDept (χ2 = 0.07, p = 0.79). The difference between ACT_ACC and ACT_NACC is marginally significant (χ2 = 2.86, p = 0. 09).

27
auditors provide stricter external monitoring. Loss increases the chance that current financial
statements are corrected later.
Insert Table 5 here.
In Table 6, we further partition observations with AC-auditor school ties into subgroups by
the types of AC members. Consistent with expectations, when connected observations are
partitioned by AC chair position or whether the AC members and engagement auditors are
from the same department/school, the coefficients on ACT_Chair and ACT_Dept are
significantly positive while the coefficients on ACT_NChair and ACT_NDept are statistically
insignificant and smaller than their counterparts. This evidence implies that the impact of
school ties tends to be concentrated where engagement auditors are connected with AC chairs
or had joined the same department/school as AC members during their college education.33
However, the coefficients on both ACT_ACC and ACT_NACC are significantly positive and
there is no significant difference between them (χ2 = 1.17, p = 0.279). Accordingly, we find no
evidence that AC members’ accounting background shapes the link between AC-auditor school
ties and the probability of restatement.
Insert Table 6 here.
We next explore whether the auditor’s school ties with ACs influence the likelihood of
financial misrepresentations that are caught by regulators. The regression results are shown in
Table 7. In our sample, there is no sanctioned observation where the Chair/CEO has school
ties with engagement auditors. We therefore drop MGT_Chair/CEO from the estimation
because it is impossible to compute the maximum likelihood values of the coefficient on this
variable (i.e., there is a complete separation problem in estimation). The coefficients on ACT
are significantly positive in Columns (1) and (3), whereas the coefficients on MGT_Other are
small in magnitude and statistically indistinguishable from zero. The odds ratios suggest that,
compared with observations that are free from AC-auditor school ties, the odds of being
sanctioned by regulators due to problematic accounting/disclosure practices for observations
with such ties are larger by 1.70 times. Among the control variables, firms that are audited by
the Big 4 auditors (Big4) or more profitable (ROA) are significantly less likely to be punished by
33 Nevertheless, in untabulated F-tests, we find no significant difference between ACT_Chair and ACT_NChair (χ2 = 0.06, p = 0. 813) or between ACT_Dept and ACT_NDept (χ2 = 0.11, p = 0.735).

28
regulators for fraudulent financial reporting. Other control variables do not explain the
incidence of accounting frauds.
Insert Table 7 here.
The regressions in Table 8 analyze how types of AC members affect the role that school ties
with engagement auditors play in the probability of accounting frauds. In Columns (1) and (2),
we find that the impact is concentrated where the connected AC member is the chair of the
committee or has an accounting background. Inconsistent with expectations, we find no
empirical support for the prediction under H2 that the importance of AC-auditor school
connections to fraudulent financial reporting hinges on whether the AC members and auditors
went to the same department/school during their college education.34
Insert Table 8 here.
5.3 Social ties and firm value
Our evidence implies that school ties between engagement auditors and audit committee
members impair audit quality. This could lead to higher information asymmetry that
engenders a lower firm valuation in the capital markets. We explore whether AC-auditor
school ties reduce firm value in Table 9. We find that the coefficients on ACT are significantly
negative at the 5% level in Models 1 and 4, while the coefficients on MGT_Chair/CEO, and
MGT_Other fail to load. Economically, the coefficient magnitude on ACT is almost equivalent
to that on Top10; i.e., the adverse valuation impact of AC-school ties is close to that of
appointing a non-Top 10 domestic auditor. This evidence implies that a common education
background between the engagement auditors and AC members reduces firm valuation,
although school ties between engagement auditors and the CEO/Chair or other top managers
has no perceptible impact on firm value.
Insert Tables 9 and 10 here.
To analyze whether the role that social ties play in shaping firm valuation varies with their
importance, we replace variable ACT with a set of variables delineating AC member types.
34 The Chi-square statistics (p-values) from the F-tests for the differences in regression coefficients are as follows: 0.27 (0.600) for ACT_Chair vs. ACT_NChair; 1.11 (0.293) for ACT_ACC vs. ACT_NACC; and 0.48 (0.486) for ACT_Dept VS vs. ACT_NDept.
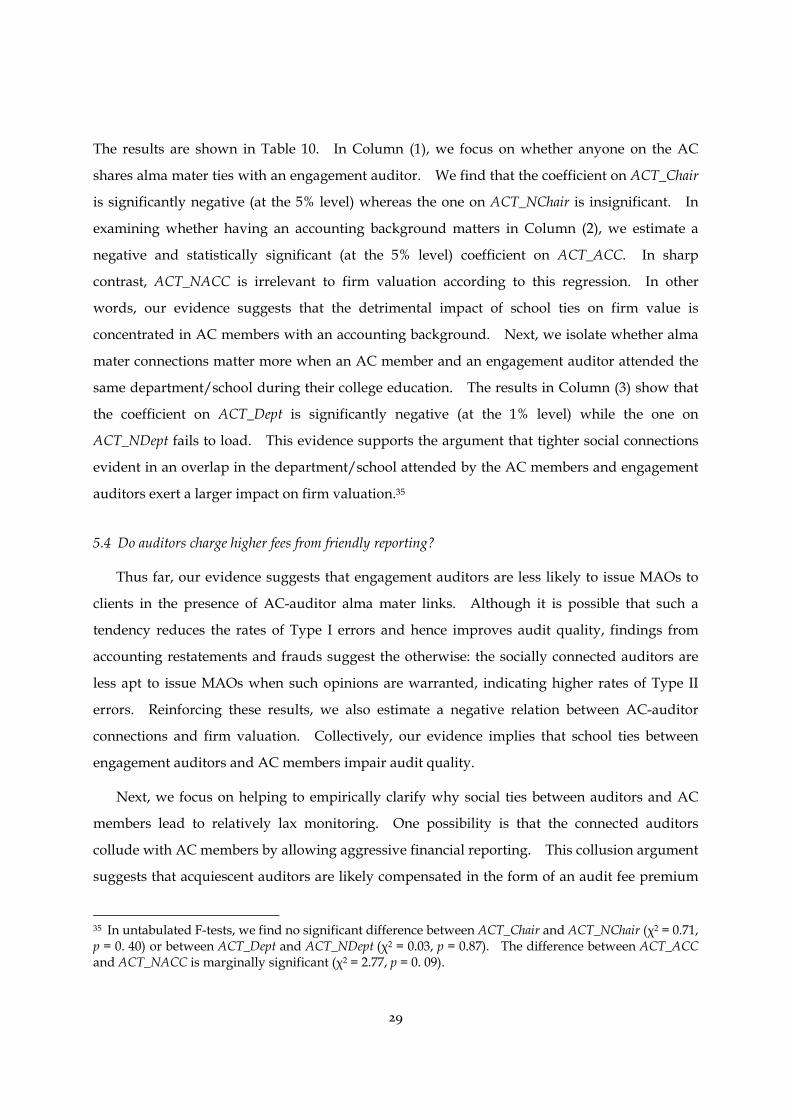
29
The results are shown in Table 10. In Column (1), we focus on whether anyone on the AC
shares alma mater ties with an engagement auditor. We find that the coefficient on ACT_Chair
is significantly negative (at the 5% level) whereas the one on ACT_NChair is insignificant. In
examining whether having an accounting background matters in Column (2), we estimate a
negative and statistically significant (at the 5% level) coefficient on ACT_ACC. In sharp
contrast, ACT_NACC is irrelevant to firm valuation according to this regression. In other
words, our evidence suggests that the detrimental impact of school ties on firm value is
concentrated in AC members with an accounting background. Next, we isolate whether alma
mater connections matter more when an AC member and an engagement auditor attended the
same department/school during their college education. The results in Column (3) show that
the coefficient on ACT_Dept is significantly negative (at the 1% level) while the one on
ACT_NDept fails to load. This evidence supports the argument that tighter social connections
evident in an overlap in the department/school attended by the AC members and engagement
auditors exert a larger impact on firm valuation.35
5.4 Do auditors charge higher fees from friendly reporting?
Thus far, our evidence suggests that engagement auditors are less likely to issue MAOs to
clients in the presence of AC-auditor alma mater links. Although it is possible that such a
tendency reduces the rates of Type I errors and hence improves audit quality, findings from
accounting restatements and frauds suggest the otherwise: the socially connected auditors are
less apt to issue MAOs when such opinions are warranted, indicating higher rates of Type II
errors. Reinforcing these results, we also estimate a negative relation between AC-auditor
connections and firm valuation. Collectively, our evidence implies that school ties between
engagement auditors and AC members impair audit quality.
Next, we focus on helping to empirically clarify why social ties between auditors and AC
members lead to relatively lax monitoring. One possibility is that the connected auditors
collude with AC members by allowing aggressive financial reporting. This collusion argument
suggests that acquiescent auditors are likely compensated in the form of an audit fee premium
35 In untabulated F-tests, we find no significant difference between ACT_Chair and ACT_NChair (χ2 = 0.71, p = 0. 40) or between ACT_Dept and ACT_NDept (χ2 = 0.03, p = 0.87). The difference between ACT_ACC and ACT_NACC is marginally significant (χ2 = 2.77, p = 0. 09).

30
for their lenient audit reporting. We therefore estimate this model to examine whether audit
fees vary systematically with AC-auditor school ties:
Fee = α + β1ACT + β2MGT_Chair/CEO + β2MGT_Other + Ci + δt + ζk + ε, (5)
where Fee is the natural logarithm of annual audit fees; 36 ACT, MGT_Chair/CEO, and
MGT_Other are defined as before; Ci includes these potential determinants of audit fees: Big4,
Top10, MAO, LTA, ROA, Liquidity, Leverage, REC, INV, and Loss, all of which are defined as
before; δt and ζk are year and industry fixed effects, respectively; and ε is the regression error
term. We expect the coefficients on Big4 and Top10 to be positive stemming from the superior
reputation or expertise of large auditors. We also expect LTA to have a positive coefficient
because large firms are usually more complex, requiring auditors to exert more effort on these
engagements. MAO, Leverage, REC, INV, and Loss are expected to have positive coefficients
since larger values in these variables indicate higher audit risks, whereas Liquidity and ROA are
expected to load with negative coefficients since they mitigate audit risks.
Table 11 reports the audit fee model results. In the first three columns where the school tie
variables are entered successively, we observe that the coefficients on these variables are all
positive, suggesting higher audit fees in the presence of educational networks between
engagement auditors and firm managers and directors. However, only ACT is significantly
different from zero (at the 5% level) when all three school connection variables are included in
the same regression. Most of the coefficients on the control variables load with the expected
signs, except that the coefficients on ROA and Loss are not statistically significant and that on
INV is significantly negative (which is consistent with the results from the MAO regression,
suggesting that higher levels of inventory is not perceived as an indicator for audit risks).
When we replace the ACT variable with finer partitions according to the types of AC members
in Table 12, we find that the importance of school ties to audit fees is isolated where the
connection is forged through AC chairs, AC members with an accounting background, or AC
members from the same department/school as the engagement auditors. These cross-sectional
variations lend support to the intuition that the impact of social ties is concentrated where AC
36 Picconi and Reynolds (2013) stress that the standard audit fee model where the natural logarithm of audit fees is regressed on fee determinants could be mis-specified. In untabulated analysis, we re-specify the dependent variable in this regression as the natural logarithm of audit fees scaled by total assets and find that our core evidence reported below persists.

31
members play an influential role in the committees or the connection is strengthened by
common experience in the same department/school.37
Insert Tables 11 and 12 here.
Taken at face value, the fee premium commanded by socially connected auditors is
consistent with the collusion argument. However, in terms of economic significance, the
importance of AC-auditor social ties to audit fees is fairly small. The coefficient of 0.03 on ACT
in Table 11 implies that, holding other things constant, fees are about 3.05% (= e0.03 – 1) higher in
the presence of AC-auditor school ties. Given that the mean audit fee for our sample is about
RMB 519,177 yuan, this difference translates into a higher fee of about RMB 15,811 yuan, which
is hardly material from an economic standpoint.38 Since regulatory sanctions against audit
failure in public firms can be harsh in China⎯such sanctions could include the revocation of
practice licenses and even imprisonment (DeFond et al. 2000; Chan and Wu 2011)⎯it is hard to
accept that an auditor would risk audit failure for such a small monetary gain. The collusion
explanation of lax monitoring offered by socially tied auditors thus does not appear to be
plausible.
We believe that our evidence is more consistent with the social norm of reciprocity. In
social psychology, reciprocity refers to “responding to a positive action with another positive
action, rewarding kind actions,” and is “considered as a strong determining factor of human
behavior” (Wikipedia). This theory has been introduced into the auditing literature to explain
auditor behavior.39 In our setting, the higher audit fees in the presence of AC-auditor school
ties are consistent with favoritism triggered by social networks. Kwon and Yi (2012) suggest
37 The Chi-square statistics (p-values) from the F-tests for the differences in regression coefficients are as follows: 0.27 (0.601) for ACT_Chair vs. ACT_NChair; 0.21 (0.644) for ACT_ACC vs. ACT_NACC; and 3.48 (0.06) for ACT_Dept vs. ACT_NDept. 38 To put this difference into perspective, the mean starting monthly salary for Chinese bachelor graduates in 2010 is RMB 2,815 yuan (http://finance.people.com.cn/n/2012/0801/c1004-18643862.html). 39 Drawing on the reciprocity theory, experimental studies show that clients are more willing to accept significant proposed audit adjustments after auditors demonstrate to the clients that they have waived some trivial audit adjustment items (Sanchez et al. 2007), and auditors tend to reduce the magnitude of audit adjustments when the client management have conceded by resolving some immaterial misstatements (Hatfield et al. 2010). Using archival data, Christensen et al. (2013) find that auditors offer first-year discounts for audits provided to new clients where audit committee members are well connected and could be important for auditors to develop their clientele; and consistent with the reciprocal behavior explanation, auditors are able to leverage audit committee connections to attract new clients.

32
that audit fees are higher when CEOs are socially connected with engagement auditors because
“friends with money (i.e., CEOs) offer their friends in the social networks (i.e., auditors) a very
lucrative contract term (i.e., audit fee premiums) simply based on favoritism.” Likewise, AC
members may approach firm management and negotiate a more favorable audit fee
arrangement when they are connected with engagement auditors. The reciprocity theory
predicts that a small favor can produce a sense of obligation to provide a larger return favor
because “from a young age people are taught to return favors and to disregard this teaching
will lead to the social stigma of being an ingrate” (Wikipedia). The fee premium, albeit
immaterial in an economic sense, may lead auditors to feel obligated to act positively toward
their clients when audit contractual terms are more favorable. As such, school ties with AC
members lead to unconscious errors in auditors’ judgment and decision making. More
specifically, auditors are less likely to adopt an independent attitude and exercise professional
skepticism, which leads to a less rigorous audit process and reduces their ability to detect
material misstatements in financial reporting.40
6. Conclusions
As the liaison between the company’s management and its external auditor, the audit
committee plays an important role in overseeing the financial reporting process. In examining
the importance of social connections, extant research has predominantly focused on whether
audit committee members’ formal or informal ties with firm management influence financial
reporting quality. Despite auditing standard setters’ recent emphasis on external auditors’
reliance on information provided by audit committees (e.g., PCAOB 2007; 2012) and calls for
research on the economic implications of the interactions between audit committees and outside
auditors (e.g., DeFond and Zhang 2013), this line of research seldom considers the impact of
connections between the audit committee and engagement auditors on financial reporting.
To help bridge this gap, we investigate whether alma mater connections between
engagement auditors and audit committee members shape audit outcomes in China, where the
40 This may suggest that auditors are irrational given, for example, that substandard audits will ultimately tarnish auditor reputation. However, a sense of obligation with reciprocity can help an auditor to develop and continue relationships with AC members, thereby increasing the likelihood of attracting more clients from the social network in the future.

33
biographic information on audit committee members and signing auditors are available and the
guanxi (networking) culture prevails in socioeconomic activities. We argue that AC-auditors
social ties could affect audit quality in one of two competing ways. In one direction, social ties
facilitate information flows between the AC and auditor and protect auditor independence from
management, leading to higher quality audits. In the other direction, AC-auditor social ties
could impede the auditor from exercising due care and even inject unintentional bias into
auditors’ judgment and decision making when conducting the audit, resulting in lower quality
audits.
Our empirical findings suggest that the costs of social connections between the audit
committee and engagement auditor outweigh their potential benefits. Specifically, we
estimate that the likelihood of receiving modified audit opinions for observations where
AC-auditor school ties are present is about 33% times smaller than that for observations where
such ties are absent. Moreover, financial statements originally audited by connected
engagement auditors are more likely to be restated and AC-auditor school ties are associated
with a higher incidence of regulatory sanctions for committing accounting fraud. These results
lend support to the intuition that the lower propensity to issue non-clean opinions represents
higher Type II error rates in connected auditors’ decision-making. This evidence is
corroborated by a valuation analysis⎯we find that investors discount share prices of firms
where auditors and AC members are connected⎯suggesting that investors perceive that audit
quality suffers when auditors are socially linked to their client’s audit committee. Consistent
with favoritism triggered by the social network, we also document that audit fees are higher in
the presence of social ties between an engagement auditor and the audit committee. Finally,
we show that the above findings are generally concentrated in situations where AC-auditor
social links are expected to be more salient, namely among firms where a connected AC
member chairs the committee, has an accounting background, or went to the same
department/school as the engagement auditor. This cross-sectional variation pattern
reinforces the inference that social networks between AC members and engagement auditors
undermine audit quality.
Our research has several policy and practical implications. First, our findings suggest that
financial report users would benefit from the disclosure of the identity of the engagement
auditor. This information would enable users to spot the interpersonal links between the

34
engagement auditor and AC members, putting them in a better position to gauge the audit
quality impact. Our valuation analysis suggests that Chinese investors rely on such
information in pricing securities. This evidence is relevant to the discourse on the PCAOB’s
(2013) proposal calling for the disclosure of audit partner identity in the U.S., although research
on another country’s auditing institutions naturally should be interpreted with caution from a
policy perspective.
Second, whether audit committee members and the outside auditors are independent from
each other has largely been overlooked in regulatory circles. Our analysis indicates that audit
committee members cannot be presumed to be independent from outside auditors, and the cozy
interpersonal relations between these two parties can significantly jeopardize audit quality.
Accordingly, it would be constructive for regulators to consider the role that informal personal
ties play when setting policies surrounding the independence of audit committees and external
auditors. Also, our evidence suggests that it would be prudent for regulators to devote more
resources toward scrutinizing companies that are audited by connected auditors.
Finally, for practitioners eager to strengthen corporate governance, they should beware of
the detrimental effect of social networks in the context of external auditing when developing
firm-level governance structures. For public accounting firms attempting to improve their
performance, the message from our study is that personal ties between engagement auditors
and client audit committee members should be taken into account in the allocation of their
scarce quality control resources and the assignment of individuals to audit engagements.

35
References
Agrawal, A. and S. Chadha. 2005. Corporate governance and accounting scandals. Journal of Law and Economics 48 (2): 371–406.
Allen, F., J. Qian, and M. Qian. 2005. Law, finance, and economic growth in China. Journal of Financial Economics 77 (1): 57–116.
Babcock, L., G. Loewenstein, S. Issacharoff, and C. F. Camerer. 1995. Biased judgments of fairness in bargaining. American Economic Review 85 (5): 1337–1343.
Baber W.R., J. Krishnan, and Y. Zhang. 2013. Investor perceptions of the earnings quality consequences of hiring an affiliated auditor. Review of Accounting Studies. Forthcoming.
Ball, R. 2009. Market and political/regulatory perspectives on the recent accounting scandals. Journal of Accounting Research 47 (2): 277–323.
Bame-Aldred, C., D. Brandon, W. Messier, L. Rittenberg, and C. Stefaniak. 2013. A summary of research on external auditor reliance on the internal audit function. Auditing: A Journal of Practice & Theory 32 (Supplement 1): 251–286.
Bazerman, M. H., K. P. Korgan, and G. F. Loewenstein. 1997. The impossibility of auditor independence. Sloan Management Review 38 (4): 89–94.
Beasley, M., J. Carcello, D. Hermanson, and T. Neal. 2009. The audit committee oversight process. Contemporary Accounting Research 26 (1): 65–122.
Bédard, J., S.M., Chtourou and L. Courteau. 2004. The effect of audit committee expertise, independence, and activity on aggressive earnings management. Auditing: A journal of Practice & Theory 23 (2): 13–35.
Bhowmik, D. and E. Rogers. 1971. Homophily-heterophily: Relational concepts for communication research. Public Opinion Quarterly 34 (4): 523–538.
Bruynseels, L. and E. Cardinaels. 2013. The audit committee: Management watchdog or personal friend of the CEO. The Accounting Review: forthcoming.
Cai, J., R.A. Walkling, and K. Ye. 2012. The price of Street friends: Social networks, informed trading, and shareholder costs. Working paper. Available at: http://dx.doi.org/10.2139/ssrn.1785417.
Carcello, J.V. and C. Li. 2013. Costs and benefits of requiring an engagement partner signature: Recent experience in the United Kingdom. The Accounting Review 88 (5): 1511–1546.
Carcello, J.V. and T. Neal. 2000. Audit committee composition and auditor reporting. The Accounting Review 75 (4): 453–467.
Carcello, J.V., and T. Neal. 2003. Audit committee characteristics and auditor dismissals following “new” going-concern reports. The Accounting Review 78 (1): 95–117.
Carey, P. and R. Simnett. 2006. Audit partner tenure and audit quality. The Accounting Review 81(3): 653–676.
Chan, K.H. and D. Wu. 2011. Aggregate quasi rents and auditor independence: Evidence from audit firm mergers in China. Contemporary Accounting Research 28 (1): 175–213.
Chan, K.H., K. Lin, and P. Mo. 2006. A political-economic analysis of auditor reporting and auditor switches. Review of Accounting Studies 11 (1): 21–48.
Chen, C., S. Chen, and X. Su. 2001. Profitability regulation, earnings management, and modified audit opinions: Evidence from China. Auditing: A Journal of Practice & Theory 20 (2): 9–30.
Chen, C., X. Su, and R. Zhao. 2000. An emerging market’s reaction to initial modified audit opinions:
36
Evidence from the Shanghai Stock Exchange. Contemporary Accounting Research 17 (3): 429–455. Chen, C., X. Su, and X. Wu. 2007. Market competitiveness and Big 5 pricing: Evidence from China’s
binary market. The International Journal of Accounting 42 (1): 1–24. Chen, K. and H. Yuan. 2004. Earnings management and capital resources allocation: evidence from
China accounting-based regulations of right issues. The Accounting Review 79 (3): 645–665. Chen, S., S. Sun, and D. Wu. 2010. Client importance, institutional improvements, and audit quality
in China: An office and individual auditor level analysis. The Accounting Review 85 (1): 127–158. Chi, W., H. Huang, Y. Liao, and H. Xie. 2009. Mandatory audit partner rotation, audit quality, and
market perception: Evidence from Taiwan. Contemporary Accounting Research 26 (2): 359–391. Chidambaran, N.K., S. Kedia, and N.R. Prabhala. 2012. CEO-director connections and corporate
fraud. Working paper. Available at: http://dx.doi.org/10.2139/ssrn.2023030. Christensen, B.E., T.C. Omer, N.Y. Sharp, and P.A. Wong. 2013. Who you know matters: Evidence of
fee discounts for clients with well-connected audit committees. Working paper. Available at: http://dx.doi.org/10.2139/ssrn.2209408.
Church, B., S. Davis, and S. McCraken. 2008. The auditor’s reporting model: A literature overview and research synthesis. Accounting Horizons 22 (1): 69–90.
Cohen, J.R. and G. M. Trompeter. 1998. An examination of factors affecting audit practice development. Contemporary Accounting Research 15 (4): 481–504.
Cohen, L., A. Frazzini, and C. Malloy. 2008. The small world of investing: Board connections and mutual fund returns. Journal of Political Economy 116 (5): 51–979.
Cohen, L., A. Frazzini, and C. Malloy. 2010. Sell-side school ties. Journal of Finance 65 (4): 1409–1437. CSRC (the China Securities Regulatory Commission). 2001a. Compilation Rules for Information
Disclosure by Companies That Offer Securities to the Public No. 14: Dealing with Non-standard Audit Opinions and Related Events. Beijing, China. In Chinese.
CSRC (the China Securities Regulatory Commission). 2001b. Stipulations of the Suspension and Termination of Public Listing of Stocks of Loss Firms (Revised). Beijing, China. In Chinese.
DeAngelo, L. 1981. Auditor size and audit quality. Journal of Accounting and Economics 3 (3): 183–199. Dechow, P.M., R.G. Sloan, and A.P. Sweeney. 1995. Detecting earnings management. The Accounting
Review 70 (2): 193–225. Dechow, P.M., W. Ge, and C. Schrand. 2010. Understanding earnings quality: A review of the
proxies, their determinants and their consequences. Journal of Accounting and Economics 50 (2–3): 344–401.
DeFond, M. and J. Zhang. 2013. A review of archival auditing research. Working paper, University of Southern California.
DeFond, M., and J.R. Francis. 2005. Audit Research after Sarbanes-Oxley? Auditing: A Journal of Practice & Theory 24 (Supplement): 5–30.
DeFond, M., R. Hann, and X. Hu. 2005. Does the market value financial expertise on audit committees of boards of directors? Journal of Accounting Research 43 (2): 153–193.
DeFond, M., T.J. Wong, and S. Li. 2000. The impact of improved auditor independence on audit market concentration in China. Journal of Accounting and Economics 28 (3): 269–305.
Deng, M., N. Melumad, and T. Shibano. 2012. Auditors’ liability, investments, and capital markets: A potential unintended consequence of the Sarbanes-Oxley Act. Journal of Accounting Research 50

37
(5): 1179–1215. DeZoort, T., P. Harrison, and M. Taylor. 2006. Accountability and auditors materiality judgments:
The effects of differential pressure strength on conservatism, variability, and effort. Accounting, Organizations and Society 31 (4): 373–390.
Dhaliwal, D., V. Naiker, and F. Navissi. 2010. The association between accruals quality and the characteristics of accounting experts and mix of expertise on audit committees. Contemporary Accounting Research 27 (3): 787–827.
Dichev, I.D., J. Graham, C.R. Harvey, and S. Rajgopal. 2013. Earnings quality: Evidence from the field. Journal of Accounting and Economics 56 (2–3): 1–33.
Engelberg, E., P. Gao, and C.A. Parsons. 2012. Friends with money. Journal of Financial Economics 103 (1): 169–188.
Fan, J., and T.J. Wong. 2005. Do external auditors perform a corporate governance role in emerging markets? Evidence from East Asia. Journal of Accounting Research 43 (1): 35–72.
Firth, M., O.M. Rui, and X. Wu. 2012a. Rotate back or not after mandatory audit partner rotation? Journal of Accounting and Public Policy 31 (4): 356–373.
Firth, M., P. Mo, and R. Wong. 2012b. Auditors’ organizational form, legal liability, and reporting conservatism: Evidence from China. Contemporary Accounting Research 29 (1): 57–93.
Fogel-Yaari, H. and P. Zhang. 2013. Is an auditor’s propensity to issue going concern opinions related to audit quality? Working paper. Available at: http://dx.doi.org/10.2139/ssrn.2197781.
Fracassi, C. and G.A. Tate. 2012. External networking and internal firm governance. Journal of Finance 67 (1): 153–194.
Francis, J.R. 2011. A framework for understanding and researching audit quality. Auditing: A Journal of Practice & Theory 30 (2): 125–152.
Francis, J.R., P. Michas, and M. Yu. 2013. Office size of Big 4 auditors and client restatements. Contemporary Accounting Research 30 (4): 1626–1661.
Geiger, M.A., C. S. Lennox, and D. S. North. 2008. The hiring of accounting and finance officers from audit firms: How did the market react? Review of Accounting Studies 13 (1): 119–143.
Gibbons, D.E. 2004. Friendship and advice networks in the context of changing professional values. Administrative Science Quarterly 49 (2): 238–262.
Granovetter, M. 1985. Economic action and social structure: The problem of embeddedness. American Journal of Sociology 91 (3): 481–510.
Granovetter, M. 2005. The impact of social structure on economic outcomes. Journal of Economic Perspectives 19 (1): 33–50.
Guan, Y., L. Su, D. Wu, and Z. Yang. 2014. Do school ties between auditors and client executives influence audit quality? Working paper. Available at: http://dx.doi.org/10.2139/ssrn.2386529.
Guay, W., S. Kothari, and R. Watts. 1996. A market-based evaluation of discretionary accrual models. Journal of Accounting Research 34 (Supplement): 83–105.
Guedhami, O., J.A. Pittman, and W. Saffar. 2014. Auditor choice in politically connected firms. Journal of Accounting Research 52 (1): 107–162.
Gul, F.A., D. Wu, and Z. Yang. 2013. Do individual auditors affect audit quality? Evidence from archival data. The Accounting Review 88 (6): 1993–2023.
Hackenbrack, K. and M. W. Nelson. 1996. Auditors’ incentives and their application of financial
38
accounting standards. The Accounting Review 71 (1): 43–59. Hatfield, R.C., R.W. Houston, C.M. Stefaniak, and S. Usrey. 2010. The effect of magnitude of audit
difference and prior client concessions on negotiations of proposed adjustments. The Accounting Review 85 (5): 1647–1668.
He, X., J.A. Pittman, and O.M. Rui. 2013. Reputational implications for partners after a major audit failure: Evidence from China. Working paper. Available at: http://dx.doi.org/10.2139/ssrn.201 3104.
Healy, P. and J. Wahlen. 1999. A review of the earnings management literature and its implications for standard setting. Accounting Horizons 13 (4): 365–383.
Hribar, P. and D. Collins. 2002. Errors in estimating accruals: Implications for empirical research. Journal of Accounting Research 40 (1): 105–134.
Hui, C. and G. Green. 1997. Guanxi and professional leadership in contemporary Sino-American joint ventures. Leadership Quarterly 8 (4): 451–465.
Hung, M.Y., T.J. Wong, and F. Zhang. 2013. The value of political ties and market credibility: Evidence from corporate scandals in China. Working paper. Available at: http://dx.doi.org/10. 2139/ssrn.2231520.
Hwang, B-H., and S. Kim. 2009. It pays to have friends. Journal of Financial Economics 93 (1): 138–158. Hwang, B-H., and S. Kim. 2012. Social ties and earnings management. Working paper. Available at:
http://dx.doi.org/10.2139/ssrn.1215962. Jiang, G. H., Charles M. C. Lee, and H. Yue. 2010. Tunneling through intercorporate loans: The
China experience. Journal of Financial Economics 98 (1): 1–20. King, R. 2002. An experimental investigation of self-serving biases in an auditing trust game: The
effect of group affiliation. The Accounting Review 77 (2): 265–284. Klein, A. 2002. Audit committee, board of director characteristics, and earnings management. Journal
of Accounting and Economics 33 (3): 375–400. Knechel, W.R., L. Niemi, and M. Zerni. 2013a. Empirical evidence on the implicit determinants of
compensation in Big 4 audit partnerships. Journal of Accounting Research 51 (2): 349–387. Knechel, W.R., G. Krishnan, M. Pevzner, L. Shefchik, and U. Velury. 2013b. Audit quality: Insights
from the academic literature. Auditing: A Journal of Practice & Theory 32 (Supplement 1): 385–421. Krishnan, G.V. and G. Visvanathan. 2008. Does the SOX definition of an accounting expert matter?
The association between audit committee directors’ accounting expertise and accounting conservatism. Contemporary Accounting Research 25 (3): 827–857.
Krishnan, G.V., K.K., Raman, K. Yang, and W. Yu. 2011. CFO/CEO-board social ties, Sarbanes-Oxley, and earnings management. Accounting Horizons 25 (3): 537–557.
Krishnan, J. 2005. Audit committee quality and internal control: An empirical analysis. The Accounting Review 80 (2): 649–675.
Kwon, S.Y. and H. Yi. 2012. Do social ties between CEOs and engagement audit partners affect audit fees and audit quality? Working paper, Korea University.
Lennox, C. 2005. Audit quality and executive officers’ affiliations with CPA firms. Journal of Accounting and Economics 39 (2): 201–231.
Lennox, C.S. and C. Park. 2007. Audit firm appointments, audit firm alumni, and audit committee independence. Contemporary Accounting Research 24 (1): 235–258.

39
Lennox, C.S. and J.A. Pittman. 2010. Big five audits and accounting fraud. Contemporary Accounting Research 27 (1): 209–247.
Lennox, C.S., P. Lisowsky, and J.A. Pittman. 2013. Tax aggressiveness and accounting fraud. Journal of Accounting Research 51 (4): 739–778.
Loewenstein, G.1996. Behavioral decision theory and business ethics: Skewed trade-offs between self and other. In D.M. Messick and A.E. Tenbrunsel, eds., Codes of Conduct. New York: Russell Sage Foundation.
McPherson, M., L. Smith-Lovin, and J.M. Cook. 2001. Birds of a feather: Homophily in social networks. Annual Review of Sociology 27: 415–444.
Menon, K. and D. Williams. 2004. Former audit partners and abnormal accruals. The Accounting Review 79 (4): 1095–1118.
Miller, G.S. 2006. The press as a watchdog for accounting fraud. Journal of Accounting Research 44 (5): 1–33.
MOF (the Ministry of Finance of the People’s Republic of China). 1995a. Independent Auditing Standards No. 7: Audit Report. Beijing, China. In Chinese.
MOF (the Ministry of Finance of the People’s Republic of China). 1995b. Practice Guidelines of Certified Public Accountants in China No. 1: Annual Report Audit. Beijing, China. In Chinese.
Moore, D.A., P.E. Tetlock, L. Tanlu, and M.H. Bazerman. 2006. Conflicts of interest and the case of auditor independence: Moral seduction and strategic issue recycling. Academy of Management Review 31 (1): 10–29.
Naiker, V., and D.S. Sharma. 2009. Former audit partners on the audit committee and internal control committee. The Accounting Review 84 (2): 559–587.
Naiker, V., D.S. Sharma, and V.D. Sharma. 2013. Do former audit firm partners on audit committees procure greater nonaudit services from the auditor? The Accounting Review 88 (1): 297–326.
Nelson, M. 2006. Ameliorating conflicts of interest in auditing: Effects of recent reforms on auditors and their clients. Academy of Management Review 31 (1): 30–42.
Nelson, M., and H. Tan. 2005. Judgment and decision making research in auditing: A task, person, and interpersonal interaction perspective. Auditing: A Journal of Practice & Theory 24 (Supplement): 41–71.
Nguyen, B.D. 2012. Does the Rolodex matter? Corporate elite's small world and the effectiveness of boards of directors. Management Science 58 (2): 236–252.
PCAOB (the Public Company Accounting Oversight Board). 2007. Auditing Standard No. 5: An Audit of Internal Control Over Financial Reporting That Is Integrated with An Audit of Financial Statements. Washington, D.C.
PCAOB (the Public Company Accounting Oversight Board). 2011. Concept Release on Auditor Independence and Audit Firm Rotation. Release No. 2011-006. Washington, D.C.
PCAOB (the Public Company Accounting Oversight Board). 2012. Auditing Standard No. 16: Communications with Audit Committees. Washington, D.C.
PCAOB (the Public Company Accounting Oversight Board). 2013. PCAOB reproposes amendments to improve transparency by requiring disclosure of the engagement partner and certain participants in the audit. Available at: http://pcaobus.org/News/Releases/Pages/12042013_Transparency.aspx.
Peng, W.Q., J.K.C. Wei, and Z. Yang. 2011. Tunneling or propping: Evidence from connected

40
transactions in China. Journal of Corporate Finance 17 (2): 306–325. Picconi, M. and J.K. Reynolds. 2013. Audit fee theory and estimation: A consideration of the
logarithmic audit fee model. Working paper. College of William and Mary and Florida State University.
Rajan, R.G., and L. Zingales. 1998, Financial dependence and growth. American Economic Review 88 (3): 559–586.
Rennie, M.D., L.S., Kopp and W.M. Lemon. 2010. Exploring trust and the auditor-client relationship: Factors influencing the auditor’s trust of a client representative. Auditing: A Journal of Practice & Theory 29 (1): 279–293.
Rose, J.M. 2007. Attention to evidence of aggressive financial reporting and intentional misstatement judgments: Effects of experience and trust. Behavioral Research in Accounting 19 (1): 215–229.
Sanchez, M.H., C.P. Agoglia, and R.C. Hatfield. 2007. The effect of auditors’ use of a reciprocity-based strategy on auditor-client negotiations. The Accounting Review 82 (1): 205–240.
Schmidt, B. 2009. Costs and benefits of “friendly” boards during mergers and acquisitions. Working paper. Available at: http://dx.doi.org/10.2139/ssrn.1219102.
Sias, P.M., and D.J. Cahill. 1998. From coworkers to friends: The development of peer friendships in the workplace. Western Journal of Communication 62 (3): 273–299.
Subrahmanyam, A. 2008. Social networks and corporate governance. European Financial Management 14 (4): 633–662.
Tajfel, H. and J. C. Turner. 1986. The social identity theory of intergroup behavior. In S. Worchel, & W. Austin (Eds.), The Psychology of Intergroup Relations, 2nd ed. Chicago: Nelson-Hall.
Thoman, L. 1996. Legal damages and auditor efforts. Contemporary Accounting Research 13 (1): 275–306.
Thompson, L. 1995. “They saw a negotiation”: Partisanship and involvement. Journal of Personality and Social Psychology 68 (5): 839–853.
Thompson, L. and G. Loewenstein. 1992. Egocentric interpretations of fairness and interpersonal conflict. Organizational Behavior and Human Decision Processes 51 (2): 176–197.
Tsang, W.K. 1998. Can guanxi be a source of sustained competitive advantage? The Academy of Management Executive 12 (2): 64–73.
Uzzi, B. 1996. The sources and consequences of embeddedness for the economic performance of organizations: The network effect. American Sociological Review 61 (4): 674–698.
Wang, Q., T.J. Wong, and L. Xia. 2008. State ownership, the institutional environment, and auditor choice: Evidence from China. Journal of Accounting and Economics 46 (1): 112–134.
Wang, X. and M. Wu. 2012. The quality of financial reporting in China: An examination from an accounting restatement perspective. China Journal of Accounting Research 4 (4): 167–196.
Watts, R. and J. Zimmerman. 1986. Positive Accounting Theory. Englewood Cliffs: Prentice Hall. Wooldridge, J.M. 2002. Econometric Analysis of Cross Section and Panel Data. Cambridge: MIT Press. Xin, K.R. and J.L. Pearce. 1996. Guanxi: Connections as substitutes for formal institutional support.
Academy of Management Journal 39 (6): 1641–1658. Zerni, M. 2012. Audit partner specialization and audit fees: Some evidence from Sweden.
Contemporary Accounting Research 29 (1): 312–340.
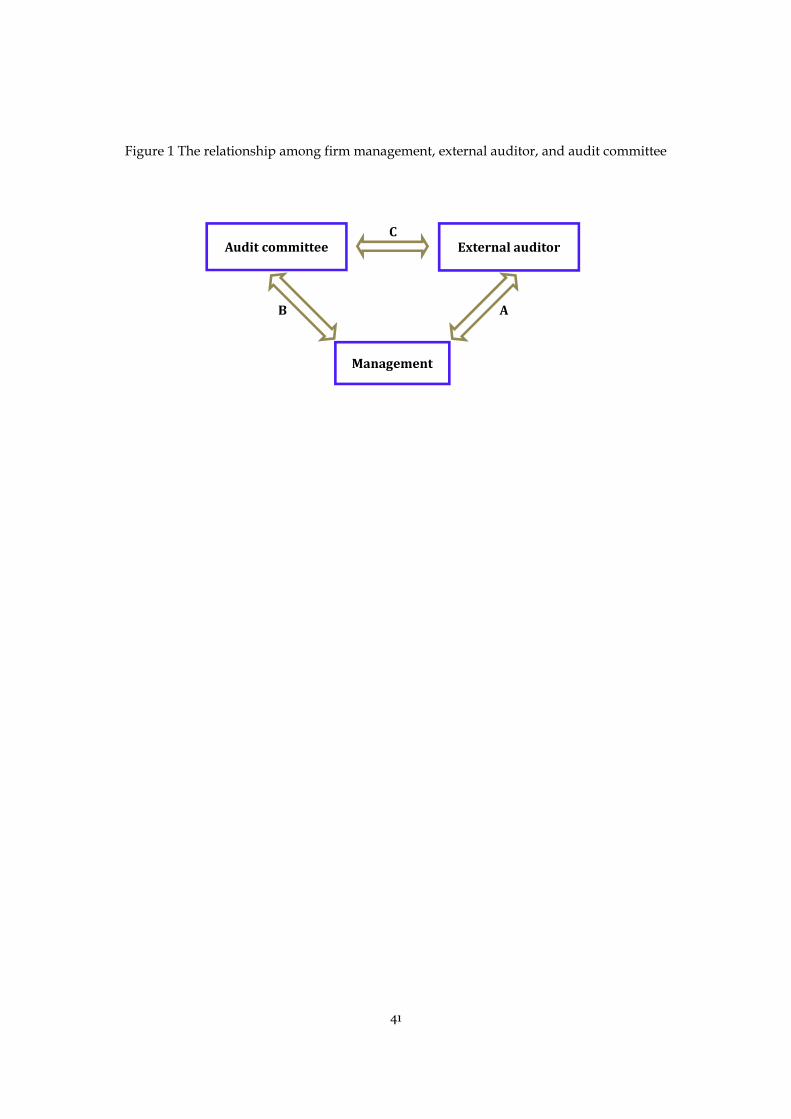
41
Figure 1 The relationship among firm management, external auditor, and audit committee
Management
Audit committee External auditor C
B A

42
Table 1 Sample distribution Panel A. Distribution by year
Year ACT = 1 ACT = 0 Total Percentage 2004 77 328 405 19.01% 2005 105 461 566 18.55% 2006 123 548 671 18.33% 2007 186 800 986 18.86% 2008 261 1,029 1,290 20.23% 2009 255 1,167 1,422 17.93% 2010 275 1,383 1,658 16.59% Total 1,282 5,716 6,998 18.32%
Panel B. Distribution by industry Industry N ACT = 1 ACT = 0
Farming, Forestry, Animal Husbandry, and Fishing 154 1.56% 2.34% Mining 132 1.09% 2.06% Food and Beverage 272 3.59% 3.95% Textile, Apparel, Fur and Leather 289 5.23% 3.88% Furniture Manufacturing 25 0.86% 0.24% Paper and Allied Products; Printing 132 1.40% 1.99% Petroleum, Chemical, Plastics, and Rubber Products 737 9.91% 10.67% Electronics 296 4.68% 4.13% Metal and Non-metal 620 8.97% 8.83% Machinery, Equipment, and Instrument Manufacturing 1,146 14.59% 16.78% Medicine and Biological Products 475 5.54% 7.07% Other Manufacturing 60 0.47% 0.94% Utilities 317 4.37% 4.57% Construction 146 2.26% 2.05% Transportation and Warehousing 295 5.46% 3.94% Information Technology 449 5.15% 6.70% Wholesale and Retail Trades 463 9.67% 5.93% Banking and Financial Institutions 8 0.00% 0.14% Real Estate 373 5.85% 5.21% Public Facilities and Other Services 197 2.96% 2.78% Communication and Cultural Industries 54 0.39% 0.86% Conglomerates 358 6.01% 4.92% Total 6,998 100.00% 100.00% The sample includes all A-share companies that have established audit committees, after excluding observations with missing values in variables necessary for multivariate regression analysis. ACT is equal to one if at least one of audit committee member has school ties with one of the engagement auditors, and zero otherwise.

43
Table 2 Descriptive statistics Variable Mean Median Min. Max. Std. Dev. N
ACT 0.183 0.000 0.000 1.000 0.387 6,998 ACT_Num 0.226 0.000 0.000 5.000 0.525 6,998 ACT_Chair 0.128 0.000 0.000 1.000 0.334 6,998 ACT_NChair 0.056 0.000 0.000 1.000 0.229 6,998 ACT_ACC 0.143 0.000 0.000 1.000 0.350 6,998 ACT_NACC 0.041 0.000 0.000 1.000 0.197 6,998 ACT_Dept 0.095 0.000 0.000 1.000 0.294 6,748 ACT_NDept 0.057 0.000 0.000 1.000 0.233 6,748 MGT_Chair/CEO 0.012 0.000 0.000 1.000 0.110 6,998 MGT_Other 0.093 0.000 0.000 1.000 0.290 6,998 MAO 0.076 0.000 0.000 1.000 0.265 6,998 Restatement 0.114 0.000 0.000 1.000 0.318 3,918 Fraud 0.025 0.000 0.000 1.000 0.155 6,998 Big4 0.063 0.000 0.000 1.000 0.242 6,998 Top10 0.434 0.000 0.000 1.000 0.496 6,998 LTA 21.509 21.400 18.493 25.057 1.218 6,998 Leverage 0.540 0.519 0.068 2.529 0.313 6,998 Loss 0.113 0.000 0.000 1.000 0.317 6,998 ROA 0.027 0.030 -0.382 0.225 0.076 6,998 Liquidity 1.646 1.217 0.113 10.948 1.628 6,998 REC 0.095 0.070 0.000 0.416 0.090 6,998 INV 0.174 0.138 0.000 0.747 0.155 6,998 Fee 13.160 13.122 11.983 15.009 0.559 5,891 Tobin’s Q 2.571 1.935 0.883 13.612 2.030 6,760 Growth 0.245 0.146 -0.771 5.162 0.676 6,760 CAPEXP 0.053 0.037 -0.074 0.273 0.060 6,760 Variable definitions: ACT = An indicator variable that is equal to one if at least one of AC members has school ties
with one of the engagement auditors, and zero otherwise. ACT_Num = The number of committee members that have school ties with one of the engagement
auditors. ACT_Chair = An indicator variable that is equal to one if AC chair has school ties with one of the
engagement auditors, and zero otherwise. ACT_NChair = An indicator variable that is equal to one if one of AC members other than chair has
school ties with one of the engagement auditors, and zero otherwise. ACT_ACC = An indicator variable that is equal to one if at least one of AC members with accounting
background (including accounting professors, public accountants, or CFOs from another firm) has school ties with one of the engagement auditors, and zero otherwise.
ACT_NACC = An indicator variable that is equal to one if at least one of AC members without accounting background has school ties with one of the engagement auditors, and zero otherwise.
ACT_Dept = An indicator variable that is equal to one if at least one of AC members and one of the
44
engagement auditors are from the same department/school, and zero otherwise ACT_NDept = An indicator variable that is equal to one if at least one of AC members have school ties
with one of the engagement auditors, but none of them are from the same department/school, and zero otherwise.
MAO = An indicator variable that is equal to one for observations where auditors modify audit opinions (including unqualified opinions with explanatory notes, qualified, and disclaimed), and zero otherwise.
Restatement = An indicator variable that is equal to one if earnings in the current year are restated in subsequent years, and zero otherwise.
Fraud = An indicator variable that is equal to one if the observation is subsequently sanctioned by the CSRC, MOF, or stock exchanges due to accounting frauds or accounting irregularities in the current year, and zero otherwise.
Big4 = An indicator variable for observations that are audited by the international Big 4 auditors.
Top10 = An indicator variable for observations that are audited by the domestic top 10 auditors, ranked by the number of listed clients in the year of interest.
LTA = Natural logarithm of client’s total assets at the fiscal year end. Leverage = Ratio of total liabilities to total assets. Loss = An indicator variable for negative net income. ROA = Net income divided by total assets at the fiscal year end. Liquidity = Ratio of current assets to current liabilities. REC = Net accounts receivables divided by total assets at the fiscal year end. INV = Inventories divided by total assets at the fiscal year end). Fee = Natural logarithm of annual audit fees. Tobin’s Q = Market value of common equity plus book value of debt divided by total assets at the
end of the year. Growth = The difference between sales of the current and the prior year divided by prior year
sales. CAPEXP = The ratio of capital expenditures over total assets at the end of year. All the continuous variables are winsorized at the 1st and 99th percentile.
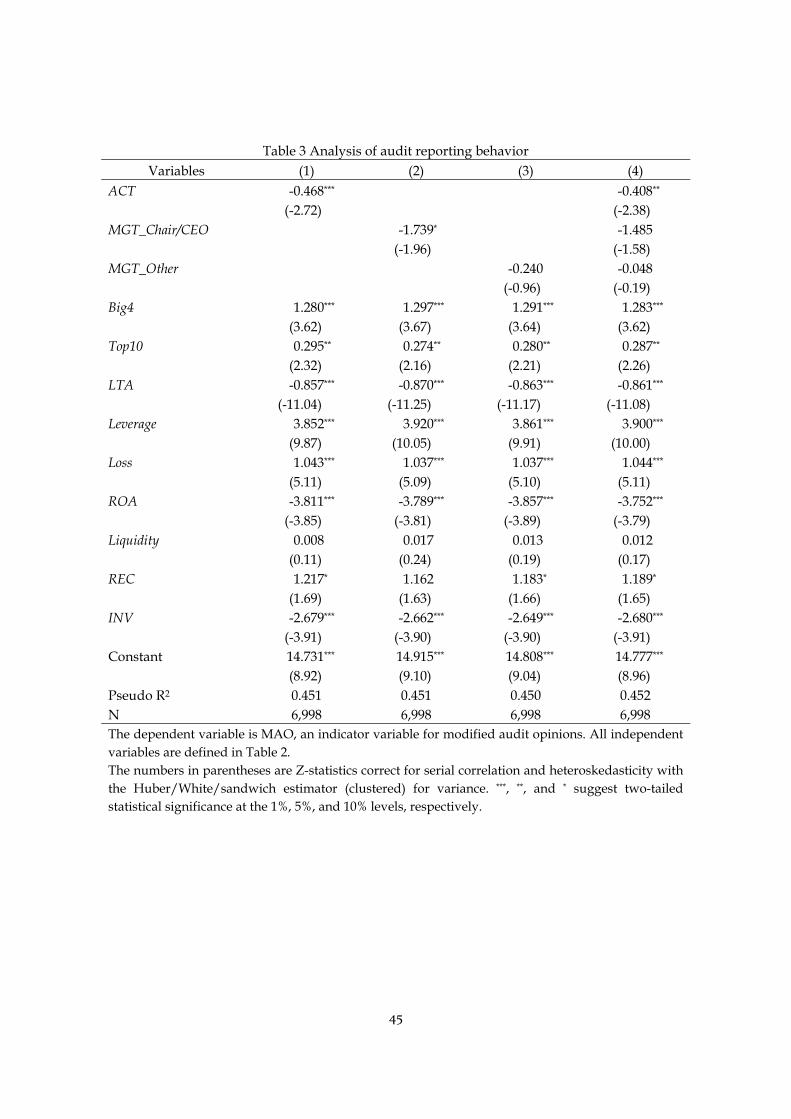
45
Table 3 Analysis of audit reporting behavior Variables (1) (2) (3) (4)
ACT -0.468*** -0.408** (-2.72) (-2.38)
MGT_Chair/CEO -1.739* -1.485 (-1.96) (-1.58) MGT_Other -0.240 -0.048
(-0.96) (-0.19) Big4 1.280*** 1.297*** 1.291*** 1.283***
(3.62) (3.67) (3.64) (3.62) Top10 0.295** 0.274** 0.280** 0.287**
(2.32) (2.16) (2.21) (2.26) LTA -0.857*** -0.870*** -0.863*** -0.861***
(-11.04) (-11.25) (-11.17) (-11.08) Leverage 3.852*** 3.920*** 3.861*** 3.900***
(9.87) (10.05) (9.91) (10.00) Loss 1.043*** 1.037*** 1.037*** 1.044***
(5.11) (5.09) (5.10) (5.11) ROA -3.811*** -3.789*** -3.857*** -3.752***
(-3.85) (-3.81) (-3.89) (-3.79) Liquidity 0.008 0.017 0.013 0.012
(0.11) (0.24) (0.19) (0.17) REC 1.217* 1.162 1.183* 1.189*
(1.69) (1.63) (1.66) (1.65) INV -2.679*** -2.662*** -2.649*** -2.680***
(-3.91) (-3.90) (-3.90) (-3.91) Constant 14.731*** 14.915*** 14.808*** 14.777***
(8.92) (9.10) (9.04) (8.96) Pseudo R2 0.451 0.451 0.450 0.452 N 6,998 6,998 6,998 6,998 The dependent variable is MAO, an indicator variable for modified audit opinions. All independent variables are defined in Table 2. The numbers in parentheses are Z-statistics correct for serial correlation and heteroskedasticity with the Huber/White/sandwich estimator (clustered) for variance. ***, **, and * suggest two-tailed statistical significance at the 1%, 5%, and 10% levels, respectively.

46
Table 4 Analysis of audit reporting behavior by the types of audit committee members Variables (1) (2) (3)
ACT_Chair -0.404** (-2.00) ACT_NChair -0.416
(-1.42) ACT_ACC -0.568*** (-2.76) ACT_NACC 0.007 (0.03) ACT_Dept -0.535**
(-2.21) ACT_NDept -0.436 (-1.50) MGT_Chair/CEO -1.485 -1.546* -2.409***
(-1.58) (-1.67) (-2.97) MGT_Other -0.048 -0.035 0.022 (-0.19) (-0.14) (0.09) Big4 1.283*** 1.282*** 1.358***
(3.62) (3.63) (3.80) Top10 0.287** 0.293** 0.326**
(2.26) (2.29) (2.50) LTA -0.861*** -0.861*** -0.887***
(-11.08) (-11.08) (-11.00) Leverage 3.900*** 3.910*** 4.032***
(9.97) (10.04) (9.60) Loss 1.044*** 1.040*** 1.000***
(5.11) (5.08) (4.73) ROA -3.752*** -3.777*** -3.903***
(-3.78) (-3.81) (-3.80) Liquidity 0.012 0.015 0.020
(0.17) (0.22) (0.29) REC 1.188 1.183 1.007
(1.64) (1.64) (1.36) INV -2.680*** -2.653*** -2.433***
(-3.91) (-3.89) (-3.56) Constant 14.777*** 14.743*** 15.194***
(8.96) (8.96) (8.91) Pseudo R2 0.452 0.453 0.463 N 6,998 6,998 6,748 The dependent variable is MAO, an indicator variable for modified audit opinions. All independent variables are defined in Table 2. The numbers in parentheses are Z-statistics correct for serial correlation and heteroskedasticity with the Huber/White/sandwich estimator (clustered) for variance. ***, **, and * suggest two-tailed statistical significance at the 1%, 5%, and 10% levels, respectively.

47
Table 5 Analysis of earnings restatement Variables (1) (2) (3) (4)
ACT 0.334*** 0.305** (2.64) (2.38)
MGT_Chair/CEO 0.739* 0.560 (1.91) (1.43) MGT_Other 0.127 -0.009
(0.70) (-0.05) Big4 -1.313*** -1.321*** -1.337*** -1.306***
(-3.56) (-3.59) (-3.62) (-3.54) Top10 -0.171 -0.154 -0.158 -0.166
(-1.55) (-1.40) (-1.44) (-1.51) MAO 0.649*** 0.628*** 0.618*** 0.657*** (3.27) (3.18) (3.12) (3.31) LTA 0.040 0.050 0.046 0.043
(0.74) (0.92) (0.84) (0.80) Leverage 0.268 0.258 0.266 0.261
(1.61) (1.55) (1.60) (1.57) ROA -1.276 -1.281 -1.241 -1.307
(-1.45) (-1.45) (-1.40) (-1.48) Loss 0.605*** 0.608*** 0.619*** 0.596***
(3.00) (3.01) (3.07) (2.96) Constant -2.177* -2.334** -2.261* -2.239*
(-1.84) (-1.97) (-1.90) (-1.89) Pseudo R2 0.091 0.090 0.089 0.092 N 3,918 3,918 3,918 3,918 The dependent variable is Restatement, an indicator variable for observations where earnings in the current year are restated in subsequent years. All independent variables are defined in Table 2. The numbers in parentheses are Z-statistics correct for serial correlation and heteroskedasticity with the Huber/White/sandwich estimator (clustered) for variance. ***, **, and * suggest two-tailed statistical significance at the 1%, 5%, and 10% levels, respectively.

48
Table 6 Analysis of earnings restatement by the types of audit committee members Variables (1) (2) (3)
ACT_Chair 0.322** (2.22) ACT_NChair 0.264
(1.22) ACT_ACC 0.237* (1.68) ACT_NACC 0.522** (2.17) ACT_Dept 0.343** (2.16) ACT_NDept 0.254 (1.09) MGT_Chair/CEO 0.565 0.540 0.843** (1.44) (1.37) (2.18) MGT_Other -0.007 -0.007 0.016 (-0.04) (-0.04) (0.09) Big4 -1.306*** -1.310*** -1.278***
(-3.54) (-3.54) (-3.44) Top10 -0.167 -0.161 -0.186*
(-1.51) (-1.45) (-1.65) MAO 0.656*** 0.654*** 0.580*** (3.31) (3.31) (2.84) LTA 0.043 0.044 0.030
(0.80) (0.81) (0.55) Leverage 0.263 0.256 0.314*
(1.58) (1.54) (1.89) ROA -1.298 -1.340 -1.102
(-1.47) (-1.52) (-1.27) Loss 0.598*** 0.592*** 0.626***
(2.97) (2.94) (3.08) Constant -2.240* -2.257* -1.994*
(-1.89) (-1.90) (-1.65) Pseudo R2 0.092 0.092 0.089 N 3,918 3,918 3,773 The dependent variable is Restatement, an indicator variable for observations where earnings in the current year are restated in subsequent years. All independent variables are defined in Table 2. The numbers in parentheses are Z-statistics correct for serial correlation and heteroskedasticity with the Huber/White/sandwich estimator (clustered) for variance. ***, **, and * suggest two-tailed statistical significance at the 1%, 5%, and 10% levels, respectively.
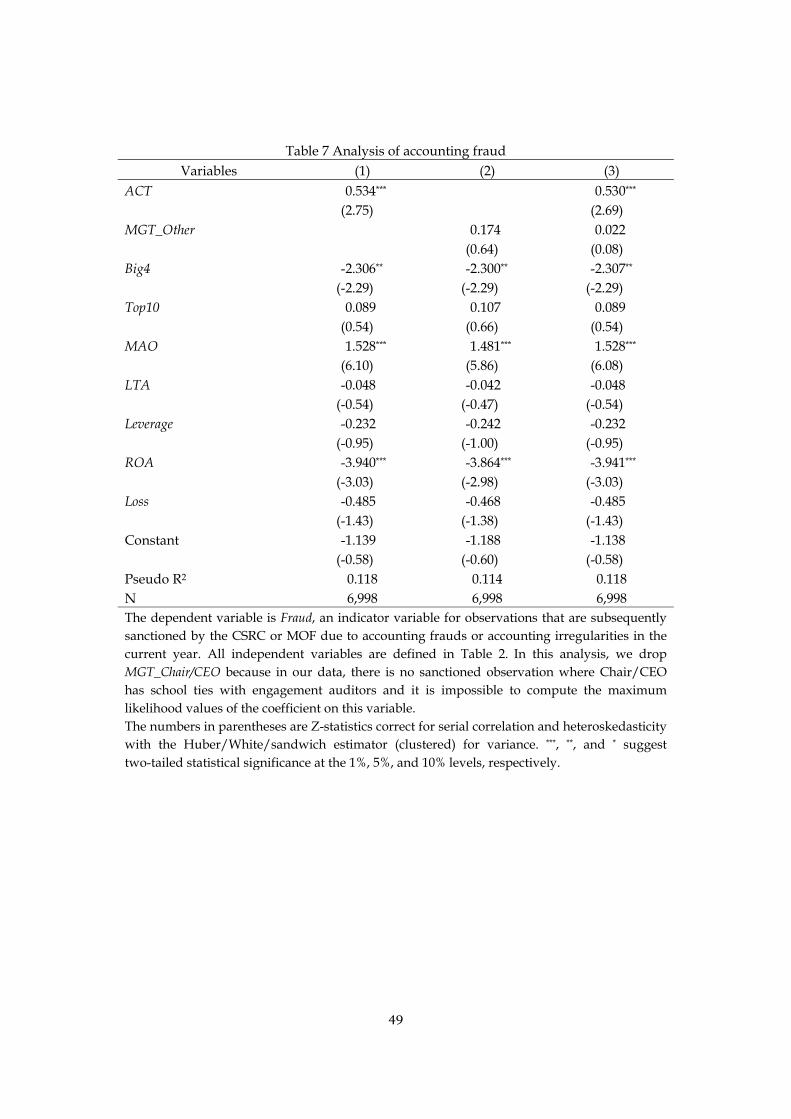
49
Table 7 Analysis of accounting fraud Variables (1) (2) (3)
ACT 0.534*** 0.530*** (2.75) (2.69)
MGT_Other 0.174 0.022 (0.64) (0.08)
Big4 -2.306** -2.300** -2.307** (-2.29) (-2.29) (-2.29)
Top10 0.089 0.107 0.089 (0.54) (0.66) (0.54)
MAO 1.528*** 1.481*** 1.528*** (6.10) (5.86) (6.08) LTA -0.048 -0.042 -0.048
(-0.54) (-0.47) (-0.54) Leverage -0.232 -0.242 -0.232
(-0.95) (-1.00) (-0.95) ROA -3.940*** -3.864*** -3.941***
(-3.03) (-2.98) (-3.03) Loss -0.485 -0.468 -0.485
(-1.43) (-1.38) (-1.43) Constant -1.139 -1.188 -1.138
(-0.58) (-0.60) (-0.58) Pseudo R2 0.118 0.114 0.118 N 6,998 6,998 6,998 The dependent variable is Fraud, an indicator variable for observations that are subsequently sanctioned by the CSRC or MOF due to accounting frauds or accounting irregularities in the current year. All independent variables are defined in Table 2. In this analysis, we drop MGT_Chair/CEO because in our data, there is no sanctioned observation where Chair/CEO has school ties with engagement auditors and it is impossible to compute the maximum likelihood values of the coefficient on this variable. The numbers in parentheses are Z-statistics correct for serial correlation and heteroskedasticity with the Huber/White/sandwich estimator (clustered) for variance. ***, **, and * suggest two-tailed statistical significance at the 1%, 5%, and 10% levels, respectively.

50
Table 8 Analysis of accounting fraud by the types of audit committee members Variables (1) (2) (3)
ACT_Chair 0.585*** (2.64) ACT_NChair 0.382
(1.10) ACT_ACC 0.627*** (2.95) ACT_NACC 0.179 (0.45) ACT_Dept 0.182 (0.64) ACT_NDept 0.481 (1.43) MGT_Other 0.035 0.024 0.216 (0.13) (0.09) (0.77) Big4 -2.302** -2.293** -2.263**
(-2.29) (-2.28) (-2.26) Top10 0.085 0.080 0.093
(0.52) (0.49) (0.55) MAO 1.528*** 1.538*** 1.633*** (6.07) (6.12) (6.34) LTA -0.047 -0.048 0.003
(-0.53) (-0.54) (0.03) Leverage -0.229 -0.236 -0.194
(-0.94) (-0.97) (-0.80) ROA -3.923*** -3.911*** -3.443***
(-3.01) (-3.01) (-2.67) Loss -0.480 -0.476 -0.428
(-1.41) (-1.40) (-1.21) Constant -1.160 -1.119 -2.258
(-0.59) (-0.57) (-1.13) Pseudo R2 0.118 0.119 0.117 N 6,998 6,998 6,748 The dependent variable is Fraud, an indicator variable for observations that are subsequently sanctioned by the CSRC or MOF due to accounting frauds or accounting irregularities in the current year. All independent variables are defined in Table 2. The numbers in parentheses are Z-statistics correct for serial correlation and heteroskedasticity with the Huber/White/sandwich estimator (clustered) for variance. ***, **, and * suggest two-tailed statistical significance at the 1%, 5%, and 10% levels, respectively.

51
Table 9 Analysis of firm value Variables (1) (2) (3) (4) ACT -0.093** -0.091** (-2.24) (-2.16) MGT_Chair/CEO -0.060 -0.016 (-0.34) (-0.09) MGT_Other -0.039 -0.012 (-0.64) (-0.20) Big4 0.723*** 0.723*** 0.725*** 0.723*** (10.19) (10.19) (10.21) (10.17) Top10 0.109*** 0.107*** 0.107*** 0.109*** (2.85) (2.81) (2.80) (2.85) LTA -0.839*** -0.840*** -0.840*** -0.839*** (-33.77) (-33.85) (-33.77) (-33.74) Leverage 2.257*** 2.262*** 2.261*** 2.257*** (13.73) (13.76) (13.75) (13.72) ROA 4.906*** 4.903*** 4.903*** 4.907*** (9.26) (9.26) (9.25) (9.26) Liquidity 0.268*** 0.269*** 0.269*** 0.268*** (11.88) (11.92) (11.92) (11.87) GROWTH 0.019 0.019 0.019 0.019 (0.57) (0.58) (0.58) (0.57) CAPEXP 1.263*** 1.268*** 1.270*** 1.263*** (3.67) (3.68) (3.69) (3.67) Constant 17.528*** 17.539*** 17.533*** 17.528*** (34.01) (34.05) (34.00) (33.99) Adjusted R2 0.490 0.490 0.490 0.490 N 6,760 6,760 6,760 6,760 The dependent variable is Tobin’s Q, market value of common equity plus book value of debt divided by total assets at the end of the year. All independent variables are defined in Table 2. The numbers in parentheses are T-statistics correct for serial correlation and heteroskedasticity with the Huber/White/sandwich Estimator (clustered) for variance. ***, **, and * suggest two-tailed statistical significance at the 1%, 5%, and 10% levels, respectively.

52
Table 10 Analysis of firm value by the types of audit committee members (1) (2) (3) ACT_Chair -0.111**
(-2.34)ACT_NChair -0.043
(-0.60)ACT_ACC -0.094**
(-2.08)ACT_NACC -0.079
(-0.92)ACT_Dept -0.156***
(-3.31) ACT_NDept -0.028
(-0.41) MGT_Chair/CEO -0.021 -0.017 0.052
(-0.12) (-0.10) (0.27) MGT_Other -0.015 -0.013 -0.019
(-0.25) (-0.20) (-0.31) BIG4 0.723*** 0.723*** 0.728***
(10.17) (10.17) (10.20) Top10 0.109*** 0.109*** 0.095**
(2.86) (2.85) (2.47) LTA -0.839*** -0.839*** -0.833***
(-33.75) (-33.74) (-33.57) Leverage 2.256*** 2.257*** 2.317***
(13.72) (13.72) (14.13) ROA 4.902*** 4.906*** 5.093***
(9.26) (9.26) (9.78) Liquidity 0.268*** 0.268*** 0.274***
(11.88) (11.87) (11.91) GROWTH 0.019 0.019 0.019
(0.58) (0.57) (0.57) CAPEXP 1.267*** 1.264*** 1.138***
(3.68) (3.67) (3.25) Constant 17.532*** 17.528*** 17.382***
(34.00) (33.99) (33.69) Adjusted R2 0.490 0.490 0.497 N 6,760 6,760 6,520 The dependent variable is Tobin’s Q, market value of common equity plus book value of debt divided by total assets at the end of the year. All independent variables are defined in Table 2. The numbers in parentheses are T-statistics correct for serial correlation and heteroskedasticity with the Huber/White/sandwich Estimator (clustered) for variance. ***, **, and * suggest two-tailed statistical significance at the 1%, 5%, and 10% levels, respectively.

53
Table 11 Analysis of audit fees Variables (1) (2) (3) (4)
ACT 0.034*** 0.030** (2.74) (2.32)
MGT_Chair/CEO 0.074** 0.055 (2.09) (1.52)
MGT_Other 0.026 0.015 (1.60) (0.85) Big4 0.681*** 0.680*** 0.680*** 0.680***
(22.45) (22.47) (22.40) (22.44) Top10 0.113*** 0.113*** 0.113*** 0.113***
(11.21) (11.26) (11.27) (11.24) MAO 0.130*** 0.129*** 0.129*** 0.131*** (5.66) (5.63) (5.60) (5.70) LTA 0.296*** 0.297*** 0.296*** 0.296***
(53.03) (53.20) (53.08) (53.07) ROA 0.075 0.077 0.080 0.074
(0.77) (0.78) (0.81) (0.75) Liquidity -0.010** -0.010*** -0.010*** -0.010** (-2.52) (-2.60) (-2.59) (-2.53) Leverage 0.108*** 0.106*** 0.108*** 0.107*** (5.31) (5.21) (5.28) (5.25) REC 0.066 0.073 0.071 0.067 (0.99) (1.09) (1.06) (1.00) INV -0.120*** -0.119*** -0.120*** -0.119*** (-3.00) (-2.97) (-2.99) (-2.97) Loss 0.016 0.017 0.017 0.016
(0.74) (0.77) (0.79) (0.74) Constant 6.687*** 6.679*** 6.688*** 6.681***
(53.43) (53.38) (53.47) (53.39) Adjusted R2 0.554 0.554 0.554 0.554 N 5,891 5,891 5,891 5,891 The dependent variable is Fee, Natural logarithm of annual audit fees. All independent variables are defined in Table 2. The numbers in parentheses are T-statistics correct for serial correlation and heteroskedasticity with the Huber/White/sandwich estimator (clustered) for variance. ***, **, and * suggest two-tailed statistical significance at the 1%, 5%, and 10% levels, respectively.
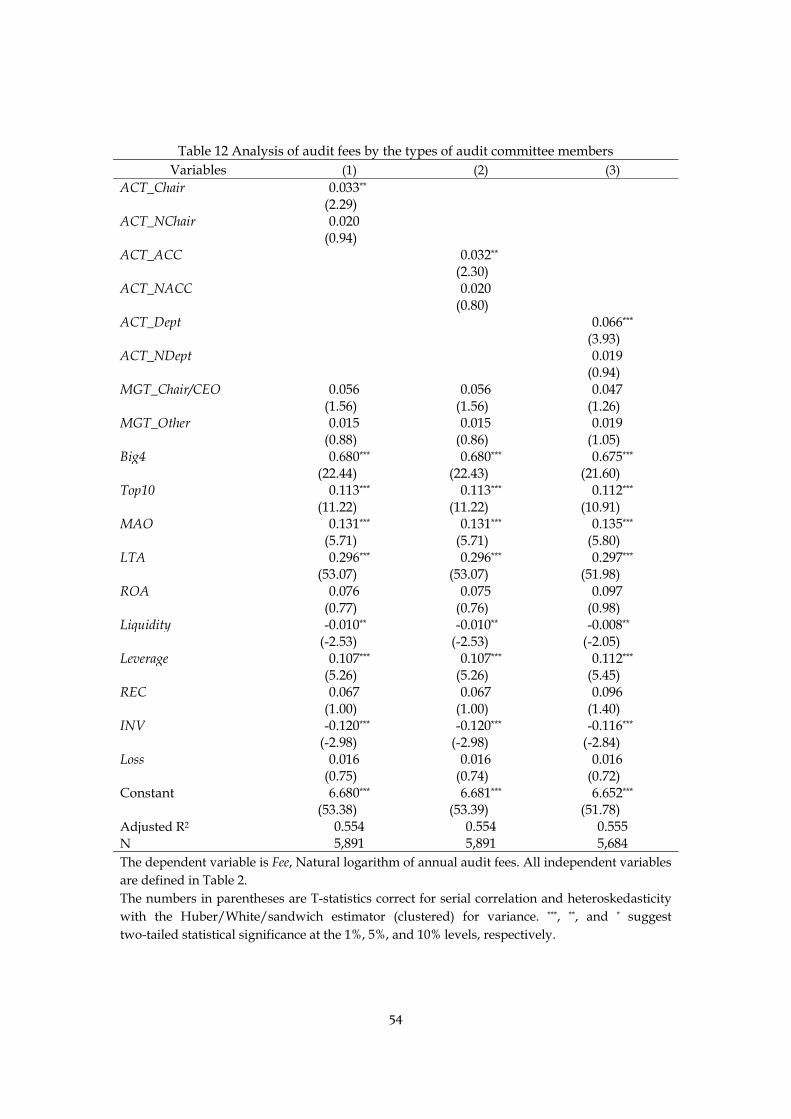
54
Table 12 Analysis of audit fees by the types of audit committee members Variables (1) (2) (3)
ACT_Chair 0.033** (2.29) ACT_NChair 0.020
(0.94) ACT_ACC 0.032** (2.30) ACT_NACC 0.020 (0.80) ACT_Dept 0.066*** (3.93) ACT_NDept 0.019 (0.94) MGT_Chair/CEO 0.056 0.056 0.047 (1.56) (1.56) (1.26) MGT_Other 0.015 0.015 0.019 (0.88) (0.86) (1.05) Big4 0.680*** 0.680*** 0.675*** (22.44) (22.43) (21.60) Top10 0.113*** 0.113*** 0.112*** (11.22) (11.22) (10.91) MAO 0.131*** 0.131*** 0.135*** (5.71) (5.71) (5.80) LTA 0.296*** 0.296*** 0.297*** (53.07) (53.07) (51.98) ROA 0.076 0.075 0.097 (0.77) (0.76) (0.98) Liquidity -0.010** -0.010** -0.008**
(-2.53) (-2.53) (-2.05) Leverage 0.107*** 0.107*** 0.112***
(5.26) (5.26) (5.45) REC 0.067 0.067 0.096
(1.00) (1.00) (1.40) INV -0.120*** -0.120*** -0.116***
(-2.98) (-2.98) (-2.84) Loss 0.016 0.016 0.016
(0.75) (0.74) (0.72) Constant 6.680*** 6.681*** 6.652***
(53.38) (53.39) (51.78) Adjusted R2 0.554 0.554 0.555 N 5,891 5,891 5,684 The dependent variable is Fee, Natural logarithm of annual audit fees. All independent variables are defined in Table 2. The numbers in parentheses are T-statistics correct for serial correlation and heteroskedasticity with the Huber/White/sandwich estimator (clustered) for variance. ***, **, and * suggest two-tailed statistical significance at the 1%, 5%, and 10% levels, respectively.