do open primaries improve representation? an experimental
TRANSCRIPT
UC BerkeleyUC Berkeley Previously Published Works
TitleDo open primaries improve representation? An experimental test of California's 2012 top-two primary
Permalinkhttps://escholarship.org/uc/item/5pz04073
JournalLegislative Studies Quarterly, 41(2)
ISSN0362-9805
AuthorsAhler, DJCitrin, JLenz, GS
Publication Date2016-05-01
DOI10.1111/lsq.12113 Peer reviewed
eScholarship.org Powered by the California Digital LibraryUniversity of California

DOUGLAS J. AHLERJACK CITRIN
GABRIEL S. LENZUniversity of California, Berkeley
Do Open PrimariesImprove Representation?
An Experimental Test of
California’s 2012 Top-Two Primary
To improve representation and alleviate polarization among US lawmakers,many have promoted open primaries—allowing voters to choose candidates from anyparty—but the evidence that this reform works is mixed. To determine whether openprimaries lead voters to choose ideologically proximate candidates, we conducted astatewide experiment just before California’s 2012 primaries, the first conducted under anew top-two format. We find that voters failed to distinguish moderate and extreme can-didates. As a consequence, voters actually chose more ideologically distant candidateson the new ballot, and the reform failed to improve the fortunes of moderatecongressional and state senate candidates.
According to a large body of research in American politics,citizens’ political preferences are not polarized but their choices overwho represents them are (Bafumi and Herron 2010; Fiorina, Abrams,and Pope 2005). Despite politicians and other party elites being moreideologically polarized than at any time in the past century (Bonica2014; McCarty, Poole, and Rosenthal 2008), ordinary citizens still tendto claim to be ideological moderates and hold ideologically heterodoxbundles of positions (Baldassarri and Gelman 2008; Broockman 2016;Fiorina and Abrams 2009). On its face, such a divergence betweenvoters’ preferences and the choices on offer is potentially worrisome fordemocratic representation (Bafumi and Herron 2010; Fiorina andAbrams 2009). But the ramifications of elite polarization are potentiallymore far-reaching and disturbing. In recent years, gridlock over routinenominations in the Senate spurred Democrats to “go nuclear” and changethe filibuster rules. Partisan brinkmanship led Standard and Poor’s todowngrade the nation’s credit rating for the first time in history. And
LEGISLATIVE STUDIES QUARTERLY, 41, 2, May 2016 237DOI: 10.1111/lsq.12113VC 2016 Washington University in St. Louis
ideological warfare produced the first federal government shutdown in17 years. Since voters say they want effective governance above all else(Fiorina, Abrams, and Pope 2005), the rise of legislative intransigence asa consequence of rigid ideological divisions further signals a breakdownof representation.
Reforming primary elections to make them more “open” is oneproposed solution for this worrisome state of affairs. Open primariestake several forms but generally allow voters to cast ballots for candi-dates of more than one party. The boldest recent reform is the top-two,or runoff, format. Designed to reduce partisan control of the nominat-ing process, it places candidates with any party label (or no partylabel) on a single ballot, with the top two vote getters, regardless ofparty, then competing in the general election. On the assumption thatvoters prefer candidates more proximate to their own ideology andthat in the aggregate they tend to prefer centrist policies, reformerstheorize that these changes will benefit moderate candidates who,once elected, will be more willing to compromise. Proponents alsoargue that open primaries may increase participation by moderate vot-ers (though see McCarty 2011, 365). This reasoning is consistent withpolitical scientists’ models of primary systems (Aranson andOrdeshook 1972; Coleman 1971, 1972; McGann 2002) and was thepitch California voters heard in 2010 from Abel Maldonado, theauthor of the Top-Two Primaries Act that won 54% in a referendumand took effect in the June 2012 primaries.1
Many appear to have concluded that open primaries are likely toimprove ideological congruence between voters and candidates, therebyyielding less ideologically extreme legislators (Burden 2004; Fiorina,Abrams, and Pope 2005; Hacker and Pierson 2005; Kanthak and Morton2001; Mann and Ornstein 2012). Indeed, McCarty observes, “It seemsalmost a logical certainty that opening primary elections to more nonpar-tisan and independent voters should have a moderating effect on politicsby increasing the chance that moderate candidates get nominated”(2011, 363). But for all the apparent certainty, empirical evidence ismixed.
On one side, a handful of studies find that open primaries do mod-erate political outcomes. For example, Members of Congress’ (MCs)roll-call votes from 1982 to 1990 appear to hew more closely to their dis-tricts’ ideological leanings in states with semi-closed or open-primariesthan in states with closed party primaries (Gerber and Morton 1998).And, examining California’s first attempt at primary reform in 1998,Gerber (2002) concludes that moderates were more likely to advance to
238 Douglas J. Ahler, Jack Citrin, and Gabriel S. Lenz

the general election in state legislative races in 1998 than in 1996,controlling for other characteristics of the contests.
On the other hand, several studies fail to find that open primariesmoderate politicians. Analyzing state legislators’ roll-call votes from1996 to 2006, McGhee et al. (2014) conclude that open primaries are notassociated with reduced legislative polarization at the state level.McGhee (2014) reaches similar conclusions about MCs’ roll-call voting.According to several studies, ideologically extreme congressional candi-dates fail to fare better in closed primaries compared to open primaries(Brady, Han, and Pope 2007; Hall and Snyder 2013).2 In another studyof the 1998 California blanket primaries, Bullock and Clinton (2011)find that MCs elected in 1998 were on average no more moderate in theirroll-call voting than those elected in 1996 under the closed-primary sys-tem, though MCs in competitive districts may have moderated slightly.
Studies on primary reform thus have produced mixed findings, butthey have also relied solely on cross-sectional or pretest-posttest obser-vational designs, which have well-known shortcomings for causalinference (Campbell and Stanley 1963). Consequently, inferences fromthese studies about how primary reforms affect polarization may be vul-nerable to alternative explanations. To overcome these limitations, weturned to an experiment. In a large survey of registered California votersconducted just prior to the June 6 California primary, we randomlyassigned half the sample to vote with a ballot identical to the one theywould see in the actual top-two primary (treatment), and the other half tothe traditional ballot they would have seen had the referendum (Proposi-tion 14) failed (control). With this design, we assess whether the reformled voters to choose candidates closer to their claimed ideologies—thatis, whether the reform improved proximity voting—and whether ithelped moderate candidates for the US Congress and the California StateSenate.
The survey in which we conducted the experiment is one of themost comprehensive studies of congressional primaries in a state, ena-bling analysis of a range of factors potentially related to the success orfailure of primary reform. We therefore begin the article not with theexperimental results themselves but with an empirical analysis ofwhether the assumptions reformers often make are plausible. In particu-lar, we examine whether district electorates are indeed more moderatethan partisan primary electorates and whether voters have the knowledgenecessary to pick proximate (and therefore often moderate) candidates.
Previewing the findings, voters appear to know so little about thecandidates’ positions that, even if they wanted to, they could notintentionally cast a ballot for their district’s moderate candidates. They
239Do Open Primaries Improve Representation?

distinguish ideologically between Democrats and Republicans, but theydo not distinguish between candidates within party. In fact, voters oftenperceive Tea Party candidates, “Occupy” candidates, and genuinemoderates as equally centrist. As one might therefore expect, votersfailed to choose more proximate candidates under the top-two format inour experiment. To a reformist’s chagrin, this suggests that voters lackthe knowledge to incentivize centrism in open primaries for Congressand California State Senate. More broadly, this lack of finer-grainedinformation about candidate ideology runs contrary to assumptions fre-quently made in spatial models of legislative elections and suggestslimits to citizens’ ability to hold politicians accountable for ideologicalextremism even with open primary reform.
The article now proceeds as follows. First, we describe the experi-ment and the data we collected on candidates. Second, we bring thesedata to bear on the most critical assumptions underlying reformers’hopes. Third, we analyze the data at the level of individual voters, focus-ing on whether the reform led them to choose more ideologicallyproximate candidates. Fourth, we explore alternative interpretations andlook for evidence of the reform’s effectiveness among subgroups ofvoters. Fifth, we analyze the experimental data at the candidate level todetermine whether the top-two reform improved the vote share ofmoderate candidates. Sixth, we extend the analysis from congressionalraces to state senate races. Finally, we conclude by discussing the impli-cations of our negative findings as well as their limitations for a longer-term assessment of the new ballot form.
Experiment and Data
In the 10 days before the 2012 California primary, we polled4,599 registered California voters recruited through Survey SamplingInternational (SSI). Although not a probability sample, the partici-pants represent the population on party registration, ideologicalself-placement, and other key demographic variables. The survey’sresults on vote choice also closely mirror the results of the actualelection.3
The top-two ballot can only help moderate candidates when theyappear on the ballot and compete against more extreme candidates.Accordingly, about one month before the election, we classified districtsinto three categories: (1) no chance the reform could help a moderate, (2)a slight chance it could help, (3) a better than slight chance it could help.We based these decisions largely on whether at least one viable moderatefaced at least one (more) extreme candidate who was also viable, taking
240 Douglas J. Ahler, Jack Citrin, and Gabriel S. Lenz

into account the district’s partisan registration and electoral history. Weconducted the ballot experiment in the 34 of California’s 53 congres-sional districts that fell into categories 2 and 3. In these districts, weconsidered 130 of the 238 candidates who ran as viable (based on theauthors’ preprimary assessments of previous election results, endorse-ments, media coverage, and money raised).4 Our analysis mostly focuseson viable candidates in the 20 category 3 races, which we call “best-casedistricts” (but the results are the same for all candidates; see Table 3).These contests had 110 candidates, 58 of whom we considered viable.
To determine whether moderate candidates benefit from the top-two primary, we need to identify the moderates. Here, we employmultiple measures. To learn about participants’ perceptions of the candi-dates, we asked participants to rate the ideology of their districts’candidates using a 7-point scale after they reported their intended votechoice. While these ratings allow us to answer questions about voters’knowledge of the candidates, they may fail to reliably measure candidateideology because voters tend to project their own positions onto theirpreferred candidates (Dalager 1996; Granberg and Brent 1980; Markusand Converse 1979; Merrill, Grofman, and Adams 2001; cf. Krosnick1990), a tendency that appears markedly in these data.5 We thereforeassess candidate ideology by averaging four other measures. First, priorto fielding the survey, the research team visited candidates’ websites,scoured media coverage of the races, and attempted to rate the candidateswith the 7-point ideology scale. Second, we hired 204 politically knowl-edgeable Mechanical Turk workers to visit websites for viablecandidates in the 20 category 3 districts and rate those candidates on the7-point scale.6 Third, we use Campaign Finance scores (CFscores),which map candidates into an ideological space based on the sources ofcampaign contributions (Bonica 2014). Fourth, we make use of ProjectVote Smart’s database of candidates’ positions, which reflects candidatesurveys and imputed positions from candidate statements and which wetransform into an ideology measure using a unidimensional itemresponse theory (IRT) model. We standardized the means and variancesof these four measures to zero and one, respectively, and averaged theminto a single index (no listwise deletion). They correlate reasonably wellfor Democratic candidates, less well for Republicans.7 Each of thesemeasures suffers from potential drawbacks, including substantial mea-surement error and missing data. We believe averaging these four is themost defensible approach for measuring candidate ideology, and theaverage score correlates with representatives’ ideologies as measuredwith roll-call votes (first-dimension DW-NOMINATE scores) at 0.61for Republican incumbents and 0.73 for Democratic incumbents
241Do Open Primaries Improve Representation?
(Poole and Rosenthal 1997). The findings are similar when we use eachitem individually, as we show below (see Table 2). We also use thisfour-item index to evaluate the accuracy of voters’ perceptions by com-paring candidates’ scores to voters’ own placements of the candidates.
Why Primary Reform May or May Not Succeed
According to their advocates, open primaries should improve ideo-logical representation because they allow voters to choose candidateswho agree with them ideologically regardless of party. For example, theyallow moderate Republicans to vote for a moderate Democratic candidateor allow an independent to vote for a moderate Republican candidate.There are, however, several reasons why voters may fail to cast ballotsfor moderate candidates in open primaries. And, if voters succeed indoing so, there are also reasons why moderates may not end up winning.In this section, we briefly examine the logic behind reformers’ hopes,focusing on four potential obstacles: voter ignorance, strategic voting,voter extremity, and the problem of more than two candidates.
Obstacle 1: Voter Ignorance of Candidate Ideology
The first obstacle is voter ignorance. To opt for ideologically proxi-mate candidates on an open ballot, voters must first have some sense forthe candidates’ ideologies. Do voters know enough about the candidatesto make such judgments? Can they distinguish, for example, moderateliberals from extreme liberals? To our knowledge, no large-scale surveyhas investigated this question in congressional primaries. For generalelections, however, studies yield worrisome results: citizens do, on aver-age, see incumbent House and Senate Democrats as more liberal thanRepublicans, but they generally are unable to distinguish ideologicaldifferences within parties (Franklin 1991; Snyder and Ting 2002;Tausanovitch and Warshaw 2013). If people cannot distinguish theviews of House candidates in general elections, it seems unlikely theycould do so in primary elections, when information tends to be scarcer(Moore 1987). Since our survey asked participants to place candidateson the same 7-point ideology scale as they placed themselves, we canshed light on this critical assumption about voters’ knowledge.
For advocates of primary reform, the results are discouraging. Vot-ers, we find, know little about primary candidates’ ideologies beyondwhat they can infer from party labels. Indeed, many participants wouldnot even venture a guess about candidates’ ideologies, especially whenasked about challengers. In the 20 best-case districts (category 3),
242 Douglas J. Ahler, Jack Citrin, and Gabriel S. Lenz

participants rated 30% of incumbents and 54% of viable challengerswith a “don’t know” or blank response. When participants did rate theideology of candidates, they generally hit wide of the mark—often verywide of the mark. In perhaps the most striking example, participantsfrom the 24th District failed to view Abel Maldonado, the moderateRepublican who spearheaded the top-two reform, as appreciably morecentrist than his Tea Party opponent, Chris Mitchum. As one of the fewRepublican lawmakers to break the Taxpayer Protection Pledge, Maldo-nado faced a backlash from the right, culminating in the local GOP’sdecision to endorse the inexperienced Tea Party candidate ChrisMitchum in the primary. But while Santa Barbara’s conservative politi-cal elite observed gaping ideological differences between the twocandidates, most constituents in the district failed to do so. They placedthe two candidates at almost the same position on the ideological contin-uum, with Maldonado at 5.21 and Mitchum at 5.26, despite Maldonadoraising more than $1.5 million during his primary campaign to advertisehis more moderate views (FEC data, June 2010).8
To examine the extent of voter ignorance of candidates’ ideology,Figure 1 plots participants’ perceptions of Democratic and Republicancandidates against the four-item average ideological scores. It plots theserelationships separately by candidate party and by incumbency, includ-ing the best-fit line (least squares regression) to describe the relationshipbetween perceptions and reality in each subplot, the 45 8 line as a refer-ence point, and the R2s that measure the goodness of fit for eachregression. Figure 1 reports on the 109 viable major-party candidates inour survey.9 It shows that voters did see Democrats as more liberal andRepublicans as more conservative (the study showed party labels on theballot) but were largely unable to distinguish moderates from extremistswithin each party. If they had done so, we would see a positive slopesimilar to the 45 8 line, indicating that the more conservative the candi-date, the more conservative the rating assigned by participants. Forincumbents, we see some sign of the expected upward slope, but most ofthe variation appears to be noise, with R2s below 0.25. Voters alsoarguably see incumbents from both parties as more moderate than theyreally are, with mean ratings varying only between about 2.2 and 3.8 forDemocrats and 4.0 and 6.0 for Republicans.
Although voters seem to have an inkling of where incumbentsstand, they appear to lack any awareness of challengers’ ideology. Theirperceptions of nonincumbents from both parties fail to correlate withreality (as measured by the four-item index score). The R2s for the best-fit lines in Figure 1 (right plots) are essentially zero, a result that holds up
243Do Open Primaries Improve Representation?

when we disaggregate by both participant and candidate party affiliation.We therefore see little signal in these perceptions, just noise.
Voters’ knowledge of the candidates’ positions appears so limitedthat a simple party indicator predicts beliefs about candidate ideologybetter than does the four-item measure (or any component of that mea-sure). When we regress participants’ perceptions of candidate ideologyon the party indicator (following Snyder and Ting 2002), we find aslightly better fit (larger R2) than when we regress it on the four-itemaverage. This pattern holds across a variety of specifications. This resultis consistent with previous findings on voters’ inability to accurately
FIGURE 1Participants’ Perceptions of 7-Point Candidate Ideology
(incumbents and viable challengers only)
Slope = 0.15R-squared = 0.051
2
3
4
1 2 3 4
Democratic, Incumbent
Slope = -0.05R-squared = 0.011
2
3
4
1 2 3 4
Democratic, Nonincumbent
Slope = 0.25R-squared = 0.104
5
6
7
4 5 6 7
Republican, Incumbent
Slope = 0.05R-squared = 0.0064
5
6
7
4 5 6 7
Republican, Nonincumbent
Non
incu
mbe
nt r
espo
nden
t per
cept
ion
Candidate Ideology (Four-item average)
Note: The figures show participant perceptions of 109 viable, major-party candidates for 52 ofCalifornia’s 53 districts against our measurement of their actual positions using the four-itemaverage (author ratings, MTurk ratings, Project Vote Smart ratings, and CF scores). As a refer-ence, each plot also shows the 458 line. The weak or absent relationship between perceptionand reality also holds separately for each of the ideology measures (not just the four-item aver-age), and they hold when we only examine the 20 best-case districts. They also hold when weexamine only same-party perceptions (e.g., Republican perceptions of Republican candidates).After we exclude participants who say they will definitely not vote, 4,520 participants rated atleast one candidate. We weight the least-square estimates by the number of participants ratingeach candidate, which averages 38 for incumbents and 25 for challengers. We do not show theplot for the 11 no party preference (NPP) candidates for whom we have ratings (we lack dataon three candidates), but the findings are similar with a slope of 0.06 and an R2 of 0.04. In alarger version in the online supporting information (section 6), we label each data point withthe candidate’s last name and district.
244 Douglas J. Ahler, Jack Citrin, and Gabriel S. Lenz
locate representatives ideologically within parties (Franklin 1991;Tausanovitch and Warshaw 2013; Snyder and Ting 2002). Our contribu-tion here is to show that this pattern holds for primary candidates as well.
Obstacle 2: Strategic Voting
The second obstacle to the reform aiding moderate candidates isstrategic voting. Voters may not choose ideologically proximate candi-dates on the top-two ballot for strategic reasons. This can take manyforms, but one of the most problematic for primary reform is raiding.Instead of voting for the candidate who most closely shares a voter’s ide-ology (sincere voting), voters “raid” when they cross over to vote forweaker candidates of the other party (strategic voting), hoping theiraction will ultimately help their own party’s chances in the general elec-tion. Research suggests that strategic voting of this kind is rare inprimaries (Alvarez and Nagler 1997; Hedlund 1977; Ranney 1968,1972; Sides, Cohen, and Citrin 2002), a result we confirm in a later sec-tion (in addition to addressing another form of strategic voting, hedging).
Obstacle 3: Voter Extremity
The third obstacle is voter extremity. If voters do shift towardsideologically proximate candidates on the top-two ballot, they will onlychoose moderate candidates if voters themselves are moderate. Arethey? Research shows that voters are generally not ideologicallyextreme, but moderate (Ansolabehere, Rodden, and Snyder 2006;Fiorina, Abrams, and Pope 2005; Levendusky and Pope 2011; thoughsee Broockman 2016 for a methodological critique). Does this hold inCalifornia? The median voters in California congressional districts alsotend to be moderate, as measured by constituent policy preferences(Kousser, Phillips, and Shor n.d.), a finding we replicate with participantself-reported ideology. Even in California districts with reputations forextremity, such as the 23rd (Central Valley) being conservative or the13th (Berkeley and Oakland) being liberal, median voters are moderate.Moreover, we find that Democratic candidates encountered medianvoters more moderate than their closed-primary counterparts in 11 of the20 best-case districts, while Republican candidates did so in all 20.10
Obstacle 4: Multicandidate Races
The fourth obstacle is the problem of multiple candidates. Even ifvoters have the necessary knowledge, vote sincerely (not strategically),
245Do Open Primaries Improve Representation?
and prefer moderate candidates, moderate candidates still may notbenefit. Formal models of open primaries and multicandidate races failto yield consistent predictions about the ideology of winners, even inmoderate districts (Chen and Yang 2002; Cooper and Munger 2000;Cox 1987; Oak 2006). Open primaries may fail to favor moderate candi-dates for many reasons, but one of the more straightforward is that theyallow for more than two candidates. With more than two contestants, thewinning platform is not necessarily that of the median voter. In fact, thekey to victory in such races is not where candidates locate on an ideologi-cal spectrum relative to voters, but how close they are to other candidates(Tullock 1967).
Top-Two Primary Experiment
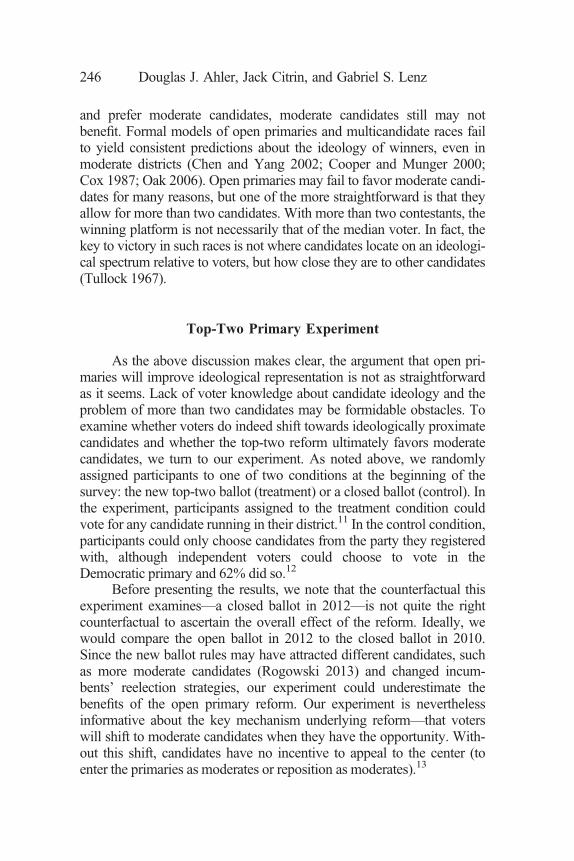
As the above discussion makes clear, the argument that open pri-maries will improve ideological representation is not as straightforwardas it seems. Lack of voter knowledge about candidate ideology and theproblem of more than two candidates may be formidable obstacles. Toexamine whether voters do indeed shift towards ideologically proximatecandidates and whether the top-two reform ultimately favors moderatecandidates, we turn to our experiment. As noted above, we randomlyassigned participants to one of two conditions at the beginning of thesurvey: the new top-two ballot (treatment) or a closed ballot (control). Inthe experiment, participants assigned to the treatment condition couldvote for any candidate running in their district.11 In the control condition,participants could only choose candidates from the party they registeredwith, although independent voters could choose to vote in theDemocratic primary and 62% did so.12
Before presenting the results, we note that the counterfactual thisexperiment examines—a closed ballot in 2012—is not quite the rightcounterfactual to ascertain the overall effect of the reform. Ideally, wewould compare the open ballot in 2012 to the closed ballot in 2010.Since the new ballot rules may have attracted different candidates, suchas more moderate candidates (Rogowski 2013) and changed incum-bents’ reelection strategies, our experiment could underestimate thebenefits of the open primary reform. Our experiment is neverthelessinformative about the key mechanism underlying reform—that voterswill shift to moderate candidates when they have the opportunity. With-out this shift, candidates have no incentive to appeal to the center (toenter the primaries as moderates or reposition as moderates).13
246 Douglas J. Ahler, Jack Citrin, and Gabriel S. Lenz
Individual-Level Proximity Results for Congressional Elections
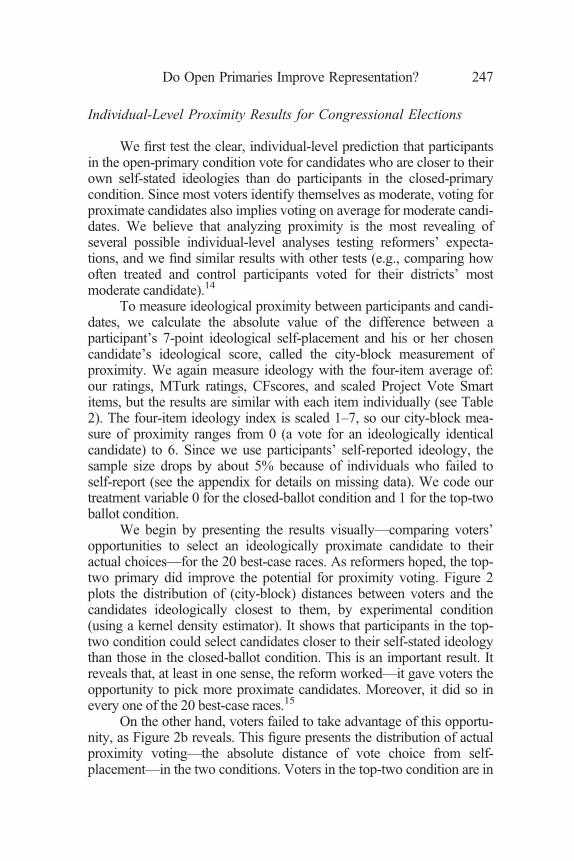
We first test the clear, individual-level prediction that participantsin the open-primary condition vote for candidates who are closer to theirown self-stated ideologies than do participants in the closed-primarycondition. Since most voters identify themselves as moderate, voting forproximate candidates also implies voting on average for moderate candi-dates. We believe that analyzing proximity is the most revealing ofseveral possible individual-level analyses testing reformers’ expecta-tions, and we find similar results with other tests (e.g., comparing howoften treated and control participants voted for their districts’ mostmoderate candidate).14
To measure ideological proximity between participants and candi-dates, we calculate the absolute value of the difference between aparticipant’s 7-point ideological self-placement and his or her chosencandidate’s ideological score, called the city-block measurement ofproximity. We again measure ideology with the four-item average of:our ratings, MTurk ratings, CFscores, and scaled Project Vote Smartitems, but the results are similar with each item individually (see Table2). The four-item ideology index is scaled 1–7, so our city-block mea-sure of proximity ranges from 0 (a vote for an ideologically identicalcandidate) to 6. Since we use participants’ self-reported ideology, thesample size drops by about 5% because of individuals who failed toself-report (see the appendix for details on missing data). We code ourtreatment variable 0 for the closed-ballot condition and 1 for the top-twoballot condition.
We begin by presenting the results visually—comparing voters’opportunities to select an ideologically proximate candidate to theiractual choices—for the 20 best-case races. As reformers hoped, the top-two primary did improve the potential for proximity voting. Figure 2plots the distribution of (city-block) distances between voters and thecandidates ideologically closest to them, by experimental condition(using a kernel density estimator). It shows that participants in the top-two condition could select candidates closer to their self-stated ideologythan those in the closed-ballot condition. This is an important result. Itreveals that, at least in one sense, the reform worked—it gave voters theopportunity to pick more proximate candidates. Moreover, it did so inevery one of the 20 best-case races.15
On the other hand, voters failed to take advantage of this opportu-nity, as Figure 2b reveals. This figure presents the distribution of actualproximity voting—the absolute distance of vote choice from self-placement—in the two conditions. Voters in the top-two condition are in
247Do Open Primaries Improve Representation?

FIGURE 2(a) Possible Proximity Voting in Top-Two and Closed-Ballot
Conditions. (b) Actual Proximity Voting in Top-Two andClosed-Ballot Conditions
(a)
(b)
Note: The figures show proximity calculated using the city-block method for best-case districts(category 3). In section 11 of the online supporting information, we show that the pattern isrobust: it holds using the Euclidean method (see 11.1), in all 34 districts where we conductedthe experiment (11.2), separately for registered Democrats, Republicans, and independents (see11.2), with average participant perceptions (see 11.3), and with individual participant percep-tions (see 11.4).
248 Douglas J. Ahler, Jack Citrin, and Gabriel S. Lenz
fact not more but less ideologically proximate to their chosen candidatesthan those in the closed primary condition. Comparing Figures 2a and b,we see that the potential gain from the top-two format went unrealized, asurprising finding.
To summarize these results, Table 1 presents the individual-levelbivariate regression of actual proximity voting (the x-axis in Figure 2b)on the treatment indicator variable. It includes district indicator variables(that is, fixed effects for districts), so that the analysis only examines theexperiment’s effect within districts, not between districts. It confirmsthat, at least in its first test in June 2012, California’s primary reformfailed to improve proximity voting. Rather, it appears to slightly increasethe distance between voters and their chosen candidates by an average of0.15 points on the 7-point scale (95% confidence interval, 0.01 to 0.29)
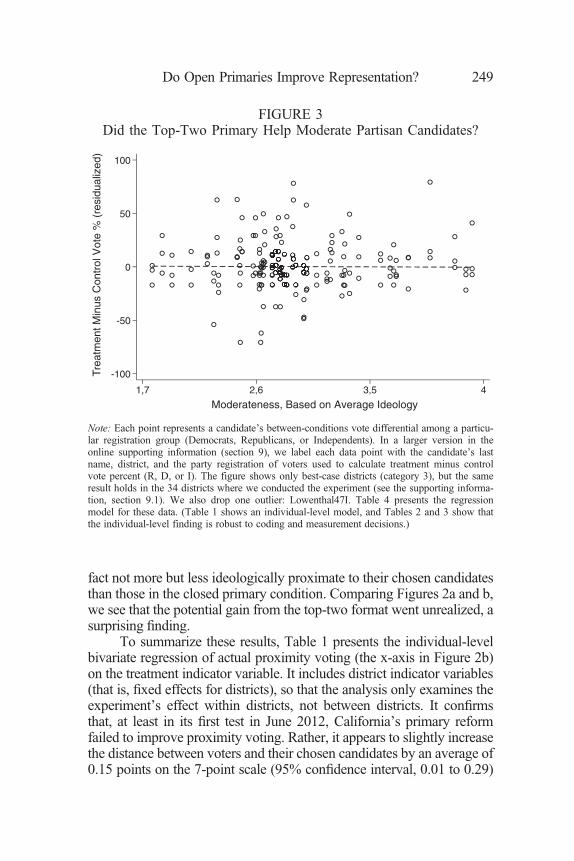
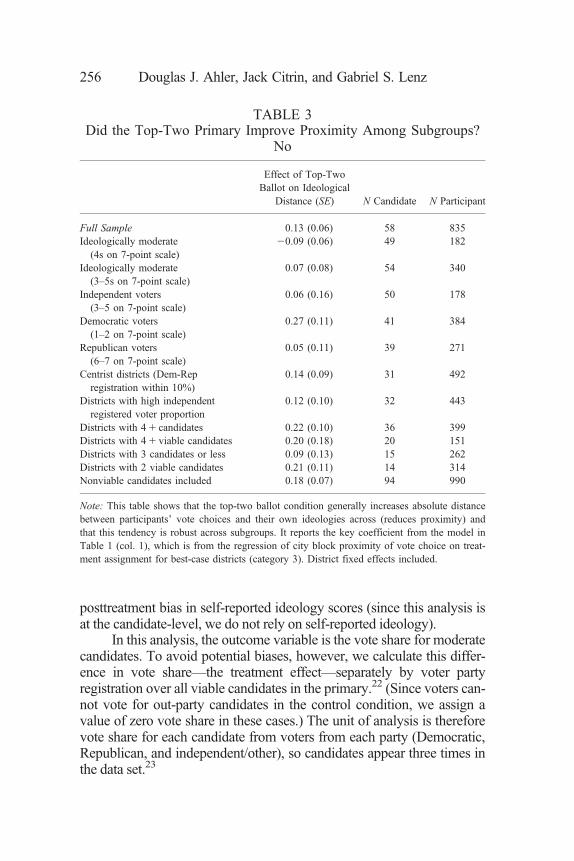
FIGURE 3Did the Top-Two Primary Help Moderate Partisan Candidates?
-100
-50
0
50
100
Trea
tmen
t Min
us C
ontr
ol V
ote
% (
resi
dual
ized
)
1,7 2,6 3,5 4
Moderateness, Based on Average Ideology
Note: Each point represents a candidate’s between-conditions vote differential among a particu-lar registration group (Democrats, Republicans, or Independents). In a larger version in theonline supporting information (section 9), we label each data point with the candidate’s lastname, district, and the party registration of voters used to calculate treatment minus controlvote percent (R, D, or I). The figure shows only best-case districts (category 3), but the sameresult holds in the 34 districts where we conducted the experiment (see the supporting informa-tion, section 9.1). We also drop one outlier: Lowenthal47I. Table 4 presents the regressionmodel for these data. (Table 1 shows an individual-level model, and Tables 2 and 3 show thatthe individual-level finding is robust to coding and measurement decisions.)
249Do Open Primaries Improve Representation?

in the best-case districts (column 1), a result that is similar across alldistricts (column 2). Of course, ideological proximity is only one reasonto vote for a candidate, but it is striking that the reform worsened prox-imity voting despite its potential to improve it. In the next section, weshow that this result is robust to coding and measurement decisions.
Alternative Interpretations and Robustness
Given the earlier findings about voters’ misperceptions of candi-date ideology, voters may fail to support moderate or more proximatecandidates on the open ballot because they simply do not know whichcandidates are moderate or proximate. Before we reach that conclusion,however, we must rule out several alternative interpretations.
One concern is that participants may have behaved unusually inour closed-ballot condition because of its artificiality. In particular, if par-ticipants were aware of the new ballot format and planned to takeadvantage of it by voting for a candidate of another party, they may havebeen confused when they failed to see that candidate on the experimentalballot in the closed-ballot condition and picked candidates randomly or
TABLE 1Did the Top-Two Primary Improve Proximity Voting? No
DV: Absolute Distance of Vote Choicefrom Self Placement
(1) Best-Case Districts(category 3)
(2) All 34 Districts(categories 2 and 3)
Top-Two Ballot Condition(treatment)
0.15** (0.07) 0.13** (0.06)
Constant 1.22** (0.05) 1.23** (0.04)Observations 835 1,365R2 0.02 0.04
Note: This table shows that the top-two ballot condition slightly increases absolute distancebetween participants’ vote choices and their own ideologies (that is, reduces proximity). Stand-ard errors are in parentheses. We do not cluster the standard errors at the district level because,with only 20 (or even 34) clusters, clustering is unreliable (Angrist and Pischke 2009, chap. 8).We therefore likely underestimate standard errors, but showing that the true standard errors areactually larger, which they no doubt are, would not substantially alter our conclusions. Districtfixed effects are included but not shown in the table. The analysis is restricted to viable candi-dates, but Tables 2 and 3 show that this pattern is robust to this and numerous other codingdecisions. See the appendix for an accounting of the number of observations.***p< 0.01; **p< 0.05; *p< 0.1.
250 Douglas J. Ahler, Jack Citrin, and Gabriel S. Lenz
chosen the “don’t know” option. To investigate this possibility, weasked participants after the vote choice and ideology questions, “Hadyou heard about the new ballot format before this survey?” Only abouthalf of the participants said they were aware of the change. Table 2presents evidence that awareness did not affect outcomes. It only reportsthe key coefficient from the model in Table 1, which is from the regres-sion of city-block proximity of vote choice on treatment assignment. Asits second and third rows show, the top-two format increased ideologicaldistance by a similar amount among those who were and were not awareof the ballot change.16 We can also address this concern by examining“don’t know” responses to the vote question. Participants who did notsee their preferred candidate on the ballot in the closed condition mayhave chosen the “don’t know” response at higher rates when asked aboutvoting. If so, we should see more “don’t know” responses in the closedcondition, but we do not. The “don’t know” response rate is the same(33%) in the two groups.
Another concern is that turnout in this primary was light, and oursample may overrepresent individuals who failed to vote and who maytherefore be less likely to vote based on ideology and to recognize andreward moderate candidates on the open ballot. Several facts mitigatesuch concerns. First, we only interviewed registered voters. Second, weexclude from analyses voters who said they would not vote. Third, can-didates’ vote share in the survey’s open-ballot condition closely matchedactual election results. Finally, the results remain the same when we limitthe analysis to individuals who said they would definitely vote and to themost politically knowledgeable individuals, as shown in Table 2.17 Mostimportantly, if actual voters are more partisan and ideologically extreme,they should be even less likely to cross over and vote for moderate candi-dates, not more so. To the extent that our survey includes nonvoters,which it undoubtedly does, their presence may work against the finding.
The presence of No Party Preference (NPP) candidates on theballot for the first time could also potentially explain the failure of theopen ballot to reduce ideological distance. Voters may have attributedgreater centrism to these candidates simply because of their nonpartisanlabel even when they were not actually centrist. As shown in Table 2’snext row, we find, however, that proximity worsened significantly indistricts without NPP candidates.
This raises a related concern: the top-two reform may have ledmany candidates to adopt more moderate positions than they wouldhave in a closed primary (Rogowski 2013). As a consequence, candi-dates may have already been unusually proximate to voters in the closedcondition, resulting in a ceiling effect—i.e., voters could not choose
251Do Open Primaries Improve Representation?

TABLE 2The Top-Two Ballot Fails to Improve Proximity Voting
(additional robustness checks)
Effect of Treatmenton IdeologicalDistance (SE) N Candidate N Participant
Full Sample 0.154 (0.070) 58 835Respondent and Contest Characteristics
Unaware of open ballot change 0.168 (0.109) 55 409Aware of open ballot change 0.144 (0.094) 53 426Said they would “Definitely vote” 0.070 (0.082) 57 613Knowledgeable voters (3/4> of
knowledge Qs)0.052 (0.076) 58 548
Districts with no No Party Preference(NPP) candidates
0.355 (0.129) 18 227
Strategic Voting: HedgingRepublicans in dist. with more
registered Reps. than Dems.20.079 (0.171) 12 143
Republicans in dist. with moreregistered Dems. than Reps.
0.145 (0.137) 29 165
Democrats in dist. with more registeredReps. than Dems.
0.546 (0.295) 13 75
Democrats in dist. with more registeredDems. than Reps.
0.172 (0.110) 31 341
Districts with an incumbent 0.189 (0.083) 34 601Districts with open seats 0.060 (0.134) 24 234
Robustness to Component RatingsAuthor ratings 0.142 (0.078) 58 835Mechanical Turk ratings 0.108 (0.076) 56 823CFscores 0.114 (0.066) 54 788Project Vote Smart 0.168 (0.093) 41 746Factor score from the four ratings (no
listwise deletion)0.132 (0.121) 34 640
Other Robustness ChecksProximity calculated with Euclidean
distance0.553 (0.291) 58 835
Proximity calculated with ave.respondent placement of candidates
0.025 (0.059) 58 835
Proximity calculated with respondentplacement
20.080 (0.084) 57 688
Weighted 0.179 (0.074) 58 835
Note: This table shows that the top-two ballot condition generally increases the absolute dis-tance between participants’ vote choices and their own ideologies (reduces proximity) and thatthis tendency is robust to various alternative explanations, measurement decisions, and codingdecisions. It reports the key coefficient from the model in Table 1 (col. 1), which is from theregression of city block proximity of vote choice on treatment assignment for best-case districts(category 3). District fixed effects included. For more robustness checks, see Table 3.
252 Douglas J. Ahler, Jack Citrin, and Gabriel S. Lenz

more proximate candidates on the top-two ballot. However, this conjec-ture is inconsistent with the evidence. First, viable candidates held adiverse range of positions. Second, the reform appears not to havechanged the distribution of candidate positions compared to the previousprimary. Third, as Figure 2 shows, voters had the potential to select farmore proximate candidates on the top-two ballot, inconsistent with aceiling. Finally, a proximity ceiling should not lead voters to make lessproximate choices on the top-two ballot, but they do.18
Strategic Voting: Hedging and Raiding
Yet another possible interpretation is that ideological distance mayincrease with the top-two format, not because voters are making poordecisions, but because they are strategically voting for more distant can-didates. One such form of insincere voting is called hedging: whenvoters’ proximate choices have little chance of winning the election, vot-ers may vote strategically for more distant candidates. In particular,Republicans in California’s many Democratic-leaning districts maychoose to vote for a Democratic candidate in the top-two conditionbecause the Republican candidates are unlikely to finish in the top twoor win the general election—likewise for Democratic voters in the hand-ful of Republican-leaning districts. They may also cross over simply toparticipate in a competitive contest (Alvarez and Nagler 2002; Kousser2002; Salvanto and Wattenberg 2002). If hedging is common, the openballot may worsen proximity not because of voters’ ignorance aboutcandidate ideology but because they are strategically choosing to votefor candidates who happen to be more distant from themselvesideologically.
To see whether hedging lies behind our key finding, Table 2 showsthe open-ballot effect by two variables that likely predict hedging:whether district partisanship corresponds with participant partisanshipand whether the district has an incumbent. The estimates provide somesupport for hedging—the top-two ballot does worsen proximity more indistricts where party registration leans against the participant or indistricts with an incumbent—but they show that hedging does notexplain our key finding. Even in districts where we would expect lesshedging (e.g., open races), we still fail to find that the open ballotimproved proximity.
Another way we examine whether hedging drives these results isto look at voters’ choices when they do cross over and vote for a candi-date of the other party. If they are hedging, we should see them generallyvoting for the most proximate candidate from the other side (of course,
253Do Open Primaries Improve Representation?

this assumes they know the candidate positions, which seems unlikelygiven the above findings). When a moderate Republican crosses over tovote for a Democrat, for example, she should tend to select the mostmoderate Democrat. To investigate this, similar to the logic of Figure 2,we compare the minimum possible proximity to an out-party candidateto the actual proximity of vote choices made by the 16.2% of participantswho crossed over. We find that crossover voters chose candidates overhalf a point more distant from their own self-reported ideology than theycould have, on average (p< .001). Indeed, just 52.7% of crossovervoters selected the most proximate candidate from the other party.
Of course, ideological distance may be large for crossover votersbecause of another form of strategic voting that we have already dis-cussed: raiding. Voters raid when they attempt to sabotage the other sideby voting for its weakest candidate. Raiding seems likely to be rare inthis primary. Studies have generally found little evidence of it in a vari-ety of elections (Alvarez and Nagler 1997; Hedlund 1977; Ranney 1968,1972), including the 1998 California blanket primary (Sides, Cohen, andCitrin 2002). Moreover, raiding should be rarer in this type of open pri-mary than in other types, such as blanket primaries, because voters lacka guarantee that their party’s candidates will move on to the general elec-tion, and so raiding could jeopardize their own party’s chances (Sinclair2013). Nevertheless, we searched extensively for evidence of raiding butfound no clear sign of it. In fact, when voters cross over, they tend tovote for the same candidates as their out-party peers. Of course, strategicvoting can take many other forms. However, given these results and thelow salience and low information nature of the primary, substantialstrategic voting seems unlikely.19
Robustness to Measurement and Coding Decisions
In the remainder of Table 2, we show that the tendency of the top-two ballot to increase ideology-vote distance (worsen proximity) isrobust to measurement and coding decisions: it holds using each of thecomponent ratings of the four-item average (author ratings, MechanicalTurk ratings, CF scores, Project Vote Smart ratings) and when using afactor score from all four ratings based on principal component factoranalysis.20 It holds when we calculate proximity with Euclidean distanceinstead of absolute distance. It holds when we calculate ideology-voteproximity with the average respondent placement of candidates. Theonly estimate where the sign becomes negative, the expected direction,is when we calculate proximity with respondents’ own placement of thecandidate they voted for, though the coefficient is imprecisely estimated
254 Douglas J. Ahler, Jack Citrin, and Gabriel S. Lenz
(the sample size decreases here because we exclude respondents whofailed to place the candidate for whom they voted). Given voters’ tend-ency to project their own ideology onto candidates, we are surprised bythis weak result. Finally, the main finding is robust to weighting thesurvey data to 2012 Census Current Population Survey data forCalifornia.21 In the next section, we show that this result holds up amongmany subgroups.
Did the Reform Help Among Subgroups?
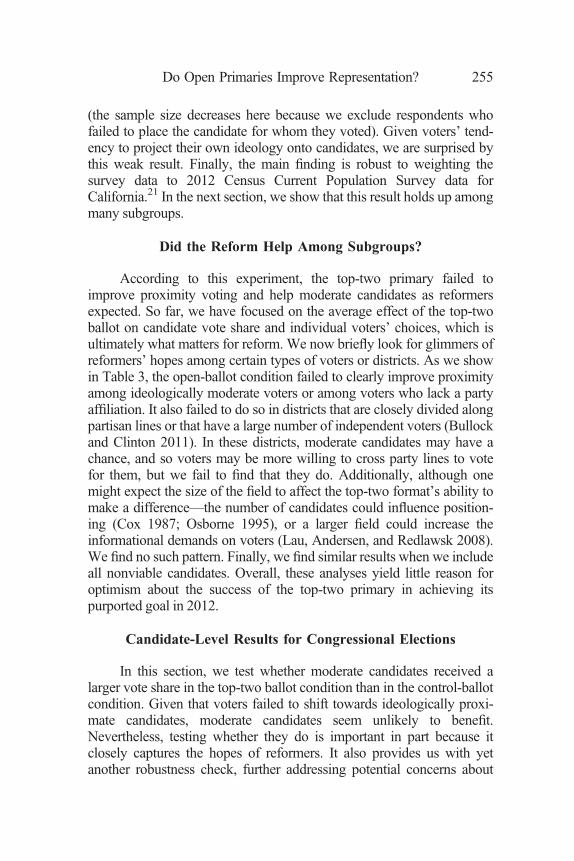
According to this experiment, the top-two primary failed toimprove proximity voting and help moderate candidates as reformersexpected. So far, we have focused on the average effect of the top-twoballot on candidate vote share and individual voters’ choices, which isultimately what matters for reform. We now briefly look for glimmers ofreformers’ hopes among certain types of voters or districts. As we showin Table 3, the open-ballot condition failed to clearly improve proximityamong ideologically moderate voters or among voters who lack a partyaffiliation. It also failed to do so in districts that are closely divided alongpartisan lines or that have a large number of independent voters (Bullockand Clinton 2011). In these districts, moderate candidates may have achance, and so voters may be more willing to cross party lines to votefor them, but we fail to find that they do. Additionally, although onemight expect the size of the field to affect the top-two format’s ability tomake a difference—the number of candidates could influence position-ing (Cox 1987; Osborne 1995), or a larger field could increase theinformational demands on voters (Lau, Andersen, and Redlawsk 2008).We find no such pattern. Finally, we find similar results when we includeall nonviable candidates. Overall, these analyses yield little reason foroptimism about the success of the top-two primary in achieving itspurported goal in 2012.
Candidate-Level Results for Congressional Elections
In this section, we test whether moderate candidates received alarger vote share in the top-two ballot condition than in the control-ballotcondition. Given that voters failed to shift towards ideologically proxi-mate candidates, moderate candidates seem unlikely to benefit.Nevertheless, testing whether they do is important in part because itclosely captures the hopes of reformers. It also provides us with yetanother robustness check, further addressing potential concerns about
255Do Open Primaries Improve Representation?
posttreatment bias in self-reported ideology scores (since this analysis isat the candidate-level, we do not rely on self-reported ideology).
In this analysis, the outcome variable is the vote share for moderatecandidates. To avoid potential biases, however, we calculate this differ-ence in vote share—the treatment effect—separately by voter partyregistration over all viable candidates in the primary.22 (Since voters can-not vote for out-party candidates in the control condition, we assign avalue of zero vote share in these cases.) The unit of analysis is thereforevote share for each candidate from voters from each party (Democratic,Republican, and independent/other), so candidates appear three times inthe data set.23
TABLE 3Did the Top-Two Primary Improve Proximity Among Subgroups?
No
Effect of Top-TwoBallot on Ideological
Distance (SE) N Candidate N Participant
Full Sample 0.13 (0.06) 58 835Ideologically moderate
(4s on 7-point scale)20.09 (0.06) 49 182
Ideologically moderate(3–5s on 7-point scale)
0.07 (0.08) 54 340
Independent voters(3–5 on 7-point scale)
0.06 (0.16) 50 178
Democratic voters(1–2 on 7-point scale)
0.27 (0.11) 41 384
Republican voters(6–7 on 7-point scale)
0.05 (0.11) 39 271
Centrist districts (Dem-Repregistration within 10%)
0.14 (0.09) 31 492
Districts with high independentregistered voter proportion
0.12 (0.10) 32 443
Districts with 4 1 candidates 0.22 (0.10) 36 399Districts with 4 1 viable candidates 0.20 (0.18) 20 151Districts with 3 candidates or less 0.09 (0.13) 15 262Districts with 2 viable candidates 0.21 (0.11) 14 314Nonviable candidates included 0.18 (0.07) 94 990
Note: This table shows that the top-two ballot condition generally increases absolute distancebetween participants’ vote choices and their own ideologies across (reduces proximity) andthat this tendency is robust across subgroups. It reports the key coefficient from the model inTable 1 (col. 1), which is from the regression of city block proximity of vote choice on treat-ment assignment for best-case districts (category 3). District fixed effects included.
256 Douglas J. Ahler, Jack Citrin, and Gabriel S. Lenz
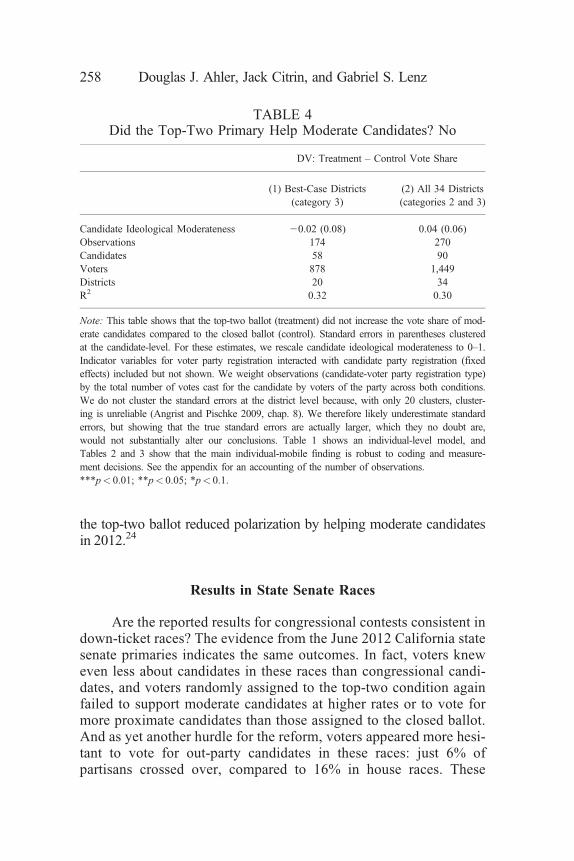
Figure 3 presents this analysis for the 20 best-case districts(category 3), although the results are similar for all districts, as weshow below. The vertical axis depicts the difference in vote sharebetween the open- and closed-ballot conditions for each candidate(after removing the main effects for the six types of party and voterregistration), while the horizontal axis places candidates from mostextreme to most moderate, determined by folding our four-item ide-ology measure (so extreme liberal and extreme conservative are nowcoded 1 and moderates continue to be coded 4). If the reform helpedmoderate candidates, we should see an upward slope in the scatter-plot—that is, we should see the more moderate candidates receivingmore votes under the open ballot than under the closed ballot. Instead,however, we find a downward slope. After recoding candidate modera-tion to 0–1, we estimate the slope at 20.021, which implies that anextreme candidate, located at 1 or 7 on the ideology scale, would experi-ence a 2.1% loss in vote share were she to relocate at 4 with thetransition from the closed primary to the top-two primary. Table 4presents the regression of the difference in vote share between ballotformats on candidates’ moderateness, the same best-fit line shown inthe plot. It shows that the slightly negative slope we find is impreciselyestimated (95% confidence interval 20.17 to 0.14), so it could be con-sistent with a more positive or negative effect. The regressions includedummy variables for voter party registration interacted with candidateparty (fixed effects), and we cluster the standard errors at the candidatelevel. In short, the experimental results fail to support the hypothesisthat the top-two format helped moderate candidates.
We repeated these analyses in all 34 districts where we conductedthe ballot experiment. We would expect the open ballot to benefitmoderates even less in this larger set of districts, but we actually find aslightly positive coefficient of 0.039 (see Table 4, column 2), thoughagain, it is imprecisely estimated.
Finally, we may fail to find that the open ballot helped moderatesbecause these centrists competed against each other in some cases. Wetest this possibility by repeating the analysis from Table 4 after combin-ing the vote shares of similarly positioned candidates within districts.(For example, if two candidates from the same district had ideologicalscores of 3.8 and 4.2, we would round their ideologies to 4.0 and com-bine their vote shares.) We continue to fail to find an effect afterrounding ideology scores to the nearest half-point and full-point. Wealso investigated whether the top-two ballot helped moderates finish inthe top two, but we found no sign that it did—if anything, extreme candi-dates fared better on the open ballot. In sum, we find scant evidence that
257Do Open Primaries Improve Representation?
the top-two ballot reduced polarization by helping moderate candidatesin 2012.24
Results in State Senate Races
Are the reported results for congressional contests consistent indown-ticket races? The evidence from the June 2012 California statesenate primaries indicates the same outcomes. In fact, voters kneweven less about candidates in these races than congressional candi-dates, and voters randomly assigned to the top-two condition againfailed to support moderate candidates at higher rates or to vote formore proximate candidates than those assigned to the closed ballot.And as yet another hurdle for the reform, voters appeared more hesi-tant to vote for out-party candidates in these races: just 6% ofpartisans crossed over, compared to 16% in house races. These
TABLE 4Did the Top-Two Primary Help Moderate Candidates? No
DV: Treatment – Control Vote Share
(1) Best-Case Districts(category 3)
(2) All 34 Districts(categories 2 and 3)
Candidate Ideological Moderateness 20.02 (0.08) 0.04 (0.06)Observations 174 270Candidates 58 90Voters 878 1,449Districts 20 34R2 0.32 0.30
Note: This table shows that the top-two ballot (treatment) did not increase the vote share of mod-erate candidates compared to the closed ballot (control). Standard errors in parentheses clusteredat the candidate-level. For these estimates, we rescale candidate ideological moderateness to 0–1.Indicator variables for voter party registration interacted with candidate party registration (fixedeffects) included but not shown. We weight observations (candidate-voter party registration type)by the total number of votes cast for the candidate by voters of the party across both conditions.We do not cluster the standard errors at the district level because, with only 20 clusters, cluster-ing is unreliable (Angrist and Pischke 2009, chap. 8). We therefore likely underestimate standarderrors, but showing that the true standard errors are actually larger, which they no doubt are,would not substantially alter our conclusions. Table 1 shows an individual-level model, andTables 2 and 3 show that the main individual-mobile finding is robust to coding and measure-ment decisions. See the appendix for an accounting of the number of observations.***p< 0.01; **p< 0.05; *p< 0.1.
258 Douglas J. Ahler, Jack Citrin, and Gabriel S. Lenz
results provide evidence of the reform’s apparent failure in 2012across multiple electoral contexts.25
Discussion and Conclusion
Pundits and scholars frequently assert that closed primary electionscontribute to ideological polarization in legislatures across America(e.g., Nivola and Galston 2006). As a cure for polarization and its effectson legislative behavior—gridlock and dysfunction—many advocateopen primaries, arguing that this institutional reform will improve ideo-logical congruence between representatives and the represented and thusyield more moderate legislators. For this logic to hold, however, so toomust multiple assumptions regarding voting behavior, including that citi-zens have some sense for where candidates stand (or at least act as ifthey do). We find little evidence consistent with this assumption aboutvoters’ knowledge. In particular, we find that voters in House racesfailed to distinguish between relatively extreme and centrist candidatesof the same party, and thus they appeared unable to engage in the sort ofideologically nuanced voting that spatially minded theorists and reform-ers envisioned. More to the point, we find that voters failed to shifttowards ideologically proximate candidates on the top-two ballot.Consequently, the top-two primary reform appears so far to have failedto help centrist candidates in California and thus may not be the prom-ised cure for polarization.
Because our study is experimental, it has an advantage over previ-ous studies, but it also has limitations. Open primaries may stillmoderate legislators’ behavior even if voters fail to recognize or explic-itly reward such centrism because politicians may mistakenly think theydo. Indeed, one study finds that roll-call voting in the California stateassembly moderated somewhat following the reform (Grose 2014). Can-didates and voters may also take time to learn about and adapt to newrules, as they did for earlier electoral reforms in California (Gaines andCho 2002; Masket 2009). In particular, it may take time for moderatecandidates to learn how to effectively inform voters about their centristviews. It may also take time for moderate politicians to react to the rulechange and enter the field at greater rates. The top-two ballot’s effect oncandidate entry and positioning is beyond the scope of our study (thoughthe similarity in the distributions of estimated primary candidateideology in 2010 and 2012 is potentially inconsistent with an effect;more generally, see Rogowski 2013).
These results may also not generalize to other states and electoralcontexts. California is the most polarized state at the elite level, as
259Do Open Primaries Improve Representation?

measured by roll-call votes in the state legislature (Shor and McCarty2011), which may disadvantage centrists. It is also worth noting,however, that the 2012 House primaries in California featured severalwell-funded and experienced moderates, and yet voters still failed torecognize their ideological centrism and disproportionally vote for themwhen given the chance (e.g., Abel Maldonado in the 24th District andAnthony Adams in the 8th).
Open primaries may also succeed in higher salience races, suchas gubernatorial or US senatorial contests, where voters have betteraccess to information about candidate ideology. In fact, in contrastwith our findings about voter ignorance in this article, a small fractionof voters appear to learn something about nonincumbent gubernatorialand senatorial candidates’ positions in closed primaries and use thisinformation to select proximate candidates (Hirano et al. 2015). Futurework could investigate whether open primaries help moderate candi-dates in higher-salience races. It is worth keeping in mind, however,that research on the introduction of the direct primary in US Senateraces found no sign that these primaries contributed to polarization(Hirano et al. 2010).
Even if voters fail to favor moderate candidates in the open pri-mary, they may still do so in the general election, especially those wheresame-party candidates run against each other. Kousser, Phillips, andShor (n.d.) investigate whether they do for the eight such California con-gressional races in 2012 and conclude that the moderate candidate wonin half of the cases but lost in the other half. More generally, they con-clude that California elected slightly more extreme candidates in 2012than in 2010, despite redistricting reform and the open primary, aconclusion consistent with this article’s findings.
Our findings also have implications for research on voter compe-tence. Scholars have noted that, by using heuristics, voters may act as ifinformed even though they are not (Lupia 1994). For example, one coulduse the gender or race of a candidate or her endorsements as a proxy forideology. However, little research to this point has investigated the qual-ity of heuristics in legislative primaries—low-information electoralcontexts in which the predominant heuristic for ideological voting (can-didate partisanship) may fail. At least in this case, the experimentalresults cast doubt on the quality and availability of heuristics in legisla-tive primaries. If voters could rely on heuristics, they should select moreproximate candidates when provided the opportunity to do so in theopen-ballot condition, but we failed to find this result. Of course, withtime, campaigns and interest groups may learn to provide voters with thecues they need.
260 Douglas J. Ahler, Jack Citrin, and Gabriel S. Lenz

The intent of open primaries is to counter growing polarizationamong representatives and thus potentially to improve democraticaccountability. Yet in the case examined here, no such improvementoccurred. For significant change to develop, reformers may have to gobeyond the rules to find a way to substantially increase voters’ infor-mation. In fact, by increasing voters’ options without increasinginformation, our experiment suggests that the top-two ballot led toslightly worse voting decisions: voters chose candidates ideologicallyfurther from themselves under the top-two format than with the closedballot. Since most voters are moderate, this means they chose moreextreme candidates on average. Given the limitation of voters’ infor-mation, reforms that make voters’ decisions harder may lead to worse,not better, decisions, a result supported by some laboratory studies(Cunow 2013). More positively, we did find that the top-two primarycreated the potential for improved proximity voting. But realization ofthis outcome will ultimately hinge on the ability of motivated candi-dates and interest groups to improve voters’ knowledge of theelectoral landscape and, perhaps, to reduce the hold of party identifica-tion on voting decisions. Predicting the future is a fool’s game, to besure. But politicians respond to incentives in the long run, so the juryremains out on the consequences, intended and unintended, of thislatest reform.
Douglas J. Ahler<[email protected]> is a Ph.D. candidate inthe Travers Department of Political Science at the University ofCalifornia, Berkeley, 210 Barrows Hall, Berkeley, CA 94720-1950.Jack Citrin <[email protected]> is Heller Professor of PoliticalScience and Director of the Institute of Governmental Studies at the Uni-versity of California, Berkeley, 210 Barrows Hall, Berkeley, CA 94720-1950. Gabriel S. Lenz<[email protected]> is Associate Professor ofPolitical Science at the University of California, Berkeley, 210 BarrowsHall, Berkeley, CA 94720-1950.
APPENDIX
Given the complexities of the survey, accounting for the sample sizes in analysesis complicated. To make things clear, the table below shows how we get from the samplesizes of the full survey to the actual samples used in the analyses.
As the table shows, we lose a large number of participants because they failed toreport a vote intent on the ballot. Given the low salience of the primary and low turnoutrate in the actual primary, this falloff is not unexpected. As we note in the article,
261Do Open Primaries Improve Representation?

however, we find a similar rate of “don’t know” responses to the vote-choice question inthe treatment and control groups.
Total N for Survey(completed first question): 4,599
20 Best-Case Districts(category 3)
All 34 Districts(categories 2 and 3)
N forDistricts included in ballot
experiment (excludes faces exp. districts)1,775 2,916
Excluding participants whosaid they would not vote
1,670 2,733
Excluding participants whodid not report a vote intent
1,043 1,683
Excluding participants whovoted for nonviable candidates
878 1,452
Excluding respond. who votedfor candidates for whom we lack ratings
878 (Table 4,col. 1) 1,449 (Table 4,col. 2)
Excluding participants who failedto report their own ideology
835 (Table 1,col. 1) 1,365 (Table 1,col. 2)
Note: This table does not show the sample sizes for 19 category-1 districts, in which weinterviewed (4,599–2,916 5 ) 1,683 participants. In these districts, we conducted anunrelated experiment about candidates’ faces, though we do use these participants in Fig-ure 1.
NOTES
We thank Tony Valeriano for especially helpful research assistance, as well asLuke Edwards, Aaron Kaufman, and Aidan McCarthy. We are grateful to Thad Kousser,Eric McGhee, Stephen Rogers, Andrew Sinclair, Jonathan Wand, workshop participantsat UCSD and Stanford University, and conference participants at WPSA 2013 andAPSA 2013 for thoughtful comments. Replication data is available from the authors.
1. California adopted another primary reform, the blanket primary, for its 1998primary elections, but the Supreme Court declared it unconstitutional. Under the blanketprimary, voters could vote for any candidate and the top vote-getter from each partymoved on to the general election.
2. More precisely, Hall and Snyder (2013) report that their estimates are tooimprecise to reach strong conclusions.
3. We present these results and numerous other findings in an online supportinginformation available at https://www.ocf.berkeley.edu/~glenz/openprimary/SI.pdf. Seesections 1 and 2 for evidence on the survey vote results closely mirroring actual electionresults.
4. We originally planned to conduct the experiment in 36 districts with 3,308participants. Due to technical errors in assigning 201 participants to their districts, andhuman errors in creating ballots for District 10 and District 37, we were left with 2,916participants across 34 districts.
262 Douglas J. Ahler, Jack Citrin, and Gabriel S. Lenz
5. See online supporting information, section 4.6. Cronbach’s a 5 0.98 for all candidates; a 5 0.40 Democratic and a 5 0.50
Republican.7. Cronbach’s a 5 0.98 for all candidates; a 5 0.68 Democratic and a 5 0.41
Republican. See the supporting information, section 4, for additional details on thesemeasures (and for plots of candidate ideology by district).
8. This was not an isolated incident. We could list other egregious examples ofvoters’ apparent ignorance of candidate ideology, and we do so in the supporting infor-mation, section 6.
9. One hundred and sixteen viable, major-party candidates competed, so we aremissing data on seven candidates (missing ideological ratings for one candidate, partici-pant ratings for five candidates, and both for one candidate). We do not show the plot forthe 11 no party preference (NPP) candidates for whom we have ratings (we lack data onthree candidates), but the findings are similar with a slope of 0.06 and an R2 of 0.04. Foradditional results, see supporting information, section 6.
10. This held for Democratic candidates in 29 of 48 districts and held for Republi-can candidates in all 48 districts where we interviewed respondents. For more details, seethe supporting information, section 5. A potential problem with these findings is that vot-ers may respond to the ideology scale relative to their own districts rather than in anabsolute sense. Although our survey cannot address this criticism, Kousser, Phillips, andShor (n.d.) measures mean constituent ideology by scaling responses to policy preferen-ces and reaches a similar conclusion. See the supporting information, section 5, for plotsand more on our analyses of self-reported ideology.
11. The supporting information, section 7, presents an example.12. This procedure does produce slight differences between the treatment and
control groups, but it allows us to speak to actual effects of the reform in California. Seethe supporting information, section 8, for more detail.
13. Evidence suggests that the top-two ballot reform failed to alter the distri-bution of candidate positions compared to the previous primary (at least accordingto CFscores, see the supporting information, section 4.5) or of general election can-didates (Kousser, Phillips, and Shor n.d.). So our counterfactual may not be far offthe ideal counterfactual. (We discuss this point further in the Alternative Interpreta-tions section below.)
14. We present these results in section 10 of the supporting information. Weshould note that one potential problem with the individual-level analysis is that wemeasured participants’ ideology posttreatment, but we reassuringly fail to find evi-dence of posttreatment bias, that is, an effect of the treatment on participant ideology(see the supporting information, section 8). Moreover, the candidate-level analysisbelow (see Figure 3 and Table 4) yields the same finding but does not rely onself-reported ideology.
15. The supporting information, section 11.2, presents the within-district resultsgraphically.
16. Among all survey respondents, just 41.3% reported being aware of the switchto the top-two ballot. This increased to 42.4% in best case (category 3) districts andincreases further to 50.5% when restricting the sample to participants who indicated apreferred candidate for US House of Representatives.
263Do Open Primaries Improve Representation?

17. See the supporting information, section 1, for the correspondence betweenactual election results and the results of our top-two condition. See the supporting infor-mation, section 13, for the knowledge battery and the distribution of political knowledgein the sample.
18. The supporting information, section 4, presents more detail on these analyses:section 4.2 plots the distribution of candidate ideology, while section 4.5 compares thedistributions of candidate CF scores in 2012 and 2010.
19. We conducted several additional analyses that yield evidence inconsistentwith hedging driving the main results. The supporting information, section 14, presentsthese, while section 15 presents a density plot comparing possible to actual proximity ofchoice among crossover voters. The supporting information, section 16, presents theevidence against raiding visually.
20. The first-dimension of the principal component factor analysis has an eigen-value of 3.70 and accounts for 92.4% of the common variation (the second factor has aneigenvalue of 0.15 and accounts for 3.7%).
21. The supporting information, section 11, graphically presents the raw data forthese findings.
22. Since Democratic and no party preference (NPP) candidates tend to be moremoderate, a tendency to vote for them in the open-ballot condition for any reason—i.e.,dislike of the Republican Party—will make the open ballot appear to favor moderate can-didates. Failing to account for this tendency in the candidate-level analysis thus has thepotential to create the false appearance of a moderating effect. By calculating the treat-ment effect separately by voter party registration, we eliminate this potential bias (see thesupporting information, section 9, for more details).
23. To convey a sense for these calculations, consider the case of AbelMaldonado. He would have a positive treatment effect (more vote share) among reg-istered Democrats if he received any votes at all from them in the treatmentcondition, since he obviously received no votes from them in the control condition.He is unlikely to receive a positive treatment effect for registered Republicans, buthe may avoid a negative treatment effect (less vote share) if he prevented defections.Since the mean treatment effect will generally be negative for in-party candidatesand positive for out-party candidates, and since NPP candidates tend to be moremoderate and never appear on a closed ballot, we remove mean differences usingdummy variables for the three candidate parties interacted with the three voter partyregistration types.
24. The supporting information, section 9.2, presents tables showing the regres-sion results after rounding candidate ideology. The supporting information, section 9.3,presents the analysis investigating the top-two’s effect on advancement rather than voteshare.
25. We discuss these results more fully and present plots in the supporting infor-mation, section 17.
REFERENCES
Alvarez, R. Michael, and Jonathan Nagler. 1997. “Analysis of Crossover and StrategicVoting.” California Institute of Technology. Unpublished manuscript.
264 Douglas J. Ahler, Jack Citrin, and Gabriel S. Lenz
Alvarez, R. Michael, and Jonathan Nagler. 2002. “Should I Stay or Should I Go?” InVoting at the Political Fault Line, ed. Bruce E. Cain and Elisabeth R. Gerber.Berkeley: University of California Press, 107–23.
Ansolabehere, Stephen, Jonathan Rodden, and James M. Snyder, Jr. 2006. “PurpleAmerica.” Journal of Economic Perspectives 20(2): 97–118.
Aranson, Peter H., and Peter C. Ordeshook. 1972. “Spatial Strategies for SequentialElections.” In Probability Models of Collective Decision Making, ed. Richard G.Niemi and Herbert F. Weisberg. Columbus, OH: Merrill, 298–331.
Baldassarri, Delia, and Andrew Gelman. 2008. “Partisans without Constraint: PoliticalPolarization and Trends in American Public Opinion.” American Journal ofSociology 114(2): 408–46.
Bafumi, Joseph, and Michael C. Herron. 2010. “Leapfrog Representation and Extre-mism: A Study of American Voters and Their Members in Congress.” AmericanPolitical Science Review 104(3): 519–42.
Bonica, Adam. 2014. “Mapping the Ideological Marketplace.” American Journal ofPolitical Science 58(2): 367–86.
Brady, David W., Hahrie Han, and Jeremy C. Pope. 2007. “Primary Elections and Can-didate Ideology: Out of Step with the Primary Electorate?” Legislative StudiesQuarterly 32(1): 79–105.
Broockman, David. 2016. “Approaches to Studying Representation.” Legislative Stud-ies Quarterly 41(1): 181–215.
Bullock, Will, and Joshua D. Clinton. 2011. “More a Mountain than a Molehill: TheEffects of the Blanket Primary on Elected Officials’ Behavior from California.”Journal of Politics 73(3): 915–30.
Burden, Barry C. 2004. “Candidate Positioning in U.S. Congressional Elections.” Brit-ish Journal of Political Science 34: 211–27.
Campbell, Donald T., and Julian C. Stanley. 1963. Experimental and Quasi-Experimental Research Designs for Research. Boston: Houghton Mifflin.
Chen, Kong-Pin, and Sheng-Zhang Yang. 2002. “Strategic Voting in Open Primaries.”Public Choice 112(1–2): 1–30.
Coleman, James S. 1971. “Internal Processes Governing Party Positions in Elections.”Public Choice 11(1): 35–60.
Coleman, James S. 1972. “The Positions of Political Parties in Elections.” In Probabil-ity Models of Collective Decision Making, ed. Richard G. Niemi and Herbert F.Weisberg. Columbus, OH: Merrill, 332–57.
Cooper, A., and M. C. Munger. 2000. “The (Un)Predictability of Primaries with ManyCandidates: Simulation Evidence.” Public Choice 103(3–4): 337–55.
Cox, Gary W. 1987. “Electoral Equilibrium under Alternative Voting Institutions.”American Journal of Political Science 31(1): 82–108.
Cunow, Saul. 2013. “More is Less (Representation): Choice Set Size, InformationAcquisition, and Correct Voting in Multimember Districts.” University of Cali-fornia, San Diego. Unpublished manuscript.
Dalager, Jon K. 1996. “Voters, Issues, and Elections: Are the Candidates’ MessagesGetting Through?” Journal of Politics 58(2): 486–515.
Fiorina, Morris P., and Samuel J. Abrams. 2009. Disconnect: The Breakdown ofRepresentation in American Politics. Norman: University of OklahomaPress.
265Do Open Primaries Improve Representation?
Fiorina, Morris P., Samuel J. Abrams, and Jeremy Pope. 2005. Culture War? The Mythof a Polarized America. New York: Pearson Education.
Franklin, Charles H. 1991. “Eschewing Obfuscation? Campaigns and the Perception ofU.S. Senate Incumbents.” American Political Science Review 85(4): 1193–214.
Gaines, Brian J., and Wendy K. Tam Cho. 2002. “Crossover Voting before theBlanket.” In Voting at the Political Fault Line, ed. Bruce E. Cain and ElisabethR. Gerber. Berkeley: University of California Press, 12–35.
Gerber, Elisabeth R. 2002. “Strategic Voting and Candidate Policy Positions.” In Votingat the Political Fault Line, ed. Bruce E. Cain and Elisabeth R. Gerber. Berkeley:University of California Press, 192–213.
Gerber, Elisabeth R., and Rebecca B. Morton. 1998. “Primary Election Systemsand Representation.” Journal of Law, Economics, and Organization 14(1):304–24.
Granberg, Donald, and Edward Brent. 1980. “Perceptions of Issue Positions of Presi-dential Candidates.” American Scientist 68: 617–25.
Grose, Christian R. 2014. “The Adoption of Electoral Reforms and Ideological Changein the California State Legislature.” Schwarzenegger Institute Report, Universityof California Price School of Public Policy.
Hacker, Jacob S., and Paul Pierson. 2005. “Abandoning the Middle: The Bush TaxCuts and the Limits of Democratic Control.” Perspectives on Politics 3: 33–53.
Hall, Andrew B., and James M. Snyder Jr. 2013. “Candidate Ideology and ElectoralSuccess.” Harvard University. Unpublished manuscript.
Hedlund, Ronald D. 1977. “Cross-Over Voting in a 1976 Open Presidential Primary.”Public Opinion Quarterly 41(4): 498–514.
Hirano, Shigeo, James M. Snyder, Stephen Ansolabehere, and John Mark Hansen.2010. “Primary Elections and Partisan Polarization in the US Congress.” Quar-terly Journal of Political Science 5(2): 169–91.
Hirano, Shigeo, Gabriel S. Lenz, Maksim L. Pinkovskiy, and James M. Snyder, Jr.2015. “Voter Learning in State Primary Elections.” American Journal of Politi-cal Science 59(1): 91–108.
Kanthak, Kristin, and Rebecca Morton. 2001. “The Effects of Electoral Rules onCongressional Primaries.” In Congressional Primaries and the Politics of Repre-sentation, ed. Peter F. Galderisi, Marni Ezra, and Michael Lyons. Lantham, MD:Rowan and Littlefield, 116–31.
Kousser, Thad. 2002. “Crossing over When It Counts: How the Motives of Voters inBlanket Primaries Are Revealed by Their Actions in General Elections.” In Vot-ing at the Political Fault Line, ed. Bruce E. Cain and Elisabeth R. Gerber.Berkeley: University of California Press, 143–70.
Kousser, Thad, Justin Phillips, and Boris Shor. n.d. “Reform and Representation: ANew Method Applied to Recent Electoral Changes.” Political Science Researchand Methods. Forthcoming.
Krosnick, John A. 1990. “Americans’ Perceptions of Presidential Candidates: A Test ofthe Projection Hypothesis.” Journal of Social Issues 46(2): 159–82.
Lau, Richard R., David J. Andersen, and David P. Redlawsk. 2008. “An Exploration ofCorrect Voting in Recent U.S. Presidential Elections.” American Journal ofPolitical Science 52(2): 395–411.
266 Douglas J. Ahler, Jack Citrin, and Gabriel S. Lenz

Levendusky, Matthew S., and Jeremy C. Pope. 2011. “Red States vs. Blue States:Going Beyond the Mean.” Public Opinion Quarterly 75(2): 227–48.
Lupia, Arthur. 1994. “Shortcuts Versus Encyclopedias: Information and Voting Behav-ior in California Insurance Reform Elections.” American Political ScienceReview 88(1): 63–76.
Mann, Thomas E., and Norman Ornstein. 2012. It’s Even Worse Than It Looks: Howthe American Constitutional System Collided with the New Politics of Extremism.Philadelphia, PA: Basic Books.
Masket, Seth. 2009. No Middle Ground: How Informal Party Organizations ControlNominations and Polarize Legislatures. Ann Arbor: University of MichiganPress.
Markus, Gregory B., and Philip E. Converse. 1979. “A Dynamic Simultaneous Equa-tion Model of Electoral Choice.” American Political Science Review 73(2):1055–70.
McCarty, Nolan M. 2011. “The Limits of Electoral and Legislative Reform in Address-ing Polarization.” California Law Review 99: 359–72.
McCarty, Nolan, Keith Poole, and Howard Rosenthal. 2008. Polarized America: TheDance of Ideology and Unequal Riches. Cambridge, MA: MIT Press.
McGann, Anthony J. 2002. “The Advantages of Ideological Cohesion.” Journal of The-oretical Politics 14(1): 37–70.
McGhee, Eric, Seth Masket, Boris Shor, Stephen Rogers, and Nolan McCarty. 2014.“A Primary Cause of Partisanship?” American Journal of Political Science58(2): 337–51.
McGhee, Eric. 2010. “Open Primaries.” San Francisco: Public Policy Institute ofCalifornia.
Merrill, Samuel III, Bernard Grofman, and James Adams. 2001. “Assimilation and Con-trast Effects in Voter Projections of Party Locations.” European Journal ofPolitical Research 40: 199–221.
Moore, David W. 1987. “Political Campaigns and the Knowledge-Gap Hypothesis.”Public Opinion Quarterly 51(2): 186–200.
Nivola, Pietro S., and William A. Galston. 2006. Toward Depolarization. Red and BlueNation? Vol. 2. Stanford, CA: Hoover Institution.
Oak, Mandar P. 2006. “On the Role of the Primary System in Candidate Selection.”Economics & Politics 18(2): 169–90.
Osborne, Martin J. 1995. “Spatial Models of Political Competition under PluralityRule.” Canadian Journal of Economics 28(2): 261–301.
Poole, Keith T., and Howard Rosenthal. 1997. Congress: A Political-Economic Historyof Roll Call Voting. New York: Oxford University Press.
Ranney, Austin. 1968. “The Representativeness of Primary Electorates.” Midwest Jour-nal of Political Science 12(22): 224–38.
Ranney, Austin. 1972. “Turnout and Representation in Presidential Primary Elections.”American Political Science Review 66(1): 21–37.
Rogowski, Jon C. 2013. “Primary Systems, Candidate Platforms, and IdeologicalExtremity.” Washington University in St. Louis. Unpublished manuscript.
Salvanto, Anthony M., and Martin P. Wattenberg. 2002. “Peeking under the Blanket.”In Voting at the Political Fault Line, ed. Bruce E. Cain and Elizabeth R. Gerber.Berkeley: University of California Press.
267Do Open Primaries Improve Representation?
Shor, Boris, and Nolan McCarty. 2011. “The Ideological Mapping of American Legis-latures.” American Political Science Review 105(3): 530–51.
Sides, John, Jonathan Cohen, and Jack Citrin. 2002. “The Causes and Consequences ofCrossover Voting in the 1998 California Elections.” In Voting at the PoliticalFault Line, ed. Bruce E. Cain and Elisabeth R. Gerber. Berkeley, CA: Universityof California Press, 77–106.
Sinclair, J. Andrew. 2013. “Between Person and Party: Voter Behavior in California’sFirst Top-Two Primary.” Presented at the Annual Meeting of the American Polit-ical Science Association, Chicago.
Snyder Jr, James M., and Michael M. Ting. 2002. “An Informational Rationale forPolitical Parties.” American Journal of Political Science 46(1): 90–110.
Tausanovitch, Chris, and Christopher Warshaw. 2013. “Electoral Accountability andRepresentation in the US House: 2004–2012.” University of California, LosAngeles and Massachusetts Institute of Technology. Unpublished manuscript.
Tullock, Gordon. 1967. Toward a Mathematics of Politics. Ann Arbor: University ofMichigan Press.
268 Douglas J. Ahler, Jack Citrin, and Gabriel S. Lenz