do boys and girls use computers differently, and does it ...rfairlie/papers/published/bejournals...
TRANSCRIPT

Contributions
Robert W. Fairlie*
Do Boys and Girls Use ComputersDifferently, and Does It Contribute toWhy Boys do Worse in School Than Girls?
DOI 10.1515/bejeap-2015-0094
Abstract: Boys are doing worse in school than are girls, which has been dubbed“the Boy Crisis.” An analysis of the latest data on educational outcomes amongboys and girls reveals extensive disparities in grades, reading and writing testscores, and other measurable educational outcomes, and these disparities existacross family resources and race. Focusing on disadvantaged schoolchildren,I then examine whether time investments made by boys and girls related tocomputer use contribute to the gender gap in academic achievement. Data fromseveral sources indicate that boys are less likely to use computers for school-work and are more likely to use computers for playing games, but are less likelyto use computers for social networking and email than are girls. Using data froma large field experiment randomly providing free personal computers to school-children for home use, I also test whether these differential patterns of computeruse displace homework time and ultimately translate into worse educationaloutcomes among boys. No evidence is found indicating that personal computerscrowd out homework time and effort for disadvantaged boys relative to girls.Home computers also do not have negative effects on educational outcomessuch as grades, test scores, courses completed, and tardies for disadvantagedboys relative to girls.
Keywords: technology, computers, ICT, education, gender, field experimentJEL Codes: C93, I24, J16
*Corresponding author: Robert W. Fairlie, Department of Economics, Universityof California, Engineering 2 Bldg., Santa Cruz, California 95064, USA,E-mail: [email protected]
BE J. Econ. Anal. Policy 2015; aop
Brought to you by | University of California - Santa CruzAuthenticated
Download Date | 10/15/15 10:33 PM

1 Introduction
Boys do worse in school than girls. They obtain lower grades and are less likelyto graduate from high school and attend college (NCES 2012).1 These genderdisparities in academic performance exist for minority and low-income school-children as well as for more advantaged schoolchildren. One factor that mightcontribute to why boys and girls differ in academic performance is that theymake different time investments after school.2 For example, boys might spendmore time playing video games, “playing around” on computers, watching TV,and using other forms of media than girls. All of these activities might crowd outtime spent doing homework and studying for exams. A recent national time-usediary survey found that children consume 7.5 hours of media a day and this levelof use is 20% higher than it was only five years ago (Kaiser Family Foundation2010). The average length of a school day in the United States is roughly6.5 hours (NCES 2012). These time investments made at young ages betweeneducational and non-educational activities might have long-lasting effects oneducational attainment. Surprisingly, very little research has focused on the timeinvestments made by children and their consequences for educationaloutcomes.
Of particular concern are the potential consequences of computer useamong boys and girls. Computer use is one of the largest types of media useamong children (Kaiser Family Foundation 2010), and thus extensive use ofcomputers after school for video games, social networking and other entertain-ment activities might crowd out homework and study time among schoolchil-dren. There is evidence in the previous literature of computer use crowding outschoolwork and negative effects on academic performance. For example,
1 The media has dubbed these disparities as the “Boy Crisis.” See “The Boy Crisis. At EveryLevel of Education, They’re Falling Behind. What to Do?” Newsweek (January 30, 2006),“Raising Cain: Boys in Focus,” PBS (January 12, 2006), “The Boys Have Fallen Behind,” NYTimes (March 27, 2010), and “The Boys at the Back,” NY Times (February 2, 2013) for example.2 The reversal of the gender gap in college education with women now earning more collegedegrees than men has been well documented (see Sundstrom 2004; Goldin, Katz, and Kuziemko2006 for example), but disparities between boys and girls in academic performance have drawnmuch less research attention. The underlying causes of these disparities are not well known.Some of the potential explanations examined in recent studies include a disproportionaterepresentation of female teachers in younger grades, girls are more self-disciplined, girlsrespond more to pre-school interventions, girls are more ready to learn, differential treatmentby teachers, and larger positive impacts for girls by Teach for America teachers (Dee 2007;Duckworth et al. 2006; Anderson 2008; Cornwell, Mustard, and Van Parys 2013; Malamud andSchanzenbach 2007; Antecol, Eren, and Ozbeklik 2013).
2 R. W. Fairlie
Brought to you by | University of California - Santa CruzAuthenticated
Download Date | 10/15/15 10:33 PM
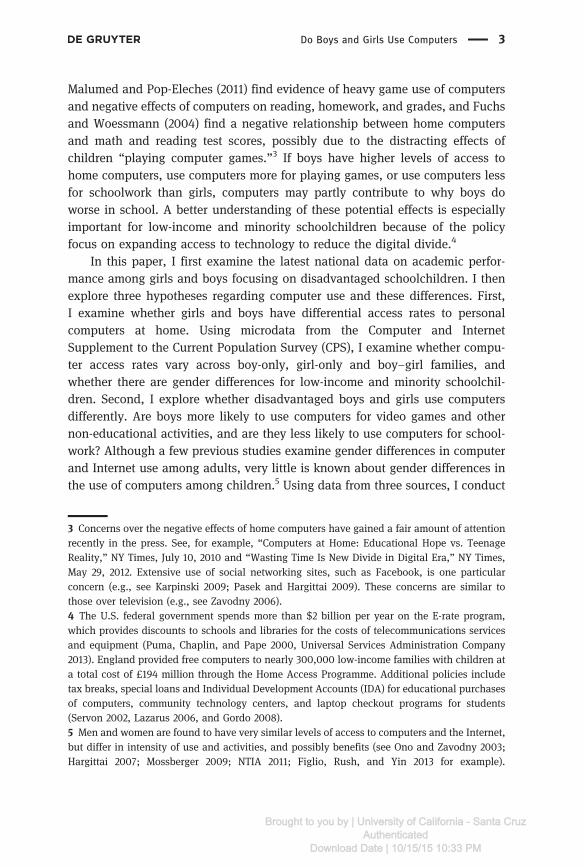
Malumed and Pop-Eleches (2011) find evidence of heavy game use of computersand negative effects of computers on reading, homework, and grades, and Fuchsand Woessmann (2004) find a negative relationship between home computersand math and reading test scores, possibly due to the distracting effects ofchildren “playing computer games.”3 If boys have higher levels of access tohome computers, use computers more for playing games, or use computers lessfor schoolwork than girls, computers may partly contribute to why boys doworse in school. A better understanding of these potential effects is especiallyimportant for low-income and minority schoolchildren because of the policyfocus on expanding access to technology to reduce the digital divide.4
In this paper, I first examine the latest national data on academic perfor-mance among girls and boys focusing on disadvantaged schoolchildren. I thenexplore three hypotheses regarding computer use and these differences. First,I examine whether girls and boys have differential access rates to personalcomputers at home. Using microdata from the Computer and InternetSupplement to the Current Population Survey (CPS), I examine whether compu-ter access rates vary across boy-only, girl-only and boy–girl families, andwhether there are gender differences for low-income and minority schoolchil-dren. Second, I explore whether disadvantaged boys and girls use computersdifferently. Are boys more likely to use computers for video games and othernon-educational activities, and are they less likely to use computers for school-work? Although a few previous studies examine gender differences in computerand Internet use among adults, very little is known about gender differences inthe use of computers among children.5 Using data from three sources, I conduct
3 Concerns over the negative effects of home computers have gained a fair amount of attentionrecently in the press. See, for example, “Computers at Home: Educational Hope vs. TeenageReality,” NY Times, July 10, 2010 and “Wasting Time Is New Divide in Digital Era,” NY Times,May 29, 2012. Extensive use of social networking sites, such as Facebook, is one particularconcern (e.g., see Karpinski 2009; Pasek and Hargittai 2009). These concerns are similar tothose over television (e.g., see Zavodny 2006).4 The U.S. federal government spends more than $2 billion per year on the E-rate program,which provides discounts to schools and libraries for the costs of telecommunications servicesand equipment (Puma, Chaplin, and Pape 2000, Universal Services Administration Company2013). England provided free computers to nearly 300,000 low-income families with children ata total cost of £194 million through the Home Access Programme. Additional policies includetax breaks, special loans and Individual Development Accounts (IDA) for educational purchasesof computers, community technology centers, and laptop checkout programs for students(Servon 2002, Lazarus 2006, and Gordo 2008).5 Men and women are found to have very similar levels of access to computers and the Internet,but differ in intensity of use and activities, and possibly benefits (see Ono and Zavodny 2003;Hargittai 2007; Mossberger 2009; NTIA 2011; Figlio, Rush, and Yin 2013 for example).
Do Boys and Girls Use Computers 3
Brought to you by | University of California - Santa CruzAuthenticated
Download Date | 10/15/15 10:33 PM

the first detailed examination of computer and Internet use among boys andgirls. Computer use for game playing, social networking, schoolwork and otheractivities is examined.
Third, I explore whether boy–girl differences in computer use crowd outhomework time and effort differently and contribute to gender disparities ineducational outcomes among disadvantaged schoolchildren. To test this hypoth-esis I estimate the effects of home computers on homework time and effort,grades, standardized test scores, and several additional educational outcomesfor girls and boys. Given similar access rates, if home computers have a largernegative impact on educational outcomes for boys than for girls then differentialcomputer use at home widens the achievement gap. If instead, home computershave a similar effect for boys and girls then differential computer use does notcontribute to the achievement gap. To remove concerns about selection biasresulting from which families decide to purchase computers I use data from thelargest-ever randomized control experiment providing free personal computersto U.S. schoolchildren for home use.6 Half of over one thousand schoolchildrengrades 6–10 attending 15 different schools were randomly selected to receivecomputers to use at home. Previous findings for all schoolchildren participatingin the field experiment indicate that the randomly selected group of studentsreceiving free computers experienced no improvement in educational outcomesrelative to the control group that did not receive free computers (Fairlie andRobinson 2013). Fairlie and Robinson (2013), however, does not explore whetherboys and girls use computers differently and whether these differences contri-bute to the gender gap in academic performance among disadvantagedschoolchildren.
Briefly previewing the results, I find that girls outperform boys not only ingrades, test scores in reading and writing, and high school graduation rates, butalso in numerous other educational outcomes. The results show a remarkablyconsistent underperformance of boys relative to girls in school, which holdsacross race and family resources. Using microdata from the CPS computer
Differences in access and use, however, are substantially larger by race and income (seeHoffman and Novak 1998; Mossberger, Tolbert, and Stansbury 2003; Mossberger, Tolbert, andGilbert 2006; Ono and Zavodny 2007; Fairlie 2004; Goldfarb and Prince 2008 for example).6 If computers were exogenously assigned to children the question could be explored bysimply comparing the girl–boy gap in educational outcomes among existing computer ownersto the girl–boy gap in educational outcomes among existing non-computer owners. But, parentsmake decisions about computer purchases partly based on concerns about the non-educationaluses of computers by children and partly based on the perceived educational benefits ofcomputers to children (which might differ between boys and girls) raising concerns aboutselection bias.
4 R. W. Fairlie
Brought to you by | University of California - Santa CruzAuthenticated
Download Date | 10/15/15 10:33 PM

supplement I find that boys and girls have very similar rates of access to homecomputers overall and by race and income even though disparities across thesegroups are large. Boys and girls use computers differently, however, with boysusing computers more for video games and girls using computers more forschoolwork, email and social networking, which does not differ substantiallyby race or income. Estimates from the random experiment, however, do notprovide evidence that computers crowd out homework time and effort for dis-advantaged boys relative to girls, or that home computers have negative effectson grades, test scores, and other educational outcomes for boys relative to girls.Although parents, schools, and policymakers may have other concerns abouthow boys and girls use computers, these patterns do not appear to contribute towhy disadvantaged boys do worse in school than girls.
The remainder of the paper is organized as follows. In Section 2, I describethe data sources used to examine gender differences in computer access anduse. I also describe the experiment used to test for gender differences in theimpacts of computers on educational outcomes. Section 3 presents estimates ofgender differences in academic performance. Section 4 presents estimates ofgender differences in computer access and use. Section 5 presents the experi-mental results for the impacts of home computers on homework time and effortand educational outcomes for boys and girls. Section 5 concludes.
2 Data and Methods
2.1 Data on Computer Use
Data from three national sources are used to examine whether boys and girls usecomputers differently. I use data from the Current Population Survey Computerand Internet Use Supplements conducted by the U.S. Bureau of Labor Statisticsand Census Bureau, a time use diary study of the use of technology by childrenconducted by the Kaiser Family Foundation, and surveys of teenagers conductedas part of the Pew Internet and American Life Project. The combination of datafrom these national sources provides the first comprehensive examination ofgender differences in computer use among children.
The Internet and Computer Use Supplement to the Current PopulationSurvey (CPS), conducted by the U.S. Census Bureau and the Bureau of LaborStatistics, is representative of the entire U.S. population and interviews approxi-mately 50,000 households and 130,000 individuals. The Internet and ComputerUse Supplement to the CPS is the primary source of information on technology
Do Boys and Girls Use Computers 5
Brought to you by | University of California - Santa CruzAuthenticated
Download Date | 10/15/15 10:33 PM

use collected by the federal government and has been conducted over the pastthree decades at irregular intervals. The information gathered differs in eachsurvey. Estimates from the 2003 supplement include the latest information oncomputer use activities among children. The estimates reported later in Table 4are from these CPS data. The 2011 Supplement is the latest available data, butdoes not allow one to examine activities of computer use among children (onlyadult householders). Because of the lack of published results from the survey,I use microdata from the 2011 CPS Supplement to examine overall access anduse rates among boys and girls ages 5–17 (N ¼ 23,594). The microdata also allowfor a more detailed examination of home computer access rates among girls andboys by child and family characteristics such as the gender composition of thehousehold, race, income, and age.
The Kaiser Family Foundation surveyed 2,002 children ages 8–18 across thecountry in 2008 and 2009 on their use of media including detailed informationon computer use (Kaiser Family Foundation 2010). Similar surveys were con-ducted in 1999 and 2004 by the Kaiser Family Foundation. Information oncomputer use activities is also reported from national surveys conducted aspart of the Pew Internet and American Life Project (see Pew Internet Project2008a, 2008b). Surveys on numerous topics related to computer, Internet andmedia use are conducted regularly by the Pew Research Center. The PewInternet Project (2008a, 2008b) studies include nationally representative sam-ples of 1,102 children ages 12–17 in 2007 and 2008 and 700 children ages 12–17in 2007, respectively. To our knowledge, these three sources of data represent allof the nationally representative sources of data providing detailed informationon computer use among children.
2.2 Randomized Control Experiment
To explore the effects of personal computers on crowding out homework timeand educational outcomes among disadvantaged boys and girls and whetherthese effects differ by gender I use data from a field experiment that providesfree personal computers to schoolchildren for home use. The randomized controlexperiment involved 1,123 students in grades 6–10 attending 15 schools acrossCalifornia (see Fairlie and Robinson 2013 for more details). It represents the firstfield experiment involving the provision of free computers to schoolchildren forhome use ever conducted, and the largest experiment involving the provision offree home computers to U.S. students at any level. The randomized controlexperiment removes concerns about selection bias resulting from which familiesdecide to purchase computers. All of the students participating in the study did
6 R. W. Fairlie
Brought to you by | University of California - Santa CruzAuthenticated
Download Date | 10/15/15 10:33 PM

not have computers at baseline. Half were randomly selected to receive freecomputers, while the other half served as the control group. Outcomes weretracked for all participating students over an academic year.
The sample for this study includes 1,123 students enrolled in grades 6–10 in15 different middle and high schools in 5 school districts in California. Theproject took place over two years: two schools participated in 2008–2009, twelveschools participated in 2009–2010, and one school participated in both years.The 15 schools in the study span the Central Valley of California geographically.Overall, these schools are similar in size (749 students compared to 781 stu-dents), student to teacher ratio (20.4 to 22.6), and female to male student ratio(1.02 to 1.05) as California schools as a whole (U.S. Department of Education2011). Schools in the experiment, however, are poorer (81% free or reduced pricelunch compared with 57%) and have a higher percentage of minority students(82% to 73%) than the California average reflecting the requirement of nothaving a home computer for eligibility in the experiment. Participating studentsalso have lower average test scores than the California average (3.2 comparedwith 3.6 in English-Language Arts and 3.1 compared with 3.3 in Math), but thedifferences are not large (California Department of Education 2010).
To identify children who did not already have home computers, we con-ducted an in-class survey at the beginning of the school year with all of thestudents in the 15 participating schools. The survey, which took only a fewminutes to complete, asked basic questions about home computer ownershipand usage. To encourage honest responses, it was not announced to studentsthat the survey would be used to determine eligibility for a free home computer(even most teachers did not know the purpose of the survey). In total, 7,337students completed in-class surveys, with 24% reporting not having a computerat home. This rate of home computer ownership is roughly comparable to thenational average: – estimates from the 2010 Current Population Survey indicatethat 27% of children aged 10–17 do not have a computer with Internet access athome (U.S. Department of Education 2011).
Any student who reported not having a home computer on an in-classsurvey was eligible for the study.7 All eligible students were given an informa-tional packet, baseline survey, and consent form to complete at home. Toparticipate, children had to have their parents sign the consent form (which,
7 Because eligibility for the study is based on not having a computer at home, our estimatescapture the impact of computers on the educational outcomes of schoolchildren whose parentsdo not buy them on their own and do not necessarily capture the impact of computers forexisting computer owners. Schoolchildren without home computers, however, are the popula-tion of interest in considering policies to expand access.
Do Boys and Girls Use Computers 7
Brought to you by | University of California - Santa CruzAuthenticated
Download Date | 10/15/15 10:33 PM

in addition to participating in the study, released future grade, test score andadministrative data) and return the completed survey to the school. Of the 1,636students eligible for the study, we received 1,123 responses with valid consentforms and completed questionnaires (68.6%). We randomized treatment at theindividual level, stratified by school. In total, of the 1,123 participants, 559 wererandomly assigned to the treatment group. For boys, there were 555 participantswith 280 assigned to the treatment group, and for girls there were 568 partici-pants with 279 assigned to the treatment group.
The computers provided through the experiment were purchased from ordonated by Computers for Classrooms, Inc., a Microsoft-certified computer refurb-isher located in Chico, California. The computers were refurbished Pentiummachines with 17” monitors, modems, ethernet cards, CD drives, flash drives,Microsoft Windows, and Microsoft Office (Word, Excel, PowerPoint, Outlook). Thecomputer came with a 1-year warranty on hardware and software during whichComputers for Classrooms offered to replace any computer not functioning prop-erly. In total, the retail value of the machines was approximately $400–500 a unit.Since the focus of the project was to estimate the impacts of home computers oneducational outcomes and not to evaluate a more intensive technology policyintervention, no training or assistance was provided with the computers. We didnot provide Internet service as part of the experiment and found that about half ofthe students receiving computers subscribed to service.
The computers were handed out by the schools to eligible students in thelate fall of the school year. Almost all of the students sampled for computersreceived them: we received reports of only 11 children who did not pick up theircomputers, and 7 of these had dropped out of their school by that time. Asexpected, we found that some of the control group students purchased homecomputers by the end of the school year. From a follow-up survey conducted atthe end of the school year, we found that 27% of girls and 25% of boys in thecontrol group purchased computers, and in most cases these computers werepurchased later in the school year (thus having less potential impacts onmeasured outcomes). After the distribution, neither the research team norComputers for Classrooms had any contact with students during the schoolyear. In addition, many of the outcomes were collected at least 6 months afterthe computers were given out (for example, end-of-year standardized test scoresand fourth quarter grades). Thus, it is very unlikely that student behavior wouldhave changed for any reason other than the computers themselves (for instance,via Hawthorne effects).
Data from the experiment were collected from four main sources. First, weadministered a detailed baseline survey which was required to participate in the
8 R. W. Fairlie
Brought to you by | University of California - Santa CruzAuthenticated
Download Date | 10/15/15 10:33 PM

project (as that was where consent was obtained). The survey includes detailedinformation on student and household characteristics. Second, we administereda follow-up survey at the end of the school year, which included detailedquestions about computer ownership, homework time, and homework effortallowing for a comparison of first-stage and homework crowd-out effects. Theresponse rates for the follow-up survey were high: 78.2% for boys and 76.6% forgirls.8 Third, each school provided us with detailed administrative data oneducational outcomes for all students covering the entire academic year. Theseadministrative data include grades in all courses taken and disciplinary infor-mation. Finally, schools provided us with standardized test scores from theCalifornia Standardized Testing and Reporting (STAR) program. A major advan-tage of the administrative data on test scores as well as grades and otheroutcomes is that they are measured without any measurement error, and attri-tion is virtually non-existent. The collection of these datasets provides anextensive amount of information on computer ownership and educationaloutcomes.
2.3 Randomization and Implementation Checks
Appendix Table 8 reports summary statistics for the treatment and controlgroups and provides a balance check. Balance checks are reported for thetotal sample, the girl sample, and the boy sample. For each sample, means forthe treatment and control groups and the p-value for a t-test of equality arereported. Overall, there is very little difference between the treatment andcontrol groups in all three samples. The only variable with a difference that isstatistically significant is that treatment children are less likely to live with theirmother in the boy sample (although the difference of 0.06 is small relative to thebase of 0.93). It is likely that this one difference is caused by random chancegiven the large number of comparisons being made – nevertheless, all of thesecovariates are controlled for in the regressions that follow.
As a check of the experimental implementation, I also examine whetherthere is a large relative increase in reported computer ownership and whetherthe effect is similar for boys and girls. Information on computer ownership isobtained from the follow-up survey conducted at the end of the school year. Forgirls, I find that 82% of the treatment group and 27% of the control group reporthaving a computer at follow-up. For boys, the overall levels are similar and the
8 The response rates are 76.7% for the control group and 79.6% for the treatment group forboys, and 75.4% for the control group and 77.8% for the treatment group for girls.
Do Boys and Girls Use Computers 9
Brought to you by | University of California - Santa CruzAuthenticated
Download Date | 10/15/15 10:33 PM

treatment-control difference is identical, with 80% of the treatment group and25% of the control group reporting having a computer at follow-up. While thesetreatment-control differences of 55 percentage points are very large, if anythingthey are understated because only a very small fraction of the 559 students inthe treatment group did not receive one (as noted above, we had reports of only11 students who did not pick up their computer). In fact, I find that one quarterof the boy and girl treatment groups report positive hours of computer use athome even though they report in a previous question that they do not have acomputer at home and are supposed to skip the question. In addition, anymeasurement error in computer ownership would understate differences inreported ownership.
The follow-up survey also asked children a battery of questions about howmuch they use computers for five different types of activities at home, school,and other locations. With the resulting 15 different questions of types of use, theself-reported hours’ responses are noisy with many missing values and someinconsistencies in reporting. Appendix Table 9 reports the average value ofresponses to these questions. Overall, computer use increased for both boysand girls. This includes separate use for schoolwork, email, games, and socialnetworking. Unfortunately, the estimates are not precise enough to identify girl–boy differences in use. With so many different categories to report hours of use,there is likely to be a fair amount of measurement error in these estimates, andthus I do not place too much weight on them.
These results are suggestive of three important findings regarding first-stageeffects. First, the experiment had a large effect for both boys and girls onincreasing computer ownership. Second, the increase in computer ownershipwas similar for girls and boys. Third, the experiment also increased computeruse for both boys and girls for numerous activities.
3 Girl–Boy Differences in Academic Performance
I first examine girl–boy differences in academic performance. Figure 1 reportsaverage grades for boys and girls from the High School Transcript Study which ispart of the National Assessment of Educational Progress (NAEP) conducted bythe National Center for Educational Statistics (NCES). The latest available data isfor 2009 and grades are available overall and in several different subjects. Theestimates clearly indicate that girls obtain better grades than boys. They havehigher overall grades than boys and obtain better grades in every core subjectmatter. The disparities are large. Even in math and science, girls obtain grades
10 R. W. Fairlie
Brought to you by | University of California - Santa CruzAuthenticated
Download Date | 10/15/15 10:33 PM

that are nearly 0.2 points higher, and in English grades are over 0.3 pointshigher (which is equivalent to a þ or – modifier on a letter grade).
Gender differences are large among disadvantaged schoolchildren. Table 1reports average grades by parental education and race (which are the categoriesavailable in the NAEP grade data). Boys from families with low parental educa-tion or from underrepresented minority groups have lower grades in all subjectsthan girls from similar families. In fact, the grade underperformance of boysrelative to girls is large across all parental education groups and all racialgroups.
Figure 2 reports test score data for boys and girls collected as part of the 2011NAEP. Overall girls score better, on average, than boys on reading and writingassessment tests, similarly on math assessment tests, but slightly lower onscience assessment tests. Table 2 reports test scores by school lunch eligibilityand race (which are the categories available in the NAEP test score data). Thegirl–boy patterns in test scores across subjects (i.e. girls score higher in readingand writing, similarly in math, and slightly lower in science than boys) hold forlow-income and minority schoolchildren.
Using the NAEP data on test scores, I also examine girl and boy distributionsof test scores. Figure 3 reports inverse cumulative distribution functions (CDFs)for each of the test scores reported in Figure 2 for both boys and girls. Thedistributional estimates are limited by NAEP reporting to showing the 10th, 25th,50th, 75th, and 90th percentiles, but these percentiles characterize the fulldistribution reasonably well. Because I report inverse CDFs, the vertical differ-ence at each of the reported points in the distribution is the equivalent to a
2.0
2.2
2.4
2.6
2.8
3.0
3.2
3.4
3.6
Overall Mathematics Science English Social Studies
Girls
Boys
Figure 1: Grade Point Average by Gender and Subject High School Transcript Study, 2009.
Do Boys and Girls Use Computers 11
Brought to you by | University of California - Santa CruzAuthenticated
Download Date | 10/15/15 10:33 PM

Table 1: Grade point average by gender, parental education, and race.
Girls Boys Girl–Boy Difference
Grade Point Average (Overall)All Students . . .Parental Education: High School Dropout . . .Parental Education: Graduated High School . . .Parental Education: Graduated College . . .Race: White . . .Race: Black . . .Race: Hispanic . . .Race: Asian . . .
Grade Point Average (Mathematics)All Students . . .Parental Education: High School Dropout . . .Parental Education: Graduated High School . . .Parental Education: Graduated College . . .Race: White . . .Race: Black . . .Race: Hispanic . . .Race: Asian . . .
Grade Point Average (Science)Average . . .Parental Education: High School Dropout . . .Parental Education: Graduated High School . . .Parental Education: Graduated College . . .Race: White . . .Race: Black . . .Race: Hispanic . . .Race: Asian . . .
Grade Point Average (English)All Students . . .Parental Education: High School Dropout . . .Parental Education: Graduated High School . . .Parental Education: Graduated College . . .Race: White . . .Race: Black . . .Race: Hispanic . . .Race: Asian . . .
Grade Point Average (Social Studies)All Students . . .Parental Education: High School Dropout . . .Parental Education: Graduated High School . . .Parental Education: Graduated College . . .Race: White . . .Race: Black . . .Race: Hispanic . . .Race: Asian . . .
Source: High School Transcript Study, 2009.
12 R. W. Fairlie
Brought to you by | University of California - Santa CruzAuthenticated
Download Date | 10/15/15 10:33 PM

100
150
200
250
300
Math (4th Grade) Math (8th Grade) Science (8th Grade) Reading (4th Grade) Reading (8th Grade) Writing (8th Grade) Writing (12th Grade)
Girls
Boys
Figure 2: Average Test Scores by Gender and Subject National Assessment of EducationalProgress, 2011.
Table 2: Average test scores by gender, school lunch eligibility, and race.
Girls Boys Girl–BoyDifference
Average Test Score (Math th Grade)All Students −
Eligible for National School Lunch Program
Not Eligible for National School Lunch Program −
Race: White −
Race: Black
Race: Hispanic −
Race: Asian
Average Test Score (Math th Grade)All Students −
Eligible for National School Lunch Program
Not Eligible for National School Lunch Program −
Race: White −
Race: Black
Race: Hispanic
Race: Asian −
(continued )
Do Boys and Girls Use Computers 13
Brought to you by | University of California - Santa CruzAuthenticated
Download Date | 10/15/15 10:33 PM

Table 2: (continued )
Girls Boys Girl–BoyDifference
Average Test Score (Science th Grade)All Students −
Eligible for National School Lunch Program −
Not Eligible for National School Lunch Program −
Race: White −
Race: Black −
Race: Hispanic −
Race: Asian −
Average Test Score (Reading th Grade)All Students
Eligible for National School Lunch Program
Not Eligible for National School Lunch Program
Race: White
Race: Black
Race: Hispanic
Race: Asian
Average Test Score (Reading th Grade)All Students
Eligible for National School Lunch Program
Not Eligible for National School Lunch Program
Race: White
Race: Black
Race: Hispanic
Race: Asian
Average Test Score (Writing th Grade)All Students
Eligible for National School Lunch Program
Not Eligible for National School Lunch Program
Race: White
Race: Black
Race: Hispanic
Race: Asian
Average Test Score (Writing th Grade)All Students
Eligible for National School Lunch Program
Not Eligible for National School Lunch Program
Race: White
Race: Black
Race: Hispanic
Race: Asian
Source: National Assessment of Educational Progress, 2011.
14 R. W. Fairlie
Brought to you by | University of California - Santa CruzAuthenticated
Download Date | 10/15/15 10:33 PM

quantile treatment effect (QTE) estimate. In addition to girls having higheraverage test scores in reading and writing, girls have higher test scores through-out the distribution. At each reported percentile girls have higher scores thanboys. For math test scores, girls and boys have roughly similar scores through-out the distribution with some slight differences at the reported tails. For sciencetest scores, the distribution for boys is slightly higher at all points.
In addition to performing better on grades, and reading and writing testscores, girls outperform boys along numerous other measures of educationaloutcomes. Girl–boy disparities in many of these measures are not as well-knownas those for grades, high school graduation rates, and college attendance.Appendix Table 10 provides evidence of consistent and sizeable gender dispa-rities in several educational outcomes starting with outcomes relevant to schoolentry and ending with high school graduation.
165.0
185.0
205.0
225.0
245.0
265.0
Reading (4th Grade)
Boys
Girls
210.0
230.0
250.0
270.0
290.0
310.0
Reading (8th Grade)
Boys
Girls
90.0
110.0
130.0
150.0
170.0
190.0
210.0
Writing (8th Grade)
Boys
Girls
90.0
110.0
130.0
150.0
170.0
190.0
0 0.5 1 0 0.5 1
0 0.5
(a)
1 0 0.5 1
Writing (12th Grade)
Boys
Girls
Math (4th Grade) Math (8th Grade)
Figure 3: (a) Inverse CDF for Test Scores (Reading and Writing) National Assessment ofEducational Progress, 2011. (b) Inverse CDF for Test Scores (Math and Science) NationalAssessment of Educational Progress, 2011.
Do Boys and Girls Use Computers 15
Brought to you by | University of California - Santa CruzAuthenticated
Download Date | 10/15/15 10:33 PM

The evidence clearly indicates that boys are doing worse in school than girls.Schoolchildren from disadvantaged families are no exception, with minority andlow-income boys having lower grades in all subjects and test scores in somesubjects than girls. Although some of these differences in academic performancehave received attention recently, we know relatively little about differences incomputer access, use, and a broader set of after-school time investments madeby boys and girls.
4 Girl–Boy Differences in Computer Accessand Use
Microdata from the computer supplement to the 2011 CPS is first used to explorewhether girls and boys have similar levels of access to computers at home.Table 3 reports home computer access rates for girls and boys. Overall, boys andgirls have identical rates of access to computers at home. The lack of differencesby gender is not simply due to boys and girls living in the same households.Even in households with only boys or only girls access rates are identical.
200.0
210.0
220.0
230.0
240.0
250.0
260.0
270.0
280.0
(b)
Boys
Girls
0 0.5 1
230
250
270
290
310
330
Boys
Girls
0% 50% 100%
100.0
120.0
140.0
160.0
180.0
200.0
0 0.5 1
Science (8th Grade)
Boys
Girls
Figure 3: (continued)
16 R. W. Fairlie
Brought to you by | University of California - Santa CruzAuthenticated
Download Date | 10/15/15 10:33 PM

Among low-income families and disadvantaged minorities, boys and girls alsohave similar access rates to home computers. This finding of lack of girl/boydifferences in computer access differs substantially from the large differencesfound by race or income (see Hoffman and Novak 1998; Mossberger, Tolbert,and Stansbury 2003; Ono and Zavodny 2003; Fairlie 2004; Goldfarb and Prince2008 for example). Ruling out gender differences in access to home computers isimportant because it focuses the analysis on differential use of computersbetween boys and girls, which is examined next.
Data from three national sources are used to examine whether disadvan-taged boys and girls use computers differently. I use microdata from the 2003CPS Computer and Internet Use Supplement, microdata from surveys of teen-agers conducted as part of the Pew Internet and American Life Project, and atime use diary study of the use of technology by children conducted by theKaiser Family Foundation. Table 4 reports gender differences in use. Focusingon how boys and girls use computers reveals some interesting differences. I findconsistent evidence of four main patterns across the datasets. First, I find thatgirls are more likely than boys to use computers for schoolwork (although thesedifferences are not large). Second, boys spend more time playing video games
Table 3: Access to personal computers at home by boys and girls.
Percent with access to a home computer
Girls Boys Girl–BoyDifference
Total
Girl only household
Boy only household
Girl and boy household
Ages –
Ages –
Ages –
Family income<$,
Family income $,–, −
Family income $,–, −
Family income $,–,
Family income $, or more
White, non-Hispanic
Hispanic −
Black
Asian −
Source: Current Population Survey, Computer and Internet Supplement 2011 Microdata.
Do Boys and Girls Use Computers 17
Brought to you by | University of California - Santa CruzAuthenticated
Download Date | 10/15/15 10:33 PM

on computers than do girls. Third, I find some evidence that girls use computersmore for social networking, email, and other communication activities. Finally,these patterns are similar for low-income and high-income children.
These results provide some evidence that boys and girls use computersdifferently, but it is not clear whether these differences lead to differential effectsof home computers on crowding out homework and educational outcomes, andthus contribute to the gender achievement gap. Unfortunately, this question is
Table 4: Computer use by gender and family income.
Girls Boys Girl–Boy Difference
Current Population Survey
Percent of Internet users using for playing games % % –%Low-income children % % –%High-income children % % –%Percent of Internet users using for email and messaging % % %Low-income children % % %High-income children % % %Percent of Internet users using for school assignments % % %Low-income children % % %High-income children % % %Percent using Internet anywhere % % %Low-income children % % %High-income children % % %
Pew Internet Study (–)Percent playing video games daily % % –%Low-income children % % –%High-income children % % –%Percent sending email on a daily basis % % %Low-income children % % %High-income children % % %Percent using Internet ever for school research % % %Low-income children % % %High-income children % % %
Kaiser Foundation Time Use Diary
Minutes of computer use for playing games –Minutes of computer use for videos and other entertainment –Minutes of computer use for social networking
Minutes of computer use for email and instant messaging
Minutes of computer use for other activities –Minutes of computer use for schoolwork
Total minutes per day of computer use –
Sources: Kaiser Family Foundation (2010); Microdata from the Pew Internet Projects (2008a,2008b); Current Population Survey, Computer and Internet Supplement 2003 microdata.
18 R. W. Fairlie
Brought to you by | University of California - Santa CruzAuthenticated
Download Date | 10/15/15 10:33 PM

not an easy one to answer empirically. One possibility is to conduct an experi-ment in which computers are randomly taken away from schoolchildren whoalready own them and examine their subsequent academic performance.Another approach, which is much more feasible, is to conduct a random experi-ment providing computers to schoolchildren who do not already own them andexamine their subsequent academic performance.9 I take this approach next.
5 Girl–Boy Differences in Impacts ofComputers on Crowding Out Homeworkand Educational Outcomes
In this section, I examine whether computers crowd out homework time and effortdifferently for boys and girls, and whether computers have differential impacts onthe educational outcomes of boys and girls. Recent research focusing on all childrenfinds mixed results on the impacts of home computers on educational outcomes,but none of these studies focus on differential impacts by gender and their implica-tions for the gender gap in academic achievement.10 To examine whether homecomputers have differential educational impacts for boys and girls using the experi-mental data, I can simply calculate treatment-control differences in mean values ofeach measure for the boy and girl samples separately. To improve precision andconfirm the robustness of the results to randomization, however, I estimate severalregressions for homework time and educational outcomes. The regression equationis straightforward in the context of the random experiment:
Yi ¼ αþ βGTiGi þ βBTiBi þ θGi þ δXi þ εi; ½1�where Yi is the outcome for student i (e.g. grade), Ti is an indicator variable for beingin the treatment group, Gi is an indicator for girls, Bi is an indicator for boys, Xi
includes the baseline characteristics such as demographic and family characteris-tics reported in Appendix Table 8, and εi is an error term. The separate effects of
9 The alternative approaches also have different implications for external validity. An experi-ment taking the former approach focuses on a more advantaged group, whereas as an experi-ment taking the latter approach focuses on a less advantaged group. The two groups may usecomputers differently.10 See Schmitt and Wadsworth (2006); Fairlie (2005); Fuchs and Woessmann (2004); Fiorini(2010); Beltran, Das, and Fairlie (2010); Malamud and Pop-Eleches (2011); Beuermann et al.(2012); Fairlie and Robinson (2013); Vigdor, Ladd, and Martinez (2014); Falck, Mang, andWoessmann 2015 for example, and see Bulman and Fairlie (2015) for a recent review of theliterature.
Do Boys and Girls Use Computers 19
Brought to you by | University of California - Santa CruzAuthenticated
Download Date | 10/15/15 10:33 PM

becoming eligible for a free computer or the “intent-to-treat” estimate of the give-away program are captured by βG for girls and βB for boys, respectively. Thedifferential impact of home computers on educational outcomes between girlsand boys is equal to βG–βB. All specifications are estimated using OLS and robuststandard errors are reported with adjustments for multiple observations per student(i.e. clustered by student) when needed for grades.11 The standard error for βG–βB isestimated from the re-specified regression:
Yi ¼ αþ βBTi þ βG�βB� �
TiGi þ θGi þ δXi þ εi: ½2�Marginal effects estimates are similar from probit and logit models and are thusnot reported.
I first examine whether obtaining a computer crowds out homework time andeffort for boys relative to girls using information collected from our follow-upsurvey. Table 5 reports estimates of home computer effects on self-reported mea-sures of time spent doing homework, turning assignments in on time, and howmuch time is spent on the last essay or report. I report estimates of treatment effectsseparately for boys and girls and the difference between the two (which is estimatedin a separate regression to obtain the standard error). Home computers do notcrowd out homework time for boys relative to girls. The point estimate on the girl–boy treatment is actually negative, although small and statistically insignificant.Obtaining a personal computer also has no negative effect on whether boys reportturning in homework on time relative to girls. Finally, the computers did not appearto result in boys spending less time working on essays than girls.
Overall, there is no evidence indicating that computers crowd out homeworktime and effort for boys relative to girls. Another interesting finding is that inabsolute terms I also do not find evidence that computers crowd out homeworktime and effort among boys (or girls).
Turning to educational outcomes, I examine whether home computers havea negative effect on grades, test scores, total courses completed and tardiesobtained from administrative data from each of the schools. Table 6 reportsestimates of the separate effects of home computers on grades for boys and girlsand the difference between the two.12 Panel A reports estimates of treatment
11 For all regressions for each educational outcome, I include controls for the sampling strata(school*year) in addition to the controls listed in Appendix Table 8. To avoid droppingobservations, for each control variable, I create a dummy equal to 1 if the variable is missingfor a student and code the original variable as a 0 (so that the coefficients are identified fromthose with non-missing values). Estimates are similar when I instead exclude these observations(there are only a few missing values).12 I focus on grades first because of their importance in determining high school graduationand college admissions (Betts and Morrell 1999).
20 R. W. Fairlie
Brought to you by | University of California - Santa CruzAuthenticated
Download Date | 10/15/15 10:33 PM

effects on overall grades and grades in academic subjects (i.e. math, English,social studies, science) for boys and girls and the difference between the two.For the grade regressions, I pool the quarter 3 and 4 grades together. I findsimilar results when I estimate separate regressions for quarter 3 and quarter 4.I also include controls for quarter 1 grades, the subject and quarter in theregressions. Grades are coded as A-4, B-3, C-2, D-1, F-0. þ /– modifiers are setequal to 0.33 points. In all cases, I find no evidence of a positive or negativeeffect of computers on grades for boys or girls.13 Similarly, home computers donot have a differential effect on grades for boys and girls.
Table 5: Experimental estimates of computer crowd-out impacts on homework time and effort.
() () () () ()
How many hours perweek do you spend
on homework?
How often do you turnin homework on time?
How much timedid you spend on
last essay?Always Usually Sometimes
Girl treatment –. –. –. . –.(.) (.) (.) (.) (.)
Boy treatment . –. . . .(.) (.) (.) (.) (.)
Girl–boytreatment diff.
–. . –. . –.(.) (.) (.) (.) (.)
Observations
Girl control mean . . . . .Boy control mean . . . . .
Notes: Data is from follow-up survey completed by students at end of school year. Regressionsinclude controls for sampling strata (school*year) and variables listed in AppendixTable 1. ***, **, * indicates significance at 1, 5 and 10%
13 LATE (or IV) estimates would be about twice as large (since the difference in computer usageis 55 percentage points). I do not report these estimates, however, because I cannot technicallyscale up the coefficients with the IV estimator because of differential timing of purchasingcomputers over the school year by the control group (two thirds of the control group with ahome computer at follow-up obtained this computer after the fall). The finding that 80–82% ofthe treatment group reports having a computer at the end of the school year also createsdifficulty in scaling up the ITT estimates because I know that essentially all treatment studentspicked up their computers and that many of the treatment group reporting not having acomputer at follow-up indeed had a computer at home (based on subsequent conversationswith the students by principals). For these reasons I focus on the ITT estimates.
Do Boys and Girls Use Computers 21
Brought to you by | University of California - Santa CruzAuthenticated
Download Date | 10/15/15 10:33 PM

Table6:Expe
rimen
talestimates
ofho
mecompu
terim
pactson
grad
es.
()
()
()
()
()
()
()
()
Grade
sIndicatorforpa
ssingclas
sIndicatorforBor
Highe
rGrade
IndicatorforAor
Highe
rGrade
All
subjects
Acade
mic
Sub
jects
All
subjects
Acad
emic
Sub
jects
All
subjects
Acade
mic
Sub
jects
All
subjects
Acade
mic
Sub
jects
Pane
lA.Clas
sGrade
sGirltrea
tmen
t.
.
.
.
–.
.
–.
.
(.)
(.)
(.)
(.)
(.)
(.)
(.)
(.)
Boy
trea
tmen
t–
.
.
–.
–.
–.
.
.
.
(.)
(.)
(.)
(.)
(.)
(.)
(.)
(.)
Girl–bo
ytrea
tmen
tdiff.
.
.
.
.
.
–.
–.
–.
(.)
(.)
(.)
(.)
(.)
(. )
(.)
(.)
Obs
ervation
s,
,
,
,
,
,
,
,
Num
berof
stud
ents
,
,
,
,
,
,
,
,
Girlcontrolmea
n.
.
.
.
.
.
.
.
Boy
controlmea
n.
.
.
.
.
.
.
.
22 R. W. Fairlie
Brought to you by | University of California - Santa CruzAuthenticated
Download Date | 10/15/15 10:33 PM

Grade
Indicatorforpa
ssingclas
s
Math
English/
Rea
ding
Social
Studies
Scien
ceMath
English/
Rea
ding
Social
Studies
Scien
ce
Pane
lB.Clas
sGrade
sby
Sub
ject
Girltrea
tmen
t.
–.
.
.
.
–.
.
.
(.)
(.)
(.)
(.)
(.)
(.)
(.)**
(.)
Boy
trea
tmen
t.
–.
.
.
.
–.
–.
–.
(.)
(.)
( .)
(.)
(.)
(.)
(.)
(.)
Girl–bo
ytrea
tmen
tdiff.
.
.
.
.
.
.
.
.
(.)
(.)
(.)
(.)
(.)
(.)
(.)
(.)
Obs
ervation
s,
,
,
,
,
,
,
,
Num
berof
stud
ents
Girlcontrolmea
n.
.
.
.
.
.
.
.
Boy
controlmea
n.
.
.
.
.
.
.
.
Notes:Re
gression
sinclud
econtrols
forsamplingstrata
(sch
ool*year),variab
leslis
tedin
App
endixTable8,an
dprevious
grad
es.***,
**,*
indicates
sign
ificanc
eat
1,5an
d10%.
Do Boys and Girls Use Computers 23
Brought to you by | University of California - Santa CruzAuthenticated
Download Date | 10/15/15 10:33 PM

In Columns 3–4, I supplement the overall grade estimate by focusing on theeffects of home computers on the pass/fail part of the grade distribution. In all ofthe schools, a grade of D- or higher is considering passing and provides credittowards moving to the next grade level and graduation. Again, I find noevidence of a differential effect of home computers between boys and girls.Expanding the distribution even further, I focus on the effects of home compu-ters on the probability of obtaining a grade of B or higher (columns 5–6) and agrade of A or higher (columns 7–8). In both cases, I find no evidence of adifferential effect of home computers for boys and girls. Estimates from quantileregressions for the full post-treatment achievement distribution confirm thesefindings (not reported). I do not find evidence of a clear pattern of differentialtreatment effects across the distribution.
I also examine whether treatment effects differ by subject. The finding foroverall grades holds when examining courses separately by subject. Girls per-form better in all subjects than boys, but home computers have no differentialeffect, either negative or positive, on grades for any subject. The lack of anegative relative effect for boys suggests that home computers are not contribut-ing to why boys have lower grades in all subjects than girls. The finding holdsfor both average grades and along the pass/fail margin.
Related to this issue, I examine whether there are differential treatmenteffects across the pre-treatment grade distribution. There might be negativerelative treatment effects for boys for some parts of the distribution that cannotbe identified focusing on the average treatment effect. I estimate the followingregression:
Yi ¼ βpc� Dip
� Ci þ βpt� Dip
� Ti þ δXi þ εi ½3�
In the regression, Dip is an indicator for whether individual i is in the pthpercentile of the pre-treatment GPA distribution. Percentiles are calculatedwithin each school and are restricted to 20 different percentile categories. Ci
is an indicator for the control group, and Ti is an indicator for the treatmentgroup. Thus, βpc and βpt are estimates of the relationship between pre- andpost-treatment performance in the control and treatment groups, respectively,and the difference, βpt � βpc provides an estimate of the treatment effect at thepth percentile. Xi is a minimal set of controls, including only subject andquarter indicators (so that the coefficients represent the unconditional rela-tionship between pre- and post-performance for the treatment and controlgroups). βpc and βpt are reported in Figure 4a for girls and Figure 4b forboys. Standard errors are clustered at the individual level, and the 95%
24 R. W. Fairlie
Brought to you by | University of California - Santa CruzAuthenticated
Download Date | 10/15/15 10:33 PM

Panel B. Boys
Panel A. Girls0
.51
1.5
22.
53
3.5
4
Pos
t-tr
eatm
ent g
rade
.05 .15 .25 .35 .45 .55 .65 .75 .85 .95Percentile in pre-treatment grade distribution
TreatmentControl95% CI of difference
Post-Treatment Grades by Pre-Treatment GPA Percentile
0.5
11.
52
2.5
33.
54
Pos
t-tr
eatm
ent g
rade
.05 .15 .25 .35 .45 .55 .65 .75 .85 .95Percentile in pre-treatment grade distribution
TreatmentControl95% CI of difference
Post-Treatment Grades by Pre-Treatment GPA Percentile
Figure 4: Post‐treatment grades by pre‐treatment GPA percentile.Notes: The graph shows estimated coefficients from a regression of post‐treatment (quarters 3and 4) grades on interactions between treatment and pre‐treatment GPA percentile (in quarter 1,before the computers were given out). The vertical line is a 95% confidence interval for thedifference between the treatment and control groups, at each percentile. See text for more details.
Do Boys and Girls Use Computers 25
Brought to you by | University of California - Santa CruzAuthenticated
Download Date | 10/15/15 10:33 PM
confidence interval of the difference between the treatment and control groupsis plotted.
The estimates displayed in the figures indicate that treatment effects areindistinguishable from zero at almost all points of the pre-treatment gradedistribution for both girls and boys. Thus, I do not find evidence of differentialeffects of home computers for boys and girls across the distribution.
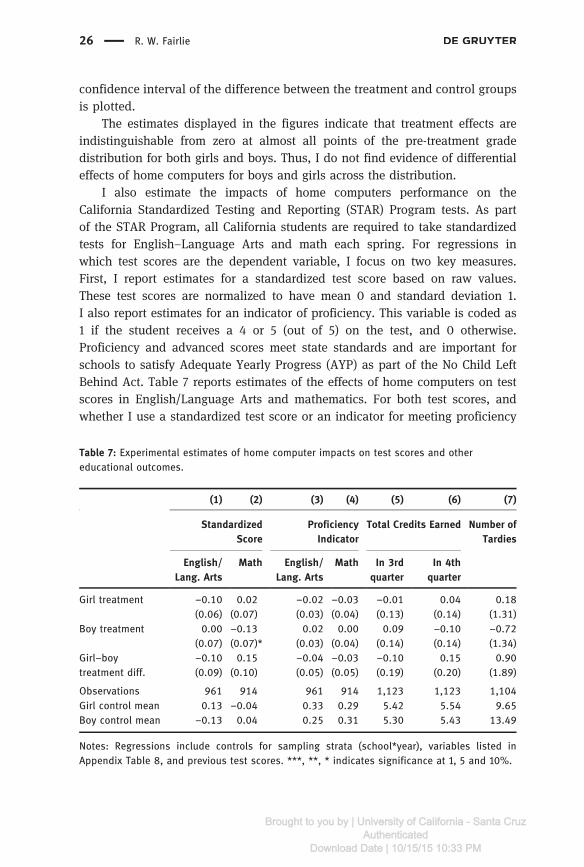
I also estimate the impacts of home computers performance on theCalifornia Standardized Testing and Reporting (STAR) Program tests. As partof the STAR Program, all California students are required to take standardizedtests for English−Language Arts and math each spring. For regressions inwhich test scores are the dependent variable, I focus on two key measures.First, I report estimates for a standardized test score based on raw values.These test scores are normalized to have mean 0 and standard deviation 1.I also report estimates for an indicator of proficiency. This variable is coded as1 if the student receives a 4 or 5 (out of 5) on the test, and 0 otherwise.Proficiency and advanced scores meet state standards and are important forschools to satisfy Adequate Yearly Progress (AYP) as part of the No Child LeftBehind Act. Table 7 reports estimates of the effects of home computers on testscores in English/Language Arts and mathematics. For both test scores, andwhether I use a standardized test score or an indicator for meeting proficiency
Table 7: Experimental estimates of home computer impacts on test scores and othereducational outcomes.
() () () () () () ()
StandardizedScore
ProficiencyIndicator
Total Credits Earned Number ofTardies
English/Lang. Arts
Math English/Lang. Arts
Math In rdquarter
In thquarter
Girl treatment –. . –. –. –. . .(.) (.) (.) (.) (.) (.) (.)
Boy treatment . –. . . . –. –.(.) (.)* (.) (.) (.) (.) (.)
Girl–boytreatment diff.
–. . –. –. –. . .(.) (.) (.) (.) (.) (.) (.)
Observations , , ,Girl control mean . –. . . . . .Boy control mean –. . . . . . .
Notes: Regressions include controls for sampling strata (school*year), variables listed inAppendix Table 8, and previous test scores. ***, **, * indicates significance at 1, 5 and 10%.
26 R. W. Fairlie
Brought to you by | University of California - Santa CruzAuthenticated
Download Date | 10/15/15 10:33 PM

Panel B. Boys
Panel A. Girls0
.51
1.5
22.
53
3.5
44.
55
End
line
ST
AR
sco
re
.05 .15 .25 .35 .45 .55 .65 .75 .85 .95Percentile in pre-treatment STAR score distribution
TreatmentControl95% CI of difference
Endline STAR Score by Pre-Treatment STAR Score Percentile
0.5
11.
52
2.5
33.
54
4.5
5
End
line
ST
AR
sco
re
.05 .15 .25 .35 .45 .55 .65 .75 .85 .95Percentile in pre-treatment STAR score distribution
95% CI of difference
Endline STAR Score by Pre-Treatment STAR Score Percentile
TreatmentControl
Figure 5: Post‐treatment English/Language Arts STAR scores by pre‐treatment star percentiles.Notes: The graph shows estimated coefficients from a regression of endline STAR scoreson interactions between treatment and pre‐treatment STAR scores. The vertical line is a 95%confidence interval for the difference between the treatment and control groups, ateach percentile. See text for more details.
Do Boys and Girls Use Computers 27
Brought to you by | University of California - Santa CruzAuthenticated
Download Date | 10/15/15 10:33 PM

Panel B. Boys
Panel A. Girls0
.51
1.5
22.
53
3.5
44.
55
End
line
ST
AR
sco
re
.05 .15 .25 .35 .45 .55 .65 .75 .85 .95Percentile in pre-treatment STAR score distribution
TreatmentControl95% CI of difference
Endline STAR Score by Pre-Treatment STAR Score Percentile0
.51
1.5
22.
53
3.5
44.
55
End
line
ST
AR
sco
re
.05 .15 .25 .35 .45 .55 .65 .75 .85 .95Percentile in pre-treatment STAR score distribution
95% CI of difference
Endline STAR Score by Pre-Treatment STAR Score Percentile
TreatmentControl
Figure 6: Post‐treatment math star scores by pre‐treatment star percentiles.Notes: The graph shows estimated coefficients from a regression of endline STAR scoreson interactions between treatment and pre‐treatment STAR scores. The vertical line is a 95%confidence interval for the difference between the treatment and control groups, ateach percentile. See text for more details.
28 R. W. Fairlie
Brought to you by | University of California - Santa CruzAuthenticated
Download Date | 10/15/15 10:33 PM

levels, I do not find evidence that home computers have a differential effect forboys and girls.
In addition to not finding a differential effect between girls and boys at theproficiency level, I also do not find effects throughout the distribution. Plots ofinverse CDFs for both boys and girls reveal substantial overlap between thetreatment and control groups for both test scores.14 The lack of treatment effectsacross the distribution implies that there are no differential effects between boysand girls. Similarly, Figures 5 and 6 examine the effects of home computers onSTAR scores by prior achievement levels. Again, there is no discernible effect atalmost any point in the pre-treatment STAR distribution. The finding holds forboth English/Language Arts and math test scores. These figures suggest minimaleffects of computers across the pre-treatment ability distribution and rule out thepossibility that the null estimates of average treatment effects are due to off-setting positive and negative treatment effects at different parts of the pre-treatment achievement distribution. Most importantly, the lack of treatmenteffects for both boys and girls implies no differential effects throughout thedistribution.
I also examine the effects of home computers on total courses completedand number of tardies. Estimates are reported in Columns 5–7 of Table 7. I findno evidence of a differential effect of home computers on total courses com-pleted in the third and fourth quarters of the academic year. Estimates from theexperiment also do not indicate that differential effects of home computersexplain boy–girl differences in being tardy for school.
For all of the educational outcomes examined, there is no evidence of anegative relative effect for boys suggesting that home computers and their usecannot explain why boys generally do worse in school than girls.
6 Conclusions
The results from this study provide the first evidence in the literature on whetherdisadvantaged boys and girls use computers differently, whether home compu-ters crowd out homework time differently for boys and girls, and whether homecomputers have differential effects on educational outcomes among boys andgirls. Although estimates from the CPS indicate that girls and boys have similarrates of access to home computers, evidence from several sources of data
14 I examined inverse CDFs because the STAR scores are lumped into only 5 bins and thus Icannot estimate QTEs.
Do Boys and Girls Use Computers 29
Brought to you by | University of California - Santa CruzAuthenticated
Download Date | 10/15/15 10:33 PM

indicates that boys use computers differently than girls. Boys use computers lessfor schoolwork and more for playing games, but less for communication such asthrough social networking, email, and instant messaging, than girls. Using datafrom a large field experiment that randomly provides free personal computers toschoolchildren for home use, I test the hypothesis that these gender differencesin computer use partly explain why boys generally do worse than girls in school.I do not find evidence that computers crowd out homework time and effort morefor boys than for girls. Examining impacts on grades, test scores, and additionaleducational outcomes, the evidence does not indicate negative effects of homecomputers for boys relative to girls. I do not find differential effects at notablepoints in the distribution such as pass rates and meeting proficiency standards,or throughout the distribution of post-treatment outcomes.
Disadvantaged boys and girls differ in how they use computers, but thesedifferences do not appear to lead to different levels of crowding out ofhomework and study time, and do not ultimately lead to different grades,test scores and other educational outcomes. Thus, gender differences in timeinvestments in how personal computers are used at home do not appear tocontribute to the achievement gap between disadvantaged boys and girls.This finding has implications for the general view that girls are more “self-disciplined” than are boys. Both girls and boys are found here to usecomputers for non-educational activities, but for both boys and girls theseactivities do not appear to crowd out homework time and negatively affectperformance in school.
For the broader picture of the girl–boy achievement gap, identifying, orruling out, potential explanations for why boys are doing worse in schoolthan girls is extremely important. Some policy recommendations includeincreasing the number of male teachers at young grades, all-boy classrooms,more hands-on activities, and more frequent or longer recesses. Recent trendsin educational outcomes do not show relative improvement for boys, anddifferences between boys and girls are quite large. The girl–boy difference ingrades of 0.2 grade points is only slightly smaller than the white-Latinodifference of 0.25 grade points and half the white-black difference of0.4 grade points. The racial achievement gap, however, has attracted con-siderably more attention in the literature and policy arena (e.g. Jencks andPhillips 1998). Further research on the causes of gender differences in educa-tional outcomes especially among disadvantaged and low-income children isclearly needed.
30 R. W. Fairlie
Brought to you by | University of California - Santa CruzAuthenticated
Download Date | 10/15/15 10:33 PM

App
endix
Table8:Individu
al-level
summarystatistics
andba
lanc
ech
eck.
Total
Girls
Boy
s
Control
Trea
tmen
tEq
ualityof
mea
nsp-value
Control
Trea
tmen
tEq
ualityof
mea
nsp-value
Control
Trea
tmen
tEq
ualityof
mea
nsp-value
Age
.
.
.
.
.
.
.
.
.
(.)
(.)
(.)
(.)
(.)
(.)
Female
.
.
.
(.)
(.)
Ethn
icity¼
African
American
.
.
.
.
.
.
.
.
.
(.)
(.)
(.)
(.)
(.)
(.)
Ethn
icity¼
Latino
.
.
.
.
.
.
.
.
.
(.)
(.)
(.)
(.)
(.)
(.)
Ethn
icity¼
Asian
.
.
.
.
.
.
.
.
.
(.)
(.)
( .)
(.)
(.)
(.)
Ethn
icity¼
White
.
.
.
.
.
.
.
.
.
(.)
(.)
(.)
(.)
(.)
(.)
Immigrant
.
.
.
.
.
.
.
.
.
(.)
(.)
(.)
(.)
(.)
(.)
Prim
arylang
uage
isEn
glish
.
.
.
.
.
.
.
.
.
(.)
(.)
(.)
(.)
(.)
(.)
Parent’s
education
.
.
.
.
.
.
.
.
.
(.)
(.)
(.)
(.)
(.)
(.)
Num
berof
peop
lelivingin
hous
ehold
.
.
.
.
.
.
.
.
.
(.)
(.)
(.)
(.)
(.)
(.)
(con
tinu
ed)
Do Boys and Girls Use Computers 31
Brought to you by | University of California - Santa CruzAuthenticated
Download Date | 10/15/15 10:33 PM

Table8:(con
tinu
ed)
Total
Girls
Boy
s
Control
Trea
tmen
tEq
ualityof
mea
nsp-value
Control
Trea
tmen
tEq
ualityof
mea
nsp-value
Control
Trea
tmen
tEq
ualityof
mea
nsp-value
Liveswithmothe
r.
.
.
.
.
.
.
.
.**
(.)
(.)
(.)
(.)
(.)
(.)
Liveswithfather
.
.
.
.
.
.
.
.
.
(.)
(.)
(.)
(.)
(.)
(.)
Doe
syo
urmothe
rha
vejob?
.
.
.
.
.
.
.
.
.
(.)
(.)
(.)
(.)
(.)
(.)
Doe
syo
urfather
have
ajob?
.
.
.
.
.
.
.
.
.
(.)
(.)
(.)
(.)
(.)
(.)
Fullsamplesize
Notes:In
Colum
ns1,
2,4,
5,7an
d8,mea
nsrepo
rted
withstan
dard
errors
arein
parenthe
ses.
Colum
ns3,
6,an
d9repo
rtthep-valueforthet-test
fortheeq
ualityof
mea
ns.***,
**,*indicatessign
ifican
ceat
1,5,
and10%.
1 Omittedethn
icitycatego
ryis
“not
repo
rted
.”2Th
isis
thehigh
ested
ucationlevelof
either
parent
(which
isthemea
sure
mos
tscho
olsin
oursamplecolle
cted
).3Th
evariab
lesformothe
r’san
dfather’s
jobarerepo
rted
only
forho
useh
olds
inwhich
thegivenpa
rent
lives
intheho
useh
old.
32 R. W. Fairlie
Brought to you by | University of California - Santa CruzAuthenticated
Download Date | 10/15/15 10:33 PM

Table 9: First-stage effects on reported hours of computer use by location and type of activity.
() () () () ()
Hours of Computer Use Per Week
Schoolwork Email Games,Videos,
Music, Ent.
SocialNetworking
Other
Panel A. TotalGirl control group . . . . .Girl treatment group . . . . .Treatment-control . . . . .
(.)** (.)* (.)** (.)** –.Boy control group . . . . .Boy treatment group . . . . .Treatment-control . . . . .
(.)** (.)*** (.)*** (.)* –.Girl–Boy Treatment-
Control–. –. –. . .(.) (.) (.) (.) (.)
Observations
Panel B. At HomeGirl control group . . . . .Girl treatment group . . . . .Treatment-control . . . . .
(.)*** (.)*** (.)*** (.)*** (.)***Boy control group . . . . .Boy treatment group . . . . .Treatment-control . . . . .
(.)*** (.)*** (.)*** (.)*** (.)***Girl–Boy Treatment-
Control. –. –. –. –.
(.) (.) (.) (.) (.)Observations
Panel C. At SchoolGirl control group . . . . .Girl treatment group . . . . .Treatment-control –. –. –. –. –.
–. –. –. –. –.Boy control group . . . . .Boy treatment group . . . . .Treatment-control . –. . –. –.
–. –. –. (.)* (.)**Girl–Boy Treatment-
Control–. . –. . .(.) (.) (.) (.) (.)
Observations
(continued )
Do Boys and Girls Use Computers 33
Brought to you by | University of California - Santa CruzAuthenticated
Download Date | 10/15/15 10:33 PM
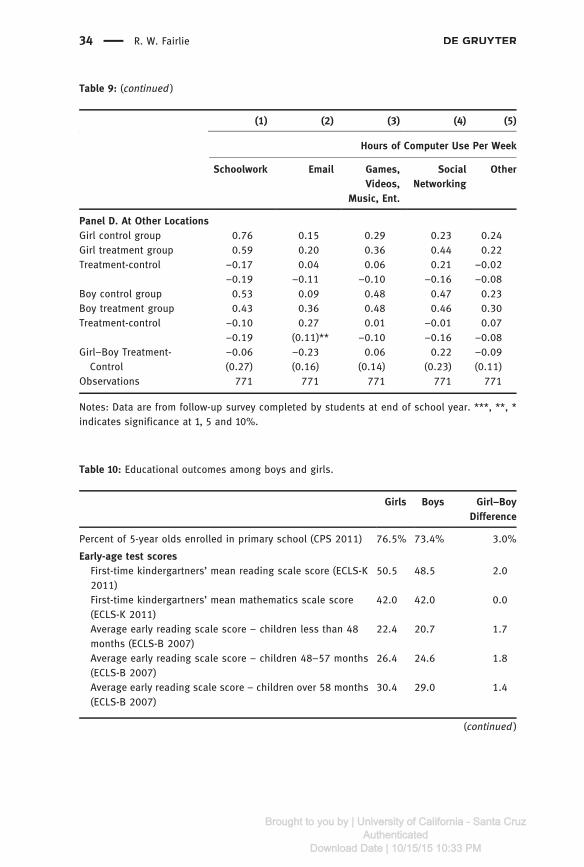
Table 10: Educational outcomes among boys and girls.
Girls Boys Girl–BoyDifference
Percent of -year olds enrolled in primary school (CPS ) .% .% .%
Early-age test scoresFirst-time kindergartners’ mean reading scale score (ECLS-K)
. . .
First-time kindergartners’ mean mathematics scale score(ECLS-K )
. . .
Average early reading scale score – children less than
months (ECLS-B ). . .
Average early reading scale score – children – months(ECLS-B )
. . .
Average early reading scale score – children over months(ECLS-B )
. . .
(continued )
Table 9: (continued )
() () () () ()
Hours of Computer Use Per Week
Schoolwork Email Games,Videos,
Music, Ent.
SocialNetworking
Other
Panel D. At Other LocationsGirl control group . . . . .Girl treatment group . . . . .Treatment-control –. . . . –.
–. –. –. –. –.Boy control group . . . . .Boy treatment group . . . . .Treatment-control –. . . –. .
–. (.)** –. –. –.Girl–Boy Treatment-
Control–. –. . . –.(.) (.) (.) (.) (.)
Observations
Notes: Data are from follow-up survey completed by students at end of school year. ***, **, *indicates significance at 1, 5 and 10%.
34 R. W. Fairlie
Brought to you by | University of California - Santa CruzAuthenticated
Download Date | 10/15/15 10:33 PM

Acknowledgments: I would like to thank Computers for Classrooms, Inc., theZeroDivide Foundation, and the NET Institute for generous funding for theproject. I would also like to thank seminar participants at Stanford University,University of Toronto, Santa Clara University, Wellesley College, the Chicano
Table 10: (continued )
Girls Boys Girl–BoyDifference
Grade retention: th grade students ever retained (K-)(HSLS )
.% .% –.%
Learning difficultiesDiagnosed with a learning disability (NHIS ) .% .% –.%Diagnosed with Attention Deficit Hyperactivity Disorder(NHIS )
.% .% –.%
Percentage of gifted and talented students (CRDC ) .% .% .%
Truancy and disciplinaryStudents aged – who skipped any classes in previous weeks (SCS )
.% .% –.%
Public school students in th–th grade who had ever beensuspended (SCS )
.% .% –.%
Public school students in th–th grade who had ever beenexpelled (SCS )
.% .% –.%
Advanced placement and activitiesAdvanced placement examination participation (CBNSR–)
.% .% .%
Average credits earned – advanced placement courses,grade (CBNSR –)
. . .
High school seniors who participated in student council/government (MTF )
.% .% .%
Average freshman graduation rate (CCD –) .% .% .%
Percent of population aged – without a high schooldegree (CPS )
.% .% .%
Sources: National Center for Education Statistics, Early Childhood Longitudinal Study,Kindergarten Class of 2010–11 (ECLS-K:2011); National Center for Health Statistics, NationalHealth Interview Survey (NHIS 2008); Current Population Survey (CPS 2012); National Center forEducation Statistics, Common Core of Data (CCD 2008–09); National Center for EducationStatistics, Early Childhood Longitudinal Study, Birth Cohort (ECLS–B 2007); U.S. Departmentof Education, Office for Civil Rights, Civil Rights Data Collection (CRDC 2006); University ofMichigan, Institute for Social Research, Monitoring the Future (MTF 2009); The College Board,AP Program National Summary Reports (CBNSR 2009–10); U.S. Department of Justice, Bureau ofJustice Statistics, School Crime Supplement (SCS) to the National Crime Victimization Survey(NCVS) (SCS 2007).
Do Boys and Girls Use Computers 35
Brought to you by | University of California - Santa CruzAuthenticated
Download Date | 10/15/15 10:33 PM

Latino Research Center at UC Santa Cruz, and Claremont McKenna College forcomments and suggestions. I would also like to thank Jennifer Bevers, BruceBesnard John Bohannon, Linda Coleman, Reg Govan, Rebecka Hagerty,Kathleen Hannah-Chambas, Brian Gault, David Jansen, Cynthia Kampf, GinaLanphier, Linda Leonard, Kurt Madden, Lee McPeak, Stephen Morris, JoanneParsley, Richard Pascual, Jeanette Sanchez, Zenae Scott, Tom Sharp, and manyothers for administering the program in schools. Shilpa Aggarwal, JulianCaballero, David Castaneda, James Chiu, Samantha Grunberg, Brandon Heck,Keith Henwood, Cody Kennedy, Nicole Mendoza, Nick Parker, MirandaSchirmer, Eva Shapiro, Glen Wolf and Heidi Wu are also thanked for researchassistance. Finally, special thanks go to Pat Furr for donating many computersfor the study and distributing computers to schools.
References
Anderson, M. 2008. “Multiple Inference and Gender Differences in the Effects of EarlyIntervention: A Reevaluation of the Abecedarian, Perry Preschool, and Early TrainingProjects.” Journal of the American Statistical Association 103 (484):1481–95.
Antecol, H., O. Eren, and S. Ozbeklik. 2013. “The Effect of Teach for America on the Distributionof Student Achievement in Primary School: Evidence From a Randomized Experiment.”Economics of Education Review 37:113–25.
Beltran, D. O., K. K. Das, and R. W. Fairlie. 2010. “Home Computers and Educational Outcomes:Evidence From the NLSY97 and CPS.” Economic Inquiry 48 (3):771–92.
Betts, J., and D. Morell. 1999. “The Determinants of Undergraduate Grade Point Average: TheRelative Importance of Family Background, High School Resources, and Peer GroupEffects.” Journal of Human Resources 34 (2):268–93.
Beuermann, D. W., J. P. Cristia, Y. Cruz-Aguayo, S. Cueto, and O. Malamud. 2012. HomeComputers and Child Outcomes: Short-Term Impacts from a Randomized Experiment inPeru Inter-American Development Bank Working Paper No. IDB-WP–382.
Bulman, G., and R. W. Fairlie. 2015. “Technology and Education: Computers, Software, and theInternet.” In Handbook of the Economics of Education, Volume 5, edited by R. Hanushek, S.Machin, and L. Woessmann. North-Holland: Elsevier.
California Department of Education. 2010. 2010 STAR Test Results: California STAR Program,http://star.cde.ca.gov/star2010/
Cornwell, C. M., D. B. Mustard, and J. Van Parys. 2013. “Non-Cognitive Skills and the GenderDisparities in Test Scores and Teacher Assessments: Evidence From Primary School.”Journal of Human Resources 48 (1):236–64.
Dee, T. S. 2007. “Teachers and the Gender Gaps in Student Achievement.” Journal of HumanResources XLII (3):528–54.
Duckworth, A. L., and M. E. P.Seligman. 2006. “Self-Discipline Gives Girls the Edge: Gender inSelf-Discipline, Grades, and Achievement Test Scores.” Journal of Educational Psychology98 (1):198–208.
36 R. W. Fairlie
Brought to you by | University of California - Santa CruzAuthenticated
Download Date | 10/15/15 10:33 PM

Fairlie, R. W. 2004. “Race and the Digital Divide.” Contributions to Economic Analysis & Policy,the Berkeley Electronic Journals 3 (1) Article 15:1–38.
Fairlie, R. W. 2005. “The Effects of Home Computers on School Enrollment.” Economics ofEducation Review 24 (5):533–47.
Fairlie, R. W., and J. Robinson. 2013. “Experimental Evidence on the Effects of Home Computerson Academic Achievement Among Schoolchildren.” American Economic Journal: AppliedEconomics 5 (3):211–40.
Falck, O., C. Mang, and L. Woessmann. 2015. Virtually No Effect? Different Types of ComputerUse and the Effect of Classroom Computers on Student Achievement CESifo Working PaperNo. 5266.
Figlio, D., M. Rush, and Lu. Yin. 2013. “Is It Live or Is It Internet? Experimental Estimates of theEffects of Online Instruction on Student Learning.” Journal of Labor Economics 31 (4):763–84.
Fiorini, M. 2010. “The Effect of Home Computer Use on Children’s Cognitive and Non-CognitiveSkills.” Economics of Education Review 29:55–72.
Fuchs, T., and L. Woessmann. 2004. Computers and Student Learning: Bivariate andMultivariate Evidence on the Availability and Use of Computers at Home and at School.CESifo Working Paper No. 1321.
Goldfarb, A., and J. Prince. 2008. “Internet Adoption and Usage Patterns Are Different:Implications for the Digital Divide.” Information Economics and Policy 20 (1):2–15.
Goldin, C., L. Katz, and I. Kuziemko. 2006. “The Homecoming of American College Women: TheReversal of the College Gender Gap.” Journal of Economic Perspectives 20 (4):133–56.
Gordo, B. 2008. Disconnected: A Community and Technology Needs Assessment of theSoutheast Los Angeles Region. Center for Latino Policy Research, UC Berkeley Report.
Hargittai, E. 2007. “Whose Space? Differences Among Users and Non-Users of Social NetworkSites.” Journal of Computer-Mediated Communication 13 (1):276–97.
Hoffman, D. L., and T. P. Novak. 1998. “Bridging the Racial Divide on the Internet.” Science 17(April):390–1.
Jencks, C., and M. Phillips. 1998. The Black-White Test Score Gap. Washington, DC: BrookingsInstitution Press.
Kaiser Family Foundation. 2010. Generation M2: Media in the Lives of 8- to 18-Year Olds. MenloPark, California: Kaiser Family Foundation Study.
Karpinski, A. C. 2009. “A description of Facebook use and academic performance amongundergraduate and graduate students,” paper presented at the Annual Meeting of theAmerican Educational Research Association, San Diego, Calif.
Lazarus, W. 2006. California Competes: Deploying Technology to Help California Youth Competein a 21st-Century World: A Three-Point Digital Opportunity Action Plan, Children’sPartnership Report.
Malamud, O., and C. Pop-Eleches. 2011. “Home Computer Use and the Development of HumanCapital.” Quarterly Journal of Economics 126:987–1027.
Malamud, O., and D. Schanzenbach. 2007. “The Disparity between Boys’ Performance andTeacher Evaluations during Elementary School.” University of Chicago working paper.
Mossberger, K. 2009. “Toward Digital Citizenship: Addressing Inequality in the InformationAge.” In Routledge Handbook of Internet Politics 173–85
Mossberger, K., C. Tolbert, and M. Gilbert. 2006. “Race, Place, and Information Technology.”Urban Affairs Review 41 (5):583–620.
Mossberger, K., C. Tolbert, and M. Stansbury. 2003. Virtual Inequality: Beyond the DigitalDivide. Washington, DC: Georgetown University Press.
Do Boys and Girls Use Computers 37
Brought to you by | University of California - Santa CruzAuthenticated
Download Date | 10/15/15 10:33 PM

National Center for Educational Statistics. 2012. Digest of Educational Statistics 2011.Washington, D.C: U.S. Department of Education, National Center for Educational Statistics.
National Center for Educational Statistics. 2012. Youth Indicators 2011: America’s Youth:Transitions to Adulthood. Washington, DC: U.S. Department of Education, National Centerfor Educational Statistics.
Ono, H., and M. Zavodny. 2003. “Gender and the Internet.” Social Science Quarterly 84 (1):111–21.Ono, H., and M. Zavodny. 2007. “Digital Inequality: A Five Country Comparison Using
Microdata.” Social Science Research 36 (September 2007):1135–55.Pasek, J., and E. Hargittai. 2009. “Facebook and Academic Performance: Reconciling a Media
Sensation with Data.” First Monday 14 (5–4).Pew Internet Project. 2008a. Teens, Video Games, and Civics. Washington, DC: Pew Internet &
American Life Project.Pew Internet Project. 2008b. Writing, Technology and Teens. Washington, DC: Pew Internet &
American Life Project.Puma, M. J., D. D. Chaplin, and A. D. Pape. 2000. E-Rate and the Digital Divide: A Preliminary
Analysis From the Integrated Studies of Educational Technology. Washington, DC: UrbanInstitute.
Schmitt, J., and J. Wadsworth. 2006. “Is There an Impact of Household Computer Ownership onChildren’s Educational Attainment in Britain?” Economics of Education Review 25:659–73.
Servon, L. 2002. Bridging the Digital Divide: Community, Technology and Policy. Malden, MA:Blackwell.
Sundstrom, W. A. 2004. “The College Gender Gap in Comparative Perspective, 1950–2000,”Santa Clara University, Department of Economics Working Paper.
National Telecommunications and Information Administration. 2011. Digital Nation: ExpandingInternet Usage. Washington, DC: U.S. Department of Commerce, NationalTelecommunications and Information Administration.
U.S. Department of Education. 2011. “School Locator,” National Center for EducationalStatistics, http://nces.ed.gov/ccd/schoolsearch/
Universal Services Administration Company. 2013. Annual Report http://www.usac.org/about/tools/publications/annual-reports/default.aspx.
Vigdor, J. L., H. F. Ladd, and E. Martinez. 2014. “Scaling the Digital Divide: Home ComputerTechnology and Student Achievement.” Economic Inquiry 52 (3):1103–19.
Zavodny, M. 2006. “Does Watching Television Rot Your Mind? Estimates of the Effect on TestScores.” Economics of Education Review 25:565–73.
38 R. W. Fairlie
Brought to you by | University of California - Santa CruzAuthenticated
Download Date | 10/15/15 10:33 PM