do better schools lead to more growth? cognitive skills...
TRANSCRIPT

J Econ Growth (2012) 17:267–321DOI 10.1007/s10887-012-9081-x
Do better schools lead to more growth? Cognitive skills,economic outcomes, and causation
Eric A. Hanushek · Ludger Woessmann
Published online: 14 July 2012© Springer Science+Business Media, LLC 2012
Abstract We develop a new metric for the distribution of educational achievement acrosscountries that can further track the cognitive skill distribution within countries and overtime. Cross-country growth regressions generate a close relationship between educationalachievement and GDP growth that is remarkably stable across extensive sensitivity analysesof specification, time period, and country samples. In a series of now-common microecono-metric approaches for addressing causality, we narrow the range of plausible interpretationsof this strong cognitive skills-growth relationship. These alternative estimation approaches,including instrumental variables, difference-in-differences among immigrants on the U.S.labor market, and longitudinal analysis of changes in cognitive skills and in growth rates,leave the stylized fact of a strong impact of cognitive skills unchanged. Moreover, the resultsindicate that school policy can be an important instrument to spur growth. The shares of basicliterates and high performers have independent relationships with growth, the latter beinglarger in poorer countries.
Keywords Cognitive skills · Long run growth · Causation and identification ·School quality · Educational achievement
E. A. Hanushek (B)Hoover Institution, Stanford University, Stanford, CA 94305-6010, USAe-mail: [email protected]: www.hanushek.net
E. A. Hanushek · L. WoessmannCESifo, University of Munich, Munich, Germany
E. A. HanushekNBER, National Bureau of Economic Research (NBER), Cambridge, MA, USA
L. WoessmannIfo Institute for Economic Research, University of Munich, Poschingerstr. 5, 81679 Munich, Germanye-mail: [email protected]: www.cesifo.de/woessmann
123

268 J Econ Growth (2012) 17:267–321
1 Introduction
Schooling and human capital investments have been a central focus of development policy, butdoubts have arisen as disappointments with results grow. Nowhere is this more apparent thanin the case of growth policy, where schooling investments have not appeared to return the eco-nomic outcomes promised by theoretical growth models.1 Prior analyses into the specificationof empirical cross-country growth models lead to a warranted skepticism about the identifica-tion of causal growth effects. Our analysis of newly developed measures of skill differencesbased on international tests of math and science suggests, however, that one of the most sig-nificant problems underlying these prior concerns is the valid measurement of human capitalacross countries. We find that accurately measuring differences in educational achievement,which we refer to simply as cognitive skills, dramatically improves our ability to explain vari-ations in long-run growth across countries. Moreover, while having limitations in macroeco-nomic applications, a set of microeconometric approaches can be employed in the cross-coun-try setting to rule out many of the common concerns that undermine causal interpretations.
As a simple summary observation, world policy attention today focuses on the laggingfortunes of Sub-Saharan Africa and of Latin America. Considerably less attention goes toEast Asia, and, if anything, East Asia is proposed as a role model for the lagging regions.Yet to somebody contemplating development policy in the 1960s, none of this would be soobvious. Latin America had average income exceeding that in Sub-Saharan Africa and theMiddle East and North Africa regions, and both of these exceeded East Asia (see AppendixTable 8).2 Further, Latin America had schooling levels that exceeded those in the others,which were roughly equal. Thus, on the basis of observed human capital investments, onemight have expected Latin America to pull even farther ahead while having no strong priorson the other regions. The unmistakable failure of such expectations, coupled with a similar setof observations for separate countries in the regions, suggests skepticism about using humancapital policies to foster development. But, this skepticism appears to be more an outgrowthof imperfect measurement of human capital investments than an empirical reality.
The measurement issues become apparent when we introduce direct measures of cognitiveskills from international tests of math and science into the growth picture. The entire pic-ture changes. Figure 1 plots regional growth in real per capita GDP between 1960 and 2000against average test scores after conditioning on initial GDP per capita in 1960.3 Regionalannual growth rates, which vary from 1.4 % in Sub-Saharan Africa to 4.5 % in East Asia, fallon a straight line with an R2 = 0.985. But, school attainment, when added to this regression,is unrelated to growth-rate differences. Figure 1 suggests that, conditional on initial incomelevels, regional growth over the last four decades is completely described by differences incognitive skills.
In the upsurge of empirical analyses of why some nations grow faster than others since theseminal contributions by Barro (1991, 1997) and Mankiw et al. (1992), a vast literature ofcross-country growth regressions has tended to find a significant positive association between
1 See, for example, Pritchett (2006).2 Japan was significantly ahead of the rest of the East Asia region, but its exclusion does not change theregional ordering (see Appendix Table 8).3 Regional data come from averaging all countries with available data in a region. The 50 countries are notchosen to be representative but instead represent the universe of countries that participated in internationaltests and had available the requisite economic data. Still, Appendix A shows that the average 1960 incomesfor all countries in each region are quite similar to those for our subset of countries. The division of Europeinto three regions illustrates the heterogeneity within OECD countries, but a combined Europe also falls onthe line in Fig. 1.
123

J Econ Growth (2012) 17:267–321 269
Fig. 1 Cognitive Skills and Growth across World Regions. Notes: Added-variable plot of a regression of theaverage annual rate of growth (in percent) of real GDP per capita in 1960–2000 on the initial level of real GDPper capita in 1960 and average test scores on international student achievement tests. Authors’ calculations.See Table 8 for a list of the countries contained in each world region. Region codes: East Asia and India(ASIA), Central Europe (C-EUR), Commonwealth OECD members (COMM), Latin America (LATAM),Middle East and North Africa (MENA), Northern Europe (N-EUR), Southern Europe (S-EUR), Sub-SaharanAfrica (SSAFR)
quantitative measures of schooling and economic growth.4 But, all analyses using averageyears of schooling as the human capital measure implicitly assume that a year of schoolingdelivers the same increase in knowledge and skills regardless of the education system. Forexample, a year of schooling in Peru is assumed to create the same increase in productivehuman capital as a year of schooling in Japan. Equally as important, this measure assumesthat formal schooling is the primary source of education and that variations in the quality ofnonschool factors have a negligible effect on education outcomes.
In this paper, we concentrate directly on the role of cognitive skills. This approach wasinitiated by Hanushek and Kimko (2000), who related a measure of educational achievementderived from the international student achievement tests through 1991 to economic growthin 1960–1990 in a sample of 31 countries with available data. They found that the associationof economic growth with cognitive skills dwarfs its association with years of schooling andraises the explanatory power of growth models substantially. Their general pattern of resultshas been duplicated by a series of other studies over the past 10 years that pursue differenttests and specifications along with different variations of skills measurement.5
But should we interpret the tight relationship between cognitive skills and growth asreflecting a causal relationship that can support direct policy actions? Questions about theidentification of underlying causal effects in cross-country growth models have existed for along time and go beyond just the impact of human capital. Beginning with Levine and Renelt(1992), plentiful evidence of the general sensitivity to alternative samples and specificationshas convinced many that cross-country empirical models are not fruitful policy investiga-tions. In terms of schooling, Bils and Klenow (2000) provide convincing evidence of the
4 For extensive reviews of the literature, see Topel (1999), Krueger and Lindahl (2001), Pritchett (2006), andHanushek and Woessmann (2008). The robustness of the association is highlighted by the extensive analysisby Sala-i-Martin et al. (2004): Of 67 explanatory variables in growth regressions on a sample of 88 countries,primary schooling turns out to be the most robust influence factor (after an East Asian dummy) on growth inGDP per capita in 1960–1996.5 Detailed discussion of these studies is available in Hanushek and Woessmann (2011a).
123

270 J Econ Growth (2012) 17:267–321
endogeneity of school attainment in growth models. Further, it is unclear to what extent priorattempts to deal with endogeneity, such as the panel data approaches of Barro (1997) andVandenbussche et al. (2006), have been successful in a setting where the dominant infor-mation is found in the cross-country variation.6 Perhaps the strongest evidence on causalityhas been related to the importance of fundamental economic institutions using identificationthrough historical factors (Acemoglu et al. 2001, 2005), but this has not yielded clear adviceabout the kinds of feasible policies that will lead to national payoffs, and it itself has beensubject to question (Glaeser et al. 2004).
When estimating the effect of cognitive skills on growth, the main causality concernsrelate to reverse causality and to omitted country variables such as inherent difference innations’ culture and economic institutions that are correlated both with economic growth andwith cognitive skills or their determinants. We assess these issues from a number of angleswith the objective of narrowing the range of threats to a causal interpretation. Of course,it is virtually impossible to identify causality in a thoroughly convincing manner given thelimited observations underlying cross-country growth models. Each approach we employdeals with one or more common concerns such as the influence of cultural differences, faultymeasurement of cognitive skills, or simple reverse causality. But each relies upon strongmaintained hypotheses that may or may not be completely persuasive.
Our analysis, while building on Hanushek and Kimko (2000), provides new evidence aboutthe potential causal interpretation of the cognitive skills-growth relationship. The develop-ment of a new data series on cognitive skills (Sect. 3), expanded to 64 countries for someanalyses, permits approaches to estimation not previously possible. We are able to improveon the underlying measurement, to increase the country observations to a broader range ofdevelopment experiences, to extend the period of observed long-term growth to 1960–2000(and to 2007 in some specifications), and to add both a longitudinal and a within-countrydistributional dimension to the database. We begin by showing that the relationship betweencognitive skills and economic growth is extraordinarily robust to alternative samples definedby different time periods and sets of countries and to different specifications of the skillsmeasure and of the growth relationship (Sect. 4).
The core of the paper applies a series of approaches to identification of causal parame-ters now common in microeconometric studies to the macroeconomic analysis of growth,although the application to cross-country estimation remains difficult. The important newanalyses include estimation with instrumental variables (Sect. 5) and consideration of in-tertemporal changes in growth rates within countries (Sect. 7). More recent U.S. data alsopermit important refinements to the analysis of cognitive skills on the labor market earningsof immigrants (Sect. 6) previously introduced in Hanushek and Kimko (2000), including thespecification of full difference-in-differences models.
Each of our three approaches deals with a particular class of reverse causation or omittedvariables. By identifying skill variation stemming from institutional school policies in thecountries, the instrumental-variable models highlight the role of schools while addressingissues of simple reverse causality and of inherent cultural difference across nations that mightbe related to attitudes and performance in learning. By focusing on U.S. labor-market out-comes for immigrants, the difference-in-differences approach deals not only with reversecausality but also with the possibility that cultural differences or economic institutions ofnational economies may be correlated with favorable educational outcomes. By using theintertemporal dimension of our new database, our longitudinal analysis of changes in growthrates eliminates stable country-specific factors in a general way in the spirit of country fixed
6 Aghion et al. (2009) approach causality by relying on within-country variation.
123

J Econ Growth (2012) 17:267–321 271
effects. In each of the three investigations, we explicitly describe the assumptions that are keyto interpreting the results. Importantly, the different approaches rely on different assumptions,guard against different threats to identification, and would fail for different reasons.
A related aspect of these separate causal investigations is the pinpointing of a specificpolicy role for improved school quality. While variations in cognitive skills can arise fromvarious influences—families, culture, health, and ability—the instrumental-variable resultsindicate that schools, and in particular institutional structures of school systems, are one wayfor improvement available to policy makers. This conclusion is reinforced by how countryof schooling—U.S. versus home country—is important for identifying individual skills inthe immigrant analysis.
A final issue addressed is that average test scores do not adequately reflect the range ofpolicy options facing a nation. Specifically, one could institute policies chiefly directed to thelower end of the cognitive distribution, such as the Education for All initiative, or one couldaim more at the top end, such as the focused technological colleges of India. In an analysisenabled by the detailed country-specific distributional dimension of our new micro database,we are able to go beyond simple mean difference in scores and provide the first estimates ofhow growth is affected by the distribution of skills within countries and how it might interactwith the nation’s technology (Sect. 8). We find improving both ends of the distribution to bebeneficial and complementary. The importance of the highly skilled is even more importantin developing countries that have scope for imitation than in developed countries that areinnovating.
2 A simple growth model with cognitive skills
We begin with a very simple growth model: a country’s growth rate (g) is a function of theskills of workers (H) and other factors (X) that include initial levels of income and tech-nology, economic institutions, and other systematic factors. Skills are frequently referred tosimply as the workers’ human capital stock. For simplicity in Eq. (1), we assume that H isa one-dimensional index and that growth rates are linear in these inputs, although these arenot important for our purposes.7
g = γ H + β X + ε (1)
It is useful at this stage to understand where the skills (H) might come from. As discussedin the extensive educational production function literature (Hanushek 2002), these skills areaffected by a range of factors including family inputs (F), the quantity and quality of inputsprovided by schools (qS), individual ability (A), and other relevant factors (Z) which includelabor market experience, health, and so forth as in:
H = λF + φ(q S) + ηA + αZ + ν (2)
The schooling term combines school attainment (S) and its quality (q).Human capital is nonetheless a latent variable that is not directly observed. To be useful
and verifiable, it is necessary to specify the measurement of H . The vast majority of existing
7 The form of this relationship has been the subject of considerable debate and controversy. As we write it, itcan be consistent with both basic endogenous growth models such as Lucas (1988), Romer (1990), and Aghionand Howitt (1998) and neoclassical growth models such as Mankiw et al. (1992). We allow for conditionalconvergence in the empirical specifications, and the parameters estimated suggest very long transitional peri-ods from any perturbation off of a balanced growth path. We generally cannot adequately distinguish amongalternative forms of the underlying growth process. While considering the growth implications of variouspolicy changes, we can, however, investigate directly the sensitivity of GDP projections to the alternativemodels (see Hanushek and Woessmann 2011b).
123

272 J Econ Growth (2012) 17:267–321
theoretical and empirical work on growth begins—frequently without discussion—by takingthe quantity of schooling of workers (S) as a direct measure of H .
A more compelling alternative is to focus directly on the cognitive skills component ofhuman capital and to measure H with test-score measures of mathematics, science, andreading achievement.8 The use of measures of educational achievement has a number ofpotential advantages. First, they capture variations in the knowledge and ability that schoolsstrive to produce and thus relate the putative outputs of schooling to subsequent economicsuccess. Second, by emphasizing total outcomes of education, they incorporate skills fromany source—families, schools, and ability. Third, by allowing for differences in performanceamong students with differing quality of schooling (but possibly the same quantity of school-ing), they open the investigation of the importance of different policies designed to affect thequality aspects of schools.9
3 Consistent international measures of cognitive skills
This analysis starts with the development of new measures of international differences ofcognitive skills derived from educational achievement tests. We would ideally have measuresof the skills for workers in the labor force, but our measures of cognitive skills come from dataon testing for students who are still in school. This creates a trade-off: incorporating morerecent testing has the potential advantages of improved assessments and observations on agreater number of countries but it also weights any country measures more toward studentsand less toward workers.10 We begin with an expansive inclusion of more recent tests butthen investigate the impact of this choice through extended robustness checks that take morerestrictive choices.
The measures developed here extend those developed in Hanushek and Kimko (2000) toadd new international tests, more countries, and intertemporal and within-country dimen-sions. They also deal with a set of problems that remained with the early calculations.11
8 Some researchers have suggested that test scores should be thought of as a measure of school quality (q),leading to use of test scores times years of schooling as a measure of H , but this ignores the influence of familyfactors and other elements of Eq. (2) that have been shown to be very important in determining cognitive skills.9 Some recent work has introduced the possibility that noncognitive skills also enter into individual eco-nomic outcomes (see importantly Bowles et al. 2001; Heckman et al. 2006; Cunha et al. 2006). Hanushek andWoessmann (2008) integrate noncognitive skills into the interpretation of general models such as above andshow how this affects the interpretation of the parameter on school attainment and other estimates. While thereare no agreed-upon measures of noncognitive skills, at the aggregate level they might well be incorporated in“cultural differences,” something that we address in the analysis below.10 The reliance on schooling-based measures of skills also makes it clear why it is not possible to employpanel data estimation even though tests are spread across almost four decades for some nations. Any panelstudy would require measuring the cognitive skills of the labor force at different points in time, something thatis not possible with the sporadic measurement of student skills. Only one international test—the InternationalAssessment of Adult Literacy—has suggested the possibility of panel estimation across countries because ithas tested adults rather than students (see Coulombe and Tremblay 2006). Nonetheless, such analysis requiresvery strong assumptions about the mapping of observed age patterns of skills onto changes in labor force skillsover time. Further, most of the variance in growth and in test scores is found across countries, not across timefor individual countries—suggesting that panel data do not deal effectively with the most acute estimationissues. As shown in Appendix B, the testing has involved voluntary participation by a time-varying group ofcountries in tests that assess varying subject matters and grade/age ranges of students.11 The correlation across the common 30 countries of the new test measures developed here and those inHanushek and Kimko (2000) is 0.83. Appendix B assesses the importance for growth modeling of the differ-ences in their measures and those developed here.
123

J Econ Growth (2012) 17:267–321 273
Between 1964 and 2003, twelve different international tests of math, science, or readingwere administered to a voluntarily participating group of countries (see Appendix Table 10).These include 36 different possible scores for year-age-test combinations (e.g., science forstudents of grade 8 in 1972 as part of the First International Science Study or math of 15-year-olds in 2000 as a part of the Programme on International Student Assessment). Onlythe United States participated in all possible tests.
The assessments are designed to identify a common set of expected skills, which werethen tested in the local language. It is easier to do this in math and science than in reading,and a majority of the international testing has focused on math and science. Each test is newlyconstructed, usually with no effort to link to any of the other tests.
We wish to construct consistent measures at the national level that will allow comparing,say, math performance of 13-year-olds in 1972 to that in 2003. This would permit us tocompare performance across countries, even when they did not each participate in a com-mon assessment, as well as track performance over time. It would also provide the ability toaggregate scores across different years, ages, and even subjects as appropriate. The detailsof this construction along with the final data are found in Appendix B, and here we simplysketch the methodology. Because the test distribution is normal within the OECD sample,our construction of aggregate country scores focuses on transformations of the means andvariances of the original country scores in order to put them each into a common distributionof outcomes.
Comparisons of the difficulty of tests across time are readily possible because the UnitedStates has participated in all assessments and because there is external information on theabsolute level of performance of U.S. students of different ages and across subjects. TheUnited States began consistent testing of a random sample of students around 1970 underthe National Assessment of Educational Progress (NAEP). By using the pattern of NAEPscores for the U.S. over time, it is possible to equate the U.S. performance across each of theinternational tests.
The comparison of performance of other countries to the U.S. requires a distance metricfor each test. Each assessment has varying country participation and has different test con-struction so that the variance of scores for each assessment cannot be assumed to be constant.Our approach is built on the observed variations of country means for a group of countriesthat have well developed and relatively stable educational systems over the time period.12
We create the “OECD Standardization Group” (OSG) by using the thirteen OECD countriesthat had half or more of the relevant population attaining a secondary education in the 1960s(the time of the first tests). For each assessment, we then calibrate the variance in countrymean scores for the subset of the OSG participating to the variance observed on the PISAtests in 2000 (when all countries of the OSG participate). The identifying assumption of thisapproach is that the variance in the mean performance among a group of relatively stableeducation systems does not change substantially over time.
By combining the adjustments in levels (based on the U.S. NAEP scores) and the adjust-ment in variances (based on the OECD Standardization Group), we can directly calculatestandardized scores for all countries on all assessments. Each age group and subject isnormalized to the PISA standard of mean 500 and individual standard deviation of 100across OECD countries. We can then aggregate scores across time, ages, and subjects as wedesire.
12 The development of aggregate scores by Hanushek and Kimko (2000) and by Barro (2001) assumed thatthe test variances across assessments were constant, but there is no reason for this to be the case. Our approachis in the spirit of Gundlach et al. (2001).
123
274 J Econ Growth (2012) 17:267–321
The international testing protocols have evolved over time so that recent assessmentsemploy careful sampling rules, restrictions on the extent of any student exclusions, andmodern psychometric testing procedures, while earlier testing less consistently met currentstandards. This variation in testing quality potentially affects parts of our analysis, becausethe earlier (but poorer) tests relate to relevant members of the labor force during our periodof observation for economic growth. The more recent testing involves students not observedto be in the labor force. As a result, most of the estimation relies upon an assumption thatthe average scores for a country tend to be relatively stable over time and that the differencesamong countries are a good index of the relative skill differences of the workforces. Thisassumption is partially tested below, and, while there are some observed score changes, theoverall rankings of countries show considerable stability. For the 693 separate test observa-tions in the 50 countries employed in our growth analysis, 73 % of the variance falls betweencountries. The remaining 27 % includes both changes over time in countries’ scores andrandom noise from the testing. Our averaging procedure will minimize the noise componentat the cost of obscuring any differences over time for each country. In Sect. 7 below, we usethe intertemporal variation in scores for the subset of countries with enough observations toestimate the systematic changes as opposed to test noise. For the 15 countries employed inthe analysis of score trends in that section, 85 % of the variance lies between countries, andthe remaining 15 % within countries will be more heavily the result of systematic trends inscores.
The assessments give cognitive skill measures for tested students. Thus, exclusion rates(say for handicapped children) or differential student enrollment and attendance could affectthe estimation. Direct investigation of these issues, at least for tests since 1995 when reportingis sufficient, indicates that the growth analysis is not affected by variations in testing.13
4 Stability of the cognitive skills-growth relationship
The basic growth model in Eq. (1) is estimated for the 50 countries with cognitive-skilland economic data over the period 1960–2000. Cognitive skills are measured by the simpleaverage of all observed math and science scores between 1964 and 2003 for each country,although we test the sensitivity of the results to inclusion of varying time periods and subsetsof tests. The income data come from version 6.1 of the Penn World Tables (Heston et al.2002), while the data on years of schooling are an extended version of the Cohen and Soto(2007) data.14
We have concentrated on issues surrounding the measurement of cognitive skills, but otherquestions have recently been raised about the accuracy and reliability of both economic andschooling data. In Appendix D, we investigate the impact of using the latest Barro and Lee(2010) data on school attainment and of substituting the most recent Penn World Table data(version 7.0), which provides additional evidence confirming our basic results through theperiod up to 2009. Because neither of these alternatives materially affects our results, wesimply combine these sensitivity studies in the Appendix.
13 Hanushek and Woessmann (2011c) show that average tests can be affected by these: greater exclusions andhigher enrollment rates are correlated with higher scores. Nonetheless, the variations caused by these factorsare orthogonal to growth rates, so they do not bias our estimated skill parameters. The problems are potentiallymore severe with the earliest tests, but the reported information for these is insufficient for any analysis.14 Because we need comparable data on economic growth over the 1960–2000 period, all former communistcountries are eliminated even if they have test measures. Appendix B provides details on the country sample,and Appendix C provides descriptive statistics for each of the analyses below.
123

J Econ Growth (2012) 17:267–321 275
Table 1 Years of schooling versus cognitive skills in growth regressions
(1) (2) (3) (4)a (5)b (6)c (7)d (8)e (9)f
Cognitive skills 2.015 1.980 1.975 1.933 1.666 1.265 1.239 1.985(10.68) (9.12) (8.28) (8.29) (5.09) (4.06) (4.12) (7.83)
Years of schooling 1960 0.369 0.026 0.024 0.025 0.047 0.004 −0.049 −0.090(3.23) (0.34) (0.78) (0.29) (0.54) (0.05) (0.66) (1.02)
GDP per capita 1960 −0.379 −0.287 −0.302 −0.298 −0.298 −0.255 −0.351 −0.310 −0.879(4.24) (9.15) (5.54) (6.02) (5.04) (3.12) (6.01) (5.73) (3.39)
No. of countries 50 50 50 50 52 50 47 45 50R2 (adj.) 0.252 0.733 0.728 0.728 0.706 0.784 0.797 0.637
Notes Dependent variable: average annual growth rate in GDP per capita, 1960–2000. Regressions includea constant. Test scores are average of math and science, primary through end of secondary school, all years.Absolute t-statistics in parenthesesa Measure of years of schooling refers to the average between 1960 and 2000b Robust regression including the two outliers of Botswana and Nigeria (using rreg robust estimation commandimplemented in Stata)c Specification includes dummies for the eight world regions depicted in Fig. 1d Specification includes additional controls for openness and property rightse Specification includes additional controls for openness, property rights, fertility, and tropical locationf GDP per capita 1960 measured in logs
The central finding of the statistical analysis is the importance of cognitive skills in explain-ing international differences in long-run growth rates. As a comparison to prior cross-countryanalyses, the first column of Table 1 presents estimates of a simple growth model with schoolattainment.15 While this model explains one-quarter of the variance in growth rates, addingcognitive skills increases this to three-quarters of the variance. The test score is stronglysignificant with a magnitude that is unchanged by whether initial school attainment in 1960is excluded (col. 2) or included (col. 3).
School attainment is not statistically significant in the presence of the direct cognitive-skillmeasure of human capital. This does not change when attainment is measured as the averagebetween 1960 and 2000 (col. 4), rather than at the beginning of the period. This finding,of course, does not mean that schooling is irrelevant. Measured skills are closely related toschooling—a point we emphasize below—but life-cycle skill accumulation depends uponthe learning earlier in life. We measure achievement at various points during primary andsecondary education. Even if tertiary schooling is simply additive, knowledge at earlier pointsin education will strongly influence the ultimate skill accumulation when students enter thelabor force. But, as James Heckman and his colleagues have emphasized, there is a dynamiccomplementary of investments such that further schooling has a larger impact on skills if itbuilds on a larger base developed earlier (Cunha and Heckman 2007). The simple point isthat “skill begets skill through a multiplier process” (Cunha et al. 2006, p. 698), such thatadditional attainment has a lessened impact if built upon lower basic skills.16 It does suggest
15 While not the focal point of this analysis, all specifications include GDP per capita in 1960, which providesconsistent evidence for conditional convergence, i.e., countries with higher initial income tend to grow moreslowly.16 Relatedly, a variety of people place extra weight on tertiary education (e.g., Ehrlich 2007). However,without building on strong basic skills, such investment appears to have little extra value. In analysis ofgrowth across both developed and developing countries, tertiary education has little added value in explainingeconomic growth after consideration of measured cognitive skills on international tests with the exceptionthat U.S. investments in higher education have signaled increased growth (Hanushek and Woessmann 2011b).
123

276 J Econ Growth (2012) 17:267–321
that simply investing in further schooling without ensuring commensurate improvements incognitive skills does not lead to economic returns.
One standard deviation in test scores (measured at the OECD student level) is associatedwith a two percentage point higher average annual growth rate in GDP per capita across 40years. (This effect is equivalent to one percentage point per country-level standard devia-tion, thus making it virtually identical to the more limited estimates in Hanushek and Kimko2000). Such impacts are clearly large in substantive economic terms, and below we providealternative perspectives on the magnitude of these effects.
The remaining columns of Table 1 provide alternative perspectives on these basic results.Estimating the model with regression techniques robust to outliers yields virtually identicalcoefficient estimates to those including Nigeria and Botswana, the two significant outliercountries in the growth equation (col. 5).17 Because the robust model assigns essentially zeroweight to these two observations, they are dropped from the remaining models. Includingfixed effects for the eight world regions depicted in Fig. 1 (so that no between-region variationin test scores is used in the estimation) reduces the estimated test effect to 1.7 (col. 6).
Columns 7 and 8 consider economic institutions. Acemoglu et al. (2001, 2005) argue thathistoric factors surrounding the colonization of nations affected economic institutions andthat we can thus isolate the causal impact of institutions on growth. We add institutionaldifferences for openness of the economy and security of property rights (col. 7)18 and forthese plus fertility rates and location in the tropics (col. 8) into our growth models.19 Thesereduce the estimated test-score effect to around 1.25, but the effect of cognitive skills remainsstrongly statistically significant. On the other hand, Glaeser et al. (2004) argue that the col-onists brought human capital in addition to knowledge of good societal institutions and thatit is more likely that better human capital led both to the development of good institutionsand higher economic growth. This latter perspective highlights the difficulty of using mea-sures that reflect economic institutions from near the end of the observed growth period andthat might better be thought of as outcomes of growth itself. In their spirit, we interpret thereduced estimates of test scores in columns 7 and 8 as a lower bound on the true effect, sincethe institutional measures include any direct effects of cognitive skills on the developmentof good institutions.20 Additionally (not shown), the stock of physical capital per adult in
Footnote 16 continuedThe difficulty is that it is impossible to identify the impact of higher education as opposed to other unmeasureddeterminants of economic growth in the United States.17 The specific robust regression technique reported is Stata’s rreg command, which eliminates gross outlierswith Cook’s distance measure greater than one and iteratively down weights observations with large absoluteresiduals. The OLS estimate of the test effect in the 52-country sample is 1.752 (t-statistic 5.75). Nigeria andBotswana each participated only in a single international test.18 The measure of openness is the Sachs and Warner (1995) index reflecting the fraction of years between1960 and 1998 that a country was classified as having an economy open to international trade, based on fivefactors including tariffs, quotas, exchange rate controls, export controls, and whether or not a socialist econ-omy. Following Acemoglu et al. (2001), the measure of security of property rights is an index of the protectionagainst expropriation risk, averaged over 1985–1995, from Political Risk Services, a private company whichassesses the risk that investments will be expropriated in different countries.19 Openness and security of property rights enter the model (jointly) significantly; fertility and tropical locationdo not.20 A separate analysis of institutions has evolved in the developed countries of the OECD. These countriesall have strong property rights, open economies, and institutions that generally favor economic growth thatexplain differences between developed and developing countries. In order to explain differences within devel-oped countries, considerable analysis has gone into how various regulations of labor and product marketswithin the OECD affect economic growth (e.g., Nicoletti and Scarpetta 2003 on product market regulationsand Cingano et al. (2010) on labor market regulation). Nonetheless, none of the explicit measures of economic
123

J Econ Growth (2012) 17:267–321 277
1960 does not enter the basic growth model significantly and does not affect the test-scorecoefficient.
Finally, the precise specification of the growth model is the subject of considerable debatewithin macroeconomics. While there are many nuances of the argument, it can be framedas a simple contrast. The endogenous growth model indicates that increases in human cap-ital can lead to permanent differences in growth rates, because a better-educated workforceleads to a larger stream of new ideas that produces technological progress at a higher rate(e.g., Lucas 1988 or Romer 1990). By contrast, in the augmented neoclassical growth model,changes in human capital lead to higher steady-state levels of income but do not affect thelong-run growth path (e.g., Mankiw et al. 1992). Our estimates, which include the level ofinitial GDP per capita, allow for conditional convergence, but it is difficult to distinguishbetween temporary ”catch-up” growth and long-run differences in growth in the empiricalmodel. Those who favor the neoclassical model, however, favor estimation that includes thelog of initial income. Column 9 shows these results, where the impact of cognitive skills ongrowth is little changed from the linear alternative. Thus, the results do not appear to be theresult of the specific empirical model that is estimated.
While the estimated effect of test scores varies some across these different specifications,the cognitive-skill coefficients are always very significant and the variation is quite limited:A move of one standard deviation of individual student performance translates into 1.2–2.0percentage points difference in annual growth rates, other things equal. How much is onestandard deviation in performance? The difference between the U.S. average and the topperformers on the PISA tests is approximately 0.4 standard deviations, while the differencebetween the average Mexican student and the rest of the OECD was approximately onestandard deviation.
Two other important questions that relate to interpretation arise. The first set of issues iswhether the sample of countries or years of observation heavily influences the results, thusimplying that the results are potentially driven by other, unmeasured factors. The second iswhether the specific measure of cognitive skills drives the estimates.
Table 2 provides the matrix of estimated cognitive-skill coefficients across different sam-ples of observations. The columns consider sample sensitivity and concentrate on whetherthe overall results are driven by specific subsets of countries, which might indicate that thecognitive-skill measures simply proxy for other facets of the economies. The top row focuseson the average of all observed math and science scores—as presented previously—while, asexplained below, the second row relies on just lower-secondary-school scores which may bea more reliable measure of skill differences. Each entry comes from a separate regressionthat includes GDP per capita in 1960 and school attainment.
The first two comparisons (col. 2–3 and col. 4–5) present evidence on whether cognitiveskills are more or less important in developed countries. The first comparison divides theestimation into the 23 OECD countries and 27 non-OECD countries, while the second com-parison divides countries into above and below the median level of per-capita GDP in 1960.The statistically significant difference of high-income and lower (below median)-incomecountries indicates that developing countries are somewhat more affected by cognitive skillsthan developed countries.21 This larger impact of skills in low-income countries is consistent
Footnote 20 continuedregulations identified in this work is useful at explaining the large differences in long-run growth rates amongOECD countries (Hanushek and Woessmann 2011b). Thus, at least for the developed countries, omission ofthis expanded set of economic institutions does not appear to bias our growth estimates.21 While not shown, the school attainment measures are insignificantly related to growth even among thedeveloping countries where the levels are low and where there is considerable cross-country variance.
123

278 J Econ Growth (2012) 17:267–321
Tabl
e2
Sens
itivi
tyof
estim
ated
effe
cts
ofco
gniti
vesk
ills
toth
esa
mpl
eof
coun
trie
san
dtim
epe
riod
s
(1)
(2)
(3)
(4)
(5)
(6)
(7)
(8)
(9)
(10)
(11)
Cou
ntry
/yea
rsa
mpl
eFu
llO
EC
DN
on-
OE
CD
Hig
h-in
com
eaL
ow-i
ncom
eaW
/oE
ast
Asi
a
1960
–19
8019
80–
2000
1980
–200
0bSc
ore-
scho
olin
gou
tlier
sc
Scor
e-sc
hool
ing
core
c
Test
-sco
resp
ecifi
cati
onA
llm
ath
and
scie
nce
1.98
01.
736
2.05
61.
287
2.28
61.
301
1.52
22.
996
3.78
21.
888
2.17
5(9
.12)
(4.1
7)(6
.10)
(5.3
7)(6
.98)
(4.9
0)(4
.29)
(9.4
2)(3
.11)
(7.8
1)(3
.47)
Onl
ylo
wer
seco
ndar
y1.
759
1.64
61.
792
1.04
02.
083
1.13
71.
407
2.58
04.
386
1.67
31.
887
(9.2
2)(4
.02)
(6.1
9)(4
.70)
(7.4
4)(4
.82)
(4.5
6)(8
.88)
(4.4
9)(7
.83)
(3.4
5)N
o.of
coun
trie
s50
2327
2525
4050
5025
2525
Not
esR
epor
ted
num
bers
are
the
coef
ficie
nton
test
scor
esin
each
mod
elsp
ecifi
catio
n.D
epen
dent
vari
able
:Unl
ess
note
dot
herw
ise,
aver
age
annu
algr
owth
rate
inG
DP
perc
apita
,19
60–2
000.
Con
trol
vari
able
s:In
itial
GD
Ppe
rcap
ita,i
nitia
lyea
rsof
scho
olin
g,an
da
cons
tant
.Tes
tsco
res:
Unl
ess
note
dot
herw
ise,
aver
age
ofm
ath
and
scie
nce,
prim
ary
thro
ugh
end
ofse
cond
ary
scho
ol,a
llye
ars.
Abs
olut
et-
stat
istic
sin
pare
nthe
ses
aC
ount
ries
abov
e/be
low
sam
ple
med
ian
ofG
DP
per
capi
ta19
60b
Test
scor
esre
fer
only
tote
sts
perf
orm
edun
til19
84c
Cou
ntri
esw
ithla
rges
t(ou
tlier
s)/s
mal
lest
(cor
e)re
sidu
als
whe
nre
gres
sing
year
sof
scho
olin
gon
test
scor
es
123

J Econ Growth (2012) 17:267–321 279
with the arguments by Glaeser et al. (2004) that nearly all poor countries in 1960 were dicta-torships, some of which developed better societal institutions as an outcome of growth ratherthan a cause. The countries that did better in terms of growth were those with higher humancapital, supporting the larger coefficient on human capital in the poor countries. Nonetheless,variations in math and science skills remain very important in distinguishing among growthrates of the developed countries.
A portion of the influence of cognitive skills comes from the high growth of East Asiancountries. As shown in column 6, excluding the ten East Asian countries lowers the estimatedimpact of math and science skills to 1.3, but it remains highly significant in the remainingcountries. In other words, the overall estimates, while influenced by the East Asian growthexperience, are not simply identifying the high growth—high test-score position of EastAsia, which would raise the possibility that the growth relationships might be driven by otherfactors that were simply correlated with East Asian test performance.
The growth estimates are meant to identify long-run factors, but the sample period of1960–2000 includes sub-periods of world stagnation, fast growth, and financial crises. Somehave suggested, for example, that the observed growth rates are dominated by the early-period growth explosion of East Asia and that this changed considerably with the financialcrises of the late 1990s (Ramirez et al. 2006). Our results (col. 7 and 8) indicate, however, aconsistent impact of cognitive skills across the period that, if anything, has grown stronger inthe second half of our observations. Indeed, the estimated impact doubles in the most recentperiod, consistent with various arguments that, at least for the U.S. and OECD countries, theimportance of skills has increased (Murnane et al. 1995; Katz and Autor 1999; Goldin andKatz 2008).
The analysis has relied on assessments given throughout the period of economic obser-vation. This choice is made to maximize the number of countries and to include the moreprecise testing of recent periods, but it raises questions of reverse causality. If greater growthprovides added resources that can be used to improve schools and test scores, our estimatescould suffer from simultaneity bias. One direct set of estimates addresses this issue.22 Thesame impact on 1980–2000 growth is found when we restrict the test scores to measuresobtained before 1985 (available for only 25 countries), i.e., when we use test scores nearlyfully pre-dating the growth period (col. 9). In fact, the point estimate for cognitive skillsbecomes substantially larger in this specification. By using pre-determined test scores, thisspecification excludes the possibility of simple reverse causation. The conclusion that sim-ple reverse causation is not driving the results is reinforced in analyses using data updatesthat extend the economic series to 2009 (Appendix D).23 The possibility of reverse causationfrom economic growth to test scores is also unlikely because additional educational spending(which might become affordable with higher growth) does not systematically relate to bettertest scores (e.g., Hanushek 2002).
Levels of schooling and cognitive scores are correlated across our sample (r = 0.62), inpart because of the differences between developed and developing countries. Still, in manycases countries with similar years of schooling have very different test scores (see AppendixFig. 6). The separation of the impact of cognitive skills from that of school attainment in ourestimation relies upon information where these two diverge, and it might be a peculiar set ofcountries in terms of growth where the pattern of school attainment and skills varies most.
22 A second set of analyses directly addresses the resource question and finds that international tests are notdriven by differences in resources across countries. See the review in Hanushek and Woessmann (2011a).23 Results using only test scores that pre-date the analyzed growth period (not shown) are also robust whencombined with our other robustness checks pursued in Table 1.
123

280 J Econ Growth (2012) 17:267–321
The final two columns divide countries based on deviations of cognitive scores from schoolattainment. Specifically, the “score-schooling outliers” are the 25 countries with the largestresiduals when test scores are regressed on attainment, and the “score-schooling core” arethe 25 with the smallest residuals. Interestingly, the relationship between cognitive skills andgrowth is virtually the same across these two samples, revealing that the results are not drivenby “peculiar” countries in the production of cognitive skills.
The preceding results hold looking across columns, but the pattern also obtains for thealternative measures of test scores. The estimated coefficients using only lower-secondary-school math and science scores are systematically a little smaller than those from all scores,which may reflect attenuation bias when using fewer test observations in the construction ofthe cognitive-skill measure, but there are no changes in patterns across any of the columnarcomparisons. This test-score measure excludes any test in primary schooling or in the finalyear of secondary education. Test scores at the end of the secondary level, which combinethe knowledge accumulated over primary and secondary schooling, may be most relevantfor the labor force, but, at the same time, the duration of secondary education differs acrosscountries, so that tests performed in the final year of secondary schooling may not be asreadily comparable across countries. Further, given differing school completion rates, testsin the final year of secondary schooling may produce samples with differential selectivity oftest takers. Yet neither the primary-school tests nor the tests in the final secondary year arecrucial for the results.24
Table 3 provides more detail on sensitivity to the measure of cognitive skills, compar-ing several additional plausible alternatives for the aggregation of scores, including usingmath, science, and reading scores separately. We also provide breakdowns by OECD andnon-OECD countries, although this breakdown makes little qualitative difference, and weconcentrate on the variations in aggregate test information found in the table rows.
Results are qualitatively the same when using only scores on tests performed since 1995(row A). These recent tests have not been used in previously available analyses and are gener-ally viewed as having the highest standard of sampling and quality control. Likewise, resultsare robust to using tests scores since 1995 for just lower secondary grades (row B).
A drawback of using only the more recent tests is that such an approach requires a strongversion of the assumption that test performance is reasonably constant over time, because itrelates test performance measured since 1995 to the economic data for 1960–2000. To makesure that higher previous economic growth is not driving the measured test performance, thetest-score measure used in row C disregards all tests since the late 1990s. Our results turnout to be robust, with a point estimate on the test-score variable that is significantly higher(although the sample is reduced to 37 countries). Our results are also robust to using theaverage early test scores as an instrument for the average of all test scores in a two-stageleast-squares regression, in order to utilize only that part of the total test-score measure thatcan be traced back to the early test scores (row D). In sum, the results do not appear to bedriven by either early or late test scores alone.
The remainder of the table investigates different combinations of the math, science, andreading tests. While we were concerned about the reliability of the reading tests and thus havefocused on math and science, the use of reading tests provides similar results in the growthmodels (rows E-G). In a specification that enters the different subjects together (panel H),the three are always jointly significant at the 1 % level and higher, even though the scienceeffect gets smaller and the reading effect loses significance in the joint model.
24 Hanushek and Woessmann (2011c) also provide direct analysis of potential biases from test exclusions andenrollment rates and find that they are not an important concern.
123

J Econ Growth (2012) 17:267–321 281
Table 3 Sensitivity of estimated effects of cognitive skills to the measurement of skills
(1) (2) (3) No. of countriesCountry sample Full OECD Non-OECD
Test-score specification(A) Only since 1995 1.814 1.473 1.850 47
(9.91) (3.80) (6.74)(B) Only lower secondary since 1995 1.644 1.379 1.657 47
(9.57) (3.49) (6.48)(C) Only until 1995 3.156 1.377 3.668 37
(6.57) (1.93) (4.44)(D) Early as instrument for averagea 2.341 1.212 2.915 37
(7.71) (1.98) (5.80)(E) Only math 2.009 1.529 2.063 47
(8.98) (4.62) (5.81)(F) Only science 1.576 1.769 1.556 50
(7.00) (3.28) (4.48)(G) Only reading 2.351 1.616 2.529 46
(6.21) (3.33) (3.68)(H) All subjects entered jointly 41
Math 1.662 2.270 1.882(3.69) (2.97) (1.97)
Science 1.007 −2.414 1.270(2.34) (1.62) (1.92)
Reading −0.793 1.333 −1.457(1.15) (1.44) (0.94)
Notes Reported numbers are the coefficient on test scores in each model specification. Dependent variable:Average annual growth rate in GDP per capita, 1960–2000. Control variables: GDP per capita 1960, years ofschooling 1960, and a constant. Test scores: Unless noted otherwise, average of math and science, primarythrough end of secondary school, all years. Absolute t-statistics in parenthesesa 2SLS with average of test scores until 1995 as instrument for average of all test scores
The overall picture from this sensitivity analysis is that the estimated effect of cognitiveskills on growth is quite robust to a range of samples, specifications, and measurements.This finding contrasts sharply with many previous analyses that use years of schooling as thehuman capital measure, beginning with Levine and Renelt (1992) and continuing throughPritchett (2006). But of course the similarity of findings, while ruling out some specificationand measurement issues, cannot guard against all plausible threats to the identification ofcausal growth relationships.
The main theme of this paper is that cross-sectional growth regressions using existingvariation across countries provide stylized facts about long-term development but that theirinterpretation may be hampered by endogeneity biases. Endogeneity of cognitive skills could,for example, arise because nations with conditions favorable to economic growth also pro-duce high test performance. This correlation could arise because cultural factors, historicallygood economic institutions, variations in health status, or any other set of factors that lead tostrong economic performance might also be systematically related to high cognitive skills.Indeed, it does not matter whether such relationships are causal or purely associational. Ifthese factors are omitted from the growth estimation, they will tend to bias the coefficienton cognitive skills. Likewise, as suggested previously, there might be reverse causality ifeconomic growth facilitates investments in the school system or increases family resourcesthat improve cognitive skills.
123

282 J Econ Growth (2012) 17:267–321
The following three sections approach the interpretation of these stylized facts aboutgrowth from different viewpoints. Each approach to dealing with potential interpretativeproblems is clearly inconclusive, but each does work to eliminate specific sets of concerns.These further analyses also highlight the potential for policies based upon improved schoolquality.
5 Variations in cognitive skills driven by schools: instrumental variable models
One general concern in cross-country investigations is that cultural features influence botheconomic behavior and school outcomes. Even if the cognitive skills-growth relationship iscausal, the results presented so far would only be relevant for school policy if the variationin cognitive skills emanating from school policies is in fact related to economic growth. Asnoted, cognitive skills are likely to depend not only on formal schooling but also on non-school factors such as families, peers, and ability. Therefore, it is important to establish anylinks with school policy levers.
One means of addressing the set of issues is to use measures of the institutional structure ofthe school systems as instruments for the cognitive-skill measure, thereby focusing only thatpart of the international variation in cognitive skills that can be traced back to internationaldifferences in school systems. We use several institutional features—notably the existenceof external exit exam systems, the share of privately operated schools, the impact of varyingCatholic church history, the centralization of decision-making, and relative teacher pay—thathave been shown in the literature on international educational production to be associatedwith student achievement (see Hanushek and Woessmann 2011a for a review and evaluationof the micro evidence).
While other school policies such as those surrounding educational spending levels maywell be endogenous to the growth process, these institutional features can plausibly beassumed uncorrelated with the regression disturbances of our growth models. First, manyeducational institutions such as the existence and extent of private schooling reflect long-standing polices embedded in education law and thus are not outcomes of the growth processper se (see, for example, the review of private schooling across countries in Glenn and DeGroof 2002).25 Second, while there have been some trends in these institutions—such asthe slow movement toward decentralizing school decision-making—there is no suggestionthat this reflects either growth or other systematic differences in cultural and economic sys-tems.26 Third, there is empirical support from the literature on educational production thatthese institutional effects on student learning are robust to including regional fixed effects incross-country analyses, to within-country analyses, and to the use of historical instruments(see Woessmann 2003a; West and Woessmann 2010; Hanushek and Woessmann 2011a).These results suggest that institutional impacts are not driven by cultural differences and donot suffer directly from reverse causality.
25 If private school attendance rates are also related to the religious composition of countries, this instrumentmight still by problematic because of religious impacts on economic behavior; see Barro and McCleary (2003).However, evidence in West and Woessmann (2010) shows that, if anything, such impacts would be likely tolead to an underestimation of the effect of private school competition.26 Glenn and De Groof (2002, p. 267), note that “there has been in most Western democracies a slow butvery marked shift in the allocation of responsibility for the organization and control of education, in the publicas well as the nonpublic education sector, through decentralization of various aspects of decision-making tothe local school community.” The cross-country details suggest no obvious political or cultural differences inthese trends.
123

J Econ Growth (2012) 17:267–321 283
External exit exam systems are a device to increase accountability in the school systemthat has been repeatedly shown to be related to better student achievement (see Bishop 2006for a review).27 The first specification reported in Table 4 uses the share of students in acountry who are subject to external exit exams as an instrument for our measure of cogni-tive skills in the growth regression. The first-stage results confirm a statistically significantassociation between external exit exams and cognitive skills. The effect of cognitive skillson economic growth in the second stage of the instrumental variable (IV) estimation is sta-tistically significant and close to the OLS estimate.28 However, the relatively low F-statisticof the instrument in the first stage indicates the possibility of a weak instrument problem.Instruments that are only weakly correlated with the endogenous explanatory variable mayactually increase estimation bias and compromise the reliability of the conventional asymp-totic approximations used for hypothesis testing. Thus, we also report estimates based onthe modification of the limited information maximum likelihood (LIML) estimator by Fuller(1977), but the results are hardly affected.29 While the confidence band of the conditionallikelihood ratio test proposed by Moreira (2003) and Andrews et al. (2007) gets large at theupper end in this specification, difference from zero still reaches significance at the 10 %level.30
Because initial years of schooling are insignificant in the growth model once test scoresare controlled for (both in the OLS and in the IV specification), another possibility is toinclude years of schooling as a second instrument for test scores.31 This approach is alsosuggested by the prior model as long as cognitive skills are a measure of human capital in Eq.(1). Specification (2) of Table 4 reveals that years of schooling are significantly associatedwith test scores in the first stage, and the first-stage F-statistic increases substantially. TheSargan test does not reject the overidentifying restrictions of the model, suggesting that, ifexternal exit exams are a valid instrument, years of schooling are also valid. Both the 2SLSand the Fuller estimates, as well as inference based on Moreira confidence bands, confirmthat schooling-induced differences in cognitive skills are significantly related to economicgrowth.
School choice, as measured by the share of privately operated schools in a system, con-sistently shows a positive association with student achievement in OECD countries (seethe review in Woessmann et al. (2009), along with West and Woessmann (2010)) and pro-vides an additional instrument. In our sample, the share of private enrollment in a countryis significantly positively associated with cognitive skills in the first stage of our IV model(specification (3) of Table 4).32 The second-stage estimate of the growth model confirms our
27 Data on external exit exams are available for 43 countries in Woessmann et al. (2009), who update Bishop(2006)’s collection from reviews of comparative-education studies, educational encyclopedia, governmentdocuments, background papers, and interviews with national representatives. The measure refers roughly tothe mid-1990s, but exam regimes are relatively stable over time for countries.28 The Durbin–Wu–Hausman test does not reject the exogeneity of cognitive skills at conventional levels.29 Fuller’s modification of the LIML estimator is more robust than 2SLS in the presence of weak instrumentsand performs relatively well in the simulations by Hahn et al. (2004). We set the user-specified constant (Fuller1977’s alpha) to a value of one, but our results are hardly affected if we set alpha to four.30 Likewise, the Anderson–Rubin χ2 statistic (3.06) of this just-identified model indicates significance atthe 8 % level. Note that the LIML estimators, around which the Moreira bands are centered, differ from thereported 2SLS estimates only in the third digit in all our models.31 School attainment will also be affected by enrollment in higher education, which is not explicitly modeled.The results here suggest that international differences in cognitive skills still remain the dominant factor ingrowth.32 The data on private enrollment as percentage of total enrollment in general secondary education are fromUNESCO (1998) and refer to 1985, the earliest year with consistent data. For greater consistency of the time
123

284 J Econ Growth (2012) 17:267–321
Tabl
e4
From
scho
olin
gin
stitu
tions
toco
gniti
vesk
ills
toec
onom
icgr
owth
:ins
trum
enta
lvar
iabl
ees
timat
es
(1)
(2)
(3)a
(4)
(5)a
(6)
Seco
ndst
age
2SL
SC
ogni
tive
skill
s2.
151
2.02
32.
978
2.20
73.
914
1.74
9(2
.73)
(5.8
1)(5
.84)
(6.5
4)(4
.17)
(5.7
7)C
atho
licsh
are
in19
700.
003
(0.0
1)Fu
ller
(1)
mod
ifica
tion
ofL
IML
Cog
nitiv
esk
ills
2.12
12.
022
2.96
92.
197
3.79
71.
753
(3.0
1)(5
.94)
(5.9
3)(6
.64)
(4.1
7)(5
.92)
Mor
eira
95%
confi
denc
eba
ndC
ogni
tive
skill
s[−
3.88
8,19
.871
][1
.190
,2.8
68]
[1.7
34,4
.343
][1
.465
,3.0
93]
[2.0
63,7
.006
][0
.865
,2.5
25]
p-va
lue
(0.1
00)
(0.0
01)
(0.0
004)
(0.0
001)
(0.0
000)
(0.0
07)
Firs
tsta
ge(d
epen
dent
vari
able
:cog
nitiv
esk
ills)
Ext
erna
lexi
texa
msy
stem
0.28
60.
286
(2.0
1)(2
.01)
Initi
alye
ars
ofsc
hool
ing
0.17
60.
137
0.18
60.
065
0.16
1(4
.11)
(4.1
9)(4
.32)
(2.0
6)(3
.05)
Priv
ate
enro
llmen
tsha
re0.
520
(2.3
6)C
entr
aliz
atio
n(s
hare
)of
deci
sion
son
orga
niza
tion
−0.9
41of
inst
ruct
ion
(3.2
4)C
atho
licsh
are
in19
002.
301
(2.1
5)R
elat
ive
teac
her
sala
ry0.
188
(2.1
9)C
atho
licsh
are
in19
70−2
.801
(2.4
6)
123

J Econ Growth (2012) 17:267–321 285
Tabl
e4
cont
inue
d
(1)
(2)
(3)a
(4)
(5)a
(6)
No.
ofco
untr
ies
4343
2050
1834
Cen
tere
dR
20.
752
0.75
30.
791
0.74
30.
590
0.81
9Fi
rst-
stag
eF
-sta
tistic
4.04
10.2
812
.15
10.6
013
.35
6.94
Sarg
anst
atis
ticp-
valu
e0.
033
(0.8
56)
0.15
8(0
.691
)0.
193
(0.6
61)
0.01
1(0
.917
)0.
377
(0.5
40)
Dur
bin–
Wu–
Hau
sman
χ2
test
p-va
lue
0.03
4(0
.855
)0.
003
(0.9
57)
0.11
3(0
.737
)0.
479
(0.4
89)
4.74
4(0
.029
)0.
081
(0.7
76)
Not
esD
epen
dent
vari
able
(of
the
seco
ndst
age)
:ave
rage
annu
algr
owth
rate
inG
DP
per
capi
ta,1
960–
2000
.Con
trol
vari
able
s:In
itial
GD
Ppe
rca
pita
,ini
tialy
ears
ofsc
hool
ing,
and
aco
nsta
nt.T
ests
core
sar
eav
erag
eof
mat
han
dsc
ienc
e,pr
imar
yth
roug
hen
dof
seco
ndar
ysc
hool
,all
year
s.t-
stat
istic
sin
pare
nthe
ses
unle
ssot
herw
ise
note
da
Dep
ende
ntva
riab
le:a
vera
gean
nual
grow
thra
tein
GD
Ppe
rca
pita
,198
0–20
00;s
ampl
eof
OE
CD
coun
trie
s
123

286 J Econ Growth (2012) 17:267–321
previous results—schooling-induced differences in cognitive skills are significantly relatedto economic growth. Again, the Sargan test does not reject the validity of the overidentifyingrestrictions, and the Durbin–Wu–Hausman test presents no evidence of endogeneity of thecognitive-skill measure. Results are also very similar without years of schooling as a secondinstrument.
An additional way to exploit the effect of private competition is to use the historical ori-gins of international variation in the size of the private school sector.33 In particular, Westand Woessmann (2010) show that the opposition of 19th century Catholic church doctrineto state schooling provides a natural experiment in that the share of Catholics in a country’spopulation in 1900 is associated with the share of privately operated schools in its currentschool system, even after controlling for current Catholic shares. In this spirit, specification(4) of Table 4 uses the Catholic share in 1900 as an instrument for the cognitive skill mea-sure and controls for the Catholic share in 1970 in both stages of the IV model to ensurethat results are not driven by effects of religious affiliation per se on cognitive skills and oneconomic growth (see Hanushek and Woessmann (2012) for details). The first stage showsthat historical Catholic shares are indeed positively related to cognitive skills, whereas theopposite is true for modern Catholic shares (which are insignificant in the second stage). ThisIV specification, which we can estimate for our full sample of 50 countries, confirms a sig-nificant effect of cognitive skills on economic growth that is very close to the OLS estimate.The F-statistic of the instruments in the first stage is just above 10, and LIML estimates andMoreira bands confirm that the result is not driven by weak instruments problems.34
A further institutional feature regularly shown to be positively associated with studentachievement is the extent to which schools (or at least local decision-makers) are autono-mous to make their own decisions about the organization of instruction (see Woessmann2003b). Specification (5) of Table 4 shows that the share of decisions on the organizationof instruction that are made at the central government level is significantly negatively asso-ciated with our cognitive-skill measure. The second-stage estimators, robust to potentiallyweak instruments, confirm the significantly positive effect of cognitive skills on economicgrowth.35
Finally, given the crucial importance of teacher quality in educational production, ourfinal IV specification uses the relative position of teacher salaries in the income distributionof a country as an instrument for cognitive skills (see Hanushek and Woessmann 2012 fordetails). Following Dolton and Marcenaro-Gutierrez (2011), we use teacher salaries relativeto per-capita income as a proxy for the overall quality of the teaching force in a cross-country
Footnote 32 continuedspans, the dependent variable in this specification is economic growth in 1980–2000; results are robust tousing growth in 1960–2000. Given that the results from the educational production literature mostly refer tothe sample of OECD countries, we restrict the analysis to the OECD sample, for which 20 observations areavailable.33 The idea for this IV specification, as well as the IV specification using relative teacher salaries, was firstpresented by Hanushek and Woessmann (2012) in the context of analyzing the Latin American growth puzzle;that reference also provides additional detail on these two IV specifications.34 While the F-statistic of the instrument in the first stage is lower (at 4.61) in a model that does not useyears of schooling as a second control, such a specification also confirms the significant main result and isalso robust to LIML estimation and to the use of Moreira bands.35 Data on the percentage of decisions on the organization of instruction in public lower secondary educa-tion taken at the central level of government are available in Organisation for Economic Co-operation andDevelopment (1998), available only for 1998. The IV results are very similar without using years of schoolingas a second instrument, and the F-statistic of the excluded instrument is already above 10. In this specifica-tion, the estimated growth effect is even larger than the OLS estimate. Note, though, that the Fuller estimate isalready closer to the OLS estimate, and the Moreira confidence bands include the OLS and other IV estimates.
123

J Econ Growth (2012) 17:267–321 287
perspective, which targets the point in the overall “ability” distribution from which a countrydraws its teacher population and circumvents issues of salary levels being themselves relatedto growth.36 Again, the results confirm the significant growth effect of cognitive skills, in thesame order of magnitude as the OLS estimates, as well as the robustness to LIML estimationand Moreira bands (specification (6) of Table 4).
One potential worry about the exogeneity of our instruments is that the institutional fea-tures of school systems may be correlated with economic institutions, which are themselvescorrelated with economic growth. To test whether this affects our identification, we add thetwo measures of differences in economic institutions that tend to enter most robustly ingrowth regressions—openness and security of property rights—to our IV models (remem-bering, however, our prior reservations about the distinct possibility that these economicinstitutions capture part of the human capital effect). Our basic result is unaffected. In fact,the measures of economic institutions do not enter significantly (individually or jointly) inany of the IV models except column 2, and the effect of cognitive skills remains significantin all specification except for the just-identified model (1). The point estimates for cogni-tive skills are hardly affected except for model (2), where—in line with the OLS results ofTable 1—it is reduced to 1.1 (and to 1.3 in model (4)), similar to our OLS estimate of thelower bound for the effect.
The results suggest that improvements in cognitive skills generated in the school sys-tem—through institutional features affecting school quality—lead to higher long-run growthof economies. There are obvious limits of cross-country regressions with small data samples,and these are particularly salient in IV specifications. Caution is appropriate in interpretingIV results for our relatively small samples of countries and employing the aggregate natureof the institutional measures, but these cautions also make the statistical significance, reason-able precision, and quantitative robustness of the results based on quite different instrumentseven more striking.37
A significant concern remains, however. The institutional characteristics of the school sys-tem might still be related to important unmeasured aspects of economic institutions (eithercausally or correlationally). Nonetheless, any such problems must go beyond the traditionalmeasures of differences in economic institutions that are commonly employed.
6 Comparing the impacts of U.S. and home-country education on the U.S. labormarket
An alternative approach for assessing the causal importance of schools and of our measuredskill differences on economic outcomes relies on microdata on earnings differences withina single labor market—the U.S. labor market. This strategy, first proposed by Hanushek andKimko (2000), looks within a single labor market, thereby explicitly holding constant thequality of economic and cultural factors affecting the operations of the economy and focusingon whether measured cognitive skills directly relate to productivity.38 Following a difference-
36 The teacher salary data, based on OECD and UNESCO surveys, refer to teacher salaries at the top of theexperience scale in 2003.37 The IV results hold when employing several of the institutional instruments jointly in the specification, butonly one of them tends to capture statistical significance in the joint specifications.38 This analysis extends the original work in Hanushek and Kimko (2000) in several ways. By placing theanalysis in the framework of a difference-in-differences model, it compares the earnings of late immigrantsjust to early immigrants from the same country; it dramatically expands both the sample of workers andthe number of countries of origin for immigrants; it uses better test information for the comparisons; and it
123

288 J Econ Growth (2012) 17:267–321
in-differences strategy, we can compare the returns to skills of immigrants schooled in theircountry of origin to those of immigrants from the same country schooled within the UnitedStates. If it is the measured differences in cognitive skills and not other economically relevantattributes of the families and economies that are important, the impact of skills can be derivedfrom the different earnings of immigrants who received their schooling at home and in theUnited States.
The structure of the estimation is derived from a standard Mincer (1974) wage equationaugmented by measured cognitive skills such as:
ln yic = α0 + α1Sic + α2 P Eic + α3 P E2ic + γy Hic + υic (3)
where y is annual earnings for immigrant i from country c, S is years of school attainment,PE (=age-S-6) is potential experience, H is cognitive skills, and υ is a random error.39
We look at immigrants to the U.S. who were either educated entirely in their country oforigin or entirely in the United States.40 (This excludes any individuals partially educated inboth the U.S. and their home countries in order to obtain a clear separation of treatment andcontrol groups.) We assign the average cognitive-skill score of the home country (T c) foreach immigrant and estimate the Mincer earnings Eq. (3) as:
ln yic = α0 + α1Sic + α2 P Eic + α3 P E2ic
+[α4 O RI G I Ni + δT c + δO(T c × O RI G I Ni )] + υic (4)
where ORIGIN is an indicator that is one if immigrant i was educated entirely in schools inthe country of origin and zero otherwise and the combined terms in brackets indicate the skillsof individuals from country c. The parameter δO is the relevant contrast in skills betweenhome-country schooling and U.S. schooling. We interpret δO as a difference-in-differencesestimate of the effect of home-country test scores on earnings, where the first differenceis between home-country educated immigrants (the “treatment group”) and U.S.-educatedimmigrants (the “control group”) from the same country, and the second difference is in theaverage cognitive-skill score of the home country.41 The parameter δ captures the bias thatwould emerge in standard cross-sectional estimates from omitted variables like cultural traitsthat are correlated with home-country test scores in the same way for all immigrants from
Footnote 38 continuedconsiders a range of sensitivity analyses such as excluding Mexican immigrants and including only immigrantsfrom English-speaking countries.39 Given that our growth specifications are most closely related to an endogenous-growth formulation, onecannot directly go from the estimated effects on individual productivity to the impact on growth rates. For thatreason, in order to validate our micro estimates below, we concentrate on comparisons with other micro esti-mates of the impact of cognitive skills on productivity. While our analysis uses skill differences by country oforigin to infer earnings differences among immigration in the U.S., Hendricks (2002) and Schoellman (2012)go the opposite way of using earnings differences of U.S. immigrations to infer cross-country differences inhuman capital.40 Immigrants are individuals born in a foreign country. The sample includes all individuals age 25 or oldercurrently in the labor force with wage and salary earnings of at least $1,000 and not enrolled in school.Included immigrants had to have been born in a country with international test data (see Appendix B). Thenumber of included countries is larger than in the previous growth regressions because of the lack of need tohave internationally comparable GDP data for country of origin. Descriptive statistics are found in AppendixTable 13.41 Immigrants educated in their home country necessarily come to the U.S. at an older age than comparableimmigrants educated in the U.S., suggesting that there might be differential selectivity and motivation of thesetwo groups. But the key issue for identifying the impact of cognitive skills is that any selectivity in migration isthe same across countries (which would then be captured by α4), or at least is not correlated with differencesin home-country cognitive skills.
123

J Econ Growth (2012) 17:267–321 289
the same country of origin (independent of where they were educated); in our more elaboratespecifications with country-of-origin fixed effects, this parameter is not identified.
The first two columns of Table 5 report the estimates of the impact of cognitive skillsfrom stratified samples for the two groups of immigrants. Test scores are normalized tomean zero and a standard deviation of one, so that the estimates indicate the proportionateincrease in earnings from a one standard deviation increase in scores. Other things equal,there is essentially no relationship of U.S. earnings to scores of their country of origin, eitherquantitatively or statistically, for the 50,597 immigrants educated entirely in the U.S. Onthe other hand, one standard deviation greater performance in country-specific average testscores translates into a statistically significant earnings increase of approximately 16 % forthe 258,977 immigrants educated in their country of origin.
This estimate is surprisingly close to recent estimates for cognitive skills of U.S. workers,which indicate 10-15 % returns to a standard deviation of test scores for young workers and19 % across the full age range of workers.42 The closeness to the various estimates is surpris-ing given that just average country scores as opposed to individual specific scores are used inthe estimation here, although the averaging of scores does eliminate the measurement errorfound in individual test data.
Column 3 combines the samples and fully estimates Eq. (4). These estimates indicate asignificant impact of test scores emanating from schooling in the immigrant’s country of ori-gin (δO). In contrast, the estimate of (home-country) test score for U.S.-educated immigrants(δ) is statistically insignificant, although the point estimate is noticeably greater than zero.Column 4 demonstrates that this latter effect comes entirely from the influence of immi-grants from Mexico (who constitute 37 % of all immigrants to the U.S.). The estimation forimmigrants from Mexico is prone to classification error, because many Mexican familiestend to move back and forth from Mexico—thus making assignment to U.S. or Mexicanschooling prone to error.43 Excluding Mexican immigrants, ̂δO is highly significant with apoint estimate of 0.13, while the coefficient for U.S.-educated immigrants falls to −0.026and remains statistically insignificant.
The prior estimates indicate that the estimation strategy might be sensitive to variationsin immigration patterns across the 64 sampled countries. For example, in addition to thecomplications for Mexican immigrants, the immigrants from other countries might vary bywhere they come in the ability distribution of the home country and the like. For this reason,the remaining columns of Table 5 contain country-of-origin fixed effects. Thus, immigrantseducated entirely abroad in their home country are compared directly to immigrants fromthe same country educated entirely in the U.S. This eliminates any potential bias emanatingfrom features specific to the country of origin, be they specific selectivity of the immigrantpopulation or country-specific cultural traits. The only remaining assumption required foridentification of our parameter of interest is that any potential difference between the early-
42 Murnane et al. (2000) provide evidence from the High School and Beyond and the National LongitudinalSurvey of the High School Class of 1972. Their estimates suggest some variation with males obtaining a15 % increase and females a 10 % increase per standard deviation of test performance. Lazear (2003), relyingon a somewhat younger sample from NELS88, provides a single estimate of 12 %. These estimates are alsovery close to those in Mulligan (1999), who finds 11 % for the normalized AFQT score in the NLSY data.Hanushek and Zhang (2009) estimate a return of 19 % from the International Adult Literacy Survey, whichsamples workers aged 16–65.43 The assignment of individuals to U.S. schooling is based on census data indicating immigration before age6. The assignment of individuals to schooling all in country of origin is based on age of immigration greaterthan years of schooling plus six. A person who moves back and forth during the schooling years could beerroneously classified as all U.S. or no U.S. schooling, even though they are really in the partial treatmentcategory (which is excluded from the difference-in-differences estimation).
123

290 J Econ Growth (2012) 17:267–321
Tabl
e5
Dif
fere
nce-
in-d
iffe
renc
eses
timat
esof
retu
rns
toco
untr
y-of
-ori
gin
cogn
itive
skill
sfo
rU
.S.i
mm
igra
nts
Sam
ple:
U.S
.ed
ucat
eda
Edu
cate
din
coun
try
ofor
igin
b
All
imm
igra
nts
W/o
Mex
ico
All
imm
igra
nts
W/o
Mex
ico
Gro
wth
sam
plec
Onl
yE
nglis
hsp
eaki
ngco
untr
ies
(1)
(2)
(3)
(4)
(5)
(6)
(7)
(8)
Cog
nitiv
esk
ills×
educ
ated
inco
untr
yof
orig
in
0.08
730.
1324
0.13
750.
1398
0.16
700.
1616
(2.0
2)(3
.31)
(3.1
6)(4
.13)
(3.7
7)(3
.57)
Cog
nitiv
esk
ills
0.00
500.
1582
0.06
34−0
.025
8N
otid
entifi
edN
otid
entifi
edN
otid
entifi
edN
otid
entifi
ed(0
.14)
(2.3
7)(1
.06)
(1.4
2)E
duca
ted
inco
untr
yof
orig
in
−0.1
385
−0.1
011
−0.1
298
−0.0
626
−0.1
309
−0.0
206
(3.9
5)(3
.03)
(2.9
8)(2
.07)
(2.5
8)(0
.83)
Yea
rsof
scho
olin
g0.
1155
0.06
730.
0700
0.08
630.
0579
0.08
560.
0553
0.09
92(1
4.08
)(7
.35)
(7.4
3)(1
3.47
)(4
.14)
(17.
40)
(4.0
6)(1
5.41
)
123

J Econ Growth (2012) 17:267–321 291
Tabl
e5
cont
inue
d
Sam
ple:
U.S
.ed
ucat
eda
Edu
cate
din
coun
try
ofor
igin
bA
llim
mig
rant
sW
/oM
exic
oA
llim
mig
rant
sW
/oM
exic
oG
row
thsa
mpl
ecO
nly
Eng
lish
spea
king
coun
trie
s(1
)(2
)(3
)(4
)(5
)(6
)(7
)(8
)
Pote
ntia
lexp
erie
nce
0.03
720.
0235
0.02
430.
0215
0.02
410.
0227
0.02
330.
0205
(19.
71)
(4.1
2)(5
.67)
(4.7
5)(7
.68)
(5.5
7)(6
.50)
(2.8
0)Po
tent
iale
xper
ienc
e−0
.000
64−0
.000
35−0
.000
36−0
.000
4−0
.000
39−0
.000
4−0
.000
4−0
.000
4sq
uare
d(1
3.02
)(4
.79)
(6.1
0)(4
.90)
(7.4
0)(5
.87)
(6.4
6)(3
.25)
Fixe
def
fect
sfo
rno
nono
noye
sye
sye
sye
sco
untr
yof
orig
inO
bser
vatio
ns50
,597
258,
977
309,
574
187,
506
309,
574
187,
506
273,
213
72,0
91N
o.of
coun
trie
s64
6464
6364
6347
12R
20.
157
0.17
00.
180
0.13
20.
196
0.15
00.
202
0.15
6
Not
esD
epen
dent
vari
able
:log
(ann
uale
arni
ngs)
.Cog
nitiv
esk
ills
refe
rto
aver
age
test
scor
eof
coun
try
ofor
igin
(cen
tere
dat
zero
).Sa
mpl
e:A
llim
mig
rant
sid
entifi
edby
coun
try
ofbi
rth
noti
nsc
hool
who
seag
eis
grea
tert
han
25,w
hoar
eem
ploy
ed,a
ndw
hoea
rned
mor
eth
an$1
,000
in19
99.I
mm
igra
nts
who
had
obta
ined
som
ebu
tnot
allo
fthe
ired
ucat
ion
inth
eU
.S.w
ere
excl
uded
from
the
sam
ple.
Imm
igra
nts
from
allc
ount
ries
ofor
igin
for
whi
chth
ere
are
cogn
itive
-ski
llsc
ores
,exc
eptf
orth
efo
llow
ing
coun
trie
s(a
reas
)w
hich
coul
dno
tbe
iden
tified
beca
use
ofce
nsus
rest
rict
ions
onre
leas
eof
data
for
smal
lce
lls:
Swaz
iland
,Sl
oven
ia,
Mac
au-C
hina
,L
uxem
bour
g,L
iech
tens
tein
,E
ston
ia,
Bot
swan
a,B
ahra
in,T
unis
ia,a
ndIc
elan
d.Is
rael
coul
dno
tbe
iden
tified
sepa
rate
lyfr
omPa
lest
ine;
both
wer
eas
sign
edth
eIs
rael
isco
re.R
obus
tabs
olut
eva
lues
oft-
stat
istic
sin
pare
nthe
ses
with
clus
teri
ngby
coun
try
ofor
igin
.Sou
rce:
Aut
hors
’ca
lcul
atio
nsfr
om20
00C
ensu
sIP
UM
Sda
taa
U.S
.edu
cate
dim
mig
rant
sar
eid
entifi
edas
imm
igra
ting
toth
eU
.S.b
efor
eth
ebe
ginn
ing
year
ofsc
hool
ing
bIm
mig
rant
sed
ucat
edin
thei
rco
untr
yof
orig
inar
eid
entifi
edas
imm
igra
ting
toth
eU
.S.a
fter
the
final
year
ofsc
hool
ing
cT
heec
onom
icgr
owth
sam
ple
relie
son
the
data
for
imm
igra
nts
from
the
50co
untr
ies
inth
eba
sic
grow
thre
gres
sion
s
123
292 J Econ Growth (2012) 17:267–321
immigrated U-S.-educated and the late-immigrated home-educated group of immigrants fromeach country (as captured by the ORIGIN indicator) does not vary across countries in a wayassociated with country-of-origin test scores.
Column 5 displays the primary estimation across all sampled countries with country-spe-cific fixed effects. The estimated impact of cognitive skills is a 14 % increase in earnings fromeach standard deviation increase in origin-country test scores (when educated there). Thisestimate is highly significant. Further, the point estimate is virtually unchanged by exclud-ing the Mexican immigrants (col. 6). The standard error is reduced by clearer assignmentto treatment category (when Mexicans excluded), even though the sample is substantiallyreduced.
The final two columns investigate the sensitivity of these estimates to sample definition.First, our estimation of growth models used the 50 countries for which we could obtain therelevant economic data for GDP growth. Restricting this analysis to that smaller sample yieldsa slight increase in the magnitude of ̂δO to 17 %, while it remains statistically significant.Second, because immigrants from non-English speaking countries may have lower earningsbecause of language difficulties, the final column shows estimates that come entirely fromcountries where English is the primary or official language.44 Again, even for this sample ofjust 12 countries, variations in cognitive skills across countries have a strongly significantimpact on earnings of 16 %.
The remaining rows of Table 5 provide estimates of the complete set of parameters. Whilethere is some variance across samples in the estimate of the effect on earnings of being edu-cated entirely in the country of origin, this appears to reduce average earnings by 6–13 %with the exception of English-speaking immigrants, who appear to suffer no significant aver-age earnings loss compared to people educated entirely in the U.S. The estimated “Mincer”parameters (α1, α2, and α3) appear within the range of typical estimates for the general pop-ulation (see Heckman et al. 2008). Results remain qualitatively the same when indicators fordecade of immigration and for gender are added to the model.45 These last specificationsaddress in part concerns that unmeasured differences between late immigrants (those receiv-ing schooling in their home country) and early immigrants (those receiving schooling in theU.S.) might be driving the results.
These difference-in-differences estimates provide support for two conclusions about thepotential causal impacts of cognitive skills. First, they contrast individuals receiving the treat-ment of home-country schooling to immigrants from the same country, all within the samelabor market. Thus, they cannot be driven by differences in underlying economic institutionsaround the globe that are correlated with differences in cognitive skills. Second, they pin-point the impact of schooling differences across countries, as distinct from family or culturaldifferences in attitudes, motivation, child rearing, and the like. In sum, the estimates, whichare highly stable across different estimation samples, provide evidence that the economicimpact is a causal one, and not purely associational.
It is very difficult, however, to compare magnitudes of coefficients from the immigrantearnings models to the growth regressions. These estimates are restricted to the private returnsand leave out any of the externalities implicit in the estimated growth models. Thus, while
44 Data on English language come from the CIA World Factbook. Countries were coded as English speakingif the CIA World Factbook listed English as an official language or as the most widely spoken language in thecountry. See https://www.cia.gov/library/publications/the-world-factbook/.45 When analyzed separately by gender, the results hold strongly for males whereas results for females—whilepointing in the same direction—mostly do not reach statistical significance, as is common in labor-marketanalyses.
123

J Econ Growth (2012) 17:267–321 293
the estimated earnings impacts of cognitive skills are remarkably close to existing panel-dataestimates, they do not translate easily into aggregate growth estimates.
The estimates do, however, provide direct support for the production view of schoolingas contrasted with the signaling or screening view. Since the analysis of Spence (1973),questions have been raised about whether schools simply act as devices to select more ablestudents as opposed to providing them with new knowledge and skills. Thus, an individualmay get more schooling simply to signal high ability to the labor market. The difficulty hasbeen that the labor-market implications for the returns to school attainment are the same inthe alternative models—those with more schooling have more skills and thus receive higherwages. This fact has led to a variety of alternative ways to identify production versus signal-ing (cf. Weiss 1995; Riley 2001). One salient approach is reliance on what happens duringschooling as opposed to the market returns to school attainment to identify the differences.The previous results provide just such evidence, because they show that the quality of differ-ent schools and the cognitive skills related to different schooling have direct payoffs withinthe same labor market. Therefore, these estimates yield even stronger evidence that policiesto improve schools have social payoffs, as opposed to being limited to private payoffs aswould be implied in the screening model.
7 Skill improvement and improved growth
The prior analyses have relied upon the average test score for each nation in order to charac-terize differences in skills of their labor forces. As noted, most of the variation in test scoresoccurs between countries, but the existence of some systematic change for countries suggeststhe possibility of an alternative difference-in-differences approach that uses the time-seriesevidence on performance within each country to identify the impact of skills on growth. Spe-cifically, countries that improve the skills of their population—no matter how it is done—bythe underlying model should see commensurate improvements in their rate of growth. Thisestimation removes any country-specific fixed effects affecting growth rates—such as basiceconomic institutions, cultural factors, political environment, and the like—and focuses onwhether a country that alters the cognitive skills of its population is observed to receive aneconomic return.
While others have investigated turning points in growth, our focus is low-frequencychanges such as those that might result from evolutionary schooling policies and that alterthe path of economic growth.46 Policies affecting the skill composition of the labor forcenecessarily unfold over lengthy periods and are not seen as sharp changes in outcomes.
To characterize the longitudinal patterns of test scores, we regress separate test scores byyear, age group, and subject on a time variable (as well as age-group and subject indicators)and use the time coefficient as the measure of change in cognitive skills for each nation(see Appendix B for details). The amount of noise in each test observation, particularly withour common scaling, implies that such trends are also estimated with considerable noise.We therefore trust the rough cross-country pattern more than the specific point estimates ofchanges in each country. To put limits on the amount of noise affecting our analyses, we rely
46 Relevant studies include Hausmann et al. (2005) who look at episodes of “growth accelerations”; Jonesand Olken (2008) who consider patterns of 10-year periods of acceleration and collapse; and Barro and Ursúa(2008) who identify events of major declines in consumption that have potential implications for long-rungrowth. The identified periods are generally characterized by financial crisis, political instability, or war.
123

294 J Econ Growth (2012) 17:267–321
Fig. 2 Trends in Growth Rates vs. Trends in Test Scores. Notes: Scatter plot of trend in the growth rate ofGDP per capita from 1975 to 2000 against trend in test scores, which is equivalent to the first column ofTable 6. Three countries without test scores before 1972 in light gray; regression line refers to the remainingtwelve countries. See Appendix B for details
on the sample of OECD countries that have test observations both before 1985 and up to2003.47
As is evident from Fig. 2 (see also Appendix Fig. 5), substantial changes in test perfor-mance—both positive and negative—have occurred for OECD countries.48 The rapid growthin performance of such countries as Canada, Finland, and the Netherlands contrasts sharplywith the declining scores in Germany, Italy, and Norway. For our purposes, however, we arenot interested in test scores for the school-aged population but instead in the skills of therelevant portions of the labor force. Thus, we need to assume that the currently observedtrends in performance reflect long-run patterns of skill change and specifically those holdingduring the earlier time periods.
In a parallel manner, we estimate a time trend for annual growth rates in each countryusing the Penn World Tables data. The annual growth rate series for each country containsconsiderable noise, largely reflecting short-run business cycle phenomena or financial crises,and the trend estimation is designed to extract long-run changes in growth.49
The consistency of changes in test performance and changes in growth rates is evident inFig. 2. When we split countries by being above or below the median change in growth ratesand above or below the median change in cognitive skills, all countries fall into either thepositive or negative quadrants on both measures. The largest outliers from the trend line are
47 In fact, all countries except Canada, Korea, and Norway have test scores dating back at least to 1971.48 A comparison of the country rankings of projected skill levels for 1975 and 2000 yields a Spearman rankcorrelation is 0.78—again reinforcing the validity of country average scores for the main growth analysis.49 Descriptive statistics are found in Appendix Table 14. We also tried alternative measures of growth-ratechanges, including the difference between the average growth rate in the first five years and in the last fiveyears; trend growth using IMF data in national currencies; and IMF national currency data for the period1975–2004. Using IMF national currency data is consistent with Nuxoll (1994) and Hanousek et al. (2008)who argue that using national accounts data is superior to relying on the price and exchange-rate adjustmentsin the basic Penn World Tables data when looking at growth rates. In our investigation of these options, theestimates of the impact of changes in test scores remain statistically significant and quantitatively very similaracross alternatives and compared to the estimates reported in Table 6.
123

J Econ Growth (2012) 17:267–321 295
Table 6 Changes in cognitive skills and changes in growth paths
(1) (2) (3) (4) (5)a (6)b (7) (8) (9)
Trend in cognitiveskills
0.084 0.073 0.074 0.074 0.080 0.117 0.073(3.10) (3.21) (3.07) (3.04) (3.34) (6.90) (2.97)
Dummy forcognitive-skilltrend abovemedian
0.117 0.103(5.98) (4.87)
Average annualgrowth rate inGDP per capita1975–2000
−0.030 −0.035 −0.028 −0.039 −0.085 −0.004 −0.031(2.73) (1.61) (1.69) (2.32) (5.26) (0.21) (2.55)
Initial GDP per capita −0.002 0.005(0.27) (0.80)
Change in years ofschooling1975–2000
−0.004(0.21)
Trend in cognitiveskills in1999–2009
0.0004(0.03)
No. of countries 15 15 15 15 15 12 15 15 15R2 (adj.) 0.380 0.586 0.551 0.550 0.582 0.891 0.713 0.735 0.548
Notes Dependent variable: trend in the growth rate of GDP per capita from 1975 to 2000. Regressions includea constant. Sample: OECD countries with test-score data both before 1985 and up to 2003. Test scores areaverage of math and science, primary through end of secondary school. Absolute t-statistics in parenthesesa WLS with inverse of standard error with which the trend in test scores was estimated as weightsb Excluding countries without test scores before 1972 (Canada, Korea, and Norway)
precisely the countries that have less historical test score data (Canada, Korea, and Norway)and that thus have poorer trend data.
We provide estimates of simple models of the change in growth rates over the 1975–2000 period in Table 6. By focusing on changes in test scores and in growth rates, thesespecifications are essentially equivalent to panel estimates with country fixed effects thateliminate time-invariant factors of cultural, institutions, or other potential influences. For the15 OECD countries, 38 % of the variance in growth-rate changes can be explained by test-score changes.50 If we add measures for the average growth rate in each country and the initialGDP per capita (col. 2–3), the change in achievement scores remains statistically significantat near the same level as found in the simple regressions of column 1. The same is true whenthe change in quantitative educational attainment is added to the model (col. 4). Importantly,the change in educational attainment is orthogonal to the change in growth rates (either withcontrols for the test-score trend or without), reinforcing the introductory skepticism about theefficacy of past reliance on school attainment measures of human capital. Likewise, resultsare hardly affected if we weigh each observation by the inverse of the standard error with
50 Results are fully consistent when adding six non-OECD countries with available data to the analysis (dis-regarding three non-OECD countries that prove extreme outliers on the estimated test-score trend at more thantwo and a half standard deviations above/below the OECD sample mean). While in the extended 21-countrysample, OECD countries on average have lower growth trends, the effect of test-score trends on growth trendsdoes not differ significantly between the OECD and non-OECD countries, and the main effect of the test-scoretrend is unaltered from the OECD-sample analysis (detailed results available from the authors upon request).
123

296 J Econ Growth (2012) 17:267–321
which the trend in test scores was estimated, in order to down weight those that are morenoisily estimated (col. 5).
If, however, we restrict the analysis to those countries with test scores spanning a rangeof more than three decades, from at least 1971 to 2003, both the coefficient estimate and theexplained variance grow in size (col. 6), as suggested in Fig. 2. In the sample without the threecountries with limited time series information (Canada, Korea, and Norway), the test-scoretrend alone accounts for 64 % of the variation in growth trends. Alternative specificationslook simply at whether the test-score trend is above or below the OECD median (col. 7–8).In all cases, the impact of changes in test scores on changes in growth rates remains verystable and is always statistically significant.
The underlying identifying assumption of these analyses is that the observed test-scoretrend captures a prior trend and is not affected by the partly overlapping growth trend. Oneway to test the validity of this identifying assumption is to use the most recently availabletest score data to estimate the trend in test scores subsequent to the period over which thegrowth trend is estimated. To do so, we estimate the trend in test scores from the 24 availabletest observations in 1999–2009 (details available on request). When entering the test-scoretrend in 1999–2009 to our regression, it is totally unrelated to the prior growth trend anddoes not affect the result on the prior test-score trend (col. 9). In fact, the test-score trendin 1999–2009 is not correlated with the prior long-term test-score trend (correlation coeffi-cient −0.302, p-value 0.274) or with the growth trend in 1975–2000 (correlation coefficient−0.293, p-value 0.289).51 This result corroborates the assumption that the identifying test-score variation is not itself caused by variation in growth. Furthermore, analyses presentedin Appendix D (Table 16) use the most recent Penn World Table data (version 7.0) to showthat results are strengthened when relating the initial test-score trend to the growth trend in1985–2007 (rather than 1975–2000).
Still, this analysis requires backward extrapolation of the test-score data in order to cap-ture changes for workers in the labor force. Thus, it cannot be considered definitive. We can,however, relate these estimates to the prior growth models. If we assumed that the observedtrend in test scores had been going on since the oldest person in the current labor force wentto school, an annual increase in test scores by 1 % of a standard deviation would translate intoan annual increase in the growth rate by 0.07–0.12 percentage points. However, if we morerealistically thought that any change in test scores began at the beginning of our observationperiod, then the impact of student improvements on the average labor force is much less, andthe projected change in growth rates would be commensurately reduced. Back-of-the-enve-lope calculations suggest that in such a setting, the estimates based on the trend analysis inTable 6 are close to the steady-state estimates in Table 1.
In conclusion, the positive relationship between improving cognitive skills and improv-ing growth rates provides another set of surprisingly consistent results based on a differentapproach to identifying the causal impact of cognitive skills—a focus on changes within eachcountry that removes country-specific fixed effects. While it requires large extrapolations ofchanges to cover existing workers, the results are remarkably compatible with the underly-ing growth model—showing growth rates changing in a manner consistent with changes incognitive skills.
51 Results are qualitatively the same when using just the PISA tests in 2000–2009.
123

J Econ Growth (2012) 17:267–321 297
8 Rocket scientists or basic education for all?
While addressing the range of potential schooling policy options is clearly beyond the scopeof this paper, our new data series allows us to extend the growth analysis to illuminate oneimportant issue—whether to concentrate attention at the lowest or at the highest achievers.Some argue in favor of elitist school systems which focus on the top performers as potentialfuture managers of the economy and drivers of innovation. Others favor more egalitarianschool systems to ensure well-educated masses that will be capable of implementing estab-lished technologies. In other words, should education policy focus on forming a small groupof “rocket scientists,” or are approaches such as the Education for All initiative (UNESCO2005) more promising in spurring growth?
To capture these differences in the distributional patterns of the test-score performancein different countries, we use the microdata from each of the international assessments tocalculate measures of the share of students in each country who reach at least basic skillsas well as those who reach superior performance levels (see Appendix B). We use perfor-mance of at least 400 test-score points on our transformed international scale—one standarddeviation below the OECD mean—as our threshold of basic literacy and numeracy.52 Theinternational median of this share of students is 86 % in our sample, ranging from 18 % inPeru to 97 % in the Netherlands and Japan. As our threshold for superior performance, wetake 600 points or one standard deviation above the OECD mean.53 This level is reached byan international median of only 5 %, although it ranges from below 0.1 % in Colombia andMorocco to 18 % in Singapore and Korea and 22 % in Taiwan.54 (As shown in AppendixFig. 4, these differences represent more than simple mean displacement.)
As seen in the first three columns of Table 7, both measures of the test-score distribution aresignificantly related to economic growth, either when entered individually or jointly.55 Boththe basic-skill and the top-performing dimensions of educational performance appear sepa-rately important for growth. From the estimates in column 3, a ten percentage point increasein the share of students reaching basic literacy is associated with 0.3 percentage points higherannual growth, and a ten percentage point increase in the share of top-performing studentsis associated with 1.3 percentage points higher annual growth. However, it may be muchmore feasible to increase the basic-literacy share than to increase the top-performing shareby the same amount, as suggested by the fact that the international standard deviations of
52 The PISA 2003 science test uses the threshold of 400 points as the lowest bound for a basic level of scienceliteracy (Organisation for Economic Co-operation and Development 2004, p. 292), and on the math test thiscorresponds to the middle of the level 1 range (358 to 420 test-score points), which denotes that 15-year-oldstudents can answer questions involving familiar contexts where all relevant information is present and thequestions are clearly defined. For example, given the exchange rate between dollars and euros, a student atlevel 1 can calculate the euro-equivalent of a given number of dollars.53 A score of 600 points is near the threshold of the level 5 range of performance on the PISA 2003 math test,which denotes that 15-year-old students can develop and work with models for complex situations, identifyingconstraints and specifying assumptions; they can reflect on their answers and can formulate and communicatetheir interpretations and reasoning.54 The distributions depicted in Fig. 4 reveal that such distributional measures capture much more of theoverall distribution than a simple measure such as the standard deviation in national test scores. The standarddeviation in test scores does not enter our basic model significantly (see Castelló and Doménech 2002 forrelated analyses using measures of educational inequality based on years of schooling).55 In the joint model, the two measures are separately significant even though they are highly correlatedacross countries with a simple correlation of 0.73. The mean test score used in previous models is more highlycorrelated with the basic literacy share (r = 0.96) than with the top-performing share (r = 0.85). If the meantest score is added to column 3, the basic-literacy share becomes insignificant, but in a specification with justthe mean, mean and top-performing shares both remain significant.
123

298 J Econ Growth (2012) 17:267–321
Table 7 Rocket scientists or basic education for all?
(1) (2) (3) (4)a (5)b (6)b (7)b
Share of students reaching basic literacy 4.717 2.732 1.002 3.460 5.150 5.869(6.64) (3.61) (1.33) (3.81) (2.87) (3.33)
Share of top-performing students 19.347 12.880 11.735 8.460 4.226 −1.530(2.653) (4.35) (4.18) (2.37) (0.65) (0.22)
Share of students reaching basic literacy 0.376× initial GDP per capita (1.25)
Share of top-performing students −2.148 −1.649× Initial GDP per capita (2.11) (2.07)
Share of students reaching basic literacy 42.357 53.538× Share of top-performing students (1.48) (1.91)
No. of countries 50 50 50 45 50 50 50R2 (adj.) 0.610 0.646 0.719 0.823 0.734 0.727 0.746
Notes Dependent variable: average annual growth rate in GDP per capita, 1960–2000. Control variables: GDPper capita 1960, years of schooling 1960, and a constant. Shares are based on average test scores in math andscience, primary through end of secondary school, all years. Absolute t-statistics in parenthesesa Specification includes additional controls for openness, property rights, fertility, and tropical locationb All interacted variables are centered on zero
these two shares are 0.215 and 0.054, respectively. Thus, increasing each share by roughlyhalf a standard deviation (10 percentage points basic-literacy share and 2.5 percentage pointstop-performing share) yields a similar growth effect of roughly 0.3 percentage points.
The impact of having more top performers is only slightly reduced by introducing the mea-sures of economic institutions, fertility, and tropical geography (col. 4). On the other hand,the separate influence of basic literacy levels falls quantitatively and becomes statisticallyinsignificant in the expanded model (for the 45 countries with complete data), in line with aninterpretation where part of the effect of basic literacy comes through improved institutions(Glaeser et al. 2004).
The effect of the basic-literacy share does not vary significantly with the initial level ofdevelopment, but the effect of the top-performing share is significantly larger in countriesthat have more scope to catch up to the initially most productive countries (col. 5). Theseresults appear consistent with a mixture of the basic models of human capital and growthmentioned earlier. The accumulation of skills as a standard production factor, emphasizedby augmented neoclassical growth models (e.g., Mankiw et al. 1992), is probably best cap-tured by the basic-literacy term, which has positive effects that are similar in size acrossall countries. But, the larger growth effect of high-level skills in countries farther from thetechnological frontier is most consistent with technological diffusion models (e.g., Nelsonand Phelps 1966). From this perspective, countries need high-skilled human capital for animitation strategy, and the process of economic convergence is accelerated in countries withlarger shares of high-performing students.56 Obvious cases are East Asian countries suchas Taiwan, Singapore, and Korea that all have particularly large shares of high-performers,started from relatively low levels, and have shown outstanding growth performances, but theresults of column 5 are nonetheless robust to the inclusion of an East Asian dummy, or a fullset of regional dummies.
56 For an alternative model of imitation and innovation that emphasizes the innovation margin, see Vanden-bussche et al. (2006) and Aghion et al. (2009). These studies, however, focus just on developed countriesand miss the role of rocket scientists in the transmission of technologies to developing countries. Moreover,Hanushek and Woessmann (2011b) show that differences in basic skills are more important than differencesin advanced skills in explaining growth differences among just the OECD countries.
123

J Econ Growth (2012) 17:267–321 299
A particularly informative extension considers the interaction of the top-performing andbasic-literacy shares (col. 6 and 7). This complementarity between basic skills and top-levelskills suggests that in order to be able to implement the imitation and innovation strategiesdeveloped by scientists, countries need a workforce with at least basic skills.57
Many countries have focused on either basic skills or engineers and scientists. In termsof growth, our estimates suggest that developing basic skills and highly talented people rein-force each other. Moreover, achieving basic literacy for all may well be a precondition foridentifying those who can reach “rocket scientist” status. In other words, tournaments amonga large pool of students with basic skills may be an efficient way to obtain a large share ofhigh-performers.
9 Conclusions
A myriad of empirical estimates of cross-country growth models exist. The general criticismof these is that they provide little confidence that the models satisfactorily identify the causalimpact of their included determinants of growth. And, a related criticism is that they thencannot provide any real policy guidance.
We have focused on the role of educational achievement, or cognitive skills, in determiningeconomic growth and have taken the quest for policy guidance seriously. We have investigateda set of models that approach identification from different vantage points. Individually, asdiscussed, these approaches do require some strong maintained hypotheses, but importantlyeach of the approaches is subject to different questions and would fail for very differentreasons. While there remain other threats to identification that cannot be ruled out in oursamples, the alternative analytical perspectives narrow the range of possible opposing expla-nations for the stylized facts based on reverse causation, economic and social institutions,and cultural influences.
The clearest result here is the consistency of the alternative estimates of the cognitiveskills-growth relationship—both in terms of quantitative impacts and statistical significance.The remarkable stability of the models in the face of alternative specifications, varying sam-ples, and alternative measures of cognitive skills implies a robustness uncommon to mostcross-country growth modeling. In terms of previous questions about the fragility of anyestimates of human capital and growth, these estimates underscore a simple finding that priorresults suffered from critical measurement issues.
The stylized fact of a very strong relationship between cognitive skills and growth doesnot address all concerns. For policy advice, it is important to know whether the estimatedrelationship is causal or a mere association reflecting omitted variables, poor achievementmeasurement, or restricted models of growth. With the limited sample of nations—each withalternative political, cultural, and economic institutions—it is clearly very difficult to rule outall hypotheses about other possible reasons for the association between cognitive skills andgrowth. Our approach involves adapting common microeconometric approaches to the verydifferent circumstances of long-term economic growth. We estimate instrumental-variablemodels using institutional characteristics of each country’s school system to rule out that theskill-growth connection just reflects cultural differences across countries. Difference-in-dif-ferences approaches for immigrants from different countries on the U.S. labor market to ruleout the possibility that test scores simply reflect cultural factors or economic institutions of
57 The issue of skill complementarity in production has been addressed in explaining the pattern of earningsinequality. The U.S. analysis of Autor et al. (2006, 2008) suggests that high-skilled workers and low-skilledworkers are complements, a result that helps explain income variations across the educational spectrum.
123
300 J Econ Growth (2012) 17:267–321
the home countries. And longitudinal models to eliminate the level effects which may beinterrelated with country-specific institutions and cultures. Conclusions about the impact ofcognitive skills are remarkably consistent across the very different estimation methods.
Our analysis is reinforced by Ciccone and Papaioannou (2009) who find that countrieswith a more skilled labor force (using the Hanushek and Kimko test measures) experiencedfaster growth in skill-intensive industries during the 1980s and 1990s. This evidence, whichis derived from within-country analysis of development outcomes, strengthens our interpre-tation that more skilled people contribute to a more rapid adoption of new technologies andproduction processes—a central element of both endogenous growth models that stress inno-vation and ideas (Romer 1990) and of models of technological diffusion and growth (Nelsonand Phelps 1966). By using country and industry fixed effects, it also excludes a variety ofconcerns about endogeneity due to variations in country institutions and cultures which tendto affect sectors uniformly.
The simple conclusion from the combined evidence is that differences in cognitive skillslead to economically significant differences in economic growth. Moreover, since the testsconcentrate on the impact of schools, the evidence suggests that school policy can, if effectivein raising cognitive skills, be an important force in economic development. Thus, it wouldbe inappropriate to interpret the test differences as a simple reflection of ability or familydifferences, factors that might be very impervious to policy changes.
Finally, what are the economic rewards that are suggested by the models for improvingskills? Almost all of the alternative specifications and modeling approaches suggest that onestandard deviation higher cognitive skills of a country’s workforce is associated with approx-imately two percentage points higher annual growth in per capita GDP. This magnitude isclearly substantial, particularly when compared to regional growth rates that average between1.4 and 4.5 % over the 1960-2000 period (Appendix Table 8). On the other hand, it is implau-sible to expect a country to improve by one standard deviation—bringing, say, Mexico upto the OECD average—over any reasonable time horizon. It is plausible to think of gettingschooling improvements that would lift a country’s average by 1/4 standard deviation (25points on a PISA scale). This kind of improvement has, for example, been observed by Polandduring the past decade and by Finland over the past two to three decades. In an endogenousgrowth world, where long-run growth rates can change permanently with improved skills andhuman capital, the estimates would imply a boast in growth rates of 1/2 %. Such a changewould lead to enormous changes in the economic outcomes for a country. Hanushek andWoessmann (2011b) simulate the impact of such a change on GDP and find that the presentvalue of improvements over the next 80 years would be almost three times the value of currentGDP for the country.58 Put in terms of the present value of future GDP, this amounts to a6.2 % increase in GDP over the 80-year period.
An alternative perspective is that of the neoclassical model where there would be a periodof higher growth because of the improved skills but the economy would then return to theprior steady-state rate of growth at a higher level of income. The prior growth model estimatesprovide a means of estimating the impacts of this.59 In the same scenario as above, the presentvalue would be slightly over two times current GDP or 4.3 % of the present value of GDPover the 80 year period. The relative closeness of the endogenous and neoclassical estimatesreflects the fact that convergence is, similar to that in Mankiw et al. (1992), relatively slow
58 These simulations assume that the past growth patterns hold into the future; that base growth in per capitaGDP is 1.5 %; that the reform of schools takes 20 years to complete; that the impact depends on the averagequality of the labor force; and that future values are discounted at 3 %.59 For these simulations we rely upon the estimates in Table 1, column 9, that have the log of initial GDP percapita as an explanatory variable.
123
J Econ Growth (2012) 17:267–321 301
so that it takes a substantial time before the economy reverts to the old steady-state path.These simulations also underscore that the estimated impacts are still large even if part ofour estimates were produced by omitted variables that are correlated with cognitive skills. If,for example, the true causal impact of skill differences were only half as large as suggestedby our estimates, we would still be left with extraordinarily large policy opportunities.
By itself, finding a potential role for schools does not point to any clear policies. Indeed,that discussion would enter into a variety of controversial areas and would lead us far afield.Nonetheless, our aggregate data provide direct evidence that both providing broad basic edu-cation—education for all—and pushing significant numbers to very high achievement levelshave economic payoffs.
Appendix A: Regional data
See Table 8.
Appendix B: Measures of cognitive skills
A key element of our work is developing a measure that can equate knowledge of peopleacross countries. In many ways this is an extension of notions of human capital that havebeen developed over the past half century. But it is a specific refinement that, while importantin a variety of applications within nations, becomes a necessity when comparing differentcountries. Within a country, human capital is often proxied by quantity of schooling. This ispartly necessitated by commonly available data but partly justified on the idea that differencesin knowledge between levels of schooling are greater than those within levels of schooling.
Until recent publicity, most people were unaware of the international student testing thatcould provide direct comparisons of student knowledge across countries. In fact, interna-tional assessments of student achievement, aimed largely at math and science, were begunover four decades ago. Although national participation has been voluntary, recent expan-sions to all OECD countries and more have led to increasingly valid and reliable indicatorsof cognitive skills.
Internationally comparable student achievement tests have been conducted since the FirstInternational Mathematics Study (FIMS), which tested in 1964. The latest international stud-ies used in our analyses are the 2003 cycles of the Trends in International Mathematics andScience Study (TIMSS) and the Programme for International Student Assessment (PISA).From FIMS to the latest TIMSS and PISA, a total of 12 international student achievementtests (ISATs) were conducted.60 Although varying across the individual assessments, test-ing covers math, science, and reading for three age/grade groups: primary education (age9/10), lower secondary education (age 13 to 15), and the final year of secondary education(generally grade 12 or 13).
Given this 3×3 grade-by-subject matrix, Table 9 summarizes the specific ISATs that havebeen conducted in three periods of time: late 1960s/early 1970s (1964-72), 1980s (1982-91),and late 1990s/early 2000s (1995-2003). Several features of the emerging pattern are worth
60 In this study, we do not include the two tests conducted by the International Assessment of EducationalProgress (IAEP) in 1988 and 1991, because they used the U.S. NAEP test as their testing instrument, whichis geared to the U.S. curriculum and may thus introduce bias to the international testing. By contrast, the testsincluded here are not associated with the curriculum in any particular country, but have been devised in aninternational cooperative process between all participating countries.
123

302 J Econ Growth (2012) 17:267–321
Tabl
e8
Inco
me,
educ
atio
n,an
dgr
owth
acro
ssw
orld
regi
ons
Reg
iona
No.
coun
trie
sbG
DP
per
capi
ta19
60(U
S$)
Gro
wth
ofG
DP
per
capi
ta19
60–2
000
(%)
GD
Ppe
rca
pita
2000
(US$
)
Yea
rsof
scho
olin
g19
60
Test
scor
eA
llPe
nnW
orld
Tabl
esC
ount
ries
No.
coun
trie
scG
DP
per
capi
ta19
60(U
S$)
Asi
a11
1,89
14.
513
,571
4.0
479.
815
1,64
2
Sub-
Saha
ran
Afr
ica
32,
304
1.4
3,79
23.
336
0.0
401,
482
Mid
dle
Eas
tand
Nor
thA
fric
a8
2,59
92.
78,
415
2.7
412.
410
2,48
7
Sout
hern
Eur
ope
54,
030
3.4
14,9
435.
646
6.4
54,
030
Lat
inA
mer
ica
74,
152
1.8
8,06
34.
738
8.3
243,
276
Cen
tral
Eur
ope
78,
859
2.6
24,1
638.
350
5.3
78,
859
Nor
ther
nE
urop
e5
8,96
22.
625
,185
8.0
497.
35
8,96
2
Com
mon
wea
lthO
EC
D4
11,2
512.
126
,147
9.5
500.
34
11,2
51
Not
e:A
sia
w/o
Japa
n10
1,61
44.
512
,460
3.5
474.
714
1,42
7
aT
heco
untr
yob
serv
atio
nsco
ntai
ned
inth
eei
ghtr
egio
nsar
e:A
sia
(11)
:Chi
na,H
ong
Kon
g,In
dia,
Indo
nesi
a,Ja
pan,
Rep
.of
Kor
ea,M
alay
sia,
Phili
ppin
es,S
inga
pore
,Tai
wan
,T
haila
nd;S
ub-S
ahar
anA
fric
a(3
):G
hana
,Sou
thA
fric
a,Z
imba
bwe;
Mid
dle
Eas
tand
Nor
thA
fric
a(8
):C
ypru
s,E
gypt
,Ira
n,Is
rael
,Jor
dan,
Mor
occo
,Tun
isia
,Tur
key;
Sout
hern
Eur
ope
(5):
Gre
ece,
Ital
y,Po
rtug
al,
Rom
ania
,Sp
ain;
Lat
inA
mer
ica
(7):
Arg
entin
a,B
razi
l,C
hile
,C
olom
bia,
Mex
ico,
Peru
,U
rugu
ay;
Cen
tral
Eur
ope
(7):
Aus
tria
,B
elgi
um,
Fran
ce,I
rela
nd,N
ethe
rlan
ds,S
witz
erla
nd,U
nite
dK
ingd
om;N
orth
ern
Eur
ope
(5):
Den
mar
k,Fi
nlan
d,Ic
elan
d,N
orw
ay,S
wed
en;C
omm
onw
ealth
OE
CD
mem
bers
(4):
Aus
tral
ia,
Can
ada,
New
Zea
land
,USA
.b
Sam
ple
ofal
lcou
ntri
esby
regi
onw
ithin
tern
atio
nally
com
para
ble
data
onG
DP
that
ever
part
icip
ated
inan
inte
rnat
iona
lstu
dent
achi
evem
entt
est;
see
App
endi
xB
for
deta
ils.
cSa
mpl
eof
allc
ount
ries
inPe
nnW
orld
Tabl
esw
ithda
taon
GD
Ppe
rca
pita
in19
60by
regi
on.
Sour
ces
GD
P:ow
nca
lcul
atio
nsba
sed
onPe
nnW
orld
Tabl
es(H
esto
net
al.
(200
2));
year
sof
scho
olin
g:ow
nca
lcul
atio
nsba
sed
onC
ohen
and
Soto
(200
7);
test
scor
e:ow
nca
lcul
atio
nsba
sed
onin
tern
atio
nals
tude
ntac
hiev
emen
ttes
ts;s
eeA
ppen
dix
Bfo
rde
tails
.
123

J Econ Growth (2012) 17:267–321 303
Table 9 International tests by period, subject, and age group
Math Science Reading
1964–72
Primary FISS
Lower secondary FIMS FISS FIRS
Final secondary FIMS FISS
1982–91
Primary SISS SIRS
Lower secondary SIMS SISS SIRS
Final secondary SIMS SISS
1995–2003
Primary TIMSS TIMSS PIRLS
TIMSS 2003 TIMSS 2003
Lower secondary TIMSS TIMSS
TIMSS-Repeat TIMSS-Repeat
PISA 2000/02 PISA 2000/02
TIMSS 2003 TIMSS 2003 PISA 2000/02
PISA 2003 PISA 2003 PISA 2003
Final secondary TIMSS TIMSS
Notes For abbreviations and details, see Table 10
noting. First, math and science have been tested at all three grade levels, while reading hasnever been tested in the final grade of secondary school. Second, all subjects are available inall periods, although coverage is more extensive in math and science than in reading. Third,in each period, the lower secondary level has been tested in all three subjects; thus, thereis no primary or final-secondary study that would add a subject not already tested at lowersecondary in the period. Fourth, each cell available in 1964-91 has at least one counterpartin 1995-2003.
Table 10 provides additional detail on each ISAT. A total of 77 countries have participatedin at least one of the ISATs in math or science, but several of the countries have participatedat only one or a few points in time. Even within the same assessment, countries do not alwaysparticipate at all grade levels. The largest number of countries tends to have participated atthe lower secondary level.
To obtain a common measure of cognitive skills, we want to draw on as much inter-nationally comparable information as possible. This raises the issue whether the differentISATs with their different participating countries, student samples, and perspectives on whatshould be tested (see Neidorf et al. 2006) are measuring a common dimension of cognitiveskills. For example, the TIMSS tests are related to elements of the school curricula commonto participating countries, while the PISA tests are designed to be applied assessments ofreal-world problems, irrespective of specific curricula. However, the fact is that the TIMSStests with their curricular focus and the PISA tests with their applied focus are highly cor-related at the country level. For example, the correlation between the TIMSS 2003 tests of8th graders and the PISA 2003 tests of 15-year-olds across the 19 countries participatingin both is as high as 0.87 in math and 0.97 in science. It is also 0.86 in both math andscience across the 21 countries participating both in the TIMSS 1999 tests and the PISA
123

304 J Econ Growth (2012) 17:267–321
Tabl
e10
The
inte
rnat
iona
lstu
dent
achi
evem
entt
ests
Abb
revi
atio
nSt
udy
Yea
rSu
bjec
tA
gea,
bC
ount
ries
cO
rgan
izat
iond
Scal
ee
1FI
MS
Firs
tInt
erna
tiona
lM
athe
mat
ics
Stud
y19
64M
ath
13,F
S11
IEA
PC
2FI
SSFi
rstI
nter
natio
nalS
cien
ceSt
udy
1970
–71
Scie
nce
10,1
4,FS
14,1
6,16
IEA
PC
3FI
RS
Firs
tInt
erna
tiona
lRea
ding
Stud
y19
70–7
2R
eadi
ng13
12IE
APC
4SI
MS
Seco
ndIn
tern
atio
nal
Mat
hem
atic
sSt
udy
1980
–82
Mat
h13
,FS
17,1
2IE
APC
5SI
SSSe
cond
Inte
rnat
iona
lSci
ence
Stud
y19
83–8
4Sc
ienc
e10
,13,
FS15
,17,
13IE
APC
6SI
RS
Seco
ndIn
tern
atio
nalR
eadi
ngSt
udy
1990
–91
Rea
ding
9,13
26,3
0IE
AIR
T
7T
IMSS
Thi
rdIn
tern
atio
nal
Mat
hem
atic
san
dSc
ienc
eSt
udy
1994
–95
Mat
h/Sc
ienc
e9(
3+4)
,13(
7+8)
,FS
25,3
9,21
IEA
IRT
8T
IMSS
-R
epea
tT
IMSS
-Rep
eat
1999
Mat
h/Sc
ienc
e13
(8)
38IE
AIR
T
9PI
SA20
00/0
2Pr
ogra
mm
efo
rIn
tern
atio
nal
Stud
entA
sses
smen
t20
00+
02R
eadi
ng/M
ath/
Scie
nce
1531
+10
OE
CD
IRT
10PI
RL
SPr
ogre
ssin
Inte
rnat
iona
lR
eadi
ngL
itera
cySt
udy
2001
Rea
ding
9(4)
34IE
AIR
T
11T
IMSS
2003
Tre
nds
inIn
tern
atio
nal
Mat
hem
atic
san
dSc
ienc
eSt
udy
2003
Mat
h/Sc
ienc
e9(
4),1
3(8)
24,4
5IE
AIR
T
12PI
SA20
03Pr
ogra
mm
efo
rIn
tern
atio
nal
Stud
entA
sses
smen
t20
03R
eadi
ng/M
ath/
Scie
nce
1540
OE
CD
IRT
aG
rade
inpa
rent
hese
sw
here
grad
ele
velw
asta
rget
popu
latio
n.b
FS=
final
year
ofse
cond
ary
educ
atio
n(d
iffe
rsac
ross
coun
trie
s).
cN
umbe
rof
part
icip
atin
gco
untr
ies
that
yiel
ded
inte
rnat
iona
llyco
mpa
rabl
epe
rfor
man
ceda
ta.
dC
ondu
ctin
gor
gani
zatio
n:In
tern
atio
nalA
ssoc
iatio
nfo
rthe
Eva
luat
ion
ofE
duca
tiona
lAch
ieve
men
t(IE
A);
Org
anis
atio
nfo
rEco
nom
icC
o-op
erat
ion
and
Dev
elop
men
t(O
EC
D).
eTe
stsc
ale:
perc
ent-
corr
ectf
orm
al(P
C);
item
-res
pons
e-th
eory
profi
cien
cysc
ale
(IR
T).
123

J Econ Growth (2012) 17:267–321 305
2000/02 tests. Thus, ISATs with very different foci and perspectives tend, nonetheless, tobe highly related, lending support to our approach of aggregating different ISATs for eachcountry.
The general idea behind our approach to aggregation is that of empirical calibration. Werely upon information about the overall distribution of scores on each ISAT to comparenational responses. This contrasts with the psychometric approach to scaling that calibratestests through common elements on each test. In reality, the international testing situations areseparate events with no general attempt to provide common scaling across tests and acrossthe full time period.
The fact that the scales of their test-score results are not directly equated across tests isa major drawback in comparative uses of the various ISATs. They do not use the same testquestions; nor do they even use the same technique and scale of mapping answers into testscores.61 The early tests mainly used aggregate scores in “percent correct” format, but withquestions of varying difficulty in the different tests, these scores will not be comparable acrosstests. The later tests use a more sophisticated scale, constructed using Item Response Theory(IRT). Among other things, IRT weights different questions by their revealed difficulty andthen maps answers onto a pre-set scale set to yield a given international mean and standarddeviation among the participating countries. However, the questions on which the mappingis based are not the same in the different tests. Even more, the set of participating countriesvaries considerably across tests, making the separately developed scales incomparable acrossISATs.
Therefore, to compare performance on the ISATs across tests and thus over time, we haveto project the performance of different countries on different tests onto a common metric.For that, we have to develop a common metric both for the level and for the variation of testperformance.
Comparable level. To make the level of ISATs comparable, we need information on testperformance that is comparable over time. Such information is available in the United Statesin the form of the National Assessment of Educational Progress (NAEP), which tests themath, science, and reading performance of nationally representative samples of 9-, 13-, and17-year-old U.S. students in an intertemporally comparable way since 1969. This is the onlyavailable information on educational performance that is consistently available for compar-isons over time. The United States is also the only country that participated in every ISAT.Given the time-series evidence on the performance of U.S. students, we can thus scale thelevel of each ISAT relative to the known intertemporally comparable test performance ofthe United States. Figure 3 shows the available NAEP results in the three subjects and agegroups.62 Despite some notable changes, the performance of U.S. students has been relativelyflat over the period 1969-1999.
We start by calculating the U.S. performance difference between 1999 and any earlierpoint in time and express it in standard deviations (s.d.) of the international PISA 2000study:
UU Sa,s,t =
(
N AE PU Sa,s,t − N AE PU S
a,s,1999
) SDU S,P I S As
SDU S,N AE Pa,s
(A1)
61 Recent testing in both TIMSS and PISA has involved overlapping test items that permit test calibration,but these do not provide any benchmarks across the two testing regimes or links with earlier testing.62 Note that changes in NAEP testing make it difficult to use this methodology for the more recent PISA andTIMSS assessments. For example, the science tests were revised in 2009, and the new scale that was employedmakes the data incomparable to prior years. On the other hand, recent PISA and TIMSS assessments havebeen designed to provide comparability over time of the subject surveys.
123

306 J Econ Growth (2012) 17:267–321
200
220
240
260
280
300
320
1969
1971
1973
1975
1977
1979
1981
1983
1985
1987
1989
1991
1993
1995
1997
1999
read-9
read-13
read-17
math-9
math-13
math-17
science-9
science-13
science-17
Fig. 3 Student Achievement in the United States over Time: The National Assessment of Educational Progress(NAEP) Source: U.S. Department of Education, Institute of Education Sciences (2008)
where U is the standardized performance difference of U.S. students at age a in subject sat time t relative to 1999, NAEP is the age-, subject-, and time-specific NAEP test score,SDU S,P I S A is the subject-specific s.d. of U.S. students on the PISA test, and SDU S,N AE P isthe age- and subject-specific s.d. of the U.S. NAEP test.63 NAEP scores are available at 2–4year intervals over the period; values for non-NAEP years are obtained by linear interpolationbetween available years.
This alone does not yet yield a common scale for all the countries on the different tests.While we know for each participating country whether it performed above or below therespective U.S. performance on each specific test, we need to make the international varia-tion in test scores comparable across the different ISATs to determine “how much” above orbelow.
Comparable variation. Developing a common metric for the variation of test scores inthe different ISATs is harder to achieve than for the level. There is no explicit external infor-mation available on trends in the cross-country performance variation, and the diversity oforiginal tests and participating countries precludes a direct comparison across tests. One wayto achieve comparability, though, would be to have a group of countries across which it isreasonable to assume relative constancy in the size of the cross-country variation in test scoresand whose members participated in sufficient number in the different tests. This group couldonly include relatively stable countries with relatively stable education systems over time,which should not have experienced major changes in overall enrollment across the ISATs.
Thus, we suggest two criteria for a group of countries to serve as a standardization bench-mark for performance variation over time. First, the countries have been member states of therelatively homogenous and economically advanced group of OECD countries in the whole
63 The s.d. of the NAEP tests in reading for 1984-1996 and in math and science in 1977/78-1996 are reportedin Department of Education, Institute of Education Sciences (2008). Since no s.d. information is availablefor the earlier and the 1999 NAEP tests, and since the available s.d. are relatively stable over time, we take asimple mean of the available s.d. in each subject at each age level over time. PISA tested only 15-year-olds,but has the same three subjects as the NAEP test.
123

J Econ Growth (2012) 17:267–321 307
period of ISAT observations, that is, since 1964. Second, the countries should have had asubstantial enrollment in secondary education already in 1964. Given data constraints, weimplement this by dropping all countries where more than half of the 2001 population aged45-54 (the cohort roughly in secondary school in the first ISAT) did not attain upper second-ary education (OECD 2003a). There are 13 countries that meet both of these measures ofstability, which we term the “OECD Standardization Group” (OSG) of countries.64
Under the assumption that the cross-country variation among the OSG countries did notvary substantially since 1964, we can use the OSG countries to develop a comparable scalefor the variation on the different ISATs. We do so by projecting the s.d. among those of theOSG countries that participated in any particular ISAT from the subject-specific PISA testonto the particular ISAT. That is, we transform the original test score O of country i (specificfor each age a and subject s) at time t into a transformed test score X according to:
Xia,s,t =
(
Oia,s,t − O O SG
a,s,t
) SDO SGs,P I S A
SDO SGa,s,t
(A2)
The test score X has the following distributional characteristics for each ISAT. First, ithas a mean of zero among the OSG (attained by subtracting the OSG mean O O SG from eachcountry’s original test score). Second, it has a between-country s.d. among the OSG that is thesame as the s.d. of the very same countries on the PISA test in the specific subject (attainedby dividing through the s.d. among the OSG countries in the specific test and multiplying bythe s.d. of these same countries in the relevant PISA test). In effect, this rescaled test scorenow has a metric whose variation is comparable across tests.
Performance on a common metric. Finally, we use the time-series evidence on educa-tional performance in the U.S. derived above to put a common level to the intertemporallycomparable metric for the different ISATs. This is achieved in the standardized test score I :
I ia,s,t = Xi
a,s,t − XU Sa,s,t + OU S
s,P I S A + UU Sa,s,t (A3)
which adjusts the variation-adjusted test score X so that the U.S. performance level on eachtest equals the U.S. performance on the PISA test in the specific subject plus the age- andsubject-specific adjustment factor U based on NAEP as derived in Eq. (A1) above.
Equation (A3) yields measures of the performance of the participating countries in eachISAT on a common scale that is comparable across ISATs. In effect, the internationally andintertemporally standardized test score I projects the PISA scale onto all other tests.
While we are reasonably confident about the comparisons of the standardized scores withinthe OECD countries which are fully tested in recent years, we are less certain about countriesthat are far from the measured OECD performance. In particular, countries far off the scale ofthe original test scores—e.g., two s.d. below the mean—may not be well represented becausethe tests may be too hard and thus not very informative for them. Our linear transformationsare susceptible to considerable noise for these countries.
Our main measure of cognitive skills is a simple average of all standardized math andscience test scores of the ISATs in which a country participated. Table 11 reports the basic
64 The OSG countries are: Austria, Belgium, Canada, Denmark, France, Germany, Iceland, Japan, Norway,Sweden, Switzerland, the United Kingdom, and the United States. The Netherlands also meets both criteria,but does not have internationally comparable PISA 2000 data which we require for our standardization.
123

308 J Econ Growth (2012) 17:267–321
Table 11 International data on cognitive skills
Code Country Growth samplea Cognitiveb Lowsecc Basicd Tope
ALB Albania 0 3.785 3.785 0.424 0.013
ARG Argentina 1 3.920 3.920 0.492 0.027
ARM Armenia 0 4.429 4.490 0.745 0.008
AUS Australia 1 5.094 5.138 0.938 0.112
AUT Austria 1 5.089 5.090 0.931 0.097
BEL Belgium 1 5.041 5.072 0.931 0.094
BGR Bulgaria 0 4.789 4.789 0.765 0.083
BHR Bahrain 0 4.114 4.114 0.608 0.003
BRA Brazil 1 3.638 3.638 0.338 0.011
BWA Botswana 0 3.575 3.575 0.374 0.000
CAN Canada 1 5.038 5.125 0.948 0.083
CHE Switzerland 1 5.142 5.102 0.919 0.134
CHL Chile 1 4.049 3.945 0.625 0.013
CHN China 1 4.939 4.939 0.935 0.083
COL Colombia 1 4.152 4.152 0.644 0.000
CYP Cyprus 1 4.542 4.413 0.825 0.011
CZE Czech Republic 0 5.108 5.177 0.931 0.122
DNK Denmark 1 4.962 4.869 0.888 0.088
EGY Egypt 1 4.030 4.030 0.577 0.010
ESP Spain 1 4.829 4.829 0.859 0.079
EST Estonia 0 5.192 5.192 0.973 0.095
FIN Finland 1 5.126 5.173 0.958 0.124
FRA France 1 5.040 4.972 0.926 0.085
GBR United Kingdom 1 4.950 4.995 0.929 0.088
GER Germany 0 4.956 4.959 0.906 0.105
GHA Ghana 1 3.603 3.252 0.403 0.010
GRC Greece 1 4.608 4.618 0.798 0.042
HKG Hong Kong 1 5.195 5.265 0.944 0.123
HUN Hungary 0 5.045 5.134 0.941 0.103
IDN Indonesia 1 3.880 3.880 0.467 0.008
IND India 1 4.281 4.165 0.922 0.013
IRL Ireland 1 4.995 5.040 0.914 0.094
IRN Iran 1 4.219 4.262 0.727 0.006
ISL Iceland 1 4.936 4.945 0.908 0.074
ISR Israel 1 4.686 4.660 0.826 0.053
ITA Italy 1 4.758 4.693 0.875 0.054
JOR Jordan 1 4.264 4.264 0.662 0.044
JPN Japan 1 5.310 5.398 0.967 0.168
KOR Korea, Republic of 1 5.338 5.401 0.962 0.178
KWT Kuwait 0 4.046 4.223 0.575 0.000
LBN Lebanon 0 3.950 3.950 0.595 0.002
123

J Econ Growth (2012) 17:267–321 309
Table 11 continued
Code Country Growth samplea Cognitiveb Lowsecc basicd Tope
LIE Liechtenstein 0 5.128 5.128 0.860 0.198
LTU Lithuania 0 4.779 4.694 0.891 0.030
LUX Luxembourg 0 4.641 4.641 0.776 0.067
LVA Latvia 0 4.803 4.779 0.869 0.050
MAC Macao-China 0 5.260 5.260 0.919 0.204
MAR Morocco 1 3.327 3.243 0.344 0.001
MDA Moldova 0 4.530 4.419 0.787 0.029
MEX Mexico 1 3.998 3.998 0.489 0.009
MKD Macedonia 0 4.151 4.151 0.609 0.028
MYS Malaysia 1 4.838 4.838 0.864 0.065
NGA Nigeria 0 4.154 4.163 0.671 0.001
NLD Netherlands 1 5.115 5.149 0.965 0.092
NOR Norway 1 4.830 4.855 0.894 0.056
NZL New Zealand 1 4.978 5.009 0.910 0.106
PER Peru 1 3.125 3.125 0.182 0.002
PHL Philippines 1 3.647 3.502 0.485 0.006
POL Poland 0 4.846 4.861 0.838 0.099
PRT Portugal 1 4.564 4.592 0.803 0.032
PSE Palestine 0 4.062 4.062 0.571 0.008
ROM Romania 1 4.562 4.562 0.780 0.046
RUS Russian Federation 0 4.922 4.906 0.884 0.081
SAU Saudi Arabia 0 3.663 3.663 0.331 0.000
SGP Singapore 1 5.330 5.512 0.945 0.177
SRB Serbia 0 4.447 4.447 0.718 0.024
SVK Slovak Rep. 0 5.052 5.052 0.906 0.112
SVN Slovenia 0 4.993 5.076 0.939 0.061
SWE Sweden 1 5.013 4.948 0.939 0.088
SWZ Swaziland 0 4.398 4.398 0.801 0.004
THA Thailand 1 4.565 4.556 0.851 0.019
TUN Tunisia 1 3.795 3.889 0.458 0.003
TUR Turkey 1 4.128 4.128 0.582 0.039
TWN Taiwan (Chinese Taipei) 1 5.452 5.599 0.958 0.219
URY Uruguay 1 4.300 4.300 0.615 0.049
USA United States 1 4.903 4.911 0.918 0.073
ZAF South Africa 1 3.089 2.683 0.353 0.005
ZWE Zimbabwe 1 4.107 4.107 0.684 0.010
Notes A data file is available at www.cesifo.de/woessmann#data or http://hanushek.stanford.edu/downloadaIndicator of whether country is in the main sample of 50 countries contained in the growth regressions, forwhich internationally comparable GDP data are availablebAverage test score in math and science, primary through end of secondary school, all years (scaled to PISAscale divided by 100)cAverage test score in math and science, only lower secondary, all years (scaled to PISA scale divided by 100)dShare of students reaching basic literacy (based on average test scores in math and science, primary throughend of secondary school, all years)eShare of top-performing students (based on average test scores in math and science, primary through end ofsecondary school, all years)
123

310 J Econ Growth (2012) 17:267–321
combined measure for the 77 countries that have ever participated in any of the math andscience tests.65 The sample for our growth regressions contains 50 of these countries.66
Distributional measures. Apart from the mean scores, we also analyze the distribution oftest scores in each country by accessing the microdata of all ISATs.67 The kernel densityplots for math achievement on the 2003 PISA in Fig. 4 show that countries vary significantlyin their patterns of test-score distributions. The depicted selected examples of developedcountries reveals that it is possible to achieve relatively high median performance both witha relatively equal spread (Finland) and with a relatively unequal spread (Belgium) in thetest scores at the student level. The same is true for countries with low average performancesuch as the depicted developing countries, where Brazil has a long right tail in contrast toIndonesia which shows a much greater density around its median.
To depict both ends of the distribution, we aim to calculate both the share of studentsreaching a basic level of literacy in the different subjects equivalent to 400 test-score pointson the PISA scale (one student-level s.d. below the OECD mean) and the share of studentsreaching a top performance level equivalent to 600 test-score points on the PISA scale.
To do so, we use the above transformation to translate these two thresholds into the spe-cific metric of each ISAT. Using the microdata of each ISAT, we then calculate the share ofstudents in each country reaching the thresholds in the overall distribution of the ISAT. Theinformation from the different ISATs is again combined by taking a simple average of theshares across tests.
Trends over time. The standardized performance information over a long period of timealso allows us to derive longitudinal patterns of test scores for countries that participatedboth in early and recent ISATs. Given the amplification of noise in first-differenced data andthe limitations of our rescaling method for poorly performing countries mentioned above,we perform the trend estimation only for the sample of 15 OECD countries that participatedboth in an ISAT before 1985 (i.e., on FIMS, FISS, FIRS, SIMS, or SISS) and up to 2003,spanning a period of nearly 20 years. (Twelve countries participated in a test before 1971,spanning a period of over 30 years.)
To estimate the trend in test performance, for each country we regress performance on thedifferent ISATs, expressed on the standardized test metric developed above, on dummies forthe subjects, dummies for the age groups, and on the year the test was conducted. The unitof observation in these country-specific regressions is each subject-by-age-by-year occasionof an ISAT, using all available tests, subjects, and age groups (see Appendix Table 10). Toaccount for heteroscedasticity and for the fact that the signal-to-noise ratio will be larger thesmaller the number of OSG countries that participated in a test, we weight the regression by
65 The sources of the underlying international test data are: Beaton et al. (1996a, 1996b), Lee and Barro(2001), Martin et al. (1997, 2000, 2004), Mullis et al. (1997, 1998, 2000, 2003, 2004), OECD (2001, 2003b,2004), and own calculations based on the microdata of the early tests, and own calculations based on themicrodata of the early tests.66 Twenty-five of the total of 77 countries with cognitive-skill data are not included in the growth database dueto lack of data on economic output or because they drop out of the sample for a standard exclusion criterion ingrowth analyses (15 former communist countries, 3 countries for which oil production is the dominant indus-try, 2 small countries, 3 newly created countries, 2 further countries lacking early output data). In addition,two strong outliers are excluded in most models (see above). There are four countries with cognitive-skill datathat have a few years of economic data missing at the beginning or end of the 1960–2000 period. Data forTunisia start in 1961, and data for Cyprus (1996), Singapore (1996), and Taiwan (1998) end slightly earlierthan in 2000. These countries were included in the growth regressions by estimating average annual growthover the available 36-to-39-year period.67 Unfortunately, the microdata from the FIMS test do not seem to be available in an accessible way anymore, so that the distributional measures only draw on the remaining ISATs.
123

J Econ Growth (2012) 17:267–321 311
0.0
01.0
02.0
03.0
04
200 400 600 800
0.0
01.0
02.0
03.0
04
200 400 600 800
0.0
01.0
02.0
03.0
04.0
05
200 400 600 800
0.0
01.0
02.0
03.0
04
200 400 600 800
0.0
01.0
02.0
03.0
04
200 400 600 800
0.0
02.0
04.0
06
200 400 600 800
0.0
01.0
02.0
03.0
04.0
05
200 400 600 800
0.0
01.0
02.0
03.0
04
200 400 600 800
Mean: 529Median: 537
Mean: 503Median: 510
Mean: 544Median: 543
Mean: 483Median: 483
Mean: 356Median: 348
Mean: 360Median: 354
Mean: 417Median: 409
Mean: 422Median: 423
BEL
FIN
BRA
THA
DEU
USA
IDN
URY
Fig. 4 Selected Examples of the Distribution of Student Performance. Notes: Kernel densities of studentperformance on the PISA 2003 math test. Bold solid line: specified country; thin dotted line: OECD countries.Codes: Belgium (BEL), Germany (DEU), Finland (FIN), United States of America (USA), Brazil (BRA),Indonesia (IDN), Thailand (THA), Uruguay (URY)
the square root of the number of OSG countries participating in each test. The coefficienton the year variable provides us with the time trend that we are interested in. The patternscaptured by these country-specific regressions are shown in Fig. 5 that simply extrapolatesscores for the range of 1975-2000 with scores anchored by the PISA 2000 score.
One possible worry with combining the different tests into a single measure and with esti-mating performance changes over time is that enrollment shares have changed to differentextents over time, especially at the secondary level. To test the extent to which this affects our
123

312 J Econ Growth (2012) 17:267–321
Australia
Australia
Belgium
BelgiumCanada
Canada
Finland
Finland
France
FranceUK
UK
GermanyGermany
Italy
Italy
JapanJapan
Korea
KoreaNetherlands
Netherlands
N. Zealand
N. Zealand
Norway
Norway
Sweden
Sweden
USA
USA
460
480
500
520
540
560
1975 2000
Fig. 5 Trends in Test Scores Notes: Depiction based on PISA 2000 performance and a backward inductionbased on the coefficient on a time variable from a regression of all available international test scores (by year,age group, and subject) on the time variable and dummies for age group and subject. See Appendix B fordetails
cognitive-skill measures, we calculated the correlation between our measure of trend in testscores and changes in enrollment rates. It turns out that the two are orthogonal to each other,diluting worries that differential changes in enrollment bias the results reported in this paper.68
Comparisons with Cognitive Skills Measure of Hanushek and Kimko (2000). The skillmeasures developed in Hanushek and Kimko (2000) fail to account for the unequal vari-ances of the tests over time, but instead assume a constant variance.69 Our measure is highlycorrelated with the Hanushek-Kimko measure (r = 0.83), but the important question isthe relationship with growth. For the 30 countries in common from the two data sets, weestimate the growth models with the alternative measures of cognitive skills. While bothversions of the test-score measure enter the model strongly and significantly, statistical pre-cision is considerably higher with the new measure (t = 7.43 vs. t = 4.02), as is theexplanatory power of the model (adj. R2 = 0.80 vs. adj. R2 = 0.61). The content of signal
68 As noted previously, direct estimation of the impacts of school selectivity and of test exclusions on ourgrowth models confirm that potential testing problems do not bias our growth estimation (Hanushek andWoessmann 2011c).69 Hanushek and Kimko (2000) actually have alternative measures. Two of their three measures assume aconstant mean for all of the tests, similar to what is also done in Lee and Barro (2001).
123

J Econ Growth (2012) 17:267–321 313
relative to noise in the test-score measure thus seems to be considerably raised in the newmeasure.
Data download
The data by country may be downloaded in Excel or Stata formats at:http://hanushek.stanford.edu/download or www.cesifo.de/woessmann#data.
Data sources
Beaton, Albert E., Ina V.S. Mullis, Michael O. Martin, Eugenio J. Gonzalez, Dana L. Kelly,and Teresa A. Smith. 1996. Mathematics Achievement in the Middle School Years: IEA’sThird International Mathematics and Science Study (TIMSS). Chestnut Hill, MA: BostonCollege.
Beaton, Albert E., Michael O. Martin, Ina V.S. Mullis, Eugenio J. Gonzalez, Teresa A.Smith, and Dana L. Kelly. 1996. Science Achievement in the Middle School Years: IEA’sThird International Mathematics and Science Study (TIMSS). Chestnut Hill, MA: BostonCollege.
Lee, Jong-Wha, and Robert J. Barro. 2001. Schooling Quality in a Cross-Section of Coun-tries. Economica 68, no. 272: 465-488.
Martin, Michael O., Ina V.S. Mullis, Albert E. Beaton, Eugenio J. Gonzalez, Teresa A.Smith, and Dana L. Kelly. 1997. Science Achievement in the Primary School Years: IEA’sThird International Mathematics and Science Study (TIMSS). Chestnut Hill, MA: BostonCollege.
Martin, Michael O., Ina V.S. Mullis, Eugenio J. Gonzalez, Kelvin D. Gregory, TeresaA. Smith, Steven J. Chrostowski, Robert A. Garden, and Kathleen M. O’Connor. 2000.TIMSS 1999 International Science Report:Findings from IEA’s Repeat of the Third Inter-national Mathematics and Science Study at the Eighth Grade. Chestnut Hill, MA: BostonCollege.
Martin, Michael O., Ina V.S. Mullis, Eugenio J. Gonzalez, and Steven J. Chrostowski.2004. TIMSS 2003 International Science Report: Findings from IEA’s Trends in Interna-tional Mathematics and Science Study at the Fourth and Eighth Grades. Chestnut Hill, MA:Boston College.
Mullis, Ina V.S., Michael O. Martin, Albert E. Beaton, Eugenio J. Gonzalez, Dana L.Kelly, and Teresa A. Smith. 1997. Mathematics Achievement in the Primary School Years:IEA’s Third International Mathematics and Science Study (TIMSS). Chestnut Hill, MA: Bos-ton College.
—. 1998. Mathematics and Science Achievement in the Final Year of Secondary School:IEA’s Third International Mathematics and Science Study (TIMSS). Chestnut Hill, MA: Bos-ton College.
123

314 J Econ Growth (2012) 17:267–321
Mullis, Ina V.S., Michael O. Martin, Eugenio J. Gonzalez, Kelvin D. Gregory, Robert A.Garden, Kathleen M. O’Connor, Steven J. Chrostowski, and Teresa A. Smith. 2000. TIMSS1999 International Mathematics Report: Findings from IEA’s Repeat of the Third Inter-national Mathematics and Science Study at the Eighth Grade. Chestnut Hill, MA: BostonCollege.
Mullis, Ina V.S., Michael O. Martin, Eugenio J. Gonzalez, and Ann M. Kennedy. 2003.PIRLS 2001 International Report: IEA’s Study of Reading Literacy Achievement in Pri-mary School in 35 Countries. Chestnut Hill, MA: International Study Center, Boston Col-lege.
Mullis, Ina V.S., Michael O. Martin, Eugenio J. Gonzalez, and Steven J. Chrostowski.2004. TIMSS 2003 International Mathematics Report: Findings from IEA’s Trends in Inter-national Mathematics and Science Study at the Fourth and Eighth Grades. Chestnut Hill,MA: Boston College.
Organisation for Economic Co-operation and Development (OECD). 2001. Knowledgeand Skills for Life: First Results from the OECD Programme for International Student Assess-ment (PISA) 2000. Paris: OECD.
—. 2003a. Education at a Glance: OECD Indicators 2003. Paris: OECD.
—. 2003b. Literacy Skills for the World of Tomorrow: Further Results from PISA 2000.Paris: OECD.
—. 2004. Learning for Tomorrow’s World: First Results from PISA 2003. Paris: OECD.
U.S. Department of Education, Institute of Education Sciences. 2008. National Assess-ment of Educational Progress–The Nation’s Report Card. Website:http://nces.ed.gov/nationsreportcard/aboutnaep.asp.
Appendix C: Descriptive statistics
See Appendix Tables 12, 13, 14 and Figure 6.
Table 12 Descriptive statistics for the growth models
Observations Mean Std. Dev. Min Max
Average annual growth rate inGDP per capita 1960–2000
50 2.903 1.387 0.967 6.871
Cognitive skills (all grades) 50 4.546 0.611 3.089 5.452Cognitive skills (lower secondary) 50 4.535 0.671 2.683 5.599Share of students reaching basic literacy 50 0.761 0.215 0.182 0.967Share of top-performing students 50 0.062 0.054 0.000 0.219GDP per capita 1960 50 4,991 3,676 685 14,877Years of schooling 1960 50 5.447 2.877 0.611 10.963Years of schooling, average 1960–2000 50 7.425 2.654 2.098 11.845
123
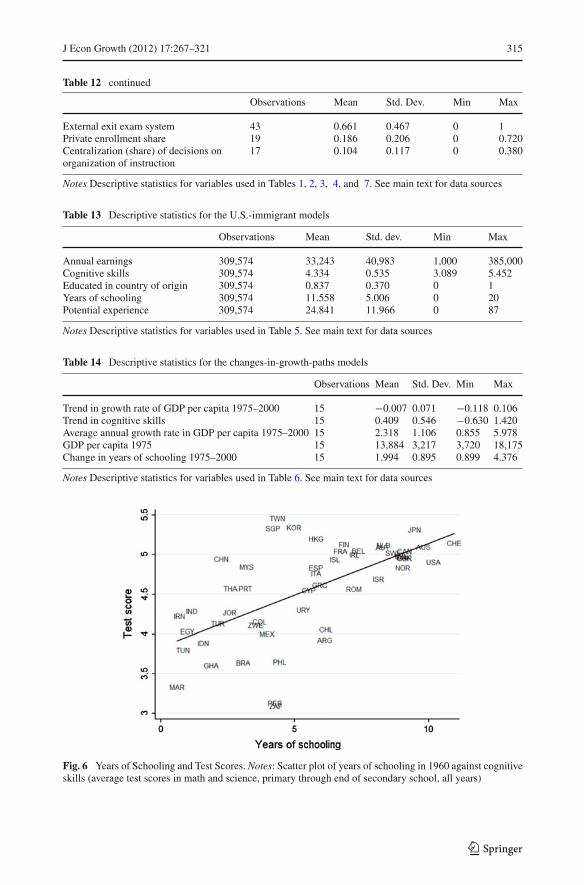
J Econ Growth (2012) 17:267–321 315
Table 12 continued
Observations Mean Std. Dev. Min Max
External exit exam system 43 0.661 0.467 0 1Private enrollment share 19 0.186 0.206 0 0.720Centralization (share) of decisions on 17 0.104 0.117 0 0.380organization of instruction
Notes Descriptive statistics for variables used in Tables 1, 2, 3, 4, and 7. See main text for data sources
Table 13 Descriptive statistics for the U.S.-immigrant models
Observations Mean Std. dev. Min Max
Annual earnings 309,574 33,243 40,983 1,000 385,000Cognitive skills 309,574 4.334 0.535 3.089 5.452Educated in country of origin 309,574 0.837 0.370 0 1Years of schooling 309,574 11.558 5.006 0 20Potential experience 309,574 24.841 11.966 0 87
Notes Descriptive statistics for variables used in Table 5. See main text for data sources
Table 14 Descriptive statistics for the changes-in-growth-paths models
Observations Mean Std. Dev. Min Max
Trend in growth rate of GDP per capita 1975–2000 15 −0.007 0.071 −0.118 0.106Trend in cognitive skills 15 0.409 0.546 −0.630 1.420Average annual growth rate in GDP per capita 1975–2000 15 2.318 1.106 0.855 5.978GDP per capita 1975 15 13,884 3,217 3,720 18,175Change in years of schooling 1975–2000 15 1.994 0.895 0.899 4.376
Notes Descriptive statistics for variables used in Table 6. See main text for data sources
Fig. 6 Years of Schooling and Test Scores. Notes: Scatter plot of years of schooling in 1960 against cognitiveskills (average test scores in math and science, primary through end of secondary school, all years)
123

316 J Econ Growth (2012) 17:267–321
Appendix D: Impact of data updates and expansion of observed growth period
The analysis in this paper concentrates on measurement issues surrounding cognitive skills.But these are not the only measurement issues that have been raised in the context of empiricalgrowth analysis. This appendix provides an analysis of the impact of other data measurementissues in the area of data on school attainment and on economic growth. It also considers themost recent wave of cognitive skills data. These updates and revisions do not substantiallychange the results presented in our main analyses.
The measurement of school attainment has been discussed at various times. Barro and Lee(1993) developed the initial international database for school attainment. This was criticizedby Cohen and Soto (2007), who produced the dataset that is the basis of our estimation.Most recently, Barro and Lee (2010) have produced a new dataset of their own. Using thelatest series of school attainment developed by Barro and Lee (2010) (data version 1.0,03/10, accessed on May 17, 2010) has no effect on the estimates of the impact of cognitiveskills and only slightly increases the attainment coefficient. As shown in Table 15, column2, the estimated cognitive skills coefficient is 1.92, as opposed to 1.98 in our base estimates(column 1).
A second area of concern is the underlying economic data themselves. It has recentlybeen argued that changes in the Penn World Tables (PWT), particularly the 6.2 revision, leadto significant alternations in standard estimates of growth models (Ciccone and Jarocinski(2010); Appleton et al. (2011)).70 To assess the impact of these data, we compare the mostrecent version of the PWT (version 7.0, released on June 3, 2011; Heston et al. (2011)) to ourestimates based on version 6.1. As is apparent from column 3, the estimate on cognitive skillsis hardly affected when estimating the same model with the same growth period (1960-2000)using the new economic data; in fact, the point estimate is slightly higher.
The new version of the PWT allows us to expand the growth period to 2007. Again, resultsare strongly confirmed in this 47-year growth period (column 4), with the point estimate closerto the original estimate again. We use 2007 as the endpoint of the considered growth periodrather than 2009 (which is the latest year available in the new PWT) because we do not wantthe long-run growth analysis being affected by the global recession that started at the endof 2008 (as clearly visible in the PWT data, where average growth rates in our sample dropfrom around 4 % in the preceding years to 1.6 in 2007-2008 and to -2.5 in 2008-2009). Still,our result on cognitive skills is confirmed also in the 1960-2009 growth period (not shown),with a point estimate of 1.76 (t = 7.32).
The expanded PWT data also allow us to perform an analysis where the observation periodof test scores strictly pre-dates the observation period of economic growth. For a sample of25 countries, we have test-score data observed between 1964 and 1984. Column 5 uses thesetest-score data to predict economic growth in 1985-2007. Again, the significant effect ofcognitive skills on growth is confirmed, with a point estimate substantially larger than in thebase model. (Again, results are very similar for the growth period expanded to 2009.)
While we are reluctant to perform analyses on shorter growth periods because these areprone to country-specific shocks and business-cycle fluctuations, we can expand our sampleof countries with test scores pre-dating the observed growth period to 37 countries when weuse the tests conducted until 1995 to predict growth in 1995-2009 or in 2000-2009. Again,results confirm a strong estimate on cognitive skills with a point estimate larger than in
70 As noted in section 7 above, calculation of growth rates relying on national account data rather than onpurchasing power parity incomes does not significantly affect our estimates.
123

J Econ Growth (2012) 17:267–321 317
Tabl
e15
Gro
wth
regr
essi
ons
with
upda
ted
data
seri
eson
scho
olat
tain
men
tand
econ
omic
grow
th
PWT
vers
ion
6.1
6.1
7.0
7.0
7.0
Yea
rsof
scho
olin
gda
taC
ohen
and
Soto
(200
7)B
arro
and
Lee
(201
0)B
arro
and
Lee
(201
0)B
arro
and
Lee
(201
0)B
arro
and
Lee
(201
0)G
row
thpe
riod
1960
–200
019
60–2
000
1960
–200
019
60–2
007
1985
–200
7Te
stsc
ores
All
year
sA
llye
ars
All
year
sA
llye
ars
Unt
il19
84(1
)(2
)(3
)(4
)(5
)
Cog
nitiv
esk
ills
1.98
01.
921
2.13
31.
881
3.59
3(9
.12)
(9.2
5)(9
.01)
(7.7
8)(2
.56)
Initi
alye
ars
ofsc
hool
ing
0.02
60.
079
0.01
80.
018
−0.0
79(0
.34)
(1.0
9)(0
.23)
(0.2
2)(0
.41)
Initi
alG
DP
per
capi
ta−0
.302
−0.3
24−0
.219
−0.2
12−0
.123
(5.5
4)(7
.01)
(5.5
9)(5
.29)
(2.2
0)N
o.of
coun
trie
s50
5050
5025
R2
(adj
.)0.
728
0.73
40.
667
0.61
00.
318
Not
esD
epen
dent
vari
able
:ave
rage
annu
algr
owth
rate
inG
DP
per
capi
ta.R
egre
ssio
nsin
clud
ea
cons
tant
.Tes
tsco
res
are
aver
age
ofm
ath
and
scie
nce,
prim
ary
thro
ugh
end
ofse
cond
ary
scho
ol.A
bsol
ute
t-st
atis
tics
inpa
rent
hese
s
123

318 J Econ Growth (2012) 17:267–321
Table 16 Changes in cognitive skills and changes in growth paths with updated data series on economicgrowth
Period of trend in growth 1975–2000 1975–2007 1985–2007(1) (2) (3)
Trend in cognitive skills 0.072 0.072 0.115(2.61) (2.92) (2.94)
Average annual growth rate −0.017 −0.022 −0.067in GDP per capita over period (1.30) (1.69) (3.16)No. of countries 15 15 15R2 (adj.) 0.316 0.387 0.516
Notes Dependent variable: trend in the growth rate of GDP percapita over the period shown in the header,based on PWT version 7.0. Regressions include a constant. Sample: OECD countries with test-score data bothbefore 1985 and up to 2003. Test scores are average of math and science, primary through end of secondaryschool. Absolute t-statistics in parentheses
the base model (not shown), although the precise point estimate is sensitive to excludingindividual countries when considering this shorter growth period.
We have also experimented with the latest wave of test-score data, the 2009 wave of thePISA study. Our test-score measure derived from the tests conducted in 1964-2003 is stronglycorrelated with the PISA 2009 data (correlation coefficient of 0.94 for the 37 countries avail-able in both datasets). This corroborates the assumption of relative stability underlying ourmain analysis. Also, using the PISA 2009 as an alternative measure of cognitive skills inthe growth regressions fully confirms our results, with a highly significant point estimateextremely close to our main analysis (1.96).
Finally, Table 16 shows that our analysis in Section 7 on trends in skills and in growth isstrongly confirmed with the new 7.0 version of the PWT. Considering the revised data overthe same 1975-2000 period (col. 1) hardly affects the result on cognitive skills from col. 2of Table 6. Similarly, extending the growth period with the newly available data to 2007 (orto 2009, not shown) confirms the previous result (col. 2). Similarly, when using the growthperiod 1985-2007 (col. 3), so that the test-score trend partly predates the growth rate trend,even strengthens the result of a significant positive relation of trends in test scores with trendsin growth rates.
Acknowledgments We thank Mark Bils, Pete Klenow, Giovanni Peri, Paul Romer, participants at seminarsat Stanford University, the London School of Economics, the Universities of Stockholm, Mannheim, Heidel-berg, Uppsala, and Rochester, Simon Fraser University, the European School of Management and Technologyin Berlin, the City University of Hong Kong, the World Bank, the NBER growth conference in San Francisco,and the Econometric Society World Congress in Shanghai, and anonymous referees for helpful comments andsuggestions. We are grateful to the International Association for the Evaluation of Educational Achievement(IEA) for providing us with the micro data for the FISS, SIMS, and SISS studies. Jason Grissom and TreyMiller provided important research assistance. Support has come from CESifo, the Packard Humanities Insti-tute, the W. Glenn Campbell and Rita Ricardo-Campbell National Fellowship of the Hoover Institution, andthe Pact for Research and Innovation of the Leibniz Association.
References
Acemoglu, D., Johnson, S., & Robinson, A. R. (2001). The colonial origins of comparative development:An empirical investigation. American Economic Review, 91(5), 1369–1401.
123

J Econ Growth (2012) 17:267–321 319
Acemoglu, D., Johnson, S., & Robinson, A. R. (2005). Institutions as a fundamental cause of long-rungrowth. In P. Aghion & S. N. Durlauf (Eds.), Handbook of economic growth (pp. 385–472). Amster-dam: North Holland.
Aghion, P., & Howitt, P. (1998). Endogenous growth theory. Cambridge, MA: MIT Press.Aghion, P., Boustan, L., Hoxby, C. M., & Vandenbussche, J. (2009). The causal impact of education on
economic growth: Evidence from the U.S. (mimeo) Department of Economics: Harvard University(March).
Andrews, D. R., Moreira, M. J., & Stock, J. H. (2007). Performance of conditional Wald tests in IVregression with weak instruments. Journal of Econometrics, 139(1), 116–132.
Appleton, S., Atherton, P., & Bleaney, M. (2011). Growth regressions and data revisions in Penn WorldTables. Journal of Economic Studies, 38(3), 301–312.
Autor, D. H., Katz, L. F., & Kearney, M. S. (2006). The polarization of the U.S. labor market. AmericanEconomic Review, 96(2), 189–194.
Autor, D. H., Katz, L. F., & Kearney, M. S. (2008). Trends in U.S. wage inequality: Revising therevisionists. Review of Economics and Statistics, 90(2), 300–323.
Barro, R. J. (1991). Economic growth in a cross section of countries. Quarterly Journal of Econom-ics, 106(2), 407–443.
Barro, R. J. (1997). Determinants of economic growth: A cross-country empirical study. Cambridge,MA: MIT Press.
Barro, R. J. (2001). Human capital and growth. American Economic Review, 91(2), 12–17.Barro, R. J., & Lee, J.-W. (1993). International comparisons of educational attainment. Journal of Monetary
Economics, 32(3), 363–394.Barro, R. J., & Lee, J.-W. (2010). A new data set of educational attainment in the world, 1950-2010.
NBER Working Paper 15902. Cambridge, MA: National Bureau of Economic Research (April).Barro, R. J., & McCleary, R. M. (2003). Religion and economic growth across countries. American
Sociological Review, 68(5), 760–781.Barro, R. J., & Ursúa José, F. (2008). Macroeconomic crises since 1870. Brookings Papers on Economic
Activity, 1, 336–350.Bils, M., & Klenow, P. J. (2000). Does schooling cause growth?. American Economic Review, 90(5), 1160–
1183.Bishop, J. H. (2006). Drinking from the fountain of knowledge: Student incentive to study and learn—Exter-
nalities, information problems, and peer pressure. In E. A. Hanushek & F. Welch (Eds.), Handbookof the Economics of Education (pp. 909–944). Amsterdam: North Holland.
Bowles, S., Gintis, H., & Osborne, M. (2001). The determinants of earnings: A behavioral approach. Journalof Economic Literature, 39(4), 1137–1176.
Castelló, A., & Doménech, R. (2002). Human capital inequality and economic growth: Some newevidence. Economic Journal, 112(478), C187–C200.
Ciccone, A., & Jarocinski, M. (2010). Determinants of economic growth: Will data tell?. American EconomicJournal: Macroeconomics, 2(4), 222–246.
Ciccone, A., & Papaioannou, E. (2009). Human capital, the structure of production, and growth. Reviewof Economics and Statistics, 91(1), 66–82.
Cingano, F., Leonardi, M., Messina, J., & Pica, G. (2010). The effects of employment protection leg-islation and financial market imperfections on investment: evidence from a firm-level panel of EUcountries. Economic Policy, 25(61), 117–163.
Cohen, D., & Soto, M. (2007). Growth and human capital: Good data, good results. Journal of EconomicGrowth, 12(1), 51–76.
Coulombe, S., & Tremblay, J.-F. (2006). Literacy and growth. Topics in Macroeconomics 6(2), Article 4.Cunha, F., & Heckman, J. (2007). The technology of skill formation. American Economic Review, 97(2), 31–
47.Cunha, F., Heckman, J. J., Lochner, L., & Masterov, D. V. (2006). Interpreting the evidence on life
cycle skill formation. In E. A. Hanushek & F. Welch (Eds.), Handbook of the Economics ofEducation. (pp. 697–812). Amsterdam: Elsevier.
Dolton, P., & Marcenaro-Gutierrez, O. D. (2011). If you pay peanuts do you get monkeys? A cross countryanalysis of teacher pay and pupil performance. Economic Policy, 26(65), 7–55.
Ehrlich, I. (2007). The mystery of human capital as engine of growth, or why the US became the economicsuperpower in the 20th Century. NBER Working Paper 12868. Cambridge, MA: National Bureau ofEconomic Research (January).
Fuller, W. A. (1977). Some properties of a modification of the limited information estimator. Econome-trica, 45(4), 939–954.
123

320 J Econ Growth (2012) 17:267–321
Glaeser, E. L., La Porta, R., Lopez-de-Silanes, F., & Shleifer, A. (2004). Do institutions cause growth?. Journalof Economic Growth, 9(3), 271–303.
Glenn, C. L., & De Groof, J. (2002). Finding the right balance: Freedom, autonomy and accountabilityin education, Vol. II. The Netherlands: Lemma Publishers.
Goldin, C., & Katz, L. F. (2008). The race between education and technology. Cambridge, MA: HarvardUniversity Press.
Gundlach, E., Woessmann, L., & Gmelin, J. (2001). The decline of schooling productivity in OECDcountries. Economic Journal, 111(May), C135–C147.
Hahn, J., Hausman, J. A., & Kuersteiner, G. (2004). Estimation with weak instruments: Accuracy ofhigher-order bias and MSE approximations. Econometrics Journal, 7(1), 272–306.
Hanousek, J., Hajkova, D., & Filer, R. K. (2008). A rise by any other name? Sensitivity of growthregressions to data source. Journal of Macroeconomics, 30(3), 1188–1206.
Hanushek, E. A. (2002). Publicly provided education. In A. J. Auerbach & M. Feldstein (Eds.), Handbookof Public Economics. (pp. 2045–2141). Amsterdam: Elsevier.
Hanushek, E. A., & Kimko, D. D. (2000). Schooling, labor force quality, and the growth of nations. AmericanEconomic Review, 90(5), 1184–1208.
Hanushek, E. A., & Woessmann, L. (2008). The role of cognitive skills in economic development. Journalof Economic Literature, 46(3), 607–668.
Hanushek, E. A., & Woessmann, L. (2011a). The economics of international differences in educationalachievement. In E. A. Hanushek, S. Machin, & L. Woessmann (Eds.), Handbook of the Economicsof Education, Vol. 3 (pp. 89–200). Amsterdam: North Holland.
Hanushek, E. A., & Woessmann, L. (2011b). How much do educational outcomes matter in OECDcountries?. Economic Policy, 26(67), 427–491.
Hanushek, E. A., & Woessmann, L. (2011c). Sample selectivity and the validity of international studentachievement tests in economic research. Economic Letters, 110(2), 79–82.
Hanushek, E. A., & Woessmann, L. (2012). Schooling, educational achievement, and the Latin Americangrowth puzzle. Journal of Development Economics (forthcoming).
Hanushek, E. A., & Zhang, L. (2009). Quality-consistent estimates of international schooling and skillgradients. Journal of Human Capital, 3(2), 107–143.
Hausmann, R., Pritchett, L., & Rodrik, D. (2005). Growth accelerations. Journal of EconomicGrowth, 10(4), 303–329.
Heckman, J. J., Lochner, L. J., & Todd, P. E. (2008). Earnings functions and rates of return. Journal ofHuman Capital, 2(1), 1–31.
Heckman, J. J., Stixrud, J., & Urzua, S. (2006). The effects of cognitive and noncognitive abilities onlabor market outcomes and social behavior. Journal of Labor Economics, 24(3), 411–482.
Hendricks, L. (2002). How important is human capital for development? Evidence from immigrantearnings. American Economic Review, 92(1), 198–219.
Heston, A., Summers, R., & Aten, B. (2002). Penn World Table Version 6.1. Center for InternationalComparisons at the University of Pennsylvania (CICUP). Philadelphia: University of Pennsylvania.
Heston, A., Summers, R., & Aten, B. (2011). Penn World Table Version 7.0. Center for InternationalComparisons of Production, Income and Prices at the University of Pennsylvania Philadelphia:University of Pennsylvania (June 3 update).
Jones, B. F., & Olken, B. A. (2008). The anatomy of start-stop growth. Review of Economics andStatistics, 90(3), 582–587.
Katz, L. F., & Autor, D. H. (1999). Changes in the wage structure and earnings inequality. In A. Orley &D. Card (Eds.), Handbook of Labor Economics. (pp. 1463–1558). Amsterdam: Elsevier.
Krueger, A. B., & Lindahl, M. (2001). Education for growth: Why and for whom?. Journal of EconomicLiterature, 39(4), 1101–1136.
Lazear, E. P. (2003). Teacher incentives. Swedish Economic Policy Review, 10(3), 179–214.Lee, J.-W., & Barro, R. J. (2001). Schooling quality in a cross-section of countries. Economica, 68(272), 465–
488.Levine, R., & Renelt, D. (1992). A sensitivity analysis of cross-country growth regressions. American
Economic Review, 82(4), 942–963.Lucas, R. E., Jr. (1988). On the mechanics of economic development. Journal of Monetary Econom-
ics, 22(1), 3–42.Mankiw, N. G., Romer, D., & Weil, D. (1992). A contribution to the empirics of economic growth. Quarterly
Journal of Economics, 107(2), 407–437.Mincer, J. (1974). Schooling, experience, and earnings. New York: NBER.Moreira, M. J. (2003). A conditional likelihood ratio test for structural models. Econometrica, 71(4), 1027–
1048.
123

J Econ Growth (2012) 17:267–321 321
Mulligan, C. B. (1999). Galton versus the human capital approach to inheritance. Journal of PoliticalEconomy 107(6), pt. 2 (December): S184–S224.
Murnane, R. J., Willett, J. B., Duhaldeborde, Y., & Tyler, J. H. (2000). How important are the cognitiveskills of teenagers in predicting subsequent earnings?. Journal of Policy Analysis and Manage-ment, 19(4), 547–568.
Murnane, R. J., Willett, J. B., & Levy, F. (1995). The growing importance of cognitive skills in wagedetermination. Review of Economics and Statistics, 77(2), 251–266.
Neidorf, T. S., Binkley, M., Gattis, K., & Nohara, D. (2006). Comparing mathematics content in theNational Assessment of Educational Progress (NAEP), Trends in International Mathematics andScience Study (TIMSS), and Program for International Student Assessment (PISA) 2003 assess-ments. Washington: National Center for Education Statistics.
Nelson, R. R., & Phelps, E. (1966). Investment in humans, technology diffusion and economic growth. Amer-ican Economic Review, 56(2), 69–75.
Nicoletti, G., & Scarpetta, S. (2003). Regulation, productivity, and growth: OECD evidence. EconomicPolicy, 18(1), 10–72.
Nuxoll, D. A. (1994). Differences in relative prices and international differences in growth rates. AmericanEconomic Review, 84(5), 1423–1436.
Organisation for Economic Co-operation and Development. (1998). Education at a glance: OECD Indi-cators. Paris: Organisation for Economic Co-operation and Development.
Organisation for Economic Co-operation and Development. (2004). Learning for tomorrow’s world: Firstresults from PISA 2003. Paris: OECD.
Pritchett, L. (2006). Does learning to add up add up? The returns to schooling in aggregate data. In E. A.Hanushek & F. Welch (Eds.), Handbook of the Economics of Education. (pp. 635–695). Amster-dam: North Holland.
Ramirez, F., Luo, X., Schofer, E., & Meyer, J. (2006). Student achievement and national economicgrowth. American Journal of Education, 113(1), 1–29.
Riley, J. G. (2001). Silver signals: Twenty-five years of screening and signaling. Journal of EconomicLiterature, 39(2), 432–478.
Romer, P. (1990). Endogenous technological change. Journal of Political Economy 99(5), pt. II: S71–S102.Sachs, J. D., & Warner, A. M. (1995). Economic reform and the process of global integration. Brookings
Papers on Economic Activity (1),1–96.Sala-i-Martin, X., Doppelhofer, G., & Miller, R. I. (2004). Determinants of long-term growth: A Bayesian
Averaging of Classical Estimates (BACE) approach. American Economic Review, 94(4), 813–835.Schoellman, T. (2012). Education quality and development accounting. Review of Economic Stud-
ies, 79(1), 388–417.Spence, A. M (1973). Job market signalling. Quarterly Journal of Economics, 87(3), 355–374.Topel, R. (1999). Labor markets and economic growth. In A. Orley & D. Card (Eds.), Handbook of Labor
Economics. (pp. 2943–2984). Amsterdam: Elsevier.UNESCO. (1998). World education report, 1998: Teachers and teaching in a changing world. Paris:
UNESCO.UNESCO. (2005). Education for all: The quality imperative, EFA Global Monitoring Report. Paris:
UNESCO.Vandenbussche, J., Aghion, P., & Meghir, C. (2006). Growth, distance to frontier and composition of
human capital. Journal of Economic Growth, 11(2), 97–127.Weiss, A. (1995). Human capital vs. signalling explanations of wages. Journal of Economic Perspec-
tives, 9(4), 133–154.West, M. R., & Woessmann, L. (2010). ’Every Catholic child in a Catholic school’: Historical resistance to
state schooling, contemporary private competition and student achievement across countries. EconomicJournal, 120(546), F229–F255.
Woessmann, L. (2003a). Central exit exams and student achievement: International evidence. In P.E. Peterson & M. R. West (Eds.), No child left behind? The politics and practice of schoolaccountability (pp. 292–323). Washington D.C.: Brookings Institution Press.
Woessmann, L. (2003b). Schooling resources, educational institutions, and student performance: Theinternational evidence. Oxford Bulletin of Economics and Statistics, 65(2), 117–170.
Woessmann, L., Luedemann, E., Schuetz, G., & West, M. R. (2009). School accountability, autonomy,and choice around the world. Cheltenham, UK: Edward Elgar.
123