do actions speak louder than words? the response of … actions speak louder than words? the...
TRANSCRIPT
Do Actions Speak Louder Than Words?
The Response of Asset Prices to Monetary
Policy Actions and Statements∗
Refet S. Gurkaynak,a,c Brian Sack,b and Eric T. Swansonc
aDepartment of Economics, Bilkent University, Ankara, TurkeybMacroeconomic Advisers, LLC, Washington, DC
cDivision of Monetary Affairs, Federal Reserve BoardWashington, DC
We investigate the effects of U.S. monetary policy on as-set prices using a high-frequency event-study analysis. Wetest whether these effects are adequately captured by a singlefactor—changes in the federal funds rate target—and find thatthey are not. Instead, we find that two factors are required.These factors have a structural interpretation as a “currentfederal funds rate target” factor and a “future path of policy”factor, with the latter closely associated with Federal OpenMarket Committee statements. We measure the effects of thesetwo factors on bond yields and stock prices using a new intra-day data set going back to 1990. According to our estimates,both monetary policy actions and statements have importantbut differing effects on asset prices, with statements having amuch greater impact on longer-term Treasury yields.JEL Codes: E52, E58, E43, G14.
∗We thank Ben Bernanke, Ken Kuttner, Jon Faust, Jonathan Wright, twoanonymous referees, and seminar participants at Bilkent, Koc, and Sabancı Uni-versities, the Central Bank of Turkey, and the Federal Reserve Bank of SanFrancisco for valuable discussions, comments, and suggestions. Andrea Surrattand Kunal Gullapalli provided excellent research assistance. The views in thispaper, and any errors and omissions, should be regarded as those of the authors,and do not necessarily reflect those of the individuals listed above, the FederalReserve Board, or any other individual within the Federal Reserve System. Au-thor contact: Refet S. Gurkaynak, Division of Monetary Affairs, Federal ReserveBoard and Department of Economics, Bilkent University, 06800 Ankara, Turkey(e-mail: [email protected]).
55

56 International Journal of Central Banking May 2005
The Federal Reserve’s announcement following its January 28,2004, policy meeting led to one of the largest reactions in the Trea-sury market on record, with two- and five-year yields jumping 20and 25 basis points (bp) respectively in the half-hour surroundingthe announcement—the largest movements around any Federal OpenMarket Committee (FOMC) announcement over the fourteen yearsfor which we have data. Even more remarkably, this outsized reac-tion was spurred not by what the FOMC did, but rather by whatit said : indeed, the decision to leave the current federal funds rateunchanged was completely anticipated by financial markets, but theFOMC’s decision to drop the phrase “policy accommodation can bemaintained for a considerable period” from its accompanying state-ment and replace it with “the Committee believes it can be patient inremoving its policy accommodation” was read by financial marketsas indicating that the FOMC would begin tightening policy soonerthan previously expected.1 On this date, then, treating the monetarypolicy action as a 0 bp surprise change in the current federal fundsrate target would be missing the whole story.
In this paper, we investigate the extent to which this observationis true more generally: are the effects of monetary policy announce-ments on asset prices adequately characterized by a single factor,namely the surprise component of the change in the current federalfunds rate target? We perform a test of this hypothesis using the ranktest of Cragg and Donald (1997) and strongly reject the hypothesisof a single factor. By contrast, we do not reject the hypothesis thatthe effects of monetary policy on asset prices are characterized bytwo factors. By performing a suitable rotation of these unobservedfactors, we show that they can be given a structural interpretationas a “current federal funds rate target” factor, corresponding to sur-prise changes in the current federal funds rate target, and a “futurepath of policy” factor, corresponding to changes in futures rates outto horizons of one year that are independent of changes in the currentfunds rate target. We show that this latter (“path”) factor has typi-cally been associated with significant changes in FOMC statements,such as the January 28 example above. In this way, we generalize and
1For example, the front page of The Wall Street Journal reported the fol-lowing morning that “investors interpreted the omission of ‘considerable period’as a signal that the Fed is closer to raising interest rates than many thought”(Ip 2004).

Vol. 1 No. 1 Do Actions Speak Louder Than Words? 57
improve the single-factor analysis of the effects of monetary policyon asset prices performed by earlier authors, such as Cook and Hahn(1989), Kuttner (2001), Cochrane and Piazzesi (2002), Rigobon andSack (2004), Ellingsen and Soderstrom (2003), and Bernanke andKuttner (forthcoming).
To measure the effects of monetary policy actions and statementson asset prices, we construct a new data set that captures changesin asset prices in a thirty-minute window and in a one-hour windowbracketing every FOMC announcement going back to 1990 (we usethe term announcement to refer to any means by which a policy deci-sion was communicated to financial markets, including open marketoperations as well as explicit press releases). The use of intraday dataallows us to better isolate the response of asset prices to monetarypolicy announcements, since we can be almost certain that no othereconomic news was released within such a brief interval of time. Thegains from using intraday data are most apparent in the early 1990s,when on a number of occasions the FOMC eased policy just a fewhours after a weak employment report released earlier in the day.
In estimating the separate effects of monetary policy actions andstatements, we are not suggesting that FOMC statements representa policy tool that is completely independent of the federal funds ratetarget. In particular, FOMC statements likely exert their effects onfinancial markets through their influence on financial market expec-tations of future policy actions. Nonetheless, the two-factor approachwe employ in this paper greatly adds to our understanding of theresponse of asset prices to monetary policy announcements—for ex-ample, we find that 75 to 90 percent of the explainable variation infive- and ten-year Treasury yields in response to monetary policy an-nouncements is due to the path factor (associated with statements)rather than to changes in the federal funds rate target. We interpretthis result as indicating not that policy actions are secondary so muchas that their influence comes earlier, when investors build in expecta-tions of those actions in response to FOMC statements (and perhapsother events, such as speeches and testimony by FOMC members).
Our findings have important implications for the conduct ofmonetary policy in a low-inflation environment. In particular,the fact that FOMC statements have such significant effects onlong-term yields suggests that the FOMC may be able to crediblycommit to future plans for the federal funds rate. Thus, even when

58 International Journal of Central Banking May 2005
faced with a low or zero nominal funds rate, our results indicate thatthe FOMC may be able to effectively communicate to the marketsits intention to keep the federal funds rate low for an extendedperiod, thereby lowering longer-term interest rates and stimulatingeconomic growth.2
The remainder of the paper proceeds as follows. Section 1 pro-vides a detailed study of surprises in the federal funds rate targetand measures asset price responses to these surprises. Section 2 testswhether there are additional dimensions underlying monetary pol-icy announcements, finds that one additional dimension is required,shows that this additional factor is closely associated with FOMCstatements, and estimates the response of asset prices to this addi-tional factor. Section 3 concludes. The appendix provides technicaldetails regarding our factor test and the estimation of the unobservedfactors, and a data appendix (only available online at www.ijcb.org)provides a complete listing of our monetary policy announcementdates, times, and federal funds rate and statement surprise measuresextending back to 1990.
1. The Effects of Changes in the Federal Funds RateTarget on Asset Prices
1.1 Methodology
We begin our analysis in the framework of one-dimensional mea-sures of monetary policy surprises that has been used in the existingliterature. To measure the effects of unexpected monetary policy ac-tions (changes in the federal funds rate) on asset prices, we rely onthe following regression, which has been frequently estimated in theliterature:
∆yt = α + β∆xt + εt (1)
where ∆xt denotes the surprise component of the change in the fed-eral funds rate target announced by the FOMC, ∆yt denotes thechange in a bond yield or stock market index over an interval that
2Reifschneider and Williams (2000) and Eggertsson and Woodford (2003) pro-vide theoretical support for the argument that a central bank is relatively uncon-strained by the zero nominal bound so long as it can credibly commit to futurepolicy actions. Bernanke, Reinhart, and Sack (2004) investigate the potentialeffectiveness of monetary policy at the zero nominal bound empirically.

Vol. 1 No. 1 Do Actions Speak Louder Than Words? 59
brackets the monetary policy announcement, and εt is a stochasticerror term that captures the effects of other factors that influencethe asset in question.
We use a high-frequency event-study analysis to estimate equa-tion (1). One generally cannot estimate equation (1) using monthlyor quarterly data due to simultaneous equations and omitted vari-ables bias. In particular, the change in monetary policy could ac-tually be a response of monetary policy to the change in the assetprice that took place earlier in the month or quarter, due to the di-rect effects of stock market wealth on the economic outlook or dueto the signal that term spreads provide about future economic activ-ity and inflation.3 Alternatively, both the change in monetary policyand the change in the asset price could be responding to importantmacroeconomic news (captured by εt) that was released earlier in theperiod, such as an employment report.4 In either case, the classicalregression assumption that εt is orthogonal to ∆xt is violated.5
These problems can be mitigated by using higher-frequencydata to shrink the time period around the policy decision. Kuttner(2001), for example, uses daily data to measure changes in Trea-sury yields and the surprise component of FOMC monetary policyannouncements. Cochrane and Piazzesi (2002) and Ellingsen and
3Rigobon and Sack (2003) discuss reasons why asset prices might be expectedto feed back into monetary policy. Using a heteroskedasticity-based identificationprocedure, they estimate a statistically and economically significant responseof monetary policy to the stock market, and this response has the expectedpositive sign. Using their heteroskedasticity-based procedure, Rigobon and Sack(2004) also estimate the size of the endogeneity and omitted variables problemsin estimating equation (1).
4Asset prices can respond to macroeconomic news for many reasons otherthan changes in monetary policy expectations: First, information about economicoutput is likely to influence expectations of corporate earnings and dividends,hence stock prices; second, information about the government budget or currentaccount deficit would, assuming home bias in savings and imperfect Ricardianequivalence, affect bond yields; third, investors’ appetite for risk can change inresponse to economic developments, to name a few examples.
5One way to partially account for these issues is to estimate a VAR for the assetprice, the policy instrument, and other relevant macroeconomic variables, as inLeeper, Sims, and Zha (1996) and Evans and Marshall (1998). The problem withthis approach is that the recursive identifying restrictions typically employed arenot plausible for fast-moving financial market variables. (Two exceptions to thisrule are the heteroskedasticity-based identification procedure used by Rigobonand Sack [2003, 2004] and the high-frequency identification procedure used byCochrane and Piazzesi [2002] and Faust, Swanson, and Wright [2004a].)

60 International Journal of Central Banking May 2005
Soderstrom (2003) perform variations on this analysis, and Bernankeand Kuttner (forthcoming) apply the method to measure the effectsof monetary policy announcements on the stock market. However, asnoted by Rudebusch (1998) and Bernanke and Kuttner (forthcom-ing), simultaneity in equation (1) is still a potential problem evenat daily frequency because, for a time, the FOMC often changed itstarget for the federal funds rate just hours after (and in responseto) the Bureau of Labor Statistics’ employment report release. As aresult, event-study regressions using daily data in part capture theendogenous response of asset prices and monetary policy to the infor-mation that was released earlier in the day, as well as noise from otherfinancial market developments that took place throughout the day.
We address this potential problem by estimating regression (1)using intraday data to measure both the funds rate surprise ∆xt
and the change in the asset price ∆yt. By measuring these changesin a sufficiently narrow window of time around the monetary policyannouncement, we can be sure that the FOMC decision was in noway influenced by asset price movements or other macroeconomicnews over that interval. In addition, by shrinking the event-studywindow down to an hour or less, it becomes much less likely thatany other significant events took place within this narrow windowthat might have influenced asset prices, thereby increasing theprecision of our estimates.
1.2 Dates and Times of Monetary Policy Announcements
To perform the above analysis using intraday data, we first put to-gether a complete list of dates and times of monetary policy an-nouncements from January 1990 through December 2004. In Febru-ary 1994, the FOMC began issuing a press release after every meet-ing and every change in policy, and thus the announcement datesand times are simply those of the corresponding press releases.6
Prior to 1994, the FOMC did not explicitly announce changes inits target for the federal funds rate, but such changes were implicitly
6Since 1995, these press releases have occurred at about 2:15 p.m., after reg-ularly scheduled FOMC meetings; press releases for intermeeting policy movesand FOMC decisions in 1994 were released at varying times throughout the day.We obtained all of these dates and times from the office of the secretary of theFederal Reserve Board.

Vol. 1 No. 1 Do Actions Speak Louder Than Words? 61
communicated to financial markets through the size and type of openmarket operation. Thus, prior to 1994, the date and time of a mone-tary policy announcement are typically those of the next open marketoperation following the FOMC decision.7
The dates, times, and methods of communication of FOMC mon-etary policy announcements are reported in table 1 of the online dataappendix. Note that this listing includes not just dates on which theFOMC actually changed the federal funds rate, but also dates onwhich there was an FOMC meeting followed by no change in policy,since in some cases the FOMC’s decision not to change policy sur-prised financial markets and led to movements in asset prices. Therightmost column of this table reports other major macroeconomicdata releases that took place on each date, before the monetary pol-icy announcement. From the table, we can see that eight monetarypolicy announcements occurred on the date of an employment re-port release, seven announcements occurred on the date of a grossdomestic product release, nine occurred on the date of a consumerprice index release, and five on the date of a producer price indexrelease, to name just a few.
1.3 The Surprise Component of Federal Funds Rate Changes
For each monetary policy announcement, we measure the surprisecomponent of the change in the federal funds rate target usingfederal funds futures. We use the surprise component of monetarypolicy announcements in estimating regression (1) because changesin policy that are expected by financial markets should have little or
7On a few occasions between 1990 and 1994, the FOMC issued, prior to theopen market operation, a press release announcing a change in the discount rateoffered to depository institutions, and market participants correctly inferred fromthe press release a corresponding change in the target federal funds rate as well.On those occasions, we set the time of the monetary policy announcement tothe time of the discount rate change press release. Open market operations overthis period were conducted at 11:30 a.m. every day. There are a few dates onwhich volatility in the federal funds market prevented the Open Market TradingDesk from successfully communicating the FOMC’s intentions for the funds ratethe first morning after the FOMC’s decision (see Kuttner 2003). On these dates,we regard the announcement as having taken place on whichever morning theCredit Markets column of The Wall Street Journal regarded as a clear signal ofthe Federal Reserve’s intentions, as reported by Kuttner (2003). This is more ofan issue prior to 1990 than for our sample period in this paper.

62 International Journal of Central Banking May 2005
no effect on asset prices, a hypothesis that is confirmed by Kuttner(2001). Thus, using the raw changes in the federal funds rate target asthe right-hand-side variable ∆xt would impart an errors-in-variablesbias to our estimates of β to the extent that the monetary policydecisions were correctly anticipated by financial markets.
Federal funds futures have traded at the Chicago Board of Tradeexchange since October 1988 and settle based on the average effectivefederal funds rate that is realized for the calendar month specified inthe contract. Thus, daily changes in the current-month futures ratelargely reflect revisions to the market’s expectations for the federalfunds rate over the remainder of the month. As described in theappendix, the change in the current month’s contract rate on theday of an FOMC announcement can be scaled up to account for thetiming of the announcement within the month, and thereby measurethe surprise component of the FOMC’s announcement for the federalfunds rate. For the present paper, we acquired tick-by-tick data onall federal funds futures contract trades from January 1990 to thepresent from Genesis Financial Technologies. To provide a sense ofthe quality of this data and its advantages, figure 1 graphs the dataon three illustrative dates:
1. June 25, 2003, was the date of a regularly scheduled FOMCmeeting (see panel a). Trades were intermittent throughout the dayuntil just before and just after the FOMC’s press release at 2:15p.m. At that time, the FOMC announced that it was lowering itstarget for the federal funds rate from 1.25 percent to 1 percent.According to surveys and press reports both before and after thepolicy announcement, many market participants had been expectingthe FOMC to ease policy by 50 bp at the meeting. Thus, this decisionis characterized as a 13 bp tightening surprise under our measure.This example illustrates two key points: First, financial markets seemto fully adjust to the policy action within just a few minutes—i.e.,there is no evidence of learning or sluggish adjustment to the targetrate decision going on after about 2:20 p.m. in this example. Second,the federal funds rate surprise is not necessarily in the same directionas the federal funds rate action itself.
2. April 9, 1992, was the date of an intermeeting monetary pol-icy move (see panel b). The FOMC reduced its target for the federalfunds rate from 4 percent to 3.75 percent that morning, but giventhat this date precedes 1994, the FOMC did not issue a press release

Vol. 1 No. 1 Do Actions Speak Louder Than Words? 63
Figure 1. Intraday Trading in Federal Funds FuturesContracts
9:00 12:00 3:00
3.85
3.90
3.95
4.00
4.05(b) April 9, 1992 (April 1992 Contract)
11:30 a.m.Open Market Operation
9:00 12:00 3:00
3.00
3.05
3.10
3.15
3.20
3.25(c) September 4, 1992 (September 1992 Contract)
11:30 a.m.Open Market Operation
8:30 a.m.Employment Report Release
9:00 12:00 3:00
0.90
0.95
1.00
1.05(a) June 25, 2003 (July 2003 Contract)
2:15 p.m.FOMC Press Release
about its change in policy to the public. As can be seen in the fig-ure, trading in federal funds futures was thin until shortly before theopen market operation at 11:30 a.m. At that time, the Open Mar-ket Trading Desk injected a significant quantity of reserves into themarket, and market participants correctly inferred from this that theFOMC had changed its target for the funds rate, causing the futuresrate to move quickly to the new target rate.8
8The federal funds futures contract rate falls to 3.85 percent after the an-nouncement rather than the new funds rate target of 3.75 percent because nine

64 International Journal of Central Banking May 2005
3. September 4, 1992, witnessed the release of a very weak em-ployment report at 8:30 a.m. (see panel c). In response to that report,investors significantly revised downward their expectations for thefederal funds rate, pushing the futures rate down sharply. Sometimeafter the poor data release, the FOMC decided to reduce its tar-get for the federal funds rate from 3.25 percent to 3 percent. Again,because there was no press release, the FOMC’s decision becameknown to the markets at 11:30 a.m., the time of the open marketoperation. In contrast to panel b, however, the FOMC’s decision forthe funds rate on this date was essentially completely anticipated bythe time it was signaled to the market—indeed, our intraday mea-sure of the funds rate surprise (reported in table 2 of the online dataappendix and discussed below) is 0 bp. By contrast, the daily mea-sure of the funds rate surprise is –22 bp, because it incorporates theendogenous policy response to the weak employment report. In thiscase, we would not want to use the daily measure of the funds ratesurprise in an event-study regression, because it would suffer fromthe omitted variables problem discussed earlier (in that the employ-ment report itself has sizable effects on stock prices, bond yields, andmonetary policy expectations).
To focus on the monetary policy decision itself, we computepolicy surprises by looking at changes in the futures rate in nar-row windows around the FOMC announcements. More specifically,online data appendix table 2 reports two intraday measures, a “tight”window and a “wide” window, which begin ten (fifteen) minutes priorto the monetary policy announcement and end twenty (forty-five)minutes after the policy announcement, respectively, for the periodfrom January 1990 through December 2004.9 For comparison, thetable also reports a “daily” window that begins with the financialmarket close the day before the policy announcement and ends withthe financial market close the day of the policy announcement. Onmost of the days in our sample, the two intraday measures are quite
days of the month have already elapsed with an average federal funds rate of 4percent, which will result in a month-average funds rate for April of 3.85 percent.
9When there is no federal funds futures trade exactly at the beginning of thespecified window, we use the most recent price. When there is no trade exactlyat the end of the specified window, we use the next available trade price. Federalfunds futures trading is often sparse early in our sample period, but becomessignificantly more dense around the times of macroeconomic data releases andmonetary policy announcements.

Vol. 1 No. 1 Do Actions Speak Louder Than Words? 65
similar to the daily measure: the average absolute difference betweenthe daily and two intraday surprise measures is only about 2 bp, andthe difference is 0 bp on many days. There are a few days, however,on which the differences between the intraday measures and the dailymeasure are quite large: for example, there are five observations forwhich the discrepancy between the tight surprise and the daily sur-prise exceeds 10 bp. Each of those observations took place before1994 on the day of an employment report release, as in the exam-ple of September 4, 1992, discussed previously. Figure 2 makes thispoint graphically: as can be seen in the top panel, the tight window
Figure 2. Measures of Surprises in the Federal Funds RateTarget
-0.5
-0.4
-0.3
-0.2
-0.1
0.0
0.1
0.2
-0.5 -0.4 -0.3 -0.2 -0.1 0.0 0.1 0.2
Percentage pointsTight Window vs. Daily
Tight surprise
Dai
ly s
urpr
ise
0.0
-0.1
-0.5
-0.4
-0.3
-0.2
0.1
0.2
-0.5 -0.4 -0.3 -0.2 -0.1 0.0 0.1 0.2
Percentage pointsTight Window vs. Wide Window
Tight surprise
Wid
e su
rpris
e
Note: Hollow circles denote days of employment report releases.

66 International Journal of Central Banking May 2005
and daily window surprises are in very close agreement on all but ahandful of dates, almost all of which correspond to days on which theFOMC was responding to an employment report release (depictedby the hollow circles). By contrast, in the bottom panel of the figure,we see that the two intraday measures are in very close agreementon all dates in our sample.
We draw two conclusions from these observations. First, theFOMC decision accounted for the vast majority of the movement inthe federal funds futures rate on all of the non-employment-reportdays in our sample. This is perhaps surprising, given the largenumber of other data releases that also coincided with monetarypolicy announcements in data appendix table 1, and is in itselfan important finding: it shows that for samples that exclude em-ployment report dates, or samples that begin in 1994, the surprisecomponent of monetary policy announcements can be measuredvery well using just daily data. Second, FOMC actions were pricedinto the federal funds futures market almost immediately—quicklyenough to be completely captured by our tight, thirty-minutewindow—consistent with the examples discussed above. Thus, wecan feel comfortable focusing on the analysis using our tight windowof thirty minutes, although we will report results using the widerone-hour window as well.
1.4 The Effect of Federal Funds Rate Changes on Asset Prices
Table 1 presents our results for regression equation (1) estimated us-ing intraday data on bond yields and stock prices.10 The independentvariable is the surprise component of the change in the federal fundsrate target just described, and the dependent variable is the changein the financial variable measured over the same window. We presentresults for the tight (thirty-minute), wide (one-hour), and daily win-dows described above.
Our results for stock prices imply that, on average, a surprise 25bp tightening in the federal funds rate leads to a little more than
10We obtained tick-by-tick Treasury yield data back to June 1991 for on-the-run Treasury securities from GovPX, a consortium of interdealer brokers thataccounted for a large portion of trading volume in Treasury securities over oursample. For equity prices, we obtained five-minute intraday quotes on the S&P500 index back to the mid-1980s, which are available from a variety of sources.

Vol. 1 No. 1 Do Actions Speak Louder Than Words? 67Tab
le1.
Res
pon
seof
Ass
etP
rice
sto
Chan
ges
inth
eFed
eral
Funds
Rat
e
Tig
ht
Win
dow
Wid
eW
indow
Dai
lyC
onst
ant
MP
Surp
rise
R2
Con
stan
tM
PSu
rpri
seR
2C
onst
ant
MP
Surp
rise
R2
(std
.er
r.)
(std
.er
r.)
(std
.er
r.)
(std
.er
r.)
(std
.er
r.)
(std
.er
r.)
S&P
500
–0.0
95∗∗
∗–4
.032
∗∗∗
.36
–0.0
59–4
.531
∗∗∗
.36
0.17
1*–3
.961
∗∗∗
.12
(0.0
34)
(1.1
10)
(0.0
42)
(1.0
69)
(0.0
90)
(1.5
60)
Thr
ee-M
onth
–0.0
05∗∗
0.53
7∗∗∗
.80
–0.0
07∗∗
0.58
3∗∗∗
.77
–0.0
040.
669∗
∗∗.5
6Bill
(0.0
02)
(0.0
40)
(0.0
03)
(0.0
38)
(0.0
04)
(0.0
87)
Six-
Mon
th–0
.005
0.52
2∗∗∗
.63
–0.0
07∗∗
0.57
0∗∗∗
.66
–0.0
080.
627∗
∗∗.5
4Bill
(0.0
03)
(0.0
57)
(0.0
03)
(0.0
53)
(0.0
05)
(0.0
83)
Two-
Yea
r–0
.002
0.45
5∗∗∗
.40
–0.0
010.
475∗
∗∗.3
3–0
.006
0.42
9∗∗∗
.23
Not
e(0
.004
)(0
.087
)(0
.006
)(0
.092
)(0
.007
)(0
.117
)
Fiv
e-Yea
r–0
.000
0.26
4∗∗∗
.19
0.00
00.
267∗
∗∗.1
4–0
.007
0.31
8∗∗
.13
Not
e(0
.004
)(0
.081
)(0
.005
)(0
.100
)(0
.007
)(0
.142
)
Ten
-Yea
r–0
.001
0.12
5∗∗
.08
0.00
00.
129
.05
–0.0
060.
166
.05
Not
e(0
.003
)(0
.058
)(0
.005
)(0
.080
)(0
.006
)(0
.124
)
Fiv
e-Yea
rFo
rwar
dRat
eFiv
eYea
rsA
head
–0.0
01–0
.087
*.0
50.
001
–0.0
61.0
2–0
.006
–0.0
42.0
0(0
.003
)(0
.047
)(0
.004
)(0
.061
)(0
.006
)(0
.114
)
Not
e:Sa
mpl
eis
allm
onet
ary
polic
yan
noun
cem
ents
from
July
1991
thro
ugh
Dec
embe
r20
04(J
anua
ry19
90–
Dec
embe
r20
04fo
rS&
P50
0).Tar
get
fact
oran
dpa
thfa
ctor
are
defin
edin
the
mai
nte
xt.H
eter
oske
dast
icity-
cons
iste
ntst
anda
rder
rors
repo
rted
inpa
rent
hese
s.∗ ,
∗∗,an
d∗∗
∗de
note
sign
ifica
nce
at10
perc
ent,
5pe
rcen
t,an
d1
perc
ent,
resp
ecti
vely
.Se
ete
xtfo
rde
tails
.

68 International Journal of Central Banking May 2005
a 1 percent fall in the S&P 500, and these estimates are highly sig-nificant. The estimated coefficients do not differ greatly across theintraday and daily regressions, although the effects of the omittedemployment report variable can be seen clearly in the scatter plotsin figure 3: the handful of days on which the policy decision followedan employment report, shown by the hollow points, do not appearunusual when the intraday data are used, but in the daily data theystand out as large policy easings that yielded no gains in equityprices, most likely due to the negative direct influence of the weakemployment reports.
The most striking feature of figure 3, however, is the increasein tightness of the relationship as we move from daily to intradaydata. By eliminating the effects of employment reports and othernews that occurred on the days of monetary policy announcements,the relationship between monetary policy actions and equity pricesbecomes much clearer in the figure. This advantage also stands outin the regression results in table 1, in terms of the much greaterprecision of the coefficient estimates and a tripling of R2 from .12to .36.
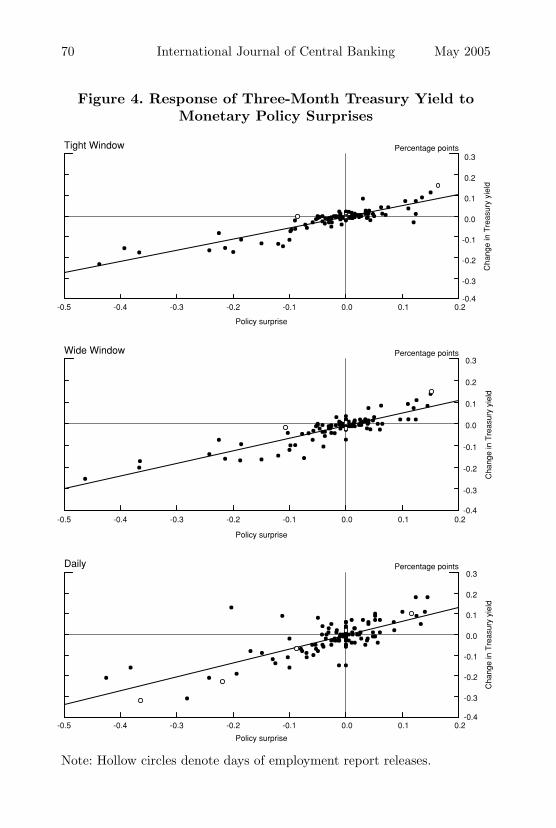
Intraday data yield additional benefits for our Treasury yield re-gressions. As shown in figure 4, employment report days (the hollowpoints) stand out in the daily data as very large funds rate surprisesand large changes in the three-month Treasury-bill rate in the samedirection, reflecting the fact that the employment report has a verylarge influence on both the FOMC decision and the short end of theTreasury yield curve.11 By contrast, those days do not stand outat all when the intraday windows are used. Moreover, employmentreport surprises appear to have a larger effect on the T-bill rate com-pared to policy surprises. Because of this, the estimated coefficient inthe regression is biased upward if daily data are used. As with equityprices, the response of the T-bill rate to monetary policy actions isalso estimated much more precisely using intraday data, reflected inthe much smaller standard errors (about half the size of the dailymeasures) and the much higher R2 (.80 versus .56).
The differences in the coefficients between the intraday regres-sions and the daily regression become much smaller at horizons of
11Recall that our intraday Treasury data extend back only to June 1991, so ourTreasury yield regressions and graphs contain eighteen fewer observations (andonly five employment report dates instead of eight).

Vol. 1 No. 1 Do Actions Speak Louder Than Words? 69
Figure 3. Response of S&P 500 to Monetary PolicySurprises
-2
0
2
4
6
-0.5 -0.4 -0.3 -0.2 -0.1 0.0 0.1 0.2
Percentage pointsTight Window
Policy surprise
Per
cent
cha
nge
in S
&P
500
-2
0
2
4
6
-0.5 -0.4 -0.3 -0.2 -0.1 0.0 0.1 0.2
Percentage pointsWide Window
Policy surprise
Per
cent
cha
nge
in S
&P
500
Per
cent
cha
nge
in S
&P
500
-2
0
2
4
6
-0.5 -0.4 -0.3 -0.2 -0.1 0.0 0.1 0.2
Percentage pointsDaily
Policy surprise
Note: Hollow circles denote days of employment report releases.
70 International Journal of Central Banking May 2005
Figure 4. Response of Three-Month Treasury Yield toMonetary Policy Surprises
-0.4
-0.3
-0.2
-0.1
0.0
0.1
0.2
0.3
-0.5 -0.4 -0.3 -0.2 -0.1 0.0 0.1 0.2
Percentage pointsTight Window
Policy surprise
Cha
nge
in T
reas
ury
yiel
d
-0.4
-0.3
-0.2
-0.1
0.0
0.1
0.2
0.3
-0.5 -0.4 -0.3 -0.2 -0.1 0.0 0.1 0.2
Percentage pointsWide Window
Policy surprise
Cha
nge
in T
reas
ury
yiel
d
-0.4
-0.3
-0.2
-0.1
0.0
0.1
0.2
0.3
-0.5 -0.4 -0.3 -0.2 -0.1 0.0 0.1 0.2
Percentage pointsDaily
Policy surprise
Cha
nge
in T
reas
ury
yiel
d
Note: Hollow circles denote days of employment report releases.

Vol. 1 No. 1 Do Actions Speak Louder Than Words? 71
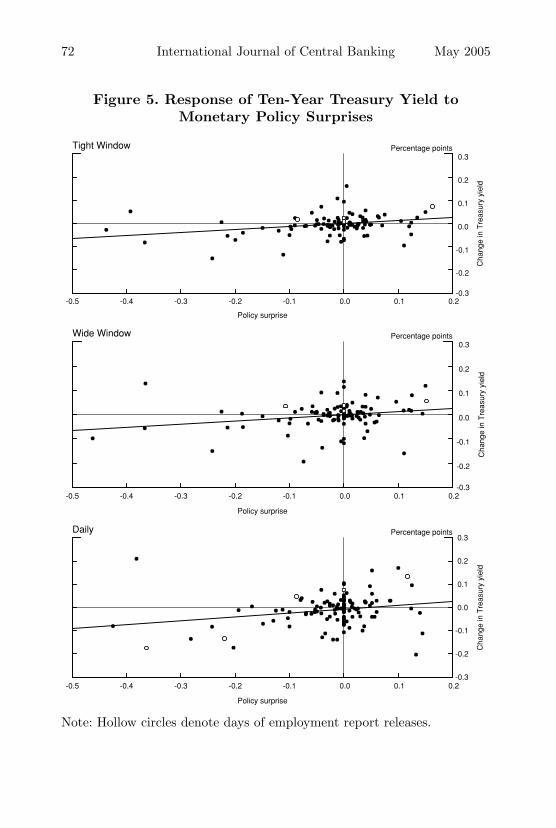
two years or more, but this observation is somewhat misleading, as asingle outlier, January 3, 2001, pulls the daily estimate toward the in-traday one (shown in figure 5).12 Without that one observation in theupper left, the daily regression would estimate a significant responseof the ten-year rate to the FOMC announcement of 0.28 rather thanthe statistically insignificant 0.17 that is estimated including the out-lier. By contrast, using the intraday data, the estimated coefficientchanges only very slightly (from 0.13 to 0.17) when we exclude thatobservation. As before, the precision of our estimates also improvesdramatically using intraday data, with the standard errors beingabout half as large. This makes the response of the ten-year Trea-sury yield—which is statistically indistinguishable from zero usingdaily data—significantly greater than zero (albeit small) using ourtight-window data.
The response of the term structure can also be expressed in termsof forward rates. We compute the five-year forward Treasury rate be-ginning five years ahead from five- and ten-year Treasury yields usingthe Shiller-Campbell-Schoenholtz (1983) approximation. The esti-mated response of the forward rate to the policy surprise is negativeover this sample. This is consistent with the findings of Gurkaynak,Sack, and Swanson (2003) that far-ahead forward rates typicallymove inversely with the monetary policy surprise, although our es-timates here are not highly statistically significant, partly becausewe cannot compute intraday forward rate changes that begin morethan five years ahead. Gurkaynak, Sack, and Swanson (2003) presenttheir findings in terms of the nine-year-ahead one-year forward rate,which is probably a better measure of far-ahead forward rates.13
12On that day, although the FOMC unexpectedly eased policy, which wouldnormally be associated with a fall in Treasury yields, market participants re-portedly became much more optimistic about the economic outlook as a result,leading to a huge rally in equity markets (including an astounding 14 percent risein the NASDAQ that afternoon) and a large upward shift in Treasury yields. Thisoutlier poses particular problems for a researcher using only daily data, since it isunclear whether the observation should be dropped or retained, and the empiricalresults are highly sensitive to this choice; by contrast, using the intraday data,the observation poses no problems.
13We only have intraday data for the on-the-run five- and ten-year Treasurynotes, which gives us the forward rate from five to ten years ahead, but not for anyfiner subintervals. The five-year-ahead five-year rate may not capture movementsin far-ahead forward rates as well as the nine-year-ahead one-year rate.
72 International Journal of Central Banking May 2005
Figure 5. Response of Ten-Year Treasury Yield toMonetary Policy Surprises
-0.3
-0.2
-0.1
0.0
0.1
0.2
0.3
-0.5 -0.4 -0.3 -0.2 -0.1 0.0 0.1 0.2
Percentage pointsTight Window
Policy surprise
Cha
nge
in T
reas
ury
yiel
d-0.3
-0.2
-0.1
0.0
0.1
0.2
0.3
-0.5 -0.4 -0.3 -0.2 -0.1 0.0 0.1 0.2
Percentage pointsWide Window
Policy surprise
Cha
nge
in T
reas
ury
yiel
d
-0.3
-0.2
-0.1
0.0
0.1
0.2
0.3
-0.5 -0.4 -0.3 -0.2 -0.1 0.0 0.1 0.2
Percentage pointsDaily
Policy surprise
Cha
nge
in T
reas
ury
yiel
d
Note: Hollow circles denote days of employment report releases.

Vol. 1 No. 1 Do Actions Speak Louder Than Words? 73
2. The Effects of FOMC Statements on Asset Prices
2.1 Testing for Additional Dimensions of Monetary PolicyAnnouncements
The preceding section assumed that the effects of FOMC an-nouncements on asset prices are completely (or at least adequately)described by the surprise component of the change in the federalfunds rate target. Although this assumption is standard in the exist-ing literature, the example of January 28, 2004, given earlier raises se-rious questions regarding its validity. In this section, we ask whetherthe example of January 28 was a one-time occurrence or a manifes-tation of something much more systematic. If the latter, how manyadditional dimensions are required to adequately characterize mon-etary policy announcements?14
The above questions essentially ask how many latent factors un-derlie the response of asset prices to monetary policy announcements.Let X denote the T×n matrix, with rows corresponding to mone-tary policy announcements, columns corresponding to asset prices,and each element of X reporting the change in the correspondingasset price in a thirty-minute window around the corresponding an-nouncement. Writing X in the form
X = FΛ + η (2)
where F is a T×k matrix of unobserved factors (with k < n), Λ is ak×n matrix of factor loadings, and η is a T×n matrix of white noisedisturbances, we wish to know how many factors (columns of F )are required to adequately describe X. The hypothesis that a singlefactor (for example, the surprise component of changes in the federalfunds rate) is sufficient is a statement that there exists a T×1 vectorF and constants λi, i = 1,...,k, such that the matrix X is describedby F×[λ1,...,λk] up to white noise.
This restriction on the structure of the data X can be testedusing the matrix rank test of Cragg and Donald (1997). In brief,the null hypothesis that X is described by k0 common factors can
14One can imagine that several dimensions might be required, corresponding toinformation about the future path of interest rates, policymakers’ objectives andpreferences, and perhaps the future paths of output and inflation, if the FOMCpossesses private information about these latter two variables.

74 International Journal of Central Banking May 2005
be tested against the alternative that X is described by k > k0
factors by measuring the minimum distance between Cov(X) andthe covariance matrices of all possible factor models (2) with k0
factors. This distance, after a suitable normalization, has a limitingχ2 distribution with (n − k0)(n − k0+1)/2 – n degrees of freedom.Additional details of the method are provided in the appendix.
Table 2 reports the results of this test applied to two sets ofassets: one that includes all of our Treasury yields and stock prices,and another that includes only federal funds futures and eurodollarfutures with one year or less to expiration.15 We consider the latterset of assets in this table because they will turn out to be very usefulin the structural interpretation of the factors, below.
As can be seen in table 2, the hypothesis that the response of as-set prices to monetary policy announcements is characterized by zeroor by one common factor is clearly rejected. An important and directcorollary of this finding is that surprise changes in the federal fundsrate alone are not sufficient to describe the response of asset prices tomonetary policy announcements, in contrast to one of the standardassumptions in the literature. However, as is also clear in table 2,we find that two factors are sufficient—tests of this hypothesis arenot rejected at even the 10 percent level. Given our strong rejectionof zero or one factor, this result is perhaps somewhat surprising—itimplies that, despite the potentially unlimited complexity of mone-tary policy statements and hence announcements, financial marketsnonetheless have reacted as if there is essentially only one additionaldegree of information beyond the surprise change in the federal fundsrate target. In the remainder of this section, we turn to estimatingand interpreting this additional dimension of U.S. monetary policyand estimating its effect on Treasury yields and stock prices.
15Treasury yields include the three-month, six-month, two-year, five-year, andten-year yields. Recall that we only have intraday data for these yields begin-ning in July 1991, which explains the smaller number of observations for thesesecurities in table 2. For futures rates, we use five contracts that pin down theexpected path of the federal funds rate over the next year without overlapping:the current-month and three-month-ahead federal funds futures contracts (witha scale factor to account for the timing of FOMC meetings within the month)and the two-, three-, and four-quarter-ahead eurodollar futures contracts. See theappendix for details. Avoiding overlap is desirable because very similar assets willtend to covary strongly, producing an additional factor even if that variation isorthogonal to all of the other assets in X.

Vol. 1 No. 1 Do Actions Speak Louder Than Words? 75
Tab
le2.
Tes
tsof
Num
ber
ofFac
tors
Char
acte
rizi
ng
Mon
etar
yPol
icy
Annou
nce
men
ts
Tre
asur
yY
ield
san
dSt
ock
Pri
ces
Futu
res
Rat
esw
ith≤
1Y
ear
toE
xpir
atio
n
H0:
Num
ber
ofχ
2D
egre
esχ
2D
egre
esFa
ctor
sW
ald
ofN
umbe
rof
Wal
dof
Num
ber
ofE
qual
sSt
atis
tic
Free
dom
p-v
alue
Obs
.St
atis
tic
Free
dom
p-v
alue
Obs
.
046
.72
15.0
0004
120
36.6
110
.000
0713
8
121
.41
9.0
1112
017
.19
5.0
0413
8
24.
364
.360
120
1.06
1.3
0413
8
Not
e:Tes
tis
from
Cra
ggan
dD
onal
d(1
997)
and
test
sth
enu
llhy
poth
esis
ofN
H0
fact
ors
agai
nst
the
alte
rnat
ive
ofN
>N
H0
fact
ors.
Sam
ple:
Janu
ary
1990
–Dec
embe
r20
04(J
uly
1991
–Dec
embe
r20
04fo
rTre
asur
ies)
.Tre
asur
yyi
elds
com
pris
eth
ree-
mon
th,s
ix-m
onth
,tw
o-ye
ar,fi
ve-y
ear,
and
ten-
year
yiel
ds,s
tock
pric
esth
eS&
P50
0.Fu
ture
sra
tesco
mpr
ise
one-
and
thre
e-m
onth
-ahe
adfe
dera
lfun
dsfu
ture
sra
tes(w
ith
scal
ead
just
men
tfo
rti
min
gof
FO
MC
mee
ting
sw
ithi
nth
em
onth
)an
dtw
o-,th
ree-
,an
dfo
ur-q
uart
er-a
head
euro
dolla
rfu
ture
sra
tes.
76 International Journal of Central Banking May 2005
2.2 Estimation of the Two Factors
We estimate the unobserved factor matrix F using the standardmethod of principal components applied to our data matrix X.16
This procedure decomposes the matrix X into a set of orthogonalvectors Fi, i= 1,..., n, where F1 is the (length-T ) vector that hasmaximum explanatory power for X, F2 is the vector that has maxi-mum explanatory power for the residuals of X after projecting eachcolumn on F1, and so on. Based on the results of our factor ranktest, above, we will restrict attention to the first two factors (F1
and F2) estimated by this procedure. Details are provided in theappendix.
As mentioned above, we estimate the unobserved factors F1 andF2 using the set of federal funds futures and eurodollar futures rateswith one year or less to expiration that characterize the expectedpath of the funds rate over the upcoming year.17 Estimates of theunobserved factors using Treasury yields and stock prices are quitesimilar; the reason for focusing on the shorter-term futures rates forestimation is that it makes the structural interpretation of the twofactors, and interpretation of the effects of the two factors on bondyields and stock prices, more clear.
2.3 A Structural Interpretation of the Two Factors
The two factors F1 and F2 explain a maximal fraction of the vari-ance of X, but do not have a structural interpretation. For example,both factors are correlated with the surprises in the current federalfunds rate target, so we cannot interpret one factor as the changein the federal funds rate target and the other factor as some otherdimension of monetary policy. To address this deficiency and allowfor a more structural interpretation of the factors, we perform a ro-tation of F1 and F2 to yield two new factors, which we call Z1 and
16The primary alternative to principal components is Kalman filtering, whichis optimal under the assumption of normally distributed residuals. However, thenormality assumption may not fit our data very well.
17Gurkaynak, Sack, and Swanson (2002) show that these rates are the bestfinancial market predictors of the federal funds rate at horizons out to a year. Asone familiar with factor decompositions of the yield curve might expect, we findthat F1 and F2 look very much like “level” and “slope” factors from that litera-ture, although our sample differs from that literature in that we focus exclusivelyon the brief intervals around monetary policy announcements.
Vol. 1 No. 1 Do Actions Speak Louder Than Words? 77
Z2, which are still orthogonal and explain the matrix X to exactlythe same extent that F1 and F2 did, but for which the second factor(Z2) has no effect on the current federal funds rate. In other words,we define
Z = FU
in such a way that U is a 2×2 orthogonal matrix and the secondcolumn of Z is a vector that is associated on average with no changein the current-month federal funds futures rate. Exact details of thisrotation are reported in the appendix. As a result of this transfor-mation, we can regard the unexpected change in the current targetfor the federal funds rate as being driven exclusively by Z1 (plus asmall amount of white noise), and Z2 represents all other aspectsof FOMC announcements that move futures rates for the upcomingyear without changing the current federal funds rate. The factor Z2
therefore includes any information (besides the decision for the cur-rent target rate) that affects the expected path for monetary policyover the upcoming year. Accordingly, we refer to Z1 and Z2 as the“target” factor and the “path” factor, respectively. The estimatedvalues for the target and path factors for each monetary policy an-nouncement in our sample are reported in table 3 of the online dataappendix.
Note that the target factor (Z1) defined in this way should besimilar to—but not exactly equal to—the measure of federal fundstarget surprises we presented in the previous section and reported indata appendix table 2.18 To check the tightness of the relationshipbetween these two measures, we regressed our target surprises onthe factor Z1 (results not reported) and found that Z1 is in factvery close to our previous measure, with a correlation of over 95percent (R2 of .91). Thus, to further facilitate interpretation of Z1
18The two measures generally are not identical because the factor estimationprocedure strips out white noise from the data. Thus, Z1 will tend to excludepart of the “timing” component of federal funds rate surprises—i.e., changes inthe funds rate target that are only a surprise to the extent that they occur atthe present meeting instead of the next meeting. (Gurkaynak, Sack, and Swanson[2002] and Gurkaynak [2005] discuss “timing” surprises in more detail.) To theextent that assets other than the current-month federal funds futures rate ignorethese timing surprises, the factor estimation procedure will assign this componentto white noise rather than to Z1. In this respect, Z1 is a better measure of theimportant component of funds rate surprises than is the standard measure basedon the current-month futures rate.

78 International Journal of Central Banking May 2005
as the surprise change in the funds rate target, we normalize its scaleso that a change of .01 in Z1 corresponds to a surprise of 1 bp inthe federal funds rate target. Similarly, to facilitate interpretationof the second factor, we normalize its scale so that the effect of Z2
on the four-quarter-ahead eurodollar futures rate is exactly the sameas the effect of Z1 on the four-quarter-ahead eurodollar futures rate,about 55 bp.19
2.4 The Association Between the Path Factor and FOMCStatements
The path factor Z2 corresponds to all aspects of FOMC announce-ments that move futures rates for the upcoming year without chang-ing the current federal funds rate; thus, it is to some extent a residualthat is subject to various interpretations. In this section, we presentthree pieces of evidence that show a close correlation between thepath factor and FOMC statements: first, a time series plot that al-lows comparison of pre-1994 to post-1994 (and also statement tononstatement) monetary policy announcements; second, a regressiontest of the path factor on a dummy variable indicating the presenceof an FOMC statement; and third, a case study of the largest pathfactor observations in our sample. In addition, in section 2.5 below,we compare our estimated effects of the path factor on asset prices tothe effects of the FOMC minutes release on January 4, 2005, which,because of new procedures adopted by the FOMC, has many of thefeatures of an FOMC statement release with no change in the fundsrate target.
In figure 6, we plot the target and the path factors over time,with dates on which there was an FOMC statement plotted as solidbars and those on which there was no FOMC statement (dates priorto 1994 and dates from 1994 to 1999 on which there was no changein the federal funds rate target) plotted as hollow bars. As can beseen in the figure, there have been many large realizations of thepath factor in recent years, while realizations of the path factor priorto 1994 (and on nonstatement days in general) were typically verysmall.
19These scale normalizations are performed for the July 1991–December 2004sample, the period for which we have data on U.S. Treasury yields.

Vol. 1 No. 1 Do Actions Speak Louder Than Words? 79
Figure 6. Monetary Policy Surprises as Two Factors
-50-40-30-20-10010203040
Basis points Target Factor
StatementNo Statement
1990 1991 1992 1993 1994 1995 1996 1997 1998 1999 2000 2001 2002 2003 2004
-50-40-30-20-10010203040
Basis points Path Factor
StatementNo Statement
1990 1991 1992 1993 1994 1995 1996 1997 1998 1999 2000 2001 2002 2003 2004
Table 3 verifies this observation econometrically by regressingthe absolute value of the path factor on a constant and a dummyvariable that takes on the value one for all dates on which therewas an FOMC statement. The coefficient on the dummy variable ispositive and highly statistically significant, allowing us to strongly
Table 3. Estimated Effects of Policy Statements onthe Size of the Path Factor
Dependent Constant Statement NumberVariable (std. err.) (std. err.) R2 of Obs.
Abs(Z2) 0.044∗∗∗ 0.070∗∗∗ .18 138(0.005) (0.014)
Note: Regression of absolute value of path factor on a constantand dummy variable indicating presence of an FOMC statement.Heteroskedasticity-consistent standard errors reported in parenthe-ses. ∗∗∗ denotes significance at 1 percent level.
80 International Journal of Central Banking May 2005
reject the hypothesis that FOMC statements and the path factor areunrelated.20
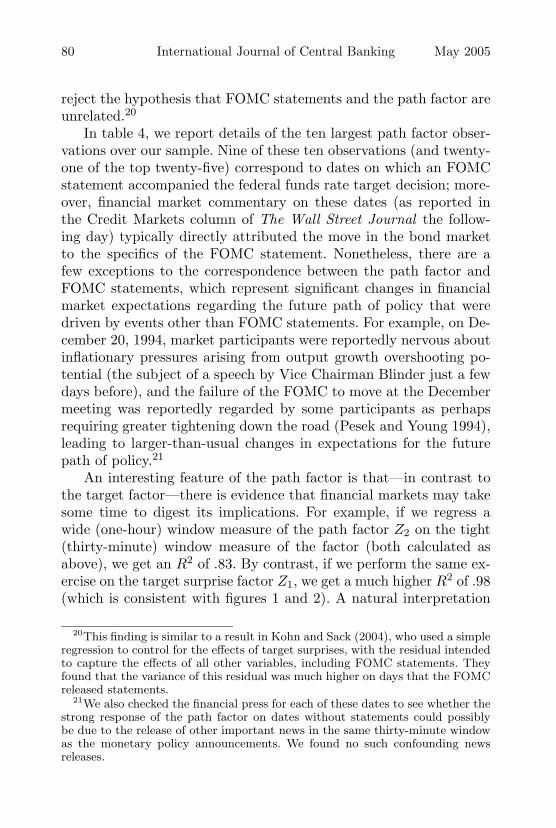
In table 4, we report details of the ten largest path factor obser-vations over our sample. Nine of these ten observations (and twenty-one of the top twenty-five) correspond to dates on which an FOMCstatement accompanied the federal funds rate target decision; more-over, financial market commentary on these dates (as reported inthe Credit Markets column of The Wall Street Journal the follow-ing day) typically directly attributed the move in the bond marketto the specifics of the FOMC statement. Nonetheless, there are afew exceptions to the correspondence between the path factor andFOMC statements, which represent significant changes in financialmarket expectations regarding the future path of policy that weredriven by events other than FOMC statements. For example, on De-cember 20, 1994, market participants were reportedly nervous aboutinflationary pressures arising from output growth overshooting po-tential (the subject of a speech by Vice Chairman Blinder just a fewdays before), and the failure of the FOMC to move at the Decembermeeting was reportedly regarded by some participants as perhapsrequiring greater tightening down the road (Pesek and Young 1994),leading to larger-than-usual changes in expectations for the futurepath of policy.21
An interesting feature of the path factor is that—in contrast tothe target factor—there is evidence that financial markets may takesome time to digest its implications. For example, if we regress awide (one-hour) window measure of the path factor Z2 on the tight(thirty-minute) window measure of the factor (both calculated asabove), we get an R2 of .83. By contrast, if we perform the same ex-ercise on the target surprise factor Z1, we get a much higher R2 of .98(which is consistent with figures 1 and 2). A natural interpretation
20This finding is similar to a result in Kohn and Sack (2004), who used a simpleregression to control for the effects of target surprises, with the residual intendedto capture the effects of all other variables, including FOMC statements. Theyfound that the variance of this residual was much higher on days that the FOMCreleased statements.
21We also checked the financial press for each of these dates to see whether thestrong response of the path factor on dates without statements could possiblybe due to the release of other important news in the same thirty-minute windowas the monetary policy announcements. We found no such confounding newsreleases.

Vol. 1 No. 1 Do Actions Speak Louder Than Words? 81
Tab
le4.
Ten
Lar
gest
Obse
rvat
ions
ofth
ePat
hFac
tor
Z1
Z2
(Targ
et(P
ath
Date
Fact
or)
Fact
or)
Sta
tem
ent
Fin
anci
alM
ark
etC
om
men
tary
Jan.28,2004
–1.1
42.7
√Sta
tem
ent
dro
ps
com
mit
men
tto
kee
ppolicy
unch
anged
for
“a
consi
der
able
pe-
riod,”
bri
ngin
gfo
rward
expec
tati
ons
offu
ture
tighte
nin
gs
Jul.
6,1995
–8.7
–38.4
√Fir
stea
sing
aft
erlo
ng
(sev
ente
en-m
onth
)se
ries
ofti
ghte
nin
gs
rais
esex
pec
tati
ons
offu
rther
easi
ngs;
state
men
tnote
sth
at
inflati
onary
pre
ssure
shave
rece
ded
Aug.13,2002
8.1
–37.2
√Sta
tem
ent
announce
sbala
nce
ofri
sks
has
shifte
dfr
om
neu
tralto
econom
icw
eak-
nes
s
May
18,1999
0.5
32.8
√Sta
tem
ent
announce
sch
ange
inpolicy
bia
sgoin
gfo
rward
from
neu
tralto
tight-
enin
g
May
6,2003
5.2
–27.0
√Sta
tem
ent
announce
sbala
nce
of
risk
snow
dom
inate
dby
risk
of
“an
unw
elco
me
subst
anti
alfa
llin
inflati
on”
Dec
.20,1994
–15.1
26.6
Surp
rise
that
FO
MC
not
tighte
nin
gco
nsi
der
ing
rece
nt
com
men
tsby
Blinder
on
“over
shooti
ng”;so
me
fear
Fed
may
have
toti
ghte
nm
ore
in1995
as
are
sult
Oct
.5,1999
–2.7
25.8
√Sta
tem
ent
announce
sch
ange
inpolicy
bia
sgoin
gfo
rward
from
neu
tralto
tight-
enin
g
Oct
.28,2003
3.9
–24.4
√Sta
tem
entle
aves
the
“co
nsi
der
able
per
iod”
com
mit
men
tunch
anged
,push
ing
back
expec
tati
ons
offu
ture
tighte
nin
gs
Jan.3,2001
–32.3
22.8
√Larg
esu
rpri
sein
term
eeti
ng
ease
report
edly
cause
sfinanci
alm
ark
etsto
mark
dow
npro
bability
ofa
rece
ssio
n;Fed
isper
ceiv
edas
bei
ng
“ahea
dofth
ecu
rve”
and
as
nee
din
gto
ease
less
dow
nth
ero
ad
as
are
sult
Oct
.15,1998
–24.0
–22.6
√Fir
stin
term
eeti
ng
move
since
1994
and
state
men
tpoin
ting
to“unse
ttle
dco
ndi-
tions
infinanci
alm
ark
ets.
..re
stra
inin
gaggre
gate
dem
and”
incr
ease
sex
pec
tati
ons
offu
rther
easi
ngs

82 International Journal of Central Banking May 2005
of this finding is that changes in the federal funds rate target it-self are immediately and clearly observable to all financial marketparticipants within minutes of the announcement while, by contrast,FOMC statements about the policy and economic outlook typicallyrequire time to digest and are subject to a great deal of uncertaintywith respect to how they are interpreted by other financial mar-ket participants, so that the process of assimilating the informationcontained in the statements is not instantaneous. Nonetheless, wecontinue to emphasize our tight window responses in the analysisbelow because most of the policy information is incorporated withinthat window and having a narrower window reduces the amount ofnoise in our left-hand-side variables, increasing the precision of ourestimates.22
2.5 The Response of Asset Prices to the Target Factor andPath Factor
We now estimate the effects of each of these two dimensions of mone-tary policy announcements on asset prices. For each monetary policyannouncement from January 1990 through December 2004, we haveestimates of the target factor and path factor components of the an-nouncement and we observe the change in Treasury yields and stockprices in a narrow window bracketing the announcement (the sameleft-hand-side variables as in section 1).23 For each Treasury yield orstock prices, we run the regression
∆yt = α + β Z1,t + γ Z2,t + εt. (3)
Results are reported in table 5.24
22Robustness tests using the wide window data were in line with the resultsreported below.
23Recall that, due to data availability, we only observe intraday Treasury re-sponses beginning in July 1991.
24Because the regressors in table 5 are generated rather than directly observed,we have also computed the standard errors by bootstrapping to capture the addi-tional sampling error associated with the first-stage factor estimation procedure.The statistical significance of all our results was essentially identical whetherwe used the bootstrapped or asymptotic standard errors. Bootstrap percentileswere based on 1,000 repetitions; in each repetition, we sampled 138 new observa-tions from the data with replacement, took the two largest principal componentsfrom the synthetic futures data, rotated and normalized them, and regressed the

Vol. 1 No. 1 Do Actions Speak Louder Than Words? 83
Tab
le5.
Res
pon
seof
Ass
etP
rice
sto
Tar
get
and
Pat
hFac
tors
One
Facto
rT
wo
Facto
rs
Const
ant
Targ
etFact
or
R2
Const
ant
Targ
etFact
or
Path
Fact
or
R2
(std
.er
r.)
(std
.er
r.)
(std
.er
r.)
(std
.er
r.)
(std
.er
r.)
MP
Surp
rise
–0.0
21∗∗
∗1.0
00∗∗
∗.9
1–0.0
21∗∗
∗1.0
00∗∗
∗0.0
01
.91
(0.0
03)
(0.0
47)
(0.0
03)
(0.0
48)
(0.0
26)
One-
Yea
r-A
hea
d–0.0
18∗∗
∗0.5
55∗∗
∗.3
6–0.0
17∗∗
∗0.5
51∗∗
∗0.5
51∗∗
∗.9
8Euro
dollar
Futu
re(0
.006)
(0.0
76)
(0.0
01)
(0.0
17)
(0.0
14)
....................................................................................................................................................................................................
S&
P500
–0.0
08
–4.2
83∗∗
∗.3
7–0.0
08
–4.2
83∗∗
∗–0.9
66
.40
(0.0
41)
(1.0
83)
(0.0
40)
(1.1
44)
(0.5
94)
Two-Y
ear
Note
–0.0
11∗∗
0.4
85∗∗
∗.4
1–0.0
11∗∗
∗0.4
82∗∗
∗0.4
11∗∗
∗.9
4(0
.005)
(0.0
80)
(0.0
02)
(0.0
32)
(0.0
23)
Fiv
e-Yea
rN
ote
–0.0
06
0.2
79∗∗
∗.1
9–0.0
06∗∗
0.2
76∗∗
∗0.3
69∗∗
∗.8
0(0
.005)
(0.0
78)
(0.0
02)
(0.0
44)
(0.0
35)
Ten
-Yea
rN
ote
–0.0
04
0.1
30∗∗
.08
–0.0
04*
0.1
28∗∗
∗0.2
83∗∗
∗.7
4(0
.004)
(0.0
59)
(0.0
02)
(0.0
39)
(0.0
25)
Fiv
e-Yea
rForw
ard
Rate
Fiv
eYea
rsA
hea
d
0.0
01
–0.0
98∗∗
.06
0.0
01
–0.0
99∗∗
0.1
57∗∗
∗.3
4(0
.003)
(0.0
49)
(0.0
03)
(0.0
47)
(0.0
28)
Note
:Sam
ple
isall
monet
ary
policy
announce
men
tsfr
om
July
1991–D
ecem
ber
2004
(January
1990–D
ecem
ber
2004
for
S&
P500).
Targ
etfa
ctor
and
path
fact
or
are
defi
ned
inth
em
ain
text.
Het
erosk
edast
icity-c
onsi
sten
tst
andard
erro
rsre
port
edin
pare
nth
eses
.∗ ,
∗∗,and
∗∗∗
den
ote
signifi
cance
at
10
per
cent,
5per
cent,
and
1per
cent,
resp
ecti
vel
y.See
text
for
det
ails.

84 International Journal of Central Banking May 2005
As we would expect from the close correspondence between ourtarget factor and the funds rate target surprises in section 1 (andfrom the orthogonality of Z2 to Z1), the estimated coefficients on thetarget factor (Z1) are very similar to those we estimated previously intable 1. In particular, we estimate that a 1 percentage point surprisetightening in the federal funds rate leads, on average, to a 4.3 percentdecline in the S&P 500 and increases of 49, 28, and 13 bp in two-,five-, and ten-year Treasury yields, respectively.
The novel feature of table 5, however, is our estimates of theeffects of the path factor (Z2) on asset prices. As can be seen inthe table, the effect of this factor on the one-year-ahead eurodollarfuture rate is the same as the effect of the target factor, by defini-tion.25 However, the path factor has effects on the other financialvariables that differ considerably from the target factor. In particu-lar, the path factor has a much greater impact on the long end ofthe yield curve, with a 1 percentage point innovation to the factorcausing responses of 37 and 28 bp in five- and ten-year Treasuryyields, respectively. Thus, FOMC statements that move one-year-ahead policy expectations appear to have much greater effects onthe long end of the yield curve than do changes in the federal fundstarget rate itself, even when they generate the same size movementin one-year-ahead interest rates. Moreover, as can be seen by com-paring the R2 statistics from the one- and two-factor regressions, thelarge majority of variation in long-term Treasury yields seems to bedue to statements rather than funds rate changes, with two-thirdsof the explainable variation in two-year yields, three-fourths of theexplainable variation in five-year yields, and nine-tenths of the ex-plainable variation in ten-year yields attributable to the path factorrather than to changes in the federal funds rate target. Thus, byfocusing only on the FOMC’s decisions regarding the current fed-eral funds rate target, previous authors have been missing by far themost important component of monetary policy decisions, especially
synthetic changes in asset prices on the synthetically generated Z1 or Z1 and Z2.The bootstrapped standard errors are available from the authors upon request.
25The path factor is orthogonal to the monetary policy surprise (and the targetfactor) over our full sample, January 1990–December 2004. The coefficient of theMP Surprise on the path factor in table 5 is not exactly zero because it is reportedfor the July 1991–December 2004 sample, for comparability to the Treasury yieldresponses.

Vol. 1 No. 1 Do Actions Speak Louder Than Words? 85
in recent years when target funds rate changes have often been well-anticipated.
By contrast, the effect of changes in the path factor on the stockmarket appears to be smaller than the effect of changes in the fundsrate target, amounting to only about –1 percent for a 1 percentagepoint innovation. Given the yield curve findings above, this result issomewhat surprising: for longer-maturity Treasury securities, policy-makers’ statements seem to have much larger effects than changes inthe current federal funds rate, but the effect of statements on stockprices, which also have very long durations, is smaller.
One possible explanation for this pattern is that the statementsthat seem to drive the path factor lead, to a greater extent, to pos-itive revisions in investors’ assessment of the future path of outputand inflation, consistent with a story first formalized by Romer andRomer (2000).26 A large positive realization of the path factor, forexample, might be related to a statement suggesting that the FOMCsees greater output or inflation going forward than markets had beenexpecting. Gurkaynak, Sack, and Swanson (forthcoming) show thatlong-term yields move substantially and positively in response topositive surprises in macroeconomic data releases for output and in-flation; thus, if in fact FOMC statements do reveal information aboutthe future course of these variables, the strong response of long-termyields to the path factor in this paper would be completely consis-tent with those earlier results. Moreover, to the extent that financialmarkets revise upward their forecasts of output (and hence earningsand dividends) in response to positive path factor surprises, thenthe tendency for stocks to fall in response would be muted by theupwardly revised economic outlook.
As a final note, the events of January 4, 2005, provide us with aninteresting out-of-sample test of our results. At 2:00 p.m. that day,the FOMC for the first time released the minutes for its previousmeeting under a new, accelerated schedule—three weeks before (asopposed to a few days after) the next FOMC meeting. This gives
26This story has been questioned on the basis of a pure target factor analysis byFaust, Swanson, and Wright (2004b). Those authors find that surprise tighteningsin what we call the target factor convey essentially no positive information aboutthe future path of output or inflation. However, as in all of the previous literature,those authors did not consider changes in what we call the path factor, whichour results suggest could be more informative about these variables.

86 International Journal of Central Banking May 2005
the minutes release on that date many of the features of an FOMCstatement: for example (and in contrast to speeches or testimony byindividual FOMC members), the minutes report the thinking anddeliberation of the entire FOMC and have been voted on and ap-proved by the whole committee; moreover, the minutes now provideadditional information about the most recent FOMC meeting. Inthe thirty-minute window around the minutes release on January 4,one-year-ahead eurodollar futures rose 6.5 bp, as the minutes weretaken to imply greater risks of inflation and funds rate tighteningthan markets had previously been expecting. Two-, five-, and ten-year Treasury yields increased 4.9, 5.0, and 4.1 bp, respectively—verymuch in line with our estimates of the effects of the path factor intable 5, which would predict changes of 4.8, 4.4, and 3.3 bp for thesesecurities, respectively. The S&P 500 declined by .49 percent, some-what larger than the .11 percent decline predicted by table 5, andthe five-to-ten-year forward rate rose by 3.0 bp, a bit more than the1.9 bp predicted by our estimates. Although we cannot rule out thepossibility that markets view minutes and FOMC statements as dif-fering in important ways, all of these results are broadly in line withour estimates of the effects of FOMC statements, suggesting thatour estimation and identification procedures have been reasonablyeffective.
3. Conclusions
Do central bank actions speak louder than words? We find that theanswer to this question is a qualified “no.” In particular, we find thatviewing the effects of FOMC announcements on financial markets asdriven by a single factor—changes in the federal funds rate target—is inadequate. Instead, we find that a second policy factor—one notassociated with the current federal funds rate decision of the FOMCbut instead with statements that it releases—accounted for morethan three-fourths of the explainable variation in the movements offive- and ten-year Treasury yields around FOMC meetings.
We emphasize that our findings do not imply that FOMC state-ments represent an independent policy tool. In particular, FOMCstatements likely exert their effects on financial markets throughtheir influence on financial market expectations of future policy ac-tions. Viewed in this light, our results do not indicate that policy
Vol. 1 No. 1 Do Actions Speak Louder Than Words? 87
actions are secondary so much as that their influence comes earlier—when investors build in expectations of those actions in response toFOMC statements (and perhaps other events, such as speeches andtestimony by FOMC members).
Our findings have important implications for the literature on theeffects of monetary policy on asset markets. Indeed, we have shownthat previous studies estimating the effects of changes in the federalfunds rate on bond yields and stock prices have been missing mostof the story. This is especially true in recent years, when FOMCdecisions regarding the target for the funds rate have rarely been asurprise and, instead, changes in the wording of FOMC statementstypically have been the major driver of financial market responses.
More broadly, our finding that FOMC statements have such sig-nificant effects on asset prices suggests that the FOMC has the abilityto conduct policy with a substantial degree of commitment to a state-contingent, or conditional, path for the funds rate several quarters oreven years into the future. This finding has important implicationsfor the conduct of monetary policy in a low-inflation environment—in particular, even when faced with a low or zero nominal funds rate,our results directly support the theoretical analysis of Reifschneiderand Williams (2000) and Eggertsson and Woodford (2003) that theFOMC is largely unhindered in its ability to conduct policy, becauseit has the ability to manipulate financial market expectations of fu-ture policy actions and thereby longer-term interest rates and theeconomy more generally.
Appendix. Factor Model Rank Test and Estimation
Testing the Number of Factors
Let X denote a T×n matrix of data generated by a factor model:
X = FΛ + η, (A1)
where F is a T×k matrix of unobserved factors (with k < n), Λ isa k×n matrix of factor loadings, and η is a T×n matrix of whitenoise disturbances. We wish to test the hypothesis that X was gen-erated by k0 factors against the alternative that X was generatedby k > k0 factors. We do this by computing the distance between

88 International Journal of Central Banking May 2005
the covariance matrix of the data, X, and the set of all covariancematrices corresponding to factor models (A1) with k0 factors.
The covariance matrix ΣX of the data, X, has elements given byσjk = (1/T )
∑i (xij − xj)(xik − xk). To compute the Wald statistic,
below, we also need to know the sampling uncertainty surroundingthe σjk. This is given by:
Cov(σjk, σlm) = (1/T 2)∑
i
[(xij − xj)(xik − xk)− σjk]
× [(xil − xl)(xim − xm) − σlm]. (A2)
The covariance matrix of the factor model (A1) is given byΛ′Λ + Ση. To compute the distance between the two, we stack theelements of ΣX and Λ′Λ + Ση into vectors and normalize the dif-ference, vech(ΣX) – vech(Λ′Λ + Ση), by Cov(vech(ΣX)), whose ele-ments are given by (A2):
W = [vech(ΣX)− vech(Λ′Λ + Ση)]′Ω−1[vech(ΣX)− vech(Λ′Λ + Ση)],(A3)
where Ω = Cov(vech(ΣX)). We search over all possible factor load-ings Λ (nk0 parameters) and white noise variances Ση (n parameters)to find the minimum distance (A3). Under the null hypothesis, thisis a Wald statistic with limiting χ2 distribution on n(n + 1)/2 –(nk0 + n) + k0(k0 − 1)/2 degrees of freedom (the last term comesfrom the fact that there are k0(k0–1)/2 possible rotations of the un-observed factors F , and hence Λ, which all yield the same observablemodel). The Matlab code that performs this factor test is availablefrom the authors upon request.
Factor Estimation
To estimate the unobserved factors F , let X be the matrix with138 rows corresponding to monetary policy announcements and fivecolumns corresponding to futures contracts with one year or less tomaturity. The third through fifth columns of X are the changes inprice of the second, third, and fourth eurodollar futures contracts,which have 1.5, 2.5, and 3.5 quarters to expiration on average (eu-rodollar futures have expiration dates that lie about two weeks before
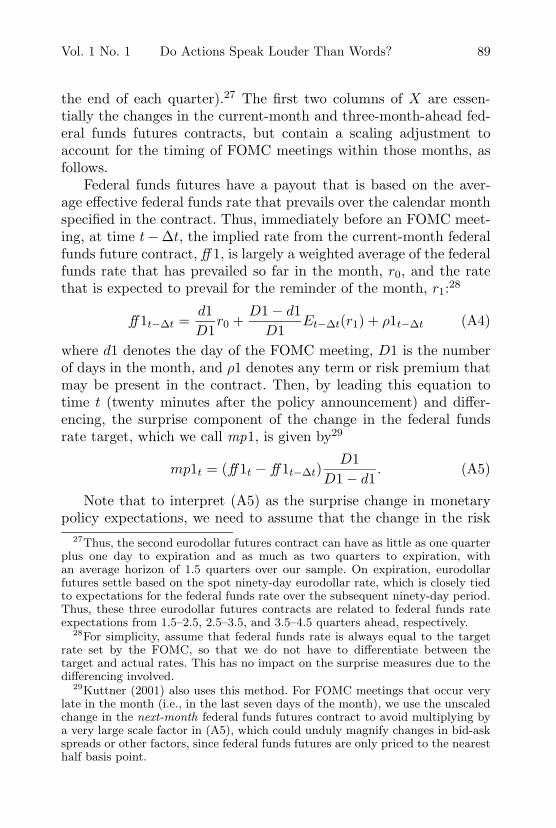
Vol. 1 No. 1 Do Actions Speak Louder Than Words? 89
the end of each quarter).27 The first two columns of X are essen-tially the changes in the current-month and three-month-ahead fed-eral funds futures contracts, but contain a scaling adjustment toaccount for the timing of FOMC meetings within those months, asfollows.
Federal funds futures have a payout that is based on the aver-age effective federal funds rate that prevails over the calendar monthspecified in the contract. Thus, immediately before an FOMC meet-ing, at time t−∆t, the implied rate from the current-month federalfunds future contract, ff 1, is largely a weighted average of the federalfunds rate that has prevailed so far in the month, r0, and the ratethat is expected to prevail for the reminder of the month, r1:28
ff1t−∆t =d1D1
r0 +D1 − d1
D1Et−∆t(r1) + ρ1t−∆t (A4)
where d1 denotes the day of the FOMC meeting, D1 is the numberof days in the month, and ρ1 denotes any term or risk premium thatmay be present in the contract. Then, by leading this equation totime t (twenty minutes after the policy announcement) and differ-encing, the surprise component of the change in the federal fundsrate target, which we call mp1, is given by29
mp1t = (ff1t − ff1t−∆t)D1
D1 − d1. (A5)
Note that to interpret (A5) as the surprise change in monetarypolicy expectations, we need to assume that the change in the risk
27Thus, the second eurodollar futures contract can have as little as one quarterplus one day to expiration and as much as two quarters to expiration, withan average horizon of 1.5 quarters over our sample. On expiration, eurodollarfutures settle based on the spot ninety-day eurodollar rate, which is closely tiedto expectations for the federal funds rate over the subsequent ninety-day period.Thus, these three eurodollar futures contracts are related to federal funds rateexpectations from 1.5–2.5, 2.5–3.5, and 3.5–4.5 quarters ahead, respectively.
28For simplicity, assume that federal funds rate is always equal to the targetrate set by the FOMC, so that we do not have to differentiate between thetarget and actual rates. This has no impact on the surprise measures due to thedifferencing involved.
29Kuttner (2001) also uses this method. For FOMC meetings that occur verylate in the month (i.e., in the last seven days of the month), we use the unscaledchange in the next-month federal funds futures contract to avoid multiplying bya very large scale factor in (A5), which could unduly magnify changes in bid-askspreads or other factors, since federal funds futures are only priced to the nearesthalf basis point.

90 International Journal of Central Banking May 2005
premium ρ in this narrow window of time is small in comparisonto the change in expectations itself. Piazzesi and Swanson (2004)provide some evidence that this assumption is not inconsistent withthe data.
We can apply a similar procedure to measure the change in ex-pectations about r2, the federal funds rate target that will prevailafter the second FOMC meeting from now. Let ff 2 denote the fed-eral funds futures rate for the month containing the second FOMCmeeting (typically the three-month-ahead contract). Then
ff 2t−∆t =d2D2
Et−∆t(r1) +D2 − d2
D2Et−∆t(r2) + ρ2t−∆t, (A6)
where d2 and D2 are the day of that FOMC meeting and the numberof days in the month containing that FOMC meeting, respectively,and ρ2 denotes any risk premium in the contract. By leading thisequation to time t and differencing, the change in expectations forthat second FOMC meeting, which we call mp2, is given by
mp2t =[(ff 2t − ff 2t−∆t) − d2
D2mp1t
]D2
D2 − d2. (A7)
Additional details can be obtained from various sources.30
As described in section 2, we decompose X into its principal com-ponents after normalizing each column to have zero mean and unitvariance. We let F1 and F2 denote the first two principal componentsof X, and normalize each of them to have unit variance.
To allow for a more structural interpretation of these unobservedfactors, we rotate them so that the first factor corresponds to surprisechanges in the current federal funds rate target and the second factorcorresponds to moves in interest rate expectations over the comingyear that are not driven by changes in the current funds rate. Inother words, we define a 138×2 matrix Z by
Z = FU, (A8)30Gurkaynak (2005) discusses measuring policy expectations and surprises at
horizons farther ahead than the current meeting; Gurkaynak, Sack, and Swanson(2002) show that federal funds futures are the best financial market predictorsof the federal funds rate with the smallest average term premium; Piazzesi andSwanson (2004) estimate to what extent risk premia in these markets vary overtime; and Kuttner (2001) discusses the construction and some uses of mp1.

Vol. 1 No. 1 Do Actions Speak Louder Than Words? 91
where
U =
α1 β1
α2 β2
,
and where U is identified by four restrictions. First, the columns ofU are normalized to have unit length (which normalizes Z1 and Z2
to have unit variance). Second, the new factors Z1 and Z2 shouldremain orthogonal to each other:
E(Z1Z2) = α1β1 + α2β2 = 0. (A9)
Lastly, we impose the restriction that Z2 does not influence thecurrent policy surprise, mp1, as follows. Let γ1 and γ2 denote the(known) loadings of mp1 on F1 and F2, respectively. Since
F1 =1
α1β2 − α2β1
[β2Z1 − α2Z2] , (A10)
F2 =1
α1β2 − α2β1
[α1Z2 − β1Z1] , (A11)
it follows that:γ2α1 − γ1α2 = 0,
which is the final restriction. It is then easy to solve for the uniquematrix U satisfying these restrictions.
Finally, as noted in section 2, we rescale Z1 and Z2 so that Z1
moves the current policy surprise mp1 one-for-one and Z2 has thesame magnitude effect on the year-ahead eurodollar futures rate asZ1 has on that rate (about 55.1 bp).
References
Bernanke, Ben, and Kenneth Kuttner. Forthcoming. “What Explainsthe Stock Market’s Reaction to Federal Reserve Policy?” Journalof Finance.
Bernanke, Ben, Vincent Reinhart, and Brian Sack. 2004. “Mone-tary Policy Alternatives at the Zero Bound: An Empirical As-sessment.” Brookings Papers on Economic Activity 2:1–100.
Cochrane, John, and Monika Piazzesi. 2002. “The Fed and InterestRates: A High Frequency Identification.” American EconomicReview Papers and Proceedings 92:90–101.

92 International Journal of Central Banking May 2005
Cook, Timothy, and Thomas Hahn. 1989. “The Effect of Changes inthe Federal Funds Rate Target on Market Interest Rates in the1970s.” Journal of Monetary Economics 24:331–51.
Cragg, John G., and Stephen G. Donald. 1997. “Inferring the Rankof a Matrix.” Journal of Econometrics 76:223–50.
Eggertsson, Gauti, and Michael Woodford. 2003. “The Zero Boundon Short-Term Interest Rates and Optimal Monetary Policy.”Brookings Papers on Economic Activity 1:139–211.
Ellingsen, Tore, and Ulf Soderstrom. 2003. “Monetary Policy and theBond Market.” Unpublished Manuscript, Bocconi University.
Evans, Charles, and David Marshall. 1998. “Monetary Policy andthe Term Structure of Nominal Interest Rates: Evidence andTheory.” Carnegie-Rochester Conference Series on Public Pol-icy 49:53–111.
Faust, Jon, Eric Swanson, and Jonathan Wright. 2004a. “Identify-ing VARs Based on High-Frequency Futures Data.” Journal ofMonetary Economics 51 (6): 1077–1317.
Faust, Jon, Eric Swanson, and Jonathan Wright. 2004b. “Do FederalReserve Policy Surprises Reveal Superior Information About theEconomy?” Contributions to Macroeconomics 4 (1): Article 10.
Gurkaynak, Refet. 2005. “Using Federal Funds Futures Contractsfor Monetary Policy Analysis.” Working Paper, Federal ReserveBoard.
Gurkaynak, Refet, Brian Sack, and Eric Swanson. 2002. “Market-Based Measures of Monetary Policy Expectations.” FederalReserve Board Finance and Economics Discussion Series 2002-40.
Gurkaynak, Refet, Brian Sack, and Eric Swanson. Forthcoming.“The Sensitivity of Long-Term Interest Rates to EconomicNews: Evidence and Implications for Macroeconomic Models.”American Economic Review.
Ip, Greg. 2004. “Fed Clears Way For Future Rise In Interest Rates.”The Wall Street Journal, January 29, A1.
Kohn, Donald, and Brian Sack. 2004. “Central Bank Talk: Does ItMatter and Why?” In Macroeconomics, Monetary Policy, andFinancial Stability. Ottawa: Bank of Canada.
Krueger, Joel T., and Kenneth N. Kuttner. 1996. “The Fed FundsFutures Rate as a Predictor of Federal Reserve Policy.” Journalof Futures Markets 16:865–79.

Vol. 1 No. 1 Do Actions Speak Louder Than Words? 93
Kuttner, Kenneth. 2001. “Monetary Policy Surprises and InterestRates: Evidence from the Fed Funds Futures Market.” Journalof Monetary Economics, 523–44.
Kuttner, Kenneth. 2003. “The Revelation of Funds Rate Changes,1989-92: What Did the Markets Know and When Did They KnowIt?” Unpublished Manuscript, Oberlin College.
Leeper, Eric, Christopher Sims, and Tao Zha. 1996. “What DoesMonetary Policy Do?” Brookings Papers on Economic Activity2:1–63.
Pesek, William, and Lauren Young. 1994. “Bond Prices Fin-ish Little Changed After Fed Decides to Keep Rates atTheir Current Levels.” The Wall Street Journal, December 21,C22.
Piazzesi, Monika, and Eric Swanson. 2004. “Futures Rates as Risk-Adjusted Forecasts of Monetary Policy.” NBER Working PaperNo. 10547.
Reifschneider, David, and John Williams. 2000. “Three Lessons forMonetary Policy in a Low-Inflation Era.” Journal of Money,Credit, and Banking 32:936–66.
Rigobon, Roberto, and Brian Sack. 2004. “The Impact of Mone-tary Policy on Asset Prices.” Journal of Monetary Economics51:1553–75.
Rigobon, Roberto, and Brian Sack. 2003. “Measuring the Reactionof Monetary Policy to the Stock Market.” Quarterly Journal ofEconomics 118:639–69.
Romer, Christina, and David Romer. 2000. “Federal Reserve Infor-mation and the Behavior of Interest Rates.” American EconomicReview 90:429–57.
Rudebusch, Glenn. 1998. “Do Measures of Monetary Policy in a VARMake Sense?” International Economic Review 39:907–31.
Shiller, Robert, John Campbell, and Kermit Schoenholtz. 1983. “For-ward Rates and Future Policy: Interpreting the Term Structure ofInterest Rates.” Brookings Papers on Economic Activity 1:173–217.