dna methylation research tools - sequencing.roche.com · the seqcap epi system is a set of target...
TRANSCRIPT

1 Allum F, Shao X, Guénard F, et al. Characterization of functional methylomes by next-generation capture sequencing identifies novel disease-associated variants. Nat Commun. 2015 May 29;6:7211.
2 Li Q, Suzuki M, Wendt J, et al. Post-conversion targeted capture of modified cytosines in mammalian and plant genomes. Nucleic Acids Res. 2015 Jul 13;43(12):e81.
Data on file.For Research Use Only. Not for use in diagnostic procedures.
DNA METHYLATION RESEARCH TOOLS
The SeqCap Epi System is a set of target enrichment tools for DNA methylation assessment at single-base resolution. This system includes a fixed content epigenome-wide design and a full range of custom target offerings, suitable for both broad discovery and focused research applications.
SeqCap Epi Enrichment SystemRevolutionize your epigenomic research
Benefits
• Efficiently discover differential methylation. Our capture technology delivers massive time and cost savings over whole genome or fixed content sequencing approaches.1,2
• Reveal hidden epigenetic modifications. Innovative probe design and manufacture allows for the capture of both strands, enabling the detection of complex or rare methylation events.
• Experience superior performance. Inherent flexibility of the system and optimized bisulfite-then-capture workflow offer unprecedented resolution, sensitivity, and sequencing sample capacity.1,2
Methylated NGS Adaptor
Probes
Capture Beads
HSO3-
Sequencing
Washing
Amplification
Hybridization
Bead Capture
Library Preparation
Methylated DNA
Bisulfitereaction
Converted DNA
2Data on file.
For Research Use Only. Not for use in diagnostic procedures.
Target Enrichment Solution for Bisulfite-treated DNA
Why study methylation?In life science research, it is critical to understand the association between diseases or traits and modifications to the genome. Epigenetic modifications, which are functionally relevant changes to the genome that do not involve a change in the nucleotide sequence, are an essential part of genomics. A major epigenetic modification is DNA methylation.
DNA methylation has been shown to play an important role in a wide variety of biological processes, including silencing of transposable elements, stem cell differentiation, embryonic development, genomic imprinting, and inflammation. Alteration of methylation patterns has been identified in many diseases, including cancer, diabetes, cardiovascular disease, inflamation, and neurological disorders.
Researchers have been using a number of approaches for methylation assessment, utilizing next-generation sequencing or microarray technologies. However, current research tools either provide limited efficiency or introduce experimental biases for genome-wide or targeted applications.
Why SeqCap Epi Enrichment System? SeqCap Epi Enrichment System is designed to overcome the challenges of existing methods and greatly increase efficiency and accuracy for a broad range of research applications.
Applying concepts similar to those demonstrated by the best-in-class3,4 technical performance of the SeqCap EZ products, Roche has pioneered target enrichment of bisulfite-treated DNA. Depending on your organism of choice and genomic region of interest, a series of SeqCap Epi products are available to you:
• SeqCap Epi CpGiant Probes offer researchers a solution for human epigenome-wide discovery and easy transition from microarrays to a sequencing-based workflow.
• SeqCap Epi Choice Probes offer customized enrichment of your regions of interest in the human genome up to 90 Mb.
• SeqCap Epi Developer Probes provide enrichment from any organism and allow for custom designs of up to 210 Mb.
HSO3-
Bisulfite reaction
Amplification
A T C C G C G CT A G G C G C G
A T U C G U G UT A G G U G U G
A T T C G T G T
T A G G T G T G
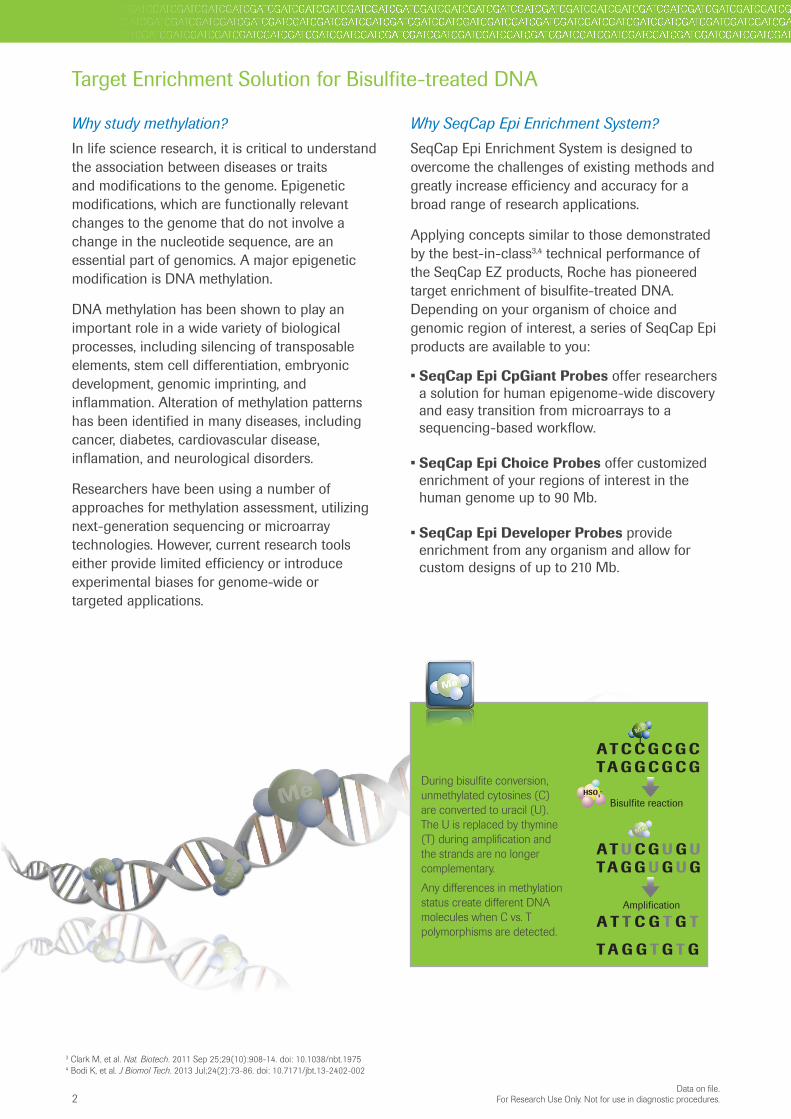
During bisulfite conversion, unmethylated cytosines (C) are converted to uracil (U). The U is replaced by thymine (T) during amplification and the strands are no longer complementary.
Any differences in methylation status create different DNA molecules when C vs. T polymorphisms are detected.
3 Clark M, et al. Nat. Biotech. 2011 Sep 25;29(10):908-14. doi: 10.1038/nbt.19754 Bodi K, et al. J Biomol Tech. 2013 Jul;24(2):73-86. doi: 10.7171/jbt.13-2402-002
3Data on file. For Research Use Only. Not for use in diagnostic procedures.
Targeted bisulfite sequencing enables focused epigenetic discovery
Whole genome shotgun bisulfite sequencing (WGBS) has been the traditional method used by many researchers, as it provides DNA methylation status at base pair resolution and allows for the assessment of percent methylation at each position in the genome. However, WGBS is time-consuming and costly due to large amount of sequencing and data analysis, when generally 65% of the reads do not contain any CpGs2, and only a subset of the genome is of interest to most researchers.
In contrast, the SeqCap Epi Enrichment System enables the reproducible targeting of selected genomic regions, for regions up to 210 Mb, from bisulfite-treated genomic DNA in a single workflow (Table 1). It was developed for researchers to more efficiently study a variety of regions, including:
• Select Differentially Methylated Regions (DMRs)
• Promoter and enhancer regions from disease pathways
• All potentially methylated regions of the genome, also known as the methylome
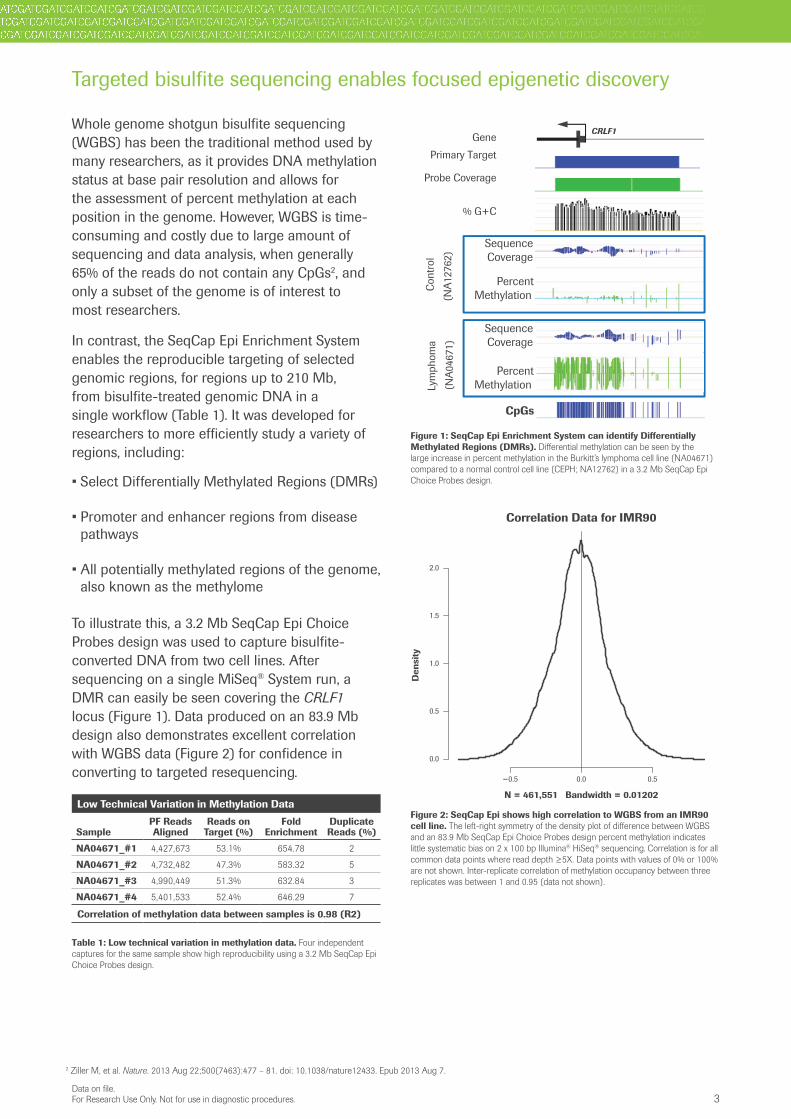
To illustrate this, a 3.2 Mb SeqCap Epi Choice Probes design was used to capture bisulfite-converted DNA from two cell lines. After sequencing on a single MiSeq® System run, a DMR can easily be seen covering the CRLF1 locus (Figure 1). Data produced on an 83.9 Mb design also demonstrates excellent correlation with WGBS data (Figure 2) for confidence in converting to targeted resequencing.
Low Technical Variation in Methylation Data
SamplePF Reads Aligned
Reads on Target (%)
Fold Enrichment
Duplicate Reads (%)
NA04671_#1 4,427,673 53.1% 654.78 2
NA04671_#2 4,732,482 47.3% 583.32 5
NA04671_#3 4,990,449 51.3% 632.84 3
NA04671_#4 5,401,533 52.4% 646.29 7
Correlation of methylation data between samples is 0.98 (R2)
Table 1: Low technical variation in methylation data. Four independent captures for the same sample show high reproducibility using a 3.2 Mb SeqCap Epi Choice Probes design.
Figure 1: SeqCap Epi Enrichment System can identify Differentially Methylated Regions (DMRs). Differential methylation can be seen by the large increase in percent methylation in the Burkitt’s lymphoma cell line (NA04671) compared to a normal control cell line (CEPH; NA12762) in a 3.2 Mb SeqCap Epi Choice Probes design.
Figure 2: SeqCap Epi shows high correlation to WGBS from an IMR90 cell line. The left-right symmetry of the density plot of difference between WGBS and an 83.9 Mb SeqCap Epi Choice Probes design percent methylation indicates little systematic bias on 2 x 100 bp Illumina® HiSeq® sequencing. Correlation is for all common data points where read depth ≥5X. Data points with values of 0% or 100% are not shown. Inter-replicate correlation of methylation occupancy between three replicates was between 1 and 0.95 (data not shown).
Primary Target
Probe Coverage
% G+C
Lym
phom
a
(NA
0467
1)
Cont
rol
(NA
1276
2)
CpGs
Sequence Coverage
Sequence Coverage
Percent Methylation
Percent Methylation
CRLF1Gene
−0.5 0.0 0.5
0.0
0.5
1.0
1.5
2.0
N = 461,551 Bandwidth = 0.01202
Correlation Data for IMR90
Den
sity
2 Ziller M, et al. Nature. 2013 Aug 22;500(7463):477 – 81. doi: 10.1038/nature12433. Epub 2013 Aug 7.
4Data on file.
For Research Use Only. Not for use in diagnostic procedures.
Double-stranded design delivers balanced coverage of methylation events
Bisulfite treatment brings a series of challenges to variant analysis. The SeqCap Epi Enrichment System can overcome these challenges by utilizing a design algorithm that creates probes against the possible methylation configurations on both strands from a bisulfite-converted genomic template. This is made possible through Roche’s ability to manufacture millions of DNA probes in parallel.
Such designs enable you to capture bisulfite-treated DNA and identify sequencing and methylation patterns on both strands, something no other enrichment technology yet can do (Table 3). This will allow for better determination of SNPs vs. methylation status events, plus preservation of sequencing data where one strand may not have sufficient coverage (Figure 3). The SeqCap Epi system was more uniform, had better coverage statistics, and assayed approximately 440,000 more CpGs (Table 2).
As shown on the cover page, in the SeqCap Epi protocol, the bisulfite conversion is conducted before the capture step. This is a more efficient workflow to conserve molecular complexity of your epigenome, ultimately allowing you to:
• Detect strand-specific methylation and interrogate more CpGs than other enrichment platforms
• Start with a lower sample input amount
• Create your own custom designs
Coverage Comparison of IMR90 Cell Line
PlatformSeqCap
Epi ChoiceSupplier A
Enrichment System
Primary Capture Target Size 83.9 Mb 84 Mb
Median Depth of Coverage 29 34
Target Covered >1X (%) 99.228 98.133
Target Covered >10X (%) 90.322 86.696
Uniformity (Fold 80 Penalty) 2.03 3.07
Total CpGs Assayed 3,438,562 3,028,258
Table 2: Comparison of a SeqCap Epi Choice Probes design created to capture all targets covered by the alternate enrichment system. An IMR90 cell line DNA was captured and sequenced on an Illumina® HiSeq®
platform (2 x 100 bp reads), subsampled to 55 million reads.
Design comparison
Platform CustomizableTarget Size
DNA Input
Strand Coverage
SeqCap Epi CpGiant No 80.5 Mb 1 µg Both
SeqCap Epi Choice Yes up to 90 Mb 1 µg Both
SeqCap Epi Developer Yes up to
210 Mb 1 µg Both
Supplier A No 84 Mb 3 µg Single
Table 3: SeqCap Epi Probes design metrics and comparison with an alternate enrichment system for methylation detection.
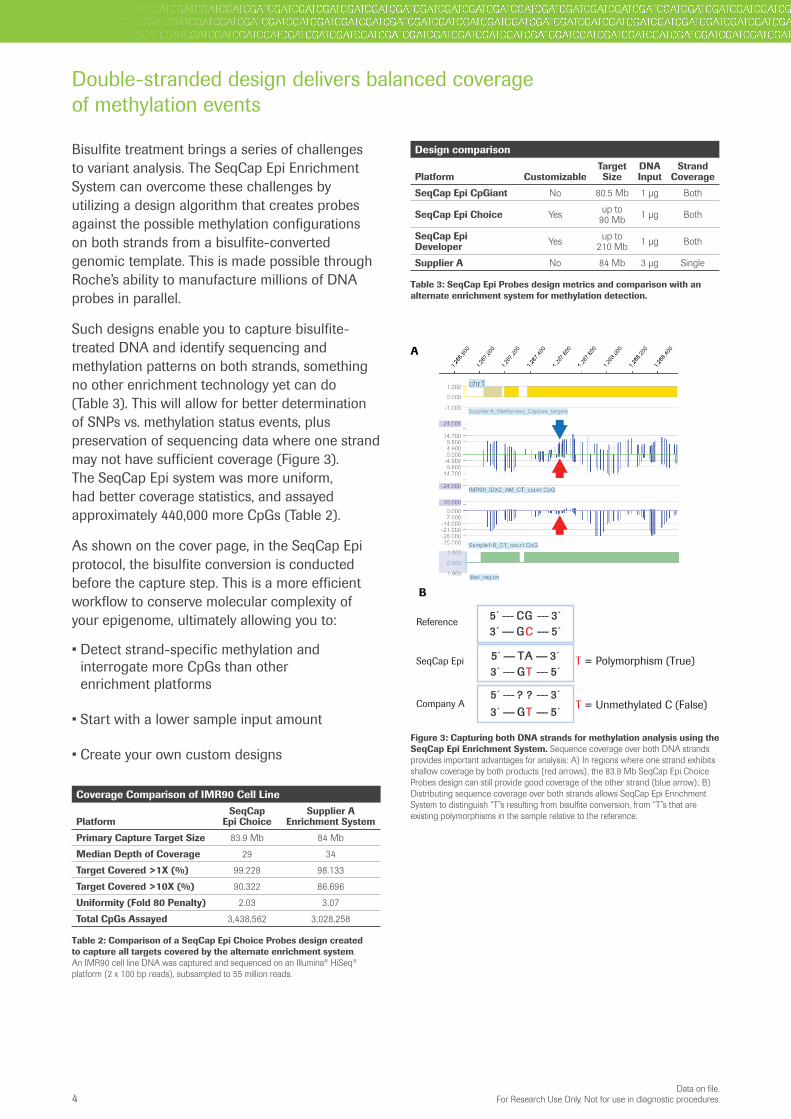
Figure 3: Capturing both DNA strands for methylation analysis using the SeqCap Epi Enrichment System. Sequence coverage over both DNA strands provides important advantages for analysis: A) In regions where one strand exhibits shallow coverage by both products (red arrows), the 83.9 Mb SeqCap Epi Choice Probes design can still provide good coverage of the other strand (blue arrow); B) Distributing sequence coverage over both strands allows SeqCap Epi Enrichment System to distinguish “T”s resulting from bisulfite conversion, from “T”s that are existing polymorphisms in the sample relative to the reference.
A
Supplier A_Methyl-seq_Capture_targets
3 ́--- GT --- 5´
3 ́--- GT --- 5´5 ́--- TA --- 3´
3 ́--- GC --- 5´5 ́--- CG --- 3´Reference
5 ́--- ? ? --- 3´Company A
SeqCap Epi T = Polymorphism (True)
T = Unmethylated C (False)
B

5Data on file. For Research Use Only. Not for use in diagnostic procedures.
Targeted Sequencing enables broader discovery than microarrays
Microarrays have been another popular platform for DNA methylation analysis. However, arrays have problems incorporating genetic information like SNP detection, discovery of new loci, and providing allele-specific patterns. Moreover, array probes are susceptible to batch effects and can potentially cross-hybridize with non-targeted DNA, confounding results and requiring secondary confirmation.
As a fixed epigenome-wide design, the SeqCap Epi CpGiant Probes provide a new platform for discovery screening, without the array-based drawbacks and with all the NGS-based benefits (Table 4). CpGiant design targets more than 5.5 million CpGs, or 12x more CpGs than a commonly used microarray platform for DNA methylation detection (Table 4). Its coverage is highly correlated with the microarray data, allowing for your NGS data to be easily compared with your existing array data sets (Figure 4).
SeqCap Epi CpGiant Probes are also cost-effective. Based on empirical coverage statistics, to achieve mean coverage of 30x across the entire target, a researcher could fit four samples in one lane of a HiSeq® 2000 instrument using 2 x 100 bp reads (Figure 5).
Product comparison
PlatformSeqCap Epi
CpGiant Probes Company B microarray
CpGs Targeted >5.5 million 485,512
Discern SNPs from Methylation? Yes N/A
Discover Novel CpGs? Yes N/A
Providing Allelic Specificity? Yes N/A
Scalable Process up to 96 samples at once 12 samples per array
Table 4: SeqCap Epi CpGiant Probes comparison against a commonly used microarray platform.
Figure 4: Same-site CpG methylation is strongly correlated between the 80.5 Mb SeqCap Epi CpGiant Probes design and microarray data. DNA methylation status was measured at CpG sites in seven buccal DNA samples using a microarray or the SeqCap Epi CpGiant Probes design, at 500 ng sample DNA input. The mean value is indicated by the blue bars. Increased read coverage depth filtering for the SeqCap Epi CpGiant Probes design data results in improved correlations.
Figure 5: Coverage per base comparison across three sequencing depths. The 80.5 Mb SeqCap Epi CpGiant Probes design was sequenced using Illumina® 2 x 100 bp reads, subsampled to calculate gigabases of sequencing needed per sample for 1x, 10x, and 30x mean coverage depths. Based on these results, four samples could be sequenced in one lane of an Illumina HiSeq 2000 sequencer to achieve 30x mean coverage.
0.92
0.93
0.94
0.95
0.96
0.97
Cor
rela
tion
(R)
Read Depth (≥ fold coverage)
Correlation of SeqCap Epi CpGiant Probes vs. Microarray
1x 5x 10x
�
�
���
� � � � � � � � � � � � �
Sequencing Coverage
Sequencing Data (Gb)
Targ
ets
Cov
ered
(%
)
0 1 2 3 4 5 6 7 8 9 10 11 12 13
0
10
20
30
40
50
60
70
80
90
100
��
�
�
�
�
�
�
� � � � � � � � � �
�����
�
�
�
�
�
�
�
�
��
�� �
1X depth10X depth30X depth

Published by:
Roche Sequencing Solutions, Inc.4300 Hacienda DrivePleasanton, CA 94588
sequencing.roche.com
Data presented in this document was processed by Roche unless otherwise stated. For patent license limitations for individual products please refer to: www.technical-support.roche.com
For Research Use Only. Not for use in diagnostic procedures.CPGIANT and SEQCAP are trademarks of Roche. All other product names and trademarks are the property of their respective owners.© 2018 Roche Sequencing Solutions, Inc. All rights reserved. SEQ100146 01/18
Target any region of interest in any genome with custom SeqCap Epi Choice and Developer Probes
Sequencing specific genomic regions of interest is vital to advancing our knowledge of epigenetic variation. Targeted bisulfite sequencing helps accelerate epigenetic discovery by allowing for higher depths of coverage, increased sample throughput, and lower costs compared to WGBS.
For example, with the same amount of sequencing, a 3 Mb human target design gives you the opportunity to achieve up to 1,000-fold enrichment, or up to 1,000 times the sample throughput of WGBS. Targeted bisulfite sequencing leverages the depth of coverage available from next-gen sequencing, providing a solution that was previously impractical in DNA methylation occupancy estimations.
SeqCap Epi Choice Probes are designed for human studies, with regions of interest up to 90 Mb. SeqCap Epi Developer Probes offer a solution to study any organism, or any human genomic region from 90 Mb to 210 Mb.
Targeted bisulfite sequencing with the SeqCap Epi Choice Probes enable discovery in human genome regions not covered by other enrichment products (Figure 6). SeqCap Epi Developer Probes are also the first products to enable targeted bisulfite sequencing in non-human species, with excellent correlation with WGBS (Figure 7).
Available Custom ProductsProduct Size
SeqCap Epi Choice Probes S Up to 30 Mb
SeqCap Epi Choice Probes M 30 – 60 Mb
SeqCap Epi Choice Probes L 60 – 90 Mb
SeqCap Epi Developer Probes S Up to 30 Mb
SeqCap Epi Developer Probes M 30 – 60 Mb
SeqCap Epi Developer Probes L 60 – 90 Mb
SeqCap Epi Developer Probes XL 90 – 210 Mb
Figure 6: The SeqCap Epi Choice Probes’ custom options allow you to study your regions for focused research. A 3.2 Mb SeqCap Epi Choice Probes design was created to cover known DMRs. Illustrated is a region not covered by the alternative target enrichment product, which is representative of many regions with limited coverage.
Figure 7: This 4.9 Mb SeqCap Epi Developer Probes design shows high correlation with Whole Genome Bisulfite Sequencing (WGBS) results for Maize. Density plots of differences in methylation value measurements relative to WGBS data are shown for DNA isolated from the B73 strain of Maize. The left-right symmetry of the plot indicates little systematic bias in % methylation measurements compared to the WGBS data. The correlation between platforms is: R=0.93
Contact your Roche Sales Representative for more information.
Additional coverage from SeqCap Epi Choice
Probes design
1.0000.000
0.00017.000
-17.000
41.000
-41.000
4.000-38.000-76.000
-114.000-152.000-181.000
1.000
-1.0000.000
73,12
0,000
73,12
4,000
73,12
8,000
73,13
2,000
73,13
6,000
73,14
0,000
73,14
4,000
73,14
8,000
73,15
2,000
73,15
6,000
73,16
0,000
73,16
4,000
73,16
8,000
73,17
2,000
73,17
6,000
73,18
0,000
73,18
4,000
73,18
8,000
73,19
2,000
73,19
6,000
73,20
0,000
73,20
4,000
1.000
-1.0000.000
Company A Capture Targets
Company A coverage depth over CpG positions
Company A methylation ratios
SeqCap Epi Choice Probes custom design methylation ratios
SeqCap Epi Choice custom design coverage depth over CpG positions
−1.0 −0.5 0.0 0.5 1.0
0
5
10
15
20
N = 197,725 Bandwidth = 0.01262
Den
sity
Correlation Data for Maize (B73)