dna barcoding of fish larvae reveals uncharacterised
TRANSCRIPT
DNA barcoding of fish larvae reveals uncharacterisedbiodiversity in tropical peat swamps of New Guinea,Indonesia
Arif WibowoA,E, Niklas WahlbergB,D and Anti VasemagiB,C
AResearch Institute for Inland Fisheries, Agency for Marine and Fisheries Research,
Ministry of Marine Affairs and Fisheries, Jalan Beringin 08 Mariana, Palembang, 30763,
South Sumatera, Indonesia.BDepartment of Biology, University of Turku, Pharmacity Itainen Pitkakatu 4,
FI-20014 Turku, Finland.CDepartment of Aquaculture, Institute of Veterinary Medicine and Animal Sciences,
Estonian University of Life Sciences, Kreutzwaldi 1, EE-51014 Tartu, Estonia.DDepartment of Biology, Lund University, Solvegatan 35, SE-223 62 Lund, Sweden.ECorresponding author. Email: [email protected]
Abstract. The Indonesian archipelago, Borneo, Sumatra andWest NewGuinea (Papua), hosts half of theworld’s known
tropical peat swamps, which support a significant proportion of the estimated biodiversity on Earth. However, severalspecies groups that inhabit peat swamp environments remain poorly characterised and their biology, particularly duringearly life stages, is not well understood. In the present study we characterised larval and juvenile fish biodiversity, as well
as spatial and temporal variability, in a pristine peat swamp environment of the River Kumbe in West New Guinea,Indonesia, based on analysis of the mitochondrial cytochrome-c oxidase subunit 1 (COI) sequence (501 bp). Altogether,10 fish species were detected in the peat swamp habitat during the larval and juvenile stages, whereas 13 additional species
were caught at older stages. Twelve species were detected only in a single site, whereas some species, such as theWesternarcherfish (Toxotes oligolepis) and Lorentz’s grunter (Pingalla lorentzi), were observed in all sampling sites. Theoccurrence of fish larvae also varied temporally for several species. In contrast with many earlier DNA barcoding studies
in fish, we were not able to determine the species identity for a large proportion of sequenced larvae (68%) because of thelack of corresponding COI sequences in the reference dataset. Unidentified sequences clustered into fiveseparate monophyletic clades. Based on genetic divergences, the putative taxonomic origin for the five morphotypesare Atherinidae, Osteoglossidae, Terapontidae and Gobiidae.
Received 14 March 2016, accepted 5 August 2016, published online 13 September 2016
Introduction
Peatland ecosystems are characterised by the accumulation of
partially decayed organic matter, which is formed from plantdebris under waterlogged conditions (Andriesse 1988). Peat-lands cover over 4 � 108 ha and can be found in all parts of the
world (Parish et al. 2008). In the tropics, peat and peaty soils(histosols) originate from woody plant debris under high-rainfall and high-temperature conditions (Andriesse 1988;
Chimner and Ewel 2005). The greatest peat depths occur in peatswamp forests at low altitudes in river valley basins, watershedsand subcoastal areas (Posa et al. 2011). They are characterisedby extreme acidic, anaerobic and nutrient-poor conditions, and
are regarded as one of the most unusual biomes in tropicalrainforests (Ng et al. 1992). As a result of these extreme con-ditions, many peatland species are highly specialised and not
found in other habitats (Kaat and Joosten 2008).
The Indonesian archipelago, Borneo, Sumatra andWest NewGuinea (Papua), hosts half the world’s known tropical peat
swamps (Pearce 2007). Approximately 50% of the Indonesianpeat swamp lands occur in West New Guinea (Papua; Yoshinoet al. 2010). With some 786 000 km2 of tropical land (82% of
forest cover), less than 0.5% of the Earth’s surface, NewGuineahas an immense biodiversity, containing between 5 and 10% ofthe total species on the planet. However, although certain
species groups within this region, such as birds, have beenrelatively well characterised, many other animals, such asfreshwater organisms living in peat swamp habitat, remainpoorly understood (Polhemus et al. 2004; Marshall and Beehler
2007). Given that vast areas of pristine peat swamp habitats havebeen lost or degraded over past decades because of anthropo-genic activities, including logging, deforestation, pollution and
mining, this represents a serious threat to freshwater biodiversity
CSIRO PUBLISHING
Marine and Freshwater Research
http://dx.doi.org/10.1071/MF16078
Journal compilation � CSIRO 2016 www.publish.csiro.au/journals/mfr
(Dennis and Aldhous 2004; Page et al. 2009; Posa et al. 2011).For example, Indonesia lost at least 2.69� 106 ha peatland cover
between 2000 and 2010, of which 13.6% was located in WestNew Guinea (Papua; Miettinen et al. 2011).
The tropical peat swamp forests support some of the highest
freshwater biodiversity of any habitat in the world (Parish et al.2008), consisting of a large number of rare species of fishes(Dennis and Aldhous 2004). For example, it is estimated that
20% of Malaysian freshwater fish occur in peatlands (Ahmadet al. 2002) and at least 219 fish species have been recorded fromtropical peat swamps, 80 species restricted to the ecosystem, 31of which are endemic species found only in single locations
(Posa et al. 2011). One of the least known aspects of the biologyof peat swamp fish relates to the larval stages, and questionsassociated with the timing and location of spawning, location of
nursery habitats and dispersal during early life history stages(Ng 1994; Ng et al. 1994; Beamish et al. 2003; Dennis andAldhous 2004). Yet, this information is crucial for conservation,
management and assessment of environmental effects, becausequantifying and classifying fish eggs and larvae remains one ofthemost effective ways of monitoring the recruitment process infish (Smith and Richardson 1977; Baumgartner et al. 2004;
Bialetzki et al. 2005; Valdez-Moreno et al. 2010; Reynalte-Tataje et al. 2011). However, accurate identification of manytaxonomic groups at larval stages is extremely challenging or
impossible, even for experienced taxonomists (Kochzius 2009;Frantine-Silva et al. 2015).
During the past decade, sequencing of the mitochondrial
cytochrome-c oxidase subunit 1 (COI) gene fragment in animalshas become one of the most widely used and effective tools forspecies identification and discovery (Hebert et al. 2003; Ward
et al. 2005; Kochzius 2009; Trivedi et al. 2016). This approach,known as DNA barcoding, has been shown to provide unprece-dented accuracy for the identification of various taxonomicgroups of fish (Kochzius 2009; Collins et al. 2012; Landi et al.
2014; Frantine-Silva et al. 2015). DNA barcoding has alsoemerged as a principal tool for specimen identification from fisheggs and larvae (Pegg et al. 2006; Victor 2007; Baldwin et al.
2011; Hubert et al. 2015a) and it has been recently demonstratedthat the DNA-based approach is superior to traditional morpho-logical identification of fish larvae (Ko et al. 2013). However,
most previous DNA barcoding studies on fish larvae andichthyoplankton assemblages have been conducted in a marinehabitat (Pegg et al. 2006; Valdez-Moreno et al. 2010; Ko et al.
2013; Hubert et al. 2015a), with only a few studies using this
approach for larval identification of fish in freshwater environ-ments (Loh et al. 2014; Frantine-Silva et al. 2015).
Herein we describe a first attempt to use DNA barcoding for
characterisation of larval and juvenile fish biodiversity in apristine peat swamp environment in Papua, Indonesia, on theisland of NewGuinea. The peat land forests of the River Kumbe
are often flooded during March, whereas the water level isusually at its lowest in October during the dry season. Therefore,we also evaluated temporal variability of the juvenile occur-
rence by repeated sampling during different seasons to furtherunderstand the life history characteristics of the species. Weexpect that our work, together with other similar DNA barcod-ing efforts, will help describe and conserve biodiversity in this
region.
Materials and methods
Ethics statement
A permit to collect fish was given to A. Wibowo from theResearch Institute of Inland Fisheries, Ministry of Marine and
Fisheries Affairs. No experimentation was conducted on livespecimens during this study, because the permit granted does notextend to experimentation on animals.
Area study, sample collection and preservation
Sampling campaigns were conducted at four sites (Alfasera,
7824023.900S, 14083704.600E; Inggun, 7859005.300S, 140827053.300E;Yakui, 882026.300S, 140831047.500E; Sakor, 886051.600S,140829098.900E) and three times between March and October2014 along the Kumbe River, West New Guinea (Papua). Three
sites were located at peat swamp areas (Inggun, Sakor andYakui), whereas one (Alfasera) was located on the RiverKumbe (Fig. 1). Sampling and collection of representative
samples of the adult fish community and fish larvae were per-formed using five sets of experimental gill nets (stretch meshsize 12.7, 25.4, 38.09, 50.8, 76.19 and 101.6 mm). All nets were
1.5 m deep and 15 m long comprising five randomly placedsections of different mesh size. Nets were placed in the water inthe evening (1700 hours) and were collected in the morning
(0700 hours).All adult fish caught were identified to the species level or,
alternatively, to the genus level when systematic knowledgewasinadequate for reliable identification of the species following
Allen (1991). An approximate 2-cm2 piece of fin clip tissue wastaken from every dead individual using a scalpel and tissuesamples were stored in 1.5 mL absolute ethanol. Live adult fish
(n ¼ 27) were killed by benzocaine overdose at the collectionsite to minimise animal suffering. Thereafter, fish were imme-diately preserved in 10% buffered formaldehyde for 7 days.
Subsequently, fish were washed and transferred through anethanol series (10, 50 and 70% ethanol) for preservation andfuture analyses. These specimens are stored at the ResearchInstitute of Inland Fisheries, Palembang, South Sumatra, Indo-
nesia. Fish larvae at various developmental stages (from pre-flexion to post-flexion larvae) were collected using two sets of30-cm diameter modified bongo nets. The nets were maintained
submerged at ,5 cm from the water surface. Samples werecollected early in the morning (0600–0700 hours) and late in theafternoon (1700–1800 hours). Larvae were kept in water, sorted
manually after collection and were subsequently stored individ-ually in absolute ethanol.
DNA extraction, amplification and sequencing
Total genomic DNA was extracted from muscle tissue or wholelarvae using a salt-extraction procedure as described byAljanabi
and Martinez (1997). A partial fragment (501 bp) of the mito-chondrial COI was amplified using modified universal primersFish-COI-F and COI-Fish-R, as described by Ivanova et al.
(2007). The primer sequences were as follows: Fish-COI-F,50-TAA TACGACTCACTATAGGGTTCTCCACCAACCACA ARG AYA TYGG-30; COI-Fish-R, 50-ATT AAC CCTCAC TAA AGG GCA CCT CAG GGT GTC CGA ARA AYC
ARAA-30.
B Marine and Freshwater Research A. Wibowo et al.

Amplification of the COI fragment was performed in a12.5-mL reaction volume consisting of 4.0 mL of ultrapurewater,
0.625 mL of each primer (1 mM), 6.25 mL of 2� QIAGENMultiplex PCR Master Mix and 1 mL of DNA template(,100 ng mL�1). The polymerase chain reaction (PCR) cycling
parameters included an initial DNA polymerase activation stepof 15 min at 958C, followed by 35 cycles of 30 s at 948C, 90 s at558C and 30 s at 728C, and endingwith a final extension of 5min
at 728C. The PCR products were visualised on a 1% agarose geland purified using the A’SAP PCR Clean-up kit (ArcticZymes,Tromsø, Norway, see www.articzymes.com). A sequencingreaction was performed by the EZ-Seq service (Macrogen)
using the reverse primer (COI-Fish-R). In total, 141 sampleswere successfully sequenced, consisting of 19 morphologicallyidentified adult fish species and 122 fish larvae.
Data analysis
Chromatograms were checked manually and multisequencealignments were done using MUSCLE (Dereeper et al. 2004).Additional sequences were obtained fromBasic Local Alignment
Search Tool (BLAST) searches of the National Center for Bio-technology Information (NCBI) GenBank database (http://www.ncbi.nlm.nih.gov/, accessed 12 June 2016) and were used to
identify specimens when the resulting sequences were atminimum of 97% similar. This threshold has often been usedfor specimen identification in different taxonomic groups(e.g. Hebert et al. 2003). However, in some cases this may lead to
clumping of closely related species, because coalescent depthsamong specieswill vary due to differences in population size, rateof mutation and time since speciation (Monaghan et al. 2009;
Fujita et al. 2012). A neighbour-joining tree was constructedwith
the Kimura 2-parameter (K2P) model using MEGA ver. 5.0software (Sudhir Kumar, Temple University, Philadelphia, PA,
USA) (Tamura et al. 2011). Analysed specimenswere consideredto belong to a specific taxonomic group only if they formed acluster with a maximum of 3% (K2P) sequence divergence
(Hebert et al. 2003). Bootstrap analyses were based on 1000replicates. The COI sequences of every specimen analysed weresubmitted to the NCBI database (for accession numbers, see
Table S1, available as Supplementary material to this paper).
Results
Species identification using DNA barcoding
Initially,DNAwas isolated from347 specimens but amplificationof the 501-bp target DNA fragment was successful only for 141
samples (amplification success rate 41.3%; Table 1; Fig. 2),despite testing various annealing temperatures. Such low ampli-fication success most likely reflects the degradation of DNA, as
revealed by gel electrophoresis of total DNA (data not shown).DNA degradation most likely occurred during sampling andcollection of tissues or specimens. Altogether, 161 sequences of
mitochondrial COI (501 bp) were included in the analysis, con-sisting of 19 known adult samples (11 species), 122 fish larvae(Table S1) and 20 known species from the NCBI GenBank
database. The reference library dataset consisted of COI
sequences from 31 species placed in 28 genera, 20 families andseven orders. The dataset included taxonomic groups (includingClupeoides) that are expected to occur at the sampling locations
based on the available literature. Five of the reference specieswere represented by more than two individuals per species.Sequences from seven species (Parambassis gulliveri, Pingalla
lorentzi, Nematalosa flyensis, Toxotes oligolepis, Strongylura
0 50 100 km
138� 139� 140�
�8�
�7�
0 500 km1
23
4
Riv
er K
umbe
N e w G u i n e a
Alfasera (1)
Yakui (3) Sakor (4)Inggum (2)
Fig. 1. Sampling locations (1–4) in the River Kumbe, Indonesia. 1, Alfasera; 2, Inggun; 3, Yakui; 4, Sakor.
Fish larvae in tropical peat swamps of New Guinea Marine and Freshwater Research C
krefftii, Ambassis agrammus, Porochilus meraukensis) that wereincluded in the reference represented new additions to the global
COI barcode database for freshwater fish at the time of analysis.Fish larvae were initially sorted into 10 different morpho-
types according to their basic morphological features, including
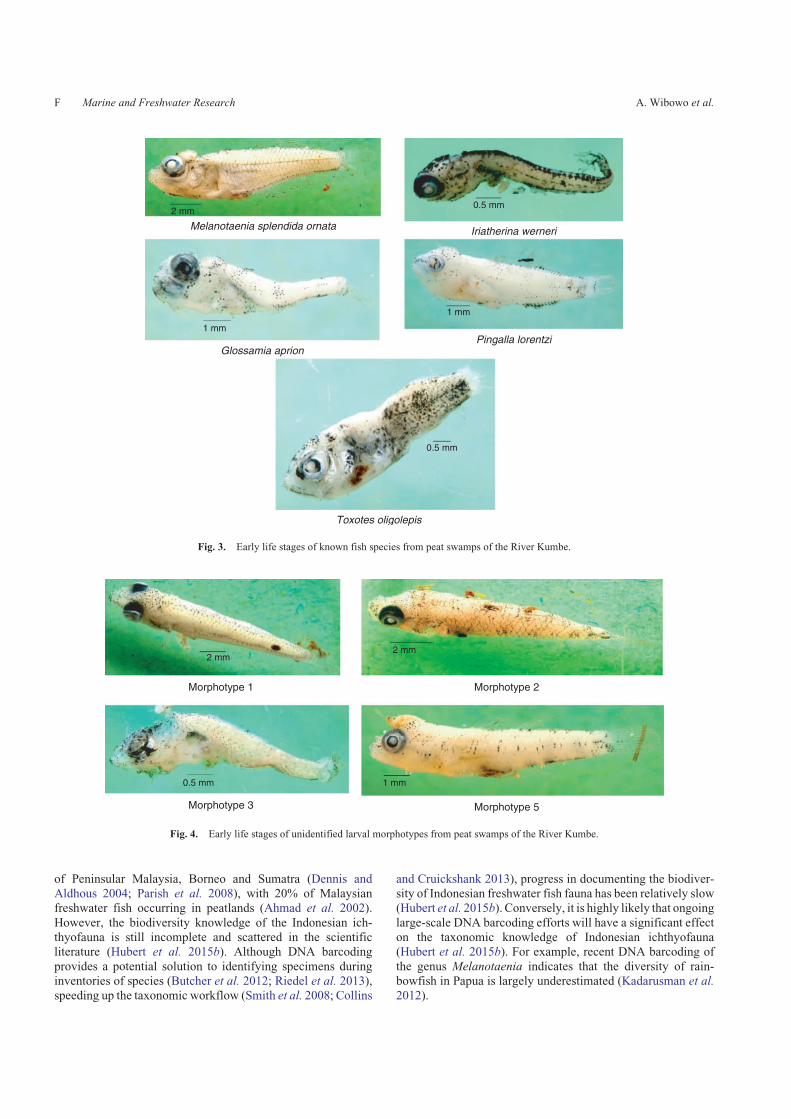
size, shape and pigmentation. DNA barcoding enabled thespecies identification of five larval morphotypes (Melanotaenia
splendida inornata, Iriatherina werneri, T. oligolepis, Glossa-
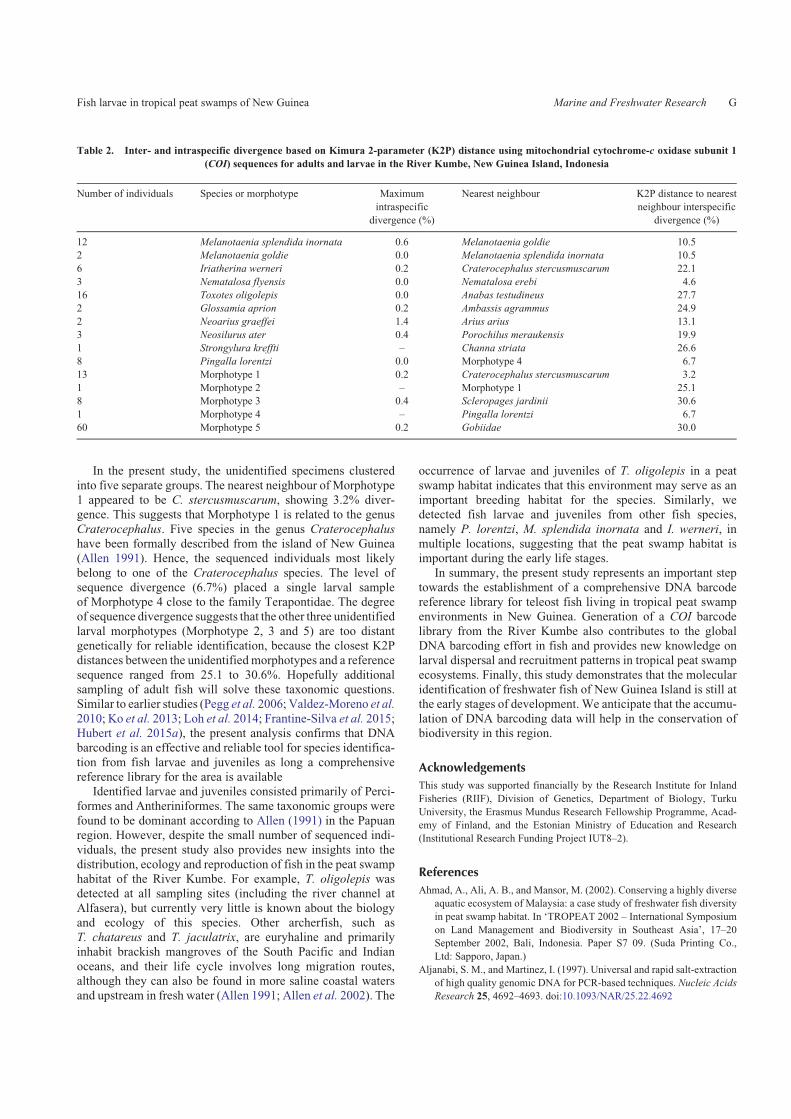
mia aprion, P. lorentzi) (Fig. 3), whereas the other five clustersremained unidentified (Figs 2, 4). The maximum observedintraspecific divergence based on the K2P distance betweenindividuals belonging to the same morphotype was 0.8%
(G. aprion; Fig. 2), whereas no intraspecific variation was foundwithin T. oligolepis and P. lorentzi (Table 2).
Undescribed biodiversity of fish
In contrast with several earlier DNA barcoding studies in fishlarvae (Ko et al. 2013; Frantine-Silva et al. 2015), we were not
able to determine the species identity for a large proportion ofsequenced specimens. Specifically, fish larvae and juvenile
specimens could not be assigned to species in 58.7% of cases(84 sequences) because of a lack of corresponding COI
sequences in the reference dataset. Unidentified sequences
clustered into five separate groups.The maximum K2P divergence within the unidentified Mor-
photype 1 group was 0.2% (Table 2) and its nearest neighbour
wasCraterocephalus stercusmuscarum (GB-KF22798.1), whichshowed a minimum divergence of 3.2% (Table 1; Fig. 2). Only asingle individual was identified as Morphotype 2 and the mini-mum K2P divergence to its nearest neighbour (Morphotype 1)
was 25.1% (Table 2; Fig. 2). Morphotype 3, comprising eightlarvae and juvenile sequences, exhibited maximum K2P diver-gence of 0.4% within the group (Table 2) and the closest
reference sequence from Scleropages jardinii (KF481952.1)showed minimum K2P divergence of 30.6% (Table1; Fig. 2).Only a single larvae comprisedMorphotype 4, and the minimum
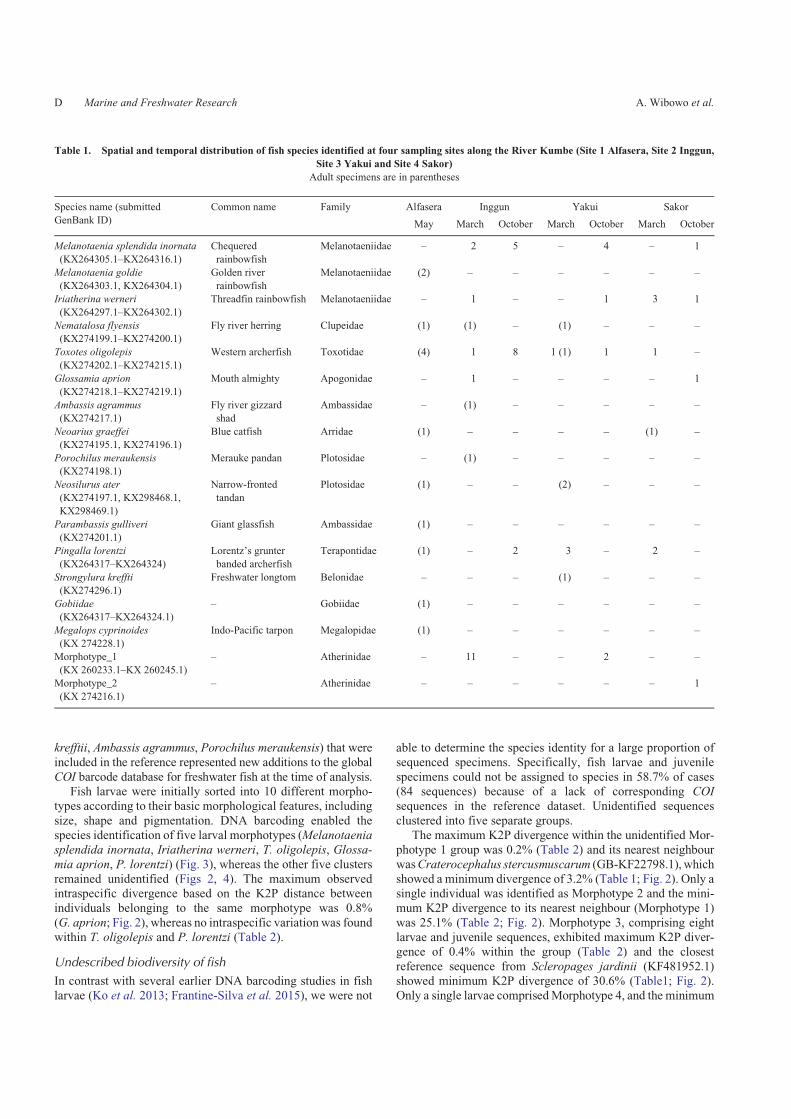
Table 1. Spatial and temporal distribution of fish species identified at four sampling sites along the River Kumbe (Site 1 Alfasera, Site 2 Inggun,
Site 3 Yakui and Site 4 Sakor)
Adult specimens are in parentheses
Species name (submitted
GenBank ID)
Common name Family Alfasera Inggun Yakui Sakor
May March October March October March October
Melanotaenia splendida inornata
(KX264305.1–KX264316.1)
Chequered
rainbowfish
Melanotaeniidae – 2 5 – 4 – 1
Melanotaenia goldie
(KX264303.1, KX264304.1)
Golden river
rainbowfish
Melanotaeniidae (2) – – – – – –
Iriatherina werneri
(KX264297.1–KX264302.1)
Threadfin rainbowfish Melanotaeniidae – 1 – – 1 3 1
Nematalosa flyensis
(KX274199.1–KX274200.1)
Fly river herring Clupeidae (1) (1) – (1) – – –
Toxotes oligolepis
(KX274202.1–KX274215.1)
Western archerfish Toxotidae (4) 1 8 1 (1) 1 1 –
Glossamia aprion
(KX274218.1–KX274219.1)
Mouth almighty Apogonidae – 1 – – – – 1
Ambassis agrammus
(KX274217.1)
Fly river gizzard
shad
Ambassidae – (1) – – – – –
Neoarius graeffei
(KX274195.1, KX274196.1)
Blue catfish Arridae (1) – – – – (1) –
Porochilus meraukensis
(KX274198.1)
Merauke pandan Plotosidae – (1) – – – – –
Neosilurus ater
(KX274197.1, KX298468.1,
KX298469.1)
Narrow-fronted
tandan
Plotosidae (1) – – (2) – – –
Parambassis gulliveri
(KX274201.1)
Giant glassfish Ambassidae (1) – – – – – –
Pingalla lorentzi
(KX264317–KX264324)
Lorentz’s grunter
banded archerfish
Terapontidae (1) – 2 3 – 2 –
Strongylura kreffti
(KX274296.1)
Freshwater longtom Belonidae – – – (1) – – –
Gobiidae
(KX264317–KX264324.1)
– Gobiidae (1) – – – – – –
Megalops cyprinoides
(KX 274228.1)
Indo-Pacific tarpon Megalopidae (1) – – – – – –
Morphotype_1
(KX 260233.1–KX 260245.1)
– Atherinidae – 11 – – 2 – –
Morphotype_2
(KX 274216.1)
– Atherinidae – – – – – – 1
D Marine and Freshwater Research A. Wibowo et al.
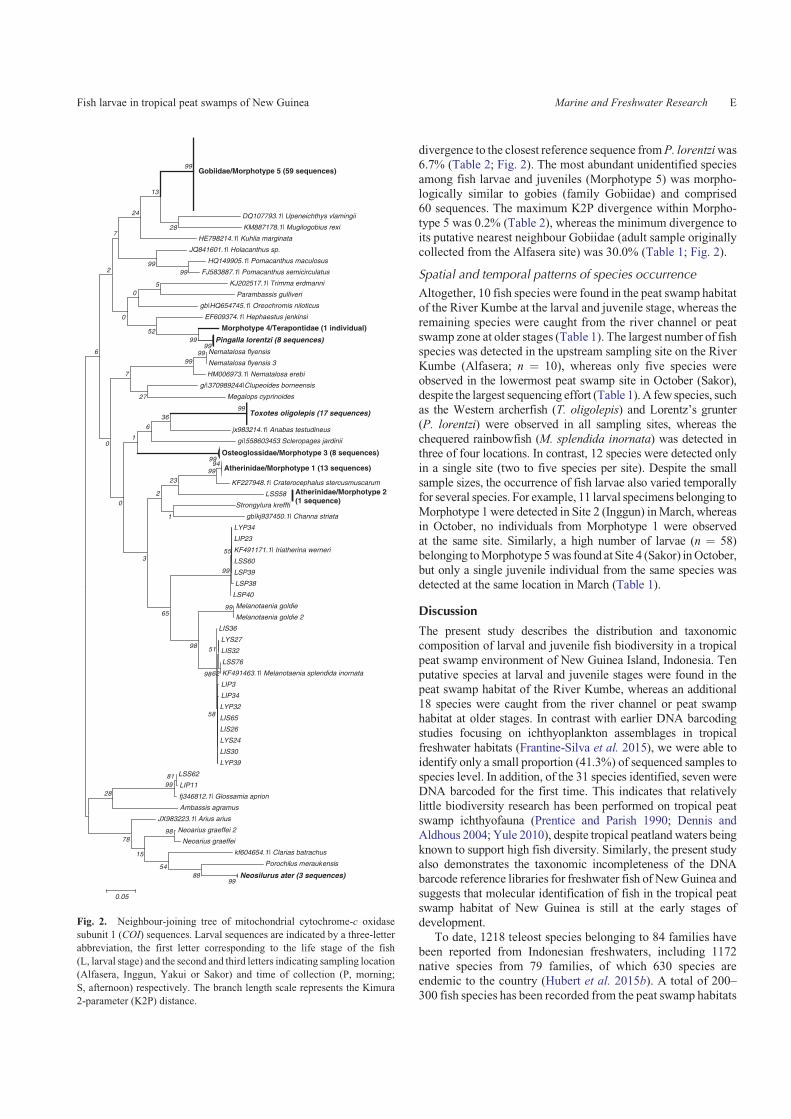
divergence to the closest reference sequence fromP. lorentziwas6.7% (Table 2; Fig. 2). The most abundant unidentified species
among fish larvae and juveniles (Morphotype 5) was morpho-logically similar to gobies (family Gobiidae) and comprised60 sequences. The maximum K2P divergence within Morpho-
type 5 was 0.2% (Table 2), whereas the minimum divergence toits putative nearest neighbour Gobiidae (adult sample originallycollected from the Alfasera site) was 30.0% (Table 1; Fig. 2).
Spatial and temporal patterns of species occurrence
Altogether, 10 fish species were found in the peat swamp habitatof the River Kumbe at the larval and juvenile stage, whereas the
remaining species were caught from the river channel or peatswamp zone at older stages (Table 1). The largest number of fishspecies was detected in the upstream sampling site on the River
Kumbe (Alfasera; n ¼ 10), whereas only five species wereobserved in the lowermost peat swamp site in October (Sakor),despite the largest sequencing effort (Table 1). A fewspecies, suchas the Western archerfish (T. oligolepis) and Lorentz’s grunter
(P. lorentzi) were observed in all sampling sites, whereas thechequered rainbowfish (M. splendida inornata) was detected inthree of four locations. In contrast, 12 species were detected only
in a single site (two to five species per site). Despite the smallsample sizes, the occurrence of fish larvae also varied temporallyfor several species. For example, 11 larval specimens belonging to
Morphotype 1 were detected in Site 2 (Inggun) inMarch, whereasin October, no individuals from Morphotype 1 were observedat the same site. Similarly, a high number of larvae (n ¼ 58)belonging toMorphotype 5was found at Site 4 (Sakor) inOctober,
but only a single juvenile individual from the same species wasdetected at the same location in March (Table 1).
Discussion
The present study describes the distribution and taxonomiccomposition of larval and juvenile fish biodiversity in a tropical
peat swamp environment of New Guinea Island, Indonesia. Tenputative species at larval and juvenile stages were found in thepeat swamp habitat of the River Kumbe, whereas an additional
18 species were caught from the river channel or peat swamphabitat at older stages. In contrast with earlier DNA barcodingstudies focusing on ichthyoplankton assemblages in tropical
freshwater habitats (Frantine-Silva et al. 2015), we were able toidentify only a small proportion (41.3%) of sequenced samples tospecies level. In addition, of the 31 species identified, seven wereDNA barcoded for the first time. This indicates that relatively
little biodiversity research has been performed on tropical peatswamp ichthyofauna (Prentice and Parish 1990; Dennis andAldhous 2004; Yule 2010), despite tropical peatland waters being
known to support high fish diversity. Similarly, the present studyalso demonstrates the taxonomic incompleteness of the DNAbarcode reference libraries for freshwater fish of NewGuinea and
suggests that molecular identification of fish in the tropical peatswamp habitat of New Guinea is still at the early stages ofdevelopment.
To date, 1218 teleost species belonging to 84 families havebeen reported from Indonesian freshwaters, including 1172native species from 79 families, of which 630 species areendemic to the country (Hubert et al. 2015b). A total of 200–
300 fish species has been recorded from the peat swamp habitats
Gobiidae/Morphotype 5 (59 sequences)
DQ107793.1| Upeneichthys vlamingii
KM887178.1| Mugilogobius rexi
HE798214.1| Kuhlia marginata
JQ841601.1| Holacanthus sp.
HQ149905.1| Pomacanthus maculosus
FJ583887.1| Pomacanthus semicirculatus
KJ202517.1| Trimma erdmanni
Parambassis gulliveri
gb|HQ654745.1| Oreochromis niloticus
EF609374.1| Hephaestus jenkinsi
Morphotype 4/Terapontidae (1 individual)
Pingalla lorentzi (8 sequences)
Nematalosa flyensis
Nematalosa flyensis 3
HM006973.1| Nematalosa erebi
gi |370989244|Clupeoides borneensis
Megalops cyprinoides
Toxotes oligolepis (17 sequences)
jx983214.1| Anabas testudineus
gi |558603453 Scleropages jardinii
Osteoglossidae/Morphotype 3 (8 sequences)
Atherinidae/Morphotype 1 (13 sequences)
KF227948.1| Craterocephalus stercusmuscarumAtherinidae/Morphotype 2(1 sequence)
LSS58
Strongylura kreffti
gb|kj937450.1| Channa striata
LYP34
LIP23
KF491171.1| Iriatherina werneri
LSS60
LSP39
LSP38
LSP40
Melanotaenia goldie
Melanotaenia goldie 2
LIS36
LYS27
LIS32
LSS76
KF491463.1| Melanotaenia splendida inornata
LIP3
LIP34
LYP32
LIS65
LIS26
LYS24
LIS30
LYP39
LSS62
LIP11
fj346812.1| Glossamia aprion
Ambassis agramus
JX983223.1| Arius arius
Neoarius graeffei 2
Neoarius graeffei
kf604654.1| Clarias batrachus
Porochilus meraukensis
Neosilurus ater (3 sequences)99
8199
99
99
99
98
99
55
99
9499
99
62
51
58
98
9999
98
99
78
8854
65
36
15
23
27
52
6
3
28
99
1
7
0
0
6
0
1
2
50
2
7
24
28
13
99
0.05
Fig. 2. Neighbour-joining tree of mitochondrial cytochrome-c oxidase
subunit 1 (COI) sequences. Larval sequences are indicated by a three-letter
abbreviation, the first letter corresponding to the life stage of the fish
(L, larval stage) and the second and third letters indicating sampling location
(Alfasera, Inggun, Yakui or Sakor) and time of collection (P, morning;
S, afternoon) respectively. The branch length scale represents the Kimura
2-parameter (K2P) distance.
Fish larvae in tropical peat swamps of New Guinea Marine and Freshwater Research E
of Peninsular Malaysia, Borneo and Sumatra (Dennis andAldhous 2004; Parish et al. 2008), with 20% of Malaysianfreshwater fish occurring in peatlands (Ahmad et al. 2002).
However, the biodiversity knowledge of the Indonesian ich-thyofauna is still incomplete and scattered in the scientificliterature (Hubert et al. 2015b). Although DNA barcoding
provides a potential solution to identifying specimens duringinventories of species (Butcher et al. 2012; Riedel et al. 2013),speeding up the taxonomic workflow (Smith et al. 2008; Collins
and Cruickshank 2013), progress in documenting the biodiver-sity of Indonesian freshwater fish fauna has been relatively slow(Hubert et al. 2015b). Conversely, it is highly likely that ongoing
large-scale DNA barcoding efforts will have a significant effecton the taxonomic knowledge of Indonesian ichthyofauna(Hubert et al. 2015b). For example, recent DNA barcoding of
the genus Melanotaenia indicates that the diversity of rain-bowfish in Papua is largely underestimated (Kadarusman et al.
2012).
Melanotaenia splendida ornata Iriatherina werneri
Glossamia aprionPingalla lorentzi
Toxotes oligolepis
0.5 mm2 mm
1 mm
1 mm
0.5 mm
Fig. 3. Early life stages of known fish species from peat swamps of the River Kumbe.
Morphotype 1 Morphotype 2
Morphotype 3 Morphotype 5
0.5 mm 1 mm
2 mm2 mm
Fig. 4. Early life stages of unidentified larval morphotypes from peat swamps of the River Kumbe.
F Marine and Freshwater Research A. Wibowo et al.
In the present study, the unidentified specimens clustered
into five separate groups. The nearest neighbour of Morphotype1 appeared to be C. stercusmuscarum, showing 3.2% diver-gence. This suggests that Morphotype 1 is related to the genus
Craterocephalus. Five species in the genus Craterocephalus
have been formally described from the island of New Guinea(Allen 1991). Hence, the sequenced individuals most likely
belong to one of the Craterocephalus species. The level ofsequence divergence (6.7%) placed a single larval sampleof Morphotype 4 close to the family Terapontidae. The degreeof sequence divergence suggests that the other three unidentified
larval morphotypes (Morphotype 2, 3 and 5) are too distantgenetically for reliable identification, because the closest K2Pdistances between the unidentified morphotypes and a reference
sequence ranged from 25.1 to 30.6%. Hopefully additionalsampling of adult fish will solve these taxonomic questions.Similar to earlier studies (Pegg et al. 2006; Valdez-Moreno et al.
2010; Ko et al. 2013; Loh et al. 2014; Frantine-Silva et al. 2015;Hubert et al. 2015a), the present analysis confirms that DNAbarcoding is an effective and reliable tool for species identifica-
tion from fish larvae and juveniles as long a comprehensivereference library for the area is available
Identified larvae and juveniles consisted primarily of Perci-formes and Antheriniformes. The same taxonomic groups were
found to be dominant according to Allen (1991) in the Papuanregion. However, despite the small number of sequenced indi-viduals, the present study also provides new insights into the
distribution, ecology and reproduction of fish in the peat swamphabitat of the River Kumbe. For example, T. oligolepis wasdetected at all sampling sites (including the river channel at
Alfasera), but currently very little is known about the biologyand ecology of this species. Other archerfish, such asT. chatareus and T. jaculatrix, are euryhaline and primarilyinhabit brackish mangroves of the South Pacific and Indian
oceans, and their life cycle involves long migration routes,although they can also be found in more saline coastal watersand upstream in fresh water (Allen 1991; Allen et al. 2002). The
occurrence of larvae and juveniles of T. oligolepis in a peat
swamp habitat indicates that this environment may serve as animportant breeding habitat for the species. Similarly, wedetected fish larvae and juveniles from other fish species,
namely P. lorentzi, M. splendida inornata and I. werneri, inmultiple locations, suggesting that the peat swamp habitat isimportant during the early life stages.
In summary, the present study represents an important steptowards the establishment of a comprehensive DNA barcodereference library for teleost fish living in tropical peat swampenvironments in New Guinea. Generation of a COI barcode
library from the River Kumbe also contributes to the globalDNA barcoding effort in fish and provides new knowledge onlarval dispersal and recruitment patterns in tropical peat swamp
ecosystems. Finally, this study demonstrates that the molecularidentification of freshwater fish of New Guinea Island is still atthe early stages of development. We anticipate that the accumu-
lation of DNA barcoding data will help in the conservation ofbiodiversity in this region.
Acknowledgements
This study was supported financially by the Research Institute for Inland
Fisheries (RIIF), Division of Genetics, Department of Biology, Turku
University, the Erasmus Mundus Research Fellowship Programme, Acad-
emy of Finland, and the Estonian Ministry of Education and Research
(Institutional Research Funding Project IUT8–2).
References
Ahmad, A., Ali, A. B., and Mansor, M. (2002). Conserving a highly diverse
aquatic ecosystem of Malaysia: a case study of freshwater fish diversity
in peat swamp habitat. In ‘TROPEAT 2002 – International Symposium
on Land Management and Biodiversity in Southeast Asia’, 17–20
September 2002, Bali, Indonesia. Paper S7 09. (Suda Printing Co.,
Ltd: Sapporo, Japan.)
Aljanabi, S. M., and Martinez, I. (1997). Universal and rapid salt-extraction
of high quality genomic DNA for PCR-based techniques. Nucleic Acids
Research 25, 4692–4693. doi:10.1093/NAR/25.22.4692
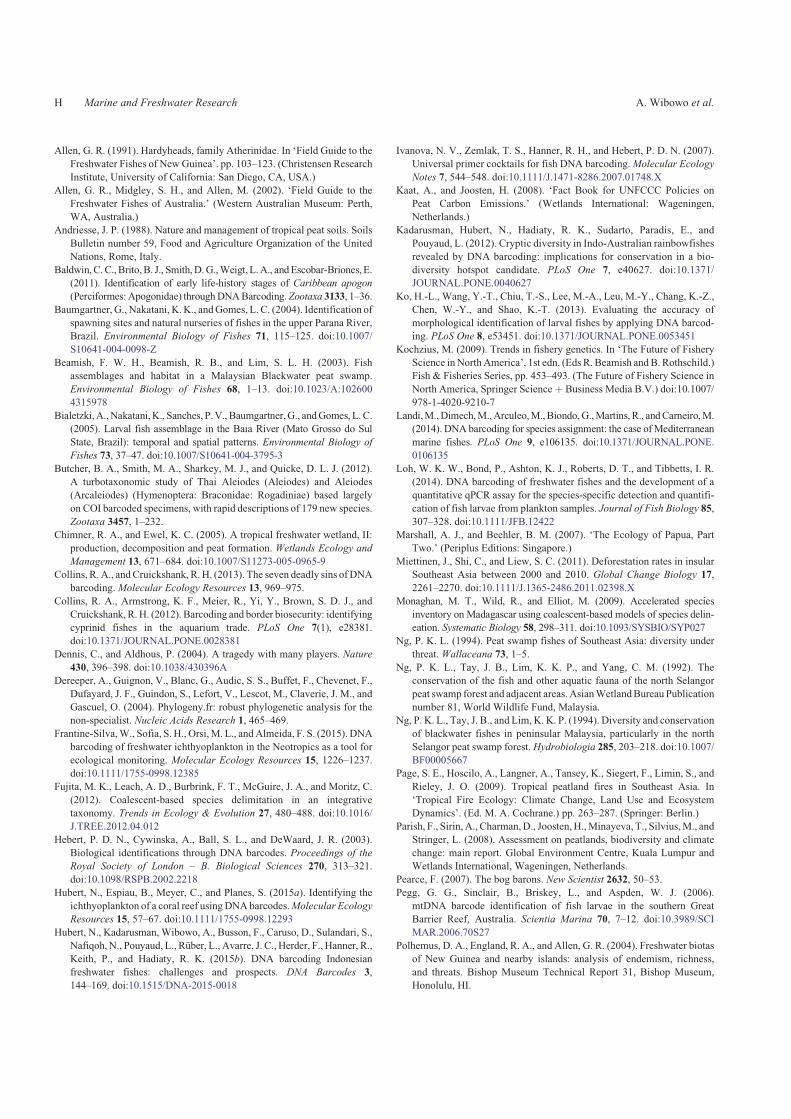
Table 2. Inter- and intraspecific divergence based on Kimura 2-parameter (K2P) distance using mitochondrial cytochrome-c oxidase subunit 1
(COI) sequences for adults and larvae in the River Kumbe, New Guinea Island, Indonesia
Number of individuals Species or morphotype Maximum
intraspecific
divergence (%)
Nearest neighbour K2P distance to nearest
neighbour interspecific
divergence (%)
12 Melanotaenia splendida inornata 0.6 Melanotaenia goldie 10.5
2 Melanotaenia goldie 0.0 Melanotaenia splendida inornata 10.5
6 Iriatherina werneri 0.2 Craterocephalus stercusmuscarum 22.1
3 Nematalosa flyensis 0.0 Nematalosa erebi 4.6
16 Toxotes oligolepis 0.0 Anabas testudineus 27.7
2 Glossamia aprion 0.2 Ambassis agrammus 24.9
2 Neoarius graeffei 1.4 Arius arius 13.1
3 Neosilurus ater 0.4 Porochilus meraukensis 19.9
1 Strongylura kreffti – Channa striata 26.6
8 Pingalla lorentzi 0.0 Morphotype 4 6.7
13 Morphotype 1 0.2 Craterocephalus stercusmuscarum 3.2
1 Morphotype 2 – Morphotype 1 25.1
8 Morphotype 3 0.4 Scleropages jardinii 30.6
1 Morphotype 4 – Pingalla lorentzi 6.7
60 Morphotype 5 0.2 Gobiidae 30.0
Fish larvae in tropical peat swamps of New Guinea Marine and Freshwater Research G
Allen, G. R. (1991). Hardyheads, family Atherinidae. In ‘Field Guide to the
Freshwater Fishes of New Guinea’. pp. 103–123. (Christensen Research
Institute, University of California: San Diego, CA, USA.)
Allen, G. R., Midgley, S. H., and Allen, M. (2002). ‘Field Guide to the
Freshwater Fishes of Australia.’ (Western Australian Museum: Perth,
WA, Australia.)
Andriesse, J. P. (1988). Nature and management of tropical peat soils. Soils
Bulletin number 59, Food and Agriculture Organization of the United
Nations, Rome, Italy.
Baldwin,C.C., Brito,B. J., Smith,D.G.,Weigt,L.A., andEscobar-Briones, E.
(2011). Identification of early life-history stages of Caribbean apogon
(Perciformes:Apogonidae) throughDNABarcoding.Zootaxa 3133, 1–36.
Baumgartner, G., Nakatani, K.K., andGomes, L. C. (2004). Identification of
spawning sites and natural nurseries of fishes in the upper Parana River,
Brazil. Environmental Biology of Fishes 71, 115–125. doi:10.1007/
S10641-004-0098-Z
Beamish, F. W. H., Beamish, R. B., and Lim, S. L. H. (2003). Fish
assemblages and habitat in a Malaysian Blackwater peat swamp.
Environmental Biology of Fishes 68, 1–13. doi:10.1023/A:102600
4315978
Bialetzki,A.,Nakatani,K., Sanches, P.V., Baumgartner,G., andGomes, L. C.
(2005). Larval fish assemblage in the Baıa River (Mato Grosso do Sul
State, Brazil): temporal and spatial patterns. Environmental Biology of
Fishes 73, 37–47. doi:10.1007/S10641-004-3795-3
Butcher, B. A., Smith, M. A., Sharkey, M. J., and Quicke, D. L. J. (2012).
A turbotaxonomic study of Thai Aleiodes (Aleiodes) and Aleiodes
(Arcaleiodes) (Hymenoptera: Braconidae: Rogadiniae) based largely
on COI barcoded specimens, with rapid descriptions of 179 new species.
Zootaxa 3457, 1–232.
Chimner, R. A., and Ewel, K. C. (2005). A tropical freshwater wetland, II:
production, decomposition and peat formation. Wetlands Ecology and
Management 13, 671–684. doi:10.1007/S11273-005-0965-9
Collins, R. A., andCruickshank, R.H. (2013). The seven deadly sins of DNA
barcoding. Molecular Ecology Resources 13, 969–975.
Collins, R. A., Armstrong, K. F., Meier, R., Yi, Y., Brown, S. D. J., and
Cruickshank, R.H. (2012). Barcoding and border biosecurity: identifying
cyprinid fishes in the aquarium trade. PLoS One 7(1), e28381.
doi:10.1371/JOURNAL.PONE.0028381
Dennis, C., and Aldhous, P. (2004). A tragedy with many players. Nature
430, 396–398. doi:10.1038/430396A
Dereeper, A., Guignon, V., Blanc, G., Audic, S. S., Buffet, F., Chevenet, F.,
Dufayard, J. F., Guindon, S., Lefort, V., Lescot, M., Claverie, J. M., and
Gascuel, O. (2004). Phylogeny.fr: robust phylogenetic analysis for the
non-specialist. Nucleic Acids Research 1, 465–469.
Frantine-Silva,W., Sofia, S. H., Orsi,M. L., andAlmeida, F. S. (2015). DNA
barcoding of freshwater ichthyoplankton in the Neotropics as a tool for
ecological monitoring. Molecular Ecology Resources 15, 1226–1237.
doi:10.1111/1755-0998.12385
Fujita, M. K., Leach, A. D., Burbrink, F. T., McGuire, J. A., and Moritz, C.
(2012). Coalescent-based species delimitation in an integrative
taxonomy. Trends in Ecology & Evolution 27, 480–488. doi:10.1016/
J.TREE.2012.04.012
Hebert, P. D. N., Cywinska, A., Ball, S. L., and DeWaard, J. R. (2003).
Biological identifications through DNA barcodes. Proceedings of the
Royal Society of London – B. Biological Sciences 270, 313–321.
doi:10.1098/RSPB.2002.2218
Hubert, N., Espiau, B., Meyer, C., and Planes, S. (2015a). Identifying the
ichthyoplankton of a coral reef usingDNA barcodes.Molecular Ecology
Resources 15, 57–67. doi:10.1111/1755-0998.12293
Hubert, N., Kadarusman, Wibowo, A., Busson, F., Caruso, D., Sulandari, S.,
Nafiqoh, N., Pouyaud, L., Ruber, L., Avarre, J. C., Herder, F., Hanner, R.,
Keith, P., and Hadiaty, R. K. (2015b). DNA barcoding Indonesian
freshwater fishes: challenges and prospects. DNA Barcodes 3,
144–169. doi:10.1515/DNA-2015-0018
Ivanova, N. V., Zemlak, T. S., Hanner, R. H., and Hebert, P. D. N. (2007).
Universal primer cocktails for fish DNA barcoding.Molecular Ecology
Notes 7, 544–548. doi:10.1111/J.1471-8286.2007.01748.X
Kaat, A., and Joosten, H. (2008). ‘Fact Book for UNFCCC Policies on
Peat Carbon Emissions.’ (Wetlands International: Wageningen,
Netherlands.)
Kadarusman, Hubert, N., Hadiaty, R. K., Sudarto, Paradis, E., and
Pouyaud, L. (2012). Cryptic diversity in Indo-Australian rainbowfishes
revealed by DNA barcoding: implications for conservation in a bio-
diversity hotspot candidate. PLoS One 7, e40627. doi:10.1371/
JOURNAL.PONE.0040627
Ko, H.-L., Wang, Y.-T., Chiu, T.-S., Lee, M.-A., Leu, M.-Y., Chang, K.-Z.,
Chen, W.-Y., and Shao, K.-T. (2013). Evaluating the accuracy of
morphological identification of larval fishes by applying DNA barcod-
ing. PLoS One 8, e53451. doi:10.1371/JOURNAL.PONE.0053451
Kochzius, M. (2009). Trends in fishery genetics. In ‘The Future of Fishery
Science inNorthAmerica’, 1st edn. (Eds R. Beamish andB. Rothschild.)
Fish & Fisheries Series, pp. 453–493. (The Future of Fishery Science in
North America, Springer Scienceþ Business Media B.V.) doi:10.1007/
978-1-4020-9210-7
Landi,M.,Dimech,M.,Arculeo,M.,Biondo,G.,Martins,R., andCarneiro,M.
(2014). DNA barcoding for species assignment: the case ofMediterranean
marine fishes. PLoS One 9, e106135. doi:10.1371/JOURNAL.PONE.
0106135
Loh, W. K. W., Bond, P., Ashton, K. J., Roberts, D. T., and Tibbetts, I. R.
(2014). DNA barcoding of freshwater fishes and the development of a
quantitative qPCR assay for the species-specific detection and quantifi-
cation of fish larvae from plankton samples. Journal of Fish Biology 85,
307–328. doi:10.1111/JFB.12422
Marshall, A. J., and Beehler, B. M. (2007). ‘The Ecology of Papua, Part
Two.’ (Periplus Editions: Singapore.)
Miettinen, J., Shi, C., and Liew, S. C. (2011). Deforestation rates in insular
Southeast Asia between 2000 and 2010. Global Change Biology 17,
2261–2270. doi:10.1111/J.1365-2486.2011.02398.X
Monaghan, M. T., Wild, R., and Elliot, M. (2009). Accelerated species
inventory on Madagascar using coalescent-based models of species delin-
eation. Systematic Biology 58, 298–311. doi:10.1093/SYSBIO/SYP027
Ng, P. K. L. (1994). Peat swamp fishes of Southeast Asia: diversity under
threat. Wallaceana 73, 1–5.
Ng, P. K. L., Tay, J. B., Lim, K. K. P., and Yang, C. M. (1992). The
conservation of the fish and other aquatic fauna of the north Selangor
peat swamp forest and adjacent areas. AsianWetlandBureau Publication
number 81, World Wildlife Fund, Malaysia.
Ng, P. K. L., Tay, J. B., and Lim, K. K. P. (1994). Diversity and conservation
of blackwater fishes in peninsular Malaysia, particularly in the north
Selangor peat swamp forest.Hydrobiologia 285, 203–218. doi:10.1007/
BF00005667
Page, S. E., Hoscilo, A., Langner, A., Tansey, K., Siegert, F., Limin, S., and
Rieley, J. O. (2009). Tropical peatland fires in Southeast Asia. In
‘Tropical Fire Ecology: Climate Change, Land Use and Ecosystem
Dynamics’. (Ed. M. A. Cochrane.) pp. 263–287. (Springer: Berlin.)
Parish, F., Sirin, A., Charman,D., Joosten,H.,Minayeva, T., Silvius,M., and
Stringer, L. (2008). Assessment on peatlands, biodiversity and climate
change: main report. Global Environment Centre, Kuala Lumpur and
Wetlands International, Wageningen, Netherlands.
Pearce, F. (2007). The bog barons. New Scientist 2632, 50–53.
Pegg, G. G., Sinclair, B., Briskey, L., and Aspden, W. J. (2006).
mtDNA barcode identification of fish larvae in the southern Great
Barrier Reef, Australia. Scientia Marina 70, 7–12. doi:10.3989/SCI
MAR.2006.70S27
Polhemus, D. A., England, R. A., and Allen, G. R. (2004). Freshwater biotas
of New Guinea and nearby islands: analysis of endemism, richness,
and threats. Bishop Museum Technical Report 31, Bishop Museum,
Honolulu, HI.
H Marine and Freshwater Research A. Wibowo et al.
Posa, M. R. C., Wijedasa, S. L. S., and Corlett, T. R. T. (2011). Biodiversity
and conservation of tropical peat swamp forests. Bioscience 61, 49–57.
doi:10.1525/BIO.2011.61.1.10
Prentice, C., and Parish, D. (1990). Conservation of peat swamp forest: a
forgotten ecosystem. In ‘In Harmony with Nature: Proceedings of the
International Conference on Conservation of Tropical Biodiversity’,
12–16 June 1990, Kuala Lumpur, Malaysia. (Eds Y. S. Kheong and L. S.
Win.) pp. 128–144. (FAO: Rome.)
Reynalte-Tataje, D. A., Nakatani, K., Fernandes, R., Agostinho, A. A., and
Bialetzki, A. (2011). Temporal distribution of ichthyoplankton in the
Ivinhema River (Mato Grosso do Sul State/Brazil): influence of envi-
ronmental variables. Neotropical Ichthyology 9, 427–436. doi:10.1590/
S1679-62252011005000017
Riedel, A., Sagata, K., Suhardjono, Y. R., Tanzler, R., and Balke,M. (2013).
Integrative taxonomy on the fast track: towards more sustainability in
biodiversity research. Frontiers in Zoology 10, 15. doi:10.1186/1742-
9994-10-15
Smith, P. E., and Richardson, S. L. (1977). Standard techniques for pelagic
fish egg and larva surveys. Southwest FisheriesCenterNMFS,NOM,US
Department of Commerce, La Jolla, CA, USA, and Sally L. Richardson
Department of Oceanography, Oregon State University, Corvallis,
OR, USA.
Smith, A. M., Rodriguez, J. J., Whitfield, J. B., Deans, A. R., Janzen, D. H.,
Hallwachs, W., and Hebert, P. D. N. (2008). Extreme diversity of
tropical parasitoid wasps exposed by iterative integration of natural
history, DNA barcoding, morphology, and collections. Proceedings of
the National Academy of Sciences of the United States of America 105,
12359–12364. doi:10.1073/PNAS.0805319105
Tamura, K., Peterson, D., Peterson, N., Stecher, G., Nei, M., and Kumar, S.
(2011). Mega5: molecular evolutionary genetics analysis using
maximum likelihood, evolutionary distance, and maximum parsimony
methods.Molecular Biology andEvolution 28, 2731–2739. doi:10.1093/
MOLBEV/MSR121
Trivedi, S., Aloufi, A. A., Ansari, A. A., and Ghosh, S. K. (2016). Role of
DNA barcoding in marine biodiversity assessment and conservation: an
update. Saudi Journal of Biological Sciences 23(2), 161–171.
doi:10.1016/J.SJBS.2015.01.001
Valdez-Moreno, M. V., Asquez-Yeomans, L., Elıas-Gutierrez, M., Ivanova,
N. V., and Hebert, P. D. N. (2010). Using DNA barcodes to connect
adults and early life stages of marine fishes from the Yucatan Peninsula,
Mexico: potential in fisheries management. Marine and Frewshwater
Research 61, 655–671. doi:10.1071/MF09222
Victor, B. C. (2007). Coryphopterus kuna, a new goby (Perciformes:
Gobiidae: Gobinae) from the western Caribbean, with the identification
of the late larval stage and an estimate of the pelagic larval duration.
Zootaxa 1526, 51–61.
Ward, R. D., Zemlak, T. S., and Innes, B. H. (2005). DNA barcoding
Australia’s fish species.Philosophical Transactions of the Royal Society
of London – B. Biological Sciences 360, 1847–1857. doi:10.1098/RSTB.
2005.1716
Yoshino, K., Ishida, T., Nagano, T., and Setiawan, Y. (2010). Land cover
pattern analysis of peat swamp lands in Southeast Asia. The International
Archives of thePhotogrammetry, Remote Sensing and Spatial Information
Sciences 38, 941–946.
Yule, C. M. (2010). Loss of biodiversity and ecosystem functioning in Indo-
Malayan peat swamp forests. Biodiversity and Conservation 19,
393–409. doi:10.1007/S10531-008-9510-5
www.publish.csiro.au/journals/mfr
Fish larvae in tropical peat swamps of New Guinea Marine and Freshwater Research I