dixie urbanizing area interim long-range (2000 … · dixie urbanizing area interim long-range ......
TRANSCRIPT

DIXIE URBANIZING AREA INTERIM LONG-RANGE (2000-2020) TRANSPORTATION PLAN
FOR THE ST. GEORGE URBANIZED AREAJUNE 2004
Prepared By The Dixie Transportation Planning Office
Five County Association Of Governments1070 W. 1600 S., Bldg. B
P.O. Box 1550, St. George, Utah 84771-1550

Suzanne Allen
Chair, Transportation Executive Council
Larry Bulloch
Chair, Transportation Advisory Committee
Lowell Elmer
Director, Transportation Planning Office
June 30, 2004
Transportation Planning Community
On behalf of the Dixie Metropolitan Planning Organization leadership we present to you the Interim Long
Range Transportation Plan for the Dixie Urbanizing Area with a horizon to the year 2020, as adopted by the
Dixie Transportation Executive Council. This document sets base-line and 2020 projections for many
population and demographic data and includes projects and financial costs that address short term and long
term transportation needs.
This interim plan is not a static document. The Dixie Transportation Planning Office is setting groundwork for
a 30 year horizon publication targeted for Spring of 2005. The expanded picture to 2035 will provide better
correlation with the other three MPO’s in the state and the Utah Department of Transportation’s planning
process. We hope you will review this document and provide input towards the 2035 Long Range
Transportation Plan for Utah’s Dixie.
We especially want to thank the MPO partners, Ivins, Santa Clara, St. George and Washington Cities,
Washington County and UDOT staff and elected officials for their input and direction on this interim effort;
and the Community and Economic Development staff of Five County Association of Governments for their
excellent work in editing and publishing this plan for the MPO.
Besides the hard copy presented with this letter a compact disk is also included. In July 2004 this document
will also be available on the Dixie MPO home page which is associated with the Five County Association of
Governments’ web site: http://www.fcaog.state.ut.us. Once there, please click on the “Departments” link and
then the “Dixie MPO” link. Higher resolution version of this plan’s maps are also available on that site.
You may also send comments to me at : [email protected].
Sincerely,
Lowell Elmer, Director
Dixie Metropolitan Planning Organization
Dixie Transportation Planning Office
Five County Association of Governments
1070 W. 1600 S., Bldg. B
P.O. Box 1550, St. George, UT 84771-1550
(435) 673-3548

TABLE OF CONTENTS
I. INTRODUCTION . . . . . . . . . . . . . . . . . . . . . . . . . . . . . . . . . . . . . . . . . . . . . . . . . . . . . . . . . . . . . . . . . . . . . . . . . 1
Background . . . . . . . . . . . . . . . . . . . . . . . . . . . . . . . . . . . . . . . . . . . . . . . . . . . . . . . . . . . . . . . . . . . . . . . . . . . . 1
Purpose . . . . . . . . . . . . . . . . . . . . . . . . . . . . . . . . . . . . . . . . . . . . . . . . . . . . . . . . . . . . . . . . . . . . . . . . . . . . . . . 2
Planning Process . . . . . . . . . . . . . . . . . . . . . . . . . . . . . . . . . . . . . . . . . . . . . . . . . . . . . . . . . . . . . . . . . . . . . . . . 2
Planning Data . . . . . . . . . . . . . . . . . . . . . . . . . . . . . . . . . . . . . . . . . . . . . . . . . . . . . . . . . . . . . . . . . . . . . . . . . . . 4
II. MISSION, GOALS, AND OBJECTIVES . . . . . . . . . . . . . . . . . . . . . . . . . . . . . . . . . . . . . . . . . . . . . . . . . . . . . . . 4
Mission . . . . . . . . . . . . . . . . . . . . . . . . . . . . . . . . . . . . . . . . . . . . . . . . . . . . . . . . . . . . . . . . . . . . . . . . . . . . . . . . 4
Vision . . . . . . . . . . . . . . . . . . . . . . . . . . . . . . . . . . . . . . . . . . . . . . . . . . . . . . . . . . . . . . . . . . . . . . . . . . . . . . . . . 5
Operating Values . . . . . . . . . . . . . . . . . . . . . . . . . . . . . . . . . . . . . . . . . . . . . . . . . . . . . . . . . . . . . . . . . . . . . . . . 5
Goals and Objectives . . . . . . . . . . . . . . . . . . . . . . . . . . . . . . . . . . . . . . . . . . . . . . . . . . . . . . . . . . . . . . . . . . . . . 5
III. DESCRIPTION OF THE PLANNING AREA . . . . . . . . . . . . . . . . . . . . . . . . . . . . . . . . . . . . . . . . . . . . . . . . . . . . 6
Urbanizing Area Boundary . . . . . . . . . . . . . . . . . . . . . . . . . . . . . . . . . . . . . . . . . . . . . . . . . . . . . . . . . . . . . . . . 6
Urbanizing Area Population . . . . . . . . . . . . . . . . . . . . . . . . . . . . . . . . . . . . . . . . . . . . . . . . . . . . . . . . . . . . . . . 6
Urbanizing Area Demographics . . . . . . . . . . . . . . . . . . . . . . . . . . . . . . . . . . . . . . . . . . . . . . . . . . . . . . . . . . . . 7
Population Density . . . . . . . . . . . . . . . . . . . . . . . . . . . . . . . . . . . . . . . . . . . . . . . . . . . . . . . . . . . . . . . . . . . . . . 8
Mobility Limited . . . . . . . . . . . . . . . . . . . . . . . . . . . . . . . . . . . . . . . . . . . . . . . . . . . . . . . . . . . . . . . . . . . . . . . . . 9
Environmental Justice (Low Income Populations) . . . . . . . . . . . . . . . . . . . . . . . . . . . . . . . . . . . . . . . . . . . . . 9
Zero Vehicle Households . . . . . . . . . . . . . . . . . . . . . . . . . . . . . . . . . . . . . . . . . . . . . . . . . . . . . . . . . . . . . . . . 10
Land Use Patterns . . . . . . . . . . . . . . . . . . . . . . . . . . . . . . . . . . . . . . . . . . . . . . . . . . . . . . . . . . . . . . . . . . . . . . 10
Land Use Plans (2003) . . . . . . . . . . . . . . . . . . . . . . . . . . . . . . . . . . . . . . . . . . . . . . . . . . . . . . . . . . . . . . . . . . . 10
Employment Patterns . . . . . . . . . . . . . . . . . . . . . . . . . . . . . . . . . . . . . . . . . . . . . . . . . . . . . . . . . . . . . . . . . . . 11
Summary . . . . . . . . . . . . . . . . . . . . . . . . . . . . . . . . . . . . . . . . . . . . . . . . . . . . . . . . . . . . . . . . . . . . . . . . . . . . . 14
IV. TRANSPORTATION SYSTEMS . . . . . . . . . . . . . . . . . . . . . . . . . . . . . . . . . . . . . . . . . . . . . . . . . . . . . . . . . . . . 15
Functional Classification . . . . . . . . . . . . . . . . . . . . . . . . . . . . . . . . . . . . . . . . . . . . . . . . . . . . . . . . . . . . . . . . . 15
Roadway System . . . . . . . . . . . . . . . . . . . . . . . . . . . . . . . . . . . . . . . . . . . . . . . . . . . . . . . . . . . . . . . 15
Public Transportation . . . . . . . . . . . . . . . . . . . . . . . . . . . . . . . . . . . . . . . . . . . . . . . . . . . . . . . . . . . . 16
Bicycle /Pedestrian Facilities . . . . . . . . . . . . . . . . . . . . . . . . . . . . . . . . . . . . . . . . . . . . . . . . . . . . . . 17
Existing and Projected Traffic Volumes . . . . . . . . . . . . . . . . . . . . . . . . . . . . . . . . . . . . . . . . . . . . . . . . . . . . 17
Environmental Constraints . . . . . . . . . . . . . . . . . . . . . . . . . . . . . . . . . . . . . . . . . . . . . . . . . . . . . . . . . . . . . . . 20
Air Quality . . . . . . . . . . . . . . . . . . . . . . . . . . . . . . . . . . . . . . . . . . . . . . . . . . . . . . . . . . . . . . . . . . . . . 20
Summary . . . . . . . . . . . . . . . . . . . . . . . . . . . . . . . . . . . . . . . . . . . . . . . . . . . . . . . . . . . . . . . . . . . . . . . . . . . . . 20
V. IDENTIFIED PROJECTS/NEEDS . . . . . . . . . . . . . . . . . . . . . . . . . . . . . . . . . . . . . . . . . . . . . . . . . . . . . . . . . . . 21
Introduction . . . . . . . . . . . . . . . . . . . . . . . . . . . . . . . . . . . . . . . . . . . . . . . . . . . . . . . . . . . . . . . . . . . . . . . . . . . 21
Highway Projects/Needs . . . . . . . . . . . . . . . . . . . . . . . . . . . . . . . . . . . . . . . . . . . . . . . . . . . . . . . . . . . . . . . . . 22
Transit Projects . . . . . . . . . . . . . . . . . . . . . . . . . . . . . . . . . . . . . . . . . . . . . . . . . . . . . . . . . . . . . . . . . . . . . . . . 23
Pedestrian and Bicycle Projects . . . . . . . . . . . . . . . . . . . . . . . . . . . . . . . . . . . . . . . . . . . . . . . . . . . . . . . . . . 24
Public Involvement . . . . . . . . . . . . . . . . . . . . . . . . . . . . . . . . . . . . . . . . . . . . . . . . . . . . . . . . . . . . . . . . . . . . . 25
VI. REVENUE SOURCES . . . . . . . . . . . . . . . . . . . . . . . . . . . . . . . . . . . . . . . . . . . . . . . . . . . . . . . . . . . . . . . . . . . . 26
Federal Sources . . . . . . . . . . . . . . . . . . . . . . . . . . . . . . . . . . . . . . . . . . . . . . . . . . . . . . . . . . . . . . . . . . . . . . . . 27
Federal Highway Administration . . . . . . . . . . . . . . . . . . . . . . . . . . . . . . . . . . . . . . . . . . . . . . . . . . . . . . . . . . 27
Federal-Aid Interstate Maintenance Program(FAIM) . . . . . . . . . . . . . . . . . . . . . . . . . . . . . . . . . . . 27
National Highway System(NHS) . . . . . . . . . . . . . . . . . . . . . . . . . . . . . . . . . . . . . . . . . . . . . . . . . . . 27
Surface Transportation Program (STP) . . . . . . . . . . . . . . . . . . . . . . . . . . . . . . . . . . . . . . . . . . . . . 28
Congestion Management/Air Quality(CMAQ) . . . . . . . . . . . . . . . . . . . . . . . . . . . . . . . . . . . . . . . . . 28
Bridge Replacement Program(BR) . . . . . . . . . . . . . . . . . . . . . . . . . . . . . . . . . . . . . . . . . . . . . . . . . 28
Planning (PL) . . . . . . . . . . . . . . . . . . . . . . . . . . . . . . . . . . . . . . . . . . . . . . . . . . . . . . . . . . . . . . . . . . . 29
State Planning & Research(SPR) . . . . . . . . . . . . . . . . . . . . . . . . . . . . . . . . . . . . . . . . . . . . . . . . . . . 29
Rideshare Program . . . . . . . . . . . . . . . . . . . . . . . . . . . . . . . . . . . . . . . . . . . . . . . . . . . . . . . . . . . . . . 29
Federal Transit Administration . . . . . . . . . . . . . . . . . . . . . . . . . . . . . . . . . . . . . . . . . . . . . . . . . . . . . . . . . . . . 30
Capital Program(5309) . . . . . . . . . . . . . . . . . . . . . . . . . . . . . . . . . . . . . . . . . . . . . . . . . . . . . . . . . . . 30
Urbanized Area Formula Program(5307) . . . . . . . . . . . . . . . . . . . . . . . . . . . . . . . . . . . . . . . . . . . . 30
Elderly and Persons with Disabilities Program(5310) . . . . . . . . . . . . . . . . . . . . . . . . . . . . . . . . . . 30
Non-urbanized Area Formula Program(5311) . . . . . . . . . . . . . . . . . . . . . . . . . . . . . . . . . . . . . . . . . 31
Statewide Planning and Research(5313) . . . . . . . . . . . . . . . . . . . . . . . . . . . . . . . . . . . . . . . . . . . . 31
Metropolitan Planning(5303) . . . . . . . . . . . . . . . . . . . . . . . . . . . . . . . . . . . . . . . . . . . . . . . . . . . . . . 31
Demonstration Funds . . . . . . . . . . . . . . . . . . . . . . . . . . . . . . . . . . . . . . . . . . . . . . . . . . . . . . . . . . . . 32

Other Federal Programs . . . . . . . . . . . . . . . . . . . . . . . . . . . . . . . . . . . . . . . . . . . . . . . . . . . . . . . . . . . . . . . . . 32
Community Development Block Grants(CDBG) . . . . . . . . . . . . . . . . . . . . . . . . . . . . . . . . . . . . . . . 32
Economic Development Grants . . . . . . . . . . . . . . . . . . . . . . . . . . . . . . . . . . . . . . . . . . . . . . . . . . . . 33
State Sources . . . . . . . . . . . . . . . . . . . . . . . . . . . . . . . . . . . . . . . . . . . . . . . . . . . . . . . . . . . . . . . . . . . . . . . . . . 33
Local Sources . . . . . . . . . . . . . . . . . . . . . . . . . . . . . . . . . . . . . . . . . . . . . . . . . . . . . . . . . . . . . . . . . . . . . . . . . 33
Private Sources . . . . . . . . . . . . . . . . . . . . . . . . . . . . . . . . . . . . . . . . . . . . . . . . . . . . . . . . . . . . . . . . . . . . . . . . 34
VII. PROJECTED REVENUES . . . . . . . . . . . . . . . . . . . . . . . . . . . . . . . . . . . . . . . . . . . . . . . . . . . . . . . . . . . . . . . . 34
Introduction . . . . . . . . . . . . . . . . . . . . . . . . . . . . . . . . . . . . . . . . . . . . . . . . . . . . . . . . . . . . . . . . . . . . . . . . . . . 34
Highway Sources . . . . . . . . . . . . . . . . . . . . . . . . . . . . . . . . . . . . . . . . . . . . . . . . . . . . . . . . . . . . . . . . . . . . . . . 35
Federal Funds . . . . . . . . . . . . . . . . . . . . . . . . . . . . . . . . . . . . . . . . . . . . . . . . . . . . . . . . . . . . . . . . . . 35
State Funds . . . . . . . . . . . . . . . . . . . . . . . . . . . . . . . . . . . . . . . . . . . . . . . . . . . . . . . . . . . . . . . . . . . . 35
Local Funds . . . . . . . . . . . . . . . . . . . . . . . . . . . . . . . . . . . . . . . . . . . . . . . . . . . . . . . . . . . . . . . . . . . . 36
Summary . . . . . . . . . . . . . . . . . . . . . . . . . . . . . . . . . . . . . . . . . . . . . . . . . . . . . . . . . . . . . . . . . . . . . . . . . . . . . 37
Transit Sources . . . . . . . . . . . . . . . . . . . . . . . . . . . . . . . . . . . . . . . . . . . . . . . . . . . . . . . . . . . . . . . . . . . . . . . . 37
Federal Funds . . . . . . . . . . . . . . . . . . . . . . . . . . . . . . . . . . . . . . . . . . . . . . . . . . . . . . . . . . . . . . . . . . 37
Capital Program(5309) . . . . . . . . . . . . . . . . . . . . . . . . . . . . . . . . . . . . . . . . . . . . . . . . . . . . 37
Formula(5307) . . . . . . . . . . . . . . . . . . . . . . . . . . . . . . . . . . . . . . . . . . . . . . . . . . . . . . . . . . . 37
Local Funding . . . . . . . . . . . . . . . . . . . . . . . . . . . . . . . . . . . . . . . . . . . . . . . . . . . . . . . . . . . . . . . . . . 38
User Fees . . . . . . . . . . . . . . . . . . . . . . . . . . . . . . . . . . . . . . . . . . . . . . . . . . . . . . . . . . . . . . . . . . . . . . 38
Fare Revenue . . . . . . . . . . . . . . . . . . . . . . . . . . . . . . . . . . . . . . . . . . . . . . . . . . . . . . . . . . . . . . . . . . . 38
Other Revenues . . . . . . . . . . . . . . . . . . . . . . . . . . . . . . . . . . . . . . . . . . . . . . . . . . . . . . . . . . . . . . . . . 39
Flexible Funding . . . . . . . . . . . . . . . . . . . . . . . . . . . . . . . . . . . . . . . . . . . . . . . . . . . . . . . . . . . . . . . . 39
Revenue Summary . . . . . . . . . . . . . . . . . . . . . . . . . . . . . . . . . . . . . . . . . . . . . . . . . . . . . . . . . . . . . . . . . . . . . . 40
VIII. PROJECTED COSTS . . . . . . . . . . . . . . . . . . . . . . . . . . . . . . . . . . . . . . . . . . . . . . . . . . . . . . . . . . . . . . . . . . . . 40
Highway Cost Estimates . . . . . . . . . . . . . . . . . . . . . . . . . . . . . . . . . . . . . . . . . . . . . . . . . . . . . . . . . . . . . . . . . 40
Administration . . . . . . . . . . . . . . . . . . . . . . . . . . . . . . . . . . . . . . . . . . . . . . . . . . . . . . . . . . . . . . . . . . 40
Maintenance . . . . . . . . . . . . . . . . . . . . . . . . . . . . . . . . . . . . . . . . . . . . . . . . . . . . . . . . . . . . . . . . . . . 41
Pavement Preservation . . . . . . . . . . . . . . . . . . . . . . . . . . . . . . . . . . . . . . . . . . . . . . . . . . . . . . . . . . 41
Safety . . . . . . . . . . . . . . . . . . . . . . . . . . . . . . . . . . . . . . . . . . . . . . . . . . . . . . . . . . . . . . . . . . . . . . . . . 41
Bridge Replacement . . . . . . . . . . . . . . . . . . . . . . . . . . . . . . . . . . . . . . . . . . . . . . . . . . . . . . . . . . . . . 41
Enhancements . . . . . . . . . . . . . . . . . . . . . . . . . . . . . . . . . . . . . . . . . . . . . . . . . . . . . . . . . . . . . . . . . . 42
New Capacity . . . . . . . . . . . . . . . . . . . . . . . . . . . . . . . . . . . . . . . . . . . . . . . . . . . . . . . . . . . . . . . . . . . 42
Summary . . . . . . . . . . . . . . . . . . . . . . . . . . . . . . . . . . . . . . . . . . . . . . . . . . . . . . . . . . . . . . . . . . . . . . . . . . . . . 42
Transit Costs . . . . . . . . . . . . . . . . . . . . . . . . . . . . . . . . . . . . . . . . . . . . . . . . . . . . . . . . . . . . . . . . . . . . . . . . . . 43
TABLES . . . . . . . . . . . . . . . . . . . . . . . . . . . . . . . . . . . . . . . . . . . . . . . . . . . . . . . . . . . . . . . . . . . . . . . . . . . . . . . . . . . . . . . .
Table 1 - Dixie Urbanizing Area 20 Year Planning Boundary Estimated 2000 Demographics . . . . . . . . . .7
Table 2 - Dixie Urbanizing Area 20 Year Planning Boundary Projected 2020 Demographics . . . . . . . . . .8
Table 3 - Washington County Largest Employers (Annual Averages 2002) . . . . . . . . . . . . . . . . . . . . . . . . 11
Table 4 - Right-of-Way Functional Classification . . . . . . . . . . . . . . . . . . . . . . . . . . . . . . . . . . . . . . . . . . . . . 15
Table 5 - Road Ownership . . . . . . . . . . . . . . . . . . . . . . . . . . . . . . . . . . . . . . . . . . . . . . . . . . . . . . . . . . . . . . . . 16
Table 6 - Current & Projected 2015 ADT for the St. George Portion of the UZA Parsons Brinckerhoff
Study Traffic Volumes . . . . . . . . . . . . . . . . . . . . . . . . . . . . . . . . . . . . . . . . . . . . . . . . . . . . . . . . . . . 18
Table 7 - Current & Projected 2025 ADT for the Washington City Portion of the UZA Sear Brown Study
Traffic Volumes . . . . . . . . . . . . . . . . . . . . . . . . . . . . . . . . . . . . . . . . . . . . . . . . . . . . . . . . . . . . . . . . . 19
Table 8 - Identified Highway Needs . . . . . . . . . . . . . . . . . . . . . . . . . . . . . . . . . . . . . . . . . . . . . . . . . . . . . . . . 22
Table 9 - Identified Transit Projects/Needs . . . . . . . . . . . . . . . . . . . . . . . . . . . . . . . . . . . . . . . . . . . . . . . . . . 24
Table 10 - Identified Bicycle/Pedestrian Projects/Needs . . . . . . . . . . . . . . . . . . . . . . . . . . . . . . . . . . . . . . . 24
Table 11 - Estimated Federal Highway Funds Available to SGUZA . . . . . . . . . . . . . . . . . . . . . . . . . . . . . . 36
Table 12 - Projected Revenues for Highway Improvements in the St. George UZA FROM 2003 to 2020
(Rounded) . . . . . . . . . . . . . . . . . . . . . . . . . . . . . . . . . . . . . . . . . . . . . . . . . . . . . . . . . . . . . . . . . . . . . 37
Table 13 - Projected Revenues for Public Transit in the St. George UZA, FROM 2003 TO 2020 . . . . . . .40
Table 14 - Summary of Cost by Category for Highway Needs . . . . . . . . . . . . . . . . . . . . . . . . . . . . . . . . . . . 42
APPENDIXES . . . . . . . . . . . . . . . . . . . . . . . . . . . . . . . . . . . . . . . . . . . . . . . . . . . . . . . . . . . . . . . . . . . . . . . . . . . . . . . . . 44
A GLOSSARY . . . . . . . . . . . . . . . . . . . . . . . . . . . . . . . . . . . . . . . . . . . . . . . . . . . . . . . . . . . . . . . . . . . . 44
B URBANIZED AREA AND MPO PLANNING BOUNDARY MAP . . . . . . . . . . . . . . . . . . . . . . . . . . 45
C LAND USE ZONING MAP AND LAND USE DENSITY MAPS . . . . . . . . . . . . . . . . . . . . . . . . . . 46,47
D DIXIE ROADWAY FUNCTIONAL CLASSIFICATION MAPS . . . . . . . . . . . . . . . . . . . . . . . . . . . 48,49
E PUBLIC TRANSPORTATION MAP/SUN TRAN BUS ROUTES . . . . . . . . . . . . . . . . . . . . . . . . . . . . 50
F WASHINGTON COUNTY REGIONAL TRAILS MASTER PLAN MAP . . . . . . . . . . . . . . . . . . . . . . . 51

DIXIE URBANIZING AREA INTERIM LONG-RANGE
(2000-2020) TRANSPORTATION PLAN
1
I. INTRODUCTION
Background
In June of 2000, it was anticipated by planning professionals at the Five County
Association of Governments and the Utah Governor’s Office of Planning and
Budget, that the general geographic area encompassing the Utah cities of St.
George, Washington, Ivins and Santa Clara would exceed a population of 50,000
persons when the 2000 U.S. Census count was released. The Five County
Association of Governments, in cooperation with the aforementioned cities, as well
as Washington County and the Utah Department of Transportation, embarked on
a three year transportation agreement and work program to develop a long-range
planning process, prepare for urbanized designation, and establish a metropolitan
planning organization (MPO) in this area known historically as “Utah’s Dixie”. A long-
range planning process was commenced in December of 2001, with the hosting of
an public open house to promote the long-term involvement of the general public,
stake holders and other interested groups in the development of plans for
transportation systems for the Dixie urbanizing area.
On May 1, 2002, the Bureau of the Census, published in the Federal Register,
seventy-six new urbanized areas in the United States, including the St. George,
Utah Urbanized Area (UZA) with a boundary population of 62,630, short of the total
Census 2000 population estimate for the four cities noted above, of 66,929. The
Census defined boundary maps for the new urbanized areas were released in June
of 2002. The Governor of Utah designated an MPO for the urbanized area on
September 20, 2002. The Governor’s action was concurred with by the U.S.
Department of Transportation on October 9, 2002. Official organization of the Dixie
MPO was established on November 19, 2002 by the Dixie Transportation Executive
Council (DTEC), the policy body for the new MPO.
The Governor’s designation included the recognition of two other entities besides
the policy body mentioned above as the DTEC: a technical advisory committee
known as the Dixie Transportation Advisory Committee (DTAC) to develop plans
and project recommendations to the policy body, and the Dixie Transportation
Planning Office (DTPO). The office of the Dixie Metropolitan Planning Organization
is administered by the Five County Association of Governments (FCAOG), a multi-
county planning district, with an office located in St. George, Utah. The DTPO
provides MPO management and staff who conduct the day to day operations of the
MPO including providing staff support to the DTEC and DTAC. The FCAOG
executes, manages and administers all contracts and agreements between various
agencies and consultant services needs for the MPO in the conduct of the urban
transportation planning process for the urbanized area and planning boundary.

DIXIE URBANIZING AREA INTERIM LONG-RANGE
(2000-2020) TRANSPORTATION PLAN
2
The U.S. Census boundary includes the majority of the four municipal boundaries
but excludes specific portions of each community such as the Kayenta housing
development located in Ivins City, the northernmost part of Santa Clara City, the
Sun River active adult housing development in the southwestern corner of St.
George City, and much of the Washington Fields area in the southern portion of
Washington City. These areas, along with some others not mentioned, did not meet
the U.S. Census Bureau’s contiguous density requirements but have been included
in the Dixie MPO planning boundary. The Dixie MPO planning boundary is a twenty
year planning horizon and includes those areas expected to be urbanized within
twenty years, comprised of the both the Census defined UZA and areas outside.
The MPO planning area totals 223 square miles. The planning boundary is based
on section boundaries and generally follows the west border of Ivins south to the
Arizona-Utah border, east to the Section boundary that coincides with the
Washington City’s municipal east boundary line, north along that section line to the
northeast corner of Section 20 and west along that line to the northwest corner of
section 24 just above Ivins City’s municipal northwest corner boundary.
Purpose
The MPO, in cooperation with the State of Utah and local operators of publicly-
owned transit services, is responsible for carrying out the metropolitan
transportation planning process.
To be eligible to receive federal assistance for surface transportation projects within
an urbanized area, an MPO must have an adopted transportation plan for the area
as required by federal regulations 23 CFR Part 450 and 49 CFR Part 613,
corresponding administered programs of the Federal Highway (FHWA) and Federal
Transit (FTA) Administrations. New urbanized areas and their MPO’s have until the
Spring of 2005 to adopt a long range plan.
The intent of this draft interim long range plan is to: 1) prepare an early document
that supports the transportation improvement program (TIP) which obligates federal
funding for local projects of immediate need, and 2) presents basic baseline
information used in developing the long-range plan in 2005.
Planning Process
The transportation planning process is a requirement of federal regulations for
metropolitan planning (23CFR Part 450). The plan must be developed through a
proactive public involvement effort and recognition of local community issues
(23CFR Part 450.322). Seven specific planning factors must be considered in the
development of a long range plan; they have been considered and incorporated in
this interim effort, as appropriate. The Planning regulation states that each
metropolitan planning process shall provide for consideration of projects and
strategies that will:

DIXIE URBANIZING AREA INTERIM LONG-RANGE
(2000-2020) TRANSPORTATION PLAN
3
1) Support the economic vitality of the metropolitan planning area, especially by
enabling global competitiveness, productivity, and efficiency;
2) Increase the safety and security of the transportation system for motorized and
non-motorized users;
3) Increase the accessibility and mobility options available to people and for freight;
4) Protect and enhance the environment, promote energy conservation, and
improve quality of life;
5) Enhance the integration and connectivity of the transportation system, across
and between modes, for people and freight;
6) Promote efficient system management and operation; and
7) Emphasize the efficient preservation of the existing transportation system.
In the fall of 2001, the Dixie Transportation Advisory Committee determined the
most significant corridors for improvement within the expected urbanized area,
along with detailed cost estimates of the improvements.
Thirty projects were identified which were later pared down to twelve. From these,
a list of six were placed in the first transportation improvement program. These
same projects have been carried forward into the 2004-8 TIP. The original thirty
projects, or corridors of need, represent an unconstrained listing of projects along
transportation corridors capable of meeting trip demands over the next twenty years.
Planning documents from by each of the member cities and one developed by
Washington County were the foundation for these technical decisions.
Besides individual road network plans from the cities involved, the firm of Fehr &
Peers, Inc., completed a transit feasibility study in 1999 that supported the proposed
transit plans for the area. In the spring of 2002, the firm of Leigh/Scott/Cleary, Inc.,
prepared a transit service analysis for the City of St. George and completed a short-
range transit development plan in December 2003 to comply with federal regulations
to allow for the flow of federal funds to the urbanized area for transit projects. That
short range plan is made part of this document by reference and may be viewed at
the MPO office.
A companion financial plan must be made part of the overall transportation plan for
a region to ensure that the recommended improvements included in the plan can
be implemented within projected revenues.

DIXIE URBANIZING AREA INTERIM LONG-RANGE
(2000-2020) TRANSPORTATION PLAN
4
This interim plan documents a basic financial plan for the St. George Urbanized
Area. Potential revenue sources are summarized. Estimates of future revenue from
these sources are also made. The costs to meet the projected needs of all elements
of the plan over the next 20 years are estimated. These costs include those required
to meet the needs identified in the plan as well as for general administration and the
operation and maintenance of the existing transportation system.
The pre-Dixie MPO team approved a policy for public involvement. The public
involvement document, as well as all other processes established prior to MPO
designation, will be re-visited and updated over time. Twenty-five people attended
the Dec. 5, 2001 ‘kick off’ of the Long Range Transportation Plan open house. The
open house presented the 30 corridors of improvement and was a forum for public
comment. Written comments were also received. Legal notices announcing the
schedule of monthly meetings of the technical advisory committee and executive
council are published in the local papers twice annually.
Planning Data
Census and other data utilized and presented in this interim long-range plan will
cover the Urbanized Area as defined by the U.S. Census Bureau and the MPO
planning boundary, as adopted by the executive council. The Five County
Association of Governments’ service area includes numerous jurisdictions outside
of the MPO planning boundary. Additionally, Washington County is providing inkind
support including mapping, GIS, and other data gathering for the MPO. For these
reasons, it was decided that the cities of Hurricane, LaVerkin, Leeds, and
Toquerville should be included. These rural and urban cluster areas are likely to
become part of the urbanized area in future census determinations.
II. MISSION, GOALS, AND OBJECTIVES
Mission
A Memorandum of Understanding, (hereinafter “MOU”) entered into on June 1,
2001, by and between the cities of Ivins, St. George, Santa Clara and Washington
City, W ashington County and the Five County Association of Governments
(hereinafter ‘FCAOG’), and the Utah Department of Transportation (hereinafter
‘UDOT’), included a ‘partnership charter’ whereby the stakeholders agreed to work
together for the common good and to act and represent the agencies in the MPO
development process, and beyond, by adherence to a quality initiative.
The MPO mission agreed upon when the MOU was signed and later formally
adopted by the DTEC is as follows:
“Providing Unified Transportation Planning For Utah’s Dixie”
DIXIE URBANIZING AREA INTERIM LONG-RANGE
(2000-2020) TRANSPORTATION PLAN
5
Vision
The Vision agreed upon by the members states:
“A Safe, Pleasant, and Efficient Transportation System in Utah’s Dixie,
Through Proactive Leadership and Excellence in Transportation Planning”
Operating Values
The following eleven operating principles were established and are active behaviors
of all partners and their representatives in the planning process, for today, tomorrow
and in the future:
1. Seek equity and trust in stake holder decision making, and partnership building
2. Focus on issues
3. Operate using shared team leadership, resources, and knowledge to improve
customer service
4. Represent the ideals of the Dixie Transportation Executive Council and
communities
5. Listen and respect the views of others
6. Strive for mutually beneficial goals/objectives through common permanent
solutions
7. Be proactive
8. Make the right decisions for the right reasons
9. Reach out for public support and buy-in
10. Base all decisions on facts, verified data and observable behavior
11. Communicate for cooperation, consensus, coordination, and commitment
Goals and Objectives
The Dixie Transportation Executive Council participated in a visioning process
facilitated by a third party in the fall of 2002 and identified a twenty year vision that
may be useful in the near future to establish performance measures for the existing
and future transportation system in Utah’s Dixie. The key vision elements are listed
below:Responsibility - Fiscal, Safety, Public Involvement & Education
Mobility - Provide mode choices in transportation planning and systems
Consistency - Plans, standards, system function, partnering, relationships
Convenience - Regional planning scope & accessibility of systems
Beauty - Access to amenities, preservation of vistas/sites, appropriate landscaping
Continuity - System Connectivity, teamwork, planning for the future
Expansion - Hurricane/LaVerkin Cluster
Quality of Life - ties into all elements listed above
Congestion mitigation
Air Quality protection
Meeting Community Health Standards
Maintaining ‘open feeling’ and community identity

DIXIE URBANIZING AREA INTERIM LONG-RANGE
(2000-2020) TRANSPORTATION PLAN
6
Enhancing law enforcement and emergency access
Evaluation - Establish performance measures for all vision elements, obtain customer
feedback and make improvements
Goals and objectives will be identified and flow from these vision elements as the
DTAC and DTEC work through the planning process including obtaining feedback
from the public involvement process.
III. DESCRIPTION OF THE PLANNING AREA
Urbanizing Area Boundary
On May 1, 2002, the United States Census Bureau announced in the Federal
Register, 76 new urbanized areas(UZAs) based on the results of the 2000 Census
and rules. The St. George UZA , was identified as one of them. The Dixie MPO will
have the opportunity to adjust the Census UZA boundary but will not be allowed to
increase the population figure provided by the Census Bureau. The boundary maps
for urbanized areas based on the 2000 Census were released June 20, 2002. The
boundary for the SGUZA included the major portions of the four participating cities
based on 1000 persons per square mile, contiguous. A 20 year MPO planning
boundary approved by the DTEC, and necessary for Governor designation, was
adopted on Nov. 19, 2002. The UZA boundary encompasses an area of about
33.52 square miles, while the MPO planning boundary is approximately 223 square
miles. A map showing both boundaries is provided in Appendix B.
Urbanizing Area Population
Federal funding for the newest of Utah’s MPO’s must be based on the Census figure
of 62,630, announced in the May 1, 2002 Federal Register. This figure is shy of the
66,966 census total for the four cities. The MPO determined 20 year planning
boundary includes the municipal boundaries of the four cities impacted by the UZA.
The 2000 Census total for the four member cities including areas outside the
municipal boundaries but still in western Washington County, is estimated to be
approximately 67,000 persons. The projected population for the year 2020 for the
MPO planning boundary is 125,800 based on a growth rate of 3.2% used by the
Governors’ Office of Planning and Budget. This conservative rate may be balanced
by a more generous growth rate of 6% as predicted and experienced by the various
cities in terms of annual utility connections, resulting in an estimate of 214,900
persons living in the current planning boundary, by year 2020. Estimates for the St.
George Urbanized boundary and what may be urbanized by 2020 using 3.2% and
6% growth rates could be between, 117,600 and 200, 900 people, respectively.

DIXIE URBANIZING AREA INTERIM LONG-RANGE
(2000-2020) TRANSPORTATION PLAN
7
Urbanizing Area Demographics
The Dixie 2005 Long Range Transportation Plan will utilize Census block data in the
projection of area demographics out thirty years. For the purposes of this interim
plan, however, projected 20 year demographics for the area is based on 1990 and
1996 Census information with the growth in population presented by the Census
2000 total population for the communities and Washington County. This growth rate
history is used to estimate the demographics for the year 2020. Tables 1 and 2
present data sets that were created based on this process. They include the
populations that are elderly (65+ years old), persons with limited mobility, minority
population, and low income persons, for year 2000 and projected for year 2020. A
final data set is households having no vehicle available for personal transportation,
shown for the same years. A brief discussion of each of these population elements
and their relationship to transportation systems planning follows the tables.
Table 1 - Dixie Urbanizing Area 20 Year Planning Boundary Estimated
2000 Demographics
Place Total
Population
Population
Age 65+
Population
Mobility Limited
Minority
Population
Population
Below Poverty
Line
Households
with No
Vehicle
Ivins 4,450 468 40 365 757 9
St. George 49,663 8,939 844 2,136 6,456 745
Santa Clara 4,630 486 56 74 231 19
Washington 8,186 1,228 147 458 778 25
MPO Total 66,929 11,121 1,087 3,033 8,222 798
Hurricane 8,250 1,403 116 388 1,320 83
Toquerville 910 191 18 3 182 12
La Verkin 3,392 546 34 132 577 34
Leeds 547 126 5 5 93 9
Rural Total 13,099 2,266 173 568 2,172 138
GrandTotal 80,028 13,387 1,260 3,601 10,394 936
Sources: US Bureau of the Census Data, 1990, 1996 pop., and 2000; Utah Governor’s Office of Planning & Budget;
W ashington County Planning Office Dixie Area Transit Feasibility Study, Fehr & Peers Associates, Inc. 1999
DIXIE URBANIZING AREA INTERIM LONG-RANGE
(2000-2020) TRANSPORTATION PLAN
8
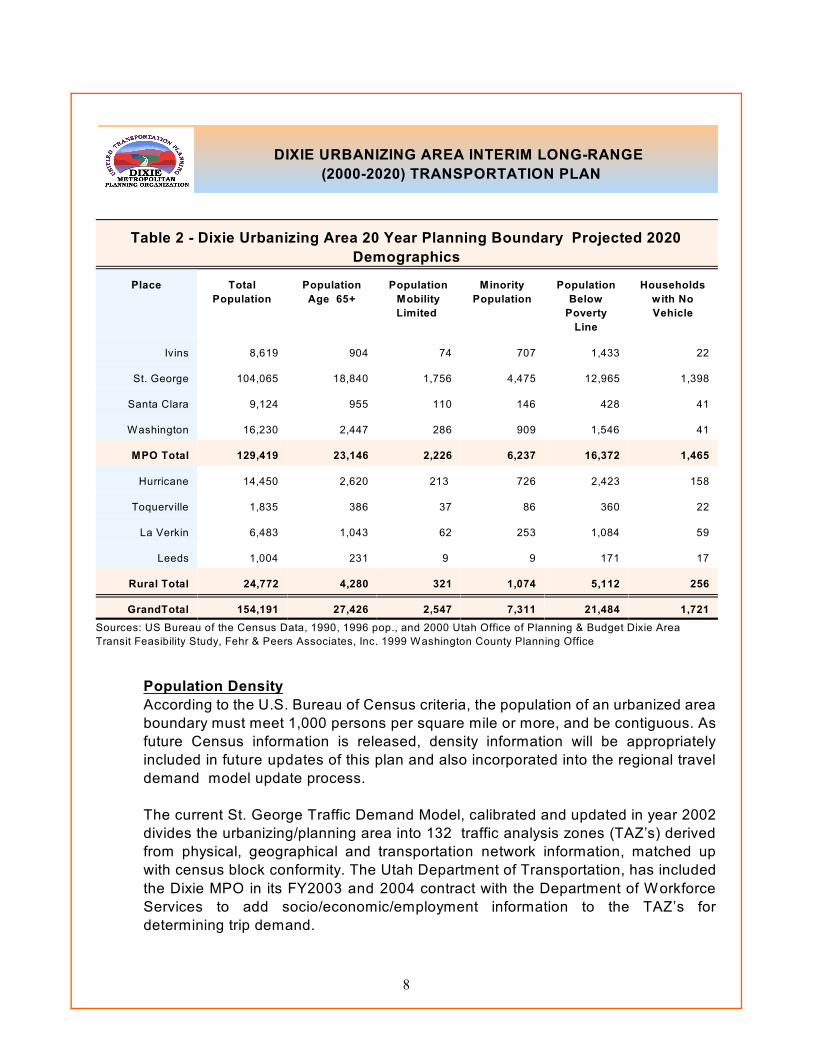
Table 2 - Dixie Urbanizing Area 20 Year Planning Boundary Projected 2020
Demographics
Place Total
Population
Population
Age 65+
Population
Mobility
Limited
Minority
Population
Population
Below
Poverty
Line
Households
with No
Vehicle
Ivins 8,619 904 74 707 1,433 22
St. George 104,065 18,840 1,756 4,475 12,965 1,398
Santa Clara 9,124 955 110 146 428 41
Washington 16,230 2,447 286 909 1,546 41
MPO Total 129,419 23,146 2,226 6,237 16,372 1,465
Hurricane 14,450 2,620 213 726 2,423 158
Toquerville 1,835 386 37 86 360 22
La Verkin 6,483 1,043 62 253 1,084 59
Leeds 1,004 231 9 9 171 17
Rural Total 24,772 4,280 321 1,074 5,112 256
GrandTotal 154,191 27,426 2,547 7,311 21,484 1,721
Sources: US Bureau of the Census Data, 1990, 1996 pop., and 2000 Utah Office of Planning & Budget Dixie Area
Transit Feasibility Study, Fehr & Peers Associates, Inc. 1999 Washington County Planning Office
Population Density
According to the U.S. Bureau of Census criteria, the population of an urbanized area
boundary must meet 1,000 persons per square mile or more, and be contiguous. As
future Census information is released, density information will be appropriately
included in future updates of this plan and also incorporated into the regional travel
demand model update process.
The current St. George Traffic Demand Model, calibrated and updated in year 2002
divides the urbanizing/planning area into 132 traffic analysis zones (TAZ’s) derived
from physical, geographical and transportation network information, matched up
with census block conformity. The Utah Department of Transportation, has included
the Dixie MPO in its FY2003 and 2004 contract with the Department of Workforce
Services to add socio/economic/employment information to the TAZ’s for
determining trip demand.

DIXIE URBANIZING AREA INTERIM LONG-RANGE
(2000-2020) TRANSPORTATION PLAN
9
The update documentation prepared by PEC, Ltd., for the City of St. George is
incorporated into this interim plan by reference and is available at the City of St.
George and the DTPO/FCAOG office. PEC, Ltd., is currently developing traffic
demand projections for the years 2015 and 2030. That information will be
incorporated into the 2005 Dixie LRTP publication.
Mobility Limited
Mobility is defined as the ease of changing one’s location, a function of available
transportation and the individual traveler. The Bureau of the Census defines
mobility-limited status as a person who has a health condition lasting six months or
more. In addition, the said health condition has made it difficult for that individual to
go outside of the home alone. The Census Bureau refers to a health condition as
both a physical and mental problem. Mobility impairments can significantly restrict
the number of trips a person may take to basic needs such as grocery stores and
medical facilities. For the purposes of this planning process, individuals who are
mobility-limited are considered those for whom it is difficult if not impossible to use
traditional transportation facilities without assistance or with modifications of those
facilities.
The number of people who are mobility limited within the Dixie MPO boundary was
1,260, based on estimates from the 1990/96 Census, projected to be 2,547 by year
2020. In 2000, 67% of those considered mobility limited resided within the City of St.
George. In 2020, it is estimated that 69% will reside in the centrum city. Hurricane
and Washington on their own, were host to over 100 persons mobility limited by the
year 2000; a significant number, when one considers that both these smaller
communities were approaching or exceeding the total for the City of Logan, in
Cache County, at 102. The operation of transit and other paratransit systems is
important to meet the transportation needs of citizens with disabilities.
Environmental Justice (Low Income Populations)
For purposes of this interim plan, persons below the poverty line will be the focus
of estimating special transportation needs rather than looking at all economic levels.
Also, persons of minority status will be reflected since nearly half of all minorities fall
below the poverty line in most areas of the state.
Based on similar methodology, the total number of people below the Census defined
poverty line in the Dixie MPO area for year 2000 was 10,394, projected to nearly
double by year 2020, to 20,410. All cities harbor folks in this category, but for

DIXIE URBANIZING AREA INTERIM LONG-RANGE
(2000-2020) TRANSPORTATION PLAN
10
obvious reasons, St. George carries the majority with 6,456, or 62%, and will likely
have 64%, or nearly 13,000 residents living below poverty line by year 2020.
Ivins and LaVerkin, two of the smaller entities in the Dixie urbanizing area, are
shouldering a disproportionate number of persons living below the poverty line. The
data supports the need for public and/or para transit services to meet the needs of
those unable to make trips or to gain access to primary services.
Zero Vehicle Households
Households where no vehicle exists for transportation rely completely on transit or
special services. In homes where there is only one vehicle and one or both spouse
works, access to jobs for either parent can be difficult on a consistent basis. This
situation affects people’s ability to hold jobs and have access to jobs or needed
services for themselves and other family members.
Nine hundred and thirty-six households with no vehicle were estimated to exist in
the Dixie urbanizing area in the year 2000, based on the method described above.
This number is projected to nearly double for each community by year 2020. The
majority of those households (80%) are within the City of St. George.
Land Use Patterns
Projections for population and employment data may assist in development of
generalized land use maps for Washington County by providing a reasonable
estimate of the primary activities taking place within the traffic analysis zones. One
method of looking at the population or employment density of each zone is a
comparison of employment and population density which allows for creating a
generalized land use for each TAZ. This approach may be more feasible in the
future as the model itself is improved and staff and resources become available to
calculate those outputs. For purposes of this interim plan land use and density
maps have been developed showing what exists for 2004, as a base line, from
documentation from the county and the four cities. The assumption is made that
zones having more population compared to employment are more likely to be
residential areas, while those with more employment than population will tend to be
more commercial/industrial areas.
Land Use Plans (2003)
The Washington County GIS Office contacted each of the cities in the MPO planning
boundary to obtain current landuse plans and also obtained density data from the

DIXIE URBANIZING AREA INTERIM LONG-RANGE
(2000-2020) TRANSPORTATION PLAN
11
2000 Census tracts. Based upon that information, regional maps showing current
land use and density, included in Appendix C, were prepared. Projected density and
landuse out to years 2015 and 2030 will be documented in the DLRP published in
the year 2005.
The regional landuse zoning map clearly indicates areas where growth will most
likely occur in the near future in terms of residential and employment/commercial
location. This information will be important in determining future traffic demand and
trip origin and production.
The density map indicates the number of persons per acre and should guide local
municipal transportation decisions in protecting corridors, and locating and
determining capacity of future improvements to the highway and transit network.
Employment Patterns
According to the Utah Department of Workforce Services there were approximately
3,381 employment establishments operating in Washington County in 2002. It
should be realized that companies come and go. Table 3 shows the major (100 or
more employees) places of employment in Washington County in year 2002,
presented as an ‘employment range’. As is the case with many businesses, there
are seasonal peaks in employment, such as the Christmas holiday season at retail
establishments. The largest employer in the urbanizing area is the Washington
County School District; Their employees, however, and their work destinations, are
spread throughout the Urbanizing area. The total employment at the two Wal-Mart
Super Centers and Distribution Center is next. The third largest employer in the
county is Intermountain Health Care. The hospital company opened the new 250
bed Dixie Regional Medical Regional Medical Center in mid-November 2003, with
an estimated 350 additional new jobs expected to be filled by the end of 2004.
Table 3 - Washington County Largest Employers (Annual Averages 2002)
Company Employment Range
Washington County School District 2,000-2,999
Wal-Mart Discount Department Stores 1,000-1,999
Intermountain Health Care/Dixie Regional Medical Center 1,000-1,999
Dixie State College 500- 999

DIXIE URBANIZING AREA INTERIM LONG-RANGE
(2000-2020) TRANSPORTATION PLAN
Table 3 - Washington County Largest Employers (Annual Averages 2002)
12
St. George City Municipal Corporation 500- 999
Federal Government 250- 499
SkyWest Airlines 250- 499
Washington County Government 250- 499
Cross Creek Manor Residential and Nursing Care 250- 499
Smith’s Food King Grocery Store 100- 249
Zions Bank 100- 249
Wells Fargo Bank 100- 249
Anderson Lumber Home Improvement Center 100- 249
Sears Roebuck Department Store 100- 249
Xanterra Parks and Resorts Accommodations/Resort 100- 249
Harmons Grocery Store 100- 249
Hurst Stores Sporting Goods 100- 249
Lin’s Supermarket Grocery Stores 100- 249
Interstate Rock Products Heavy Construction 100- 249
Albertsons Grocery Stores 100- 249
St. George Care & Rehabilitation Residential & Nursing Care 100- 249
Kmart Discount Department Store 100- 249
McDonald’s Restaurants 100- 249
Boulevard Home Furnishings Store 100- 249
Stephen Wade Auto Center Automobile Dealerships 100- 249
Green Valley Resort Accommodations/Resort 100- 249
Cabinetec Cabinet Manufacturing 100- 249
Costco Warehouse Club 100- 249
Andrus Trucking 100- 249
St. George Mitsubishi Automobile Dealership 100- 249

DIXIE URBANIZING AREA INTERIM LONG-RANGE
(2000-2020) TRANSPORTATION PLAN
Table 3 - Washington County Largest Employers (Annual Averages 2002)
13
Deseret Laboratories Pharmaceutical Manufacturing 100- 249
Red Cliffs Regional Residential & Nursing Care 100- 249
Cinnamon Hills Youth Crisis Center Residential Care 100- 249
Pace American Truck Trailer Manufacturing 100- 249
Lowe’s Home Improvement Center 100- 249
Target General Merchandise Store 100- 249
Sunroc Corp Concrete Products 100- 249
PGM Inc. Market Research 100- 249
Red Mountain Spa Accommodations/Resort 100- 249
Western Wats Interviewing Telephone Call Center 100- 249
Red Rock Canyon School Youth Residential Care 100- 249
The Spectrum Newspaper Publishing 100- 249
Marketing Solutions International Electronic Shopping 100- 249
State of Utah Government 100- 249
Hurricane City Municipal Corporation 100- 249
Source: Utah Dept. of Workforce Services, Workforce Information
Updated September 2003
Please note that several additional “big box” stores have been opened since the last
Work Force Service update and are not shown in this D.W.F.S. list.
Projected year 2020 employment by major employment sectors, such as Mining,
Construction, Manufacturing, Transportation, Communication, Public Utilities, Trade,
Finance, Insurance, Real Estate, Service, and Government will be presented in the
Dixie LRTP published in 2005. Major activity centers in the Dixie Urbanizing area
such as commercial businesses, but including schools, recreation facilities, parks,
golf courses, religious buildings, not necessarily commercially based destinations,
will be identified.
DIXIE URBANIZING AREA INTERIM LONG-RANGE
(2000-2020) TRANSPORTATION PLAN
14
Summary
The population characteristics of the St. George Urbanized Area clearly defines a
centralized population core; however, the population continues to expand in all other
communities, due to many factors, including the individual uniqueness of each
community, and ‘snowbird’ desirability/location. “Snowbirds” is a local reference to
seasonal inhabitants, who utilize the Dixie area as a second home, primarily in the
winter months. These residents are typically from northern cities and states as well
as from the Canadian Provinces.
High density residential development neighborhoods are located within St. George
City, and will continue to expand over the next 20 years, especially as the population
and infrastructure ages together. Medium density areas are seen and will continue
to expand in the other three communities in the UZA, and nearby Hurricane. The
other communities in the planning boundary will continue to exhibit lighter densities
as they move towards build out.
The generalized land use for the Dixie Urbanizing area shows continuing trends
important for development of an expanded transportation system:
! Increased densities of commercial development along several corridors will
increase demand for an expanded and enhanced transportation network.
! The mobility-limited population is primarily located in the City of St. George
and will increase demand for transit services.
! T h e overall age of the population shows that over the next 20 years those
over 65 will continue to grow in significant numbers adding to the mobility-
limited need for transportation services.
! Households with zero to one vehicle are also primarily located in St. George
and will require access to jobs and services.
! The increasing population and vehicle miles of travel will continue to place
demands on the existing transportation system. Without increasing or
expanding the system, existing congestion and potential air quality impacts will
only worsen.

DIXIE URBANIZING AREA INTERIM LONG-RANGE
(2000-2020) TRANSPORTATION PLAN
15
IV. TRANSPORTATION SYSTEMS
Functional Classification
Roadway System
The functional classification of the existing roadway network within an urbanized
area is shown in Table 4 below and describes the functional classification
system in regard to how traffic moves along different roadways. The Major
Roadway Map included in the Roadway Functional Classification maps shown in
Appendix D also depict the long-range transportation needs of the Dixie
Urbanizing area. There are four functional classifications which define the road
network in an urbanized area.
Table 4 - Right-of-Way Functional Classification
Classification Definition
Principal Arterial Move traffic to destinations within, and in and out of Washington
County. During peak hours these roads handle most of the traffic
demand. They should have limited access to adjacent land use.
Minor Arterial Allow more access to adjacent land than a Principal; generally located
on a 80-106 foot right-of-way and may connect to principal arterials
through intersections or gradual transitions.
Collector Serve mainly internal neighborhood traffic movements or connect an
area with the arterial street system. They handle through traffic for
short distances; provide link to Minor arterials and are characterized by
two lanes of traffic with ample median/turning lane or by four lanes with
no parking allowed during peak hours. Right-of-way needs satisfied by
66-80 foot widths.
Local Provide good accessibility to land. Traffic volumes should be very low
and movement is slow. On-street parking combined with short lengths
and reduced pavement width yields essentially a one-lane street with a
right-of-way of 60 feet or less.
The jurisdictional responsibility for roads within the urbanizing area is divided among
the municipalities, the county, and the Utah Department of Transportation. Table 5
shows the roadway classification and jurisdiction.

DIXIE URBANIZING AREA INTERIM LONG-RANGE
(2000-2020) TRANSPORTATION PLAN
16
Table 5 - Road Ownership
Type Ownership
Class A Public roads under ownership and control of UDOT. Constructed and maintained
by UDOT from funds made available for that purpose.
Class B Public roads located in unincorporated areas under ownership and control of
Washington County. Constructed and maintained by the County Road Department.
Class C Public roads located in the incorporated municipalities of the County and owned ,
constructed, and maintained by the different communities.
Public Transportation
The Five County Association of Governments sponsored and operated the Dixie
Area Rapid Transit System (DARTS), within the city limits of St. George, for several
years until December 30, 2002. W hen it began as a rural funded project DARTS
was intended to be a transition service to be taken over by a willing and able public
entity with taxing authority, thereby enabling the Dixie area to receive federal
urbanized funds for transit operations and capital expansion upon metropolitan and
urbanized status designation.
On September 5 , 2002, the St. George City Council voted in support of taking overth
the public transit responsibility, and became the Federal Transit Administration
recipient for annual formula funding eligible to the St. George Urbanized Area.
Utah’s Governor designated the city as the recipient and federal concurrence was
made in November 2002.
The current system operates a fixed route system over three routes, with hourly
head-way and a separate dial-a-ride system for individuals with special needs.
Back-up vehicles are available to feed into the systems to maintain scheduled
service. The most current SunTran bus route map and schedule are included in
Appendix E.
A feasibility study produced under cooperation of UDOT, Five County Association
of Governments and St. George City by Fehr & Peer in 1999, is included here by
reference. A draft Short Range Transit Service Analysis produced by the City of St.
George, by LSC, Inc., is attached by reference. These documents are available for
review at the Dixie MPO Office or the City of St.George. A short range transit plan

DIXIE URBANIZING AREA INTERIM LONG-RANGE
(2000-2020) TRANSPORTATION PLAN
17
for the MPO was completed in December 2003 to comply with federal regulations
to allow the flow of transit funding to the St. George Urbanized Area for SunTran.
Bicycle /Pedestrian Facilities
A committee entitled the ‘Three Rivers Trails Committee’ has been functioning in the
Dixie area for many years, creating a non-motorized trail system. Members have
been appointed to this committee by various partners including local governments,
developers and citizens at large. This proactive team has developed a long range
plan that focuses on pedestrian and bicycle path needs for the area, linking new
projects with existing trails, and seeking funding for construction of those projects.
They have recently completed a Washington County Regional Trails Cooperative
Master Plan, shown in Appendix F. Individual Parks Departments of the
communities typically make decisions on trails. The DMPO recommends that the
agency public works directors become more involved in trail planning and decision
making and to facilitate needs/improvements for this mode in the MPO decision
making process.
Existing and Projected Traffic Volumes
Two planning studies prepared by consultants will provide the source of engineering
estimations for current and projected traffic demand in the urbanized area; one
completed for St. George in 1995, and one completed in March of 2002, for
Washington City.
The study needs portion of these documents raise issues that have concerned this
region for many years and will continue to focus efforts in the future. Those issues
are outlined below:
! Adequacy of access between neighborhoods, existing roadways, lack of a
completed roadway network and single point access to residential areas.
! The limited number of roadways connecting the central business districts with
outlying areas and communities in the area.
! Interstate 15, major area rivers and geological formations form barriers,
physically limiting crossing locations. The limited crossings focuses trips to these
points, implying congestion, and ultimately detracts from the ability of the system
to function as a network.
! Emergency vehicle access to the land use is also severly limiting and impacts
the desired response time by such services to the incidents.

DIXIE URBANIZING AREA INTERIM LONG-RANGE
(2000-2020) TRANSPORTATION PLAN
18
! Public transit access and route on-time performance is also affected by these
constraints and their traffic implications.
The centrum city of the Dixie metro area is St. George. Since this city is the source
of the majority of trip origination and destination in the urbanized area , current and
projected traffic volumes for this plan will focus on data and information from the
Parsons Brinckerhoff “City of St. George Traffic and Transportation Master Study”,
completed in 1995. The Parsons Brinckerhoff study projected traffic volumes for
2005 and 2015. It is Important to point out that “Ground Counts” conducted by the
City of St. George during twelve months ending June 2002, substantiate the
accuracy of the study predictions for 2005 for most of the road segments. This plan
will use the 2005 estimates for the average daily traffic (ADT ) as ‘Current’ ADT for
the St. George portion of the urbanized area.
Sear Brown, Inc., recently completed the “Washington City Transportation Master
Plan, March 2002, and in doing so utilized the regional traffic demand model with
some updating, that was used by Parsons Brinckeroff in 1995. The external stations
used for the Washington City study for current ADT ( year 2000) match up
consistently with ADT figures (year 2005) for the network that is contiguous to St.
George. So, for purposes of this interim plan, the results of these two engineering
studies are considered to provide more than adequate forecasts for this interim plan.
The St. George Area traffic demand mode, updated, re-calibrated and supporting
new volume documentation and projections will support the 2005 update of the Dixie
Long Range Transportation Plan.
Table 6 presents those roads within the City of St. George’s portion of the UZA
boundary, with at least 30 thousand ADT volumes currently occurring along some
portion of the roadway.
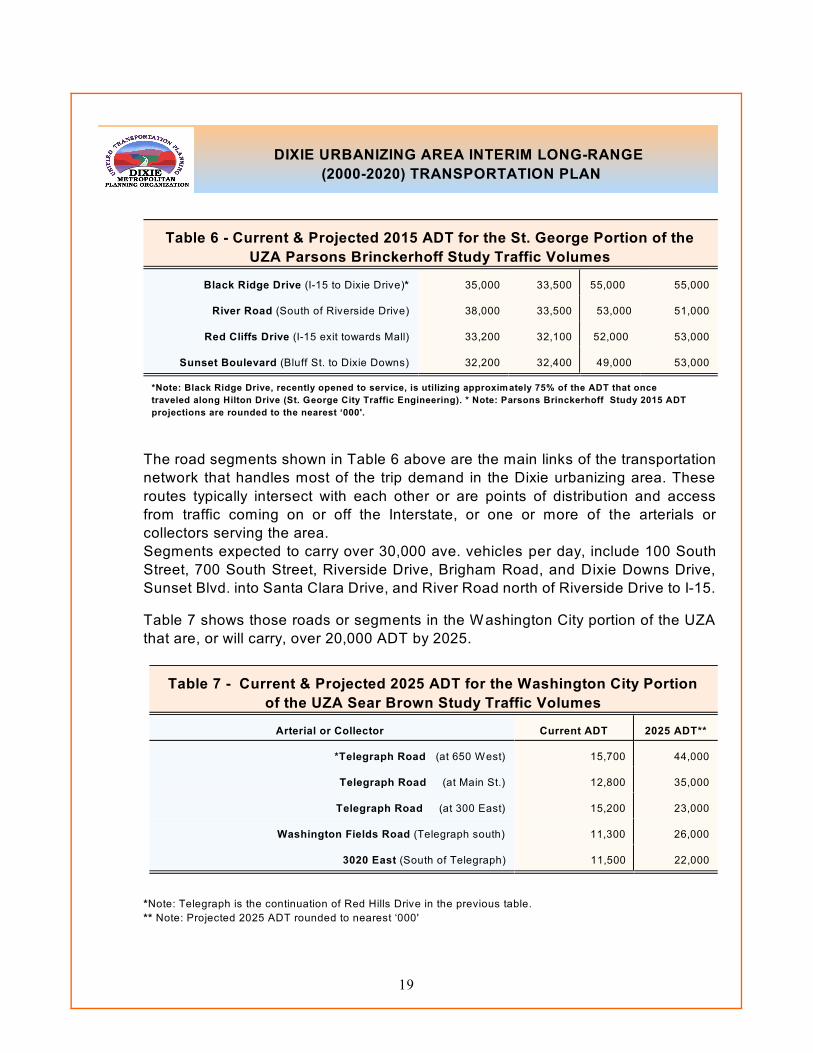
Table 6 - Current & Projected 2015 ADT for the St. George Portion of the
UZA Parsons Brinckerhoff Study Traffic Volumes
Arterial or Collector
Current 2015**
No Plan With Plan No plan With Plan
Bluff Street (St. George Blvd. to Sunset Blvd.) 64,100 64,100 79,000 90,000
St. George Boulevard (I-15 to Bluff St.) 38,900 40,600 55,000 51,000
DIXIE URBANIZING AREA INTERIM LONG-RANGE
(2000-2020) TRANSPORTATION PLAN
Table 6 - Current & Projected 2015 ADT for the St. George Portion of the
UZA Parsons Brinckerhoff Study Traffic Volumes
19
Black Ridge Drive (I-15 to Dixie Drive)* 35,000 33,500 55,000 55,000
River Road (South of Riverside Drive) 38,000 33,500 53,000 51,000
Red Cliffs Drive (I-15 exit towards Mall) 33,200 32,100 52,000 53,000
Sunset Boulevard (Bluff St. to Dixie Downs) 32,200 32,400 49,000 53,000
*Note: Black Ridge Drive, recently opened to service, is utilizing approximately 75% of the ADT that once
traveled along Hilton Drive (St. George City Traffic Engineering). * Note: Parsons Brinckerhoff Study 2015 ADT
projections are rounded to the nearest ‘000'.
The road segments shown in Table 6 above are the main links of the transportation
network that handles most of the trip demand in the Dixie urbanizing area. These
routes typically intersect with each other or are points of distribution and access
from traffic coming on or off the Interstate, or one or more of the arterials or
collectors serving the area.
Segments expected to carry over 30,000 ave. vehicles per day, include 100 South
Street, 700 South Street, Riverside Drive, Brigham Road, and Dixie Downs Drive,
Sunset Blvd. into Santa Clara Drive, and River Road north of Riverside Drive to I-15.
Table 7 shows those roads or segments in the Washington City portion of the UZA
that are, or will carry, over 20,000 ADT by 2025.
Table 7 - Current & Projected 2025 ADT for the Washington City Portion
of the UZA Sear Brown Study Traffic Volumes
Arterial or Collector Current ADT 2025 ADT**
*Telegraph Road (at 650 West) 15,700 44,000
Telegraph Road (at Main St.) 12,800 35,000
Telegraph Road (at 300 East) 15,200 23,000
Washington Fields Road (Telegraph south) 11,300 26,000
3020 East (South of Telegraph) 11,500 22,000
*Note: Telegraph is the continuation of Red Hills Drive in the previous table.
** Note: Projected 2025 ADT rounded to nearest ‘000'

DIXIE URBANIZING AREA INTERIM LONG-RANGE
(2000-2020) TRANSPORTATION PLAN
20
This interim long range transportation plan, specifically the projects described in
section V of this plan, are the means proposed to address some of the major
transportation problems or deficiencies of the existing capacity of the system and
future growth and travel demand effects on the system.
Environmental Constraints
Floodplains, protected species, wetland or other appropriate cataloging, mapping
or documentation will be addressed in the Dixie MPO LRTP in year 2005. Because
air quality issues have been explored recently a brief history of this topic is
presented in this interim plan.
Air Quality
Air Quality is of concern, especially with a growing population, increasing vehicle
miles of travel, and growing congestion playing into potential erosion of heathy air.
Maintaining or exceeding reasonable community heath standards has been a goal
of the communities in this area, especially in light of the visible desire to entice
people and environmentally friendly business to locate here.
From 1995 to 1997, the State Division of Air Quality monitored the ambient air in the
Dixie Area with a station located just south of the existing Washington County
Administration building. The results at that time did not show any problems.
However, new standards have been adopted by the federal government, and as that
old data was reviewed, it shows that for ozone, April through May for two of those
years was approaching the new standard of .08 parts per million. This sends a clear
signal that the Dixie area, if it continues to grow as anticipated, may see
deterioration of the air shed. Wise voluntary measures may be taken to help
postpone or avoid reaching or exceeding those federal/ community pollutant
standards, which bring about increased illness to our population, puts stringent
constraints on the transportation planning process and increases costs to project
development. An Air Quality Protection Strategy has been developed and is
referenced by this plan. That document is available for review at the MPO office.
Summary
The Dixie urbanizing area is a growing region experiencing the detrimental effects
of growth on the transportation system. Current and projected Average Annual Daily
Traffic in the City of St. George Traffic and Transportation Master Study, by Parsons
Brinkerhoff in 1995 determined locations on the road network where the heaviest
traffic is occurring. This regional interim plan begins to provide the mechanism to

DIXIE URBANIZING AREA INTERIM LONG-RANGE
(2000-2020) TRANSPORTATION PLAN
21
address the transportation deficiencies and needs and to plan for the improvements
which will address these needs or problems.
An Environmental Impact Study is nearing a ‘record of decision’ for a segment of
the “Dixie Belt W ay”, called the Southern Corridor, which if constructed, would
provide a limited access for land use development planned for the area south and
east of the cities of St. George and W ashington, and provide other traffic ability to
by-pass the Urbanized area. Additional corridors to the east and north and west of
St. George, are being looked at as well, providing a loop system connecting all four
cities of the St. George Urbanized Area, and taking pressure off Sunset, Bluff and
St. George Blvd. Because St. George Blvd. is planned for reconstruction in the next
year or two, the Northern Corridor has risen in project priority to provide a critical
bypass for east-west trip demand.
The projects in the current Dixie TIP and Statewide Improvement Program support
the Dixie Beltway plan and the need for Highway 91 functional improvements that
will benefit alternative routing of trips when I-15 is blocked during unplanned
incidents in the Virgin Narrows. These projects, when constructed, will not only
improve traffic flow and safety, but will provide trip alternatives away from the
heavily used network described above, help to manage congestion and air quality,
and improve mobility and access, and support objectives of national, state and local
homeland security issues.
V. IDENTIFIED PROJECTS/NEEDS
Introduction
The regional area partners identified projects to be considered in solving regional
problems over the next twenty years. These projects are primarily highway and
transit projects. Other projects, including pedestrian and bicycle facilities, have been
identified and are discussed briefly in this chapter. Other projects, needs or issues
were identified through various meetings with DTAC, DTEC, the trails committee,
and other public meetings, including the Open Houses held in December of 2001
and 2003. Those projects were added to the list of possible projects which form the
unconstrained transportation plan needs and from which short term solutions are
programmed into the TIP and STIP. Most of these unfunded projects are of regional
scope or significance in solving transportation problems and meeting trip demands
within the area.
DIXIE URBANIZING AREA INTERIM LONG-RANGE
(2000-2020) TRANSPORTATION PLAN
22
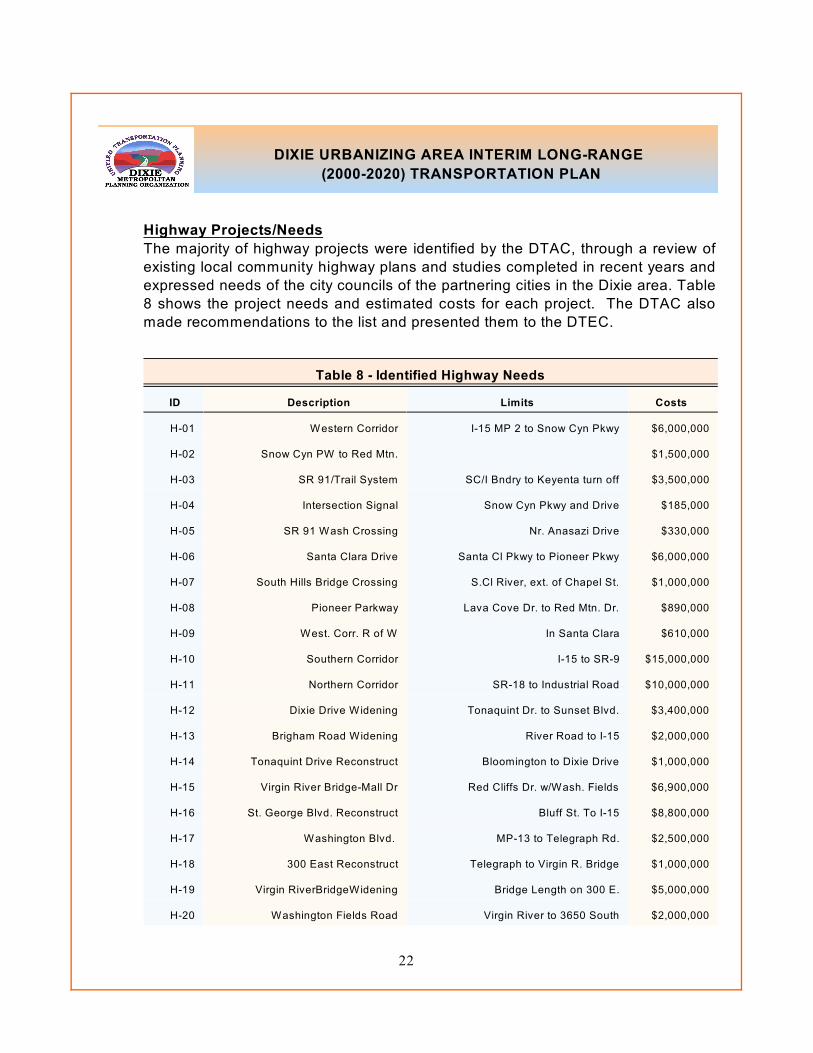
Highway Projects/Needs
The majority of highway projects were identified by the DTAC, through a review of
existing local community highway plans and studies completed in recent years and
expressed needs of the city councils of the partnering cities in the Dixie area. Table
8 shows the project needs and estimated costs for each project. The DTAC also
made recommendations to the list and presented them to the DTEC.
Table 8 - Identified Highway Needs
ID Description Limits Costs
H-01 Western Corridor I-15 MP 2 to Snow Cyn Pkwy $6,000,000
H-02 Snow Cyn PW to Red Mtn. $1,500,000
H-03 SR 91/Trail System SC/I Bndry to Keyenta turn off $3,500,000
H-04 Intersection Signal Snow Cyn Pkwy and Drive $185,000
H-05 SR 91 Wash Crossing Nr. Anasazi Drive $330,000
H-06 Santa Clara Drive Santa Cl Pkwy to Pioneer Pkwy $6,000,000
H-07 South Hills Bridge Crossing S.Cl River, ext. of Chapel St. $1,000,000
H-08 Pioneer Parkway Lava Cove Dr. to Red Mtn. Dr. $890,000
H-09 West. Corr. R of W In Santa Clara $610,000
H-10 Southern Corridor I-15 to SR-9 $15,000,000
H-11 Northern Corridor SR-18 to Industrial Road $10,000,000
H-12 Dixie Drive Widening Tonaquint Dr. to Sunset Blvd. $3,400,000
H-13 Brigham Road Widening River Road to I-15 $2,000,000
H-14 Tonaquint Drive Reconstruct Bloomington to Dixie Drive $1,000,000
H-15 Virgin River Bridge-Mall Dr Red Cliffs Dr. w/Wash. Fields $6,900,000
H-16 St. George Blvd. Reconstruct Bluff St. To I-15 $8,800,000
H-17 Washington Blvd. MP-13 to Telegraph Rd. $2,500,000
H-18 300 East Reconstruct Telegraph to Virgin R. Bridge $1,000,000
H-19 Virgin RiverBridgeWidening Bridge Length on 300 E. $5,000,000
H-20 Washington Fields Road Virgin River to 3650 South $2,000,000

DIXIE URBANIZING AREA INTERIM LONG-RANGE
(2000-2020) TRANSPORTATION PLAN
Table 8 - Identified Highway Needs
23
H-21 Buena Vista Road Main St. to MP- 13 $1,500,000
H-22 Middleton Drive Green Sprs. Dr. to SGC Limits $1,000,000
H-23 Telegraph Road 500 S. to 300 E. $2,000,000
H-24 Bluff St. Widening Diagonal St. to Main St. $10,000,000
H-25 Riverside Drive, Ph. 4 So. end of East Black Ridge $2,900,000
H-26 1450 S. In St. George River Rd. To 3000 E. $3,900,000
H-27 3000 East in St. George 700 S. to 2450 S. $3,900,000
H-28 Snow Canyon Drive Center St. to State Park $240,000
Total Costs Current $ $103,055,000
Transit Projects
The DMPO and St. George City (and its SunTran public transit system) have
identified transit projects to be included in a list of needs. These include operating
funds, a transit maintenance facility, and rolling stock(bus) purchases, and are
displayed in Table 9, entitled “Identified Transit Projects”. The MPO has included
some far reaching projects assuming transit ridership grows, demand increases and
congestion policy requires reducing single occupancy vehicles and air pollution
impacts by year 2020.
A feasibility study completed in 1999, charted a plan for establishing public transit
service in Dixie which began under sponsorship of the Five County Association of
Governments which also was managing a welfare to work program. The current
service operates within the city limits of St.George. Plans for expansion will depend
on future demand. A Transit Services Analysis, completed in the Spring of 2002 by
St. George City, recommended adjustments to the system, including routes,
headways and suggested potential sites for future transit facilities. A transit short
range plan is currently being prepared by the DMPO in compliance with federal
regulation to document 5 year planning needs and to justify current flow of Federal
Transit funds to the urbanized area.

DIXIE URBANIZING AREA INTERIM LONG-RANGE
(2000-2020) TRANSPORTATION PLAN
24
Table 9 - Identified Transit Projects/Needs
ID Description Limits Costs
T-01 Operating Funds 50/50% match $1,500,000
T-02 Maintenance Facility 80/20% match $3,000,000
T-03 Rolling Stock Purchase(Buses) 80/20% match $1,000,000
T-04 Intermodal Center 80/20% match $3,000,000
T-05 Rubber Tired Bus- Way 80/20% match $10,000,000
Total Costs $18,500,000
Pedestrian and Bicycle Projects
Several bicycle and pedestrian projects have been identified by the DTAC and
members of the Washington County Trails Committee. These projects are shown
in Table 10.
Table 10 - Identified Bicycle/Pedestrian Projects/Needs
ID Description Limits Costs
B-01 Virgin River Trail Grapevine to Mill Creek $300,000
B-02 Coral Canyon Trail Virgin River to 3 Rivers $1,000,000
B-03 Millcreek Trail I-15 So. to Virgin R. Trail $300,000
B-04 Warm Springs Trail Warm Sprs. to Mill Creek $80,000
B-05 Grapevine Trail I-15 to VRT at MP 13 $300,000
B-05 Chuckawalla Trail-head $350,000
B-06 Highway 91 Trail ?
B-07 Red Mountain Trail Loop $325,000
B-08 River Trail Loop $200,000
B-09 West Ivins Trail $250,000
B-10 Santa Clara River Trail $500,000
Total Costs $3,605,000

DIXIE URBANIZING AREA INTERIM LONG-RANGE
(2000-2020) TRANSPORTATION PLAN
25
Public Involvement
Comments received during the Open Houses and public comment period were
considered in the development of this plan and are summarized in this section of the
plan based on their scope and planning horizon. The following comments relate to
long term issues and concerns to pay attention to during the planning process, with
some having immediate need and action, but all having linkage to quality of life,
economic development, environmental protection, safety and mobility, the basic
issues, goals and objectives of the metropolitan planning organization for Utah’s
Dixie.
1) The CANAMEX Corridor, is a collaborative planning effort of the five states
of Arizona, Nevada, Utah, Idaho, and Montana. The advent of the North
American Free Trade Act which created a set of preferential economic
relationships among Canada, the US, and Mexico, underscore the
importance of strengthening north-south economic, transportation, and
telecommunication linkages. Within the National Highway System
Designation Act of 1995, the US Congress defined this priority corridor and
specified I-15 as the route. Dixie is touched by I-15 which carries significant
traffic demands including, tourist, freight, recreational and local, state and
regional trip needs. As projects develop from this effort, the urbanizing area
will need to consider and plan ways to link and respond to innovations and
capacity needs of this corridor.
2) The TransAmerica Transportation Corridor (I-66) and Mag-Lev Train are
two Congressionally proposed concepts of future response to growth,
homeland defense, and movement of goods and people. The possibility of
nuclear waste being transported through Dixie to destinations in Neveda on
current and future corridors is of concern within the positive effects that may
be realized. The MPO must be alert to these issues during the planning
process and be ready to support or defend or mitigate, as needed.
3) The Habitat Conservation Plan established in Washington County was
created to be a facilitator between development and open space protection,
specifically the protection of various biological species found within the
boundary and region while allowing public use, access and utility easements
following various protocols. The HCP administers land primarily north of the
City of St. George, Washington and near the cities of Ivins, Santa Clara and
Hurricane in cooperation with the US Fish and Wildlife Service, Utah State
Department of Natural Resources, The State Institutional Trust Lands, and
DIXIE URBANIZING AREA INTERIM LONG-RANGE
(2000-2020) TRANSPORTATION PLAN
26
Washington County and its local municipalities and environs. HCP staff have
expressed concerns about the 20 year plan showing a proposed corridor
north of the Skyline Drive, which is currently being improved by the City of St.
George as a detour for the eventual re-construction of St. George Blvd. The
HCP staff continued by saying that the the “City of St. George continues to
show this line in the Interim Long Range Plan”. The MPO’s Interim Long
Range Plan is a document of regional need, not of one specific city.
Regardless of the negotiations that have taken place in the past between the
HCP and any one city, the 20 year plan and future 30 year plan will continue
to show a corridor bisecting the current HCP boundary because the purpose
and need for such capacity will be likely justified in the future, if not by 2030
then some later time as Dixie builds out and 300,000 people are living in the
future urbanized area between what is now Ivins and the Hurricane/LaVerkin
urban cluster. The issues will continue to be providing open space, protection
of endangered species, while removing ‘through trip’ demand away from the
central business district thus relieving the congestion that will be prevalent.
4) With the continued rapid growth in Dixie and projected patterns of that
growth residents will be concerned about many issues but we must plan to
act on this growth. The MPO should make sure that public parking is
provided to offer access to public parks, reserves and recreation facilities.
Traffic corridors will contain recreational locations with trails and fields for
hiking, biking, soccer, baseball, etc. As traffic volumes increase on high
profile roads in the urbanizing area people will park in residential
neighborhoods, developments with private roads or along high traffic streets.
Uncontrolled parking will impact community safety and security.
5) Several comments pointed out the need to maintain traffic flow, especially
around Dixie State College and the new Dixie Regional Medical Center.
These issues will continue to be coordinated with partners to insure traffic
flow, congestion relief and air quality protection as well as the safety and
convenience of the pedestrians and patrons who not only use these two
facilities but other facilities too such as elementary and secondary schools,
churches, recreation facilities, and many other trip destinations.
VI. REVENUE SOURCES
Funding for transportation improvement projects in the St. George Urbanized Area
will be available from federal, state, and local governments as well as from private

DIXIE URBANIZING AREA INTERIM LONG-RANGE
(2000-2020) TRANSPORTATION PLAN
27
developers. The table included in this chapter provides a summary of the specific
federal, state, and local programs available to fund transportation projects. Section
VII provides an estimate of the revenue which may be available from each funding
source. If the SGUZA is not eligible for a program at the present time, no further
consideration will be spent in this document. The following section briefly outlines
the various transportation funding sources, programs, and what they may be used
for.
Federal Sources
The Federal Highway and Transit Administrations, of the US Department of
Transportation, provide the major source of funds from the federal government for
local transportation infrastructure development and improvement. The current
federal highway and transit bill TEA-21 has been extended and continues increased
funding levels and philosophy of ISTEA, the 1991 landmark bill, which provided
increased flexibility within and between the highway and transit programs. In
addition to these programs, funds are also available from several other federal
agencies and are discussed below. A new multi-year bill is being developed in
Congress to be called SAFETEA.
Federal Highway Administration
The Federal Highway Administration (FHWA) directs the national highway funding
programs for improvements to the Federal-Aid Interstate System, for improvements
to other highways in rural and urban America, and for safety related improvements.
Funding sources for these programs comes from the federal gasoline tax currently
dedicated to the Highway Account of the Highway Trust Fund. A brief description of
each of these programs follows:
Federal-Aid Interstate Maintenance Program(FAIM)
These funds can be used for resurfacing, restoration, and rehabilitation of the
Interstate Highway System.. I -15 disects the Dixie area and emerges from
the northeast into the planning boundary at Leeds, and exists south of the
port of entry at the border of Utah and Nevada leading to Las Vegas. The
Utah Department of Transportation’s Region 4 - Cedar District Offices, in
Cedar City, manage these funds.
National Highway System(NHS)
This category includes funds for all interstate, other major US routes and
state highways. The federal share for this program is approximately 93%,
supporting projects such as commuter parking lots and new interchanges.
DIXIE URBANIZING AREA INTERIM LONG-RANGE
(2000-2020) TRANSPORTATION PLAN
28
The section of Interstate 15 from the Arizona Border to near Mile Mark 16 is
the only road that fits this category at the present time.
Surface Transportation Program (STP)
Funds from this program may be spent on any road that is functionally
classified as a collector or arterial for urban streets or as a major collector or
arterial for rural areas. The type of project may range from rehabilitation to
new construction, and for transit projects. The Utah Department of
Transportation is in the process of updating the Functional Classification
statewide.
Fifty percent of a state’s STP funds are allocated to urban and rural areas of
the state based on population. Thirty percent can be used in any area of the
state at the discretion of the State Transportation Commission. For the
remaining 20 percent of the funds, 10 percent must be spent on highway
safety projects, and 10 percent must be spent on Transportation
Enhancements. Enhancement projects can range form historic preservation
and bicycle and pedestrian facilities to landscaping and water runoff
mitigation. Safety projects include Hazard Elimination, Railroad Crossing, and
Railroad Protective Devices.
Congestion Management/Air Quality(CMAQ)
The money from this program may be spent in areas currently considered
non-attainment for certain air pollutants. Since the Dixie Urbanizing area is
neither attainment, nor non-attainment, these funds will not be tracked or
analyzed, suffice it to say that the funds must be proven to reduce traffic
congestion and/or improve air quality in non-attainment areas. Examples of
CMAQ projects are signal coordination, park-and-ride lots, ridesharing, and
alternative transportation modes. Federal Funds do not currently exist to help
new small urbanized areas prolong or prevent air quality issues with
appropriate designed projects.
Bridge Replacement Program(BR)
The State Transportation Commission sets policy for this UDOT managed
program, which provides funds for the replacement of substandard bridges,
both on and off the federal-aid system. Bridges must have a span of 20 feet
to be eligible to receive these funds. UDOT evaluates all eligible bridges in
the state every two years, assigns them a rating, and coordinates the
DIXIE URBANIZING AREA INTERIM LONG-RANGE
(2000-2020) TRANSPORTATION PLAN
29
program with local governments. Bridges with a rating of 50 are eligible for
reconstruction, while those achieving at least a 70 are eligible for
rehabilitation. By policy, 65 percent of these funds will be used for bridges on
the state system, 35 percent for those under local government jurisdiction.
The federal share for this program is 80 percent.
Planning (PL)
By formula, the State Transportation Commission provides a piece of the
STP funds called ‘planning funds’ to Metropolitan Planning Organizations
based on share of urbanized population and a minimum floor. The Dixie MPO
became a recipient of these funds through its annual work program submittal
beginning Oct. 1, 2003. These funds are based on a federal share of
approximately 93 per cent.
State Planning & Research(SPR)
UDOT sets aside a portion of its STP funding into this category which
supports planning and research projects on a statewide basis. Dixie MPO
may apply for these competitive discretionary funds annually under a ‘call for
projects’ by UDOT for priority planning needs whose costs are above and
beyond the annual formula allocations.
Rideshare Program
Although primarily used in urbanized settings where congestion and air
quality problems are paramount, the Utah Transit Authority/UDOT
administered program is available to other areas in Utah for no interest loans
for purchase of 7-15 passenger vans for van pooling of employees from their
homes to places of work. The car pooling computerized program is also
available for interested citizens who want to match trips from their
neighborhood to their place of work. The car and van pooling program has
the greatest potential of reducing single occupant vehicle numbers during
peak hours, even more than public transit, but the difficulty is enticing
employees to become less dependent on their personal auto to get to work
and share their trip with others in a close personal setting on a regular basis.
Trip distance is also an important incentive. The no interest loan must be
paid back over the life of a typical loan for the value of the vehicle being
purchased. The federal loan share is approximately 93 per cent, the van pool
operators must supply the remaining 7% match to pay the dealer, and then
set aside enough funds on a monthly basis to pay off the loan.

DIXIE URBANIZING AREA INTERIM LONG-RANGE
(2000-2020) TRANSPORTATION PLAN
30
Federal Transit Administration
Transit capital, planning, and operating assistance are made available through the
Federal Transit Administration (FTA), and are financed through 1½ cents of the
federal gasoline tax currently going to the Mass Transit Account of the Highway
Trust Fund. US General Fund reserves also support this federal program. A brief
description of the transit assistance program follows:
Capital Program(5309)
This program provides discretionary funding for capital improvements such
as construction of maintenance or transit center facilities, purchase of rolling
stock, or buses. These normally expensive items are funded through project
sponsor lobbying of the states Congressional delegation, much the same as
large highway needs, and ear marked in the multi-year transportation bill
(SAFETEA). The Designated Recipient (DR) or operator of the transit
system, must be prepared to submit a grant application for these ear-
markings, to FTA.. The federal share is up to 80%. Sponsors increase the
likelihood for funding by providing a strong local match, over the normal 20
per cent.
Urbanized Area Formula Program(5307)
The St George UZA will be listed annually in the Federal Register
announcing the apportionments to the states, UZA’s and other jurisdictions
of funding available for transportation planning, and transit capital/operating
programs. The funding is distributed annually by formula, based on
population, population density, and bus revenue miles of service. Funds can
be spent for either capital or operating expenses. A public body, capable of
levying taxes and operating a public transit system must apply directly to FTA
for approval of these funds. The federal share for operating assistance is up
to 50%, while capital and planning assistance is up to 80%.
Elderly and Persons with Disabilities Program(5310)
Begun in 1976, this program provides funding to private and public non-profit
agencies for capital improvements for the provision of transportation services
to elderly people and persons with disabilities. UDOT has a selection and
evaluation team to review applications from throughout the state, and makes
recommendation to the State Transportation Commission for funding. UDOT,
then applies to FTA for approval of the projects, also shown in the MPO TIP
and State TIP. The federal share for these projects is also up to 80%.

DIXIE URBANIZING AREA INTERIM LONG-RANGE
(2000-2020) TRANSPORTATION PLAN
31
Non-urbanized Area Formula Program(5311)
The counter-part to the Urbanized program this funding pot supports the
capital and operating needs of rural public transit services. Although these
funds may not be used within designated Urbanzed Areas, they may be used
in areas outside the boundary but within an MPO’s 20 year planning
boundary. These small urban or rural pieces may have coordinated public or
specialized transit services that have origins or destinations that occur in
UZA’s.
Statewide Planning and Research(5313)
UDOT submits annually to FTA a grant for support of departmental planning
activities, a portion of which may be spent on identified needs throughout the
state. Typically the local planning needs portion is transferred by UDOT on
a case by case basis, through interagency agreements with AOG’s or other
local governments for special transit planning studies or research. The Dixie
area has benefitted from these funds in the past under rural or small urban
designation, and could access these funds in the future when consideration
of transit expansion needs outside the UZA boundary is warranted or
demanded, the focus being within the 20 year planning boundary. The
federal share with this program is also up to 80%.
Metropolitan Planning(5303)
The State Transportation Commission by a similar formula as the PL
program, distributes these FTA planning funds by formula and minimum floor
along with the PL funds to existing MPOs to support the annual work
programs of each MPO and staff. Upon MPO designation by Utah’s
Governor, the Dixie MPO will be eligible to receive these funds to reimburse
planning activities carried out in support of the regional transportation
planning process. These funds, expected to be available on or after October
1, each year, are also based on a federal share of up to 80%, but may max
out at the 93.23 per cent ‘PL’ level under the Consolidated Planning Grant
offered by the federal government and currently being managed by UDOT
for the MPO’s in Utah. This recent program, available at the states option,
allows maximum flexibility in use of all planning dollars to support all planning
work program elements, transit or highways, with minimal accounting and
management burdens to all partners, and allows local manpower and match
funds saved, to be used for other local needs.

DIXIE URBANIZING AREA INTERIM LONG-RANGE
(2000-2020) TRANSPORTATION PLAN
32
Demonstration Funds
Since the mid l970's, Congress has authorized funding for specific transit or
highway projects labeled as demonstration projects. Funding for these
projects can come from either the Highway Trust Fund or the General Fund,
usually over and above the state’s allocation of federal funding. It was by this
method that Congress eventually created the non-urban or rural public transit
program in 1978. This program was first demonstrated and administered by
FHWA, then turned over to FTA a few years later.
The Ute Indian Tribe, Park City, and TRAIL, Inc. in Nephi, were among the
first demonstration projects in Utah to utilize these seed funds for their public
transit operations. The program proved so successful that the 5311 or what
was called the Rural Public Transit Program was born.
Other Federal Programs
Other federal agencies provide funds that can be used for transportation
improvements under certain conditions, and are described below:
Community Development Block Grants (CDBG)
The U. S. Department of Housing and Urban Development is the sponsor of
this program which can be used for a wide variety of activities directed
toward neighborhood revitalization, economic development, and improved
community facilities and services, including the construction of streets,
highways, and transit facilities or their improvements. The projects must
clearly demonstrate benefits to low and moderate income persons, aid in the
prevention or elimination of slums and blight, or meet other urgent community
health and safety needs.
Municipalities with a population of more than 50,000 and counties with a
population of more than 200,000 are entitlement areas, and are allocated
CDBG funds annually. Areas under 50,000 must compete for state-
administered ‘small cities’ grants or as in the case of Five County, the AOG
administers the program region wide for the state. The City of St. George
petitioned for a Census recount, as the 2000 Census showed them just a few
people short of the 50,000 needed. The City of St. George has subsequently
been designated an entitlement area. These funds can be used to pay for the
entire project cost, or to provide the local matching funds for other federal
funding programs, including transportation programs. Match ratios vary
based on community size, category and ability to generate local revenues.

DIXIE URBANIZING AREA INTERIM LONG-RANGE
(2000-2020) TRANSPORTATION PLAN
33
Economic Development Grants
Economically distressed areas may be the focus for this source of funding if
the construction or rehabilitation activities have a significant and longlasting
favorable impact. Administered by the Economic Development
Administration, these EDA funds should be considered if a project is to be
constructed in an area of high unemployment or will assist in the creation of
long-term employment opportunities. Eligible entities must be within an
Economic Development District and the proposed project must be part of the
District’s overall Economic Development Program in order to apply.
State Sources
The State of Utah makes funds available from several sources for highway
improvement projects. The major source of these revenues is highway user fees,
which include motor fuel taxes, special fuel taxes, vehicle registration fees, and
drivers license fees. Seventy five percent of these funds are kept by UDOT for their
construction and maintenance program. The remaining 25% are made available to
the cities and counties in the state through the Class B and C Program. Class B and
C funds are allocated to each city and county by a formula based on population and
miles of road.
The legislature established a Safe Sidewalks Program to fund the construction of
sidewalks on roads on the state system. The money is distributed by formula
partially based on miles of state road per UDOT Region. One million dollars have
been appropriated for the past few years. Each county in UDOT’s districts submits
projects to the district, which then prioritizes them. A statewide representative
committee then makes final selection for each county.
Over the past decade, the state has also used general funds for specific highway
projects. Occasionally, funds are appropriated for specific projects. In others, the
general fund revenues are used to pay off bonds issued by the state for highway
and other capital improvements. The legislature created the CHEF fund which
provides the leverages described.
Local Sources
Local government agencies have a variety of funding sources available to them for
transportation improvements. The primary source is from the general fund of the
cities and counties. These general funds can be used for construction of new roads,
or the upgrading, or maintenance of existing ones. Transportation projects,

DIXIE URBANIZING AREA INTERIM LONG-RANGE
(2000-2020) TRANSPORTATION PLAN
34
however, must compete with the other needs of the city or county for these funds.
Other options involve some kind of bonding arrangement, either through creation
of a redevelopment district, a special improvement district organized for a specific
project benefiting and identifiable group of properties, or through general obligation
bonding arrangements for projects felt to be beneficial to the entire entity issuing the
bonds.
Finally, local funding for transportation improvements, both for highways and public
transit service is being provided through a 0.25 per cent sales tax in St. George to
support the transit system and other highway improvements. Recent language
changes in the local options sales taxing authority by the legislature has made this
flexibility possible.
Private Sources
Sources of funding for transportation improvements often come from private
interests, such as developers who may construct local streets within subdivisions
and often dedicate right-of-way for and participate in the construction of collector
and arterial streets adjacent to their developments. Developments may cause
impacts on street capacity or traffic signalization, triggering the need for new signals,
or even street widening demanding fees or construction of off site improvements.
Businesses or developers have supported capital expenses or operating costs for
transit services that provide them with special benefits, such as reduced need for
parking or increased accessibility to their development.
The DTAC should review proposed developments within the urbanizing area that
may have an effect on the transportation system and then recommend system
improvements which should be made as part of the development. These
improvements may include right-of-way designation, construction of local streets,
and construction of collector or arterial streets.
VII. PROJECTED REVENUES
Introduction
The Dixie Transportation Planning Office worked with UDOT and the cities of Ivins,
Santa Clara, St. George and Washington, including DARTS and SunTran staff and
AOG staff to develop projections of revenues that will be available for transportation
improvements over the next 20 years. Included were federal, state, and local
sources for highway and transit improvements. Assumptions were made concerning

DIXIE URBANIZING AREA INTERIM LONG-RANGE
(2000-2020) TRANSPORTATION PLAN
35
revenue growth and new or increased sources of funds. These projections and
assumptions used are discussed throughout this chapter.
Highway Sources
Federal, state, and local government revenues will be available for highway
improvements in the St. George UZA. Revenues for this interim plan were estimated
based on the year 2003 STP allocations to the St. George UZA, and past revenues
enjoyed by the Logan UZA, an urbanizing area in northern Utah similar in population
to this Dixie area. Assumptions used to develop these estimates are discussed
below.
Federal Funds
Chapter V lays out the several spending programs for federal highway
improvements. For projecting future revenues, Logan UZA amounts were assumed
to be available to the St. George UZA through 2020, with a modest growth of one
percent per year for each program between now and 2020 along with the STP
SGUZA allocations. Cache MPO’s 2020 Long-Range Plan, 1997, provides the basic
framework for these estimates and are presented in Table 11 as projections.
State Funds
These funds are described in detail in Chapter V, but are primarily user fees.
According to the Cache LRP for 2020, overall highway user fees statewide grew at
about six percent from 1985. However, because of a motor fuel tax increase during
1987-88, which skewed the rate, their plan concluded that after accounting for that
tax increase, a growth rate of about 2.5% per year for motor fuel consumption was
estimated from 1985 to 1997. This interim plan assumes that same trend through
August 2001. Revenues have dropped off due to events of 9/11 and a slowing
economy prior to 9/11. Other revenue sources grew at about a rate of 3 to five
percent.
Highway user fees are split among other agencies, UDOT, and the Class B and C
roadway funds. In the past, approximately eight percent of these funds have been
diverted to other agencies such as the Highway Patrol. The remaining funds are
allocated 75 percent to UDOT and 25% to local governments. These represent 69
percent and 23 percent of the total revenues, respectively. This allocation of
highway user fees was held constant for the future estimations in the Cache plan,
and the same assumption made for this interim plan which comes out to about 0.8
percent of UDOT’s retained portion of the highway user fees.

DIXIE URBANIZING AREA INTERIM LONG-RANGE
(2000-2020) TRANSPORTATION PLAN
36
Table 11 - ESTIMATED FEDERAL HIGHWAY FUNDS AVAILABLE TO SGUZA
PROGRAM % of
State
UZA 2003 UZA 2020 UZA Accrued
National Highway System (NHS) 0.4 $155,000 $185,000 $3,200,000
Any Area Statewide STP 0.8 $133,000 $159,000 $2,800,000
St. George Urbanized Area STP 100.0 $664,000 $786,000 $13,000,000
Other STP (Safety) 0.8 $34,000 $40,000 $667,000
Transportation Enhancement 0.8 $34,000 $40,000 $667,000
State Bridge Replacement On System 0.8 $61,000 $72,000 $1,200,000
Local Bridge Replacement Off System 0.8 $14,000 $17,000 $275,000
Local Bridge Replacement Optional 0.8 $19,000 $23,000 $373,000
Planning (PL) 4.8 $83,000 $98,000 $1,600,000
State Planning & Research 5.0 $25,000 $26,000 $432,000
Totals $1,222,000 $1,446,000 $24,214,000
Based on UDOT 2003 SGUZA STP Allocation and Logan UZA Estimates
The Statewide total user fees estimated in the CMPO plan from 1997 through 2020
was $570,132,000, so an 0.8 % estimate for St. George UZA for that same period
is $456,000.
Local Funds
The two main sources of local revenues for transportation projects, Class B and C
Funds from state highway user revenues for counties and cities, are allocated on
a ratio of population, and road miles, respectively. The past trend has split the
roadway fund 53% for unincorporated county areas and the remaining 47% to the
cities and towns of the state, based on a formulas of 50% centerline road miles and
50% land area. According to UDOT staff, the St. George Urbanized Area
communities together received approximately $2,660,000 in C funds in 2002, while
the County utilized nearly 1.3 million in B funds in 2002, of which 10% is estimated
spent inside the MPO planning boundary($130,000). With a 1% annual growth rate
in these funds it is anticipated that the Dixie MPO area cities and county portion will
have $3,337,000 available for year 2020 with an accrued total of $ 58,000,000 from
year 2002.

DIXIE URBANIZING AREA INTERIM LONG-RANGE
(2000-2020) TRANSPORTATION PLAN
37
Summary
Revenue totals have been projected to 2002 dollars to match with project cost
estimates based on 2000 construction costs. Table 12 below summarizes the
amount of revenues projected to be available in the St. George UZA to year 2020
years in 2002 dollars. The estimate of local funds is based on 10 percent of the B
& C Funds to be used for MPO projects.
Table 12 - PROJECTED REVENUES FOR HIGHWAY IMPROVEMENTS IN
THE ST. GEORGE UZA FROM 2003 TO 2020 (Rounded)
Source of Funds 2003 2020 Total: 2003-2020
Federal Funds $1,200,000 $1,400,000 $ 25,000,000
State Funds: UDOT 456,000 545,000 9,490,000
Local Funds: B&C 2,600,000 3,300,000 58,000,000
Total $ 4,256,000 $ 5,245,000 $ 92,490,000
Transit Sources
Revenues for transit service and improvements are available from several sources
including federal funds, local sales tax, fares, and others. Projections of future transit
revenues are discussed below.
Federal Funds
Capital Program(5309)
Accessed via lobbying efforts towards earmarking in the multi- year
transportation bill, and annual appropriations from Congress. Projects
listed in DMPO’s TIP for 2004-08 totals $4,160,000 and supports Bus
purchases of $800,000, design and construction of a maintenance
facility of $2,560,000 and a future transit center at $800,000 in FTA
5309 funds. Again, these are discretionary funds and should not be
counted on in the mature years of a system. They are more likely
available during start- up and technology transition periods.
Formula(5307)
The 2003 Urbanized Area Formula allocation of $643,840 to the St.
George Urbanized is used to project future allocations, taking into
account recent decline in federal gas tax revenues with a one percent

DIXIE URBANIZING AREA INTERIM LONG-RANGE
(2000-2020) TRANSPORTATION PLAN
38
inflation factor. It is therefore estimated that nearly $ 770,000 will be
available for public transit in year 2020, with an accrued amount over
the seventeen year period of nearly 13.4 million.
Local Funding
The local sales tax options are flexible now after significant language
changes in tax legislation removing restrictive and descriminatory language.
Local governments can utilize the sales tax option for highways and/or public
transit. St. George City calculates that $375,000 annually from the sales tax
could support transit operations, if needed. $128,000 will be used during
year 2003. Recent trends show sales tax revenues growing at approximately
6% percent per year. This rate of growth was used to estimate the sales tax
revenue for the transit system.
To fund any future expansion of public transit to areas outside the City of St.
George, an additional sales taxes would need to be collected from those
outlying areas currently utilizing the sales tax. Areas not using the local
options sales tax would require a voter approval of residents in those areas
demanding service.
In summary, 2002 quarter cent sales tax revenues totaled $2.5million in the
City of St. George. The 2020 sales tax revenues are projected to be
$7.1million, so, between 2002 and 2020, a minimum of $1,065,000 or more,
depending on expansion of the system, could be applied or available to
public transit from this source.
User Fees
The transit system currently charges a one dollar per trip fare for general
public use. Other special needs users are paid by their support agency for
the trips they take on the system. Also, advertising opportunities are visible
on the buses for local business exposure. These various revenues will be
projected into the future for this document.
Fare Revenue
Charging fares to transit users is a generally accepted practice and
conforms to common economic philosophy that users contribute at the
mode decision, not just through general or special taxes. This
contributes to buy-in and may even affect incident rates for destructive
passenger behavior observed with all public facilities. SunTran’s fares
contributed $19,000 for the first six months of service. Peak use has

DIXIE URBANIZING AREA INTERIM LONG-RANGE
(2000-2020) TRANSPORTATION PLAN
39
not reached capacity as yet but may occur in the future depending on
operation decisions. As service is enhanced, additional riders will be
attracted to the system. Projected annual fare revenue for year 2020
is estimated at $65,000 assuming 3% growth rate. Accrued revenue
over the seventeen years to 2020 is estimated to be nearly
$1,000,000.
Other Revenues
Advertising space on SunTran buses for the first six months was
$18,000. If and when benches are constructed additional revenue
from advertizing may increase. Based on bus only advertizing it is
expected that $ 61,000 or more may be generated during year 2020,
and $904,000 accrued.
Flexible Funding
The funds discussed above have been identified with either highway or
transit, but it should be mentioned that flexibility in the use of many of these
funds does exist, especially if the current mode need is satisfied by the
parent source, with funds left over. Most of the federal funds can be used for
either highways or transit under certain conditions. Interstate Maintenance,
National Highway System, Surface Transportation Program, and CMAQ
funds can all be used for transit capital projects. FTA Formula Program funds
can be used for highway improvements if American with Disabilities Act
requirements are met and if no local matching funds issues are present.
State highway user revenues, including B & C funds, must be used for
highway improvements. However, eligible uses could include construction of
bus turnouts along arterial streets and construction of joint use park-and-ride
lots that can also serve transit riders. State and local general fund revenues
that are currently dedicated to highway improvements could possibly be used
to support transit’s capital or operating expenses, with approval of local
governing bodies.
The local options sales tax is now available for transit and or highway uses.
This plan does not anticipate any transfer of funds between highways and
transit, since projected funds for each will not meet all the future needs.
Since the St. George Urbanized Area is not being monitored for air pollutants,
CMAQ funds have not been made available and are not anticipated in the
near future. However, to prolong such state designation based on DAQ
observed monitoring of local air quality, an air quality protection strategy was
developed. It is included by reference in this document and is available at the

DIXIE URBANIZING AREA INTERIM LONG-RANGE
(2000-2020) TRANSPORTATION PLAN
40
MPO office. Unwritten in the plan is a Dixie MPO strategy to encourage Congress
to create a prevention program to assist areas like Dixie to prolong and/or prevent
designation status.
Revenue Summary
Table 13 summarizes the amount of revenue projected to be available for
transit improvements in the St. George Urbanized Area between 2003 and
2020. Approximately $27,500,000 is projected to be available during this
period.
Table 13 - PROJECTED REVENUES FOR PUBLIC TRANSIT IN THE
ST. GEORGE UZA, FROM 2003 TO 2020
Source of Funds 2003 2020 Total: 2000-2020
Capital Program(5309) $0 $0 $4,160,000
Formula (5307) $644,000 $770,000 $4,400,000
Share of Local Sales Tax $375,000 $1,065,000 $7,136,000
User Fees: Bus Fares $38,000 $65,000 $954,000
Advertizing on Buses $36,000 $61,000 $904,000
TOTAL (Transit O&M) $1,093,000 $1,961,000 $27,554,000
Transit Planning (MPO) $22,000 $26,000 $432,000
VIII. PROJECTED COSTS
Highway Cost Estimates
The DMPO estimated the cost to meet future needs to year 2020 to assist in the
developing the financial plans for this interim long range plan. Seven cost categories
were estimated, including administration, maintenance, pavement preservation,
safety, bridge replacement, enhancements, and new capacity. The assumptions
used to estimate the costs are associated with UDOT and local agency experience
with each category.
Administration
Typically, administration runs 8% of total revenue available to an agency for
transportation management and associated public works statewide.
Urbanized status adds additional compliance costs. Expenditures include
state and local staff, planning, pre-engineering, etc. UDOT budgets 10% for

DIXIE URBANIZING AREA INTERIM LONG-RANGE
(2000-2020) TRANSPORTATION PLAN
41
administration; cities typically range from 8-10%. As a new Urbanized Area ten
percent of total revenue available for highway improvements as projected in
Chapter V are assumed for the administration function. These costs are estimated
to total $8,000,000 through the year 2020.
Maintenance
Snow removal, sweeping, weed control, crack sealing, and pothole patching
are typical tasks throughout most of Utah. In Utah’s Dixie, snow removal is
as rare as a desert tortoise, consequently lane mile maintenance costs are
somewhat less than other regions of the state. Prolonged hot temperatures
during summer months do not show additional deterioration to the roadway
system because of improved asphalt additives and formulas that account for
such conditions. Based on statewide averages and experience with the local
communities in Dixie, $1,000 per lane mile per year is the baseline for
projecting future costs with 1/2% growth in lane miles per year, and counting
only arterials and collector roads. With a total of 573.2 arterial and collector
lane miles existing in the planning boundary, these costs will total
approximately $ 12,660,000 to the year 2020.
Pavement Preservation
Intensive treatments for arterial and collector roads ranging from chip sealing
up to full blown re-construction of sub and surface bases, which add to or
extend pavement life, are considered preservation rather than maintenance.
On average, about $6,000 per lane mile per year for arterial roads and
$4,000 for collector roads is estimated for this system management function.
So, for the 179.6 Collector lane miles totaling $718,400 current year, and
315.1 Arterial lane miles, totaling $1,896,000 for the current year,
preservation needs in the Dixie MPO boundary, at a growth of 1/2% per year,
by year 2020, $57,600,000 will be needed.
Safety
From UDOT experience about $20,000 is prorated in the Dixie area each
year for safety improvements ,including hazard elimination, intersection
upgrades, and other activities. With that as a baseline, and 1/2% growth per
year through year 2020, nearly $442,000 is estimated to meet safety related
issues and projects.
Bridge Replacement
Bridge replacement needs identified in the Dixie TIP include spans over the
Santa Clara and Virgin Rivers plus one new bridge over the Virgin in the next

DIXIE URBANIZING AREA INTERIM LONG-RANGE
(2000-2020) TRANSPORTATION PLAN
42
twenty years to meet capacity. So, for the needs through year 2020 it is estimated
that $16,570,000 will cover bridge replacement.
Enhancements
The identified enhancement projects from the cities and trails committee total
$3,605,000. As detailed pedestrian and bicycle plans are developed and
projects are linked within the system additional needs will likely total over
$5,000,000 into 2020.
New Capacity
The Dixie MPO figures that to just complete the Dixie Beltway, comprised of
the Northern, Southern and Western Corridors, over $100,000,000 will be
required into 2020. Including additional capacity on existing system
collectors and arterials and some new accesses, such as to the new
replacement airport via the Washington Fields, another $100,000,000 is
feasible. Therefore, $200,000,000 through year 2020 is required for this
management outlook.
Summary
Projected highway and related pavement/trail needs for the Dixie MPO planning
area through year 2020, exceeds $300,000,000. These costs include, maintenance,
preservation, administration, as well as construction.
Available revenue into year 2020 totals only, $92,000,000, leaving a huge gap
towards meeting highway related needs of $228,000,000. Table 14 presents these
costs.
Table 14 - Summary of Cost by Category for Highway Needs
Cost Category Projected Costs to 2020
Administration $8,000,000
Pavement Maintenance $12,700,000
Pavement Preservation $57,600,000
Safety $442,000
Bridge Replacement $16,570,000
Enhancements $5,000,000
New Capacity $200,000,000
TOTAL $300,312,000

DIXIE URBANIZING AREA INTERIM LONG-RANGE
(2000-2020) TRANSPORTATION PLAN
43
Transit Costs
Public transit projects/needs were developed in the Transit Services Analysis report
by the City of St. George and discussed in Chapter V of this document. Essentially,
anticipating another city in the metro area coming on line for transit service provision
in the short term, $350,000 per year in capital cost and $450,000 in operating cost,
is estimated with a 5% growth factor. Conservatively, the total estimated capital cost
through year 2020 is $9,800,000. The operating cost over the same years is
estimated to be $13,000,000. Projected revenues to cover these two management
functions into year 2020 appears to be more than adequate with local and federal
assistance expected to grow to keep up with needs. These figures are very
conservative. If ridership and demands exceed expectations earlier, then doubling
these two costs to year 2020 would not be unrealistic, and would match the
revenues likely available from all sources. If demand increases then capital and
operating needs for expanded and or improved facilities and equipment could
emerge quickly.

DIXIE URBANIZING AREA INTERIM LONG-RANGE
(2000-2020) TRANSPORTATION PLAN
44
APPENDIX A
G L O S S A R Y
DMPO Dixie Metropolitan Planning Organization
DTAC Dixie Transportation Advisory Committee
DTEC Dixie Transportation Planning Office
FCAOG Five County Association of Governments
FHWA Federal Highway Administration
FTA Federal Transit Administration
GIS Geographic Information System
ITS Intelligent Transportation System
LRTP Long Range Transportation Plan
MPO Metropolitan Planning Organization
QRS II Quick Response System II, Traffic Demand Model
SGUZA St. George Urbanized Area
SRTP Short Range Transportation Plan
STIP Statewide Transportation Improvement Program
TDP Transit Development Program (3-5 year Plan)
UDOT Utah Department of Transportation
UPWP Unified Planning Work Program
USDOT United States Department of Transportation
UZA An Urbanized Area (over 50,000 people)

45
APPENDIX B
URBANIZED AREA
AND MPO PLANNING BOUNDARIES

46
APPENDIX C
LAND USE ZONING MAP

47
APPENDIX C
LAND USE DENSITY MAP

48
APPENDIX D
DIXIE ROADWAY FUNCTIONAL CLASSIFICATION MAP (SHEET 1)
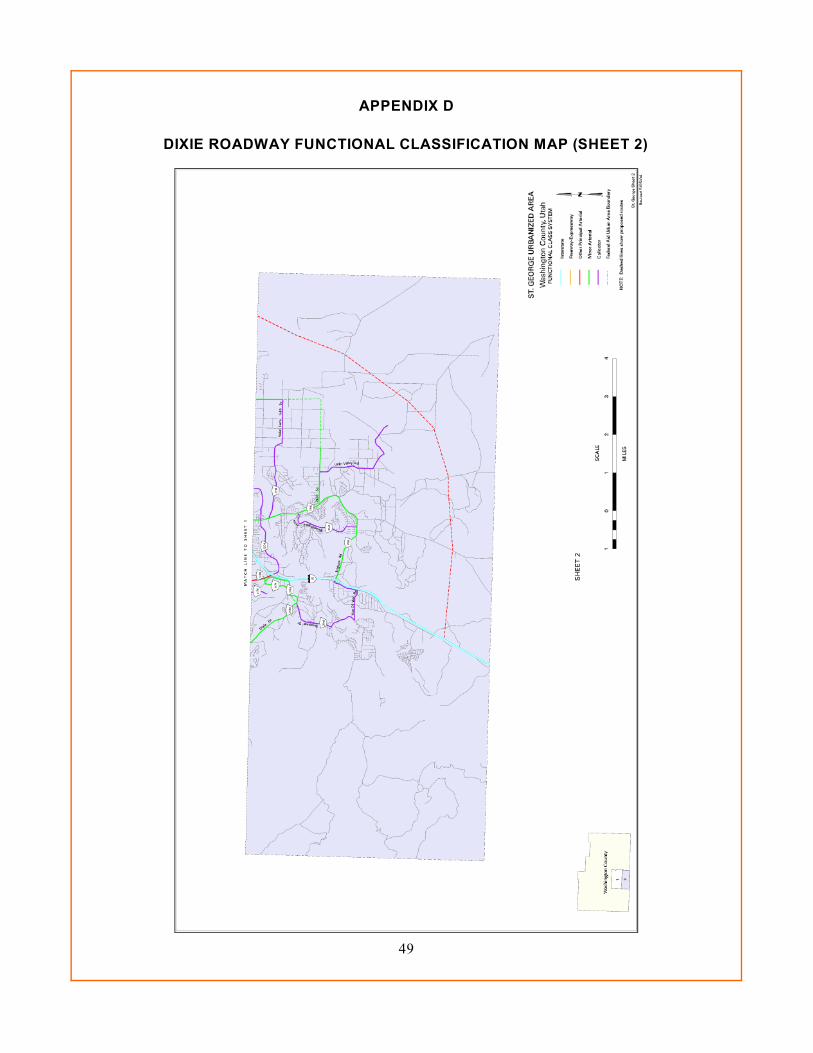
49
APPENDIX D
DIXIE ROADWAY FUNCTIONAL CLASSIFICATION MAP (SHEET 2)

50
APPENDIX E
PUBLIC TRANSPORTATION MAP - SUNTRAN BUS ROUTES

51
APPENDIX F
WASHINGTON COUNTY REGIONAL TRAILS MASTER PLAN MAP