division of governmental studies and services final report
TRANSCRIPT
1
2016 Hazardous Materials Commodity Flow Assessment:Findings from a Commodity Flow Study Conducted for Greater Spokane
Emergency Management
Division of Governmental Studies and Services
Final ReportAugust 25, 2016
Report Authors:Michael Gaffney, J.D.Christina Sanders, MPASeason A. Hoard, Ph.D.John S. Snyder, J.D.Gregg N. Teasdale, P.E., PhD.Maria Rebeca Orozco, Graduate Student
Field Research Staff:
Fernanda Buril AlmeidaColby CavanaughDerek CoburnSheila Cuellar-ZunigarRaymond HohnholzJessica JelcickJenny LauDaniel MuellerSonia VillaneuvaDallin Walton

2
EXECUTIVE SUMMARY
The following report presents the principal findings from analysis of data collected as
part of a hazardous materials commodity flow study conducted by researchers from Washington
State University for Greater Spokane Emergency Management in the summer of 2016. Greater
Spokane Emergency Management contracted with the Division of Governmental Studies and
Services (DGSS) at Washington State University in February of 2016 to conduct a hazardous
materials commodity flow study, including of transport via truck, pipeline, and railroad in
Spokane County. This study involved the assessment of data gathered from other sources on
pipeline and rail transport, coupled with primary data collection via roadside observation for
highway transport. DGSS, a unit jointly sponsored by WSU Extension and the College of Arts
and Sciences, serves as a link between WSU resources and the population of the Pacific
Northwest. For over 50 years, DGSS has served the University’s land grant mission through
applied social science research, program evaluation, training and technical assistance to public
and private entities throughout the Pacific Northwest. As part of this mission, DGSS has
conducted several hazardous materials commodity flow studies in Washington State. Our
extensive experience in these studies includes the collection and analysis of primary data along
with secondary data to help communities and counties in the region better prepare for potential
hazardous materials risks.
Hazardous materials flow studies help inform emergency plans for the procurement and
staging of appropriate supplies and equipment, and assist in the development and provision of
more focused training for emergency responders. In addition, hazardous materials flow studies
are a prerequisite and important step in successfully applying for some types of grants, and
support additional risk assessments and emergency planning projects.
The contract with DGSS included primary and secondary data collection and analysis.
Primary data collection began in the summer of 2016 by a team of field researchers recruited by
DGSS. This team consisted of two supervising professors, five graduate students and six
undergraduate students trained in documenting hazardous materials classification and transport.
The team conducted observations at five sites on eight days spread over three weeks in and
around the City of Spokane. Secondary source data was gathered by the Greater Spokane

3
Emergency Management and DGSS to assess potential hazardous materials presented by other
activities within the county, including railroad lines, airports, and businesses. The goal of this
study was to obtain threshold determinations of the types and amounts of hazardous materials in
transit throughout Spokane County and the City of Spokane. These determinations, while based
on limited observations, will be useful to inform planning and preparation for “all hazards”
events throughout Spokane County.
Data collection and analysis findings indicate several opportunities for the city and
county to plan for, prepare for, and address the mitigation of potential risks to the residents of
Spokane County. These risks include:
Proximity of Interstate 90, railroads and pipelines to the population centers of Spokane
County and the City of Spokane (city population is approximately 210,000; county
population is approximately 475,000), and to the surrounding recreational, commercial,
and agricultural areas, as well as the Spokane River.
Many retail businesses located within Spokane County communities regularly stock a
variety of chemicals and substances which would qualify for reporting except that the
quantities of potentially hazardous materials are below mandatory reporting levels.
These stores require regular re-supply by truck (in the case of Walmart, often between 2
and 5 trucks per day). Each such truck may carry an un-quantified number of hazardous
substances, or substances that might be hazardous if combined, all below placarding
levels. For example, a walk-through assessment of a typical big-box store yields a
staggering variety of kitchen, auto, household, garden and maintenance chemicals and
substances including insecticides, caustic cleansers and volatile compounds.
Significant quantities of jet fuel delivered, stored, and distributed to local airports via
truck and/or pipeline. The Spokane International Airport (GEG) maintains its own fuel
tank farm and distribution system.
Significant quantities of hazardous materials transported through Spokane County by
Union Pacific and BNSF Railroads.
4
The geography and demography of the county complicate these potential risks. The City
of Spokane is the second largest city in the State of Washington and is an anchor for the
Spokane-Coeur d’Alene (Idaho) Corridor. Spokane County and surrounding areas comprise a
Metropolitan Statistical Area with a total population of just under 700,000 (Office of
Management and Budget 2012). Interstate 90 connects Spokane to Coeur d’Alene; it is the
primary east-west highway in the State of Washington and is a main through-route for
commercial truck traffic in the northern United States, with endpoints in Boston and Seattle. US
Highway 2 also runs east/west. Major north-south highways include US 195 and 395. While all
of these highways are part of the National Highway System, (highways considered crucial to the
nation’s economy, defense and mobility), traffic on Highways 195 and 395 is often congested.
The northern terminus of Highway 195 is at I90, just west of downtown Spokane. Highway 395
runs from Mexico to Canada, but several miles of Highway 395 run concurrently with Division
Street in the City of Spokane, a heavily congested thoroughfare. The Washington State
Department of Transportation, the City of Spokane, and Spokane County have plans to create a
North Spokane Corridor, but presently completion of the construction is not expected until 2027.
Geographically the county has a number of small lakes and rivers, farmland and
mountains spread across nearly 1800 square miles. The Spokane River flows from east to west,
through the heart of the City of Spokane; Spokane (River) Falls are a distinct part of the city’s
downtown area. In addition, Spokane County’s economy is diverse and includes strong
agricultural and natural resource-based segments, along with technology and some
manufacturing industry.
The more densely populated area of the City of Spokane (about 267 people/square mile),
with its congested traffic, and the diverse landscape could potentially delay both offensive and
defensive responses to a hazardous materials incident. In addition to the risks presented directly
to the people living and visiting in this area, significant economic and environmental losses
could result even from a small incident.
There are two airports of significant size located within the County. One is the Spokane
International Airport, a small international hub, and the other is Fairchild Air Force Base, home
of the 92d Air Refueling Wing. One of Fairchild Air Force Base’s primary functions is to refuel
5
air force assets in air, which indicates a likelihood of significantly larger amounts of fuel passing
through the county than would be expected for an air base. Spokane International Airport is
located about 5 miles west of the City of Spokane, north of Interstate 90. Fairchild AFB is a little
further west from Spokane International Airport, and is also north of I-90. A third entity -- Felts
Field -- is a small airstrip located just east of downtown Spokane along the Spokane River.
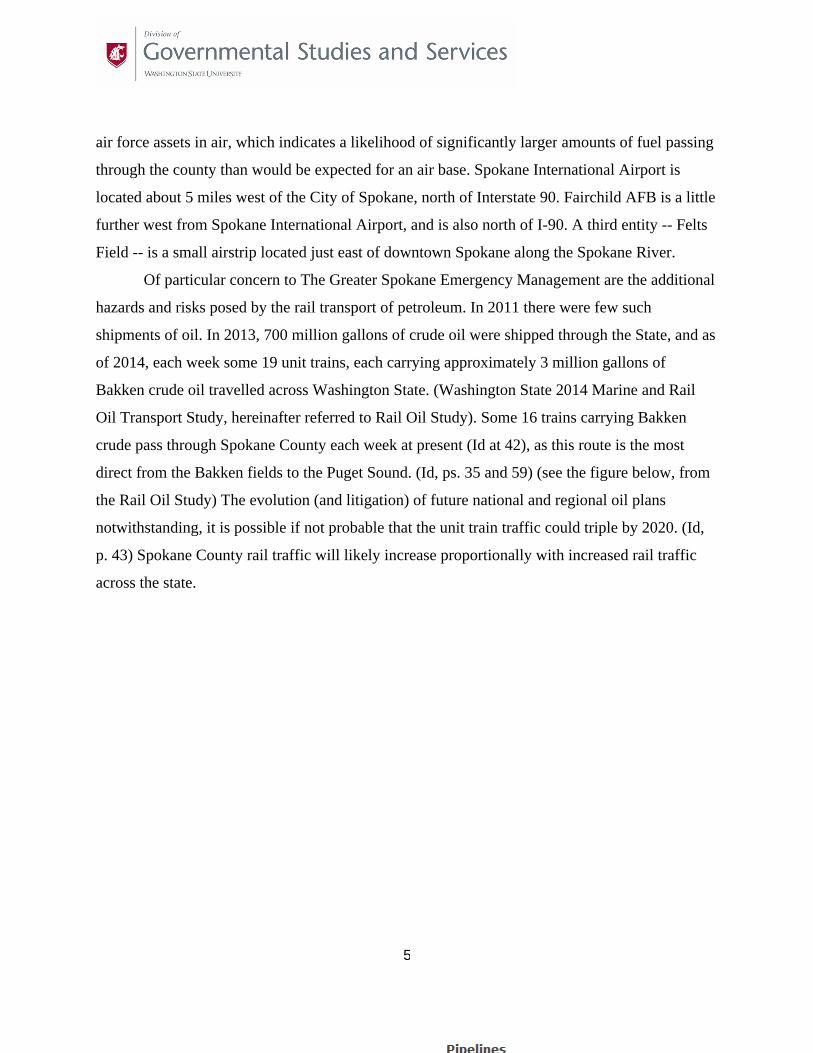
Of particular concern to The Greater Spokane Emergency Management are the additional
hazards and risks posed by the rail transport of petroleum. In 2011 there were few such
shipments of oil. In 2013, 700 million gallons of crude oil were shipped through the State, and as
of 2014, each week some 19 unit trains, each carrying approximately 3 million gallons of
Bakken crude oil travelled across Washington State. (Washington State 2014 Marine and Rail
Oil Transport Study, hereinafter referred to Rail Oil Study). Some 16 trains carrying Bakken
crude pass through Spokane County each week at present (Id at 42), as this route is the most
direct from the Bakken fields to the Puget Sound. (Id, ps. 35 and 59) (see the figure below, from
the Rail Oil Study) The evolution (and litigation) of future national and regional oil plans
notwithstanding, it is possible if not probable that the unit train traffic could triple by 2020. (Id,
p. 43) Spokane County rail traffic will likely increase proportionally with increased rail traffic
across the state.

6
Hazardous liquid and high pressure-natural gas pipelines also exist within the County but
generally run east-west, in places close to the Interstate and the Spokane River. (See the map
below, from the Washington Utilities and Transportation Commission).There is a significant
pipeline that runs from Pasco (south-central Washington) to Spokane County.
In the following sections, this report describes the study design, data collection and
analysis efforts, and provides a summary of the data collected. It also sets forth some of the
hazards and risks that Greater Spokane Emergency Management officials can anticipate. The
report includes some implications for future policy formulation, preparedness, planning,
mitigation, training and exercise activities derived from this data collection and analysis process.

7
THIS PAGE INTENTIONALLY LEFT BLANK INTRODUCTION

8
Spokane County covers 1,781 square miles in eastern Washington State and shares a
border with the State of Idaho.
Interstate 90 stretches from the Pacific Ocean to the Atlantic across the northern United
States; it is the main east-west highway in Washington State and passes through the center of
Spokane County and through the City of Spokane. Interstate 90 is the main route for east/west
hazardous materials transportation by truck through Washington State, north Idaho and east-west
through the State of Montana. It is a primary funnel for crude oil and coal from Montana,
Wyoming and North Dakota (Bakken crude) on its way to export from western Washington
ports. There are a number of lesser state highways dissecting Spokane County; however, most of
the potential risk for exposure to a hazardous material incident is centered on Interstate 90 and
nearby rail lines, given the far greater amount of hazardous materials truck traffic on the
Interstate as compared to observations from all other highway sites combined.
The residents of Spokane County face a number of potential risks, most of them
stemming from the fact that about half of the county’s population is located within a densely
populated area comprised primarily of the City of Spokane, with a high potential for exposure to
hazardous materials being transported or stored within or near city borders. Some of the more
significant potential risks include:
Interstate 90. Primary land route coast to coast for east-west transportation through
the State of Washington to and from Seattle, Tacoma and other western Washington
communities.
Pipelines and railroad lines passing in or near the center of the City of Spokane and
Spokane County, and the proximity of multiple sources of hazardous materials
transportation to the Spokane River.
The hazardous materials contained within manufacturing and production businesses
and retail stores.
The storage and transportation of propane across the county.
The potential for vehicles carrying hazardous materials to stop for either a short or a
prolonged period at any number of truck stops in the county.

9
An accident involving any of the above-mentioned points could have significant negative
impact on the residents of Spokane County. This could potentially involve significant property
damage as well as adverse effects on the health and economic well-being of county residents and
businesses. Depending upon the location or magnitude of the incident, residents of nearby cities
and counties could also be impacted. These hazards exist not only locally, but also for those
residents of communities and environments far downstream.
Hazardous materials incidents are a serious cause for concern. On June 3, 2016, the
failure of a spike on a Union Pacific rail line caused the derailment of an oil train along the
Columbia River. Oil leaked into the Columbia, and multiple oil tank cars caught fire. Other rail
incidents have involved derailments with catastrophic results to towns and villages: on February
2015 an oil train derailed and burned in West Virginia, and possibly the worst oil train disaster
killed 47 people in Canada in July 2013. In December of 2013, a grain train derailed outside of
Casselton, North Dakota, west of Fargo; this derailment caused several petroleum cars to derail
when an oil train hit the grain train.
Other modes of transport are not immune from incident: Pipeline failures resulted in
leaks of hazardous materials into the Pacific Ocean at Santa Barbara in May 2015 and into the
Yellowstone River in January of the same year. Whether causation of these incidents is human
error, poor or faulty maintenance, materials failure or blind chance, the incidents could happen
anywhere.
At the State level, the Rail Oil Study recommends planning for emergency spill and
response, and it calls for “investments in the development and delivery of specialized training,
and the purchase or sharing of equipment” (p. 109 – 111). The National Transportation Safety
Board has stated that, “carriers have effectively placed the burden of remediating the environmental
consequences of an accident on local communities along their routes”. (Department of Transportation,
Pipeline and Hazardous Materials Safety Administration, Notice of Proposed Rulemaking, accessed on
10/10 /2016 at
http://www.phmsa.dot.gov/staticfiles/PHMSA/DownloadableFiles/Files/HM_251B_OSRP_NPRM_adva
nced_copy.pdf)

10
Local Emergency Planning Committees (LEPCs) are responsible for local emergency
planning under the Emergency Planning and Community Right-to-Know Act (EPCRA) (Bierling
et al (2011). LEPCs develop emergency response plans to be activated in the event of a
hazardous materials incident, specifically including incidents occurring from rail transport of
petroleum. This is a Federally mandated, continuing planning obligation under EPCRA; such
planning from LEPCs, Emergency Management offices and first responder agencies across the
State to address the oil train hazard is critical for the safety of our communities and resources.
The present report provides critical information to The Greater Spokane Emergency
Management and the Spokane County LEPC in terms of application to planning and preparation
for, the mitigation of, response to and recovery from any such incident. Informed planning will
involve a more refined focus for procuring the appropriate equipment for the risks presented,
staging of that equipment, and providing appropriate training for the responders to such an event.
Informed preparation for particular hazardous material events will save precious time in
responding to any particular event, thereby making the residents and visitors in Spokane County
safer.
OBJECTIVES AND METHODOLOGY
The U.S. Department of Transportation (DOT) publishes a guide for conducting
Hazardous Materials Flow Surveys that suggests three critical elements (location, timing and
types of observations) in designing and implementing a study. The DOT guidelines are detailed
and elaborate – calling for studies extensive in their scope and therefore very time consuming
and expensive. Furthermore, DOT guidelines call for the replication of these studies over time.
While following the DOT guidelines might be the recommended alternative, for most
counties or agencies in need of the information gained in a flow study, the cost of this kind of
research is prohibitive. Washington State University modified the DOT guidelines to be more
cost effective and responsive to the needs of entities such as Spokane County, while still
maintaining the integrity of the data collection process.
As was the case with the field observations performed in or around the county for this
study, the first objective of any hazardous materials commodity flow assessment is to identify
the sample space within which field researchers are to work. The purpose of establishing a

11
sample space is to draw an adequate number of quality observations that will accurately
represent the total population of events being studied. From the observations in this sample
space, then, conclusions can be drawn which apply more broadly to the immediate and
surrounding areas.
The U.S. DOT suggests that, in order to narrow the scope of the study, roads that are
accessible for hazardous materials transportation should be identified first. This can be done
quickly by examining maps of the area and atlases produced for the trucking industry, and
consulting with individuals who are familiar with the area. A number of reports are available to
aid in this process, such as the Highway Performance Monitoring System (HPMS), the
Commodity Transportation Survey (CTS) and the Hazardous Materials Incident Reporting
Systems (HMIRS).
A second theoretical dimension of data collection pertains to the location of observations.
DOT advises researchers to collect data where it will be minimally disruptive to trucking
companies and drivers. They suggest that ports of entry and weigh station sites might be the
least disruptive locations for data collection, but warn that data collected in this manner might
reflect primarily interstate transportation, thus missing important intrastate shipments. In
general, the DOT recommends that survey teams should set up observations wherever the
appropriate combinations of the following are present:
High truck volumes.
Good visibility along the highway, in the event traffic volume is such that it is difficult if not impossible to accurately record shipping data. In this case, placards could still be read and noted.
Absence of legal restrictions on survey activity.
Safety of the observers and traffic.
In this case, Interstate 90 was quickly identified as a primary focus for Spokane County;
secondary routes included US Highways 2, 195 and 395.
Recommendations from the DOT are meant for state-wide commodity flow studies, and as
such, were tailored substantially for use in observation planning for Spokane County in order to
include local commodity traffic in addition to traffic passing through. Observations for Spokane
County were collected at six (6) sites around the county, including:

12
Location 1: Interstate 90 at the intersection with US 195. This site was used for orientation and training, although data was collected for this report. Observers were present at this site only on day 1.
Location 2: Interstate 90, at exit 272, west of the City of Spokane. Primary focus at this site was on truck traffic inbound to the City of Spokane, although observers were asked to record traffic outbound, if possible.
Location 3: Interstate 90 near the Spokane Valley Mall east of the City of Spokane. Primary focus at this site was on truck traffic inbound to the City of Spokane, although observers were asked to record traffic outbound, if possible.
Location 4: US highway 395, 12219 Division Street, Washington State Patrol North Office, Spokane, WA. Observers were asked to record traffic proceeding in both directions. During the first day of observation, it was apparent that many commercial trucks were using Hastings Road, which connects 395 to Highway 2 to the east as a bypass. Trucks were proceeding both east and west on Hastings, generally turning onto or off of 395; observers were asked to record observations for traffic on both Highway 395 and Hastings, in all directions for the duration of the field work. Directions for turning trucks were categorized by their direction of travel after the turn.
Location 5: US Highway 2, at 3812 E. Highland Road in Mead, WA. Observers were asked to record traffic proceeding in both directions.
Location 6: US Highway 195, 4017 Cheney-Spokane Road, Spokane, WA. Observerswere asked to record traffic proceeding in both directions. Highway 195 originates at Lewiston, Idaho and branches north northwest from US Highway 95 (a major, national north/south highway through the agricultural Palouse. It ends at its junction with Interstate 90 just west of the downtown area of the City of Spokane.
Closely linked to the location of observations is the question of the timing of
observations. A thorough study must be able to account for seasonal and daily changes in
commercial transportation flows. In periodic national commodity flow studies according to the
DOT, data collection should occur on the 5th, 18th, 31st and 44th weeks of any survey year. At the
proposed sites, the researcher should observe for three hour shifts at three different times during
a 24-hour period (one morning shift, one late afternoon shift and one evening shift). An
adaptation of this multi-shift approach was applied in this study which allows the estimation of
the daily flows, but does not specifically account for differences in seasonal flows of traffic

13
containing hazardous materials through the sites indicated above. Given budget constraints,
observations were conducted during the summer in order to maximize the validity and utility of
the data collected under this reduced-cost approach to hazardous materials flow study.
Observations were conducted on 8 days over the course of three weeks (onsite orientation
for about 2.5 hours on May 17; 7 more days of observations from May 19 through June 4). The 7
days included each day of the week. Observation times were generally 2 hours in length, 3
times/day, from 9 – 11, 12 – 2 and 3 – 5. Observations on two days (Tuesday and Wednesday,
5/31 and 6/4) began at 7 a.m. in order to insure the inclusion of early morning truck data.
Observations generally were that traffic peaked on both I-90 sites at about 4:30 p.m., but
significantly earlier at other sites. Traffic seemed to be steady at all sites on weekday mornings.
Two observers were always stationed at both Interstate 90 and the Highway 195 sites; on several
days only one observer was stationed at the 395 and Highway 2 sites. While two observers were
preferred for safety reasons at all sites, generally one observer was sufficient to cover
observations at the Highway 395 and Highway 2 locations. Field staff at these locations
observed far less truck traffic than those at either of the Interstate 90 or the Highway 195 sites.
The third conceptual question in designing methodology for data collection concerns the
types of observations that make up the data to be processed. At each of the observation sites,
field researchers recorded all commercial truck traffic on these routes, the number of displayed
placards, placard class, material ID number, carrier (if possible), and vehicle types. From this
data, estimates are determined as to the percentage of hazardous material traffic in comparison to
overall commercial traffic, and classes and types of hazardous materials flowing through
Spokane County.
In previous commodity flow studies observers sought, but encountered difficulty in their
efforts to collect data from particularly high volume retail vendors. But, because high volume
retailers receive hazardous materials several times per day on trucks that are not placarded due to
contents not meeting threshold placarding requirements, the potential for significant volumes of
hazardous materials to be transported into the county without being noticed exists. To confirm
that this is the case in Spokane County, observers did a walk-through visual assessment of
potentially hazardous materials located on the shelves in of big box stores. Their inventory in

14
fact regularly contains materials (lawn, pool, automotive, household cleaning chemicals) that
alone or in combination would be hazardous if spilled.
Other limitations of the study include the late evening and nighttime observations, which
were limited due to concerns for the observers’ safety, and concerns for being in dark areas on
the roadside at night, which could inhibit their ability to accurately capture the character of
nighttime transport of potentially hazardous materials.
In addition to the primary data collection consisting of field research through roadside
observation of commercial traffic in Spokane County, this study employed and tested a novel
approach for such observations: Aerial photography. While this approach was limited somewhat
by expense (this test did not involve additional expense to Spokane County) and weather, it is
apparent that photographic technology has improved sufficiently that air- or ground based
photography is a viable option for capture of observations. Photography efforts were successful
when airborne; given the inclement weather during the observation period, photographic efforts
were also deployed via automobiles. From the observation perspective, this technique merits
further development.
Hazardous Materials
The hazardous materials which are the subject of this study are those which are both
identified and subject to placarding rules by Federal and State laws. They include the following
categories:
A more thorough description of these classifications and the placarding requirements can
be found in the U.S. DOT’s 2016 Emergency Response Guidebook.

15
1 This location was only used on training/orientation day to monitor truck traffic, and does not reflect proportion of traffic at this point over a 5-day period.
DATA ANALYSIS
The largest portion of the various forms of data collected in this process of systematic
observation and research represent the hazardous material commodity flow for road vehicle
transport through Spokane County. Data were entered into data sets using SPSS (Statistical
Package for the Social Sciences) and Excel Spreadsheets so that descriptive analyses could be
conducted. Both narrative discussion and tabular/graphic representations of these data and the
implications from data analysis are set forth in the body of this report, below.
Vehicle Hazardous Materials Study
Roads in Spokane County vary from small
roads to heavily traveled U.S. Highways. Major routes
through the county include Interstate 90 and U.S.
Highway 2, the active east-west routes; and U.S.
Highways 195 and 395 which run north-south. From
the total number of observations collected over the
research period, 2.5 percent of placarded vehicles (18)
were observed at the intersection of SR 195 and I-90 (orientation/training day)1, 33.8% percent
of placarded vehicles (241) were observed on I-90 at Exit 272, 37.6 percent of placarded vehicles
(268) were observed on I-90 at Exit 291A (Spokane Valley Mall), 3.6 percent of placarded
vehicles (26) were observed on State Route 395 (State Patrol Office), 7 percent of placarded
vehicles (50) were observed on Highway 2 (next to Chevron), and 15.4 percent of placarded
vehicles (110) were observed on Highway 195. The majority of placarded vehicles observed at
each of these locations were carrying flammable liquids (and combustible liquids), usually
petroleum. Additionally, the majority of the locations have a high percentage of freights,
flatbeds, and dump trucks passing daily.
Over the research period, WSU personnel documented a total of 713 placarded trucks
from a total of 20,038 trucks in transit observed at locations #1, 2, 3, 4, 5, and 6. Numbers and

16
types observed at each location are set out in the tables which follow in the appendices. Of the
713 vehicles, 321 displayed Class 2 placards (Flammable Liquids), 61 carried Class 2 placards
(Gases), 24 carried Class 8 (corrosive materials) and few carried other placards (Oxidizers and
Organic Peroxides, Miscellaneous Dangerous Goods, and Toxic Materials and Infections
Substances). Additionally, 14 vehicles were displaying two or three placards. Of the vehicles
displaying two placards (14), 7 carried Class 3 (Gases), and 4 carried Class 2 (Flammable
Liquids). Of the vehicles with three placards (16), 14 were carrying Class 2 (Flammable
Liquids).
The two locations on I90 (Exit 272 and 291A) accounted for the majority of hazardous
materials being transported daily, such as Flammable Liquids and Combustible Liquids (183),
Gases (35), and Corrosive Materials (16). I-90 at Exit 272 also had the highest number of
vehicles displaying two or more placards. Seven vehicles displayed a second placard with Gases
being the most often identified (2). Lastly, 15 were carrying a third placard, and the majority of
these (13) were carrying Flammable Liquids (and Combustible Liquids). Overall, the data
indicate higher traffic flows in the afternoon (after 12pm), and a higher amount of hazardous
materials transported at this time. A majority of locations, excluding location 1 (because of the
limited time spent there), experienced higher traffic flows in the afternoons, particularly Monday
and Friday afternoons. However, there are differences based on location. Location 2 (I-90 at
Exit 272) experienced heavier traffic flows on Monday and Thursday afternoon, Location 3 (I-90
at Exit 291A) had heavier traffic flows on Wednesday morning and Friday afternoon, Location 4
(Highway 395) had heavier traffic flows on Thursday and Friday afternoon, Location 5
(Highway 2) had higher flows on Wednesday morning and Friday afternoon, and Location 6
(Highway 195) experienced heavier traffic flows on Monday and Wednesday afternoon. A more
in-depth look at the data can be found in the appendices.
One aspect bears further brief comment. On the first full day of observations, our field
researcher on Highway 395 noted truck traffic on Hastings Road, a cross street to 395 which
connects with Highway 2, to the east. This researcher observed several trucks turning off 395
onto Hastings (in both directions). This truck traffic seemed to peak early in the afternoon,
especially for all truck traffic west of 395 on Hastings, regardless of direction of travel.
17
Furthermore, very few if any of the trucks were placarded. This could be due to the presence of
Mead High School about 3 blocks west of the Hastings/395 intersection. Unfortunately
observations provided too little data for more robust analysis.
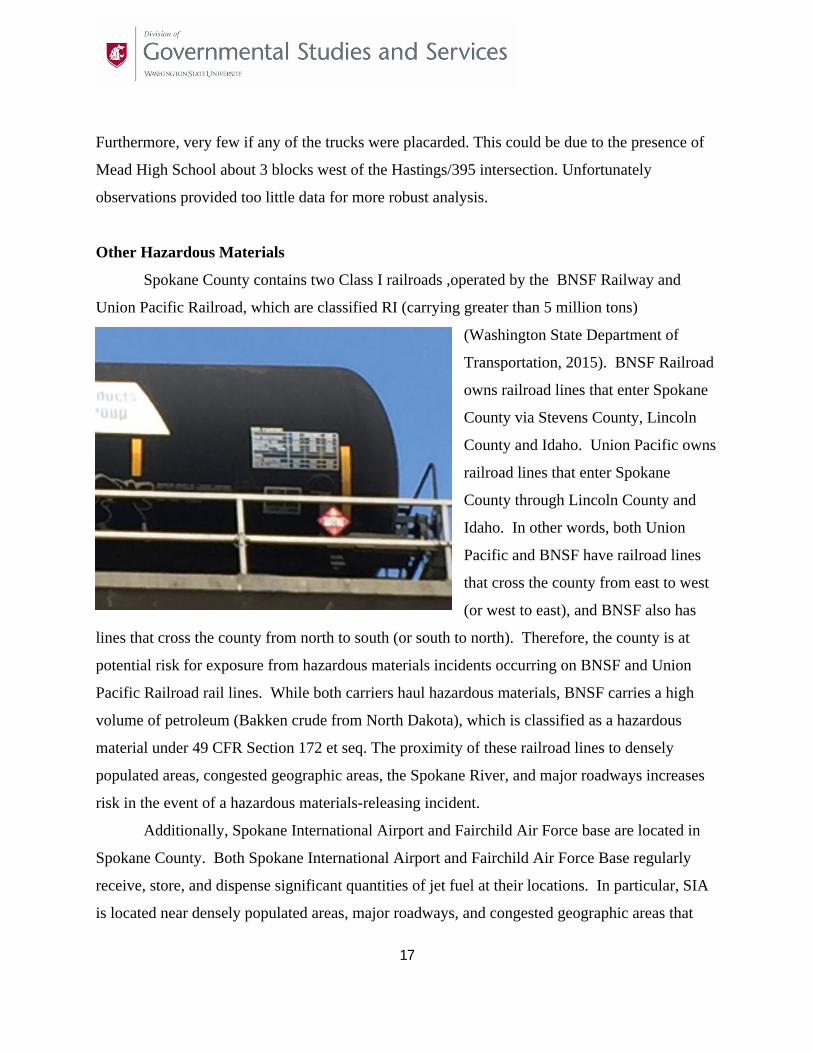
Other Hazardous Materials
Spokane County contains two Class I railroads ,operated by the BNSF Railway and
Union Pacific Railroad, which are classified RI (carrying greater than 5 million tons)
(Washington State Department of
Transportation, 2015). BNSF Railroad
owns railroad lines that enter Spokane
County via Stevens County, Lincoln
County and Idaho. Union Pacific owns
railroad lines that enter Spokane
County through Lincoln County and
Idaho. In other words, both Union
Pacific and BNSF have railroad lines
that cross the county from east to west
(or west to east), and BNSF also has
lines that cross the county from north to south (or south to north). Therefore, the county is at
potential risk for exposure from hazardous materials incidents occurring on BNSF and Union
Pacific Railroad rail lines. While both carriers haul hazardous materials, BNSF carries a high
volume of petroleum (Bakken crude from North Dakota), which is classified as a hazardous
material under 49 CFR Section 172 et seq. The proximity of these railroad lines to densely
populated areas, congested geographic areas, the Spokane River, and major roadways increases
risk in the event of a hazardous materials-releasing incident.
Additionally, Spokane International Airport and Fairchild Air Force base are located in
Spokane County. Both Spokane International Airport and Fairchild Air Force Base regularly
receive, store, and dispense significant quantities of jet fuel at their locations. In particular, SIA
is located near densely populated areas, major roadways, and congested geographic areas that

18
may hinder defensive response in the event of a hazardous materials incident. An SIA
spokesman, interviewed for a different DGSS project, reported that on an annual basis 15 – 20
million gallons of jet fuel are consumed at SIA.
There are also several pipelines within Spokane County. The Washington Utilities and
Transportation Commission (UTC) provides information on hazardous liquid pipelines and high-
pressure natural gas pipelines within the State of Washington. According to Washington UTC,
six hazardous liquid pipelines and high-pressure natural gas pipelines are located within Spokane
County. Most of these pipelines run east/west and closely parallel I-90 (Avista Utilities
Corporation pipeline, Northwest Pipeline LLC, Phillips 66 Pipeline LLC, and Tesoro Logistics
Northwest Pipeline LLC), while Gas Transmission Northwest LLC and Avista have pipelines
that travel north/south through the county. At least one pipeline crosses the Spokane River.
Given the nature of the pipelines as carriers of hazardous liquids and high-pressure natural gas
products, their location near I-90 and along the Spokane River, and the east/west rail lines,
associated risks with the pipelines are likely consistent with that of the rail cars with petroleum
based cargo.
Aerial Observations
The DGSS team also had the opportunity to use aerial photographic observations of
traffic in Spokane County. Certainly such an approach is weather dependent, at present, and
more observations are needed for robust statistical analysis and enhanced level of confidence in
the conclusions. Nonetheless, this approach to examining traffic flow is novel and presents an
opportunity for expanded analysis in future hazardous material commodity flow studies. Basic
aerial observations and analysis follow.
Methods
In order to conduct aerial observations, truck traffic inbound to Spokane on Interstate 90
between mile post 222 and mile post 259 northeast of Ritzville, WA was photographed from a
fixed wing aircraft between the hours 11:30 pm and 12:00 pm on June 1, 2016. A total of 88
semi-trailer trucks were counted and photographed traveling the inbound lanes. Only one of the

19
trucks (Figure 1) photographed displayed a DOT hazardous materials placard. Placard number
1203 (gasoline) was displayed on both the tanker truck and trailer (Figure 2).
Figure 1. Placarded semi-trailer truck at MP 236 at 11:47 pm PDT (NWAS image 8291).
Figure 2. Placarded semi-trailer truck at MP 236 at 11:47 pm PDT (NWAS image 8291) Enlarged.

20
The aerial survey was performed with a Cessna 182 fixed wing aircraft operated by
Northwest Aerial Systems, PLLC. The aircraft was flown offset from the highway at an altitude
of about 1000 feet above ground level at an air speed of approximately 100 miles per hour in a
direction opposite to the traffic inbound to Spokane. The photographer captured digital still
images of truck traffic in both lanes with a gyro-stabilized Canon 5d Mark III camera equipped
with a 400 mm Canon telephoto lens. Geographic positions of the images were recorded at the
time of capture with an external GPS device tethered to the camera. The digital images were
recorded in RAW format and converted to jpeg images with Adobe Light Room software after
the flight. Sharpness and clarity of the RAW images were adjusted in the conversion to jpeg.
Geographic positions of the truck images were processed with geographical information system
software, aligned to the highway, and converted to Google Earth KMZ format (Figure 3). None
of the outbound trucks display hazardous materials placards.
Analysis
The truck images were acquired during a 22-minute interval along the 37-mile segment
of I-90. Assuming average speeds of the truck traffic and aircraft of 70 mph and 100 mph, the
effective sampling velocity is 170 mph. At this relative velocity, 62 moving vehicle miles were
sampled in 0.37 hours. Since there are 88 trucks in 62 moving vehicle miles, at 70 mph the
hourly inbound truck traffic relative to a fixed point on the highway is estimated as:
ADTtrucks = 88 trucks62 miles × 70 mileshr×24 hrday=2384 trucksday
Since 1 truck in 88 trucks was placarded as transporting hazardous materials, the apparent
hazardous material transport rate is estimated to be:
ADThazmat= 188 2384=27 trucksday
For comparison, traffic counts on I-90 by the Washington State Department of
Transportation in 2014 near mile post 222 indicate a total ADT of 17,000, of which 23.5 percent

21
is truck traffic traveling both ways. From this data, the truck traffic inbound to Spokane can be
estimated,
ADTtrucks= 17,000 vehicles day ×0.235 trucksvehicles ×12 directions =1998 trucks inboundday
For a short duration sample, the truck traffic rate as estimated by the aerial survey method
(approximately 2400 trucks per day) is not substantially different from the average daily truck
traffic rate measured by WSDOT (approximately 2000 trucks per day) on this segment of I-90.
Therefore, it is reasonable to estimate that the rate of trucks transporting hazardous materials into
Spokane on I-90 is about 30 trucks per day.
Limitations
While the aerial survey methodology is valid and provides interesting information, strong
statistical conclusions cannot be made because of the limited amount of data on a single short
duration sample.
SUMMARY OF OBSERVATIONS
At all locations, DGSS researchers examined the quantity of placarded vehicles, and class
type of hazardous materials being transported. The following section presents the observations
in a series of graphs with some further discussion. Additionally, the appendices provide more
detailed information regarding hazardous materials flow at each observed location.
Motor Vehicle/Highway Study—WSU Personnel Observations
Percentage of Truck by Type
Truck Type Frequency Percent
Box (B) 2487 12.5%
Cement Truck (CT) 3271 1.4%
Dump Truck (DT) 1503 7.6%
Freight Truck (F) 10186 51.3%
22
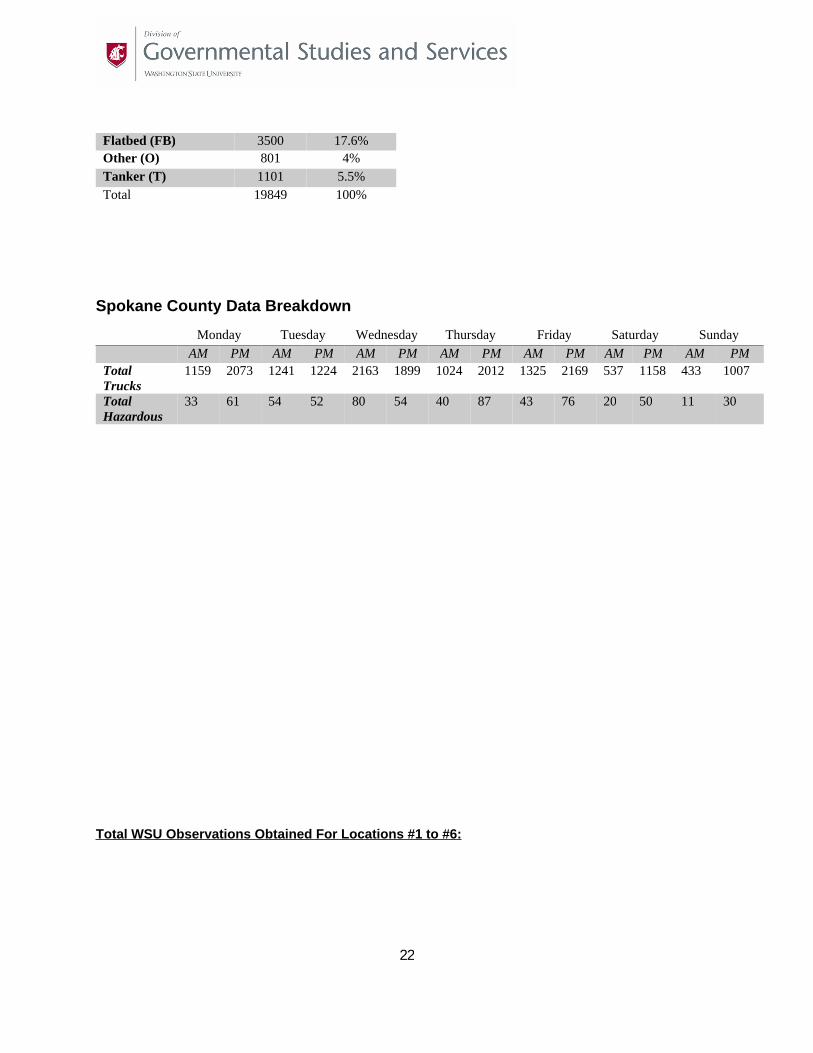
Flatbed (FB) 3500 17.6%
Other (O) 801 4%
Tanker (T) 1101 5.5%
Total 19849 100%
Spokane County Data Breakdown
Monday Tuesday Wednesday Thursday Friday Saturday Sunday
AM PM AM PM AM PM AM PM AM PM AM PM AM PM
Total Trucks
1159 2073 1241 1224 2163 1899 1024 2012 1325 2169 537 1158 433 1007
Total Hazardous
33 61 54 52 80 54 40 87 43 76 20 50 11 30
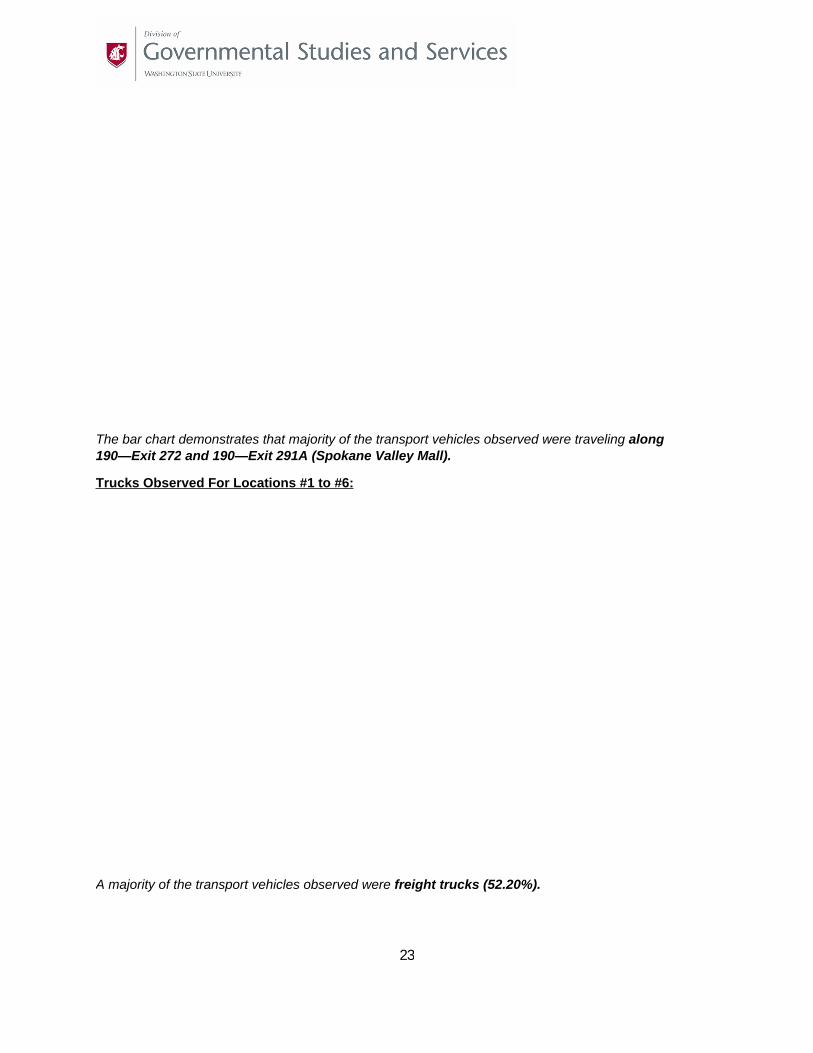
Total WSU Observations Obtained For Locations #1 to #6:
23
The bar chart demonstrates that majority of the transport vehicles observed were traveling along 190—Exit 272 and 190—Exit 291A (Spokane Valley Mall).
Trucks Observed For Locations #1 to #6:
A majority of the transport vehicles observed were freight trucks (52.20%).

24
Types of Hazardous Materials Observed, by Percent at Locations #1 to #6:

25
The bar chart reveals that most of the transport vehicles were carrying flammable liquids (and combustible liquids) for Locations #1 to #6.
Comparison with Other Eastern Washington Counties
Over the past two decades, DGSS has conducted hazardous material flow studies for a number ofcounties and Tribal jurisdictions. The following table shows the total number of commercial trucks and placarded trucks (i.e. trucks carrying hazardous materials), expressed as a percentage observed in Spokane County compared with similar observations conducted in studies for other eastern Washington counties by DGSS in the past few years. While the total number of commercial trucks and placarded trucks are much larger than in other counties, the actual percentage of placarded trucks in Spokane County is slightly less than what was observed elsewhere. Experience from more than a dozen such studies statewide indicates that the volume of hazardous materials trucks expressed as a percentage of commercial truck traffic is roughly similar across the State.
Douglas/ChelanPend Oreille Columbia Grant/Adams Spokane
TOTAL 6886 4173 1159 6280 19849
PLACARD 297 152 57 235 708
% Hazmat 4.31 3.64 4.91 3.74 3.57In a similar vein, the following chart reflects the three largest classes of hazardous material
observed for each of those eastern Washington counties (except for Douglas/Chelan, where only
two volumes are noted). This chart shows that by far the largest type of hazardous material in
transport by truck in these counties involved flammable liquids (and gasses). (Note that due to
counting methodologies in older studies these two types of materials were combined here for
each county; the combination of flammable liquids and gasses was used in this table for
consistency. While not reflected in this chart, in all of our previous studies, flammable liquid
petroleum products consistently represented the largest volumes of such material.

26
CONCLUSION AND RECOMMENDATIONS
This study provides valuable information regarding potential hazardous material risks
associated with transport in and through Spokane County. The information provided can
substantially help Greater Spokane Emergency Management and the Spokane County LEPC plan
for potential hazardous materials events within the county, and aid awareness and mitigation
strategies. Additionally, under 49 CFR Part 110 (25), LEPC’s that conduct a Hazardous
Materials Commodity Flow Study are eligible for hazmat risk assessment grant funding that is
administered through PHMSA’s Hazardous Materials Emergency Preparedness (HMEP) Grant
Program (Transportation Research Board, National Academies, 2011.p. 2). WSU researchers are
able to derive the following conclusions based on the data collected over the observation period.
First, due to Spokane County, and particularly the City of Spokane’s proximity to major
roadways and densely populated areas, the potential risks to property, the economy, the
environment, and human health in case of a hazardous materials incident are substantial. These
risks are exacerbated due to logistical difficulties presented by large, densely populated areas
which have the potential to significantly delay or complicate response to a hazardous materials
incident. While the data indicate relatively low percentage of truck traffic carrying hazardous
materials in relation to non-hazardous, significant risks exist if a hazardous materials-releasing
incident were to occur given the proximity of major roadways, business centers, and densely
populated areas. By far the largest amount of hazardous materials transport occurs on I-90 (as
observed at both exits) and Highway 195. These routes also experience the heaviest traffic flow
which exacerbates potential risks related to a hazardous materials-releasing incident. For I-90,
27
the observations indicate that the heaviest traffic flows occur Wednesday mornings and Friday
afternoons by Exit 291A, and Monday and Thursday afternoons by Exit 272. For Highway 195,
observations indicate that Thursday and Friday afternoons experience the heaviest traffic flows.
By far, Flammable Liquids and Gases (Class 2 and 3) constitute the majority of hazardous
materials transport in all locations. This information, in combination with traffic flow
information, can help the Spokane County Emergency Management with planning for hazardous
materials related incidents, despite the limitation that the observation period was limited, and
may not reflect current traffic flows at all times of the year.
Second, both Union Pacific Railroad and BNSF Railway own railroad lines within
Spokane County. These railroads, particularly BNSF, ship large quantities of hazardous
materials through the county, and the proximity of these railroad lines to densely populated areas
and major roadways presents significant risks in the occurrence of a hazardous materials-
releasing event. The trend for such transportation is upward. The Rail Oil Study showed little
rail transportation of oil through Washington prior to 2011. (Rail Oil Study at p.30) Each rail car
carries approximately 30,000 gallons of petroleum or petroleum products. Given the high
volumes involved currently, and the possible if not probable expansion of such traffic by 2020
and then 2035, the transport of petroleum and related products through Spokane County
constitutes a significant risk to its people, resources and economy.
Third, as mentioned above, Spokane County is home to the Spokane International Airport
and Fairchild Air Force Base. To perform their daily tasks, these facilities receive, store, and
dispense significant quantities of jet fuel at their locations. These locations present additional
risks to Spokane County.
Fourth, several pipelines carrying hazardous materials run through the county; most
closely parallel I-90. These pipelines present significant risks in the event of a hazardous
materials incident due to their location near and across the Spokane River.
Lastly, our past research suggests that a number of vehicles transporting hazardous
materials are not placarded due to carrying amounts that do not meet placarding threshold
28
requirements. Nonetheless, these vehicles could present an additional threat when traveling in
Spokane County.
In the context of issues relevant to Spokane County, these conclusions help inform the
discussion regarding next steps taken by The Greater Spokane Emergency Management in their
efforts to meet their goals. One critical capacity supported by a Commodity Flow Study such as
this is the ability to use information on hazardous materials observed in transit in a region to
prioritize resource allocation, training and the acquisition and staging of equipment. The process
of prioritization can be complex, but the availability of better data on type, amount and likely
location (or route) for hazardous materials provides critical intelligence to inform efforts to build
and focus capacity of local emergency management departments in terms of training for
personnel, maintenance of appropriate equipment and supplies, engagement of partners, and
establishment of geographic planning components to better address the identified risks.
Threat and hazard identification and risk assessment in the context of hazardous material
in transit relies on several common factors regardless of location. Perhaps the most important
concern is the exposure to any particular type of identified hazardous material based on its
frequency in transit vis-à-vis other materials. In DGSS’ previous Hazardous Materials studies
thus far performed (see list in appendices), the more common materials identified in transit are
flammable materials – typically flammable petroleum products (refined or un-refined). This
should not be taken as a diminution of the threats/risks posed by other substances. For instance,
the risk of exposure to some materials may be slight, but the consequences terrific: some
materials are toxic if not fatal when inhaled, while others become so when exposed to external
agents, like oxygen or water. This suggests two more variables: an evaluation of the
consequences of exposure to a particular material, and whether the release of a substance might
mix with a local agent to increase the seriousness of the consequences.
The location of a particular potential hazmat incident also is important. Clearly the risk of
pollution of the Spokane River and Spokane’s aquifer is reduced should the incident occur on I-
90 near Lincoln County, as compared to the heart of the City of Spokane. Conversely, any event
occurring in downtown Spokane will be dramatically complicated by location, transportation
29
logistics and human exposure concerns. Assessing risks associated with location involves the
consideration of what might be affected by the spill, whether there are local agents which
combined with the hazardous material might exacerbate the consequences, and possibly other
considerations. For example, should a derailment of petroleum cars occur, with resulting fire and
materials spill, on the elevated tracks through the City of Spokane, the ability of Spokane Fire
Department and other first responders to effectively respond in the urban environment could be
compromised due to lack of access. Nationally 1 gallon of oil is spilled for every 11,628 gallons
transported. (Rail Oil Study at 79). While technology and heightened awareness may be reducing
the rate of rail oil spills, due to the great increase in rail transportation the amount of oil spilled
has actually increased. Regardless, it is difficult to assess the probability of future rail oil spills
According to the Rail Oil Study, there is too little data to assess the risk of a future serious Rail
Oil incident, and we are not aware of any significant data in that regard.
Effective assessment and prioritization of risks in the context of hazardous materials will,
by definition, vary significantly between communities. Nonetheless, there are commonalities in
such endeavors. Variables such as the frequency of particular materials in transit and the
seriousness of the consequences of a given event are the primary concerns. Such an evaluation
should also consider the location of the event, which would include an assessment of the impact
of external agents present in the given location. Finally, as part of the risk assessment, Greater
Spokane Emergency Management and the LEPC should be aware of their own capacities and
limitations in terms of defining and quantifying their immediate risks.
In terms of volume, frequency, proximity to critical infrastructure and population, and
difficulty in appropriate response for a significant event, these flammable petroleum products are
the most significant risk presented by materials in transit through the Greater Spokane Area.
High volumes of oil trains containing very high numbers (100+) of tank cars containing crude oil
from the Bakken and other oil fields represent an increased risk for significant incidents, possibly
within the congested urban environments of the Greater Spokane Area. Clearly, this is a risk for
which the City of Spokane and Spokane County should plan, equip, train and exercise.

30
Greater Spokane emergency responders should anticipate and prepare for spills or other
hazardous materials which:
A) Likely will involve major highways and railways,
B) Likely will involve flammable liquids or gases,
C) May occur near business and entertainment centers;
D) Will disrupt travel and commerce, and
E) Could have significant environmental impact.
There are opportunities to address the risks identified in this study across all five phases of emergency management: Prevention, Preparedness, Mitigation, Response and Recovery:
1. Prevention:
The opportunities for direct action by emergency management authorities is limited in theprevention arena. However, there may be legal, regulatory, contractual and collaborative mechanisms that could be used by local government to reduce the risk by making incidents involving hazardous materials less likely. For instance, voluntary negotiated action or regulatory policy might be options to improve rail maintenance and operations and thereby to reduce the risk of derailments or rail accidents.
2. Preparedness and Planning
There are a number of approaches to improve preparedness for emergency management, first responders, affected stakeholders, and the community. Some of these mechanisms are strictly within the purview of agencies, and some involve engaging the community in efforts to increase capacity to respond to incidents involving hazardous materials. These efforts fall into several broad categories:
a. Equipment and Supplies;Containing spills, combating fires involving such substances, and cleanup of hazardous waste releases all require specialized equipment, especially if the events threaten to impact sensitive areas (e.g. the Spokane River), high populationconcentrations, or critical infrastructure. Given the high volume of petroleum products flowing through Spokane County, it would behoove officials to assure that appropriate equipment and levels of supplies to deal with events involving petroleum products are available within the County, and within reasonable proximity to areas of greatest risk (such as downtown Spokane and the UniversityDistrict).
b. Public Awareness

31
Some level of preparedness, including individual, household, and business, can beachieved through a focused process of messaging to build public awareness. The annual Great Shakeout has built awareness of earthquake risk and appropriate preparedness activities. A local, similar approach might be considered to build awareness, and foster preparedness activities, among the affected populations.
c. Engaging PartnersNot all capacity, and not all resources, reside with government agencies. Business (such as the railroads), non-governmental organizations, non-profits, volunteer and service organizations (e.g. the Lions or Elks clubs), neighborhood associations (COPS and SCOPE in the Spokane area are great examples), public education, and resident groups are all potential sources of capacity to address the risks posed by hazardous materials. Outreach to any and all of these should be considered and enhanced so that they are available “force multipliers” in the eventof an incident.
3. Mitigation
Mitigation involves activities such as planning, zoning, design and construction which work to reduce the impact from possible serious incidents. Adding terrain features to protect sensitive watercourses from a large hazardous materials release would be but one example of mitigation activity. The Threat and Hazard Identification and Risk Assessment (THIRA. See https://www.fema.gov/threat-and-hazard-identification-and-risk-assessment) process provides a basis for assessing particular risk and development ofstrategies to mitigate those threats/risks.
4. Response
a. Training and ExercisesSpecialized equipment, supplies and techniques are not particularly effective unless responder personnel are trained and capable in their use. A robust, recurring training and exercise schedule for first responders focusing on the primary identified risks, especially oil transport by rail, should be a part of Countypreparedness activities. In addition to training and exercises for “professional” responders, attention should be given to training of volunteers, engaging the non-profit, non-governmental, faith-based, and volunteer organizations, to fostering resident preparedness through programs such as the Community Emergency Response Team (CERT) program.
b. Mutual Aid, Contracts and CoordinationJust as residents, NGOs and other stakeholder groups might be seen as response capacity augmenters, response capacity and the ability to effectively respond to incidents may be enhanced through cross- or multi-jurisdictional mutual aid
32
agreements, through contingency contracts for supplies, equipment,, manpower and expertise, and through coordination both horizontally and vertically with other response entities to insure that response to actual events is timely, efficient, effective and sufficient to deal with the event appropriately to limit impact on life and safety.
5. Recovery
There is a high likelihood that any significant hazardous material emergency or disaster will carry with it the need to be concerned about continuity of operations and recovery: for government, the private sector and residents. Building capacity for recovery by building relationships and partnerships, through planning, and by attention to recovery in all preceding phases of recovery is a necessity.
Questions about this report, the underlying study, or any observations, findings or recommendations herein may be directed to the study authors.
Works Cited
David H. Bierling et al. Hazardous Materials Cooperative Research Project Report 3 Guidebook for
conducting local hazardous materials commodity flow studies. Transportation Research Board
(2011)
Dr. Dagmar Schmidt Etkin et al. Washington State 2014 Marine and Rail Oil Transport Study (2015)
Retrieved September 21, 2016 from:
https://fortress.wa.gov/ecy/publications/documents/1508010.pdf

33
Freight Rail. (n.d.). Retrieved July 1, 2016, from Washington State Department of Transportation:
http://www.wsdot.wa.gov/Freight/Rail/
Washington State Economic Rail Cooridors. (2015). Retrieved from Washington State Department of
Transportation: http://www.wsdot.wa.gov/NR/rdonlyres/DE5CAED4-0E62-45F9-9397-
CFE7ADE1A6F3/0/2015FreightRailCorridorsinWA.pdf
Washington State Utilities and Transportation Department. Retrieved 10/6/2016 from
https://wutc.maps.arcgis.com/home/webmap/viewer.html?webmap=9e3622d269d341d787e8bb010c4
00916
APPENDIX A: Hazardous Material Classification
Total Observed
Placard Type
Identification Number
Possible Hazardous Materials
18 #3 1075 Gases- Flammable (including Refrigerated Liquids)Butane, Butane mixture, Butylene, Isobutane, Isobutane mixture, Isobutylene, Liquefied petroleum gas, LPG, Petroleum gases, liquefied, Propane, Propane mixture, Propylene
193 #3 1203 Flammable Liquids (and Combustible Liquids): Gasohol, Gasoline, Motor Spirit, Petrol
3 #1 1863 Flammable Liquids (Non-Polar/Water-Immiscible): Fuel, aviation, turbine engine
34
1 #1 1903 Substances- Toxic and/or Corrosive (Combustible):Disinfectant, liquid, corrosive, n.o.s., Disinfectants, corrosive,liquid, n.o.s.
10 #3 1993 Flammable Liquids (Non-Polar/Water-Immiscible):Combustible liquid, n.o.s, Compound, cleaning liquid (flammable), tree or weed killing, liquid (flammable) Diesel fluid, flammable liquid, n.o.s, Fuel oil, Medicines, flammable,liquids, Refrigerating machines
1 #1 1830 Substances- Water-Reactive- Corrosive: Sulfuric acid, Sulfuric acid, with more than 51% acid, Sulphuric acid, Sulphuric acid, with more than 51% acid
1 #1 3264 Substances- Toxic and/or Corrosive (Combustible): Corrosiveliquid, acidic, inorganic, n.o.s.
1 #1 2187 Gases- Inert (Including Refrigerated Liquids): Carbon dioxide, refrigerated liquid
5 #1 1951 Gases-Inert (Including Refrigerated Liquids): Argon, refrigerated liquid (cryogenic liquid)
1 #1 1073 Gases- Oxidizing (Including Refrigerated Liquids): Oxygen, refrigerated liquid (cryogenic liquid)
4 #1 2203 Gases- Flammable (Unstable): Silane, Silane compressed
1 #1 1230 Flammable Liquids- Toxic: Methanol, Methyl alcohol
1 #1 1863 Flammable Liquids (Non-Polar/Water-Immiscible): Fuel, aviation, turbine engine
3 #1 2426 Oxidizers: Ammonium nitrate, liquid (hot concentrated solution)
1 #1 1281 Flammable Liquids (Non-Polar/Water-Immiscible): Propyl formats
1 #1 1824 Substances- Toxic and/or Corrosive (Non-Combustible): Caustic soda, solution, Sodium hydroxide, solution
1 #1 2582 Substances- Toxic and/or Corrosive (Non-Combustible):Ferric chloride, solution
1 #1 3082 Substances (Low to Moderate Hazard): Environmentally hazardous substances, liquid, n.o.s., Hazardous waste, liquid, n.o.s., Other regulated substances, liquid, n.o.s.
3 #1 3264 Substances- Toxic and/or Corrosive (Non-Combustible): Corrosive liquid, acidic, inorganic, n.o.s.
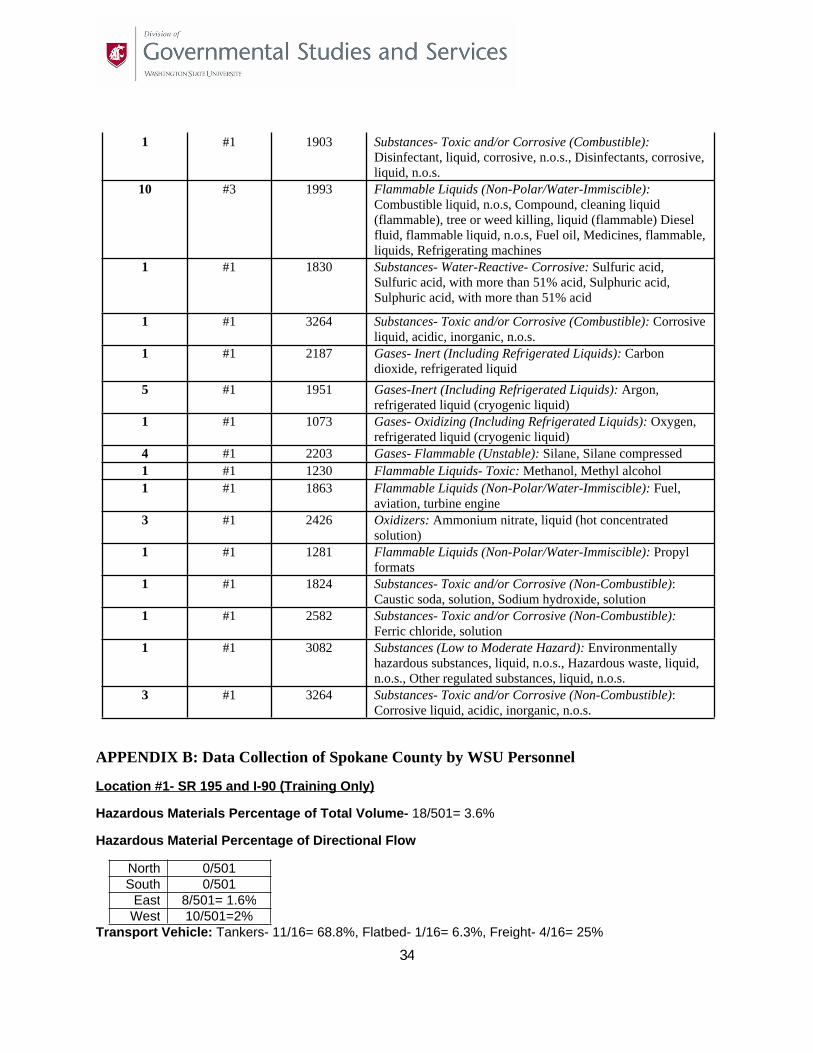
APPENDIX B: Data Collection of Spokane County by WSU Personnel
Location #1- SR 195 and I-90 (Training Only)
Hazardous Materials Percentage of Total Volume- 18/501= 3.6%
Hazardous Material Percentage of Directional Flow
North 0/501South 0/501
East 8/501= 1.6%West 10/501=2%
Transport Vehicle: Tankers- 11/16= 68.8%, Flatbed- 1/16= 6.3%, Freight- 4/16= 25%

35
Hazardous Material Classification
Total Placards
PlacardType
IdentificationNumber
Possible Hazardous Materials
12 #3 1203 Flammable Liquids (and Combustible Liquids): Gasohol, Gasoline, Motor Spirit, Petrol.
1 #3 1075 Gases- Flammable (including Refrigerated Liquids), "203": Butane, Butane mixture, Butylene, Isobutane, Isobutane mixture, Isobutylene, Liquefied petroleum gas, LPG, Petroleum gases, liquefied, Propane, Propane mixture, Propylene,
Truck Type Flow PercentageBox (B) 50/467= 10.7%Cement Truck (CT)
8/467= 1.7%
Dump Truck(DT) 32/467= 6.9%Freight Truck (F) 255/467= 54.6%Flatbed (FB) 89/467= 19.1%Tanker (T) 22/467= 4.7%
483/501= 96.4%, No, Placard18/502= 3.6%, Yes, Placard
Total Trucks Observed For Location #1:
36
2 Some teams had difficulties observing westbound traffic at this location, these teams only recorded vehicles traveling east into Spokane.
A majority of the transport vehicles observed for Location #1 (SR 195 and I-90) were freight trucks (54.60%).
Location #2- I-90—Exit 2722
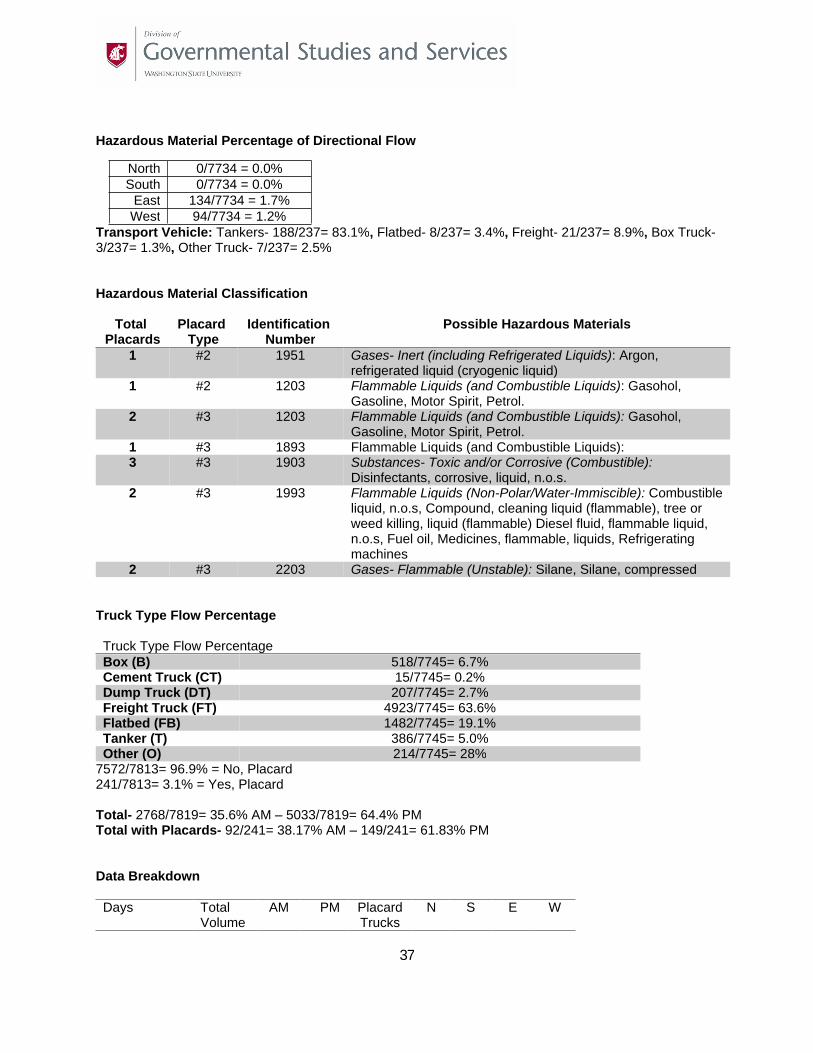
Hazardous Materials Percentage of Total Volume- 241/7734= 3.1%
37
Hazardous Material Percentage of Directional Flow
North 0/7734 = 0.0%South 0/7734 = 0.0%
East 134/7734 = 1.7%West 94/7734 = 1.2%
Transport Vehicle: Tankers- 188/237= 83.1%, Flatbed- 8/237= 3.4%, Freight- 21/237= 8.9%, Box Truck-3/237= 1.3%, Other Truck- 7/237= 2.5%
Hazardous Material Classification
Total Placards
Placard Type
Identification Number
Possible Hazardous Materials
1 #2 1951 Gases- Inert (including Refrigerated Liquids): Argon, refrigerated liquid (cryogenic liquid)
1 #2 1203 Flammable Liquids (and Combustible Liquids): Gasohol, Gasoline, Motor Spirit, Petrol.
2 #3 1203 Flammable Liquids (and Combustible Liquids): Gasohol, Gasoline, Motor Spirit, Petrol.
1 #3 1893 Flammable Liquids (and Combustible Liquids):3 #3 1903 Substances- Toxic and/or Corrosive (Combustible):
Disinfectants, corrosive, liquid, n.o.s.2 #3 1993 Flammable Liquids (Non-Polar/Water-Immiscible): Combustible
liquid, n.o.s, Compound, cleaning liquid (flammable), tree or weed killing, liquid (flammable) Diesel fluid, flammable liquid, n.o.s, Fuel oil, Medicines, flammable, liquids, Refrigerating machines
2 #3 2203 Gases- Flammable (Unstable): Silane, Silane, compressed
Truck Type Flow Percentage
Truck Type Flow PercentageBox (B) 518/7745= 6.7%Cement Truck (CT) 15/7745= 0.2%Dump Truck (DT) 207/7745= 2.7%Freight Truck (FT) 4923/7745= 63.6%Flatbed (FB) 1482/7745= 19.1%Tanker (T) 386/7745= 5.0%Other (O) 214/7745= 28%
7572/7813= 96.9% = No, Placard241/7813= 3.1% = Yes, Placard
Total- 2768/7819= 35.6% AM – 5033/7819= 64.4% PMTotal with Placards- 92/241= 38.17% AM – 149/241= 61.83% PM
Data Breakdown
Days Total Volume
AM PM PlacardTrucks
N S E W

38
Monday 1436 480 956 38 0 0 613 817
Tuesday 586 249 337 23 0 0 585 0
Wednesday 1461 732 729 41 0 0 721 701
Thursday 1481 455 1026 56 0 0 777 681
Friday 1430 552 878 45 0 0 769 658
Saturday 548 89 459 17 0 0 307 234
Sunday 877 229 648 21 0 0 217 620
Total Trucks Observed For Location #2:
Freight trucks (63.60%) were the majority of the transport vehicles observed for Location #2 (I-90—Exit 272).
Total Trucks Observed During AM/PM For Location #2:

39
The above bar chart demonstrates that a majority of the transport vehicles were traveling on Mondays, Thursdays, and Fridays during the evenings. While, Wednesdays had the most transport vehicles traveling during the morning for Location #2 (I-90—Exit 272).
Total Volume of Trucks Observed and With Placards for Location #2:
A majority of the transport vehicles traveling in Location #2 (I-90—Exit 272) had more transport vehicles traveling without any placards. The bar chart also shows the majority of the transport trucks traveled on Mondays, Wednesday, Thursday, and Fridays, as well for the transport vehicles that had placards.
Total Volume of Trucks Observed Through Direction of East and West for Location #2:

40
3 Some teams had difficulties observing eastbound traffic at this location, these teams only recorded vehicles traveling west into Spokane.
The above graph provides a summary of the data collected passing both through the east and west bounds. The majority of the transport vehicles traveled on Mondays, Wednesdays, Thursdays and Fridays for Location #2 (I-90—Exit 272).
Location #3- I-90—Exit 291A—Spokane Valley Mall3
Hazardous Materials Percentage of Total Volume- 268/7663= 3.5%

41
Hazardous Material Percentage of Directional Flow
North 0/7663= 0.0%South 0/7663= 0.0%
East 99/7663= 1.3%West 150/7663= 2%
Transport Vehicle: Box Truck- 11/259= 4.2%, Dump Truck- 5/259= 1.9%, Freight- 20/259= 7.7%, Flatbed- 8/259= 3.1%, Tanker- 211/259= 81.5%, Other- 4/259= 1.5%
Hazardous Material Classification
Total Placards
PlacardType
IdentificationNumber
Possible Hazardous Materials
1 #1 1073 Gases- Oxidizing (Including Refrigerated Liquids): Oxygen, refrigerated liquid (cryogenic liquid)
3 #3 1075 Gases- Flammable (including Refrigerated Liquids)Butane, Butane mixture, Butylene, Isobutane, Isobutane mixture, Isobutylene, Liquefied petroleum gas, LPG, Petroleum gases,liquefied, Propane, Propane mixture, Propylene
4 #1 2203 Gases- Flammable (Unstable): Silane, Silane compressed90 #3 1203 Flammable Liquids (and Combustible Liquids): Gasohol,
Gasoline, Motor Spirit, Petrol.1 #1 1230 Flammable Liquids- Toxic: Methanol, Methyl alcohol1 #1 1863 Flammable Liquids (Non-Polar/Water-Immiscible): Fuel,
aviation, turbine engine 4 #3 1993 Flammable Liquids (Non-Polar/Water-Immiscible):
Combustible liquid, n.o.s, Compound, cleaning liquid (flammable), tree or weed killing, liquid (flammable) Diesel fluid, flammable liquid, n.o.s, Fuel oil, Medicines, flammable, liquids, Refrigerating machines
3 #1 2426 Oxidizers: Ammonium nitrate, liquid (hot concentrated solution)
1 #1 1281 Flammable Liquids (Non-Polar/Water-Immiscible): Propyl formats
1 #1 1824 Substances- Toxic and/or Corrosive (Non-Combustible): Caustic soda, solution, Sodium hydroxide, solution
1 #1 2582 Substances- Toxic and/or Corrosive (Non-Combustible):Ferric chloride, solution
1 #1 3082 Substances (Low to Moderate Hazard): Environmentally hazardous substances, liquid, n.o.s., Hazardous waste, liquid,n.o.s., Other regulated substances, liquid, n.o.s.
3 #1 3264 Substances- Toxic and/or Corrosive (Non-Combustible): Corrosive liquid, acidic, inorganic, n.o.s.
Truck Type Flow Percentage
Truck Type Flow Percentage
Box (B) 942/7648= 12.3%Cement Truck (CT)
173/7648= 2.3%
Dump Truck (DT) 557/7648= 7.3%Freight Truck (F) 3967/7648= 51.9%

42
Flatbed (FB) 1344/7648= 17.6%Tanker (T) 405/7648= 5.3%Other (O) 114/7648= 5.4%
7395/7663= 96.5%, No, Placard268/7663= 3.5%, Yes, Placard
Total- 3213/7592= 42.3% AM – 4379/7592= 57.7% PMTotal with Placards- 109/264=41.3% AM – 155/264= 58.7%PM
Data Breakdown
Days Total Volume
AM PM PlacardTrucks
N S E W
Monday 1077 400 677 24 0 0 0 1062
Tuesday 1226 629 597 54 0 0 582 681
Wednesday 1785 909 876 67 0 0 913 847
Thursday 907 356 551 28 0 0 0 907
Friday 1273 455 818 48 0 0 721 555
Saturday 852 296 556 37 0 0 514 331
Sunday 472 168 304 10 0 0 0 471
Total Trucks Observed For Location #3:

43
Freight trucks (51.90%) were the majority of transport vehicles observed for Location #3 (I-90—Exit 291A—Spokane Valley Mall).
Total Trucks Observed During AM/PM For Location #3:
The above bar chart demonstrates that a majority of the transport vehicles were traveling both Wednesdays and Fridays during the evenings. While, both Tuesdays and Wednesdays had the most transport vehicles traveling during the morning for Location #3 (I-90—Exit 291A—Spokane Valley Mall).
Total Volume of Trucks Observed and With Placards for Location #3:
44
The bar chart shows that majority of the transport vehicles traveling in Location #3 (I-90—Exit 291A—Spokane Valley Mall) had less placards compared to the transport vehicles ratio. The bar chart also shows that majority of the transport vehicles traveled on Tuesdays, Wednesdays, and Fridays, as well for the transport vehicles that had placards.
Total Volume of Trucks Observed Through Direction of East and West for Location #3:

45
The above graph provides a summary of the data collected passing through both the east and west bounds for Location #3 (I-90—Exit 291A), in which the majority of the transport vehicles traveled on Mondays and Thursdays for west bound and Wednesdays for both west and east bound.
Location #4- 395 State Patrol Office

46
Hazardous Materials Percentage of Total Volume- 26/915= 2.8%
Hazardous Material Percentage of Directional Flow
North 12/902= 0.13%South 12/902= 1.35%
East 1/902= 0.11%West 0/902= 0.00%
Transport Vehicle: Tankers- 16/26= 61.5%, Flatbed- 0/26= 0%, Freight- 4/26= 15.4%, Box Truck- 3/26= 11.5%, Other- 3/26= 11.5%
Hazardous Material Classification
Total Placards
PlacardType
Identification Number
Possible Hazardous Materials
5 #3 1075 Gases- Flammable (including Refrigerated Liquids)Butane, Butane mixture, Butylene, Isobutane, Isobutane mixture, Isobutylene, Liquefied petroleum gas, LPG, Petroleum gases, liquefied, Propane, Propane mixture, Propylene,
5 #1 1951 Gases-Inert (Including Refrigerated Liquids): Argon, refrigerated liquid (cryogenic liquid)
9 #3 1203 Flammable Liquids (and Combustible Liquids): Gasohol, Gasoline, Motor Spirit, Petrol.
Truck Type Flow Percentage
Truck Type Flow Percentage
Box (B) 294/906= 32.5%Cement Truck (CT) 25/906= 2.8%Dump Truck (DT) 154/906= 17.0%Tanker (T) 38/906= 4.2%Freight Truck (F) 213/906= 23.5%Flatbed (FB) 119/906= 13.1%Other (O) 63/906= 7%
889/915= 97.2%, No, Placard26/915= 2.8%, Yes, Placard
Total- 646/1273= 50.7% AM – 627/1274= 49.3%PMTotal with Placards- 9/26= 34.6% AM – 17/26= 65.4% PM
Data Breakdown

47
Days Total Volume
AM PM PlacardTrucks
N S E W
Monday 96 60 36 6 55 74 0 0
Tuesday 96 60 36 3 90 6 0 0
Wednesday 154 102 52 4 63 91 0 0
Thursday 159 44 115 6 63 80 8 3
Friday 212 83 129 3 54 66 51 41
Saturday 151 79 72 3 26 106 3 9
Sunday 15 11 4 1 5 5 1 2
Total Trucks Observed For Location #4:
The bar chart demonstrates that Box trucks (32.50%) were the majority of the transport vehicles observed for Location #4 (395- State Patrol Office).
48
Total Trucks Observed During AM/PM For Location #4:
The above bar chart shows that majority of the transport vehicles were traveling both Fridays and Saturdays during the evenings for Location #4 (395- State Patrol Office). While, Saturdays had the mosttransport vehicles traveling during the morning.
Total Volume of Trucks Observed and With Placards for Location #4:
The bar chart demonstrates that majority of the transport vehicles for Location #4 (395- State Patrol Office) had less placards compared to the transport vehicles ratio. The bar chart also shows that majority of the transport vehicles traveled on Tuesdays and Saturdays. Also, both Mondays, Tuesdays, and Thursdays had the majority of placard vehicles traveling for Location #4 (395- State Patrol Office).

49
Total Volume of Trucks Observed Through Direction of East and West for Location #4:
The above graph provides a summary of the data collected passing through north, south, east, and west bounds for Location #4 (395- State Patrol Office), in which the majority of the transport vehicles traveled on Saturdays for north bound, Tuesdays for south bound.
50
Location #5- Highway 2—Next to Chevron
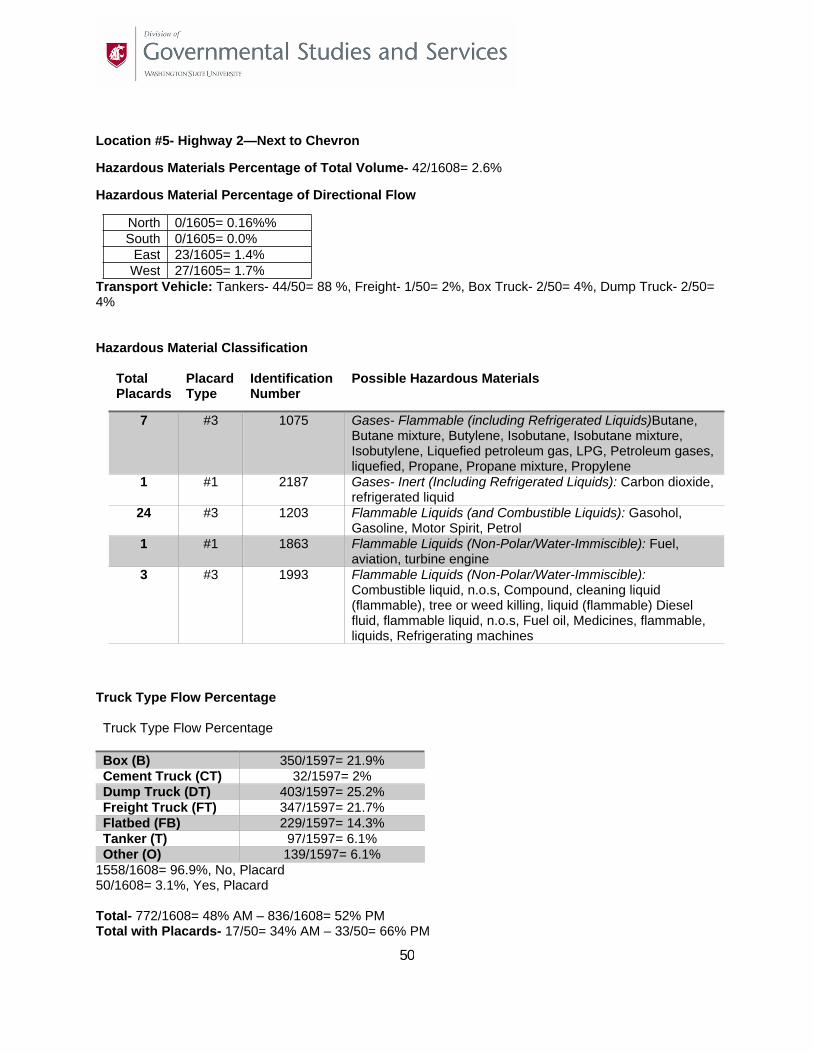
Hazardous Materials Percentage of Total Volume- 42/1608= 2.6%
Hazardous Material Percentage of Directional Flow
North 0/1605= 0.16%%South 0/1605= 0.0%
East 23/1605= 1.4%West 27/1605= 1.7%
Transport Vehicle: Tankers- 44/50= 88 %, Freight- 1/50= 2%, Box Truck- 2/50= 4%, Dump Truck- 2/50= 4%
Hazardous Material Classification
Total Placards
PlacardType
Identification Number
Possible Hazardous Materials
7 #3 1075 Gases- Flammable (including Refrigerated Liquids)Butane, Butane mixture, Butylene, Isobutane, Isobutane mixture, Isobutylene, Liquefied petroleum gas, LPG, Petroleum gases,liquefied, Propane, Propane mixture, Propylene
1 #1 2187 Gases- Inert (Including Refrigerated Liquids): Carbon dioxide,refrigerated liquid
24 #3 1203 Flammable Liquids (and Combustible Liquids): Gasohol, Gasoline, Motor Spirit, Petrol
1 #1 1863 Flammable Liquids (Non-Polar/Water-Immiscible): Fuel, aviation, turbine engine
3 #3 1993 Flammable Liquids (Non-Polar/Water-Immiscible): Combustible liquid, n.o.s, Compound, cleaning liquid (flammable), tree or weed killing, liquid (flammable) Diesel fluid, flammable liquid, n.o.s, Fuel oil, Medicines, flammable, liquids, Refrigerating machines
Truck Type Flow Percentage
Truck Type Flow Percentage
Box (B) 350/1597= 21.9%Cement Truck (CT) 32/1597= 2%Dump Truck (DT) 403/1597= 25.2%Freight Truck (FT) 347/1597= 21.7%Flatbed (FB) 229/1597= 14.3%Tanker (T) 97/1597= 6.1%Other (O) 139/1597= 6.1%
1558/1608= 96.9%, No, Placard50/1608= 3.1%, Yes, Placard
Total- 772/1608= 48% AM – 836/1608= 52% PMTotal with Placards- 17/50= 34% AM – 33/50= 66% PM
51
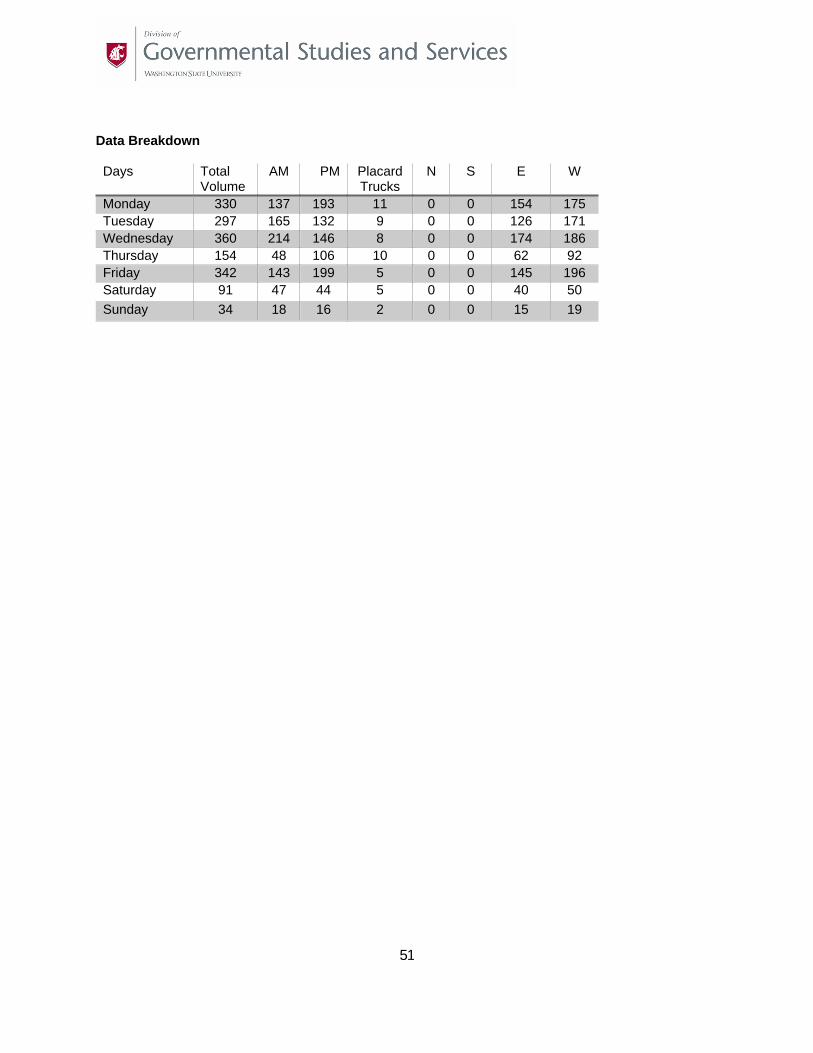
Data Breakdown
Days Total Volume
AM PM PlacardTrucks
N S E W
Monday 330 137 193 11 0 0 154 175
Tuesday 297 165 132 9 0 0 126 171
Wednesday 360 214 146 8 0 0 174 186
Thursday 154 48 106 10 0 0 62 92
Friday 342 143 199 5 0 0 145 196
Saturday 91 47 44 5 0 0 40 50
Sunday 34 18 16 2 0 0 15 19
52
Total Trucks Observed For Location #5:
The bar chart shows that Box trucks (21.90%), Dump trucks (25.20%), and Freight trucks (21.70%) were the majority of the transport vehicles observed for Location #5 (Highway 2—Next to Chevron).
Total Trucks Observed During AM/PM For Location #5:
The above bar chart demonstrates that majority of the transport vehicles were traveling both Mondays, and Fridays during the evenings. While, both Tuesdays and Fridays had more transport vehicles traveling during the morning for Location #5 (Highway 2—Next to Chevron).

53
Total Volume of Trucks Observed and With Placards for Location #5:
The bar chart demonstrates that majority of the transport vehicles for Location #5 (Highway 2—Next to Chevron) had less placards compared to the transport vehicles ratio. The bar chart also shows that majority of the transport vehicles traveled on Mondays, Tuesdays, and Fridays. In which, Mondays, Tuesdays, and Thursdays had the majority of placard vehicles traveling for Location #5 (Highway 2—Next to Chevron).
54
Total Volume of Trucks Observed Traveling East and West for Location #5:
The above graph provides a summary of the data collected passing through both east and west bounds for Location #5 (Highway 2- Next to Chevron), in which the majority of the transport vehicles traveled on Mondays and Fridays for both east and west bound, Mondays and Fridays for west bound.

55
Location #6- Highway 195
Hazardous Materials Percentage of Total Volume- 107/1489= 7.4%
Hazardous Material Percentage of Directional Flow
North 48/1453= 3.3%South 59/1453= 4.1%
East 0/1453= 0.0%West 0/1453= 0.0%
Transport Vehicle: Tankers- 97/110= 88.2%, Flatbed- 1/110= 0.9%, Freight- 8/110= 7.3%, Box Truck- 2/110= 1.8%, Other- 1/110= 0.9%
Hazardous Material Classification
Total Placards
PlacardType
IdentificationNumber
Possible Hazardous Materials
3 #3 1075 Gases- Flammable (including Refrigerated Liquids)Butane, Butane mixture, Butylene, Isobutane, Isobutane mixture, Isobutylene, Liquefied petroleum gas, LPG, Petroleum gases, liquefied, Propane, Propane mixture, Propylene
74 #3 1203 Flammable Liquids (and Combustible Liquids): Gasohol, Gasoline, Motor Spirit, Petrol
2 #1 1863 Flammable Liquids (Non-Polar/Water-Immiscible): Fuel, aviation, turbine engine
1 #1 1903 Substances- Toxic and/or Corrosive (Combustible): Disinfectant, liquid, corrosive, n.o.s., Disinfectants, corrosive, liquid, n.o.s.
3 #3 1993 Flammable Liquids (Non-Polar/Water-Immiscible): Combustible liquid, n.o.s, Compound, cleaning liquid (flammable), tree or weed killing, liquid (flammable) Diesel fluid, flammable liquid, n.o.s, Fuel oil, Medicines, flammable, liquids, Refrigerating machines
1 #1 1830 Substances- Water-Reactive- Corrosive: Sulfuric acid, Sulfuric acid, with more than 51% acid, Sulphuric acid, Sulphuric acid, with more than 51% acid
1 #1 3264 Substances- Toxic and/or Corrosive (Combustible): Corrosive liquid, acidic, inorganic, n.o.s.

56
Truck Type Flow Percentage
Truck Type Flow Percentage
Box (B) 333/1486= 22.4%Cement Truck (CT) 18/1486= 1.2%Dump Truck (DT) 150/1486= 10.1%Freight Truck (FT) 481/1486= 32.4%Flatbed (FB) 237/1486= 15.9%Tanker (T) 153/1486= 10.3%Other (O) 114/1486= 7.7%
1379/1489= 92.6%, No, Placard110/1489= 7.4%, Yes, Placard
Total- 680/1489= 45.7% AM – 809/1489= 54.3% PMTotal with Placards- 54/1489= 49.1% AM – 56/1489= 50.9% PM
Data Breakdown
Days Total Volume
AM PM PlacardTrucks
N S E W
Monday 258 88 170 15 146 102 0 0
Tuesday 260 138 122 13 113 147 0 0
Wednesday 302 206 96 22 129 173 0 0
Thursday 335 121 214 27 195 116 0 0
Friday 237 92 145 19 128 109 0 0
Saturday 53 26 27 7 30 23 0 0
Sunday 44 9 35 7 23 19 0 0

57
Total Trucks Observed For Location #6:
The bar chart determines that freight trucks (32.40%) and box trucks (22.40%) were the majority of the transport vehicles observed for Location #6 (Highway 195).

58
Total Trucks Observed During AM/PM For Location #6:
The above bar chart shows that majority of the transport vehicles were traveling both Mondays and Thursdays during the evenings). While, Wednesdays had the most transport vehicles traveling during the morning for Location #6 (Highway 195.
Total Volume of Trucks Observed and With Placards for Location #6:
The bar chart shows that majority of the transport vehicles for Location #6 (Highway 195) had less placards compared to the transport vehicles ratio. The bar chart also shows that majority of the transport vehicles traveled on Mondays, Tuesdays, Wednesdays, and Thursdays. In which, Wednesdays and Thursdays had the majority of placard vehicles traveling Location #6 (Highway 195).

59
Total Volume of Trucks Observed Traveling North and South for Location #6:
The above graph provides a summary of the data collected passing through both north and south bounds for Location 6 (Highway 195), in which the majority of the transport vehicles traveled on Mondays and Thursdays for north bound, Tuesdays and Wednesdays for south bound.

60
APPENDIX C: Previous DGSS Hazardous Material Flow studies
1. Washington Traffic Safety Commission 1988
2. Swinomish Tribal Community 2002
3. Stevens County 2004
4. Lummi Reservation 2005
5. Okanogan County 2005
6. Tulalip Tribe 2005
7. Stevens County (Part 2) 2006
8. Grant/Adams Counties 2007
9. Douglas/Chelan Counties 2007
10. Pend Oreille County 2008
11. Columbia County 2010
12. Whatcom County 2010