diversion channel outlet – hydraulic modeling – ras ... · diversion channel outlet –...
TRANSCRIPT
Appendix C, Attachment 4 June 11, 2012
1
Diversion Channel Outlet – Hydraulic Modeling – RAS and ADH
11 June 2012

Appendix C, Attachment 4 June 11, 2012
2
Contents Introduction .................................................................................................................................................. 3
HEC-RAS modeling of Outlet ......................................................................................................................... 3
Transition Structure Geometry ................................................................................................................. 3
ADH Modeling of Outlet and Floodplain ....................................................................................................... 6
ADH ....................................................................................................................................................... 6
Elevation Data Sources ......................................................................................................................... 7
Material Types .................................................................................................................................... 10
Boundary Conditions ........................................................................................................................... 12
ADH Modeling Results ................................................................................................................................ 13
Table of Figures
Figure 1 Section of Channel at Top of Friction Slope .................................................................................... 4 Figure 2 Cross Section Midway Down Friction Slope .................................................................................... 4 Figure 3 Cross Section of Channel at bottom of Friction Slope .................................................................... 5 Figure 4 Cross Section of Diversion Channel at Junction with the Red River of the North .......................... 5 Figure 5 Profiles of Thalweg and Water Surface from 173rd Ave SE Bridge to Red River ............................. 6 Figure 6- One Foot Contour Map of Fargo Diversion Outlet Friction Slope ................................................. 8 Figure 7- Computational Mesh ..................................................................................................................... 9 Figure 8 - Computational Mesh in Vicinity of Outlet ................................................................................. 10 Figure 9 Map of Material Type.................................................................................................................... 11 Figure 10 Existing Conditions Velocity (ft/s), Run 7 (High Flow). Model Overview ................................... 14 Figure 11 Project Conditions Velocity, Run 7 (High Flow). Model Overview ............................................ 15 Figure 12 Existing Conditions Velocity (Run 7) High Flow Condition .......................................................... 16 Figure 13 Project Conditions Velocity (Run 7) High Flow Condition ........................................................... 17 Figure 14 Existing Conditions Velocity (ft/s) (Run 6) Low Flow Condition .................................................. 18 Figure 15 Project Conditions Velocity (Run 6) Low Flow Condition ........................................................... 19
Table of Tables
Table 1 Table of Manning n Values ............................................................................................................. 12 Table 2 Boundary Conditions for Existing and Project Runs ....................................................................... 12

Appendix C, Attachment 4 June 11, 2012
3
Introduction The modeling and design of the diversion channel outlet was completed using HEC-RAS and ADH software. Hydraulic Engineering Center – River Analysis System (HEC-RAS) is a hydraulic modeling program designed to perform one-dimensional hydraulic calculations for natural and constructed channels for both steady and unsteady flow scenarios. The HEC-RAS one dimensional modeling was used to produce an initial design where the diversion channel transitions from the more elevated channel down to the Red River of the North river bottom. Adaptive Hydraulics Modeling (ADH) is a hydraulic modeling program developed by the Coastal and Hydraulics Laboratory (CHL), a member of the USACE Engineer Research and Development Center (ERDC). The model is capable of performing two-dimensional hydraulic modeling using adaptive numerical meshes to improve model accuracy. ADH is the two-dimensional model of choice for USACE, especially for modeling on the Mississippi and Missouri Rivers. The ADH two dimensional hydraulic modeling will show detailed hydrodynamics of the floodplain and in particular the Red River channel velocities near the confluence.
HEC-RAS modeling of Outlet
Transition Structure Geometry The approaching diversion channel bottom is about 10 feet higher than the Red River. A transition structure was necessary to bring the diversion water down to the river bottom. This is most significant for lower flow conditions where the Red River is low and flows in the diversion channel have to drop a larger vertical distance to the river. The Red River is much higher for higher flow conditions so the differential in water surface elevations is dramatically reduced. The HEC-RAS mixed flow option was used because some of the water surface profiles pass through critical depth.
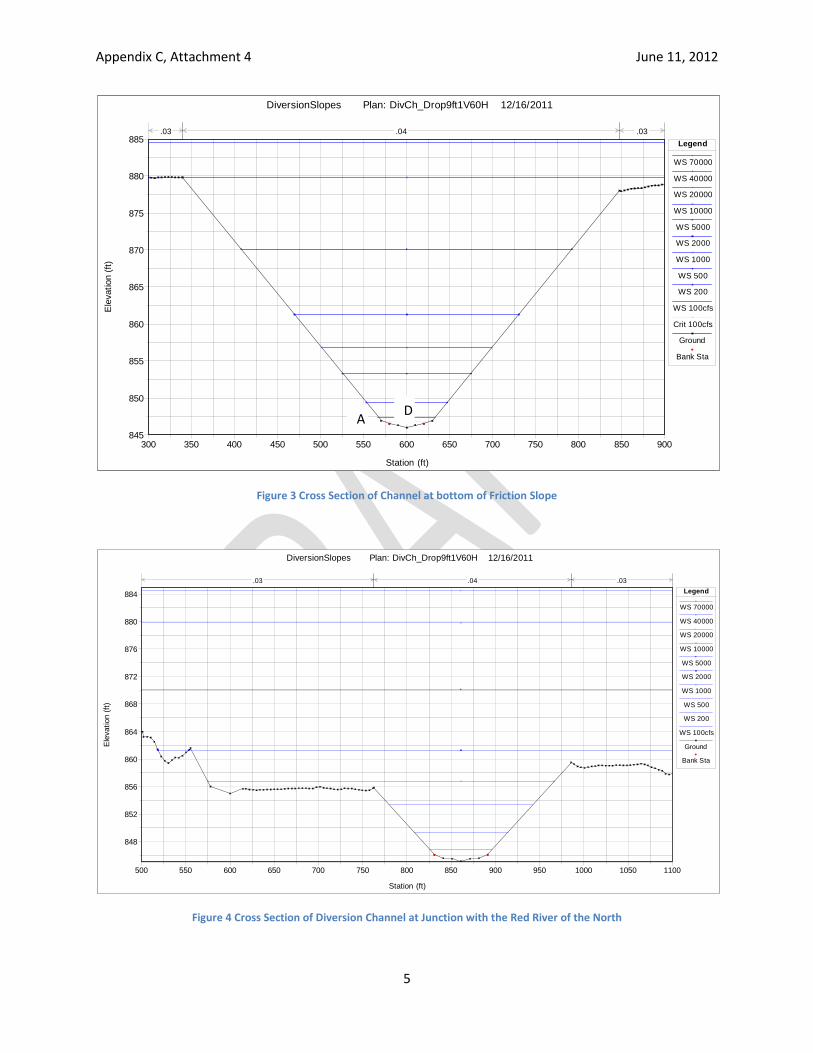
The initial design used a Manning’s n value of 0.04 (0.04 is considered low for the roughened riprap slope and will produce conservatively high velocity values in HEC-RAS). Figure 1 shows a cross section of the diversion channel just upstream of the transition structure. Figure 2 shows the transition of the section half way down and Figure 3 shows the cross section at the base of the slope. The HEC-RAS cross section interpolation routine was used to calculate the geometry of the transition. Points labeled A, B, C, and D identifies common points along the interpolation. Different slopes (parallel to flow) develop because of the varying elevations from the diversion channel’s bottom terrace and low flow channel to the different geometry at the bottom of the structure. The drop along the channel centerline (“D”’s in the figures) is 1V:55H. The slope is steeper along the transition of the “B” points at 1V:30H. This is due to the greater height between the bottom terrace elevation above the structure, and the bottom elevation at the bottom (Figure 3). Figure 5 shows the water surface profiles through the structure.
The final segment between the bottom of structure slope and the river bank drops another foot in the final 450 feet. This reach allows for dissipation of turbulence and expansion of flow before it reenters the Red River. The elevation of the diversion channel outlet where it meets the river is 845.1 feet NAVD88. The Red River channel thalweg is at an approximate elevation of 841.0 feet and the soundings along the edge of the river channel are about 847 (variable). The diversion channel will join the Red River at about the same bed elevation.

Appendix C, Attachment 4 June 11, 2012
4
Figure 1 Section of Channel at Top of Friction Slope
Figure 2 Cross Section Midway Down Friction Slope
300 350 400 450 500 550 600 650 700 750 800 850 900
848
852
856
860
864
868
872
876
880
884
DiversionSlopes Plan: DivCh_Drop9ft1V60H 12/16/2011
Station (ft)
Ele
vatio
n (ft
)
Legend
WS 70000
WS 40000
WS 20000
WS 10000
WS 5000
WS 2000
WS 1000
WS 500
WS 200
WS 100cfs
Ground
Bank Sta
.03 .04 .03
300 350 400 450 500 550 600 650 700 750 800 850 900
848
852
856
860
864
868
872
876
880
884
DiversionSlopes Plan: DivCh_Drop9ft1V60H 12/16/2011
Station (ft)
Ele
vatio
n (ft
)
Legend
WS 70000
WS 40000
WS 20000
WS 10000
WS 5000
WS 2000
WS 1000
WS 500
WS 200
WS 100cfs
Ground
Bank Sta
.035 .04 .04 .04 .04 .03
.03
A
C D
B
A
C D
B
Appendix C, Attachment 4 June 11, 2012
5
Figure 3 Cross Section of Channel at bottom of Friction Slope
Figure 4 Cross Section of Diversion Channel at Junction with the Red River of the North
300 350 400 450 500 550 600 650 700 750 800 850 900845
850
855
860
865
870
875
880
885
DiversionSlopes Plan: DivCh_Drop9ft1V60H 12/16/2011
Station (ft)
Ele
vatio
n (ft
)
Legend
WS 70000
WS 40000
WS 20000
WS 10000
WS 5000
WS 2000
WS 1000
WS 500
WS 200
WS 100cfs
Crit 100cfs
Ground
Bank Sta
.03 .04 .03
500 550 600 650 700 750 800 850 900 950 1000 1050 1100
848
852
856
860
864
868
872
876
880
884
DiversionSlopes Plan: DivCh_Drop9ft1V60H 12/16/2011
Station (ft)
Ele
vatio
n (ft
)
Legend
WS 70000
WS 40000
WS 20000
WS 10000
WS 5000
WS 2000
WS 1000
WS 500
WS 200
WS 100cfs
Ground
Bank Sta
.03 .04 .03
A D
Appendix C, Attachment 4 June 11, 2012
6
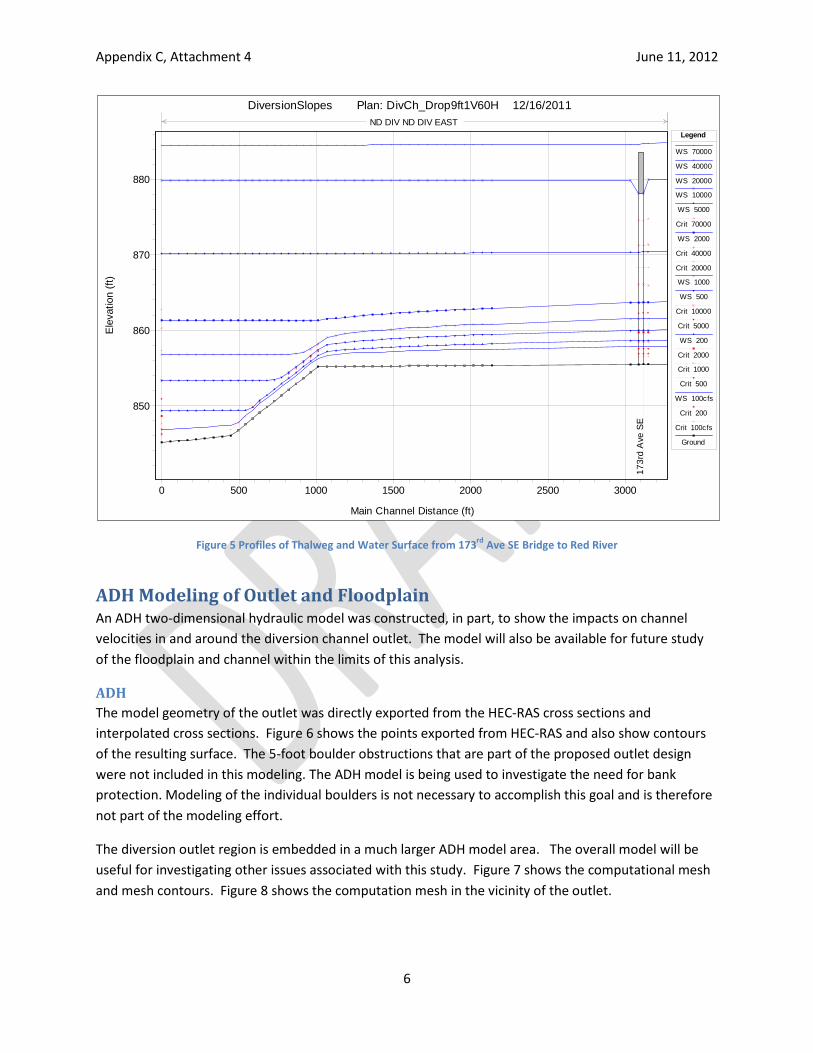
Figure 5 Profiles of Thalweg and Water Surface from 173rd Ave SE Bridge to Red River
ADH Modeling of Outlet and Floodplain An ADH two-dimensional hydraulic model was constructed, in part, to show the impacts on channel velocities in and around the diversion channel outlet. The model will also be available for future study of the floodplain and channel within the limits of this analysis.
ADH The model geometry of the outlet was directly exported from the HEC-RAS cross sections and interpolated cross sections. Figure 6 shows the points exported from HEC-RAS and also show contours of the resulting surface. The 5-foot boulder obstructions that are part of the proposed outlet design were not included in this modeling. The ADH model is being used to investigate the need for bank protection. Modeling of the individual boulders is not necessary to accomplish this goal and is therefore not part of the modeling effort.
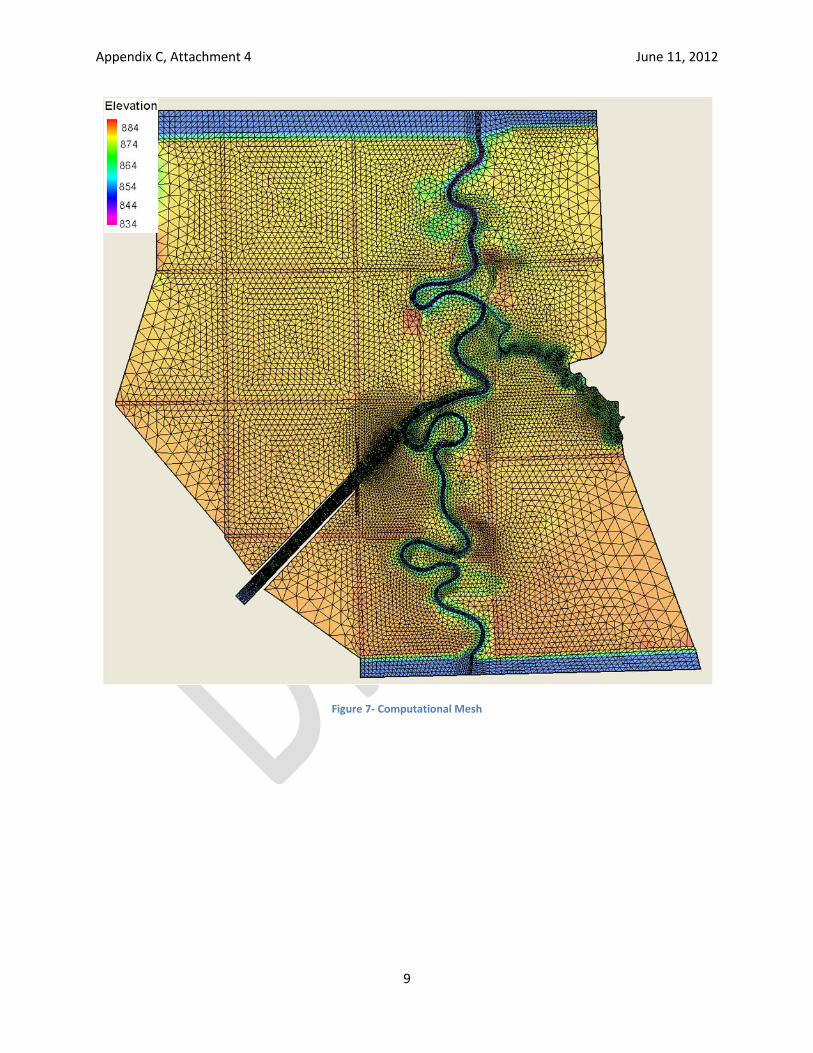
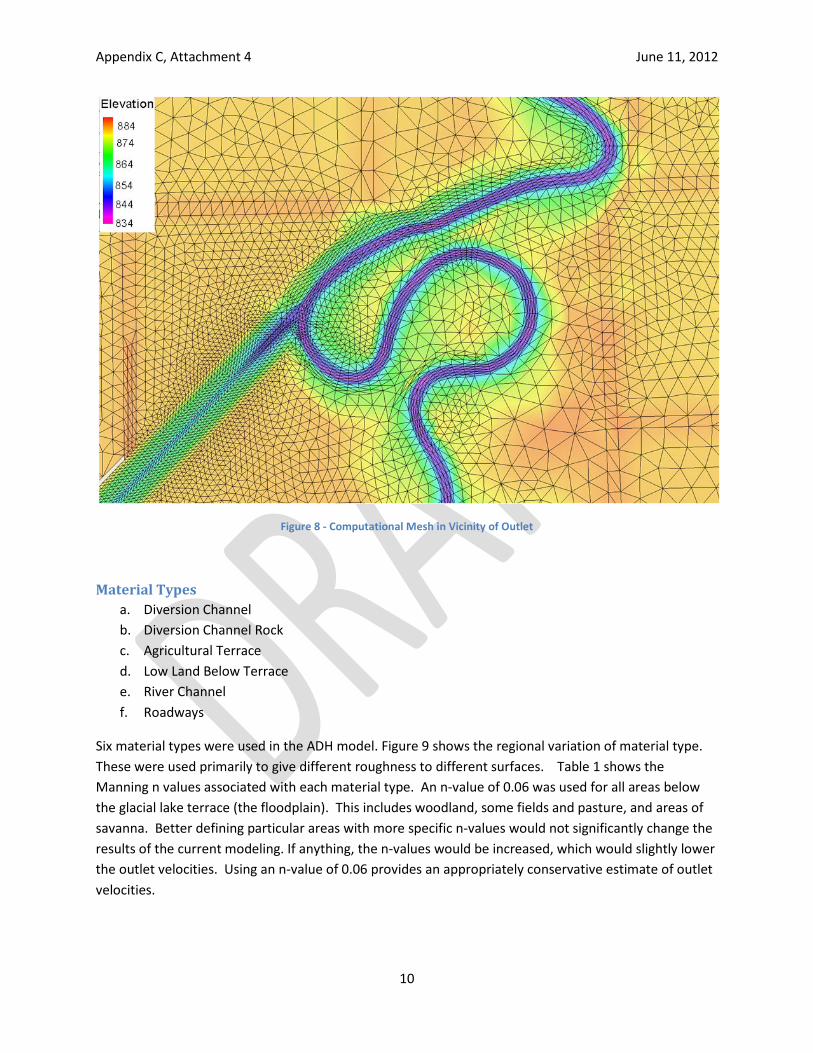
The diversion outlet region is embedded in a much larger ADH model area. The overall model will be useful for investigating other issues associated with this study. Figure 7 shows the computational mesh and mesh contours. Figure 8 shows the computation mesh in the vicinity of the outlet.
0 500 1000 1500 2000 2500 3000
850
860
870
880
DiversionSlopes Plan: DivCh_Drop9ft1V60H 12/16/2011
Main Channel Distance (ft)
Ele
vatio
n (ft
)
Legend
WS 70000
WS 40000
WS 20000
WS 10000
WS 5000
Crit 70000
WS 2000
Crit 40000
Crit 20000
WS 1000
WS 500
Crit 10000
Crit 5000
WS 200
Crit 2000
Crit 1000
Crit 500
WS 100cfs
Crit 200
Crit 100cfs
Ground
173r
d A
ve S
E
ND DIV ND DIV EAST
Appendix C, Attachment 4 June 11, 2012
7
Elevation Data Sources a. HEC-RAS model of Diversion Channel b. Channel Soundings c. LIDAR
The channel soundings were available for the Red River from the upstream end of the model to County Road 36 (well below the diversion channel). A channel bottom elevation of 839 downstream of County Road 36 was assumed based on the soundings.
LIDAR data was available for the entire area. The LIDAR data is very dense and needed to be re-sampled to produce scatter sets suitable to be used for model construction. The LIDAR dataset was sampled on a 500 foot spacing to be used to generate model elevations for the higher farmland areas. Lower areas below the agricultural terrace used LIDAR dataset was sampled at 10 foot spacing. This more detailed data was required where elevations change more rapidly on the steeper slopes. The roadways were assigned elevations based on LIDAR point elevations taken along roadways. These roadway points were triangulated to produce a surface. This allowed roadway elements to be set very close to actual roadway elevations even if the width of the roadway was exaggerated (for modeling purposes) and the node locations were no longer directly over the roadway points.

Appendix C, Attachment 4 June 11, 2012
8
Figure 6- One Foot Contour Map of Fargo Diversion Outlet Friction Slope
Appendix C, Attachment 4 June 11, 2012
9
Figure 7- Computational Mesh
Appendix C, Attachment 4 June 11, 2012
10
Figure 8 - Computational Mesh in Vicinity of Outlet
Material Types a. Diversion Channel b. Diversion Channel Rock c. Agricultural Terrace d. Low Land Below Terrace e. River Channel f. Roadways
Six material types were used in the ADH model. Figure 9 shows the regional variation of material type. These were used primarily to give different roughness to different surfaces. Table 1 shows the Manning n values associated with each material type. An n-value of 0.06 was used for all areas below the glacial lake terrace (the floodplain). This includes woodland, some fields and pasture, and areas of savanna. Better defining particular areas with more specific n-values would not significantly change the results of the current modeling. If anything, the n-values would be increased, which would slightly lower the outlet velocities. Using an n-value of 0.06 provides an appropriately conservative estimate of outlet velocities.

Appendix C, Attachment 4 June 11, 2012
11
Figure 9 Map of Material Type
Appendix C, Attachment 4 June 11, 2012
12
Material Manning's Type n
Diversion Channel 0.030 Diversion Channel Rock 0.045
Low Land Woods 0.060 River Channel 0.032
Roadways 0.029 Row Crops 0.033
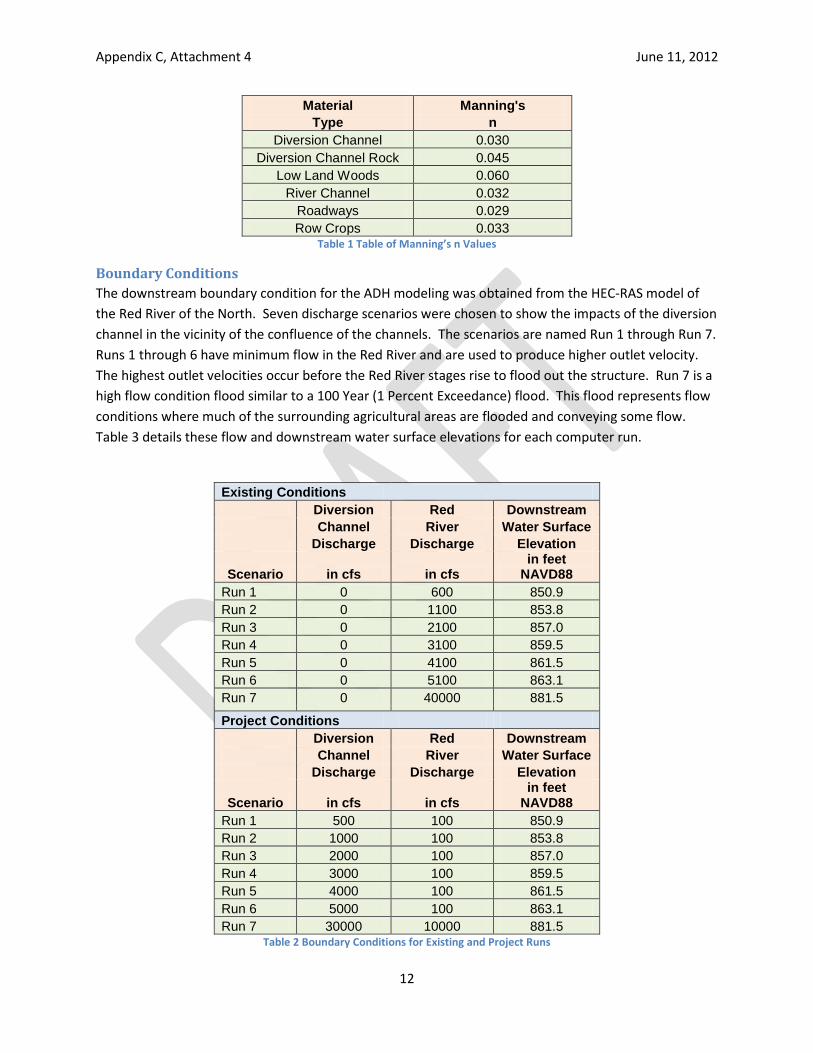
Table 1 Table of Manning’s n Values
Boundary Conditions The downstream boundary condition for the ADH modeling was obtained from the HEC-RAS model of the Red River of the North. Seven discharge scenarios were chosen to show the impacts of the diversion channel in the vicinity of the confluence of the channels. The scenarios are named Run 1 through Run 7. Runs 1 through 6 have minimum flow in the Red River and are used to produce higher outlet velocity. The highest outlet velocities occur before the Red River stages rise to flood out the structure. Run 7 is a high flow condition flood similar to a 100 Year (1 Percent Exceedance) flood. This flood represents flow conditions where much of the surrounding agricultural areas are flooded and conveying some flow. Table 3 details these flow and downstream water surface elevations for each computer run.
Existing Conditions Diversion Red Downstream Channel River Water Surface Discharge Discharge Elevation
Scenario in cfs in cfs in feet
NAVD88 Run 1 0 600 850.9 Run 2 0 1100 853.8 Run 3 0 2100 857.0 Run 4 0 3100 859.5 Run 5 0 4100 861.5 Run 6 0 5100 863.1 Run 7 0 40000 881.5 Project Conditions
Diversion Red Downstream Channel River Water Surface Discharge Discharge Elevation
Scenario in cfs in cfs in feet
NAVD88 Run 1 500 100 850.9 Run 2 1000 100 853.8 Run 3 2000 100 857.0 Run 4 3000 100 859.5 Run 5 4000 100 861.5 Run 6 5000 100 863.1 Run 7 30000 10000 881.5
Table 2 Boundary Conditions for Existing and Project Runs

Appendix C, Attachment 4 June 11, 2012
13
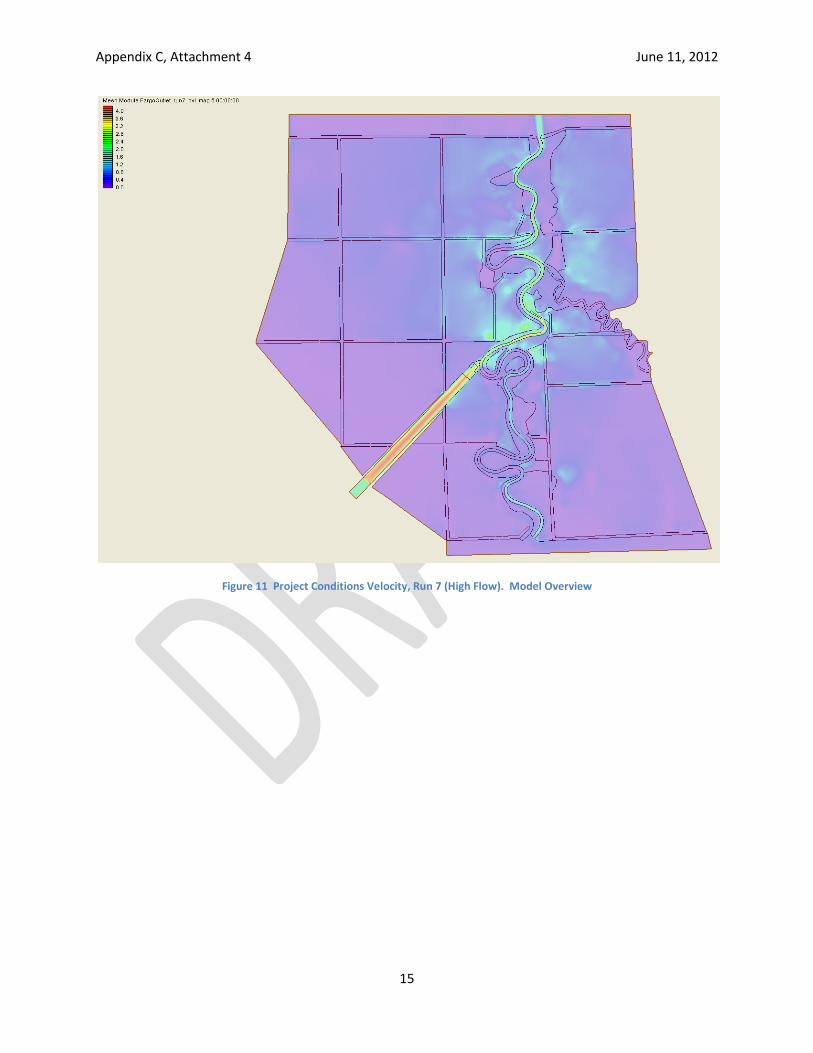
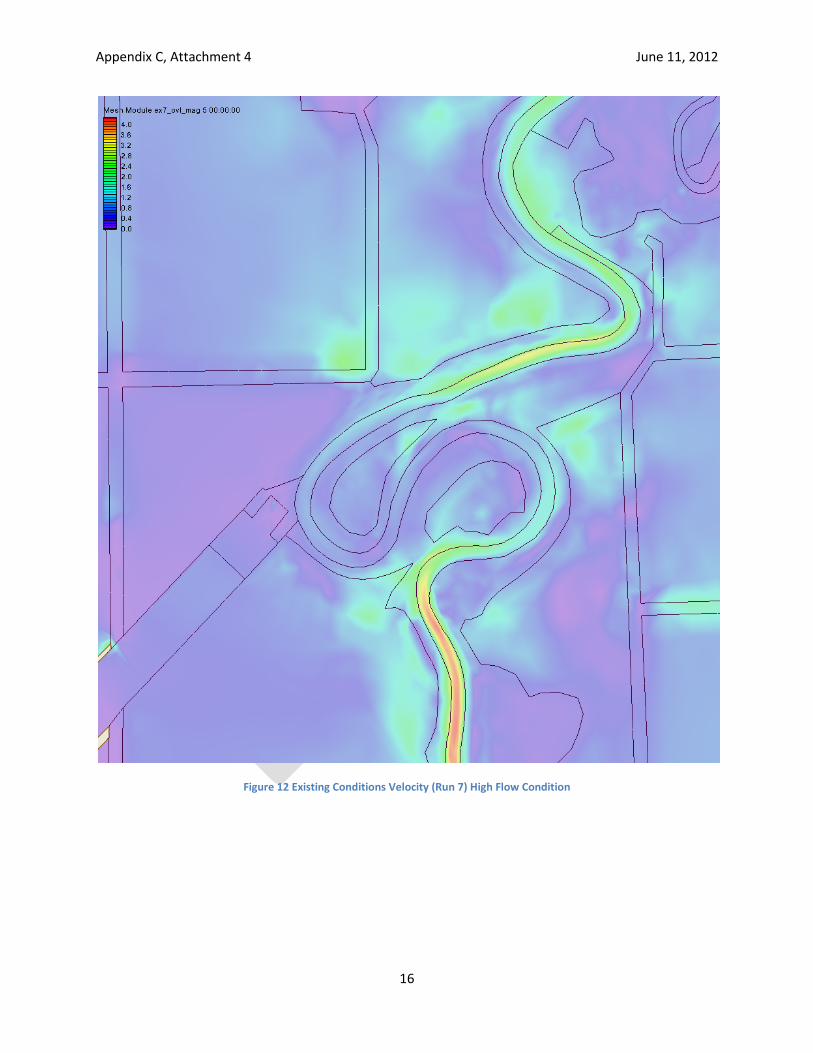
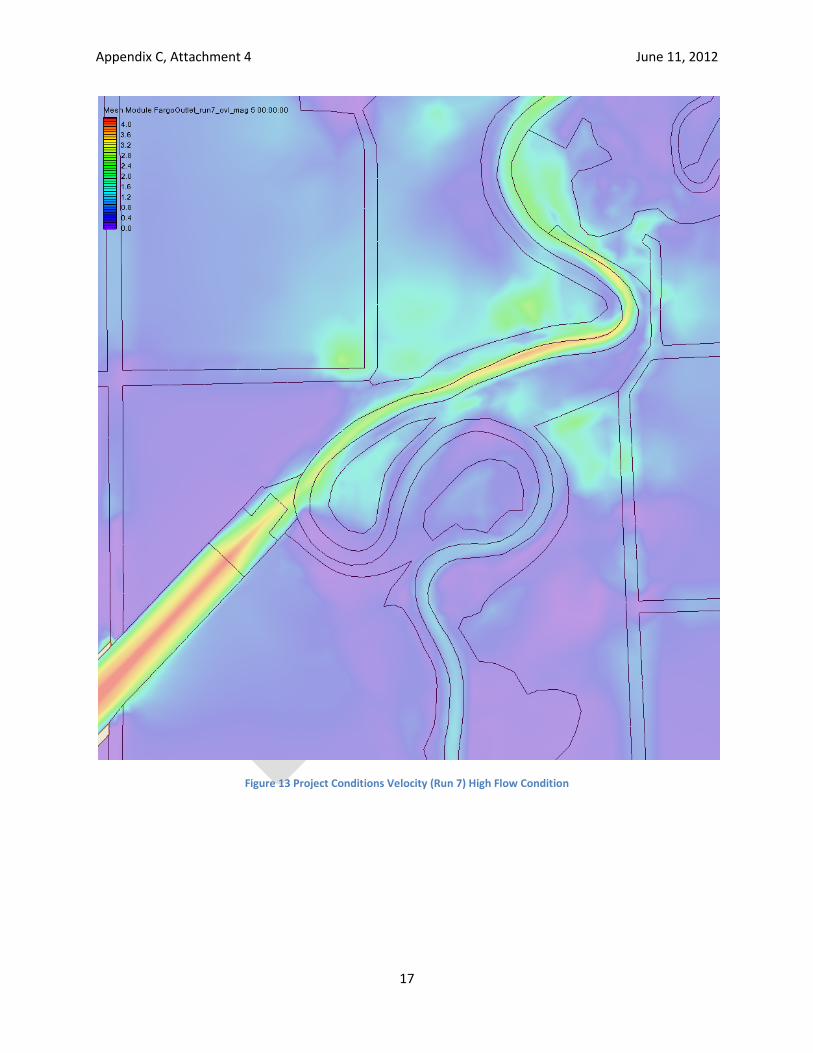
ADH Modeling Results The velocity distribution for existing and project conditions in Run 7 (High Flow Condition) can be seen in Figures 10 through 13. The velocities in the entire model can be seen in Figures 10 and 11 and the more detailed images in Figures 12 and 13 show velocity in meanders closest to the outlet. The existing condition modeling shows that for the large flood (Run 7), there is a lot more break out from the channel upstream of the diversion. The overall channel velocity peaks at about 4.4 ft/s within the channel reaches upstream of the proposed outlet.
Comparison of Figures 12 and 13 show some increased velocity in the river reach below the outlet. This increase is not directly caused by the alignment of the outlet geometry. It is caused by the secondary condition of the upstream breakout conditions. Because the existing condition model has all of the flow coming in through the Red River from the south, more of the water is breaking out of the channel and flowing overland. During project conditions, less of the discharge breaks out because of the lower water elevations south (upstream) of the diversion outlet. Figure 13 shows that for very large floods the peak velocity will be slightly elevated from about 3.2 to 3.8 feet per second. This elevated velocity is considered low for a flood of this magnitude. It is also lower than velocities found in nearby meanders to the south which have existing condition velocities of about 4.3 to 4.4 ft/s.
River velocity for the lower flow conditions in Run 6 (5100 cfs) can be seen in Figures 14 and 15. The existing and project condition velocities within the Red River channel are nearly indistinguishable. Upstream breakout is not an issue for these low flow conditions.

Appendix C, Attachment 4 June 11, 2012
14
Figure 10 Existing Conditions Velocity (ft/s), Run 7 (High Flow). Model Overview
Appendix C, Attachment 4 June 11, 2012
15
Figure 11 Project Conditions Velocity, Run 7 (High Flow). Model Overview
Appendix C, Attachment 4 June 11, 2012
16
Figure 12 Existing Conditions Velocity (Run 7) High Flow Condition
Appendix C, Attachment 4 June 11, 2012
17
Figure 13 Project Conditions Velocity (Run 7) High Flow Condition

Appendix C, Attachment 4 June 11, 2012
18
Figure 14 Existing Conditions Velocity (ft/s) (Run 6) Low Flow Condition

Appendix C, Attachment 4 June 11, 2012
19
Figure 15 Project Conditions Velocity (Run 6) Low Flow Condition