disturbance analysis for power systems based on labview
TRANSCRIPT

Disturbance Analysis for Power Systems Based on LabVIEW Real-Time and Reconfigurable
FPGA Modules Using Wavelet Transform
Marcel Nicola*, Claudiu-Ionel Nicola*,†, Sebastian Popescu*, Dumitru Sacerdoţianu*, Marian Duţă* * National Institute for Research, Development and Testing in Electrical Engineering – ICMET/ Research, Development
Division for Electric Equipment and Energy Efficiency, Craiova, Romania, [email protected], [email protected], [email protected], [email protected], [email protected] † University of Craiova/Department of Automatic Control and Electronics, Craiova, Romania, clau-
Abstract - This paper present a disturbance analysis moni-toring system for the purpose of detection of disturbance analysis using Wavelet Transform (WT). The proposed sys-tem is based on the real-time capabilities of the Real-Time LabVIEW operating system and on a CompactRIO type real-time computer which contains a network of FPGA (Field Programmable Gate Array). The WT is used to ana-lyze the quality of energy and to detect the transient phe-nomena characteristic of the quasi-periodic signals. The system achieves the storage of entries as TDMS (Technical Data Management Streaming) files and Word/Excel type automatic reports automatically sent by email at predefined addresses, contains an OPC UA (Open Platform Communi-cations Unified Architecture) type server for communication with a hierarchically superior SCADA (Supervisory Control And Data Acquisition) type system, performs selective entry of the characteristic parameters into a database, contains a Webserver for Intranet/Internet access, for viewing the measured data, and for system management from any-where, the application is connected to a Cloud-type plat-form. The disturbance analysis monitoring system has been tested using both simulated signals and real signals from a practical experiment.
Cuvinte cheie: calitatea energiei electrice, transformata Wave-let, FPGA, timp real, baze de date cloud.
Keywords: power quality, Wavelet transform, FPGA, real time, cloud database.
I. INTRODUCTION
Electricity is probably the most important raw material used today in trade and industry. It is a product with a distinct feature, because it must supply a continuous flow, it cannot be stored in large quantities and cannot be sub-ject to quality control before it is used. Electricity produc-ers, distributors and consumers face multiple challenges in the area of energy in recent years. Due to the growing concern for environment, energy, and financial savings, it is essential for energy consumers to benefit from a mod-ern, efficient, and intelligent system for monitoring the electrical grid and improving PQ (Power Quality) and its management. Thanks to network monitoring systems, providers are able to detect electrical anomalies (and their causes) at the same time providing better energy service to communities, while reducing the recurring losses and the effects of disturbances, such as material damages, deterio-
ration of the lifetime of the equipment and loss of infor-mation [1-4].
PQ is becoming prevalent and of critical importance for power industry recently. The result of the increased use of microprocessors in appliances, office equipment and proc-ess controls is growing awareness of the disturbance analysis demands for equipment and the unpredictability of its supply. Transient phenomena are extremely critical since they can result in over voltages leading to insulation breakdown or flashover. The effects of these failures in-clude: tripping of any protection device, which initiates a short interruption to the supplied power; complete damage to system equipment during the transient period, caused by excess current produced by transients; failures or mal-functions of various if such disturbances are not mitigated [5-8].
Wavelet Transform has been used in the area of PQ to carry out several studies aimed at detecting and locating disturbances, by analyzing sag, swell, interruption, etc. of non-stationary signals. These disturbances are “slow changing” disturbances, containing only the spectral con-tents in the low frequency range. Therefore, WT coeffi-cients (WTCs) can be studied in very high decomposition levels in order to determine the occurrence of the distur-bance events as well as their time of occurrence. Owing to this, the Discret Wavelet Transform (DWT) techniques have been widely used to analyze the disturbance events in power systems. Due to its capability of solving prob-lems in many areas, computer science technology has been developing rapidly in this very modern era. High power signal processing has been made possible as a re-sult of this progress in technology. DWT is one of the very important modern techniques widely used in signal processing tools especially for extracting the power dis-turbance signal [9-14].
Wavelets localize the information in the time-frequency plane; in particular, they are especially suitable for the analysis of non-stationary signals since they are capable of trading one type of resolution for another. Such properties have been found to be relevant for power engineering, where the wavelet transform is used for various applica-tions, depending on the wide variety of signals and prob-lems encountered, ranging from the analysis of the PQ disturbance signals to, very recently, power system relay-ing and protection. The extreme variability of the signals and the necessity to operate for each case in particular makes it difficult for power engineering phenomena to be

dealt with. Power disturbance signals are also character-ized by the fact that the information under consideration is often a combination of features that are well localized temporally or spatially (e.g., transients in power systems), requiring analysis methods sufficiently versatile to exam-ine signals according to their time-frequency localization [15-21].
The proposed system presented in this article is based on the real-time capabilities of the Real-Time LabVIEW operating system and on a CompactRIO – National In-struments type real-time computer which contains a net-work of FPGA type reconfigurable logic gates providing great flexibility, reliability and speed of execution.
The DWT is used to analyze the quality of energy and to detect the transient phenomena characteristic of the quasi-periodic signals. The system contains a prefilter module for removal of spikes by using a Wavelet Denois-ing type module. The system achieves the storage of en-tries as TDMS files and Word/Excel type automatic re-ports automatically sent by email at predefined addresses, contains an OPC UA type server for communication with a hierarchically superior SCADA type system [22], per-forms selective entry of the characteristic parameters into a database, contains a Webserver for Intranet/Internet ac-cess, for viewing the measured data, and for system man-agement from anywhere, the application is connected to a Cloud-type platform.
The paper is organized as follows: Section 2 describes the most used tool for the analysis of the quasi-stationary signals which occur during the study of the quality of elec-tricity, i.e. the Wavelet transform and some simulations of the most common disturbances in the electrical network. Section 3 presents the implementation of the real-time system for electricity quality analysis and the software facilities for data management and integration into global Intranet/Internet networks. A practical example is pre-sented in section 4, and section 5 presents the conclusions and the advantages of the presented system for electricity quality analysis, but also some perspectives for further development.
II. WAVELET TRANSFORM
Wavelet theory is a method for decomposing a function (signal) into various frequency components and study of each component with a resolution match to its scale. A wavelet is a small wave with the energy concentrated in time and gives a tool for analysis of transients, non-stationary, time varying phenomenon which generally occurs in the power system network.
Mother wavelets are oscillating function with a finite energy and average values of zero, i.e.
R
dt)t( 0 ,
where )t( is mother wavelet [9].
The signal can be represented in terms of wavelet func-tion and scaling function as:
n j
j/jjj )nt()n(d)nt()n(c)t(f 22 2
(1)
Where: cj represents level scaling coefficient; dj repre-sents j level wavelet coefficient; represents scaling func-tion; (t) represents wavelet function; j can be any higher level wavelet transform and t is time.
DWT uses the discrete values of the signal in time do-main. Mathematically the expression for DWT can be given as:
m
m
mb,aa
anbt
a)t(
0
00
0
1 (2)
Where m and n are the integers which control the wave-let dilation and translation respectively, a0 is a fixed dila-tion step parameter which should be always greater than one and b0 is the position parameter.
The original signal is passed through a low-pass and high-pass digital filter hd(n) and gd(n). The coefficients of first level decomposition signal are:
k
d )nk(h).n(f)n(cA 21 (3)
k
d )nk(g).n(f)n(cD 21 (4)
When these signals pass through another low pass digi-tal filter then second level wavelet coefficient can be ob-tained and this process we continued to calculate the “n” level approximation.
The wavelet coefficients are used for calculating ap-proximation as well as the detailed version of original signal, in different levels of resolutions, in the time do-main and these features is used for the detection and anal-ysis of PQ events in power systems.
Next, this chapter presents the application of WT for the detection and analysis of virtual digital signals for sags, swells and transient impulses.
The voltage signals are generated and processed by us-ing LabVIEW and Matlab environment software devel-opment. The sampling frequency is of 12.8 kHz with 256 samples per cycle for the supply frequency of 50 Hz. WT is applied to detect the voltage disturbances such as volt-age sags, swells and transient impulses. The frequency bands of WT coefficients are shown in Table I.
TABLE I. FREQUENCY BANDS OF DWT COEFFICIENTS AT DIFFERENT LEVELS
Coefficients Frequency Band (Hz) d1 6400-12800 d2 3200-6400 d3 1600-3200 d4 800-1600 d5 400-800 d6 200-400 d7 100-200 d8 50-100 d9 25-50
The WT analysis of signals by using the Db5 wavelet for voltage sag, swell, and transient impulse, and the de-tailed coefficients at seven levels (d1 to d9) and approxi-mation coefficient at level 9 (a9) are presented in Fig. 1, 2 and 3 respectively.
By analyzing the d1 coefficient, it is noted that for both the sag and the swell phenomenon, the start and end points are of 0.05 s (sample no. 640) respectively 0.15 s (sample no. 1920).
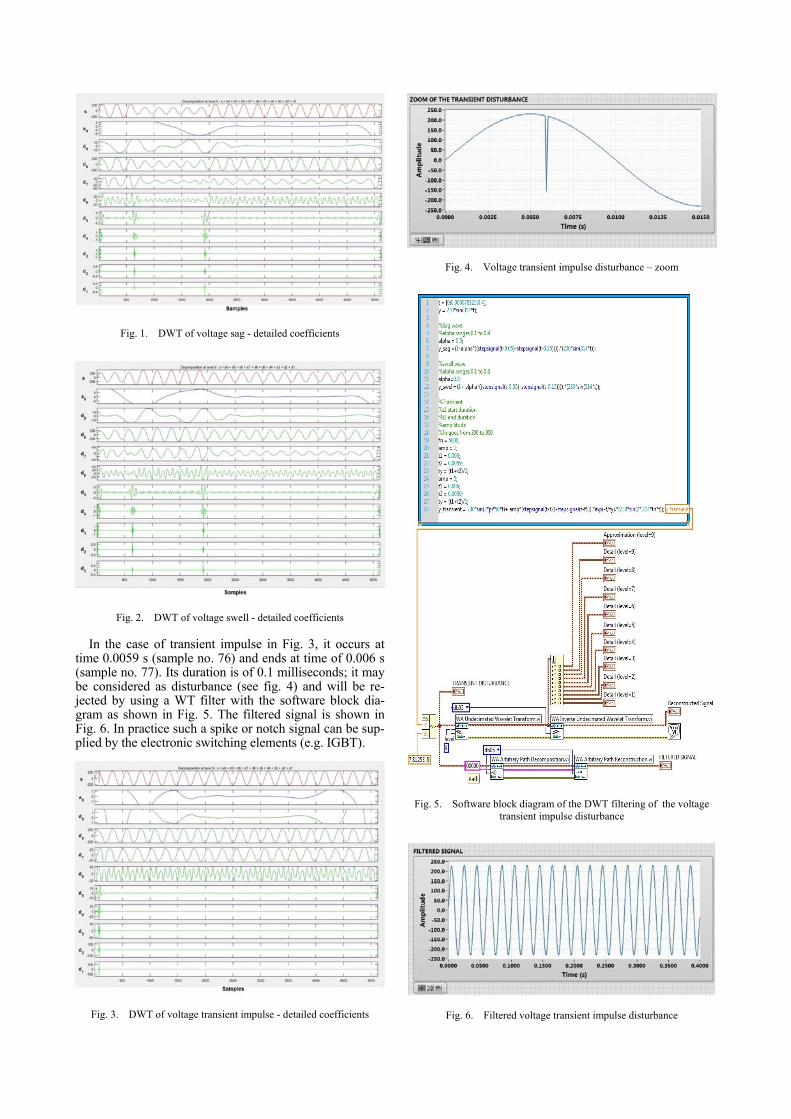
Fig. 1. DWT of voltage sag - detailed coefficients
Fig. 2. DWT of voltage swell - detailed coefficients
In the case of transient impulse in Fig. 3, it occurs at time 0.0059 s (sample no. 76) and ends at time of 0.006 s (sample no. 77). Its duration is of 0.1 milliseconds; it may be considered as disturbance (see fig. 4) and will be re-jected by using a WT filter with the software block dia-gram as shown in Fig. 5. The filtered signal is shown in Fig. 6. In practice such a spike or notch signal can be sup-plied by the electronic switching elements (e.g. IGBT).
Fig. 3. DWT of voltage transient impulse - detailed coefficients
Fig. 4. Voltage transient impulse disturbance – zoom
Fig. 5. Software block diagram of the DWT filtering of the voltage transient impulse disturbance
Fig. 6. Filtered voltage transient impulse disturbance
III. HARDWARE AND SOFTWARE DESCRIPTION
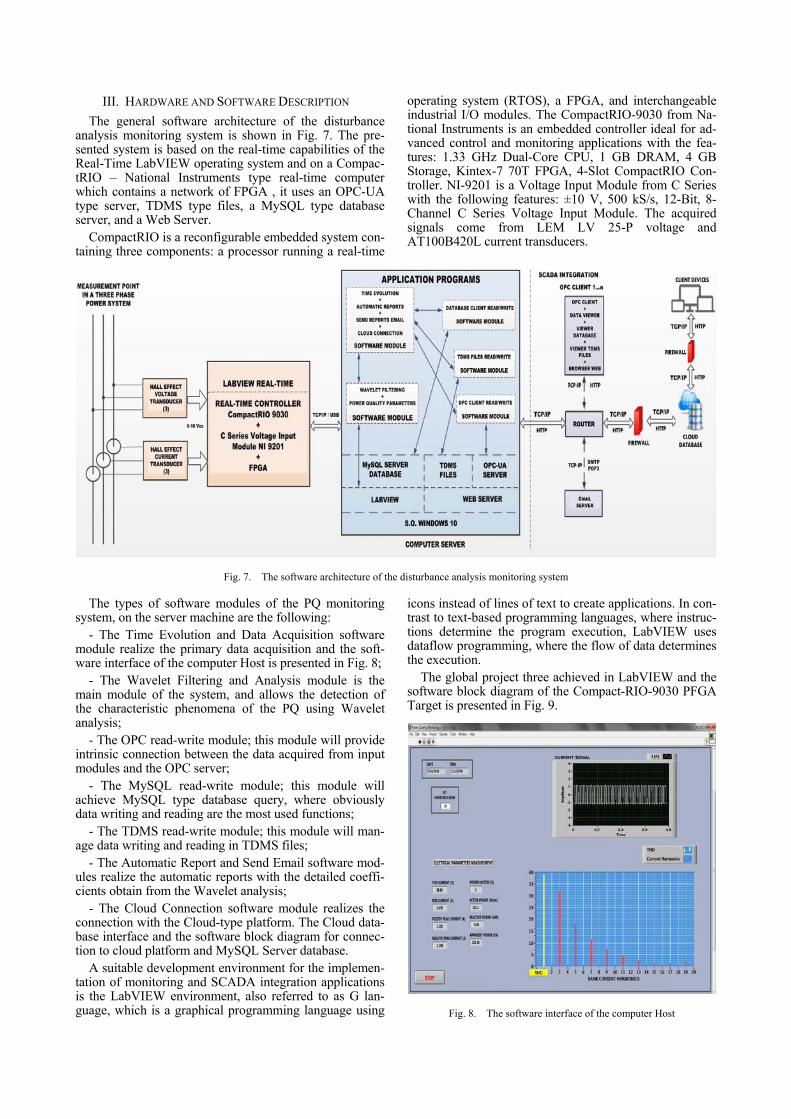
The general software architecture of the disturbance analysis monitoring system is shown in Fig. 7. The pre-sented system is based on the real-time capabilities of the Real-Time LabVIEW operating system and on a Compac-tRIO – National Instruments type real-time computer which contains a network of FPGA , it uses an OPC-UA type server, TDMS type files, a MySQL type database server, and a Web Server.
CompactRIO is a reconfigurable embedded system con-taining three components: a processor running a real-time
operating system (RTOS), a FPGA, and interchangeable industrial I/O modules. The CompactRIO-9030 from Na-tional Instruments is an embedded controller ideal for ad-vanced control and monitoring applications with the fea-tures: 1.33 GHz Dual-Core CPU, 1 GB DRAM, 4 GB Storage, Kintex-7 70T FPGA, 4-Slot CompactRIO Con-troller. NI-9201 is a Voltage Input Module from C Series with the following features: ±10 V, 500 kS/s, 12-Bit, 8-Channel C Series Voltage Input Module. The acquired signals come from LEM LV 25-P voltage and AT100B420L current transducers.
Fig. 7. The software architecture of the disturbance analysis monitoring system
The types of software modules of the PQ monitoring system, on the server machine are the following:
- The Time Evolution and Data Acquisition software module realize the primary data acquisition and the soft-ware interface of the computer Host is presented in Fig. 8;
- The Wavelet Filtering and Analysis module is the main module of the system, and allows the detection of the characteristic phenomena of the PQ using Wavelet analysis;
- The OPC read-write module; this module will provide intrinsic connection between the data acquired from input modules and the OPC server;
- The MySQL read-write module; this module will achieve MySQL type database query, where obviously data writing and reading are the most used functions;
- The TDMS read-write module; this module will man-age data writing and reading in TDMS files;
- The Automatic Report and Send Email software mod-ules realize the automatic reports with the detailed coeffi-cients obtain from the Wavelet analysis;
- The Cloud Connection software module realizes the connection with the Cloud-type platform. The Cloud data-base interface and the software block diagram for connec-tion to cloud platform and MySQL Server database.
A suitable development environment for the implemen-tation of monitoring and SCADA integration applications is the LabVIEW environment, also referred to as G lan-guage, which is a graphical programming language using
icons instead of lines of text to create applications. In con-trast to text-based programming languages, where instruc-tions determine the program execution, LabVIEW uses dataflow programming, where the flow of data determines the execution.
The global project three achieved in LabVIEW and the software block diagram of the Compact-RIO-9030 PFGA Target is presented in Fig. 9.
Fig. 8. The software interface of the computer Host

The initial filtering of the acquired signals consists of eliminating the transient impulses of less than 0.1 milli-seconds, and is performed using a 10 kHz Butterworth Filter, implemented in the FPGA target, in a loop that runs cyclically at 78 microseconds. The transfer mode of the data between the FPGA Target and the Host computer is achieved through the DMA (Direct Memory Access) transfer RT FIFO (Real Time First-In-First-Out memory buffers) type.
For SCADA integration of the presented application is used the OPC Unified Architecture (UA) which is a new communication technology standard. This new communi-cation technology is based on the OPC and includes all the functionality of the OPC Classic. In OPC UA are im-proved the security and the easiness to connection of the non-windows platform [24].
The software interface for disturbance analysis monitor-ing system based on OPC UA Server is shown in Fig. 10 and contains: the software block diagram OPC UA Server SCADA integration, the software block diagram of the client write data toward OPC UA Server and the software block diagram of the client read data from OPC UA Serv-er.
Fig. 9. The PQ monitoring project with the software block diagram of the Compact-RIO-9030 FPGA Target
Fig. 10. Disturbance analysis monitoring system – SCADA integration: (a) OPC UA Server software interface, (b) Software block diagram OPC UA Server SCADA integration, (c) Software block diagram of the client write data OPC UA Server, (d) Software block diagram of the client read data
OPC UA Server
For reading and writing the database of application is used a DataSources (ODBC) type connection.
A cloud database is a database that typically runs on a cloud computing platform, access to it is provided as a service. The dashboard editor is a powerful, flexible tool that helps you design the interface you require.
Fig. 11, (a) shows a sample of the database from which a Word type report can be automatically generated and printed, Fig. 11, (b) shows the Cloud database interface,
and Fig. 11, (c) shows the software block diagram for connection to cloud and MySQL Server database.
The application program automatically generates emails with automatic reports at predefined addresses based on the support of ActiveX Containers, and ActiveX Events included in LabVIEW programming environment.
In Fig. 11, (d) is presented the software block diagram for the implementation in LabVIEW of the Send Auto-matic Report Email Module.

Fig. 11. Disturbance analysis monitoring system – connection MySQL and Cloud database and Gmail Server: (a) Database selection software inter-face, (b) Cloud database interface, (c) The software block diagram for connection to cloud and MySQL Server database, (d) Send Automatic Report
Email Module software block diagram
The exchange of live data with other applications on different computers from Intranet/Internet is assured by an integrated Web Server. The method used to transmit data between Web Browser and Web Server is by type POST HTTP method.
In Fig. 12, (a) is presented the time evolution of PQ pa-rameters using a Web Browser.
The reading and writing of global variables is achieved used a LabVIEW Web Service Request and is presented in Fig. 12, (b).
Fig. 12. Disturbance analysis monitoring system – Intranet/Internet integration: (a) PQ parameters Web Browser time evolution, (b) LabVIEW Web-Service request for HTTP Method software block diagram

IV. PRACTICAL EXPERIMENT
For testing the disturbance analysis monitoring system a practical experiment has been carried out in a laboratory environment whose components are presented in Fig. 13. The computer server and the Host computer implements the software architecture presented in previous section.
Fig. 13. Image of the practical experiment
The current and the voltage signals are taken from the load, supplied from main network supply through a UPS (Uninterruptible Power Supply), processed by the trans-ducers Hall type acquired through a Compact-RIO-9030 with FPGA in a system with LabVIEW real time capabili-ties.
Starting with the results from [23-24] where are pre-sented some problems which occur in the network when supplying a consumer from an UPS, in this practical ex-periment, is analyzed with Wavelet transform means, the phenomenon of coupling and decoupling from a UPS (See Fig. 14).
Fig. 14. The acquired current signal: a) At switching between main network supply and capacitors bank of the UPS; b) Detailed of the start-
ing process; c) Detailed of the ending process
The WT analysis of signal by using the Db10 wavelet for current sag harmonics, and the detailed coefficients at nine levels (d1 to d9) and approximation coefficient at level nine (a9) are presented in Fig. 15.
Fig. 15. DWT of current sag with harmonics - detailed coefficients
The waveform graph from the software interface of the current swell disturbance signal is presented in Fig. 16. The WT analysis of signal by using the Db10 wavelet for swell disturbance, and the detailed coefficients at nine levels (d1 to d9) and approximation coefficient at level nine (a9) are presented in Fig. 17.
Fig. 16. Current swell disturbance signal
Fig. 17. DWT of current swell - detailed coefficients
For the current interrupt disturbance the waveform graph is presented in Fig. 18. The WT analysis of signal by using the Db10 wavelet for interrupt disturbance, and the detailed coefficients at nine levels (d1 to d9) and ap-proximation coefficient at level nine (a9) are presented in Fig. 19.

Fig. 18. Current interrupt disturbance signal
Fig. 19. DWT of current interrupt disturbance - detailed coefficients
V. CONCLUSIONS
This article presents the implementation of a distur-bance analysis system, based on LabVIEW Real-Time and reconfigurable FPGA modules using Wavelet Transform.
The presented disturbance analysis monitoring system contains a pre-filtering module for removal of spikes, achieves the storage of entries as TDMS files and Word/Excel type automatic reports automatically sent by email at predefined addresses, contains an OPC UA type server for communication with a hierarchically superior SCADA type system, performs selective entry of the char-acteristic parameters into a database, contains a Web Server for Intranet/Internet access, for viewing the meas-ured data, and for system management from anywhere, the application is connected to a Cloud-type platform. The main Module is the Wavelet Filtering and Analysis and allows the detection of the characteristic phenomena of the PQ with Wavelet analysis.
The disturbance analysis monitoring system was tested with simulated signals but even in a practical experiment. The future researches will concern on the automatic clas-sifications of the PQ events and on the software optimiza-tion.
ACKNOWLEDGMENT
The paper was developed with funds from the Ministry of Scientific Research as part of the NUCLEU Program: PN 18 25 02 03.
Contribution of authors: First author – 40%
First coauthor – 30% Second coauthor – 10% Third coauthor – 10% Fourth coauthor – 10% Received on November 9, 2018 Editorial Approval on December 03, 2018
REFERENCES
[1] M. H. Sazli, İ. Koşalay and G. Erdenesaikhan, “A brief review of
power quality issues in smart grid and a simple user friendly soft-ware," 2018 6th International Istanbul Smart Grids and Cities Congress and Fair (ICSG), Istanbul, Turkey, 2018, pp. 54-58.
[2] M. Youhannaei, H. Mokhtari, M. E. Honarmand, J. Talebi and A. Sharifi, “Power quality observation algorithm to power distribu-tion network,” in CIRED - Open Access Proceedings Journal, vol. 2017, no. 1, pp. 823-827, October 2017.
[3] L. Luo, S. Chen, Y. Yang, S. Yuan, H. Luo and Y. Hu, “Design and application of power quality monitoring system for the smart substation based on IEC 61850,” in CIRED - Open Access Pro-ceedings Journal, vol. 2017, no. 1, pp. 577-580, October 2017.
[4] S. Rönnberg, M. Bollen and J. Nömm, “Power quality measure-ments in a single-house microgrid,” in CIRED - Open Access Pro-ceedings Journal, vol. 2017, no. 1, pp. 818-822, October 2017.
[5] S. Das, A. K. Pradhan, A. Kedia, S. Dalai, B. Chatterjee and S. Chakravorti, “Diagnosis of Power Quality Events Based on De-trended Fluctuation Analysis,” in IEEE Transactions on Industrial Electronics, vol. 65, no. 9, pp. 7322-7331, September 2018.
[6] B. Biswal, M. Biswal, S. Mishra and R. Jalaja, “Automatic Classi-fication of Power Quality Events Using Balanced Neural Tree,” in IEEE Transactions on Industrial Electronics, vol. 61, no. 1, pp. 521-530, January 2014.
[7] M. Valtierra-Rodriguez, R. de Jesus Romero-Troncoso, R. A. Osornio-Rios and A. Garcia-Perez, “Detection and Classification of Single and Combined Power Quality Disturbances Using Neu-ral Networks,” in IEEE Transactions on Industrial Electronics, vol. 61, no. 5, pp. 2473-2482, May 2014.
[8] C. Nicola et al., “Quality analysis of electric energy using an inter-face developed in LabVIEW environment,” 2016 International Conference on Applied and Theoretical Electricity (ICATE), Cra-iova, Romania, 2016, pp. 1-6.
[9] V. Kumar, S. K. Gawre and T. Kumar, “Power Quality Analysis Using Wavelet Transform: A Review” in The International Jour-nal of Innovative Research in Science, Engineering and Technol-ogy (IJIRSET), vol. 3, no. 3, pp. 130-136, March 2014.
[10] F. Z. Dekhandji, “Detection of power quality disturbances using discrete wavelet transform,” 2017 5th International Conference on Electrical Engineering - Boumerdes (ICEE-B), Boumerdes, Alge-ria, 2017, pp. 1-5.
[11] F. M. Arrabal-Campos, F. G. Montoya, R. Baños, J. Martínez-Lao and A. Alcayde, “Simulation of power quality disturbances through the wavelet transform,” 2018 18th International Confer-ence on Harmonics and Quality of Power (ICHQP), Ljubljana, Slovenia, 2018, pp. 1-5.
[12] B. Eristi, O. Yildirim, H. Eristi and Y. Demir, “A real-time power quality disturbance detection system based on the wavelet trans-form,” 2016 51st International Universities Power Engineering Conference (UPEC), Coimbra, Portugal, 2016, pp. 1-5.
[13] F. Hafiz, S. Abecrombie, A. Eaton, C. Naik and A. Swain, “Power quality event identification using wavelet packet transform: A comprehensive investigation,” TENCON 2017 - 2017 IEEE Re-gion 10 Conference, Penang, Malaysia, 2017, pp. 2978-2983.
[14] M. A. S. Masoum, S. Jamali and N. Ghaffarzadeh, “Detection and classification of power quality disturbances using discrete wavelet transform and wavelet networks,” in IET Science, Measurement & Technology, vol. 4, no. 4, pp. 193-205, July 2010.
[15] M. Lopez-Ramirez, L. M. Ledesma-Carrillo, A. L. Martínez-Herrera, E. Cabal-Yepez and H. Miranda-Vidales, “FPGA-based reconfigurable unit for real-time power quality index estimation,”

2014 International Conference on ReConFigurable Computing and FPGAs (ReConFig14), Cancun, Mexico, 2014, pp. 1-6.
[16] Ö. Yildirim, B. Eri�şti�, H. Eri�şti�, S. Ünal, Y. Erol and Y. Demi�R, “An FPGA based power quality monitoring system,” 2015 23nd Signal Processing and Communications Applications Conference (SIU), Malatya, Turkey, 2015, pp. 1292-1295.
[17] K. V. Parimala and K. C. R. Nisha, “FPGA based power quality monitoring using FFT method for single phase power metering,” 2016 International Conference on Emerging Technological Trends (ICETT), Kollam, India, 2016, pp. 1-6.
[18] Y. Biletskiy, S. Nanacekivell, Liuchen Chang and Riming Shao, “An FPGA-based power quality monitoring and event identifier,” 2017 IEEE 8th International Symposium on Power Electronics for Distributed Generation Systems (PEDG), Florianopolis, Brazil, 2017, pp. 1-6.
[19] G. Petrović, I. Šimić, J. A. Bosnić and P. Mostarac, “Power qual-ity meter based on FPGA and LabVIEW,” 2017 11th International Conference on Measurement, Smolenice, Slovakia, 2017, pp. 151-154.
[20] J. Esim, I. J. Oleagordia and S. Loureiro, “Research and Devel-opment of a Virtual Instrument for Measurement Analysis and Monitoring of the Power Quality,” in Journal of Fundamentals of
Renewable Energy and Applications, vol. 5, no. 5, pp. 185-191, October 2015.
[21] G. D. J. Martinez-Figueroa, D. Morinigo-Sotelo, A. L. Zorita-Lamadrid, L. Morales-Velazquez and R. D. J. Romero-Troncoso, “FPGA-Based Smart Sensor for Detection and Classification of Power Quality Disturbances Using Higher Order Statistics,” in IEEE Access, vol. 5, pp. 14259-14274, July 2017.
[22] M. Nicola, C. I. Nicola, M. Du�ă and D. Sacerdo�ianu, “SCADA Systems Architecture Based on OPC and Web Servers and Inte-gration of Applications for Industrial Process Control,” in Interna-tional Journal of Control Science and Engineering, vol. 8, no. 1, pp. 13-21, July 2018.
[23] M. C. Niţu, C. Nicola, V. Voicu, S. Popescu and M. Nicola, “Analysis using virtual instrumentation of perturbations induced in the network to supply a consumer from a UPS,” 2016 Interna-tional Conference on Applied and Theoretical Electricity (ICATE), Craiova, Romania, 2016, pp. 1-6.
[24] C. Nicola, et al., “Causes and methods of eliminating the distur-bances which occur in the network when supplying a consumer from an UPS using virtual instrumentation,” in International Jour-nal of Engineering Technology and Scientific Innovation (IJETSI), vol. 2, no. 3, pp. 652-670, June 2017.