distributional implications of a carbon tax...distributional implications of a carbon tax 1255...
TRANSCRIPT

DISTRIBUTIONAL IMPLICATIONS OF A CARBON TAXBY JOSEPH ROSENBERG, ERIC TODER, AND CHENXI LU, URBAN-BROOKINGS TAX POLICY CENTER EDITED BY NOAH KAUFMAN, COLUMBIA SIPA CENTER ON GLOBAL ENERGY POLICYJULY 2018

ABOUT THE CENTER ON GLOBAL ENERGY POLICY
The Center on Global Energy Policy provides independent, balanced, data-driven analysis to help policymakers navigate the complex world of energy. We approach energy as an economic, security, and environmental concern. And we draw on the resources of a world-class institution, faculty with real-world experience, and a location in the world’s finance and media capital. Visit us at www.energypolicy.columbia.edu
@ColumbiaUenergy
ABOUT THE SCHOOL OF INTERNATIONAL AND PUBLIC AFFAIRS
SIPA’s mission is to empower people to serve the global public interest. Our goal is to foster economic growth, sustainable development, social progress, and democratic governance by educating public policy professionals, producing policy-related research, and conveying the results to the world. Based in New York City, with a student body that is 50 percent international and educational partners in cities around the world, SIPA is the most global of
public policy schools.
For more information, please visit www.sipa.columbia.edu
ABOUT THE TAX POLICY CENTER
The Urban-Brookings Tax Policy Center aims to provide independent analyses of current and longer-term tax issues and to communicate its analyses to the public and to policymakers in a timely and accessible manner. The Center combines top national experts in tax, expenditure, budget policy, and microsimulation modeling to concentrate on four overarching areas of tax policy that are critical to future debate. For more information, please visit www.taxpolicycenter.org www.rhg.com

DISTRIBUTIONAL IMPLICATIONS OF A CARBON TAX
1255 Amsterdam Ave New York NY 10027
www.energypolicy.columbia.edu
@ColumbiaUenergy
BY JOSEPH ROSENBERG, ERIC TODER, AND CHENXI LU, URBAN-BROOKINGS TAX POLICY CENTER
EDITED BY NOAH KAUFMAN, COLUMBIA SIPA CENTER ON GLOBAL ENERGY POLICY
JULY 2018

DISTRIBUTIONAL IMPLICATIONS OF A CARBON TAX
3 | CENTER ON GLOBAL ENERGY POLICY | COLUMBIA SIPA
The views expressed are those of the authors and should not be attributed the Urban-Brookings Tax Policy Center, the Urban Institute, the Brookings Institution, their trustees, or their funders.
This work was made possible by support from the Center on Global Energy Policy (CGEP). More information is available at http://energypolicy.columbia.edu/about/mission. The views expressed in this paper should not be attributed to Columbia University or CGEP.
The authors would like to thank Noah Kaufman, Jason Bordoff , Jesse McCormick, Matthew Robinson, Ron Minsk, Kate Gordon and Edwin Saliba at CGEP; Trevor Houser, John Larsen, and Shashank Mohan at the Rhodium Group; Anna Gossett for her work in designing the paper; and Donald Marron, Mark Mazur, and three anonymous reviewers for helpful comments.
ACKNOWLEDGEMENTS

DISTRIBUTIONAL IMPLICATIONS OF A CARBON TAX
ENERGYPOLICY.COLUMBIA.EDU | JUNE 2018 | 4
Joseph Rosenberg is a senior research associate in the Urban-Brookings Tax Policy Center at the Urban Institute, where his research focuses primarily on issues of federal taxation, including business and corporate taxation, broad-based consumption taxes, tax expenditures, and tax incentives for charitable giving. He also develops and maintains the Tax Policy Center’s microsimulation model of the federal tax system, which is regularly used to produce analyses of the revenue and distributional impacts of federal tax policy that are broadly cited by policymakers and the press. Before joining Urban, Rosenberg worked at the Board of Governors of the Federal Reserve System in Washington, DC, and was a PhD candidate in economics at the University of California, Berkeley.
Eric Toder is an Institute fellow and codirector of the Urban-Brookings Tax Policy Center at the Urban Institute. In his current position, he oversees the modeling team at the Tax Policy Center; serves as its leading expert on corporate and international tax and tax compliance issues; and authors and directs research studies. Before joining Urban, Toder held a number of senior-level positions in tax policy offices in the US government and overseas, including service as deputy assistant secretary for the Office of Tax Analysis at the US Department of the Treasury; director of research at the Internal Revenue Service; deputy assistant director for the Office of Tax Analysis at the Congressional Budget Office; and consultant to the New Zealand Treasury. He has also served as a part-time consultant to the International Monetary Fund and serves as treasurer of the National Tax Association
Chenxi Lu is a research analyst in the Urban-Brookings Tax Policy Center at the Urban Institute, where she works on the microsimulation model of the federal tax system. Lu earned her BA in mathematical economics from Fudan University and her MPP from Georgetown University.
ABOUT THE AUTHORS

DISTRIBUTIONAL IMPLICATIONS OF A CARBON TAX
5 | CENTER ON GLOBAL ENERGY POLICY | COLUMBIA SIPA
Executive Summary
Introduction
Overview of Distributional Methodology
General Approach for Distributing Consumption Taxes
Application to a Carbon Tax
Does a Carbon Tax Also Affect the Normal Return to Capital?
Alternative Methods of Distributing Consumption Taxes
Carbon Tax Simulations
Revenue Effects
Relative Price Effects
Revenue Recycling Options
Distributional Effecs of a Carbon Tax
Combined Distributional Effecs of a Carbon Tax and Revenue Recycling Options
Conclusions
Appendix A: Using the Ratio of Carbon Consumption to Income by Income Group to Allocate the Burden of a Carbon Tax
Appendix B: Distributional Results Assuming the Normal Return to Capital Bears Some Burden from Carbon Tax
Appendix C: Brief Description of TPC Microsimulation Model
Notes
References
TABLE OF CONTENTS
06
07
08
09
10
11
12
13
13
15
17
18
21
28
29
30
35
37
39
TABLE OF CONTENTS

DISTRIBUTIONAL IMPLICATIONS OF A CARBON TAX
ENERGYPOLICY.COLUMBIA.EDU | JUNE 2018 | 6
A federal carbon tax in the United States would reduce greenhouse gas emissions and generate significant new revenue for the federal government. In this study, part of the Carbon Tax Research Initiative led by Columbia University’s SIPA Center on Global Energy Policy (CGEP), the Urban-Brookings Tax Policy Center (TPC) estimates the effects of various potential carbon taxes on the tax burdens of US households across the income distribution.
In a separate study, the Rhodium Group (RHG) uses its version of the National Energy Modeling System to estimate the effects of the same carbon taxes on energy market outcomes, including the prices of consumer goods. The outputs of the RHG analysis are inputs to this study, which uses Urban-Brookings Tax Policy Center’s large-scale microsimulation model to distribute the burden of a carbon tax across US households of different income levels.
We consider three carbon tax scenarios that would price carbon at roughly $14, $50, and $73 per metric ton starting in 2020 and increasing thereafter between 1 and 3 percent per year. A carbon tax at those rates would raise a significant amount of federal revenue, ranging from $740 billion ($14/ton scenario) to $3 trillion ($73/ton scenario) over a 10-year period. We consider four options for the use of this revenue: reducing the federal deficit, reducing payroll taxes, reducing the corporate income tax, and providing per capita household rebates.
Depending on how the revenue is used, a carbon tax policy can have dramatically different effects on the distribution of tax burdens. When revenue is used to reduce the deficit, a carbon tax is moderately regressive—that is, it increases taxes by a larger percentage of income for lower-income households than for higher-income households. Using revenue to reduce the corporate income tax (beyond the corporate tax cut in the recent Tax Cuts and Jobs Act) would result in higher taxes for low-income families and disproportionate benefits for higher-income taxpayers. Using revenue to provide lump-sum rebates would more than offset the carbon tax burden for low- and middle-income taxpayers but leave high-income families with a net tax increase. Using carbon tax revenues to reduce employee payroll taxes would result in a net benefit for upper middle-income taxpayers, while increasing tax burdens modestly for low-income and the highest-income households.
Our study is the first of which we are aware to estimate the distributional implications of a carbon tax since the passage of the Tax Cuts and Jobs Act of 2017. Our results are consistent with the findings of previous similar studies that have showed an overall carbon tax policy can be progressive, regressive, or neither, depending on how the revenue is used.
EXECUTIVE SUMMARY

DISTRIBUTIONAL IMPLICATIONS OF A CARBON TAX
7 | CENTER ON GLOBAL ENERGY POLICY | COLUMBIA SIPA
With the ink still drying on the recently passed tax overhaul, there are compelling reasons for US policymakers to consider adopting a national-level carbon tax. First, there is a strong economic (Diamond and Zodrow 2018) and political case for a carbon tax to address the growing concern about the social, environmental, and financial costs of climate change due to carbon emissions (Larsen, Mohan, Ferndon, and Marsters 2018). Second, with projected annual federal deficits of nearly $1 trillion and growing, there is also a compelling fiscal case for a carbon tax as a new revenue source for the federal government. Among the many important issues to consider in the design and implementation of a carbon tax (see Marron and Toder 2014 and Marron, Toder, and Austin 2015), one consideration is what effect a carbon tax would have on the distribution of federal tax burdens.
In this paper, part of the Carbon Tax Research Initiative led by Columbia University’s SIPA Center on Global Energy Policy (CGEP), the Urban-Brookings Tax Policy Center (referred to throughout this paper as “we”) estimates how a carbon tax would affect the distribution of tax burdens across US taxpayers.
We consider three carbon tax scenarios that would price carbon at roughly $14, $50, and $73 (in 2016 dollars) per metric ton starting in 2020 and increasing thereafter between 1 and 3 percent per year. A carbon tax at those rates would raise a significant amount of federal revenue, ranging from $740 billion (low scenario) to $3 trillion (high scenario) over a 10-year period. We also consider three options to return the carbon tax revenue back to households—leaving the overall tax burden constant—including reducing payroll taxes, reducing the corporate income tax, and providing per capita household rebates. Each of these options would have dramatically different effects on the distribution of tax burdens. The combination of reducing the corporate income tax (beyond the corporate tax cut in the recent Tax Cuts and Jobs Act) and imposing a carbon tax would hurt low-income families and disproportionately benefit higher-income taxpayers. Lump-sum rebates would more than offset the carbon tax burden for low- and middle-income taxpayers but leave high-income families with a net tax increase. Using carbon tax revenues to reduce employee payroll taxes would result in a net benefit for upper middle-income taxpayers, while increasing tax burdens modestly for low-income and the highest-income households.
We proceed by first outlining TPC’s general methodology for distributing the burden of a carbon tax, which involves modeling the policy as a special case of a general consumption tax. We then describe the carbon tax and revenue recycling.
INTRODUCTION

DISTRIBUTIONAL IMPLICATIONS OF A CARBON TAX
ENERGYPOLICY.COLUMBIA.EDU | JUNE 2018 | 8
TPC distributes the burden of excise taxes, including a carbon tax, among income groups as a special case of its more general approach to distributing the burden of a broad-based consumption tax (Toder, Nunns, and Rosenberg 2011). Consumption taxes, including carbon taxes, drive a wedge between prices paid by purchasers of taxed goods and prices received by firms that sell them. Any reduction in prices firms receive reduces the sum of the wages and benefits they pay their employees and the profits they receive. Thus, depending on the extent to which monetary authorities enable prices to rise, consumption taxes must either raise the overall price level or reduce wages and profits. Either way, a consumption tax reduces the real purchasing power of wage earners and business owners.
The profits of business owners come from two sources. First, investors in a business (or with financial claims in a business) must receive a return to compensate them for deferring consumption. The rate of return they earn must equal the interest rate they could receive on risk-free bonds plus a premium to compensate them for the risk they assume by investing in an asset with uncertain returns (the risk premium). We refer to this as the “normal return” to the business owner. Second, profits can reflect unique attributes of the business, whether they come from access to scarce natural resources, superior organizational attributes of the firm, or patents on products they have developed. This component of profits is often called “economic rent” or “supernormal” profits. The classical example of economic rent is the return to a farmer who owns more fertile land than his or her neighbors. But it could also apply to a pharmaceutical company holding patents that confer a temporary monopoly right to produce and market new highly profitable drugs or to a company with a brand-name reputation that enables it to earn higher profits than its competitors.
A consumption tax does not reduce the rate of return that investors can earn from owning shares in a business, because under a consumption tax firms can either exclude or deduct the cost of capital goods they purchase. Instead, unlike an income tax, a consumption tax exempts the portion of profits that represents a normal return to capital (interest plus a risk premium) and includes in its base only the portion of profits that represents economic rents (or “supernormal” profits). TPC assumes, therefore, that in the long run taxpayers bear the burden of a uniform consumption tax, such as a value-added tax, in proportion to the sum of their labor compensation, wage-indexed transfer payments, and supernormal returns to capital, but that a consumption tax exempts normal investment returns.
In addition to reducing real incomes in this manner, a consumption tax that imposes different rates on different goods and services (such as selective excises, including a carbon tax) also reallocates tax burdens among consumers based on the share of their income they spend on taxable goods relative to their spending on all goods and services. Consumers with relatively high spending on taxable goods incur an additional tax burden, and consumers with relatively low spending on taxable goods see their tax burden reduced compared with the burden the tax imposes by lowering their real incomes.
OVERVIEW OF DISTRIBUTIONAL METHODOLOGY

DISTRIBUTIONAL IMPLICATIONS OF A CARBON TAX
9 | CENTER ON GLOBAL ENERGY POLICY | COLUMBIA SIPA
General Approach for Distributing Consumption Taxes
Sources versus Uses
Distributional estimates assign the burden of taxes among households in different income groups. Households differ from each other in how they earn income (their sources of income) and how they spend income (their uses of income).
● Sources. Household income consists of earnings (cash wages, noncash compensation, and the labor component of income from active ownership of businesses), income from investments (interest income, capital gains, dividends, wealth accruals within retirement accounts), and the profits from ownership of “pass-through” businesses. People at different income levels have different shares of income from earnings and investments, so the composition of income can affect the distribution of tax burdens by income level. In general, investment income is much more concentrated than earnings among higher-income households. Because a consumption tax exempts a portion of investment income, it is less progressive than a tax on all income.
● Uses. Consumption patterns among households also differ by level of household income. Low-income households devote a relatively larger share of their consumption to some goods and services (for example, tobacco products and home heating oil), while higher-income households allocate a larger share of their total spending to other goods and services (for example, luxury automobiles and foreign travel). Selective excise taxes therefore may impose relatively larger burdens on some households than others, compared with more broad-based consumption taxes. In general, lower-income households spend a larger share of their total consumption on carbon-intensive goods (electric power, gasoline, home heating fuels) than upper-income households, which also makes a carbon tax less progressive than a uniform tax on all income.
How Consumption Taxes Affect Sources of Income
Consumption taxes reduce real incomes by reducing the ratio of wages of workers and profits of business owners to average prices that consumers must pay.
In general, consumption taxes can be viewed as income taxes that exempt the portion of income that households save.1 Exempting saving is equivalent to exempting the return to saving. Thus, consumption taxes in general do not impose a burden on normal returns to capital, defined as the investment income people receive as the reward for deferring consumption (time value of money) plus an average risk premium. Consumption taxes, however, do not exempt all income that people receive from dividends, capital gains, and profits of businesses they own. To the extent that these returns reflect supernormal returns, they would be captured by a consumption tax. TPC estimates that about 60 percent of business profits represent economic rents or supernormal returns, not the reward for deferring consumption.2
TPC therefore allocates the burden of a consumption tax to all sources of income except for normal returns to capital. These income sources include wages, nonwage compensation, wage-indexed transfer payments, and the share of business profits that represent supernormal returns.

DISTRIBUTIONAL IMPLICATIONS OF A CARBON TAX
ENERGYPOLICY.COLUMBIA.EDU | JUNE 2018 | 10
In modeling changes in consumption taxes, TPC also assumes that Social Security benefits and other wage-indexed transfer payments bear the burden of a consumption tax in the long run. This is because the starting level of benefits that retirees and recipients of disability benefits receive is indexed to the growth in the national average wage. Because a consumption tax reduces real wages (either by raising prices or lowering nominal wages), it will eventually lower the real value of transfer payments that are indexed to the average wage level. (If the government were to adjust starting Social Security benefits to offset the effects of a new consumption tax, then benefit recipients would not bear any burden from the tax, and federal outlays would increase.) This is a long-run impact; in the short run, existing beneficiaries are held harmless because their starting benefit has already been determined and their growth in benefits is indexed to the change in the consumer price index. If the consumption tax raises the price level, current beneficiaries will be held harmless because benefits will increase with the price level. If it reduces wages instead of raising prices, current beneficiaries will also be held harmless because their benefits are then fixed in nominal terms.
How Consumption Taxes Affect Uses of Income
In addition to reducing real incomes, taxes also affect the relative prices that people pay for different consumer goods. Most consumption taxes around the world, including sales taxes in the United States, exempt from tax certain goods and services and impose preferential rates on others. By doing so, they discriminate among consumers based on the mixture of goods and services they consume. Households who spend relatively more of their total consumption on heavily taxed goods and services bear a higher burden than those who spend relatively more on tax-exempt or more lightly taxed goods and services.
TPC implements this uses-side effect in its estimate of the distributional burden by assigning to each household an additional burden or benefit based on the change in the cost of the household’s total spending on goods and services resulting from the tax. If the household spends a larger share of total consumption than the average household on highly taxed goods, then the household has a positive uses-side burden; if the household spends relatively less on highly taxed goods, then the household has a negative uses-side burden. Across all households, the uses-side burden adds up to zero, leaving the total tax burden equal to the amount it reduces real incomes.
Application to a Carbon Tax
TPC models a carbon tax as a selective excise tax on the carbon content of goods.3 It directly raises the relative prices of energy products used by consumers, including gasoline, home heating fuels, and electricity generated by plants powered by coal, natural gas, and oil. In addition, it indirectly raises consumer prices through the contribution of resources with carbon content to the sectors (manufacturing, transportation, power generation) that provide inputs to final consumer goods.
Determining how a carbon tax would affect prices in the economy requires a model that estimates how such a tax would affect the final prices of consumer goods. As part of this project, CGEP has contracted with the Rhodium Group to supply such estimates, based on the Rhodium Group’s version of the National Energy Modeling System (NEMS), which

DISTRIBUTIONAL IMPLICATIONS OF A CARBON TAX
11 | CENTER ON GLOBAL ENERGY POLICY | COLUMBIA SIPA
is developed by modelers at the US Energy Information Administration. For the estimates presented in this paper, TPC uses information provided by the Rhodium Group of the effects of a carbon tax on the relative prices of different goods and services.
TPC distributes the sources-side burden of a carbon tax to each tax unit in proportion to their sum of labor compensation, the labor share of business income, wage-indexed transfer payments, and super-normal returns to capital. It then distributes the uses-side effect by increasing or reducing burdens to households depending on the change in cost for the bundle of goods they consume.
Does a Carbon Tax Also Affect the Normal Return to Capital?
Carbon taxes apply to both final consumer goods and inputs used in production, including capital inputs. If, for example, a building or piece of equipment is manufactured by a process that uses carbon-based fuels in production, the carbon tax will increase the price of that capital good and raise the price of consumer goods and services that use those capital goods as inputs in production.
A carbon tax by itself does not affect the relative price of current and future consumption goods and thus does not by itself reduce the normal return to investment. It simply makes goods produced with carbon-intensive technologies, including technology used to produce capital inputs, more expensive than other goods.
In combination with the current income tax, however, a carbon tax could reduce the rate of return to investment because the income tax does not allow the full and immediate recovery of costs firms incur by purchasing capital inputs. Instead, firms can only recover these costs over time through depreciation. An income tax, therefore, does reduce the rate of return to investment. By increasing the price of investment goods, a carbon tax can raise the share of costs in the economy that firms cannot recover through an immediate deduction. Through this mechanism, a carbon tax can reduce the overall rate of return to investment in the economy. By doing so, it would impose some burden on the household income that comes in the form of a normal return to capital.
TPC does not have any reliable estimates of how much a carbon tax reduces the returns to capital or, more broadly, how much it might change the shares of after-tax income received by labor and capital. For the distributional estimates presented in the main paper, we assume the carbon tax imposes no burden on the normal return to capital. That is, we allocate the burden in proportion to the sum of labor compensation, wage-indexed transfer payments, the labor share of business income, and supernormal returns to capital. We present alternative estimates in appendix B, where we allocate the burden in proportion to the sum of labor compensation, wage-indexed transfer payments, the labor share of business income, supernormal returns to capital, and 50 percent of normal returns to capital. The 50 percent assumption is used to illustrate how an assumption that normal returns bear some of the burden would affect the distributional results.
Alternative Methods of Distributing Consumption Taxes
The consensus from the literature is that a carbon tax imposes larger burdens on lower-

DISTRIBUTIONAL IMPLICATIONS OF A CARBON TAX
ENERGYPOLICY.COLUMBIA.EDU | JUNE 2018 | 12
income households when measured as a percentage of annual income, but the pattern of tax burdens across the income distribution varies depending on the specific assumptions and methods used. Below we summarize a few of the important methodological differences for measuring distributional effects across income groups. Other studies have looked at the distributional implications of a carbon tax among taxpayers within income groups (Rausch, Metcalf, and Reilly 2011 and Cronin, Fullerton, and Sexton 2017), and across geographical regions (Hassett, Mathur, and Metcalf 2009). A more complete review of the literature is presented in Cronin, Fullerton, and Sexton (2017).
One of the important methodological differences across studies is whether the incidence of a carbon tax is assigned based on changes in prices (i.e., “uses”) or factor incomes (i.e., “sources”). Some studies—including Hassett, Mathur, and Metcalf (2009); Dinan (2012); and Cronin, Fullerton, and Sexton (2017)—assume the carbon tax is fully passed through into consumer prices and assigns the burden of a carbon tax based on ratio of the consumption expenditures of households to income. Other studies—including Metcalf, Mathur, and Hassett (2010) and Mathur and Morris (2017)—have estimated the distributional implications of a carbon tax under different assumptions about the degree to which a carbon tax is passed forward into prices or backward into factor incomes. Additional discussion of why TPC believes its sources-based approach is preferable to uses-based methods is presented in appendix A.
Other studies have focused on the sensitivity of using annual income to measure the regressivity of a carbon tax. Poterba (1991) finds that the federal excise tax on gasoline is regressive when incidence is based on the ratio of gasoline consumption to annual income, but roughly proportional when the tax is assigned based on the ratio of gasoline consumption to total annual consumption. Others—including Hassett, Mathur, and Metcalf (2009) and Cronin, Fullerton, and Sexton (2017)—have also showed that a carbon tax is less regressive when measured as a fraction of annual consumption or some other proxy for lifetime income. We believe distributional estimates of consumption-based taxes are most useful when measured as a share of annual income to facilitate comparisons with distributional analyses of existing income-based taxes or revenue recycling options like those considered in this paper.
TPC’s methodology is most similar to that used by the US Treasury Department’s Office of Tax Analysis (OTA) as described in Horowitz et al. (2017). They also use a sources-based approach with relative price effects to assign the burden of a carbon tax using OTA’s distributional tax model. Horowitz et al. find that the burden from a carbon tax of roughly $50 per ton (before any revenue recycling options are considered) increases as a percentage of after-tax income up through the 90th income percentile and then declines with income in the top decile. The main difference between our results and those in Horowitz et al. is, as explained above, that we assume a carbon tax burdens Social Security and other wage-indexed transfer payments, and OTA does not. In that sense, our methodology reflects a “fully phased-in” analysis and better represents the long run effects of adopting a carbon tax.

DISTRIBUTIONAL IMPLICATIONS OF A CARBON TAX
13 | CENTER ON GLOBAL ENERGY POLICY | COLUMBIA SIPA
We consider three baseline carbon tax scenarios based on estimates provided by the Rhodium Group reflecting three estimates of the social cost of carbon (SC-CO2) released by an Obama administration working group (figure 1). (The Trump administration subsequently removed the OMB guidance requiring the use of the (SC-CO2) values in government analyses.) The low scenario would start at $14 (in 2016 dollars) per ton in 2020 and increase at a rate of about 3 percent per year (adjusted for inflation). The central scenario would start at $50 (in 2016 dollars) per ton in 2020 and increase at a rate of about 2 percent per year (adjusted for inflation). The high scenario would begin at $73 (in 2016 dollars) per ton in 2020 and increase at a rate of about 1.5 percent per year (adjusted for inflation).
Figure 1: Carbon tax scenarios, 2020–2040
Source: Rhodium Group Analysis
Revenue Effects
A carbon tax could raise a significant amount of revenue for the federal government (table 1). In the low carbon tax scenario, carbon tax receipts would be $989 billion over 10 years, and net federal revenue would increase by about $740 billion (in current dollars) after accounting for a reduction in other receipts (see below). For the central scenario—corresponding to a carbon tax of roughly $50 per ton—carbon tax receipts would be $2.8 trillion, and net revenues would be higher by about $2.1 trillion (in current dollars) over the 2020–2029 period. The high carbon tax scenario would increase net federal receipts by about $3 trillion (in current dollars) through 2029.
CARBON TAX SIMULATIONS

DISTRIBUTIONAL IMPLICATIONS OF A CARBON TAX
ENERGYPOLICY.COLUMBIA.EDU | JUNE 2018 | 14
Table 1: Carbon tax revenue scenarios, 2020–2040
Gross Carbon Tax Revenue(billions of 2016 dollars)
Net Carbon Tax Revenue(billions of 2016 dollars)
YearLow Scenario
Central Scenario
High Scenario
Low Scenario
Central Scenario
High Scenario
2020 75.7 247.9 355.7 58.1 190.3 273.1
2021 76.9 242.4 342.5 59.0 185.8 262.7
2022 78.3 238.1 335.3 59.9 182.4 256.9
2023 80.0 236.2 333.1 61.1 180.6 254.9
2024 81.6 236.0 333.4 62.3 180.3 254.8
2025 83.2 235.1 333.6 63.4 179.4 254.7
2026 84.7 234.5 333.1 62.3 172.4 244.9
2027 86.1 234.2 332.5 63.2 172.0 244.2
2028 87.0 234.4 331.8 63.8 171.9 243.4
2029 88.9 236.0 333.5 65.1 172.9 244.4
2030 90.6 238.5 335.3 66.3 174.5 245.4
2031 92.2 241.5 336.9 67.4 176.5 246.2
2032 94.0 245.1 339.8 68.6 178.8 248.1
2033 95.8 249.2 342.8 69.9 181.7 249.9
2034 97.7 253.9 346.8 71.1 184.9 252.5
2035 99.9 259.1 351.3 72.7 188.4 255.5
2036 102.8 263.6 355.9 74.6 191.4 258.5
2037 106.3 268.6 360.5 77.0 194.8 261.5
2038 109.7 274.0 365.1 79.4 198.4 264.5
2039 113.2 279.1 369.4 81.8 201.9 267.3
2040 116.4 283.6 372.6 84.1 204.9 269.2
10-year Revenue (2020-2029, in billions
of 2016 dollars)
822.4 2,374.9 3,364.6 618.3 1,788.2 2,534.0
10-year Revenue (2020-2029, in billions
of current dollars)
988.7 2,843.7 4,028.6 742.5 2,138.7 3,030.5
Source: Tax Policy Center Microsimulation Model (version 0217-1) based on Rhodium Group Analysis.Note: Net revenue is gross revenue net of reduced income and payroll tax revenue.
Income and Payroll Tax Offsets. The net revenue estimates presented reflect the lower income and payroll taxes that would be collected after adoption of the carbon tax. Like most excise taxes, a carbon tax is collected from businesses before they pay wages or return profits to their owners and therefore reduces the amount available to compensate factors of production (i.e., labor and capital) by an amount equal to the gross revenue collected.

DISTRIBUTIONAL IMPLICATIONS OF A CARBON TAX
15 | CENTER ON GLOBAL ENERGY POLICY | COLUMBIA SIPA
Assuming, as do conventional government revenue estimates, that GDP remains unchanged, a tax imposed on sales by businesses must in the aggregate reduce incomes instead of raising the overall price level. TPC calculates the resulting offset to tax revenue by reducing incomes in proportion to the allocation of the carbon tax burden among income sources and calculating the resulting change in income and payroll tax liability.4
Federal Spending Offsets. If a carbon tax reduces wages (with the overall price level unchanged), it will also over time reduce Social Security and other wage-indexed government transfer payments. This will reduce federal outlays and the federal budget deficit. A carbon tax will also reduce the cost of any constant quantity of government purchases of labor services and of goods not subject to the carbon tax, while raising the cost of purchases (such as gasoline for government vehicles or electricity generated by fossil fuels in government facilities) that do include the carbon tax. The net revenue figures presented above do not include any of these effects on federal outlays. Due to the larger share of federal outlays attributable to transfer payments and direct wages to government employees than to purchases of material inputs, we expect the net effects of the carbon tax on outlays will be negative. If so, our estimate of net receipts is underestimating the net budgetary savings from the carbon tax.
Relative Price Effects
A carbon tax would affect the relative prices of consumption goods in the economy. A carbon tax would generally raise relative prices of energy and carbon-intensive goods, while lowering relative prices of non-carbon-intensive goods. We use estimates produced by the Rhodium Group from its energy model based on the National Energy Modeling System (NEMS) model developed by the US Energy Information Administration (EIA), which provides us with the price response across 25 different categories of final consumption goods.
Consistent with estimating conventions, our analysis assumes the overall price level remains fixed. We therefore normalize the price of each category by the overall CPI (table 2). In the central carbon tax scenario, the relative prices of energy goods would increase by about 11 percent on average in 2020, the prices of energy commodities would increase by about 5 percent, electricity prices would increase by 14 percent, and natural gas prices would increase by nearly 32 percent. There would be little relative price change on average for commodities other than food and energy, while the relative price would on average decline by about 1 percent for nonenergy services.

DISTRIBUTIONAL IMPLICATIONS OF A CARBON TAX
ENERGYPOLICY.COLUMBIA.EDU | JUNE 2018 | 16
Table 2: Relative price effects of carbon tax scenarios (Percentage change relative to overall CPI)
2020 2025 2030 2040Low Central High Low Central High Low Central High Low Central High
CPI - All Urban 0.0 0.0 0.0 0.0 0.0 0.0 0.0 0.0 0.0 0.0 0.0 0.0
Food 0.1 0.3 0.4 0.1 0.2 0.4 0.1 0.3 0.4 0.1 0.3 0.4
Food and beverage at home 0.2 0.6 0.9 0.2 0.5 0.7 0.2 0.5 0.7 0.2 0.6 0.8
Food services 0.0 -0.1 -0.1 0.0 -0.1 -0.1 0.0 -0.1 -0.1 0.0 -0.1 -0.2
Energy 3.1 10.9 16.1 3.7 11.7 16.3 4.1 11.8 16.0 5.3 13.2 17.1
Energy commodities 1.5 5.2 7.6 1.5 5.0 7.5 1.8 5.5 8.2 2.0 6.1 8.7
Fuel oil and other fuels 2.3 7.7 11.4 2.3 7.7 11.4 2.7 8.3 12.3 3.1 9.3 13.1
Motor vehicle fuels, lubricants, and fluids 1.5 4.9 7.3 1.4 4.8 7.2 1.7 5.3 7.8 1.9 5.8 8.3
Energy services 5.1 18.6 27.4 6.6 20.5 28.0 7.2 20.1 26.3 9.6 22.7 28.3
Electricity 4.0 14.2 20.9 6.0 17.9 23.5 6.5 17.1 21.5 8.5 19.2 23.0
Natural gas 8.4 31.9 47.4 8.5 28.6 41.9 9.2 29.1 41.2 12.8 33.3 44.8
Core -0.2 -0.6 -0.9 -0.2 -0.6 -0.9 -0.2 -0.6 -0.8 -0.3 -0.7 -0.9
Commodities other than food and energy 0.0 0.0 0.0 0.0 -0.1 -0.1 0.0 0.0 -0.1 0.0 0.0 0.0
Motor vehicle and parts -0.1 -0.3 -0.4 -0.1 -0.3 -0.4 -0.1 -0.3 -0.4 -0.1 -0.3 -0.4
Therapeutic appliances and equipment -0.2 -0.6 -0.8 -0.2 -0.6 -0.8 -0.2 -0.6 -0.8 -0.3 -0.7 -0.9
Furnishings and durable household equipment 0.1 0.2 0.3 0.1 0.2 0.2 0.1 0.2 0.2 0.1 0.2 0.3
Other durable goods -0.2 -0.6 -0.8 -0.2 -0.6 -0.8 -0.2 -0.6 -0.8 -0.3 -0.7 -0.9
Pharmaceutical and other medical products -0.1 -0.5 -0.7 -0.2 -0.5 -0.7 -0.2 -0.5 -0.7 -0.2 -0.6 -0.8
Tobacco -0.2 -0.7 -1.1 -0.2 -0.8 -1.1 -0.3 -0.8 -1.0 -0.4 -0.9 -1.1
Clothing and footwear 0.0 0.0 0.0 0.0 -0.1 -0.1 0.0 -0.1 -0.1 0.0 -0.1 -0.1
Other nondurable goods 0.1 0.5 0.7 0.1 0.4 0.5 0.1 0.4 0.6 0.2 0.5 0.7
Recreational goods and vehicles -0.2 -0.6 -0.8 -0.2 -0.6 -0.8 -0.2 -0.6 -0.8 -0.3 -0.7 -0.9
Non-energy services -0.3 -0.9 -1.4 -0.3 -1.0 -1.3 -0.3 -1.0 -1.3 -0.4 -1.1 -1.4
Housing -0.4 -1.4 -2.0 -0.4 -1.3 -1.9 -0.5 -1.4 -1.9 -0.6 -1.6 -2.0
Transportation services 0.3 1.1 1.6 0.3 0.9 1.5 0.3 1.1 1.6 0.4 1.1 1.6
Health care -0.3 -1.0 -1.5 -0.3 -1.0 -1.4 -0.4 -1.0 -1.4 -0.5 -1.1 -1.5
Recreational services -0.2 -0.8 -1.2 -0.3 -0.8 -1.2 -0.3 -0.9 -1.2 -0.4 -1.0 -1.3
Telecommunication services -0.3 -1.0 -1.5 -0.3 -1.0 -1.5 -0.4 -1.1 -1.5 -0.5 -1.2 -1.6
Financial service charges, fees and commissions -0.4 -1.5 -2.2 -0.5 -1.5 -2.1 -0.5 -1.5 -2.1 -0.7 -1.7 -2.3
Insurance -0.5 -1.6 -2.3 -0.5 -1.6 -2.2 -0.6 -1.6 -2.2 -0.7 -1.8 -2.4
Water supply and sanitation 0.7 2.5 3.6 0.7 2.1 3.1 0.8 2.2 3.1 1.1 2.6 3.5
Accomodations -0.1 -0.3 -0.4 -0.1 -0.3 -0.4 -0.1 -0.3 -0.4 -0.1 -0.4 -0.5
Others -0.2 -0.7 -1.0 -0.2 -0.7 -0.9 -0.2 -0.7 -0.9 -0.3 -0.8 -1.0
Source: Rhodium Group Analysis.

DISTRIBUTIONAL IMPLICATIONS OF A CARBON TAX
17 | CENTER ON GLOBAL ENERGY POLICY | COLUMBIA SIPA
Revenue Recycling Options
A key question for policymakers considering a carbon tax is what to do with the resulting revenue. In this paper, we consider four options. The first option is to implement a carbon tax with no offsetting tax changes, which would reduce the federal deficit by the net revenue raised (plus the additional effects on outlays in the long run). We also consider three options that would not change the overall level of federal revenues by returning all the carbon tax revenue through the reduction of other federal taxes or provision of rebates.
Reduce the Federal Deficit
CBO projects that federal deficits will total nearly $12 trillion over the next ten years.5 This option would devote all the increased carbon tax revenue toward reducing the federal deficit. The distributional results we present in this paper only account for current federal taxes; therefore, we do not assign any benefit from lower federal deficits to taxpayers. The distribution of such benefits would depend on assumptions about how deficits are financed and future policy changes (e.g., whether the lower budget deficits result in higher future government spending or lower future taxes and the composition of any increased spending or reduced taxes).
Reduce Payroll Taxes
This option would return carbon tax revenues by reducing the employee’s share of the Social Security payroll tax. Currently the Old Age, Survivors, and Disability Insurance (OASDI) payroll tax rate is 12.4 percent (half on the employer and half on the employee), and applies to earnings up to a maximum of $128,400 (in 2018). This option would reduce the 6.2 percent rate that applies to employees, which would alleviate the carbon tax burden on labor income.6
Reduce the Corporate Income Tax
This option would return carbon tax revenues by reducing the US corporate income tax (Marron and Toder 2013). The recently passed Tax Cuts and Jobs Act reduced the US statutory corporate income tax rate from 35 percent down to 21 percent. This option would further reduce the amount of corporate revenue collected, which in the high tax scenarios could amount to full repeal of the corporate income tax.7
Provide Households with Lump-Sum Rebates
This option would return carbon tax revenues by providing per capita rebates to households. The rebates would be given to all nondependent individuals filing a tax return. Married couples would be eligible to claim a rebate for each spouse, and each dependent of a taxpayer would receive a rebate equal to one-half the amount given to each spouse. Adjusting the rebates based on the composition of the tax filing unit provides a reasonable adjustment based on ability to pay, as costs of living grow less than in proportion to the size of households. These rebates would be easy to administer through the existing federal income tax system because most individuals already file tax returns and, because the rebate is conditioned only on the size of a household and not on economic status or other attributes, nonfilers could submit a simple form to claim them.

DISTRIBUTIONAL IMPLICATIONS OF A CARBON TAX
ENERGYPOLICY.COLUMBIA.EDU | JUNE 2018 | 18
Distributional Effects of a Carbon Tax
We first present distributional results for our benchmark carbon tax scenarios with no offsetting revenue recycling or tax changes, where all the net carbon tax revenue would be allocated to deficit reduction. Specifically, we estimate the (long-run) tax burden of the low, central, and high carbon tax scenarios in years 2020, 2025, 2030, and 2040. The baseline for all our distributional estimates is present law after the enactment of the Tax Cuts and Jobs Act.
To facilitate comparisons with previously published estimates, we report the tax change both as a percent of pretax income (table 3a) and after-tax income (table 3b). We show the results for three scenarios—a low tax scenario, a central scenario, and a high tax scenario. In 2020:
● In the low scenario, taxes would increase overall by an average of 0.4 percent of pretax income. They would increase by 0.6 percent of pretax income for taxpayers in the bottom quintile of the income distribution; by 0.5 percent of pretax income for taxpayers in the middle quintile; and by 0.3 percent of pretax income for taxpayers in the top 20 percent. Estimates measured as a percentage of after-tax income would be similar.
● In the central scenario, taxes would increase overall by an average of 1.3 percent of pretax income. They would increase by 2.1 percent of pretax income for taxpayers in the bottom quintile of the income distribution; by 1.6 percent of pretax income for taxpayers in the middle quintile; and by 1.1 percent of pretax income for taxpayers in the top 20 percent (0.9 percent of income in the top 1 percent). After-tax income would decline by an average of 1.6 percent overall; by 2.2 percent for taxpayers in the bottom quintile of the income distribution; by 1.8 percent in the middle quintile; and by 1.4 percent for taxpayers in the top 20 percent (1.3 percent of after-tax income in the top 1 percent).
● In the high scenario, taxes would increase overall by an average of 1.9 percent of pretax income. They would increase by 3.1 percent of pretax income for taxpayers in the bottom quintile of the income distribution; by 2.3 percent of pretax income for taxpayers in the middle quintile; and by 1.6 percent of pretax income for taxpayers in the top 20 percent (1.3 percent of income in the top 1 percent). After-tax income would decline by an average of 2.3 percent overall; by 3.1 percent for taxpayers in the bottom quintile; by 2.6 in the middle quintile; and by 2.1 percent for taxpayers in the top 20 percent (1.8 percent of after-tax income in the top 1 percent).
In future years, the level of the overall carbon tax burden as a percentage of income varies depending on the growth rate of carbon tax revenues relative to incomes. In the low tax scenario, the overall burden remains steady at 0.5 percent of after-tax income. In the central and high tax scenarios, the overall average burden declines over time due to the slower rate of increase in the carbon tax rate and the slower resulting decline in gross carbon tax revenues.

DISTRIBUTIONAL IMPLICATIONS OF A CARBON TAX
19 | CENTER ON GLOBAL ENERGY POLICY | COLUMBIA SIPA
Table 3a: Distributional effect of carbon tax scenarios with revenue used for deficit reduction. (Fully phased-in tax change as a percent of pretax income)
No burden on normal return Burden on normal returnExpanded cash income % 2020 2025 2030 2040 2020 2025 2030 2040
Panel A: Low Scenario
Lowest quintile 0.6 0.7 0.7 0.8 0.6 0.7 0.7 0.8
Second quintile 0.5 0.6 0.6 0.6 0.5 0.6 0.6 0.6
Middle quintile 0.5 0.5 0.5 0.5 0.5 0.5 0.5 0.5
Fourth quintile 0.4 0.4 0.4 0.4 0.4 0.4 0.4 0.4
Top quintile 0.3 0.3 0.3 0.3 0.4 0.3 0.3 0.3
All 0.4 0.4 0.4 0.4 0.4 0.4 0.4 0.4
Addendum
80-90 0.4 0.4 0.4 0.4 0.4 0.4 0.4 0.4
90-95 0.4 0.4 0.4 0.3 0.4 0.4 0.3 0.3
95-99 0.3 0.3 0.3 0.3 0.3 0.3 0.3 0.3
Top 1 percent 0.3 0.3 0.2 0.3 0.3 0.3 0.3 0.3
Panel B: Central Scenario
Lowest quintile 2.1 2.0 1.9 1.9 2.1 1.9 1.8 1.9
Second quintile 1.8 1.6 1.5 1.5 1.7 1.6 1.5 1.5
Middle quintile 1.6 1.4 1.3 1.3 1.6 1.4 1.3 1.2
Fourth quintile 1.4 1.2 1.1 1.1 1.4 1.2 1.1 1.0
Top quintile 1.1 0.9 0.8 0.8 1.1 1.0 0.8 0.8
All 1.3 1.1 1.0 1.0 1.3 1.2 1.0 1.0
Addendum
80-90 1.3 1.1 1.0 0.9 1.3 1.1 1.0 0.9
90-95 1.2 1.0 0.9 0.8 1.2 1.0 0.9 0.8
95-99 1.1 0.9 0.8 0.7 1.1 0.9 0.8 0.8
Top 1 percent 0.9 0.7 0.6 0.6 1.0 0.9 0.8 0.7
Panel C: High Scenario
Lowest quintile 3.1 2.8 2.5 2.4 3.0 2.7 2.5 2.4
Second quintile 2.6 2.3 2.1 2.0 2.5 2.2 2.0 1.9
Middle quintile 2.3 2.0 1.8 1.7 2.3 2.0 1.8 1.6
Fourth quintile 2.0 1.7 1.6 1.4 2.0 1.7 1.5 1.4
Top quintile 1.6 1.3 1.1 1.0 1.6 1.4 1.2 1.0
All 1.9 1.6 1.4 1.3 1.9 1.6 1.5 1.3
Addendum
80-90 1.8 1.6 1.4 1.2 1.8 1.5 1.4 1.2
90-95 1.7 1.4 1.3 1.1 1.7 1.4 1.3 1.1
95-99 1.5 1.3 1.1 1.0 1.6 1.3 1.2 1.0
Top 1 percent 1.3 1.1 0.9 0.8 1.5 1.2 1.1 1.0
Source: Tax Policy Center Microsimulation Model (version 0217-1) based on Rhodium Group Analysis.Note: Baseline is current law in effect for the given calendar year. Estimates are evaluated at income levels in that year, and the burden of the carbon tax is based on fully phased-in law. For a description of expanded cash income, see https://www.taxpolicycenter.org/TaxModel/Income.cfm.

DISTRIBUTIONAL IMPLICATIONS OF A CARBON TAX
ENERGYPOLICY.COLUMBIA.EDU | JUNE 2018 | 20
Table 3b: Distributional effect of carbon tax scenarios with revenue used for deficit reduction. (Fully phased-in tax change as a percent of after-tax income)
No burden on normal return Burden on normal returnExpanded cash income % 2020 2025 2030 2040 2020 2025 2030 2040
Panel A: Low Scenario
Lowest quintile 0.6 0.7 0.7 0.8 0.6 0.7 0.7 0.8
Second quintile 0.6 0.6 0.6 0.7 0.6 0.6 0.6 0.7
Middle quintile 0.6 0.6 0.6 0.6 0.5 0.6 0.6 0.6
Fourth quintile 0.5 0.5 0.5 0.5 0.5 0.5 0.5 0.5
Top quintile 0.4 0.4 0.4 0.4 0.5 0.5 0.4 0.4
All 0.5 0.5 0.5 0.5 0.5 0.5 0.5 0.5
Addendum
80-90 0.5 0.5 0.5 0.5 0.5 0.5 0.5 0.5
90-95 0.5 0.5 0.4 0.4 0.5 0.5 0.4 0.4
95-99 0.4 0.4 0.4 0.4 0.5 0.4 0.4 0.4
Top 1 percent 0.4 0.4 0.4 0.4 0.5 0.5 0.4 0.4
Panel B: Central Scenario
Lowest quintile 2.2 2.0 1.9 2.0 2.1 2.0 1.9 2.0
Second quintile 1.9 1.7 1.6 1.7 1.9 1.7 1.6 1.6
Middle quintile 1.8 1.6 1.5 1.5 1.8 1.6 1.5 1.4
Fourth quintile 1.7 1.4 1.3 1.3 1.6 1.4 1.3 1.3
Top quintile 1.4 1.2 1.1 1.0 1.5 1.3 1.1 1.1
All 1.6 1.4 1.3 1.2 1.6 1.4 1.3 1.3
Addendum
80-90 1.6 1.3 1.2 1.2 1.5 1.3 1.2 1.1
90-95 1.5 1.3 1.1 1.1 1.5 1.3 1.1 1.1
95-99 1.4 1.2 1.1 1.0 1.5 1.2 1.1 1.0
Top 1 percent 1.3 1.1 1.0 0.9 1.5 1.3 1.1 1.1
Panel C: High Scenario
Lowest quintile 3.1 2.8 2.6 2.6 3.0 2.7 2.6 2.5
Second quintile 2.8 2.5 2.3 2.2 2.7 2.4 2.2 2.1
Middle quintile 2.6 2.3 2.1 1.9 2.6 2.2 2.0 1.9
Fourth quintile 2.4 2.1 1.9 1.7 2.3 2.0 1.8 1.7
Top quintile 2.1 1.7 1.5 1.4 2.1 1.8 1.6 1.4
All 2.3 2.0 1.8 1.6 2.3 2.0 1.8 1.7
Addendum
80-90 2.2 1.9 1.8 1.5 2.2 1.9 1.7 1.5
90-95 2.2 1.8 1.6 1.4 2.2 1.8 1.6 1.4
95-99 2.0 1.7 1.5 1.3 2.1 1.7 1.6 1.4
Top 1 percent 1.8 1.5 1.3 1.2 2.1 1.8 1.6 1.4
Source: Tax Policy Center Microsimulation Model (version 0217-1) based on Rhodium Group Analysis.Note: Baseline is current law in effect for the given calendar year. Estimates are evaluated at income levels in that year, and the burden of the carbon tax is based on fully phased-in law. For a description of expanded cash income, see https://www.taxpolicycenter.org/TaxModel/Income.cfm.

DISTRIBUTIONAL IMPLICATIONS OF A CARBON TAX
21 | CENTER ON GLOBAL ENERGY POLICY | COLUMBIA SIPA
As discussed above, we present distributional estimates under our two different assumptions about how a carbon tax would affect the normal return to capital: (1) that the normal return bears no burden (as is the case with general consumption taxes), and (2) that the normal return would bear 50 percent of the full burden that applies to labor income, wage-indexed transfer payments, and the supernormal return to capital. Shifting an additional portion of the carbon tax burden on capital income makes the carbon tax slightly less regressive, as expected, but it has a relatively small effect on the overall results (tables 3a and 3b). For the remainder of the paper, we will present results using the assumption that the normal return bears no burden from a carbon tax.8
Combined Distributional Effects of Carbon Tax and Revenue Recycling Options
Next, we estimate the combined distributional effects of adopting a carbon tax and the three options to fully return the revenue to hold the overall tax burden unchanged. While each of the revenue recycling options would leave the overall tax burden unchanged, they would have dramatically different effects on the distribution across income groups. We summarize the results for the central carbon tax scenario in 2025 below (figure 2). The pattern across income groups is similar in other years, although the level of the overall burden generally declines over time as projected carbon tax revenues grow slower than overall income (because the tax is expected to reduce the consumption of taxed goods over time). The full set of distributional results and revenue recycling parameters is shown in tables 4a–4d and table 5.
Reducing Payroll Taxes
Reducing employee payroll taxes would offset much of the impact of the carbon tax across the income distribution. In the central scenario, the employee OASDI payroll tax rate could be lowered from 6.2 percent to 3.4 percent in 2025 (table 5). Taxpayers in the bottom quintile of the income distribution would on average see their taxes increase by 0.5 percent of pretax income; taxpayers in the middle quintile would see a tax increase of 0.1 percent on average; taxpayers between the 60th and 99th income percentiles would receive a net tax cut; and taxpayers in the top 1 percent would see taxes increase by 0.5 percent of pretax income. The tax increase at the top reflects the fact that the OASDI payroll tax is capped at wages above the OASDI maximum amount and does not apply to capital income, so the share of the carbon tax that falls on the top 1 percent exceeds the share of OASDI payroll taxes that they pay.
Reducing the Corporate Income Tax
Reducing the corporate income tax would disproportionately benefit higher-income taxpayers, exacerbating the regressivity of the carbon tax. In the central scenario, corporate income tax revenues could be reduced by $250 billion in 2025 (table 5).9 For taxpayers in the bottom quintile, the corporate tax reduction would offset just 20 percent of the carbon tax burden—that is, they would see their taxes increase by 1.6 percent of pretax income on average versus the 2.0 percent in the carbon tax only simulation. On average, the corporate tax reduction would offset 36 percent of carbon tax for taxpayers in the middle quintile and 82 percent for taxpayers in the 80th to 90th percentiles. Taxpayers in the top 10 percent would receive a net tax cut on average, with a tax decrease of 1.6 percent of pretax income for the top 1 percent.

DISTRIBUTIONAL IMPLICATIONS OF A CARBON TAX
ENERGYPOLICY.COLUMBIA.EDU | JUNE 2018 | 22
Lump-Sum Household Rebates
Providing lump-sum rebates to households would benefit lower- and middle-income taxpayers the most as a percentage of income. In the central scenario, carbon tax revenue could be returned by offering a $990 rebate to all individuals (half that amount for dependents) in 2025 (table 5). Taxpayers in the bottom income quintile would on average receive a net tax cut of 4.4 percent of pretax income; taxpayers in the middle quintile would on average receive a net tax cut of 0.3 percent of pretax income; taxpayers in the top quintile would face a net tax increase of between 0.3 percent of pretax income in the 80th to 90th income percentiles and 0.7 percent of pretax income in the top 1 percent.
Figure 2: Tax change of revenue recycling options as a percent of pretax income. Central carbon tax scenario, fully phased-in effect, 2025.
Source: Tax Policy Center Microsimulation Model (version 0217-1) based on Rhodium Group analysis Note: Baseline is current law in effect for calendar 2025. Estimates are evaluated at 2025 income levels, and the burden of the carbon tax is based on the fully phased-in 2025 law.

DISTRIBUTIONAL IMPLICATIONS OF A CARBON TAX
23 | CENTER ON GLOBAL ENERGY POLICY | COLUMBIA SIPA
Table 4a: Distributional effect of carbon tax and revenue recycling options (Fully phased-in tax change as a percent of pretax income, 2020)
Revenue Recycling Option
Expanded cash income % Reduce federal deficit Reduce payroll tax rate Reduce corporate income tax rate
Per capita household rebate
Panel A: Low Scenario
Lowest quintile 0.6 0.2 0.5 -1.6
Second quintile 0.5 0.1 0.4 -0.5
Middle quintile 0.5 0.0 0.3 -0.1
Fourth quintile 0.5 -0.1 0.2 0.0
Top quintile 0.3 0.0 -0.2 0.2
All 0.4 0.0 0.0 0.0
Addendum
80-90 0.4 -0.1 0.1 0.1
90-95 0.4 -0.1 0.0 0.2
95-99 0.3 0.0 -0.2 0.2
Top 1 percent 0.3 0.2 -0.6 0.2
Panel B: Central Scenario
Lowest quintile 2.1 0.5 1.7 -5.3
Second quintile 1.8 0.4 1.3 -1.5
Middle quintile 1.6 0.1 0.9 -0.4
Fourth quintile 1.4 -0.3 0.5 0.1
Top quintile 1.1 0.0 -0.7 0.6
All 1.3 0.0 0.0 0.0
Addendum
80-90 1.3 -0.4 0.2 0.3
90-95 1.2 -0.4 -0.1 0.5
95-99 1.1 -0.1 -0.6 0.7
Top 1 percent 0.9 0.6 -1.9 0.8
Panel C: High Scenario
Lowest quintile 3.1 0.8 2.5 -7.5
Second quintile 2.6 0.5 1.8 -2.2
Middle quintile 2.3 0.1 1.3 -0.6
Fourth quintile 2.0 -0.4 0.8 0.1
Top quintile 1.6 0.0 -1.0 0.8
All 1.9 0.0 0.0 0.0
Addendum
80-90 1.8 -0.6 0.3 0.5
90-95 1.7 -0.6 -0.1 0.7
95-99 1.5 -0.1 -0.9 1.0
Top 1 percent 1.3 0.9 -2.7 1.1
Source: Tax Policy Center Microsimulation Model (version 0217-1) based on Rhodium Group AnalysisNote: Baseline is current law in effect for calendar year 2020. Estimates are evaluated at 2020 income levels and the burden of the carbon tax is based on the fully phased-in 2020 law. For a description of expanded cash income, see https://taxpolicycenter.org/TaxModel/Income.cfm

DISTRIBUTIONAL IMPLICATIONS OF A CARBON TAX
ENERGYPOLICY.COLUMBIA.EDU | JUNE 2018 | 24
Table 4b: Distributional effect of carbon tax and revenue recycling options (Fully phased-in tax change as a percent of pretax income, 2025)
Revenue Recycling Option
Expanded cash income % Reduce federal deficit Reduce payroll tax rate Reduce corporate income tax rate
Per capita household rebate
Panel A: Low Scenario
Lowest quintile 0.7 0.2 0.6 -1.6
Second quintile 0.6 0.1 0.4 -0.4
Middle quintile 0.5 0.0 0.3 -0.1
Fourth quintile 0.4 -0.1 0.2 0.0
Top quintile 0.3 0.0 -0.2 0.2
All 0.4 0.0 0.0 0.0
Addendum
80-90 0.4 -0.1 0.1 0.1
90-95 0.4 -0.2 0.0 0.2
95-99 0.3 0.0 -0.2 0.2
Top 1 percent 0.3 0.2 -0.6 0.2
Panel B: Central Scenario
Lowest quintile 2.0 0.5 1.6 -4.4
Second quintile 1.6 0.4 1.2 -1.2
Middle quintile 1.4 0.1 0.9 -0.3
Fourth quintile 1.2 -0.2 0.5 0.0
Top quintile 0.9 0.0 -0.6 0.5
All 1.1 0.0 0.0 0.0
Addendum
80-90 1.1 -0.4 0.2 0.3
90-95 1.0 -0.4 -0.1 0.4
95-99 0.9 -0.1 -0.5 0.5
Top 1 percent 0.7 0.5 -1.6 0.7
Panel C: High Scenario
Lowest quintile 2.8 0.7 2.2 -6.3
Second quintile 2.3 0.5 1.7 -1.8
Middle quintile 2.0 0.2 1.1 -0.5
Fourth quintile 1.7 -0.3 0.7 0.0
Top quintile 1.3 -0.1 -0.9 0.7
All 1.6 0.0 0.0 0.0
Addendum
80-90 1.6 -0.6 0.3 0.4
90-95 1.4 -0.6 -0.1 0.6
95-99 1.3 -0.2 -0.8 0.8
Top 1 percent 1.1 0.8 -2.2 1.0
Source: Tax Policy Center Microsimulation Model (version 0217-1) based on Rhodium Group Analysis.Note: Baseline is current law in effect for calendar year 2025. Estimates are evaluated at 2025 income levels, and the burden of the carbon tax is based on the fully phased-in 2025 law. For a description of expanded cash income, see https://www.taxpolicycenter.org/TaxModel/Income.cfm.

DISTRIBUTIONAL IMPLICATIONS OF A CARBON TAX
25 | CENTER ON GLOBAL ENERGY POLICY | COLUMBIA SIPA
Table 4c: Distributional Effect of carbon tax and revenue recycling options (Fully phased-in tax change as a percent of pretax income, 2030)
Revenue Recycling Option
Expanded cash income % Reduce federal deficit Reduce payroll tax rate Reduce corporate income tax rate
Per capita household rebate
Panel A: Low Scenario
Lowest quintile 0.7 0.2 0.6 -1.5
Second quintile 0.6 0.1 0.4 -0.4
Middle quintile 0.5 0.0 0.3 -0.1
Fourth quintile 0.4 -0.1 0.2 0.0
Top quintile 0.3 0.0 -0.2 0.2
All 0.4 0.0 0.0 0.0
Addendum
80-90 0.4 -0.2 0.1 0.1
90-95 0.3 -0.2 0.0 0.1
95-99 0.3 -0.1 -0.1 0.2
Top 1 percent 0.2 0.2 -0.6 0.2
Panel B: Central Scenario
Lowest quintile 1.9 0.5 1.5 -3.8
Second quintile 1.5 0.4 1.1 -1.0
Middle quintile 1.3 0.1 0.8 -0.3
Fourth quintile 1.1 -0.2 0.5 0.0
Top quintile 0.8 -0.1 -0.6 0.4
All 1.0 0.0 0.0 0.0
Addendum
80-90 1.0 -0.4 0.2 0.2
90-95 0.9 -0.5 0.0 0.3
95-99 0.8 -0.2 -0.4 0.5
Top 1 percent 0.6 0.5 -1.5 0.6
Panel C: High Scenario
Lowest quintile 2.5 0.6 2.0 -5.5
Second quintile 2.1 0.6 1.6 -1.4
Middle quintile 1.8 0.1 1.1 -0.4
Fourth quintile 1.6 -0.2 0.7 0.0
Top quintile 1.1 -0.1 -0.8 0.6
All 1.4 0.0 0.0 0.0
Addendum
80-90 1.4 -0.6 0.3 0.3
90-95 1.3 -0.7 0.0 0.4
95-99 1.1 -0.3 -0.5 0.7
Top 1 percent 0.9 0.7 -2.1 0.8
Source: Tax Policy Center Microsimulation Model (version 0217-1) based on Rhodium Group Analysis.Note: Baseline is current law in effect for calendar year 2030. Estimates evaluated at 2030 income levels, and the burden of the carbon tax is based on the fully phased-in 2030 law, For a description of expanded cash income, see https://www.taxpolicycenter.org/TaxModel/Income.cfm.
DISTRIBUTIONAL IMPLICATIONS OF A CARBON TAX
ENERGYPOLICY.COLUMBIA.EDU | JUNE 2018 | 26
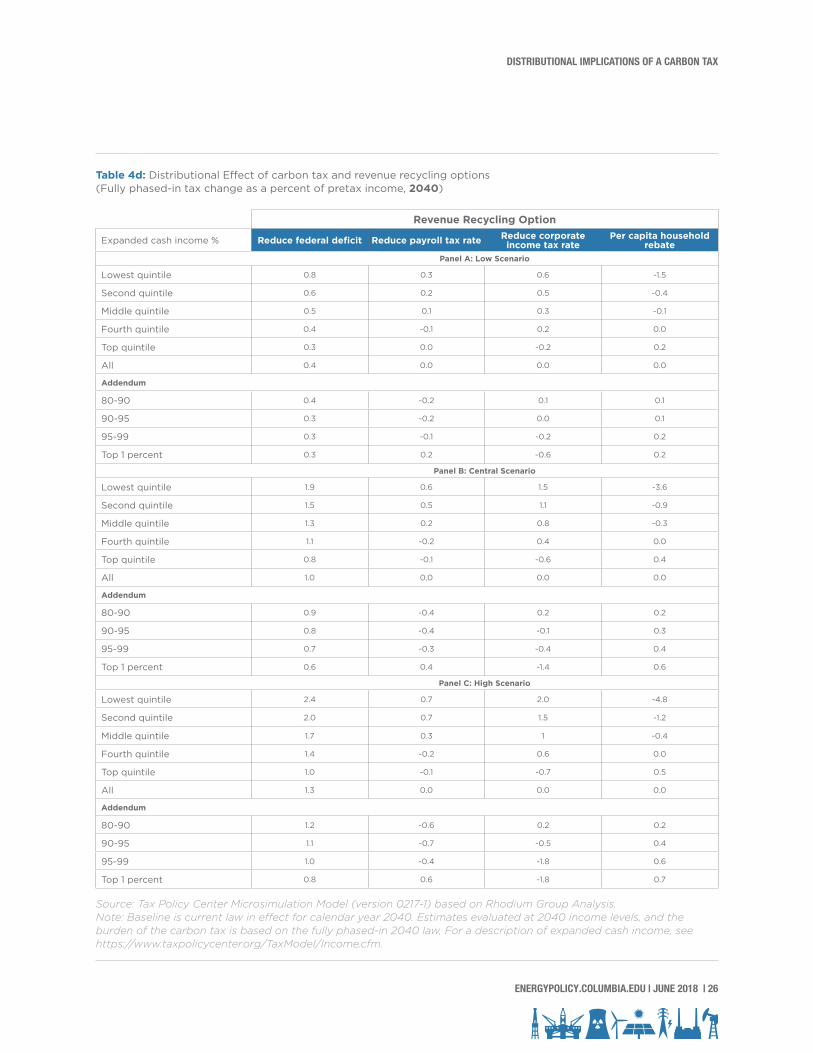
Table 4d: Distributional Effect of carbon tax and revenue recycling options (Fully phased-in tax change as a percent of pretax income, 2040)
Revenue Recycling Option
Expanded cash income % Reduce federal deficit Reduce payroll tax rate Reduce corporate income tax rate
Per capita household rebate
Panel A: Low Scenario
Lowest quintile 0.8 0.3 0.6 -1.5
Second quintile 0.6 0.2 0.5 -0.4
Middle quintile 0.5 0.1 0.3 -0.1
Fourth quintile 0.4 -0.1 0.2 0.0
Top quintile 0.3 0.0 -0.2 0.2
All 0.4 0.0 0.0 0.0
Addendum
80-90 0.4 -0.2 0.1 0.1
90-95 0.3 -0.2 0.0 0.1
95-99 0.3 -0.1 -0.2 0.2
Top 1 percent 0.3 0.2 -0.6 0.2
Panel B: Central Scenario
Lowest quintile 1.9 0.6 1.5 -3.6
Second quintile 1.5 0.5 1.1 -0.9
Middle quintile 1.3 0.2 0.8 -0.3
Fourth quintile 1.1 -0.2 0.4 0.0
Top quintile 0.8 -0.1 -0.6 0.4
All 1.0 0.0 0.0 0.0
Addendum
80-90 0.9 -0.4 0.2 0.2
90-95 0.8 -0.4 -0.1 0.3
95-99 0.7 -0.3 -0.4 0.4
Top 1 percent 0.6 0.4 -1.4 0.6
Panel C: High Scenario
Lowest quintile 2.4 0.7 2.0 -4.8
Second quintile 2.0 0.7 1.5 -1.2
Middle quintile 1.7 0.3 1 -0.4
Fourth quintile 1.4 -0.2 0.6 0.0
Top quintile 1.0 -0.1 -0.7 0.5
All 1.3 0.0 0.0 0.0
Addendum
80-90 1.2 -0.6 0.2 0.2
90-95 1.1 -0.7 -0.5 0.4
95-99 1.0 -0.4 -1.8 0.6
Top 1 percent 0.8 0.6 -1.8 0.7
Source: Tax Policy Center Microsimulation Model (version 0217-1) based on Rhodium Group Analysis.Note: Baseline is current law in effect for calendar year 2040. Estimates evaluated at 2040 income levels, and the burden of the carbon tax is based on the fully phased-in 2040 law, For a description of expanded cash income, see https://www.taxpolicycenter.org/TaxModel/Income.cfm.

DISTRIBUTIONAL IMPLICATIONS OF A CARBON TAX
27 | CENTER ON GLOBAL ENERGY POLICY | COLUMBIA SIPA
Table 5: Tax parameters for revenue recycling options
2020 2025 2030 2040Panel A: Reduce employee portion of payroll tax rate to:
Low scenario 5.26% 5.22% 5.24% 5.19%
Central scenario 3.07% 3.42% 3.64% 3.71%
High scenario 1.68% 2.23% 2.58% 2.91%
Panel B: Reduce corporate income tax revenues by ($ billions)
Low scenario -71.9 -88.0 -104.2 -163.1
Central scenario -235.6 -249.1 -274.4 -397.2
High scenario -338.1 -353.5 -385.9 -522.0
Panel C: Per capita household rebates of ($)
Low scenario 295 350 400 585
Central scenario 970 990 1,050 1,420
High scenario 1,390 1,405 1,475 1,865
Source: Tax Policy Center Microsimulation Model (version 0217-1) based on Rhodium Group Analysis.

DISTRIBUTIONAL IMPLICATIONS OF A CARBON TAX
ENERGYPOLICY.COLUMBIA.EDU | JUNE 2018 | 28
A carbon tax remains a compelling option as US policymakers grapple with ongoing environmental and fiscal challenges. This paper focuses on the distributional impact of adopting a carbon tax, based on how a carbon tax would affect real incomes and relative prices across US households. We show that a carbon tax alone would be moderately regressive; that is, it would raise tax burdens as a percentage of income more for lower-income households than for higher-income households. However, using some or all the resulting revenue to reduce other taxes—such as reducing payroll taxes or increasing refundable tax credits—could mitigate much or all of the carbon tax burden and lead to an overall carbon tax policy that is either regressive, progressive, or neither.
CONCLUSIONS

DISTRIBUTIONAL IMPLICATIONS OF A CARBON TAX
29 | CENTER ON GLOBAL ENERGY POLICY | COLUMBIA SIPA
TPC rejected using the ratio of carbon consumption to income to allocate the burden of a consumption tax for two reasons (see discussion in Toder, Nunns, and Rosenberg 2011 and Joint Committee on Taxation 1993). First, the main data source used to measure consumption, the Consumer Expenditure Survey (CEX), does a poor job in measuring the ratio of income to consumption for different income groups, especially in the bottom income quintiles, where the CEX substantially understates household incomes. We believe the CEX is very useful for computing relative price effects, but misleading for estimating the burden of an overall consumption tax. It makes the consumption tax appear more regressive than it is by overstating the ratio of consumption to income at the bottom of the income distribution and understating the ratio of consumption to income at the top.
Second, there is a serious conceptual problem with using the ratio of consumption to income in a single year as a measure of the relative burdens of a consumption tax among income groups. Household income can vary substantially from year to year, especially among lower income households, who may have less steady employment. Yet generally people do not reduce their consumption in proportion to temporary declines in income. This would make consumption to income ratios appear relatively large for people who are experiencing a low-income year due, for example, to a spell of unemployment, and relatively small for people who may receive a short-term windfall. Moreover, over a lifetime, many people will save during their working years and then consume some of their assets in retirement. So, for example, a retiree who is spending more than his or her current income may simply be consuming the proceeds of income earned in prior years. Data from a single year in general do not align consumption with the income used to finance that consumption.
We note that the “sources-based” method we use makes a consumption tax look much less regressive than using the ratio of consumption to income to distribute the burden of a consumption tax. Data from the CEX show that households in the bottom income group consume about two times as much as their income, a result we find implausible for an extended time. A consumption tax, however, remains less progressive than a flat-rate income tax under our methodology. This is because the normal return to capital, which is highly concentrated among the top income groups, is included in the income tax base, but not the base of a consumption tax.
APPENDIX A: USING THE RATIO OF CARBON CONSUMPTION TO INCOME BY INCOME GROUP TO ALLOCATE THE BURDEN OF A CARBON TAX

DISTRIBUTIONAL IMPLICATIONS OF A CARBON TAX
ENERGYPOLICY.COLUMBIA.EDU | JUNE 2018 | 30
Tables begin on next page.
APPENDIX B: DISTRIBUTIONAL RESULTS ASSUMING THE NORMAL RETURN TO CAPITAL BEARS SOME BURDEN FROM CARBON TAX

DISTRIBUTIONAL IMPLICATIONS OF A CARBON TAX
31 | CENTER ON GLOBAL ENERGY POLICY | COLUMBIA SIPA
Table A 1a: Distributional Effect of Carbon Tax and Revenue Recycling Options. Assuming Some Burden on the Normal Return to Capital (Fully phased-in tax change as a percent of pretax income, 2020)
Revenue Recycling Option
Expanded cash income % Reduce federal deficit Reduce payroll tax rate Reduce corporate income tax rate
Per capita household rebate
Panel A: Low Scenario
Lowest quintile 0.6 0.1 0.5 -1.7
Second quintile 0.5 0.1 0.4 -0.5
Middle quintile 0.5 0.0 0.3 -0.2
Fourth quintile 0.4 -0.1 0.2 0.0
Top quintile 0.4 0.0 -0.2 0.2
All 0.4 0.0 0.0 0.0
Addendum
80-90 0.4 -0.1 0.1 0.1
90-95 0.4 -0.1 0.0 0.2
95-99 0.3 0.0 -0.2 0.2
Top 1 percent 0.3 0.2 -0.5 0.3
Panel B: Central Scenario
Lowest quintile 2.1 0.5 1.7 -5.4
Second quintile 1.7 0.3 1.2 -1.6
Middle quintile 1.6 0.0 0.9 -0.5
Fourth quintile 1.4 -0.3 0.5 0.0
Top quintile 1.1 0.0 -0.6 0.6
All 1.3 0.0 0.0 0.0
Addendum
80-90 1.3 -0.5 0.2 0.3
90-95 1.2 -0.4 -0.1 0.5
95-99 1.1 0.0 -0.6 0.7
Top 1 percent 1.0 0.8 -1.8 0.9
Panel C: High Scenario
Lowest quintile 3.0 0.7 2.4 -7.7
Second quintile 2.5 0.4 1.7 -2.3
Middle quintile 2.3 0.0 1.3 -0.7
Fourth quintile 2.0 -0.4 0.7 0.0
Top quintile 1.6 0.1 -0.9 0.9
All 1.9 0.0 0.0 0.0
Addendum
80-90 1.8 -0.7 0.3 0.4
90-95 1.7 -0.6 -0.2 0.7
95-99 1.6 0.0 -0.8 1.1
Top 1 percent 1.5 1.1 -2.5 1.4
Source: Tax Policy Center Microsimulation Model (version 0217-1) based on Rhodium Group Analysis.Note: Baseline is current law in effect for calendar year 2020. Estimates are evaluated at 2020 income levels and the burden of the carbon tax is based on the fully phased-in 2020 law, assuming that the normal return to capital bears 50 percent of the full burden that applies to labor income, wage-indexed transfer payments, and the supernormal return to capital. For a description of expanded cash income, see https://www.taxpolicycenter.org/TaxModel/Income.cfm.

DISTRIBUTIONAL IMPLICATIONS OF A CARBON TAX
ENERGYPOLICY.COLUMBIA.EDU | JUNE 2018 | 32
Table A 1b: Distributional Effect of Carbon Tax and Revenue Recycling Options. Assuming Some Burden on the Normal Return to Capital (Fully phased-in tax change as a percent of pretax income, 2025)
Revenue Recycling Option
Expanded cash income % Reduce federal deficit Reduce payroll tax rate Reduce corporate income tax rate
Per capita household rebate
Panel A: Low Scenario
Lowest quintile 0.7 0.1 0.5 -1.6
Second quintile 0.6 0.1 0.4 -0.5
Middle quintile 0.5 0.0 0.3 -0.1
Fourth quintile 0.4 -0.1 0.2 0.0
Top quintile 0.3 0.0 -0.2 0.2
All 0.4 0.0 0.0 0.0
Addendum
80-90 0.4 -0.2 0.1 0.1
90-95 0.4 -0.2 0.0 0.1
95-99 0.3 0.0 -0.2 0.2
Top 1 percent 0.3 0.2 -0.5 0.3
Panel B: Central Scenario
Lowest quintile 1.9 0.4 1.5 -4.5
Second quintile 1.6 0.3 1.1 -1.3
Middle quintile 1.4 0.1 0.8 -0.4
Fourth quintile 1.2 -0.3 0.4 0.0
Top quintile 1.0 0.0 -0.6 0.5
All 1.2 0.0 0.0 0.0
Addendum
80-90 1.1 -0.4 0.2 0.2
90-95 1.0 -0.4 -0.1 0.4
95-99 0.9 -0.1 -0.5 0.6
Top 1 percent 0.9 0.7 -1.5 0.8
Panel C: High Scenario
Lowest quintile 2.7 0.6 2.2 -6.4
Second quintile 2.2 0.5 1.6 -1.9
Middle quintile 2.0 0.1 1.1 -0.6
Fourth quintile 1.7 -0.4 0.6 0.0
Top quintile 1.4 0.0 -0.8 0.8
All 1.6 0.0 0.0 0.0
Addendum
80-90 1.5 -0.6 0.2 0.4
90-95 1.4 -0.6 -0.1 0.6
95-99 1.3 -0.1 -0.7 0.8
Top 1 percent 1.2 0.9 -2.1 1.2
Source: Tax Policy Center Microsimulation Model (version 0217-1) based on Rhodium Group AnalysisNote: Baseline is current law in effect for calendar year 2025. Estimates are evaluated at 2025 income levels and the burden of the carbon tax is based on the fully phased-in 2025 law, assuming that the normal return to capital bears 50 percent of the full burden that applies to labor income, wage-indexed transfer payments, and the supernormal return to capital. For a description of expanded cash income, see https://www.taxpolicycenter.org/TaxModel/Income.cfm.

DISTRIBUTIONAL IMPLICATIONS OF A CARBON TAX
33 | CENTER ON GLOBAL ENERGY POLICY | COLUMBIA SIPA
Table A 1c: Distributional Effect of Carbon Tax and Revenue Recycling Options. Assuming Some Burden on the Normal Return to Capital (Fully phased-in tax change as a percent of pretax income, 2030)
Revenue Recycling Option
Expanded cash income % Reduce federal deficit Reduce payroll tax rate Reduce corporate income tax rate
Per capita household rebate
Panel A: Low Scenario
Lowest quintile 0.7 0.2 0.5 -1.5
Second quintile 0.6 0.1 0.4 -0.4
Middle quintile 0.5 0.0 0.3 -0.1
Fourth quintile 0.4 -0.1 0.2 0.0
Top quintile 0.3 0.0 -0.2 0.2
All 0.4 0.0 0.0 0.0
Addendum
80-90 0.4 -0.2 0.1 0.1
90-95 0.3 -0.2 0.0 0.1
95-99 0.3 -0.1 -0.1 0.2
Top 1 percent 0.3 0.2 -0.5 0.3
Panel B: Central Scenario
Lowest quintile 1.8 0.5 1.4 -3.9
Second quintile 1.5 0.4 1.1 -1.1
Middle quintile 1.3 0.1 0.8 -0.3
Fourth quintile 1.1 -0.2 0.5 0.0
Top quintile 0.8 0.0 -0.5 0.5
All 1.0 0.0 0.0 0.0
Addendum
80-90 1.0 -0.5 0.2 0.2
90-95 0.9 -0.5 0.0 0.3
95-99 0.8 -0.2 -0.4 0.5
Top 1 percent 0.8 0.6 -1.4 0.7
Panel C: High Scenario
Lowest quintile 2.5 0.6 2.0 -5.6
Second quintile 2.0 0.5 1.5 -1.5
Middle quintile 1.8 0.1 1.0 -0.5
Fourth quintile 1.5 -0.3 0.6 -0.1
Top quintile 1.2 0.0 -0.8 0.7
All 1.5 0.0 0.0 0.0
Addendum
80-90 1.4 -0.6 0.3 0.3
90-95 1.3 -0.7 -0.1 0.4
95-99 1.2 -0.3 -0.5 0.7
Top 1 percent 1.1 0.8 -1.9 1.0
Source: Tax Policy Center Microsimulation Model (version 0217-1) based on Rhodium Group Analysis.]Note: Baseline is current law in effect for calendar year 2030. Estimates are evaluated at 2030 income levels and the burden of the carbon tax is based on the fully phased-in 2030 law, assuming that the normal return to capital bears 50 percent of the full burden that applies to labor income, wage-indexed transfer payments, and the supernormal return to capital. For a description of expanded cash income, see https://www.taxpolicycenter.org/TaxModel/Income.cfm.

DISTRIBUTIONAL IMPLICATIONS OF A CARBON TAX
ENERGYPOLICY.COLUMBIA.EDU | JUNE 2018 | 34
Table A 1d: Distributional Effect of Carbon Tax and Revenue Recycling Options. Assuming Some Burden on the Normal Return to Capital (Fully phased-in tax change as a percent of pretax income, 2040)
Revenue Recycling Option
Expanded cash income % Reduce federal deficit Reduce payroll tax rate Reduce corporate income tax rate
Per capita household rebate
Panel A: Low Scenario
Lowest quintile 0.8 0.2 0.6 -1.5
Second quintile 0.6 0.2 0.4 -0.4
Middle quintile 0.5 0.1 0.3 -0.1
Fourth quintile 0.4 -0.1 0.2 0.0
Top quintile 0.3 0.0 -0.2 0.2
All 0.4 0.0 0.0 0.0
Addendum
80-90 0.4 -0.2 0.1 0.1
90-95 0.3 -0.2 0.0 0.1
95-99 0.3 -0.1 -0.2 0.2
Top 1 percent 0.3 0.2 -0.5 0.3
Panel B: Central Scenario
Lowest quintile 1.9 0.5 1.5 -3.7
Second quintile 1.5 0.5 1.1 -1.0
Middle quintile 1.2 0.2 0.7 -0.3
Fourth quintile 1.0 -0.2 0.4 0.0
Top quintile 0.8 -0.1 -0.5 0.4
All 1.0 0.0 0.0 0.0
Addendum
80-90 0.9 -0.5 0.1 0.2
90-95 0.8 -0.6 -0.1 0.3
95-99 0.8 -0.2 -0.4 0.4
Top 1 percent 0.7 0.6 -1.3 0.7
Panel C: High Scenario
Lowest quintile 2.4 0.6 1.9 -4.9
Second quintile 1.9 0.6 1.4 -1.3
Middle quintile 1.6 0.2 1.0 -0.4
Fourth quintile 1.4 -0.3 0.5 0.0
Top quintile 1.0 -0.1 -0.7 0.6
All 1.3 0.0 0.0 0.0
Addendum
80-90 1.2 -0.6 0.2 0.2
90-95 1.1 -0.7 -0.1 0.3
95-99 1.0 -0.3 -0.5 0.6
Top 1 percent 1.0 0.7 -1.7 0.9
Source: Tax Policy Center Microsimulation Model (version 0217-1) based on Rhodium Group AnalysisNote: Baseline is current law in effect for calendar year 2040. Estimates are evaluated at 2040 income levels and the burden of the carbon tax is based on the fully phased-in 2040 law, assuming that the normal return to capital bears 50 percent of the full burden that applies to labor income, wage-indexed transfer payments, and the supernormal return to capital. For a description of expanded cash income, see https://www.taxpolicycenter.org/TaxModel/Income.cfm..

DISTRIBUTIONAL IMPLICATIONS OF A CARBON TAX
35 | CENTER ON GLOBAL ENERGY POLICY | COLUMBIA SIPA
The Urban-Brookings Tax Policy Center’s large-scale microsimulation model produces revenue and distribution estimates of the US federal tax system. The model is similar to those used by the Congressional Budget Office (CBO), the Joint Committee on Taxation (JCT), and the Treasury’s Office of Tax Analysis (OTA). This appendix provides a brief summary of the model, but a more complete description is available at http://www.taxpolicycenter.org/resources/brief-description-tax-model.
Tax Model Database
The model’s primary data source is the 2006 public-use file (PUF) produced by the Statistics of Income (SOI) Division of the Internal Revenue Service (IRS). The PUF contains 145,858 records with detailed information from federal individual income tax returns filed in the 2006 calendar year. Beginning with the 2006 data, we employ a two-step process to create a file that is representative of the tax filing population for the 2011 tax year. In the first step of the process, we use published tax data to calculate per-return average growth rates for income, deduction, and other items between 2006 and 2011 by adjusted gross income (AGI) class. We then use these growth rates to adjust the dollar amounts on each PUF record. In the second step of the process, we use a constrained optimization algorithm to reweight the records to match an extensive set of about 100 targets for both return counts and dollar amounts. We refer to the resulting file as the 2011 “Look-Alike Public Use File” or LAPUF.
We next use cross tabulations of age, filing status, and income sources provided to us by SOI and implement a ranking algorithm to impute the ages of taxpayers and their dependents onto the LAPUF. We add information on other demographic characteristics and sources of income that are not reported on tax returns through a constrained statistical match of the LAPUF with data for 2011 from the March 2012 Current Population Survey (CPS) of the US Census Bureau. That match also generates a sample of individuals who do not file individual income tax returns (“nonfilers”). The data set combining filers from the LAPUF (augmented by demographic and other information from the CPS) and nonfilers from the CPS provides us with a representative sample of the entire population rather than just the segment that files income tax returns. This allows us to estimate the revenue and distributional impact of tax proposals that would potentially affect current nonfilers.
We then augment the tax model database by imputing wealth, education, consumption, health, and retirement-related variables for each record in the matched LAPUF-CPS file. More detail about the data sources and methods for these imputations are available at http://www.taxpolicycenter.org/resources/brief-description-tax-model.
Consumption Imputations
In order to model the distributional impact of federal excise taxes and a variety of other indirect taxes, including broad-based consumption taxes (e.g., a value-added tax, or VAT) and
APPENDIX C: BRIEF DESCRIPTION OF TPC MICROSIMULATION MODEL

DISTRIBUTIONAL IMPLICATIONS OF A CARBON TAX
ENERGYPOLICY.COLUMBIA.EDU | JUNE 2018 | 36
carbon taxes, we impute consumption spending to each record in the tax model database. We use data from the Consumer Expenditure Survey (CEX) to produce estimates of consumption expenditures across 16 categories of goods and services for each household in our model. We also use the Urban Institute’s Dynamic Simulation of Income Model (DYNASIM) to estimate the amount of future consumption financed out of current wealth, which allows us to analyze transitional issues for options that move the tax system from an income base to a consumption base.
Tax Calculators and Incidence Assumptions
The tax model consists of a set of detailed tax calculators that (a) compute individual income tax liability for all filers in the sample under current law and under alternative policy proposals; (b) compute the employee and employer shares of payroll taxes for Social Security and Medicare; (c) assign the burden of the corporate income tax and excise taxes to tax units; and (d) determine the expected value of estate tax liability for each tax unit in the sample using an estate tax calculator in combination with age-specific mortality rates.
The Tax Policy Center’s incidence assumptions generally follow those adopted by the Congressional Budget Office and the Department of the Treasury. In particular, our tables assume that (1) the individual income tax is borne directly by individual income-tax payers; (2) both the employee and employer shares of payroll taxes are borne by the employee; (3) 60 percent of the corporate income tax is borne by shareholders, 20 percent by all capital owners, and 20 percent by labor; (4) the estate tax is borne by decedents (as opposed to heirs); and (5) excise taxes lower real incomes in proportion to each tax unit’s share of labor income plus the portion of capital income that exceeds the normal rate of return, and they change the relative prices consumers face (i.e., raise the cost of taxed goods and services relative to others).
Income Classifier
TPC uses an income concept called “expanded cash income” (ECI) for the purpose of distributional analysis. We construct ECI to be a broad measure of pretax income, and we use it both to rank tax units in our distribution tables and to calculate effective tax rates. We define ECI to be adjusted gross income (AGI) plus the following: above-the-line adjustments (e.g., IRA deductions, student loan interest, self-employed health insurance deduction, etc.), employer-paid health insurance and other nontaxable fringe benefits, employee and employer contributions to tax-deferred retirement savings plans, tax-exempt interest, nontaxable Social Security benefits, nontaxable pension and retirement income, accruals within defined benefit pension plans, inside buildup within defined contribution retirement accounts, cash and cash-like (e.g., SNAP) transfer income, employer’s share of payroll taxes, and imputed corporate income tax liability.

DISTRIBUTIONAL IMPLICATIONS OF A CARBON TAX
37 | CENTER ON GLOBAL ENERGY POLICY | COLUMBIA SIPA
1. This exemption occurs because the base of a consumption tax either excludes purchases of capital and other intermediate goods directly (retail sales taxes collected only on final sales to consumers), allows an immediate deduction for the purchase of capital goods (a subtraction-method value added tax), or allows taxpayers to claim a credit for taxes their suppliers pay on sales to them of capital goods (a credit-invoice value added tax, the form used in most other countries). Allowing a deduction for the purchase of capital goods is equivalent to exempting income from capital because the tax system does not reduce the rate of return on investment. In effect, with a consumption tax, the government is simply a partner in the investment, supplying t percent of the capital invested and then taking t percent of the return. The deduction reduces the cost of a $1 capital purchase to $(1-t), where t is the tax rate (on a tax-inclusive basis) and reduces the annual rental return from capital to r(1-t), where r is the pretax yield. The after-tax rate of return, r(1-t)/(1-t), is simply equal to the pretax return, r.
2. More recent research sets the share of profits that represent economic rents as high as 75 percent. See Power and Frerick (2016).
3. Our approach is similar to the methodology used at the Office of Tax Analysis at the US Treasury Department as described in Horowitz et al. (2017), with the exception of the treatment of wage-indexed transfer payments. Also, in most tables, we represent the tax burden as a share of pretax income instead of as a share of after-tax income, as do Horowitz et al.
4. TPC’s offset percentage averages about 25 percent of carbon tax receipts, close to what was historically used by official government revenue estimators (Joint Committee on Taxation 2011). We estimate an offset of about 23 percent while the TCJA’s individual tax cuts are in effect and roughly 27 percent thereafter. In comparison, JCT now uses an offset of roughly 22 percent through 2025 and 24 percent thereafter. Our estimate of the offset is done using TPC’s microsimulation model by simulating the decrease in nominal incomes and calculating the resulting change in income and payroll tax revenues. For that reason, our offset is more consistent with our distributional results than using the JCT offset, which is based on aggregate data and the assumption that excise taxes reduce all factor incomes proportionately.
5. As of 4/9/2018, CBO estimated federal deficits of $12.4 trillion over the ten-year budget period ending in 2028. See https://www.cbo.gov/publication/53651.
6. Like the temporary payroll tax cut in 2011–12, this option could be implemented without affecting Social Security financing or trust fund balances by either reimbursing trust funds out of general revenue or structuring it as a refundable income tax credit.
7. The reduction in corporate income tax revenues is below the baseline level projected by the administration in the 2019 budget. But that forecast is based on very optimistic
NOTES

DISTRIBUTIONAL IMPLICATIONS OF A CARBON TAX
ENERGYPOLICY.COLUMBIA.EDU | JUNE 2018 | 38
assumptions about economic growth over the 10-year budget period. The CBO has not yet released an updated budget forecast reflecting the new tax laws.
8. In appendix B, we report the full set of distributional results under the assumption that the normal return to capital bears 50 percent of the full burden that applies to labor income, wage-indexed transfer payments, and the supernormal return to capital.
9. CBO (Congressional Budget Office 2018) projects corporate tax receipts of $447 billion in fiscal year 2025. A reduction of $250 billion in corporate receipts would be a cut in corporate receipts of about 56 percent, which could be achieved by cutting the corporate rate from 21 percent to roughly 9 percent.

DISTRIBUTIONAL IMPLICATIONS OF A CARBON TAX
39 | CENTER ON GLOBAL ENERGY POLICY | COLUMBIA SIPA
1. Congressional Budget Office. 2018. “The Budget Outlook: 2018 to 2028.” Congressional Budget Office, April 2018. Available at https://www.cbo.gov/publication/53651.
2. Cronin, Julie-Anne, Don Fullerton, and Steven Sexton. 2017. “Vertical and Horizontal Redistributions from a Carbon Tax and Rebate.” NBER Working Paper 23250. National Bureau of Economic Research, March 2017.
3. Diamond, John W., and George R. Zodrow. 2018. “Macroeconomic and Distributional Effects of a Carbon Tax Under Alternative Revenue Recycling Options.” Report prepared by the Baker Institute for Public Policy at Rice University for the Columbia University SIPA Center for Global Energy Policy, July 2018.
4. Dinan, Terry. 2012. “Offsetting a Carbon Tax’s Costs on Low-Income Households.” CBO Working Paper 2012–16. Congressional Budget Office, November, 2012.
5. Hassett, Kevin, Aparna Mathur, and Gilbert Metcalf. 2009. “The Incidence of a U.S. Carbon Pollution Tax: A Lifetime and Regional Analysis. Energy Journal 30, no. 2: 155–178.
6. Horowitz, John, Julie-Anne Cronin, Hannah Hawkins, Laura Konda, and Alex Yuskavage. 2017. “Methodology for Analyzing a Carbon Tax.” US Department of the Treasury, Office of Tax Analysis, January 2017.
7. Joint Committee on Taxation. 1993. “Methodology and Issues in Measuring Changes in the Distribution of Tax Burdens.” JCS-7-93. June 14, 1993.
8. Joint Committee on Taxation. 2011. “The Income and Payroll Tax Offset to Changes in Excise Tax Revenues.” JCX-59-11. December 23, 2011.
9. Larsen, John, Shashank Mohan, Whitney Herndon, and Peter Marsters. 2018. “Energy and Environmental Implications of a Carbon Tax in the United States.” Report prepared by the Rhodium Group for the Columbia University SIPA Center for Global Energy Policy, July 2018.
10. Marron, Donald, and Eric Toder. 2013. “Carbon Taxes and Corporate Tax Reform.” Urban-Brookings Tax Policy Center, February 2013.
11. Marron, Donald, and Eric Toder. 2014. “Tax Policy Issues in Designing a Carbon Tax.” Urban-Brookings Tax Policy Center, May 2014.
12. Marron, Donald, Eric Toder, and Lydia Austin. 2015. “Taxing Carbon: What, Why, and How.” Urban-Brookings Tax Policy Center, June 2015.
13. Mathur, Aparna, and Adele C. Morris. 2017. “A U.S. Carbon Tax and the Earned Income Tax Credit: An Analysis of Potential Linkages.” Brookings Institution, January 2017.
REFERENCES

DISTRIBUTIONAL IMPLICATIONS OF A CARBON TAX
ENERGYPOLICY.COLUMBIA.EDU | JUNE 2018 | 40
14. Metcalf, Gilbert, Aparna Mathur, and Kevin Hassett. 2012. “Distributional Impacts in a Comprehensive Climate Policy Package.” In The Design and Implementation of U.S. Climate Policy, edited by Don Fullerton and Catherine Wolfram. Chicago: University of Chicago Press.
15. Poterba, James. 1991. “Is the Gasoline Tax Regressive?” Tax Policy and the Economy 5: 145–164.
16. Power, Laura, and Austin Frerick. 2016. “Have Excess Returns to Corporations Been Increasing over Time?” National Tax Journal 69, no. 4: 831–846.
17. Rausch, Sebastian, Gilbert E. Metcalf, and John M. Reilly. 2011. “Distributional Impacts of Carbon Pricing: A General Equilibrium Approach with Micro-Data for Households.” Energy Economics 33, no. S1: S20–S33.
18. Toder, Eric, Jim Nunns, and Joseph Rosenberg. 2011. “Methodology for Distributing a VAT.” Urban-Brookings Tax Policy Center, April 2011.

DISTRIBUTIONAL IMPLICATIONS OF A CARBON TAX
41 | CENTER ON GLOBAL ENERGY POLICY | COLUMBIA SIPA