inclusive and sustainable growth in high-income …€¦ · inclusive and sustainable growth in...
TRANSCRIPT
Inclusive and sustainable growth in high-income countries
• The distributional implications of environ-mental policies to support sustainability vary across income groups and can have beneficial or adverse effects on equity and labor earnings. Policies to encourage agricultural production, for example, can exacerbate off-farm pollution and lead to less efficient use of water, since water charges for farmers rarely reflect real scar-city or environmental costs.
• Sustainability requires policies to reduce pollution or resource-intensive produc-tion and consumption. Fostering labor force skills that enable businesses to adopt resource-efficient, sustainable processes and technologies is a central pillar of the transition to low-carbon economies.
Trends in growth and income distribution in high-income countries
Several high-income countries have been fac-ing slow growth and high unemployment since the crisis, while at the same time wit-nessing a gradual, long-term deterioration in the distribution of income. In particular:
Inequality in high-income economies has reached levels unprecedented in the post-World-War-II period. This chapter analyzes the determinants of growth and inequality in those high-income countries that belong to the Organisation for Economic Co-operation and Development (OECD) as well as how improvements in policies affecting labor uti-lization and productivity could make growth more inclusive and sustainable. The main messages are:
• Progrowth policies that foster greater labor utilization could reduce poverty levels in high-income OECD countries.1 However, progrowth policies that boost technologi-cal progress, which tends to favor high-skill workers, should not unduly harm poorer, low-skill workers.
• Investments in human capital are necessary to promote equality of opportunity, par-ticularly through raising preschool enroll-ment among disadvantaged households and ensuring educational attainment at least through primary school. Any increase in the flexibility of labor markets needs to be balanced with programs, such as unem-ployment benefits, that protect workers, but not jobs.
71
3
72 I N C L U S I V E A N D S U S T A I N A B L E G R O W T H G L O B A L M O N I T O R I N G R E P O R T 2 0 1 4 / 2 0 1 5
• The global crisis has taken its toll on potential growth in several countries, essentially because of lower capital inten-sity in production and persistently high unemployment; the unemployment situa-tion risks becoming structural in nature. Recent OECD estimates put the permanent GDP loss associated with the global crisis at about 3 percentage points on average across the OECD (OECD 2013g).
• Unemployment has reached close to 49 mil-lion people in the OECD area as a whole, or about 7.9 percent of the labor force. The youth unemployment rate has increased from 12 percent in 2000 to 16.3 percent in 2012. In addition, nearly 8 million youth in OECD countries are neither employed nor enrolled in education or training.
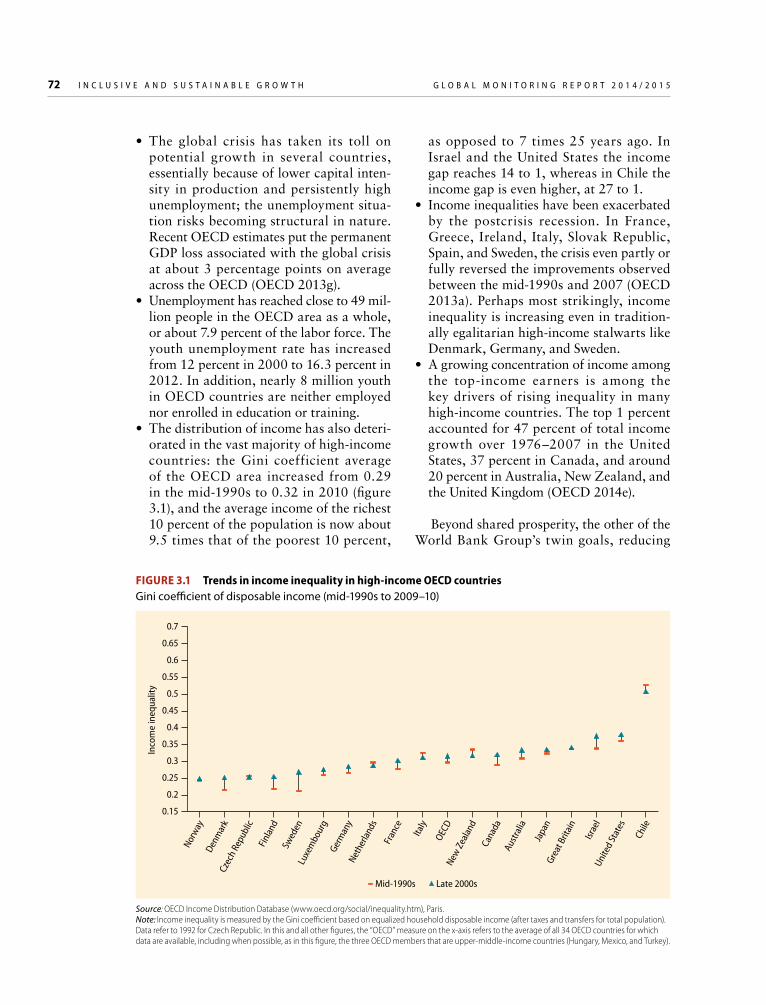
• The distribution of income has also deteri-orated in the vast majority of high-income countries: the Gini coefficient average of the OECD area increased from 0.29 in the mid-1990s to 0.32 in 2010 (figure 3.1), and the average income of the richest 10 percent of the population is now about 9.5 times that of the poorest 10 percent,
as opposed to 7 times 25 years ago. In Israel and the United States the income gap reaches 14 to 1, whereas in Chile the income gap is even higher, at 27 to 1.
• Income inequalities have been exacerbated by the postcrisis recession. In France, Greece, Ireland, Italy, Slovak Republic, Spain, and Sweden, the crisis even partly or fully reversed the improvements observed between the mid-1990s and 2007 (OECD 2013a). Perhaps most strikingly, income inequality is increasing even in tradition-ally egalitarian high-income stalwarts like Denmark, Germany, and Sweden.
• A growing concentration of income among the top-income earners is among the key drivers of rising inequality in many high-income countries. The top 1 percent accounted for 47 percent of total income growth over 1976–2007 in the United States, 37 percent in Canada, and around 20 percent in Australia, New Zealand, and the United Kingdom (OECD 2014e).
Beyond shared prosperity, the other of the World Bank Group’s twin goals, reducing
Inco
me
ineq
ualit
y
0.15
0.2
0.25
0.3
0.35
0.4
0.45
0.5
0.55
0.6
0.65
0.7
Norway
Denm
ark
Czec
h Re
publ
icFin
land
Swed
enLu
xem
bour
gGe
rman
yNet
herla
nds
Fran
ce
Italy
OECD
New Z
ealan
dCa
nada
Austr
alia
Japa
nGr
eat B
ritain
Israe
lUn
ited
Stat
es
Chile
Mid-1990s Late 2000s
FIGURE 3.1 Trends in income inequality in high-income OECD countriesGini coefficient of disposable income (mid-1990s to 2009–10)
Source: OECD Income Distribution Database (www.oecd.org/social/inequality.htm), Paris.Note: Income inequality is measured by the Gini coefficient based on equalized household disposable income (after taxes and transfers for total population). Data refer to 1992 for Czech Republic. In this and all other figures, the “OECD” measure on the x-axis refers to the average of all 34 OECD countries for which data are available, including when possible, as in this figure, the three OECD members that are upper-middle-income countries (Hungary, Mexico, and Turkey).
G L O B A L M O N I T O R I N G R E P O R T 2 0 1 4 / 2 0 1 5 I N C L U S I V E A N D S U S T A I N A B L E G R O W T H 73
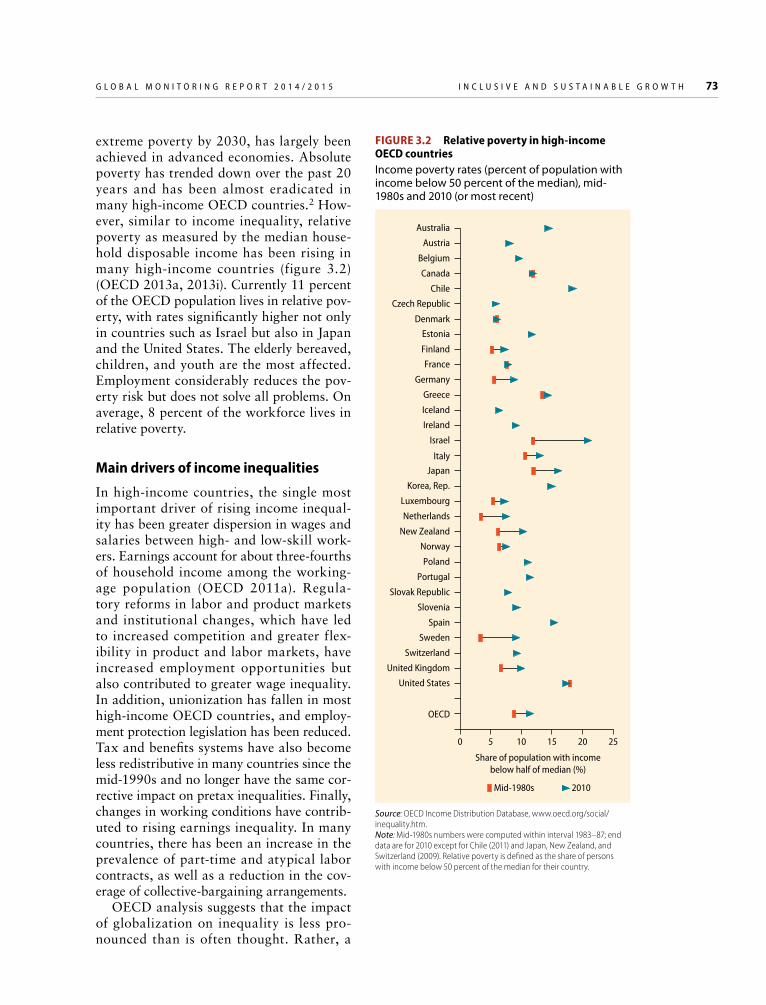
extreme poverty by 2030, has largely been achieved in advanced economies. Absolute poverty has trended down over the past 20 years and has been almost eradicated in many high-income OECD countries.2 How-ever, similar to income inequality, relative poverty as measured by the median house-hold disposable income has been rising in many high-income countries (figure 3.2) (OECD 2013a, 2013i). Currently 11 percent of the OECD population lives in relative pov-erty, with rates significantly higher not only in countries such as Israel but also in Japan and the United States. The elderly bereaved, children, and youth are the most affected. Employment considerably reduces the pov-erty risk but does not solve all problems. On average, 8 percent of the workforce lives in relative poverty.
Main drivers of income inequalities
In high-income countries, the single most important driver of rising income inequal-ity has been greater dispersion in wages and salaries between high- and low-skill work-ers. Earnings account for about three-fourths of household income among the working-age population (OECD 2011a). Regula-tory reforms in labor and product markets and institutional changes, which have led to increased competition and greater flex-ibility in product and labor markets, have increased employment opportunities but also contributed to greater wage inequality. In addition, unionization has fallen in most high-income OECD countries, and employ-ment protection legislation has been reduced. Tax and benefits systems have also become less redistributive in many countries since the mid-1990s and no longer have the same cor-rective impact on pretax inequalities. Finally, changes in working conditions have contrib-uted to rising earnings inequality. In many countries, there has been an increase in the prevalence of part-time and atypical labor contracts, as well as a reduction in the cov-erage of collective-bargaining arrangements.
OECD analysis suggests that the impact of globalization on inequality is less pro-nounced than is often thought. Rather, a
0 5 10 15 20 25
Australia
Austria
Belgium
Canada
Chile
Czech Republic
DenmarkEstonia
Finland
France
Germany
Greece
Iceland
Ireland
Israel
ItalyJapan
Korea, Rep.
Luxembourg
Netherlands
New Zealand
Norway
Poland
Portugal
Slovak Republic
Slovenia
Spain
Sweden
Switzerland
United Kingdom
United States
OECD
Mid-1980s 2010
Share of population with incomebelow half of median (%)
FIGURE 3.2 Relative poverty in high-income OECD countriesIncome poverty rates (percent of population with income below 50 percent of the median), mid-1980s and 2010 (or most recent)
Source: OECD Income Distribution Database, www.oecd.org/social/inequality.htm.Note: Mid-1980s numbers were computed within interval 1983–87; end data are for 2010 except for Chile (2011) and Japan, New Zealand, and Switzerland (2009). Relative poverty is defined as the share of persons with income below 50 percent of the median for their country.
74 I N C L U S I V E A N D S U S T A I N A B L E G R O W T H G L O B A L M O N I T O R I N G R E P O R T 2 0 1 4 / 2 0 1 5
greater impact has come from technological progress, which has been much more benefi-cial to higher-skilled workers. The impact of technology has increased wage dispersion by allowing those with the relevant skills, such as information and communications technol-ogy (ICT) or financial services professionals, to benefit from significant income gains while lower-skill individuals have fallen behind. As a result, the earnings gap between high- and low-skill workers has grown. In some coun-tries, including the United States, skill-based technical change induced a shift in labor demand toward higher skills. Yet the supply of such individuals has not kept pace with rising demand, as indicated by the slowing growth of tertiary educational attainment (Denk and others 2013).
Rising shares of nonwage income from capital have also increased household income inequality. Capital income inequality has increased more than earnings inequality in most high-income countries. But, at around 7 percent, the share of capital income in total household income still remains mod-est on average, although richer individuals tend to receive a larger share of their income from capital. In Canada, France, Italy, Spain, and the United States, the five high-income OECD countries for which data are avail-able, the share of capital income (exclud-ing capital gains) is largest for the top 0.01 percent. In Canada about 20 percent of this group’s income comes from capital, whereas in France it is almost 60 percent (OECD 2014e). Wealth-to-income ratios have risen sharply in OECD countries since the mid-20th century. The challenge this trend poses for policy making is that wealth is transmit-ted across generations, perpetuating inequali-ties in both wealth and the incomes derived from it.
Inequalities in non-income outcomes
Inequality is multidimensional and goes beyond income, affecting opportunities. Rising inequality in income is often accom-panied by growing exclusion in the labor market, lower intergenerational social
mobility, and greater polarization in edu-cational and health outcomes. Access to quality jobs is also unequal and perpetuates income discrepancies. Not only are youth, the low-skilled, immigrants, and other dis-advantaged groups currently facing rela-tively higher unemployment rates, but many of them who are employed are subjected to nonstandard work arrangements, such as involuntary part-time or temporary jobs and self-employment. These jobs now account for about one-third of total employment across OECD countries.
Rising income inequality is also accompa-nied by greater polarization in educational outcomes, which triggers a vicious circle of exclusion and inequality. In high-income OECD countries, adults ages 25–64 with tertiary education have lower unemploy-ment rates than those with at most upper-secondary education, who in turn have lower unemployment rates than those with less than secondary education. Tertiary-educated adults are more likely than others to be in the labor force in the first place and to earn higher salaries, enjoy good health, and live longer. Poorer students struggle to compete with their wealthier classmates and go on to lower levels of educational attainment, lower salaries, and shorter lives.
Large income inequalities also affect the health status of the different socioeconomic groups. Data from 14 OECD countries (including Hungary) show, for instance, that on average people with better education live 6 years longer than their poorly educated peers (OECD 2013d). In the United States, in 2008, well-educated white males were expected to live 14 years longer than the worst-educated African-Americans (OECD 2014f). The impact of environmental con-ditions on health is also largely unequal. Poor, young, and elderly individuals stand at greater risk from environmental degradation than the remainder of the population because of a combination of higher susceptibility and greater exposure. People with lower incomes are more likely to live in environmentally distressed areas and thus be subjected to pollution and other environmental hazards.
G L O B A L M O N I T O R I N G R E P O R T 2 0 1 4 / 2 0 1 5 I N C L U S I V E A N D S U S T A I N A B L E G R O W T H 75
Short-term effects of high concentrations of air pollution (PM10) appear to be largely restricted to people of low socioeconomic sta-tus living in dense urban areas (Gwynn and Thurston 2001).
Capturing the multidimensional aspect of inequality
Addressing the different aspects of inequali-ties and their impacts on different popula-tion groups matters for policy design and implementation. In this respect, the notion of multidimensional living standards is particu-larly useful, because it combines income and non-income outcomes in a single measure that can be computed for different social groups (box 3.1).
An illustrative exercise has been carried out for OECD countries before and after the financial crisis of 2008–09.3 On the basis of
the three selected dimensions (income, jobs, and health), it appears that:
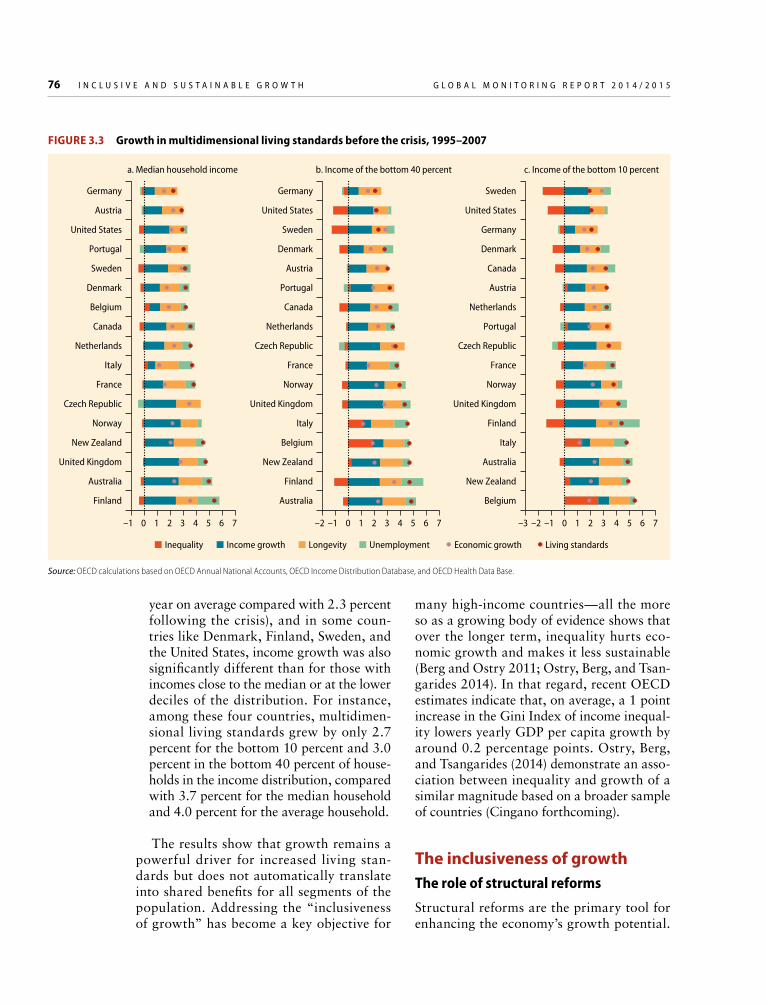
• Over the decade running up to the crisis, multidimensional living standards rose faster than per capita GDP. This result is largely attributable to robust GDP growth that led to rising household incomes and falling unemployment, but it also stems from improvements in health conditions, which have been associated with rising lon-gevity (figure 3.3). The cross-country cor-relation between growth rates of GDP per capita and multidimensional living stan-dards is positive but with large variance across countries.4
• Growth in multidimensional living stan-dards varies among social groups. Multidi-mensional living standards of the average household rose faster than GDP per capita before the crisis (1995–2007) (3.9 percent a
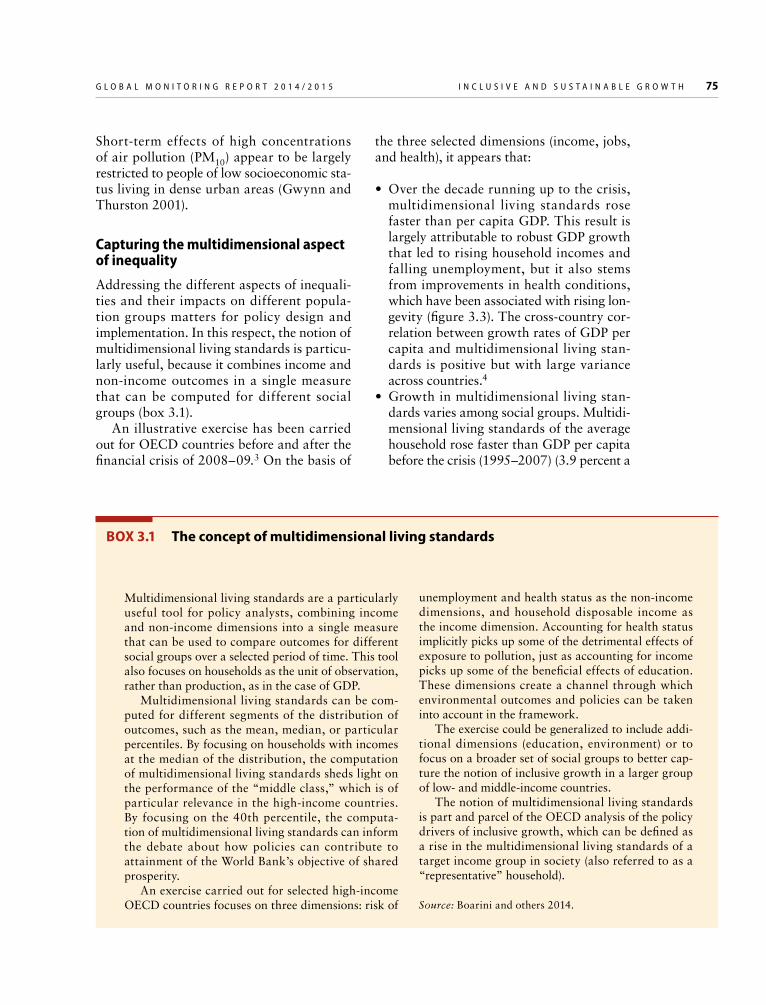
BOX 3.1 The concept of multidimensional living standards
Multidimensional living standards are a particularly useful tool for policy analysts, combining income and non-income dimensions into a single measure that can be used to compare outcomes for different social groups over a selected period of time. This tool also focuses on households as the unit of observation, rather than production, as in the case of GDP.
Multidimensional living standards can be com-puted for different segments of the distribution of outcomes, such as the mean, median, or particular percentiles. By focusing on households with incomes at the median of the distribution, the computation of multidimensional living standards sheds light on the performance of the “middle class,” which is of particular relevance in the high-income countries. By focusing on the 40th percentile, the computa-tion of multidimensional living standards can inform the debate about how policies can contribute to attainment of the World Bank’s objective of shared prosperity.
An exercise carried out for selected high-income OECD countries focuses on three dimensions: risk of
unemployment and health status as the non-income dimensions, and household disposable income as the income dimension. Accounting for health status implicitly picks up some of the detrimental effects of exposure to pollution, just as accounting for income picks up some of the beneficial effects of education. These dimensions create a channel through which environmental outcomes and policies can be taken into account in the framework.
The exercise could be generalized to include addi-tional dimensions (education, environment) or to focus on a broader set of social groups to better cap-ture the notion of inclusive growth in a larger group of low- and middle-income countries.
The notion of multidimensional living standards is part and parcel of the OECD analysis of the policy drivers of inclusive growth, which can be defined as a rise in the multidimensional living standards of a target income group in society (also referred to as a “representative” household).
Source: Boarini and others 2014.
76 I N C L U S I V E A N D S U S T A I N A B L E G R O W T H G L O B A L M O N I T O R I N G R E P O R T 2 0 1 4 / 2 0 1 5
year on average compared with 2.3 percent following the crisis), and in some coun-tries like Denmark, Finland, Sweden, and the United States, income growth was also significantly different than for those with incomes close to the median or at the lower deciles of the distribution. For instance, among these four countries, multidimen-sional living standards grew by only 2.7 percent for the bottom 10 percent and 3.0 percent in the bottom 40 percent of house-holds in the income distribution, compared with 3.7 percent for the median household and 4.0 percent for the average household.
The results show that growth remains a powerful driver for increased living stan-dards but does not automatically translate into shared benefits for all segments of the population. Addressing the “inclusiveness of growth” has become a key objective for
many high-income countries—all the more so as a growing body of evidence shows that over the longer term, inequality hurts eco-nomic growth and makes it less sustainable (Berg and Ostry 2011; Ostry, Berg, and Tsan-garides 2014). In that regard, recent OECD estimates indicate that, on average, a 1 point increase in the Gini Index of income inequal-ity lowers yearly GDP per capita growth by around 0.2 percentage points. Ostry, Berg, and Tsangarides (2014) demonstrate an asso-ciation between inequality and growth of a similar magnitude based on a broader sample of countries (Cingano forthcoming).
The inclusiveness of growth The role of structural reforms
Structural reforms are the primary tool for enhancing the economy’s growth potential.
Germany
Austria
United States
Portugal
Sweden
Denmark
Belgium
Canada
Netherlands
Italy
France
Czech Republic
Norway
New Zealand
United Kingdom
Australia
Finland
Inequality Income growth Longevity Unemployment Economic growth Living standards
Germany
United States
Sweden
Denmark
Austria
Portugal
Canada
Netherlands
Czech Republic
France
Norway
United Kingdom
Italy
Belgium
New Zealand
Finland
Australia
–3 –2 –1 0 1 2 3 4 5 6 7–2 –1 0 1 2 3
c. Income of the bottom 10 percentb. Income of the bottom 40 percent
4 5 6 7–1 0 1 2 3
a. Median household income
4 5 6 7
Sweden
United States
Germany
Denmark
Canada
Austria
Netherlands
Portugal
Czech Republic
France
Norway
United Kingdom
Finland
Italy
Australia
New Zealand
Belgium
FIGURE 3.3 Growth in multidimensional living standards before the crisis, 1995–2007
Source: OECD calculations based on OECD Annual National Accounts, OECD Income Distribution Database, and OECD Health Data Base.
G L O B A L M O N I T O R I N G R E P O R T 2 0 1 4 / 2 0 1 5 I N C L U S I V E A N D S U S T A I N A B L E G R O W T H 77
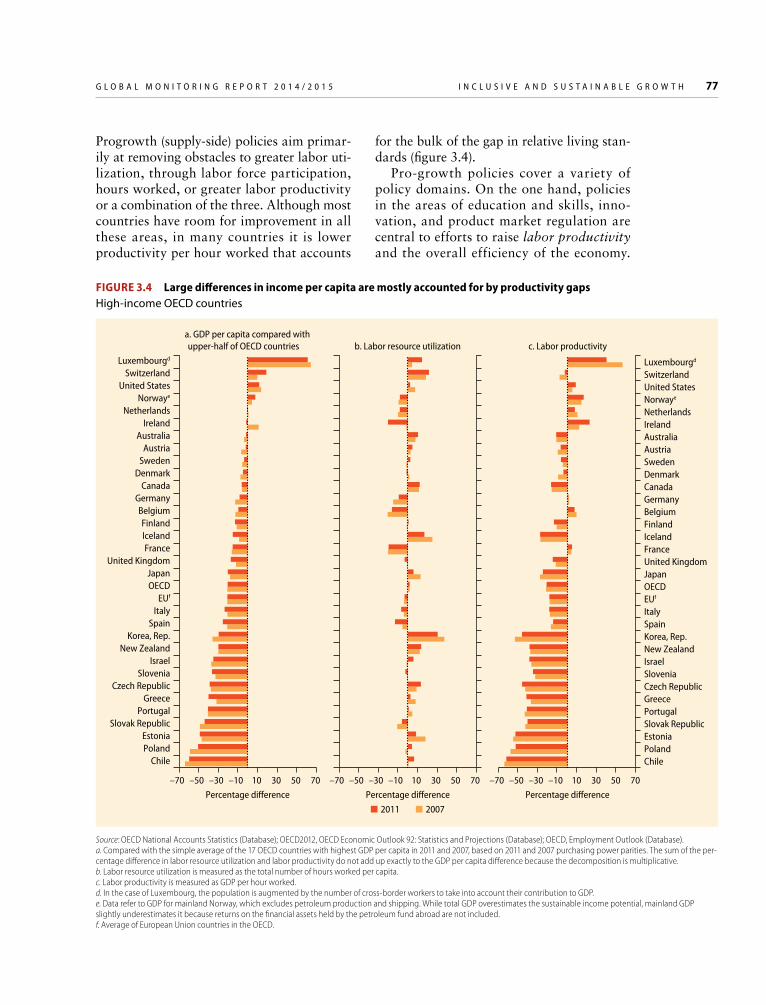
Progrowth (supply-side) policies aim primar-ily at removing obstacles to greater labor uti-lization, through labor force participation, hours worked, or greater labor productivity or a combination of the three. Although most countries have room for improvement in all these areas, in many countries it is lower productivity per hour worked that accounts
for the bulk of the gap in relative living stan-dards (figure 3.4).
Pro-growth policies cover a variety of policy domains. On the one hand, policies in the areas of education and skills, inno-vation, and product market regulation are central to efforts to raise labor productivity and the overall efficiency of the economy.
–70 –50 –30 –10 10 Percentage di�erence Percentage di�erence Percentage di�erence
30 50 70
ChilePolandEstonia
Slovak RepublicPortugal
GreeceCzech Republic
SloveniaIsrael
New ZealandKorea, Rep.
SpainItaly
EUf
OECDJapan
United KingdomFrance
IcelandFinland
BelgiumGermany
CanadaDenmark
SwedenAustria
AustraliaIreland
NetherlandsNorwaye
United StatesSwitzerland
Luxembourgd
–70 –50 –30 –10 10 30 50 70 –70 –50 –30 –10 10 30 50 70
Chile Poland Estonia Slovak Republic Portugal Greece Czech Republic Slovenia Israel New Zealand Korea, Rep. Spain Italy EUf OECD Japan United Kingdom France Iceland Finland Belgium Germany Canada Denmark Sweden Austria Australia Ireland Netherlands Norwaye United States Switzerland Luxembourgd
a. GDP per capita compared withupper-half of OECD countries b. Labor resource utilization c. Labor productivity
20072011
FIGURE 3.4 Large differences in income per capita are mostly accounted for by productivity gapsHigh-income OECD countries
Source: OECD National Accounts Statistics (Database); OECD2012, OECD Economic Outlook 92: Statistics and Projections (Database); OECD, Employment Outlook (Database).a. Compared with the simple average of the 17 OECD countries with highest GDP per capita in 2011 and 2007, based on 2011 and 2007 purchasing power parities. The sum of the per-centage difference in labor resource utilization and labor productivity do not add up exactly to the GDP per capita difference because the decomposition is multiplicative.b. Labor resource utilization is measured as the total number of hours worked per capita.c. Labor productivity is measured as GDP per hour worked.d. In the case of Luxembourg, the population is augmented by the number of cross-border workers to take into account their contribution to GDP.e. Data refer to GDP for mainland Norway, which excludes petroleum production and shipping. While total GDP overestimates the sustainable income potential, mainland GDP slightly underestimates it because returns on the financial assets held by the petroleum fund abroad are not included.f. Average of European Union countries in the OECD.
78 I N C L U S I V E A N D S U S T A I N A B L E G R O W T H G L O B A L M O N I T O R I N G R E P O R T 2 0 1 4 / 2 0 1 5
On the other hand, reforms to tax and ben-efit systems, unemployment insurance, and active labor market policies, as well as pen-sion and health care systems, for example, can do much to remove obstacles to greater labor utilization and disincentives to the par-ticipation of groups with weak attachment to the labor force, such as migrants, youth, and women. Of course, interventions in different policy domains may complement each other, acting to boost labor productivity at the same time as encouraging a more effective utiliza-tion of labor. Efforts to improve the business environment, by reducing red tape and open-ing up protected sectors to competition, have the advantage of unlocking opportunities for investment and improving the overall effi-ciency of the economy.
Tradeoffs between progrowth and pro-inclusiveness policies may exist that need to be considered. For instance:
• A reduction in the level of protection of permanent jobs helps to reduce labor mar-ket duality but can disproportionately affect low-wage earners.
• Reducing the legal extension of collective wage agreements to more workers might lower labor costs and promote employ-ment, which is good for growth, but it might also contribute to widening wage dispersion, which is undesirable from the point of view of inclusiveness.
• Shifting the tax structure away from direct taxes (labor and corporate income taxes) toward consumption, environment, and property taxes provides incentives to work and can encourage employment but may also raise equity concerns.
• Greater competition in product markets can stimulate innovation and entrepreneur-ship, but it can also raise inequality to the extent that technological progress favors high-skill workers.
In a number of areas, there is clear evi-dence that policies designed to reduce inequality can also boost growth. The clear-est example is education. In high-income OECD countries, there are signs that the
completion of secondary and tertiary educa-tion can boost income. Addressing inequali-ties in both access to, and quality of, educa-tion can be expected to help lower inequality in labor income. Policies that address impedi-ments to labor market participation, for instance by improving the access to child care for women, or ensuring a smooth transi-tion from school to work, could lead to more equal labor market outcomes while boosting long-run growth.
Equally important is the recognition of the distributional effects of progrowth struc-tural policies. In other words, by affecting the utilization and productivity of labor, supply-side policies are likely to influence the way in which the benefits and rewards of growth are shared among the different social groups. For example, initiatives aimed primarily at enhancing the performance of students and facilitating their transition from school to work allow them to compete for better- paying jobs and, depending on how these policies affect disadvantaged groups, may have an impact on the distribution of labor income. Reforms to tax benefit systems can help to remove obstacles to labor force participation (by reducing the tax burden on the income of second earners, for exam-ple), which is supportive of growth and also improve the earnings prospects of otherwise discouraged workers.
Progrowth structural reforms can also affect the distribution of non-income out-comes, including skills and education, employment, health, or environment. For instance, an increase in nonstandard employ-ment, such as involuntary part-time or tempo-rary jobs, can lower job quality, in particular for low-skill workers. It can also increase job strain, adversely impact mental health, and reduce worker capacity to connect to social and professional networks. These trade-offs are also important to address because inequality goes far beyond income dispari-ties. Some population groups, particularly the less educated and low-income individu-als, live shorter lives, are less active in politi-cal activities, have greater health problems and more children with lower performance
G L O B A L M O N I T O R I N G R E P O R T 2 0 1 4 / 2 0 1 5 I N C L U S I V E A N D S U S T A I N A B L E G R O W T H 79
at school than more advantaged groups. Dis-advantaged population groups are also more exposed to insecurity, crime, and environ-mental degradation (OECD 2013e).
Strengthening productivity by investing in human capital
Investing in human capital is essential to promote equality of opportunity and sustain economic growth. A broad range of actions can make education policy more growth-friendly and inclusive.
First, education is more effective the earlier it starts. The OECD’s Programme for Inter-national Student Assessment (PISA) shows that children who have enrolled in preschool education perform better throughout their educational life and tend to be better inte-grated socially. Disadvantaged students tend to have less access to preprimary education, but some countries manage to avoid this situ-ation. For example, Estonia, Iceland, Japan, and the Republic of Korea have smaller-than- average enrollment gaps between socioeco-nomic backgrounds for preprimary school education. More investment to increase pre-school enrollment among economically and socially deprived households should there-fore be a priority. The provision of child care services can provide parents with young children the care support they need to work, while also providing safe environments for preschoolers to learn and develop.
Second, raising educational attainment up to at least lower-secondary level is likely to reduce income inequality. OECD analysis shows that reaching at least secondary-level education boosts an individual’s employment prospects, and moreover, raising the share of workers with upper-secondary education is associated with a decline in earnings inequal-ity (Fournier and Koske 2012). In the OECD approximately 20 percent of young adults leave school before finishing upper- secondary education, dramatically increasing their risk of unemployment, poverty, and social exclu-sion. Several policies can help prevent fail-ure and promote completion of secondary education. For instance, early tracking (at
the lower-secondary level), which discour-ages students and encourages early dropout, should be avoided. School choice should also be managed to avoid socioeconomic segre-gation, and upper-secondary pathways need to be designed to encourage completion by allowing two-way passage between differ-ent curriculum streams and to ensure that completed secondary schooling leads to aca-demic or vocational education and training qualification.
Third, education policies need to improve low-performing schools and classrooms by offering a quality learning experience for the most disadvantaged. Low-performing schools often lack the capacity or support to improve. In these schools, policy should focus on strengthening and supporting academic leadership by providing good working con-ditions, systemic support, full teacher train-ing, and incentives for staff. Disadvantaged schools also need to focus on prioritizing the development of positive teacher-student and peer relationships, ensuring that effective classroom learning strategies and diagnos-tic tools (data information systems) are in place to identify struggling students and the factors of learning disruptions. These strate-gies have been employed in Japan and Korea, where successful teachers and principals are often reassigned to different schools, foster-ing more equal distribution of the most capa-ble teachers and school leaders. In Finnish schools specially trained teachers are assigned to support struggling students who are at risk of dropping out, whereas in Canada, equal or greater educational resources are targeted at disadvantaged immigrant students to boost their performance (Cheung 2012).
Although skills are a powerful determi-nant of employability, many advanced econo-mies face a mismatch between the demands of employers and the supply of workers that can meet those demands (OECD 2013h). Many different considerations affect student choices; labor market prospects and needs compete with personal interests and social stereotypes. Most developed economies face shortages in the STEM disciplines (science, technology, engineering, and mathematics), and many
80 I N C L U S I V E A N D S U S T A I N A B L E G R O W T H G L O B A L M O N I T O R I N G R E P O R T 2 0 1 4 / 2 0 1 5
countries take initiatives to stimulate young people—especially girls and young women—to study STEM subjects. The OECD Survey of Adult Skills (PIAAC) also points to the existence of significant mismatches between skills and their use at work, particularly for some sociodemographic groups. Skills-use indicators show that more proficient workers often use their skills at work less intensively than less proficient workers. Overqualifica-tion is particularly common among foreign-born workers and those employed in small establishments, in part-time jobs, or on fixed-term contracts. Overqualification has a sig-nificant impact on wages, even after adjusting for proficiency, implying a “waste” of human capital, since overqualified workers tend to underuse their skills.
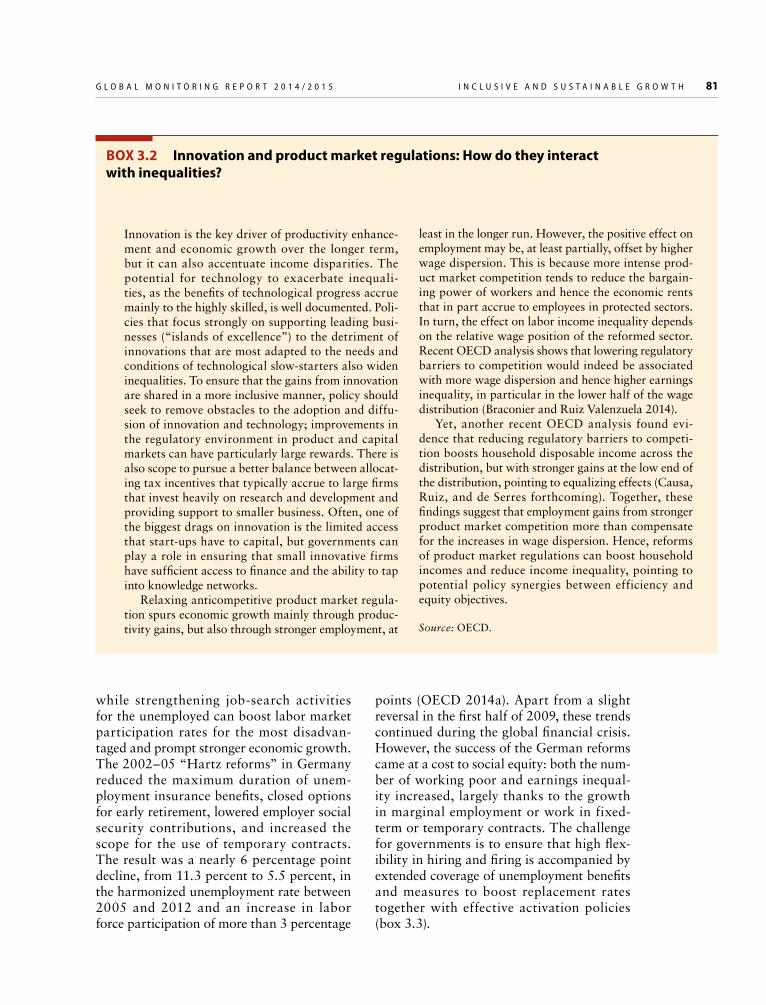
Ensuring that the workforce has ample opportunity to upgrade its skills bestows benefits on the wider economy and under-scores equality of opportunity. Reinforcing the skills of the workforce, and enabling skill progression by creating structured pathways for skills development, is essential to buttress the business environment and help all indi-viduals to take advantage of technological innovation and liberalizing reforms, which otherwise negatively affect the low-skilled (box. 3.2). To enable successful up-skilling, governments need to focus on creating clear and well-structured learning pathways that contain a greater degree of flexibility for adult learners. In Belgium (Flanders), centers for adult education facilitate the participa-tion of working adults with flexible modular provision of programs (Flemish Department of Education and Training 2013). Flexible access in Denmark ensures that in any given year around 40 percent of adults participate in formal or informal education (OECD 2011b). Policy makers also need to ensure that learning pathways lead to higher-level vocational qualifications for graduates of the initial vocational system. This approach has been successful in Iceland, where graduate apprentices learn how to run their own busi-nesses after a certain period of work, through the master craftsman examination (Musset and Castañeda Valle 2013).
More generally, systematic efforts are needed both to support professional train-ing with tertiary academic education and to enhance the status of vocational education and training. Such systematic approaches have been effective in the United Kingdom, where after two-year foundational (voca-tional) degrees, students can progress to an honors degree (normally three years full-time) through an additional year of full-time study, or two years part-time. Fifty-nine percent of full-time and 42 percent of part-time students pursuing a foundation degree in 2007–08 went on to study for an honors degree in 2008–09 (CEDEFOP 2009). In Austria, vocational training is held in high esteem and there is a clear pathway from vocational to tertiary education. In total, around 27 percent of upper-secondary stu-dents enroll in a vocational college (Berufs-bildende höhere Schule); those who complete five years of study are granted a vocational diploma and the reifeprüfung, which quali-fies them to enter university (Musset and oth-ers 2013).
Strengthening labor utilization
Flexibility vs. securityTo make labor market policies more growth-friendly and inclusive, policy makers must strike a balance between providing the flex-ibility required by employers and the need to protect workers against adverse income shocks. Reductions in the level of protection of permanent jobs can reduce labor market duality, making it easier for vulnerable and less experienced workers to find jobs. In the wake of the financial crisis, several south-ern Euro Area countries have embarked on reform programs to address different aspects of employment protection legislation. The Spanish government has pursued clarification of dismissal criteria, in Portugal there has been a decrease in severance pay, and in Italy measures have been implemented to reduce number of forced reinstatement cases for dis-missed workers.
Reducing the duration of unemployment benefits and options for early retirement
G L O B A L M O N I T O R I N G R E P O R T 2 0 1 4 / 2 0 1 5 I N C L U S I V E A N D S U S T A I N A B L E G R O W T H 81
while strengthening job-search activities for the unemployed can boost labor market participation rates for the most disadvan-taged and prompt stronger economic growth. The 2002–05 “Hartz reforms” in Germany reduced the maximum duration of unem-ployment insurance benefits, closed options for early retirement, lowered employer social security contributions, and increased the scope for the use of temporary contracts. The result was a nearly 6 percentage point decline, from 11.3 percent to 5.5 percent, in the harmonized unemployment rate between 2005 and 2012 and an increase in labor force participation of more than 3 percentage
points (OECD 2014a). Apart from a slight reversal in the first half of 2009, these trends continued during the global financial crisis. However, the success of the German reforms came at a cost to social equity: both the num-ber of working poor and earnings inequal-ity increased, largely thanks to the growth in marginal employment or work in fixed-term or temporary contracts. The challenge for governments is to ensure that high flex-ibility in hiring and firing is accompanied by extended coverage of unemployment benefits and measures to boost replacement rates together with effective activation policies (box 3.3).
BOX 3.2 Innovation and product market regulations: How do they interact with inequalities?
Innovation is the key driver of productivity enhance-ment and economic growth over the longer term, but it can also accentuate income disparities. The potential for technology to exacerbate inequali-ties, as the benefits of technological progress accrue mainly to the highly skilled, is well documented. Poli-cies that focus strongly on supporting leading busi-nesses (“islands of excellence”) to the detriment of innovations that are most adapted to the needs and conditions of technological slow-starters also widen inequalities. To ensure that the gains from innovation are shared in a more inclusive manner, policy should seek to remove obstacles to the adoption and diffu-sion of innovation and technology; improvements in the regulatory environment in product and capital markets can have particularly large rewards. There is also scope to pursue a better balance between allocat-ing tax incentives that typically accrue to large firms that invest heavily on research and development and providing support to smaller business. Often, one of the biggest drags on innovation is the limited access that start-ups have to capital, but governments can play a role in ensuring that small innovative firms have sufficient access to finance and the ability to tap into knowledge networks.
Relaxing anticompetitive product market regula-tion spurs economic growth mainly through produc-tivity gains, but also through stronger employment, at
least in the longer run. However, the positive effect on employment may be, at least partially, offset by higher wage dispersion. This is because more intense prod-uct market competition tends to reduce the bargain-ing power of workers and hence the economic rents that in part accrue to employees in protected sectors. In turn, the effect on labor income inequality depends on the relative wage position of the reformed sector. Recent OECD analysis shows that lowering regulatory barriers to competition would indeed be associated with more wage dispersion and hence higher earnings inequality, in particular in the lower half of the wage distribution (Braconier and Ruiz Valenzuela 2014).
Yet, another recent OECD analysis found evi-dence that reducing regulatory barriers to competi-tion boosts household disposable income across the distribution, but with stronger gains at the low end of the distribution, pointing to equalizing effects (Causa, Ruiz, and de Serres forthcoming). Together, these findings suggest that employment gains from stronger product market competition more than compensate for the increases in wage dispersion. Hence, reforms of product market regulations can boost household incomes and reduce income inequality, pointing to potential policy synergies between efficiency and equity objectives.
Source: OECD.
82 I N C L U S I V E A N D S U S T A I N A B L E G R O W T H G L O B A L M O N I T O R I N G R E P O R T 2 0 1 4 / 2 0 1 5
Governments are challenged with pro-viding levels of wage flexibility conducive to strong economic performance and low unemployment, while limiting increases in the number of working poor and earn-ings inequality. Reforms to the negotiation of collective bargaining agreements can help to strike a balance between flexibility and security. In Spain policy actions have focused on amending collective bargaining to give priority to firm-level wage agreements over sectoral ones, whereas in France a “job
safeguarding agreement” enabled employ-ers to negotiate individually with the unions concerning the adjustment of working hours and wages to reduce potential layoffs. Policy makers must set the minimum wage at a level that provides adequate income for the lowest paid individuals, while also ensuring that it is not set so high that it discourages the employ-ment of youth and low-skilled workers. They can also develop measures to increase job quality and the employability of youth and the low-skilled through effective employment
BOX 3.3 “Flexicurity”: The case of Denmark
The Danish labor market is characterized by a high degree of what is often referred to as “flexicurity.” The term denotes the coexistence of flexibility, in the form of low adjustment costs for both employers and employees, and security, which is a by-product of Denmark’s developed social safety net, ensuring high coverage and replacement rates. The principal aim of flexicurity is to promote employment security over job security, meaning workers are protected, rather than their jobs. Consequently, employers benefit from all the advantages of a flexible labor force, while at the same time employees can take comfort in a robust social safety net applied in conjunction with active labor market policies.
Employing flexible rules for hiring and firing makes it easier for Danish employers to dismiss employees during downturns and to take on more staff during periods of growth. This strong degree of flexibility is evidenced by the fact that around 25 percent of Danish private-sector workers change jobs each year. Adjustment costs in Denmark are tradition-ally low for both employers and employees, because social benefits (such as pensions and health care) are not tied to the employer, and unemployment benefits are set at a comparatively high level for those over age 25 (up to 90 percent for the lowest-paid workers) and have a comparably long duration.
Since the 1990s the flexicurity system has placed increasing emphasis on activation policies, which further reduce employees’ adjustment costs and miti-gate the disincentive effects of the unemployment insurance system. In percentage terms, Denmark now spends more than any other OECD country,
in the region of 1.5 percent of GDP, on active labor policy measures. This ensures that an effective sys-tem is in place to offer guidance alongside employ-ment or education opportunities to the unemployed. Reform has also led to the earlier introduction and greater concentration of activation measures. In addi-tion , the reform programs, which began in the mid-1990s, have also seen a steady reduction in the maxi-mum duration of unemployment benefits. Before the early 1990s, insured workers who met the eligibility requirements could expect to receive benefits indefi-nitely, provided that they complied with the require-ments imposed by the system. Following a number of reforms in subsequent years, the maximum period for which benefits can be drawn now rests at two years in any three-year period.
In the wake of the crisis, the “flex” part of flexi-curity has been performing well. Exit rates out of unemployment have declined, but a large propor-tion of the jobless still manage to find employment quickly. As far as security is concerned, earnings losses associated with plant closures or major worker displacements seem to have been relatively small from an international perspective, but this is likely due to the compressed Danish wage structure. On the whole, the program of reforms undertaken in the mid-1990s seems to have led to a decline in earnings losses asso-ciated with unemployment, although it remains to be seen whether this trend will continue in a prolonged period of low growth.
Source: Eriksson 2012.
G L O B A L M O N I T O R I N G R E P O R T 2 0 1 4 / 2 0 1 5 I N C L U S I V E A N D S U S T A I N A B L E G R O W T H 83
counseling, job-search assistance, and tem-porary hiring subsidies. Finally, they can also implement more targeted policies toward the working poor by implementing in-work ben-efit schemes such as the U.S. Earned Income Tax Credit.
Effective social protection systems are important for inclusive labor markets, but governments also need to promote access to productive and rewarding work. The chal-lenge is how to design policies at the lowest costs to efficiency. Means-testing family ben-efits with strong links to work and intensify-ing the use of active labor market programs are two ways of achieving this objective (IMF 2014). It is fundamental that social protection systems operate in tandem with employment policies by focusing on, for example, social benefits that are employment-related or pen-sion reforms that raise effective retirement ages and are accompanied by measures to pro-mote the employment of older workers. There is also sufficient scope to introduce child care or educational reforms, such as with the move toward provision of early childhood educa-tion in Australia and the United Kingdom and the provision of subsidies to child care in Korea. In Denmark reforms have focused on redirecting spending on social assistance to youth education programs, with the 2013 reform of Danish social assistance aiming to help youth with low educational attainment escape from the trap of remaining inactive.
Redistribution through tax and benefit systemsFiscal policies have a profound effect on the distribution of income and non-income out-comes through the tax and benefit system. Transfers and public spending can increase opportunities for upward social mobility, pro-vide social safety nets, and build more inclu-sive social infrastructure; financing social protection systems can help individuals and households to manage a range of issues from disability to unemployment. In high- and upper-middle-income economies, tax ben-efit systems have been the main instrument for mitigating inequality of market income. At the end of the 2000s, income inequal-ity among the working-age population was,
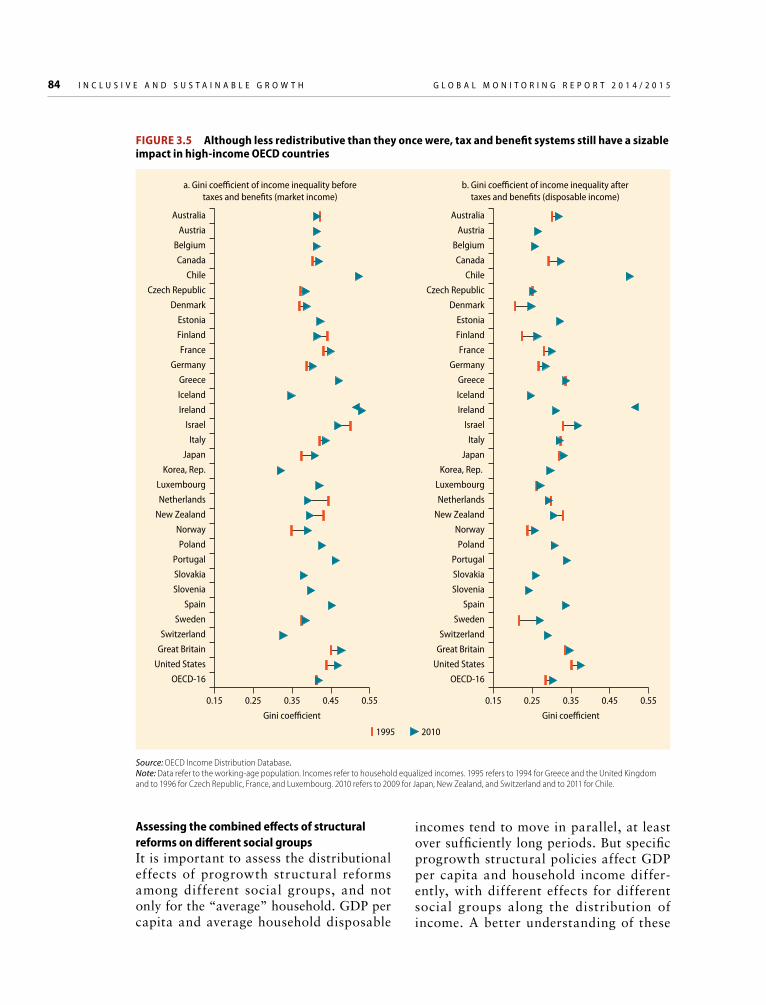
on average, 25 percent lower after taxes and transfers had been applied than it was at the beginning of the decade (Joumard, Pisu, and Bloch 2012). About two-thirds of the redistri-bution resulted from cash transfers to targeted households in the form of child allowances, public pensions, and the like, and one-third the result of progressive tax schedules. How-ever, despite the predominance of tax and benefit systems as instruments for tackling market income inequalities, it is important that policy makers acknowledge that these systems have become less effective at fulfilling this task than in the past (figure 3.5).
Several countries are reforming their tax and transfer systems to improve their redis-tributive impact. Governments in many high-income OECD countries have sufficient scope to raise marginal tax rates on high incomes, eliminate or scale back tax deduc-tions that tend to benefit high earners dis-proportionally, increase tax rates on income from capital and immovable property, and impose higher rates of taxes and duties on intergenerational transfers of wealth. Addi-tional revenue mobilization may also be pos-sible through a more efficient international tax framework that closes gaps in compli-ance (IMF 2013). Taking action on tax eva-sion and avoidance can also help ensure that governments raise sufficient funds to target toward social ends. Some countries have broadened the tax base (Australia, Austria, Denmark, the Netherlands) or reduced tax credits (United Kingdom), while others are seeking to reduce the personal income tax base through tax credits. Encouraging inter-generational social mobility and equality of opportunity also means taxing capital gains on bequeathed assets at standard rates, and replacing estate taxes with inheritance taxes. Protecting the redistributive role of the tax-benefits system is becoming more challenging over the medium term in the high-debt, high-income economies and calls for better targeted fiscal policies. There is a lot of scope for improving the provision of cost-effective social protection in a fis-cally sustainable manner in many countries (box 3.4).
84 I N C L U S I V E A N D S U S T A I N A B L E G R O W T H G L O B A L M O N I T O R I N G R E P O R T 2 0 1 4 / 2 0 1 5
0.15 0.25 0.35 0.45 0.55
Australia
Austria
Belgium
Canada
Chile
Czech Republic
Denmark
Estonia
Finland
France
Germany
Greece
Iceland
Ireland
Israel
Italy
Japan
Korea, Rep.
Luxembourg
Netherlands
New Zealand
Norway
Poland
Portugal
Slovakia
Slovenia
Spain
Sweden
Switzerland
Great Britain
United States
OECD-16
1995 2010
Gini coe�cient
0.15 0.25 0.35 0.45 0.55
Australia
Austria
Belgium
Canada
Chile
Czech Republic
Denmark
Estonia
Finland
France
Germany
Greece
Iceland
Ireland
Israel
Italy
Japan
Korea, Rep.
Luxembourg
Netherlands
New Zealand
Norway
Poland
Portugal
Slovakia
Slovenia
Spain
Sweden
Switzerland
Great Britain
United States
OECD-16
Gini coe�cient
a. Gini coe�cient of income inequality beforetaxes and bene�ts (market income)
b. Gini coe�cient of income inequality aftertaxes and bene�ts (disposable income)
FIGURE 3.5 Although less redistributive than they once were, tax and benefit systems still have a sizable impact in high-income OECD countries
Source: OECD Income Distribution Database.Note: Data refer to the working-age population. Incomes refer to household equalized incomes. 1995 refers to 1994 for Greece and the United Kingdom and to 1996 for Czech Republic, France, and Luxembourg. 2010 refers to 2009 for Japan, New Zealand, and Switzerland and to 2011 for Chile.
Assessing the combined effects of structural reforms on different social groupsIt is important to assess the distributional effects of progrowth structural reforms among different social groups, and not only for the “average” household. GDP per capita and average household disposable
incomes tend to move in parallel, at least over sufficiently long periods. But specific progrowth structural policies affect GDP per capita and household income differ-ently, with different effects for different social groups along the distribution of income. A better understanding of these
G L O B A L M O N I T O R I N G R E P O R T 2 0 1 4 / 2 0 1 5 I N C L U S I V E A N D S U S T A I N A B L E G R O W T H 85
different effects, as well as of the “win-ners” and “losers,” helps policy makers maximize synergies and design compensa-tory measures when tradeoffs are present.
Empirical analysis for high-income OECD countries shows that specific progrowth reforms indeed affect social groups differ-ently.5 Attention is focused on the effects of a set of stylized structural reforms on house-holds with incomes at the mean, median, and lowest decile of the income distribution. The key findings follow:
• Reforms to reduce barriers to competition in product markets, ease job protection, and lower the tax burden on labor income can lift the incomes of the lower-middle class by more than they do GDP per capita and average incomes.
• However, shifting the tax burden from income to property and consumption, and boosting ICT investment can lift GDP per capita more than it does the incomes of the lower-middle class.
• A tightening of unemployment benefits for the long-term unemployed, if implemented without strengthening job-search support and other activation programs, may lead to a decline in the income of the lower-middle class, even if it boosts average income.
• Reforms to promote exports and inward FDI can lift the income of the lower- middle class and the poor by more than they do GDP per capita, while outward FDI can reduce the income of households at the lower end of the distribution.
The sustainability of growthThe case for green growth
Current growth models are environmentally unsustainable, a fact that may ultimately act to undermine economic performance. Cli-mate change will have serious consequences for the long-term global economic outlook; left unabated, climate change could dampen world GDP in 2060 by 0.7 percent to
BOX 3.4 Improving targeting and efficiency of social programs to preserve tax and benefit systems
Better targeting of fiscal policies can ensure that social protection continues to be an effective driver of equity, while remaining on a financially sustain-able footing. A number of countries have engaged in reforms that simplify a myriad of social benefit pro-grams in order to focus on key target groups, lower administrative costs, and increase take-up. The United Kingdom, for instance, is currently imple-menting a reform aiming to bring together six dif-ferent means-tested transfer programs into a single Universal Credit, aiming to make the transfer system more efficient and user-friendly.
Several high-income OECD countries are also engaged in important reforms of disability benefits that will increase cost effectiveness and better target resources to those most in need. Australia, the Neth-erlands, Switzerland, the United Kingdom, and the Nordic countries have all recently introduced reforms
to give passive disability benefits a more active focus with a stronger reemployment perspective. Thus far, structural reforms of disability benefits have focused on introducing stronger gate-keeping mechanisms, time-limiting benefits, and reassessing the eligibility of existing recipients. These measures have, on the whole, managed to avert the risk of the long-term unemployed drifting onto disability benefits. Conse-quently, reforming countries have largely been able to put disability benefit claims on a declining trend. By contrast, countries that have failed to reform dis-ability benefits now face mounting beneficiary rates—more than 10 percent in Estonia and the United States—which may eventually threaten the afford-ability of the entire system.
Source: OECD 2010; OECD 2014b; OECD, Social Benefit Recipients Database, forthcoming.
86 I N C L U S I V E A N D S U S T A I N A B L E G R O W T H G L O B A L M O N I T O R I N G R E P O R T 2 0 1 4 / 2 0 1 5
2.5 percent (OECD 2014c, 2014d). Increas-ing evidence also suggests that environmen-tal degradation and overuse of resources will have damaging effects on economic and social sustainability. The OECD’s work on green growth has been helping governments to identify and implement policies that maxi-mize synergies between growth and environ-mental objectives (box 3.5).
Distributional impact of environmental and green growth policies
Policies to tackle environmental challenges can have beneficial effects on equity, employ-ment, and income, but they can also exac-erbate social challenges. The distributional impacts of environmental policies occur at
different scales, including between coun-tries, regions, sectors, and groups in soci-ety (OECD 2012). Governments need to carefully assess the impacts of new policy actions and put in place measures to amelio-rate negative effects and enhance the posi-tive ones. Therefore a good understanding of what influences people’s behavior is needed when developing a policy mix that promotes greener lifestyles while taking social consid-erations into account (box 3.6).
Introducing or increasing environmentally related taxes and charges, or removing sub-sidies, can ensure that prices reflect the full environmental and social costs of resource usage but can also have a regressive impact. In addition, some high-income countries, for example in Europe, impose high energy
BOX 3.5 Green growth in high-income OECD countries
The framework of the OECD Green Growth Strat-egy provides a lens for looking at growth and identi-fying mutually reinforcing aspects of economic and environmental policy. It recognizes the full value of natural capital as a factor of production along with other commodities and services. It focuses on cost-effective ways of attenuating environmental pressures to achieve a transition toward new patterns of growth that will avoid crossing critical local, regional, and global environmental thresholds. Two broad sets of policies are essential elements in any green growth strategy:
• The first set consists of broad framework policies that mutually reinforce economic growth and the conservation of natural capital. These include core fiscal and regulatory settings, such as tax and com-petition policy, that, if well designed and executed, maximize the efficient allocation of resources. This is the familiar agenda of economic policy with the added realization that it can be as good for the environment as for the economy. Innovation poli-cies should be added to this set as well.
• The second set includes policies that provide incentives to use natural resources efficiently and that make activities that cause pollution
more expensive. These policies include a mix of price-based instruments, such as environmentally related taxes and removal of environmentally harmful subsidies, and nonmarket instruments such as regulations, technology support policies, and voluntary approaches.
Demand has been increasing for policy guidance focused on translating green growth into practice, and for drawing lessons learned as implementation efforts progress. Government efforts to transition to greener growth have intensified in both OECD and partner countries. The European Union’s Resource Efficiency Strategy, for example, is seen as a key tool for changing the use of resources to improve the resilience of our environment, societies, and econo-mies, and to stay within the ecological boundaries of the planet. The Republic of Korea is using the green growth approach to modernize its industrial sector, the United States’ green growth policies emphasize the strategic advantages of technology leadership, and China’s 12th Five-Year Plan focuses on green develop-ment. Similar efforts are also happening at the city level, with Amsterdam and Copenhagen using green growth policies as a lever to increase their attractive-ness to citizens and businesses.
G L O B A L M O N I T O R I N G R E P O R T 2 0 1 4 / 2 0 1 5 I N C L U S I V E A N D S U S T A I N A B L E G R O W T H 87
taxes measured as a percentage of GDP, but those are often not that well-targeted from an environmental perspective because taxes on residential electricity consumption and vehi-cle ownership have limited effects on emis-sions. An environmentally friendly policy, such as instigating full-cost recovery water pricing, may be efficient at an economywide level, but it can also engender negative dis-tributional consequences, in this instance rendering water bills for poorer families unaffordable. Environmentally harmful sub-sidies also act as a barrier to green growth and hinder social equity. Energy subsi-dies total $55 billion–$90 billion a year in OECD countries (OECD 2013f), and while these subsidies have often been designed to alleviate poverty, they overwhelmingly ben-efit wealthier households that consume more energy.
Agricultural supports can also have a neg-ative impact upon the pursuit of greener and more inclusive growth. Government policies to support agricultural output often encour-age production and lead to less efficient use of water, not to mention exacerbating
off-farm pollution. Water charges for farmers rarely reflect real scarcity or environmental costs. For example, in Greece and Italy, irri-gation water is subsidized in that farmers do not pay the full cost of the service. Also, price supports often benefit richer farmers at the expense of poorer agricultural workers. The potentially negative environmental and dis-tributive effects of agricultural support based on prices and output levels have been recog-nized in recent years, and there has been a concerted effort across the OECD to reduce them. Between 1995 and 2011, support based on prices and output levels fell from a 74 per-cent share of agricultural subsidies to 50 per-cent (OECD 2013b). However, those support mechanisms with the greatest environmental potential still only account for a small share of the total support to agricultural producers, standing at around 8 percent in 2011.
Government failure to calibrate for the distributional effects of environmental poli-cies can lead to public opposition to environ-mentally necessary and economically sensible measures. It is therefore essential to ensure that policies geared toward creating greener,
BOX 3.6 The right policy responses need to take people’s preferences into account
Not all households have identical preferences, and assuming that they do can lead to misguided policy conclusions. A recent OECD survey of 12,000 house-holds in 11 countries sheds light on how people value environmental, social, and economic concerns. The right financial incentives can influence environment-friendly choices. However, what households and gov-ernments identify as the “best” policies do not always coincide. OECD evidence indicates that some of the most cost-effective environmental policies from a public policy perspective (such as unit-based charges for waste generation and higher fuel taxes) garner less public support relative to other policies.
OECD analysis suggests that the justification and motivation for policies may not be properly commu-nicated to the public, which can lead to misunder-standing about the aims and rationale of the policy.
Another reason is that, although a proposed policy may be efficient economywide (such as full-cost recovery water pricing), unaddressed distributional issues (such as affordability of water bills for poor large families) or a perception that these are insuf-ficiently addressed can lead to public opposition. Stimulating desirable behavioral changes ultimately requires a mix of instruments coherently imple-mented across policy areas. In areas such as energy and water, the provision of services and infrastruc-ture can be an important complement. And for spe-cific groups of households that cannot afford to take up greener practices, a mix of policies including tar-geted transfers and safety net instruments could be envisaged.
Source: OECD 2013c, 2013j, 2011c.
88 I N C L U S I V E A N D S U S T A I N A B L E G R O W T H G L O B A L M O N I T O R I N G R E P O R T 2 0 1 4 / 2 0 1 5
more sustainable economic growth are them-selves politically sustainable, in the sense that their effects on equity are acceptable to a broad coalition of the population. For this reason, it is important that governments recognize that the distributional impacts of environmental policies occur at different lev-els: between countries, regions, sectors, and groups in different societies. A full assess-ment of the income distributional effects of environmental policies will have to include indirect effects, such as price increases on taxed products, employment effects of using environmental tax revenues, and the resul-tant environmental benefits.
Governments must carefully assess the impacts of policy actions, putting in place measures to compensate for negative effects and to reinforce positive actions. These mea-sures can be achieved through recycling the revenue streams raised by environmental lev-ies, or saved by the removal of harmful sub-sidies, toward ends that target social equity. Using resources from reduced energy subsi-dies to better target support directly to low-income households can benefit the poor and do so at a much lower cost to the government budget than costly and harmful subsidies.
Progress is also being made in the agri-culture sector to improve the cost-effective-ness of policy support. In OECD countries, the support to agriculture is increasingly aimed at raising farm income with less production-distorting and potentially less environmentally damaging effects (OECD 2013b). Although OECD countries have made a concerted effort to reduce agricul-tural support based on prices and output levels (from 74 percent to 50 percent over 1995–97 to 2009–11), the potentially most environmentally beneficial support accounts for a small share of the total support to agri-cultural producers (8 percent in 2009–11) (OECD 2013b). More efforts are needed to strengthen cross-compliance support mea-sures requiring farmers to meet specific environmental conditions as an alternative to price support measures, which provide income transfers to farmers without any environmental conditions. In relation to the
reform of agricultural subsidies, this entails moving further away from price- or output-based support mechanisms, making greater efforts to strengthen cross-compliance mea-sures that require farmers to meet specific environmental targets.
Coherence between energy, agriculture, and water policies is essential if governments are to meet a diverse range of societal goals while not damaging the water resource base. It is crucial to avoid unnecessary resource competition between households, farmers, industry, and energy suppliers. Such resource competition can have a negative impact on equity, leading to depleted supplies, higher prices, increased flood risks from changes in land use patterns, and exacerbated water pollution. It is also important to boost effi-ciency and avoid wastage due to aging, leaky infrastructure. Inadequate urban drainage is a major problem in many OECD countries, leading to high volumes of polluted run-off that flood streets and the surrounding envi-ronment. Questions also remain in a number of OECD countries about the affordability of water prices and charges for low-income households. For example, the Flanders region of Belgium has designed a water tariff system that addresses affordability by allocating 15 cubic meters of “free” water a year for each inhabitant.
Maximizing access to safe water for social equity requires innovative approaches to financing. Despite the reforms away from subsidized water to pricing based on supply costs and the subsequent improvements in economic efficiency, water tariffs in many cases in the OECD remain both inefficient and inequitable. A greater emphasis on equity and efficiency is required to cover the mainte-nance and expansion costs for infrastructure and water treatment. Scarcity pricing in com-bination with “social tariffs” that take into account household income and size are viable policy options to manage water security and increase efficiency, while addressing equity concerns. Governments can also endeavor to explore innovative water governance models that promote equity by more effec-tively engaging water users and stakeholders,
G L O B A L M O N I T O R I N G R E P O R T 2 0 1 4 / 2 0 1 5 I N C L U S I V E A N D S U S T A I N A B L E G R O W T H 89
boosting environmental quality by ensuring smart regulation of water services, and facili-tating cooperation between cities and sur-rounding rural areas.
Green growth policies are primarily designed to substitute away from polluting or resource-intensive production and consump-tion. New opportunities for workers may arise from green growth policies, but new risks that could undermine political support for green growth policies could also appear. Accordingly, labor market and skills policy should also seek to maximize the benefits of green growth for workers while assuring that unavoidable adjustment costs are shared fairly. To this end, green growth policies can usefully complement the role of macro-economic and structural reform policies in achieving employment goals and efficient resource allocation.
Labor market and skills policy should seek to maximize the benefits of green growth for workers. The development of labor force skills that enable the adoption of resource-efficient, sustainable processes and technologies by businesses is a central pillar of the transi-tion to low-carbon economies. Measures to expand the base of workers with green skills can also ensure that individuals from all seg-ments of society are able to capitalize on all the social, environmental, and economic ben-efits that this brings. Policy makers will need to ensure that policies across a broad range of sectors share common direction and coor-dination, so that effective skills development and training strategies can be implemented. The development of green skills needs to be integrated into wider training and skills development policy, with agreement among institutions to a focus on transversal skills in resource efficiency rather than on the skills required by specific green occupations. This focus would require the broader involvement of all the relevant actors including employers, workers, unions, industry associations, edu-cational institutions, and governments at all levels.
Governments can accelerate the participa-tion of market actors in the provision of skills by providing clear and transparent signals
about the direction of policy, which will inform private investment decisions, creat-ing more resilient sectors that can withstand the eventual withdrawal of public support. Developing green skills is part of a broader challenge to increase the strategic manage-ment capabilities of small and medium enter-prises, which have limited awareness of their needs and options in terms of green skill development. In a similar vein, businesses’ research and development activities need to broaden out to encompass a broader range of skills and benefit a wider range of the popu-lation; to date, they have largely focused on the skills-related needs of a small number of high-technology occupations and a few niche industries. Investment in research and development needs to scale up as the transi-tion to low-carbon economies unfolds new challenges for inclusive economic growth and sustainable employment.
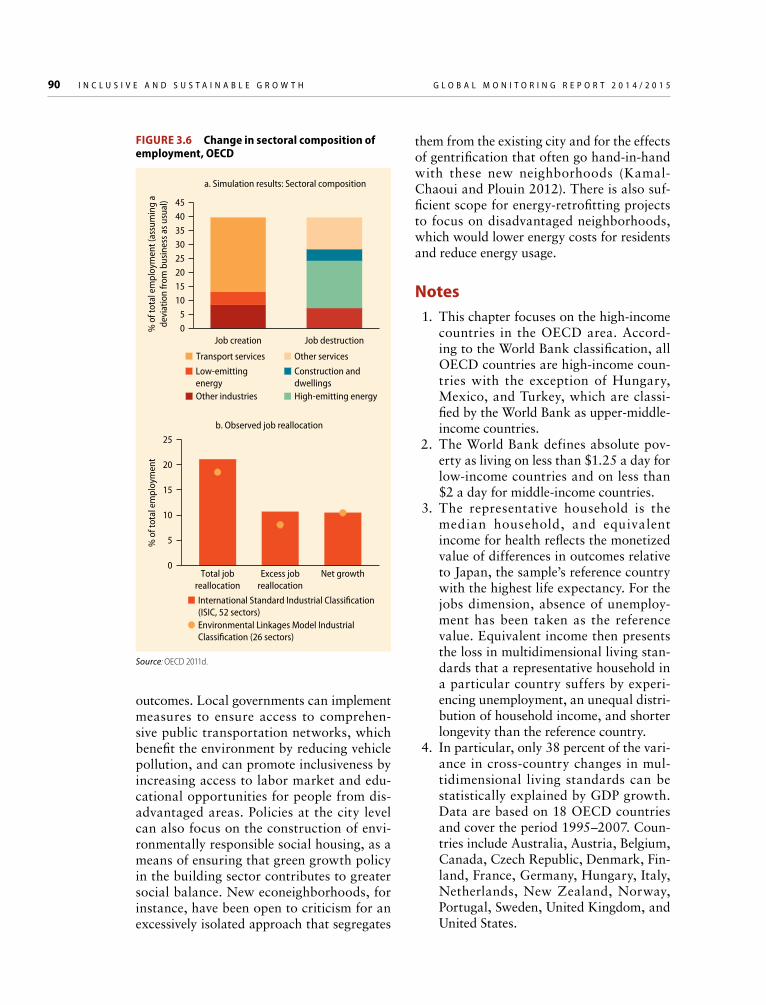
The overall net impact on employment of this transition is likely to be low, but mea-sures should be put in place to ensure that unavoidable adjustment costs are shared fairly. The quality of labor market institu-tions and the redistribution of revenues from carbon taxes or auctioned tradable emission permits will be key factors in determining the overall effect on employment (figure 3.6). Revenue recycling instruments can mitigate distorting taxes on labor income through a double dividend effect. Under such circum-stances, it is conceivable that shifting the tax burden from workers to pollution could affect employment, while improving the envi-ronment. More generally, mitigation policy is likely to have a limited impact on real GDP in OECD countries (by less than 0.5 percent) and modest deviations in employment levels (0.2 percent–1.6 percent) from baseline levels in 2030, depending on assumed labor market rigidities (OECD 2013b).
Green growth policies can boost equity at the urban level. They have great poten-tial to bolster employment and innovation in metropolitan areas. Taking an integrated approach to land-use, transport, and eco-nomic development planning at the local level can lead to greener and more equitable
90 I N C L U S I V E A N D S U S T A I N A B L E G R O W T H G L O B A L M O N I T O R I N G R E P O R T 2 0 1 4 / 2 0 1 5
outcomes. Local governments can implement measures to ensure access to comprehen-sive public transportation networks, which benefit the environment by reducing vehicle pollution, and can promote inclusiveness by increasing access to labor market and edu-cational opportunities for people from dis-advantaged areas. Policies at the city level can also focus on the construction of envi-ronmentally responsible social housing, as a means of ensuring that green growth policy in the building sector contributes to greater social balance. New econeighborhoods, for instance, have been open to criticism for an excessively isolated approach that segregates
them from the existing city and for the effects of gentrification that often go hand-in-hand with these new neighborhoods (Kamal- Chaoui and Plouin 2012). There is also suf-ficient scope for energy-retrofitting projects to focus on disadvantaged neighborhoods, which would lower energy costs for residents and reduce energy usage.
Notes 1. This chapter focuses on the high-income
countries in the OECD area. Accord-ing to the World Bank classification, all OECD countries are high-income coun-tries with the exception of Hungary, Mexico, and Turkey, which are classi-fied by the World Bank as upper-middle-income countries.
2. The World Bank defines absolute pov-erty as living on less than $1.25 a day for low-income countries and on less than $2 a day for middle-income countries.
3. The representative household is the median household, and equivalent income for health reflects the monetized value of differences in outcomes relative to Japan, the sample’s reference country with the highest life expectancy. For the jobs dimension, absence of unemploy-ment has been taken as the reference value. Equivalent income then presents the loss in multidimensional living stan-dards that a representative household in a particular country suffers by experi-encing unemployment, an unequal distri-bution of household income, and shorter longevity than the reference country.
4. In particular, only 38 percent of the vari-ance in cross-country changes in mul-tidimensional living standards can be statistically explained by GDP growth. Data are based on 18 OECD countries and cover the period 1995–2007. Coun-tries include Australia, Austria, Belgium, Canada, Czech Republic, Denmark, Fin-land, France, Germany, Hungary, Italy, Netherlands, New Zealand, Norway, Portugal, Sweden, United Kingdom, and United States.
a. Simulation results: Sectoral composition
b. Observed job reallocation
4540353025201510
50
Job creation Job destruction
% o
f tot
al e
mpl
oym
ent (
assu
min
g a
devi
atio
n fro
m b
usin
ess a
s usu
al)
Transport services Other servicesConstruction anddwellings
Low-emitting energy
High-emitting energyOther industries
25
20
15
10
5
0Total job
reallocationExcess job
reallocationNet growth
International Standard Industrial Classi�cation(ISIC, 52 sectors)Environmental Linkages Model Industrial Classi�cation (26 sectors)
% o
f tot
al e
mpl
oym
ent
FIGURE 3.6 Change in sectoral composition of employment, OECD
Source: OECD 2011d.
G L O B A L M O N I T O R I N G R E P O R T 2 0 1 4 / 2 0 1 5 I N C L U S I V E A N D S U S T A I N A B L E G R O W T H 91
5. This analysis shows that different policy actions that are known to have a posi-tive effect on GDP per capita growth and average incomes over the longer term may nevertheless have a different, less favorable, effect on specific social groups; see Boarini and others 2014.
ReferencesBerg, A., and J. D. Ostry. 2011. Inequality and
Unsustainable Growth: Two Sides of the Same Coin? Washington, DC: International Mon-etary Fund.
Boarini, Romina, Luiz de Mello, Alain de Serres, Fabrice Murtin, and Paul Schreyer. 2014. “Report on the OECD Framework for Inclu-sive Growth.” Technical document prepared for the 2014 MCM. OECD, Paris.
Braconier, H., and J. Ruiz Valenzuela. 2014. “Gross Earning Inequalities in OECD Coun-tries and Major Non-member Economies: Determinants and Future Scenarios.” OECD Economics Department Working Paper 1139, OECD Publishing, Paris.
Causa, O., N. Ruiz, and A. de Serres. Forthcom-ing. “Can Growth-enhancing Policies Lift All Boats? A Preliminary Analysis Based on Household Disposable Incomes.” OECD Eco-nomics Department Working Papers, OECD Publishing, Paris.
CEDEFOP. 2009. “Professionalising Career Guid-ance: Practitioner Competences and Qualifi-cation Routes in Europe.” Office for Official Publications of the European Communities, Luxembourg.
Cheung, Ji Eun. 2012. “How Can Education Help Tackle Rising Income Inequality? Educa-tion Today.” OECD, Paris (April).
Cingano, F. Forthcoming. “Inequality, Social Mobility and Growth: Evidence from OECD countries.”
Denk, O., and others. 2013. “Inequality and Pov-erty in the United States: Public Policies for Inclusive Growth.” OECD Economics Depart-ment Working Paper 1052, OECD Publishing, Paris.
Eriksson, T. 2012. “Flexicurity and the Economic Crisis 2008–2009: Evidence from Denmark.” OECD Social, Employment and Migration Working Paper 139, OECD Publishing, Paris.
Flemish Department of Education and Training. 2013. “Vocational Education and Training
in Flanders.” Country Background Report, OECD Review of Post-secondary Vocational Education and Training. Paris.
Fournier, J.-M., and I. Koske. 2012. “Less Income Inequality and More Growth—Are They Compatible? Part 7 of The Drivers of Labour Earnings Inequality—An Analysis Based on Conditional and Unconditional Quantile Regressions.” OECD Economics Depart-ment Working Paper 930, OECD Publishing, Paris.
Gwynn, R. C., and G. D. Thurston. 2001. “The Burden of Air Pollution: Impacts Among Racial Minorities.” Environmental Health Perspectives 109 (Suppl. 4)¸ August.
IMF (International Monetary Fund). 2013. “Fis-cal Monitor.” IMF, Washington, DC (October).
———. 2014. “Fiscal Policy and Income Inequal-ity.” IMF, Washington, DC (January).
Joumard, Isabelle, Mauro Pisu, and Debbie Bloch. 2012. “Tackling Income Inequality: The Role of Taxes and Transfers.” OECD Journal: Eco-nomic Studies 2012 (1): 37–70.
Kamal-Chaoui, L., and M. Plouin. 2012. “Cit-ies and Green Growth: Case Study of Paris/Ile-de-France Region.” OECD Regional Devel-opment Working Paper 2012/02. OECD Pub-lishing, Paris.
Musset, P., and R. Castañeda Valle. 2013. “A Skills beyond School Commentary on Iceland.” OECD Reviews of Vocational Education and Train-ing. www.oecd.org/edu/skills-beyond-school /ASkillsBeyondSchoolCommentaryOnIceland .pdf.
Musset P., and others. 2013. “Skills beyond School Review of Austria.” OECD Reviews of Vocational Education and Training, OECD Publishing, Paris. doi: http://dx.doi .org/10.1787/9789264200418-en.
OECD (Organisation for Economic Co-operation and Development). 2010. “Sickness, Disability and Work: Breaking the Barriers. A Synthesis of Findings across OECD Countries.” OECD Publishing, Paris.
———. 2011a. “Divided We Stand.” OECD Pub-lishing, Paris.
———. 2011b. “Education at a Glance 2011: OECD Indicators.” OECD Publishing, Paris.
———. 2011c. Greening Household Behav-iour: The Role of Public Policy. Paris: OECD Publishing.
———. 2011d. “Employment Impacts of Cli-mate Change Mitigation Policies in OECD: A General-Equilibrium Perspective.” OECD
92 I N C L U S I V E A N D S U S T A I N A B L E G R O W T H G L O B A L M O N I T O R I N G R E P O R T 2 0 1 4 / 2 0 1 5
Environment Working Papers 32. OECD Pub-lishing, Paris.
———. 2012. “OECD Environmental Outlook to 2050: The Consequences of Inaction.” OECD Publishing, Paris.
———. 2013a. “Crisis Squeezes Income and Puts Pressure on Inequality and Poverty.” OECD Publishing, Paris.
———. 2013b. “Green Growth Studies: Policy Instruments to Support Green Growth in Agri-culture.” OECD Publishing, Paris.
———. 2013c. “Greening Household Behaviour: Overview from the 2011 Survey.” OECD Pub-lishing, Paris.
———. 2013d. “Health at a Glance 2013: OECD Indicators.” OECD Publishing, Paris.
———. 2013e. “How Is Life? Measuring Well-Being.” OECD Publishing, Paris.
———. 2013f. “Inventory of Estimated Budget-ary Support and Tax Expenditures for Fossil Fuels.” OECD Publishing.
———. 2013g. “OECD Economic Outlook.” OECD Publishing (June).
———. 2013h. “Water Security for Better Lives.” OECD Studies on Water. OECD Publishing, Paris.
———. 2013i. “OECD Skills Outlook 2013: First Results from the Survey of Adult Skills.” OECD Publishing, Paris.
———. 2013j. “Splitting the Bill: How Income Is Being Distributed during the Crisis.” OECD Publishing, Paris.
———. 2014a. “All on Board: Making Inclusive Growth Happen.” OECD Publishing, Paris.
———. 2014b. “The Crisis and Its Aftermath: A ‘Stress Test’ for Societies and for Social Policies.” In Society at a Glance 2014: OECD Social Indicators. Paris: OECD Publishing.
———. 2014c. “New Approaches to Economic Challenges: Synthesis.” OECD Publishing, Paris.
———. 2014d. “OECD@100: Policies for a Shift-ing World.” OECD Publishing, Paris.
———. 2014e. “Trends in Top Incomes and their Taxation.” OECD Publishing, Paris.
———. 2014f. “United States Tackling High Inequalities: Creating Opportunities for All.” OECD Publishing, Paris.
Ostry, J. D., A Berg, and C. G. Tsangarides. 2014. Redistribution, Inequality, and Growth. Wash-ington, DC: International Monetary Fund.