distribution of heavy metals in the environmental … of heavy metals in the saemangeum coastal...
TRANSCRIPT
71
Coastal Environmental and Ecosystem Issues of the East China Sea,Eds., A. Ishimatsu and H.-J. Lie, pp. 71–90.© by TERRAPUB and Nagasaki University, 2010.
Distribution of Heavy Metals in the Environmental Samples ofthe Saemangeum Coastal Area, Korea
Kyung Tae KIM1, Eun Soo KIM2, Sung Rok CHO2, Jun Kun PARK3,Kong Tae RA1 and Jung Moo LEE1
1Marine Environment and Pollution Prevention Research Department, KORDI,Ansan 426-744, Korea
2Marine Instrument Service and Calibration Department, KORDI,Ansan 426-744, Korea
3E&C Technology Co. LTD.,708-7, Songnae-dong, Sosa-gu, Bucheon, Gyeonggi-do, Korea
Abstract—In order to understand the distribution of elements in the environmentalsamples, surface seawater and sediment samples collected from the Saemangeumregion of western coast of Korea were analyzed for their concentrations of majorand trace elements. Dissolved heavy metal concentrations except for Cd werehighest in inner part of the Saemangeum dike and in the Geum River Estuary.Riverine discharge of dissolved metal in July was much higher than that in May,and high in the Mangyeong River and low in the Dongjin River. Dissolved Cdconcentration was low in the river waters but high in saline waters, indicatingdesorption from SPMs with the increase of salinity (ionic strength increase).Because of land-based sources of pollutants, dissolved metals except Cd showedan inverse correlation with salinity. High metal concentrations and metal/Al ratiosin the marine sediments were observed in the Geum River Estuary and in thesouthwestern part of the study area in August. In the surface sediments, TOC andmean grain size (Mz) are controlling factors of metal composition. However, TOCand Mz did not impose any significant effect on the abundance and distribution ofMn, Pb and As.
Keywords: Saemangeum region, environmental change, surface seawater, surfacesediment, geochemical components, heavy metals
1. INTRODUCTION
The Yellow Sea is a semi-enclosed sea surrounded by the continent of China and theKorean Peninsula in the mid latitudes of the northwestern Pacific (Kim et al., 2000).The coastline of the Korean Peninsula is characterized by a long stretch of a Ria-typecoast in the southern and western part, thus forming numerous inlets whosephysiographic features significantly differ from each other (Hong et al., 1991).Because of high tide range, the tidal flats are largely developed along the west coastof Korea. Tidal ranges along the west coast reach a maximum of 10 m. High turbidityis developed by high tidal flow in the west coast. In some places the boundary betweenland and sea is in the form of abrupt and often spectacular cliffs but, elsewhere, the
72 K. T. KIM et al.
boundary can take the form of a complex environment of intertidal sediments. Theseenvironments include shingle banks, sandy beaches, mud flats, saltmarsh andmangrove communities. In some cases one or other of these environments will occur,in others they will be associated with one another (Jickells and Rae, 1997). Thewetlands along the western coast of the Korean Peninsula are among the largest in theworld. They include almost a million hectares of tidal flats in South Korea alone, withNorth Korea also having many large tracts of coastal wetlands. However, significantenvironmental issues in the western coast of Korean Peninsula result from reclamation.In Korea, planned reclamation of estuaries, shallow bays, and intertidal mudflatsthreaten enormous areas of highly productive coastal habitats. Korea government hasinitiated unprecedented large-scale reclamation projects in its western coasts since1962 to replace the crop lands lost to human encroachment as well as creating landfor constructing industrial complexes and supporting coastal cities (Ahn et al., 1998).Reclamation project of Asan, Shihwa and Saemangeum are examples of therepresentative land fill in Korea.
There are positive contributions to social and economic development in thereclamation projects of Korea. These massive projects have created land that can beused for constructing residential houses, industrial and agricultural estates, recreationalfacilities, parks, and the expansion of airport and seaport facilities. However, somenegative impacts on the coastal environment were inevitable including the loss ofnatural coastlines and coastal habitats, adverse effects on fisheries and a decrease inthe self-purification capacity of mudflats (Kim and Kahng, 2000). Large-scalereclamation projects have removed mudflats, reducing the natural pollution adsorptioncapabilities while increasing the pollution loads. Dike construction in estuaries hasproduced several artificial lakes in the western coast of Korea; however, most of thefresh and brackish lakes have suffered from severe eutrophication and variouschemicals pollution because of extreme pollutant discharge. In particular, degradationof water quality in an artificial estuarine lake, Lake Shihwa, becomes a hot issue inKorea. The lake Shihwa is suffering from water and sediment contaminations suchas nutrients, COD and heavy metals during the desalination after the dike establishmentof 1994. It was a serious environmental threat (Jung et al., 1997; Kim and Khang,2000). In recent, the importance of tidal flat has been recognized while the tidal flatshave been seriously destroyed due to reclamation and landfills.
Despite social concerns, a huge reclamation project in the Saemangeum area ofthe mid west coast of Korea is proceeding. This project has a total area of 401 km2
(land—283 km2, lake—118 km2). The Saemangeum dyke of 33 km was completelyclosed on 21 April 2006. In Korea, this region was one of the most important coastalareas for shellfish aquaculture and fisheries. This area receives a huge amount of freshwater, suspended matter and pollutants from Mangyeong and Dongjin Rivers.
Heavy metals (HMs) are often used without any strict definition. Naturalmetallic elements (NMEs) are characterized by a high specific gravity exceeding 5,and they are generally known as heavy metals. HMs are present in all environmentalcompartments, but generally in very small quantities (ppt–ppm): trace metal elements,trace elements, trace metals. Sediments consist as a function of either repository orsource. They may have been eroded at the bottom of the sea in a form of sediment or
Distribution of Heavy Metals in the Saemangeum Coastal Area, Korea 73
act as a source where NMEs radiate from the sediments. The amount of heavy metalsin the water can be altered by bioaccumulation and biomagnifications; whereorganism uptakes and the metal contents magnify throughout foodweb. HMs arecomposed of essential elements such as Fe, Co, Cu and Zn and toxic elements knownas Pb, Cd and Hg. And of course the large amount of essential elements can be definedas toxic elements from the biological perspective view. It can not be decomposed ordestroyed in environment, meaning they are one of conservative pollutants. The inputof metal contaminants into the aquatic system has various sources; and metal sourcesare divided into two major groups. Firstly, natural sources, which include erosion ofore-bearing rocks, wind-blown dust, volcanic activity and forest fires. Naturalsources are based on inherently accommodated metals. Anthropogenic sources areproduced from industrialization and urbanization processes; such as fossil fuelburning, waste incineration, industrial complex area, paint, mining etc (Wittmann etal., 1981). In the present, trace metal data of environmental samples such as water,sediment and biota are reliable for further study, however, in the past, trace metal datawere unreliable due to lack of instruments and clean techniques for procedure andmetal analysis (Windom, 1991; Coquery et al., 2000).
Cho et al. (2001) and Kim et al. (2004) reported the geochemical compositionand the processes governing the distribution of elements in surface sediments fromthe Saemangeum tidal flat. Dissolved heavy metal concentrations in the MangyeongRiver estuary where is one of the Saemangeum system were reported. However, someof the dissolved heavy metal data are unreliable (over estimation).
The objectives of this study are to obtain accurate metals in the Saemangeumarea and to understand the distribution character of heavy metals in the surfaceseawater and sediments.
2. MATERIALS AND METHODS
Sampling
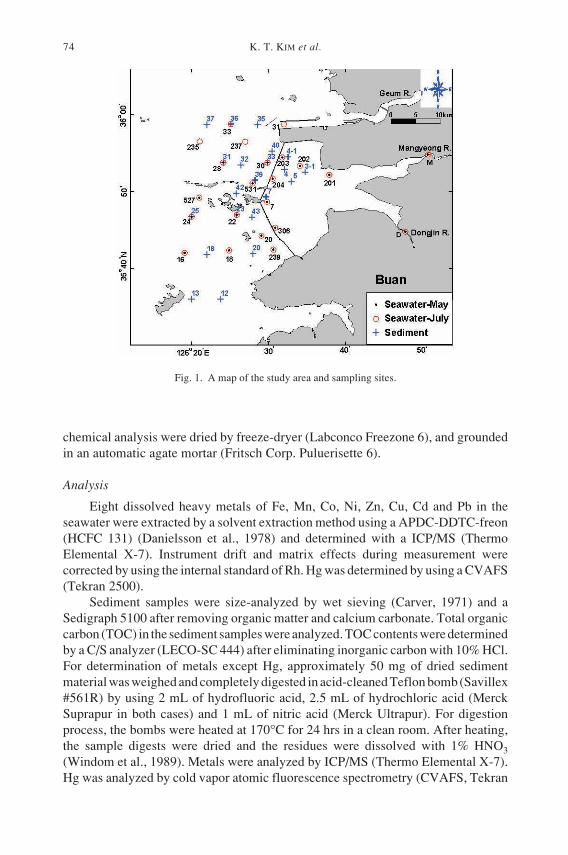
To obtain high accuracy of the experiment, each procedure has been undergonethoroughly. In May 2006, seawater samples were collected from 18 different sitesincluding Mangyeong and Dongjin Rriver Estuaries and surface sediments werecollected from 16 different sites. In July 2006, seawater samples were collected from22 sites. In August 2006, sediment samples were collected from 19 sites (Fig. 1). Tominimize the contamination due to metal emission from the small boat to the sea, theboat traveled at low speed and minimized the wave movements, and a long pole;holding the sampling bottle is used to collect seawater samples from the moving craft(Boyle et al., 1981). Those samples were filtered through a vacuum filtration systemand 0.4 µm PC membrane filters (Whatman Co.), pre-cleaned and pre-weighed, in aClass-100 laminar flow clean bench. To analyze Hg, samples were placed in the acidrinsed 300 mL glass bottle and BrCl solution was added and stored.
The surface sediment samples were collected by a van Veen Grab sampler andtop 1 cm layer was taken by a PE spoon, and put into the acid-washed PE jars. Thecollected samples were immediately frozen with dry ice. Subsamples for grain sizeanalysis were stored in room temperature. In laboratory, these sediment samples for
74 K. T. KIM et al.
chemical analysis were dried by freeze-dryer (Labconco Freezone 6), and groundedin an automatic agate mortar (Fritsch Corp. Puluerisette 6).
Analysis
Eight dissolved heavy metals of Fe, Mn, Co, Ni, Zn, Cu, Cd and Pb in theseawater were extracted by a solvent extraction method using a APDC-DDTC-freon(HCFC 131) (Danielsson et al., 1978) and determined with a ICP/MS (ThermoElemental X-7). Instrument drift and matrix effects during measurement werecorrected by using the internal standard of Rh. Hg was determined by using a CVAFS(Tekran 2500).
Sediment samples were size-analyzed by wet sieving (Carver, 1971) and aSedigraph 5100 after removing organic matter and calcium carbonate. Total organiccarbon (TOC) in the sediment samples were analyzed. TOC contents were determinedby a C/S analyzer (LECO-SC 444) after eliminating inorganic carbon with 10% HCl.For determination of metals except Hg, approximately 50 mg of dried sedimentmaterial was weighed and completely digested in acid-cleaned Teflon bomb (Savillex#561R) by using 2 mL of hydrofluoric acid, 2.5 mL of hydrochloric acid (MerckSuprapur in both cases) and 1 mL of nitric acid (Merck Ultrapur). For digestionprocess, the bombs were heated at 170°C for 24 hrs in a clean room. After heating,the sample digests were dried and the residues were dissolved with 1% HNO3(Windom et al., 1989). Metals were analyzed by ICP/MS (Thermo Elemental X-7).Hg was analyzed by cold vapor atomic fluorescence spectrometry (CVAFS, Tekran
Fig. 1. A map of the study area and sampling sites.
Distribution of Heavy Metals in the Saemangeum Coastal Area, Korea 75
2500) after digestion with 5 mL of 1:1 HNO3and HCl on a hot plate for 2 hrs using a Teflonvessel (Savillex #561R) (Smith, 1993).
Accuracy of the analytical procedures wasassessed by CRM such as CASS-3 for dissolvedmetals in seawater and the collection percentagewas ranged between 89.6% (Mn) and 100%(Co). Reproducibility and accuracy of metalanalysis data for sediment were checked byusing marine sediment SRM (MESS-2 of NRC,Canada) as a reference. Recoveries of all themetals are ranged from 95.4% for Fe to 108%for Cd. The results indicate good agreementbetween the certified and the analytical values.
3. RESULTS AND DISCUSSION
Dissolved metals in surface water
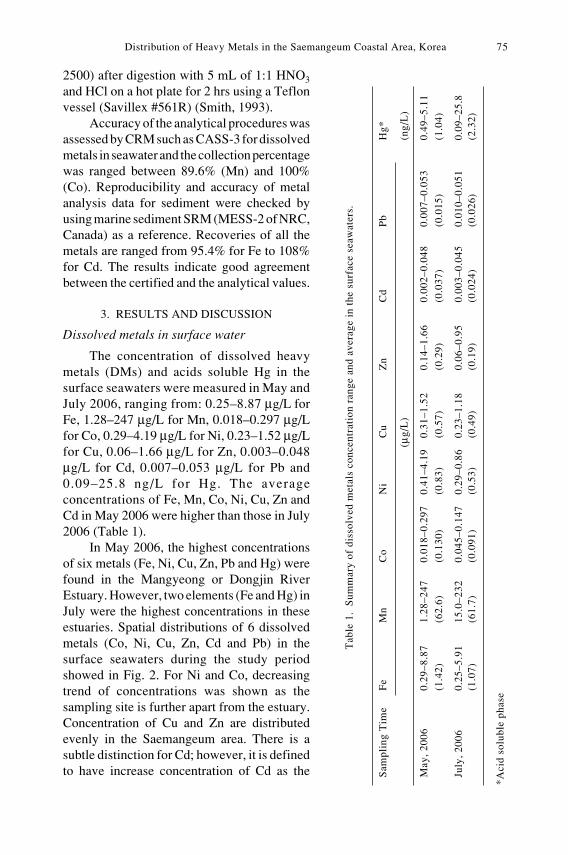
The concentration of dissolved heavymetals (DMs) and acids soluble Hg in thesurface seawaters were measured in May andJuly 2006, ranging from: 0.25–8.87 µg/L forFe, 1.28–247 µg/L for Mn, 0.018–0.297 µg/Lfor Co, 0.29–4.19 µg/L for Ni, 0.23–1.52 µg/Lfor Cu, 0.06–1.66 µg/L for Zn, 0.003–0.048µg/L for Cd, 0.007–0.053 µg/L for Pb and0.09–25.8 ng/L for Hg. The averageconcentrations of Fe, Mn, Co, Ni, Cu, Zn andCd in May 2006 were higher than those in July2006 (Table 1).
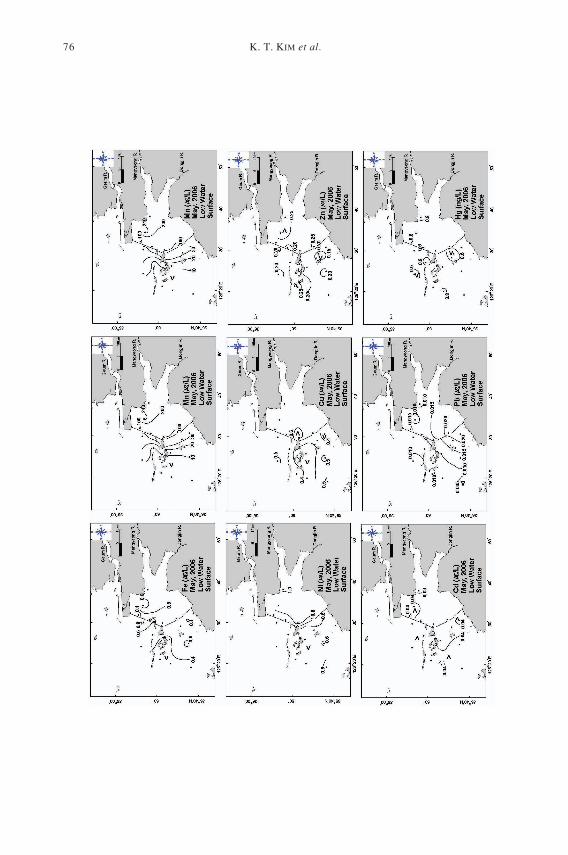
In May 2006, the highest concentrationsof six metals (Fe, Ni, Cu, Zn, Pb and Hg) werefound in the Mangyeong or Dongjin RiverEstuary. However, two elements (Fe and Hg) inJuly were the highest concentrations in theseestuaries. Spatial distributions of 6 dissolvedmetals (Co, Ni, Cu, Zn, Cd and Pb) in thesurface seawaters during the study periodshowed in Fig. 2. For Ni and Co, decreasingtrend of concentrations was shown as thesampling site is further apart from the estuary.Concentration of Cu and Zn are distributedevenly in the Saemangeum area. There is asubtle distinction for Cd; however, it is definedto have increase concentration of Cd as the
*Aci
d so
lubl
e ph
ase
Sam
plin
g T
ime
Fe
Mn
Co
Ni
Cu
Zn
Cd
Pb
Hg*
(µg/
L)
(ng/
L)
May
, 20
060.
29–8
.87
1.28
–247
0.01
8–0.
297
0.41
–4.1
90.
31–1
.52
0.14
–1.6
60.
002–
0.04
80.
007–
0.05
30.
49–5
.11
(1.4
2)(6
2.6)
(0.1
30)
(0.8
3)(0
.57)
(0.2
9)(0
.037
)(0
.015
)(1
.04)
July
, 20
060.
25–5
.91
15.0
–232
0.04
5–0.
147
0.29
–0.8
60.
23–1
.18
0.06
–0.9
50.
003–
0.04
50.
010–
0.05
10.
09–2
5.8
(1.0
7)(6
1.7)
(0.0
91)
(0.5
3)(0
.49)
(0.1
9)(0
.024
)(0
.026
)(2
.32)
Tab
le 1
. S
umm
a ry
of d
isso
lve d
me t
a ls
c onc
e ntr
a tio
n ra
nge
a nd
a ve r
a ge
in t
he s
urfa
c e s
e aw
a te r
s.
76 K. T. KIM et al.
Distribution of Heavy Metals in the Saemangeum Coastal Area, Korea 77
Fig
. 2.
Dis
trib
utio
n of
dis
solv
ed m
etal
s in
the
surf
ace
seaw
ater
s of
the
stud
y ar
ea.
78 K. T. KIM et al.
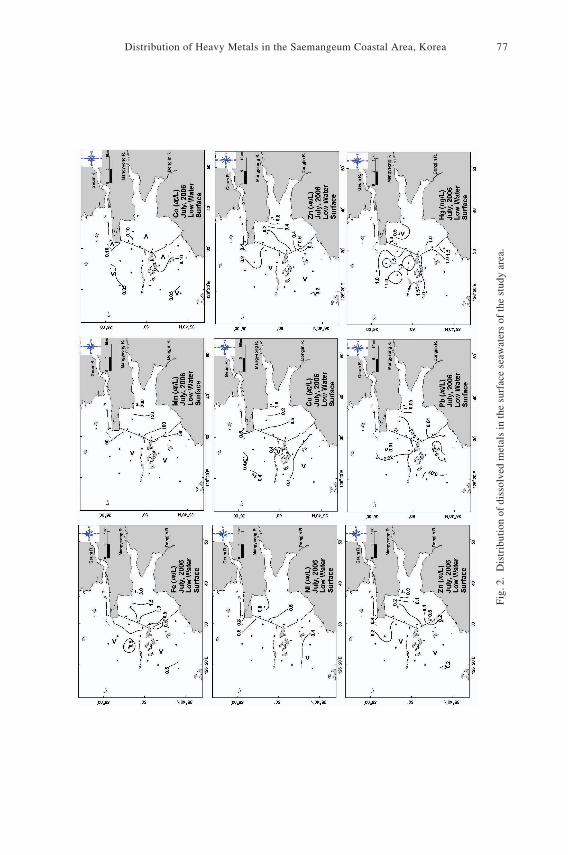
sampling site is further apart from the estuary. In July, concentration of Ni, Co, Cuand Zn at inner dike was higher than outer sea. And, relevantly high concentrationson exterior region of Geum River Estuary informed that they were from Geum River.Distribution of Cd has a similar trend to May. Pb shows a decreasing trend as thesampling sites were away from the estuary.
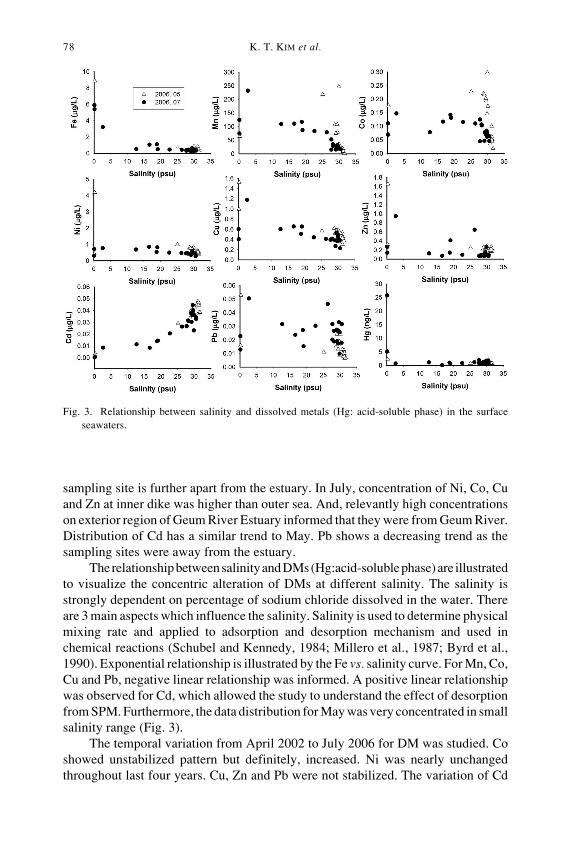
The relationship between salinity and DMs (Hg:acid-soluble phase) are illustratedto visualize the concentric alteration of DMs at different salinity. The salinity isstrongly dependent on percentage of sodium chloride dissolved in the water. Thereare 3 main aspects which influence the salinity. Salinity is used to determine physicalmixing rate and applied to adsorption and desorption mechanism and used inchemical reactions (Schubel and Kennedy, 1984; Millero et al., 1987; Byrd et al.,1990). Exponential relationship is illustrated by the Fe vs. salinity curve. For Mn, Co,Cu and Pb, negative linear relationship was informed. A positive linear relationshipwas observed for Cd, which allowed the study to understand the effect of desorptionfrom SPM. Furthermore, the data distribution for May was very concentrated in smallsalinity range (Fig. 3).
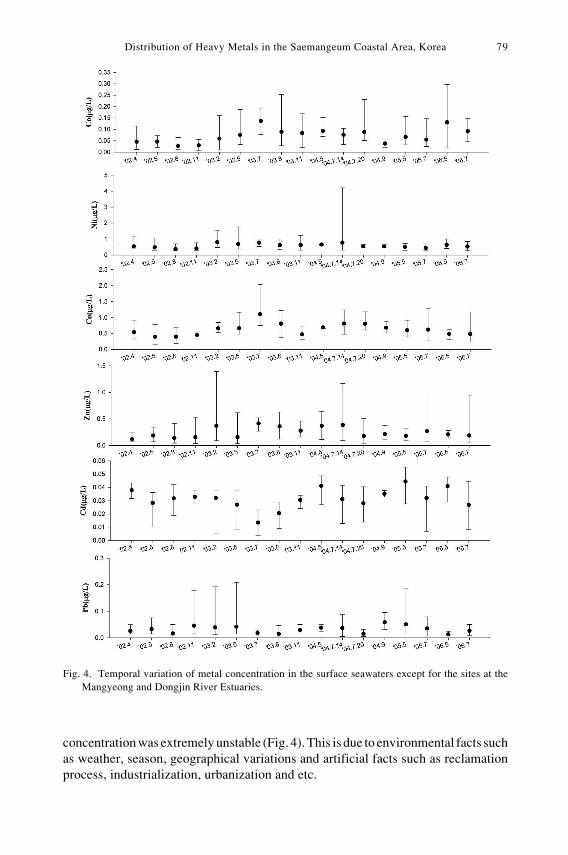
The temporal variation from April 2002 to July 2006 for DM was studied. Coshowed unstabilized pattern but definitely, increased. Ni was nearly unchangedthroughout last four years. Cu, Zn and Pb were not stabilized. The variation of Cd
Fig. 3. Relationship between salinity and dissolved metals (Hg: acid-soluble phase) in the surfaceseawaters.
Distribution of Heavy Metals in the Saemangeum Coastal Area, Korea 79
Fig. 4. Temporal variation of metal concentration in the surface seawaters except for the sites at theMangyeong and Dongjin River Estuaries.
concentration was extremely unstable (Fig. 4). This is due to environmental facts suchas weather, season, geographical variations and artificial facts such as reclamationprocess, industrialization, urbanization and etc.
80 K. T. KIM et al.
Concentrations of DMs in the surface seawater in 2006 are compared to LenaRiver Estuary which represents the natural condition, Bristol Channel and SevernEstuary which represents DMs concentrations in highly polluted region, and pastresearch of Geum River Estuary, Shihwa lake and Saemangeum. A comparison of theDMs concentrations of 1999 Saemangeum research and this study shows that theconcentrations of DMs are significantly decreased except the Co and Cd. Theirconcentrations are roughly half of the previous values. A trend of lower concentrationsof DMs of this study is easily observed compare to Bristol Channel and SevernEstuary (Harper, 1991) and Shihwa lake (KORDI, 1999). The higher concentrationin Saemangeum compare to Lena Rriver Estuary (Martin et al., 1993) informs that theSaemangeum is more polluted. Cu and Cd concentrations in this study are similar toGeum River Estuary (KORDI, 1996) (Table 2).
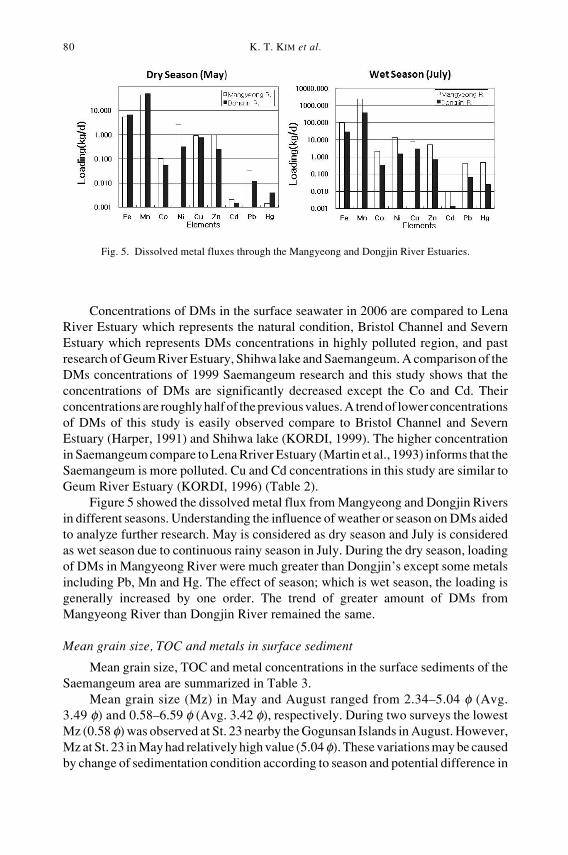
Figure 5 showed the dissolved metal flux from Mangyeong and Dongjin Riversin different seasons. Understanding the influence of weather or season on DMs aidedto analyze further research. May is considered as dry season and July is consideredas wet season due to continuous rainy season in July. During the dry season, loadingof DMs in Mangyeong River were much greater than Dongjin’s except some metalsincluding Pb, Mn and Hg. The effect of season; which is wet season, the loading isgenerally increased by one order. The trend of greater amount of DMs fromMangyeong River than Dongjin River remained the same.
Mean grain size, TOC and metals in surface sediment
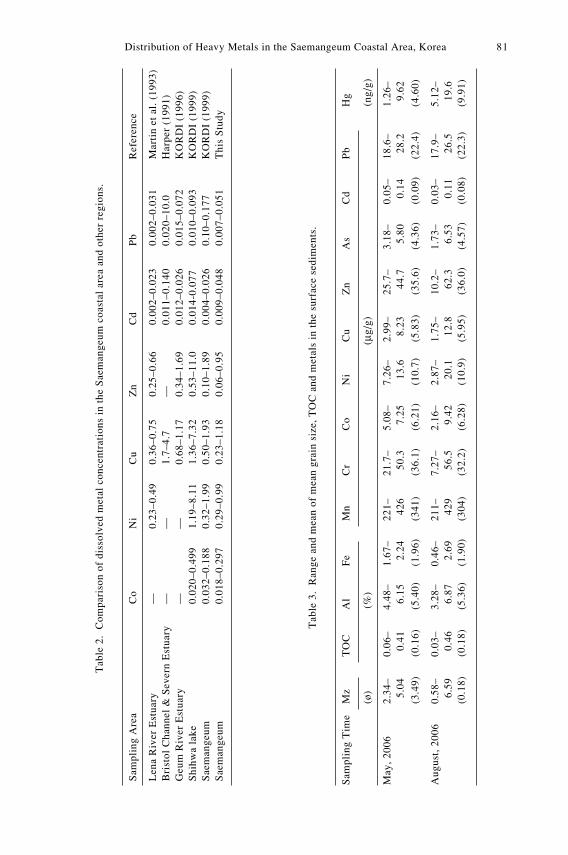
Mean grain size, TOC and metal concentrations in the surface sediments of theSaemangeum area are summarized in Table 3.
Mean grain size (Mz) in May and August ranged from 2.34–5.04 φ (Avg.3.49 φ) and 0.58–6.59 φ (Avg. 3.42 φ), respectively. During two surveys the lowestMz (0.58 φ) was observed at St. 23 nearby the Gogunsan Islands in August. However,Mz at St. 23 in May had relatively high value (5.04 φ). These variations may be causedby change of sedimentation condition according to season and potential difference in
Fig. 5. Dissolved metal fluxes through the Mangyeong and Dongjin River Estuaries.
Distribution of Heavy Metals in the Saemangeum Coastal Area, Korea 81
Tab
le 3
. R
ange
and
me a
n of
me a
n gr
a in
siz e
, T
OC
and
me t
a ls
in t
he s
urfa
c e s
e dim
e nts
.
Tab
le 2
. C
ompa
riso
n of
dis
solv
ed m
etal
con
cent
rati
ons
in t
he S
aem
ange
um c
oast
al a
rea
and
othe
r re
gion
s.
Sam
plin
g A
rea
Co
Ni
Cu
Zn
Cd
Pb
Ref
eren
ce
Len
a R
iver
Est
uary
—0.
23–0
.49
0.36
–0.7
50.
25–0
.66
0.00
2–0.
023
0.00
2–0.
031
Mar
tin
et a
l. (
1993
)B
rist
ol C
hann
el &
Sev
ern
Est
uary
——
1.7–
4.7
—0.
011–
0.14
00.
020–
10.0
Har
per
(199
1)G
eum
Riv
er E
stua
ry—
—0.
68–1
.17
0.34
–1.6
90.
012–
0.02
60.
015–
0.07
2K
OR
DI
(199
6)S
hihw
a la
ke0.
020–
0.49
91.
19–8
.11
1.36
–7.3
20.
53–1
1.0
0.01
4-0.
077
0.01
0–0.
093
KO
RD
I (1
999)
Sae
man
geum
0.03
2–0.
188
0.32
–1.9
90.
50–1
.93
0.10
–1.8
90.
004–
0.02
60.
10–0
.177
KO
RD
I (1
999)
Sae
man
geum
0.01
8–0.
297
0.29
–0.9
90.
23–1
.18
0.06
–0.9
50.
009–
0.04
80.
007–
0.05
1T
his
Stu
dy
Sam
plin
g T
ime
Mz
TO
CA
lF
eM
nC
rC
oN
iC
uZ
nA
sC
dP
bH
g
(ø)
(%)
(µg/
g)(n
g/g)
May
, 20
062.
34–
0.06
–4.
48–
1.67
–22
1–21
.7–
5.08
–7.
26–
2.99
–25
.7–
3.18
–0.
05–
18.6
–1.
26–
5.
04
0.41
6.
15
2.24
42
6
50.3
7.
25
13.6
8.
23
44.7
5.
80
0.14
28
.2
9.62
(3.4
9)(0
.16)
(5.4
0)(1
.96)
(341
)(3
6.1)
(6.2
1)(1
0.7)
(5.8
3)(3
5.6)
(4.3
6)(0
.09)
(22.
4)(4
.60)
Aug
ust,
200
60.
58–
0.03
–3.
28–
0.46
–21
1–7.
27–
2.16
–2.
87–
1.75
–10
.2–
1.73
–0.
03–
17.9
–5.
12–
6.
59
0.46
6.
87
2.69
42
9
56.5
9.
42
20.1
12
.8
62.3
6.
53
0.11
26
.5
19.6
(0.1
8)(0
.18)
(5.3
6)(1
.90)
(304
)(3
2.2)
(6.2
8)(1
0.9)
(5.9
5)(3
6.0)
(4.5
7)(0
.08)
(22.
3)(9
.91)
82 K. T. KIM et al.
Distribution of Heavy Metals in the Saemangeum Coastal Area, Korea 83
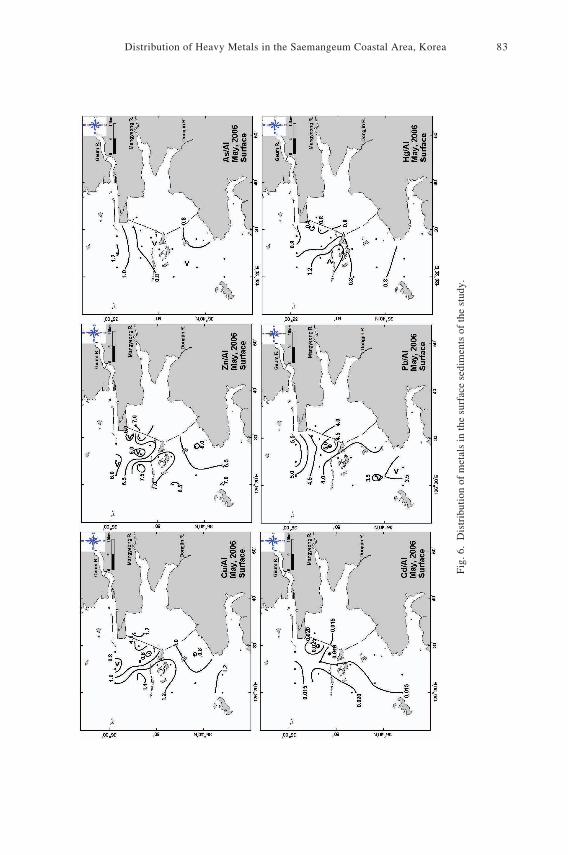
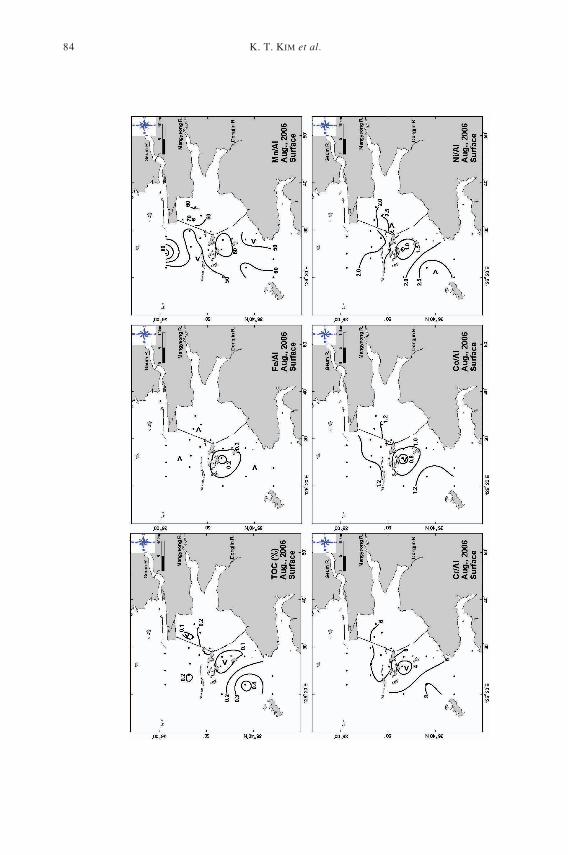
Fig
. 6.
Dis
trib
utio
n of
met
als
in th
e su
rfac
e se
dim
ents
of
the
stud
y.
84 K. T. KIM et al.
Distribution of Heavy Metals in the Saemangeum Coastal Area, Korea 85
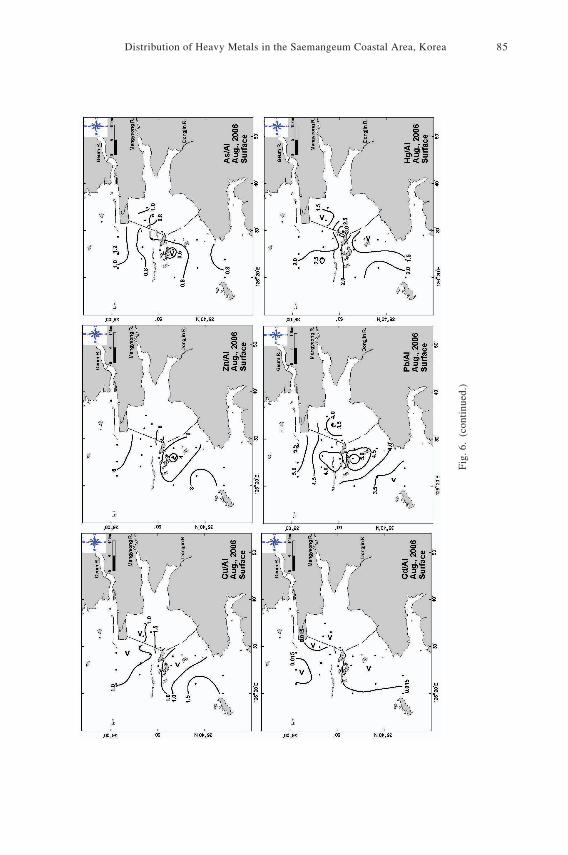
Fig
. 6.
(con
tinu
ed.)
86 K. T. KIM et al.
sampling position. Relatively high Mz during all two surveys was found in the innerpart of the dike but low in outer sea.
TOC in the sediments varied from 0.06–0.41% (Avg. 0.16%) in May and 0.03–0.46% (Avg. 0.18%) in August (Table 3). The maximum values were about 30 timeshigher than the minimum ones. The minimum content (0.03%) was found at St. 23with the minimum Mz (0.58 φ) nearby Gogunsan Islands in August and the maximum(0.46%) at St. 18 with the maximum Mz (6.59 φ) in August (Fig. 6). High correlationcoefficient (R = 0.883) between Mz and TOC in August was observed, but low one(R = 0.436) in May. Yang et al. (1998) reported close relationship between grain sizeand organic carbon in the surface sediments of the Yellow Sea. In general, the organiccarbon content increases as grain size decreases (Bordovskiy, 1965). Biologicalproductivity in the surface water, chemistry of the water column and sedimentationrate are the most important factors controlling the geographical variation of organiccarbon contents (Cho et al., 1999).
The concentrations of chemical elements in the surface sediments were measuredin May and August 2006, ranging from: 0.03–0.46% for TOC, 3.28–6.87% for Al,0.46–2.69% for Fe, 211–429 µg/g for Mn, 7.27–56.5 µg/g for Cr, 2.16–9.42 µg/gfor Co, 2.87–20.1 µg/g for Ni, 1.75–12.8 µg/g for Cu, 10.2–62.3 µg/g for Zn, 1.73–6.53 µg/g for As, 0.03–0.14 µg/g for Cd, 17.9–28.2 µg/g for Pb and 1.26–19.6 ng/gfor Hg (Table 3).
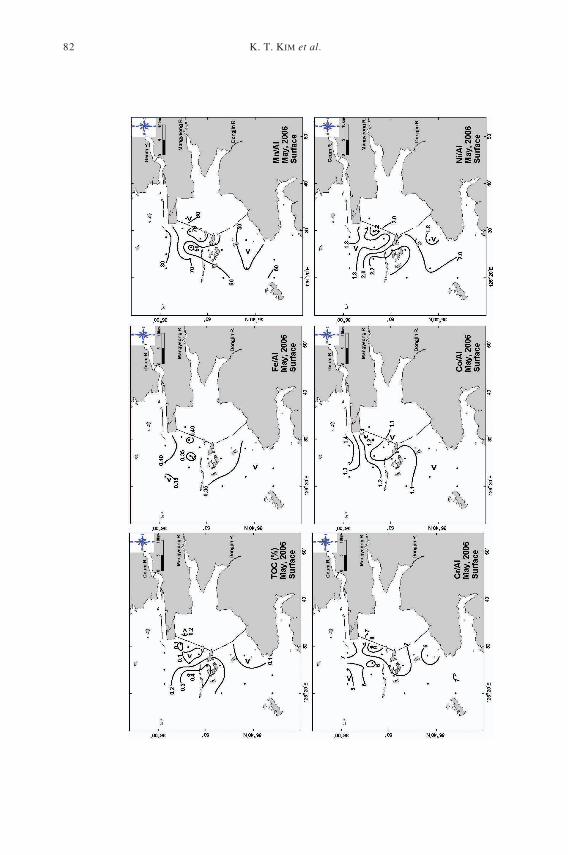
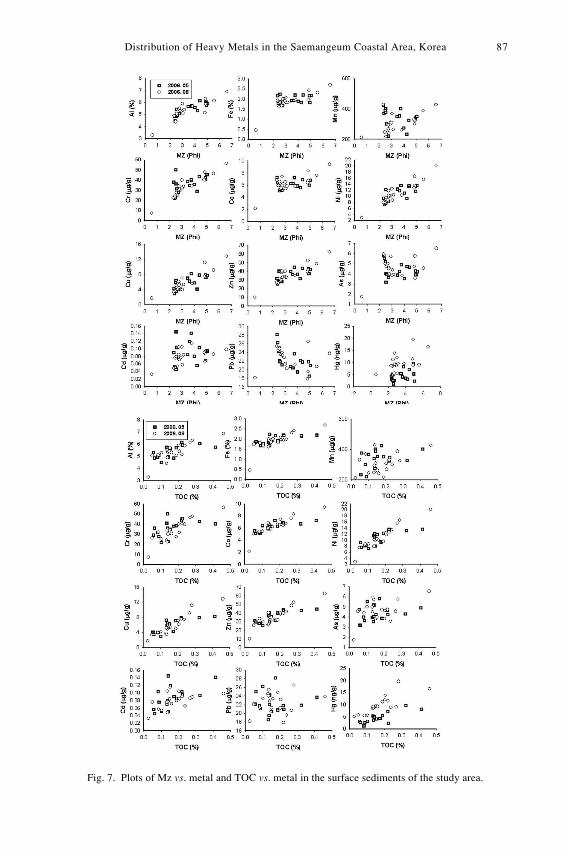
Al informed the highest value at St. 4-1 in May and at St. 18 in August. In May,most metals including Fe, Cr, Cd, Mn, Co, As and Pb showed the highest concentrationsin the sites nearby the Geum River Estuary and the northern part in the offsea of thedyke. In August, the highest concentrations of most metals except Cd, Pb and Hg werefound at St. 7 in southern part of outer dyke. In these sediments, variations in chemicalcompositions are controlled by changes in the river-derived material supply as wellas from the source area. Most of the nearshore marine sediments are composed ofsolid material brought to the sea mainly by the action of rivers (Chester, 1990). Thechemical composition of marine sediments also varies primarily depending uponsource rock types, climate, composition of constituents, diagenesis, grain size andorganic carbon content (Zhao and Yan, 1993). Several kinds of refractory metals suchas Al, Fe, Mg, Ti, Sc, Li and Cs have been used to normalize the grain size effect formetal concentrations in sediments (Schropp et al., 1990; Soto-Jiménez and Páez-Osuna, 2001). Some elements such as Al, Cr, Co, Ni, Cu and Zn have reliable positivelinear relationship to Mz. But Mn, As, Cd and Pb curves had no relevance. Irrelevanceis caused by high metal concentrations from Geum River Estuary. On the other hand,relationships of TOC and metals generally consisted of positive linear relationship,however Mn, As and Pb were scattered (Fig. 7).
Distribution of metal/Al ratios in sediment are plotted in different sites in thisstudy area. Since the metal to Al ratio (Metal/Al; % for Al and Fe or µg/g for others)is used generally, our study used this ratio to compensate grain size effect for metalconcentrations. In May, the high ratio of Mn, Co, As, Cd and Pb were found at GeumRiver Estuary. Most of elements showed relatively low ratio in southern area of outerdyke (Fig. 6). In August, the high ratio of Mn, As and Pb were found at Geum RiverEstuary. Low ratios were reported at Gogunsan Islands region.
Distribution of Heavy Metals in the Saemangeum Coastal Area, Korea 87
Fig. 7. Plots of Mz vs. metal and TOC vs. metal in the surface sediments of the study area.
88 K. T. KIM et al.
Elements NOAA SQCs KORDI (2003) Cho et al. (2001) This Study
ERL ERM Sea sediment in 2002 Intertidal F.S. in 1993 Sea sediment in 2006
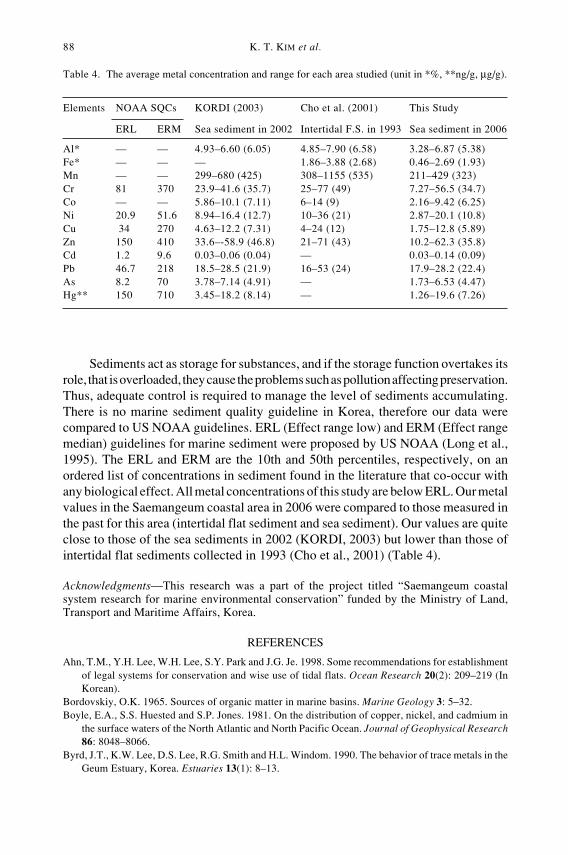
Al* — — 4.93–6.60 (6.05) 4.85–7.90 (6.58) 3.28–6.87 (5.38)Fe* — — — 1.86–3.88 (2.68) 0.46–2.69 (1.93)Mn — — 299–680 (425) 308–1155 (535) 211–429 (323)Cr 81 370 23.9–41.6 (35.7) 25–77 (49) 7.27–56.5 (34.7)Co — — 5.86–10.1 (7.11) 6–14 (9) 2.16–9.42 (6.25)Ni 20.9 51.6 8.94–16.4 (12.7) 10–36 (21) 2.87–20.1 (10.8)Cu 34 270 4.63–12.2 (7.31) 4–24 (12) 1.75–12.8 (5.89)Zn 150 410 33.6–-58.9 (46.8) 21–71 (43) 10.2–62.3 (35.8)Cd 1.2 9.6 0.03–0.06 (0.04) — 0.03–0.14 (0.09)Pb 46.7 218 18.5–28.5 (21.9) 16–53 (24) 17.9–28.2 (22.4)As 8.2 70 3.78–7.14 (4.91) — 1.73–6.53 (4.47)Hg** 150 710 3.45–18.2 (8.14) — 1.26–19.6 (7.26)
Sediments act as storage for substances, and if the storage function overtakes itsrole, that is overloaded, they cause the problems such as pollution affecting preservation.Thus, adequate control is required to manage the level of sediments accumulating.There is no marine sediment quality guideline in Korea, therefore our data werecompared to US NOAA guidelines. ERL (Effect range low) and ERM (Effect rangemedian) guidelines for marine sediment were proposed by US NOAA (Long et al.,1995). The ERL and ERM are the 10th and 50th percentiles, respectively, on anordered list of concentrations in sediment found in the literature that co-occur withany biological effect. All metal concentrations of this study are below ERL. Our metalvalues in the Saemangeum coastal area in 2006 were compared to those measured inthe past for this area (intertidal flat sediment and sea sediment). Our values are quiteclose to those of the sea sediments in 2002 (KORDI, 2003) but lower than those ofintertidal flat sediments collected in 1993 (Cho et al., 2001) (Table 4).
Acknowledgments—This research was a part of the project titled “Saemangeum coastalsystem research for marine environmental conservation” funded by the Ministry of Land,Transport and Maritime Affairs, Korea.
REFERENCES
Ahn, T.M., Y.H. Lee, W.H. Lee, S.Y. Park and J.G. Je. 1998. Some recommendations for establishmentof legal systems for conservation and wise use of tidal flats. Ocean Research 20(2): 209–219 (InKorean).
Bordovskiy, O.K. 1965. Sources of organic matter in marine basins. Marine Geology 3: 5–32.Boyle, E.A., S.S. Huested and S.P. Jones. 1981. On the distribution of copper, nickel, and cadmium in
the surface waters of the North Atlantic and North Pacific Ocean. Journal of Geophysical Research86: 8048–8066.
Byrd, J.T., K.W. Lee, D.S. Lee, R.G. Smith and H.L. Windom. 1990. The behavior of trace metals in theGeum Estuary, Korea. Estuaries 13(1): 8–13.
Table 4. The average metal concentration and range for each area studied (unit in *%, **ng/g, µg/g).
Distribution of Heavy Metals in the Saemangeum Coastal Area, Korea 89
Carver, R.E. 1971. Procedures in Sedimentary Petrology. Wiley Interscuence, New York.Chester, R. 1990. Marine Geochemistry. Unwin Hyman, London.Cho, Y.G., C.B. Lee and M.S. Choi. 1999. Geochemistry of surface sediments off the southern and
western coasts of Korea. Marine Geology 159: 111–129.Cho, Y.G., S.O. Ryu, Y.K. Khu and J.Y. Kim. 2001. Geochemical composition of surface sediment from
the Saemangeum tidal flat, west coast of Korea. Journal of the Korean Society of Oceanography, TheSea 6(1): 27–34.
Coquery, M., S. Azemard and S.J. de Mora. 2000. Report on the world-wide intercomparison exercisefor the determination of trace elements and methylmercury in estuarine sediment sample IAEA-405.IAEA/AL127, IAEA/MEL/70, IAEA.
Danielsson, L.G., B. Magnusson and S. Westerlund. 1978. An improved metal extraction procedure forthe determination of trace metals in sea water by atomic absorption spectrometry with electro-thermal atomization. Analytica Chimica Acta 98: 47–57.
Harper, D.J. 1991. The distribution of dissolved cadmium, lead and copper in the Bristol Channel and theouter Severn estuary. Marine Chemistry 33: 131–143.
Hong, G.H., K.T. Kim, S.J. Pae, S.H. Kim and S.H. Lee. 1991. Annual cycles of nutrients and dissolvedoxygen in a nutrient-rich temperate coastal bay, Chinhae Bay, Korea. Journal of the Korean Societyof Oceanography 26(3): 204–222.
Jickells, T.D. and J.E. Rae. 1997. Biogeochemistry of intertidal sediments. In: Biogeochemistry ofIntertidal Sediments, T.D. Jickells and J.E. Rae (Eds.). 1st Edition. Cambridge University Press,Cambridge, pp. 1–15.
Jung, H.S., K.W. Choi, D. Kim and C.S. Kim. 2000. Status of environmental conditions of Shihwa lakein the west coast of Korea and strategies for its remediation. Ocean Policy Research 12: 123–163 (InKorean).
Kim, K.T., H.S. Shin, C.R. Lim, Y.G. Cho, G.H. Hong, S.H. Kim, D.B. Yang and M.S. Choi. 2000.Geochemistry of Pb in surface sediments of the Yellow Sea: Contents and Speciation. Journal of theKorean Society of Oceanography 35(4): 179–191.
Kim, K.T., H.S. Seo, E.S. Kim, K.H. Chung, S.D. Hur, J.K. Park and S.R. Cho. 2004. Geochemicalcharacteristics of surface sediments from a tidal flat, west coast of Korea. Techno Ocean 2004, Kobe.
Kim, S.A. and S.H. Khang. 2000. The Yellow Sea. In: Seas at the Millennium: An EnvironmentalEvaluation, C.R.C. Sheppard (Ed.), Pergamon, Amsterdam, pp. 487–497.
KORDI. 1996. A study on the investigation and countermeasure of marine pollution in the Yellow Sea.(1st year of 2nd stage). KORDI Report, Ansan, Korea, 346 pp. (In Korean).
KORDI. 1999. A study on environmental changes of Shihwa lake by outer seawater inflow (3rd year).KORDI Report, Ansan, Korea, 363 pp. (In Korean).
KORDI. 2003. Integrated preservation study on the oceanic environments in the Saemangeum area(1st year). KORDI Report, Ansan, Korea, 298 pp. (In Korean).
Long, E.R., D.D. McDonald, S.L. Smith and F.D. Calder. 1995. Incidence of adverse biological effectswithin ranges of chemical concentrations in marine and estuarine sediments. EnvironmentalManagement 19: 18–97.
Martin, J.M., D.M. Guan, F. Elbaz-Poulichet, A.J. Thomas and V.V. Gordeev. 1993. Preliminaryassessment of the distribution of some trace elements (As, Cd, Cu, Fe, Ni, Pb and Zn) in a pristineaquatic environment: the Lena River estuary (Russia). Marine Chemistry 43: 185–199.
Millero, F.J., M. Izaguirrel and V.K. Sharma. 1987. The effect of ionic interaction on the oxidation innatural waters*. Marine Chemistry 22: 179–191.
Schropp, S.J., F.G. Lewis, H.L. Windom, J.D. Ryan, F.D. Calder and L.C. Burney. 1990. Interpretationof metal concentrations in estuarine sediments of Florida using aluminium as a reference element.Estuaries 13: 227–235.
Schubel, J.R. and V.C. Kennedy. 1984. The estuary as a filter: An introduction. In: The Estuary as a Filter,V.C. Kennedy (Ed.), Academic Press, Orland, pp. 1–11.
Smith, R.G. 1993. Determination of mercury in environmental samples by isotope dilution/ICPMS.Analytical Chemistry 65(18): 2485–2488.
Soto- Jiménez, M.F. and F. Páez-Osuna. 2001. Distribution and normalization of heavy metal concentrations
90 K. T. KIM et al.
in mangrove and lagoonal sediments from Mazatlán Harbor (SE Gulf of California). Estuarine,Coastal and Shelf Science 53: 259–274.
Windom, H.L., S.L. Schropp, F.D. Calder, J.D. Ryan, R.G. Smith, Jr., L.C. Burney, F.G. Lewis and C.H.Rawlinson. 1989. Natural trace metal concentrations in estuarine and coastal marine sediment of thesoutheastern United States. Environmental Science & Technology 23: 314–320.
Windom, H.L., J.T. Byrd, R.G. Smith, Jr. and F. Huan. 1991. Inadequacy of NASQAN data for assessingmetal trends in the Nation’s Rivers. Environmental Science & Technology 25(6): 1137–1142.
Wittmann, G.T.W. 1981. Toxic metals. In: Metal Pollution in the Aquatic Environment, U. Förstner andG.T.W. Wittmann (Eds.). 2nd Edition. Spring-Verlag, Berlin, pp. 3–70.
Yang, D.B., K.T. Kim, G.H. Hong and C.K. Park. 1998. Organic carbon, nitrogen and trace metals in thesurface sediments of the southern Yellow Sea: Results of observation made in 1996. The Yellow Sea4: 5–12.
Zhao, Y.Y. and M.C. Yan. 1993. Geochemical record of the climatic effect in sediments of the China ShelfSea. Chemical Geology 107: 267–269.
K. T. Kim (e-mail: [email protected]), E. S. Kim, S. R. Cho, J. K. Park, K. T.Ra and J. M. Lee