distribution, abundance and population structure of ... · distribution, abundance and population...
TRANSCRIPT

Scottish Natural HeritageCommissioned Report No. 354
Distribution, abundance and population structure of bottlenose dolphins in Scottish waters


iv
evidence of historic and contemporary exchange between Scottish and Irish waters.
A high proportion of dolphins using the Moray Firth SAC in summer were also
detected within east coast waters during winter. Passive acoustic monitoring highlighted that core areas within the SAC continued to be used during much of the winter, although at a lower level than that observed during the summer months.
The following conclusions were reached:
Photo-identification can provide a robust method for estimating the abundance of bottlenose dolphins throughout Scottish coastal waters. However, in areas such as the west coast, where animals are sparsely and unpredictably distributed, research surveys are best targeted through close collaboration with public reporting schemes.
Only low numbers of bottlenose dolphins occur in Scottish coastal waters.
Consequently, broad-scale systematic surveys provide limited power for detecting core-habitats either in winter or summer. However, this study has demonstrated that a combination of Passive Acoustic Monitoring and targeted photo-identification surveys can provide robust data on seasonal and inter-annual patterns of occurrence in particular coastal areas of interest.
For further information on this project contact: Fiona Manson, Scottish Natural Heritage, Battleby, Redgorton, Perth, PH1 3EW
Tel: 01738 458 641 or [email protected]

v
Acknowledgements
This project was carried out as a collaboration between the University of Aberdeen, the University of St Andrews, the Scottish Association of Marine Science and the Hebridean Whale and Dolphin Trust. However, the success of many aspects of the project depended upon much wider collaboration with a range of different organisations. These are listed on the following page, and colleagues from these organisations appear as authors on the individual chapters to which they have contributed. We would especially like to thank all these colleagues for agreeing to collaborate on this project, and for their contributions in terms of data, analytical expertise and insights into the interpretation of our collective datasets. We would also like to thank Tim Barton, Kelly Lewis, Andy Foote and the many other colleagues who have contributed to the challenging field work required to collect the photo-identification and acoustic data presented in this report. Thanks also to the South Grampian group of the Sea Watch Foundation and everyone who contributed to the Aberdeen Cetacean Catalogue. The success of field work on the remoter coasts of Scotland was also dependent upon input from members of the public living, working and taking holidays in these areas. We are indebted to all those who responded to the call for information (see section 3), and particularly thank those who contributed photographs that could be used photo-identification purposes. The information coming from these contributions surpassed all our expectations at the beginning of the project. The core project was funded jointly by the Scottish Government and Scottish Natural Heritage and we thank Elaine Tait, Louise Cunningham, Karen Hall, Fiona Manson, Katie Gillham, Sam Kelly, Evanthia Karpouzli and Ian Walker who have supported the project through its steering group. Many aspects of the project have also benefited from close integration with related studies that have been funded from a variety of sources. In particular we would like to thank the Whale & Dolphin Conservation Society, Talisman Energy (UK) Ltd., Earthwatch, Chevron, the European Union, and the Natural Environment Research Council for additional support.

vi
Author Affiliations
Paul M. Thompson, Simon Ingram, Barbara Cheney,
Ana Candido & Simon Elwen University of Aberdeen, Institute of Biological and Environmental Sciences,
Lighthouse Field Station, Cromarty IV11 8YJ
Philip S. Hammond, Vincent M. Janik, Nicola Quick & Valentina Islas Sea Mammal Research Unit, Scottish Oceans Institute,
University of St Andrews, Fife KY16 8LB
Ben Wilson & Ross Culloch Scottish Association for Marine Science, Dunstaffnage Marine Laboratory,
Oban, Argyll PA37 1QA
Peter Stevick & Laura Mandleberg Hebridean Whale and Dolphin Trust, 28 Main Street, Tobermory,
Isle of Mull, Argyll PA75 6NU
Stuart Piertney & Gill Murray-Dickson University of Aberdeen, Institute of Biological and Environmental Sciences,
Zoology Building, Aberdeen AB24 2TZ UK
Peter G.H. Evans Sea Watch Foundation, Cynifryn, Abershore, Llanfaglan,
Caernarfon, Gwynedd, Wales LL54 5RA
Alice Pope & Charlie Phillips Whale & Dolphin Conservation Society, WDCS Wildlife Centre,
Spey Bay, Moray IV32 7PJ
Kevin P. Robinson Cetacean Research & Rescue Unit, P.O. Box 11307, Banff AB45 3WB
Caroline R. Weir
Ketos Ecology, 44 Lord Hay's Grove, Aberdeen, AB24 1WS & Sea Watch Foundation.
Robert J. Reid Wildlife Unit, SAC Veterinary Services, Drummondhill, Inverness IV2 4JZ, UK.
Simon Berrow Shannon Dolphin and Wildlife Foundation, Merchants Quay, Kilrush, Co Clare, Ireland.
John W. Durban
NOAA, Alaska Fisheries Science Center National Marine Mammal Laboratory 7600 Sand Point Way NE Seattle WA 98115 USA

vii
Table of Contents Page 1 INTRODUCTION ................................................................................................................. 1 2 REVIEW OF HISTORIC RECORDS OF BOTTLENOSE DOLPHINS IN SCOTTISH WATERS ................................................................................................................................ 3
2.1 Introduction ................................................................................................................... 3 2.2 Data sources................................................................................................................. 3 2.3 Results .......................................................................................................................... 5 2.4 Discussion................................................................................................................... 12
3 DEVELOPMENT OF A DOLPHIN SIGHTING NETWORK............................................... 13 3.1 Introduction ................................................................................................................. 13 3.2 Methods ...................................................................................................................... 13 3.3 Results ........................................................................................................................ 16 3.4 Discussion................................................................................................................... 24
4 USING PHOTO-IDENTIFICATION TO DETERMINE THE DISTRIBUTION AND ABUNDANCE OF BOTTLENOSE DOLPHINS IN SCOTTISH COASTAL WATERS......... 26
4.1 Introduction ................................................................................................................. 26 4.2 Methods ...................................................................................................................... 26 4.3 Results ........................................................................................................................ 31 4.4 Discussion................................................................................................................... 42
5 MULTI-SITE MARK RECAPTURE ESTIMATE OF THE ABUNDANCE AND MOVEMENT RATES OF BOTTLENOSE DOLPHINS............................................................................... 44
5.1 Introduction ................................................................................................................. 44 5.2 Methods ...................................................................................................................... 45 5.3 Results ........................................................................................................................ 48 5.4 Discussion................................................................................................................... 52
6 ASSESSMENT OF POPULATION STRUCTURE USING MOLECULAR ANALYSES OF TISSUES FROM STRANDINGS .......................................................................................... 55
6.1 Introduction ................................................................................................................. 55 6.2 Methods ...................................................................................................................... 56 6.3 Results ........................................................................................................................ 59 6.4 Discussion................................................................................................................... 63
7 WINTER DISTRIBUTION OF BOTTLENOSE DOLPHINS USING THE MORAY FIRTH SPECIAL AREA OF CONSERVATION ............................................................................... 65
7.1 Introduction ................................................................................................................. 65 7.2 Methods ...................................................................................................................... 65 7.3 Results ........................................................................................................................ 71 7.4 Discussion................................................................................................................... 83
8 CONCLUSIONS & RECOMMENDATIONS ...................................................................... 86 8.1 Distribution and abundance of bottlenose dolphins in Scottish coastal waters........... 86 8.2 Links with offshore and other coastal populations ...................................................... 86 8.3 Integrating public sightings into research.................................................................... 87 8.4 Monitoring changes in dolphin occurrence in key areas ............................................. 88 8.5. Science and policy ..................................................................................................... 88
9 REFERENCES .................................................................................................................. 89
viii
List of Figures Page Figure 1.1. Map of Scotland showing the key locations mentioned in the report. 2 Figure 2.1. Strandings of bottlenose dolphins around Scotland from 1929 to 2008 from the Scottish Agricultural College in Inverness and the Natural History Museum. 7 Figure 2.2. Strandings of bottlenose dolphins around Scotland from 1929 to 2008 from the Scottish Agricultural College in Inverness and the Natural History Museum. 7 Figure 2.3. North-west Europe bottlenose dolphin distribution from the JNCC Cetacean Atlas. (Reproduced from Reid et al., 2003). 8 Figure 2.4. Sightings of bottlenose dolphins recorded during SCANS-II in 2005 and during seismic surveys conducted between 1994 and 2006. 9 Figure 2.5. Distribution of sightings of bottlenose dolphins around Scotland from 1966 to 2007 from the Sea Watch Foundation. 10 Figure 2.6. Number of sightings of bottlenose dolphins around Scotland from 1966 to 2007 from the Sea Watch Foundation. 10 Figure 2.7. Distribution of sightings of bottlenose dolphins around Scotland from 1989 to 2007 from the Hebridean Whale and Dolphin Trust. 11 Figure 2.8. Number of sightings of bottlenose dolphins around Scotland from 1989 to 2007 from the Hebridean Whale and Dolphin Trust. 11 Figure 3.1. The business card designed to promote the Scottish Bottlenose Dolphin Project and encourage sightings to the HWDT freephone hotline. 14 Figure 3.2. The leaflet designed to promote the Scottish Bottlenose Dolphin Project and encourage sightings to the HWDT freephone hotline. 15 Figure 3.3. The locations of sightings reporters that contributed to the HWDT sightings network during 2006 and additional reporters recruited for 2007 and 2008. 16 Figure 3.4. Number of public bottlenose dolphin sightings from the HWDT sightings network per area. 19 Figure 3.5. Locations of public bottlenose dolphin sightings from the HWDT sightings network from 1989 to 2005. 19 Figure 3.6. Locations of sightings of bottlenose dolphin schools reported to the HWDT sightings network during 2006. 21 Figure 3.7. Locations of sightings of bottlenose dolphin schools reported to the HWDT sightings network during 2007. 21 Figure 3.8. Locations of public photographs of bottlenose dolphin schools from 2001 to 2007, additional 2008 photographs and east coast. 23 Figure 4.1. Map of Scotland showing the key locations mentioned in the text. 27

ix
Figure 4.2. One of the RIBs used for photo-identification surveys. 28
Figure 4.3. The criteria used to quality grade the photographs taken during photo-identification surveys. 30
Figure 4.4. The tracks from dedicated photo-identification surveys conducted during 2006. 32 Figure 4.5. The locations of bottlenose dolphin groups encountered during 2006. 32 Figure 4.6. The tracks from dedicated photo-identification surveys conducted during 2007. 33 Figure 4.7. The locations of bottlenose dolphin groups encountered during 2007. 33 Figure 4.8. The year in which animals sighted during east coast surveys conducted in 2006 and 2007 were first identified. 34 Figure 4.9. The rate that individual dolphins (excluding calves) were identified during dedicated photo-identification survey work conducted on the east coast during summer 2006 and 2007. 36 Figure 4.10. The year in which animals sighted during west coast surveys conducted in 2006 and 2007 were first identified. 37 Figure 4.11. The rate that individual dolphins (excluding calves) were identified using all photo-identification work conducted on the west coast during 2006 and 2007. 37 Figure 4.12. The composition of schools encountered in the waters around the west coast during 2006 and 2007 at different latitudes. 40 Figure 4.13. Dendrogram showing cluster analysis of association values between identified dolphins. 41 Figure 4.14. The composition of schools encountered in the waters around the Inner Hebrides during 2006 and 2007 at different latitudes. 41 Figure 5.1. The areas used for the multi-site mark-recapture. 46 Figure 6.1. Map of the United Kingdom and Ireland indicating the sampling locations of the 46 bottlenose dolphin individuals sampled and analysed. 46 Figure 6.2. Maximum likelihood phylogeny derived mitochondrial sequence data illustrating relationships between the 11 haplotypes identified among 46 dolphins. 60 Figure 6.3. Principle coordinate analysis indicating the genetic relationships among 45 bottlenose dolphin individuals inferred from differences across 10 microsatellite loci. 62 Figure 6.4. Proportional membership for each bottlenose dolphin individual into four genetic clusters identified by Structure 2.1. 62 Figure 7.1. East Scotland showing the east coast study sites. 66 Figure 7.2. Aircraft used for the aerial surveys. 67 Figure 7.3. A Timing Porpoise Detector (T-POD). 69
x
Figure 7.4. Locations of the T-POD deployment sites between June 2006 and April 2009. 69 Figure 7.5. Diagram of the basic T-POD mooring. 70 Figure 7.6. Tracks of aerial surveys flown on the east coast during March and April 2007. 72 Figure 7.7. A sighting of bottlenose dolphins during the east coast aerial surveys. 72 Figure 7.8. Routes taken during the boat surveys conducted within the Moray Firth SAC during the winters of a) 2006/7 and b) 2007/8. 73 Figure 7.9. Distribution of encounters with bottlenose dolphins during boat surveys conducted within the Moray Firth SAC during the winters of 2006/7 and 2007/8. 74 Figure 7.10. Routes taken during the boat surveys conducted outside the Moray Firth SAC during a) the winters of 2006/7 and b) 2007/8. 75 Figure 7.11. Distribution of encounters with bottlenose dolphins during boat surveys conducted outside the Moray Firth SAC during the winters of 2006/7 and 2007/8. 76 Figure 7.12. Occurrence of bottlenose dolphins around the east coast of Scotland a) in summer and b) in winter of 2008. 79 Figure 7.13. Inter-annual comparison of the proportion of days in which dolphins were present at the nine sites where year-round data were available for both 2007 and 2008. 80 Figure 7.14. The average proportion of dolphin positive days in each month for T-POD sites within the Moray Firth SAC. 82 Figure 7.15. The average proportion of dolphin positive days in each month for T-POD sites outside the Moray Firth SAC. 83

xi
List of Tables Page
Table 3.1. Public talks undertaken to promote the HWDT sightings network in 2007. 17 Table 3.2. Additional leaflet drops, informal talks and contacts to promote the sightings network in 2007. 18 Table 3.3. Summary of public photographs from the HWDT sightings network. 20 Table 3.4. Sightings histories of individually recognisable dolphins recorded by the public along the west coast of Scotland. 22 Table 4.1. Summary of photo-identification survey effort during 2006 and 2007. 31 Table 4.2. Summary of photo-identification results during 2006 and 2007. 31 Table 4.3. Sightings histories of individually recognisable dolphins recorded in the Moray Firth in 2006 and 2007. 35 Table 4.4. Sightings histories of individually recognisable dolphins recorded along the west coast of Scotland. 39 Table 5.1. The number of well-marked individuals recorded in different combinations of the three study areas on the east coast. 48 Table 5.2. Model-averaged estimates of a) the number of well-marked individuals and b) the total number of all individual dolphins using the east coast of Scotland in the summers of 2006 and 2007. 48 Table 5.3. Occurrence of different individually recognisable dolphins in the three sampling areas on the east coast of Scotland (May to September 2006 and 2007). 49 Table 5.4. The number of well-marked individuals recorded in different combinations of the three study areas on the west coast. 50 Table 5.5. Model-averaged estimates of a) the number of well-marked individuals and b) the total number of all individual dolphins using the west coast of Scotland in the summers of 2006 and 2007. 50 Table 5.6. Occurrence of different individually recognisable dolphins in the three sampling areas on the west coast of Scotland in 2006 and 2007. 51 Table 5.7. Movement of individuals between locations (nij) expressed as transition probabilities (ptij). 51 Table 6.1. Details of samples used for molecular analyses 57 Table 6.2. Characteristics of 10 microsatellite loci used to examine population structure among 46 bottlenose dolphin individuals. 59 Table 6.3. Polymorphic nucleotide sites across the cytochrome b and control region that define the 11 mitochondrial haplotypes resolved among the 46 bottlenose dolphin samples. 59
xii
Table 6.4. Genetic diversity as estimated at 10 microsatellite loci by the total number of alleles resolved, allelic richness (AR) and observed heterozygosity (Ho) within populations. 61 Table 7.1. Details of the winter photo-identification surveys carried out within the Moray Firth SAC. 73 Table 7.2. Details of the winter photo-identification surveys on the east coast of Scotland that were conducted outside the Moray Firth SAC. 74 Table 7.3. Summary of where each of the well-marked individuals from the east coast were recorded in each of the summer and winter field seasons. 77 Table 7.4. Availability of T-POD and C-POD data from different east coast sites. 78 Table 7.5. Availability of T-POD and C-POD data from different east coast sites for summer and winter 2008. 78 Table 7.6 Summary of Chi-Square test comparing the proportion of dolphin positive days in combined summers (May-Sept) and winters (Jan-Apr, Oct-Dec) from T-PODs and C-PODs around the east coast of Scotland. 81

1
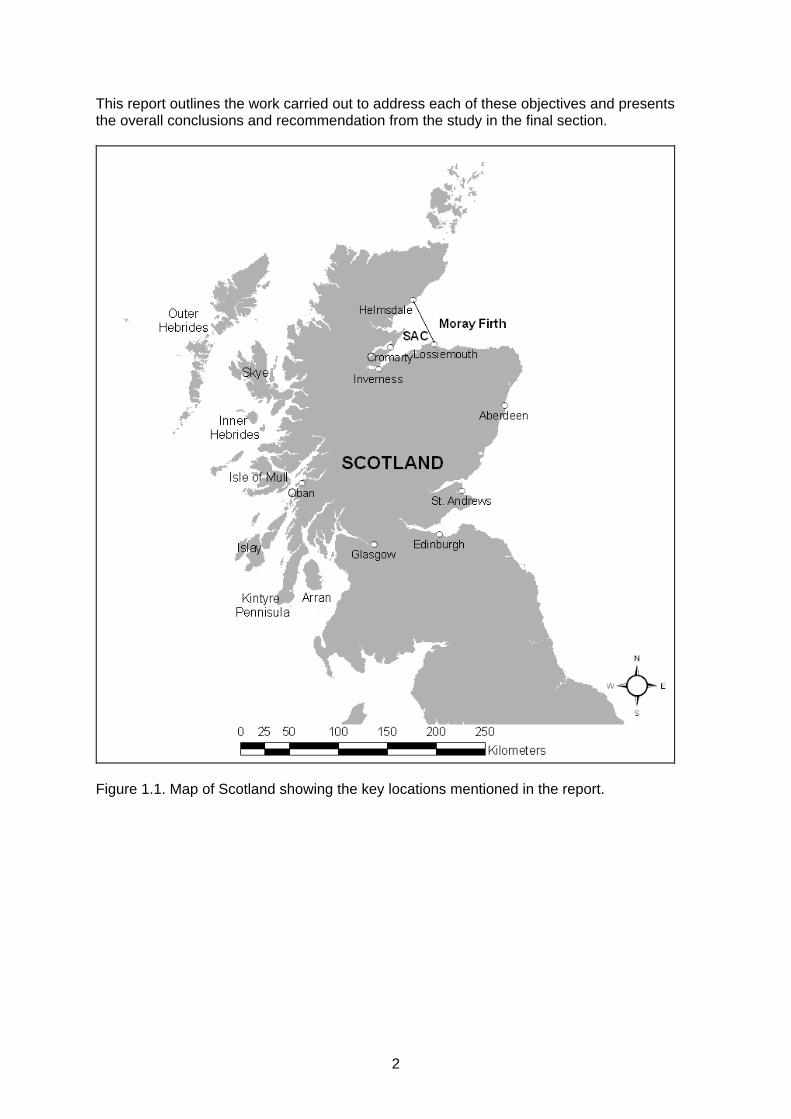
1 INTRODUCTION Bottlenose dolphins (Tursiops truncatus) are one of the most regularly sighted cetaceans around the Scottish coast, and require conservation action in response to the EU Habitats Directive, the Agreement on the Conservation of Small Cetaceans of the Baltic and North Seas (ASCOBANS) and the UK Biodiversity Action Plan for Small Cetaceans. Since it was submitted to the European Commission as a candidate site, the Moray Firth Special Area of Conservation (SAC) has provided an important focus for efforts to protect bottlenose dolphins in Scottish waters. Research on this species in Scottish waters has also focussed on the population that uses the Moray Firth SAC and adjacent waters along the east coast. However, broad-scale surveys, short-term projects and anecdotal reports all indicate that bottlenose dolphins also use inshore waters along the north and west coasts of Scotland. Protection of Scottish bottlenose dolphins requires management of threatening activities in these other areas as well as in the Moray Firth SAC, but our knowledge of their broader-scale distribution, abundance and population structure is poor. Consequently, the Scottish Government and Scottish Natural Heritage (SNH) recognised that there was a need for better data on the distribution and activity of bottlenose dolphins outside the Moray Firth SAC. In turn, these data would then help assess potential risks from the diverse range of human activities that occur around our coast. In response to this need, the Scottish Government and Scottish Natural Heritage commissioned a research project to determine the distribution, abundance and population structure of bottlenose dolphins around the Scottish coast (Figure 1.1), with the purpose of answering conservation policy questions. This collaborative project has been carried out by the University of St Andrews’ Sea Mammal Research Unit (SMRU), the Scottish Association for Marine Science (SAMS), the Hebridean Whale and Dolphin Trust (HWDT) and the University of Aberdeen’s Lighthouse Field Station (AULFS), with additional support from a wide range of individuals and bodies. The objectives of the project were to: 1. Review historic records from scientific surveys, wildlife tour operators and other voluntary sources, to provide information on the distribution of sightings of bottlenose dolphins around the entire Scottish coast. 2. Develop, and train, a voluntary reporting network that will allow the project to target focussed research surveys around Scotland’s remoter coasts and build capacity for future photo-identification research in these areas. 3. Determine the distribution and abundance of bottlenose dolphins in Scottish coastal waters, using ongoing photo-identification studies in the SAC and east coast, and boat-based photo-identification surveys of dolphin groups in western and northern coastal waters. 4. Provide estimates of abundance and movement rates between different sampling areas using multi-site mark-recapture analyses. 5. Determine the potential for molecular analysis of DNA from stranded bottlenose dolphins that will complement photo-identification studies and assess relationships between dolphins using the SAC and those found along other Scottish coasts. 6. Identify winter feeding areas used by the bottlenose dolphin population that uses the Moray Firth SAC.
2
This report outlines the work carried out to address each of these objectives and presents the overall conclusions and recommendation from the study in the final section.
Figure 1.1. Map of Scotland showing the key locations mentioned in the report.
3
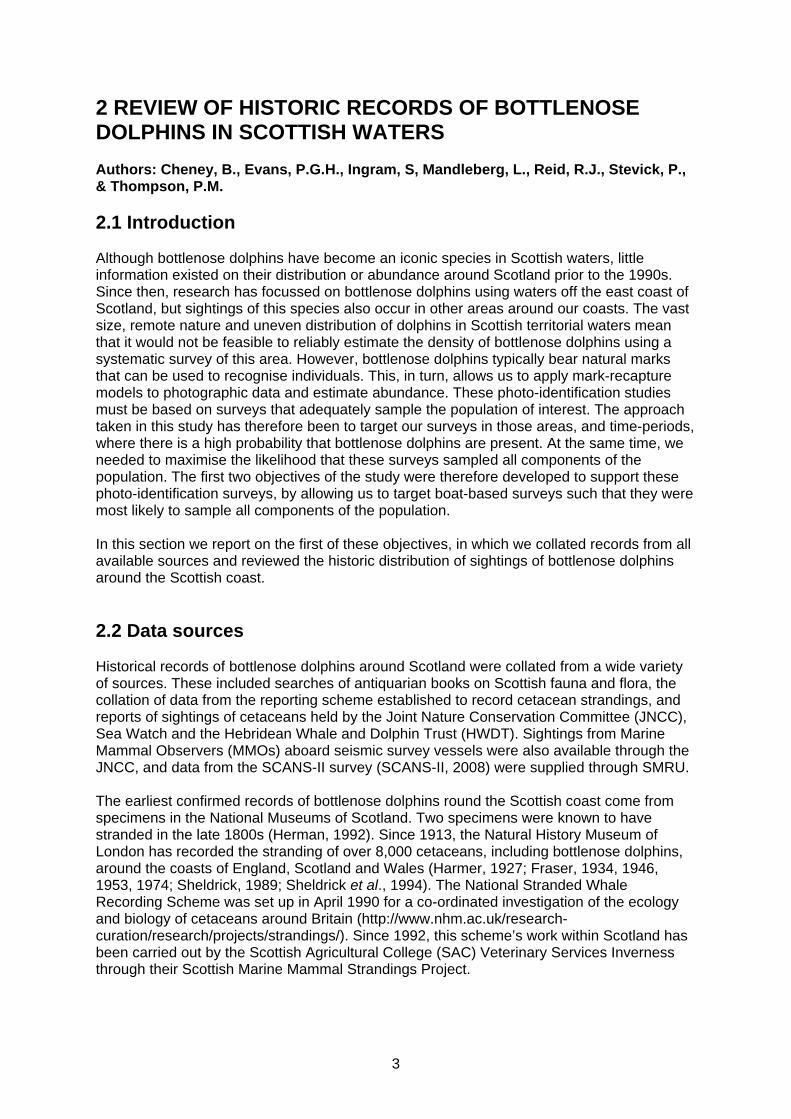
2 REVIEW OF HISTORIC RECORDS OF BOTTLENOSE DOLPHINS IN SCOTTISH WATERS Authors: Cheney, B., Evans, P.G.H., Ingram, S, Mandleberg, L., Reid, R.J., Stevick, P., & Thompson, P.M.
2.1 Introduction Although bottlenose dolphins have become an iconic species in Scottish waters, little information existed on their distribution or abundance around Scotland prior to the 1990s. Since then, research has focussed on bottlenose dolphins using waters off the east coast of Scotland, but sightings of this species also occur in other areas around our coasts. The vast size, remote nature and uneven distribution of dolphins in Scottish territorial waters mean that it would not be feasible to reliably estimate the density of bottlenose dolphins using a systematic survey of this area. However, bottlenose dolphins typically bear natural marks that can be used to recognise individuals. This, in turn, allows us to apply mark-recapture models to photographic data and estimate abundance. These photo-identification studies must be based on surveys that adequately sample the population of interest. The approach taken in this study has therefore been to target our surveys in those areas, and time-periods, where there is a high probability that bottlenose dolphins are present. At the same time, we needed to maximise the likelihood that these surveys sampled all components of the population. The first two objectives of the study were therefore developed to support these photo-identification surveys, by allowing us to target boat-based surveys such that they were most likely to sample all components of the population. In this section we report on the first of these objectives, in which we collated records from all available sources and reviewed the historic distribution of sightings of bottlenose dolphins around the Scottish coast.
2.2 Data sources Historical records of bottlenose dolphins around Scotland were collated from a wide variety of sources. These included searches of antiquarian books on Scottish fauna and flora, the collation of data from the reporting scheme established to record cetacean strandings, and reports of sightings of cetaceans held by the Joint Nature Conservation Committee (JNCC), Sea Watch and the Hebridean Whale and Dolphin Trust (HWDT). Sightings from Marine Mammal Observers (MMOs) aboard seismic survey vessels were also available through the JNCC, and data from the SCANS-II survey (SCANS-II, 2008) were supplied through SMRU. The earliest confirmed records of bottlenose dolphins round the Scottish coast come from specimens in the National Museums of Scotland. Two specimens were known to have stranded in the late 1800s (Herman, 1992). Since 1913, the Natural History Museum of London has recorded the stranding of over 8,000 cetaceans, including bottlenose dolphins, around the coasts of England, Scotland and Wales (Harmer, 1927; Fraser, 1934, 1946, 1953, 1974; Sheldrick, 1989; Sheldrick et al., 1994). The National Stranded Whale Recording Scheme was set up in April 1990 for a co-ordinated investigation of the ecology and biology of cetaceans around Britain (http://www.nhm.ac.uk/research-curation/research/projects/strandings/). Since 1992, this scheme’s work within Scotland has been carried out by the Scottish Agricultural College (SAC) Veterinary Services Inverness through their Scottish Marine Mammal Strandings Project.

4
JNCC have integrated data from three main sources to produce an atlas of cetacean distribution (Reid et al., 2003). Firstly, this draws upon the European Seabirds at Sea (ESAS) database which contains 13,000 year round cetacean records collected by JNCC and sister organisations in other European countries (Reid et al., 2003). ESAS surveys were carried out on ships of opportunity, using standard line transect methodology. Although designed for the detection of seabirds, they also collected information on cetaceans at approximately 10 minute intervals. Further details on the methods used are presented in Reid et al. (2003). A limited number of aerial surveys were also carried out as part of these studies, and all cetacean sightings were recorded (for methods see Pollock et al., 2000). Secondly, the JNCC atlas also draws upon effort-based data collected by the Sea Watch Foundation (see below). The majority of these data are from the late 1980s onwards, as most sightings in their database were opportunistic prior to this. Finally, the JNCC atlas uses data from the Small Cetacean Abundance in the North Sea (SCANS) surveys (Hammond et al., 2002). These line-transect surveys were conducted in June and July 1994, over a 20,000km area that included the North Sea, Skagerrak and Kattegat, the Western Baltic, English Channel and Celtic Sea (Hammond et al., 2002). To create each of the distribution maps in the JNCC atlas, all data from 1979 to 1997 were converted to a common format and only sightings which were related to effort were included (Reid et al., 2003). The Sea Watch Foundation (formerly the UK Mammal Society Cetacean Group) was founded in 1991 and has been collecting marine mammal sightings in UK and Irish waters, from their network of over 2000 observers (http://www.seawatchfoundation.org.uk/). From the 1960s to the late 1980s most of these sightings were opportunistic. Since then the majority of sightings have been effort based. Sea Watch members have conducted land-based watches at a number of different sites in periods of one to three hours, in a variety of intervals (daily, weekly, monthly). These have mainly been carried out between April and September but some sites have also been surveyed in the winter. Offshore watches have also been made from a variety of platforms of opportunity (e.g. research vessels, whale watching boats, seismic boats, fishery protection vessels, etc.) (Reid et al., 2003). All sightings were entered into the Sea Watch National Database, which currently has over 60,000 records (http://www.seawatchfoundation.org.uk/). The Hebridean Whale and Dolphin Trust (HWDT) have been collecting bottlenose dolphin sightings from members of the public since 1989. In the early years, effort concentrated on the Mull coast, but in 1997 the HWDT launched a co-ordinated programme of cetacean sightings throughout the Hebrides, involving a network of observers (Jeewoonarain et al., 1999). The network expanded in 2001 with the creation of the Hebridean Bottlenose Dolphin Project (HBDP), set up in part to collect and collate sightings and photo-identification data from members of the public and local marine users. Finally, in 2004 a dedicated fieldworker was employed to travel around the Hebrides informing locals of the project and encouraging them to report sightings. The HWDT sightings database includes casual sightings data that were collected from a number of different sources. Incidental sightings were encouraged from the general public and from a variety of marine operators including fishermen, fish farmers, coastguards, ferry personnel, local wildlife ecotourism operators and birdwatchers. Contributors were encouraged to use standard forms which recorded information relating to each sighting including location, date and time, species, group size and direction of travel. The recorders were also asked to give a score of the confidence of their species identification to allow post hoc sorting according to data quality. Sightings forms, posted to the HWDT office usually at the end of each summer season, were entered onto a central database (Mandleberg, 2006). In 2005, the SCANS-II survey was a carried out to repeat and extend the SCANS survey conducted in 1994. This survey provided coverage of more offshore areas around Scotland. Additional data on offshore sightings were available from JNCC through the Marine Mammal
5
Observer (MMO) programme that has been conducted since 1997 during seismic operations (Stone, 2003).
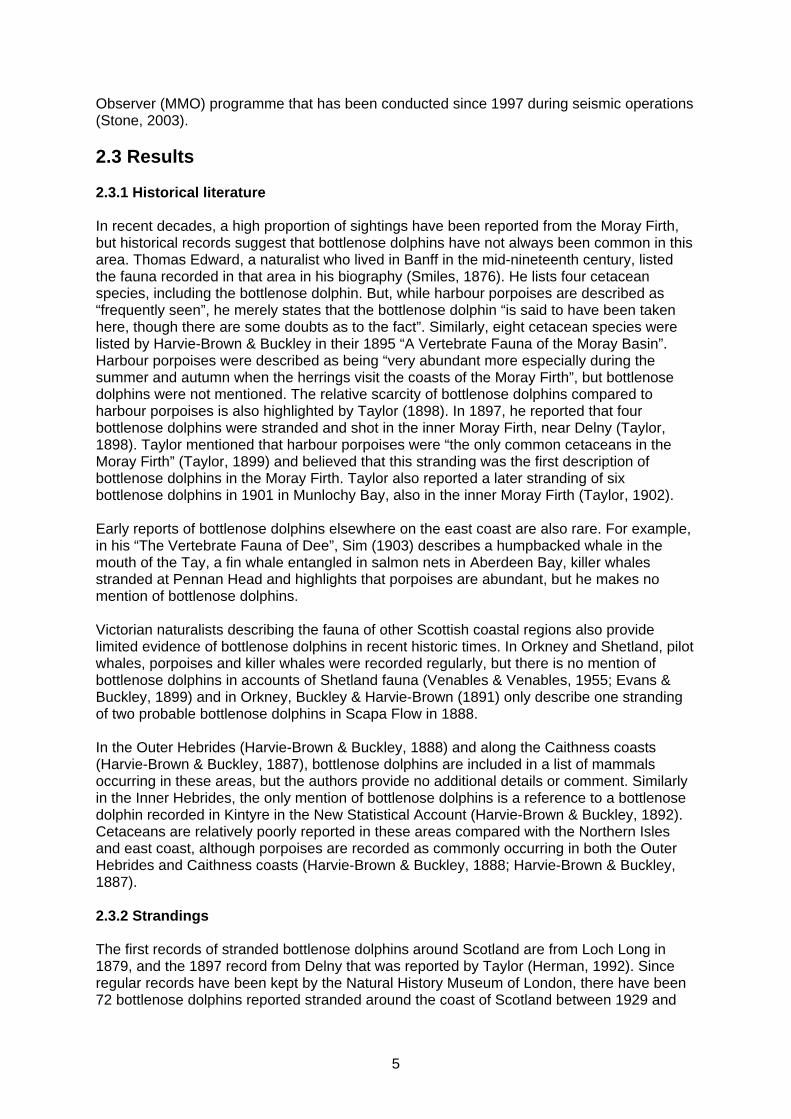
2.3 Results 2.3.1 Historical literature In recent decades, a high proportion of sightings have been reported from the Moray Firth, but historical records suggest that bottlenose dolphins have not always been common in this area. Thomas Edward, a naturalist who lived in Banff in the mid-nineteenth century, listed the fauna recorded in that area in his biography (Smiles, 1876). He lists four cetacean species, including the bottlenose dolphin. But, while harbour porpoises are described as “frequently seen”, he merely states that the bottlenose dolphin “is said to have been taken here, though there are some doubts as to the fact”. Similarly, eight cetacean species were listed by Harvie-Brown & Buckley in their 1895 “A Vertebrate Fauna of the Moray Basin”. Harbour porpoises were described as being “very abundant more especially during the summer and autumn when the herrings visit the coasts of the Moray Firth”, but bottlenose dolphins were not mentioned. The relative scarcity of bottlenose dolphins compared to harbour porpoises is also highlighted by Taylor (1898). In 1897, he reported that four bottlenose dolphins were stranded and shot in the inner Moray Firth, near Delny (Taylor, 1898). Taylor mentioned that harbour porpoises were “the only common cetaceans in the Moray Firth” (Taylor, 1899) and believed that this stranding was the first description of bottlenose dolphins in the Moray Firth. Taylor also reported a later stranding of six bottlenose dolphins in 1901 in Munlochy Bay, also in the inner Moray Firth (Taylor, 1902). Early reports of bottlenose dolphins elsewhere on the east coast are also rare. For example, in his “The Vertebrate Fauna of Dee”, Sim (1903) describes a humpbacked whale in the mouth of the Tay, a fin whale entangled in salmon nets in Aberdeen Bay, killer whales stranded at Pennan Head and highlights that porpoises are abundant, but he makes no mention of bottlenose dolphins. Victorian naturalists describing the fauna of other Scottish coastal regions also provide limited evidence of bottlenose dolphins in recent historic times. In Orkney and Shetland, pilot whales, porpoises and killer whales were recorded regularly, but there is no mention of bottlenose dolphins in accounts of Shetland fauna (Venables & Venables, 1955; Evans & Buckley, 1899) and in Orkney, Buckley & Harvie-Brown (1891) only describe one stranding of two probable bottlenose dolphins in Scapa Flow in 1888. In the Outer Hebrides (Harvie-Brown & Buckley, 1888) and along the Caithness coasts (Harvie-Brown & Buckley, 1887), bottlenose dolphins are included in a list of mammals occurring in these areas, but the authors provide no additional details or comment. Similarly in the Inner Hebrides, the only mention of bottlenose dolphins is a reference to a bottlenose dolphin recorded in Kintyre in the New Statistical Account (Harvie-Brown & Buckley, 1892). Cetaceans are relatively poorly reported in these areas compared with the Northern Isles and east coast, although porpoises are recorded as commonly occurring in both the Outer Hebrides and Caithness coasts (Harvie-Brown & Buckley, 1888; Harvie-Brown & Buckley, 1887). 2.3.2 Strandings The first records of stranded bottlenose dolphins around Scotland are from Loch Long in 1879, and the 1897 record from Delny that was reported by Taylor (Herman, 1992). Since regular records have been kept by the Natural History Museum of London, there have been 72 bottlenose dolphins reported stranded around the coast of Scotland between 1929 and

6
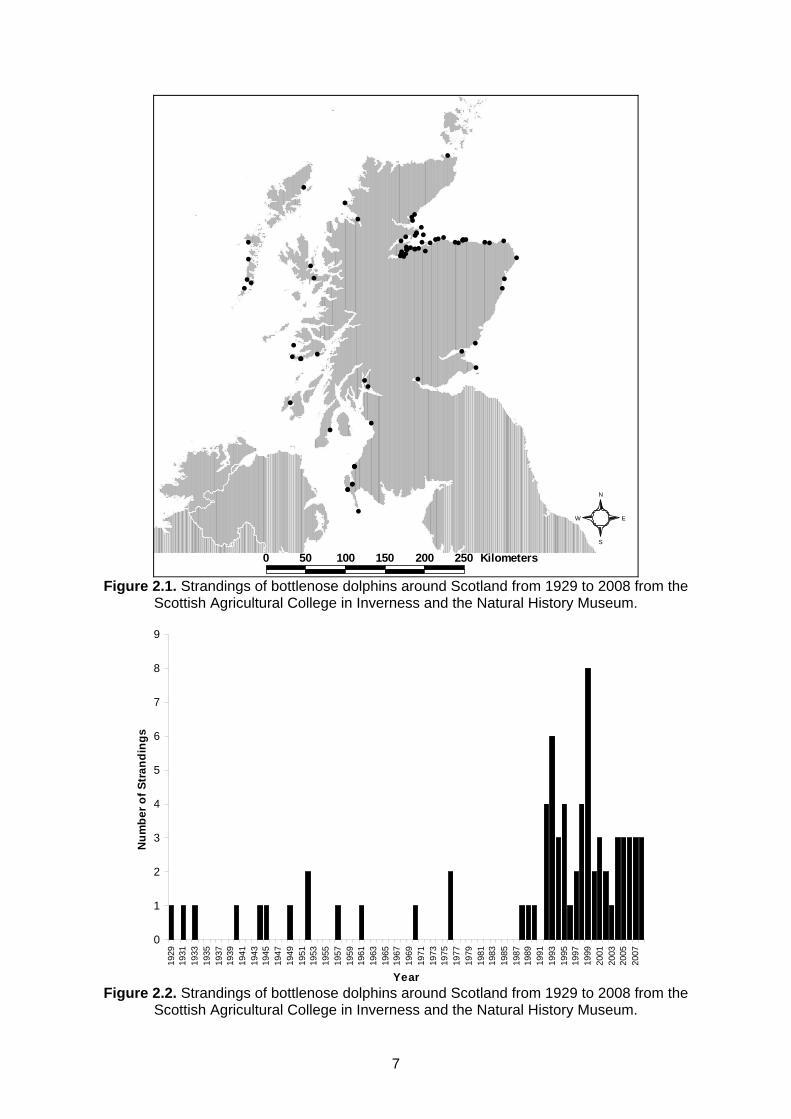
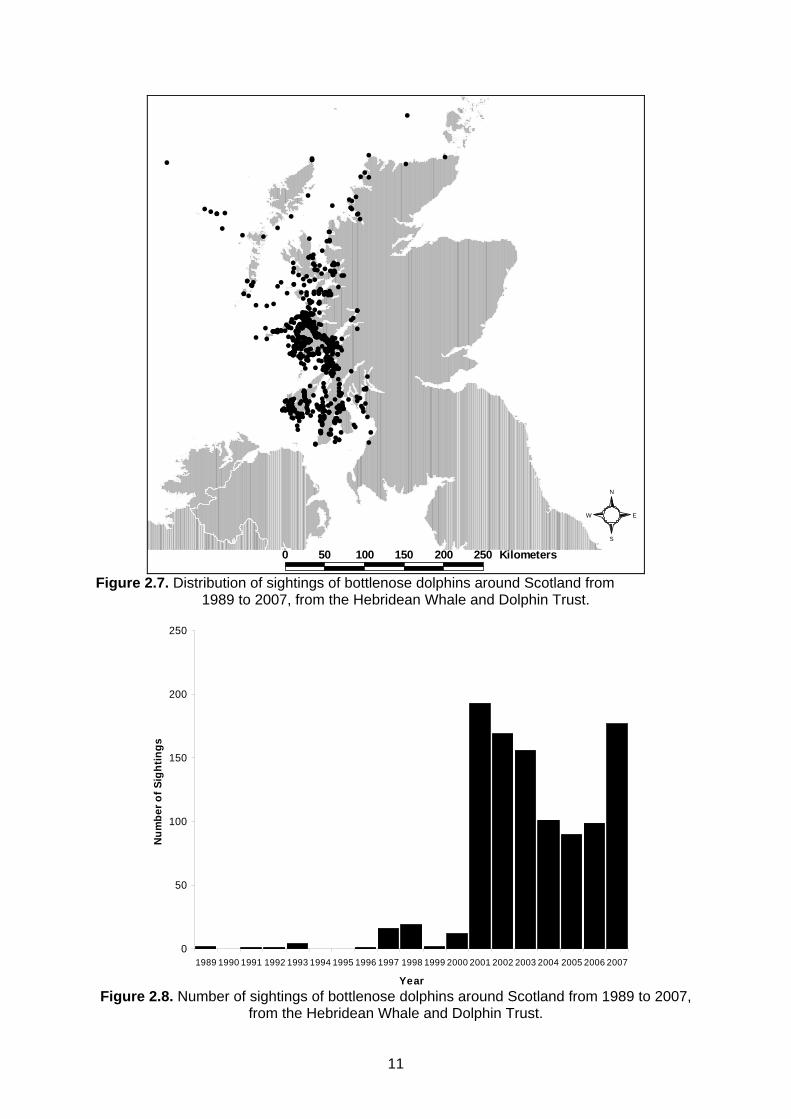
2008 (Figure 2.1). Most of these animals were reported in the Moray Firth and the Hebrides, and the majority of these (78%) were in the 1990s and 2000s. Only 16 strandings of bottlenose dolphins were recorded between 1929 and 1989 (Figure 2.2). Stranded bottlenose dolphins were found throughout the year although most were found in July and August. Of all strandings, 38% were male and 30% were female, with the sex of the remainder unidentified. 2.3.3 Sightings The JNCC cetacean atlas shows the distribution of bottlenose dolphins in north west Europe from 1979 to 1997. In Scotland, the largest numbers have been seen in the north-east, specifically around the Moray Firth (Figure 2.3). However, there are also sightings on the west coast (especially the Outer Hebrides) and south of Shetland. Three sightings of bottlenose dolphins were recorded in Scottish waters during SCANS-II. One of these was in the Firth of Forth, the second was 20 miles west of the Outer Hebrides, and the third was over 100 miles east of Shetland (Figure 2.4). Marine Mammal Observers have also observed bottlenose dolphins in more offshore waters to both the west and east of Scotland during seismic operations (Figure 2.4). The Sea Watch Foundation provided 9,856 sightings of bottlenose dolphins around the Scottish coast from July 1966 to September 2007 (Figure 2.5). Group sizes ranged from 1 to 150 dolphins (the latter being seen north of Portpatrick, Dumfries and Galloway in 1997) with an average group size of 8, and median of 6. However, nearly 94% of groups consisted of 20 or fewer animals and nearly half the groups contained a maximum of five individuals. The highest number of sightings, 1043, were reported in 1992, with other peaks of approximately 800 sightings in 1991, 1993, 2001, 2002 and 2006 (Figure 2.6). Sightings were reported in every month although the majority, 77%, were between April and September and the fewest sightings, 228 (2%), were in December. There were 1043 sightings of bottlenose dolphins around the coast of Scotland reported to the HWDT sightings network between 1989 and 2007, with the majority of sightings around the Inner Hebrides (Figure 2.7). Group sizes ranged from 1 to 40 dolphins, with nearly half the groups having five or fewer individuals and the majority of groups, 91%, consisting of 15 or fewer individuals. The average group size was 7, with a median of 6. The peak of sightings was in 2001, with 193 sightings reported, but there were also over 100 sightings in 2002 to 2004 and 2007 (Figure 2.8). Sightings were reported every month but most sightings were during the summer, May to August, and the fewest sightings were in December.
7
#
#
#
#
#
#
#
#
#
##
#
#
#
#
#
#
###
#
# ##
#
#
##
#
#
## ##
##
#
#
##
#
#
#
#
#
#
#
#
# #
#
#
#
#
#
#
#
#
#
#
#
#
#
#
#
#
#
#
#
#
#
#
#
#
0 50 100 150 200 250 Kilometers
S
N
EW
Figure 2.1. Strandings of bottlenose dolphins around Scotland from 1929 to 2008 from the
Scottish Agricultural College in Inverness and the Natural History Museum.
0
1
2
3
4
5
6
7
8
9
1929
1931
1933
1935
1937
1939
1941
1943
1945
1947
1949
1951
1953
1955
1957
1959
1961
1963
1965
1967
1969
1971
1973
1975
1977
1979
1981
1983
1985
1987
1989
1991
1993
1995
1997
1999
2001
2003
2005
2007
Year
Nu
mb
er
of
Str
an
din
gs
Figure 2.2. Strandings of bottlenose dolphins around Scotland from 1929 to 2008 from the
Scottish Agricultural College in Inverness and the Natural History Museum.

8
Figure 2.3. North-west Europe bottlenose dolphin distribution from the JNCC Cetacean Atlas. The map depicts grid cells (1/4 ICES rectangle) that are shaded, the greater the survey
effort in the cell the darker the shading. Red dots indicate the relative sighting rate (Reproduced from Reid et al., 2003).

9
#
#
#
$
$$$
$
$
$
$$
$
$
$
$ $$
$
$$
$
$
$
$
$
$
$
$$ $ $$ $
$
$$
$
$
$$
$
$
$
$
$
$
$
$
$
$
$$
$
$
$
$
$
$
0 80 160 240 320 400 Kilometers
S
N
EW
Figure 2.4. Sightings of bottlenose dolphins recorded during SCANS-II in 2005 (circles) and
during seismic surveys conducted between 1994 and 2006 (triangles).

10
#
##
#
##
##
#
#
#
#
#
##
#
#
###
#
#
#
##
####
#
##
###
##
# #### ##### ##
##
## ##### ###
#
# ###
#
###
#
#
#
###############################
#
#############################
#
##############################
##
############################################################################################################ #####
##
##
######
##
#### ##
####################
#
###########
##########
#################
#######
#
########################################
#########
#
##
##############
#
##
#
#
#
###############
#
##
#
#
##
##
##
##############
############
#
#####
#####################################
#
#
##
#
#
###
#
##
##
#
##
#####
#
####
#
#
#
##
##
###
###
#
####
#####
##
#
##
#
#
##
###
#
##
#
##
##########
#
#######
##
#
###
###
#
##############
#
#######
#
####
#
##
################
###
#
#
##
##
#
#####
##
##
#
######
#
####
#
####
##
##
##
#
##
#
#
######
#
#
#
###
###
##
#
###
##
#
#
#
##
##
#
#
#
#
##
###
#
###
##
####
#
###
##
#
##
#
###
###
#
##
#####
##
#
#########
#
#
#
#####
#
###
#
## #####
#
###
#
######
#
# #####
#
# #####
#
######
#
##
#####
##
#
#
#####
#
######
############################## #
#
##
#
###### ##
###
####
##
##
#
##
# ###
###
##
##### #### #######
#
#####
##
# #
#
############# #### ## #
##
#
###
#
###
#
#
#
#######################
#
#########
############
##
###
#
##
##
#############
###
#
############# ##
#########################
#
###############
######
#
##
###
#####
##
#######
##
#
####################
#
##
## #
###
## #
####
###### ###
##############
####
###
# ######
#############
##
######
####
####################
######
#
#
#
##
##
#
###
##############
#
#
#
#
# ##
#################################
# ## #########
##
######## ###### ########### #####
############
## ###### #
#
#
##
#####
##########
# # ##### ######
#
#
##
##
##
################
###
####
###
##
#######
##################
#
####
## #
########
#####
###
#
# ######
##########
##### ####
#######
#
###
#
#
###
##
#
#
##########
#########
#
#
#
##########################
#
#
##########################
##########
################
#
##########
#
########
###############
#####
########
########
#################
#
##
###
#############
##
#
######
#####
##
################
######### ### ##
###
###
################# ###########
#
#####
### ##
#################
########## #####
##########################
#################
#
#####
###
#
###########
####################### ##
### ##
############
###
################ #
#
##################### ###############
#####################
############
##
###
## #################################
#
#
# ########## ##################################
####################### #################### #######################
########
######### #############
##########
#### #### ###############
##################
######## ###########
#
#######################
###########################################
#########################
#
####################
#############
##########
################# ############ #######
################
##############
# ############## ################ ##############
#############
##
#
#########
#######
############ ########### ###
################
####################################
##
###
######
#####
##### ######
###
#######
#####
#
#
#### ###
#
#
########
###
##
#####
#
#
#
############
###### #
##################
###
#
# #
##########
#
#####
########################
#####
############################# ###
###############
###########
######
##########
###########
#
####
######
################################
#################
######
##
###
#
#
#############################
#
#### ##
#
# ####
##
# ###
###########################################
#
## ###
#############
###
##
#################
##################
######
#####################
#
###########################
# #####
###########
#####################
## ######### ######### ##################### ####
########################
###### ############ ####
#########
## #######################
################
#
###############
################
###################
###
########################
# ###
#
#####
#
#############
######
#########
##
#####
####
####
#
#
###
############
#
##
#
#
#
####
###########
##
#
#
######## ##
#
##
##
###
#
#######
####
##
#
#
#######
############
#
##############
#
##########
##
#########
#
##############
#
###
# ####
#
########
#
##
#
###
#
## ####
#
#########
#
## ##
#
# #####
#
## ########
#
#####
#
########
##
########
##
###
######
##########################
##
###
#
######
#
####################################### ########
#
#####
#
##########################
#
###################################################
#
#########
#
######
#
###############
#
#########################################
##
##
####
#########
#
# #######
##
##########
#
#####
# #
##############
#
#####
##
#
#
####
#
#######
#
#######
##
#####
#
#
#
#
##
##
#
#
##
####
###
#
### ###
###
##########
# ###
###
###
#########
#
# #####
##
#
###
######
#
#
#
#### ##################### #
#####
##
#
#########
#### #### ####### #
## ##### ### ## ############# ## #
##
# ##### ############### ######### #### #### ######## #### #
#
####
#
### ########
#
#######
# ######## ###### ########## #######################
# ########### #####
###
#
####
######## ### ###### ####
#
######### ###### ###################### ###################### ######## ## #########
#
## ########## #####
## ##### ##### #######
###############################
#
# ###
########
# #
#
# ##
#####
###
#####
#####
####
####
#
#
# #### ####
#
#
#
##### ######
#
###### ######### ### ### ####### ## ##### ### ######### ########
#### #### ### ## ### ########## ####### #### ### ##### ############ #####
#
# ##
###
## ####### #
#
############ ########## ############### ##
#
### ###### ## ################
######
####################################### ################
#
### ###
##### ###########
###
#### ###### ### ### ######### ######
##
##
#
#### #########
####
### ####### ### ###### ### ###
########### #####
#
## #
####
######## #
#
#######
###
#
#
#
##
######
#
#
##
####
#
#####
###
#
#
##
#
#
#
#
#
#
#
# ##
######
##
#
#
#####
#
####
#
#
#
#
##
###
# ###
#
#####
#
#
###############
##
######
#
##
###########
##
#
###
##
##
#
#
##
#####
#
####
###
##
## ### ############ ##### ####### #### ####
######
###### #
#
##
##
##
###
##
####
###
####
##
###
#
##
#
##
# #
#
################# #
#
### #
## ############
#
#
#####
#
####
#
### #### #### ## # ## #####
### ### ### ## ### ### #####
#
#
#
#
# ### #####
#
##
###
##
#
###########
#
##################
#
##
#
#
#
########
##
#
## ##
#
##
#
#
#
#
###
##########
# ## #########
#######
#########
#
#
##
#
#
#
#
#
######
#
#
##
#####
#
#
#
#
##
##############
#
#
########
##
#
##########################
#
#
#
#####################################################
#
###
#
######################
###
###
##
#
##
###
#
#######
##
#
#
####
#
###
#
#
#
#####
#
##
#
#
#
#
#
#
#
#
#
#
#
##
#
#
##
#
##
###
###
##
#
#
####
#
#
#
#
#
#
#
### ###
##
###
#
#
######
#
##
##
##
####
# ##
#
#
###
#
##
##
###
#
##
##
####
#
#
#
##
### #
#
##
##
#
###########
#
########
#
##
#
#
##
#######################
##
####
##
#
#
####
#
####
##
#
####
##
#################
#
#
#
############
#
##
##########
#
#####
#
############
###
#
##########
##
#
#
#
##
#
####
#
#
###
#
#
#
#
#
#
#
#
#######
#
#####
#
##
#
#
#
##
#
###
#
#
#
#
#####
#
#
#
#
##
#
##
#
# #####
##
#
#
##
###
####
##
#
#
#
##
# #
#
#
#
########
# ####
#
#
####
#### ###
#
######
#
# ###
#
###
#
#
#
##
#
##
#
#
#
## #
#
#
#
#
###
#
#
#
## #
#
#
#
#
#
#####
#
#
#
#
#
#
####
#
#
#
###
#
#####
#
#
#
#
##
#
#
#
#
###
#
####
#
#
#
#
# #
##
##
############
##
###
#
##
#
#
#
#
#
#
#
#####
###
##
##
#
#
#
# ###
##
###
# #
#
####
#
##
##
#
#
##
##
# #
#
#
#
##
##
####
#
#
##
#
#
#
#
#
#
#####
#
###
#
##
#
##
####
#
###
###
##
###
#
##
###
##### #
###
##
#
#
## ###
##
##
#
# ##
##
#
##
#
#
#
###
##
##
#
####
##
###
#
#
#
#
#
#
# #
##
##
#
###
##
#
##
#
#
#
####
###
########
#
######
## ###
#
# ####
###########
#
#
###
## ##
###
## # ##
#############
#
#
# #
##
#
#
#
#
#
#
#
## ###
#
######
#
#
#
#
##
###
##
#
#####
#
#
##
#
#####
#
#######
#
####
#
#
#
##
#########
#
######
###
#
##
###
#
####
##
##############
#
####
##########
#
#########
###
#
###
###
############
#
##
##
##
###
############
#
#
################################
##
###########################
##
#########
#
###
#
#####
####
#
#
#
#
#####
#
####
#
######
#
########
#
#########
#
#
#
############
####
#
#
###
#
#####
#####
###
#
#
##
#
#
#
#
#
##
##
#
########
#
#
##
#
#
#
##
#
###
###
#
######
#
#
#
###########
#
###
##
##
###
#
####
###
#
#
####
#
#
#
#########
#
#
##
##
#
#
#######
#
####
# ##
#
#
##
####
##############
####
##
####
####
#######
### #
#
###
###
#
#
#
#
#
#####
#
#
#
#######
##
#
####
####
#
# ### #
#
###
##
#############
##
#
##
#
##
#
#
#
###
##########
###
##
##
######
###
#
#
##
##
#
##### #
#
##
#
#
### #
#
#
#
###
#
#
###
####
#
#
##
#
#
#
#
#
#######
# ###
##
##
#
#
#
###
#
###
#
##
# ###
####
#########
####
#
#
#
#
###
###
#
#
#
#
#
#
##
##
#
#
#
###
#
#
################
##
###############
#
#
#
#
## ###
#
##
#
#
#
#
#
##
#
#
######
##
#
#
#
#
#
########
#
####
##
#
######
#
#########
# # #
#
#
#
#
#
#
#
#
#
#
#
##
#
#
#
#### ##
#
#
#
# #
###
#
#
#
#
#
#
#
#
#
#
##
#
#
#
######
#
#
##
#
##
#
#
#
#
#
#
##
#
######### #
#
#
#
##
#
####
##
######
#
###############
#
#
##
###
####
#
#########
#
#
#
#####
#
#
#
#######
#
###
#
#
#
##
#
######
####
######################
#
###############
#
#
#
##
#####
#
#
#
#
#########
###
##
#
###
#
#
###
#
#
#
##
#
#
##
#
###
#
## ###
#
##
##
#####
##
##
#
#
#
#
##
####
#
#
##
#
#
#
#
#
#
##
#
##
#
#
#
# #
##
#
#
#
#
#
#
##
#
#
###
#
#
#
#
##
#
#
#
#
#
#
#
##
#
#
#
#
#
#
#
#
#
#
#
##
#
###
##
#
##
#
#
#
#
#
#
#
#
#
#
#
#
##
#
#
##
#
##
#
########
##
#
# #
#
#
#
##
# #
#
#
#### ##
##
#
#
#
#
#
############
# #
########
#
###
#
###
#
############
###
##
#
#
#
##
#
#
#############
#
####
#
#
#
#
#
#
###
######
#
#
#
#
#
#
#
#######
#
##
#
#####
#
#
# ##########
#
#
####
#
####
########
##
#
#
##
##
#
#
###
###
##### #
#### ########### ###### ### #
#
#
#
#
# ####
############
###
#
##
######### #
### ###
##
## # ###
#####
#
##
#
#
###
###
#
# ### #
#
#
#
# ### ##
#####
# #
#
######
###
#
#######
#
#########################################################################################
#
#
#
#####################
####
##
#
################
#
#
#
#
#
#
#
#
#
###
###
##
##
#
###
#
#
##
###
############
#
###
##
###########
# #
#
##
#####
############
#
#
#
#
###
#
#
##
#
#
#
########
# #
#
###
#
###
#
#
#
#
###
####
#
#
#
#
#
#
#
#######
#####
###
#
##
#
##
#
#
#
#### ###
#######
#
#
####
###
####
#
#
#######
#######
##
##
###
##
#
#
# ##
##
#
##
###
#
# #####
####
#
#
#
#
########
####
#
###
######################################
#
###########
#
####
##################
####
###################
#
##
######
#
##
###################################
#
##
##
##
##
#
#
#
##########
###
##
##################
##
#########
##
#######
#
#
##
########
##
###########
#
##
#######################
#
###
#
#########
##
##########
#
##
##
#
###############
##
##
##########
####
######
##
####
#
####
##
#
#
##
##
####
######
#
#####
##
#
##############
#
#
###
#
########
#
#
##
#
#####
##
#
#########
#
#
#
#########
#
###
####
###
#
#
#
#
######
######
###################### ###############################
#
###
##
#
#
#
##
###
#########
###
##
#######
###
####
#
##
#
###################
#
####
#
##
##
###
##
####
#
#######
##
##
#
######
##
######################
##
####
##
##
##
####
##
#
##
#
##
#########
##
#
#
#
##
##########
#
#####
##
#
#####
##
#############
#####
##
#################
##
########
##########
###
#######
#
#
#
#
############
##
############################
####
####
##
#
###
###
#
#
############
##
##
##
####
#
######
###
#
#
#
#####
#
###
#
####
#
#
####
#
##
###
#
#
####
###
#########
##
##
#
################
#################
#
#
#
######
###
###################
######
######
##
#
###
#
#####
#
#
#############################
##
##############
####
#
#
#
#
#
#
####
#
#
#
#####################
###
#
#
#
#
#
##
####
#
#
##
##
#
#
#
############################
#
#######################
#
##########
#######
#
###
##
#
#
#
#####
#####
##
#####
##
#
###
#
#
#
#
##
#
#
#
##
##
#
####
##
###
#
# #
##
#
#
#
#
##
#
#
#
######
#
# #
# ##
#
#
##
##
#
#
#
##
##
#
#
#
##
#
##
##
#
#
#
#
#
#########
##
#
#
#
#
#
#
##
#
#
#
######
#######
#
#
#
###
#
##
##
#####
##
##
##
##
####
# ###
#
#
#
###
##
#
0 50 100 150 200 250 Kilometers
S
N
EW
Figure 2.5. Distribution of sightings of bottlenose dolphins around Scotland from 1966 to
2007, from the Sea Watch Foundation.
0
200
400
600
800
1000
1200
1966
1968
1970
1972
1974
1976
1978
1980
1982
1984
1986
1988
1990
1992
1994
1996
1998
2000
2002
2004
2006
Year
Nu
mb
er o
f S
igh
tin
gs
Figure 2.6. Number of sightings of bottlenose dolphins around Scotland from 1966 to 2007,
from the Sea Watch Foundation.
11
##
#
#
##
#
#
#
#
#
####
#
###
#
#
#
#
#
##
#
#
#
#
##
###
#
#
#
###
#
#
#
#
#
##
####
#
#
#
#
#
#
#######
#
#
#
#
#
##
###
##
#
#
#
#
#
#
#
#
#
#
#
#
#
# #
##
#
#
##
##
#
#
##
##
###
#
#
#
#
#
######
# ##
#
#
#
## #
#
##
##
###
#
####
#
##
##
############
##
###
#
##
##
#
#####
#
##
#
###
#
####
###
## #
# #
#
##
#
#
#
#
#
#####
#
#########
#
##
#
#
##
#
#
#
#
#
######
#
#
#
#
#####
##
#
##
#####
#
#
#
##
##
###
#########
###
####
##
#
#
#
#
#
#
#
##
#
##
#
#
# ##
#
###
#
##
#
#
#
##
#
#
#
#
#
#
#
#
#
#
#
#
#
#
###
#
#
# ##
#
#
#
#
#
#
#
##
#
#
#
##
#
# #
#####
#
#
#
#
#
#
##
#
##
####
#
####
##
##
##
#
#
#
#
#
#
##
######### #
#
###
###
#
######
#
######################
#
#
##
#
#
#
###
#
#
#
##
#
#
## ###
#
##
#
#
#
#####
#
##
##
#
# ##
####
#
#
##
#
###
##
#
#
##
#
#
#
#
#
#
#
#
##
#
##
##
#
#
#
##
#
#
#
#
#######
#
#
#
#
#
#
##
#
###
#
#
#
#
#
#
##
#
#
##
#
##
#
#
#
##
####
#
## #
#
#
#
#
##
#
#
#
#
#
#
####
#
#
#
##
#
#
##
#
##
#
#
#
##
#
#
#
#
#
#
#
#
#
#
#
#
#
## ###
#
##
#
#
#
###
#
# #
#
#
#
#
#
#
#
#
#
##
#
#
#
#
##
#
#
##
#
#
#
#
##
##
#
###
#
##
##
#
#
##
###
#
#
#
# #
#
#
#####
#
#
#
#
#
#
#
# #
#
#
#
#
#
#
#
#
#
#
#
#
#
#
#
#
#
#
#
# #
#
#
#
#
#
#
#
##
#
#
#
#
#
##
##
#
#
#
#####
##
#
##
#
#
#
#
# #
#
#
# ##
##
#
#
#
#
##
##
#
#
#
#
#
#
#
##
#
#
#
#
#
#
#
##
#
#
#
#
#
#
#
##
#
##
#
#
#
#
#
##
#
#
#
#
#
#
#
#
##
#
#
#
#
##
## #
#
#
#
#
#
#
#
#
#
#
#
#
#
# #
#
##
#
#
###
#
#
#
#
#
#
#
#
#
#
#
####
#
#
#
##
#
#
#
#
###
#
##
#
###
#
#
#
#
#
##
#
#
#
#
#
##
##
#
##
#
#
#
#
#
#
#
##
#
#
#
#
#
##
#
###
##
## ###
#
##
### #
###
#
#
#
#
#
#
#
#
##
#
# #
#
#
#
#
#
##
#
###
#
#
#
#
#
#
#
#
##
##
#
#
# ####
#
#
#
# #
#
#
#
#
#
#
#
#
#
##
#
##
#
#
#
#
##
#
#
##
#
#
#
#
#
#
#
#
##
#
### ##
#
#
#
#
0 50 100 150 200 250 Kilometers
S
N
EW
Figure 2.7. Distribution of sightings of bottlenose dolphins around Scotland from
1989 to 2007, from the Hebridean Whale and Dolphin Trust.
0
50
100
150
200
250
1989 1990 1991 1992 1993 1994 1995 1996 1997 1998 1999 2000 2001 2002 2003 2004 2005 2006 2007
Year
Nu
mb
er
of
Sig
hti
ng
s
Figure 2.8. Number of sightings of bottlenose dolphins around Scotland from 1989 to 2007,
from the Hebridean Whale and Dolphin Trust.

12
2.4 Discussion Historic and contemporary sightings from naturalists and members of the public can provide a useful indication of the broad scale distribution of bottlenose dolphins around the Scottish coast. However, inferences from these data are constrained both by uncertainty over the reliability of species identification, and spatial and temporal variation in sightings effort. Data on strandings are generally less vulnerable to misidentification issues, but are also potentially biased due to the lower likelihood of reporting on remote coasts and the relevance of location of death/stranding relative to living distribution. Historical literature sources provide little evidence of the occurrence of bottlenose dolphins in Scottish waters. There are no known archaeological sites, and all reports from Victorian Naturalists suggest that their occurrence in the late 1800s was sporadic compared with other species such as harbour porpoises, killer whales and pilot whales. Nevertheless, it is clear from our review of more recent strandings and sightings that bottlenose dolphins may now be encountered both in offshore waters and throughout most Scottish inshore waters. Reid et al. (2003) provide the most robust effort-corrected dataset for comparing density in different areas, although this analysis is restricted to data collected before 1998. These data (Figure 2.3) highlight the high densities of sightings along the east coast of Scotland and the occurrence of dolphins further offshore along the shelf edge. Sightings on the west coast of Scotland were rare in this dataset (Figure 2.3), but search effort both here and along the north coast were also relatively low. Additional sightings from the Sea Watch Foundation (Figure 2.5) and the HWDT (Figure 2.7), many of them reported since 1997 (Figures 2.6 and 2.8), provide evidence of widespread occurrence of bottlenose dolphins in the inner Hebrides, and more sporadic occurrence along the north-west and north coasts of Scotland. Variation in the effort underpinning these sightings constrains the extent to which these data truly indicate geographical variation in the density of dolphins, resulting in the need to further develop the sightings network under Objective 2 of this study (see section 3). Similarly, temporal variation in sighting effort makes it difficult to assess how the occurrence of dolphins in different areas may have changed over time. Over the last two or three decades, sightings have been consistently reported from just two areas: the east coast of Scotland (Wilson et al., 2004) and the Sound of Barra (Grellier & Wilson, 2003). Interestingly, these represent one of the most human-populated areas and one of the most remote areas of the Scottish coast. This provides some support for the assumption that the regular occurrence of dolphins in any part of the Scottish coast is unlikely to remain undetected (see Section 3). Bottlenose dolphins have also been reported in many other remoter areas of Scotland (see Figures 2.5 and 2.7), but the temporal pattern of sightings appeared much more patchy, with no evidence of predictable sightings at the same location either within or between years. Consequently, the project’s photo-identification studies required the development of a more intensive reporting scheme that provided near real-time reports of sightings. The development of this scheme is described in Section 3 and the survey work resulting from it is described in Section 4.

13
3 DEVELOPMENT OF A DOLPHIN SIGHTING NETWORK Authors: Ingram, S., Cheney, B., Culloch, R., Elwen, S., Mandleberg, L. & Stevick, P.
3.1 Introduction Photo-identification studies of abundance and movements are most powerful where sighting probabilities and recapture rates are high. On the east coast of Scotland, high human population densities and prior knowledge of the dolphins’ tendency to return to predictable core areas meant that it was straightforward to design appropriate boat-based photo-identification surveys when work started there in the late 1980s. In contrast, collecting suitable photo-identification data from dolphins using the much larger, complex and remote western and northern coasts of Scotland was a more challenging task. The review of historic data in Section 2 indicated that most inshore sightings of bottlenose dolphins were reported from around the inner Hebrides and the Sound of Barra, but that animals sometimes occurred further north up the west coast and along the north coast of Scotland. However, whilst sightings in Barra Sound appear to have been relatively predictable over a period of several years (Grellier & Wilson, 2003), the occurrence of bottlenose dolphins in other parts of the Hebrides was much more variable, even in areas such as Islay and Mull where sighting effort was relatively high. At the start of the current project, it was clear that success of our boat-based photo-identification surveys would require the support of a larger scale network of marine users. Our second major objective was therefore to develop, and train, a voluntary reporting network that would allow the project to target focussed research surveys around Scotland’s remoter coasts and build capacity for future photo-identification research in these areas. This section reports on the work undertaken to address this second objective, which involved collaboration with the Hebridean Whale and Dolphin Trust (HWDT) and the further development of their existing cetacean sightings network (www.whaledolphintrust.co.uk).
3.2 Methods The HWDT is a marine awareness and research charity who established a regional cetacean sightings reporting network in association with the national scheme organised by the Sea Watch Foundation (www.seawatchfoundation.org.uk). This scheme aimed to raise public awareness of cetaceans and marine conservation, and to collate opportunistic and public sightings of all cetacean species in the Hebrides. This information from the public was used to supplement dedicated survey data collected from the HWDT research yacht Silurian. The HWDT have been collecting bottlenose dolphin sightings from members of the public since 1989, first as the Mull Cetacean Project, and from 1994 under its own auspices. Cetacean sightings were minimal at first and concentrated on the Mull coast, but in 1997 the Operation Sightings scheme was launched, establishing a co-ordinated programme of cetacean sightings throughout the Hebrides and the development of a network of observers (Jeewoonarain et al., 1999). The network expanded in 2001 with the creation of the Hebridean Bottlenose Dolphin Project (HBDP), set up to collect and collate sightings and photo-identification data from members of the public and local marine users. Finally, in 2004 a dedicated field agent was employed to travel around the Hebrides informing locals of the project and encouraging them to report sightings.

14
The existing HWDT sightings network database included casual sightings data that were collected from a number of different sources. Incidental sightings were encouraged from the general public and from a variety of marine operators including fishermen, fish farmers, coastguards, ferry personnel, local wildlife ecotourism operators and birdwatchers. Contributors were encouraged to use standard forms and record set information relating to each sighting including location, date and time, species, group size and direction of travel. The recorders were also asked to give a score of the confidence of their species identification to allow post hoc sorting according to data quality. Sightings forms were entered into a central database annually. However, sightings were reported throughout the year (Mandleberg, 2006). During this study, our aim was to expand the HWDT sightings network, not only to increase the number of sightings but also to help direct field effort. A review of historic sightings highlighted those areas where sightings were more probable, but also indicated that encounters in these areas were unpredictable and often of relatively short duration. Thus, if this project’s dedicated boat-based photo-identification surveys were to be conducted in response to casual sightings reports, the scheme needed to be adapted to provide real-time information. To achieve this, we first worked with the HWDT to encourage rapid reporting of sightings by the public via a freephone ‘hotline’. In turn, this project provided additional staff time that allowed the HWDT Sightings Officer to feed this information directly to the project field team. Dedicated boat-based photo-identification field efforts were then directed by this sighting reporting structure (Section 4). All sightings were entered onto the central HWDT database. Secondly, the project was highlighted to all the members of the HWDT mailing list who were based around the west coast of Scotland. Researchers from the project contacted the existing HWDT sightings network either by e-mail, telephone or in person to inform them of this new project and encourage immediate reporting of any bottlenose dolphin sightings. Whenever possible, all these individuals were also encouraged to submit any photographs that they had taken during these sightings to incorporate into the photo-identification studies. A dedicated project website http://www.scottishdolphins.info/ was set up and promoted. This was regularly updated to disseminate information and encourage continual public involvement. Thirdly, business cards (Figure 3.1) and leaflets (Figure 3.2) outlining the project were printed and distributed both through the HWDT sightings network and by the project field team who visited key ports and tourist hotspots around the north and west coasts. The field team also proactively contacted and encouraged key individuals and organisations such as ecotourism operators, local ferry services, fishermen, harbour masters, and any other people that may be on or near the water to report sightings of marine mammals to the HWDT office either through the hotline or online.
Figure 3.1. The business card designed to promote the Scottish Bottlenose Dolphin Project and encourage sightings to the HWDT freephone hotline.

15
Figure 3.2. The leaflet designed to promote the Scottish Bottlenose Dolphin Project and encourage sightings to the HWDT freephone hotline.

16
At the end of HWDT’s 2006 field season (which runs from approximately April to September), few reports had been received from the north and north-west coasts. Recognising that these areas were outside the HWDT’s normal area of operation, and that few regular reporters lived or worked in these areas, extra effort was made prior to the 2007 field season to develop contacts in these areas. Members of the research team gave a series of public talks to promote both this project and parallel studies of killer whales in these areas. These talks provided an overview of the project’s aims, background on bottlenose dolphin ecology, and clear guidelines on how to identify different species and submit reports to the HWDT sightings network.
3.3 Results 3.3.1 Sightings network
The original HWDT voluntary sightings network included 90 contacts, covering areas from South Argyll to Wester Ross (Figure 3.3). However, there were no contacts on the north coast and in the southern Outer Hebrides. As a result of the recruitment drive by project staff, by the end of 2007, the sightings network was increased by nearly 70% to 152 contacts, with seven new contacts along the north coast. This new network of reporters provided good coverage of coastal areas from the Kintyre Peninsula and Firth of Clyde to Wick and John O’Groats and the Hebridean Islands (Figure 3.3).
TT T
T
T
T
T
T
TTTTT
TTTT
T
TT
T
TTTT TT
TT T
T
TT
T
T
T
TTT
T
TT
T
T
TT
T
T
T
T
T
TT
TT
T
TT
TT
T
TTT
T
T
T
T
T
T
TT
T TT
T
T
T
T
T
T
T
T
T
T
$
$$
$$$$
$$
$
$
$
$
$
$
$
$
$ $
$
$
$
$ $
$
$
$
$
$$
$
$
$
$
$
$$$
$$$
$$$
$
$
$
$
$
$
$
$
$
$
$
$$
$
$$
$
$
%
%
%%
%
%
%
%%%%%
0 50 100 150 200 250 Kilometers
S
N
EW
Figure 3.3. The locations of sightings reporters that contributed to the HWDT sightings network during 2006 (empty triangles) and additional reporters recruited for 2007 (filled
triangles) and 2008 (filled squares).

17
During 2006 and 2007, 114 contacts were sent leaflets and/or business cards, 112 people contacted via email and 35 regular reporters were contacted personally to promote the project and ask for additional information. Updates on the success of sightings provided by reporters were reported to them routinely, either by telephone or e-mail to encourage their continual involvement. The website was regularly updated and reporters were encouraged to check this for up-to-date sightings information. In 2007, members of the project team also toured the most remote areas of the north coasts to give public talks promoting the project and reporting network. Along the north section of the coast, talks were given in Thurso, Bettyhill, Dunnet and Lochinver. Given their location, all these talks were relatively well attended with 30, 12, 14 and 20 people respectively (Table 3.1). In other areas where numbers of residents were low, and talks were predicted to have a very low attendance, project members met with key individuals and organisations (Table 3.2). These formal and informal talks provided worthwhile new contacts. Also, feedback from people attending these talks indicated that bottlenose dolphins are not at all common along the north coast and sightings over the last four years have been sparse, despite regular sightings of other species, such as harbour porpoise, minke whales and white-beaked dolphins. As the team moved further south along the west coast, they found that bottlenose dolphin sightings became more regular, particularly around Gairloch and areas closer to Skye. Furthermore, some organisations and people that were contacted at that point were also able to provide photographs of bottlenose dolphins that could be matched with the project catalogue.
Table 3.1. Public talks undertaken to promote the HWDT sightings network in 2007.
Location Venue Date Attendance Thurso Environmental Research Institute 29/04/2007 > 30 Bettyhill Farr School 01/05/2007 12 Dunnet Rangers Centre 02/05/2007 14
Lochinver Village Hall 03/05/2007 20 Due to the success of this approach we subsequently developed a similar network to support our winter field effort on the east coast, south of the Moray Firth, during January-April 2008. The aim was to recruit regular reliable reporters to report sightings immediately and directly to the field team for immediate response. A total of 16 reporters were recruited and assisted in directing the field team during the field season. Here, the network built upon strong local Sea Watch groups and the presence of other research groups (Figure 3.3).
3.3.2 Sightings data During our study, dedicated boat-based field efforts were directed by the sighting reporting structure, particularly through the use of the new telephone ‘hotline’. This proved invaluable, especially in 2007 where the majority of surveys were made in response to a confirmed sighting from members of the public. This approach followed the low encounter rate achieved when most survey routes focussed in those areas in which dolphins had been sighted most regularly in previous years. The advantage of targeting surveys in response to near real-time sightings of dolphins is illustrated by the increase in encounters, from five encounters in 2006 to 16 in 2007 (see Section 4). Previous promotion of the HWDT sightings network resulted in a peak number of sightings in 2001 of 193, but this fell to 91 in 2005 (Figure 3.4). After promotion and publicity in 2006 the network resulted in 99 sightings reports. However, with more effort during 2007, reports increased by nearly 80% to 177 (Figure 3.4).

18
Table 3.2. Additional leaflet drops, informal talks and contacts to promote the sightings network in 2007.
Location Date Leaflet
Drop Informal
Talk Contact
Helmsdale Harbour Master 01/05/2007 √ √ √ Bettyhill Rangers Centre 01/05/2007 √ √ √ Scrabster Harbour Master 02/05/2007 √ √ √ Wick Harbour Café 02/05/2007 √ RNLI Wick 02/05/2007 √ √ John O’Groats Post Office 02/05/2007 √ John O’Groats Ferry 02/05/2007 √ √ √ John O’Groats Ecotour 02/05/2007 √ √ John O’Groats Tourist Info 02/05/2007 √ Dunnet Rangers Centre 02/05/2007 √ √ √ BDMLR Dunnet area 02/05/2007 √ √ √ Tongue Coffee Shop 03/05/2007 √ √ Durness Youth Hostel 03/05/2007 √ Durness Ferry 03/05/2007 √ √ √ Durness Rangers Centre 03/05/2007 √ √ √ Kinlochbervie Harbour Master 03/05/2007 √ √ Kinlochbervie Fisherman’s Mission 03/05/2007 √ √ Handa Island Staff 03/05/2007 √ √ √ Scourie Caravan Park 03/05/2007 √ √ Dunbeag Village Shop 03/05/2007 √ Lochinver Rangers Centre 03/05/2007 √ √ √ Barra Ferry Terminal 22/05/2007 √ Barra Harbour 22/05/2007 √ Barra Tourist Information 22/05/2007 √ √ Barra Clearwater Paddlers 22/05/2007 √ √ Barra CalMac Ferry 23/05/2007 √ √ Eriskay Fishermen 23/05/2007 √ √ South Uist Fishermen 23/05/2007 √ √ Loch Boisdale Tourist Information 23/05/2007 √ √ Loch Boisdale Marine Harvest 23/05/2007 √ √ √ Altandhu Smokehouse 29/05/2007 √ √ Polbain Stores 29/05/2007 √ √ √ Achiltibue MOP 29/05/2007 √ √ √ Ullapool Skipper 29/05/2007 √ √ √ Ullapool Ferry Office 29/05/2007 √ √ Laide Camp Site 29/05/2007 √ √ √ Poolewe Camp Site 29/05/2007 √ √ Gairloch Boat Club 29/05/2007 √ Gairloch Marine Wildlife Centre 29/05/2007 √ Gairloch Ecotour 29/05/2007 √ √ √ Loch Linnhe Marine Harvest 04/07/2007 √ √ √ Skipness Fishermen 05/08/2007 √ √ SNH, Islay 01/08/2007 √ √ Skye Ferry Service, Kyle 14/08/2007 √ √
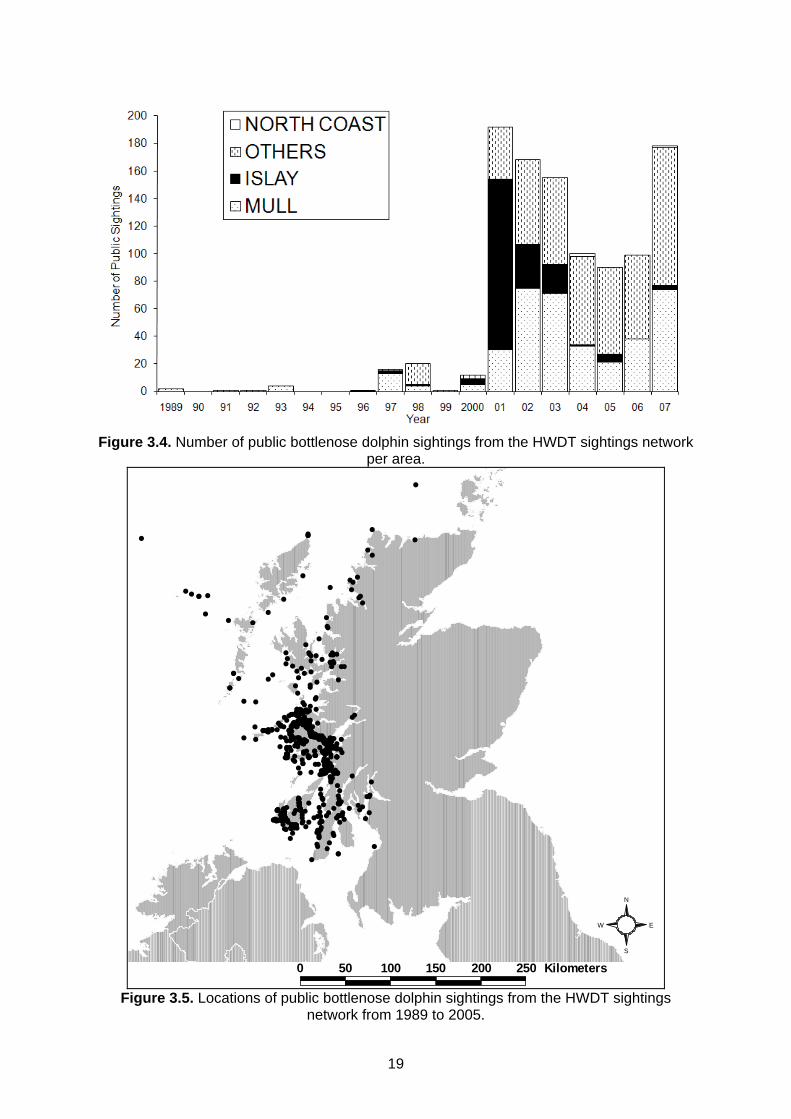
19
Figure 3.4. Number of public bottlenose dolphin sightings from the HWDT sightings network
per area.
##
#
#
##
#
#
#
#
#
####
#
###
#
#
#
#
#
##
#
#
#
#
##
###
#
#
#
###
#
#
#
###
####
#
#
#
#
#
#
#######
#
#
#
#
#
##
###
##
#
#
#
#
#
#
#
#
#
#
#
#
#
##
##
#
#
##
##
#
#
##
##
###
#
#
#
#
#
##
####
# #
#
#
#
#
## #
#
##
##
###
#
####
#
##
#
#
#
###########
##
###
#
##
##
#
#####
#
##
#
###
#
####
###
## #
# #
#
##
#
#
#
#
#
#####
#
#########
#
##
#
#
##
#
#
#
#
#
######
#
#
#
#
#####
##
#
##
#####
#
#
#
##
##
###
#########
###
####
##
#
#
#
#
#
#
#
##
#
##
#
#
# ##
#
###
#
##
#
#
#
##
#
#
#
#
#
#
#
#
#
#
#
#
#
#
###
#
#
# ##
#
#
#
#
#
#
#
##
#
#
#
##
#
# #
#####
#
#
#
#
#
#
##
#
##
####
#
####
#
#
##
##
#
#
#
#
#
#
##
######### #
#
###
##
#
#
######
#
######
################
#
#
##
#
#
#
###
#
#
#
##
#
#
##
###
#
##
#
#
#
#####
#
##
##
#
# ##
####
#
#
##
#
###
##
#
#
##
#
#
#
#
#
#
#
#
##
#
##
##
#
#
#
##
#
#
#
#
#######
#
#
#
#
#
#
##
#
###
#
#
#
#
#
#
##
#
#
##
#
##
#
#
#
##
#
###
#
## #
#
#
#
#
#
#
#
#
#
#
#
#
####
#
#
#
##
#
#
##
#
##
#
#
#
##
#
#
#
#
#
#
#
#
#
#
#
#
#
## ###
#
##
#
#
#
###
#
##
#
#
#
#
#
#
#
#
#
##
#
#
#
#
##
#
#
#
#
#
#
#
#
##
##
#
###
#
##
##
#
#
##
###
#
#
#
# #
#
#
#####
#
#
#
#
#
#
#
# #
#
#
#
#
#
#
#
#
#
#
#
#
#
#
#
#
#
#
#
# #
#
#
#
#
#
#
#
##
#
#
#
#
#
##
##
#
#
#
#####
##
#
##
#
#
#
#
##
#
#
0 50 100 150 200 250 Kilometers
S
N
EW
Figure 3.5. Locations of public bottlenose dolphin sightings from the HWDT sightings
network from 1989 to 2005.

20
Sightings that were reported to the network between 1989 and 2005 were distributed throughout the west coast with only two sightings reported from the north coast, both in 2004. In most early years the sightings reported in the Mull area were generally higher, apart from in 2001 where 64% of the sightings were from Islay (Figures 3.4 and 3.5). From 2004 onwards the majority of sightings were in other areas with fewer sightings in Islay than in the previous three years. During 2006 and 2007, sightings were again distributed throughout the west coast and concentrated around HWDT’s core region of Mull and Argyll (Figure 3.6 and 3.7). However, in 2007, with additional reporters recruited, there were sightings further north and south of this region. This included one ad hoc sighting provided during the north coast talks in May 2007, when the British Divers Marine Life Rescue (BDMLR) in the Dunnet area reported a sighting in Thurso Bay of 3 bottlenose dolphins in April 2007 (Figure 3.7). The southernmost sighting, in Ayrshire, was also recorded in 2007. 3.3.4 Public photo-identification Photographs were provided to the HWDT by members of the public and wildlife tour operators between 2001 and 2005. During this period, a total of 12 public sightings produced photographs in which individual dolphins could be recognised. These resulted in 29 identifications of 11 individuals. Therefore, in 2006 and 2007, in addition to the dedicated boat-based photo-identification effort, members of the sightings network, the public and other organisations were encouraged to send their photographs to the HWDT. In 2006 and 2007, 33 incidental sightings provided identifiable photographs (Table 3.3). These public photographs resulted in 123 identifications. The majority, over two thirds, of these identifications resulted from photographs taken during the 2007 season. In total, 33 individual dolphins were identified from these public identifications, 21 during 2006 and 29 in 2007. With the exception of one calf photographed in June 2006, all of the animals identified from public photographs were also recorded during the dedicated photo-identification surveys (Table 3.3). Other pictures were provided by the public but could only confirm species as individual identifications were not possible. These were added to the sightings database. From 2001 to 2007, the public photographs allowed us to identify 38 dolphins regularly seen on the west coast. This is 83% of the animals identified over the same time period in dedicated photo-identification surveys. However, the majority of public photographs were of a poorer quality (see section 4 for information on photographic grading). If only the top quality pictures are included then a total of 21 individuals were identified. Of the 11 individuals identified in public photographs between 2001 and 2005, six were subsequently seen in 2006 and/or 2007 (Table 3.4). The number of photographs submitted by the public increased dramatically in 2006 and 2007 with a corresponding increase in the number of individual dolphins identified (Table 3.3). The public photographs also covered a wide geographical area from Gairloch to Islay, although most were concentrated around Mull (Figure 3.8).
Table 3.3. Summary of public photographs from the HWDT sightings network.
2001 2002 2003 2004 2005 2006 2007Public sightings with identifiable photos 5 2 0 4 1 13 20 Dolphins identified 2 6 0 9 2 21 29 Dolphins identified in Q3 photos 0 0 0 1 0 6 19 Dolphins only identified from public photos 2 6 0 0 0 1 0

21
# ##
##
#
#
#
#
##
#
#
#
#
#
#
#
#
##
#
#
#
#
#
#
#
##
#
#
#
#
#
#
#
##
#
##
#
#
#
#
#
##
#
#
#
#
#
#
#
#
##
#
#
#
#
##
## #
#
#
#
#
#
#
#
#
#
#
#
#
#
# #
#
##
#
#
###
#
#
#
#
#
#
#
0 50 100 150 200 250 Kilometers
S
N
EW
Figure 3.6. Locations of sightings of bottlenose dolphin schools reported to the HWDT
sightings network during 2006.
#
#
#
#
####
#
#
#
##
#
#
#
#
###
#
##
#
###
#
#
#
#
#
##
#
#
#
#
#
##
##
#
##
#
#
#
#
#
#
#
##
#
#
#
#
#
##
#
###
##
## ###
#
##
### #
###
#
#
#
#
#
#
#
#
##
#
# #
#
#
#
#
#
##
#
###
#
#
#
#
#
#
#
#
##
##
#
#
# ####
#
#
#
# #
#
#
#
#
#
#
#
#
#
##
#
##
#
#
#
#
##
#
#
##
#
#
#
#
#
#
#
#
##
#
###
##
#
#
#
#
0 50 100 150 200 250 Kilometers
S
N
EW
Figure 3.7. Locations of sightings of bottlenose dolphin schools reported to the HWDT
sightings network during 2007.

22
Table 3.4. Sightings histories of individually recognisable dolphins recorded by the public along the west coast of Scotland, showing which years different individuals were recorded.
ID # 2001 2002 2003 2004 2005 2006 2007 5001 5002 5003 5004 5005 5006 5007 5008 5009 5010 5012 5013 5014 5016 5017 5018 5019 5020 5021 5022 5023 5024 5025 5026 5027 5028 5029 5030 5031 5032 5033 5034 5035 5036 5038 5039 5040 5043 5044 5045 5046 5047 5048 5049 5050 5051 5052 5053
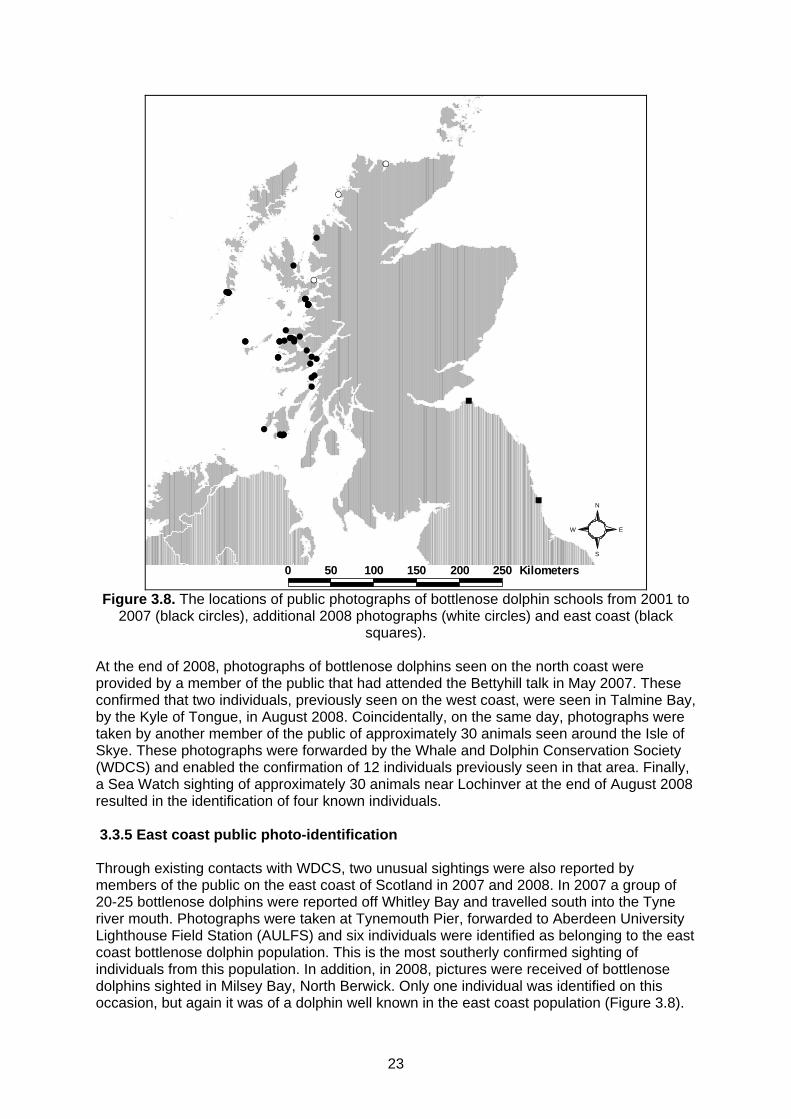
23
######
##
## # #
#
#
#
#
#
#
#
###
##
#
#
#
#
##
#
#
#
######
#
#
#
#
#
#S
#S
#S
%
%
0 50 100 150 200 250 Kilometers
S
N
EW
Figure 3.8. The locations of public photographs of bottlenose dolphin schools from 2001 to
2007 (black circles), additional 2008 photographs (white circles) and east coast (black squares).
At the end of 2008, photographs of bottlenose dolphins seen on the north coast were provided by a member of the public that had attended the Bettyhill talk in May 2007. These confirmed that two individuals, previously seen on the west coast, were seen in Talmine Bay, by the Kyle of Tongue, in August 2008. Coincidentally, on the same day, photographs were taken by another member of the public of approximately 30 animals seen around the Isle of Skye. These photographs were forwarded by the Whale and Dolphin Conservation Society (WDCS) and enabled the confirmation of 12 individuals previously seen in that area. Finally, a Sea Watch sighting of approximately 30 animals near Lochinver at the end of August 2008 resulted in the identification of four known individuals. 3.3.5 East coast public photo-identification Through existing contacts with WDCS, two unusual sightings were also reported by members of the public on the east coast of Scotland in 2007 and 2008. In 2007 a group of 20-25 bottlenose dolphins were reported off Whitley Bay and travelled south into the Tyne river mouth. Photographs were taken at Tynemouth Pier, forwarded to Aberdeen University Lighthouse Field Station (AULFS) and six individuals were identified as belonging to the east coast bottlenose dolphin population. This is the most southerly confirmed sighting of individuals from this population. In addition, in 2008, pictures were received of bottlenose dolphins sighted in Milsey Bay, North Berwick. Only one individual was identified on this occasion, but again it was of a dolphin well known in the east coast population (Figure 3.8).

24
3.4 Discussion As a basis for research on the distribution and abundance of bottlenose dolphins around Scotland, a broad spatial coverage of all areas was needed. On the remoter north and west coasts, this could best be provided by a voluntary sightings network. While public sightings data are liable to spatial and temporal variation in sightings effort and uncertainty over the reliability of species identification, they nevertheless provide useful information on dolphin distribution in otherwise data-poor areas. Long-term studies have shown site fidelity around the north-east coast of Scotland but, in these remoter coasts, bottlenose dolphins appear to range over a larger area and have a less predictable and more ephemeral distribution. Dedicated photo-identification surveys in 2006 confirmed that the chance of encountering animals around these coasts were small without the aid of the public sightings. Raising public awareness and support was key to the success of the sightings network. During 2006 and 2007, sightings reporters were contacted periodically by the HWDT Sightings Officer and the field team to enquire whether sightings had been made but not reported, and to encourage increased vigilance during the summer months. Particular effort was put into making enquiries in areas with few or no sightings. New contacts were made wherever suitable and, in the spring of 2007, public talks were given around the north coast to increase the profile and public awareness of the project. This resulted in an increase of 70% in the number of contacts in the HWDT sightings network and coastal coverage ranging from Wick and John O’Groats to the Kintyre Peninsula and Firth of Clyde. This personal contact was also essential in gathering vital information on previous bottlenose dolphin sightings (or lack of) in the area. The success of this proactive approach to developing a sightings network, through public talks and personal contact, is reflected in the addition of photographs and sightings of animals from the north coast. The telephone hotline also provided an invaluable aid to the project, sightings reports were passed to the HWDT office more rapidly and up-to-date sightings information was phoned through to the project field team by the HWDT staff. More bottlenose dolphins were reported by the public and encountered during directed boat surveys during 2007 than 2006. However, it is unlikely that this increase in sightings represents an increase in abundance or an increase in use of the area by bottlenose dolphins since almost the same numbers of dolphins were photo-identified during each year and all but one of the new individuals seen by the public in 2007 were previously identified in dedicated photo-identification surveys (Section 4). It is more likely that the profile of the project and the communication and response to sightings were more effective in the second year of this study. Initially we had little idea how many dolphins used the waters around the west coast and effort was made to survey areas in the absence of sightings reports. In 2007 it became apparent that a relatively low number of individual dolphins were ranging widely over a large coastal area. As a result, survey effort was targeted on those areas and occasions where there were recent sightings of dolphins. This approach was only possible as a result of the timely reporting of sightings through the HWDT, and the efficient collaboration between research scientists, the public and NGOs. During 2006, public sightings were distributed throughout the west coast but concentrated around Mull and Argyll. Reports from the far north-west were rare and there were no reports from the north coast during 2006. However, it was unclear whether this reflected a genuine scarcity of bottlenose dolphins or was a result of the HWDT’s previous focus on the Hebrides and Argyll region. Additional reporters were recruited in the north-west and north coasts in 2007 to address this issue. However, the general distribution of reports was similar in both years indicating that the paucity of sightings from the far north-west and north coasts represented a genuine low level of use of these coastal areas. Also, anecdotal evidence provided during these talks suggested the lack of bottlenose dolphins on the north coast is

25
genuine. A number of contacts from Scrabster, Wick and John O’Groats reported other cetacean sightings, especially minke whales, killer whales and porpoises, in this area but only one report of bottlenose dolphins around Thurso in 2007. Most contacts suggested that they had not been seen in the area for a number of years. All the sightings from the network were integrated into the HWDT database which was shared with the project team and used to examine the distribution of dolphins around the west and north coasts of Scotland (see Section 4). With little or no dedicated research in the past, the public sightings and photographs have enabled us to see the change in ranging patterns of the dolphins over time. For example, sightings were frequently reported around Islay between 2001 and 2003 (Mandleberg, 2006) but no sightings in this area were reported during 2006 and only a few in 2007. Small scale range shifts such as this are not unlikely with such a widely ranging group of animals and may be due to changes in prey distribution between years for example. Five well-marked dolphins, which were identified in previous years from public photographs, were not identified during 2006 or 2007. Due to the high number of resightings, the small size of the population using the area and the fact that no other individuals were identified in our dedicated photo-identification surveys (Section 4), it is unlikely that these dolphins were missed. Whilst it is possible that these animals may have died, it is more likely that at least some of them moved out of the area, at least for the duration of this study. In addition to range shifts, it is likely that that there has been some degree of emigration and immigration into the Hebridean region since the earliest identifications of animals were made. Nevertheless, there were repeat sightings of six animals between 2001 and 2007 suggesting some site fidelity to the region. During 2006 and 2007, only one additional animal was observed in the public photographs, increasing our understanding of bottlenose dolphin distribution and reinforcing the conclusion that no groups of animals were missed during the dedicated photo-identification surveys. Photographs from the public have even provided additional information on the distribution of the relatively well known population of bottlenose dolphins on the east coast of Scotland. In areas where little is known about the ecology of the animals being researched and where the area is extensive or the study animals are unpredictable, public involvement can be essential in directing research to suitable areas and times and providing valuable additional information. However, engaging and encouraging continual involvement of individuals is resource intensive, as is organising and effectively utilising the data provided.
26
4 USING PHOTO-IDENTIFICATION TO DETERMINE THE DISTRIBUTION AND ABUNDANCE OF BOTTLENOSE DOLPHINS IN SCOTTISH COASTAL WATERS Authors: Ingram, S., Barton, T.R., Cheney, B., Culloch, R., Elwen, S., Hammond, P.S., Mandleberg, L., Stevick, P., Thompson, P.M. & Wilson, B.
4.1 Introduction Bottlenose dolphins can be identified from their naturally occurring marks, and individual-based photo-identification studies have underpinned ecological studies of this species in coastal regions across the world. In turn, the information on distribution, movements and abundance resulting from these studies has supported regional and local conservation and environmental education programmes. In Europe, recent efforts have generally focussed on understanding the ecology of this species in and around those areas designated as Special Areas of Conservation (SAC) under the Habitats Directive (92/43/EEC) (Ingram & Rogan, 2002; Wilson et al., 2004). In Scotland, a single SAC in the inner Moray Firth on the north-east coast has been established to protect this species, but it is clear that many of the individuals using this area range well beyond the SAC boundary (Wilson et al., 2004; Stockin et al., 2006; Culloch & Robinson, 2008). Furthermore, bottlenose dolphins are sighted regularly in coastal waters off the west coast of Scotland, and in offshore areas (Section 2). However, the abundance of dolphins in these other areas, and their relationship with the population that uses the Moray Firth SAC, remains uncertain. The third objective of this study was to determine the distribution and abundance of bottlenose dolphins throughout the coastal waters off Scotland. This section describes the work carried out to address this objective, involving the continuation of ongoing photo-identification studies within the Moray Firth SAC, and the development of dedicated boat-based photo-identification surveys on other Scottish coasts to assess the abundance, ranging patterns and distribution of bottlenose dolphins during the summers of 2006 and 2007.
4.2 Methods 4.2.1 Study sites Scotland, bounded on the east by the North Sea and on the west by the Atlantic Ocean, has a long and convoluted coastline and over 750 islands, including the Hebrides to the west and Orkney and Shetland to the north. There have been historic sightings of bottlenose dolphins throughout this complex coastline (see Section 2). However, the majority of regular sightings have been within the Moray Firth, a large triangular embayment of the North Sea off the north-east coast covering approximately 5230 km2, and the west coast, specifically around the Inner and Outer Hebrides, an archipelago of over 50 islands (Figure 4.1). 4.2.2 Survey protocols All surveys were carried out on one of two near identical Maritime and Coastguard Agency (MCA) certified 5.8 m Rigid Inflatable Boats (RIB) with twin 40 hp outboard engines (Figure 4.2). Survey effort was spread through the period May to September in 2006 and 2007, but

27
restricted to days with low sea state (≤ Beaufort 3) to maximise sighting probability, and good light conditions to maximise photographic quality. While searching for dolphins, boat speeds were typically 25-30 km h-1. On the east coast, the RIB was launched from Cromarty and survey routes were chosen to maximise sighting probability whilst also providing reasonably wide coverage of the dolphins’ known core-area (Thompson et al., 2006). In other areas, survey effort was directed by historic sightings and, especially in 2007, by reports to the HWDT sightings network (see Section 3). The field team, comprising researchers from SAMS and AULFS, were able to mobilise at short notice and tow and deploy the RIB close to the location of current or recent sightings reports. Surveys were made with a minimum crew of two, including an appropriately qualified skipper and at least one of the personnel named on the Animal Scientific Licence granted to the University of Aberdeen by SNH.
#S#S
#S
#S
#S
#S
GlasgowEdinburgh
Aberdeen
Inverness
Cromarty
St. Andrews
OuterHebrides
SCOTLAND
InnerHebrides
Isle of Mull
Islay
ArranKintyre Penninsula
SAC
Moray Firth
0 50 100 150 200 250 Kilometers
S
N
EW
Figure 4.1. Map of Scotland showing the key locations mentioned in the text.
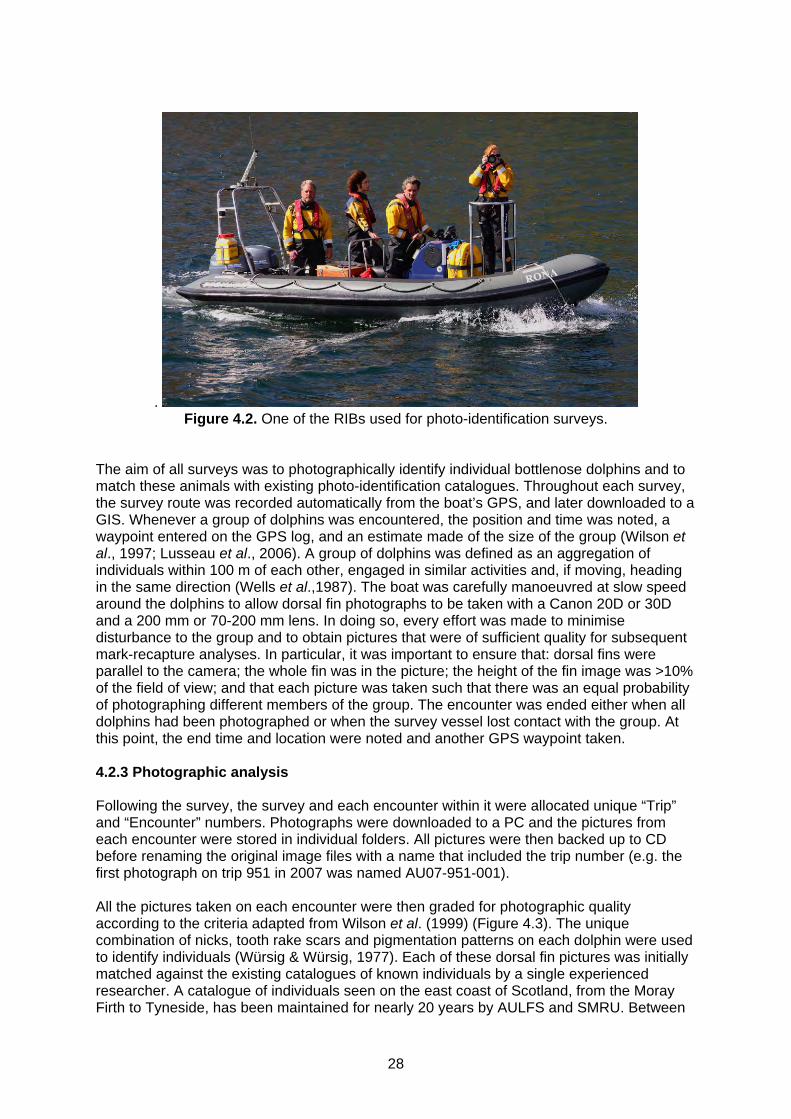
28
. Figure 4.2. One of the RIBs used for photo-identification surveys.
The aim of all surveys was to photographically identify individual bottlenose dolphins and to match these animals with existing photo-identification catalogues. Throughout each survey, the survey route was recorded automatically from the boat’s GPS, and later downloaded to a GIS. Whenever a group of dolphins was encountered, the position and time was noted, a waypoint entered on the GPS log, and an estimate made of the size of the group (Wilson et al., 1997; Lusseau et al., 2006). A group of dolphins was defined as an aggregation of individuals within 100 m of each other, engaged in similar activities and, if moving, heading in the same direction (Wells et al.,1987). The boat was carefully manoeuvred at slow speed around the dolphins to allow dorsal fin photographs to be taken with a Canon 20D or 30D and a 200 mm or 70-200 mm lens. In doing so, every effort was made to minimise disturbance to the group and to obtain pictures that were of sufficient quality for subsequent mark-recapture analyses. In particular, it was important to ensure that: dorsal fins were parallel to the camera; the whole fin was in the picture; the height of the fin image was >10% of the field of view; and that each picture was taken such that there was an equal probability of photographing different members of the group. The encounter was ended either when all dolphins had been photographed or when the survey vessel lost contact with the group. At this point, the end time and location were noted and another GPS waypoint taken. 4.2.3 Photographic analysis Following the survey, the survey and each encounter within it were allocated unique “Trip” and “Encounter” numbers. Photographs were downloaded to a PC and the pictures from each encounter were stored in individual folders. All pictures were then backed up to CD before renaming the original image files with a name that included the trip number (e.g. the first photograph on trip 951 in 2007 was named AU07-951-001). All the pictures taken on each encounter were then graded for photographic quality according to the criteria adapted from Wilson et al. (1999) (Figure 4.3). The unique combination of nicks, tooth rake scars and pigmentation patterns on each dolphin were used to identify individuals (Würsig & Würsig, 1977). Each of these dorsal fin pictures was initially matched against the existing catalogues of known individuals by a single experienced researcher. A catalogue of individuals seen on the east coast of Scotland, from the Moray Firth to Tyneside, has been maintained for nearly 20 years by AULFS and SMRU. Between

29
2001 and 2005 the HWDT also maintained a bottlenose dolphin photo-identification catalogue using images taken during 27 encounters throughout the Inner Hebridean coastal region (Mandleberg, 2006). The best pictures of the 22 individuals recorded in this catalogue were reviewed. Only individuals seen in the highest quality pictures (Grade 3.1, 3.2 or 3.3), or individuals that had either nicks in their dorsal fin or had numerous clear rakes were kept for matching to more recent pictures obtained during the present study. This resulted in a catalogue of 17 individually marked bottlenose dolphins. Using the same procedure, five individuals were identified in photos taken during three surveys conducted in the Sound of Barra by Grellier & Wilson (2003) in 1995 and 1998. These were added to the HWDT catalogue. The catalogues were compared and no matches were found in these archive images from the three different areas. At the end of the season, each match was confirmed by a second experienced team member. Confirmed sightings of different well-marked dolphins were recorded in separate Access databases, one for the east coast and one for the west coast. Each sighting was linked with information on which side of the dolphin had been photographed, and the details of the trip and encounter (e.g. locations, group size etc.) Sightings histories for the 17 well-marked individuals from the HWDT catalogue (including photographs provided by members of the public) and the five individuals from the Sound of Barra were added to the west coast database, after ensuring all the pictures were graded to the same standard. 4.2.4 Mark-recapture analysis Mark-recapture analyses were restricted to the subset of high quality (Grade 3.1, 3.2 & 3.3) pictures to avoid biasing mark-recapture estimates of abundance (see Wilson et al., 1999). Analyses were also restricted to the sub-set of animals bearing distinctive long-term marks, i.e. those with nicks in their dorsal fin. Using information in the Access databases, a capture matrix was constructed containing either a 1 or 0, to represent whether or not a high quality photograph, taken from either the left or right-hand side, had been obtained for each individual on each trip. In addition, we used all grade 3 pictures to estimate , the proportion of animals in the population that were distinctively marked (i.e. nicked). For each trip, we recorded the number of photographed individuals that had distinctive marks, and the number of individuals lacking distinctive marks, and recorded this information in a separate database table. Separate estimates of were made using data from 2006 and 2007. These capture matrices were then used to estimate the number of distinctively marked individuals using each study area during the summer survey period. Following Wilson et al. (1999), we used Chao et al.’s (1992) Mth model, implemented in the program CAPTURE (Rexstad & Burnham, 1991). We inflated the mean estimates and their confidence intervals using our estimate of , thereby producing estimates of the total number of dolphins using the study area during each summer. 4.2.5 Social structure The social structure of the bottlenose dolphins on the east coast has previously been described by Wilson (1995) and Lusseau et al. (2006). Data from 1990-2002 were used by Lusseau et al. (2006) to assign individuals into one of two communities. For the animals identified on the west coast, social structuring was explored with SocProg (Whitehead, 2008) using school membership as the unit of association (Whitehead, 1999; Whitehead & Dufault, 1999).

30
Figure 4.3. The criteria used to quality grade the photographs taken during photo-identification surveys.
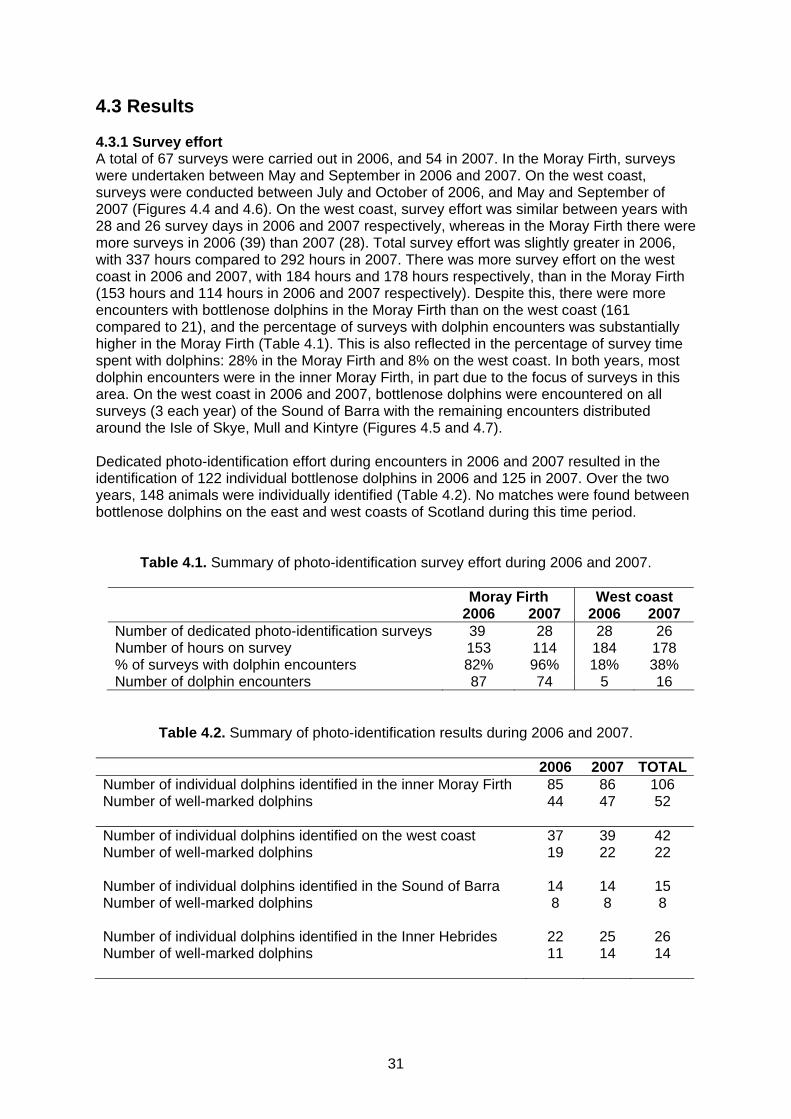
31
4.3 Results 4.3.1 Survey effort A total of 67 surveys were carried out in 2006, and 54 in 2007. In the Moray Firth, surveys were undertaken between May and September in 2006 and 2007. On the west coast, surveys were conducted between July and October of 2006, and May and September of 2007 (Figures 4.4 and 4.6). On the west coast, survey effort was similar between years with 28 and 26 survey days in 2006 and 2007 respectively, whereas in the Moray Firth there were more surveys in 2006 (39) than 2007 (28). Total survey effort was slightly greater in 2006, with 337 hours compared to 292 hours in 2007. There was more survey effort on the west coast in 2006 and 2007, with 184 hours and 178 hours respectively, than in the Moray Firth (153 hours and 114 hours in 2006 and 2007 respectively). Despite this, there were more encounters with bottlenose dolphins in the Moray Firth than on the west coast (161 compared to 21), and the percentage of surveys with dolphin encounters was substantially higher in the Moray Firth (Table 4.1). This is also reflected in the percentage of survey time spent with dolphins: 28% in the Moray Firth and 8% on the west coast. In both years, most dolphin encounters were in the inner Moray Firth, in part due to the focus of surveys in this area. On the west coast in 2006 and 2007, bottlenose dolphins were encountered on all surveys (3 each year) of the Sound of Barra with the remaining encounters distributed around the Isle of Skye, Mull and Kintyre (Figures 4.5 and 4.7). Dedicated photo-identification effort during encounters in 2006 and 2007 resulted in the identification of 122 individual bottlenose dolphins in 2006 and 125 in 2007. Over the two years, 148 animals were individually identified (Table 4.2). No matches were found between bottlenose dolphins on the east and west coasts of Scotland during this time period.
Table 4.1. Summary of photo-identification survey effort during 2006 and 2007.
Moray Firth West coast 2006 2007 2006 2007 Number of dedicated photo-identification surveys 39 28 28 26 Number of hours on survey 153 114 184 178 % of surveys with dolphin encounters 82% 96% 18% 38% Number of dolphin encounters 87 74 5 16
Table 4.2. Summary of photo-identification results during 2006 and 2007.
2006 2007 TOTALNumber of individual dolphins identified in the inner Moray Firth 85 86 106 Number of well-marked dolphins
44 47 52
Number of individual dolphins identified on the west coast 37 39 42 Number of well-marked dolphins
19 22 22
Number of individual dolphins identified in the Sound of Barra 14 14 15 Number of well-marked dolphins 8 8 8 Number of individual dolphins identified in the Inner Hebrides 22 25 26 Number of well-marked dolphins 11 14 14
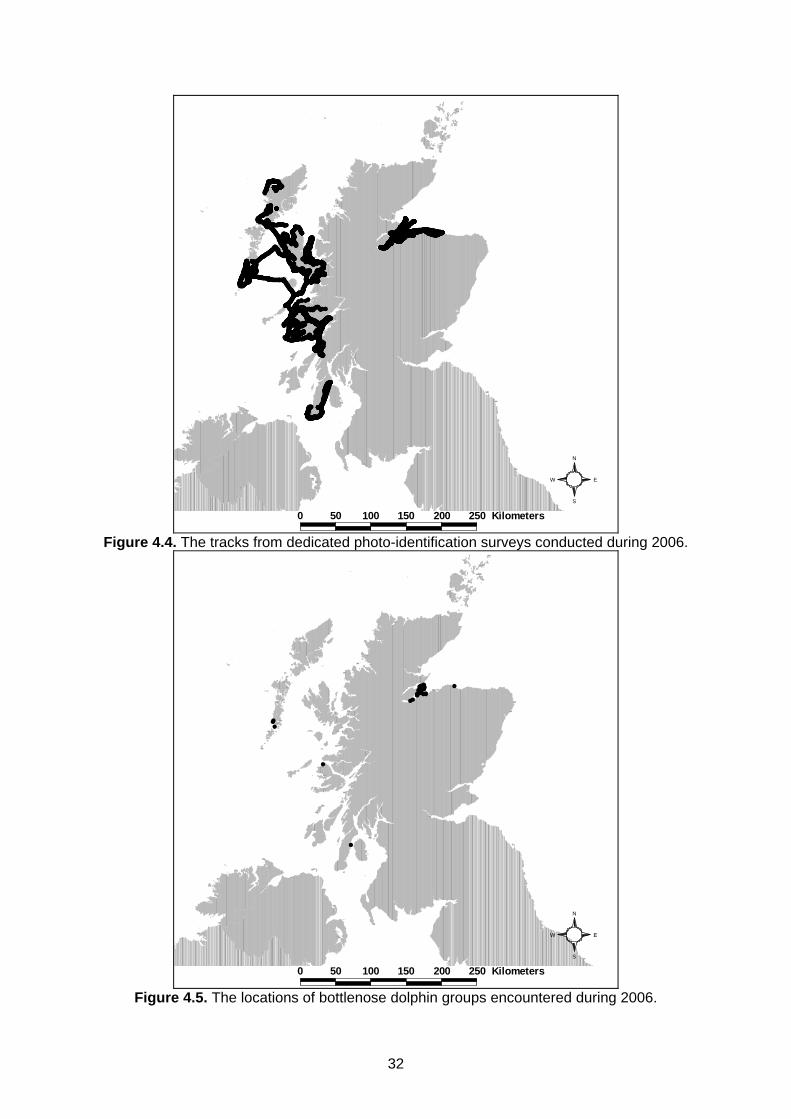
32
###########################################################################################################################################################################################################################################################################################################
###
#########################################################################################################################################################################
##############################################################################################################################################################################################################################################################
#####################################################################################
###########################################################
###################################
##
#####################################################################################################################################################################################################################################
#######################################################################################################################################
###########################################################################################################################################################################################################################################################################################################
#############################################################################################################################################################################################################################################################################################################
#################
################################################################################################################################################################################################################################################################################################################################################################################################################################################################################################################################################################################################################################################
#####################################################################################################################
#################################################################################################################################################################################################################################################################
#############################################################################################################################################################################################
#########################################################################
##################################################################################################################################################################################################################################################################################################################################################################################################################################################################################################################################################################################################################################################################################################################################################################################################################################################################################################################################################################################################################################################################################################################################################################################################################################################
################################################################################################################################################################################################################################################################################################################################################################################################################################################################
##########################################################################################################################################
###########################################
#############
############################################################################################################################################################################################################################
######################################################################################################################################################################################################################################################################################
##################################################
#####################################################################################################################################################################################################################################################################################################################################################################################################################################################################################################################################
##############################################################
###################################################################################################################################################################################################################################################################################
############################################################################################
################################################################################################################################################################################################
##############################################################################
#################################################################################################################################################################################################################################################################################################################################
########################################################
#################################################################################################################################################################################################################################################################################################################################################################
#######################################################################################################################################################################################################################################################################################################################################
#######################################################################################################################
################################################
####################################################################################################################################################################################################################################################################
##########################################################################################################################################################################################################################################################################################################
###########################################################################################################################################################################################################################################################################################################################################################################################################################################################################################################################################################################################################################################################
#######################################################################################################################################################################################################################################################################################################################################################
##########################################################################################
##
######################################################################################################################################################################################################################################################################################################################################################################################################################################################################################################################################################################################################################################################################################################################################################################################################################################################################################################################################################################################################################################################################################################################################################################################################################################################################################################
##########################################################################################################################################################################################################################################################################################################################################################################################################################################
#######################################################################################################################################################################################################################################################################################################################################################################################################################################################################################################################################################################################################################################################################################################################################################################
#######################################################################################################################################################################################################################################################################################################################################################################################################################################################################################################################################################################################################################################################################################################################################################################################
###################################################################################################################################################################################################################################################################################################################################################################################
################################################################################################################################################################################################################################
###########################################################################################################################################################################################################################################
################################################### ##############################################################################################################################################################################################################################################################################################################################################################################################################################################################################################################################################################################################################################################################################################################################################################################################################################################################################################################################################################################################################################################################################################################################################################################################################################################################################################################################################################################################################################################################################################################################################################################################################################################################################################################################################################################################################################################################################################################################################################################################################################################################################################################################################################################################################################################################################################################################################################################################################################################################################################################################################################################################################################################################################################################################################################################################################################################################################################################################################################################################################################################################################################################################################################################################################################################################################################################################################################################################################################################################################################################################################################################################################################################################################################################################################################################################################################################################################################################################################################################################################################################################################################################################################################################################################################################################################################################################################################################################################################################################################################################################################################################################################################################################################################################################################################################################################################
##############################################################################################################################
###############################################################################################################################################################################################################################################################################################################################################################################################################################
##############################################################################################################################################################################################################################################################################################################
###############################################################################################################################################################################################################################################################################################################################################################################################################################################################################################
###########################################################################################################################################################################################################################################################################################################################################################################################################################################################################################################################################################################################################
#####################################################################################################################################################################################################################################################################################################################################################################################################################################################################################################################################################################################################################################################################################################################################################################################################################################################################################################################################################################################################################################################################################################################################################################################################################
#####################################################################################################################################################################################################################################################################################################################################################################################################################################################################################################################################################################################################################################################################################################################################################################################################
####################################################################################
###########################################################################################################################################################################################################################
###############################################################################################################################################################################################################################################################################################################################################
###################################################################################################################################################################################################################################################################################################################################################################################################################################################################################################################################################################################################################################################################################
0 50 100 150 200 250 Kilometers
S
N
EW
Figure 4.4. The tracks from dedicated photo-identification surveys conducted during 2006.
###
#
#
#####
##
################
####
#####
#
## #
##################################################
0 50 100 150 200 250 Kilometers
S
N
EW
Figure 4.5. The locations of bottlenose dolphin groups encountered during 2006.

33
#######################################################################################################################################################################################################################################################################################################################################################################
####
#############################################################################################################################################################################################################################################################################################################################################################################################################
############################################################################################
############################################################################################################
##################################################################################################################################################################################################################################################
###############################################################################################################################################################################################################################################################################################################################################################################################################################################################################################################################################################################################################################################################################################################################################################################################################################################################################################################################################################################################################
##########################################################################################################################################################################################################################################################################################################################################################################################################################################################################################################################################################################################################################################################################################
################################################################################################################################################
#####
####################################################################################################################################
###############################################################################################################################################################
#############################################################################################################################################################################################################################################################################################################################################################################################################################################################################################################################################################################################################################################################################################################################################################################################################################################################################################################################
##################################################################################################################################################################
#####################################################################################################################################################################################################################################################################################################################################################################################################################################################################################################################################
##########################################################################################################################################################################################################################################################################################################################################################################################################################################################################################################################################################################################################################################
##############################################################################################################################################################################################################################################################################################################################################################################################################################################################################################################################################################################################################################################################################################################################################################################################################################################################################################################################################################################################################################################################################################################################################################################################################################################################################################################################################################################################################################################################################################################################################################################################################################################################################################################################################################################################################################################################################################################################################################################################################################################################################################################################################################################################################################################################################################
########################################################################################################################################################################################################################################################################################################################################################################################################################################################################################################################################################################################################################################################################################################################################################################
##################################################################################################################################################################################################################################################################################################################################################################################################################################################################################################################################################################################################################################################################################################################################################################################################################################################################################################################################################################################################################################################################################################
####################################################################################################################################################################################################################################################################################################################################################################################################################################################################################################################################################################################################################################################################################################################################################################################################################################################################################################################################################################################################################
###########################################################################################################################################################################################################################################################################################################################################################################################################################################################################################################################################################################################################################################################################################################################################################################################################################################################################################
###############################################################################################################################################################################################################################################################################################################################################################################################################################################################################################################################################################################################################################################################################################################################################################################################################################################################################################################################################################################################################################################################################################################################################################################################################################################################################################################################################################################################################################################################################################################################################################################################################################################################################################################################################################################################################################################################################################################################################################################################################################################################
########################################################################################################################################################################################################################################################################################################################################################################################################################################################################################################################################################################################################################################################################################################################################################
############################################################################################################################################################################################################################################################################################################################################################################################
#########################################################################################################################################################################################################################
###################################################################################################################################################################################################################################################################################################################################################################################################################################################################################################################################################################################################################################################################################################################################################################################################################################################################################################################################################################################################################
##############################################################################################################################################################################################################################################################################################################################################################################################################################################################################################################################################################################################################################################################################################################################################################################################################################################################################################################################################################################################################################################################################################################################################################################################################################################################################################################################################################################################################################################################################################################################################
#####################################################################################################################################################################################################################################################################################################################################
#################################################################################################################################################################################################################################################################################################
##################################################################################################################################################################################################################################################################################################################################################################################################################################################################################################################################################################################################################################################################################################################################################################################################################################################################################################################################################################################################################################################################################################################################################################################################
##########################################################################################################################################################################################################################################################################################################################################################################################################################################################################################################################################################################################################################################################################################################################################################################################################
##################################################################################################################################################
####################################################################################################################################################################################################################################################################################################################################################################################################################################################################################################################################################################################################################
################################################################################################################################################################################################################################################################################################################################################################################################################################################################################################################################################################################################################################
##########################################################################################################################################################################################################################################################################################################################################################################################################################################################################################################################################################################################################################################################################################################################################################################################
#####################################################################################################################################################################
################################################################################################################################################################################################################################################################################################################################################################################################################################################################################################################################################################################################################################################################################################################################################################
###############################################################################################################################
######################################################################
######################################################################################################################################################################################################################################################################################################################################################################################################################################################################################################################################################################################################################################################################################################################################################################################################
#############################################################################################################################################################################################################################################################################################################################################################################################################################################################################################################################################################################################################
#############################################################################################################################################################################################################################################################################################################################################################################################################################################################################################################################################################################################################################################################################################################################################################################################################################################################################################################
########################################################################################################################################################################################################################################################################################################################################### #
#########################################################################################################################################################################
###############################################################################################################################################################################################################################################################################################################################################################################################################
#############################################################################################################################################################################################################################################################################################################################################################################################
#####################################################################################################################################################################################################################################################################################################################################################################################################################################################################################################################################################################################################################################################################################################################################################################################################################################################################################################################################################################################################################################################################################################################################################################################################################################################################################################################################################################################################################################################################################################################
##################################################################################################################################################################################################################################################################################################################################################################################################################################################################################################################################################################################################################################################################################################################################################################################################################################################################
###################################################################################################################################################################################################################################################################################################################################################################################
########################################################################################################################################################################################################################################################################################################################################################################################################################################################################################################################################################################################################################################################################################################################################################################################################################################################################################################################################################################################################################################################################################################################################################################
#############################################################################################################################################################################################################################################################
0 50 100 150 200 250 Kilometers
S
N
EW
Figure 4.6. The tracks from dedicated photo-identification surveys conducted during 2007
####
#
##
#
##
###
#
#
#
########
##########
#########
#
######
############################
#########
#
##
0 50 100 150 200 250 Kilometers
S
N
EW
Figure 4.7. The locations of bottlenose dolphin groups encountered during 2007.
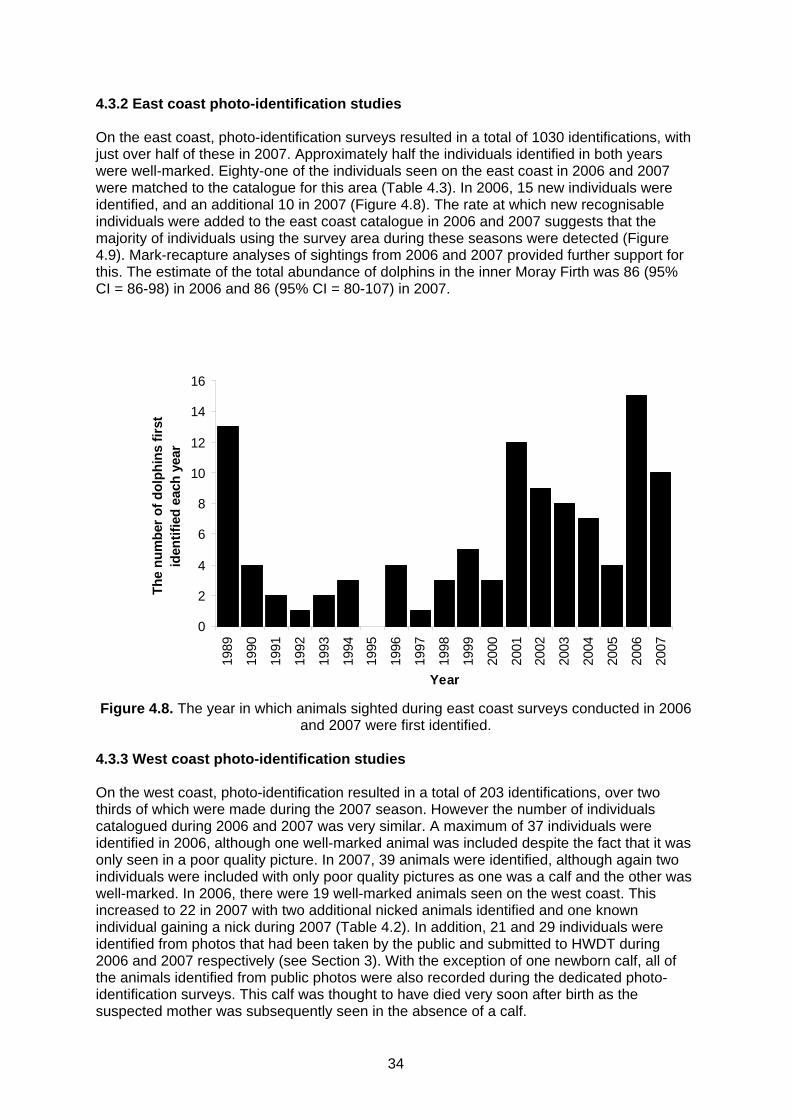
34
4.3.2 East coast photo-identification studies On the east coast, photo-identification surveys resulted in a total of 1030 identifications, with just over half of these in 2007. Approximately half the individuals identified in both years were well-marked. Eighty-one of the individuals seen on the east coast in 2006 and 2007 were matched to the catalogue for this area (Table 4.3). In 2006, 15 new individuals were identified, and an additional 10 in 2007 (Figure 4.8). The rate at which new recognisable individuals were added to the east coast catalogue in 2006 and 2007 suggests that the majority of individuals using the survey area during these seasons were detected (Figure 4.9). Mark-recapture analyses of sightings from 2006 and 2007 provided further support for this. The estimate of the total abundance of dolphins in the inner Moray Firth was 86 (95% CI = 86-98) in 2006 and 86 (95% CI = 80-107) in 2007.
0
2
4
6
8
10
12
14
16
1989
1990
1991
1992
1993
1994
1995
1996
1997
1998
1999
2000
2001
2002
2003
2004
2005
2006
2007
Year
Th
e n
um
ber
of
do
lph
ins
firs
t id
enti
fied
eac
h y
ear
Figure 4.8. The year in which animals sighted during east coast surveys conducted in 2006
and 2007 were first identified. 4.3.3 West coast photo-identification studies On the west coast, photo-identification resulted in a total of 203 identifications, over two thirds of which were made during the 2007 season. However the number of individuals catalogued during 2006 and 2007 was very similar. A maximum of 37 individuals were identified in 2006, although one well-marked animal was included despite the fact that it was only seen in a poor quality picture. In 2007, 39 animals were identified, although again two individuals were included with only poor quality pictures as one was a calf and the other was well-marked. In 2006, there were 19 well-marked animals seen on the west coast. This increased to 22 in 2007 with two additional nicked animals identified and one known individual gaining a nick during 2007 (Table 4.2). In addition, 21 and 29 individuals were identified from photos that had been taken by the public and submitted to HWDT during 2006 and 2007 respectively (see Section 3). With the exception of one newborn calf, all of the animals identified from public photos were also recorded during the dedicated photo-identification surveys. This calf was thought to have died very soon after birth as the suspected mother was subsequently seen in the absence of a calf.
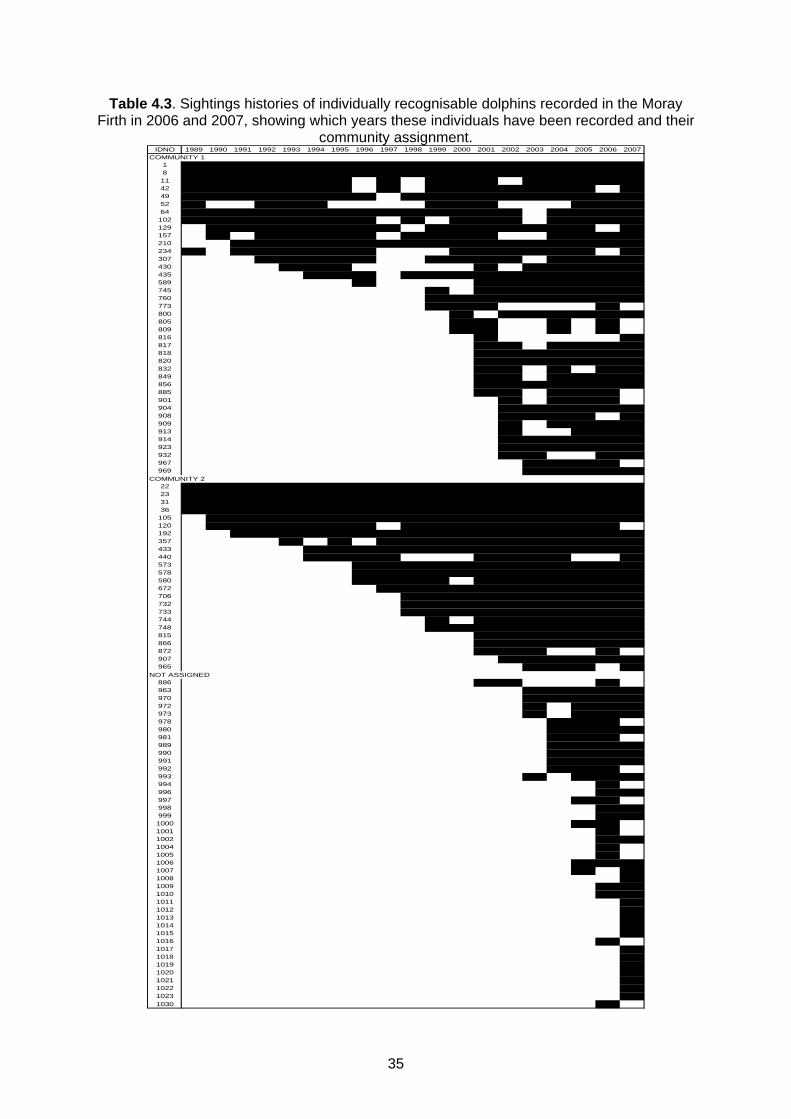
35
Table 4.3. Sightings histories of individually recognisable dolphins recorded in the Moray Firth in 2006 and 2007, showing which years these individuals have been recorded and their
community assignment. IDNO 1989 1990 1991 1992 1993 1994 1995 1996 1997 1998 1999 2000 2001 2002 2003 2004 2005 2006 2007
COMMUNITY 11 1 1 1 1 1 1 1 1 1 1 1 1 1 1 1 1 1 1 18 1 1 1 1 1 1 1 1 1 1 1 1 1 1 1 1 1 1 111 1 1 1 1 1 1 1 1 1 1 1 1 1 1 1 142 1 1 1 1 1 1 1 1 1 1 1 1 1 1 1 149 1 1 1 1 1 1 1 1 1 1 1 1 1 1 1 1 1 152 1 1 1 1 1 1 1 1 1 164 1 1 1 1 1 1 1 1 1 1 1 1 1 1 1 1 1 1
102 1 1 1 1 1 1 1 1 1 1 1 1 1 1 1 1129 1 1 1 1 1 1 1 1 1 1 1 1 1 1 1 1157 1 1 1 1 1 1 1 1 1 1 1 1 1 1210 1 1 1 1 1 1 1 1 1 1 1 1 1 1 1 1 1234 1 1 1 1 1 1 1 1 1 1 1 1 1 1307 1 1 1 1 1 1 1 1 1 1 1 1 1430 1 1 1 1 1 1 1 1 1435 1 1 1 1 1 1 1 1 1 1 1 1 1589 1 1 1 1 1 1 1 1745 1 1 1 1 1 1 1 1760 1 1 1 1 1 1 1 1 1773 1 1 1 1800 1 1 1 1 1 1 1805 1 1 1 1809 1 1 1 1816 1 1817 1 1 1 1 1 1818 1 1 1 1 1 1 1820 1 1 1 1 1 1 1832 1 1 1 1 1849 1 1 1 1 1 1856 1 1 1 1 1 1 1885 1 1 1 1 1901 1 1 1 1904 1 1 1 1 1 1908 1 1 1 1 1909 1 1 1 1 1913 1 1 1 1914 1 1 1 1 1 1923 1 1 1 1 1 1932 1 1 1 1967 1 1 1 1969 1 1 1 1 1
COMMUNITY 222 1 1 1 1 1 1 1 1 1 1 1 1 1 1 1 1 1 1 123 1 1 1 1 1 1 1 1 1 1 1 1 1 1 1 1 1 1 131 1 1 1 1 1 1 1 1 1 1 1 1 1 1 1 1 1 1 136 1 1 1 1 1 1 1 1 1 1 1 1 1 1 1 1 1 1 1
105 1 1 1 1 1 1 1 1 1 1 1 1 1 1 1 1 1 1120 1 1 1 1 1 1 1 1 1 1 1 1 1 1 1 1192 1 1 1 1 1 1 1 1 1 1 1 1 1 1 1 1 1357 1 1 1 1 1 1 1 1 1 1 1 1 1433 1 1 1 1 1 1 1 1 1 1 1 1 1 1440 1 1 1 1 1 1 1 1 1573 1 1 1 1 1 1 1 1 1 1 1 1578 1 1 1 1 1 1 1 1 1 1 1 1580 1 1 1 1 1 1 1 1 1 1 1672 1 1 1 1 1 1 1 1 1 1 1706 1 1 1 1 1 1 1 1 1 1732 1 1 1 1 1 1 1 1 1 1733 1 1 1 1 1 1 1 1 1 1744 1 1 1 1 1 1 1 1748 1 1 1 1 1 1 1 1 1815 1 1 1 1 1 1 1866 1 1 1 1 1 1 1872 1 1 1 1907 1 1 1 1 1 1965 1 1 1 1
NOT ASSIGNED886 1 1 1963 1 1 1 1 1970 1 1 1 1 1972 1 1 1 1973 1 1 1 1978 1 1 1980 1 1 1 1981 1 1 1989 1 1 1 1990 1 1 1 1991 1 1 1 1992 1 1 1993 1 1 1 1994 1996 1 1997 1 1998 1 1999 1 11000 1 11001 11002 1 11004 11005 11006 1 1 11007 1 11008 11009 1 11010 1 11011 11012 11013 11014 11015 11016 11017 11018 11019 11020 11021 11022 11023 1
1030 1

36
0
10
20
30
40
50
60
70
80
90
100
0 100 200 300 400 500 600 700 800 900 1000
Number of Identifications
Nu
mb
er o
f id
enti
fied
do
lph
ins
Figure 4.9. The rate that individual dolphins (excluding calves) were identified during
dedicated photo-identification survey work conducted on the east coast during summer 2006 and 2007.
Overall, a minimum of 40 and maximum of 42 dolphins were identified during 2006 and 2007. Of these, 16 were matched with the HWDT catalogue of animals that was produced from photo-identification effort in previous years (Figure 4.10), indicating a degree of long-term site fidelity in the area. The years in which these individuals were previously seen are presented in Table 4.4. Of the 22 well-marked dolphins in the HWDT catalogue identified prior to 2006, six were not recorded during 2006 or 2007. These missing dolphins all had clear dorsal edge nicks and were considered sufficiently well marked to enable re-identification during 2006 and 2007. All six of these dolphins had previously been identified in the same groups as individuals that were seen during 2006 and 2007, so did not represent a discrete group of animals that had travelled exclusively together. The rate at which new recognisable individuals were added to the west coast catalogue through the 2006 and 2007 seasons suggests that most individuals using the survey area over this period were detected (Figure 4.11). Mark-recapture analyses of sightings from 2007 provided further support for this. The estimate of the abundance of well-marked individuals was 24, resulting in a total abundance estimate of 41 (95% CI = 35-49).

37
0
5
10
15
20
25
1995 1998 2001 2002 2004 2005 2006 2007
Year
Th
e n
um
ber
of
do
lph
ins
firs
t id
enti
fied
eac
h y
ear
Sound of Barra Inner Hebrides
Figure 4.10. The year in which animals sighted during west coast surveys conducted in
2006 and 2007 were first identified.
0
5
10
15
20
25
30
35
40
0 50 100 150 200 250 300 350
Number of Identifications
Nu
mb
er o
f id
enti
fied
do
lph
ins
Figure 4.11. The rate that individual dolphins (excluding calves) were identified using all
photo-identification work conducted on the west coast during 2006 and 2007.
38
4.3.4 Numbers of calves encountered In total, 11 ‘young-of-year’ calves were identified in 2006 and 10 in 2007. On the east coast, five ‘young-of-year’ calves were identified in 2006, although an additional two small calves were seen in 2007, and it is estimated that these individuals were also born in 2006. During the summer of 2007, seven ‘young-of-year’ calves were identified and associated with known adults, but another two calves were born between October and December. On the west coast four ‘young-of-year’ calves were identified during 2006, one in the Sound of Barra and the others around the Isle of Mull. Only two of these ‘2006 young-of-year’ calves were subsequently seen in 2007, in both cases around the Isle of Mull. In 2007, the only young-of-year identified was a calf seen with a single female bottlenose dolphin that was associating with a school of Risso’s dolphins. Both the calf and the mother were observed on only one occasion in the whole study. 4.3.5 Community structure and ranging patterns Previous work (Lusseau et al., 2006) has highlighted that the dolphins on the east coast of Scotland associate within two communities that have overlapping but different ranging patterns. In the summers of 2006 and 2007, 38% of individuals seen within the Moray Firth SAC were animals from community 1, which are also regularly seen outside the inner Moray Firth. Just over 20% of the individuals seen in 2006 and 2007 were animals from community 2, which are rarely or never seen outside the inner Moray Firth. Most of the remaining animals were calves and juveniles which were not seen regularly enough for their association patterns to be determined and have therefore not yet been assigned to a community. Individuals from both communities were seen in some mixed groups during 2006 and 2007. Dolphins inhabiting the west coast of Scotland appeared to belong to two discrete communities: one using the waters around the Sound of Barra and the other using the waters of the Inner Hebrides and the mainland coast. Photo-identification data showed that no encounter with bottlenose dolphins contained mixed groups from these two communities (Figure 4.12). In total, a minimum of 13 and maximum of 15 dolphins were identified from surveys in and around the Sound of Barra. It appeared that these animals had a very small range and they were encountered during every visit to the area. In the Inner Hebrides, a minimum of 24 and maximum of 25 dolphins were identified during encounters in 2006 and 2007. In contrast to the dolphins using the Sound of Barra this community ranged widely with identifications from Kintyre to the north coast of the Isle of Skye and Gairloch (Figure 4.12). A cluster analysis using school membership as a measure of association shows a slight degree of segregation of the Inner Hebridean animals during 2006 and 2007 (Figure 4.13). Groups identified from the cluster analysis were found to have different but overlapping ranging patterns (Figure 4.12). Although all members of this community were seen together in schools at some point during both 2006 and 2007, there appeared to be slight latitudinal partitioning of the Inner Hebridean community with some dolphins being seen further north than other animals (Figure 4.14). Mixing of these north and south groups of the inner Hebridean community was greatest around the Sound of Mull, the area with the majority of sightings reports and survey encounters.

39
Table 4.4. Sightings histories of individually recognisable dolphins recorded along the west
coast of Scotland, showing which years different individuals have been recorded. Data prior to 2006 were made available through the HWDT bottlenose dolphin photo-
identification catalogue and Grellier & Wilson (2003).
ID# 1995 1998 2001 2002 2003 2004 2005 2006 2007500150025003500450055006500750085009501050125013501450165017501850195020502150225023502450255026502750285029503050315032503350345035503750385039504050435044504550465047504850495050505150525053

40
UUUUUUUUUUUUUUUUUUUU
#S
#S
#S#S#S
#S
#S#S
#S#S
#S#S
#S
#S#S#S#S
#S
#S
#S
#S
#S
#S#S#S#S#S#S
#S
#S$
$
$
$$
$
$
$$
$
$$
$
$
$
$
$
$
0 50 100 150 200 250 Kilometers
S
N
EW
Figure 4.12. The composition of schools encountered in the waters around the west coast during 2006 and 2007 at different latitudes. The groups consist of animals grouped from
cluster analysis of association values. The white circles are sightings of group 1 (northern ranging Inner Hebridean dolphins), black triangles are sightings of group 2 (southern ranging
inner Hebridean dolphins) and squares represent sightings of group 3 (dolphins using the Sound of Barra).

41
Figure 4.13. Dendrogram showing cluster analysis of association values between identified dolphins. School membership is used as the unit of association. Three groups of dolphins are identified; 1 = northern ranging Inner Hebridean dolphins, 2 = southern ranging Inner
Hebridean dolphins, 3 = dolphins using the Sound of Barra.
Figure 4.14. The composition of schools encountered in the waters around the Inner Hebrides during 2006 and 2007 at different latitudes. The north and south groups consist of
animals grouped from cluster analysis of association values.
0 5 1 0 1 5 2 0 2 5
5 5 . 6 3
5 5 . 7 5
5 6 . 2 7
5 6 . 3 6
5 6 . 4 3
5 6 . 6 2
5 6 . 6 4
5 7 . 0 1
5 7 . 0 4
N u m b e r o f d o l p h i n s
N o r t h g r o u p S o u t h g r o u p O t h e r
Latitude
0 5 1 0 1 5 2 0 2 5
5 5 . 6 3
5 5 . 7 5
5 6 . 2 7
5 6 . 3 6
5 6 . 4 3
5 6 . 6 2
5 6 . 6 4
5 7 . 0 1
5 7 . 0 4
N u m b e r o f d o l p h i n s
N o r t h g r o u p S o u t h g r o u p O t h e r
Latitude
42
4.4 Discussion Bottlenose dolphins are frequently found in coastal waters throughout their global range. Whilst existing data from previous studies indicated a wide but patchy distribution of the species in Scottish waters, during this study we aimed to compile a comprehensive dataset of individually identified bottlenose dolphins and sightings locations to examine fine and broad scale distribution, abundance and ranging behaviour. We used a flexible approach to directing our boat survey effort. In the inner Moray Firth, where longer term studies had shown concentrated use of areas by bottlenose dolphins, we directed our effort into systematic surveys. In areas with fewer data, we aimed to direct effort in response to public sightings reports and to cover coastal areas with less previous survey coverage. This approach worked well and by 2007 networks of public reporters yielded a high encounter rate in areas used by fewer dolphins. The combined results from this work show a widely distributed use of both the east and west coasts, but with far fewer dolphins on the west. Furthermore, the high proportion of animals identified between the two years of the study indicates that we had successfully catalogued most of the animals using the waters surveyed. The geographic distribution of the species was probably well covered in this study in areas with high and medium levels of use, with a lack of information restricted to some coastal areas likely to be infrequently used by travelling animals such as the northern coasts and the waters around the Northern Isles and the coastal border with England (on both the east and the west coast). The limited sightings reports over the past few years and the movements of known animals on the east and west coast suggest that the north coast and Northern Isles are not significant bottlenose dolphin habitat and the lack of matches between east and west coast catalogues suggests there is very little movement of individuals through this region. Although bottlenose dolphins are likely to use all parts of the Scottish coast to some extent, for the purposes of effective and realistic management the key areas of high and medium use are clearly described by our survey results. During 2006 and 2007, survey effort away from the east coast was distributed throughout most of those areas of the Scottish mainland and Hebridean coasts where bottlenose dolphins were reported or historically known to use (Grellier & Wilson, 2003; Mandleberg, 2006). Bottlenose dolphin encounters were distributed widely on the west coast from Arran in the south to Skye in the north and around the Sound of Barra.
Relatively few bottlenose dolphins use the coastal waters of western Scotland, with a maximum of 39 individuals identified during a single year. Matches with long-term but sporadic photo-identification data collected prior to this study showed that many of these animals had used the waters of western Scotland for several years. Sightings reports and photo-identification encounters show that bottlenose dolphins are widely distributed but that they use waters north of the Isle of Skye less regularly than the more southern parts of the west coast. This distribution is similar to that on the east coast where bottlenose dolphins are more rarely encountered north of the Moray Firth (Bailey & Thompson, 2009) and this may be an indication that these northernmost coasts are approaching the latitudinal limit for coastal populations of this species in the north-east Atlantic. Bottlenose dolphins using the Scottish west coast appear to belong to two discrete parapatric communities, one of which appears to be confined to the waters around the Sound of Barra whereas the other ranges much more widely throughout the Inner Hebrides and mainland coasts. This marked contrast in ranging behaviour of neighbouring groups of animals illustrates the ecological plasticity of the species. It is possible that very small numbers of animals can be supported by geographically small but productive habitat areas. For example, a similarly small community of 16 animals resident off the coast of Brittany was also found to have extremely limited ranging behaviour remaining year-round in the immediate waters surrounding the Isle de Sein (Liret et al., 1996). The factors driving the
43
larger ranging patterns of dolphins belonging to the Inner Hebridean community are unknown but patchy or mobile prey, more limited prey availability, predator distribution or cultural factors may be responsible. These communities currently appear entirely segregated; Barra and Inner Hebridean dolphins were never seen in mixed schools. In fact, only one dolphin from the Barra community was ever seen outside the waters adjacent to the Sound of Barra. This individual (id #5001) was identified alone on several occasions during 2004 around the island of Tiree, approximately 65 km from the Sound of Barra. This dolphin had not been identified from previous surveys around Barra but was subsequently seen in the Sound of Barra in 2006 and 2007 with the other dolphins of that community. It is likely that this dolphin joined the Sound of Barra community after 2004 and subsequently remained there. In addition to the segregation of the Outer and Inner Hebridean dolphins there appeared to be a degree of latitudinal partitioning amongst dolphins using the Inner Hebrides with some animals travelling further north and the majority ranging further south. These animals were not exclusively found in separate schools, however, and all Inner Hebridean dolphins were seen together at some point with the greatest degree of mixing occurring around the Sound of Mull. Whilst this partitioning was apparent from encounter locations during 2006 and 2007 this may be a temporary feature. Bottlenose dolphins are known to have fluid school structures (Shane, 1986; Connor et al., 2002) and no evidence of long-term, strong associations has been found within bottlenose dolphin communities around the coasts of Britain and Ireland (Wilson, 1995; Ingram, 2000). The ranging patterns of dolphins of the Inner Hebrides varied slightly over the years. Sightings were frequently reported around Islay between 2001 and 2003 (Mandleberg, 2006) but no sightings in this area were reported during 2006 and only a few in 2007. Small scale range shifts such as this are not unlikely with such a widely ranging group of animals and may be due to changes in prey distribution between years. In addition to range shifts it is likely that some dolphins have emigrated and immigrated into the Hebridean region during the past few years. For example, six well-marked dolphins identified in previous years’ photo-identification effort were not identified during 2006 or 2007. Due to the number of resightings of individuals and the low number of individuals using the area it is unlikely that these dolphins were missed. It is more likely that they had either died or left the region. In summary, on the west coast there are two, small and socially segregated communities of dolphins with markedly contrasting ranging behaviour whilst on the east coast there is a complex of interacting dolphins concentrated between the Moray Firth and Fife with individual differences in ranging behaviour and site fidelity (Lusseau et al., 2006; Section 5). Our records of young-of-year calves encountered throughout the surveyed areas and in each of the communities indicate that the dolphins using the Scottish coasts continue to breed successfully but without detailed survivorship data and genetic information on stock structure, the viability of this population (or meta-population) is unknown. Throughout all coastal regions some longer range movement of individuals from the more densely occupied areas would seem likely but presently this appears to be occurring at a rate not detectable with our current survey methods. The lack of data on longer range movements or broad scale seasonal migrations reflects the sensitivity and resolution of our survey methods and more detail on the possible meta-population structure of bottlenose dolphins around Scottish coasts is better examined using molecular genetic approaches. Photo-identification survey data show a lack of significant movement between east and west coasts and a large difference in the number of coastal dolphins resident or seasonally resident on the east and west coasts. However, photo-identification surveys will not necessarily provide data on the rate of mixing that may be sufficient to maintain a single reproductive stock of animals but multiple socially isolated communities.

44
5 MULTI-SITE MARK RECAPTURE ESTIMATE OF THE ABUNDANCE AND MOVEMENT RATES OF BOTTLENOSE DOLPHINS Authors: Cheney, B., Costa, M., Culloch, R., Durban, J.W., Elwen, S., Islas, V., Eisfeld, S.M., Evans, P.G.H., Hammond, P.S., Ingram, S., Janik, V.M., O’Brien, J., Pope, A., Phillips, C., Quick, N., Robinson, K.P., Thompson, P.M., Weir, C.R. & Wilson, B.
5.1 Introduction In the previous section, we described the photo-identification survey work that we conducted on the west coast of Scotland and within the Moray Firth SAC on the east coast of Scotland. These observations of individually recognisable dolphins provide a minimum estimate of the number of animals using each of these areas, but the nature of the surveys means that it is likely that some individuals will not be sampled. We therefore used a mark-recapture framework for estimating the overall abundance of dolphins from the pattern of re-sightings of identifiable individuals. Building upon the procedures developed for monitoring the number of animals using the SAC, we used the program CAPTURE to estimate the number of animals using each of our main sampling areas; the west coast and the Moray Firth SAC. Repeated surveys within each field season were used as independent sampling occasions, and the photographic captures of well-marked individuals within each of these samples were used to estimate abundance in each of these areas. An alternative approach is to apply mark-recapture models to data collected at different sampling sites, rather than in different time periods. This may be advantageous when individuals within a population range widely, and observations are focussed within specific sampling areas within the population’s overall range. For example, on the east coast of Scotland, there was evidence of a range expansion during the 1990s (Wilson et al., 2004). As a result, whilst repeated surveys within the Moray Firth SAC still allow us to use CAPTURE to estimate the number of animals using the SAC, they will underestimate the overall abundance of the east coast population (Thompson et al., 2004). To explore ways of overcoming this problem, Durban et al. (2005) developed a multi-site mark recapture framework to model data collected from different sampling areas on the east coast of Scotland (the inner Moray Firth, the southern Moray Firth coast and St Andrews Bay). Data available in Durban et al.’s (2005) study were sparse, and the resulting estimate had relatively high uncertainty, but these results did highlight the potential for extending this approach. One advantage of the multi-site mark-recapture framework is that it is well suited to situations where multiple organisations are collecting data in different parts of a population’s range. In Scotland, several organisations have carried out photo-identification studies of bottlenose dolphins on both the east and west coasts, and there are additional datasets from adjacent areas in both UK and Irish waters. The fourth objective of this study was to provide estimates of abundance and movement rates between different sampling areas using multi-site mark-recapture analyses. In this section, we build on the work reported in Section 4 by integrating results from our own surveys with those from other groups that conducted photo-identification studies of Scottish bottlenose dolphins during 2006 and 2007. To achieve this, we use two different multi-site mark-recapture frameworks. First, we use Durban et al.’s (2005) Bayesian model to estimate abundance. Second, we use maximum likelihood methods (Whitehead, 2001; Stevick et al., 2006) to estimate transition probabilities for movement between study sites.

45
5.2 Methods 5.2.1 Data sources
In addition to the data collected within this project (see Section 4), and photographs that were submitted by members of the public (see Section 3), photo-identification data were available through collaborative agreements that were established with the following four research groups. 5.2.1.1 Whale & Dolphin Conservation Society (WDCS) WDCS conduct research and educational work in the Moray Firth from their Wildlife Centres at Spey Bay and North Kessock. Photo-identification data are available through two areas of this work. First, trained WDCS volunteers act as guides on the Gemini Explorer, a commercial dolphin watching boat that operates from Buckie under the Dolphin Space Programme. This also provides opportunities for the WDCS guides to collect photo-identification data during these trips, which are made along the south side of the Moray Firth. Since 2001, a collaboration with Aberdeen University has involved both the training of volunteers in photo-identification techniques and the integration of these data into the Moray Firth photo-identification catalogue and database that is maintained at the Lighthouse Field Station. Second, Charlie Phillips, the WDCS Adopt a Dolphin Field Officer regularly makes shore-based observations and collects photo-identification data from Chanonry Point, in the inner Moray Firth. Since 2004, these photographs have also been integrated into the Moray Firth photo-identification catalogue as part of a collaborative agreement with WDCS and Charlie Phillips. 5.2.1.2 Cetacean Research & Rescue Unit (CRRU) The CRRU is a research and educational organisation based in Gardenstown on the southern coast of the Moray Firth. CRRU has been carrying out boat-based photo-identification studies of bottlenose dolphins in this area since 1997, with recent studies being conducted with teams of Earthwatch volunteers. Photo-identification surveys have focussed on an 80 km coastal strip on the south side of the Moray Firth (for details see Robinson et al., 2007 and Culloch & Robinson, 2008). CRRU maintains a photo-identification catalogue of the animals recorded in this area. For the purposes of this study, a collaborative agreement was established to share pictures and data to determine which individuals were photographed in this study area during the summers (May-September) of 2006 and 2007. 5.2.1.3 Sea Watch Foundation The South Grampian Regional Group of the Sea Watch Foundation has conducted boat-based photo-identification studies along the Aberdeen coast since 1999 (for details see Stockin et al., 2006 and Weir et al., 2008). The group maintain the Aberdeen Cetacean Catalogue (www.ketosecology.co.uk/ACC.htm), containing photo-identification data from bottlenose dolphins and other species recorded in this area. For the purposes of this study, a collaborative agreement was established to share

46
pictures and data to determine which individuals were photographed along the Aberdeenshire coast during the summers (May-September) of 2006 and 2007. 5.2.1.4 Dr Vincent Janik, University of St Andrews During 2006 and 2007, photo-identification data from the St Andrews Bay area were collected by Dr Vincent Janik and his research student Valentina Islas during related studies of bottlenose dolphin social structure. A collaborative agreement was established to share pictures and data to determine which individuals were photographed within the St Andrews Bay area during the summers (May-September) of 2006 and 2007. 5.2.2 Data collation and quality assurance All collaborators were asked to provide the best quality picture for each of the well-marked dolphins that they had photographed in their study area in both the 2006 and 2007 summer field seasons. These photographs were then graded by the same person (Barbara Cheney) for photographic quality as described in Section 4. Individual photographs were then compared within and across studies to determine whether individuals had been seen in multiple study areas. All matches across study areas were discussed between groups, and confirmed by at least one additional experienced researcher. In addition to the analysis of data collected in 2006 and 2007, archive photographs of some well-marked animals were available from some of these areas in other years. Because these photographs were often not collected in a systematic way, these data could not be used in a formal analysis of abundance or movement rates. Nevertheless, such data do provide an opportunity to detect long-range movements that could be occurring over longer time-scales. We therefore compared archive photographs of well-marked animals across west and east coast studies to determine whether individuals had been seen in multiple study areas (see Figure 5.1).
Figure 5.1. The areas used for the multi-site mark-recapture.
1 2
3
4
5
61 2
3
4
5
6
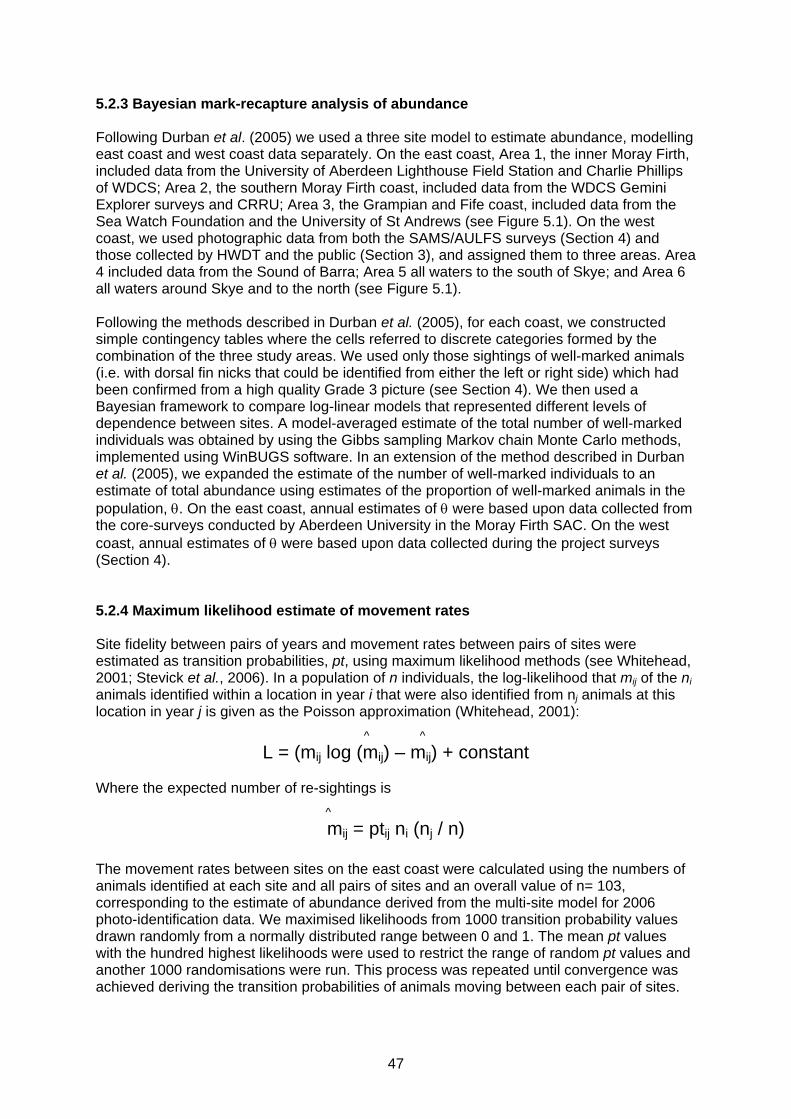
47
5.2.3 Bayesian mark-recapture analysis of abundance Following Durban et al. (2005) we used a three site model to estimate abundance, modelling east coast and west coast data separately. On the east coast, Area 1, the inner Moray Firth, included data from the University of Aberdeen Lighthouse Field Station and Charlie Phillips of WDCS; Area 2, the southern Moray Firth coast, included data from the WDCS Gemini Explorer surveys and CRRU; Area 3, the Grampian and Fife coast, included data from the Sea Watch Foundation and the University of St Andrews (see Figure 5.1). On the west coast, we used photographic data from both the SAMS/AULFS surveys (Section 4) and those collected by HWDT and the public (Section 3), and assigned them to three areas. Area 4 included data from the Sound of Barra; Area 5 all waters to the south of Skye; and Area 6 all waters around Skye and to the north (see Figure 5.1). Following the methods described in Durban et al. (2005), for each coast, we constructed simple contingency tables where the cells referred to discrete categories formed by the combination of the three study areas. We used only those sightings of well-marked animals (i.e. with dorsal fin nicks that could be identified from either the left or right side) which had been confirmed from a high quality Grade 3 picture (see Section 4). We then used a Bayesian framework to compare log-linear models that represented different levels of dependence between sites. A model-averaged estimate of the total number of well-marked individuals was obtained by using the Gibbs sampling Markov chain Monte Carlo methods, implemented using WinBUGS software. In an extension of the method described in Durban et al. (2005), we expanded the estimate of the number of well-marked individuals to an estimate of total abundance using estimates of the proportion of well-marked animals in the population, . On the east coast, annual estimates of were based upon data collected from the core-surveys conducted by Aberdeen University in the Moray Firth SAC. On the west coast, annual estimates of were based upon data collected during the project surveys (Section 4). 5.2.4 Maximum likelihood estimate of movement rates Site fidelity between pairs of years and movement rates between pairs of sites were estimated as transition probabilities, pt, using maximum likelihood methods (see Whitehead, 2001; Stevick et al., 2006). In a population of n individuals, the log-likelihood that mij of the ni animals identified within a location in year i that were also identified from nj animals at this location in year j is given as the Poisson approximation (Whitehead, 2001):
^ ^
L = (mij log (mij) – mij) + constant Where the expected number of re-sightings is
^
mij = ptij ni (nj / n) The movement rates between sites on the east coast were calculated using the numbers of animals identified at each site and all pairs of sites and an overall value of n= 103, corresponding to the estimate of abundance derived from the multi-site model for 2006 photo-identification data. We maximised likelihoods from 1000 transition probability values drawn randomly from a normally distributed range between 0 and 1. The mean pt values with the hundred highest likelihoods were used to restrict the range of random pt values and another 1000 randomisations were run. This process was repeated until convergence was achieved deriving the transition probabilities of animals moving between each pair of sites.

48
5.3 Results 5.3.1 East coast abundance estimate Overall, a total of 88 and 93 well-marked individuals were identified from Grade 3 photographs in the summers of 2006 and 2007 respectively. In both years, a high proportion of individuals were recorded in more than one of the three study areas (Table 5.1). Model-averaged estimates of the total number of well-marked individuals in 2006 and 2007 were 103 and 142 (Table 5.2). Extrapolation to total abundance using available data on produced estimates of 193 and 237, with 95% probability intervals ranging between 162 and 737 (Table 5.2) Individual use of these three east coast areas is shown in Table 5.3. Table 5.1. The number of well-marked individuals recorded in different combinations of the
three study areas on the east coast.
2006 2007 All 3 Areas 9 10 SAC 45 47 Only SAC 7 20 Outer Moray Firth 52 33 Only Outer Moray Firth 2 1 Grampian & Fife 51 55 Only Grampian & Fife 28 40 SAC and Outer Moray Firth (only) 28 17 SAC and Grampian & Fife (only) 1 0 Outer Moray Firth and Grampian & Fife (only) 13 5 Total number of well-marked individuals 88 93
Table 5.2. Model-averaged estimates of a) the number of well-marked individuals and b) the
total number of all individual dolphins using the east coast of Scotland in the summers of 2006 and 2007.
Median 95 % Probability Interval
a) Well-marked individuals
2006 103 89-129 2007 142 111-440
b) All individuals
2006 193 162-245 2007 237 181-735
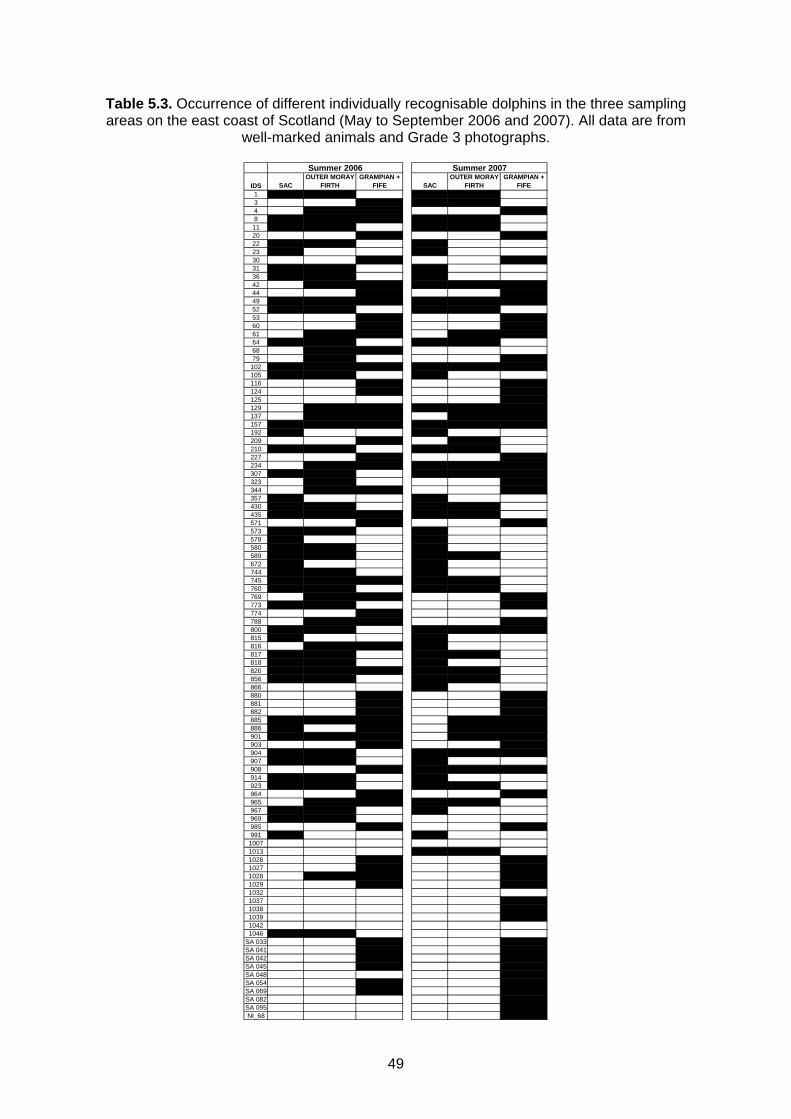
49
Table 5.3. Occurrence of different individually recognisable dolphins in the three sampling areas on the east coast of Scotland (May to September 2006 and 2007). All data are from
well-marked animals and Grade 3 photographs.
IDS SACOUTER MORAY
FIRTHGRAMPIAN +
FIFE SACOUTER MORAY
FIRTHGRAMPIAN +
FIFE1 1 1 1 13 34 4 4 48 8 8 8 8 811 11 11 11 1120 20 2022 22 22 22
23 23 23
30 30 3031 31 31 3136 36 36 3642 42 42 42 42 4244 44 4449 49 49 49 49 49 4952 52 52 52 5253 53 5360 60 6061 61 61 61 6164 64 64 64 6468 68 6879 79 79
102 102 102 102 102 102 102105 105 105 105116 116 116124 124 124125 125129 129 129 129 129 129137 137 137 137 137157 157 157 157 157 157 157192 192 192
209 209 209210 210 210 210 210227 227 227234 234 234 234 234 234307 307 307 307 307 307323 323 323344 344 344 344357 357 357430 430 430 430 430435 435 435 435 435 435571 571 571573 573 573 573
578 578 578
580 580 580 580
589 589 589 589 589672 672 672
744 744 744 744
745 745 745 745 745 745760 760 760 760 760769 769 769 769773 773 773 773774 774788 788 788 788800 800 800 800 800 800815 815 815
816 816 816 816
817 817 817 817 817
818 818 818 818
820 820 820 820 820 820856 856 856 856 856866 866
880 880 880881 881 881882 882 882885 885 885 885 885 885886 886 886 886 886901 901 901 901 901 901903 903 903904 904 904 904 904 904907 907 907 907
908 908 908 908 908914 914 914 914
923 923 923 923 923964 964 964965 965 965 965 965967 967 967 969969 969 969985 985 985991 991 99110071013 1013 10131026 1026 10261027 1027 10271028 1028 1028 10281029 1029 102910321037 10371038 10381039 103910421046 1046 1046
SA 033 SA 033 SA 033SA 041 SA 041 SA 041SA 042 SA 042 SA 042SA 045 SA 045 SA 045SA 048 SA 048SA 054 SA 054 SA 054SA 069 SA 069 SA 069SA 082 SA 082SA 095 SA 095NI_68 NI_68
Summer 2006 Summer 2007

50
5.3.2 West coast abundance estimate Overall, a total of 18 and 22 well-marked individuals were identified from Grade 3 photographs in the summers of 2006 and 2007 respectively (Table 5.4). Model-averaged estimates of the total number of well-marked individuals in 2006 and 2007 were 25 and 30 (Table 5.5). Extrapolation to total abundance using available data on produced estimates of 45 in both years, with 95% probability intervals ranging between 31 and 71 (Table 5.5) Individual use of these three west coast areas is shown in Table 5.6. Table 5.4. Number of well-marked individuals recorded in different combinations of the three
study areas on the west coast.
2006 2007 All 3 Areas 0 0 Skye & north 11 14 Only Skye & north 3 5 South of Skye 8 9 Only south of Skye 0 0 Barra 7 8 Only Barra 7 8 North and south of Skye (only) 8 9 Skye & north and Barra (only) 0 0 Barra and south of Skye (only) 0 0 Total number of well-marked individuals 18 22
Table 5.5. Model-averaged estimates of a) the number of well-marked individuals and b) the total number of all individual dolphins using the west coast of Scotland in the summers of
2006 and 2007. Median 95 % Probability Interval
a) Well-marked individuals
2006 25 19-37 2007 30 23-42
b) All individuals
2006 45 31-71 2007 45 33-66

51
Table 5.6. Occurrence of different individually recognisable dolphins in the three sampling areas on the west coast of Scotland in 2006 and 2007. All data are from well-marked
animals and Grade 3 photographs.
ID # NORTH SOUTH BARRA NORTH SOUTH BARRA5001 1 15002 1 15004 1 15005 1 15006 1 15008 1 15009 1 15012 15017 1 1 1 15018 1 1 1 15019 1 1 1 15020 1 1 1 15021 1 1 1 15022 1 15023 1 15024 1 1 1 15025 1 1 1 15026 1 1 1 15030 1 15039 1 15043 15045 1
2006 2007
5.3.3 Movement rates The photo-identification data collected at all three east coast sites (Table 5.7) show relatively high numbers of animals recorded using more than one site. The calculated transition probabilities between these sites are accordingly relatively high (Table 5.7). The transition probability between the SAC and the Outer Moray Firth is slightly higher than for movement between the other pairs of sites and it appears that the movement rates are correlated to distance between the sites. These results indicate a high degree of mixing of individuals between sites and do not show a structured pattern of movement we would expect from a highly structured and social partitioned assemblage of animals.
Table 5.7. Movement of individuals between locations (nij) expressed as transition probabilities (ptij) (n is the number of individuals identified at each location using photo-
identification data).
Movement of dolphins
ni nj nij Transition probabilities (0-1)
SAC and Outer Moray Firth
54 57 46 0.80
SAC and Grampian/Fife
54 65 21 0.75
Outer Moray Firth and Grampian/Fife
57 65 32 0.76

52
5.3.4 Long distance movements Comparison of archive pictures of well-marked dolphins from the University of Aberdeen/SMRU catalogue and the HWDT catalogue produced no matches. However, seven individuals that were photographed on the east coast by CRRU were later recorded on the west coast by HWDT. All these animals were part of a group of 15-20 dolphins that were seen along the southern shore of the outer Moray Firth on four occasions in July 2001. All seven dolphins were photographed by HWDT in the summers of 2002, 2004 and 2005, and one of them (5024) was also recorded during our SAMS/AULFS surveys in 2006 and 2007.
5.4 Discussion 5.4.1 Estimates of abundance This report presents the first comprehensive estimates of abundance of bottlenose dolphins in inshore waters of mainland Scotland and the Western Isles. The estimates do not cover the Northern Isles of Orkney and Shetland. For the east coast, the estimates are the first to include all available data from the Moray Firth to St Andrews Bay. For the west coast of Scotland they are the first such estimates. Robust estimates of abundance (as these are) are arguably the single most important information for conservation and management; these are thus highly significant results. 5.4.1.1 East coast For the east coast, our estimate for 2006 (193, 95% Probability Interval: 162-245) is much more precise that our estimate for 2007 (237, 95% PI: 181-735) (Table 5.2). We therefore consider the 2006 estimate to be the best estimate of the number of bottlenose dolphins in the area. There are few other records of bottlenose dolphins outwith our sampling area so this is also an appropriate estimate for the North Sea. The best estimate for the east coast is higher than the still widely used estimate for this area of 129 (95% Confidence Interval: 110-174) for 1992 calculated from Moray Firth data only (Wilson et al., 1999). However, it is important not to over-interpret the significance of this difference because of the difference in the area over which the data were collected and the different methodology used for estimation. In particular, it is not possible to infer from these results that the east coast population has increased in size over this period to the extent suggested by the point estimates. In a demonstration of the methodology used here, Durban et al. (2005) estimated a population of 85 (95% PI: 76-263) well-marked dolphins on the east coast of Scotland in 2001. This figure is equivalent to the 103 (95% PI: 89-129) well-marked dolphins estimated here for 2006 (Table 5.2). The point estimate for 2006 is higher than for 2001 but the probability interval for the 2006 estimate is entirely included within that for 2001 indicating that these estimates are not statistically different. Estimates of the number of bottlenose dolphins using the Moray Firth SAC in the period 2002-2007 have been made by Thompson et al. (2006; 2009). Point estimates ranged from 71 to 111, with 95% confidence limits that ranged from a low of 66 to a high of 161, and with 95% confidence intervals that overlapped considerably. Our estimate for the whole east coast of 193 (95% PI: 162-245) is significantly higher than any of these estimates for the Moray Firth. The estimates were calculated using different analytical methods but the difference nevertheless suggests that not all of the animals in the east coast population use the Moray Firth, as also noted by Thompson et al. (2006; 2009).

53
Quick (2006) estimated the number of bottlenose dolphins in the St Andrews Bay area in 2003/2004 using both conventional and Bayesian methods of analysis. The best estimates were 89 and 112, respectively, included in a conservative 95% confidence range of 81-142. When compared with our estimate of 193 (95% PI: 162-245), this suggests that a substantial proportion of the east coast population uses the St Andrews Bay area, at least in summer. 5.4.1.2 West coast For the west coast, our estimates for 2006 (45, 95% Probability Interval: 31-71) and 2007 (45, 95% PI: 33-66) (Table 5.2) are identical but the estimate for 2007 is more precise and we consider this to be the best estimate of the number of bottlenose dolphins in the area. The only previous estimate for this area is from Barra, where Grellier & Wilson (2003) estimated 6-15 individuals (point estimate of 8-9 individuals) from data collected in 1995 and 1998. This compares well with our data from 2006 and 2007, which comprised a total of 13-15 individuals, none of which were seen elsewhere, and four of which were re-sightings of individuals seen in 1995/1998. 5.4.1.3 Scottish dolphin abundance in a wider context The abundance of small cetacean populations in European Atlantic continental shelf waters from 62ºN to the Straits of Gibraltar has been estimated from ship-board and aerial surveys in 2005 (SCANS-II, 2008). The estimate of bottlenose dolphin abundance in this area was 12,645 (95% CI: 7,500-21,300). The analysis was unable to correct for animals missed on the transect line so these estimates are negatively biased (too low). SCANS-II found bottlenose dolphins around the coasts of England, Wales and Ireland but the highest densities (and numbers) were estimated in the Celtic Sea, including the south coast of Ireland (5,370; 95% CI: 2,200-13,300) and around the coasts of Spain and Portugal (3,935; 95% CI: 1,900-8,100). The surveys were not designed to estimate abundance in small areas so no direct comparison is possible with our estimates for Scottish waters. However, it is worth noting that the SCANS-II estimates from survey blocks that included Scottish waters (including Orkney and Shetland) were of the same order of magnitude (100s) as our estimates presented here. In 2007, offshore surveys of waters to the west of the SCANS-II survey area (waters deeper than 200 m) estimated 19,295 (95% CI: 11,842-31,440) bottlenose dolphins, 5,700 (95% CI: 2,900-11,100) of which were in waters north of 53ºN, including offshore Scottish waters (CODA 2009). The highest density (and number) of animals was estimated in offshore waters from 45-53 ºN (11,536; 95% CI: 6,100-21,700). As in SCANS-II, the analysis was unable to correct for animals missed on the transect line so these estimates are negatively biased (too low). These estimates from larger scale surveys illustrate that our estimates for mainland Scotland and the Western Isles are a small proportion of the populations living in European waters. 5.4.2 Movement of dolphins between sites We found that the rate of movement of dolphins between all three east coast sites is high; an animal found at any one site has at least a 75% chance of also being found at another site in the same year. The results are suggestive of a higher rate of exchange of dolphins between the two sites that are closest in distance (inner and outer Moray Firth) but it is likely that this rate is not statistically significantly different from the rates between the other sites.

54
Although these results do not provide information on the ranging patterns of individual dolphins, they clearly demonstrate that the population of bottlenose dolphins off the east coast of Scotland is highly mobile with the majority of individuals ranging from the inner Moray Firth to Fife. The population cannot, therefore, be subdivided into separate units based on area alone. The results of genetic analyses (Section 6) show some but not complete isolation between animals found on the east coast and those on the west coast and elsewhere in Britain and Ireland, Together, these results show that the east coast population should continue to be considered as a single separate unit for management purposes. Prior to the commencement of the project it was the intention to estimate rates of movement (transition probabilities) between the east and west coast sites. The lack of any matches between east and west coasts in 2006 and 2007 rendered this analysis redundant. However, archive photographs from previous years did provide evidence for such movement. Furthermore, subsequent comparisons have shown that three of these dolphins could also be matched with bottlenose dolphins photographed on the west coast of Ireland by the Irish Whale and Dolphin Group (Robinson et al., 2009). These photographic matches support the results of the genetic analysis (Section 6) for partial isolation between dolphins found on the east and west coasts.

55
6 ASSESSMENT OF POPULATION STRUCTURE USING MOLECULAR ANALYSES OF TISSUES FROM STRANDINGS Authors: Murray-Dickson, G., Berrow, S., Reid, R.J., Thompson, P.M. & Piertney, S.
6.1 Introduction Bottlenose dolphins currently have a discontinuous distribution around the Scottish coast (Section 2). On the east coast of Scotland, bottlenose dolphins are regularly seen around the Moray Firth and surrounding waters (Wilson et al., 1999; Stockin et al., 2006), whilst in the west a smaller number of individuals appear to occur around the Sound of Barra and throughout the Hebrides (Sections 3 and 4). Elsewhere in the UK and Ireland, bottlenose dolphin distribution also appears patchy, with the main population strongholds occurring in Cardigan Bay in Wales (Pesante et al., 2008) and the Shannon Estuary in Ireland (Berrow et al., 1996; Ingram & Rogan, 2002). This contemporary distribution is difficult to reconcile with historical stranding records that indicate a more continuous distribution of dolphins along both the east and west coasts of the UK during the early part of the 20th century (Parsons et al., 2002; Section 2). Concerns over the fragmentation of bottlenose dolphin populations and low population sizes have resulted in the Moray Firth, Shannon Estuary and Cardigan Bay sites being designated as Special Areas of Conservation (SACs) under the European Habitats Directive. However, it is unclear to what extent these SACs represent meaningful population subdivisions, particularly because observational data make it difficult to understand levels of contemporary exchange of individuals between areas and populations. Examination of the spatial distribution of genetic diversity has proven invaluable for identifying population subdivisions indicative of geographically isolated, demographically independent populations that may warrant separate management or conservation status (Frankham et al., 2002; Moritz, 1994). An initial survey by Parsons et al. (2002) used DNA sequence variation across the mitochondrial DNA control region to examine levels of population divergence between dolphins sampled from the Moray Firth, the west coast of Scotland, Cardigan Bay, the English Channel and Ireland. However, these analyses of maternally inherited mitochondrial DNA could not be used to evaluate the potential for male biased dispersal and gene flow among these populations. The fifth objective of this study was to determine the potential for molecular analyses of DNA from stranded bottlenose dolphins that will complement photo-identification studies and assess relationships between dolphins using the SAC and those found along other Scottish coasts. Although stranded bottlenose dolphins have been recorded fairly regularly from the east coast of Scotland, recent records from other Scottish coasts are rare (Section 2). We therefore make use of samples from other UK and Irish waters to maximise the power of molecular analyses to assess relationships between dolphins using the Moray Firth SAC and dolphins from adjacent waters. In this section, we extend and expand the initial Parsons et al. (2002) survey of genetic diversity within, and genetic divergence between, the putative populations of bottlenose dolphins around the UK. We augment the original mitochondrial dataset by including 18 new samples and sequencing a larger region of the mitochondrial genome. In addition, we provide the first description of the spatial distribution of genetic diversity across 10 microsatellite markers.
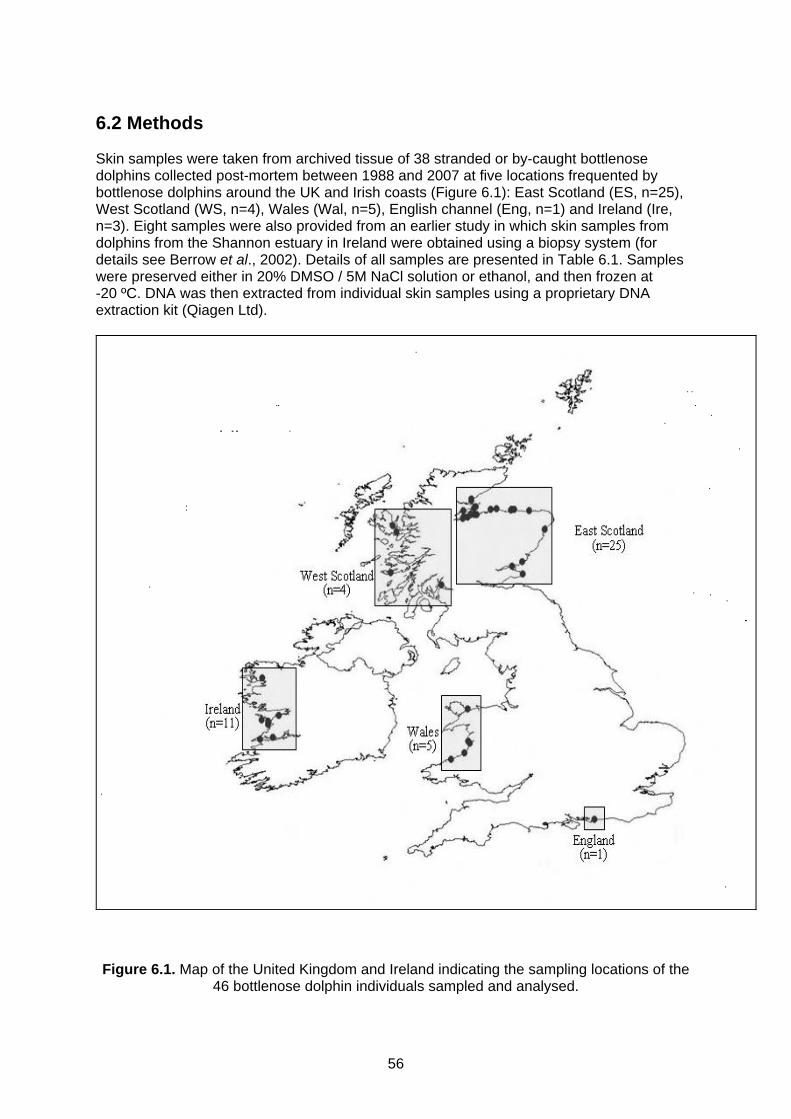
56
6.2 Methods Skin samples were taken from archived tissue of 38 stranded or by-caught bottlenose dolphins collected post-mortem between 1988 and 2007 at five locations frequented by bottlenose dolphins around the UK and Irish coasts (Figure 6.1): East Scotland (ES, n=25), West Scotland (WS, n=4), Wales (Wal, n=5), English channel (Eng, n=1) and Ireland (Ire, n=3). Eight samples were also provided from an earlier study in which skin samples from dolphins from the Shannon estuary in Ireland were obtained using a biopsy system (for details see Berrow et al., 2002). Details of all samples are presented in Table 6.1. Samples were preserved either in 20% DMSO / 5M NaCl solution or ethanol, and then frozen at -20 ºC. DNA was then extracted from individual skin samples using a proprietary DNA extraction kit (Qiagen Ltd).
Figure 6.1. Map of the United Kingdom and Ireland indicating the sampling locations of the
46 bottlenose dolphin individuals sampled and analysed.

57
Table 6.1. Details of samples used for molecular analyses
NORTH EAST LOCATION DATE_FOUND SEX ES 57.76 -3.90 Balintore, Highland 31/07/1988 M ES 57.52 -4.21 Kilmuir, Highland 18/08/1989 F ES 57.59 -3.85 Nairn , Highland 18/07/1990 F ES 57.66 -3.66 Culbin Sands, Moray 17/05/1992 F ES 57.70 -3.48 Burghead, Moray 11/08/1992 F ES 57.69 -2.93 Portessie, Moray 11/10/1992 M ES 57.91 -4.00 Embo, Highland 02/02/1993 M ES 57.51 -4.23 North Kessock, Highland 31/05/1993 F ES 57.73 -3.33 Lossiemouth, Moray 12/09/1993 F ES 57.67 -4.22 Balblair, Highland 02/10/1993 F ES 57.94 -4.00 Golpsie, Highland 07/12/1993 M ES 57.53 -4.10 Inverness, Highland 23/04/1994 M ES 57.59 -3.91 Nairn, Highland 06/08/1995 F ES 57.77 -3.89 Hilton Of Cadboll, Highland 31/12/1995 M ES 57.53 -4.20 Munlochy Bay, Highland 17/06/1996 M ES 57.74 -3.92 Shandwick, Highland 30/03/1999 F ES 57.68 -2.45 Macduff, Moray 26/08/1999 M ES 57.70 -2.91 Findochty, Moray 07/12/1999 F ES 57.70 -2.91 Findochty, Moray 07/12/1999 F ES 57.27 -2.02 Pettens Links, Grampian 21/12/1999 M ES 57.70 -2.84 Portknockie, Grampian 31/07/2000 F ES 57.60 -4.01 Ardersier, Highland 23/05/2001 F ES 56.54 -2.62 Elliot, Tayside 02/08/2004 M ES 57.55 -4.20 Balone, Highland 20/08/2004 M ES 56.26 -2.61 Crail, Fife 09/06/2005 F ES 56.44 -2.90 Tayport, Fife 19/06/2006 M WS 56.02 -4.80 Gare Loch, Argyll 01/03/1994 F WS 57.21 -6.01 Isle Of Skye. Highland 25/01/1998 F WS 56.29 -6.17 Mull, Argyll 23/06/1999 n.a. WS 57.35 -6.10 Isle Of Skye, Highland 02/04/2001 M Wal 53.26 -4.10 Gallows Point, Gwynedd 13/09/1991 F Wal 52.53 -4.08 Ynyslas, Dyfed 15/09/1993 F Wal 52.27 -4.19 Llannon, Dyfed 22/07/1991 M Wal 52.49 -4.05 Borth, Dyfed 17/04/1991 M Wal 52.13 -4.54 Aberporth, Dyfed 24/10/1993 M Ire 53.95 -9.63 Tarbert, Shannon 22/09/2000 M Ire 52.63 -9.34 Clonderlaw, Shannon 19/09/2000 M Ire 53.02 -9.65 Killimer, Shannon 19/09/2000 M Ire 53.02 -9.67 Carrig, Shannon 22/09/2000 F Ire 52.57 -9.69 Kilcredaun, Shannon 20/09/2000 M Ire 52.57 -9.69 Kilcredaun, Shannon 20/09/2000 M Ire 52.58 -9.76 SW Ireland 25/08/1993 n.a Ire 52.58 -9.75 SW Ireland 24/07/1997 n.a Ire 52.70 -9.70 SW Ireland 24/07/1997 n.a Ire 53.02 -9.18 Foynes, Shannon 22/09/2000 F Ire 52.95 -9.47 Glin, Shannon 22/09/2000 M
Eng 50.78 -0.68 Bognor, Sussex 07/10/1991 F
58
6.2.1 Mitochondrial DNA sequencing and analysis PCR analyses of maternally inherited mitochondrial DNA were conducted at two different sites within the mitochondrial genome. First, a 549 base pair (bp) fragment of the mitochondrial control region was amplified using primers developed by Eggert et al. (1998) and Rosel et al. (1995). Second, we amplified the entire mitochondrial cytochrome b region (1040 bp) using primers developed by Harlin-Cognato & Honeycutt (2006). PCR products were then purified using the QIAquick PCR purification system (Qiagen Ltd), and sequenced on a Perkin-Elmer ABI 3730XL automated DNA sequencer. Control region and cytochrome b sequence chromatograms were edited using MEGA version 4 (Tamura et al., 2007). Multiple sequence alignments were obtained for the control region and cytochrome b sequences separately using CLUSTAL W (Higgins et al., 1994) and subsequently integrated to give a single sequence per individual. The sequence of base pairs in these individual sequences was then compared to determine how many different variants, or haplotypes, existed. We then assessed evolutionary relationships between different haplotypes using a maximum–likelihood approach in PAUP version 4.0b10 (Swofford, 1997). Following standard procedures, data from a more distant relative (here Delphinus delphus) were used to root the phylogenetic tree, and a bootstrap analysis (1000 replicates) was used to assess the stability of the nodes within the tree. 6.2.2 Microsatellite genotyping Analyses of di-parentally inherited nuclear DNA were conducted at 10 microsatellite loci using cetacean primer sets known to be polymorphic in bottlenose dolphins (Table 6.2). These analyses were carried out on all samples except the single individual from the English Channel. PCR amplifications were performed using a MJ Research PTC-100 thermal cycler and all included DNA-absent negative controls. Three different microsatellite fragments labelled with different fluorescent tags (6-FAM, HEX and NED; Table 6.2) were then genotyped using an ABI 3720 automated DNA sequencer. Microsatellite genotypes were scored using GeneMarker software (version 1.71, SoftGenetics, LLC). Multilocus FIS was calculated for each population, and we tested for deviation from Hardy-Weinberg expectations by permutation using FSTAT version 2.9.3 (Goudet, 2001). Three estimates of genetic diversity were calculated for each of the four putative populations (East Scotland, West Scotland, Ireland and Wales). First, we estimated the total number of alleles at each of the 10 microsatellite loci. Second, we estimated allelic richness at each locus and, finally, we used Nei’s (1978) unbiased estimate of observed heterozygosity (HO) using FSTAT. To infer population structure and identify dispersing individuals, a Bayesian model-based clustering method was applied to these data using STRUCTURE version 2.1 (Pritchard et al., 2000) This approach assigns individuals probabilistically to populations that are characterised by a set of allele frequencies at each locus but assumes no prior information.
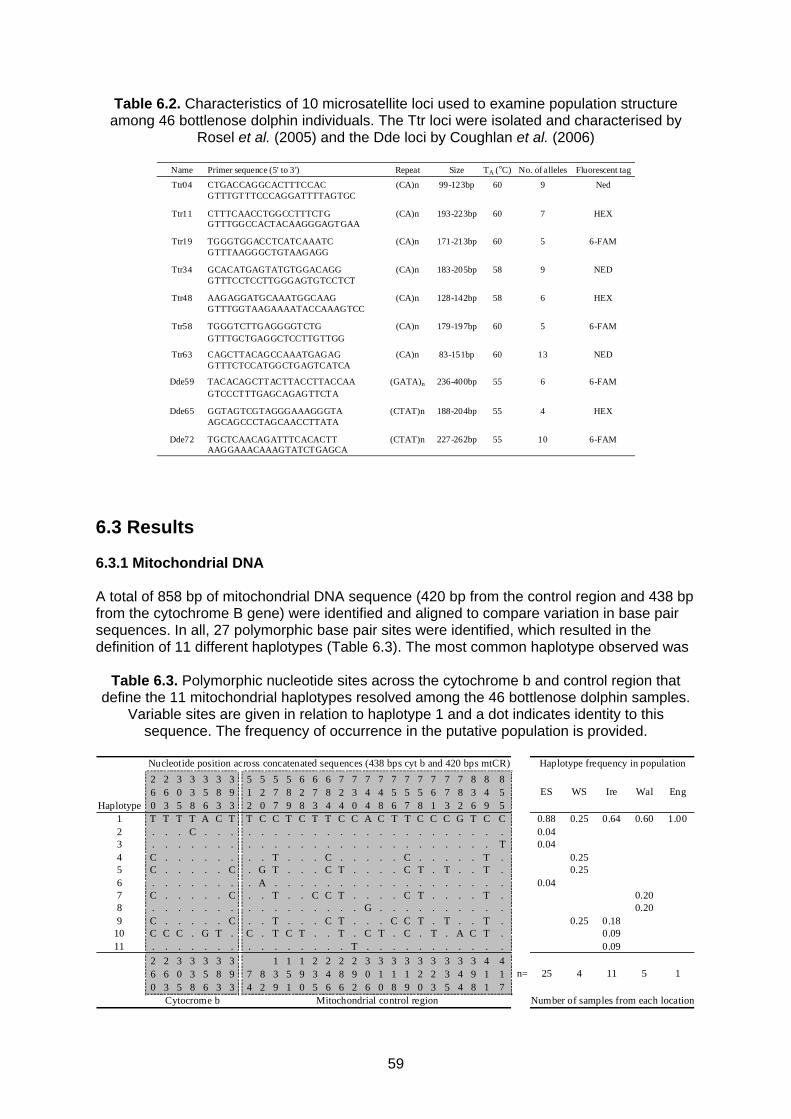
59
Table 6.2. Characteristics of 10 microsatellite loci used to examine population structure among 46 bottlenose dolphin individuals. The Ttr loci were isolated and characterised by
Rosel et al. (2005) and the Dde loci by Coughlan et al. (2006)
Name Primer sequence (5' to 3') Repeat Size TA (°C) No. of alleles Fluorescent tag
Ttr04 CTGACCAGGCACTTTCCAC (CA)n 99-123bp 60 9 NedGTTTGTTTCCCAGGATTTTAGTGC
Ttr11 CTTTCAACCTGGCCTTTCTG (CA)n 193-223bp 60 7 HEXGTTTGGCCACTACAAGGGAGTGAA
Ttr19 TGGGTGGACCTCATCAAATC (CA)n 171-213bp 60 5 6-FAMGTTTAAGGGCTGTAAGAGG
Ttr34 GCACATGAGTATGTGGACAGG (CA)n 183-205bp 58 9 NEDGTTTCCTCCTTGGGAGTGTCCTCT
Ttr48 AAGAGGATGCAAATGGCAAG (CA)n 128-142bp 58 6 HEXGTTTGGTAAGAAAATACCAAAGTCC
Ttr58 TGGGTCTTGAGGGGTCTG (CA)n 179-197bp 60 5 6-FAMGTTTGCTGAGGCTCCTTGTTGG
Ttr63 CAGCTTACAGCCAAATGAGAG (CA)n 83-151bp 60 13 NEDGTTTCTCCATGGCTGAGTCATCA
Dde59 TACACAGCTTACTTACCTTACCAA (GATA)n 236-400bp 55 6 6-FAMGTCCCTTTGAGCAGAGTTCTA
Dde65 GGTAGTCGTAGGGAAAGGGTA (CTAT)n 188-204bp 55 4 HEXAGCAGCCCTAGCAACCTTATA
Dde72 TGCTCAACAGATTTCACACTT (CTAT)n 227-262bp 55 10 6-FAMAAGGAAACAAAGTATCTGAGCA
6.3 Results 6.3.1 Mitochondrial DNA A total of 858 bp of mitochondrial DNA sequence (420 bp from the control region and 438 bp from the cytochrome B gene) were identified and aligned to compare variation in base pair sequences. In all, 27 polymorphic base pair sites were identified, which resulted in the definition of 11 different haplotypes (Table 6.3). The most common haplotype observed was
Table 6.3. Polymorphic nucleotide sites across the cytochrome b and control region that define the 11 mitochondrial haplotypes resolved among the 46 bottlenose dolphin samples.
Variable sites are given in relation to haplotype 1 and a dot indicates identity to this sequence. The frequency of occurrence in the putative population is provided.
Haplotype
260
263
305
338
356
383
393
512
520
577
589
628
673
684
724
730
744
748
756
757
758
761
773
782
836
849
855
ES WS Ire Wal Eng
1 T T T T A C T T C C T C T T C C A C T T C C C G T C C 0.88 0.25 0.64 0.60 1.002 . . . C . . . . . . . . . . . . . . . . . . . . . . . 0.043 . . . . . . . . . . . . . . . . . . . . . . . . . . T 0.044 C . . . . . . . . T . . . C . . . . . C . . . . . T . 0.255 C . . . . . C . G T . . . C T . . . . C T . T . . T . 0.256 . . . . . . . . A . . . . . . . . . . . . . . . . . . 0.047 C . . . . . C . . T . . C C T . . . . C T . . . . T . 0.208 . . . . . . . . . . . . . . . . G . . . . . . . . . . 0.209 C . . . . . C . . T . . . C T . . . C C T . T . . T . 0.25 0.18
10 C C C . G T . C . T C T . . T . C T . C . T . A C T . 0.0911 . . . . . . . . . . . . . . . T . . . . . . . . . . . 0.09
260
263
305
338
356
383
393
74
82
139
151
190
235
246
286
292
306
310
318
319
320
323
335
344
398
411
417
n= 25 4 11 5 1
Haplotype frequency in populationNucleotide position across concatenated sequences (438 bps cyt b and 420 bps mtCR)
Cytocrome b Mitochondrial control region Number of samples from each location

60
Figure 6.2. Maximum likelihood phylogeny derived mitochondrial sequence data illustrating relationships between the 11 haplotypes identified among 46 dolphins. Haplotype numbers correspond to those given in Table 6.2. Bootstrap confidence indices (1000 replicates) are
provided for internal nodes. The patterning next to each haplotype indicates in which sampling population(s) that sequence was found.
haplotype 1, which was found in 34 of 46 individuals and across all populations. Other haplotypes were found only in particular populations – haplotypes 2, 3 and 6 in eastern Scotland; haplotypes 4 and 5 in western Scotland; haplotypes 10 and 11 in Ireland; and haplotypes 7 and 8 in Wales. Whilst small sample size precludes accurate estimation of population genetic structure from the distribution of individual haplotypes, the level of mitochondrial DNA variation (ST = 0.125; p<0.01) certainly reject the null hypothesis of random mating between individuals across all geographic areas studied. The evolutionary relationships between the individual haplotypes are displayed as a maximum-likelihood phylogeny in Figure 6.2. The phylogeny describes two main groups or clades, the first comprising haplotypes 1, 2, 3, 6, 8, and 11, and the second haplotypes 4, 5, 9 and 11.
Haplotype 1
Haplotype 3
Haplotype 6
Haplotype 8
Haplotype 11
Haplotype 4
Haplotype 5
Haplotype 9
Haplotype 7
Haplotype 10
D. delphis0.005 substitutions/site
Haplotype 2
Haplotype 1
Haplotype 3
Haplotype 6
Haplotype 8
Haplotype 11
Haplotype 4
Haplotype 5
Haplotype 9
Haplotype 7
Haplotype 10
D. delphis0.005 substitutions/site
Haplotype 2
77
64
87
West Scotland
East Scotland
Ireland
England
Wales
West Scotland
East Scotland
Ireland
England
Wales
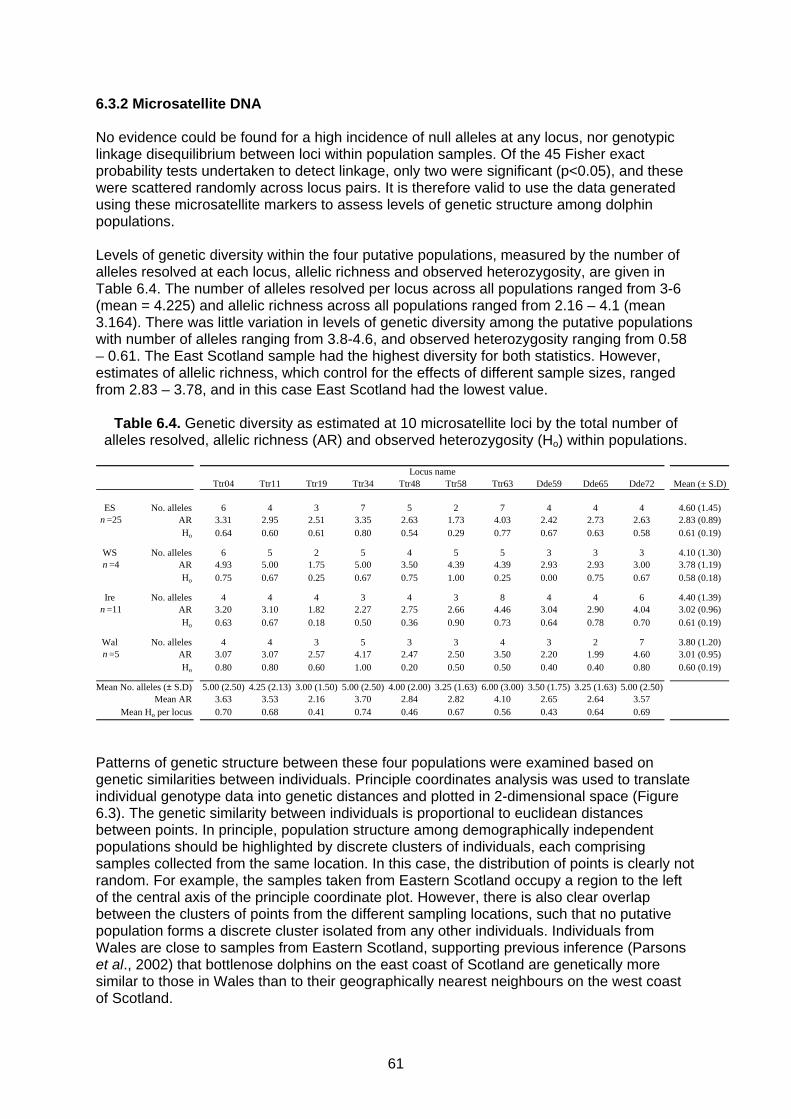
61
6.3.2 Microsatellite DNA No evidence could be found for a high incidence of null alleles at any locus, nor genotypic linkage disequilibrium between loci within population samples. Of the 45 Fisher exact probability tests undertaken to detect linkage, only two were significant (p<0.05), and these were scattered randomly across locus pairs. It is therefore valid to use the data generated using these microsatellite markers to assess levels of genetic structure among dolphin populations. Levels of genetic diversity within the four putative populations, measured by the number of alleles resolved at each locus, allelic richness and observed heterozygosity, are given in Table 6.4. The number of alleles resolved per locus across all populations ranged from 3-6 (mean = 4.225) and allelic richness across all populations ranged from 2.16 – 4.1 (mean 3.164). There was little variation in levels of genetic diversity among the putative populations with number of alleles ranging from 3.8-4.6, and observed heterozygosity ranging from 0.58 – 0.61. The East Scotland sample had the highest diversity for both statistics. However, estimates of allelic richness, which control for the effects of different sample sizes, ranged from 2.83 – 3.78, and in this case East Scotland had the lowest value.
Table 6.4. Genetic diversity as estimated at 10 microsatellite loci by the total number of alleles resolved, allelic richness (AR) and observed heterozygosity (Ho) within populations.
Ttr04 Ttr11 Ttr19 Ttr34 Ttr48 Ttr58 Ttr63 Dde59 Dde65 Dde72 Mean (± S.D)
ES No. alleles 6 4 3 7 5 2 7 4 4 4 4.60 (1.45)n =25 AR 3.31 2.95 2.51 3.35 2.63 1.73 4.03 2.42 2.73 2.63 2.83 (0.89)
Ho 0.64 0.60 0.61 0.80 0.54 0.29 0.77 0.67 0.63 0.58 0.61 (0.19)
WS No. alleles 6 5 2 5 4 5 5 3 3 3 4.10 (1.30)n =4 AR 4.93 5.00 1.75 5.00 3.50 4.39 4.39 2.93 2.93 3.00 3.78 (1.19)
Ho 0.75 0.67 0.25 0.67 0.75 1.00 0.25 0.00 0.75 0.67 0.58 (0.18)
Ire No. alleles 4 4 4 3 4 3 8 4 4 6 4.40 (1.39)n =11 AR 3.20 3.10 1.82 2.27 2.75 2.66 4.46 3.04 2.90 4.04 3.02 (0.96)
Ho 0.63 0.67 0.18 0.50 0.36 0.90 0.73 0.64 0.78 0.70 0.61 (0.19)
Wal No. alleles 4 4 3 5 3 3 4 3 2 7 3.80 (1.20)n =5 AR 3.07 3.07 2.57 4.17 2.47 2.50 3.50 2.20 1.99 4.60 3.01 (0.95)
Ho 0.80 0.80 0.60 1.00 0.20 0.50 0.50 0.40 0.40 0.80 0.60 (0.19)
5.00 (2.50) 4.25 (2.13) 3.00 (1.50) 5.00 (2.50) 4.00 (2.00) 3.25 (1.63) 6.00 (3.00) 3.50 (1.75) 3.25 (1.63) 5.00 (2.50)3.63 3.53 2.16 3.70 2.84 2.82 4.10 2.65 2.64 3.570.70 0.68 0.41 0.74 0.46 0.67 0.56 0.43 0.64 0.69
Locus name
Mean No. alleles (± S.D)Mean AR
Mean Ho per locus Patterns of genetic structure between these four populations were examined based on genetic similarities between individuals. Principle coordinates analysis was used to translate individual genotype data into genetic distances and plotted in 2-dimensional space (Figure 6.3). The genetic similarity between individuals is proportional to euclidean distances between points. In principle, population structure among demographically independent populations should be highlighted by discrete clusters of individuals, each comprising samples collected from the same location. In this case, the distribution of points is clearly not random. For example, the samples taken from Eastern Scotland occupy a region to the left of the central axis of the principle coordinate plot. However, there is also clear overlap between the clusters of points from the different sampling locations, such that no putative population forms a discrete cluster isolated from any other individuals. Individuals from Wales are close to samples from Eastern Scotland, supporting previous inference (Parsons et al., 2002) that bottlenose dolphins on the east coast of Scotland are genetically more similar to those in Wales than to their geographically nearest neighbours on the west coast of Scotland.

62
Figure 6.3. Principle coordinate analysis indicating the genetic relationships among 45 bottlenose dolphin individuals inferred from differences across 10 microsatellite loci. The first
and second axes account for 28.06 % and 23.76 % of the total variance respectively. Symbols indicate the sampling location of each individual.
Figure 6.4. Proportional membership for each bottlenose dolphin individual into four genetic
clusters identified by Structure 2.1 (Pritchard et al., 2000). A suggestion of genetic structure, but a lack of clear distinction between the four putative populations is also apparent from the Structure-based analysis. This analysis was implemented to identify the number of genetically distinct groups from the entire dataset, and then apportion individuals to these respective groups. The most-likely number of genetic groups among samples (k) identified from the analysis was four, which matches the number of main sampling locations used in our study. However, these four groups did not match the four putative sampling populations (Figure 6.4). A proportion of individuals did have a high chance of being assigned membership to one particular genetic group, but individuals sampled from the same location were not necessarily assigned membership to the same
63
genetic group (Figure 6.4). Many individuals could not be ascribed into any one of the four genetic groups with any confidence.
6.4 Discussion The data presented here highlight a level of population genetic structure among the resident populations of dolphins from East Scotland and West Scotland, and those in adjacent waters in Wales and Ireland. However, there appears to be insufficient genetic divergence to suggest that these are demographically isolated populations. At the same time, several of our analyses indicate that animals from these four areas do not form a single randomly mating population. First, the Structure-based analysis that aimed to identify the number of genetic groups represented by our data returned a most-likely estimate of four groups. Secondly, there was a heterogeneous distribution of mitochondrial DNA haplotypes among the putative populations (Figure 6.2). Thirdly, principle coordinate analysis produced an ordination profile that was not a random cluster of individuals as would be expected in the absence of genetic structure, but instead there was some grouping of individuals according to sampling location (Figure 6.3). That said, there are multiple reasons why these data cannot be viewed as indicative of isolated populations, and thus a lack of gene flow between the four regions represented in this study. Firstly, haplotypes did not assort according to geographic sampling location on the phylogenetic tree (Figure 6.2). Secondly, a single haplotype was the most frequent in all the sampled populations. Thirdly, sampling location was not a predictor of individual membership to any of the four genetic groups identified in the Structure analysis (Figure 6.4). Instead, some individuals sampled from the same putative population had a high likelihood of belonging to different genetic groups, suggestive of movement between regions. In other cases, animals could not be assigned to any of the four populations with confidence, consistent with the effects of gene flow homogenising genetic structure. A motivation for this study was to expand and extend the initial survey of genetic structure based upon mitochondrial DNA sequence variation undertaken by Parsons et al. (2002). This previous survey used reduced genetic diversity within the Moray Firth area and significant differences in haplotype frequencies among sampling locations to conclude that the Moray Firth population was both demographically and geographically isolated. Whilst the precautionary principle would indicate that this conclusion was robust given the data, the survey was based on relatively few individuals and only upon mitochondrial DNA sequence variation within a shorter length of mitochondrial DNA than that used in the present study. Here we have also added a number of samples to this original survey, and incorporated an analysis of microsatellite DNA variation. Our data do not refute the overall conclusions of the Parsons et al. (2002) survey, in that there is a signature of genetic structure between locations. However, they do indicate that the populations are not isolated but instead exchange individuals over contemporaneous timescales. Differences between the present study and the Parsons et al. (2002) survey cannot be attributed solely to sex biased dispersal within the bottlenose dolphin populations, which go undetected when only mitochondrial polymorphisms are examined. In bottlenose dolphins, as expected for all mammals (Greenwood, 1980) and has been shown in other cetacean species (Hoelzel et al., 2002), females show increased philopatry relative to males, resulting in higher levels of population genetic divergence for uniparentally inherited mitochondrial DNA markers relative to diparentally inherited nuclear equivalents. Here, genetic structure was apparent from both classes of marker, which is consistent with the findings of other studies on bottlenose dolphins that show reduced dispersal for both sexes (Natoli et al., 2004). Direct, field-based studies of identifiable individuals indicate that bottlenose dolphins have high levels of residency in the Moray Firth (Wilson et al., 1999), the Shannon Estuary

64
(Ingram, 2000) and Cardigan Bay (Pesante et al., 2008). However, even the longest of these studies, at around 20 years, approaches only a single generation time for a long-lived species such as the bottlenose dolphin. This, together with the low probability of detecting known individuals outside core-field sites means that the probability of directly detecting rare long distance movements is likely to be very low. Similarly, short term studies may provide a poor representation of population distributions occurring over longer ecological time-scales. For example, data collected over only a 10 year period suggest that individuals from the Moray Firth population of bottlenose dolphins expanded their range into areas to the south of the Moray Firth SAC (Wilson et al., 2004). Such range expansion has been explained by a change in resource availability in exploited areas (Wilson et al., 2004) and is consistent with the genetic data presented here, indicative of weak underlying structure being eroded by occasional dispersal. Further support for this conclusion has recently emerged, when dolphins were identified in photographs taken over a series of years in the Outer Moray Firth, the west coast of Scotland, and Ireland (Section 5, Cetacean Research & Rescue Unit/Hebridean Whale & Dolphin Trust/ Galway-Mayo Institute of Technology/University of Aberdeen, unpublished data).
A major genetic partitioning among bottlenose dolphin populations appears to be between coastal (nearshore) and pelagic (offshore) ecotypes in both the north-west Atlantic and north-east Pacific (Hoelzel et al., 1998; Natoli et al., 2004; Wells et al., 1999). Coastal and pelagic ecotypes show inherently different signatures of both genetic diversity and population genetic divergence, with the latter showing increased heterozygosity and allelic richness, with reduced levels of between-population differentiation (e.g. Natoli et al., 2004; Quérouil et al., 2007). This was suggested to reflect independent founder events for resident populations in the Gulf of Mexico, Bahamas and a western north Atlantic coastal area, with the pelagic population representing the source populations. Populations in the eastern north Atlantic have a more complex structure and therefore may have experienced either multiple founder events or movements between nearshore resident populations (Natoli et al., 2004). A potentially confounding issue with the present study is in the use of stranded dolphins as a source of DNA and thus reduced confidence that the sampling location matches the true population provenance of that individual. This could potentially enhance levels of purported gene flow either between resident populations or between pelagic and nearshore ecotypes. That said, the detection of four genetic groups within the entire sample, described from individuals with no a priori information on sampling location, indicates that the overall conclusion of genetic structure is unlikely to be a consequence of erroneous structure caused by inherent ecotypic differences.
65
7 WINTER DISTRIBUTION OF BOTTLENOSE DOLPHINS USING THE MORAY FIRTH SPECIAL AREA OF CONSERVATION Authors: Cheney, B., Barton, T.R., Candido, A.T., Elwen, S., Hammond, P.S., Ingram, S., Phillips, C., Pope, A., Thompson, P.M., Weir, C.R. & Wilson, B.
7.1 Introduction Previous studies of bottlenose dolphins in the inner Moray Firth indicate that dolphins occur within the SAC year-round, but that their abundance is lower during the winter months. Year-round photo-identification surveys conducted between 1990 and 1993 indicated that two to three times as many individuals were observed on surveys conducted during the summer months (May-September) than during the winter (October-April) (Figure 3 in Wilson et al., 1997). Analyses of the movements of individually recognisable dolphins also showed that those animals observed during the winter months tended to be seen further inshore, closer to Inverness, during the summer. Although this seasonal pattern was identified almost 20 years ago, the extent to which bottlenose dolphins move outside the Moray Firth SAC in winter remains uncertain. Poor weather conditions often make it difficult to conduct winter surveys in inshore areas, and even harder to survey offshore waters. Furthermore, there have subsequently been changes in the summer distribution of bottlenose dolphins that use the Moray Firth SAC, with a decline in the use of the inshore areas such as the Kessock Channel (Thompson et al., 2000), and an apparent extension of the population’s range to the south (Wilson et al., 2004). Since 1997, photo-identification surveys within the SAC have been restricted to the summer months, and it is therefore not known whether the seasonal patterns observed in Wilson et al.’s (1997) study still persist. A better understanding of seasonal variations in the dolphins’ use of the SAC, and of the areas that this population uses at other times of year is required to address a variety of conservation policy questions. For example, information on seasonal patterns of occurrence in key areas have previously informed the mitigation of potential impacts from coastal developments, and data on the extent to which dolphins move outside the SAC is vital for assessing the potential impact of more distant developments on the conservation status of the population that uses the SAC. The sixth, and final, objective of this study was to identify the winter feeding areas used by the bottlenose dolphin population that uses the Moray Firth SAC. This section of the report describes the work undertaken with the aim of addressing this question.
7.2 Methods This part of the study focussed on Scottish territorial waters along the east coast of Scotland (Figure 7.1). Several approaches were used to better understand winter distribution in this area. First, we tested the use of aerial surveys over the SAC and adjacent waters to describe winter distribution patterns. Second, we conducted year-round photo-identification surveys within the SAC to compare the numbers of individual dolphins using the SAC in summer and winter. Third, we conducted winter photo-identification surveys along the east coast of Scotland to determine whether the dolphins that regularly use the SAC in the

66
summer months were detected on more distant coasts in winter. Finally, we used passive acoustic techniques to describe seasonal and spatial patterns of occurrence of dolphins within the SAC and along adjacent coasts.
#S
#S
#S
#S
#S
#S
Tyneside
Stonehaven
Aberdeen
Inverness
Cromarty
St. Andrews
SACMoray Firth
Firth of Forth
0 50 100 150 Kilometers
S
N
EW
Figure 7.1. East Scotland showing the east coast study sites.
7.2.1 Aerial surveys Aerial surveys broadly followed the SCANS-II line-transect methodology (SCANS-II, 2008). Initially, we aimed to use Partenavia aircraft, with twin engines that would allow surveys to be conducted >1 km offshore, and a high wing design that facilitated observations. However, there are few aircraft of this design for hire in the UK and none in Scotland. Furthermore, surveys required good visibility and low sea state, which were both rare and unpredictable during the winter. In practice, it proved impossible to hire these aircraft at short notice for the relatively short surveys required for our study, especially as aircraft were in demand for larger scale surveys of birds that required less stringent weather windows. As an alternative, we carried out pilot surveys using an Inverness-based Cessna 172 during the winter of 2006/7 (Figure 7.2). Because this was a single-engine aircraft, surveys could only be carried out within 1 km of the shore. Furthermore, surveys were limited in coverage because this aircraft’s licence required it to take off and return to Inverness, such that re-fuelling at more distant airports was not possible.
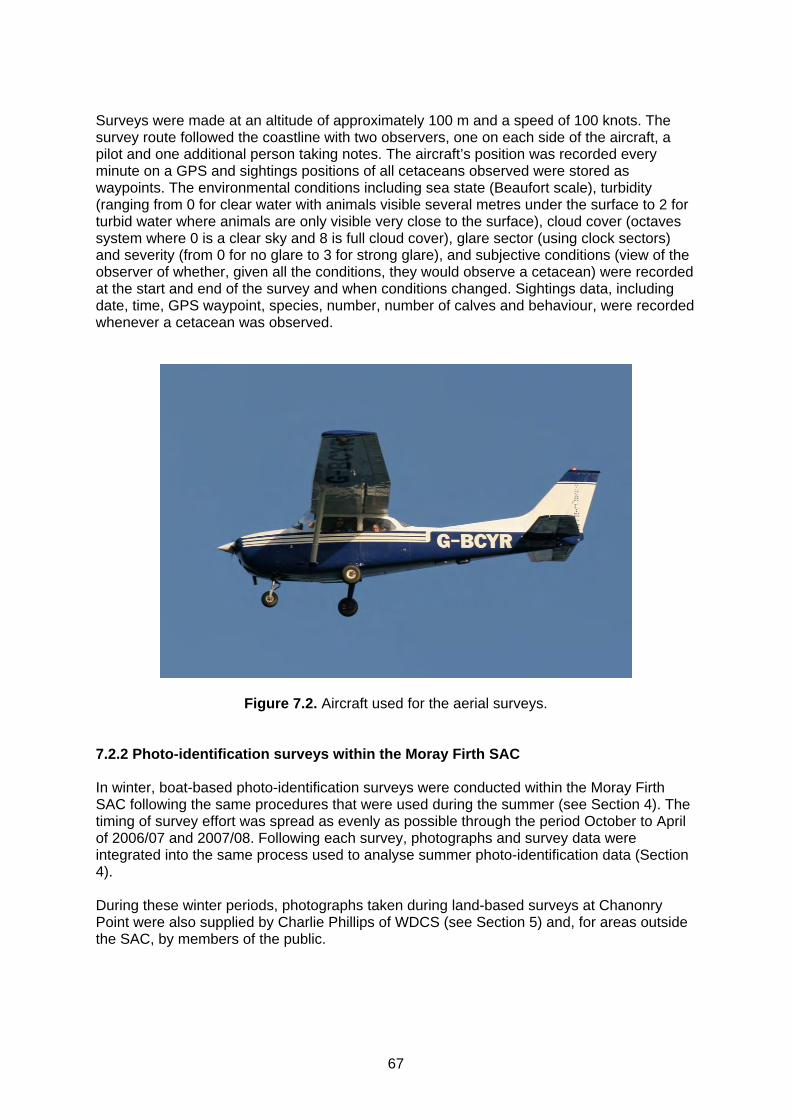
67
Surveys were made at an altitude of approximately 100 m and a speed of 100 knots. The survey route followed the coastline with two observers, one on each side of the aircraft, a pilot and one additional person taking notes. The aircraft’s position was recorded every minute on a GPS and sightings positions of all cetaceans observed were stored as waypoints. The environmental conditions including sea state (Beaufort scale), turbidity (ranging from 0 for clear water with animals visible several metres under the surface to 2 for turbid water where animals are only visible very close to the surface), cloud cover (octaves system where 0 is a clear sky and 8 is full cloud cover), glare sector (using clock sectors) and severity (from 0 for no glare to 3 for strong glare), and subjective conditions (view of the observer of whether, given all the conditions, they would observe a cetacean) were recorded at the start and end of the survey and when conditions changed. Sightings data, including date, time, GPS waypoint, species, number, number of calves and behaviour, were recorded whenever a cetacean was observed.
Figure 7.2. Aircraft used for the aerial surveys.
7.2.2 Photo-identification surveys within the Moray Firth SAC In winter, boat-based photo-identification surveys were conducted within the Moray Firth SAC following the same procedures that were used during the summer (see Section 4). The timing of survey effort was spread as evenly as possible through the period October to April of 2006/07 and 2007/08. Following each survey, photographs and survey data were integrated into the same process used to analyse summer photo-identification data (Section 4). During these winter periods, photographs taken during land-based surveys at Chanonry Point were also supplied by Charlie Phillips of WDCS (see Section 5) and, for areas outside the SAC, by members of the public.

68
7.2.3 Photo-identification surveys beyond the SAC During the winters of both 2006/7 and 2007/8, surveys conducted by Aberdeen University from Cromarty also extended outside the SAC when conditions allowed. Furthermore, some photographs were supplied to the project by WDCS from surveys on board the Gemini Explorer made at the start and end of the winter (see Section 5). In 2007/8, additional photo-identification surveys were conducted along the Grampian coast and in St Andrews Bay. This work was intensified as a result of the logistic difficulties encountered whilst conducting aerial surveys in the first winter of the study (See 7.3.1). For this work, a mobile team of two researchers were based at the University of St Andrews, using the same approach developed for summer photo-identification studies on the west coast (see Section 4). As on the west, effort was also made to link in with local sightings networks, primarily through regional Sea Watch Foundation groups, so that survey work could be targeted in response to sightings from the public. During these winter periods, photographs from areas outside the Moray Firth were also supplied by WDCS, the Sea Watch Foundation and members of the public. 7.2.4 Passive acoustic studies Timing Porpoise Detectors (T-PODs) (Figure 7.3), static acoustic monitoring devices, were used to provide data on seasonal patterns of occurrence of bottlenose dolphins at key sites around the east coast of Scotland. T-PODs incorporate a hydrophone, analogue processor and digital timing system that automatically logs the start and end of each echolocation click to 10 s resolution. In every minute, the T-POD runs six successive scans within different user-defined frequencies, logging detections for periods of up to five months. An accompanying software program is used to post-process the recovered data, detect characteristic click trains, and remove noises from other sources such as boat sonar (see www.chelonia.co.uk for details). Resulting data on the number of click trains recorded in each minute can be used to determine the presence or absence of target species in different time periods, or to identify the timing and duration of encounters with target species. In almost all cases, we used Version 4 and Version 5 T-PODs to detect echolocation click trains and processed all data using version 8.24 of the manufacturer’s software (version 4.1 train filter). Following the manufacturer’s guidelines for use in areas where both harbour porpoises and bottlenose dolphins might be detected, T-PODs were configured to detect clicks from dolphins and porpoises on alternate channels. For dolphins, we set a target frequency of 50 kHz and a reference frequency of 70 kHz. For porpoises, we set a target frequency of 130 kHz and reference of 92 kHz. In the latter stages of the study, we also deployed three Version 0 C-PODs, a recently developed digital version of the T-POD (see www.chelonia.co.uk for details). These were deployed at the two more offshore sites in Block 17/3 and the coastal site at Culbin during the summer of 2008 (see Figure 7.4). Theoretically, C-PODs are more sensitive than T-PODS, but no data are yet available to assess the extent to which this affects detection probability. Previous studies both in the Moray Firth (Bailey et al., 2010) and Ireland (Philpott et al., 2007) have confirmed that T-PODS can successfully detect bottlenose dolphins at distances of 900-1250m. Combined visual and acoustic studies in the mouth of the Cromarty Firth further showed that T-PODs detected all groups of dolphins that spent at least 30 mins in the area (Bailey et al., 2010), suggesting that the technique can be used for determining presence or absence of dolphins at hourly sampling scales.

69
Figure 7.3. A Timing Porpoise Detector (T-POD).
#
#
#
#
#
#
#
#
#
#
#
#
#
#
#
#
#
#
Lossiemouth
Beatrice
Chanonry
Kessock
Tarbat Ness
Fife Ness
Arbroath
Brora
Stonehaven
Sutors
Cruden Bay
Spey Bay
Helmsdale
Block 17/3 (1)
Block 17/3 (3)
Block 17/7
CulbinNairn
0 30 60 Kilometers
S
N
EW
Figure 7.4. Locations of the T-POD deployment sites between June 2006 and April 2009
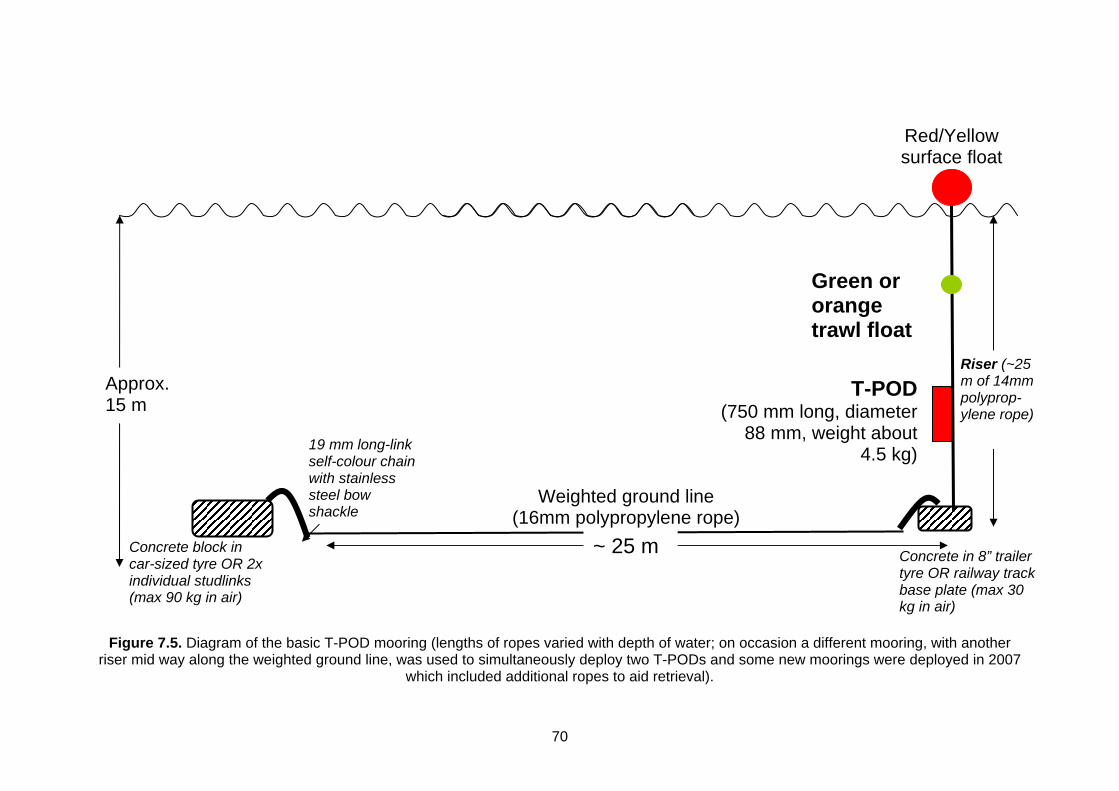
70
Figure 7.5. Diagram of the basic T-POD mooring (lengths of ropes varied with depth of water; on occasion a different mooring, with another riser mid way along the weighted ground line, was used to simultaneously deploy two T-PODs and some new moorings were deployed in 2007
which included additional ropes to aid retrieval).
Riser (~25 m of 14mm polyprop-ylene rope)
~ 25 m
T-POD(750 mm long, diameter
88 mm, weight about 4.5 kg)
Green or orange trawl float
Red/Yellow surface float
Concrete block in car-sized tyre OR 2x individual studlinks (max 90 kg in air)
Concrete in 8” trailer tyre OR railway track base plate (max 30 kg in air)
19 mm long-link self-colour chain with stainless steel bow shackle
Approx. 15 m
Weighted ground line (16mm polypropylene rope)

71
However, it must be noted that both T-PODs and C-PODs are currently unable to distinguish among dolphin species and so it cannot be concluded with certainty that all dolphin detections are from bottlenose dolphins unless confirmed by visual sightings. The second caveat is that these detectors cannot be used to infer how many dolphins are present nor can they register non-calling dolphins. For this study, we deployed T-PODS at a total of 18 sites in the Moray Firth and along the east coast of Scotland (Figure 7.4). At nine of these sites, T-PODs were deployed throughout 2007 and 2008, and into the spring of 2009. Sampling duration at the remaining sites varied, but generally aimed to cover at least one summer and one winter. The exceptions were deployments in oil Blocks 17/7 and 17/3 which were made only in the summer of 2008 as part of a related contract from Marine Scotland. At coastal sites, T-PODs were moored about one metre above the bottom, in approximately 15 m of water (Figure 7.5). Water depth at more offshore sites was up to 45 m.
7.3 Results 7.3.1 Aerial surveys Two aerial surveys were conducted on the 2 March and 4 April 2007 (Figure 7.6). The first survey covered the coastal strip from Inverness to North Berwick, with a return to Inverness over land and then a further trip north along the coast to Brims Ness on the north Caithness coast and a return over the same route. The second survey was conducted along the coast from Inverness to Fife Ness with a return on the same route, followed by a survey from Inverness to Wick. Although the return of the April survey was on the same route, this was off-effort because the sea state had increased to more than Beaufort 3. Six bottlenose dolphin groups were encountered during these surveys, all in areas known to be used by this population during the summer (Figures 7.6 and 7.7). The logistical restrictions associated with winter aerial surveys, the absence of new information along the coast (confirmation only of summer distribution) and the inability to obtain any information offshore led to a decision to abandon aerial survey in favour of other methods to obtain more useful data on winter distribution and possible feeding areas in 2007/8. 7.3.2 Photo-identification surveys within the Moray Firth SAC Twelve and seventeen surveys were made within the Moray Firth SAC during the winters of 2006/7 and 2007/8 respectively (Table 7.1; Figure 7.8). Dolphins were encountered on 58% of surveys in 2006/7 and 65% of surveys in 2007/8. The location of these encounters is shown in (Figure 7.9.) Data were also made available from five encounters at Chanonry Point (Table 7.1).
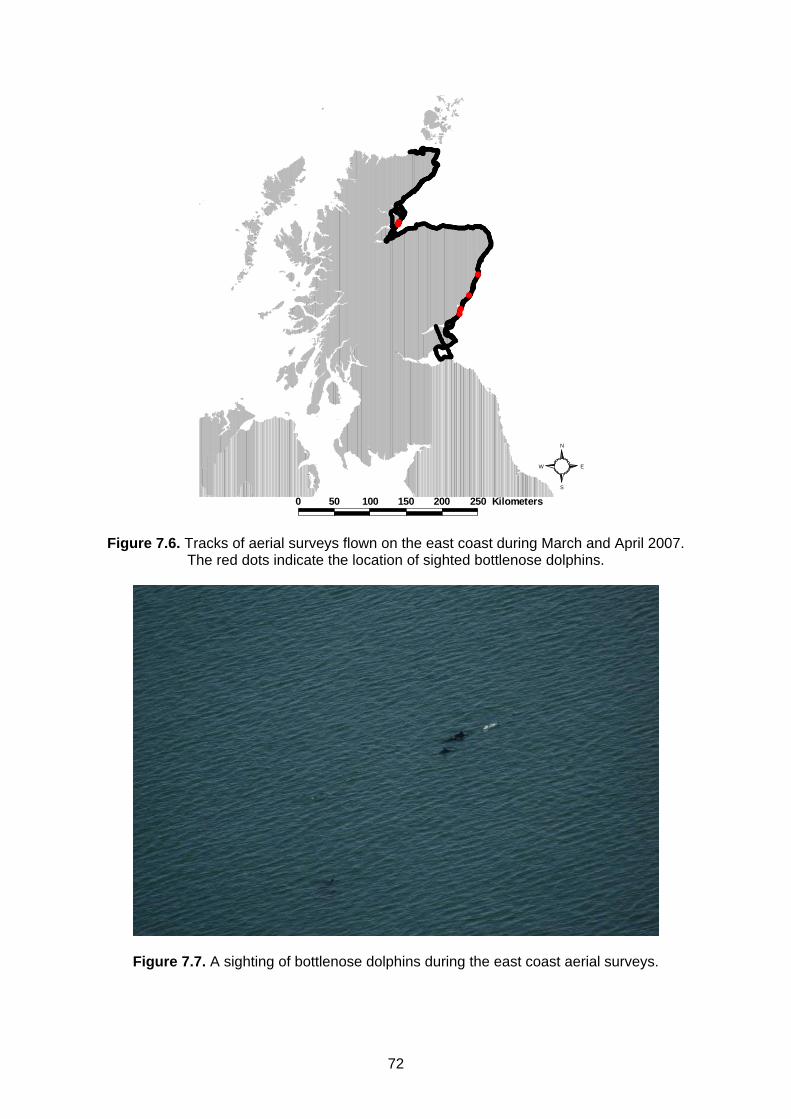
72
########
##############################################################################################################################################################################
##################
#############################################################################
####################################################################################
#######################################################################
###################################################################################################################################################################################################################################
#######################
###############################################################################################################################################################################################################################################
################################################################################################################################################################################################################
###############################################################################################################################################################################################################################################################################################################
##
#
#
##
0 50 100 150 200 250 Kilometers
S
N
EW
Figure 7.6. Tracks of aerial surveys flown on the east coast during March and April 2007. The red dots indicate the location of sighted bottlenose dolphins.
Figure 7.7. A sighting of bottlenose dolphins during the east coast aerial surveys.
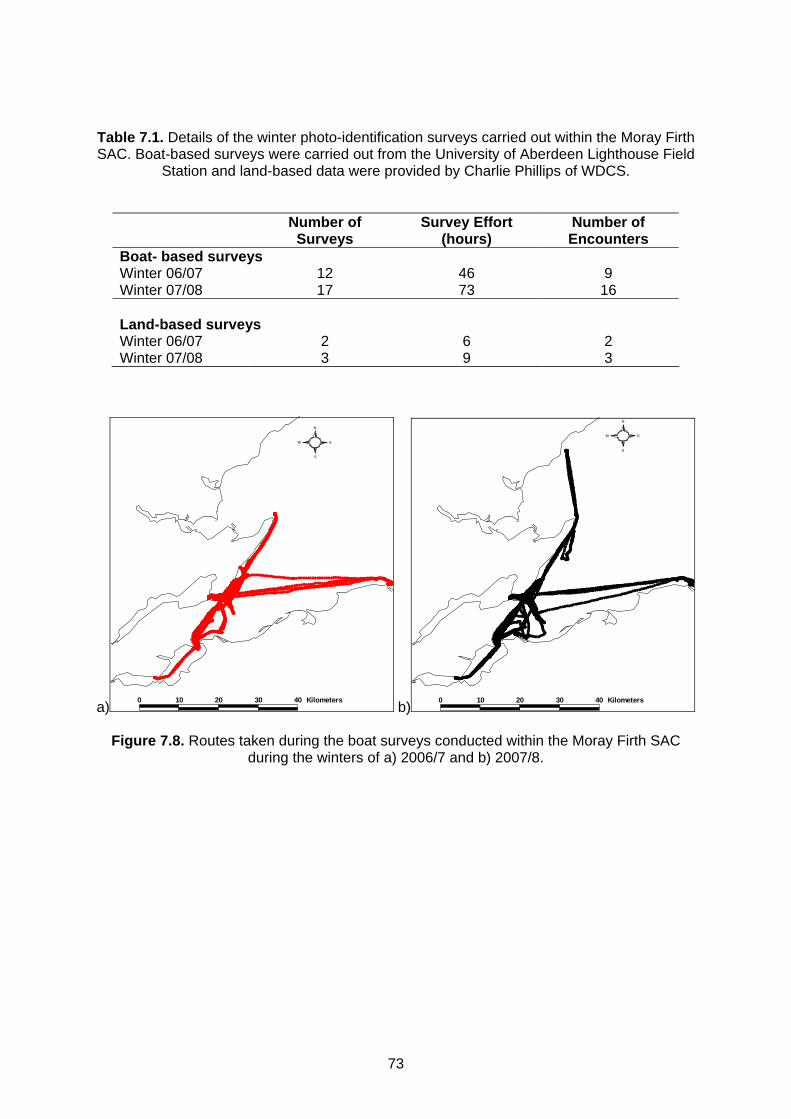
73
Table 7.1. Details of the winter photo-identification surveys carried out within the Moray Firth SAC. Boat-based surveys were carried out from the University of Aberdeen Lighthouse Field
Station and land-based data were provided by Charlie Phillips of WDCS.
Number of
Surveys Survey Effort
(hours) Number of Encounters
Boat- based surveys Winter 06/07 12 46 9 Winter 07/08 17 73 16 Land-based surveys Winter 06/07 2 6 2 Winter 07/08 3 9 3
a)
##################################################################
#############################################################################################################
##############
############
################################################
##################################################################################################
######################
#################################################################################
####
#########
################################################
####################
####################
###########
#############
##############################################################################################################################################
#################################
##############################################################################################################
############################################################################################
##########
###############################################
#################################################################################
###############################################################
############################
####################################################################################################################################
#################################
####################################################################################################################################################################################################################################################################################################################### ####################################################################################################################
#######################
######################################################################################################################################################################################################################################################################################################################
######################################################################################################################################################################################################################################################################################################################################################################################################################################################################################################################################################################################################################################################################################################################################################################################
################################################################################################################################################################################################################################################################################################################################################################################################################################################################################################################################################################################################################################################################################################################################################################################################################################################################
###############
########################
###############
#########################################################################################################################
####################################################
##############################################################################################################################################
##########################################################################################################################################################################################################
#########################################################################
#############################################################################################
##########################################################################################################################################################
##################################################################################################################
########################################################
###############################################################################################################################################################################################################################################################################################################################################################################################################################################################################################################################################################################################################################################################################################################################################################################################
#######################################################################################################################################################################################################################################################################################################################################################################################################################################################################################################################################################################################
############################################################################################################################################################################################################################################################################################################################################################################################
#####################
################################
###############################################
##########################################
##################################################
############
####################################################################
0 10 20 30 40 Kilometers
S
N
EW
b)
###########################
############################################################################################################################################################################################################################
##########################
##########################################################
################################################################################################################################################################################################################
###############################
#####
#########################################################################################
##############################
###############
###############
############################################################################
#####################################################################################################################
#############################################################################################################
#####################
#######################################################################################
#########################################################################
#####################################################################################################################################################
########################################################################################################################################################
#####################################################################################################
##############################################
###########
########
##################################################################
###########################################################
#####################################
######
####################
#####################################################
##################################
###############################################################################################################################
########################################################################################################
##################################################################################################
############################################################################################
##################################################################
########
#########################
######################################
##########################################################################################################
########
####
#######################################################################################################################################################
######################################################################################################################################################################################
########
#############################################################################################################################################
###############################################################################################################################################################################################################################################################
##################################################################################
######################################################################################
####################################
##########################################################################################
#######################################################
############################################################################################################
###########################################################################################################################################################################
##########
###########
###########
#########
#########
#######
##################################################################################
#####################################
###########################################################################################################
0 10 20 30 40 Kilometers
S
N
EW
Figure 7.8. Routes taken during the boat surveys conducted within the Moray Firth SAC during the winters of a) 2006/7 and b) 2007/8.

74
#####
#
##
#
$
$$
$
$
$
$$
$$
$
$$
$
$
$
0 10 20 30 40 Kilometers
S
N
EW
Figure 7.9. Distribution of encounters with bottlenose dolphins during boat surveys conducted within the Moray Firth SAC during the winters of 2006/7 (circles) and 2007/8
(triangles). 7.3.3 Photo-identification surveys ouside the SAC During the winters of 2006/7 and 2007/8, 39 surveys were done in waters outside the Moray Firth SAC (eight in 2006/7 and 31 in 2007/8) (Table 7.2). Routes for these surveys are shown in Figure 7.10, and the locations of all encounters with dolphins are shown in Figure 7.11.
Table 7.2. Details of the winter photo-identification surveys on the east coast of Scotland that were conducted outside the Moray Firth SAC.
Area Number of
Surveys Survey Effort
(hours) Number of Encounters
Outer Moray Firth Winter 06/07 8 26 7 Winter 07/08 6 29 6 Grampian Coast Winter 07/08 20 90 19 St Andrews Bay Winter 07/08 5 23 0

75
a)
###########################################################################
########################################################################################
##################################################################################################################################################################################################
########################################################################################################################################
#############################################################################################################################################################################################################
0 20 40 60 80 100 Kilometers
S
N
EW
b)
##############################################################################
##############################################################################################################################################################################################################
########################################################################################################################################################################################################################
##################################
##################################################################################################################################################################
#################################################################################
########################################################################################################
################################################################################################################################################################################################################
###############################################################################
#############################################################################################################################################################################################################################################
####
##
##
####
#####
#
#
#
###
####
#########################################################################################################################################################################################################################################################################################################################################################################################################################
##################
###########################################################################################################################################################################################################################################################################################
############################################
#################################################################################################################################################################################################################################################################################################################################################################################
##########################################################################################################################################################################################################################
############################################################################################################################################################################################################################################################################
#########################################################################################################################################################################################################################################################################################################################################
###########################################################################################################################################################################################################################################################################################################################
############################################################################################################################################################################################################################################################
###############################################################################################################################################################################################################################################################################################################################################################################################################################################################################################################################################################################################
############################################################################################################################################################################################################################################################################################################################################################################################################################################################################################################################################################################################################################################################################################################################################################################################################################
####################################################################################################################################################################
##########################################################################################################################################################################################################################################################################################################
########################################################################################################################################################################################################################################################################################################################################################################################################################
###################################################################################################################################################################################################################################################################################################################################################################################################################################################################################################################################################################
######################################################################################################################################################################################################################################################################################################################################################
#####################################################################################################################################################################################################################################################################
##########################################################################################################################################################################################################################################################################
##################################################################################################################################################################################################################
###############################################################
###########################################################################################################################################################################################################################################################################################################################################################################################################################################################################################################################################################################################################################################################################################################################################################################################################################################################################################################################################################################################################################################################################################################################################################################################################################################################################################################################################################################################################################################################################################################################################################################################################################################################################################################################################################
#########################################################################################################################################################################################################################################################################################################################################################################################################################################################################################################################################################################################################################################################################################################################################################################################################################################################################################################################################################################################################################################################################################################################################################################################################################################################################################################################################################################################################################################################################################################################################################################################################################################################################################################################################################################
############################################################################################################################################################################################################################################################################################################################################################################################################################################################################################################################################################################################################################################################################################################################################################################################################################################################################################################
##########################################################################################################################################################################################################################################################################################################################################################################################################################################################################################################################################################################################
#########################################################################################################################################################################################################################################################################################################################################
#####################################################################################
#################################################################################################################################################################################################################################################################################################################################################################################################################################################################################
####################################################################################################################################################################################################################################################################################################################################################################################################################################################################################################################################################################################################
###############################################################################################################################################################################################################################################################################################################################################################################################################################################################################################################################################################################################################################################################################################################################################################################################################################################
###############################################################################################################################################################################
###################################################################################################################################################################################################################################################
############################################################################################################################################################################################################################################################################################################################################################################################################################################################################################
################################################################################################################################################################################
0 20 40 60 80 100 Kilometers
S
N
EW
Figure 7.10. Routes taken during the boat surveys conducted outside the Moray Firth SAC during a) the winters of 2006/7 and b) 2007/8 (GPS data are not available for the routes of
surveys made by external groups).
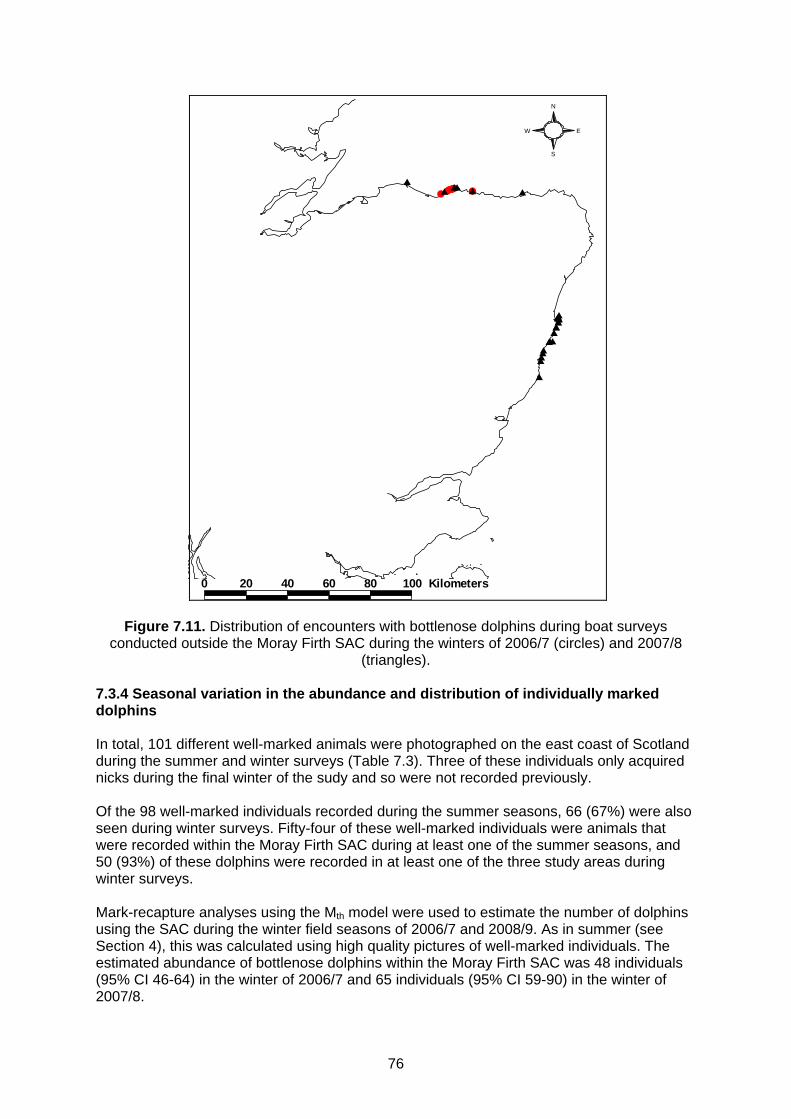
76
# ######$$ $ $
$
$$
$
$
$
$$
$
$$
$$
$
$
$$
$
$
$
$
0 20 40 60 80 100 Kilometers
S
N
EW
Figure 7.11. Distribution of encounters with bottlenose dolphins during boat surveys conducted outside the Moray Firth SAC during the winters of 2006/7 (circles) and 2007/8
(triangles). 7.3.4 Seasonal variation in the abundance and distribution of individually marked dolphins In total, 101 different well-marked animals were photographed on the east coast of Scotland during the summer and winter surveys (Table 7.3). Three of these individuals only acquired nicks during the final winter of the sudy and so were not recorded previously. Of the 98 well-marked individuals recorded during the summer seasons, 66 (67%) were also seen during winter surveys. Fifty-four of these well-marked individuals were animals that were recorded within the Moray Firth SAC during at least one of the summer seasons, and 50 (93%) of these dolphins were recorded in at least one of the three study areas during winter surveys. Mark-recapture analyses using the Mth model were used to estimate the number of dolphins using the SAC during the winter field seasons of 2006/7 and 2008/9. As in summer (see Section 4), this was calculated using high quality pictures of well-marked individuals. The estimated abundance of bottlenose dolphins within the Moray Firth SAC was 48 individuals (95% CI 46-64) in the winter of 2006/7 and 65 individuals (95% CI 59-90) in the winter of 2007/8.

77
Table 7.3. Summary of where each of the well-marked individuals from the east coast were recorded in each of the summer and winter field seasons
IDS SACOUTER MORAY
FIRTHGRAMPIAN +
FIFE SACOUTER MORAY
FIRTH GRAMPIAN SACOUTER MORAY
FIRTHGRAMPIAN +
FIFE SACOUTER MORAY
FIRTH GRAMPIANCommunity 1
1 1 1 1 1 1 13 34 4 4 4 48 8 8 8 8 8 8 8 811 11 11 11 11 11 11 1120 20 2042 42 42 42 42 42 42 4244 44 4449 49 49 49 49 49 49 49 4952 52 52 52 52 52 5253 53 5360 60 60 60 6061 61 61 61 61 61
64 64 64 64 64 6468 68 68
102 102 102 102 102 102 102 102 102 102116 116 116
124 124 124125 125129 129 129 129 129 129 129137 137 137 137 137 137157 157 157 157 157 157 157 157
209 209 209 209 209210 210 210 210 210 210 210227 227 227234 234 234 234 234 234 234
307 307 307 307 307 307 307 307323 323 323344 344 344 344430 430 430 430 430 430 430
435 435 435 435 435 435 435 435
589 589 589 589 589745 745 745 745 745 745 745 745 745 745760 760 760 760 760 760 760769 769 769 769 769773 773 773 773 773774 774788 788 788 788 788 788800 800 800 800 800 800 800816 816 816 816 816
817 817 817 817 817 817818 818 818 818 818 818820 820 820 820 820 820 820
856 856 856 856 856 856885 885 885 885 885 885 885901 901 901 901 901 901 901903 903 903 903904 904 904 904 904 904 904
908 908 908 908 908 908914 914 914 914 914923 923 923 923 923 923 923 923 923964 964 964 964
967 967 967 969
969 969 969 969
985 985 985Community 2
22 22 22 22 22 2223 23 23 23 23
30 30 3031 31 31 31 31 31
36 36 36 36 36 36
79 79 79 79
105 105 105 105 105 105192 192 192 192 192
357 357 357 357
571 571 571
573 573 573 573 573 573
578 578 578 578 578
580 580 580 580 580 580
672 672 672 672 672
744 744 744 744 744 744
815 815 815 815 815
866 866 866 866
880 880 880 880907 907 907 907 907 907
965 965 965 965 965Not Assigned
881 881 881 881882 882 882 882886 886 886 886 886 886 886991 991 991 991 991
1007 10071013 1013 10131026 1026 10261027 1027 1027 1027
1028 1028 1028 10281029 1029 1029 10291032 1032 10321037 1037 1037
1038 1038 10381039 1039 10391042 10421046 1046 1046
SA 033 SA 033 SA 033SA 041 SA 041 SA 041SA 042 SA 042 SA 042SA 045 SA 045 SA 045SA 048 SA 048SA 054 SA 054 SA 054SA 069 SA 069 SA 069SA 082 SA 082SA 095 SA 095NI_68 NI_68
Summer 2006 Winter 06/07 Summer 2007 Winter 07-08

78
7.3.5 Passive acoustic studies Data were successfully recovered from all but one site for at least six months (Table 7.4). Gaps in the data resulted from loss of T-PODS, battery failure and a T-POD being trawled up. Table 7.4. Availability of T-POD and C-POD data from different east coast sites (Black cells represent data available, white cells represent no data). All data are from T-PODs with the
exception of data from Block 17/3 and Culbin in the summer of 2008 (C-PODs).
J J A S O N D J F M A M J J A S O N D J F M A M J J A S O N D J F M AArbroathBeatriceBlock 17/3 (1)Block 17/3 (3)Block 17/7BroraChanonryCruden BayCulbinFife NessHelmsdaleKessockLossiemouthNairnSpey BayStonehavenSutorsTarbat Ness
2006 2007 2008 2009
Dolphins were detected on T-PODs and C-PODs from all sites, but their frequency of occurrence in different areas differed markedly. The most detailed information on this spatial variation in occurrence was obtained in 2008, when data were available from 17 sites distributed across the SAC and south to Fife Ness (Table 7.5). Figure 7.12 illustrates this by summarising the proportion of days on which dolphins were detected at each of these sites during the summer (May-September) and winter (January-April and October-December) of 2008. Table 7.5. Availability of T-POD and C-POD data from different east coast sites for summer
and winter 2008.
Location No. of summer
working days
No. of winter working days
Location No. of summer
working days
No. of winter working
days Arbroath 153 213 Helmsdale 105 59 Block 17/3 (1) 105 40 Kessock 153 213 Block 17/3 (3) 105 48 Lossiemouth 153 213 Block 17/7 105 59 Nairn 48 92 Brora 153 207 Spey Bay 153 213 Chanonry 139 213 Stonehaven 153 213 Cruden Bay 153 85 Sutors 153 173 Culbin 25 0 Tarbat Ness 153 158 Fife Ness 153 210

79
a) b) Figure 7.12. Occurrence of bottlenose dolphins around the east coast of Scotland a) in summer and b) in winter of 2008.
Pie charts show the proportion of dolphin positive days at a number of key sites around the east coast of Scotland

80
Year-round data for 2007 and 2008 were available from nine sites. Comparison of data from these sites indicated that, in both summer and winter, this spatial variation in the occurrence of dolphins remained highly consistent between these two years (Figure 7.13). a) Summer
0.00
0.20
0.40
0.60
0.80
1.00
0.00 0.20 0.40 0.60 0.80 1.00
2008
2007
b) Winter
0.00
0.20
0.40
0.60
0.80
1.00
0.00 0.20 0.40 0.60 0.80 1.00
2008
2007
Figure 7.13. Inter-annual comparison of the proportion of days in which dolphins were present at the nine sites where year-round data were available for both 2007 and 2008
(Arbroath, Chanonry, Fife Ness, Kessock, Lossiemouth, Spey Bay, Stonehaven, Sutors & Tarbat Ness). Data are presented a) for summer (May-Sept) and b) for winter (Jan-April and
Oct-Dec). Pearson correlation for summer 2007 vs summer 2008 is 0.967, p <0.001. Pearson correlation for winter 2007 vs winter 2008 = 0.91, p < 0.01.
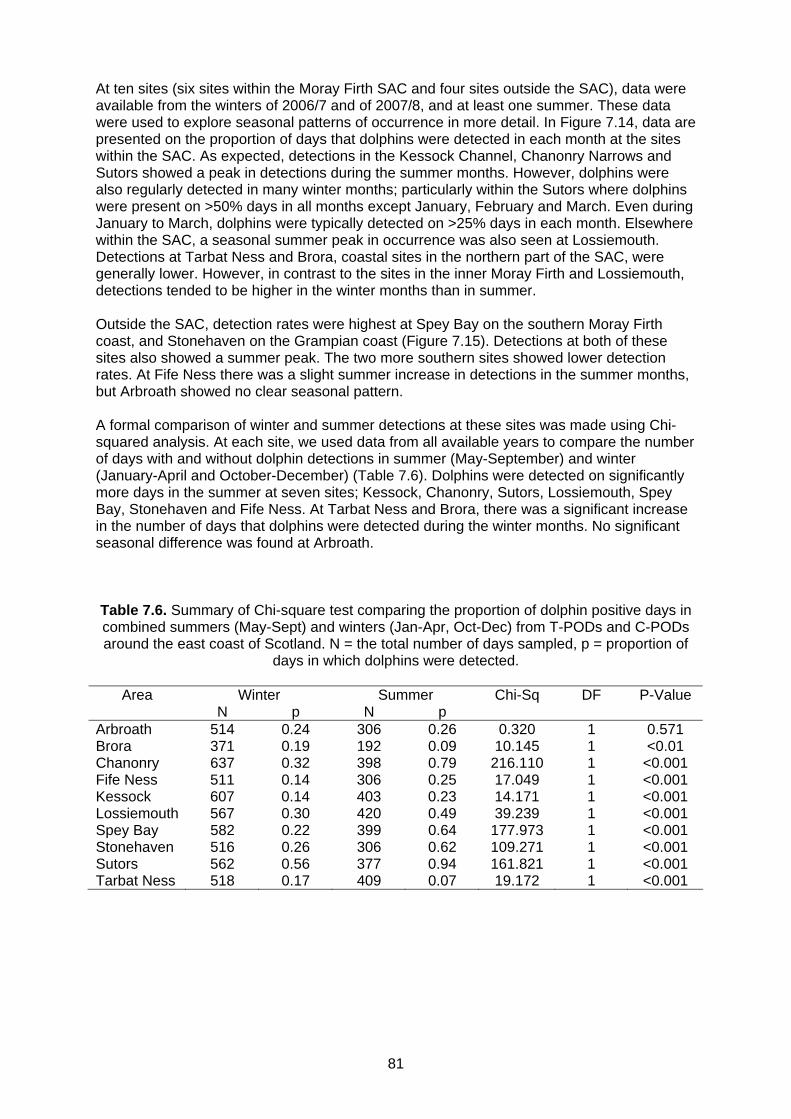
81
At ten sites (six sites within the Moray Firth SAC and four sites outside the SAC), data were available from the winters of 2006/7 and of 2007/8, and at least one summer. These data were used to explore seasonal patterns of occurrence in more detail. In Figure 7.14, data are presented on the proportion of days that dolphins were detected in each month at the sites within the SAC. As expected, detections in the Kessock Channel, Chanonry Narrows and Sutors showed a peak in detections during the summer months. However, dolphins were also regularly detected in many winter months; particularly within the Sutors where dolphins were present on >50% days in all months except January, February and March. Even during January to March, dolphins were typically detected on >25% days in each month. Elsewhere within the SAC, a seasonal summer peak in occurrence was also seen at Lossiemouth. Detections at Tarbat Ness and Brora, coastal sites in the northern part of the SAC, were generally lower. However, in contrast to the sites in the inner Moray Firth and Lossiemouth, detections tended to be higher in the winter months than in summer. Outside the SAC, detection rates were highest at Spey Bay on the southern Moray Firth coast, and Stonehaven on the Grampian coast (Figure 7.15). Detections at both of these sites also showed a summer peak. The two more southern sites showed lower detection rates. At Fife Ness there was a slight summer increase in detections in the summer months, but Arbroath showed no clear seasonal pattern. A formal comparison of winter and summer detections at these sites was made using Chi-squared analysis. At each site, we used data from all available years to compare the number of days with and without dolphin detections in summer (May-September) and winter (January-April and October-December) (Table 7.6). Dolphins were detected on significantly more days in the summer at seven sites; Kessock, Chanonry, Sutors, Lossiemouth, Spey Bay, Stonehaven and Fife Ness. At Tarbat Ness and Brora, there was a significant increase in the number of days that dolphins were detected during the winter months. No significant seasonal difference was found at Arbroath. Table 7.6. Summary of Chi-square test comparing the proportion of dolphin positive days in combined summers (May-Sept) and winters (Jan-Apr, Oct-Dec) from T-PODs and C-PODs around the east coast of Scotland. N = the total number of days sampled, p = proportion of
days in which dolphins were detected.
Area Winter Summer Chi-Sq DF P-Value N p N p
Arbroath 514 0.24 306 0.26 0.320 1 0.571 Brora 371 0.19 192 0.09 10.145 1 <0.01 Chanonry 637 0.32 398 0.79 216.110 1 <0.001 Fife Ness 511 0.14 306 0.25 17.049 1 <0.001 Kessock 607 0.14 403 0.23 14.171 1 <0.001 Lossiemouth 567 0.30 420 0.49 39.239 1 <0.001 Spey Bay 582 0.22 399 0.64 177.973 1 <0.001 Stonehaven 516 0.26 306 0.62 109.271 1 <0.001 Sutors 562 0.56 377 0.94 161.821 1 <0.001 Tarbat Ness 518 0.17 409 0.07 19.172 1 <0.001

82
Kessock
0.00
0.10
0.20
0.30
0.40
0.50
0.60
0.70
0.80
0.90
1.00
JAN FEB MAR APR MAY JUN JUL AUG SEP OCT NOV DEC
Ave
rag
e P
rop
ort
ion
of
Do
lph
in P
osi
tive
Day
s p
er M
on
th
Brora
0.00
0.10
0.20
0.30
0.40
0.50
0.60
0.70
0.80
0.90
1.00
JAN FEB MAR APR MAY JUN JUL AUG SEP OCT NOV DEC
Ave
rag
e P
rop
ort
ion
of
Do
lph
in P
osi
tive
Day
s p
er M
on
th
Chanonry
0.00
0.10
0.20
0.30
0.40
0.50
0.60
0.70
0.80
0.90
1.00
JAN FEB MAR APR MAY JUN JUL AUG SEP OCT NOV DEC
Ave
rag
e P
rop
ort
ion
of
Do
lph
in P
osi
tive
Day
s p
er M
on
th
Tarbat Ness
0.00
0.10
0.20
0.30
0.40
0.50
0.60
0.70
0.80
0.90
1.00
JAN FEB MAR APR MAY JUN JUL AUG SEP OCT NOV DEC
Ave
rag
e P
rop
ort
ion
of
Do
lph
in P
osi
tive
Day
s p
er M
on
th
Sutors
0.00
0.10
0.20
0.30
0.40
0.50
0.60
0.70
0.80
0.90
1.00
JAN FEB MAR APR MAY JUN JUL AUG SEP OCT NOV DEC
Ave
rag
e P
rop
ort
ion
of
Do
lph
in P
osi
tive
Day
s p
er M
on
th
Lossiemouth
0.00
0.10
0.20
0.30
0.40
0.50
0.60
0.70
0.80
0.90
1.00
JAN FEB MAR APR MAY JUN JUL AUG SEP OCT NOV DEC
Ave
rag
e P
rop
ort
ion
of
Do
lph
in P
osi
tive
Day
s p
er M
on
th
Figure 7.14. The average proportion of dolphin positive days in each month (+/- SE) for T-
POD sites within the Moray Firth SAC.
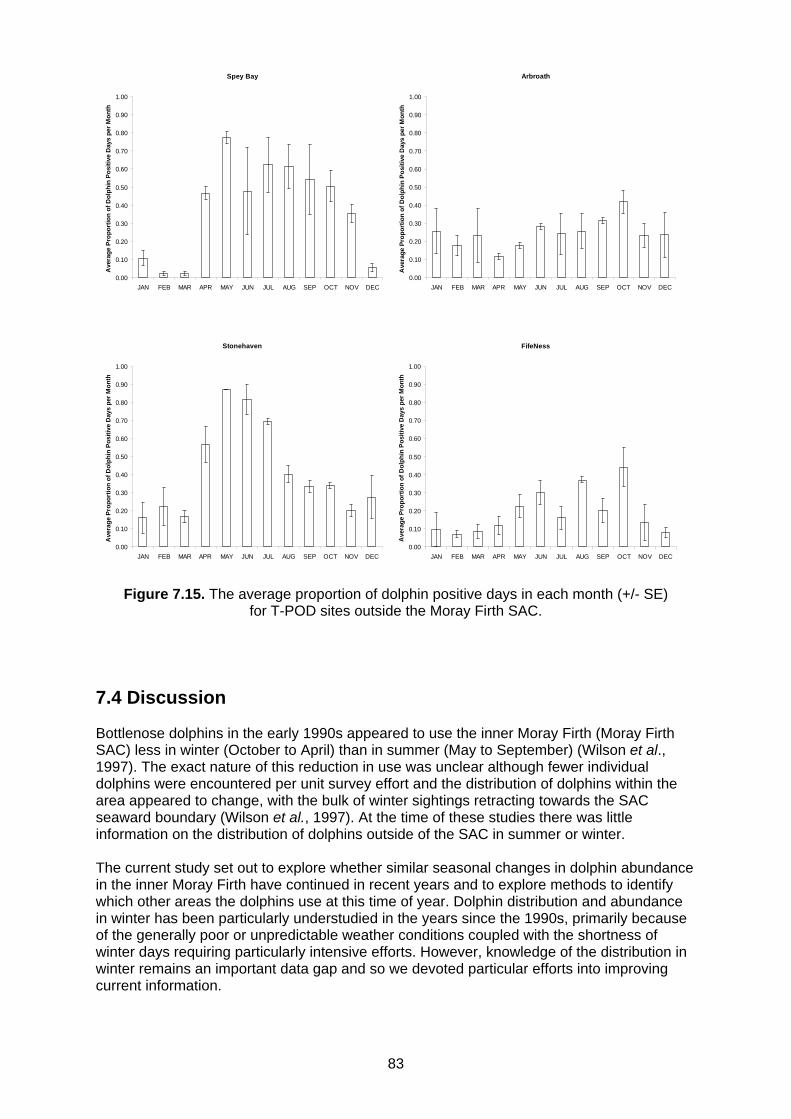
83
Spey Bay
0.00
0.10
0.20
0.30
0.40
0.50
0.60
0.70
0.80
0.90
1.00
JAN FEB MAR APR MAY JUN JUL AUG SEP OCT NOV DEC
Ave
rag
e P
rop
ort
ion
of
Do
lph
in P
osi
tive
Day
s p
er M
on
th
Arbroath
0.00
0.10
0.20
0.30
0.40
0.50
0.60
0.70
0.80
0.90
1.00
JAN FEB MAR APR MAY JUN JUL AUG SEP OCT NOV DEC
Ave
rag
e P
rop
ort
ion
of
Do
lph
in P
osi
tive
Day
s p
er M
on
th
Stonehaven
0.00
0.10
0.20
0.30
0.40
0.50
0.60
0.70
0.80
0.90
1.00
JAN FEB MAR APR MAY JUN JUL AUG SEP OCT NOV DEC
Ave
rag
e P
rop
ort
ion
of
Do
lph
in P
osi
tive
Day
s p
er M
on
th
FifeNess
0.00
0.10
0.20
0.30
0.40
0.50
0.60
0.70
0.80
0.90
1.00
JAN FEB MAR APR MAY JUN JUL AUG SEP OCT NOV DEC
Ave
rag
e P
rop
ort
ion
of
Do
lph
in P
osi
tive
Day
s p
er M
on
th
Figure 7.15. The average proportion of dolphin positive days in each month (+/- SE) for T-POD sites outside the Moray Firth SAC.
7.4 Discussion Bottlenose dolphins in the early 1990s appeared to use the inner Moray Firth (Moray Firth SAC) less in winter (October to April) than in summer (May to September) (Wilson et al., 1997). The exact nature of this reduction in use was unclear although fewer individual dolphins were encountered per unit survey effort and the distribution of dolphins within the area appeared to change, with the bulk of winter sightings retracting towards the SAC seaward boundary (Wilson et al., 1997). At the time of these studies there was little information on the distribution of dolphins outside of the SAC in summer or winter. The current study set out to explore whether similar seasonal changes in dolphin abundance in the inner Moray Firth have continued in recent years and to explore methods to identify which other areas the dolphins use at this time of year. Dolphin distribution and abundance in winter has been particularly understudied in the years since the 1990s, primarily because of the generally poor or unpredictable weather conditions coupled with the shortness of winter days requiring particularly intensive efforts. However, knowledge of the distribution in winter remains an important data gap and so we devoted particular efforts into improving current information.

84
To do this, a variety of methods were applied in the winters of 2006/07 and 2007/08. These ranged from a seasonal extension of the approaches used in summer (i.e. boat-based photo-identification surveys) to two not-previously tested methods with the scope for wider spatial coverage (aerial surveys and moored echolocation click detectors, T-PODs). Though none of these methods provided definitive information on the winter distribution of the entire east of Scotland dolphin population, the data that each method independently provided were broadly consistent. Boat surveys and shore watches in and outside of the SAC confirmed that dolphins occur in winter in areas where they are regularly seen in summer. Sightings rates were generally lower in winter than in summer and were entirely absent in St Andrews Bay despite 23 hours of survey effort. Other areas of the inner and outer Moray Firth and Aberdeenshire coast consistently delivered around 0.2 sightings for every hour of survey effort. Shore-based watches in the inner Moray Firth were comparable delivering around three sightings for every hour of effort. Photo-identification effort in winter continued to identify dolphins known from summer surveys and no new animals were identified. Mark-recapture estimates of well-marked animals identified during the summer and winter surveys of 2006-2007 further reinforced the picture gathered from the simpler sighting rate statistics from boat surveys and shore watches. The mark-recapture estimates suggest that between around 25% (2007) and 45% (2006) fewer individual dolphins used the SAC in winter compared with summer. For safety reasons, the two aerial surveys that were conducted ran along only the coastal margins of eastern Scotland and could not go further than 1 km from land. They therefore covered almost the entire known summer range of the east coast dolphin population as well as coastal waters northwards towards the Pentland Firth where less is known about bottlenose dolphin occurrence. All six groups encountered were well within the known range of the summer distribution pattern with sightings concentrated within the inner Moray Firth and waters to the south of Aberdeen. These surveys confirmed the presence of dolphins in these sites and did not discover any groups in waters north of the SAC. While the unavailability of suitable planes precluded surveys offshore, it still remains unclear where any offshore effort should be concentrated. Instead of pursuing the possibility of carrying out offshore surveys, effort was redirected into the boat surveys and maintaining a network of acoustic recorders. The use of T-PODs and C-PODs was a new method applied to Scottish bottlenose dolphins to investigate seasonal distribution. The effort needed to maintain and service a network of PODs was not inconsiderable and a variety of factors led to the complicated temporal-spatial pattern of monitoring data that they produced. However, the data resulting from the eighteen monitoring stations represent one of the most extensive applications of these new techniques to study dolphin population movements anywhere in the world. The picture that the POD data provides is relatively complex but reveals three important features of the population’s spatial use. The first is that dolphins were detected on all PODs both within and outside the Moray Firth SAC. The second is that the frequency of dolphin records was not even throughout the study area. All of the apparent “hot-spots” were in areas previously known from visual surveys to be regularly used by dolphins. Thirdly, occurrence patterns were broadly similar between summer and winter, in both 'hot spot' and low-use areas. However, detection rates in high-use areas dropped considerably below the summer detection rate of at least every second day. However, some low-use areas such as Tarbat Ness did appear to be more used in winter. Though PODs were informative in this study, there are several caveats that need to be considered. The first is that these devices are currently unable to distinguish among dolphin species. Of the other species that occur off eastern Scotland, the white-beaked dolphin (Lagenorhynchus albirostris) and common dolphin (Delphinus delphis) are the most likely to have been recorded by PODs. Less is known about the occurrence and distribution of these
85
species though sightings do suggest that some of the acoustically logged dolphin present off the outer Moray Firth and Grampian coast could have been contributed by these species. The distribution of white-beaked dolphins is generally much further offshore than bottlenose dolphins but sightings close to shore do occur regularly in some areas particularly in summer (Weir et al., 2007). Therefore, while it is likely that most winter detections in inshore waters along the east coast of Scotland are of bottlenose dolphins, it should be acknowledged that a small, but unknown, proportion may be of other species. The second caveat is that these recorders log dolphin calls but the data cannot be used to infer how many dolphins were present nor can they register non-calling dolphins. Thus the data on dolphin presence only confirm that one or more dolphins were in the area and the absence of records does not mean that dolphins were not present. Combining information from all four methods (boat, shore, aerial and acoustic) inside and outside of the SAC provides several important insights into the winter distribution of the population.
The pattern of reduced winter abundance in the inner Moray Firth that was observed in the early 1990s appears to have been conserved to the present time. Furthermore, other areas of high dolphin occurrence in the outer Moray Firth and eastern coasts to the south (Spey Bay, Aberdeen and St Andrews Bay) appear also to be used less in winter.
Areas known to be used by dolphins in the summer continued to be used in winter.
No new areas were discovered that were used by dolphins in winter that were not
used in summer. It should be noted, however, that the power of this study to detect significant new areas of use was low, particularly in offshore areas.
This final point raises a difficult question. At the start of this study and throughout, there were no indications (anecdotal or otherwise) of potential places that dolphins went in winter, outside of their known summer ranges. We have ascertained that dolphins continue to use their entire known summer range in winter, but with apparently lower rates of occupancy. The most obvious explanation is that the population further increases its range in winter to other areas yet unknown. Without some indication of where those areas might be it has proved extremely difficult to target sufficient search effort to find them. In addition, there is another possibility: that the dolphins maintain their summer range but change their behaviour sufficiently that they are harder to detect. The most obvious way for this to occur would be by increasing their group sizes. This would produce lower visual sightings rates and lower rates of dolphin-positive days on the POD recorders. Some evidence does suggest that dolphins increase their group sizes in winter but the mark-recapture estimates of dolphin numbers in the inner Moray Firth in winter suggest that this factor alone cannot entirely explain apparent reduced occupancy rates. The studies outlined in this section considerably improve our knowledge of dolphin behaviour and distribution in winter but it remains unclear whether dolphins extend their range into other eastern Scottish seas (in general or to new “hot-spots”) in winter or simply maintain their range but change their behaviour. Several options for further winter field campaigns to fill this data gap are explored in the next section.

86
8 CONCLUSIONS & RECOMMENDATIONS
8.1 Distribution and abundance of bottlenose dolphins in Scottish coastal waters The combination of dedicated photo-identification studies (Sections 4 and 5) and third party reports of sightings (Section 3) suggest that a relatively small number of bottlenose dolphins (200-300 individuals) occur regularly in Scottish coastal waters. Multi-site mark recapture estimates indicate that the numbers on the east coast are approximately five times higher than those on the west coast. On both coasts, re-sightings of identifiable individuals indicate that the animals recorded during our surveys in 2006 and 2007 have been using these coastal areas since studies began in 1989 on the east coast (Table 4.3) and 1995 on the west coast (Table 4.4). There have been relatively few reports of bottlenose dolphins on the north coast of mainland Scotland or around Orkney and Shetland (Figures 2.1, 2.5 and 2.7) and most of these are sightings from the public (Figure 2.5) where there is less certainty over species identification. Despite efforts to solicit additional reports from the north coast (Section 3), only one sighting was reported from this area during the period of our study (Figure 3.7). Although we were unable to target surveys in this area to obtain any photo-identification pictures, photographs submitted by members of the public in 2008 (Figure 3.8) confirmed that individuals from our west coast photo-identification catalogue were subsequently recorded on the north coast. The number of animals using this area therefore appears to be low, but further investigation of the occurrence of dolphins on this coast may now be justified given recent evidence of movement between east and west coasts (Sections 5 and 6) and the strategic importance of this area for marine renewable energy developments Previous studies of bottlenose dolphins in Scottish coastal waters have focussed on the east coast population, particularly in the Moray Firth. The integration of photo-identification data collected by all research groups working on this population (Section 5) has provided an abundance estimate that was higher than previous estimates for this population (Wilson et al., 1999). Variations in survey coverage, analytical frameworks and the underlying distribution of the dolphin population (Wilson et al., 2004) mean that it is not currently possible to determine why this new estimate is higher. It could be because survey design in the earlier studies resulted in an estimate that was negatively biased, or because of differences in the mark-recapture model used for the two estimates, or because the population has increased over the last two decades. Recommendation 1: Additional analyses should be undertaken to explore the differences between abundance estimates. These should include an assessment of whether additional survey effort on the Aberdeenshire and Fife coast has resulted in more effective sampling of a section of the population that had been under-sampled in previous years. Recommendation 2: A more detailed assessment of population trends, both for animals using the SAC and for the whole population, should also be undertaken. In particular, priority should be given to updating the population model developed by Corkrey et al. (2008) to include new data from 2003-2009.
8.2 Links with offshore and other coastal populations This estimate of just 200-300 bottlenose dolphins in Scottish coastal waters contrasts with the order of magnitude larger estimates of offshore animals that have been obtained through large scale surveys such as SCANS-II (Section 5). The relationship between offshore groups

87
and those occurring in coastal waters remains uncertain, although more detailed studies in the north-west Atlantic suggest that inshore and offshore populations are ecologically and genetically discrete (Hoelzel et al., 1998). Nevertheless, some offshore animals may occasionally strand on Scottish coasts and this is a potential confounding factor when using samples from stranded individuals to explore population structure (Section 6). Early records of bottlenose dolphin in Orkney describe animals that were killed or stranded alongside groups of pilot whale (Buckley & Harvie-Brown, 1891), suggesting that some more northerly records may relate to the occasional incursion of offshore groups into coastal waters. Analyses of photo-identification data from multiple studies have also shown that coastal bottlenose dolphins can make long-distance movements between the east and west coast of Scotland (Section 5), and further exchange between Scottish and Irish waters has recently been revealed (Robinson et al., 2009). Whether these movements represent exchange between different coastal communities or interaction with more widely ranging offshore animals remains uncertain, but this finding suggests that it would be worthwhile to conduct a more complete comparison between photo-identification catalogues from Scottish and other European waters. Importantly, this finding also highlights the value of maintaining long-term research effort in each of these areas. Without the long-term archives available through previous projects, these rare movements would not have been detected. However, considerable resources would be required to maintain long-term photo-identification studies across Scottish coastal waters, and monitoring programmes of this kind are only likely to be sustainable if they are integrated into broader research projects, education programmes or ecotourism operations. Recommendation 3: Investigations of long-distance movements should be extended through systematic comparisons between Scottish photo-identification catalogues and those resulting from studies in areas such as Cardigan Bay, Ireland and France. Recommendation 4: There should be a strategic review of the options for maintaining photo-identification studies of Scottish coastal bottlenose dolphins. Particular emphasis should be placed on the consolidation of the work conducted on the west coast of Scotland to complement the long-term studies that have been sustained on the east coast. Recommendation 5: There should be continued effort to archive DNA samples from stranded and by-caught dolphins from the Scottish coast and periodically update molecular analyses that can improve our understanding of the relationships between different coastal communities, and between inshore and offshore groups.
8.3 Integrating public sightings into research The study has highlighted the value of using sightings data from the public to better understand the distribution and movement of bottlenose dolphins, especially within more remote Scottish coastal waters (Sections 3 and 4). The provision of high quality digital photographs in association with sightings reports has provided particular benefits, as this has supported individual-based photo-identification studies. Recommendation 6. Approaches for maintaining a public reporting scheme throughout the west and north coasts should be reviewed, with particular focus on the most appropriate way of encouraging the submission of photographs for continuing photo-identification studies in these areas.

88
8.4 Monitoring changes in dolphin occurrence in key areas The study’s use of passive acoustic monitoring (PAM) has provided useful insights into geographic and seasonal variation in occurrence of dolphins, and these techniques can provide similar data on harbour porpoise. Although there remains uncertainty on the species of dolphins detected, these relatively easily collected data can support more intensive visual studies that provide data on species identification. The use of PAM can be particularly cost-effective where deployment and recovery of PODs is integrated into other programmes using static monitoring equipment. Recommendation 7: Consideration should be given to developing a network of passive acoustic monitoring sites in Scottish coastal waters. This coastal observatory could include monitoring sites within the Moray Firth SAC, core-areas identified during 2006 and 2007 fieldwork on the west coast (e.g. the Sound of Barra and waters around Mull) and at sites where particular policy requirements are identified (e.g. on the north coast). When scoping potential sites, it would be valuable to review the potential for integrating PAM into other long-term marine monitoring programmes in Scottish waters such as the FRS Stonehaven/Loch Ewe Ecosystem monitoring and the CEFAS Wavenet network.
8.5. Science and policy The study has increased our understanding of the distribution, abundance and movement rates of bottlenose dolphins in Scottish coastal waters. It is now important to achieve consensus on the policy implications of these findings and to identify where additional research can support current and emerging policy issues. Recommendation 8: A workshop should be convened to disseminate the project’s results to key stakeholders and policymakers. This workshop should also be used to discuss the implications of these results for the designation and management of SACs, as well identify emerging policy issues and requirements for further research on Scottish coastal bottlenose dolphins.
89
9 REFERENCES Bailey, H., Clay, G., Coates, E.A., Lusseau, D., Senior, B. & Thompson, P.M. (2010). Using T-PODS to assess variations in the occurrence of coastal bottlenose dolphins and harbour porpoises. Aquatic Conservation: Marine and Freshwater Ecosystems. 20, 150-158. Bailey, H. & Thompson, P.M. (2009). Using marine mammal habitat modelling to identify priority conservation zones within a marine protected area. Marine Ecology Progress Series, 378, 279-287. Berrow, S.D., Holmes, B. & Kiely, O.R. (1996). Distribution and abundance of bottle-nosed dolphins in the Shannon Estuary. Biology and Environment: Proceedings of the Royal Irish Academy, 96B, 1-9. Berrow, S.D., McHugh, B., Glynn, D., McGovern, E., Parsons, K.M., Baird, R. & Hooker, S.K. (2002). Organochlorine concentrations in resident bottlenose dolphins (Tursiops truncatus) in the Shannon estuary, Ireland. Marine Pollution Bulletin, 44, 1296-1313. Buckley, T.E & Harvie-Brown, J.A. (1891). A vertebrate fauna of the Orkney Islands. Edinburgh: Douglas. Chao, A., Lee, S.M. & Jeng, S.L. (1992). Estimating population size for capture–recapture data when capture probabilities vary by time and individual animal. Biometrics, 48, 201–216. Connor, R.C., Wells, R.S., Mann, J. & Read, A. (2000). The bottlenose dolphins: social relationships in a fission-fusion society. In: J. Mann, R.C. Connor, P.L. Tyack & H. Whitehead, eds. Cetacean societies. Field studies of dolphins and whales. Chicago: The University of Chicago Press. Corkrey, R., Brooks, S., Lusseau, D., Parsons, K., Durban, J.W., Hammond, P.S. & Thompson, P.M. (2008). A Bayesian capture-recapture population model with simultaneous estimation of heterogeneity. Journal of the American Statistical Association, 103, 948-960. Coughlan, J., Mirimin, L., Dillane, E., Rogan, E. & Cross, T.F. (2006). Isolation and characterisation of novel microsatellite loci for the short-beaked common dolphin (Delphinus delphis) and cross-amplification in other cetacean species. Molecular Ecology Notes, 6, 490-492. Culloch, R.M. & Robinson, K.P. (2008). Bottlenose dolphins using coastal regions adjacent to a Special Area of Conservation in north-east Scotland. Journal of the Marine Biological Association of the UK, 88, 1237-1243. Durban, J.W., Elston, D.A., Ellifrit, D.K., Dickson, E., Hammond, P.S. & Thompson, P.M. (2005). Multisite mark-recapture for cetaceans: population estimates with Bayesian model averaging. Marine Mammal Science, 21, 80-92. Eggert, L.S., Lux, C.A., O’Corry-Crowe, G.M. & Dizon, A.E. (1998). Dried dolphin blood on fishery observer records provides DNA for genetic analysis. Marine Mammal Science, 14, 136-143. Evans, A.H. & Buckley, T.E. (1899). Vertebrate fauna of the Shetland Islands. Edinburgh: Douglas. Frankham. R., Ballou, J.D., & Briscoe, D.A. (2002). Introduction to conservation genetics. Cambridge: Cambridge University Press.
90
Fraser, F.C. (1934). Report on cetacea stranded on the British Coasts from 1927 to 1932. British Museum (Natural History), No.11. Fraser, F.C. (1946). Report on cetacea stranded on the British Coasts from 1933 to 1937. British Museum (Natural History), No.12. Fraser, F.C. (1953). Report on cetacea stranded on the British Coasts from 1938 to 1947. British Museum (Natural History), No. 13. Fraser, F.C. (1974). Report on cetacea stranded on the British Coasts from 1948 to 1966. British Museum (Natural History), No.14. Goudet, J. (2001). FSTAT, a program to estimate and test gene diversities and fixation indices (version 2.9.3). Available from http://www.unil.ch/izea/softwares/fstat.html Greenwood, P.J. (1980). Mating systems, philopatry and dispersal in birds and mammals. Animal Behaviour, 28, 1140-1162. Grellier, K & Wilson, B. (2003). Bottlenose dolphins using the Sound of Barra, Scotland. Aquatic Mammals, 29, 378-382. Hammond, P.S., Berggren, P., Benke, H., Borchers, D.L., Buckland, S.T., Collet, A., Heide-Jørgensen, M.P., Heimlich, S., Hiby, A.R., Leopold, M.F. & Øien, N. (2002). Abundance of harbour porpoise and other cetaceans in the North Sea and adjacent waters. Journal of Applied Ecology, 39, 361-376. Harlin-Cognato, A.D. & Honeycutt, R.L. (2006). Multilocus phylogeny of dolphins in the subfamily Lissodelphininae: character synergy improves phylogenetic research. BMC Evolutionary Biology, 6, 87. Harmer, S.F. (1927). Report on cetacea stranded on the British coasts from 1913 to 1926. British Museum (Natural History), No.10. Harvie-Brown, J.A. & Buckley, T.E. (1887). A vertebrate fauna of Sutherland, Caithness & West Cromarty. Edinburgh: Douglas. Harvie-Brown, J.A. & Buckley, T.E. (1888). A vertebrate fauna of the Outer Hebrides. Edinburgh: Douglas. Harvie-Brown, J.A. & Buckley, T.E. (1892). A vertebrate fauna of Argyll and the Inner Hebrides. Edinburgh: Douglas. Harvie-Brown, J.A. & Buckley, T.E. (1895). A vertebrate fauna of the Moray Basin. Edinburgh: Douglas. Herman, J.S. (1992). Cetacean specimens in the National Museums of Scotland. Edinburgh: National Museums of Scotland. Higgins, D.G., Thompson, J.D. & Gibson, T.J. (1994). CLUSTAL W: improving the sensitivity of progressive multiple sequence alignment through sequence weighting, position-specific gap penalties and weight matrix choice. Nucleic Acids Research, 22, 4673-4680. Hoelzel, A.R., Potter, C.W. & Best, P.B. (1998). Genetic differentiation between parapatric ‘nearshore’ and ‘offshore’ populations of the bottlenose dolphin. Proceedings of the Royal Society of London B, 265, 1177-1183.

91
Hoelzel, A.R., Goldsworthy, S.D., Fleischer, R.C. (2002). Population genetic structure. In: A. R. Hoelzel, ed. Marine Mammal Biology. Oxford, UK: Blackwell Science Ltd. Ingram, S.N. (2000). The ecology and conservation of bottlenose dolphins using the Shannon Estuary, Ireland. PhD thesis, University College Cork, 213pp. Ingram, S.N. & Rogan, E. (2002). Identifying critical areas and habitat preferences of bottlenose dolphins Tursiops truncatus. Marine Ecology Progress Series. 244, 247-255. Jeewoonarain, T., Parsons, E.C.M. & Evans, P.G.H. (1999). Operation sightings: sightings of cetaceans in the southern Hebrides, Scotland. In: European Research on Cetaceans 13. P.G.H. Evans, J. Cruz & J.A. Raga, eds. Valencia: European Cetacean Society. pp. 237-241. Liret, C., Dreton, G. & Ridoux, V. (1996). Dolphin home range and reserve zonation: do we need field studies to define management policy? Proceedings of the 10th Annual Conference of the European Cetacean Society, Lisbon. pp15-19. Lusseau, D., Wilson, B., Hammond, P.S., Grellier, K., Durban, J.W., Parsons, K.M., Barton, T.R. & Thompson, P.M. (2006). Quantifying the influence of sociality on population structure in bottlenose dolphins. Journal of Animal Ecology, 75, 14-24. Mandleberg, L. (2006). Bottlenose dolphins of the Hebrides; a summary report from five years of research (2001-2005). Hebridean Whale and Dolphin Trust unpublished report. 19pp. Moritz, C. (1994) Application of mitochondrial DNA analysis in conservation: a critical review. Molecular Ecology, 3, 401-411. Natoli, A., Perremors, V.M., & Hoelzel, R. (2004). Population structure and speciation in the genus Tursiops based on microsatellite and mitochondrial DNA analysis. Journal of Evolutionary Biology, 17, 363-375. Nei, M. (1978). Estimation of average heterozygosity and genetic distance from a small number of individuals. Genetics, 89, 583-590. Parsons, K.M., Noble, L.R., Reid, R.J. & Thompson, P.M. (2002). Mitochondrial genetic diversity and population structuring of bottlenose dolphins (Tursiops truncatus): is the NE Scotland population demographically and geographically isolated? Biological Conservation, 108, 175-182. Pesante, G., Evans, P.G.H., Anderwald, P., Powell, D. & McMath, M. (2008). Connectivity of bottlenose dolphins in Wales: North Wales photo-monitoring interim report. CCW Marine Monitoring Report No: 62. 42pp. Philpott, E., Englund, A., Ingram, S. & Rogan, E. (2007). Using T-PODs to investigate detection range and echolocation behaviour of coastal bottlenose dolphins. Journal of the Marine Biological Association (UK), 87, 11–17. Pollock, C.M., Mavor, R., Weir, C.R., Reid, A., White, R.W., Tasker, M.L., Webb, A. & Reid, J.B. (2000). The distribution of seabirds and marine mammals in the Atlantic Frontier, north and west of Scotland. Aberdeen: Joint Nature Conservation Committee. Pritchard, J.K., Stephens, M. & Donnelly, P. (2000). Inference of population structure using multilocus genotype data. Genetics, 155, 945-959.

92
Quérouil, S., Silva, M.A., Luís, F., Prieto, R., Magalhães, S., Dinis, A., Alves, F., Matos, J.A., Mendonça, D., Hammond, P.S. & Santos, R.S. (2007). High gene flow in oceanic bottlenose dolphins (Tursiops truncatus) of the North Atlantic. Conservation Genetics, 8, 1405-1419. Quick, N.J. (2006). Vocal behaviour and abundance of bottlenose dolphins in St Andrews Bay. Unpublished PhD Thesis, University of St Andrews. Reid, J.B., Evans, P.G.H. & Northridge, S.P. (2003). Atlas of cetacean distribution in north-west European waters. Peterborough: Joint Nature Conservation Committee. Rexstad, E. & Burnham, K.P. (1991). User’s guide for interactive program CAPTURE: abundance estimation of closed animal populations. Fort Collins, Colorado, USA: Colorado Cooperative Fish and Wildlife Research Unit. Robinson, K.P., Baumgartner, N., Eisfeld, S.M., Clark, N.M., Culloch, R.M., Haskins, G.N., Zapponi, L., Whaley, A.R., Weare, J.S. & Tetley, M.J. (2007). The summer distribution and occurrence of cetaceans in the coastal waters of the outer southern Moray Firth in northeast Scotland (UK). Lutra, 50, 19-30. Robinson, K.P., Cheney, B., Mandleberg, L., Eisfeld, S.M., Costa, M., Johnston, P. & Stevick, P.T. (2009). Coast to coast: first evidence for translocational movements by Scottish bottlenose dolphins. European Research on Cetaceans, 23. (distributed on CD-ROM) Rosel, P.E., Dizon, A.E. & Haygood, M.G. (1995). Variability of the mitochondrial control region in populations of the harbour porpoise, Phocena phocena, on interoceanic and regional scales. Canadian Journal of Fisheries and Aquatic Sciences, 52, 1210-1219. Rosel, P.E., Forgetta, V. & Dewar, K. (2005). Isolation and characterization of twelve polymorphic microsatellite markers in bottlenose dolphins (Tursiops truncatus). Molecular Ecology Notes, 5, 830-833.
SCANS-II (2008). Small Cetaceans in the European Atlantic and North Sea (SCANS-II). Final report to the European Commission LIFE Nature programme on project LIFE04NAT/GB/000245. Report available from SMRU, Scottish Oceans Institute, University of St Andrews, St Andrews, Fife KY16 8LB, UK or http://biology.st-andrews.ac.uk/scans2/. Shane, S.H., Wells, R.S. & WÜrsig, B. (1986). Ecology, behavior and social organisation of the bottlenose dolphin: a review. Marine Mammal Science, 2, 34-63. Sheldrick, M.C. (1989). Stranded whale records for the entire British coastline, 1967–1986. Investigations on Cetacea, 22, 298–329. Sheldrick, M.C., Chimonides, P.J., Muir, A.I., George, J.D., Reid, R.J., Kuiken, T., Iskjaer-Ackley, C. & Kitchener, A. (1994). Stranded cetacean records for England, Scotland and Wales, 1987–1992. Investigations on Cetacea, 25, 259–283. Sim, G. (1903). The Vertebrate Fauna of “Dee”. Aberdeen: D. Wyllie & Son. Smiles, S. (1876). Life of a Scotch Naturalist: Thomas Edward. Albermarle Street, London: John Murray. 445pp. Stevick, P.T., Allen, J., Clapham, P.J., Katona, S.K., Larsen, F., Lien, J., Mattila, D. K., Palsbøll, P.J., Sears, R., Sigurjónsson, J., Smith, T.D., Vikingsson, G., Øien, N. & Hammond, P.S. (2006). Population spatial structuring on the feeding grounds in North Atlantic humpback whales (Megaptera novaeangliae). Journal of Zoology, 270, 244-255.

93
Stockin, K.A., Weir, C.R. & Pierce, G.J. (2006). Examining the importance of Aberdeenshire (UK) coastal waters for North Sea bottlenose dolphins (Tursiops truncatus). Journal of the Marine Biological Association of the UK, 86, 201-207. Stone, C.J. (2003). Marine mammal observations during seismic surveys in 2000. JNCC Report No. 322. Swofford, D.L. (1997). PAUP* (Phylogenetic Analysis Using Parsimony), version 4.0b10. Washington, DC: Smithsonian Institution. Tamura, K., Dudley, J., Nei, M. & Kumar, S. (2007). MEGA4: Molecular Evolutionary Genetics Analysis (MEGA) software version 4.0. Molecular Biology and Evolution, 24, 1596-1599. Taylor, W. (1898). The common dolphin and the bottle-nosed dolphin in the Moray Firth. Annals of Scottish Natural History, 47. Taylor, W. (1899). The whales and dolphins of the Moray Firth. The Inverness Scientific Society, 5, 236-241. Taylor, W. (1902). Bottle-nosed dolphins in the Moray Firth. Annals of Scottish Natural History, 51-52. Thompson, P.M., Wilson, B., Grellier, K. & Hammond, P.S. (2000). Combining power analysis and population viability analysis to compare traditional and precautionary approaches to conservation of coastal cetaceans. Conservation Biology, 14, 1253-1263. Thompson, P.M., Lusseau, D., Corkrey, R. & Hammond, P.S. (2004). Moray Firth bottlenose dolphin monitoring strategy options. Scottish Natural Heritage Commissioned Report No. 79. Thompson, P.M., Corkrey, R., Lusseau, D., Lusseau, S., Quick, N., Durban, J.W., Parsons, K.M. & Hammond, P.S. (2006). An assessment of the current condition of the Moray Firth bottlenose dolphin population. Scottish Natural Heritage Commissioned Report No. 175. Thompson, P.M, Cheney, B., Cândido, A.T. & Hammond, P.S. (2009). Site Condition Monitoring of bottlenose dolphins within the Moray Firth Special Area of Conservation: Interim report 2005-2007. Scottish Natural Heritage Commissioned Report. Venables, L.S.V. & Venables, U.M. (1955). Birds and Mammals of Shetland. Oliver & Boyd. Weir, C.R., Stockin, K.A. & Pierce, G.J. (2007). Spatial and temporal trends in the distribution of harbour porpoises, white-beaked dolphins and minke whales off Aberdeenshire (UK), north-western North Sea. Journal of the Marine Biological Association of the UK, 87, 327-338. Weir, C.R., Canning, S., Hepworth, K., Sim, I. & Stockin, K.A. (2008). A long-term opportunistic photo-identification study of bottlenose dolphins (Tursiops truncatus) off Aberdeen, United Kingdom: Conservation value and limitations. Aquatic Mammals, 34, 436-447. Wells, R.S., Scott, M.D. & Irvine, A.B. (1987). The social structure of free ranging bottlenose dolphins. In: H.H. Genoways, ed. Current Mammalogy. Vol. 1,. New York: Plenum Press, pp. 247–305 Wells, R.S., Rhinehart, H.L., Cunningham, P., Whaley, J., Baran, M., Koberna, C. & Costa, D.P. (1999). Long distance offshore movements of bottlenose dolphins. Marine Mammal Science, 15, 1098-1114.

94
Whitehead, H. (1999). Testing association patterns of social animals. Animal Behaviour, 57, 26-29. Whitehead, H. (2001). Analysis of animal movement using opportunistic individual identifications: Application to sperm whales. Ecology, 82, 1417-1432. Whitehead, H. (2008). SocProg 2.3 Programs for analyzing social structure: users manual, 73pp. Whitehead, H. & Dufault, S. (1999). Techniques for analysing vertebrate social structure using identified individuals: review and recommendations. Advances in the Study of Behaviour, 28, 33-74. Wilson, D.R.B. (1995). The Ecology of Bottlenose Dolphins in the Moray Firth, Scotland: A Population at the Northern Extreme of the Species' Range. PhD thesis, University of Aberdeen, 201 pp. Wilson, B., Thompson, P.M. & Hammond, P.S. (1997). Habitat use by bottlenose dolphins: seasonal distribution and stratified movement patterns in the Moray Firth Scotland. Journal of Applied Ecology, 34, 1365-1374. Wilson, B, Hammond, P.S. & Thompson, P.M. (1999). Estimating size and assessing trends in a coastal bottlenose dolphin population. Ecological Applications, 9, 288-300. Wilson, B., Reid, R.J., Grellier, K., Thompson, P.M. & Hammond, P.S. (2004). Considering the temporal when managing the spatial: a population range expansion impacts protected areas-based management for bottlenose dolphins. Animal Conservation, 7, 331-338. Würsig, B. & Würsig, M. (1977). The photographic determination of group size, composition and stability of coastal porpoises (Tursiops truncatus). Science, 198, 399-412.

www.snh.gov.uk© Scottish Natural Heritage 2011ISBN: 978-1-85397-703-9
Policy and Advice Directorate, Great Glen House,Leachkin Road, Inverness IV3 8NWT: 01463 725000
You can download a copy of this publication from the SNH website.