population trends and abundance of seals - helcom indicators/population trends and abundance...
TRANSCRIPT

HELCOM core indicator report Population trends and abundance of seals
1
Population trends and abundance of seals
Key message Grey seal
Ringed seal
Harbour seal
The indicator includes all species of seals that occur in the Baltic Sea and is applicable in the whole HELCOM
area. The status evaluation is presented separately for the three seal species. The grey seal in the Baltic
proper is evaluated as a single unit, whereas the Kattegat grey seals are evaluated separately. The status of
ringed seals is evaluated for two management units and harbour seals for four units. The evaluation of
abundance of seals is based on data from 2014.
Grey seal occurs in the entire Baltic Sea except for the Kattegat where the species has not been breeding
since the 1930s except for a few observations from recent years. Grey seals achieve GES with regard to
population growth rate in the entire Baltic when evaluated as one single population. The abundance of
grey seals achieves GES. The confidence of evaluation is high.
Ringed seals occur in the Bothnian Bay, which is one management unit, and the Gulf of Finland, the
Archipelago Sea, the Gulf of Riga and the Estonian coastal waters, which is a second management unit.
The ringed seal population growth rate is considerably below GES levels in both units. Subpopulations in
the Gulf of Finland and the Gulf of Riga are stable or declining. The size of the population is in GES only
in the Bothnian Bay. Confidence of evaluation is high for both the Northern and Southern management
units.
Harbour seals are confined to the Kalmarsund, Southern Baltic, the Kattegat and the Limfjord, which all are
separate management units. The Kattegat and Limfjord sub-populations may be approaching carrying
capacity, since the annual growth rates are levelling off. As no decline exceeding 10% has been detected
over the last 10-year period, these sub-populations have achieved GES with regard to population growth
rate. However, more information is needed for the Limfjord on the connectivity of this stock with the
Wadden Sea population. The harbour seal population in the southern Baltic is growing at 9.1% per year,
HELCOM core indicator report Population trends and abundance of seals
2
and is considered to achieve GES, while evaluation of abundance of seals is not applicable here. The
growth rate of Kalmarsund population (9%) is not deviating from GES, but the population size is well
below GES. Confidence is high for all stocks except for harbour seals in the Limfjord.
Relevance of the core indicator Marine mammals are top predators of the marine ecosystem and good indicators for the state of the food
webs, levels of hazardous substances and direct human disturbance.
Distributions of different species during feeding and annual migrations encompass the entire Baltic Sea
although no on-land haul-out sites occur in Germany, Latvia and Lithuania. Monitoring is only carried out in
areas where haul-out sites occur.
Policy relevance of the core indicator BSAP segment and objectives MSFD Descriptors and Criteria
Primary link Biodiversity
Viable populations of species
D1 Biodiversity 1.3. Population condition
Secondary link Biodiversity:
Thriving and balanced communities of plants and animals
Hazardous Substances:
Healthy wildlife
D1 Biodiversity 1.1 Species distribution (range, pattern, covered area) 1.2 Population size (abundance, biomass)
D4 Food-web 4.1. Productivity of key species or trophic groups 4.3 Abundance/distribution of key trophic groups/ species
D8 Contaminants 8.2. Effects of contaminants
Other relevant legislation: In some Contracting Parties also EU Water Framework Directive – Chemical quality and Habitats Directive
Cite this indicator HELCOM [2015].[Indicator name] HELCOM core indicator report. Online. [Date Viewed], [Web link].
HELCOM core indicator report Population trends and abundance of seals
3
Indicator concept
Good Environmental Status Good environmental status (GES) for the population trends and abundance of seals in the Baltic Sea has
been defined as boundaries and is based on concepts developed for conservation of seals, in particular the
HELCOM Recommendation 27/28-2 for the conservation of seals in the Baltic Sea.
The GES-boundary for abundance of seals in each management unit is a population above the ‘Limit Reference Level (LRL)’ with an increasing trend towards the ‘Target Reference Level (TRL: the level where the growth rate starts to level off and the population asymptotically approaches the current carrying capacity level)’. HELCOM set an LRL of 10,000 individuals for grey seals, ringed seals and harbour seals in each of their management units, respectively. The GES-boundary is set separately for populations at- and below the TRL:
- For populations at TRL GES is defined as ‘No decline in population size or pup production exceeding 10% occurred over a period up to 10 years’
- for populations below TRL GES is defined as 3% below the maximum rate of increase for seal species, i.e. 7% annual rate of increase for grey seals and ringed seals and 9% for harbour seals.
The concept for defining a GES-boundary for the population size of seals is derived from the general management principle in the HELCOM Recommendation 27/28-2, which states that the population size is to be managed with the long-term objective of allowing seal populations to recover towards carrying capacity. GES for abundance of a seal species is reached when the limit reference level (LRL) is reached in the management unit and the population grows steadily (at least with 3% below the maximum rate of increase for seal species, i.e. 7% annual rate of increase for grey seals and ringed seals and 9% for harbour seals). The limit reference level corresponds to the safe biological level and minimum viable population size. The LRL has been agreed to be set at 10,000 individuals per management unit at HELCOM HOD 43-2013, understanding that the haul-out fraction during moult surveys is 70%. The LRL of 10,000 implies a population with approximately 5,000 adult seals (and thus 2 500 adult female seals). LRL has been calculated based on estimates of minimum viable population sizes of each seal species based on different extinction risk levels (1, 3, 5 and 10%). The LRL is applicable to Baltic ringed seals, grey seals and harbour seals in the Kalmarsund corresponding to management units defined in HELCOM Rec. 27/28-2. Although other management units of harbour seals (Southern Baltic, Kattegat and the Limfjord) show distinct genetic differences, these populations are affected by immigration/emigration, which is why LRL is not applicable in these cases. In these cases population sizes of adjacent stocks are included in the evaluation of the LRL. The GES-boundary for the population trends are also based on the principles of the recommendation, as
the population is to increase until the population reaches carrying capacity. The GES-concept also follows
principles applied when Ecological Quality Objectives (EcoQOs) that were developed for marine mammals
in the North Sea by the Convention for the Protection of the Marine Environment of the North-East Atlantic
(OSPAR Convention). This core indicator is similar to the EcoQO element with the same name in the ICES
and OSPAR frameworks, with the distinction that the two latter EcoQs include ‘No decline in population size
or pup production exceeding 10% over a period up to 10 years’ for populations ‘minimally affected by
anthropogenic impacts’. This condition is however also deemed appropriate for this core indicator when
seal populations are close to natural abundances, i.e. close to carrying capacity.
The OSPAR and ICES frameworks provide some guidance also for populations far below ‘natural’ or
‘pristine’ abundances. Applying the term ‘anthropogenic influence is minimal’ would imply that a
population should grow close to its intrinsic rate of increase when not affected by human activities. The
HELCOM core indicator report Population trends and abundance of seals
4
theoretical base for this measure is outlined below and compared with empirical data from seal
populations.
Approach for defining the GES-boundary for growth rate for populations close to
carrying capacity (target reference level) All growing populations will eventually be affected by density dependent factors (such as decreased
availability of food and lack of haul out sites) and the population number will stabilize at the carrying
capacity of the ecosystem. Population sizes of marine mammals can be expected to fluctuate around the
carrying capacity due to annual changes in food abundance and other external factors (Svensson et al.
2011). In this situation the ICES and OSPAR frameworks proposed GES when ‘No decline in population size
or pup production exceeding 10% occurred over a period up to 10 years’. The same level is to be used in
the Baltic Sea for the purposes of this core indicator.
Approach for defining the GES-boundary for growth rate for populations below
carrying capacity
Long term maximum growth rates in seals
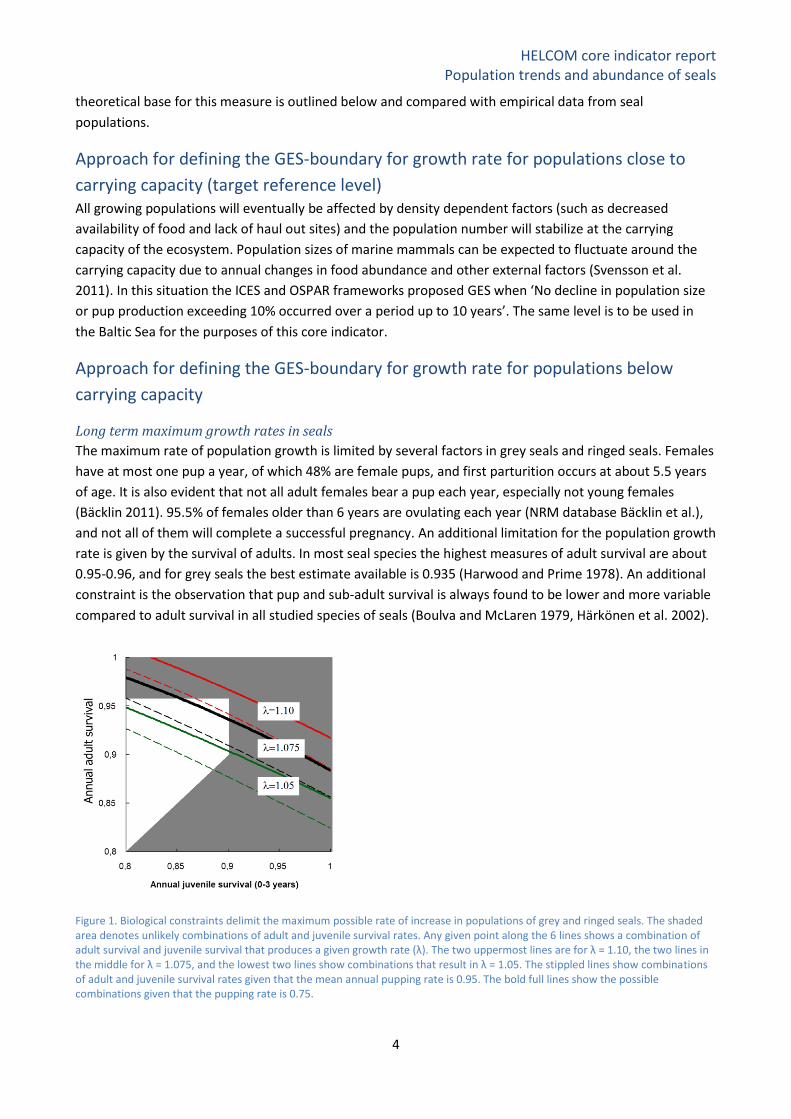
The maximum rate of population growth is limited by several factors in grey seals and ringed seals. Females
have at most one pup a year, of which 48% are female pups, and first parturition occurs at about 5.5 years
of age. It is also evident that not all adult females bear a pup each year, especially not young females
(Bäcklin 2011). 95.5% of females older than 6 years are ovulating each year (NRM database Bäcklin et al.),
and not all of them will complete a successful pregnancy. An additional limitation for the population growth
rate is given by the survival of adults. In most seal species the highest measures of adult survival are about
0.95-0.96, and for grey seals the best estimate available is 0.935 (Harwood and Prime 1978). An additional
constraint is the observation that pup and sub-adult survival is always found to be lower and more variable
compared to adult survival in all studied species of seals (Boulva and McLaren 1979, Härkönen et al. 2002).
Figure 1. Biological constraints delimit the maximum possible rate of increase in populations of grey and ringed seals. The shaded area denotes unlikely combinations of adult and juvenile survival rates. Any given point along the 6 lines shows a combination of adult survival and juvenile survival that produces a given growth rate (λ). The two uppermost lines are for λ = 1.10, the two lines in the middle for λ = 1.075, and the lowest two lines show combinations that result in λ = 1.05. The stippled lines show combinations of adult and juvenile survival rates given that the mean annual pupping rate is 0.95. The bold full lines show the possible combinations given that the pupping rate is 0.75.

HELCOM core indicator report Population trends and abundance of seals
5
These biological constraints impose an upper ceiling of possible rates of long-term population growth for
any seal species and can be found by manipulations of the life history matrix (Caswell 2001, Härkönen et al.
2002). Figure 1 illustrates how fertility and mortality rates known for grey and ringed seals can combine to
produce different long-term population growth rates. It is found that growth rates exceeding 10% (λ= 1.10)
per year are unlikely in healthy grey seal populations (top stippled line in Figure 1). Reported values
exceeding 10% should be treated sceptically since they imply unrealistic fecundity and longevity rates. Such
high growth rates can only occur temporally, and can be caused by e.g. transient age structure effects
(Härkönen et al. 1999, Caswell 2001), but are also to be expected in populations influenced by considerable
immigration.
The upper limit of individual reproductive rate is reflected at the population level, and gives an upper
theoretical limit for the population rate of increase (Figure 1). The mean values of fecundity and mortality
will always be lower than the theoretical maximum, also for populations which live under favourable
conditions. Chance events such as failed fertilisation or early abortions reduce annual pregnancy rates, and
in samples of reasonable sizes, mean pregnancy rates (or rather annual ovulation rates) rarely reach 0.96
(Boulva and McLaren 1979, Bigg 1969, Härkönen and Heide-Jørgensen 1990). Another factor that will
decrease mean pregnancy rates is senescence and pathological changes in the reproductive organs
(Härkönen and Heide-Jørgensen 1990). Further, environmental factors will reduce fecundity and survival
rates. The impact from extrinsic factors may occur with different frequency and amplitude. Environmental
pollution and high burdens of parasites can decrease population specific long-term averages of fecundity
and survival (Bergman 1999), while epizootic outbreaks and excessive hunting have the capacity to
drastically reduce population numbers on a more short-term basis (Dietz et al. 1989, Harding and Härkönen
1999, Härkönen et al. 2006). Fluctuations in food supply and availability of breeding grounds can cause an
energetic stress that affect survival and fecundity. The type of variation in fecundity and survival rates will
determine the structure of a population. In a population with a constant rate of increase (thus no temporal
variability), the age- and sex-structures quickly reach stable distributions, where the frequencies of
individuals at each age class are constant. Populations with low juvenile survival typically have steeper age
distributions compared to populations with higher juvenile survival rates (Caswell 2001). Skewed age
structure can cause a temporal flux in the population growth rate.
Harbour seals mature about one year earlier than grey seals and ringed seals, which is why maximum rate
of increase in this species is 12-13% per year (Härkönen et al. 2002).
Empirical evidence
With few exceptions, most populations of seals have been severely depleted by hunting during the 20th
century. Detailed historical hunting records for pinnipeds are available for the Saimaa ringed seal, Baltic
ringed seal, Baltic grey seal and the harbour seal in the Wadden Sea, Kattegat and the Skagerrak. Analyses
of these hunting records have documented collapses in all populations, which were depleted to about 5-
10% of pristine abundances before protective measures were taken (Heide-Jørgensen and Härkönen 1988,
Kokko et al. 1999, Harding and Härkönen 1999). After hunting was banned and protected areas were
designated most populations started to increase exponentially.
Harbour seal populations in the Kattegat and outside the Baltic increased by about 12% per year between
epizootics in 1988 and 2002 (Olsen et al 2010, Teilmann et al. 2010), whereas harbour seals and grey seals
in the Baltic showed lower increase compared with exponentially increasing oceanic populations (Wadden

HELCOM core indicator report Population trends and abundance of seals
6
Sea Portal). A Bayesian approach (below) is used to evaluate if observed rates of increase close to intrinsic
rates are supported. GES is set to a value 3% lower than the maximum rate of increase.
Table 1. Rates of increase in seal populations recovering after over-hunting. Grey seals from the UK, Norway, and Iceland are not included here since they have been consistently hunted over the years. Canadian grey seals have a life history similar to harbour seals.
Species Area Annual growth rate Period Reference Harbour seal Skagerrak +12% 1978-1987 Heide-Jørgensen &
Härkönen (1988) Harbour seal Skagerrak +12% 1989-2001 Härkönen et al. 2002 Harbour seal Kattegat +12% 1978-1987 Heide-Jørgensen &
Härkönen (1988) Harbour seal Kattegat +12% 1989-2001 Härkönen et al. 2002 Harbour seal Baltic + 9% 1972-2010 Härkönen & Isakson
2011 Harbour seal Wadden Sea +12% 1980-1988 Reijnders et al. 1994 Harbour seal Wadden Sea +12% 1989-2001 Wadden Sea Portal
Anthropogenic pressures linked to the indicator Strong connection Secondary connection
General Hunting By-catches Disturbance
Effects of climate change is a threat to the ringed seal that breeds on sea ice Fishery and food availability
MSFD Annex III, Table 2
Biological disturbance - selective extraction of species, including
incidental non-target catches (e.g. by commercial and recreational fishing)
Contamination by hazardous substance
Historically, hunting of seals has been a major anthropogenic pressure on all the seal species in the Baltic
Sea. A coordinated international campaign was initiated in the beginning of the 20th century with the aim of
exterminating the seals (Anon. 1895). Bounty systems were introduced in Denmark, Finland and Sweden
over the period 1889 to 1912, and the very detailed bounty statistics provide detailed information on the
hunting pressure. The original population sizes was about 180,000 for ringed seals, 80,000 for Baltic grey
seals and 5,000 for the Kalmarsund population of harbour seals (Harding and Härkönen 1999, Härkönen
and Isakson 2011). Similar data from the Kattegat and Skagerrak suggest that populations of harbour seals
amounted to more than 17,000 seals in this area (Heide-Jørgensen and Härkönen 1988).
The hunting pressure resulted in extirpation of grey and harbour seals in Germany and Poland in 1912, and
grey seals were also extirpated from the Kattegat by the 1930s. Ringed seals declined to about 25,000 seals
in the 1940s, whereas grey seals were reduced to about 20,000 (Harding and Härkönen 1999) over the
same time period. A similar rate of reduction of harbour seals occurred in the Kalmarsund and the Kattegat
(Heide-Jørgensen and Härkönen 1988, Härkönen and Isakson 2011). However, after these heavy reductions,
populations appear to have been stable up to the 1960s (Harding and Härkönen 1999).
In the beginning of the 1970s grey seals were observed aborting near full term foetuses, and only 17% of
ringed seal females were fertile (Helle 1980). Later investigations showed a linkage to a disease syndrome
including reproductive disorder, caused by organochlorine pollution, in both grey seals and ringed seals
(Bergman and Olsson 1986). The reduced fertility resulted in population crashes, where numbers of ringed
and grey seals dwindled to approximately 3,000 of each species in the beginning of the 1980s (Harding and
Härkönen 1999). Increasing numbers of these species were recorded after PCB-levels in biota became
HELCOM core indicator report Population trends and abundance of seals
7
reduced by the end of the 1980s. Recent samples show that fertility is normal in grey seals, but still
impaired in ringed seals (Bäcklin et al 2011, Bäcklin et al 2013).
By-catches are known to have substantial effects on the population growth rate in species like the Saimaa
and Ladoga ringed seals (Sipilä 2003). The current knowledge on the level of by-catches of Baltic seal
species is limited to a few dedicated studies which suggest that this factor can be substantial. An analysis of
reported by-caught grey seals showed that approximately 2,000 grey seals are caught annually in the Baltic
fisheries (Vanhatalo et al. 2014), but numbers of by-caught ringed seals and harbour seals are not known.
Climate change poses a pressure on species breeding on ice because shorter and warmer winters lead to
more restricted areas of suitable ice fields (Meier et al 2004). This feature alone will severely affect the
Baltic ringed seals and the predicted rate of climate warming is likely to cause extirpation of the southern
subpopulations (Sundqvist et al. 2012). Grey seals are facultative ice breeders and their breeding success is
considerably greater when they breed on ice as compared with land (Jüssi et al. 2008). Consequently, both
ringed seals and grey seals are predicted to be negatively affected by warmer climate.
By-caught grey seals are significantly leaner as compared with hunted seals (Bäcklin et al. 2011), which may
suggest that food is a limiting factor for by-caught grey seals. It is possible that food limitation is becoming
an important factor also for the entire population since data blubber thickness in Baltic grey seals (also
hunted) show a significant decline during the last decade (Bäcklin et al 2011).
Most land breeding sites of Baltic seals are protected during critical periods of time, since seals are
vulnerable to disturbance during the lactation period. This is especially important for grey seals, where
access to undisturbed land breeding sites delimit the expansion of grey seals in the southern Baltic.

HELCOM core indicator report Population trends and abundance of seals
8
Assessment protocol Each assessment unit is evaluated against two GES boundaries, the GES for population growth rate
and the LRL. Seals in each management unit can be assigned GES only when both boundaries are
met.
Time series of data for each seal species and each management unit are used as input values in
Bayesian analyses with uninformative priors, where it is evaluated if observed data support the set
GES value. In this process, 80% support for a growth rate ≥ GES is required. If the unit fails GES, the
probability distribution is used to evaluate the confidence of the assessment.
The package ‘bayesm’ in the program R is used in the analysis, and we exemplify the procedure by
using survey data from harbour seals in the Southern Baltic over the period 2002-2014:
library(bayesm) year <- c(2002,2003,2004,2005,2006,2007,2008,2009,2010,2011,2012,2013,2014) count <- c(260,401,494,560,448,511,737,586,715,783,734,893,845) y <- log(count) X <- model.matrix(log(count)~year) Theta0 <- c(0,0) A0 <- 0.0000001*diag(2) nu0 <- 0 sigma0sq <- 0 n.sims <- 5000 Data <- list(y=y,X=X) Prior <- list(betabar=Theta0, A=A0, nu=nu0, ssq=sigma0sq) Mcmc <- list(R=n.sims) bayesian.reg <- runireg(Data, Prior, Mcmc) beta.sims <- t(bayesian.reg$betadraw) sigmasq.sims <- bayesian.reg$sigmasqdraw apply(beta.sims, 1, quantile, probs = c(0.025, 0.975, 0.05, 0.1, 0.15, 0.2, 0.25, 0.3, 0.35, 0.4, 0.45, 0.5, 0.55, 0.6, 0.65, 0.7, 0.75, 0.8, 0.85, 0.90, 0.95))
Which gives the output:
2.50% 0.057402
97.50% 0.104045
5% 0.061368
10% 0.065921
15% 0.069049
20% 0.071529
25% 0.073271
30% 0.074951
35% 0.076557
40% 0.07791
45% 0.079096
50% 0.08053
55% 0.082055
60% 0.08343
65% 0.084957
70% 0.0866
75% 0.088232
80% 0.090172
85% 0.092368
90% 0.095354
95% 0.100053
In this example, there is 80% support for a growth rate ≥ 0.072 (read at 20%). Thus, the unit fails GES.
The data collected and used in the indicator are based on national aerial surveys described in
Galatius et al. (2014). Whether an area is in a good environmental status is evaluated by
determining the growth rate of the population as well as the population size over a specified time
period.
Management units and assessment units The existing management plans for seals operate based on management units that are based on the
distribution of seal populations. The management units typically encompass a handful HELCOM Level 2

HELCOM core indicator report Population trends and abundance of seals
9
assessment units, i.e. sub-basins. Evaluations are therefore done by grouping HELCOM assessment units to
align with the management units defined for each seal population.
The Baltic grey seal is a single management unit, although genetic data show spatial structuring
(Graves et al. 2013). Total numbers of counted seals in the entire Baltic during moulting surveys in
2014 was about 32,000. The proportion of the population hauled out during moult has been
estimated to about 60-80% (e.g. Hiby et al. 2013). Coordinated aerial surveys encompassing the
entire Baltic started in 2000, which is why only data after that year will be used in analyses
The Baltic Ringed seal is distributed in the Gulf of Bothnia on the one hand and Southwestern
Archipelago Sea, Gulf of Finland and Gulf of Riga on the other, and represent two different
management units. This subdivision is justified by ecological data that indicate separate dynamics
of these stocks. Since ringed seals from both areas show a high degree of site fidelity, as seen in
satellite telemetry data (Härkönen et al. 2008), it is unlikely that extensive migrations occur at
current low population numbers, although some individuals can show more extensive movements
(Oksanen et al. 2015)
Harbour seals in the Kalmarsund, Sweden constitute a separate management unit and is the
genetically most divergent of all harbour seal populations in Europe (Goodman 1998). It was
founded about 8,000 years ago, and was close to extinction in the 1970s as a consequence of
intensive hunting, and possibly also impaired reproduction (Härkönen et al. 2005). The genetic
diversity is substantially reduced as compared with other harbour seal populations
Southwestern Baltic (Danish Straits, Danish, German, Polish Baltic and the Öresund region including
Skåne county in Sweden) harbour seals. This stock is genetically distinct from adjacent populations
of harbour seals (Olsen et al. 2014) and should be managed separately
Harbour seals in the Kattegat are also genetically distinct from adjacent populations (Olsen et al.
2014). This population has experienced dramatic declines in 1988 and 2002 caused by phocine
distemper epidemics. A third epidemic caused by an unknown virus caused substantial mortality in
2007 (Härkönen et al. 2008).
Harbour seals in the Limfjord form the fourth management unit and is genetically distinct from the
Kattegat harbour seals (Olsen et al. 2014)

HELCOM core indicator report Population trends and abundance of seals
10
Relevance of the indicator
Policy Relevance The Baltic Sea Action Plan has the ecological objective ‘Viable populations of species’ with the target ‘By
2015, improved conservation status of species included in the HELCOM lists of threatened and/or declining
species and habitats of the Baltic Sea area, with the final target to reach and ensure favourable
conservation status of all species’.
The HELCOM Recommendation 27/28-2 Conservation of seals in the Baltic Sea area outlines the
conservation goals the indicators GES-boundary is based on. Specific Reference Levels are an integral part
of the conservation principles in the recommendation. For population size the target reference level (TRL) is
defined as the level where the growth rate starts to level off and the population asymptotically approaches
the current carrying capacity level, the limit reference level (LRL) which corresponds to the safe biological
level and minimum viable population size is to be set for each management unit and finally the
precautionary approach level (PAL) where the populations are at maximum productivity level 2. The LRL
was agreed to be set at 10,000 individuals per management unit at HELCOM HOD 43-2013, understanding
that the haul-out fraction used in the calculations is 70%.
The EU Marine Strategy Framework Directive requires, inter alia, assessments for the state of biodiversity
(Descriptor 1), food webs (Descriptor 4) and effects of hazardous substances (Descriptor 8), with specific
criteria for population abundance and distribution and productivity (EC Decision 477/2010). Marine
mammals were recognized by the MSFD Task Group 1 as a group to be assessed.
The EU Water Framework Directive (WFD) includes status categories for coastal waters as well as
environmental and ecological objectives, whereas the EU Habitats Directive (European Commission 1992)
specifically states that long-term management objectives should not be influenced by socio-economic
considerations, although they may be considered during the implementation of management programmes
provided the long-term objectives are not compromised. All seals in Europe are also listed under the EU
Habitats Directive Annex II (European Commission 1992), and member countries are obliged to monitor the
status of seal populations.
Role of seals in the ecosystem Being top predators in the Baltic ecosystem, seals are exposed to ecosystem changes in lower trophic
levels, but also to variations in climate (length of seasons and ice conditions) and anthropogenic impacts.
These impacts can affect fish stocks, levels of harmful substances as well as direct mortality in form of
hunting or by-catches. The vulnerability of seals to these pressures makes them good candidates for
measuring the environmental status of ecosystems.
The growth rate of a population is the result of age specific mortality rates and age specific fecundity rates.
It is therefore a sensitive parameter signalling if mortality or fecundity rates change. Depleted undisturbed
populations are expected to grow by 10% per year (grey and ringed seals) or 12% per year (harbour seals).
Significantly lower observed growth rates indicate effects from the environment in form of reduced food
availability, impaired health caused by contaminants or diseases. Low growth rates can also be the result of
excessive hunting or high levels of by-catches.
HELCOM core indicator report Population trends and abundance of seals
11
Baltic seals have experienced most of these impacts. All species of Baltic marine mammals were severely
reduced in the beginning of the 20th century as a result of a coordinated international campaign to
exterminate the seals. The number of seals in the Baltic Sea dropped by 80-90% during the period 1920 to
1945 (Harding and Härkönen 1999). Environmental contaminants in the 1960s and 1970s caused infertility
in ringed and grey seals, where fertility rates in ringed seals dropped to 17% in the beginning of the 1970s
(Helle 1980).
HELCOM core indicator report Population trends and abundance of seals
12
Results and confidence
Grey seal
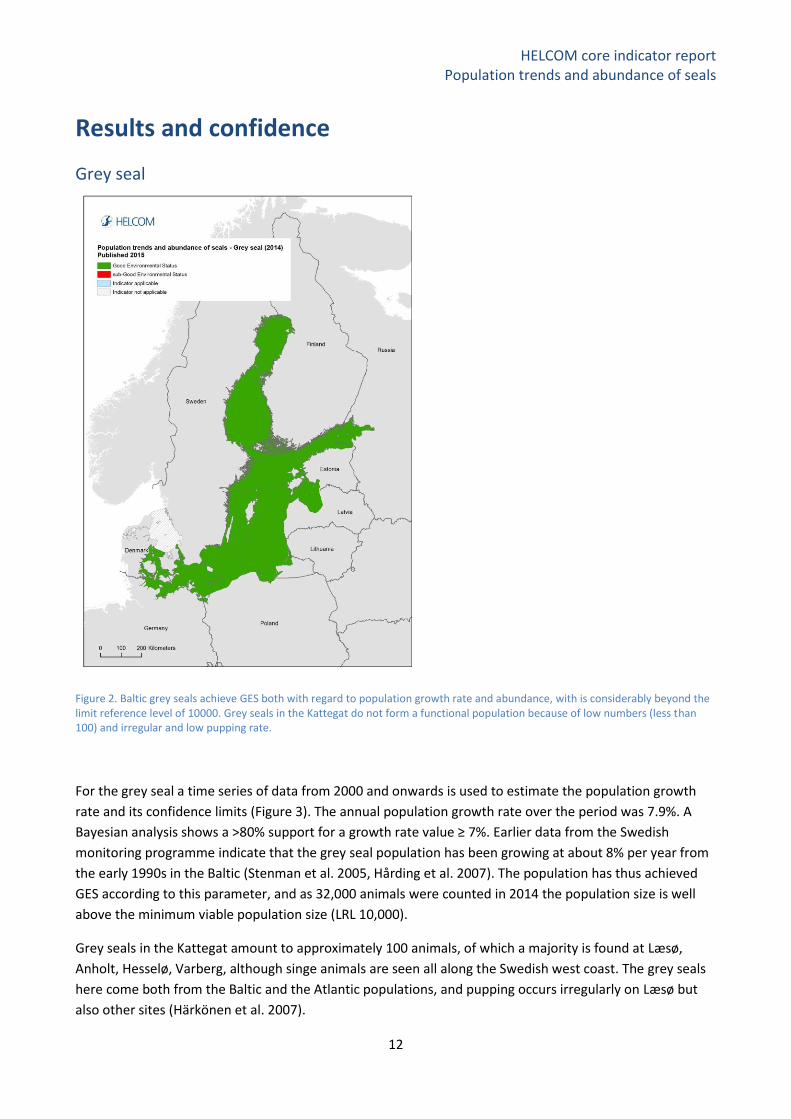
Figure 2. Baltic grey seals achieve GES both with regard to population growth rate and abundance, with is considerably beyond the limit reference level of 10000. Grey seals in the Kattegat do not form a functional population because of low numbers (less than 100) and irregular and low pupping rate.
For the grey seal a time series of data from 2000 and onwards is used to estimate the population growth
rate and its confidence limits (Figure 3). The annual population growth rate over the period was 7.9%. A
Bayesian analysis shows a >80% support for a growth rate value ≥ 7%. Earlier data from the Swedish
monitoring programme indicate that the grey seal population has been growing at about 8% per year from
the early 1990s in the Baltic (Stenman et al. 2005, Hårding et al. 2007). The population has thus achieved
GES according to this parameter, and as 32,000 animals were counted in 2014 the population size is well
above the minimum viable population size (LRL 10,000).
Grey seals in the Kattegat amount to approximately 100 animals, of which a majority is found at Læsø,
Anholt, Hesselø, Varberg, although singe animals are seen all along the Swedish west coast. The grey seals
here come both from the Baltic and the Atlantic populations, and pupping occurs irregularly on Læsø but
also other sites (Härkönen et al. 2007).
HELCOM core indicator report Population trends and abundance of seals
13
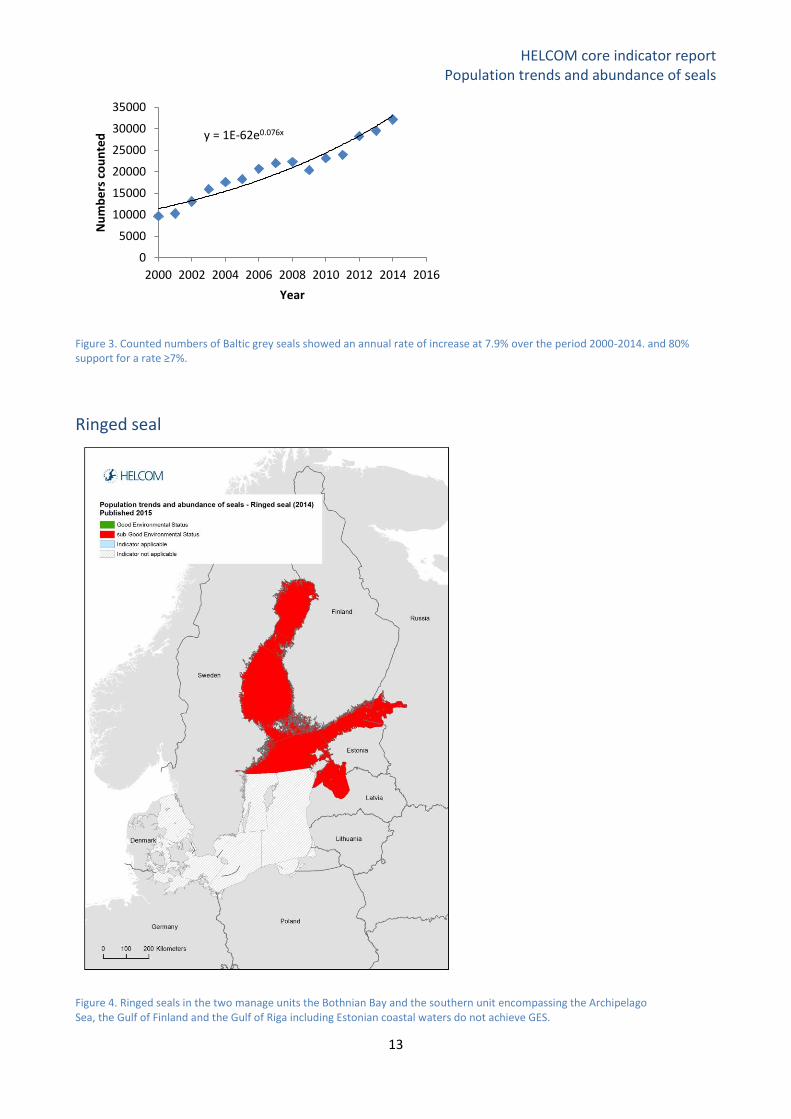
Figure 3. Counted numbers of Baltic grey seals showed an annual rate of increase at 7.9% over the period 2000-2014. and 80% support for a rate ≥7%.
Ringed seal
y = 1E-62e0.076x
0
5000
10000
15000
20000
25000
30000
35000
2000 2002 2004 2006 2008 2010 2012 2014 2016
Nu
mb
ers
co
un
ted
Year
Figure 4. Ringed seals in the two manage units the Bothnian Bay and the southern unit encompassing the Archipelago Sea, the Gulf of Finland and the Gulf of Riga including Estonian coastal waters do not achieve GES.

HELCOM core indicator report Population trends and abundance of seals
14
The ringed seal population in the Bothnian Bay has been increasing at a rate of a 4.8% per year since 1988
(Hårding and Härkönen 1999, Karlsson et al. 2008), which is less than half the intrinsic capacity and below
the GES-boundary of 7% (Figure 5, Karlsson et al. 2008). Counted numbers of seals in the Bothnian Bay
exceeded 8,000 in 2014, which indicates a true population size in the area exceeding the minimum viable
size at 10,000 animals, since the haul-out fraction during surveys is approximately 70%. A Bayesian analysis
shows that observed data do not support ringed seals having reached the GES value of 7%. This implies that
ringed seals in the Bothnian Bay management unit have just reached GES for population size but not for
growth rate.
Figure 5. Counted numbers of ringed seals in the Bothnian Bay 1988-2014. The annual growth rate was 4.8% which is well below GES (7%).The analysis shows no support for a growth rate ≥7%.
In the southern breeding areas of the ringed seals, the Gulf of Riga, the Gulf of Finland and the Archipelago
Sea, improving trends have not been observed (Karlsson et al. 2008, M. Jussi pers. Com, Ahola pers com.).
The ringed seal population in the Gulf of Finland is decreasing, amounting to about 100 animals (M.
Verevkin pers. com), and considered to indicate a very alarming status. The Baltic ringed seal is listed as
Vulnerable by the IUCN. Thus, the low population growth rates in all subpopulations show that the Baltic
ringed seal does not achieve GES.
y = 5E-39e0.0482x
0
1000
2000
3000
4000
5000
6000
7000
8000
9000
1985 1990 1995 2000 2005 2010 2015
Co
un
ted
nu
mb
ers
Year

HELCOM core indicator report Population trends and abundance of seals
15
Harbour seal
Figure 6. Harbour seals occur in three management units, where the subpopulations in the Kalmarsund and the Southern Baltic don’t achieve GES, because of their low numbers, approximately 1000 in both cases, although the growth rate in both cases don’t deviate from the GES value of 8% in a Bayesian analysis
Kalmarsund
The harbour seal population in Kalmarsund is genetically divergent from adjacent harbour seal populations
(Goodman et al 1998) and experienced a severe bottle-neck in the 1970s, when only some 30 seals were
counted. Long-term isolation and low numbers have resulted in low genetic variation in this population
(Härkönen et al. 2006). The population has increased annually by 9% since 1975 and counted numbers
amounted to about 1000 seals in 2014 (Figure 7). See also Härkönen and Isakson (2011).
A Bayesian analysis of the trend in abundance shows that there is less than 80% support for a growth rate
of 9%, and the current population size is well below the LRL of 10000, why this population does not achieve
GES.

HELCOM core indicator report Population trends and abundance of seals
16
Figure 7. Changes in abundance of the Kalmarsund population of harbour seals since 1975. There is 80% support for a growth rate ≥8.4%, which is just below the GES-boundary of 9%. The total number of individuals is also well below the LRL of 10,000, which means that this population does not reach GES.
The southern Baltic
Harbour seals in the area experienced a mass mortality caused by a Phocine Distemper virus (PDV)
epidemic in 2002 which is why the growth rate is analyzed over the period after this event. The average
annual rate of increase up to 2014 was 8.4% (Figure 8). There is less than 80% support for a growth rate
≥9%. The abundance of seals is also well below the set LRL. However, it is genetically connected to the
Kattegat population and should in this context be treated as a part of the larger unit, which would result in
GES with regard to the LRL, but not the growth rate.
Figure 8. The growth rate in the Southwestern Baltic harbour seal population was 8,4% over the period 2002-2014. There is 80% support for a growth rate ≥7.1%, which is below the GES-boundary of 9%
Kattegat and the Danish Straits
This population experienced two dramatic mass mortality events when more than 50% of the population
died in 1988 and about 30% in 2002 (Härkönen et al 2006). Both epidemics were caused by PDV. Unusually
large numbers also died in 2007, but the reason for this mortality remains unclear (Härkönen et al 2007). In
the spring of 2014 some seals appeared to show signs of pneumonia, and Avian influenza H10N7 was
isolated from seals in Sweden and Denmark, but also the North Sea coast (Zohari et al. 2014). Population
y = 1E-68e0.0811x
0
200
400
600
800
1000
2000 2005 2010 2015
Co
un
ted
nu
mb
ers
Year

HELCOM core indicator report Population trends and abundance of seals
17
surveys in August 2014 showed lower numbers at all seal localities suggesting a total mortality at
approximately 10%. Since we evaluate the population growth rate between major epidemics the data used
here encompasses the period 2003-2013.
The rate of increase between the two PDV epidemics was close to 12% per year as in the adjacent North
Sea populations (Table 1). This high annual increase is close to the intrinsic rate of increase in harbour seals
(Härkönen et al. 2002).
The annual rate of increase was close to 12% per year until 2010, but data suggest that the population
growth rate is levelling off, which could be caused by density dependent effects. It is thus unclear if the
population has reached the carrying capacity of the system. Additional surveys are needed to establish such
mechanisms. However, the increase over the period 2002-2013 at 7.5% is significantly lower than the 12%
during earlier exponential growth (Figure 9). Bayesian analysis shows 80% support for a growth rate ≥6.7
for the period after 2002, below GES at 9%.
Figure 9. The harbour seal population in the Kattegat including the Danish Straits shows signs of stabilizing No increase is seen during the four last years, bur Power analyses suggest that a significant change in growth rate can only be detected after seven years.
Limfjord
The size of the Limfjord harbour seal population appears to have been fluctuating around 1,000 individuals
since the early 1990s and appears to have reached its carrying capacity, although an annual increase at
5.6% is suggested by the surveys from 2003-2013 (Figure 10). However, genetic analysis indicates that the
seals in the fjord originate from two different populations, (1) the population originally inhabiting the fjord
and (2) seals from the Wadden Sea (Olsen et al. 2014). It is not known to what extent the seals from the
Wadden Sea use the Fjord for other purposes than hauling out and to which extent they interbreed with
the native seal population. A proper assessment of the Limfjord harbour seals is contingent on clarification
of these issues. Consequently, the status of the Limfjord population is uncertain since immigration may link
it to the expanding Wadden Sea population.
y = 2E-60e0.0729x
0100020003000400050006000700080009000
10000
2002 2004 2006 2008 2010 2012 2014
Co
un
t
Year
HELCOM core indicator report Population trends and abundance of seals
18
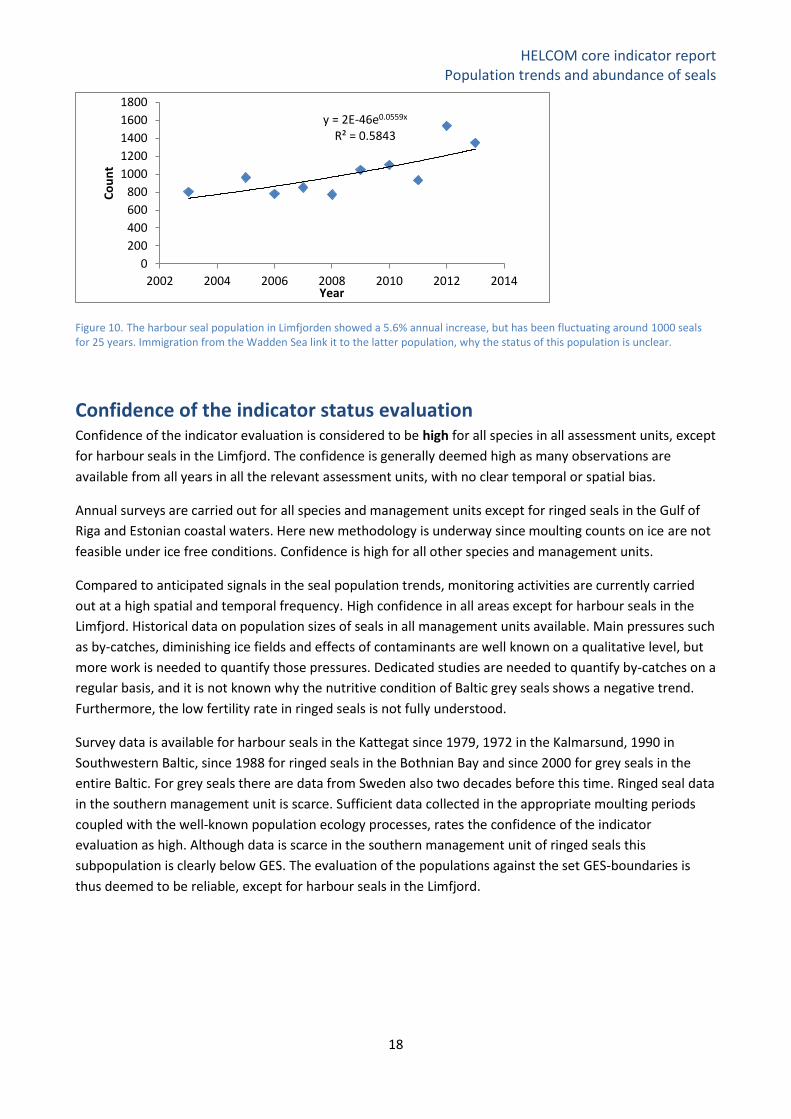
Figure 10. The harbour seal population in Limfjorden showed a 5.6% annual increase, but has been fluctuating around 1000 seals for 25 years. Immigration from the Wadden Sea link it to the latter population, why the status of this population is unclear.
Confidence of the indicator status evaluation Confidence of the indicator evaluation is considered to be high for all species in all assessment units, except
for harbour seals in the Limfjord. The confidence is generally deemed high as many observations are
available from all years in all the relevant assessment units, with no clear temporal or spatial bias.
Annual surveys are carried out for all species and management units except for ringed seals in the Gulf of
Riga and Estonian coastal waters. Here new methodology is underway since moulting counts on ice are not
feasible under ice free conditions. Confidence is high for all other species and management units.
Compared to anticipated signals in the seal population trends, monitoring activities are currently carried
out at a high spatial and temporal frequency. High confidence in all areas except for harbour seals in the
Limfjord. Historical data on population sizes of seals in all management units available. Main pressures such
as by-catches, diminishing ice fields and effects of contaminants are well known on a qualitative level, but
more work is needed to quantify those pressures. Dedicated studies are needed to quantify by-catches on a
regular basis, and it is not known why the nutritive condition of Baltic grey seals shows a negative trend.
Furthermore, the low fertility rate in ringed seals is not fully understood.
Survey data is available for harbour seals in the Kattegat since 1979, 1972 in the Kalmarsund, 1990 in
Southwestern Baltic, since 1988 for ringed seals in the Bothnian Bay and since 2000 for grey seals in the
entire Baltic. For grey seals there are data from Sweden also two decades before this time. Ringed seal data
in the southern management unit is scarce. Sufficient data collected in the appropriate moulting periods
coupled with the well-known population ecology processes, rates the confidence of the indicator
evaluation as high. Although data is scarce in the southern management unit of ringed seals this
subpopulation is clearly below GES. The evaluation of the populations against the set GES-boundaries is
thus deemed to be reliable, except for harbour seals in the Limfjord.
y = 2E-46e0.0559x
R² = 0.5843
0
200
400
600
800
1000
1200
1400
1600
1800
2002 2004 2006 2008 2010 2012 2014
Co
un
t
Year
HELCOM core indicator report Population trends and abundance of seals
19
Monitoring requirements
Monitoring methodology HELCOM common monitoring relevant for the seal population trends is documented on a general level in
the HELCOM Monitoring Manual under the sub-programme: Seal abundance. HELCOM monitoring
guidelines for seals were adopted in 2014. Detailed descriptions of the survey methodology and analysis of
results are given in the BALSAM monitoring manual (Galatius et al. 2014).
The three regularly occurring seal species in the Baltic Sea, harbour seal (Phoca vitulina), ringed seal (Pusa
hispida) and grey seal (Halichoerus grypus) are monitored at their haul-outs on land during their annual
moulting and pupping seasons, with the aim of estimating the abundance and trends (moulting counts) and
pup production (pupping counts). Ringed seals are counted during moult on the ice. Where possible, the
monitoring is performed using aerial surveys, where the seal haul-outs are photographed during the
relevant periods in areas where there is a significant occurrence of seals.
Description of optimal monitoring, The monitoring strategy is optimal for harbour seals which are surveyed three times annually during the
moulting period, and increased effort would not significantly improve results (Teilmann et al 2010). The
same is true for ringed seal surveys on ice in the Bothnian Bay, where a minimum fraction of 13% of the ice
area is surveyed. Increasing survey effort would only marginally affect the precision of estimates (Härkönen
and Lunneryd 1992). Also the coordinated grey seal surveys are only marginally improved by increased
effort.
However, two management units require modified methodology:
Limfjord harbour seals The fjord was separated from the North Sea by land until the 1820s and genetic analyses indicate different
populations in the eastern and western fjord, the eastern fjord being predominantly inhabited by the
original population of the fjord and the western fjord predominantly inhabited by immigrants from the
North Sea / Wadden Sea (Olsen et al. 2014). A study determining the relative abundances of the two
populations, the level of interbreeding and the habitat use of seals with genetic signature is necessary for
evaluation in this area.
Southern ringed seals Since ice cover has been diminishing over the past decades, monitoring of ringed seals on ice in the
Archipelago Sea, The Gulf of Finland, and Estonian coastal waters including the Gulf or Riga has only been
possible during a few years over the past 20 years. However, before the aerial surveys started, ringed seals
were counted on land in August, when they returned to the coast after having spent most of the summer
foraging at sea (e.g. Härkönen et al. 2008). Such data is available from the Gulf of Finland, where numbers
counted ringed seals amounted to 300 animals in 1992 (Härkönen et al 1998), whereas only 100 ringed
seals were observed in the same area in 2014 (Verevkin pers. com.) Consequently, the method of surveying

HELCOM core indicator report Population trends and abundance of seals
20
ringed seals hauled out on rocks in August would be an appropriate alternative method in Southern ringed
seals.
Current monitoring In the HELCOM Monitoring Manual under the sub-programme seal abundance the HELCOM Contracting
Parties currently carrying out regular monitoring activities is listed in the Monitoring Concept Table.
Current monitoring covers all haul-out sites currently used by seals in the Baltic Sea and is considered to be
sufficient to cover the needs of the indicator as described in the Assessment Requirements.

HELCOM core indicator report Population trends and abundance of seals
21
Description of data and up-dating
Metadata The national survey data is compiled annually by the HELCOM Seal Expert Group. A regional database is has
been developed and will be hosted at the HELCOM Secretariat from 2015.
HELCOM core indicator report Population trends and abundance of seals
22
Contributors, archive and references
Contributors Tero Härkönen, Anders Galatius, Karin Hårding, Olle Karlsson, Markus Ahola, Lena Avellan.
Archive 2013 Indicator report (pdf)
References Anon (1895). Svensk fiskeritidskrift 1895. Bäcklin, B-M., Moraeus, C., Roos, A., Eklöf, E., and Lind, Y. 2011. Health and age and sex distributions of Baltic grey
seals (Halichoerus grypus) collected from bycatch and hunt in the Gulf of Bothnia. – ICES Journal of Marine Science, 68: 183–188.
Bäcklin, B-M, Moraeus, C.,Kauhala, K.,and Isomursu. M, 2013. Pregnancy rates of the marine mammals - Particular emphasis on Baltic grey and ringed seals. HELCOM web portal.
Bergman, A., & Olsson, M. (1985). Pathology of Baltic grey seal and ringed seal females with special reference to adrenocortical hyperplasia: Is environmental pollution the cause of a widely distributed disease syndrome. Finnish Game Res, 44, 47-62.
Bergman, A.,. (1999). Health condition of the Baltic grey seal (Halichoerus grypus) during two decades. Apmis, 107(1‐6), 270-282.
Bigg, M. A. (1969). The harbour seal in British Columbia (No. 172). Fisheries Research Board of Canada.. Boulva, J., & McLaren, I. A. (1979). Biology of the harbor seal, Phoca vitulina, in eastern Canada. Fisheries Research Bd
of Canada.
Caswell H (2001) Matrix population models: Construction, analysis, and interpretation. Second edition. Sinauer,
Sunderland, Massachusetts, USA
Dietz, R., M.-P. Heide-Jørgensen and T. Härkönen 1989. Mass deaths of harbour seals Phoca vitulina in Europe. Ambio 18(5): 258-264.
Galatius A, Ahola M, Härkönen T, Jüssi I, Jüssi M, Karlsson O, Verevkin M. 2014. Guidelines for seal abundance monitoring in the HELCOM area 2014. HELCOM http://helcom.fi/Documents/Action%20areas/Monitoring%20and%20assessment/Manuals%20and%20Guidelines/Guidelines%20for%20Seal%20Abundance%20Monitoring%20HELCOM%202014.pdf
Goodman, S. J. (1998). Patterns of extensive genetic differentiation and variation among European harbor seals (Phoca vitulina vitulina) revealed using microsatellite DNA polymorphisms. Molecular Biology and Evolution, 15(2), 104-118.
Fietz K, Graves JA, Olsen MT (2013) Control Control Control: A Reassessment and Comparison of GenBank and Chromatogram mtDNA Sequence Variation in Baltic Grey Seals (Halichoerus grypus). PLoS ONE 8(8): e72853. doi:10.1371/journal.pone.0072853
Harding, K.C. and T.J. Härkönen 1999. Development in the Baltic grey seal (Halichoerus grypus) and ringed seal (Phoca hispida) populations during the 20th century. Ambio. 28: 619-627.
Harding, K.C. Härkönen, T., B. Helander and O. Karlsson (2007). Status of Baltic grey seals: Population assessment and risk analysis. NAMMCO Scientific Publications, 6: 33-56.
Härkönen, T. and M.-P. Heide-Jørgensen 1990. Density and distribution of the ringed seal in the Bothnian Bay.
Holarctic Ecology 13 (2): 122-129. Härkönen, T and S. G. Lunneryd 1992. Estimating abundance of ringed seals in the Bothnian Bay. Ambio 21:497-510 Härkönen, T., O. Stenman, M. Jüssi, I. Jüssi, R. Sagitov, M. Verevkin. 1998. Population size and distribution of the Baltic
ringed seal (Phoca hispida botnica). In: Ringed Seals (Phoca hispida) in the North Atlantic. Edited by C.Lydersen and M.P. Heide-Jørgensen. NAMMCO Scientific Publications, Vol. 1, 167-180.
Härkönen, T, K.C. Harding, S. Goodman, and K. Johannesson (2005) Colonization history of the Baltic harbor seals: Integrating archaeological, behavioural and genetic data. Marine Mammal Science 21: 695-716.

HELCOM core indicator report Population trends and abundance of seals
23
Härkönen, T., R. Dietz, P. Reijnders, J. Teilmann, K. Harding, A. Hall, S. Brasseur, U. Siebert, S. Goodman, P. Jepson, T. Dau Rasmussen, P. Thompson (2006). A review of the 1988 and 2002 phocine distemper virus epidemics in European harbour seals. Diseases of Aquatic Organisms, 68: 115-130.
Härkönen, T., S. Brasseur, J. Teilmann, C. Vincent, R. Dietz, P. Reijnders, K. Abt (2007) Status of grey seals along mainland Europe, from the Baltic to France. NAMMCO Scientific Publications, 6: 57-68.
Härkönen, T., Harding, K., Rasmussen, T.D., Teilmann, J., Dietz, R. (2007). Age- and Sex-specific Mortality Patterns in an Emerging Wildlife Epidemic: the Phocine Distemper in European Harbour Seals. PLoS ONE, 2(9): e887. doi: 10.1371/journal.pone.0000887
Harkonen, T., Bäcklin, B-M., Barrett, T., Anders Bergman, A., Corteyn, M., Dietz, R., Harding, K., Malmsten, J., Roos, A., Teilmann, T. (2008). Mass mortality in harbour seals and harbour porpoises caused by an unknown pathogen. The Veterinary Record, 162: 555-556.
Harkonen, T., M. Jüssi, I. Jüssi, M. Verevkin, L. Dmitrieva, E. Helle, R. Sagitov, K.C. Harding. (2008). Seasonal activity budget of adult Baltic ringed seals (Phoca hispida botnica). PLoS ONE 3(4): e2006.doi:10.1371/journal.pone.0002006
Harkonen, T. and Isakson, E. 2011. Historical and current status of harbour seals in the Baltic proper. NAMMCO Sci. Publ. 8: 71-76.
Harwood, J., & Prime, J. H. (1978). Some factors affecting the size of British grey seal populations. Journal of Applied Ecology, 401-411.
Heide-Jørgensen, M.-P. and T. Härkönen. 1988. Rebuilding seal stocks in the Kattegat-Skagerrak. Marine Mammal Science. 4(3):231-246.
Helle, E. 1980. Lowered reproductive capacity in female ringed seals (Pusa hispida) in the Bothnian Bay, northern Baltic Sea, with special reference to uterine occlusions. Annales Zoologica Fennici. 17:147-158.
Hiby, L. et al. (2013) Estimates of the size of the Baltic grey seal population based on photo-identification data. NAMMCO Scientific Publications, [S.l.], v. 6, p. 163-175, oct. 2013. ISSN 2309-2491. Available at: <http://septentrio.uit.no/index.php/NAMMCOSP/article/view/2731>. Date accessed: 22 Mar. 2015. doi:http://dx.doi.org/10.7557/3.2731.Jüssi, M., Härkönen, T., Jüssi, I. Helle, E. (2008). Decreasing ice coverage will reduce the reproductive success of Baltic grey seal (Halichoerus grypus) females. Ambio, 37: 80–85.
Karlsson, O., Härkönen, T., & Bäcklin, B. M. (2008). Populationer på tillväxt. Havet, 2008, 91-92. Kokko, H. Helle, E, J., Ranta E., Sipilä, T. (1999) Backcasting population sizes of ringed and grey seals in the Baltic and
Lake Saimaa during the 20th century. Annales Zoologici Fennici 36: 65-73 Meier, H.E.M., R. Do¨scher, and A. Halkka. 2004. Simulateddistributions of Baltic Sea-ice in the warming climate
andconsequences for the winter habitat of the Baltic Ringed Seal.AMBIO 33: 249–256. Olsen, M. T., L, Andersen, S.M., Teilmann, J. Dietz, R., Harkonen, T. 2010. Status of the harbour seal in Southern
Scandinavia. NAMMCO Sci. Publ. 8: 77-94 Olsen, M. T., L. Wesley Andersen, R. Dietz, J. Teilmann, T. Harkonen and H. R. Siegismund 2014. 'Integrating genetic
data and population viability analyses for the identification of harbour seal (Phoca vitulina) populations and management units. Molecular Ecology. 23: 815-831.
Teilmann, J., F. Riget, T. Harkonen. 2010. Optimising survey design in Scandinavian harbour seals: Population trend as an ecological quality element. ICES Journal of Marine Science, 67: 952–958
Sipilä 2003. Conservation biology of Saimaa ringed seal (Phoca hispida saimensis) with reference to other European seal populations. PhD Thesis. http://ethesis.helsinki.fi/julkaisut/mat/ekolo/vk/sipila/conserva.pdf?q=phoca
Stenman, O., Halkka, A., Helle, E., Keränen, S., Nummelin, J., Soikkeli, M., ... & Tanskanen, A. (2005). Numbers and occurrence of grey seals in the Finnish sea area in the years 1970-2004. In Symposium on Biology and Management of Seals in the Baltic area. Kala-ja riistaraportteja nro (Vol. 346, pp. 58-61).
Svensson, C.J., Hansson, A. Harkonen, T. Harding, K .2011. Detecting density dependence in growing seal populations. AMBIO (2011) 40:52–59, DOI 10.1007/s13280-010-0091-7
Sundqvist, L., T Harkonen, C J Svensson, K C. Harding. 2012. Linking climate trends to population dynamics in the Baltic ringed seal - Impacts of historical and future winter temperatures. Ambio. DOI 10.1007/s13280-012-0334-x
Vanhatalo J, Vetemaa M, Herrero A, Aho T, Tiilikainen R (2014) By-Catch of Grey Seals (Halichoerus grypus) in Baltic Fisheries—A Bayesian Analysis of Interview Survey. PLoS ONE 9(11): e113836. doi:10.1371/journal.pone.0113836
Zohari S, Neimanis A, Härkönen T, Moraeus C, Valarcher JF. Avian influenza A(H10N7) virus involvement in mass mortality of harbour seals (Phoca vitulina) in Sweden, March through October 2014. Euro Surveill. 2014;19(46):pii=20967. Available online: http://www.eurosurveillance.org/ViewArticle.aspx?ArticleId=20967

HELCOM core indicator report Population trends and abundance of seals
24
Additional relevant publications Harding, K.C., Härkönen, T., Caswell, H. (2002) The 2002 European seal plague: epidemiology and population
consequences. Ecology Letters 5: 727-732. Harding, K.C., Härkönen, T., Pineda, J. (2003) Estimating quasi-extinction risk of European harbour seals: a reply to
Lonergan and Harwood. Ecology Letters 6: 894-897. Härkönen, T., Harding, K.C. (2001) Spatial structure of harbour seal populations and the implications thereof. Can. J.
Zool. 79: 2115-2127. Harkonen, T., Harding, K.C. (2011) Predicting recurrent PDV epidemics in European harbour seals. NAMMCO Scientific
Publications 8: 275-284. Heide-Jørgensen, M.-P., Härkönen, T. (1992) Epizootiology of seal disease. J. Appl. Ecol. 29: 99-107. Heide-Jørgensen, M.-P., Härkönen, T., Dietz R., Thompson, P. (1992) Retrospective of the 1988 European seal
epizootic. Diseases of Aquatic Organisms 13: 37-62. Mortensen, P., Bergman, A., Bignert, A., Hansen, H.J., Härkönen, T., Olsson, M. (1992) Prevalence of skull lesions in
harbour seals Phoca vitulina in Swedish and Danish museum collections during the period 1835-1988. Ambio 21: 520-524.
Palo, J.U., Mäkinen, H.S., Helle, E., Stenman, O., Väinölä, R. (2001) Microsatellite variation in ringed seals (Phoca hispida): genetic structure and history of the Baltic Sea population. Heredity 86: 609–617. doi: 10.1046/j.1365-2540.2001.00859.x.