distributed by: lkjul4a coverages vs rigid floor slab thickness 15 4b coverages vs rigid floor slab...
TRANSCRIPT

.,» / pfa«fif$fts0l!S*, ■
/- "N
AD-773 715
DEVELOPMENT OF A DESIGN MANUAL FOR CONCRETE FLOOR
SLABS ON GRADE
ARMY CONSTRUCTION ENGINEERING RESEARCH LABORATORY
JANUARY 197^1
DISTRIBUTED BY:
LKJUl NalM TiMcal MMWUM Sutiet U. S. DEPARTMENT 6F COMMERCE

UNCLASSIFIED SCCUKITV CLASSIFICATION Qr THIS PAGE iWhtn Omlm f.nfrrd)
REPORT DOCUMENTATION PAGE
CERL-TR-S-27
READ INSTRUCTIONS BEFORE COMPLETING FORM
I. GOVT ACCESSION NO 1 RECIPIENT'S CATALOG NUMBEH
*. TITLE Cwd Sub>lll«f
DEVELOPMENT OF A DESIGN MANUAL FOR CONCRETE FLOOR SLABS ON GRADE
S TYPE OF REPOBT « PERIOD COVERED
FINAL REPORT • PERFORMING ORG. REPORT NUMBER
7. AUTHOR/.J
J. L. Rice A. C. Eberhardt L. Varga
« CONTRACT OR GRANT NUMSCRf»;
t PERFORMING ORGANIZATION NAME AND ADDRESS
Construction Engineering Research Laboratory P.O. Box 4005 Champaign, Illinois 61820
10 PROGRAM ELEMENT. PROJECT, TASK AREA t WORK UNIT NUMBERS
MCA63001
II CONTROLLING OFFICE NAME AND ADDRESS IS REPORT DATE
January 1974 <3 HIIMBCR OF PA!
H MONITORING AGENCY NAME Ik ADORESScll dillrrttl Irom Conlr.ttUnt OllirmT IS. SECURITY CLASS. Cor IMa raporO
UNCLASSIFIED 15« DECLASSIFICATION^OOWNGRADINO
SCHEDULE
I*. DISTRIBUTION STATEMENT lol fhfu Rtpotlj
Approved for public release; distribution unlimited.
17 DISTRIBUTION STATEMENT Co/ Ih» tbtlrmrl mnlmnd In Block 20. II dllltrmnl Irom Rtporl)
<• SUPPLEMENTARY NOTES
19. KEY WORDS rConrlnu« on rwvmrf aid* l/nara«i«ry and lamntity by block number)
concrete floor slabs foundation design rigid pavement
Reproduced by
NATIONAL TfCHNICAL INTORMATION SERVICE 0 S Department of Commerce
So'iiRfield VA ?215I
20. ABSTRACT fConlintf an ravaraa alda II nmcmctmry and Idmntily by black numbot)
This study prepared a design manual for concrete slabs on grade subjected to moderate tu heavy loads. Existing design procedures were reviewed, theoretical studies were made, and an interim manual was prepared. Information in existing manuals was critically reviewed and applicable material used extensively in the prep- aration. Assumptions made in the manuals with regard to type and volume of vehicular traffic were re-examined on the basis of a field survey and revised when necessary.
DO tjAlTi» M73 COITION O» ' HOV« IS OBSOLETE UMCUSSIEXED
SECURITY CLASSIFICATION OF THIS PACE fWian Dim Enlarad)

1
FOREWORD
The work described herein was started by the Construction Engineering Labora- tory (CEL)* of the Ohio River Division Laboratories for the Office of the Chief of Engineers, in accordance with "Performance and Requirements for PCC Floor Slabs on Grade." It was funded under O&MA Project, "Investigation for Development of Engineering Criteria." The work was completed by the Construction Engineering Research Laboratory. The technical coordinator was Mr. A. Müller.
Acknowledgement is made to the federal agencies and private companies involved in the field survey phase of the work for their helpful cooperation.
Dr. L. R. Shaffer is Director of CERL.
•In October 1968 CEL became the U.S. Army Construction Engineering Research Laboratory (CERL), located in Champaign, Illinois since July 1969.
Preceding page blank

:.,,.... f/^f ">'*"*"'"* rrf^^o^ß^S^ß^^ifi^a^tMe^
CONTENTS
DD FORM 1473 1 FOREWORD 3
LIST OF TABLES AND RGURES 5
1 INTRODUCTION 7 Background PurpoM and Scope
2 BASIS FOR FLOOR SLAB DESIGN 7 Daalgn Variablat Moving Liva Loads Traffic Volume Subgrade
3 SLAB DESIGN METHOD 9 Design Requirements Design Assumptions Vehicular Traffic Equivalent Coverage Factors Design Traffic Static Loads Reinforced Floor Slabs Joint Design
4 FIELD SURVEY 21 Data Collection General Obeervatlons
5 CONCLUSIONS AND RECOMMENDATIONS 22
REFERENCES 26
APPENDIX A: FIELD SURVEY DATA SHEET 27
DISTRIBUTION

■ -> -•'--.* iyy- J3S'-'ng3-ttr.^ »^^iru^ywM»- ^..v«*^^ ,j «H-TM »nMt'mm'l&aitl**
f:
TABLES
Number Pag«
1 Design Data 8 2 Typical Values of Modulus of Subgrade Reaction 9 3 Pass/Coverage Ratio 13 4 Equivalent Coverage Factors 15 5 Traffic Categories for Design Index 17 6 Design Index in Terms of Equivalent Coverages of Basic Loading 20 7 Design Curve Data for Categories IV. V, VI 20 8 Load Categories for Tracked Vehicles 20 9 Field Survey Sites 21
FIGURES
1 Nonuniform Subgrade Support 10 2 Difference in Subgrade Moduli—pci 10 3 M/P vs A//1 Curves for Edge Loading 14 4a Coverages vs Rigid Floor Slab Thickness 15 4b Coverages vs Rigid Floor Slab Thickness 16 5 Design Curves for Concrete Slabs: Warehouse Floors. Open Storage Areas 18 6 Design Curves for Concrete Slabs: Warehouse Floors. Open Storage
Areas (Category VI. Forklifts) 19 7 Typical Shrinkage Crack Due to Large Size Panel 23 8 Distress Caused by No Provision of Isolation Joint Around Column
Pedestal 23 9 Functioning Isolation Joint of Older Construction. Circa 1943 24
10 Newer Construction Showing Diamond-Shaped Isolation Joint Around Column 24
11 Floor Slab Cracking at Doorway 25 12 Close-Up of Cracking at Doorway 25
*■.■

DEVELOPMENT OF A DESIGN MANUAL FOR CONCRETE FLOOR SLABS ON GRADE
1 INTRODUCTION
Background.In late Fiscal Year 1965. a project was initiated by the Office of the Chief of Engineers to develop a design manual for floor slabs on grade subjected to heavy loads. Current practice is to use manuals developed for buildings and pavements. This is not satisfactory since the loadings, function and environment associated with lightly and heavily loaded floor slabs on grade differ considerably from those of floor slabs in buildings and pavements. Problems such as slab warping, joint failure, and moisture accumulation have reportedly resulted in floor slab failures and unduly high maintenance costs. While other floor slabs have performed satis- factorily, the economy of the designs is unknown. Thus the study was initiated to review the special requirements and problems associated with industrial floor slabs-on-grade subjected to heavy cyclic loadings, and to develop a design manual specifically applicable to such floor slabs. It should be noted that the scope of the manual does not include the design of floor slabs for residential and office buildings, since these are adequately covered in TM 5-809-2.>
To achieve the objectives outlined in the preced- ing paragraph, a literature search was first initiated covering existing design procedures, types and axle loads of vehicles likely to use the floor slabs of such structures, and a review of theoretical approaches available. An interim design manual was prepared and submitted to the Office of the Chief of Engineers for review. This interim design manual was based on information collected during the literature search. Concurrently a field survey of selected warehouse sites was initiated to review and, if necesary. modify the design criteria established on the basis of the literature search. A revised design manual TM 5-809-12,2 superseding the interim design manual and incorporating the field survey data and the interim approach, has been prepared.
■Concrete Structure Design for Building*, TM 5-809-2/ AFM 88-3, Chap. 2 (Department of the Army and the Air Force, January 1967).
'Concrete Floor Slabs-on-OnuU Subjected to Heavy Loads, TM 5-809-12 (Department of the Army and the Air Force, Draft).
Purpose and Scop«. The purpose of this report is to describe briefly the procedures ustd to develop the proposed design manual. The assumptions made and the design procedures recommended are discussed. One chapter summarizes the results of the field survey which, as explained earlier, led to the modification of the interim design manual. It should be noted that existing design manuals TM 5-822-6.' TM 5-818-1,4 and TM 5-818-2.» after being sub- jected to critical reviews relative to slabs for heavy loads, have been utilized extensively in the develop- ment of the new criteria for concrete floor slabs on grade.
2 BASIS FOR FLOOR SLAB DESIGN
Dasign Variables. The thickness necessary to pro- vide the desired load-carrying capacity of a rigid floor slab is a function of five principal variables:
a. loads resulting from moving live loads and stationary live loads,
b. corf.guration of the vehicle wheels or tracks, c. volume of traffic during the design life of the
pavement, d. modulus of rupture (flexural strength) of the
concrete, e. modulus of subgrade reaction.
Moving Liva Loads. All classes of vehicles which might be expected to use industrial floor slabs are divided into three general groups:
a. forklift trucks, b. other pneumatic and solid-tired vehicles, c. track laying vehicles.
Data on groups (b) and (c) have been compiled for TM 5-822-6. To obtain a complete set of data, it was considered necessary to collect information on fork- lift trucks only. It is to be noted that the majority of vehicular traffic using industrial floor slabs would
'Rigid Pavements for Roads, Streets, Walks, and Open Storage Areas, TM 5-822-6/AFM 88-7, Chap. 1 (Depart- ment of the Army and the Air Force. 1969).
'Procedures for Foundation Design of Buildings and Other Structures {Except Hydraulic Structures). TM 5-818-1/AFM 88-3. Chap. 7 (Department of the Army, 1961).
'Pavement Design for Frost Conditions, TM 5-818-2 (Department of the Army, 1965).
Preceding page link
..r»v-;:../.>/->&|

Category
Capacity (Ibsl Design Axle Load (lbs) No. of Tires Type of Tire Tire Contact Area
(sq. in.) Effective Contact
pressure (psi) Tire Width (in.) Wheel Spacing (in.) Aisle Width (in.) Spacing Between Dual
Wheel Tires (in. )<.
4000 10000
4 Solid 27.0
185
6 3i 90
Table 1
DeaigaData
II III
208
7 33 90
IV VI
6000 10000 16000 20000 52000 15000 25000 36000 43000 120000
4 6 6 6 6 Solid Pneumatic Pneumatic Pneumatic Pneumatic 36.1 62.5 100 119 316
100
8 li-52-11
132 3
90
9 13-5813
144 4
90
9 13-58-13
144 4
95
16 20-79-20
192 4
undoubtedly be forkiift trucks. In 1973 several manufacturm were asked to supply information on six forkiift truck categories established in a previous survey of industry and government specifications. The pertinent design data for these categories are shown in Table 1.
Traffic Votumt. An estimate of the traffic volume likely to use the floor slab is a necessary design input variable. Traffic volume is characterized by the fatigue effects which must be accommodated by the slab during the design life. Traffic volumes used to develop the dengn manual are discussed in detail in Chapter 3.
Subgradt. Most of the information contained in the section of the manual on subgrade was obtained from existing design manuals after they were criticslly reviewed for applicability. Table 2 indicates a range of values of the modulus of subgrade reaction (k) as a function of material type. Since slab design thickness is not highly sensitive to the modulus of subgrade reaction, the use of costly plate-bearing tests is unusually unnecessary. Tabular average values are applicable for all soils except those having special characteristics such as decrease of strength on working and rolling and expansion when ahowed to absorb moisture.
Provision is made in the design manual for non- uniform subgrade support of rigid floor slabs. This condition may be encountered when a floor slab is constructed in an area of highly variable soil types or soil conditions. A nonuniform subgrade may also result when a floor slab is located partially on a cut area and partially on a fill area. An illustrative
sketch is shown in Figure 1. Where nonuniform sub- grade materials are encountered, steel reinforcement is recommended to control slab cracking. Non- uniform subgrade support can result in slab crack- ing due to stress concentrations induced by an abrupt change in the supporting capacity of the sub- grade. These stress concentrations are encountered when some portion of the slab is forced to move with a yielding subgrade while the remaining portion is restrained from moving by a relatively less-yielding subgrade. The slab is thus forced to bridge the dis- continuity and. in so doing, experiences rather high stresses. In order to provide quantitative estimates of these induced stresses, the effects of nonuniform subgrade support have been evaluated analytically. A finite element analysis* was performed on a slab loaded to the maximum static allowable load, sup- ported in one portion by a material of one subgrade strength and in the other portion by a material of different subgrade strength. Utilizing the "working stress method," reinforcing steel percentages were computed for varying slab thicknesses and degrees of nonuniform subgrade support. The "working stress method" was considered appropriate since all other considerations in the floor slab design process (moving live loads, stationary live loads) are based on working stress concepts. Use of maximum allow- able static loads tended to collapse the data along a single line. A single curve showing the recommended reinforcing steel percentage versus the variation in subgrade strength has been prepared and is included
*C. F. Siebter and W. R. Hudson, "A Direct Computer Solution for Plates and Pavement Slabs." Research Report 56-9 (Center for Highway Research, University of Texas, October 1967).

? 1
Table 2
Typical Values of Modulo« of Sabgrade Reaction
Modulus of Subgrade Reaction, b, in ib/cn. in. for Moiaturc Contents of
1 S 9 13 17 21 25 Over 29%
25
Type of Materials to
4% to
8% to
12% to
16% to
20% to
24% to
28%
Slits and Clays Liquid Limit 50
(OH.CH.MH)
— 175 150 125 100 75 50
Silts and Clays Liquid Limit 50
(OL. CL, MLI "
200 175 ISO 125 100 75
Silty and Clayey Sards (SM & SC|,
300 250 225 200 150 — -
Gravelly Sands (SW & SP)
300 + 300 250 - - - -
Silty and Clayey Gravels (GM & GCI
300 + 300 + 300 250 — — -
Gravel and Sandy Gravels (GW & GPI
300 + 300 + - - - - -
50
NOTE: "k" values shown are typical for materials having dry densities equal to 90 to 95% of the maximum CE 55 density. For materials having dry densities less than 90% of maximum CE 55 density, values should be reduced by 60 Ib/cu in., except that a "k" of 25 lb/cu in, will be minimum used for design.
Values shown may be increased slightly if density i» .neater than 96 % maxhnum CE 66 density, except that a maximum "k" of 300 Ib/cu in. will be used for design.
in the design manual. This curve is shown here in Figure 2.
3 SLAB DESIGN METHOD
DMign Rtqulrwmnt*. Definitive life-cycle cost data were available to dictate a design life for the floor slabs. Examination of amortization costs for structures revealed a nearly constant rate after 40 to 50 years, which provided a basis for selection of a 50- year design lite. Critical stresses are based on Westergaard analysis for loading at a free edge, except that tree-edge stresses are reduced by 25% to account for load transfer across joints. This is con- sidered reasonable since, in a typical warehouse operation, only rarely will the full design load act on a free edge. An exception would be doorways carry- ing vehicular traffic, for which special provisions are provided in the manual. An impact factor of 1.25, as currently used in the Corps of Engineers design pro-
cedure for roads and streets.7 was included for all vehicles. The impact factor is used to provide for the effects of rapid vehicle braking or possible vehicle bouncing which could occur when the vehicle departs an inclined ramp to a level floor. Stresses were further modified by incorporating appropriate design factors for the effects of load repetition (fatigue).
D«sign Assumption». The following assumptions have been made with regard to applied loading:
a. The prime loads on the floor slabs will be fork- iifl trucks of various categories as described previously.
b. Vehicles other than forklift trucks can be sub- stituted as equivalent applicatbns of forklift
'Rigid Pavements for Roads, Streets, Walks, and Open Storage Areas. TM 5-822-6/AFM 88-7, Chap. 1 (Depart- ment of the Army and the Air Force, 19691.

UNIFORM LOAD
1
'SLAB IN UNLOADED POSITION
YIELDING SUBGRAOE -H Figwre 1. Nonuniform subgrade support.
8
a X
o hi K
i
2 s * s 15 § k X P L
to
to - It
I.I ■ > It
1 4
. . . 1 S 1* -
/ /
1« ■ / <t J
(i - / \ 1.0
§ ot
I A J (.0 ■
/ Of -
ot 0* ■
0 - —
0« ■ 0.4
ot
/ 1 / 1 1 1 ^^
0.» ■ / ;
> « n B M n I« n tt M M IA « •s A/
Dirre/KNCe •» SUKff40r MOOULt-pci
Figure 2. Recommended steel reinforcement for areis of nonuniform subgrtde support.
10

trucks. The specific equivalency relationships were taken from TM 5-822-6.
The following assumptions have been made with regard to the physical properties of the slab- subgrade system and its behavior upon application of loads:
a. Modulus of elasticity, E. and Poisson's ratio. M, for the concrete are 4.0 10* psi and 0.20. respectively.
b. Pavement thickness is uniform. c. The subgrade provides uniform support to the
floor slab for each major portion of the slab supported on a singly strength subgrade.
d. The floor slab and the subgrade behave elasti- cally under all loadings.
e. Floor slab stresses of various magnitudes may be equated to an equivalent number of appli- cations of a constant stress under cyclic loading.
Vehicular Traffic. The development of a desgn method to satisfy the design requirements described previously follows the procedures developed for the design of roads and streets.* Accordingly, all traffic expected to use floor slabs is compared to a single, basic loading, and after the establishment of equiva- lent coverage factors, the entire design is converted to various specified coverage levels of that base. The loading selected for the base is a single 25 kip axle load having the wheel configuration of Category HI (Table 1). The choice of the basic loading is arbitrary and was selected to provide a reasonable spread in the loadings and traffic volumes likely to be encountered under normal conditions.
the traffic lane where repetitions of the load are gmuest. It generally passes through the center line of the tire contact area (or midway between contact arras for dual tires) when the vehicle is centered in the traffic lane. A load is applied to the critical line whenever the tire contact area wanders less than a distance X'. equal to one-half the width of the tire contact area «or twin areas tor dual tires), from its centered position. For dual tires a distance X' is used to designate one-half the spacing between tire contact areas, and loads are not applied to the critical line when the vehicle wanders a distance less than X from its centered position. Traffic distribu- tion may be represented by the "normal distribution curve" and that 85 to 90 percent of this traffic is applied within the traffic lane. The area under the norm-* distribution curve corresponding to an absei, t of X (reduced by that corresponding to X' for duals) is the percentage of the total operatiotis which apply a load to the critical line. Thus, the number of operations p«r coverage is equal to the total number of operations divided by the percent- age of operations which apply a load to the critical line. That is. the number of operations per coverage is equal to the reciprocal of the product of the number of axles and the percentage of the area under the probability curve conctpcadiag to an abscissa of X (reduced by that correspoodiBg to X' for duals). In order to read the percentage of opera- tions appl äng a load to the critical line from tablet <>f probability functions, it is necessary to detenniHC values for X (and X) in terms o* standard devia- lions. To accomplisf. this, a lane of wander must be defined. This lane is taken as the traffic lane width less the distance between the outside edges of the (ire contar. areas of a vehicle. It is assumed to be equal to ±1.5 standard deviations (based on issumptun that 85 to 90 percent of the traffic is ipplied * thin the lateral limits of the traffic lane).
Before proceeding with the design method, it was necessary to establish the number of vehicle passes that would produce statistxally one coverage on the minimum aisle width specified in Table 1. The method of determining the pass-coverage relation- ship is based on the method described in a technical report,* as follows:
In this computation the critical portion of the traffic lane was considered to be a line located at points in
'P. P. CaritoB, Devtloprntnt of Rigid Pavement Thick- MM thquirtfiuntt for Mittuiy Road» and Stnt», Tech- nical Report No. 4-18 (U.S. Army Enguieer Diviaion. 1961).
'ReviseH Method of Thiehne»» Detign far Flexible High- way Pavement» at Military IfutaUation*. Technical Report No. 3-682 (U.S. Army Corps of Engiumrn, 1961).
The folk wing symbols represent values, either defined or assumed, determined on the basis of a study of dimensions, wheel configuration, load, tire pressure, and operating characteristics of standard civilian, commercial, and military vehicles expected to use roads and streets at military installations:
a. Pw = width of traffic lane; see Table 1. b. Tw = average width of tire or track; i.e. sum
of widths of tires or tracks for all vehicles within a specified load range divided by number of vehicles within this load range.
c. Ws = average wheel spacing; i.e. sum of center-to-center wheel or track spacings for all vehicles within a specified load range divided by the number of vehicles within this load
11

1
range. d. S = spacing between dual-wheel tires. e. Cw = width of tire or track contact area:
assumed to be equal to 75 percent of Tw for pneumatic tires, and equal to Tw for solid rubber tires.
f. Bw = wander: i.e. width of that portion of traffic lane available for wander of vehicle: assumed to be equal »o ±l.5o.
g. o = standard deviation: assumed to be equal
3 X = one-half the width of the tire contact area for single wheels or one-half the distance between the outside edges of tire contact areas for dual wheels. X = one-half the distance between the inside ed^rs of tire contact areas for dual wheels, n. n = values of X and X' in terms of o: for
C.
to
J
single wheels and tracks, n 2o for dual
l.75Tw+S 0.25 Tw+S wheels, n = = and n' = —= .
2o 2o
k. An. An = area under probability curve corre- sponding to abscissa of n or n'.
The following are examples of computations re- quired to determine the number of operations per coverage for representative configurations, taken from Table I.
a. Single axle, single wheel. (Category II)
Known: Single axle
Single wheel
Solid tire
10-to I Skip load
Tw = 7.0 in.
W$ = 33 in.
Pw = 90in.
Assumed: Cw = Tw = 7.0 in.
Then: B». = Pw (Ws+Cw)
= «) (33 + 7.0)
= «0 40.
= 50 in.
o =
n =
T-T-I6.67in.
'-w 7.0 2(16.67)
•0.2100
An = 16.63 percent (read from tables of probability functions)
Thus, only 16.63 percent of the operations apply a load to the critical pcrtion of the traffic lane. The number of operations per coverage of this single- axle, single-wheel configuration is equal to the reciprocal of the product of the number of axles and the area under the probability curve corresponding to an abscissa of n; therefore.
Operations per coverage = 1 I
B» = ±1.5o
(l)(An) (»(0.1663)
= 6.012
In other words, the critical portion of the traffic lane is loMded one time every 6.012 operations (passes) of this configuration.
h. Single axle, dual wheels. (Category IV)
Known: Single Axle
Dual wheels
Pneumatic tires
25- to 36-kip load
Tw = 9 in.
W$ = 71 in.
S =4 in.
Pw = 144 in.
Assumed: Cw = 0.75 Tw = 6.75 in.
12
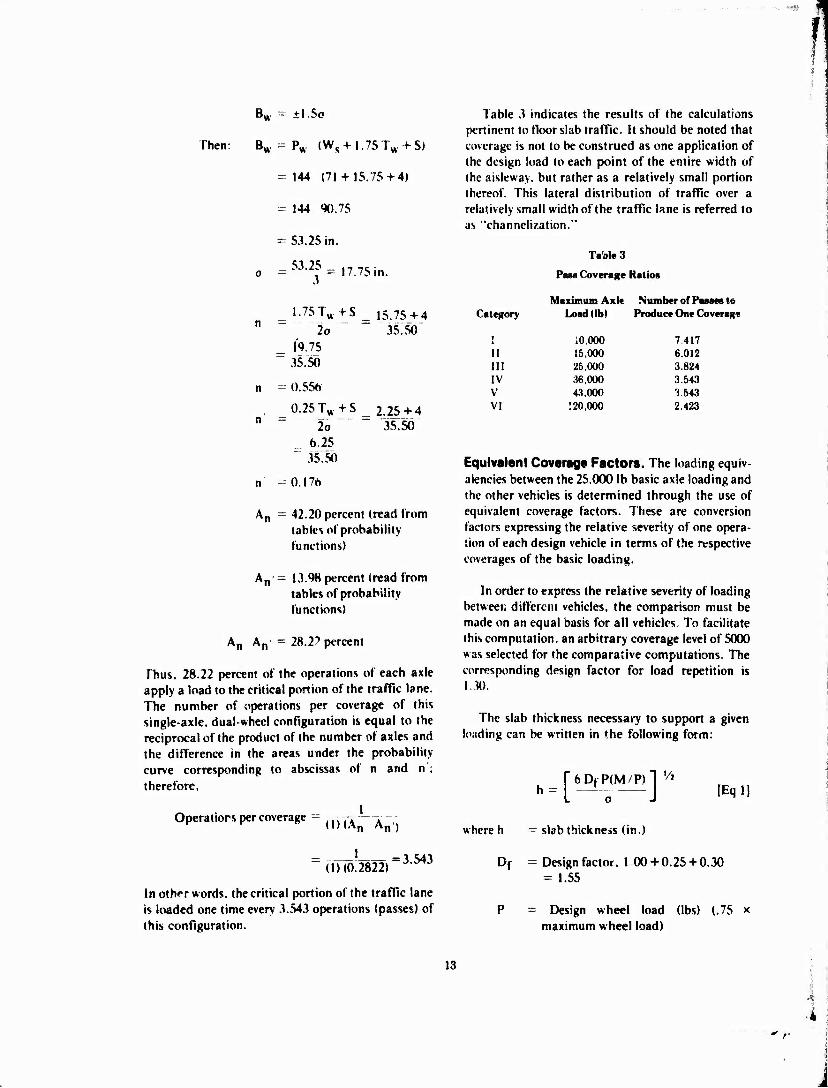
Then:
B« = ±l.5o
Bw = PW (Ws+I 75 Tw + S)
= 144 (71 + 15.75 + 4)
= 144 90.75
= 53.25 in.
0 ^•2*= 17.75 in.
1.75 TwfS _ 15.75+4 n 2o 35.50
l'<».75 35.50
n = 0.556
n 0.25 Tw+S
2o 6.25
" 35.50
_ 2.25+4 35.50
0.176
42.20 percent (read from tables of probability functions)
An' = 13.98 percent (read from tables of probability functions)
An An = 28.2? percent
Thus, 28.22 percent of the operations of each axle apply a load to the critical portion of the traffic lane. The number of operations per coverage of this single-axle, dual-wheel configuration is equal to the reciprocal of the product of the number of axles and the difference in the areas under the probability- curve corresponding to abscissas of n and n'; therefore.
Operations per coverage - J (l)(An V)
= I =1 543 (1X0.2822) J->U
In other words, the critical portion of the traffic lane is loaded one time every 3.543 operations (passes) of (his configuration.
Table 3 indicates the results of the calculations pertinent to floor slab traffic. It should be noted that coverage is not to be construed as one application of the design load to each point of the entire width of the aisleway. but rather as a relatively small portion thereof. This lateral distribution of traffic over a relatively small width of the traffic lane is referred to as "channelization."
Ta'ole 3
Pass Coverage Ratios
Maximum Axle Number of Passes to tegory Load (lb) Produce One Coverage
: 10.000 7.417 ii 15,000 6.012 in 25.000 3.824 IV 36,000 3.543 V 43.000 3.543 VI 120.000 2.423
Equivalent Coverage Factors. The loading equiv- alencies between the 25.000 lb basic axle loading and the other vehicles is determined through the use of equivalent coverage factors. These are conversion factors expressing the relative severity of one opera- tion of each design vehicle in terms of the respective coverages of the basic loading.
In order to express the relative severity of loading between ditferent vehicles, the comparison must be made on an equal basis for all vehicles. To facilitate this computation, an arbitrary coverage level of 5000 was selected for the comparative computations. The corresponding design factor for load repetition is 1.30.
The slab thickness necessary to support a given loading can be written in the following form:
r6DtP(M/P)l t/j
where h = slab thickness (in.)
Df = Design factor. 1 00+0.25 + 0.30 = 1.55
P = Design wheel load (lbs) (.75 x maximum wheel load)
13
1 !

Q.
O
u. UJ
8
S
aof 0.02 o.o? aos 0.10 0.2 0.3 0.5 1.0
A/f Figure 3. M/P vs A// curves for edge loading.
M/P = maximum moment per pound of wheel load induced by all wheels of the axle
o = concrete flexural strength (psi)
The design wheel load. P. is 75 percent of the maxi- mum wheel load specified in Table I. This reduction is a convenient way of incorporating the design assumption that streses at a pavement edge are reduced 25 percent to account for load transfer aiross joints.
Values of M/P can be determined from charts of A//2 versus M/P presented in Figure 3. A is the con- tact are.! per tire, / is the radius of relative stiffness of the slab given by the following equation:
/ r E*1 1 ,/4
L12(I V)kJ (Eq2l
where E — modulus of elasticity of the concrete (psi)
h - slab thickness (in.)
^ — Poisson's ratio for concrete
k = subgrade modulus taken as 100 pi
In developing the equivalent coverage factors, the pavement thickness required for 5000 coverages of each loading category is determined on the basis of Equation 1, This thickness is then expressed as a percentage of design thickness required for 5000 coverages of the basic loading. Using the thickness- vcrsus-coverage curve. Figure 4, the design thickness required for each loading category can be converted to equivalent coverages of the basic loading. The equivalent coverages or the basic loading are then divideu by the quantity ^ual to 5000 times the pass- coverage ratio, and thus the equivalent coverage factors are obtained for each loading. Numerical values for the equivalent coverage factors are shown in Table 4. with computed total coverages at various levels of operation for the entire design life of (lie
14

— .i-?r*nf'.\-t»j*nr't-;*
I t 4 t $ I 2 4 < • I « 4*91 t 4 t $ I I 4 9 » I 110
U 100
i to
V) I/»
•0
in to
TO 2
<0
2
It! «0
"
^,..-
5 - B ^' §
^ '■"''
i (0 I K>
COVEWACES
Figure 4a. C averages vs rigid floor slab thickness.
Table 4
Equivalent Coverage Facto« (ECF)
(1) Required Thiclaiea« far 5000 Covcragca,
Category in. (k=100lbe/ta!)
(2)
% of Bask Loading
(3) Coverages of Basic Loading
(4)
(3). 5000
(5)
Pass/Coverage Rath»
(6)
ECF (4)/(5)
I 5.84 II 7.22 III
(Basic Load) 7.20 IV 8.43 V 9.32 VI 16.18
81.1 100.3
8 6.400
.0016 1.08
7.417 6.012
2.16x10-* 0.180
100.0 117.1 129.4 210.9
5,000 440.000
4.200.000
1 88
840 •8.74 x10'
3.824 3.543 3.543 2.423
0.262 24.8
237 3.61 x 10'
'Define a new temporary basic loading which requires a 12 in. pavement thickness. Using the 12 in. bask pavement thickness, the Category V pavement thickness is 77.67% of the bask thkkness and can therefore sustain 2.5 coverages of the temporary basic loading. The Category VI pavement thickness is 126.5% of the bask thickness and can sustain 2.600.000 coverages of the temporary bask loading. Therefore, the Category VI pavement can sustain 1.04 x 10' times as many coverages as the Category V pavement. If a Category V pavement can withstand 840 coverages of the Category III loading, the Category VI pavement can with- stand 840 x 1.04 x 10' coverages or 8.74 x 10* coverages of the Category III loading.
15

I 2 4 « $ I t 4 t »I I 4 ; $ I 2 4 i $1 t 4 t » I
140 . D - g^^ -
/ I
s 1 1 .1 >'
* *
\, .''■
! '
»0 » (0
COVCIVAGCS «•
Figv« 4b. Coverages vs rigid floor slab thickness.
slab. The number of coverages of the basic loading at each level of operation for the design life of the slab is the product of the equivalent coverage factor and the total number of operations. Expressed con- versely, the teciprocal of the equivalent coverage factor is the number of actual operations required to equal one coverage of the basic loading.
The slab thickness required for 5000 coverages of the basic loading is determined through a trial-and- error procedure which is completed when the assumed slab thickness is the same as that found from Equation 1. For illustration purposes only, the last two iterations are shown. The basic loading is the 25 kip axle load Category III forklift truck. The loaded area is 62.5 in.1 per tire, k = 100 lbs per in.1
and the wheel spacings are 11-52-11 inches center to center. In the previous cycle through the solution procedure. Equation 1 yielded a value of h approxi- mately equal to 7 in. The radius of relative stiffness, /. is 33.03 in. and A//2 = 62.5/1091 = 0.0573.
From Figure 3. the M/P coefficients for the four tires are 0.484 + 0.244 + 0.025 + 0.017 = 0.770 for S//values of 0.0.0.333,1.91, and 2.24, respectively. The wheel load, which is one fourth the axle load or 6250 lbs, is reduced 25% to 0.75 (6250) = 4687.5 lbs to incorporate the assumption of 25% load transfer across joints. Since load is directly proportional to stress, this adjustment has the same effect as reducing the critical tensile stress at the pavement edge by 25%. Assuming a concrete flexural strength of 650 lb per in.2 in Equation 1, the required pave- ment thickness for 5000 coverages of the basic loading is:
h = _ r(6)(1.55)(4687.5)(0.770) L 650 r= 7.19 IEq31
For the next cycle of iteration, h is assumed to be 7.2 in. The radius of relative stiffness, /. is 33.74 in. and A//2 = 62.5/1138 = 0.0549. From Figure 3. the M/P coefficients for the four tires are 0.485 + 0.245
16

f
* |».U2> t 72 lor S//values of 0.0, 0.326. I,H7, and 2.l9. nspectivcly. The new calculated saluc oi h is:
(b)(!.55M4687.5)(0.772) 650 r- 7.20 in. |Eq41
Since the calculated value of h is the same (with 3-placi- accuracy) as that assumed at the beginning of the cycle, the iterative process is completed.
As an example of the use of equivalent coverage factors, let it be required that 250 operations per day of a 10 kip axle load forklift truck be converted into equivalent coverages of thg basic 25 kip axle load. The loaded area of the 10-kip vehicle is 27 in.2 per tire, the wheel spacing is 31 in. center to center. Again using a k-value of 100 lbs per in.1, the trial-and-error procedure leads to a required rlab thickness of 5.84 in. The corresponding radius of relative stiffness is calculated as / = 28.8 in. From Figure 3. for A//2. 27/28.81 = 0.0326. the M/P factor for tiie combined effect of both wheels is 0.636. Using the design factor of 1.55 and a flexural strength of 650 lb per in.1 in Equation I, the required pavement thickness for 5000 coverages of the 25 kip load forklift truck is 5.84 in. This is only 81.1% of the thickness required (7.20 in.) for a similar number of basic loading coverages. From the stress repetitions curve (Figure 4) 81.1 % of the 5000 coverage thickness would sustain the basic 25 kip loading only for eight coverages. Dividing by 5000. it can be seen that one coverage of the 25 kip load is equivalent to 0.0016 coverages of the basic loading. Since the Category I vehicle has a pass-to-coverage ratio of /.417. the Equivalent Coverage Factor (ECF) is 0.0016/7.417 = 2.16 x lO"4 which means that one pass or operation of tht 10 kip axle load is equivalent to 2.16 x 10"4 coverages of the basic load- ing. Thus. 250 operations per day or 3.788 x 10* operations per 50 years is equivalent to 2.16 x I0"4 x 3.788 x 10* = 818 coverages of the basic loading during the 50-year design life of the structure.
Design Traffic. Due to the wide variations in vehicle loadings and wheel configurations of the probable floor slab traffic, two different design charts were required to cover the range of anticipated traffic. The majority of forklift traffic will he composed of the smaller trucks (25.000 lbs or less). The anticipated volume of forklift truck traffic in excess of 25,000 lbs is relatively small and these
vehicles arc treated separately in the design manual.
A design index was established to provide simplicity and uniformity of design for the lighter- weight forklift truck traffic. Traffic volumes are expressed in terms of daily operations of various size forklift trucks as shown in Table 5. The number of daily operations selected for each design index was determined from observations of typical warehouse operations. The traffic volumes selected are con- sidered representative of normal warehouse activities. The design chart for these design indexes is shown as Figure 5.
TaiifeS
Traffic Categorica for Daaigii Indn
Deaign Index
1
2
Maximum Operation«
Per Day
10 kip axle load forklift truck 50
10 kip axle load forklift truck 250 15 kip axle load forklift truck 10
10 kip axle load forklift truck 250 15 kip axle load forklift truck 100
15 kip axle load forklift truck 250 25 kip axl; load forklift truck 5
Floor slab thickness requirements for Categories IV and V forklift trucks are also shown in Figure 5. The Category VI forklift trucks are shown on a separate design chart (Figure 6) because of signifi- cantly higher thickness requirements. All thickness requirements for Categories IV, V. and VI forklift trucks are based on an assumed traffic volume of five operations per day. With these trucks the use of a design index was not considered necessary since the traffic volume is constant. The appropriate design curves were merely designated as to forklift weight.
After establishing the design index, the type and volume of traffic in each category is converted to equivalent coverages of the basic 25 kip axle load. The results of these computations are shown in Table 6.
Thickness requirements for Categories IV. V. and VI were determined directly. Since mixed traffic was not involved, there was no need to convert to coverages of the basic loading. Table 7 indicates the required calculations. Table 7 and Table 8 have been
17

X o 2 UJ It
o «0
Q
§ g
is
S
I 9 CM
540
18

X o
UJ Q:
§ o V)
£ a. (0 Q 2
o Q.
O 2
£ K <0
X
I I
be e
>
E i
i I e
I •o s I IS
3 O
Xi
| "S
2
1
3 Ü e be
i
19

Table 6
Design Index io Terns of Equivalent Coverage* of Basic Loading
Operations Operations Design Per Day Per in 50 Yrs Index Category (15, ISO Days)
50-1
250 10
250 100 250
5
ECF
7.575x10' 2,16xl0•,
II
1 11 II III
3.7MxlO* 1.515 x10s
3.788x10' 1.515x10' 3.788x10' 7.575x10*
2.16 xl0M
0.180
2.16 xlO- 0.180 0.180 0.?82
Coverage* of Basic Loading
163.8
820 27,270
800 272,700 681,750
19,850
Percent TkiduM** Total for 5000 Coven^es
Coverages of Basic Loading
163.6 90.15
28,090
273.500
701,600
Table?
Design Curve Data for Categories IV, V, VI
Category
IV V VI
Operations Per Day
5 5 5
Operations in 50 Yrs
7.575 x 10* 7.675 x 10« 7.575 x 10'
used to prepare Figures 5 and 6, which present the relationships between concrete flexi>ral strength, subgrade modulus, traffic index or ioad category, and concrete slab thickness. The required slab thickness is indicated by the right side vertical scale.
The inclusion of other pneumatic and cushion- tired vehicles such as conventional trucks can be evaluated by considering each axle as one forklift truck axle of appropriate weight.
Tracked vehicles, though of considerable gross weight, do not represent a severe floor slab loading since the weight is distributed over a large area. Tracked vehicles are substituted for forklift trucks on a one-for-one basis (Table 8).
TableS
Load Categories far Tracked Vehicles
Tracked Vehicles Forklift Truck Maximum Gross Weight (kips) Category
less than 40 I 40 to 60 11 60 to 90 III 90 to 120 IV
Floor slab design requirements for special purpose ordnance, engineer, or transport vehicles producing loadings significantly different than the
Pass/ Coverage
Ratio
3.543 3.543 2.423
Total Coverages
21,380 21.380 31,260
105.6
114.9
119.5
Percent of Thickness for 5000
Coverages
104.7 104.7 106.0
loadings described herein should be requested from the Office of the Chief of Engineers (ATTN: DAEN- MCE-D).
Static Loads. Design criteria for maximum allow- able static loads are based on a procedure described by Rice.10 Negative moments in aisleways between loader1 storage bays will be critical for most designs. For each slab thickness, a critical aisle width has been established at which negative moments will attain a maximum value. The maximum negative moments are expressed in terms of the stationary live load intensity. The moments are converted to stresses and thus an allowable stationary live load intensity can be derived from allowable stresses. The resulting allowable maximum, uniformly distributed live loads are indicated in the appropriate section of the manual. Based on the field survey information, under ordinary warehouse operation . stationary live loads will be less than the allowable load; con- sequently stationary live loads will seldom control the design.
R«inf orc«d Floor Slab*. The design criteria incor- porated in the manual for reinforced concrete slabs
"P. F. Rice. "Design of Concrete Floor« on Ground for Warehouse Loadings." Journal of the American Concrete Institute. Vol. 29, No. 2 (1957).
20

F 1
Table 9
Field Survey Sites
Site Location Material StorH YearOmat
HS. PoRue Fairfax. Ohio
Dept Store inventory
1960
American Can Co. Broad* ell, Ohio
Steel wires 1967
McAlpin Co. (Old)
Cincinnati. Ohio
Textiles, household goods 1886
McAlpin Co. (New)
Cincinnati. Ohio
Textiles, household goods 1967
US Army Ais Bldg 092
Ft Knox. Kentucky
Tank engines, transmissions
1959
US Army Ars , Bldg #6658
Ft. Knox. Kentucky
Paints, paper 1953
US Army Ars Bldg #6564
Ft. Knox. Kentucky
Office equipment 1953
US Army Ars Bldg #6570
Ft. Knox. Kentucky
Ammunition 1963
GSA Depot Sharonville. Ohio
Natural Rubber Metallic Chips
1913
Def Const Supply Cn'.r
Columbus, Ohio
Heavy machinery 1942
Def Const Supply Cntr
Columbus, Ohio
Office supplies 1918
Del Const Supply Cntr
Columbus, Ohio
Very heavy machinery 1918
are based on criteria contained in TM 5-822-6. The basis of the design of reinforced floor slabs is the same as that required for the design of roads, streets, and open storage areas. Therefore, provisions con- cerning allowable thickness reductions are used without modification.
Join' Design. The general description of joint type and usage has been taken from TM 5-822-6. Joint spacing corresponds to that recommended for the design of roads and streets and was subsequently verified by the field inspection of selected warehouse sites. The use of load transfer devices, either in the form of keyed or doweled joints, has been relaxed somewhat with respect to the interim design manual on the basis of the field survey. A special feature of these structures is the use of isolation joints to pre- vent load transfer and allow for differential settle- ments between the floor slab and othir building components. The recommended design is based on a critical review of design methods by various agencies and a consensus of the personnel involved in the development of the manual.
4 FIELD SURVEY
Data Collection. A total of 13 warehouses was visited in Cincinnati and vicinity. They included warehouses of various governmental agencies and private industries (Table 9).
A fairly wide range of loadings were observed ranging from household goeds such as furniture and appliances to spools of wire for producing staples. The field survey consisted of a team of two engineers who visited the site, observed the condition of the floor slabs and questioned the personnel involved about problem areas. A field questionnaire sheet was prepir^d for use during the sum, (Appendix A). The information requested on the questionnaire is detailed and only rarely were data available in answer to all queries. The questionnaire was com- plcied by the two engineers on site to preserve terminology and adjective descriptions.
General Observations. The information collected was not amenable to rigorous analysis. It merely
21

served as a guide in the development of the technical manual. TM 5-809-12. Concrete Floor Slabs on Crude Subjected to Heavy Loads. Some general observations were made which are considered germane to all floor slabs on grade:
Traffic Volume. The average daily traffic of forklift trucks will probably seldom exceed 300 trips per day. Generally, traffic voSumes are in the range of 100 trips per day for a relatively active warehouse operation.
Allowable Slab Size, Floor slab* exhibited shrinkage cracks in nearly every case where the slab exceeded 600 square feet i|) area. A photograph of a typical shrinkage crack is shown in Figure 7. The particular crack shown in Figure 7 did not interfere with normal operations but is unsightly.
Isolation Joints. The need for isolation joints was observed during the field survey. Figure 8 shows some moderately severe distress observed in the vicinity of a column where no isolation joint was pro- vided. The floe' slab has cracked severely in this area. An example of a functioning isolation joint is shown in Figure 9. In this instance, the floor slab was not damaged by differential movement occurring between the column and floor slao. Isola- tion joints are considered essential in all floor slabs to preclude damage due to differential settlement. Figure 10 shows the diamond-shaped isolation joint used in more recent construction.
Surface Treatment of Floor Slabs. Approxi- mately half the floor slabs inspected during the field survey had a surface treatment applied to prevent concrete dusting. It consisted of a wax emulsion which produced a shiny, dust-free surface. In one case this treatment caused operational problems because ramps leading to loading docks were too slick for the forklift trucks to climb. In this particular case, the problem was solved by sawing transverse grooves in the ramps to increase traction. However, grooving concrete is a comparatively expensive operation, so an alternate solution which could reduce the cost substantially is offered in the design manual: the use of non-skid abrasive tapes of the type used on stair treads is recommended in areas where traction may be a problem.
Joint Sealing. The field survey indicated that about two thirds of the typical floor slab installations
were placed without joint sealants. Generally joints were sealed in older floor slabs. The design manual specifies sealed joints shall be optional with the designer.
Allovnable Stationary Live Loads. Personnel in charge of warehouse operations irHicated a definite need for the establishment of allowable stationary live loads. This was particularly true where operations are highly variable such as at the Defense Construction Supply Center in Columbus, Ohio.
The need for thickened edges at doorway open- ings was also observed in the field study. Cracking au» t.~ either free edge loading or subsidence of poorly compacted backfill was noted. Figures 11 and 12 are probably ndicative of the latter. Figure 12 is a close-up shot of a crack at a doorway barely visible in Figure II.
5 CONCLUSIONS AND RECOMMENDATIONS
Based on the results of the field survey, following general conclusions are drawii:
the
a. Traffic volumes, although approximate only, are substantially lower than anticipated. For the 10 kip load category, the average volume was found to be 100 trips per day with an upper limit of about 300 trips per day. Few estimates are available on the percentage of loaded trips, but it appears that 50 to 75% of the above volumes carried full load.
b. With regard to vehicular load, forklift trucks in use did not erceed the 10 kip load at the majority of the sites inspected. Only one site had a 60 kip load forklift truck to transport heavy machinery although these vehicles were utilized to some extent in outside storage areas.
c. The slab size limitation of 600 ft2 set forth in the manual appears to be reasonable to prevent shrinkage cracking. Shrinkage cracks were observed at many sites where this limitation had been exceeded.
d. Cracicing of slabs and joint spalling did not seem to interfere with normal warehouse operations as long as adjacent slabs did n< t settle differentially. In the latter case bouncing of vehicles at the joints created problems in transporting stacked material.
22

i
Fifture 7. Typical shrinkage crack due to large panel.
Picare 8. Distress caused by no provision of isolation joint around column pedestal.
23


c. Contraction and construction joints were usually designed with some load transfer device, either keyed or doweled on recent constructions.
Based on the results of the field survey, the design index chart incorporated in the interim design manna! has been revised to de-emphasize heavy volumes and loads. The number of design indexes was reduced from eight to four. The new ly prepared design chart is included in the manual as Figure 1. Individual design curves have been prepared for the Categories IV. V. and VI forklift trucks in case they would be required. The curves for Categories IV and V are included in Figure I. The Category VI design curves are given in Figure 2- A separate paragraph was added stressing the importance of compacting the backfill around columns.
REFERENCES
Carlton, P. F.. Development ol Rigid Pavement Thickness Requirements for Military Roads and Streets. Technical Report No. 4-18 (U.S. Army Engineer Division. Ohio River Division Laboratories. July l%l).
Concrete Fhtor Slabs on Grude Subjected to Heaxy Loads. TM 5-809-12 (Department of the Army and the Air Force. Draft).
Concrete Structural Design lor Buildings. TM 5-HW-2/AFM 88-3. Chap. 2 (Department of the Army and the Air Force, January 1%7).
Pavement Design for Frost Conditions. TM 5-818-2 (Department of the Army. 1%5).
Procedures Jor Foundation Design ol Buildings and Other Structures {Except Hydraulic Structuresi, TM 5-818-1 AFM 88-J. Chap. 7 (Department of the Army. I%l).
Revised Method of Thickness Design for Flexible Highway Pavements at Military Installations. Technical Report No. 3-582 (U.S. Army Corps of Engineers, Waterways Experiment Station. August l%l).
Rice. P. F.. "Design of Concrete Floors on Ground for Warehouse Loadings." Journal of the American Concrete 'nstitute. Vol 29. No. 2 (August 1957).
Rigid Pavements for Roads. Streets. Walks, and Open Storage Areas. TM 5-822-6/AFM 88-7, Chap. 1 (Department of the Army and the Air Force. 1%9).
Std/cr. C. F. and W. R. Hudson. A Direct Com- puter Solution for Plates and Pavement Slabs. Research Report 56° (Center for Highway Re- search, University of Texas. October 1%7).
26

^^MMIIW >wr
APPENDIX A: FIELD SURVEY DATA SHEET
GENERAL
Conpany:
Location:
Type of Storage:
Year Constructed;
FLOOR SLABS
Approximate Size;
Floor Cover:
Thickness:
Drainage:
Base Course:
Subsurface Information:
Generally above below natural grade.
Remarks:
27
<
u

TRAFFIC; Mainly forkllft
Approximate ADT:
, hand cart other specify
Maximum gross weight:
Most traffic pneumatic tired
% trips made at full load:
cushion tired
Traffic Lanes and storage bins defined
Aisle width If applicable
not defined
PAVEMENT:
Type:
General Condition: Excellent
Very Good
Good
Fair
Poor
Joints sealed
keyed
Joint Condition
Reinforced
Pavement distress
unsealed
doweled
non-reinforced
28
r

«■. ft*f wftii •«■ ■ w *^v TF1
!! •>•;-; ^;?''j>'r(*--fi,/*H1
Remarks
STATIC LOADS:
What is stored
Loads are heavy moderate Light
Height of stacks
Approximate load in psf
Storage bin size if applicable
Precautions taker for storage of dangerous or potentially dangerous
materials
Remarks
MISCELLANEOUS:
Type of heating if 3ny:
Areas other than storase:
Remarks:
?.>