distance learning in montana a survey-based assessment
TRANSCRIPT

Distance Learning in MontanaA Survey-Based AssessmentJune 2010
Prepared for:The Office of the Commissioner of Higher EducationMontana University SystemHelena, MT 59620
Table of Contents
Background ............................................................................................................................................ 2 Acknowledgements ................................................................................................................................ 3 Executive Summary ................................................................................................................................ 4 Introduction ......................................................................................................................................... 10 Overall Interest in Distance Learning ................................................................................................... 13 Current Experiences with Distance Learning ....................................................................................... 21 Dual Credit Courses .............................................................................................................................. 30 Internet Access ..................................................................................................................................... 32 Barriers to Taking Distance Learning Courses...................................................................................... 41 Conclusion ............................................................................................................................................ 44
Appendix A: Measuring Distance Learning Interest............................................................................ A1
Appendix B: Senior Citizens Interest in Distance Learning ................................................................. B1
Appendix C: Gallup Tables................................................................................................................... C1
Appendix D: Questionnaire .................................................................................................................D1
2
Background
The Montana University System eLearning Advisory Committee is composed of the primary eLearning representative from each of the eight MUS and the three community college campuses, eLearning leaders who, along with the MUS Director of eLearning Business Development, regularly communicate and collaborate to benefit learners and to align campus eLearning efforts. During each of the past several annual strategic planning sessions, the group identified some knowledge gaps surrounding eLearning. When the FY10 planning session was convened in June 2009, as one of the goals, the eLearning Advisory Committee believed strongly that it was time to find out from the consumer perspective, what the citizens of Montana were interested in from eLearning, whether they had ready access to eLearning from a technology perspective, whether they had accessed eLearning before and were interested in completing a certificate or degree via eLearning, and whether they had an interest in using eLearning for workforce training. With support from the eLearning Advisory Committee and the Deputy Commissioner for Academic & Student Affairs, the Commissioner’s Office commissioned a survey of Montanans, intended to serve as a gap analysis for eLearning in Montana. Though the eLearning Advisory Committee involves multiple eLearning staff from each of the campuses in its frequent discussions, the official designated campus representatives who supported this survey included the following:
Jim Aspevig, UM-MT Tech
Kevin Brockbank – UM-Helena CoT
Janice Brady – MSU-Northern
Kim Obbink – MSU-Bozeman
Pat Pezzelle – Flathead Valley CC
Anneliese Ripley – UM-Western
Keith Lynip – UM-Missoula
Tim Tirrell – MSU-Billings
MaryAnn Vester – Dawson CC
Shelly Weight – Miles CC
Ryan Schrenk – MSU-Great Falls CoT
Thomas Gibson – OCHE
The MUS recognizes and appreciates the survey and analysis conducted by the Bureau of Business and Economic Research. The people of Montana will ultimately reap the rewards of this good work as the campuses embrace the results and respond to address the eLearning gaps in program and course delivery that have been identified in this report.

3
Acknowledgements The authors at BBER greatly appreciate the assistance of the Montana Office of the Commissioner of Higher Education in all aspects of planning and administering this survey. Special thanks go to Commissioner Sheila Stearns, Deputy Commissioner Sylvia Moore, and Director of eLearning Business Development Tom Gibson of the Office of the Commissioner of Higher Education for their hard work, amazing patience, and good humor.
Janet Stevens of BBER worked diligently to supervise the data collection of this study. Finally, the authors are most grateful to the BBER telephone survey supervisors and interviewers. Their dedication to careful research and persistence made this study a success.

4
Distance Learning in Montana: A Survey-Based Assessment Executive Summary
In the fall of 2009 the Bureau of Business and Economic Research (BBER) at The University of Montana conducted a survey-based assessment of distance learning experiences, preferences, and capabilities of the Montana adult population. In this study
• The term “distance learning” was defined as educational course work that uses (i) the internet, (ii) interactive two-way television transmitted to a central learning site, or (iii) mostly mailed out materials in some combination.
• A random sample of 1,226 respondents, including both landline and cell phone-only households, was collected by survey researchers at the Bureau to assess (i) demand for distance learning, (ii) preferences for types of distance learning delivery systems, (iii) distance learning courses sought, barriers to distance learning access, and (iv) capacity of Montanans to access distance learning through the internet.
• Estimates for population totals were constructed by applying the proportions calculated from survey respondents to the most recent U.S. Census Bureau estimates of the relevant population.
• The sample was stratified by two age categories: persons age 18-64 and persons age 65 and older. This was performed to include older Montanans in the study while focusing the bulk of the study’s resources on the age group thought most likely to use distance learning. There were 1,164 respondents aged 18-64.
5
The report’s key findings include:
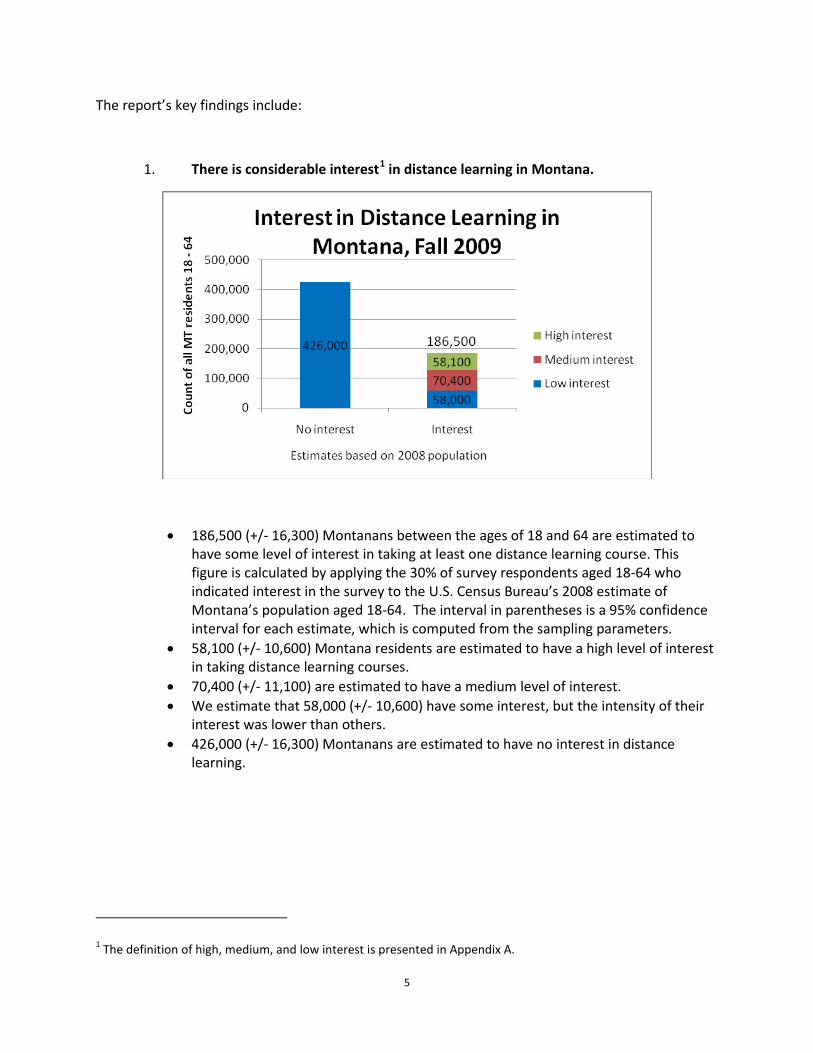
1. There is considerable interest1 in distance learning in Montana.
• 186,500 (+/- 16,300) Montanans between the ages of 18 and 64 are estimated to have some level of interest in taking at least one distance learning course. This figure is calculated by applying the 30% of survey respondents aged 18-64 who indicated interest in the survey to the U.S. Census Bureau’s 2008 estimate of Montana’s population aged 18-64. The interval in parentheses is a 95% confidence interval for each estimate, which is computed from the sampling parameters.
• 58,100 (+/- 10,600) Montana residents are estimated to have a high level of interest in taking distance learning courses.
• 70,400 (+/- 11,100) are estimated to have a medium level of interest. • We estimate that 58,000 (+/- 10,600) have some interest, but the intensity of their
interest was lower than others. • 426,000 (+/- 16,300) Montanans are estimated to have no interest in distance
learning.
1 The definition of high, medium, and low interest is presented in Appendix A.

6
2. Interest in distance learning by those aged 18-64 in Montana varies by region.
• Interest is proportionately highest in the southwest and south central regions of the state2
• Estimates of the population between the ages of 18 and 64 who have an interest in distance learning by region are as follows:
. It is lowest in eastern Montana.
Southwest Montana: 53,700 (+/- 8,300) Northwest Montana: 49,700 (+/- 9,100) South Central Montana: 45,500 (+/- 7,700) North Central Montana: 29,600 (+/- 6,000) Eastern Montana: 8,000 (+/- 3,800)
As in all population estimates, these figures were computed by applying the proportions obtained from respondents in each region to their respective populations aged 18-64 obtained from the U.S. Census Bureau.
2 MT Department of Labor and Industry Labor Market Regions: Region 1 (Northwest) Lincoln, Sanders, Mineral, Missoula, Ravalli, Flathead and Lake. Region 2 (Southwest) Granite, Powell, Lewis and Clark, Meagher, Broadwater, Jefferson, Silver Bow, Deer Lodge, Beaverhead, Madison and Gallatin. Region 3 (North Central) Glacier, Toole, Liberty, Hill, Blaine, Phillips, Pondera, Teton, Chouteau and Cascade. Region 4 (South Central) Judith Basin, Fergus, Petroleum, Wheatland, Golden Valley, Musselshell, Park, Sweet Grass, Stillwater, Carbon, Yellowstone. Region 5 (Eastern) Valley, Daniels, Roosevelt, Sheridan, Garfield, McCone, Richland, Dawson Prairie, Wibaux, Rosebud, Custer, Fallon, Treasure, Powder River, Carter.

7
3. There is considerable internet capacity overall in Montana, particularly in the population who indicate interest in distance learning.
• Survey responses indicate that nine out of ten Montanans aged 18-64 who have an
interest in distance learning have a working internet connection in their homes. This represents a total of 167,500 (+/- 15,800) people statewide.
• 158,000 (+/- 15,200) adults who are interested in distance learning most frequently use a high speed connection like a digital subscriber line (DSL) or a cable television connection to access the internet.
• Only 3.1 percent of Montanans aged 18-64 who are interested in distance learning say that they do not use the internet.
• American Indians and low income households have significantly lower internet access from their homes than the general population. Whether this is due to cost, preferences, or availability is unknown.
4. Courses in business oriented topics are the most frequently taken via distance
learning in Montana.
• Using the proportions of respondents indicating their distance learning experiences applied to the Montana population aged 18-64, we estimate that 19,000 Montana adults have taken a business course via distance learning. Course titles classified as business represented a broad spectrum of subjects including insurance, business communications, property management, marketing, customer service, and business operations.
• The next most frequently mentioned distance learning subject, finance and accounting, was taught to an estimated 11,100 Montana adults (individual respondents could indicate multiple course subjects taken). These included personal finance and tax courses.
• The estimated 10,900 Montana adults who have taken a computer science course via distance learning represented the third most frequent subject. These topics ranged from web design, information services, primers on internet use, computer languages, and use of popular computer programs.
• The next most popular subjects, in descending order of frequency, reported as having been delivered by distance learning were: mathematics, education, nursing, English, trades, psychology, communications and medical science.
8
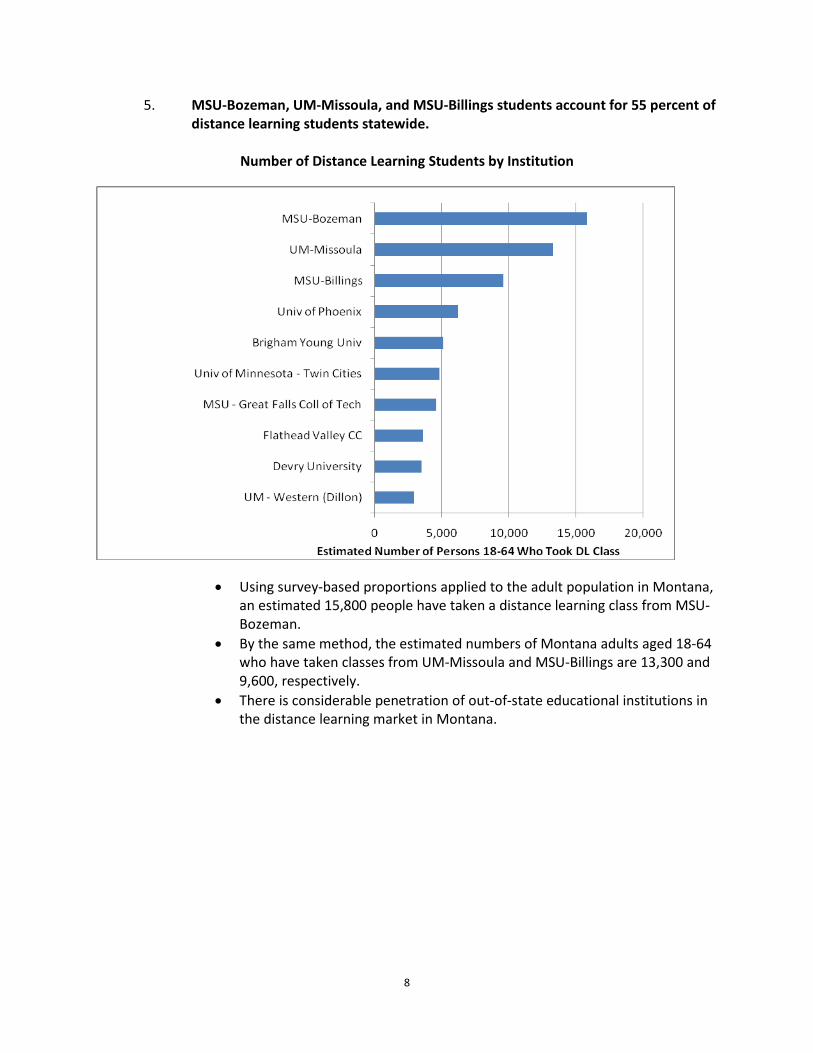
5. MSU-Bozeman, UM-Missoula, and MSU-Billings students account for 55 percent of distance learning students statewide.
Number of Distance Learning Students by Institution
• Using survey-based proportions applied to the adult population in Montana, an estimated 15,800 people have taken a distance learning class from MSU-Bozeman.
• By the same method, the estimated numbers of Montana adults aged 18-64 who have taken classes from UM-Missoula and MSU-Billings are 13,300 and 9,600, respectively.
• There is considerable penetration of out-of-state educational institutions in the distance learning market in Montana.
9
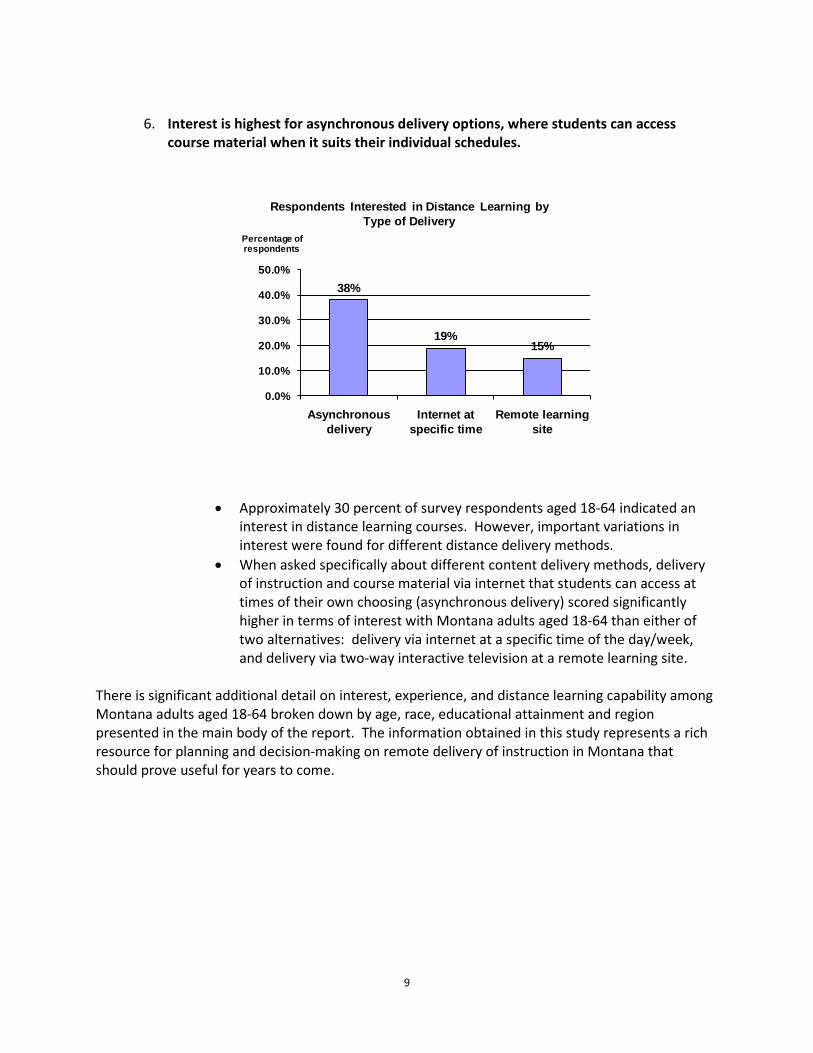
6. Interest is highest for asynchronous delivery options, where students can access
course material when it suits their individual schedules.
• Approximately 30 percent of survey respondents aged 18-64 indicated an
interest in distance learning courses. However, important variations in interest were found for different distance delivery methods.
• When asked specifically about different content delivery methods, delivery of instruction and course material via internet that students can access at times of their own choosing (asynchronous delivery) scored significantly higher in terms of interest with Montana adults aged 18-64 than either of two alternatives: delivery via internet at a specific time of the day/week, and delivery via two-way interactive television at a remote learning site.
There is significant additional detail on interest, experience, and distance learning capability among Montana adults aged 18-64 broken down by age, race, educational attainment and region presented in the main body of the report. The information obtained in this study represents a rich resource for planning and decision-making on remote delivery of instruction in Montana that should prove useful for years to come.
38%
19%15%
0.0%
10.0%
20.0%
30.0%
40.0%
50.0%
Asynchronous delivery
Internet at specific time
Remote learning site
Percentage of respondents
Respondents Interested in Distance Learning by Type of Delivery
10
1. Introduction
Project Overview The Montana Office of the Commissioner of Higher Education contracted with the Bureau of Business and Economic Research (BBER) at The University of Montana to assess demand for distance learning statewide and in major labor markets throughout Montana. Using a random sample of 1,226 respondents, including both landline and cell phone-only households, survey researchers at the Bureau assessed demand for distance learning, preferences for types of distance learning delivery systems, distance learning courses sought, barriers to distance learning access, and capacity of Montanans to access distance learning through the internet. BBER surveyed residents of Montana who were 18 years old or older and had a working landline or cellular telephone. Interviews were conducted in October and November 2009. This study population should not be confused with all adult residents because it excludes residents who do not have telephones, the institutional population, and those who were absent during the study period. The survey was administered using Computer-Assisted Telephone Interview (CATI) techniques. The study completed a total of 1,226 interviews. The sample was stratified by two age categories: persons age 18-64 and persons age 65 and older. This was done to include older Montanans in the study while focusing the bulk of the study’s resources on the age group thought most likely to use distance learning. The landline portion of the sample was selected by random digit dial and within household respondent selection was made using the Kish method. The cellular telephone sample was selected randomly from a list provided by Survey Samples International, Inc. The overall rate of sampling error for this survey is +/- 2.8 %. This means that if the survey were repeated 100 times, in 95 of the replications the estimates found would be within +/- 2.8 % of those published here. Sampling error rates for sub-samples of this study are higher. The data presented in this report are weighted by age and sex using the 2008 U.S. Census Bureau population estimates for the study area of persons age 18 and older. Post-stratification weighting of this type is a standard data processing technique that has been shown to improve the accuracy of survey-based estimates.
Key Findings This study represents a comprehensive assessment of the interests, preferences, and capabilities of the Montana adult population concerning the delivery of education electronically. Its most important findings include:
• Approximately one third of Montanans aged 18-64, or 186,500 (+/- 16,300) individual, indicated an interest in distance learning (figures in parentheses represent the margin of error in survey estimates);
11
• Overall interest varies regionally, with south central, southwest, and north central Montanans showing higher than average interest, and northwest and eastern Montanans indicating interest in distance learning lower than the overall average;
• Interest is higher for asynchronous course delivery options, where the student can access course material when it suits his or her individual schedule, as well as for options that do not require students to travel to specific facilities;
• Almost half of those with interest in distance learning courses are not interested in pursuing any formal degree or certification;
• Courses in business oriented topics are the most frequently taken via distance learning in Montana, with MSU-Bozeman, UM-Missoula, and MSU-Billings jointly accounting for 55 percent of distance learning students statewide;
• Access to high speed internet connections from home is high but not universal in Montana, particularly for lower income and American Indian households;
• 83.9 percent of survey respondents overall said that high speed internet was available where they live;
• Home is the place where Montanans most frequently use internet, particularly white, educated, more affluent individuals;
• Nine out of every ten Montanans who indicated interest in distance learning have internet access in their homes;
• Internet access for sub-populations - such as lower income, American Indian, or less educated individuals - is different from the population as a whole. Dial-up access and internet use away from home is more prevalent in these groups. This may reflect preferences, costs, or availability;
• Scheduling and coordination with other activities rank high among the barriers cited as reasons for not taking distance learning courses.
Survey Response Rate BBER documented survey case status in a manner that allowed reporting an interview response rate using the American Association for Public Opinion Research (2008) standard definition (RR3). The response rate for this survey was 41.8 %. This response rate is typical for rigorously conducted RDD surveys. The following is a detailed description of this survey’s interview outcomes:
• 1,226 completions • 1,136 refusals • 122 unresolved appointments • 119 illnesses, language problems, other non-completions • 330 estimated valid respondents among “always busy, no answer, or ambiguous
answering machine” phone numbers • 2,933 Total Sample
12
Organization of This Report The remainder of this report presents and discusses the results in greater detail. The next section presents results on overall interest in distance learning. Section three gives information on the current experiences with distance learning from Montanans who are taking or have taken electronically delivered courses. This is followed by a brief discussion concerning interest in duel credit (high school and college) programs for teens. Section five details findings on internet access in Montana, with particular emphasis on higher bandwidth access required for video and other applications common to distance instruction. Section six summarizes barriers to participation in distance learning as seen through the eyes of actual and potential students. In the conclusion we present key findings and summarize the methods used to produce them. Appendix A presents the details in the measurement of distance learning interest intensity. The interest of Montana’s senior citizens in distance learning is described in Appendix B. Full survey result tables and the questionnaire are included in Appendices C and D at the end of the report.

13
2. Overall Interest in Distance Learning
There is considerable interest in distance learning education in Montana. (See Appendix A for the definition of interest). The 30.5 percent of Montanans aged 18-64 who indicated a high, medium, or low interest in distance learning reported in Table 2.1 below represent approximately 186,500 (+/- 16,300) actual or potential students. This is more than five times the total enrollment of students on all MUS campuses during academic year 2009. There are several characteristics of this sub-population of Montana adults which we find to be statistically significant and worthy of note.
Table 2.1: Overall Interest in Distance Learning
Distance Learning Interest High
Interest Medium Interest
Low Interest
No Interest
Total Respondents
Total 9.5% 11.5% 9.5% 69.5% 1,164
Sex of respondent* Female 10.8% 13.0% 7.5% 68.8% 554 Male 8.3% 10.2% 11.3% 70.2% 610 Age of respondent
18 - 24 10.2% 13.6% 10.6% 65.7% 292 25 - 39 11.6% 13.2% 11.5% 63.6% 296 40 - 49 7.6% 9.3% 6.5% 76.5% 237 50 + 8.3% 9.7% 8.8% 73.2% 339 Race of respondent
American Indian 12.9% 10.7% 9.2% 67.2% 77 White 9.7% 11.2% 9.7% 69.3% 1,016 Educational attainment*
Less than HS diploma .0% 9.1% 13.0% 77.9% 66 HS diploma, GED, some college 8.5% 9.9% 10.5% 71.2% 712 BA + 13.6% 15.3% 6.8% 64.3% 367 2009 household income*
< 20k 4.0% 15.8% 17.6% 62.6% 148 20k - 34k 7.4% 7.9% 9.1% 75.7% 128 35k - 49k 6.3% 16.1% 8.5% 69.1% 163 50k - 74k 16.5% 8.8% 6.0% 68.6% 222 75k - 99k 10.7% 9.9% 13.7% 65.7% 147 100k + 10.2% 14.9% 5.3% 69.6% 158 Disability status*
Yes 4.6% 9.3% 10.8% 75.4% 188 No 10.4% 11.9% 9.2% 68.4% 976 MT Labor Market Areas*
Northwest 8.1% 10.6% 6.9% 74.5% 333 Southwest 12.0% 8.0% 13.9% 66.1% 298 North Central 8.9% 14.4% 9.9% 66.7% 193 South Central 9.9% 14.9% 9.5% 65.7% 264 Eastern 5.8% 10.2% 2.4% 81.6% 77 * Difference between two or more demographic categories significant at .05 level. Source: 2009 Montana Distance Learning Survey, Bureau of Business and Economic Research, The University of Montana-Missoula.

14
Those interested in distance learning are:
• slightly more likely to be female, particularly those indicating higher degrees of interest;
• more likely to be educated beyond high school;
• slightly more likely belong to be middle-high income households earning between $35,000 and $100,000 per year;
• less likely to classify themselves as disabled;
• less likely to come from eastern Montana.
Table 2.2: Are you, yourself, currently interested, not sure, or not interested in taking a distance learning course that is taught mostly on the internet at a specific time each week?
Interest in Internet Class At Specific Time
Interested Not Sure Not
Interested Total
Respondents Total 19.0% 15.1% 65.9% 1,162 Sex of respondent Female 19.1% 15.2% 65.7% 554 Male 18.9% 15.0% 66.1% 608 Age of respondent* 18 - 24 17.5% 23.0% 59.5% 292 25 - 39 24.5% 10.6% 64.9% 296 40 - 49 15.8% 14.8% 69.4% 236 50 + 17.7% 12.3% 70.0% 338 Race of respondent* American Indian 23.2% 30.9% 46.0% 77 White 18.7% 14.2% 67.1% 1,014 Educational attainment* Less than HS diploma 7.0% 33.1% 59.9% 66 HS diploma, GED, some college 18.5% 14.6% 66.9% 711 BA + 22.5% 13.5% 63.9% 367 2009 household income < 20k 29.4% 14.5% 56.2% 147 20k - 34k 15.0% 11.4% 73.6% 128 35k - 49k 19.3% 11.7% 68.9% 163 50k - 74k 19.5% 18.3% 62.2% 222 75k - 99k 20.8% 13.0% 66.2% 147 100k + 17.2% 13.5% 69.2% 158 Disability status Yes 13.4% 16.0% 70.6% 187 No 20.1% 14.9% 65.0% 975 MT Labor Market Areas* Northwest 19.4% 14.2% 66.3% 333 Southwest 21.9% 15.9% 62.2% 297 North Central 17.2% 6.6% 76.2% 192 South Central 18.9% 16.4% 64.7% 264 Eastern 11.0% 32.2% 56.8% 77
* Difference between two or more demographic categories significant at .05 level. Source: 2009 Montana Distance Learning Survey, Bureau of Business and Economic Research, The University of Montana-Missoula.

15
All of these tendencies are matters of degree. Within the nearly one third of adult Montanans aged less than 65 who report themselves as having some degree of interest in distance learning, there are undoubtedly significant numbers of those on the “less likely” side of each of these criteria.
We investigated potential interest in three specific delivery methods for distance learning education: (i) synchronous course delivery via internet, where students “meet” via internet at a regular, specific time, (ii) asynchronous internet delivery, which can be accessed by students at times of their own choosing, and (iii) delivery at a specific physical site using interactive television. Our findings on these methods are presented in Tables 2.2, 2.3 and 2.4, respectively.
Table 2.3: What about a distance learning class that is taught entirely on the internet and that can be accessed by you whenever you have time?
Interest in Internet Class At Any Time
Interested Not Sure Not
Interested Total
Respondents Total 38.0% 16.2% 45.8% 1,164 Sex of respondent Female 38.2% 17.7% 44.1% 554 Male 37.9% 14.7% 47.4% 610 Age of respondent* 18 – 24 42.1% 21.5% 36.4% 292 25 – 39 43.0% 9.2% 47.9% 296 40 – 49 33.9% 18.8% 47.3% 237 50 + 33.1% 15.8% 51.1% 339 Race of respondent American Indian 40.4% 25.4% 34.2% 77 White 38.6% 15.8% 45.5% 1,016 Educational attainment Less than HS diploma 38.0% 8.9% 53.1% 66 HS diploma, GED, some college 36.7% 17.2% 46.1% 712 BA + 42.1% 15.6% 42.3% 367 2009 household income* < 20k 43.3% 23.2% 33.4% 148 20k - 34k 32.0% 10.7% 57.4% 128 35k - 49k 42.4% 16.3% 41.3% 163 50k - 74k 37.7% 16.5% 45.8% 222 75k - 99k 41.2% 13.9% 44.9% 147 100k + 42.9% 13.8% 43.3% 158 Disability status* Yes 28.6% 17.4% 54.0% 188 No 39.8% 15.9% 44.2% 976 MT Labor Market Areas Northwest 39.1% 16.5% 44.4% 333 Southwest 41.2% 14.0% 44.8% 298 North Central 37.9% 17.1% 45.0% 193 South Central 37.2% 15.4% 47.4% 264 Eastern 24.0% 23.2% 52.9% 77 * Difference between two or more demographic categories significant at .05 level. Source: 2009 Montana Distance Learning Survey, Bureau of Business and Economic Research, The University of Montana-Missoula.

16
There is a clear distinction in interest between asynchronous internet delivery, on the one hand, and the other two methods considered. 38 percent of respondents said that they were interested in courses that they could access via internet at times of their own choosing, whereas the synchronous delivery of material via internet or via television at a central learning site were attractive to only 19.0 and 15.2 percent of adult Montanans, respectively. Most of the differences between interest according to age, sex, disability status, educational attainment, income, and region were the same for the different delivery categories as shown in Table 2.1 for distance learning education overall. An exception is the stronger preference of the young for asynchronous internet delivery.
Table 2.4: And what about a distance learning class that is taught using interactive (two-way) television at a central learning center site?
Interest in Internet Class At A Central Learning Center
Interested Not Sure
Not Interested
Total Respondents
Total 15.2% 20.8% 64.1% 1,159 Sex of respondent Female 13.3% 20.3% 66.4% 553 Male 16.8% 21.2% 61.9% 605 Age of respondent* 18 – 24 18.0% 28.4% 53.6% 292 25 – 39 16.1% 18.2% 65.7% 293 40 – 49 10.7% 19.9% 69.5% 236 50 + 15.0% 17.1% 67.9% 338 Race of respondent* American Indian 16.8% 34.3% 49.0% 77 White 13.7% 20.7% 65.6% 1,013 Educational attainment Less than HS diploma 22.1% 17.1% 60.8% 66 HS diploma, GED, some college 13.4% 23.0% 63.6% 709 BA + 17.4% 18.2% 64.4% 367 2009 household income* < 20k 12.9% 34.2% 52.9% 148 20k - 34k 16.1% 18.8% 65.1% 128 35k - 49k 13.8% 24.3% 61.9% 162 50k - 74k 19.9% 19.4% 60.6% 221 75k - 99k 15.9% 17.4% 66.7% 146 100k + 14.1% 13.4% 72.5% 158 Disability status Yes 14.9% 22.8% 62.3% 187 No 15.2% 20.4% 64.4% 971 MT Labor Market Areas Northwest 17.5% 20.5% 62.0% 331 Southwest 19.2% 20.3% 60.5% 295 North Central 11.6% 22.4% 66.0% 192 South Central 12.3% 21.4% 66.3% 263 Eastern 8.3% 17.7% 74.0% 77 * Difference between two or more demographic categories significant at .05 level. Source: 2009 Montana Distance Learning Survey, Bureau of Business and Economic Research, The University of Montana-Missoula.

17
Those who were interested in distance learning were given an opportunity to indicate what subject areas were of greatest interest to them. The highest number (12.8 %) picked business as a subject area of interest, followed by education, computer science, psychology and trades. As can be seen from Figure 2.1 depicting the top fifteen scoring subject areas, the differences between preferences beyond the highest three scoring subjects were not large.
Figure 2.1: Interest by Top Subject Areas
Source: 2009 Montana Distance Learning Survey, Bureau of Business and Economic Research, The University of Montana-Missoula.
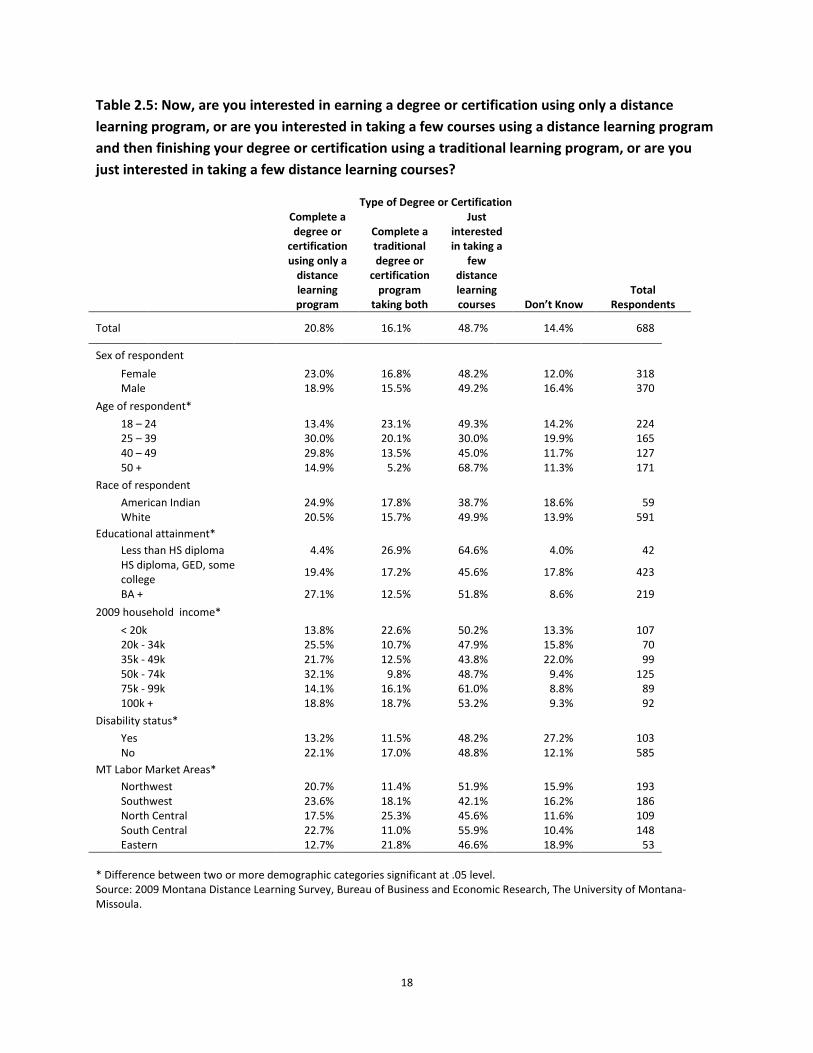
Almost half of those who indicated interest in distance learning report that they are simply interested in the classes themselves, rather than as part of the pursuit of a degree or certification. As shown in Table 2.5, 48.5 percent of those interested in distance learning say they are interested in the classes by themselves. There is also a substantial percentage (14.4%) who report that they don’t know whether or not they are interested in pursuing certification or degree. Older, more affluent individuals are more likely to say that they are not pursuing a degree or certification.
18
Table 2.5: Now, are you interested in earning a degree or certification using only a distance learning program, or are you interested in taking a few courses using a distance learning program and then finishing your degree or certification using a traditional learning program, or are you just interested in taking a few distance learning courses?
Type of Degree or Certification Complete a
degree or certification using only a
distance learning program
Complete a traditional degree or
certification program
taking both
Just interested in taking a
few distance learning courses
Don’t Know Total
Respondents
Total 20.8% 16.1% 48.7% 14.4% 688
Sex of respondent Female 23.0% 16.8% 48.2% 12.0% 318 Male 18.9% 15.5% 49.2% 16.4% 370 Age of respondent*
18 – 24 13.4% 23.1% 49.3% 14.2% 224 25 – 39 30.0% 20.1% 30.0% 19.9% 165 40 – 49 29.8% 13.5% 45.0% 11.7% 127 50 + 14.9% 5.2% 68.7% 11.3% 171 Race of respondent
American Indian 24.9% 17.8% 38.7% 18.6% 59 White 20.5% 15.7% 49.9% 13.9% 591 Educational attainment* Less than HS diploma 4.4% 26.9% 64.6% 4.0% 42 HS diploma, GED, some
college 19.4% 17.2% 45.6% 17.8% 423
BA + 27.1% 12.5% 51.8% 8.6% 219 2009 household income*
< 20k 13.8% 22.6% 50.2% 13.3% 107 20k - 34k 25.5% 10.7% 47.9% 15.8% 70 35k - 49k 21.7% 12.5% 43.8% 22.0% 99 50k - 74k 32.1% 9.8% 48.7% 9.4% 125 75k - 99k 14.1% 16.1% 61.0% 8.8% 89 100k + 18.8% 18.7% 53.2% 9.3% 92 Disability status*
Yes 13.2% 11.5% 48.2% 27.2% 103 No 22.1% 17.0% 48.8% 12.1% 585 MT Labor Market Areas*
Northwest 20.7% 11.4% 51.9% 15.9% 193 Southwest 23.6% 18.1% 42.1% 16.2% 186 North Central 17.5% 25.3% 45.6% 11.6% 109 South Central 22.7% 11.0% 55.9% 10.4% 148 Eastern 12.7% 21.8% 46.6% 18.9% 53 * Difference between two or more demographic categories significant at .05 level. Source: 2009 Montana Distance Learning Survey, Bureau of Business and Economic Research, The University of Montana-Missoula.
19
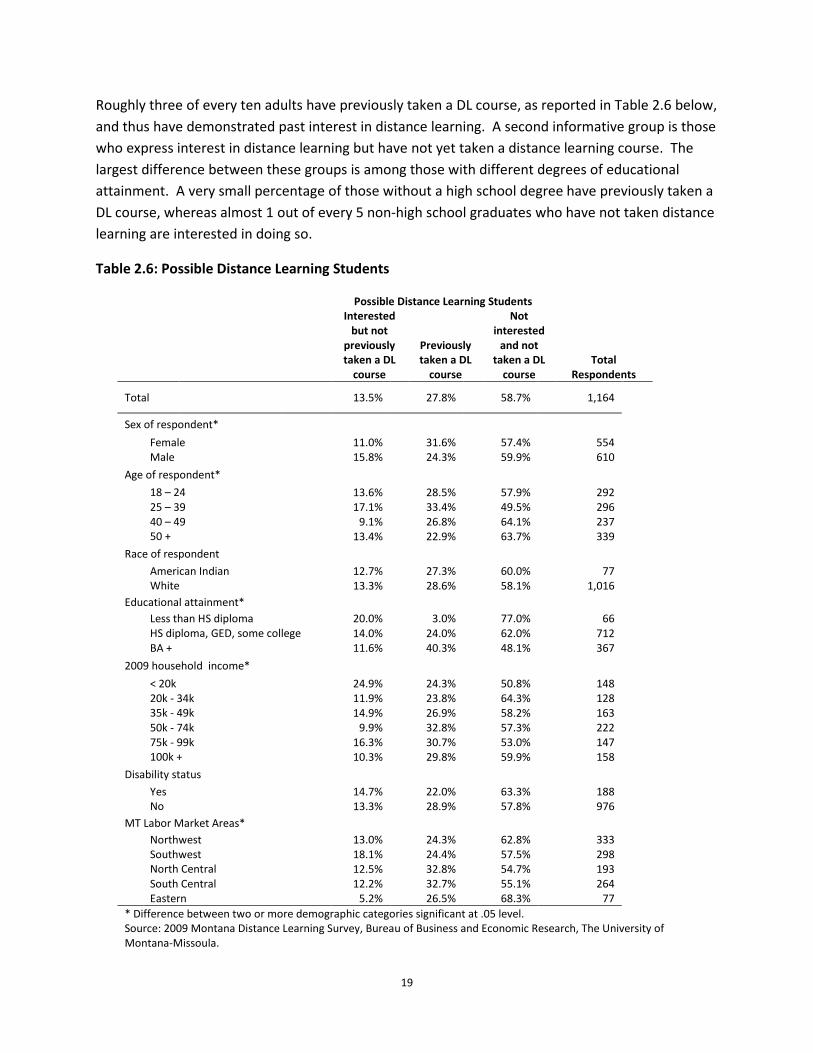
Roughly three of every ten adults have previously taken a DL course, as reported in Table 2.6 below, and thus have demonstrated past interest in distance learning. A second informative group is those who express interest in distance learning but have not yet taken a distance learning course. The largest difference between these groups is among those with different degrees of educational attainment. A very small percentage of those without a high school degree have previously taken a DL course, whereas almost 1 out of every 5 non-high school graduates who have not taken distance learning are interested in doing so.
Table 2.6: Possible Distance Learning Students
Possible Distance Learning Students Interested
but not previously taken a DL
course
Previously taken a DL
course
Not interested
and not taken a DL
course Total
Respondents
Total 13.5% 27.8% 58.7% 1,164
Sex of respondent* Female 11.0% 31.6% 57.4% 554 Male 15.8% 24.3% 59.9% 610 Age of respondent*
18 – 24 13.6% 28.5% 57.9% 292 25 – 39 17.1% 33.4% 49.5% 296 40 – 49 9.1% 26.8% 64.1% 237 50 + 13.4% 22.9% 63.7% 339 Race of respondent
American Indian 12.7% 27.3% 60.0% 77 White 13.3% 28.6% 58.1% 1,016 Educational attainment* Less than HS diploma 20.0% 3.0% 77.0% 66 HS diploma, GED, some college 14.0% 24.0% 62.0% 712 BA + 11.6% 40.3% 48.1% 367 2009 household income*
< 20k 24.9% 24.3% 50.8% 148 20k - 34k 11.9% 23.8% 64.3% 128 35k - 49k 14.9% 26.9% 58.2% 163 50k - 74k 9.9% 32.8% 57.3% 222 75k - 99k 16.3% 30.7% 53.0% 147 100k + 10.3% 29.8% 59.9% 158 Disability status
Yes 14.7% 22.0% 63.3% 188 No 13.3% 28.9% 57.8% 976 MT Labor Market Areas* Northwest 13.0% 24.3% 62.8% 333 Southwest 18.1% 24.4% 57.5% 298 North Central 12.5% 32.8% 54.7% 193 South Central 12.2% 32.7% 55.1% 264 Eastern 5.2% 26.5% 68.3% 77 * Difference between two or more demographic categories significant at .05 level. Source: 2009 Montana Distance Learning Survey, Bureau of Business and Economic Research, The University of Montana-Missoula.

20
Conclusion The number of Montanans interested in distance learning is sizeable. While differences in degree of interest exist between individuals in different age, sex, education, income and regional categories, most differences are of modest magnitude. There is a marked preference among Montanans for asynchronous internet delivery of course content, allowing students to access material at times of their own choosing, over more structured course delivery. The subject preferences of potential distance learning students are quite broad; with business, education, and computer science subject ranking the highest. A substantial proportion of those interested in distance learning say that they are more interested in the courses themselves than in pursuing a degree or certification.
Next, we examine survey responses concerning students’ actual experiences with distance learning in Montana.

21
3. Current Experiences with Distance Learning
BBER estimates that there are 69,400 Montanans who are taking or have taken at least one distance learning course in their lifetimes. As shown in Figure 3.1 below, Montana’s three largest higher education institutions – MSU-Bozeman, UM-Missoula and MSU-Billings – have had the largest number of distance learning students as well. They jointly account for almost 56 percent of all individuals served by distance learning.
Figure 3.1: Number of Distance Learning Students by Institution
Source: 2009 Montana Distance Learning Survey, Bureau of Business and Economic Research, The University of Montana-Missoula.

22
BBER asked those students about their experiences with distance education. Perhaps not surprisingly, most cited greater convenience and shorter travel as a main motivation, as shown in Figure 3.2. Almost half of them said that the ability to schedule the class around their other commitments was their motivation for taking a distance learning course. More than a third said that the course they took was not available in a traditional format where they lived. Much smaller numbers said that lower cost or simple curiosity were drivers of their decision to take a distance learning class.
Figure 3.2: Motivations for Taking Distance Learning Class
0 10,000 20,000 30,000 40,000
Could do it when I wanted/ worked around othertime obligations
Convenience
Not taught in traditional format locally
Travel/Distance
Time
Required by major or required for a class
Required for job
Better quality class, prefer online format
Curiosity/ because it was offered
Cost
Number of Persons 18-64 Who Took DL Class
Source: 2009 Montana Distance Learning Survey, Bureau of Business and Economic Research, The University of Montana-Missoula.

23
The most popular subject areas of classes actually taken, shown in Table 3.1, are broadly similar to the subject preferences reported in the previous section, but with some important differences. Business once again tops the list, with more than 28 percent of students saying that they took courses in this area. Computer science also ranks highly. Education courses, on the other hand, are less frequently taken than the preferences reported in the previous section would suggest. Trades and psychology are also relatively more preferred, and less taken, course subjects. The situation for finance and accounting, as well as math, is the opposite, with enrollment percentages higher than preferences would suggest. Nursing ranks seventh among courses taken, but only 14th among all subjects in which potential distance learning students are interested.
Table 3.1: Top 20 Courses Taken via Distance Learning
Rank Course Number of Students
1 Business 19,600 2 Finance and accounting 11,100 3 Computer science 10,900 4 Math 7,700 5 Education 7,600 6 Nursing 7,300 7 English 6,400
8 Trades (plumbing, electrician, welding, etc) 6,000
9 Psychology 5,800 10 Communications 4,500 11 Medical science 3,400 12 Personal fulfillment 3,200 13 History 2,800 14 Health and human performance 2,800 15 Political science 2,500 16 Foreign language 2,400 17 Real estate 2,400 18 Religious studies 2,300 19 Public health 2,200 20 Astronomy 2,100
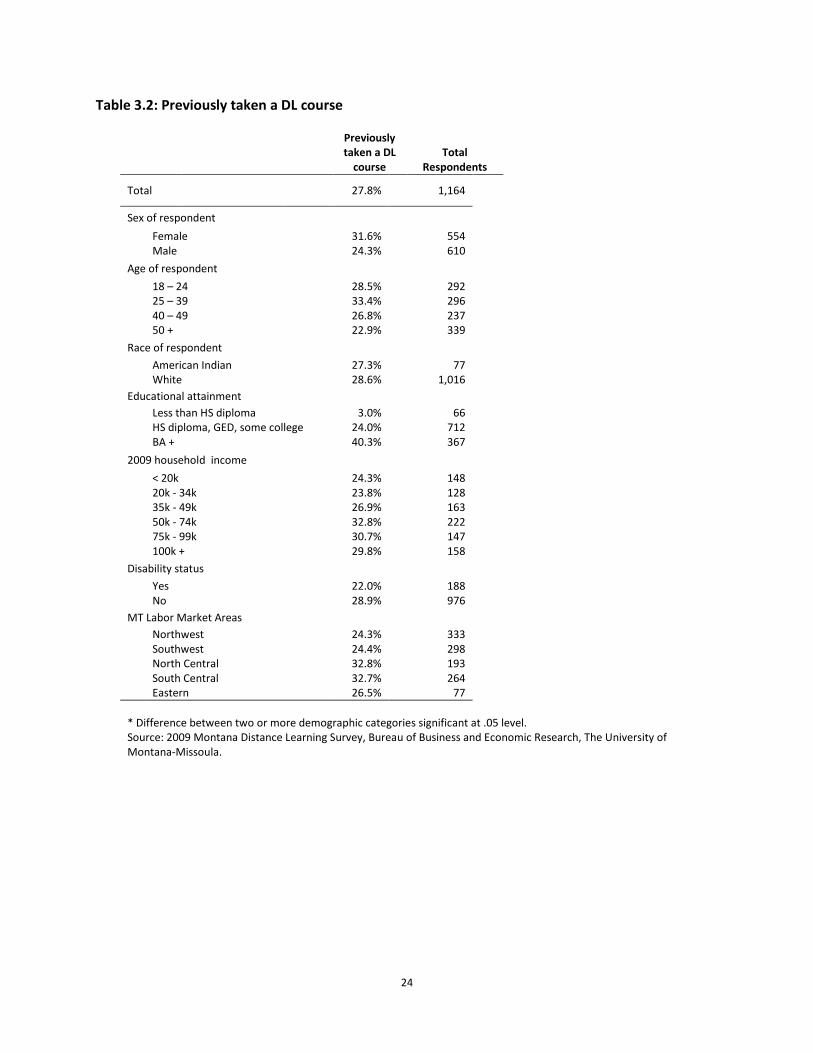
There are also some important differences between the “interested” and “experienced” distance learning education populations. Women are only slightly more interested in distance learning than men (Table 2.1), but 31.6 percent of women have taken a DL course, compared to 24.3% of men, as shown in Table 3.2. The contrast between interest and experience is also pronounced for educational attainment categories, with more of the less educated expressing interest, but with much lower fractions actually taking DL classes.
24
Table 3.2: Previously taken a DL course
Previously taken a DL
course Total
Respondents
Total 27.8% 1,164
Sex of respondent Female 31.6% 554 Male 24.3% 610 Age of respondent
18 – 24 28.5% 292 25 – 39 33.4% 296 40 – 49 26.8% 237 50 + 22.9% 339 Race of respondent
American Indian 27.3% 77 White 28.6% 1,016 Educational attainment Less than HS diploma 3.0% 66 HS diploma, GED, some college 24.0% 712 BA + 40.3% 367 2009 household income
< 20k 24.3% 148 20k - 34k 23.8% 128 35k - 49k 26.9% 163 50k - 74k 32.8% 222 75k - 99k 30.7% 147 100k + 29.8% 158 Disability status
Yes 22.0% 188 No 28.9% 976 MT Labor Market Areas
Northwest 24.3% 333 Southwest 24.4% 298 North Central 32.8% 193 South Central 32.7% 264 Eastern 26.5% 77 * Difference between two or more demographic categories significant at .05 level. Source: 2009 Montana Distance Learning Survey, Bureau of Business and Economic Research, The University of Montana-Missoula.
25
In fact, the profile of DL students presented in Table 3.2 supports the notion that distance learning courses are an integral part of obtaining a college degree. The experience profile is more heavily represented by those of a young enough age to have attended college after completing high school, and the likelihood that a Montanan with a bachelors degree has taken a DL course is much higher than the other educational attainment categories.
Finally, we note that while interest in distance learning was proportionately lower in eastern Montana (Table 2.1), the experience profile is much more balanced regionally. In fact, a higher proportion of eastern Montana adults aged less than 65 have taken DL courses than is the case in southwest Montana, the region that had the highest score in terms of interest.

26
Another contrast between stated preferences and actual experience can be seen from Table 3.3, which records total responses to the question of whether or not the student’s distance learning course was part of a completed program resulting in a degree or certification. Approximately 37 percent of potential students said they were interested in applying a distance learning course towards a terminal degree or certification, but a significantly higher fraction (57.6%) of those who have actually taken DL courses have applied it towards that outcome. Not surprisingly, those who have a 4-year college degree are much more likely to report a certificate or degree as part of their DL experience.
Table 3.3: Now, do you happen to remember whether or not you completed the distance learning degree or certification? (Asked only of those taking distance learning class)
Completed
Program
Did Not Complete Program
Don’t Know
Total Respondents
Total 57.6% 24.8% 17.6% 319
Sex of respondent Female 57.3% 28.0% 14.7% 171 Male 57.9% 21.1% 21.1% 148 Age of respondent* 18 – 24 34.6% 39.8% 25.6% 82 25 – 39 59.0% 26.0% 15.0% 97 40 – 49 64.9% 17.0% 18.1% 63 50 + 74.1% 13.7% 12.3% 77 Race of respondent* American Indian 47.9% 48.2% 3.8% 21 White 58.1% 23.3% 18.7% 286 Educational attainment* Less than HS diploma 29.1% 70.9% .0% 2 HS diploma, GED, some college 48.3% 36.4% 15.2% 168 BA + 68.7% 11.1% 20.3% 146 2009 household income* < 20k 31.0% 52.3% 16.7% 36 20k - 34k 66.7% 28.2% 5.1% 30 35k - 49k 68.9% 20.8% 10.3% 42 50k - 74k 58.5% 13.8% 27.7% 73 75k - 99k 63.4% 21.2% 15.4% 44 100k + 61.5% 27.4% 11.1% 47 Disability status Yes 60.1% 25.1% 14.8% 41 No 57.2% 24.7% 18.1% 277 MT Labor Market Areas* Northwest 59.2% 28.4% 12.4% 81 Southwest 60.9% 12.6% 26.4% 73 North Central 57.8% 29.6% 12.6% 62 South Central 54.9% 22.6% 22.5% 83 Eastern 48.9% 48.3% 2.8% 20 * Difference between two or more demographic categories significant at .05 level. Source: 2009 Montana Distance Learning Survey, Bureau of Business and Economic Research, The University of Montana-Missoula.

27
Yet, as Figure 3.3 makes clear, a high proportion of those who have earned a degree or certificate applied their DL course towards a professional credential. Just over 10 percent said that the credential that resulted (in part) from their distance learning course was a bachelor’s degree, whereas more than twice that fraction said a license or professional or trade certificate was the ultimate result. The latter included nursing (LPN), carpentry, plumbing, and welding certification.
Figure 3.3: Degree or Certificate Earned Though Distance Learning
0.0% 5.0% 10.0% 15.0% 20.0% 25.0% 30.0%
Licensed, professional, trade
Just added credits
Certificate of completion
Bachelors
Masters
Associates
High school
Not enough info/ not specific enough
DK
Percentage of Respondents Completing a Program
Source: 2009 Montana Distance Learning Survey, Bureau of Business and Economic Research, The University of Montana-Missoula.
Another issue addressed in Montanans actual experience with distance learning courses is the extent to which DL courses substitute for, or add to, traditional face to face delivery of education. 62.6 percent of current and former distance learning students said that they would have taken their DL course in a traditional format if the latter were the only option, as detailed in Table 3.4. This leaves a significant number of courses which would not have been taken at all without the option of distance learning. Those of traditional college age were much more likely to say that they would have taken their DL course in a traditional format if distance learning were not offered, whereas older students were much less likely to have said this.

28
Table 3.4: Would you have taken the course(s) you just named if it was only offered in a traditional format where you go to class for a certain amount of time each week, or not?
Percentage of Respondents Taking
Distance Learning Class
Yes No Total
Respondents
Total 62.6% 37.4% 309
Sex of respondent Female 60.8% 39.2% 165 Male 64.7% 35.3% 144 Age of respondent* 18 – 24 91.2% 8.8% 82 25 – 39 58.0% 42.0% 91 40 – 49 47.4% 52.6% 62 50 + 49.4% 50.6% 74 Race of respondent American Indian 70.5% 29.5% 20 White 62.8% 37.2% 278 Educational attainment Less than HS diploma 70.9% 29.1% 2 HS diploma, GED, some college 65.9% 34.1% 163 BA + 58.8% 41.2% 142 2009 household income* < 20k 88.8% 11.2% 36 20k - 34k 79.3% 20.7% 27 35k - 49k 52.6% 47.4% 39 50k - 74k 53.0% 47.0% 71 75k - 99k 60.1% 39.9% 44 100k + 66.1% 33.9% 46 Disability status Yes 60.8% 39.2% 41 No 62.9% 37.1% 268 MT Labor Market Areas Northwest 64.8% 35.2% 80 Southwest 70.2% 29.8% 71 North Central 58.0% 42.0% 58 South Central 55.1% 44.9% 80 Eastern 69.9% 30.1% 20 * Difference between two or more demographic categories significant at .05 level. Source: 2009 Montana Distance Learning Survey, Bureau of Business and Economic Research, The University of Montana-Missoula.
29
Conclusion
The marketplace for distance learning education, like higher education in general, is quite diverse. Montanans aged 18-64 have taken DL courses from a sizable number of institutions, and have received a wide range of credentials partially as a result. Not surprisingly, it is the convenience, both in terms of coordination with other activities as well as shorter travel requirements that rank highest in terms of their motivation for taking DL courses. However some said that DL courses were not available in traditional format where they lived and this motivated their enrollment. Although a majority of DL students would have taken their course via traditional in-person instruction if the DL option were not available (particularly for the college-age individuals), there was a sizable fraction (37.4%) whose said that DL courses added to, rather than substituted for, traditional instruction. There are also important differences between the population of those who say they are interested in distance learning and those who have actually had DL courses, with the latter group being more female, more educated, and more equally dispersed regionally than interests alone would indicate.
In the next section we address a special issue in distance learning education, namely, the interest in pursuing dual credit courses for high school aged students.

30
4. Dual Credit Courses
A topic of special interest that was addressed in this project was the interest in dual-credit, high school/college level course work. As reported in Table 4.1, roughly two-thirds of Montanans with teenaged children in their households expressed an interest in these courses. White households were much more likely to be interested in such courses for their children than American Indian households, although almost half of the latter indicated interest. There is evidence that interest grows with household income, although small numbers of respondents for individual categories makes the estimates less reliable.
Table 4.1: Are you, yourself interested in having your teen take dual-credit, high school/ college-level course work?
Yes No
Don’t Know
Total Respondents
Total 64.9% 26.9% 8.1% 212
Sex of respondent Female 66.2% 26.9% 6.9% 116 Male 63.3% 27.0% 9.7% 96 Age of respondent 18 – 24 36.9% 63.1% .0% 8 25 – 39 63.2% 23.0% 13.8% 43 40 – 49 65.8% 30.0% 4.3% 107 50 + 68.6% 19.0% 12.4% 54 Race of respondent American Indian 47.2% 42.5% 10.3% 17 White 66.7% 25.6% 7.6% 184 Educational attainment Less than HS diploma 79.9% 10.8% 9.3% 5 HS diploma, GED, some college 58.9% 29.8% 11.3% 129 BA + 74.0% 23.3% 2.7% 78 2009 household income < 20k 68.0% 14.9% 17.2% 10 20k - 34k 50.7% 41.6% 7.7% 21 35k - 49k 54.9% 31.4% 13.7% 24 50k - 74k 58.8% 28.2% 13.0% 51 75k - 99k 65.0% 32.7% 2.3% 34 100k + 83.0% 13.7% 3.3% 47 Disability status Yes 50.3% 40.0% 9.7% 28 No 67.1% 25.0% 7.9% 184 MT Labor Market Areas Northwest 59.5% 24.2% 16.4% 60 Southwest 68.4% 29.3% 2.3% 51 North Central 65.4% 29.1% 5.5% 35 South Central 72.9% 20.2% 6.9% 50 Eastern 47.2% 47.6% 5.2% 15 * Difference between two or more demographic categories significant at .05 level. Source: 2009 Montana Distance Learning Survey, Bureau of Business and Economic Research, The University of Montana-Missoula.

31
The “interested” fraction of the population drops to just under a half when the question asks respondents to assess interest from the point of view of their teenaged child. As was the case for parent interest, teen interest may be positively correlated with household income.
Table 4.2: Is your teen interested in taking dual-credit, high school/ college-level course work?
Yes No
Don’t Know
Total Respondents
Total 47.5% 32.5% 19.9% 212
Sex of respondent Female 49.3% 32.2% 18.5% 116 Male 45.5% 32.9% 21.7% 96 Age of respondent
18 – 24 66.4% 33.6% .0% 8 25 – 39 45.0% 31.9% 23.1% 43 40 – 49 44.7% 33.9% 21.5% 107 50 + 52.6% 30.2% 17.3% 54 Race of respondent
American Indian 48.6% 38.8% 12.6% 17 White 48.7% 31.3% 20.0% 184 Educational attainment Less than HS diploma 37.1% 15.6% 47.3% 5 HS diploma, GED, some college 45.6% 35.8% 18.6% 129 BA + 51.5% 28.3% 20.2% 78 2009 household income
< 20k 56.2% 38.1% 5.8% 10 20k - 34k 44.0% 41.3% 14.7% 21 35k - 49k 38.7% 39.2% 22.1% 24 50k - 74k 46.5% 27.8% 25.7% 51 75k - 99k 38.4% 47.5% 14.1% 34 100k + 61.2% 20.1% 18.6% 47 Disability status
Yes 37.0% 37.6% 25.4% 28 No 49.1% 31.7% 19.1% 184 MT Labor Market Areas
Northwest 39.0% 31.9% 29.1% 60 Southwest 50.9% 25.7% 23.4% 51 North Central 55.8% 26.9% 17.3% 35 South Central 47.0% 39.6% 13.4% 50 Eastern 52.7% 47.3% .0% 15 * Difference between two or more demographic categories significant at .05 level. Source: 2009 Montana Distance Learning Survey, Bureau of Business and Economic Research, The University of Montana-Missoula.
In the next section we assess internet access in the Montana adult population, a necessary condition for distance learning delivery in many circumstances.

32
5. Internet Access
Effective delivery of education electronically requires more than student demand and the readiness of institutions to meet it. Internet delivery typically requires hardware, knowledge, and access to a high speed internet connection. Just the last item – high speed internet availability – is a surprisingly hard piece of information to quantify in Montana. An important product of this project is a high quality estimate of internet availability.
Table 5.1: Do you happen to know whether high speed internet service is available where you currently live or stay?
Montana Adults Ages 18 – 64 Fall 2009
Yes No
Don’t Know
Total Respondents
Total 83.9% 8.8% 7.3% 1164
Sex of respondent Female 81.8% 10.6% 7.5% 554 Male 85.8% 7.1% 7.2% 610 Age of respondent
18 – 24 82.2% 8.1% 9.7% 292 25 – 39 83.5% 11.0% 5.6% 296 40 – 49 85.9% 7.1% 7.0% 237 50 + 84.3% 8.6% 7.0% 339 Race of respondent*
American Indian 73.0% 11.9% 15.1% 77 White 84.5% 8.5% 6.9% 1016 Educational attainment* Less than HS diploma 74.9% 2.8% 22.3% 66 HS diploma, GED, some college 81.9% 10.3% 7.8% 712 BA + 89.2% 6.9% 3.9% 367 2009 household income*
< 20k 74.3% 10.8% 14.9% 148 20k - 34k 81.0% 13.2% 5.7% 128 35k - 49k 85.0% 8.6% 6.4% 163 50k - 74k 87.7% 8.3% 4.0% 222 75k - 99k 90.7% 4.9% 4.4% 147 100k + 89.9% 6.1% 4.1% 158 Disability status
Yes 85.8% 5.9% 8.2% 188 No 83.5% 9.3% 7.2% 976 MT Labor Market Areas*
Northwest 86.6% 6.7% 6.6% 333 Southwest 83.7% 11.2% 5.1% 298 North Central 84.3% 8.9% 6.8% 193 South Central 82.7% 9.1% 8.2% 264 Eastern 76.0% 7.0% 17.0% 77 * Difference between two or more demographic categories significant at .05 level. Source: 2009 Montana Distance Learning Survey, Bureau of Business and Economic Research, The University of Montana-Missoula.
33
Not all Montanans access the internet most from their homes. But high speed internet access from one’s residence clearly allows for the flexibility and convenience that are cited as high motivators for pursuing distance education. Almost 84% of Montanans aged 18-64 said that high speed internet is available where they live, as shown in Table 5.1. Specifically, when asked
“Do you happen to know whether high speed internet service is available where you currently live or stay? High speed internet service is usually delivered using a digital subscriber line (DSL) delivered by a telephone company or a cable connection delivered by a cable TV company,”
these respondents indicated yes. Another 7.3 percent reported that they did not know if high speed internet was available. 8.8 percent said that high speed internet service was not available at their residence, which represents approximately 54,500 people in the state population.
There are certain categories of individuals that have markedly lower high speed internet availability at their homes. The fraction of American Indian households with high speed availability in their residences is more than 10 percentage points lower than white households, although a higher fraction of American Indian households said they didn’t know whether they had availability or not. Lower income and less educated households also were more likely to not have high speed service available. There is also less high speed internet access in eastern Montana than in other regions of the state.
Internet is seemingly everywhere these days – in homes, cafes, workplaces, and libraries. We asked Montanans about the type of internet connections that had in the place where they used internet the most, with their responses reported in Figure 5.1. Only 5.9 percent of adult Montanans aged less than 65 said that they did not use internet. More than three out of every four (76.5%) said that they access internet through a high speed connection (DSL, cable, wireless or satellite). The “wireless laptop” category comprises those who use a laptop or netbook in combination with a wireless router. Since an additional 9.1 percent said that they did not know the type of internet connection they used, actual high speed internet access is likely to be slightly higher.

34
Figure 5.1: Connection type or connection device reported
More than internet accessibility is needed for delivery of distance learning – basic familiarity with internet and computers is also necessary. As shown in Table 5.2, the “don’t use internet” population is overrepresented by older, American Indian, lower income, eastern, disabled, and male Montanans. In some cases the differences between these subgroups is statistically significant. Dialup access is slightly more common for lower income, less educated respondents. DSL use is highest in northwest Montana. Younger Montanans are less likely to use dialup access.

35
Table 5.2: Connection type or connection device - most often used
Montana Adults Ages 18 – 64 Fall 2009
Dial-up DSL Cable Wireless laptop
Handheld - Blackberry Satellite
Do not use
internet Don’t Know
Total Respondents
Total 6.4% 24.1% 16.7% 32.2% 2.1% 3.5% 5.9% 9.1% 1,148
Sex of respondent
Female 6.5% 23.2% 15.0% 33.2% 2.5% 3.9% 4.4% 11.2% 543 Male 6.4% 24.8% 18.3% 31.2% 1.7% 3.2% 7.3% 7.1% 605 Age of respondent*
18 – 24 3.2% 15.3% 15.3% 48.4% 2.1% 1.8% 3.2% 10.6% 287 25 – 39 6.4% 28.9% 15.2% 31.6% 2.9% 2.8% 3.9% 8.1% 293 40 – 49 5.3% 27.3% 18.0% 27.7% 2.4% 3.1% 7.6% 8.7% 233 50 + 10.1% 25.1% 18.4% 21.8% 1.0% 5.8% 9.0% 8.8% 335 Race of respondent
American Indian 7.4% 19.1% 12.3% 32.7% 1.4% 2.2% 10.6% 14.3% 73
White 6.6% 25.0% 15.8% 32.9% 2.2% 3.4% 5.3% 9.0% 1,006 Educational attainment* Less than
HS diploma 8.7% 9.4% 6.6% 57.1% .0% 1.2% 7.6% 9.3% 66
HS diploma, GED, some college
6.9% 23.1% 14.7% 30.3% 2.9% 3.5% 7.9% 10.7% 701
BA + 5.5% 29.1% 21.8% 31.8% 1.0% 4.2% 1.2% 5.4% 363 2009 household income*
< 20k 5.2% 25.6% 11.6% 29.4% 2.4% 4.4% 10.1% 11.4% 146 20k - 34k 7.6% 24.6% 18.7% 19.0% 2.2% 6.7% 10.7% 10.5% 125 35k - 49k 11.8% 22.7% 14.8% 33.7% 1.6% 1.1% 5.0% 9.3% 163 50k - 74k 7.1% 29.9% 16.9% 32.0% 3.8% 2.4% 2.2% 5.6% 219 75k - 99k 3.2% 26.1% 25.6% 31.8% 2.7% 3.9% 1.4% 5.2% 144 100k + 2.8% 26.9% 18.4% 40.2% 1.3% 3.1% 1.1% 6.2% 158 Disability status*
Yes 9.5% 15.4% 12.9% 29.3% 1.4% 3.8% 9.1% 18.7% 184 No 5.9% 25.8% 17.5% 32.7% 2.2% 3.5% 5.3% 7.2% 964 MT Labor Market Areas*
Northwest 5.0% 32.9% 12.1% 34.3% 1.6% 1.4% 6.2% 6.4% 329 Southwest 7.4% 23.5% 20.1% 25.8% 2.0% 3.7% 5.1% 12.4% 292 North
Central 9.8% 18.0% 16.3% 34.4% 1.4% 5.2% 4.6% 10.2% 189
South Central 5.8% 18.3% 21.9% 31.4% 3.8% 5.1% 6.4% 7.3% 260
Eastern 2.9% 23.1% 7.2% 44.5% .0% 2.3% 9.5% 10.6% 77 * Difference between two or more demographic categories significant at .05 level. Source: 2009 Montana Distance Learning Survey, Bureau of Business and Economic Research, The University of Montana-Missoula.

36
Table 5.3: What method do you most often use to connect to the internet? Montana Adults Ages 18 - 64, Fall 2009 A landline or
cable connection
A wireless connection
Never use internet
Don’t Know
Total Respondents
Total 50.7% 39.5% 5.9% 4.0% 1,164
Sex of respondent Female 49.3% 41.9% 4.4% 4.5% 554 Male 51.9% 37.3% 7.2% 3.6% 610 Age of respondent*
18 – 24 37.7% 53.3% 3.2% 5.9% 292 25 – 39 52.9% 38.5% 3.8% 4.7% 296 40 – 49 53.9% 36.4% 7.4% 2.3% 237 50 + 57.6% 30.5% 8.8% 3.0% 339 Race of respondent*
American Indian 42.8% 37.4% 10.1% 9.6% 77 White 50.5% 40.4% 5.2% 3.9% 1016 Educational attainment* Less than HS diploma 24.8% 62.4% 7.6% 5.2% 66 HS diploma, GED, some college 48.9% 38.5% 7.7% 4.8% 712 BA + 58.2% 38.1% 1.2% 2.5% 367 2009 household income*
< 20k 48.9% 37.2% 10.0% 4.0% 148 20k - 34k 52.5% 28.2% 10.5% 8.8% 128 35k - 49k 52.5% 40.8% 5.0% 1.7% 163 50k - 74k 56.2% 39.4% 2.2% 2.2% 222 75k - 99k 56.2% 39.2% 1.4% 3.3% 147 100k + 50.5% 46.9% 1.1% 1.6% 158 Disability status*
Yes 41.4% 38.6% 8.9% 11.2% 188 No 52.5% 39.6% 5.3% 2.6% 976 MT Labor Market Areas*
Northwest 52.7% 39.4% 6.1% 1.7% 333 Southwest 56.5% 33.0% 5.1% 5.4% 298 North Central 47.1% 43.4% 4.5% 5.0% 193 South Central 49.0% 41.2% 6.3% 3.5% 264 Eastern 33.8% 48.5% 9.5% 8.2% 77 * Difference between two or more demographic categories significant at .05 level. Source: 2009 Montana Distance Learning Survey, Bureau of Business and Economic Research, The University of Montana-Missoula.
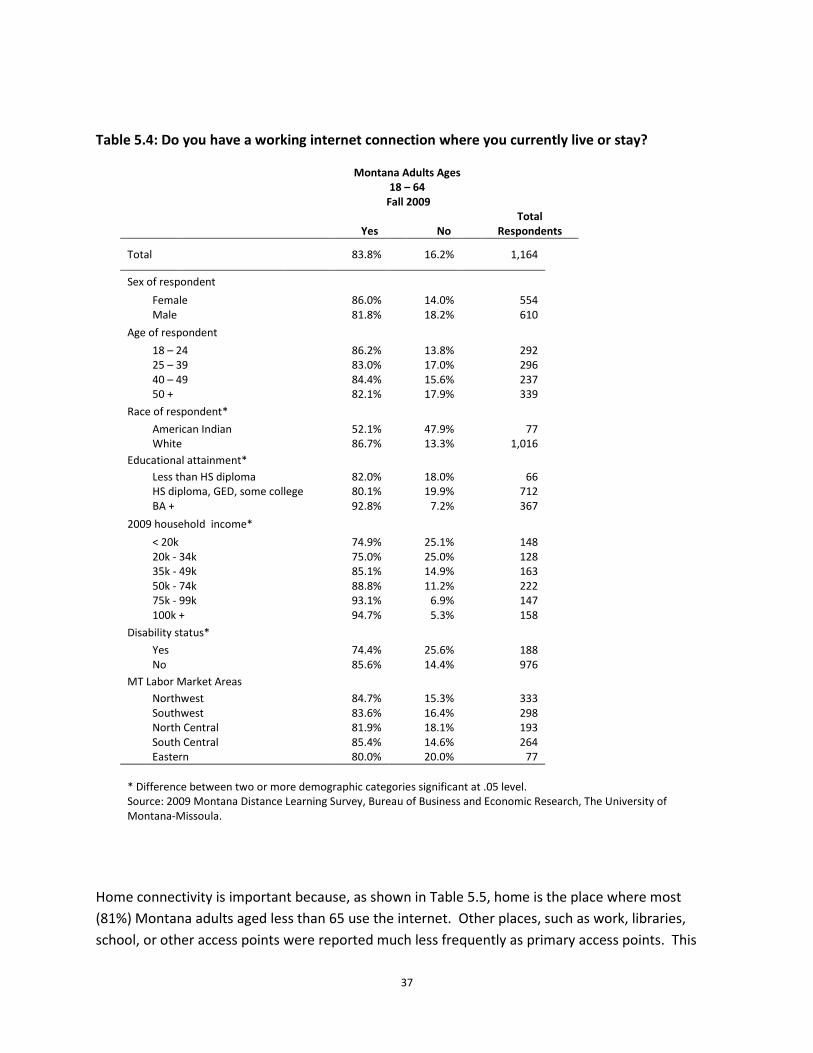
Since internet connectivity is a crucial link in distance learning, we asked the question a number of different ways. The most basic question – home internet connectivity – is reported in Table 5.4. Almost 84 percent of Montana adults aged less than 65 said they had working internet at home. Home connectivity is positively related to income and education, and is more prevalent for whites than American Indians. However, home access for even white, high earning respondents with a college degree is less than universal. Nearly one out of every ten college educated Montanans does not have internet access from home.
37
Table 5.4: Do you have a working internet connection where you currently live or stay?
Montana Adults Ages 18 – 64
Fall 2009
Yes No Total
Respondents
Total 83.8% 16.2% 1,164
Sex of respondent Female 86.0% 14.0% 554 Male 81.8% 18.2% 610 Age of respondent
18 – 24 86.2% 13.8% 292 25 – 39 83.0% 17.0% 296 40 – 49 84.4% 15.6% 237 50 + 82.1% 17.9% 339 Race of respondent*
American Indian 52.1% 47.9% 77 White 86.7% 13.3% 1,016 Educational attainment* Less than HS diploma 82.0% 18.0% 66 HS diploma, GED, some college 80.1% 19.9% 712 BA + 92.8% 7.2% 367 2009 household income*
< 20k 74.9% 25.1% 148 20k - 34k 75.0% 25.0% 128 35k - 49k 85.1% 14.9% 163 50k - 74k 88.8% 11.2% 222 75k - 99k 93.1% 6.9% 147 100k + 94.7% 5.3% 158 Disability status*
Yes 74.4% 25.6% 188 No 85.6% 14.4% 976 MT Labor Market Areas
Northwest 84.7% 15.3% 333 Southwest 83.6% 16.4% 298 North Central 81.9% 18.1% 193 South Central 85.4% 14.6% 264 Eastern 80.0% 20.0% 77 * Difference between two or more demographic categories significant at .05 level. Source: 2009 Montana Distance Learning Survey, Bureau of Business and Economic Research, The University of Montana-Missoula.
Home connectivity is important because, as shown in Table 5.5, home is the place where most (81%) Montana adults aged less than 65 use the internet. Other places, such as work, libraries, school, or other access points were reported much less frequently as primary access points. This
38
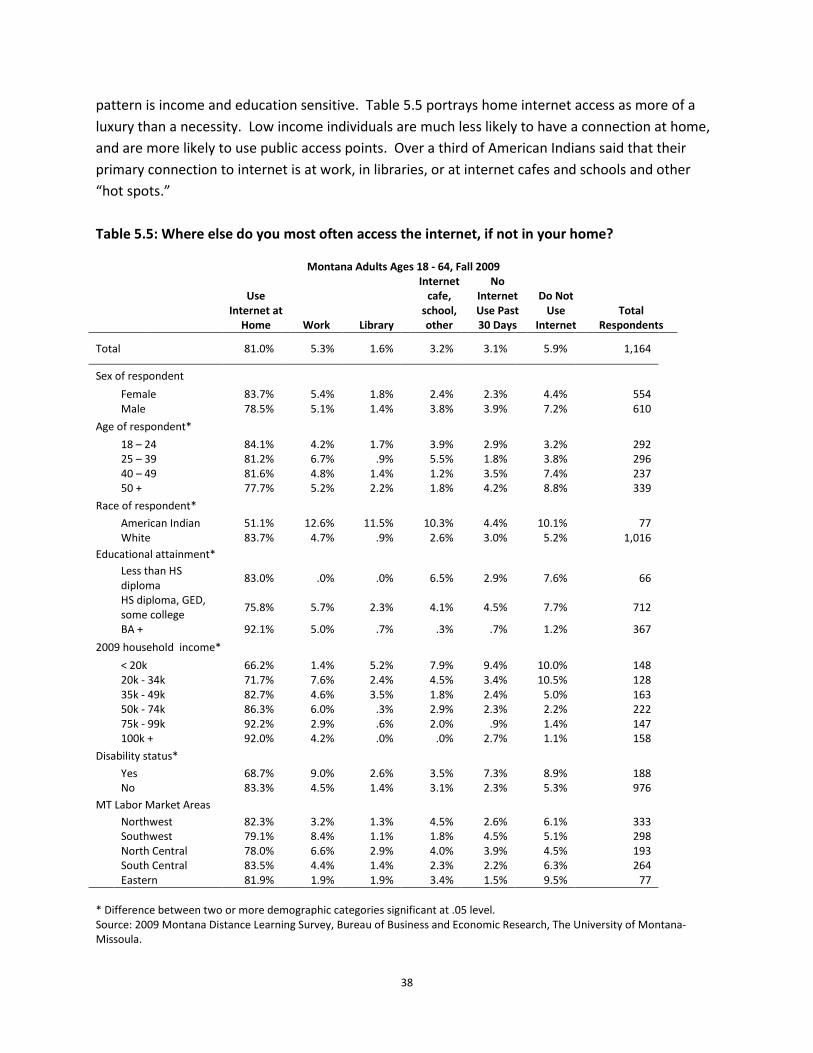
pattern is income and education sensitive. Table 5.5 portrays home internet access as more of a luxury than a necessity. Low income individuals are much less likely to have a connection at home, and are more likely to use public access points. Over a third of American Indians said that their primary connection to internet is at work, in libraries, or at internet cafes and schools and other “hot spots.” Table 5.5: Where else do you most often access the internet, if not in your home?
Montana Adults Ages 18 - 64, Fall 2009
Use Internet at
Home Work Library
Internet cafe,
school, other
No Internet Use Past 30 Days
Do Not Use
Internet Total
Respondents
Total 81.0% 5.3% 1.6% 3.2% 3.1% 5.9% 1,164
Sex of respondent Female 83.7% 5.4% 1.8% 2.4% 2.3% 4.4% 554 Male 78.5% 5.1% 1.4% 3.8% 3.9% 7.2% 610 Age of respondent* 18 – 24 84.1% 4.2% 1.7% 3.9% 2.9% 3.2% 292 25 – 39 81.2% 6.7% .9% 5.5% 1.8% 3.8% 296 40 – 49 81.6% 4.8% 1.4% 1.2% 3.5% 7.4% 237 50 + 77.7% 5.2% 2.2% 1.8% 4.2% 8.8% 339 Race of respondent* American Indian 51.1% 12.6% 11.5% 10.3% 4.4% 10.1% 77 White 83.7% 4.7% .9% 2.6% 3.0% 5.2% 1,016 Educational attainment* Less than HS
diploma 83.0% .0% .0% 6.5% 2.9% 7.6% 66
HS diploma, GED, some college 75.8% 5.7% 2.3% 4.1% 4.5% 7.7% 712
BA + 92.1% 5.0% .7% .3% .7% 1.2% 367 2009 household income* < 20k 66.2% 1.4% 5.2% 7.9% 9.4% 10.0% 148 20k - 34k 71.7% 7.6% 2.4% 4.5% 3.4% 10.5% 128 35k - 49k 82.7% 4.6% 3.5% 1.8% 2.4% 5.0% 163 50k - 74k 86.3% 6.0% .3% 2.9% 2.3% 2.2% 222 75k - 99k 92.2% 2.9% .6% 2.0% .9% 1.4% 147 100k + 92.0% 4.2% .0% .0% 2.7% 1.1% 158 Disability status* Yes 68.7% 9.0% 2.6% 3.5% 7.3% 8.9% 188 No 83.3% 4.5% 1.4% 3.1% 2.3% 5.3% 976 MT Labor Market Areas Northwest 82.3% 3.2% 1.3% 4.5% 2.6% 6.1% 333 Southwest 79.1% 8.4% 1.1% 1.8% 4.5% 5.1% 298 North Central 78.0% 6.6% 2.9% 4.0% 3.9% 4.5% 193 South Central 83.5% 4.4% 1.4% 2.3% 2.2% 6.3% 264 Eastern 81.9% 1.9% 1.9% 3.4% 1.5% 9.5% 77 * Difference between two or more demographic categories significant at .05 level. Source: 2009 Montana Distance Learning Survey, Bureau of Business and Economic Research, The University of Montana-Missoula.
39
Table 5.6 Most Frequently Used Internet Connection by Adults Age 18 - 64 Interested in Distance Learning, Montana, Fall 2009
95% Confidence Interval (+/)
Type of access Population Percent
Landline Dial-up 10,500 1.8% 4,700
DSL, Cable, T1 86,700 14.2% 12,300
DSL, Cable, T1 AND wireless router 60,800 9.9% 10,500
Unsure type of landline 3,700 0.6% 3,500
Total landline 161,700 26.5% 15,500
Wireless Blackberry - other handheld 5,300 0.9% 3,500
Satellite connection 7,900 1.3% 4,000
Unsure type of wireless or other (air-card) 2,600 0.4% 3,500
Total wireless 15,800 2.6% 5,600
Do not use internet 3,200 0.5% 3,500
Don't know 5,800 0.9% 3,500
MT 2008 population age 18 - 64 interested in distance learning 186,500 30.5% 16,300
Sources: BBER, 2009 MT Distance Learning Survey; CEIC 2008 Population Estimates, MT Department of Labor and Industry; U.S. Census Bureau
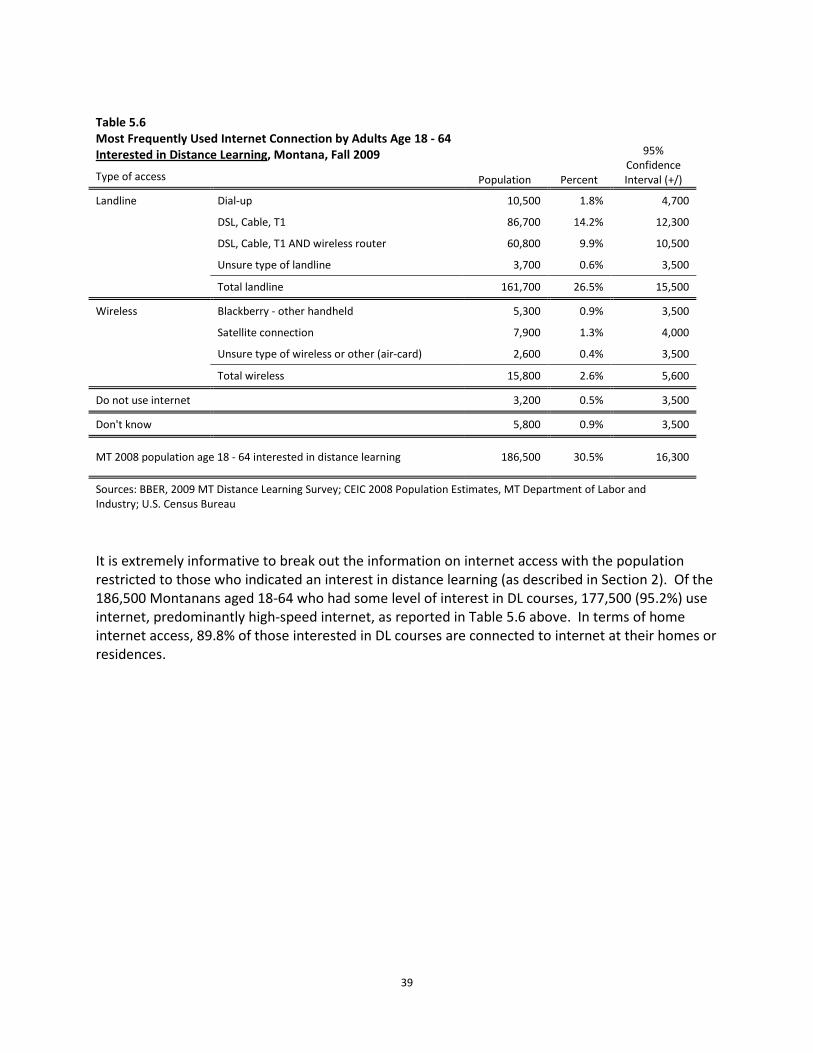
It is extremely informative to break out the information on internet access with the population restricted to those who indicated an interest in distance learning (as described in Section 2). Of the 186,500 Montanans aged 18-64 who had some level of interest in DL courses, 177,500 (95.2%) use internet, predominantly high-speed internet, as reported in Table 5.6 above. In terms of home internet access, 89.8% of those interested in DL courses are connected to internet at their homes or residences.

40
Conclusion This section presents a valuable snapshot of internet availability and usage by Montanans that is useful in its own right. It also comprises a key link between distance learning preferences and desires, and actual content delivery. In terms of availability, 84 percent of respondents said that high speed internet is available where they live, with another 7.9 percent saying that they did not know. Thus it is reasonable to suppose that the actual fraction of residences in markets where high speed internet is available is slightly higher than 84 percent.
Although internet is seemingly everywhere, access at home is arguably the most important for distance learning, for two reasons. First, home access is most consistent with the convenience and coordination with other activities that those interested in DL courses cite as main motivations. The second reason is that 84 percent of respondents said that home is the place where they use internet the most.
Patterns of internet access and usage differ markedly across sub-populations. Lower income Montanans, American Indians, and individuals with lower levels of educational attainment are less likely to have home internet access. Older Montanans are more likely to not use internet, or to have dial-up access only. Eastern Montana has slightly less high speed internet than other regions. More than 10 percent of individuals earning $35,000 per year or less say that they don’t use internet, whereas only 1.1% of those making $100,000 or more report that they don’t use the internet.
Now we will discuss the barriers to distance learning courses, as seen from the eyes of actual and potential students.
41
6. Barriers to Taking Distance Learning Courses
Given the large number of Montanans who indicate they have at least some interest in distance learning courses on the one hand, and the actual numbers of people enrolled in these courses on the other, it is natural to ask what the impediments or barriers are to more people taking DL courses. We asked this question for three types of content delivery: synchronous delivery via internet, asynchronous internet, and instruction using two-way television offered at a distance learning site.
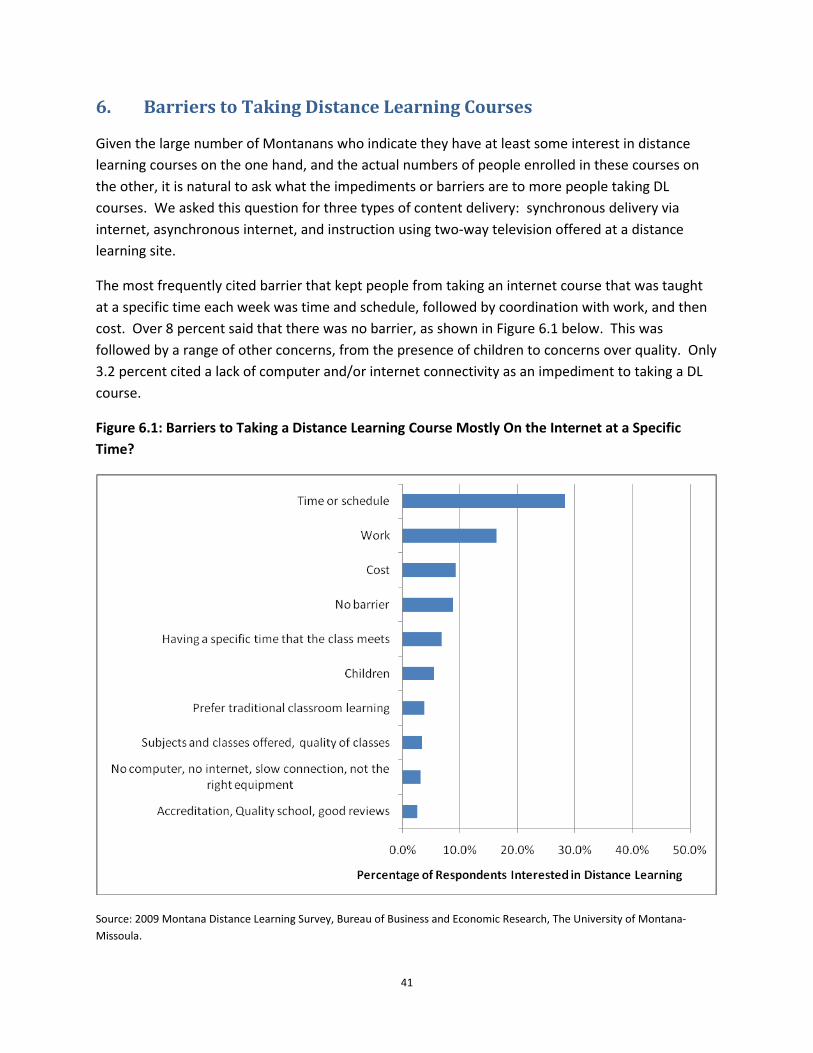
The most frequently cited barrier that kept people from taking an internet course that was taught at a specific time each week was time and schedule, followed by coordination with work, and then cost. Over 8 percent said that there was no barrier, as shown in Figure 6.1 below. This was followed by a range of other concerns, from the presence of children to concerns over quality. Only 3.2 percent cited a lack of computer and/or internet connectivity as an impediment to taking a DL course.
Figure 6.1: Barriers to Taking a Distance Learning Course Mostly On the Internet at a Specific Time?
Source: 2009 Montana Distance Learning Survey, Bureau of Business and Economic Research, The University of Montana-Missoula.

42
The situation for asynchronous internet delivery, where students can access course instruction materials at any time, is strikingly different, as shown in Figure 6.2. For these types of courses, 42% said that there was no barrier. With timing and scheduling conflicts removed by the delivery technology, issues of cost, quality, and computer capability loom larger. There remains a population that does not have adequate time, motivation, or capability for a distance learning course, but the answers shown below are consistent with the much stronger preference for asynchronous internet delivery reported in Section 2.
Figure 6.2: Barriers to Taking a Distance Learning Course Entirely on the Internet Accessed at Any Time?
Source: 2009 Montana Distance Learning Survey, Bureau of Business and Economic Research, The University of Montana-Missoula.
43
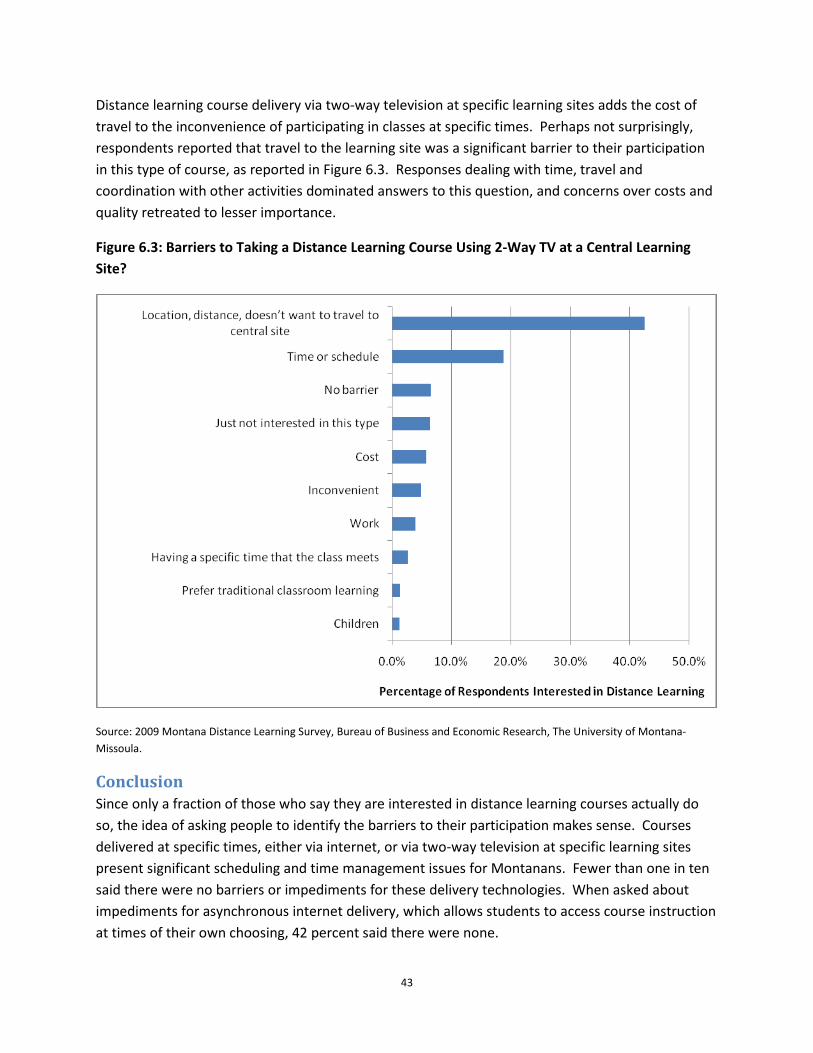
Distance learning course delivery via two-way television at specific learning sites adds the cost of travel to the inconvenience of participating in classes at specific times. Perhaps not surprisingly, respondents reported that travel to the learning site was a significant barrier to their participation in this type of course, as reported in Figure 6.3. Responses dealing with time, travel and coordination with other activities dominated answers to this question, and concerns over costs and quality retreated to lesser importance.
Figure 6.3: Barriers to Taking a Distance Learning Course Using 2-Way TV at a Central Learning Site?
Source: 2009 Montana Distance Learning Survey, Bureau of Business and Economic Research, The University of Montana-Missoula.
Conclusion Since only a fraction of those who say they are interested in distance learning courses actually do so, the idea of asking people to identify the barriers to their participation makes sense. Courses delivered at specific times, either via internet, or via two-way television at specific learning sites present significant scheduling and time management issues for Montanans. Fewer than one in ten said there were no barriers or impediments for these delivery technologies. When asked about impediments for asynchronous internet delivery, which allows students to access course instruction at times of their own choosing, 42 percent said there were none.

44
7. Conclusion This study analyzed and reported on attitudes, experiences, and capabilities of Montanans for taking distance learning (DL) courses. Using a random sample of 1,226 respondents, including both landline and cell phone-only households, survey researchers at the Bureau of Business and Economic Research assessed demand for distance learning, preferences for types of distance learning delivery systems, distance learning courses sought, barriers to distance learning access, and capacity of Montanans to access distance learning through the internet. The survey was conducted during the fall of 2009.
Key Findings This study represents a comprehensive assessment of the interests, preferences, and capabilities of the Montana adult population concerning the delivery of education electronically. Its most important findings include:
• Approximately one third of Montanans aged 18-64, or 186,500 (+/- 16,300) individual, indicated an interest in distance learning (figures in parentheses represent the margin of error in survey estimates);
• Overall interest varies regionally, with south central, southwest, and north central Montanans showing higher than average interest, and northwest and eastern Montanans indicating interest in distance learning lower than the overall average;
• Interest is higher for asynchronous course delivery options, where the student can access course material when it suits his or her individual schedule, as well as for options that do not require students to travel to specific facilities;
• Almost half of those with interest in distance learning courses are not interested in pursuing any formal degree or certification;
• Courses in business oriented topics are the most frequently taken via distance learning in Montana, with MSU-Bozeman, UM-Missoula, and MSU-Billings jointly accounting for 55 percent of DL students statewide;
• Access to high speed internet connections from home is high but not universal in Montana, particularly for lower income and American Indian households. 83.9 percent of survey respondents overall said that high speed internet connectivity was available where they live;
• Home is the place where Montanans most frequently use internet, particularly white, educated, more affluent individuals;
• Internet access for sub-populations, such as lower income, American Indian, or less educated individuals, is different from the population as a whole, with dial-up access, as well as usage of internet away from home for these groups more prevalent;
• Scheduling and coordination with other activities rank high among the barriers cited as reasons for not taking distance learning courses.

A1
APPENDIX A: MEASURING DISTANCE LEARNING INTEREST
High, medium, and low interest in distance learning were derived from a score calculated from responses to question 9 in the survey regarding respondent experience with distance learning courses, and questions 16-18, which asked if respondents were interested in DL courses delivered by internet at a specific time, internet accessed at time of student’s own choosing, or by two-way television at a remote learning site, respectively. (The text of the questions can be found in Appendix D).
Defining Q9 as equal to one if respondents answered “yes” to past DL experience, and zero otherwise, and likewise defining Q16-Q18 as equal to one if respondents said “interested” to DL deliveries via the three methods described above, and zero otherwise, we defined
High Interest, if Q9 = 1 and Q16 + Q17 + Q18 ≥ 2,
Medium interest, if Q9 = 1 and Q16 + Q17 + Q18 = 1, or if Q9 = 0 and Q16 + Q17 + Q18 = 3,
Low interest, if Q9 = 0 and Q16 + Q17 + Q18 = 2.
Thus respondents had to respond affirmatively at least twice in the course of the interview to questions about DL experience and interest in order to be given the lowest non-zero interest score. In scoring the intensity of interest, experience with DL was given slightly more weight, since it indicated an action on the part of a respondent.

B1
APPENDIX B: SENIOR CITIZEN’S INTEREST IN DISTANCE LEARNING The bulk of resources in this project were used to assess interest, experiences and capabilities for distance learning on the part of Montanans aged 18-64 years. The results presented in the main body of this report pertain to this sub-population. Another pool of potential and actual students for DL courses consists of seniors aged 65 years and older. Information was gathered for seniors as part of this project as well. Due to the sampling scheme, the precision of these estimates is lower than those presented in the main report. Thus we summarize and present them here. On the basis of our survey completions, we estimate that:
• There are 9,500 (+/- 9,250) seniors who expressed an interest in distance learning courses (6.5% of the population aged 65 and older). Half of those expressed strong interest.
• 91,000 seniors (61% of the population aged 65 and older) have used internet in the last 30 days.
• 94,800 seniors have a working internet connection where they live or stay. Essentially all seniors who expressed interest in DL courses have an internet connection.
• Nearly all seniors who have an interest in distance learning are also interested in asynchronous course delivery.
• Seniors are interested in the following distance learning course topics:
History Paleontology and Geology Agriculture Foreign Language Astronomy Law/Regulations

C1
APPENDIX C: GALLUP TABLES

C2
Demographic crosstabulation with question wording (Gallup Table)
Have you, yourself, used the internet at all in the last 30 days, that is, since September XX, 2009?
Yes No Total
Row N % Row N % Count
Sex of respondent* Total 91.0% 9.0% 1164
Female 93.4% 6.6% 554
Male 88.8% 11.2% 610 Age* 18 - 24 93.9% 6.1% 292
25 - 39 94.3% 5.7% 296 40 - 49 89.0% 11.0% 237 50 + 87.0% 13.0% 339
Race of respondent American Indian 85.4% 14.6% 77 White 91.8% 8.2% 1016
Educational attainment* Less than HS diploma 89.5% 10.5% 66 HS diploma, GED, some college 87.8% 12.2% 712 BA + 98.1% 1.9% 367
2008 HH income* < 20k 80.7% 19.3% 148 20k - 34k 86.1% 13.9% 128 35k - 49k 92.6% 7.4% 163 50k - 74k 95.5% 4.5% 222 75k - 99k 97.7% 2.3% 147 100k + 96.2% 3.8% 158
Disability Status* Yes 83.8% 16.2% 188 No 92.4% 7.6% 976
MT Labor Market Areas Northwest 91.3% 8.7% 333 Southwest 90.4% 9.6% 298 North Central 91.6% 8.4% 193 South Central 91.5% 8.5% 264 Eastern 89.0% 11.0% 77
Distance Learning Interest* Interested 95.8% 4.2% 355
Not interested 88.9% 11.1% 810
* Difference between two or more demographic categories significant at .05 level. Source: 2009 Montana Distance Learning Survey, Bureau of Business and Economic Research, The University of Montana-Missoula.
C3
Demographic crosstabulation with question wording (Gallup Table)
Do you have a working internet connection where you currently live or stay?
Yes No Total
Row N % Row N % Count
Sex of respondent Total 83.8% 16.2% 1164
Female 86.0% 14.0% 554
Male 81.8% 18.2% 610 Age 18 - 24 86.2% 13.8% 292
25 - 39 83.0% 17.0% 296 40 - 49 84.4% 15.6% 237 50 + 82.1% 17.9% 339
Race of respondent* American Indian 52.1% 47.9% 77 White 86.7% 13.3% 1016
Educational attainment* Less than HS diploma 82.0% 18.0% 66 HS diploma, GED, some college 80.1% 19.9% 712 BA + 92.8% 7.2% 367
2008 HH income* < 20k 74.9% 25.1% 148 20k - 34k 75.0% 25.0% 128 35k - 49k 85.1% 14.9% 163 50k - 74k 88.8% 11.2% 222 75k - 99k 93.1% 6.9% 147 100k + 94.7% 5.3% 158
Disability Status* Yes 74.4% 25.6% 188 No 85.6% 14.4% 976
MT Labor Market Areas Northwest 84.7% 15.3% 333 Southwest 83.6% 16.4% 298 North Central 81.9% 18.1% 193 South Central 85.4% 14.6% 264 Eastern 80.0% 20.0% 77
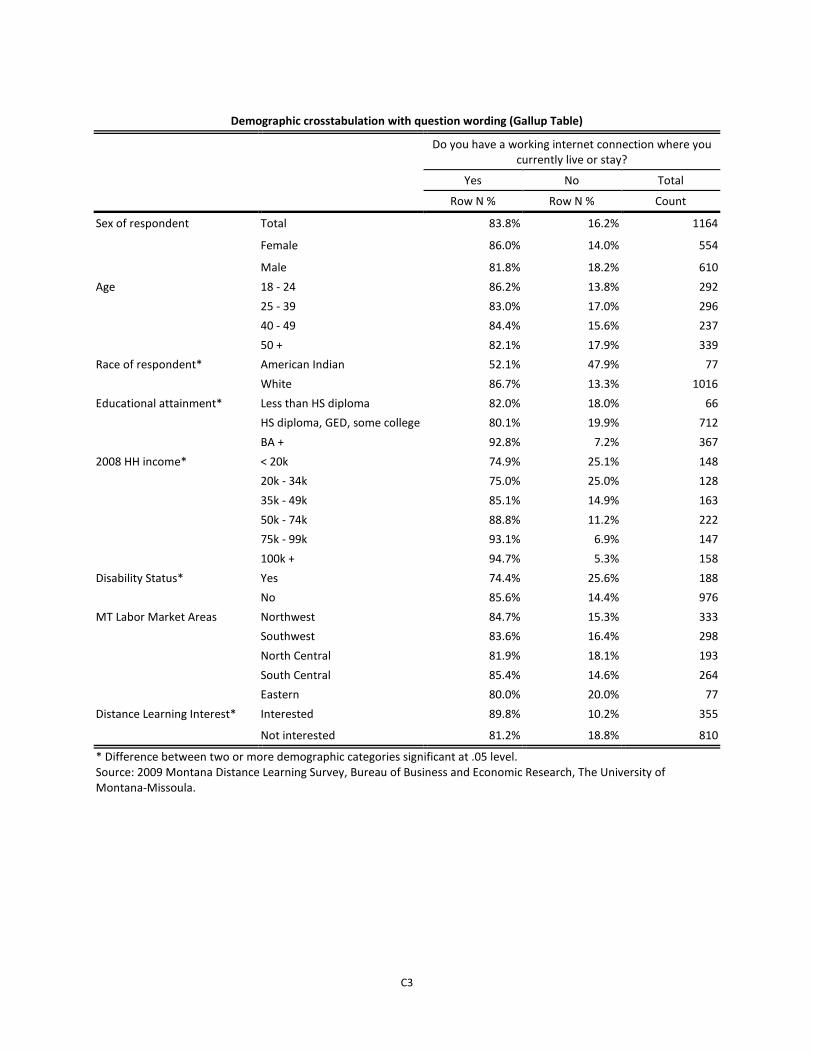
Distance Learning Interest* Interested 89.8% 10.2% 355
Not interested 81.2% 18.8% 810
* Difference between two or more demographic categories significant at .05 level. Source: 2009 Montana Distance Learning Survey, Bureau of Business and Economic Research, The University of Montana-Missoula.

C4
Demographic crosstabulation with question wording (Gallup Table)
Where else do you most often access the internet, if not in your home?
Use Internet at Home Work Library
Internet cafe, school, other
No Internet Use Past 30 Days
Do Not Use Internet Total
Row N %
Row N %
Row N % Row N % Row N % Row N % Count
Sex of respondent
Total 81.0% 5.3% 1.6% 3.2% 3.1% 5.9% 1164
Female 83.7% 5.4% 1.8% 2.4% 2.3% 4.4% 554
Male 78.5% 5.1% 1.4% 3.8% 3.9% 7.2% 610 Age* 18 - 24 84.1% 4.2% 1.7% 3.9% 2.9% 3.2% 292
25 - 39 81.2% 6.7% .9% 5.5% 1.8% 3.8% 296 40 - 49 81.6% 4.8% 1.4% 1.2% 3.5% 7.4% 237 50 + 77.7% 5.2% 2.2% 1.8% 4.2% 8.8% 339
Race of respondent*
American Indian 51.1% 12.6% 11.5% 10.3% 4.4% 10.1% 77 White 83.7% 4.7% .9% 2.6% 3.0% 5.2% 1016
Educational attainment*
Less than HS diploma 83.0% .0% .0% 6.5% 2.9% 7.6% 66
HS diploma, GED, some college 75.8% 5.7% 2.3% 4.1% 4.5% 7.7% 712
BA + 92.1% 5.0% .7% .3% .7% 1.2% 367 2008 HH income*
< 20k 66.2% 1.4% 5.2% 7.9% 9.4% 10.0% 148 20k - 34k 71.7% 7.6% 2.4% 4.5% 3.4% 10.5% 128 35k - 49k 82.7% 4.6% 3.5% 1.8% 2.4% 5.0% 163 50k - 74k 86.3% 6.0% .3% 2.9% 2.3% 2.2% 222 75k - 99k 92.2% 2.9% .6% 2.0% .9% 1.4% 147 100k + 92.0% 4.2% .0% .0% 2.7% 1.1% 158
Disability Status* Yes 68.7% 9.0% 2.6% 3.5% 7.3% 8.9% 188 No 83.3% 4.5% 1.4% 3.1% 2.3% 5.3% 976
MT Labor Market Areas
Northwest 82.3% 3.2% 1.3% 4.5% 2.6% 6.1% 333 Southwest 79.1% 8.4% 1.1% 1.8% 4.5% 5.1% 298 North Central 78.0% 6.6% 2.9% 4.0% 3.9% 4.5% 193 South Central 83.5% 4.4% 1.4% 2.3% 2.2% 6.3% 264 Eastern 81.9% 1.9% 1.9% 3.4% 1.5% 9.5% 77
Distance Learning Interest*
Interested 87.3% 4.8% .7% 3.1% 2.5% 1.7% 355
Not interested 78.2% 5.5% 2.0% 3.2% 3.4% 7.7% 810
* Difference between two or more demographic categories significant at .05 level. Source: 2009 Montana Distance Learning Survey, Bureau of Business and Economic Research, The University of Montana-Missoula.

C5
Demographic crosstabulation with question wording (Gallup Table)
What method do you most often use to connect to the internet? Do you use?
A wireless connection
A landline or cable
connection Never use internet DK Total
Row N % Row N % Row N % Row N % Count
Sex of respondent Total 39.5% 50.7% 5.9% 4.0% 1164
Female 41.9% 49.3% 4.4% 4.5% 554
Male 37.3% 51.9% 7.2% 3.6% 610 Age* 18 - 24 53.3% 37.7% 3.2% 5.9% 292
25 - 39 38.5% 52.9% 3.8% 4.7% 296 40 - 49 36.4% 53.9% 7.4% 2.3% 237 50 + 30.5% 57.6% 8.8% 3.0% 339
Race of respondent* American Indian 37.4% 42.8% 10.1% 9.6% 77 White 40.4% 50.5% 5.2% 3.9% 1016
Educational attainment*
Less than HS diploma 62.4% 24.8% 7.6% 5.2% 66 HS diploma, GED, some college 38.5% 48.9% 7.7% 4.8% 712
BA + 38.1% 58.2% 1.2% 2.5% 367 2008 HH income* < 20k 37.2% 48.9% 10.0% 4.0% 148
20k - 34k 28.2% 52.5% 10.5% 8.8% 128 35k - 49k 40.8% 52.5% 5.0% 1.7% 163 50k - 74k 39.4% 56.2% 2.2% 2.2% 222 75k - 99k 39.2% 56.2% 1.4% 3.3% 147 100k + 46.9% 50.5% 1.1% 1.6% 158
Disability Status* Yes 38.6% 41.4% 8.9% 11.2% 188 No 39.6% 52.5% 5.3% 2.6% 976
MT Labor Market Areas*
Northwest 39.4% 52.7% 6.1% 1.7% 333 Southwest 33.0% 56.5% 5.1% 5.4% 298 North Central 43.4% 47.1% 4.5% 5.0% 193 South Central 41.2% 49.0% 6.3% 3.5% 264 Eastern 48.5% 33.8% 9.5% 8.2% 77
Distance Learning Interest*
Interested 41.3% 53.9% 1.7% 3.0% 355
Not interested 38.6% 49.2% 7.7% 4.4% 810
* Difference between two or more demographic categories significant at .05 level. Source: 2009 Montana Distance Learning Survey, Bureau of Business and Economic Research, The University of Montana-Missoula.
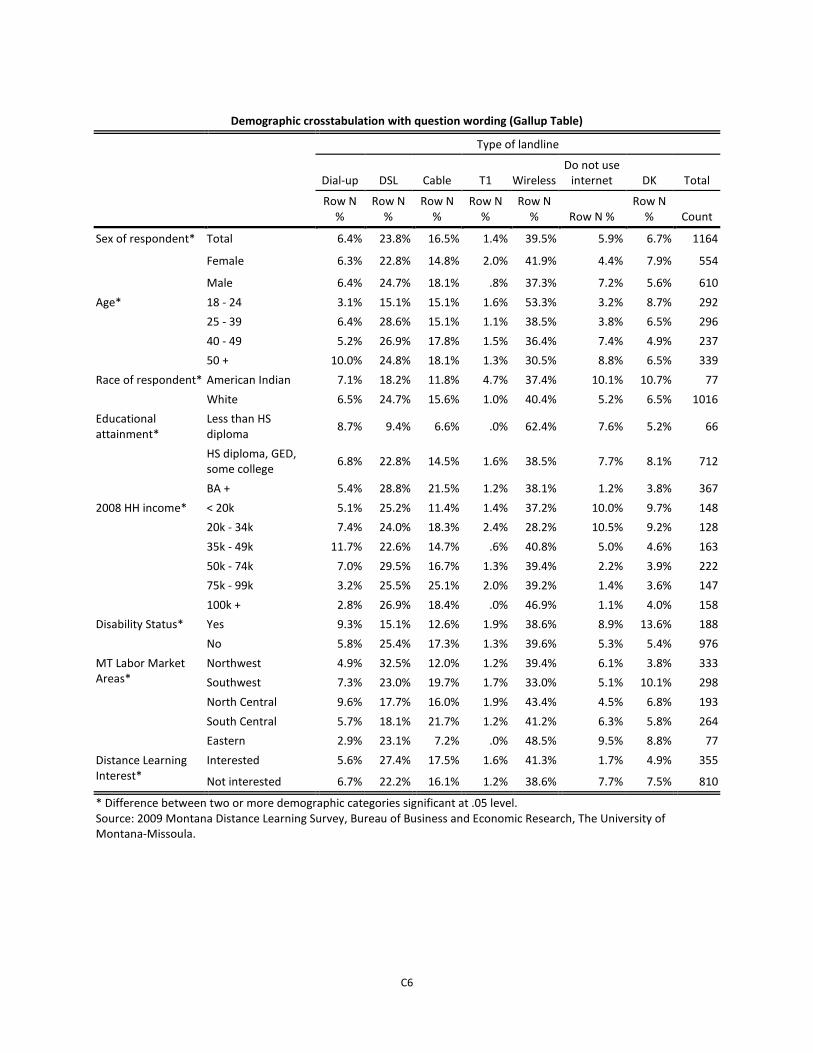
C6
Demographic crosstabulation with question wording (Gallup Table)
Type of landline
Dial-up DSL Cable T1 Wireless
Do not use internet DK Total
Row N %
Row N %
Row N %
Row N %
Row N % Row N %
Row N % Count
Sex of respondent* Total 6.4% 23.8% 16.5% 1.4% 39.5% 5.9% 6.7% 1164
Female 6.3% 22.8% 14.8% 2.0% 41.9% 4.4% 7.9% 554
Male 6.4% 24.7% 18.1% .8% 37.3% 7.2% 5.6% 610 Age* 18 - 24 3.1% 15.1% 15.1% 1.6% 53.3% 3.2% 8.7% 292
25 - 39 6.4% 28.6% 15.1% 1.1% 38.5% 3.8% 6.5% 296 40 - 49 5.2% 26.9% 17.8% 1.5% 36.4% 7.4% 4.9% 237 50 + 10.0% 24.8% 18.1% 1.3% 30.5% 8.8% 6.5% 339
Race of respondent* American Indian 7.1% 18.2% 11.8% 4.7% 37.4% 10.1% 10.7% 77 White 6.5% 24.7% 15.6% 1.0% 40.4% 5.2% 6.5% 1016
Educational attainment*
Less than HS diploma 8.7% 9.4% 6.6% .0% 62.4% 7.6% 5.2% 66
HS diploma, GED, some college 6.8% 22.8% 14.5% 1.6% 38.5% 7.7% 8.1% 712
BA + 5.4% 28.8% 21.5% 1.2% 38.1% 1.2% 3.8% 367 2008 HH income* < 20k 5.1% 25.2% 11.4% 1.4% 37.2% 10.0% 9.7% 148
20k - 34k 7.4% 24.0% 18.3% 2.4% 28.2% 10.5% 9.2% 128 35k - 49k 11.7% 22.6% 14.7% .6% 40.8% 5.0% 4.6% 163 50k - 74k 7.0% 29.5% 16.7% 1.3% 39.4% 2.2% 3.9% 222 75k - 99k 3.2% 25.5% 25.1% 2.0% 39.2% 1.4% 3.6% 147 100k + 2.8% 26.9% 18.4% .0% 46.9% 1.1% 4.0% 158
Disability Status* Yes 9.3% 15.1% 12.6% 1.9% 38.6% 8.9% 13.6% 188 No 5.8% 25.4% 17.3% 1.3% 39.6% 5.3% 5.4% 976
MT Labor Market Areas*
Northwest 4.9% 32.5% 12.0% 1.2% 39.4% 6.1% 3.8% 333 Southwest 7.3% 23.0% 19.7% 1.7% 33.0% 5.1% 10.1% 298 North Central 9.6% 17.7% 16.0% 1.9% 43.4% 4.5% 6.8% 193 South Central 5.7% 18.1% 21.7% 1.2% 41.2% 6.3% 5.8% 264 Eastern 2.9% 23.1% 7.2% .0% 48.5% 9.5% 8.8% 77
Distance Learning Interest*
Interested 5.6% 27.4% 17.5% 1.6% 41.3% 1.7% 4.9% 355
Not interested 6.7% 22.2% 16.1% 1.2% 38.6% 7.7% 7.5% 810
* Difference between two or more demographic categories significant at .05 level. Source: 2009 Montana Distance Learning Survey, Bureau of Business and Economic Research, The University of Montana-Missoula.
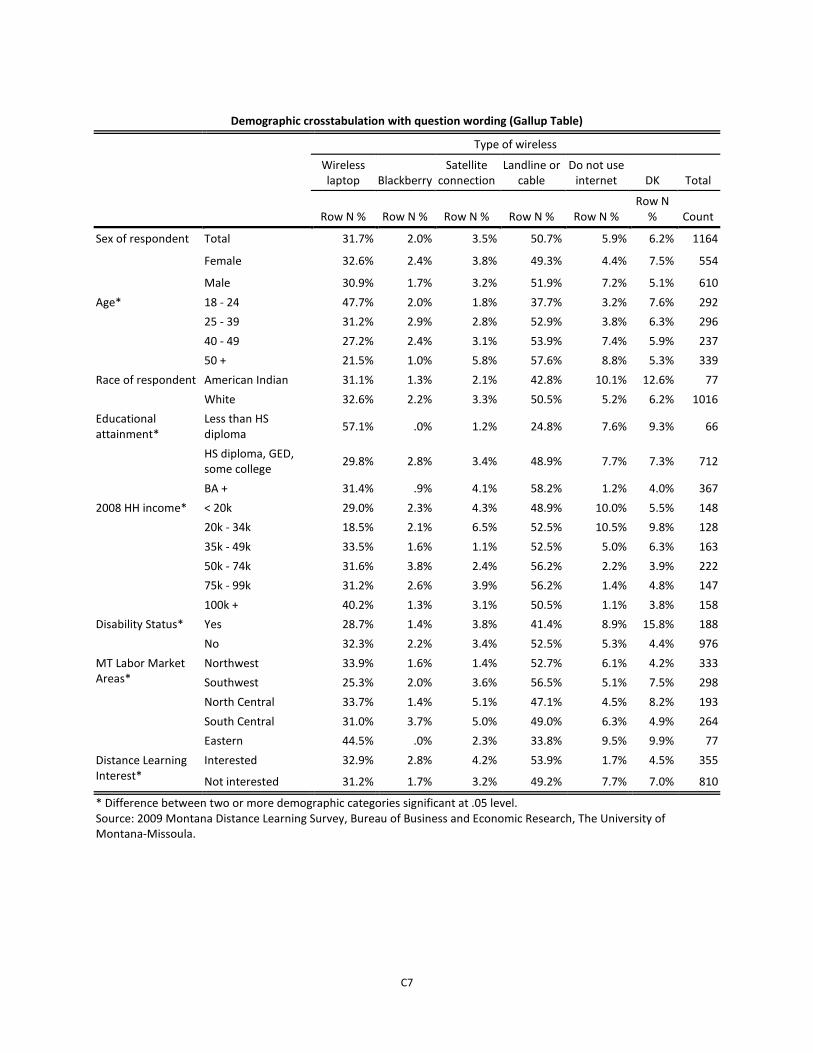
C7
Demographic crosstabulation with question wording (Gallup Table)
Type of wireless
Wireless laptop Blackberry
Satellite connection
Landline or cable
Do not use internet DK Total
Row N % Row N % Row N % Row N % Row N %
Row N % Count
Sex of respondent Total 31.7% 2.0% 3.5% 50.7% 5.9% 6.2% 1164
Female 32.6% 2.4% 3.8% 49.3% 4.4% 7.5% 554
Male 30.9% 1.7% 3.2% 51.9% 7.2% 5.1% 610 Age* 18 - 24 47.7% 2.0% 1.8% 37.7% 3.2% 7.6% 292
25 - 39 31.2% 2.9% 2.8% 52.9% 3.8% 6.3% 296 40 - 49 27.2% 2.4% 3.1% 53.9% 7.4% 5.9% 237 50 + 21.5% 1.0% 5.8% 57.6% 8.8% 5.3% 339
Race of respondent American Indian 31.1% 1.3% 2.1% 42.8% 10.1% 12.6% 77 White 32.6% 2.2% 3.3% 50.5% 5.2% 6.2% 1016
Educational attainment*
Less than HS diploma 57.1% .0% 1.2% 24.8% 7.6% 9.3% 66
HS diploma, GED, some college 29.8% 2.8% 3.4% 48.9% 7.7% 7.3% 712
BA + 31.4% .9% 4.1% 58.2% 1.2% 4.0% 367 2008 HH income* < 20k 29.0% 2.3% 4.3% 48.9% 10.0% 5.5% 148
20k - 34k 18.5% 2.1% 6.5% 52.5% 10.5% 9.8% 128 35k - 49k 33.5% 1.6% 1.1% 52.5% 5.0% 6.3% 163 50k - 74k 31.6% 3.8% 2.4% 56.2% 2.2% 3.9% 222 75k - 99k 31.2% 2.6% 3.9% 56.2% 1.4% 4.8% 147 100k + 40.2% 1.3% 3.1% 50.5% 1.1% 3.8% 158
Disability Status* Yes 28.7% 1.4% 3.8% 41.4% 8.9% 15.8% 188 No 32.3% 2.2% 3.4% 52.5% 5.3% 4.4% 976
MT Labor Market Areas*
Northwest 33.9% 1.6% 1.4% 52.7% 6.1% 4.2% 333 Southwest 25.3% 2.0% 3.6% 56.5% 5.1% 7.5% 298 North Central 33.7% 1.4% 5.1% 47.1% 4.5% 8.2% 193 South Central 31.0% 3.7% 5.0% 49.0% 6.3% 4.9% 264 Eastern 44.5% .0% 2.3% 33.8% 9.5% 9.9% 77
Distance Learning Interest*
Interested 32.9% 2.8% 4.2% 53.9% 1.7% 4.5% 355
Not interested 31.2% 1.7% 3.2% 49.2% 7.7% 7.0% 810
* Difference between two or more demographic categories significant at .05 level. Source: 2009 Montana Distance Learning Survey, Bureau of Business and Economic Research, The University of Montana-Missoula.
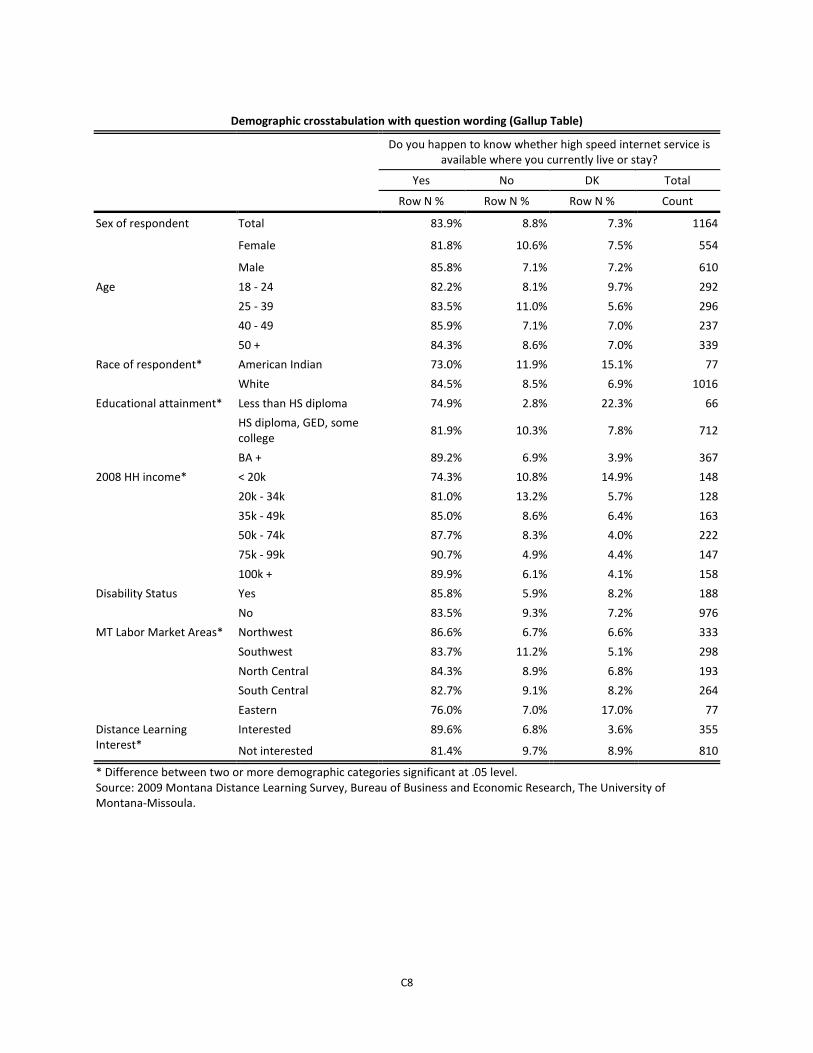
C8
Demographic crosstabulation with question wording (Gallup Table)
Do you happen to know whether high speed internet service is available where you currently live or stay?
Yes No DK Total
Row N % Row N % Row N % Count
Sex of respondent Total 83.9% 8.8% 7.3% 1164
Female 81.8% 10.6% 7.5% 554
Male 85.8% 7.1% 7.2% 610 Age 18 - 24 82.2% 8.1% 9.7% 292
25 - 39 83.5% 11.0% 5.6% 296 40 - 49 85.9% 7.1% 7.0% 237 50 + 84.3% 8.6% 7.0% 339
Race of respondent* American Indian 73.0% 11.9% 15.1% 77 White 84.5% 8.5% 6.9% 1016
Educational attainment* Less than HS diploma 74.9% 2.8% 22.3% 66 HS diploma, GED, some college 81.9% 10.3% 7.8% 712
BA + 89.2% 6.9% 3.9% 367 2008 HH income* < 20k 74.3% 10.8% 14.9% 148
20k - 34k 81.0% 13.2% 5.7% 128 35k - 49k 85.0% 8.6% 6.4% 163 50k - 74k 87.7% 8.3% 4.0% 222 75k - 99k 90.7% 4.9% 4.4% 147 100k + 89.9% 6.1% 4.1% 158
Disability Status Yes 85.8% 5.9% 8.2% 188 No 83.5% 9.3% 7.2% 976
MT Labor Market Areas* Northwest 86.6% 6.7% 6.6% 333 Southwest 83.7% 11.2% 5.1% 298 North Central 84.3% 8.9% 6.8% 193 South Central 82.7% 9.1% 8.2% 264 Eastern 76.0% 7.0% 17.0% 77
Distance Learning Interest*
Interested 89.6% 6.8% 3.6% 355
Not interested 81.4% 9.7% 8.9% 810
* Difference between two or more demographic categories significant at .05 level. Source: 2009 Montana Distance Learning Survey, Bureau of Business and Economic Research, The University of Montana-Missoula.

C9
Demographic crosstabulation with question wording (Gallup Table)
Have you, yourself, ever taken a class in which the teaching was done mostly over the internet; or a class using interactive, two-way television transmitted to a
central site; or a class using mostly mailed-out materials; or a class using any combination of these methods?
Yes No Total
Row N % Row N % Count
Sex of respondent* Total 27.8% 72.2% 1164
Female 31.6% 68.4% 554
Male 24.3% 75.7% 610 Age* 18 - 24 28.5% 71.5% 292
25 - 39 33.4% 66.6% 296 40 - 49 26.8% 73.2% 237 50 + 22.9% 77.1% 339
Race of respondent American Indian 27.3% 72.7% 77 White 28.6% 71.4% 1016
Educational attainment* Less than HS diploma 3.0% 97.0% 66 HS diploma, GED, some college 24.0% 76.0% 712 BA + 40.3% 59.7% 367
2008 HH income < 20k 24.3% 75.7% 148 20k - 34k 23.8% 76.2% 128 35k - 49k 26.9% 73.1% 163 50k - 74k 32.8% 67.2% 222 75k - 99k 30.7% 69.3% 147 100k + 29.8% 70.2% 158
Disability Status* Yes 22.0% 78.0% 188 No 28.9% 71.1% 976
MT Labor Market Areas Northwest 24.3% 75.7% 333 Southwest 24.4% 75.6% 298 North Central 32.8% 67.2% 193 South Central 32.7% 67.3% 264 Eastern 26.5% 73.5% 77
Distance Learning Interest* Interested 55.6% 44.4% 355
Not interested 15.6% 84.4% 810
* Difference between two or more demographic categories significant at .05 level. Source: 2009 Montana Distance Learning Survey, Bureau of Business and Economic Research, The University of Montana-Missoula.

C10
Demographic crosstabulation with question wording (Gallup Table)
Would you have taken the course(s) you just named if it was only offered in a traditional format where you go to class for a certain
amount of time each week, or not?
Yes No DK Total
Row N % Row N % Row N % Count
Sex of respondent Total 60.7% 36.3% 3.0% 319
Female 58.7% 37.9% 3.4% 171
Male 63.1% 34.5% 2.5% 148 Age* 18 - 24 91.2% 8.8% .0% 82
25 - 39 54.6% 39.6% 5.9% 97 40 - 49 46.8% 51.9% 1.3% 63 50 + 47.5% 48.7% 3.9% 77
Race of respondent American Indian 67.8% 28.3% 3.8% 21 White 60.9% 36.1% 3.0% 286
Educational attainment Less than HS diploma 70.9% 29.1% .0% 2 HS diploma, GED, some college 63.7% 32.9% 3.3% 168
BA + 57.2% 40.1% 2.7% 146 2008 HH income* < 20k 88.8% 11.2% .0% 36
20k - 34k 71.2% 18.6% 10.2% 30 35k - 49k 48.3% 43.5% 8.2% 42 50k - 74k 51.7% 45.8% 2.4% 73 75k - 99k 60.1% 39.9% .0% 44 100k + 64.5% 33.1% 2.4% 47
Disability Status Yes 60.0% 38.7% 1.4% 41 No 60.8% 35.9% 3.2% 277
MT Labor Market Areas Northwest 63.9% 34.7% 1.5% 81 Southwest 68.5% 29.0% 2.5% 73 North Central 54.7% 39.6% 5.7% 62 South Central 53.1% 43.3% 3.6% 83 Eastern 69.9% 30.1% .0% 20
Distance Learning Interest Interested 62.8% 34.3% 2.9% 194
Not interested 57.4% 39.4% 3.1% 124
* Difference between two or more demographic categories significant at .05 level. Source: 2009 Montana Distance Learning Survey, Bureau of Business and Economic Research, The University of Montana-Missoula.

C11
Demographic crosstabulation with question wording (Gallup Table)
Now, do you happen to remember whether or not you completed the distance learning degree or certificate
program you enrolled in?
Yes No Total
Row N % Row N % Count
Sex of respondent Total 69.9% 30.1% 262
Female 67.2% 32.8% 146
Male 73.3% 26.7% 116 Age* 18 - 24 46.5% 53.5% 61
25 - 39 69.4% 30.6% 83 40 - 49 79.3% 20.7% 51 50 + 84.4% 15.6% 68
Race of respondent* American Indian 49.8% 50.2% 20 White 71.4% 28.6% 233
Educational attainment* Less than HS diploma 29.1% 70.9% 2 HS diploma, GED, some college 57.0% 43.0% 143 BA + 86.1% 13.9% 117
2008 HH income* < 20k 37.3% 62.7% 30 20k - 34k 70.3% 29.7% 29 35k - 49k 76.9% 23.1% 38 50k - 74k 80.9% 19.1% 53 75k - 99k 74.9% 25.1% 37 100k + 69.2% 30.8% 42
Disability Status Yes 70.5% 29.5% 35 No 69.8% 30.2% 227
MT Labor Market Areas Northwest 67.6% 32.4% 71 Southwest 82.8% 17.2% 53 North Central 66.2% 33.8% 54 South Central 70.9% 29.1% 64 Eastern 50.3% 49.7% 20
Distance Learning Interest* Interested 64.1% 35.9% 157
Not interested 78.6% 21.4% 105
* Difference between two or more demographic categories significant at .05 level. Source: 2009 Montana Distance Learning Survey, Bureau of Business and Economic Research, The University of Montana-Missoula.
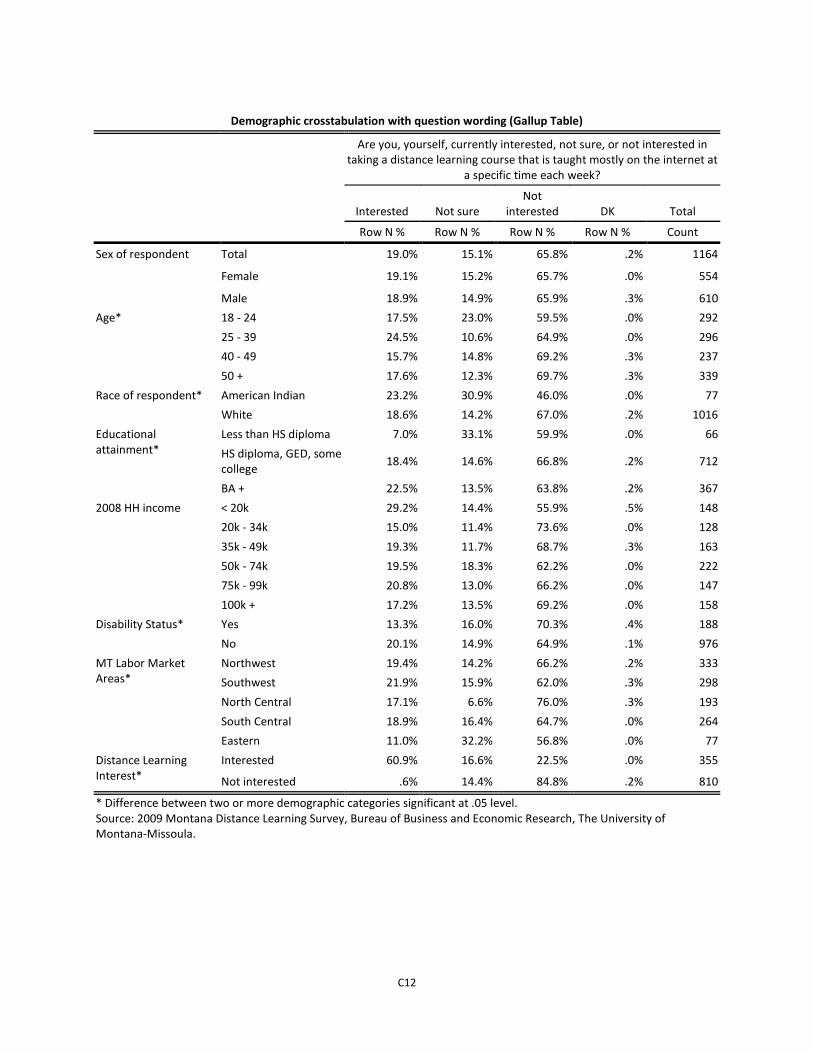
C12
Demographic crosstabulation with question wording (Gallup Table)
Are you, yourself, currently interested, not sure, or not interested in taking a distance learning course that is taught mostly on the internet at
a specific time each week?
Interested Not sure
Not interested DK Total
Row N % Row N % Row N % Row N % Count
Sex of respondent Total 19.0% 15.1% 65.8% .2% 1164
Female 19.1% 15.2% 65.7% .0% 554
Male 18.9% 14.9% 65.9% .3% 610 Age* 18 - 24 17.5% 23.0% 59.5% .0% 292
25 - 39 24.5% 10.6% 64.9% .0% 296 40 - 49 15.7% 14.8% 69.2% .3% 237 50 + 17.6% 12.3% 69.7% .3% 339
Race of respondent* American Indian 23.2% 30.9% 46.0% .0% 77 White 18.6% 14.2% 67.0% .2% 1016
Educational attainment*
Less than HS diploma 7.0% 33.1% 59.9% .0% 66 HS diploma, GED, some college 18.4% 14.6% 66.8% .2% 712
BA + 22.5% 13.5% 63.8% .2% 367 2008 HH income < 20k 29.2% 14.4% 55.9% .5% 148
20k - 34k 15.0% 11.4% 73.6% .0% 128 35k - 49k 19.3% 11.7% 68.7% .3% 163 50k - 74k 19.5% 18.3% 62.2% .0% 222 75k - 99k 20.8% 13.0% 66.2% .0% 147 100k + 17.2% 13.5% 69.2% .0% 158
Disability Status* Yes 13.3% 16.0% 70.3% .4% 188 No 20.1% 14.9% 64.9% .1% 976
MT Labor Market Areas*
Northwest 19.4% 14.2% 66.2% .2% 333 Southwest 21.9% 15.9% 62.0% .3% 298 North Central 17.1% 6.6% 76.0% .3% 193 South Central 18.9% 16.4% 64.7% .0% 264 Eastern 11.0% 32.2% 56.8% .0% 77
Distance Learning Interest*
Interested 60.9% 16.6% 22.5% .0% 355
Not interested .6% 14.4% 84.8% .2% 810
* Difference between two or more demographic categories significant at .05 level. Source: 2009 Montana Distance Learning Survey, Bureau of Business and Economic Research, The University of Montana-Missoula.

C13
Demographic crosstabulation with question wording (Gallup Table)
What about a distance learning class that is taught entirely on the internet and that can be accessed by you whenever you have
time? Would you say you are interested, not sure, or not interested?
Interested Not sure Not interested Total
Row N % Row N % Row N % Count
Sex of respondent Total 38.0% 16.2% 45.8% 1164
Female 38.2% 17.7% 44.1% 554
Male 37.9% 14.7% 47.4% 610 Age* 18 - 24 42.1% 21.5% 36.4% 292
25 - 39 43.0% 9.2% 47.9% 296 40 - 49 33.9% 18.8% 47.3% 237 50 + 33.1% 15.8% 51.1% 339
Race of respondent American Indian 40.4% 25.4% 34.2% 77 White 38.6% 15.8% 45.5% 1016
Educational attainment Less than HS diploma 38.0% 8.9% 53.1% 66 HS diploma, GED, some college 36.7% 17.2% 46.1% 712
BA + 42.1% 15.6% 42.3% 367 2008 HH income* < 20k 43.3% 23.2% 33.4% 148
20k - 34k 32.0% 10.7% 57.4% 128 35k - 49k 42.4% 16.3% 41.3% 163 50k - 74k 37.7% 16.5% 45.8% 222 75k - 99k 41.2% 13.9% 44.9% 147 100k + 42.9% 13.8% 43.3% 158
Disability Status* Yes 28.6% 17.4% 54.0% 188 No 39.8% 15.9% 44.2% 976
MT Labor Market Areas Northwest 39.1% 16.5% 44.4% 333 Southwest 41.2% 14.0% 44.8% 298 North Central 37.9% 17.1% 45.0% 193 South Central 37.2% 15.4% 47.4% 264 Eastern 24.0% 23.2% 52.9% 77
Distance Learning Interest*
Interested 95.7% 3.2% 1.1% 355
Not interested 12.8% 21.8% 65.4% 810
* Difference between two or more demographic categories significant at .05 level. Source: 2009 Montana Distance Learning Survey, Bureau of Business and Economic Research, The University of Montana-Missoula.
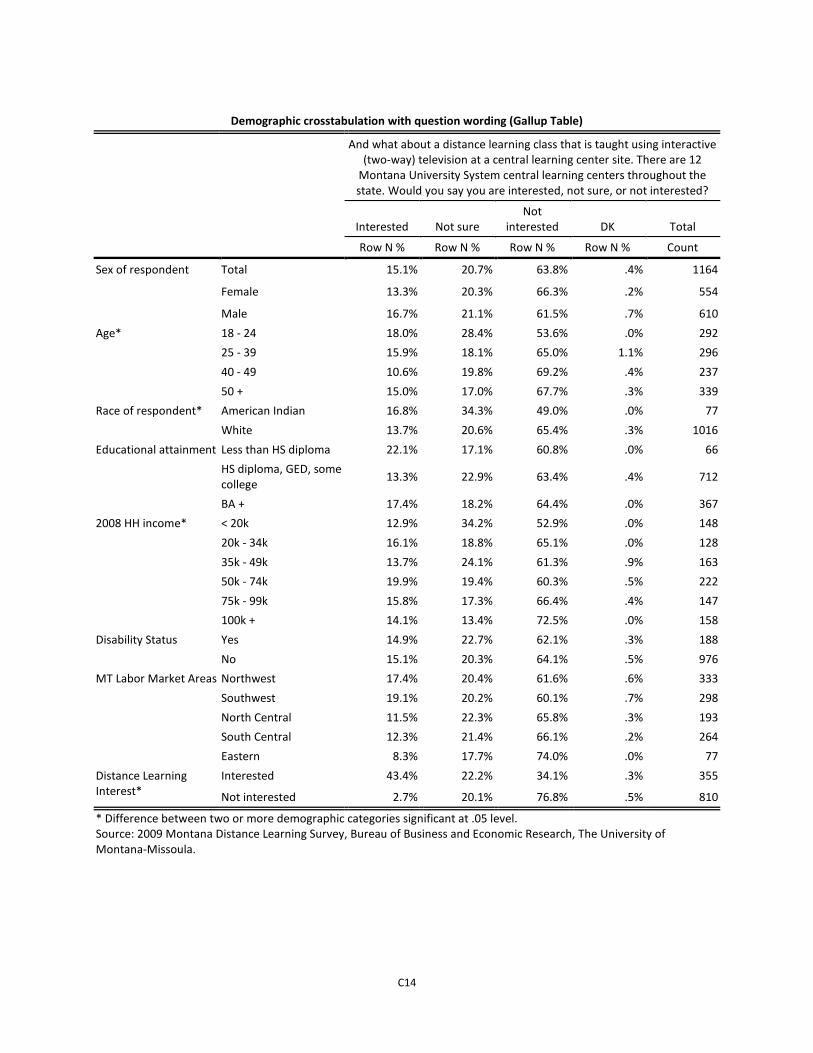
C14
Demographic crosstabulation with question wording (Gallup Table)
And what about a distance learning class that is taught using interactive (two-way) television at a central learning center site. There are 12
Montana University System central learning centers throughout the state. Would you say you are interested, not sure, or not interested?
Interested Not sure
Not interested DK Total
Row N % Row N % Row N % Row N % Count
Sex of respondent Total 15.1% 20.7% 63.8% .4% 1164
Female 13.3% 20.3% 66.3% .2% 554
Male 16.7% 21.1% 61.5% .7% 610 Age* 18 - 24 18.0% 28.4% 53.6% .0% 292
25 - 39 15.9% 18.1% 65.0% 1.1% 296 40 - 49 10.6% 19.8% 69.2% .4% 237 50 + 15.0% 17.0% 67.7% .3% 339
Race of respondent* American Indian 16.8% 34.3% 49.0% .0% 77 White 13.7% 20.6% 65.4% .3% 1016
Educational attainment Less than HS diploma 22.1% 17.1% 60.8% .0% 66 HS diploma, GED, some college 13.3% 22.9% 63.4% .4% 712
BA + 17.4% 18.2% 64.4% .0% 367 2008 HH income* < 20k 12.9% 34.2% 52.9% .0% 148
20k - 34k 16.1% 18.8% 65.1% .0% 128 35k - 49k 13.7% 24.1% 61.3% .9% 163 50k - 74k 19.9% 19.4% 60.3% .5% 222 75k - 99k 15.8% 17.3% 66.4% .4% 147 100k + 14.1% 13.4% 72.5% .0% 158
Disability Status Yes 14.9% 22.7% 62.1% .3% 188 No 15.1% 20.3% 64.1% .5% 976
MT Labor Market Areas Northwest 17.4% 20.4% 61.6% .6% 333 Southwest 19.1% 20.2% 60.1% .7% 298 North Central 11.5% 22.3% 65.8% .3% 193 South Central 12.3% 21.4% 66.1% .2% 264 Eastern 8.3% 17.7% 74.0% .0% 77
Distance Learning Interest*
Interested 43.4% 22.2% 34.1% .3% 355
Not interested 2.7% 20.1% 76.8% .5% 810
* Difference between two or more demographic categories significant at .05 level. Source: 2009 Montana Distance Learning Survey, Bureau of Business and Economic Research, The University of Montana-Missoula.

C15
Demographic crosstabulation with question wording (Gallup Table)
Are you, yourself, the parent of a child who is between 13 and 19 years old?
Yes No Total
Row N % Row N % Count
Sex of respondent* Total 18.4% 81.6% 1154
Female 21.0% 79.0% 552
Male 16.0% 84.0% 602 Age* 18 - 24 2.7% 97.3% 289
25 - 39 14.8% 85.2% 292 40 - 49 45.7% 54.3% 234 50 + 16.0% 84.0% 338
Race of respondent American Indian 22.1% 77.9% 77 White 18.1% 81.9% 1016
Educational attainment* Less than HS diploma 8.2% 91.8% 66 HS diploma, GED, some college 18.1% 81.9% 712
BA + 21.2% 78.8% 367 2008 HH income* < 20k 6.9% 93.1% 148
20k - 34k 16.1% 83.9% 128 35k - 49k 15.0% 85.0% 163 50k - 74k 23.0% 77.0% 222 75k - 99k 23.3% 76.7% 147 100k + 29.9% 70.1% 158
Disability Status Yes 14.7% 85.3% 188 No 19.1% 80.9% 966
MT Labor Market Areas Northwest 18.3% 81.7% 328 Southwest 17.4% 82.6% 293 North Central 18.3% 81.7% 193 South Central 19.2% 80.8% 263 Eastern 19.8% 80.2% 77
Distance Learning Interest Interested 17.7% 82.3% 354
Not interested 18.7% 81.3% 800
* Difference between two or more demographic categories significant at .05 level. Source: 2009 Montana Distance Learning Survey, Bureau of Business and Economic Research, The University of Montana-Missoula.

C16
Demographic crosstabulation with question wording (Gallup Table)
Are you, yourself interested in having your teen take dual-credit, high school/ college-level course work?
Yes No DK Total
Row N % Row N % Row N % Count
Sex of respondent Total 64.9% 26.9% 8.1% 212
Female 66.2% 26.9% 6.9% 116
Male 63.3% 27.0% 9.7% 96 Age 18 - 24 36.9% 63.1% .0% 8
25 - 39 63.2% 23.0% 13.8% 43 40 - 49 65.8% 30.0% 4.3% 107 50 + 68.6% 19.0% 12.4% 54
Race of respondent American Indian 47.2% 42.5% 10.3% 17 White 66.7% 25.6% 7.6% 184
Educational attainment Less than HS diploma 79.9% 10.8% 9.3% 5 HS diploma, GED, some college 58.9% 29.8% 11.3% 129
BA + 74.0% 23.3% 2.7% 78 2008 HH income < 20k 68.0% 14.9% 17.2% 10
20k - 34k 50.7% 41.6% 7.7% 21 35k - 49k 54.9% 31.4% 13.7% 24 50k - 74k 58.8% 28.2% 13.0% 51 75k - 99k 65.0% 32.7% 2.3% 34 100k + 83.0% 13.7% 3.3% 47
Disability Status Yes 50.3% 40.0% 9.7% 28 No 67.1% 25.0% 7.9% 184
MT Labor Market Areas Northwest 59.5% 24.2% 16.4% 60 Southwest 68.4% 29.3% 2.3% 51 North Central 65.4% 29.1% 5.5% 35 South Central 72.9% 20.2% 6.9% 50 Eastern 47.2% 47.6% 5.2% 15
Distance Learning Interest*
Interested 80.4% 12.8% 6.8% 63
Not interested 58.5% 32.9% 8.7% 150
* Difference between two or more demographic categories significant at .05 level. Source: 2009 Montana Distance Learning Survey, Bureau of Business and Economic Research, The University of Montana-Missoula.

C17
Demographic crosstabulation with question wording (Gallup Table)
Is your teen interested in taking dual-credit, high school/ college-level course work?
Yes No DK Total
Row N % Row N % Row N % Count
Sex of respondent Total 47.5% 32.5% 19.9% 212
Female 49.3% 32.2% 18.5% 116
Male 45.5% 32.9% 21.7% 96 Age 18 - 24 66.4% 33.6% .0% 8
25 - 39 45.0% 31.9% 23.1% 43 40 - 49 44.7% 33.9% 21.5% 107 50 + 52.6% 30.2% 17.3% 54
Race of respondent American Indian 48.6% 38.8% 12.6% 17 White 48.7% 31.3% 20.0% 184
Educational attainment Less than HS diploma 37.1% 15.6% 47.3% 5 HS diploma, GED, some college 45.6% 35.8% 18.6% 129
BA + 51.5% 28.3% 20.2% 78 2008 HH income < 20k 56.2% 38.1% 5.8% 10
20k - 34k 44.0% 41.3% 14.7% 21 35k - 49k 38.7% 39.2% 22.1% 24 50k - 74k 46.5% 27.8% 25.7% 51 75k - 99k 38.4% 47.5% 14.1% 34 100k + 61.2% 20.1% 18.6% 47
Disability Status Yes 37.0% 37.6% 25.4% 28 No 49.1% 31.7% 19.1% 184
MT Labor Market Areas Northwest 39.0% 31.9% 29.1% 60 Southwest 50.9% 25.7% 23.4% 51 North Central 55.8% 26.9% 17.3% 35 South Central 47.0% 39.6% 13.4% 50 Eastern 52.7% 47.3% .0% 15
Distance Learning Interest*
Interested 66.2% 15.0% 18.9% 63
Not interested 39.7% 39.8% 20.4% 150
* Difference between two or more demographic categories significant at .05 level. Source: 2009 Montana Distance Learning Survey, Bureau of Business and Economic Research, The University of Montana-Missoula.

C18
Demographic crosstabulation with question wording (Gallup Table)
Have you, yourself, ever attended a school in the Montana University System? The Montana University
System includes the colleges and universities funded by the State of Montana, but does not include private institutions like Rocky Mountain College or tribal
institutions like Salish Kootenai College.
Yes No Total
Row N % Row N % Count
Sex of respondent* Total 45.0% 55.0% 1145
Female 49.3% 50.7% 549
Male 41.1% 58.9% 596 Age 18 - 24 45.9% 54.1% 284
25 - 39 42.9% 57.1% 290 40 - 49 46.0% 54.0% 233 50 + 45.5% 54.5% 338
Race of respondent American Indian 37.6% 62.4% 77 White 46.2% 53.8% 1014
Educational attainment* Less than HS diploma 2.2% 97.8% 66 HS diploma, GED, some college 37.7% 62.3% 711 BA + 67.4% 32.6% 365
2008 HH income* < 20k 50.2% 49.8% 148 20k - 34k 37.1% 62.9% 128 35k - 49k 44.6% 55.4% 161 50k - 74k 49.8% 50.2% 221 75k - 99k 57.4% 42.6% 147 100k + 45.1% 54.9% 157
Disability Status Yes 39.3% 60.7% 188 No 46.2% 53.8% 957
MT Labor Market Areas* Northwest 38.3% 61.7% 323 Southwest 48.7% 51.3% 293 North Central 54.3% 45.7% 193 South Central 48.7% 51.3% 261 Eastern 23.3% 76.7% 75
Distance Learning Interest* Interested 56.2% 43.8% 349
Not interested 40.2% 59.8% 797
* Difference between two or more demographic categories significant at .05 level. Source: 2009 Montana Distance Learning Survey, Bureau of Business and Economic Research, The University of Montana-Missoula.

C19
Demographic crosstabulation with question wording (Gallup Table)
Did you complete a degree program or certification you were seeking at a Montana University System school, or not?
Yes No DK Total
Row N % Row N % Row N % Count
Sex of respondent Total 54.1% 45.9% .0% 516
Female 54.9% 45.1% .0% 270
Male 53.2% 46.8% .0% 245 Age* 18 - 24 34.1% 65.9% .0% 131
25 - 39 58.9% 41.1% .0% 124 40 - 49 62.1% 37.9% .0% 107 50 + 61.5% 38.5% .0% 154
Race of respondent American Indian 37.4% 62.6% .0% 29 White 56.1% 43.9% .0% 468
Educational attainment* Less than HS diploma .0% 100.0% .0% 1 HS diploma, GED, some college 26.9% 73.1% .0% 268
BA + 84.1% 15.9% .0% 246 2008 HH income* < 20k 25.7% 74.3% .0% 74
20k - 34k 49.9% 50.1% .0% 47 35k - 49k 56.1% 43.9% .0% 72 50k - 74k 52.9% 47.1% .0% 110 75k - 99k 69.9% 30.1% .0% 84 100k + 72.8% 27.2% .0% 71
Disability Status Yes 52.5% 47.5% .0% 74 No 54.3% 45.7% .0% 442
MT Labor Market Areas Northwest 57.2% 42.8% .0% 124 Southwest 50.2% 49.8% .0% 143 North Central 56.6% 43.4% .0% 105 South Central 51.4% 48.6% .0% 127 Eastern 66.9% 33.1% .0% 18
Distance Learning Interest*
Interested 46.1% 53.9% .0% 196
Not interested 58.9% 41.1% .0% 320
* Difference between two or more demographic categories significant at .05 level. Source: 2009 Montana Distance Learning Survey, Bureau of Business and Economic Research, The University of Montana-Missoula.

D1
APPENDIX D: QUESTIONNAIRE

D2
Hello, my name is __________ and I am calling from Bureau of Business and Economic Research in Missoula. We are doing a survey on important education issues in Montana on behalf of the Montana University System. First, though, I need to be sure I have dialed the right number. Is this ____-______? In order to do the survey, I have to follow a specific selection procedure. For this survey only people aged 18 and older are to be interviewed. So of all the people living in your household, including yourself, how many are 18 years of age and older? And how many of these persons are female? According to the selection procedure, I need to interview ______. Is he/she available? Or is that you? IF R NOT AVAILABLE, MAKE APPOINTMENT Before we start, I want to assure you that this interview is completely confidential and voluntary. If we should come to a question you don't want to answer; just let me know and we'll go on to the next question. This interview will take about 10 minutes. 1. Only people age 18 and older may participate in this survey. So, for eligibility purposes, how old were you on your last birthday? ____________________ years 2. Have you, yourself, used the internet at all in the last 30 days, that is, since August 30, 2009? Yes 1 No 0 DK 8 3. Do you have a working internet connection where you currently live or stay? Yes 1 No 0 DK 8
4. IF NO INTERNET AT HOME: Where else do you most often access the internet, if not in your home? Don’t ever use the internet (don’t read) 0 Work 1 Library 2 Internet café 3 Other (specify) 4

D3
5. IF EVER USE THE INTERNET: What method do you most often use to connect to the internet? Do you use?
A landline or cable connection, or 1 A wireless connection 2 6. IF LANDLINE CONNECTION: Do you use:
Dial-up (slower connection often provided by a telephone company) 1 DSL (higher speed connection often provided by a telephone company, Digital Subscriber Line) 2 Cable (higher speed connection often provided by a cable TV company), or 3 T1 (very high speed connection at a large institution, school, work) 4
7. IF WIRELESS CONNECTION: Do you use:
A wireless laptop or notebook computer 1 A Blackberry, iPhone, or other small, hand-held device, or 2 A satellite connection 3
8. Do you happen to know whether high speed internet service is available where you currently live or stay? High speed internet service is usually delivered using a digital subscriber line (DSL) delivered by a telephone company or a cable connection delivered by a cable TV company. Yes 1 No 0 DK 8 Next I am going to ask some questions about using distance learning services. Distance learning is a way of delivering educational course work that uses the internet, interactive, two-way television transmitted to a central learning site, mailed-out materials, or a combination of these methods. 9. Have you, yourself, ever taken a class in which the teaching was done mostly over the internet; or a class using interactive, two-way television transmitted to a central site; or a class using mostly mailed-out materials; or a class using any combination of these methods? Yes 1 No 0 DK 8
10. IF YES: What is the name of the organization(s) that taught your (most recent) distance learning class? ____________________ organization name ____________________ organization name
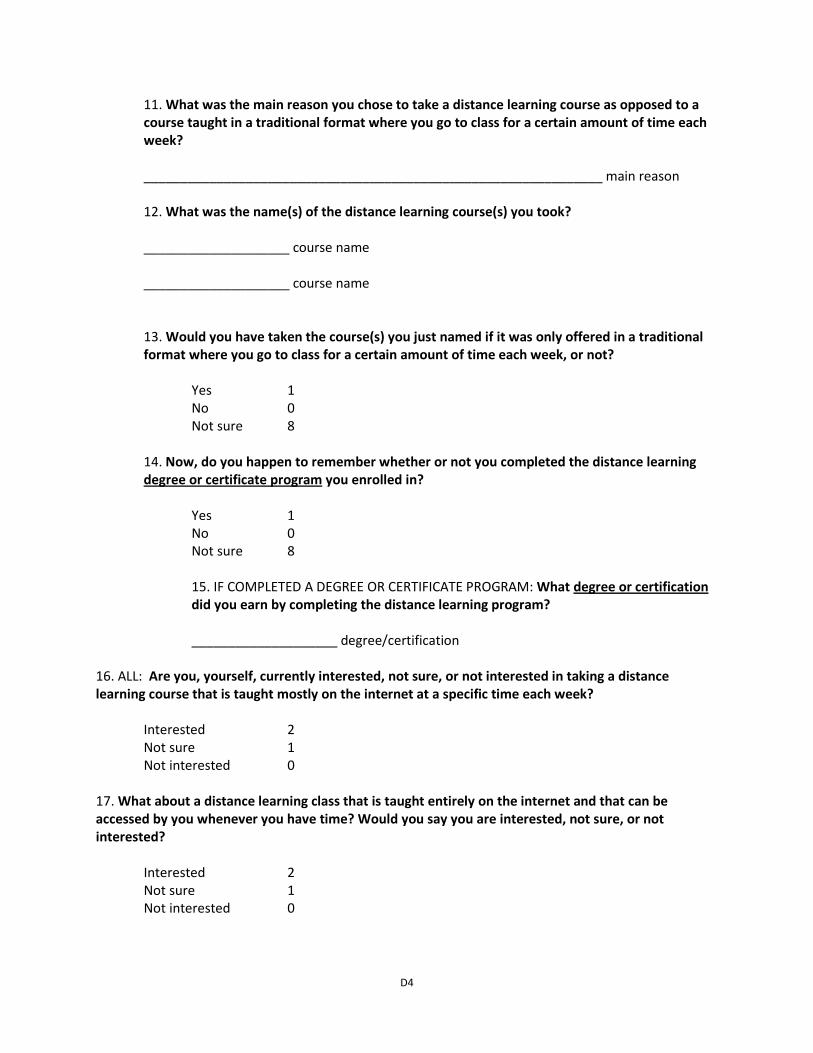
D4
11. What was the main reason you chose to take a distance learning course as opposed to a course taught in a traditional format where you go to class for a certain amount of time each week? _______________________________________________________________ main reason 12. What was the name(s) of the distance learning course(s) you took? ____________________ course name ____________________ course name
13. Would you have taken the course(s) you just named if it was only offered in a traditional format where you go to class for a certain amount of time each week, or not? Yes 1 No 0 Not sure 8 14. Now, do you happen to remember whether or not you completed the distance learning degree or certificate program you enrolled in? Yes 1 No 0 Not sure 8
15. IF COMPLETED A DEGREE OR CERTIFICATE PROGRAM: What degree or certification did you earn by completing the distance learning program?
____________________ degree/certification
16. ALL: Are you, yourself, currently interested, not sure, or not interested in taking a distance learning course that is taught mostly on the internet at a specific time each week? Interested 2 Not sure 1 Not interested 0 17. What about a distance learning class that is taught entirely on the internet and that can be accessed by you whenever you have time? Would you say you are interested, not sure, or not interested? Interested 2 Not sure 1 Not interested 0

D5
18. And what about a distance learning class that is taught using interactive (two-way) television at a central learning center site. There are 12 Montana University System central learning centers throughout the state. Would you say you are interested, not sure, or not interested?
Interested 2 Not sure 1 Not interested 0 Now I’m going to ask you about things that might keep you from taking a distance learning class. 19. What, if anything, might keep you from taking a distance learning course that is taught mostly on the internet at a specific time each week? ____________________ barrier 20. What, if anything, might keep you from taking a distance learning course that is taught entirely on the internet and that can be accessed by you whenever you have time? ____________________ barrier 21. And what, if anything, might keep you from taking a distance learning course that is taught using interactive (two-way) television at a central learning center site. ____________________ barrier
23. IF INTERESTED: What subject-area(s) are you most interested in studying using a distance learning program? ____________________ subject-area 24. IF INTERESTED: Now, are you interested in earning a degree or certification using only a distance learning program, or are you interested in taking a few courses using a distance learning program and then finishing your degree or certification using a traditional learning program, or are you just interested in taking a few distance learning courses? Complete a degree or certification using only a distance learning program 3
Complete a traditional degree or certification program taking a combination of distance learning courses and traditional courses 2 Just interested in taking a few distance learning courses 1
25. IF INTERESTED: What level of degree or certification are you interested in earning using a distance learning program?
____________________ degree/certification General interest but don’t know yet, not sure 8
26. ALL: Are you, yourself, the parent of a child who is between 13 and 19 years old?

D6
Yes 1 No 0 DK 8
28. IF YES: Are you, yourself interested in having your teen take dual-credit, high school/ college-level course work?
Yes 1
No 0 DK 8
29. IF YES: Is your teen interested in taking dual-credit, high school/ college-level course work?
Yes 1
No 0 DK 8
30. ALL: Have you, yourself, ever attended a school in the Montana University System? The Montana University System includes the colleges and universities funded by the State of Montana, but does not include private institutions like Rocky Mountain College or tribal institutions like Salish Kootenai College. Yes 1 No 0 DK 8 31. Did you complete a degree program or certification you were seeking at a Montana University System school, or not? Yes 1 No 0 DK 8
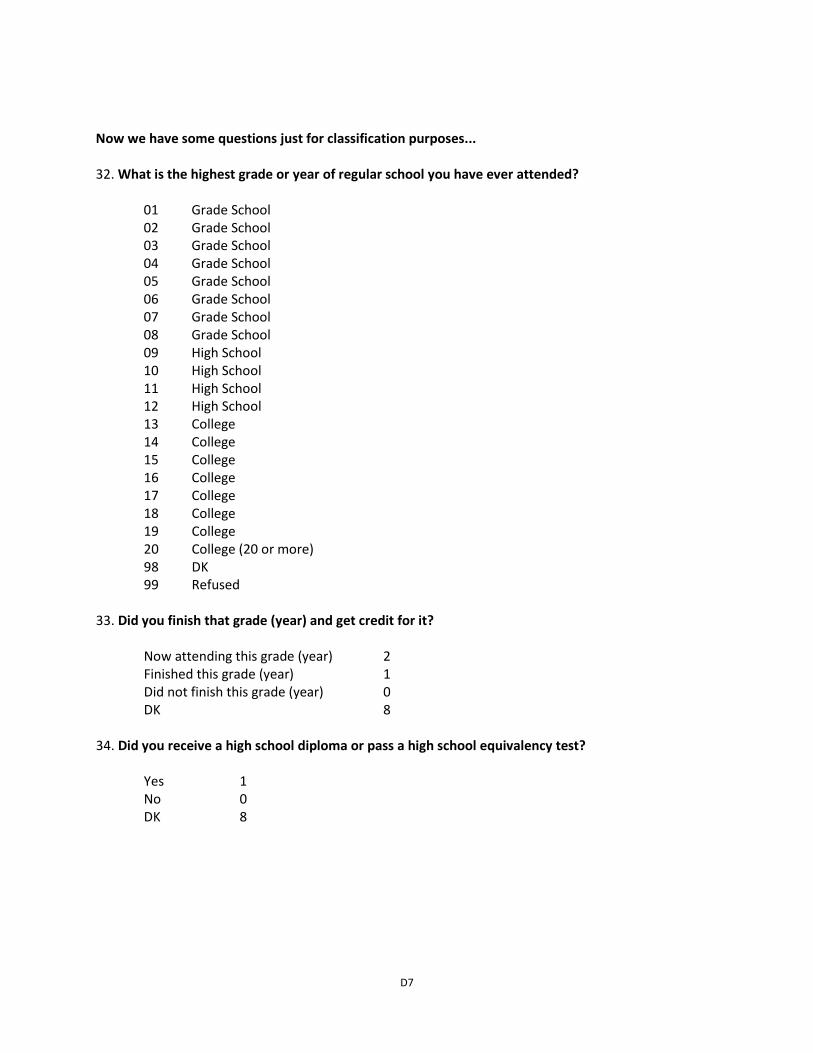
D7
Now we have some questions just for classification purposes... 32. What is the highest grade or year of regular school you have ever attended? 01 Grade School 02 Grade School 03 Grade School 04 Grade School 05 Grade School 06 Grade School 07 Grade School 08 Grade School 09 High School 10 High School 11 High School 12 High School 13 College 14 College 15 College 16 College 17 College 18 College 19 College 20 College (20 or more) 98 DK 99 Refused 33. Did you finish that grade (year) and get credit for it? Now attending this grade (year) 2 Finished this grade (year) 1 Did not finish this grade (year) 0 DK 8 34. Did you receive a high school diploma or pass a high school equivalency test? Yes 1 No 0 DK 8

D8
35. What degree or degrees did you receive? Less than high school 1 High school diploma or equivalency 2
Associate, two-year, junior college 3 Bachelor’s degree 4 Master’s degree 5
Doctorate 6 Professional (MD, JD, DDS, etc.) 7
DK 8 36. IF GREATER THAN NO HS DIPLOMA OR GED: Do you happen to recall your grade point average for the degree you received?
______.______________ GPA
37. Do you, yourself, have serious difficulty hearing? Yes 1 No 0 DK 8 38. Do you, yourself, have serious difficulty seeing even when wearing glasses? Yes 1 No 0 DK 8 39. Because of a physical, mental, or emotional condition, do you, yourself, have serious difficulty concentrating, remembering, or making decisions? Yes 1 No 0 DK 8 40. Do you, yourself, have serious difficulty walking or climbing stairs? Yes 1 No 0 DK 8 41. Are you Spanish or Hispanic or Latino?
Yes 1
No 0
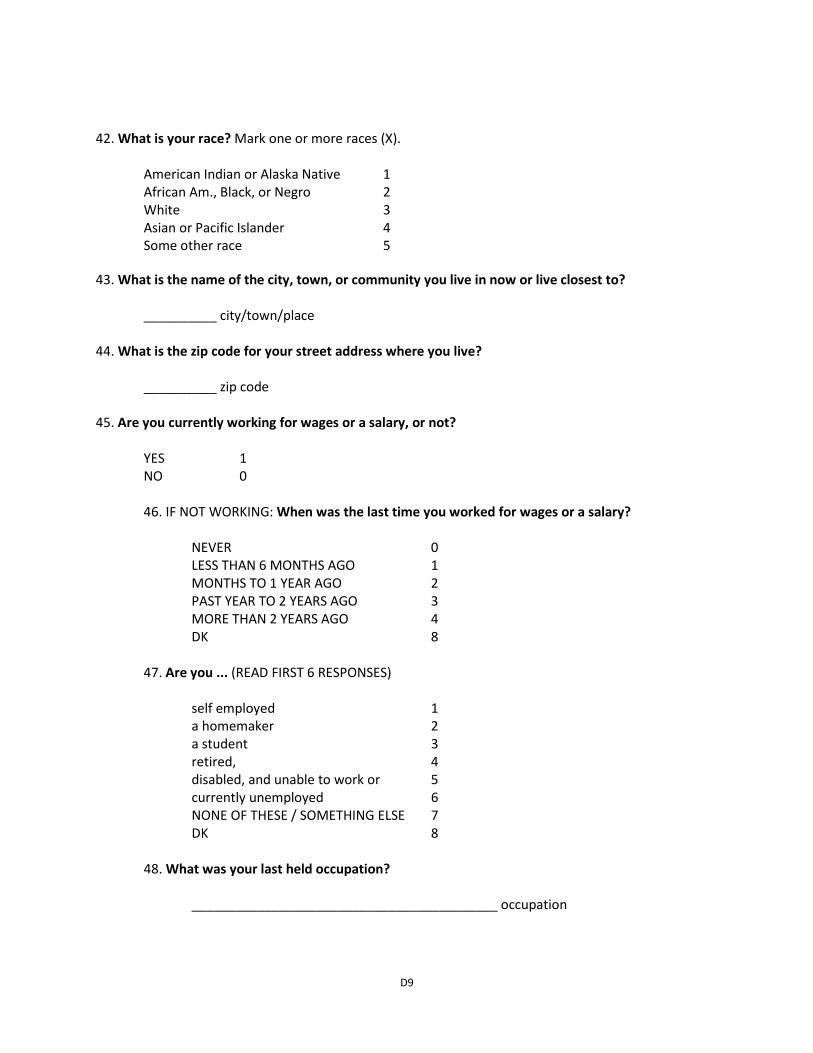
D9
42. What is your race? Mark one or more races (X). American Indian or Alaska Native 1 African Am., Black, or Negro 2
White 3 Asian or Pacific Islander 4 Some other race 5
43. What is the name of the city, town, or community you live in now or live closest to? __________ city/town/place 44. What is the zip code for your street address where you live? __________ zip code
45. Are you currently working for wages or a salary, or not?
YES 1 NO 0 46. IF NOT WORKING: When was the last time you worked for wages or a salary?
NEVER 0 LESS THAN 6 MONTHS AGO 1 MONTHS TO 1 YEAR AGO 2 PAST YEAR TO 2 YEARS AGO 3 MORE THAN 2 YEARS AGO 4 DK 8
47. Are you ... (READ FIRST 6 RESPONSES)
self employed 1 a homemaker 2 a student 3 retired, 4 disabled, and unable to work or 5 currently unemployed 6 NONE OF THESE / SOMETHING ELSE 7 DK 8
48. What was your last held occupation? __________________________________________ occupation

D10
49. Are you currently looking for a paying job?
Yes 1 No 0
DK 8 50. Do you plan to look for work within the next year?
Yes 1 No 0
DK 8 51. IF WORKING: What is your current occupation? ______________________________________
52. ALL: Was your TOTAL HOUSEHOLD INCOME for 2008? 100 thousand dollars or more? 10 Between 75 and 100 thousand dollars, or 9 Between 50 and 75 thousand 8 Between 40 and 50 thousand 7 Between 30 and 40 thousand 6 Between 25 and 30 thousand 5 Between 20 and 25 thousand 4 Between 15 and 20 thousand 3 Between 10 and 15 thousand 2 Less than 10,000 dollars 1 DK 98
Thank you very much for your help, that’s all of the questions I have. 53. After interviewer hangs up, enter respondents Sex:
Male 1 Female 2