dissolved trace element biogeochemistry of a tropical river, southwestern india
TRANSCRIPT

RESEARCH ARTICLE
Dissolved trace element biogeochemistry of a tropical river,Southwestern India
M. Tripti & G. P. Gurumurthy & K. Balakrishna & M. D. Chadaga
Received: 26 July 2012 /Accepted: 15 November 2012 /Published online: 8 December 2012# Springer-Verlag Berlin Heidelberg 2012
Abstract River Swarna, a small tropical river originating inWestern Ghats (at an altitude of 1,160m abovemean sea level)and flowing in the southwest coast of India discharges anaverage of 54 m3s−1 of water into the Arabian Sea, of whichsignificant part is being discharged during the monsoon. Nostudies have been made yet on the water chemistry of theSwarna River basin, even as half a million people of Udupidistrict use it for domestic and irrigational purposes. As largecommunity in this region depends on the freshwater of SwarnaRiver, there is an urgent need to study the trace elementgeochemistry of this west flowing river for better water man-agement and sustainable development. The paper presents theresults on the biogeochemistry of dissolved trace elements inthe Swarna River for a period of 1 year. The results obtained onthe trace elements show seasonal effect on the concentrationsas well as behavior and thus forming two groups, dischargedriven (Li, Be, Al, V, Cr, Ni, Zr, In, Pb, Bi and U) and baseflow driven (groundwater input; Mn, Fe, Co, Cu, Ga, Zn, As,Se, Rb, Sr, Ag, Cd, Cs, Ba and Tl) trace elements in SwarnaRiver. The biogeochemical processes explained throughHierarchical Cluster Analysis show complexation of Fe, Gaand Ba with dissolved organic carbon, redox control over Mn
and Tl and biological control over V and Ni. Also, the waterquality of Swarna River remains within the permissible limitsof drinking water standards.
Keywords Dissolved trace element . Biogeochemistry .
Hierarchical cluster analysis . Tropical river . Swarna River .
Southwestern India
Introduction
Knowledge on physicochemical and trace element geochem-istry of surface waters and ground waters are useful in under-standing the complex biogeochemistry of hydrologicalsystem. Recently, these studies have gained higher attentiondue to the ecological risks associated with them. Since surfacewater and groundwater form the major drinking water sourceto the entire human community and other organisms, it isimportant to know both the concentration as well as behaviorof trace elements in these hydrological systems. Other than thetrace element studies on fresh aquatic systems, the studies onestuarine or marine waters are also gaining more significanceas fish and other aquatic life depends on these waters which inturn would reflect in the food chain. It is known that the traceelements are not the only drivers of pollution in aquaticenvironment but there are also other substances that result inthe pollution of these systems. The main concern of thepresence of dissolved trace elements in water is due to itsnondegradability in natural waters; they can only be immobilein nature. Trace elements, dissolved or particulate phase pres-ent in hydrologic environment could be derived either fromnatural or anthropogenic sources. The atmospheric input likewet or dry deposition can also add to the presence of traceelements in hydro-systems.
Physicochemical parameters, organic matter, major ionsand other nutrients present in aquatic system can significant-ly affect the trace element behavior as well as bioavailable
Responsible editor: Stuart Simpson
Electronic supplementary material The online version of this article(doi:10.1007/s11356-012-1341-y) contains supplementary material,which is available to authorized users.
M. Tripti :G. P. Gurumurthy :K. Balakrishna (*) :M. D. ChadagaDepartment of Civil Engineering, Manipal Institute of Technology,Manipal University, Manipal 576104, Indiae-mail: [email protected]
M. Triptie-mail: [email protected]
G. P. Gurumurthye-mail: [email protected]
M. D. Chadagae-mail: [email protected]
Environ Sci Pollut Res (2013) 20:4067–4077DOI 10.1007/s11356-012-1341-y

metal concentrations. Few studies (Shiller and Boyle 1985;Gaillardet et al. 1995; Dupré et al. 1996; Eyrolle et al. 1996;Seyler and Elbaz-Poulichet 1996; Shiller 1997; Elbaz-Poulichet et al. 1999; Jain and Sharma 2001; Tosiani et al.2004; Rondeau et al. 2005; Deepa et al. 2007; Palmer et al.2011) have reported the dissolved trace element status ontropical rivers of the world. The biogeochemistry of therivers and estuaries gives an insight into the trace elementtoxicity or their bioavailability in traces for the well-being ofthe aquatic biota. Physicochemical parameters of water of-ten govern the adsorption/desorption, speciation or com-plexation of trace elements in hydrological system. Hence,it is important to find the relation of physicochemicalparameters mainly pH (Shiller and Boyle 1985) with traceelement existence as the above factors in turn affects thebioavailability or toxicity of these trace elements (Morel andHering 1993). The toxicity or mobility of trace elements isalso related to the availability of dissolved oxygen (DO) inthe hydro-systems. DO is known to control the redox con-dition in the aquatic system. Crerar et al. (1976) studied thetrace element (Fe and Mn) behavior at different oxic andanoxic conditions. It is found that all trace elements do notbehave similarly at same oxic or anoxic conditions respec-tively. Trace elements are mostly transported in organicallycomplexed form because of ubiquitous abundance of organ-ic carbon (dissolved organic carbon (DOC) and particulateorganic carbon) in riverine and estuarine environment(Degens et al. 1991). The organic carbon complexationtends the trace element to be removed from the water col-umn in the form of large colloidal complex (Davis 1984) orremain in the dissolved phase as small size labile metalorganic colloids (Mylon et al. 2003). The quantification ofmetal fluxes to the nearby oceans has gained significantimportance since these metals act as a nutrient to the oceanicorganisms. However, human population density and anthro-pogenic activity need to be taken in to account for quantifi-cation of metal fluxes in to the adjacent oceans (Cobelo-Garcia et al. 2004) as human activity amplifies the metaltransport through rivers by several times (Yan et al. 2000).
Most trace element studies are carried out on the riversfacing severe metal contamination or on the large rivers of theworld involving complex geological and meteorologicalaspects. This could rarely give an ideal picture on the naturaltrace element concentrations or the actual biogeochemicalprocesses occurring in the riverine environment. There is aneed to focus on the behavior of trace elements in smallercatchments, preferably at local levels, in order to understandthe complex biogeochemical processes occurring in the river-ine environment and to quantify the trace element fluxes fromthe continent to the sea through the riverine–estuarine path atthe regional or global scales. Detailed trace element studies onthe small rivers and their estuaries could solve the dilemma inunderstanding the dynamic nature of trace elements in rivers
and their estuaries.With these views, a study on physicochem-ical and trace element geochemistry of Swarna River, a smalltropical river flowing in the southwest coast of India has beentaken up with time and space. Also, no earlier studies havebeen carried out on the trace element geochemistry of SwarnaRiver, even though, the river forms the basic domestic watersource to a greater part of the Udupi district, with approxi-mately half a million population depending on this river water.Hence, this forms the baseline trace element geochemicalstudy on the Swarna River. The objectives of this study areto generate a baseline dataset on trace element geochemistryand to understand the biogeochemical processes controllingthe trace element concentration in the Swarna River.
Study area
Swarna River is the main source of drinking water to Udupiand Karkala taluks of Udupi District. It originates nearKorankal Gudda (Karkala taluk) in Western Ghats at analtitude of 1,160 m and then flows northwest for a distanceof 80 km before debouching into the Arabian Sea (Fig. 1).The river flows through the sub-urban region with no majorindustries found in the present time but are likely in the nearfuture as the area is fast developing with expansion ineducation and industrial sectors. This would result in higherfreshwater withdrawal within the river basin due to increasein population. The Swarna River flows through villages likeEedhu, Mudar, Perdoor, Hiriyadka, Parkala, Herga,Manipal, Perampalli, Uppoor, and Kallianpur. It joins theArabian Sea at Kodi-Bengre, Hangarkatta. The majortributaries are Durga hole, Kada hole, Andar hole, andHappanadka hole. The river is discharging annually16,512 m3 (river gauge station at Yennehole; CentralWater Commission, Government of India) to the ArabianSea. The study area experiences typical tropical climate withhot temperatures (20–38 °C), heavy rainfall (∼4,500 mm),and high-surface runoff (∼3,400 mm). The basin has an areaof 603 km2. The basin is located on the southwestern part ofthe Western Dharwar Craton underlain with metamorphictransition zone represented by green schist facies to granu-lite facies rock types, such as greenstone, amphibolites, andgranulites of Precambrian age (Rogers et al. 1986). Majorrock types in the river basin include granitic gneiss, doleritedyke, and laterite (Balasubramanyan 1978; GeologicalSurvey of India 1981; Ramakrishnan and Harinadhababu1981). The soil type includes lateritic soil in the upper andmid catchments of the river and alluvial soil near the coastalplains. The land use/land cover pattern in the river catch-ment includes dense vegetation in the upstream region,agricultural lands, and various plantations in the midstreamregion and the single type of plantations mainly coconutplantations in the coastal plains (Chadaga 2009). There areno major industries in the study area.
4068 Environ Sci Pollut Res (2013) 20:4067–4077

Methodology
The water samples from Swarna River were collected sea-sonally from four different locations for a period of 1 yearfrom mid 2010 to mid 2011. The water samples were col-lected from the centre of the river at the road bridge. Thesample stations were selected in such a way that threesamples represent the mainstream of Swarna River andfourth sample represents a major tributary of this river(Fig. 1). The three Swarna water samples were collected atupstream near Mudar, midstream near Yennehole, anddownstream of the river near Puttige, respectively. Watersamples collected from the major tributary of Swarna Riverinclude samples from Durga hole collected near Durga,Karkala. Onsite analysis of water samples at each samplingstation were conducted for measuring the physicochemicalparameters like temperature (in degrees Celsius), pH, con-ductivity (in microSiemens per centimeter), and DO (inmilligrams per liter). These physicochemical parameterswere measured using Hach make multiparameter apparatusby dipping the pH, conductivity, and luminescent DOprobes in river water and thus, recording the onsite measure-ments. The river water samples were collected in pre-cleaned (rinsed with ultrapure water before collection) 1 lpolypropylene (PP) bottles after rinsing it several times withthe river water to avoid any dilution. The bottles werecovered with polythene bags and carried to laboratory forfurther processing. The 1-l water samples collected at eachstation were filtered through 0.22 μm pore size and 47 mmdiameter Nuclepore membrane filters, using a Sartoriusfiltration apparatus operated through a Mityvac make handvacuum pump. Filtration was carried out in a laminar flowbench placed in a clean laboratory on the same day within 4
to 6 h of sample collection. The first 50 ml of filtered watersamples were discarded, while another 100 ml of filteredsample were used for rinsing the pre-cleaned PP bottles usedfor storing the water samples for analysis of major ions,DOC, and trace elements. The finally filtered water sampleswere particularly stored in acid-cleaned (1 N HNO3) 60-mlPP bottles for trace element analysis. The samples were thenacidified with ultrapure nitric acid (pH<2) and stored in acool condition to arrest bacterial growth. The samples forDOC and major ions were analyzed using TOC analyzer(Shimadzu make) and ion chromatography respectively,available at Geosciences Environnement Toulouse (GET),France. The water samples for trace elements were mea-sured using Thermo Scientific-Quadrupole InductivelyCoupled Plasma Mass Spectrometry (Thermo ICP-MS X-Series 2) available at Mangalore refinery and petrochemi-cals limited (MRPL), Mangalore. Maximum care was takenduring sample collection, storage, and analysis of watersamples to avoid any contamination during sample han-dling. The ICP-MS performance testing was carried out bychecking the count rate using AccuStandard multielementtuning solution, before sample analysis. The count rates ofLi>40,000 counts, In>200,000 counts, and U>400,000counts were obtained during the instrument testing. Theinstrument uses the collision reaction cell technology toovercome the matrix interferences. The interferences werecontrolled by using reactive gas mixtures of 1 % ammoniain helium, 7 % hydrogen in helium, and 100 % hydrogen. Theconventional external calibrations were carried out using stan-dard solutions of trace elements prepared from mono- andmultielement standard solutions (AccuStandard, USA). Theconcentrations of twenty six trace elements were measured inriver water samples and were subsequently deducted from the
Fig. 1 Basin map of SwarnaRiver, southwest coast of Indiashowing sampling stations andthe nearby major towns
Environ Sci Pollut Res (2013) 20:4067–4077 4069

procedural blank. The procedural blank concentrations forselected trace elements are shown in Table S1 in theElectronic supplementary material (ESM). The water sampleswere directly analyzed for trace elements using ICP-MS with-out any internal standard addition to the samples. The datawere cross-checked for accuracy and precision with certifiedreference material (SLRS-5) and triplicate analysis of eachsample. The measured values of standard river water referencematerial, SLRS-5 obtained from National Research Council,Canada were found to be in good agreement with the certifiedvalues for SLRS-5 as shown in Table S1 in the ESM. Theaccuracy for the measured values of SLRS-5 was found to bewithin the acceptable error limits, (±3 %) for most metals andslightly higher (±8 %) for Mn, except for Cd which showed arelatively higher value. However, Cd was found to be in lowerconcentration (<ngL−1) in Swarna River water. The precisionfor all the samples analyzed were found to be within theacceptable error limits (±5 %). The data on average rainfallfor the entire river basin for the study period and the averagedischarge data for Swarna River used in the statistical analysiswere collected from NASA website (http://disc2.nascom.nasa.gov/Giovanni/tovas/) and Central Water Commission(CWC), Government of India, respectively. The temporaland spatial studies on physicochemical parameters and traceelements were carried out using Statistical Package for SocialScience version 12 (SPSS 12.0v). The intervariability rela-tionship between trace elements and physicochemical param-eters, DOC, and total dissolved solids (TDS0sum of majorcations, major anions, and silica) were found using compara-tive analysis of Pearson correlation technique and Centroidclustering method of cluster analysis technique, respectively,supported by SPSS-12.0v. The results of this paper are basedon the data obtained for all the four stations during September2010 (monsoon), November 2010 (post-monsoon), andMarch 2011 (pre-monsoon) representing the seasonality ofIndian subcontinent. Additional samples of August 2010,February 2011, and May 2011 for downstream station(Puttige) were analyzed to represent overall trace elementstatus in the basin for the study period.
Results and discussion
The characteristics of Swarna River water are studied for aperiod of 1 year, i.e., from mid-2010 to mid-2011 spanningmonsoon, post-monsoon, and pre-monsoon seasons. Thetemporal and spatial variability of temperature, pH, conduc-tivity (EC), DO, and trace elements in the Swarna Riverwater are studied. The work presents the results mainly ondissolved trace elements, and the ancillary parameters likeDOC and major ion data are used in understanding thebiogeochemical processes occurring in the Swarna Riversystem. Surface water temperature of the river varies from
25.5 (in downstream of Swarna River at Puttige duringAugust) to 31.5 °C (in downstream of Swarna River atPuttige during May). This is typical for the rivers in thesouth-west coast of India experiencing heavy monsoonbetween June and September and dry summer climatic con-ditions between March and May. The river water is mildlyacidic to neutral in nature with pH ranging from 5.8 (inDurga hole during March) to 7.2 (in Yennehole duringSeptember). A moderately low pH (average 6.8) in SwarnaRiver shows that the river catchment is dominated by sili-cate rocks whereas the possible carbonate rock influence onthe river water is negligible which is consistent with otherrivers of silicate terrains (Oliva et al. 2003). The conductiv-ity of water in Swarna River is observed to be varying from25.6 (in Durga hole during September) to 59.1 μScm−1 (inYennehole during March). The minimum value is attributedto the monsoonal dilution. This is evident by the higherrainfall data for the September month (595 mm) comparedwith other months for the sampling period. A relatively lowconductivity in this river compared to major South Indianrivers (Kaveri River (377 μScm−1; Pattanaik et al. 2007),Godavari River (302 μScm−1; Jha et al. 2009), KrishnaRiver (170 μScm−1; Das et al. 2005), and Bhima River(413 μScm−1; Das et al. 2005)) shows that the major partof Swarna River basin is covered by granitic rocks as it isknown that the low conductivity in water represents thecharacteristics of river draining the granitic rock formation(Oliva et al. 2003). The DO in Swarna water is found to bebetween 5.4 (in Durga hole during March) and 8.1 mgL−1
(in Mudar during August). This shows that there exists aslight depletion of DO in the river water during the pre-monsoon period compared with post-monsoon or monsoon-al seasons, maintaining the minimum DO as observed forthe sampling period. It is found that all physicochemicalparameters representing Swarna River water quality arewithin the permissible limits of drinking water. The concen-trations for the toxic trace elements are found to be withinthe permissible drinking water limits as recommendedby World Health Organization (WHO) guidelines (WHO2011). The WHO recommended values of trace elementsconcentration for drinking water are as follows (concentra-tion range of these trace elements in Swarna river water forthe study period are given in brackets for comparison): Be,12 μgL−1 (<0.0001–0.008 μgL−1); Cr, 50 μgL−1 (0.09–0 .53 μg L− 1 ) ; Mn, 100–400 μg L− 1 (3 .71–78 .63μgL−1); Fe, 300 μgL−1 (100.2–269.7 μgL−1); Ni, 70μgL−1(0.18–0.47 μgL−1); Cu, 2 μgL−1 (0.43–1.26μgL−1); As, 10 μgL−1 (0.03–0.21 μgL−1); Cd, 3 μgL−1
(<0.0001–0.001 μgL−1); Ba, 700 μgL−1 (2.42–5.96 μgL−1); and Pb, 10 μgL−1 (0.04–0.31 μgL−1). The samplesmeasured for trace elements represent higher seasonal vari-ability than the spatial variability. This indicates that thegeochemical processes associated with climatic conditions
4070 Environ Sci Pollut Res (2013) 20:4067–4077
dominate in controlling the trace element behavior as well asits concentration.
Temporal variability in Swarna River water
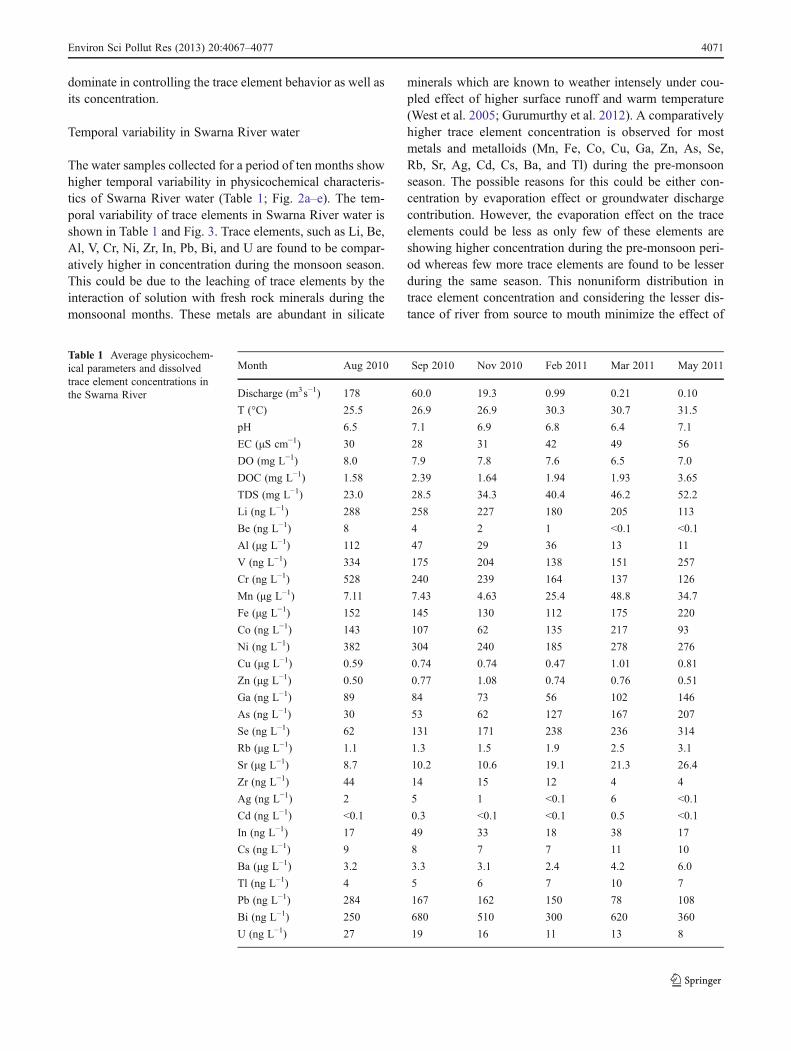
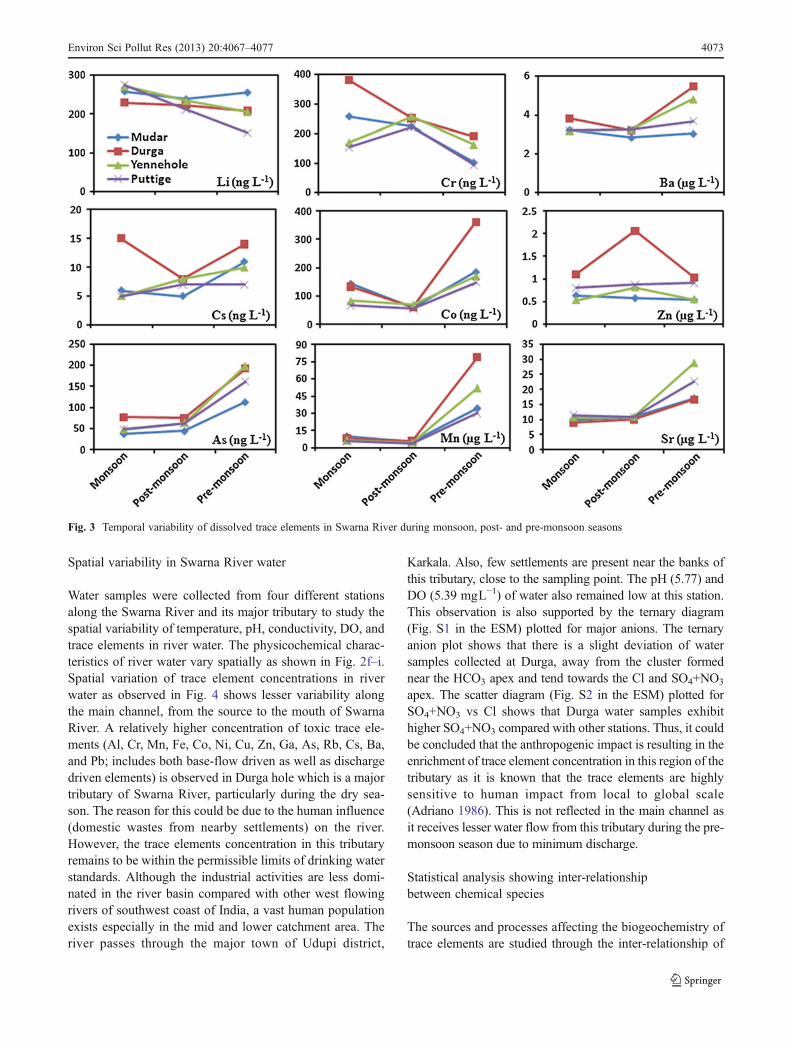
The water samples collected for a period of ten months showhigher temporal variability in physicochemical characteris-tics of Swarna River water (Table 1; Fig. 2a–e). The tem-poral variability of trace elements in Swarna River water isshown in Table 1 and Fig. 3. Trace elements, such as Li, Be,Al, V, Cr, Ni, Zr, In, Pb, Bi, and U are found to be compar-atively higher in concentration during the monsoon season.This could be due to the leaching of trace elements by theinteraction of solution with fresh rock minerals during themonsoonal months. These metals are abundant in silicate
minerals which are known to weather intensely under cou-pled effect of higher surface runoff and warm temperature(West et al. 2005; Gurumurthy et al. 2012). A comparativelyhigher trace element concentration is observed for mostmetals and metalloids (Mn, Fe, Co, Cu, Ga, Zn, As, Se,Rb, Sr, Ag, Cd, Cs, Ba, and Tl) during the pre-monsoonseason. The possible reasons for this could be either con-centration by evaporation effect or groundwater dischargecontribution. However, the evaporation effect on the traceelements could be less as only few of these elements areshowing higher concentration during the pre-monsoon peri-od whereas few more trace elements are found to be lesserduring the same season. This nonuniform distribution intrace element concentration and considering the lesser dis-tance of river from source to mouth minimize the effect of
Table 1 Average physicochem-ical parameters and dissolvedtrace element concentrations inthe Swarna River
Month Aug 2010 Sep 2010 Nov 2010 Feb 2011 Mar 2011 May 2011
Discharge (m3s−1) 178 60.0 19.3 0.99 0.21 0.10
T (°C) 25.5 26.9 26.9 30.3 30.7 31.5
pH 6.5 7.1 6.9 6.8 6.4 7.1
EC (μS cm−1) 30 28 31 42 49 56
DO (mg L−1) 8.0 7.9 7.8 7.6 6.5 7.0
DOC (mg L−1) 1.58 2.39 1.64 1.94 1.93 3.65
TDS (mg L−1) 23.0 28.5 34.3 40.4 46.2 52.2
Li (ng L−1) 288 258 227 180 205 113
Be (ng L−1) 8 4 2 1 <0.1 <0.1
Al (μg L−1) 112 47 29 36 13 11
V (ng L−1) 334 175 204 138 151 257
Cr (ng L−1) 528 240 239 164 137 126
Mn (μg L−1) 7.11 7.43 4.63 25.4 48.8 34.7
Fe (μg L−1) 152 145 130 112 175 220
Co (ng L−1) 143 107 62 135 217 93
Ni (ng L−1) 382 304 240 185 278 276
Cu (μg L−1) 0.59 0.74 0.74 0.47 1.01 0.81
Zn (μg L−1) 0.50 0.77 1.08 0.74 0.76 0.51
Ga (ng L−1) 89 84 73 56 102 146
As (ng L−1) 30 53 62 127 167 207
Se (ng L−1) 62 131 171 238 236 314
Rb (μg L−1) 1.1 1.3 1.5 1.9 2.5 3.1
Sr (μg L−1) 8.7 10.2 10.6 19.1 21.3 26.4
Zr (ng L−1) 44 14 15 12 4 4
Ag (ng L−1) 2 5 1 <0.1 6 <0.1
Cd (ng L−1) <0.1 0.3 <0.1 <0.1 0.5 <0.1
In (ng L−1) 17 49 33 18 38 17
Cs (ng L−1) 9 8 7 7 11 10
Ba (μg L−1) 3.2 3.3 3.1 2.4 4.2 6.0
Tl (ng L−1) 4 5 6 7 10 7
Pb (ng L−1) 284 167 162 150 78 108
Bi (ng L−1) 250 680 510 300 620 360
U (ng L−1) 27 19 16 11 13 8
Environ Sci Pollut Res (2013) 20:4067–4077 4071

evaporation on trace elements in Swarna River for thesampling period. Hence, the observed higher concentrationof trace elements during the pre-monsoon season is attrib-uted to the mixing of ground water with the river water inthe Swarna River catchment. This is supported by the iden-tical average isotopic values of δ18O measured for the riverwater (average δ18O–3.09±0.05‰; n015) and groundwater(avg. δ18O–3.05±0.11; n024) in the Swarna basin (Tripti etal. 2012). Similar observations on mixing of groundwaterwith the river water during the lean flow season are reportedon adjacent river basins having similar climatic, geologicaland topographical settings, Nethravati and Gurupur byRajesh et al. (2002) and Gurumurthy et al. (2012).Generally, the concentrations of cations and trace elementsare higher in the groundwater because of long interactionwith aquifer minerals, intense weathering and less dilution(Drever 1997; Erel et al. 2004; Negrél et al. 2004). Since theSwarna River is mainly rainfed (∼87 % of total dischargeduring monsoon period; Fig. 2a, Central WaterCommission, Government of India), the ground water con-tributes to the river water during the lean flow season. This
is supported by the observed higher concentrations of alkaliand alkaline earth metals, such as Rb, Sr, Ba, and lessermobile metal Fe, which increase in their concentrations asthe length of interaction increases because of weathering ofmost resistant minerals such as biotite and chlorite of silicaterocks (Erel et al. 2004). The water in the aquifer/subsurfaceregions is mostly isolated from the atmosphere and oftenexhibit reduced condition; as a consequence, the redoxsensitive elements like Fe, Mn, and As are released tothe water (Edmunds and Smedley 1996). Thus, the traceelements which are observed to be in higher concentra-tion in the Swarna river water during the pre-monsoonperiod reflects the contribution from the ground watersource (base-flow driven). Hence, the study shows in-fluence of seasonal effect on the trace elements concen-tration and thus forming two groups, discharge drivenand base-flow-driven trace elements in Swarna River.Additional sources for trace element concentration couldbe understood with the knowledge on spatial variations(any land use/land cover impact) of trace elements inSwarna River water.
Fig. 2 Temporal variability (a–e) and spatial variability (f–i) of physicochemical parameters in Swarna River
4072 Environ Sci Pollut Res (2013) 20:4067–4077
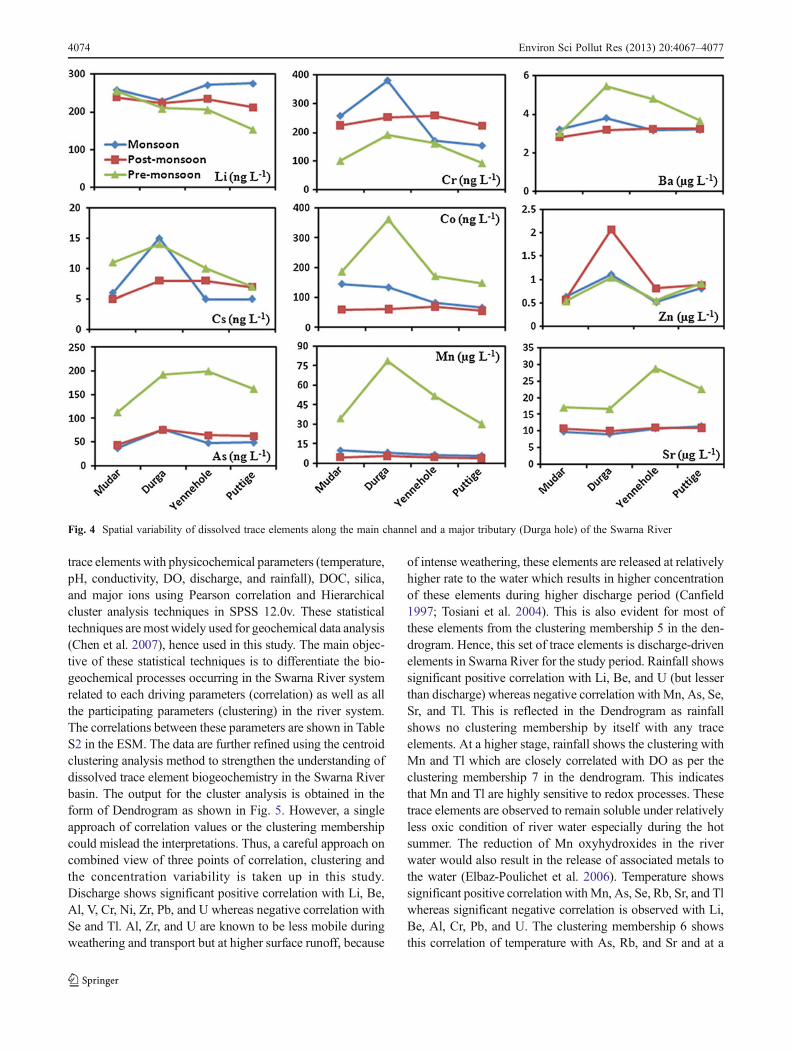
Spatial variability in Swarna River water
Water samples were collected from four different stationsalong the Swarna River and its major tributary to study thespatial variability of temperature, pH, conductivity, DO, andtrace elements in river water. The physicochemical charac-teristics of river water vary spatially as shown in Fig. 2f–i.Spatial variation of trace element concentrations in riverwater as observed in Fig. 4 shows lesser variability alongthe main channel, from the source to the mouth of SwarnaRiver. A relatively higher concentration of toxic trace ele-ments (Al, Cr, Mn, Fe, Co, Ni, Cu, Zn, Ga, As, Rb, Cs, Ba,and Pb; includes both base-flow driven as well as dischargedriven elements) is observed in Durga hole which is a majortributary of Swarna River, particularly during the dry sea-son. The reason for this could be due to the human influence(domestic wastes from nearby settlements) on the river.However, the trace elements concentration in this tributaryremains to be within the permissible limits of drinking waterstandards. Although the industrial activities are less domi-nated in the river basin compared with other west flowingrivers of southwest coast of India, a vast human populationexists especially in the mid and lower catchment area. Theriver passes through the major town of Udupi district,
Karkala. Also, few settlements are present near the banks ofthis tributary, close to the sampling point. The pH (5.77) andDO (5.39 mgL−1) of water also remained low at this station.This observation is also supported by the ternary diagram(Fig. S1 in the ESM) plotted for major anions. The ternaryanion plot shows that there is a slight deviation of watersamples collected at Durga, away from the cluster formednear the HCO3 apex and tend towards the Cl and SO4+NO3
apex. The scatter diagram (Fig. S2 in the ESM) plotted forSO4+NO3 vs Cl shows that Durga water samples exhibithigher SO4+NO3 compared with other stations. Thus, it couldbe concluded that the anthropogenic impact is resulting in theenrichment of trace element concentration in this region of thetributary as it is known that the trace elements are highlysensitive to human impact from local to global scale(Adriano 1986). This is not reflected in the main channel asit receives lesser water flow from this tributary during the pre-monsoon season due to minimum discharge.
Statistical analysis showing inter-relationshipbetween chemical species
The sources and processes affecting the biogeochemistry oftrace elements are studied through the inter-relationship of
Fig. 3 Temporal variability of dissolved trace elements in Swarna River during monsoon, post- and pre-monsoon seasons
Environ Sci Pollut Res (2013) 20:4067–4077 4073
trace elements with physicochemical parameters (temperature,pH, conductivity, DO, discharge, and rainfall), DOC, silica,and major ions using Pearson correlation and Hierarchicalcluster analysis techniques in SPSS 12.0v. These statisticaltechniques are most widely used for geochemical data analysis(Chen et al. 2007), hence used in this study. The main objec-tive of these statistical techniques is to differentiate the bio-geochemical processes occurring in the Swarna River systemrelated to each driving parameters (correlation) as well as allthe participating parameters (clustering) in the river system.The correlations between these parameters are shown in TableS2 in the ESM. The data are further refined using the centroidclustering analysis method to strengthen the understanding ofdissolved trace element biogeochemistry in the Swarna Riverbasin. The output for the cluster analysis is obtained in theform of Dendrogram as shown in Fig. 5. However, a singleapproach of correlation values or the clustering membershipcould mislead the interpretations. Thus, a careful approach oncombined view of three points of correlation, clustering andthe concentration variability is taken up in this study.Discharge shows significant positive correlation with Li, Be,Al, V, Cr, Ni, Zr, Pb, and U whereas negative correlation withSe and Tl. Al, Zr, and U are known to be less mobile duringweathering and transport but at higher surface runoff, because
of intense weathering, these elements are released at relativelyhigher rate to the water which results in higher concentrationof these elements during higher discharge period (Canfield1997; Tosiani et al. 2004). This is also evident for most ofthese elements from the clustering membership 5 in the den-drogram. Hence, this set of trace elements is discharge-drivenelements in Swarna River for the study period. Rainfall showssignificant positive correlation with Li, Be, and U (but lesserthan discharge) whereas negative correlation with Mn, As, Se,Sr, and Tl. This is reflected in the Dendrogram as rainfallshows no clustering membership by itself with any traceelements. At a higher stage, rainfall shows the clustering withMn and Tl which are closely correlated with DO as per theclustering membership 7 in the dendrogram. This indicatesthat Mn and Tl are highly sensitive to redox processes. Thesetrace elements are observed to remain soluble under relativelyless oxic condition of river water especially during the hotsummer. The reduction of Mn oxyhydroxides in the riverwater would also result in the release of associated metals tothe water (Elbaz-Poulichet et al. 2006). Temperature showssignificant positive correlation withMn, As, Se, Rb, Sr, and Tlwhereas significant negative correlation is observed with Li,Be, Al, Cr, Pb, and U. The clustering membership 6 showsthis correlation of temperature with As, Rb, and Sr and at a
Fig. 4 Spatial variability of dissolved trace elements along the main channel and a major tributary (Durga hole) of the Swarna River
4074 Environ Sci Pollut Res (2013) 20:4067–4077

higher distance it clusters with Mn and Tl. This indicates thatthese trace elements undergo temperature-driven processessuch as chemical weathering under warm and humid climaticconditions of South India (Gurumurthy et al. 2012). pH showshigher positive correlation only with Co (but not significant at5 % level). This is represented by the cluster membership 3which then combines at higher distance with In, Bi, Ag, andCd which forms the cluster membership 4. The lack of corre-lation between metal cations and pH suggests that the metalsare less involved in pH driven geochemical processes such assorption reactions. This could be due to near neutral pHcondition prevailing in the river water and lesser pH variationas observed for the study period. The effect of pH on metalabundance could be obvious at acidic/alkaline pH conditions(Shiller and Boyle 1985; Gaillardet et al. 2003). The colloidaloxyhydroxides of Mn and Fe forms the potential particlesource for metal cation (Ni, Cu, Cd, Zn, V, and Pb) adsorptionin the riverine and estuarine environment (Sholkovitz andCopland 1982; Sigg 1985; Balistrieri et al. 1994). In theSwarna River basin, Mn (also Fe, Ga, and Ba at minor level)shows inverse relationship with DO for the study period,suggesting the formation of colloidal oxyhydroxide in theriver water at higher DO concentration during the monsoonalseason compared with the non-monsoonal season. However,variation in Mn concentration is not consistent with otherheavy metals indicating lesser involvement of pH drivensorption process. This could be due to observed near neutralpH conditions prevailing in the river water, which supportsless adsorption–desorption reactions. Fe, Ga, and Ba showsignificant positive correlation with DOC. At a higher
distance, it combines with Cu and Cs to form the clustermembership 1 in the dendrogram. This indicates that thesetrace elements strongly form complexes with DOC present inSwarna River. The complexation behavior of Fe, Cu, Ba, andfew rare earth elements has been reported elsewhere in theliterature (e.g., Shafer et al. 1997; Viers et al. 2000; Pourret etal. 2007). Ba is the highly complexing trace element withDOC in Swarna River, as observed for the study period.Most studies suggest that the complexation process results inthe removal of trace elements from the dissolved phase (Davis1984). However, this could be uncertain with the presence oforganic colloids of smaller size as their proportions are knownto dominate with decreasing size in surface water (Buffle andLeppard 1995). The positive correlation of Cu, Fe, and Bawith DOC and their possible colloidal form in the river waterhave been reported by Ran et al. 2000 and Pourret et al. 2007.In Swarna River, DOC is found to be relatively higher duringthe pre-monsoon season. Also, Fe, Ga, and Ba which areknown to be sensitive to redox conditions could be releasedfrom the oxyhydroxide state to the dissolved phase underrelatively less oxic condition during the pre-monsoon season.As these metals are released to the solution, they form com-plexes with the surrounding smaller organic colloids whichare dominant in the form of DOC, allowing them toremain in the dissolved mode until they further coagu-late to form larger aggregates. Hence, the positive cor-relation of Fe, Ga, and Ba with DOC could be due tothe colloidal organic carbon complexation with thesetrace elements for the sampling period. SO4 showssignificant negative correlation with V, Fe, Ga, and Ba.
Fig. 5 Dendrogram showing inter-variable relationship between physicochemical parameters, DOC, major ions, minor and trace elements in theSwarna River water
Environ Sci Pollut Res (2013) 20:4067–4077 4075

It is evident from the cluster membership 2 of dendrogram thatSO4 is closely related with Zn, V, and Ni. This indicates thatthese trace elements and SO4 are derived from the similarsource. Also, there is a possibility that these elements mayundergo precipitation as sulfides or sulfate precipitates. SinceV and Ni are negatively correlated with SO4, the abovehypothesis is not valid for these trace elements. It isobserved that V and Ni are higher during monsoon andpre-monsoon periods compared with post-monsoon peri-od in the Swarna River. This could be due to thebiological (phytoplankton) uptake of these nutrient-liketrace elements during the post-monsoon period (phyto-plankton growth is well supported by the moderate riverwater flow) and release during the pre-monsoon period(very slow flow) when the phytoplankton decay takesplace (higher oxygen consumption for decompositionand hence, results in lesser DO associated with highertemperature of river water) as observed for SwarnaRiver water. Similar behavior of V and Ni were alsoobserved in Oubangui River, a pristine tropical river ofCentral African Republic (Seyler and Elbaz-Poulichet1996). It is found that the most trace elements showhigh correlation with TDS representing that sources fortrace elements and major ions present in Swarna Riverwater could be identical, mainly from weathering ofsource rocks in the river catchment.
Conclusions
The study reveals that the trace elements in Swarna Riverare within the permissible limits for drinking water as rec-ommended by the WHO guidelines. The time series analysisof trace elements represent that a higher temporal variabilityoccurs compared with the spatial variability of these ele-ments in Swarna River. Intense weathering of source rocksduring the monsoon period and groundwater discharge dur-ing the dry season form the two important sources to thetrace elements observed in the river water. It is concludedthat the trace elements present in Swarna River are largelycontrolled by biogeochemical processes such as redox, com-plexation, and biological uptake accompanied by dischargedriven hydrological regime, compared with sorption andprecipitation reactions.
Acknowledgments This work is funded by European Commissionthrough their support to Manipal Center for European Studies (MCES)and post-doctoral research fund (to KB) from Manipal Institute ofTechnology. Ministry of Environment and Forests (MoEF), Govern-ment of India is sincerely thanked for providing the necessary facilitiesto carry out this work. The authors are thankful to MRPL, Mangalorefor providing the ICP-MS facility for trace element analysis. Also, Dr.JJ Braun, Dr. J Riotte, and Dr. S Audry at GET, France are thanked forproviding the analytical facilities to measure major ions and DOCconcentration in Swarna River.
References
Adriano DC (1986) Trace elements in the terrestrial environment.Springer, New York
Balasubramanyan MN (1978) Geochronology and geochemistry of Ar-chean tonolitic gneisses and granites of South Kanara district, Kar-nataka State, India. In: Windley BF, Naqvi SM (eds) The origin andevolution of Archean Geochemistry. Elsevier, Amsterdam, pp 59–77
Balistrieri LS, Murray JW, Paul B (1994) Geochemical cycling of traceelements in a biogenic meromictic lake. Geochim CosmochimActa 58(19):3993–4008
Buffle J, Leppard GG (1995) Characterization of aquatic colloids andmacromolecules. 1. Structure and behavior of colloidal material.Environ Sci Technol 29:2169–2175
Canfield DE (1997) The geochemistry of river particulates from thecontinental USA: major elements. Geochim Cosmochim Acta 61(16):3349–3365
Chadaga M (2009) River basin studies of Seeta-Swarna and Gangollicomposite river systems of coastal Karnataka, west coast of Indiausing remote sensing and geographic information system (GIS)techniques. Ph.D. thesis (unpublished), Manipal University.
Chen K, Jiao JJ, Huang J, Huang R (2007) Multivariate statisticalevaluation of trace elements in groundwater in a coastal area inShenzhen, China. Environ Pollut 147:771–780
Cobelo-Garcia A, Prego R, Lambandeira A (2004) Land inputs of tracemetals, major elements, particulate organic carbon and suspendedsolids to an industrial coastal bay of the NE Atlantic. Water Res38:1753–1764
Crerar DA, Cormick RK, Barnes HL (1976) Geology and geochemis-try of manganese. Schweizerbart, Stuttgart
Das A, Krishnaswami S, Sarin MM, Pande K (2005) Chemical weath-ering in the Krishna Basin and Western Ghats of the Deccan traps,India: rates of basalt weathering and their controls. GeochimCosmochim Acta 69(8):2067–2084
Davis JA (1984) Complexation of trace metals by adsorbed naturalorganic matter. Geochim Cosmochim Acta 48(5):679–691
Deepa VJ, Balakrishna K, Mugeraya G, Srinikethan G, KrishnakumarPK (2007) Spatial and temporal variations in water quality, majorions and trace metals in River Godavari at Rajahmundry. PollutRes 26:757–763
Degens ET, Kempe S, Richey JE (1991) Summary: Biogeochemistryof major world rivers. In: Degens ET, Kempe S & Richey JE(Eds) Biogeochemistry of major world rivers. SCOPE Report.Wiley, London. pp. 323–347
Drever JI (1997) The geochemistry of natural waters: surface andgroundwater environments. Prentice-Hall, Upper Saddle
Dupré B, Gaillardet J, Rousseau D, Allègre CJ (1996) Major and traceelements of river-borne material: the Congo Basin. GeochimCosmochim Acta 60:1301–1321
Edmunds WM, Smedley PL (1996) Groundwater geochemistry andhealth: an overview. In: Appleton JD, Fuge R, McCall GJH (eds)Environmental geochemistry and health, geological society spe-cial publication, 113th edn., pp 91–105
Elbaz-Poulichet F, Seyler P, Maurice-Bourgoin L, Guyot J-L, Dupuy C(1999) Trace element geochemistry in the upper Amazon drainagebasin (Bolivia). Chem Geol 157:319–334
Elbaz-Poulichet F, Seidel J-L, Casiot C, Tuesseau-Vuillemin M-H(2006) Short term variability of dissolved trace element concen-trations in the Marne and Seine rivers near Paris. Sci TotalEnviron 367:278–287
Erel Y, Blum JD, Roueff E (2004) Lead and strontium isotopes asmonitors of experimental granitoid mineral dissolution. GeochimCosmochim Acta 68:4649–4663
Eyrolle F, Benedetti MF, Benaim JY, Février D (1996) The distribu-tions of colloidal and dissolved organic carbon, major elements
4076 Environ Sci Pollut Res (2013) 20:4067–4077
and trace elements in small tropical catchments. Geochim Cos-mochim Acta 60(19):3643–3656
Gaillardet J, Dupré B, Allègre CJ (1995) A global geochemical massbudget applied to the Congo basin rivers: erosion rates and con-tinental crust composition. Geochim Cosmochim Acta 59:3469–3485
Gaillardet J, Viers J, Dupré B (2003) The trace element geochemistryof surface waters. Treatise on geochemistry. Elsevier, Amsterdam5:225–272
Geological Survey of India (1981) Geological and mineral map ofKarnataka and Goa. Swaminath J et al. (eds) Krishnamurthy VS,Director General, Geological Survey of India.
Gurumurthy GP, Balakrishna K, Tripti M, Riotte J, Audry S, Braun JJ,Udaya Shankar HN (2012) Sources and processes affecting thechemistry of subsurface waters along a tropical river basin, South-western India. Hydrolog Sci J (under review)
Gurumurthy GP, Balakrishna K, Riotte J, Braun JJ, Audry S, UdayaShankar HN, Manjunatha BR (2012) Controls on intense silicateweathering in a tropical river, southwestern India. Chem Geol300-301:61–69
Jain CK, Sharma MK (2001) Distribution of trace elements in theHindon river system, India. J Hydrol 253:81–90
Jha PK, Tiwari J, Singh UK, Kumar M, Subramanian V (2009) Chem-ical weathering and associated CO2 consumption in the Godavaririver basin, India. Chem Geol 264:364–374
Morel FMM, Hering JG (1993) Principles and applications of aquaticgeochemistry. Wiley, New York
Mylon S, Twining B, Fisher N, Benoit G (2003) Relating the specia-tion of Cd, Cu and Pb in two Connecticut rivers with their uptakein algae. Environ Sci Technol 37:1261–1267
Negrél P, Petelet-Giraud E,Widory D (2004) Strontium isotope geochem-istry of alluvial groundwater: a tracer for groundwater resourcescharacterisation. Hydrol Earth Syst Sci Discuss 8(5):959–972
Oliva P, Viers J, Dupré B (2003) Chemical weathering in graniticenvironments. Chem Geol 202:225–256
Palmer SCJ, van Hinsberg VJ, McKenzie JM, Yee S (2011) Charac-terization of acid river dilution and associated trace elementbehaviour through hydrogeochemical modelling: a case study ofthe Banyu Pahit River in East Java, Indonesia. Appl Geochem26:1802–1810
Pattanaik JK, Balakrishnan S, Bhutani R, Singh P (2007) Chemical andstrontium isotopic composition of Kaveri, Palar and Ponnaiyarrivers: significance to weathering of granulites and graniticgneisses of southern Peninsular India. Curr Sci 93(4):523–531
Pourret O, Dia A, Davranche M, Gruau G, Hénin O, Angée M (2007)Organo-colloidal control over major- and trace-element partition-ing in shallow grounwaters: confronting ultrafiltration and mod-eling. Appl Geochem 22(8):1568–1582
Rajesh R, Murthy TRS, Raghavan BR (2002) The utility of multivar-iate statistical techniques in hydrogeochemical studies: an exam-ple from Karnataka, India. Water Res 36:2437–2442
Ramakrishnan M, Harinadhababu P (1981) Western Ghat belt. In:Swaminath J, Ramakrishnan M (eds) Early Precambriam Supra-crustals of Southern Karnataka, 112th edn. Memorandum of Geo-logical Survey of India, Kolkata, pp 147–161
Ran Y, Fu JM, Sheng GY, Beckett R, Hart BT (2000) Fractionation andcomposition of colloidal and suspended particulate materials inrivers. Chemosphere 41:33–43
Rogers JJW, Callahan EJ, Dennen KO, Fullargar PD, Shroh TP, WoodLF (1986) Chemical evolution of Peninsular Gneiss in the westernDharwar Craton, Southern India. J Geol 94(2):233–246
Rondeau B, Cossa D, Gagnon P, Pham TT, Surette C (2005) Hydro-logical and biogeochemical dynamics of the minor and traceelements in the St. Lawrence River Applied Geochemistry 20(7):1391–1408
Seyler P, Elbaz-Poulichet F (1996) Biogeochemical control on thetemporal variability of trace element concentrations in the Ouban-gui river (Central African Republic). J Hydrol 180:319–332
Shafer MM, Overdier JT, Hurley JP, Armstrong J, Webb D (1997) Theinfluence of dissolved organic carbon, suspended particulates, andhydrology on the concentration, partitioning and variability oftrace metals in two contrasting Wisconsin watersheds (USA).Chem Geol 136:71–97
Shiller AM (1997) Dissolved trace elements in the Mississippi River:seasonal, interannual, and decadal variability. Geochim Cosmo-chim Acta 61:4321–4330
Shiller AM, Boyle EA (1985) Dissolved zinc in rivers. Nature 317:49–52
Sholkovitz ER, Copland D (1982) The chemistry of suspended matterin Esthwaite water, a biologically productive lake with seasonallyanoxic hypolimnion. Geochim Cosmochim Acta 46:393–410
Sigg L (1985) Metal transfer mechanisms in lakes: the role of settlingparticles. In: Stumm W (ed) Chemical processes in lakes. Wiley,New York, pp 283–310
Tosiani T, Loubet M, Viers J, Valladon M, Tapia J, Marrero S, YanesaC, Ramirez A, Dupré B (2004) Major and trace elements in river-borne materials from the Cuyuni basin (southern Venezuela):evidence for organo-colloidal control on the dissolved load andelement redistribution between the suspended and dissolved load.Chem Geol 211:305–334
Tripti M, Lambs L, Otto T, Moussa I, Balakrishna K (2012) Role ofdual monsoons on the sources of water and water vapor recyclingacross the Swarna river basin, Southwest India—a water isotopeapproach. In: Proceedings of Joint European Stable Isotope Usersgroup Meeting 2012 (JESIUM-2012), Leipzig, Germany, 2–7September, p 242
Viers J, Dupré B, Deberdt S, Braun JJ, Angeletti B, Ndam NgoupayouJ, Michard A (2000) Major and traces elements abundances, andstrontium isotopes in the Nyong basin rivers (Cameroon) con-straints on chemical weathering processes and elements transportmechanisms inhumid tropical environments. Chem Geol169:211–241
West AJ, Galy A, Bickle M (2005) Tectonic and climatic controls onsilicate weathering. Earth Planet Sci Lett 235:211–228
World Health Organization (2011) Guidelines for drinking water qual-ity, fourth edn. ISBN: 978 92 4 154815 1.
Yan XP, Kerrich R, Hendry MJ (2000) Distribution of arsenic (III),arsenic (V) and total inorganic arsenic in pore waters from a thicktill and clay-rich aquitard sequence, Saskatchewan, Canada. Geo-chim Cosmochim Acta 64:2637–2648
Environ Sci Pollut Res (2013) 20:4067–4077 4077