displacement tracking report vanuatu
TRANSCRIPT

1
IOM OIM
Displacement Tracking Report Vanuatu
Source: IOM. Cyclone damage in Melsisi, Central Pentecost
Tropical Cyclone HaroldJune 2020

2
Table of Contents
Executive Summary Key Findings Methodology Introduction
Displacement Monitoring Displacement Baseline Sex Age Disaggregated Data (SADD) Locations of Displacement Previous Displacement
Protection and Vulnerability People with DisabilityHouseholds with Individuals in Poor Health (illness) Households with Family Members with Acute Health ConditionsChild Protection
3435
55699
1010111111
Funded by CERF
Multisectoral Needs OverviewWater Sanitation and Hygiene (WASH)HealthEducationSafety and Security
Durable SolutionsDamage to Housing Current Length of DisplacementReturn Intentions
1213131415
16161717

3
Executive Summary
This report presents the key findings from the National Disaster Management Office (NDMO) and the International Organization for Migration (IOM) Displacement Tracking Matrix (DTM) assessment carried out between 26 May and 6 June 2020 in response to Tropical Cyclone Harold (T.C. Harold).
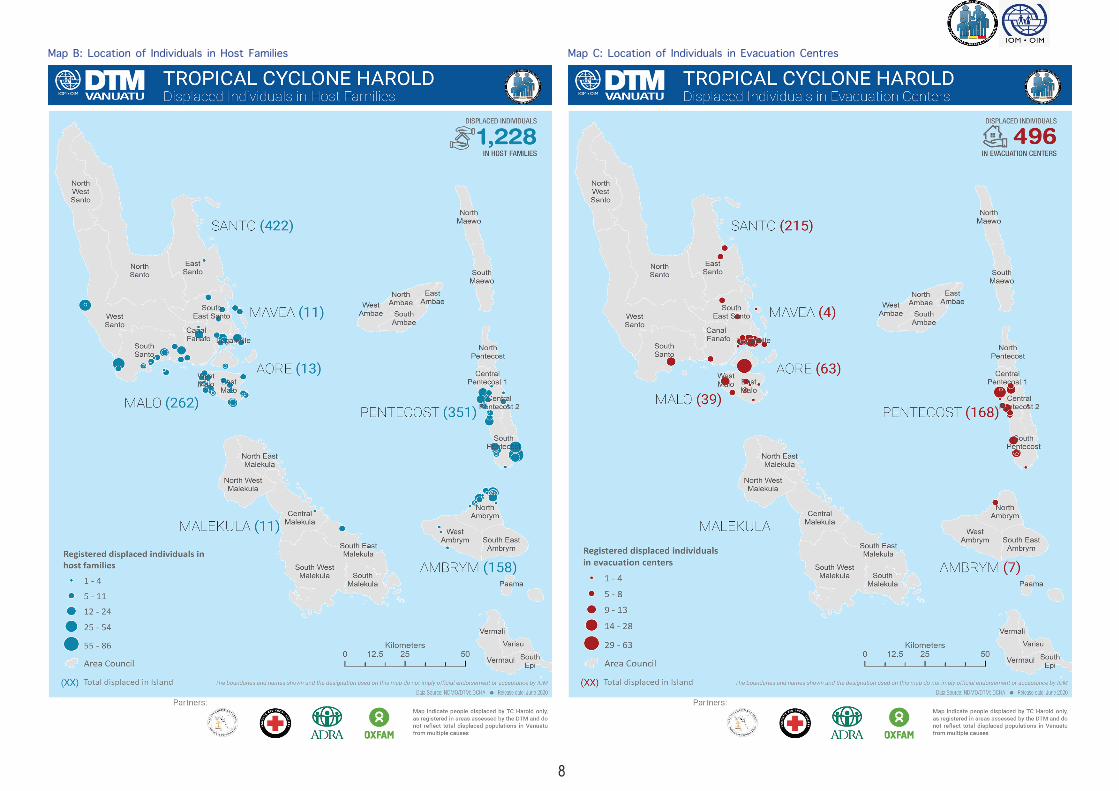
As of 6 June 2020, the research established a total of 6,218 individuals (1,295 households) as displaced across 569 host families and 178 evacuation centres. The research also mapped the locations of 265 evacuation centres that were used for shelter during the cyclone. Out of the total individuals reported as displaced, 5,714 individuals (1,190 households) were reported as displaced across five Islands (Aore, Araki, Malo, Mavea and Santo) in Samna Province, 402 individuals (84 households) across Pentecost Island of Penama Province and a total of 102 individuals (21 households) across the island of Ambrym in Malampa Province. The research indicated that the majority of those affected by T.C. Harold were young families, with minors (aged between the ages of 5-18 years) being statistically the most affected followed by individuals under the ages of 30. The affected population were evenly divided between men and women with 51% of the identified displaced population being male and 49% being female.
From the 1,295 households (6,218 individuals) reported as displaced, the research registered and carried out in-depth interviews with 359 households (1,724 individuals). This comprised 1,228 individuals (256 households) living with host families/relatives and 496 individuals (103 households) living in evacuation centres. A minority of the total population registered by the research (132 individuals) were recorded as currently displaced outside of the own community, with the greatest number of those displaced outside of their own community recorded as residing on Santo Island. 93% of all households interviewed reported an intention to return to their homes and rebuild. Only 7% (27 households) reported an intention to remain in their current location or move to a new location. Importantly across all locations 73% of the affected population reported an intention to remain in the current locations of displacement for another month.
With the majority of the displaced population having already resided in evacuation centres and/or with host families for over a month (77%), access to primary services was recorded as increasingly important. Access to safe drinking water was noted as a serious concern with up 53% of those displaced reporting not having access to safe drinking
water noting those displaced in Santo and Pentecost both respectively reporting that up to 69% and 50% of the population do not have access to safe drinking water. Access to food was also noted as an important primary need with up to 37% of the population reporting a lack of access to food. Noting that the majority of those displaced intend to remain in their current location of displacement for over a month, whilst also holding a longer-term intention to return to their homes, providing access to these basic services may build community resilience and support coordinated return efforts.
Access to greater protection services was also noted as in important area for intervention. Up to 43% of children in evacuation centres and 67% in host families are recorded as not having access to school. Compounded by reports of child abuse concerns in 22% of evacuation centres and 16% of host families, children are disproportionally affected by T.C. Harold (statistically) and noted by this research as being one of the most vulnerable population groups.
In terms of health and sanitation, the research established a positive correlation with the majority recorded as having access to toilets (albeit primarily not segregated) and the majority having access to health services, with reportedly 109 villages lacking sustained access to health services. The research recorded 8 households as hosting a family member with a disability, 94 households as hosting a family member with poor health and 6 households as hosting a family member with acute health issues. Accordingly, targeted health interventions may partially alleviate some household concerns.
Although up to 70% of the displaced reported their homes to have been completely destroyed up to 93% reported an intention to return to their homes after one month. The research established that to better strengthen displaced people’s capacities to return to their homes and communities of origin, targeted support in terms of non-food items (NFIs) and cash distributions were recorded as a priority for up to 90% of the affected population.
For more information please contact: Mr. Dan Salmon
IOM Vanuatu DTM [email protected] Dr. Jessie Connell
IOM Vanuatu Chief of Mission [email protected]

4
MethodologyThe DTM response to T.C Harold is based on a three-fold approach. First, an initial estimated number of displaced individuals at Area Council and Provincial level were mapped** using data collected from local government representatives and humanitarian partners. Second, a total of 325 key informant interviews were carried out at Area Council level establishing a revised baseline of the total number of reported displaced people to 6,218 individuals (1,295 households). Thirdly, to ensure greater data quality and a refined understanding of the core needs and vulnerabilities at household level the data collected at Area Council and Provincial level was triangulated with multisectoral registration data from 359 households (1,724 individuals). In this report, a household is considered “displaced” if they are staying in an evacuation centre or with relatives/host households because they are not able to return to their home. Evacuation centres include all public buildings or communal places where people took shelter during the cyclone, including schools, churches, caves and other protective structures.
Key Findings
Up to 93% of all households registered reported having been displaced for over 1 month;
93% of registered households intend to return to thier area of origin;
Non Food Items (NFI) are reported as the primary need to support households to return to area of origin.
6,218 individuals reported as displaced;1,724 individuals reached and registered;46% of the displaced under the age of 18;
92% of all households registered are recorded as displaced within their own community;
42% of households share shelter with pregnant or lactating women, and/or widowed individuals, individuals from a separated family, orphaned children or unaccompanied minors;
37% of households displaced report a lack of sustained access to food;
Up to 53% of all locations are reported to not having access to safe drinking water;
45% of registered households report sharing shelter with an individual who is unwell, with acute health conditions or with a disability; 1
2
3
ST EP 1Initial mapping of reported displaced population to develop baseline understading of who is where.
ST EP 2
ST EP 3
Using intial mapping, sex age dissagregated multi-sectoral data collected from 365 key informants at Area Council on the reported displaced population.
In-depth interviews and registration of 359 households, representing 1,724 individuals.
5
Displacement Monitoring
Displacement Baseline
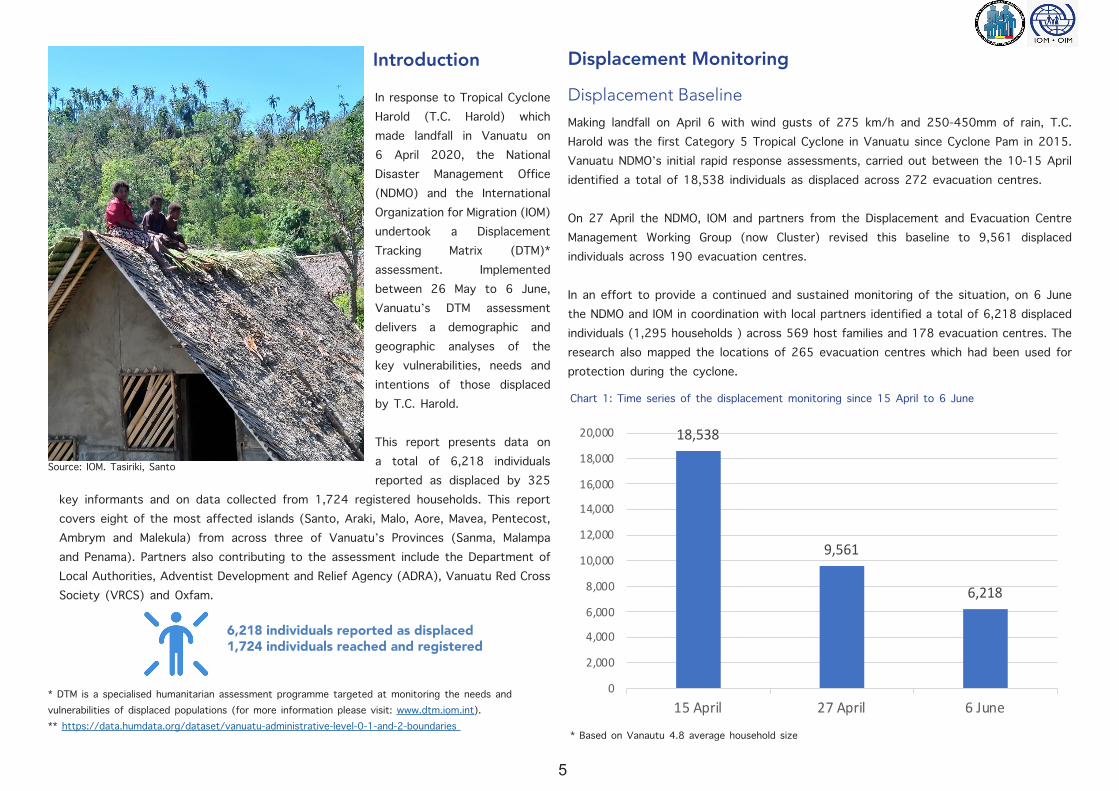
Making landfall on April 6 with wind gusts of 275 km/h and 250-450mm of rain, T.C. Harold was the first Category 5 Tropical Cyclone in Vanuatu since Cyclone Pam in 2015. Vanuatu NDMO’s initial rapid response assessments, carried out between the 10-15 April identified a total of 18,538 individuals as displaced across 272 evacuation centres.
On 27 April the NDMO, IOM and partners from the Displacement and Evacuation Centre Management Working Group (now Cluster) revised this baseline to 9,561 displaced individuals across 190 evacuation centres.
In an effort to provide a continued and sustained monitoring of the situation, on 6 June the NDMO and IOM in coordination with local partners identified a total of 6,218 displaced individuals (1,295 households ) across 569 host families and 178 evacuation centres. The research also mapped the locations of 265 evacuation centres which had been used for protection during the cyclone.
Chart 1: Time series of the displacement monitoring since 15 April to 6 June
Introduction
In response to Tropical Cyclone Harold (T.C. Harold) which made landfall in Vanuatu on 6 April 2020, the National Disaster Management Office (NDMO) and the International Organization for Migration (IOM) undertook a Displacement Tracking Matrix (DTM)* assessment. Implemented between 26 May to 6 June, Vanuatu’s DTM assessment delivers a demographic and geographic analyses of the key vulnerabilities, needs and intentions of those displaced by T.C. Harold.
This report presents data on a total of 6,218 individuals reported as displaced by 325
key informants and on data collected from 1,724 registered households. This report covers eight of the most affected islands (Santo, Araki, Malo, Aore, Mavea, Pentecost, Ambrym and Malekula) from across three of Vanuatu’s Provinces (Sanma, Malampa and Penama). Partners also contributing to the assessment include the Department of Local Authorities, Adventist Development and Relief Agency (ADRA), Vanuatu Red Cross Society (VRCS) and Oxfam.
* DTM is a specialised humanitarian assessment programme targeted at monitoring the needs and vulnerabilities of displaced populations (for more information please visit: www.dtm.iom.int).** https://data.humdata.org/dataset/vanuatu-administrative-level-0-1-and-2-boundaries
18,538
9,561
6,218
0
2,000
4,000
6,000
8,000
10,000
12,000
14,000
16,000
18,000
20,000
15 April 27 April 6 June
* Based on Vanautu 4.8 average household size
6,218 individuals reported as displaced1,724 individuals reached and registered
Source: IOM. Tasiriki, Santo

6
As described in the Methodology, to deliver a robust and comprehensive overview of Vanuatu’s displacement dynamics, data was collected from both key informants at Provincial and Area Councils, and from individualised household interviews, including registration, at village level.
From the data collected at Area Council level, a total of 6,218 individuals (1,295 households) were reported as displaced across Sanma, Penama and Malampa provinces. Sanma was reported as the Province with the largest number of displaced people followed by Penama and Malampa. A total of 5,714 individuals (1,190 households) were reported in Samna, a total of 402 individuals (84 households) were reported in Penama and a total of 102 individuals (21 households) were reported in Malampa (see Table 1).
Out of the reported baseline number of 6,218 individuals displaced by key informants, a total of 1,724 individuals (359 households) were reached, registered and interviewed. This comprises 1,228 individuals (256 households) living with host families/relatives and 496 individuals (103 households) living in evacuation centres (see Map A).
Table 1: Distribution of individuals and households reported as displaced (n=6,218 individuals)
Based on a sampling extract of the sex and age breakdown of the total population registered (28% of the total caseload), 51% of the affected population were recorded as male and 49% as female. Chart 3 provides an overview of the sex and age breakdown by site type across Vanuatu, noting the majority of those displaced were recorded as minors - under the age of 18.
Sex Age Disaggregated Data (SADD)
Chart 2: Time series of number of Evacuation Centres hosting displaced persons since 15 April to 6 June
272
190178
0
50
100
150
200
250
300
15 April 27 April 6 June
Province Island Total inds Average HH Malampa* Ambrym 102 21 Penama Pentecost 402 84
Sanma
Aore 63 13 Araki 78 16 Malo 264 55
Mavea 24 5 Santo 5,285 1,101
Grand Total 6,218 1,295 *While the baseline for Ambrym was reported at 102 individuals, an additional 63 people were identified during the household level registration process, bringing Ambrym to a total of 165 individuals (as reported in Tables 2 and 3 below). Although Malekula was reported by key informants as not hosting any displaced people, the household level research did identify and register 11 individuals (2 households) in Malekula.
18%
18%
32%
25%
15%
18%
22%
24%
13%
14%
0% 5% 10% 15% 20% 25% 30% 35%
Evac
uatio
n Ce
ntre
sH
ost F
amili
es
50+ 30-49 19-29 6-18 Years -5 Years
19%
15%
30%
30%17%
21%
23%
13%
14%
0% 5% 10% 15% 20% 25% 30% 35%
Evac
uatio
n Ce
ntre
sH
ost F
amili
es
50+ 30-49 19-29 6-18 Years -5 Years
Chart 2: Sex and age breakdown for total reported displaced population (n=6,218 individuals)
Female - Age breakdown by site type Male - Age breakdown by site type
7
Map A: Location of Displaced Individuals in by Site Type (Evacuation Centres & Host Families)
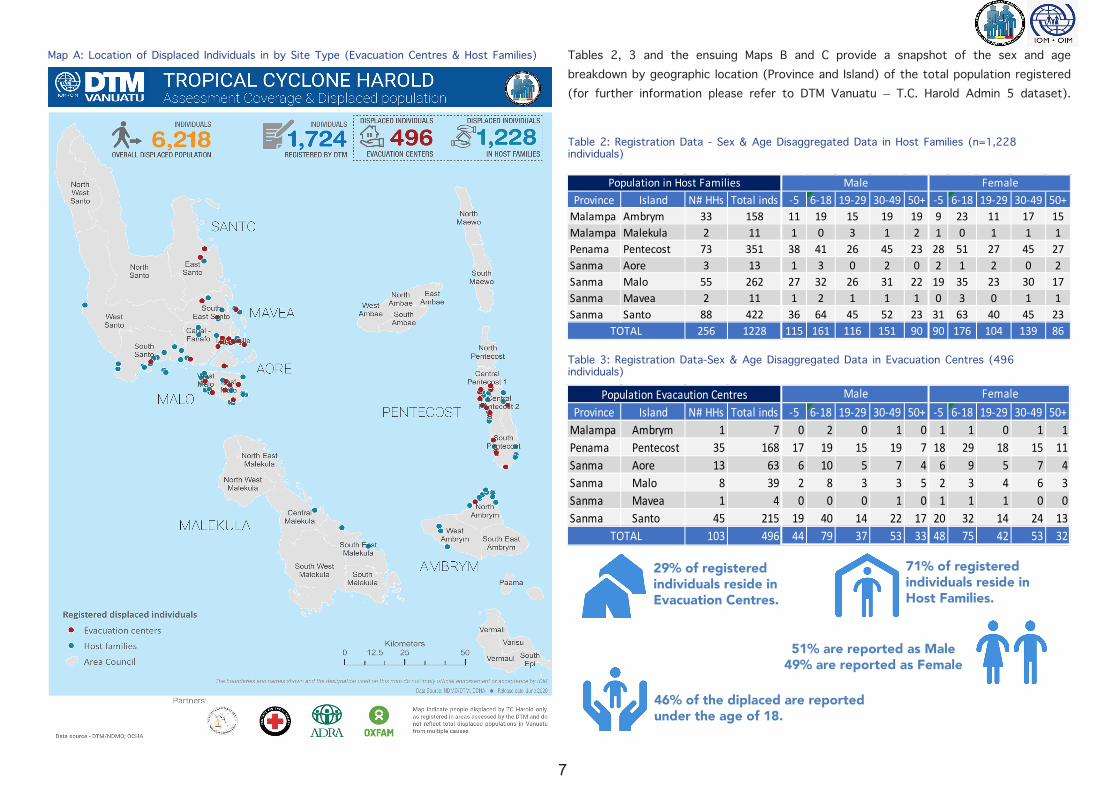
Province Island N# HHs Total inds -5 6-18 19-29 30-49 50+ -5 6-18 19-29 30-49 50+Malampa Ambrym 33 158 11 19 15 19 19 9 23 11 17 15Malampa Malekula 2 11 1 0 3 1 2 1 0 1 1 1Penama Pentecost 73 351 38 41 26 45 23 28 51 27 45 27Sanma Aore 3 13 1 3 0 2 0 2 1 2 0 2Sanma Malo 55 262 27 32 26 31 22 19 35 23 30 17Sanma Mavea 2 11 1 2 1 1 1 0 3 0 1 1Sanma Santo 88 422 36 64 45 52 23 31 63 40 45 23
256 1228 115 161 116 151 90 90 176 104 139 86
Population in Host Families FemaleMale
TOTAL
Province Island N# HHs Total inds -5 6-18 19-29 30-49 50+ -5 6-18 19-29 30-49 50+Malampa Ambrym 1 7 0 2 0 1 0 1 1 0 1 1Penama Pentecost 35 168 17 19 15 19 7 18 29 18 15 11Sanma Aore 13 63 6 10 5 7 4 6 9 5 7 4Sanma Malo 8 39 2 8 3 3 5 2 3 4 6 3Sanma Mavea 1 4 0 0 0 1 0 1 1 1 0 0Sanma Santo 45 215 19 40 14 22 17 20 32 14 24 13
103 496 44 79 37 53 33 48 75 42 53 32
Female
TOTAL
Population Evacaution Centres Male
Table 2: Registration Data - Sex & Age Disaggregated Data in Host Families (n=1,228 individuals)
Table 3: Registration Data-Sex & Age Disaggregated Data in Evacuation Centres (496 individuals)
Tables 2, 3 and the ensuing Maps B and C provide a snapshot of the sex and age breakdown by geographic location (Province and Island) of the total population registered (for further information please refer to DTM Vanuatu – T.C. Harold Admin 5 dataset).
51% are reported as Male49% are reported as Female
46% of the diplaced are reported under the age of 18.
29% of registered individuals reside in Evacuation Centres.
71% of registered individuals reside in Host Families.
8
Map B: Location of Individuals in Host Families Map C: Location of Individuals in Evacuation Centres
9
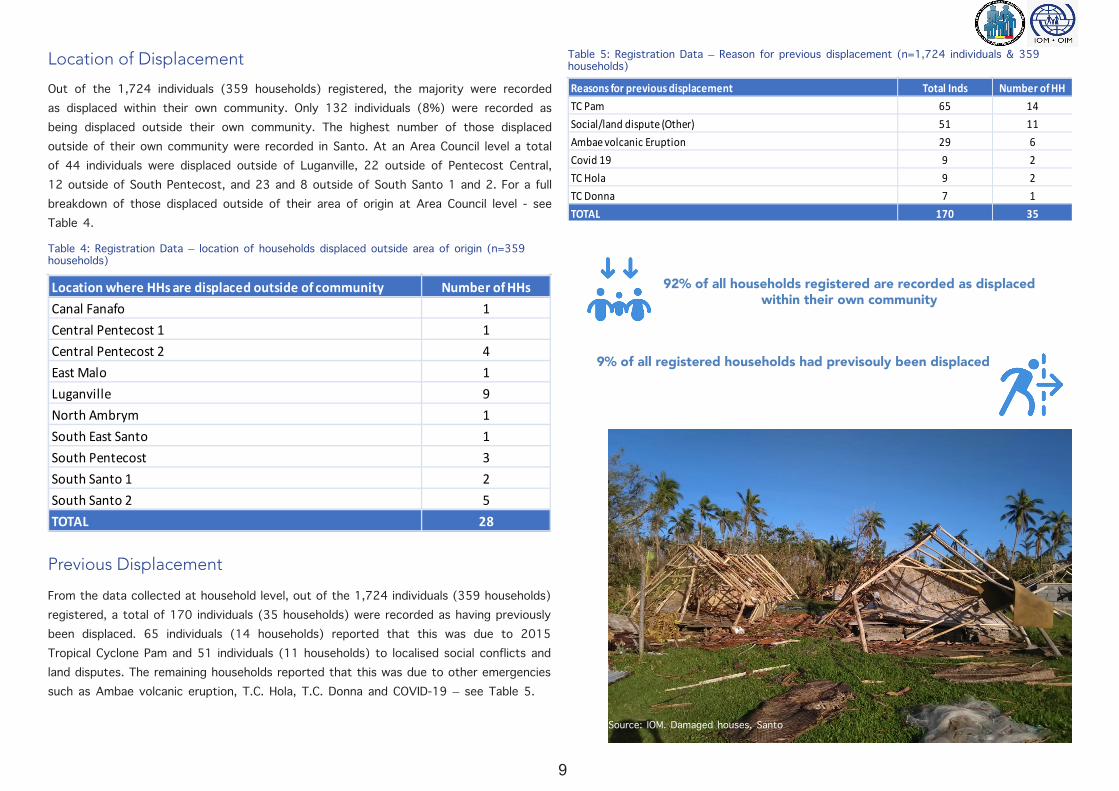
Location of Displacement
Out of the 1,724 individuals (359 households) registered, the majority were recorded as displaced within their own community. Only 132 individuals (8%) were recorded as being displaced outside their own community. The highest number of those displaced outside of their own community were recorded in Santo. At an Area Council level a total of 44 individuals were displaced outside of Luganville, 22 outside of Pentecost Central, 12 outside of South Pentecost, and 23 and 8 outside of South Santo 1 and 2. For a full breakdown of those displaced outside of their area of origin at Area Council level - see Table 4.
Table 4: Registration Data – location of households displaced outside area of origin (n=359 households)
Location where HHs are displaced outside of community Number of HHsCanal Fanafo 1Central Pentecost 1 1Central Pentecost 2 4East Malo 1Luganville 9North Ambrym 1South East Santo 1South Pentecost 3South Santo 1 2South Santo 2 5TOTAL 28
Previous Displacement
From the data collected at household level, out of the 1,724 individuals (359 households) registered, a total of 170 individuals (35 households) were recorded as having previously been displaced. 65 individuals (14 households) reported that this was due to 2015 Tropical Cyclone Pam and 51 individuals (11 households) to localised social conflicts and land disputes. The remaining households reported that this was due to other emergencies such as Ambae volcanic eruption, T.C. Hola, T.C. Donna and COVID-19 – see Table 5.
Table 5: Registration Data – Reason for previous displacement (n=1,724 individuals & 359 households)
Reasons for previous displacement Total Inds Number of HH TC Pam 65 14Social/land dispute (Other) 51 11Ambae volcanic Eruption 29 6Covid 19 9 2TC Hola 9 2TC Donna 7 1TOTAL 170 35
92% of all households registered are recorded as displaced within their own community
9% of all registered households had previsouly been displaced
Source: IOM. Damaged houses, Santo
10
45%
21%
19%
5%
1%9%
Widowed Pregnant Lactating
Seperated Family Unaccompanied Minor Orphan
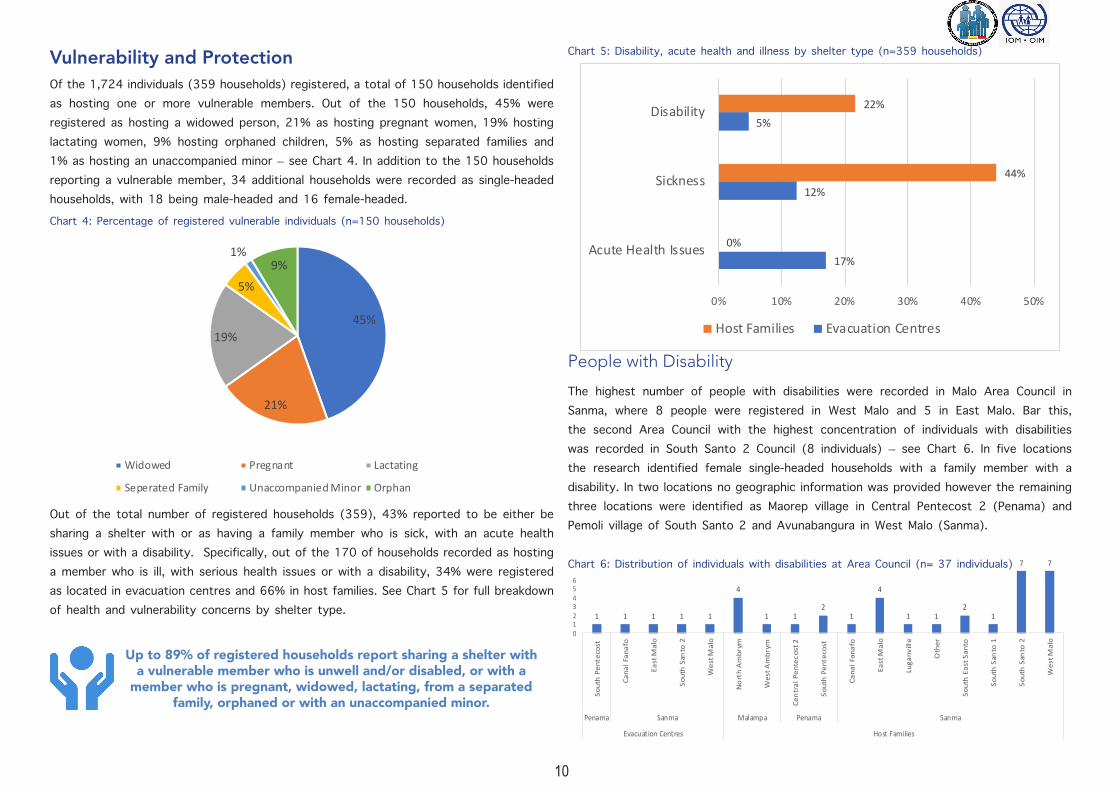
Vulnerability and ProtectionOf the 1,724 individuals (359 households) registered, a total of 150 households identified as hosting one or more vulnerable members. Out of the 150 households, 45% were registered as hosting a widowed person, 21% as hosting pregnant women, 19% hosting lactating women, 9% hosting orphaned children, 5% as hosting separated families and 1% as hosting an unaccompanied minor – see Chart 4. In addition to the 150 households reporting a vulnerable member, 34 additional households were recorded as single-headed households, with 18 being male-headed and 16 female-headed.Chart 4: Percentage of registered vulnerable individuals (n=150 households)
Out of the total number of registered households (359), 43% reported to be either be sharing a shelter with or as having a family member who is sick, with an acute health issues or with a disability. Specifically, out of the 170 of households recorded as hosting a member who is ill, with serious health issues or with a disability, 34% were registered as located in evacuation centres and 66% in host families. See Chart 5 for full breakdown of health and vulnerability concerns by shelter type.
Chart 5: Disability, acute health and illness by shelter type (n=359 households)
People with Disability
The highest number of people with disabilities were recorded in Malo Area Council in Sanma, where 8 people were registered in West Malo and 5 in East Malo. Bar this, the second Area Council with the highest concentration of individuals with disabilities was recorded in South Santo 2 Council (8 individuals) – see Chart 6. In five locations the research identified female single-headed households with a family member with a disability. In two locations no geographic information was provided however the remaining three locations were identified as Maorep village in Central Pentecost 2 (Penama) and Pemoli village of South Santo 2 and Avunabangura in West Malo (Sanma).
1 1 1 1 1
4
1 12
1
4
1 12
1
7 7
012345678
Sout
h P
ente
cost
Cana
l Fan
afo
East
Mal
o
Sout
h S
anto
2
Wes
t Mal
o
No
rth
Am
brym
Wes
t Am
brym
Cen
tral
Pen
teco
st 2
Sout
h P
ente
cost
Cana
l Fan
afo
East
Mal
o
Luga
nvill
e
Oth
er
Sout
h E
ast S
anto
Sout
h S
anto
1
Sout
h S
anto
2
Wes
t Mal
o
Penama Sanma Malampa Penama Sanma
Evacuation Centres Host Families
Chart 6: Distribution of individuals with disabilities at Area Council (n= 37 individuals)
17%
12%
5%
0%
44%
22%
0% 10% 20% 30% 40% 50%
Acute Health Issues
Sickness
Disability
Host Families Evacuation Centres
Up to 89% of registered households report sharing a shelter with a vulnerable member who is unwell and/or disabled, or with a
member who is pregnant, widowed, lactating, from a separated family, orphaned or with an unaccompanied minor.

11
Households with Individuals in Poor Health
South Santo 2 area council, of Santo Island, which hosts a total of 265 registered displaced individuals (52 households), recorded the greatest number of families with an ill individual (19). In total across all Provinces up to 94 individuals were recorded as being ill. The Area Councils with the greatest concentration of ill individuals in comparison to the total number of displaced were recorded as Area Councils of Luganville (Sanma), North Ambrym (Malampa) and Central Pentecost 2 (Penama). Each location which respectively hosts 203 individuals (42 households), 158 individuals (33 households) and 196 individuals (41 households) respectively reported 8%, 11% and 6% of the those displaced as currently being ill – see chart 7.
2
5
12
1111
1 1
67
1
3
1
7
2
6
19
8
0
2
4
6
8
10
12
14
16
18
20
North Ambrym South EastMalekula
West Ambrym CentralPentecost 1
CentralPentecost 2
South Pentecost Canal Fanafo East Malo East Santo Luganville South East Santo South Santo 1 South Santo 2 West Malo
Malampa Penama Sanma
Households with Family Members with Acute Health Conditions
No individuals with serious health conditions were registered as residing with host families. The highest concentration of individuals with acute health conditions were recorded in the Area Councils of Luganville (Sanma) and Central Pentecost 2 (Penama). Each location respectively recorded a total of 13 and 5 cases of individuals with acute health issues - see chart 8.
Chart 8: Distribution of individuals with acute health conditions by Area Council (n=29 individuals)
3
5
1 12 2
13
1 1
0
2
4
6
8
10
12
14
CentralPentecost 1
CentralPentecost 2
SouthPentecost
SouthPentecost
Canal Fanafo East Malo Luganville South Santo 2 West Malo
Penama Sanma
Child ProtectionPerceptions of child abuse relating to child marriage were reported in across 46 locations. These were highlighted across 25 locations in Sanma, 17 Penama and 4 Malampa (see Chart 9). The primary reasons provided as to why child marriage was prevalent was attributed to cultural practices, exchange of land, money and to retain family linage – see Chart 10.
Chart 7: Number of identified individuals with sick family member (n=94 individuals)
Chart 9: Distribution of reported concerns of child marriage by Area Council (n=46 cases of reported child marriage)
1
4
211 1
6
1
4
1
4
16
2
0
2
4
6
8
10
12
14
16
18
CanalFanafo
CentralPentecost 1
CentralPentecost 2
East Malo NorthAmbrym
SouthPentecost
South Santo1
South Santo2
West Malo
Evacuation Centres Host Families
7% of all registered households reported sharing shelter with an individual with acute health conditions, 11% with a disabled
individual and 24% with an inividual who is ill.

12
Chart 10: Reasons provided for reported cases of child marriage by Area Council (n=46 cases of reported child marriage) Multisectoral Needs Overview
Based on the household registration data, protection (including access to privacy, light, personal space, fear of social conflicts and poor sanitation) was recorded as the most pressing area of intervention for those currently displaced (52%), as explained further in the sections that follow. Lack of access to food was also recorded as the most urgent area of intervention for those displaced (37%) – see Chart 11 and 12 for breakdown by site type and geographic location.
Chart 11: Primary needs as reported by individuals by site type (n=1,724 individuals)
24%
0%
55%
3%18%
Lack of Food Lack of Health Lack of Protection
Lack of WASH Other
36%
1%42%
1%
21%
Lack of Food Lack of Health Lack of Protection
Lack of WASH Other
Primary needs in Evacuation Centres Primary needs in Host Families
52% of households reported protection in terms of acess to privacy, areas with sufficient lighting, access to hygienic areas and fear of social tension as a major
priority.
Lack of sustained access to food was reported a major priority for 37% of households displaced.
Up to 53% of all locations are recorded as not having access to safe drinking water.
2
1
3
2
1 1
4
9
11 1 1
4
3
1
3
2
3
1 1 1
0
1
2
3
4
5
6
7
8
9
10
NorthAmbrym
CentralPentecost
1
CentralPentecost
2
SouthPentecost
SouthPentecost
CanalFanafo
East Malo SouthSanto 1
SouthSanto 2
West Malo
Malampa Penama Sanma
Cultural practice For land Money Retain family lineage
Source: IOM. Women collecting water, Tasiriki, Santo

13
Water Sanitation and Hygiene (WASH)
Across all shelter types, access to safe drinking water was noted as a cause for concern. Up to 53% of all locations recorded households as not having access to safe drinking water. When disaggregated by site type, those currently located in host families were recorded to have the least access, with up the 55% recording not having sustained access to drinking water - see Chart 13 and 14. Noting that households currently located in host families were recorded as having the least access to safe drinking water, the Area Councils of most concern were flagged as Santo and Pentecost which both respectively reported that up to 69% and 50% of the displaced population did not have access to safe drinking water.
A positive correlation was recorded in terms of access to latrines and hygiene services. Although the latrines in all locations were recorded as being mixed (i.e. not segregated between male and female) in all locations all respondents reported to have access to latrines that were less than 20 minutes (walking) from the location where they are currently residing.
Chart 12: Primary needs by site type and Province (n=390 site type)
15 8 8
17
48
3 1
26
4
1811
65
1 3 1 1 10
10
20
30
40
50
60
70
80
90
100
EvacuationCentres
Host Families EvacuationCentres
Host Families EvacuationCentres
Host Families
Malampa Penama Sanma
Lack of Food Lack of Health Lack of Protection Lack of WASH Other
Chart 13: Access to water by site type (n= 390 site type)
48% 52%55%45%
0%
20%
40%
60%
80%
100%
No Yes
Evacuation Centres Host Families
0
10
20
30
40
50
60
70
80
90
100
Ambr
ym
Aore
Mal
o
Mav
ea
Pent
ecos
t
Sant
o
Ambr
ym
Aore
Mal
ekul
a
Mal
o
Mav
ea
Pent
ecos
t
Sant
o
Evacuation Centres Host Families
No
Yes
Chart 14: Access to water by site type and Island (=390 site type)
Health
Across all locations the majority reported having access to health services, except in 24 communities in Malampa, 31 in Penama and 54 in Sanmna. The Villages with the least access to health care were recorded as Falibour in Malampa, Bunlap in Penama and Nakere in Sanma - see Chart 15 for geographic breakdown of locations reporting no access to health services.

14
Chart 15: Number of locations with no access to health services (n=8 Province)
23
1
31
8
2
44
0
5
10
15
20
25
30
35
40
45
50
Ambrym Malekula Pentecost Malo Mavea Santo
Malampa Penama Sanma
EducationOf the communities/villages hosting displaced households with children who do not have access to school, the majority were located in Santo and Pentecost. In total up to 62% of the assessed locations reported that children do not have access to education, with those displaced in host family settings reporting to have the least access (67%) – see Chart 16 and 17 for access to school by site type and geographic location.
Chart 16: Access to school by site type (n=390 site type)
43%
57%
No Yes
67%
33%
No Yes
Access to school for HHs in Evacuation Centres
Access to school for HHs in Host Families
Source: Vanuatu Department of Water Resources. Water being reconnected in Pentecost.

15
67%
33%
No Yes
Chart 17: Total number of locations with no access to school (n=390 site type)
1
36
19
1
40
49
6
72
4
60
2
103
0
20
40
60
80
100
120
Ambrym Pentecost Aore Malo Mavea Santo Ambrym Malekula Pentecost Aore Malo Mavea Santo
Malampa Penama Sanma Malampa Penama Sanma
Evacuation Centres Host Families
Chart 18: Reason for not being able to access to school (n=390 site type)
14%
69%
9%
1%7%School is closed
School is destroyed
School is too distant
Lack of finance to pay forschool
Other
The reasons provided as to why children cannot access school was due to schools either being closed or damaged/destroyed by the cyclone and as such have not re-opened – see chart 18.
Safety and Security
Out of all the locations assessed, 22 reported serious protection concerns in term of safety and security and child protection. Out of the 22 locations that reported serious safety and security protection concerns, the majority were related to violence followed by theft, child protection and sexual harassment – see Chart 19 and 20 for safety and security concerns by site type and geographic location.
Chart 19: Safety and security concerns in Evacuation centres and Host Families (n=90 evacuations centres and 301 host families)
33%
33%
11%
22%
Violence Theft Sexual harassment Child protection issues
45%
33%
6%
16%
Violence Theft Sexual harassment Child protection issues
Safety and security concerns for HHs in Evacuation Centres
Safety and security for HHs in Host Families

16
Chart 20: Safety and security concerns by Island (n=7 Islands)
92%
17%
50%
36%
45%
0%
55%
0%
57%
18%
0%
10%
0% 0%
12%8%
17%
50%
7%
25%
0%
10%
20%
30%
40%
50%
60%
70%
80%
90%
100%
Ambrym Malo Mavea Pentecost Santo
Violence Theft Sexual harassment Child protection issues
72% of households reported to have access to health services, with 45% stating that health services are less than
20 minutes walking distance.
62% of registered households report children as not having access to schools.
32% of registered households reported safety and security concerns (theft, violence, sexual harassment and child
protection concerns)
Durable Solutions
Damage to Housing
Making reference to the assessment’s findings that the majority of those currently displaced are recorded as intending to return to their homes within the next month, the majority (70%) also reported their home had been completely destroyed. Homes located in West and East Malo were reported as having some the most extensive damage with the majority of houses reported as being 100% destroyed. Other locations such as South Pentecost reported a more varied situation with 39 communities reporting homes being completely destroyed and a lesser number of communities (19) reporting homes to be a damaged up to 50% – see Chart 21. Compounding this finding is that up to 93% of the displaced population do not have insurance and are dependent on assistance to rebuild their homes. It is important to note that at the time the research was conducted most of these households had begun re-building their houses to varying degrees.
Source: IOM. Damaged building in Melsisi, Pentecost.

17
Chart 21: Percentage of destruction of house by Area Council (n=390 Area Council)
0% 10% 20% 30% 40% 50% 60% 70% 80% 90% 100%
Canal Fanafo
Central Malekula
Central Pentecost 1
Central Pentecost 2
East Malo
East Santo
Luganville
North Ambrym
South East Malekula
South East Santo
South Pentecost
South Santo 1
South Santo 2
West Ambrym
West Malo
100% 25% 50%
Current Length of Displacement
Across both location site types (Evacuation Centres and Host Families) where displaced households were registered, all reported that the majority had been displaced for over a month (93% in Evacuation Centres and 82% in Host Families). Similarly, across all locations site types and geographic locations, the majority reported an intention to remain in their current locations for more than a month. However, those displaced were also noted as seeking solutions to their displacement and did not intend to remain in the location for a protracted period.
Up to 85% of all households registered reported having been displaced for over 1 month.
Return IntentionsUp to 93% (1,596 individuals) of all displaced people registered by the research reported an intention to return to their area of origin and only 7% intended not to return to their area of origin. The main reasons provided as to why the households would not return to their area of origin was due to their house being destroyed. However other issues such as lack of access to financial support and access to food, water and other multisectoral services were reported – see Chart 22.
Chart 22: Reasons for not returning to area of origin (n=1,724 individuals)
39%
30%
24%
5%2%
0%
5%
10%
15%
20%
25%
30%
35%
40%
45%
Housecompletelydestroyed
Lack offinance
Require moreassistance
(Other)
Lack of food Lack of water
93% of households registered intend to return to their area of origin.
Non Food Items (NFI) were reported as the primary need to support households return to area of origin.
Up to 70% of all those reached and registered reported their homes to have been completely destroyed.

18
Out of those who provided answers, cash and non-food items (NFI) support were highlighted as some of the primary requirements to ensure a sustained return (durable solutions) – see Chart 23.
30%
10%
59%
0%
10%
20%
30%
40%
50%
60%
70%
80%
90%
100%
Cash Food NFI
Chart 23: Reported needs for sustained return to area of origin (n=1,724 individuals)
Funded by CERF:
Developed in coordination with Vanuatu National Disaster Management Office (NDMO) and the International Organization for Migration (IOM), and collaboration with Vanuatu Red Cross (VRC), Vanuatu Christian Council (VCC), Adventist Development and Relief Agency (ADRA) and Oxfam.