dispersal routes of tiger and other wildlifedispersal routes of tiger and other wildlife in the...
TRANSCRIPT
DISPERSAL ROUTES OF TIGER AND OTHER WILDLIFE
IN THE BUFFER ZONE OF BANDHAVGARH TIGER RESERVE, MADHYA PRADESH, INDIA
A REPORTNovember 2018

Principal Investigator Dr. Sharad Kumar, Kedar Gore
Research Fellows Tahir Ali Rather, Shaizah Tajdar
© The Corbett Foundation. 2018. No part of this report may be used, reproduced or transmitted in any
form (electronic and print) for commercial purposes. This report is meant for educational purposes only, and can be reproduced or transmitted electronically or in print with due credit to The Corbett Foundation.
Recommended citation Kumar, Sharad; Gore, Kedar; Rather, Tahir Ali; Tajdar, Shaizah. Dispersal routes of tigers and other wildlife in the buffer zone of
Bandhavgarh Tiger Reserve, Madhya Pradesh, India. The Corbett Foundation.

DISPERSAL ROUTES OF TIGER AND OTHER WILDLIFE
IN THE BUFFER ZONE OF BANDHAVGARH TIGER RESERVE, MADHYA PRADESH, INDIA
Principal Investigator Dr. Sharad Kumar
Kedar Gore
Research Fellows Tahir Ali Rather Shaizah Tajdar
November 2018
The Corbett Foundation
Admin Office: 81-88, Atlanta, 8th floor,
Vinay K. Shah Marg, Nariman Point, Mumbai 400021
Bandhavgarh Office:
Village Bijhariya, P.O. Tala Bandhavgarh, District Umaria, Madhya Pradesh 484664
Email: [email protected]: www.corbettfoundation.org
4 © The Corbett Foundation
CHAPTER 1 PROJECT OVERVIEW 9-121.1 Introduction 101.2 Objectives 111.3 Summary 11
CHAPTER 2 STUDY AREA 13-202.1 Location 142.2 Flora 142.3 Fauna 152.4 Elevation and aspect 162.5 Drainage 162.6 Climate 16
CHAPTER 3 DISPERSAL ROUTES OF TIGER & LEOPARD 21-283.1 Introduction 223.2 Field methods 233.3 Statistical analysis 243.4 Results 243.5 Discussion 25
CHAPTER 4 FOOD HABITS OF TIGER & LEOPARD 29-404.1 Introduction 304.2 Scat collection and identification 304.3 Hair reference collection 314.4 Scat and hair standardization 31
TABLE OF CONTENTS
5© The Corbett Foundation
4.5 Data analysis 364.6 Relative biomass and relative number of prey consumed 374.7 Results 374.7.1 Diet composition of Tiger 384.7.2 Diet composition of Leopard 384.8 Discussion 39
CHAPTER 5 DENSITY & BIOMASS OF MAJOR PREY SPECIES
41-50
5.1 Introduction 425.2 Methods 425.2.1 Line transect 425.2.2 Road transects 425.3 Analysis 435.4 Biomass estimation 435.5 Population structure 435.5 Results of line transect survey 445.6 Results of road transect survey 445.7.1 Northern Plains Langur 445.7.2 Chital 455.7.3 Blue Bull (Nilgai) 455.7.4 Indian Wild Boar 465.7.5 Indian Gazelle (Chinkara) 465.7.6 Indian Peafowl 465.7.7 Red Jungle Fowl 475.7.8 Sambar 475.7.9 Barking Deer 475.7.10 Livestock (Cattle) 475.8 Discussion 48
CHAPTER 6 POPULATION OF MAJOR CARNIVORE SPECIES
51-58
6.1 Introduction 526.2 Camera trapping 526.3 Results 536.4 Photographic index rate of major carnivore species 546.4.1 Tiger 546.4.2 Leopard 546.4.3 Sloth Bear 546.4.4 Golden Jackal 546.4.5 Indian Fox 556.4.6 Jungle Cat 55
6 © The Corbett Foundation
6.4.7 Asiatic Wildcat 556.4.8 Small Indian Civet and Palm Civet 556.4.9 Indian Grey Wolf 556.4.10 Indian Grey Mongoose and Ruddy Mongoose 556.5 Discussion 58
CHAPTER 7 VEGETATION STRUCTURE & COMPOSITION 59-667.1 Introduction 607.2 Methods 617.3 Analysis 617.4 Results 627.4.1 Species composition and density of different
Tree species in Sal habitat62
7.4.2 Species composition, density of different tree species in mix forest
63
7.4.3 Species composition and density and of different trees species in Sal miscellaneous forest
64
7.4.4 Species composition and density of different tree species in scrub habitat
65
7.5 Important value index of all tree species in the buffer zone of the BTR
66
CHAPTER 8 THREATS, LIMITATIONS & RECOMMENDATIONS
67-73
8.1 Introduction 688.2 Major threats 688.2.1 Forest fires 688.2.2 Livestock grazing 698.2.3 NTFP and firewood collection 698.2.4 Habitat degradation and fragmentation 698.2.5 Tiger mortality 708.3 Limitations 708.3.1 Lack of training 708.3.2 Lack of facilities 708.3.3 Frequent transfer of field directors 708.4 Recommendations 71
REFERENCES 74-80APPENDICES 81-88
7© The Corbett Foundation
S.NO FIGURES, GRAPHS AND TABLES PG.NO
Figure 2a Location of the Bandhavgarh Tiger Reserve (BTR) 17Figure 2b Aspect map of BTR 18Figure 2c Digital elevation map of BTR 19Figure 2d Drainage system of the BTR 20Figure 3a Map showing the two potential ecological corridors between
BTR and Sanjay-Dubri TR23
Figure 3b Map showing the hotspot areas of tiger in the buffer zone of BTR 27Figure 3c Map showing the hotspot areas of leopard in the buffer zone of BTR 28Figure 4a Spatial distribution of Tiger and Leopard scats in the buffer
zone of BTR33
Figure 4b Minimum number of hair samples per scat required to assess the diet of Tiger
34
Figure 4c Minimum number of scats required to assess the diet of Tiger 34Figure 4d Minimum number of hair samples per scat required to assess
the diet of Leopard35
Figure 4e Minimum number of scats required to assess the diet of Leopard 35Figure 6a Map showing the distribution of camera trap location
in the buffer zone of the BTR56
Figure 6b Map showing the capture locations of Leopard and Tiger in the buffer zone of the BTR
57
Graph 7 Graph showing the IVI value of major tree species in the buffer zone of BTR
66
Table 4a Frequency of occurrence (A), percent occurrence (R), relative biomass consumed (D) and relative number of prey individuals consumed (E) by Tiger
38
Table 4b Frequency of occurrence (A), percent occurrence (R), relative biomass consumed (D) by Leopard
39
Table 5a Density of potential prey species during winter and summer (2017-2018) in the buffer zone of BTR derived from line transect survey
44
Table 5b Density of potential prey species during winter and summer (2017-2018) in the buffer zone of BTR derived from road transect survey
49
Table 5c Mean cluster size of potential prey species during winter and summer (2017-2018) in the buffer zone of BTR
50
Table 5d Biomass estimates of major prey species of Tiger and Leopard in the buffer zone of BTR
50
Table 7.1 Density of different tree species in sal dominated forest 62Table 7.2 Density of different tree species in mix forest 63Table 7.3 Species composition and density and of different tress species in
Sal miscellaneous forest 64
Table 7.4 Species composition and density and of different tress species in scrub
65
FIGURES, GRAPHS & TABLES

8
AcknowledgementsThis study is a result of collective efforts, guidance, support and enthusiasm of many people who voluntarily contributed their time, efforts and suggestions to make this work possible. We are greatly indebted to the Forest Department of Madhya Pradesh for giving us permission to carry out this work in Bandhavgarh Tiger Reserve. We are grateful to the PCCF (Wildlife), Madhya Pradesh who very kindly granted his permission for this study. We are very thankful to former Field Director of (Bandhavgarh Tiger Reserve) Shri Raman K. Srivastava for his help and support. We express our deep gratitude towards the current Field Director of Bandhavgarh Tiger Reserve, Shri Mridul Kumar Pathak for his support, encouragement and guidance.
We thank Shri Dilip D. Khatau (Chairman, The Corbett Foundation) for his support and encouragements.
The Corbett Foundation expresses its deepest gratitude to its Scientifc Advisors, Dr. A.J.T. Johnsingh and Dr. Asad Rahmani, for their valuable guidance and inputs in compilation of this report.
We are highly obliged to Professor Jamal A. Khan, Department of Wildlife Sciences, Aligarh Muslim University, Aligarh for his guidance.
We wish to place on record our sincere thanks to all team members namely Shri Ramsajeevan Baiga, Shri Rajendera Prasad Yadav, Shri Rakesh Gond, Shri Dheer Singh for their hard work in field. We appreciate the courtesy of other staff members of The Corbett Foundation specially Dr. Gyanendra Prajapati and Miss Kamlesh Singh Atri who always supported and encouraged us. Special thanks to the frontline forest staff of Bandhavgarh Tiger Reserve who worked with us and offered their help at the time of camera trapping and their help and experience proved very helpful for the proper placement of camera traps in the field.
Photos courtesy: Kedar Gore, Krupa Patil, Santosh Saligram, Nick Garbutt, Arvindrama Murthy, Anil Kumar.All photos used in this report are for indicative purpose only. Images may be subject to copyright.
CHAPTER 1: PROJECT OVERVIEW 9© The Corbett Foundation
Chapter 1
PROJECT OVERVIEW
CHAPTER 1: PROJECT OVERVIEW10 © The Corbett Foundation
1.1 INTRODUCTION Dispersal is one of the critical stages in the life history of animals as it plays an important
role in shaping the population dynamics, genetic structure, inbreeding depressions, movement
and continuity among sub-populations (Gour et al., 2013). Dispersal involves leaving the natal
area which increases the chances of mortality due to various factors. The first comprehensive
study of dispersal in tigers (Panthera tigris) was carried in Royal Chitwan National Park, Nepal
where 36 adult and young tigers were monitored over the period of 10 years (Smith 1993). The
study showed that males dispersed farther than females and settled in poorer habitats prior to
establishing post-dispersal territories. The females however settled in territories next to their
mother’s. In India, the studies carried in Pench Tiger Reserve, Madhya Pradesh also point to
the similar results of male-biased dispersal and philopatry in tigers (Gour et al., 2013).
A recent genetic study by Mondol, Bruford, & Ramakrishnan (2013) has shown the
loss of genetic variants and increased genetic differentiation among tiger populations in India.
Such a loss of genetic diversity is ascribed to the ongoing habitat fragmentation and increased
dis-connectivity among tiger sub-population. The persistence of wide-ranging carnivores such
as tiger, which is now restricted to the fragmented habitats, depends mostly on the mosaic
of quality of the habitat and the ability of the individuals to move among fragmented habitat
patches. For many species, once the widespread, suitable habitat is now reduced so that many
populations have become small and isolated as a result of habitat fragmentation. Once a
population declines to a small effective size, the probability of local extinction increases due
to demographic and environmental stochasticity coupled with inbreeding depression and loss
of genetic variability. Tigers now occupy only 7% of their former global range (Mondol et
al., 2013) and therefore, the application of demographic and genetic management to enhance
the remaining populations is a priority. Ensuring population persistence requires that habitats
remain suitable for tiger movement, and source sites of tiger populations are secured within
them. Since dispersal is driven by a large number of ecological, behavioral, geographical,
socioeconomic and genetic factors, it is thus necessary to understand the basic ecology of
dispersal and factors governing dispersal e.g. density and distribution of prey species (density-
mediated dispersal), habitat conditions, prey availability, sexual structure and composition of
population. A study of genetic analysis in combination with landscape permeability models to
identify and prioritize movement corridors across seven tiger populations within the Central
Indian Landscape showed that the covariates that best explained tiger occupancy were large,
remote, dense forest patches, large ungulate abundance, and low human footprint (Yumnam et

CHAPTER 1: PROJECT OVERVIEW 11© The Corbett Foundation
al., 2014). Based on this broader aspect of the project, we started the survey in the buffer zone
of the BTR from January 2016 and continued it till March 2018. We collected data on various
ecological aspects that are known to govern the density, distribution and movement patterns of
large carnivores with the following specific objectives.
The main aim of this study was to prioritize the areas of high animal presence
and identify the probable dispersal routes for tiger (Panthera tigris) and leopard
(Panthera pardus) in the buffer zone of Bandhavgarh Tiger Reserve (BTR henceforth).
1.2 OBJECTIVES • To identify and prioritize the probable dispersal routes used by tiger and leopard for
daily activity movements
• To estimate the density and biomass of major prey species in the buffer zone of BTR
• To study the food habits and quantify the biomass consumption by tiger and leopard
• To generate population indices of tiger and leopard in the buffer zone of BTR
• To quantify the vegetation structure in the buffer zone of BTR
1.3 SUMMARYThe project entitled “Dispersal routes of tiger and other wildlife in the buffer zone of
Bandhavgarh Tiger Reserve, Madhya Pradesh” was initiated by The Corbett Foundation (TCF
henceforth) in the year 2016. The main objectives of the project were to delineate the dispersal
routes used by tiger and leopard in the buffer zone of the reserve, to estimate the density of
major prey species, to determine the food habits of tiger and leopard, to generate population
indices of carnivores and to quantify the vegetation structure.
We used hotspot analysis to prioritize areas of tiger and leopard hotspots in the buffer
zone (Chapter 3). Two major routes of higher tiger movement within the buffer zone were
delineated. Leopards were spatially segregated from tigers and used more hilly terrains in
comparison to the tiger.
We used line and road transect survey to derive the prey density estimates in the buffer
zone. A total of 12 line transects were chosen and each transect had an equal length of 2km. All
the transects were sampled three times every season (summer and winter) for two years, giving
the total sampling effort of 288km for two years. We also sampled prey population using road
transects, we established five road transects. The length of the road transects varied from 10-14
CHAPTER 1: PROJECT OVERVIEW12 © The Corbett Foundation
km. Each road transect was sampled three times every season giving the total sampling effort
of 720km. The density estimates were calculated using program DISTANCE version 7.
Among wild ungulates, chital (Axis axis) had the highest density of 23.15±3.57 per km2
in winter and 19.42±4.17/km2 in the summer season. Overall, cattle had the highest densities
of 76±11.06 km2 and 89.90±14.89 km2 in winter and summer respectively. The continuous
movement of people and livestock in the buffer zone presented difficult conditions for collecting
data. The detections along the line transects were severely hindered with the continuous human
intervention in the buffer zone.
We collected 90 scats each of tiger and leopard for the estimation of food habits. Chital
had the highest frequency of occurrence (40%) in the scats of the tiger but provided only (20%)
of the biomass to the tiger. The frequency of occurrence of cattle was (34.44%) and contributed
(47%) of the biomass to the tiger. In case of leopard the cattle provided (50%) of the biomass
and chital provided only (19.48%) of the biomass to the leopard.
We recorded 29 mammalian species out of 35 listed species in BTR. Asiatic wildcat
(Felis silvestris ornata) and smooth-coated otter (Lutrogale perspicillata) were recorded for the
first time in BTR during this study. Indian guar (Bos gaurus), rusty-spotted cat (Prionailurus
rubiginosus) and fishing cat (Prionailurus viverrinus) were not recorded in camera traps,
suggesting their restrictive distribution in the core zone of the reserve.
We used 10 m radius circular plot laid at equal intervals of 250 m along foot transects
for calculating tree densities. Importance Value Index (IVI) values of major tree species in
different habitat types were also calculated.
CHAPTER 2: STUDY AREA 13© The Corbett Foundation
Chapter 2
STUDY AREA
CHAPTER 2: STUDY AREA14 © The Corbett Foundation
2.1 LOCATIONThe study was carried in the buffer zone of Bandhavgarh Tiger Reserve (BTR) that lies
between 230 27’ 00’’ to 230 59’ 50” North latitude and 800 47’ 75” to 810 15’ 45” East longitude.
The core area of BTR consists of Bandhavgarh National Park and Panpatha Wildlife Sanctuary
covering 716 km2 and the surrounding buffer includes 820 km2 adding up to 1536 km2 as the
total area of the reserve. The buffer zone has three administrative zones - Manpur, Dhamokhar,
and Panpatha. The reserve falls in the districts Umaria, Katni and Shahdol of Madhya Pradesh
(Fig 2a, pg 17).
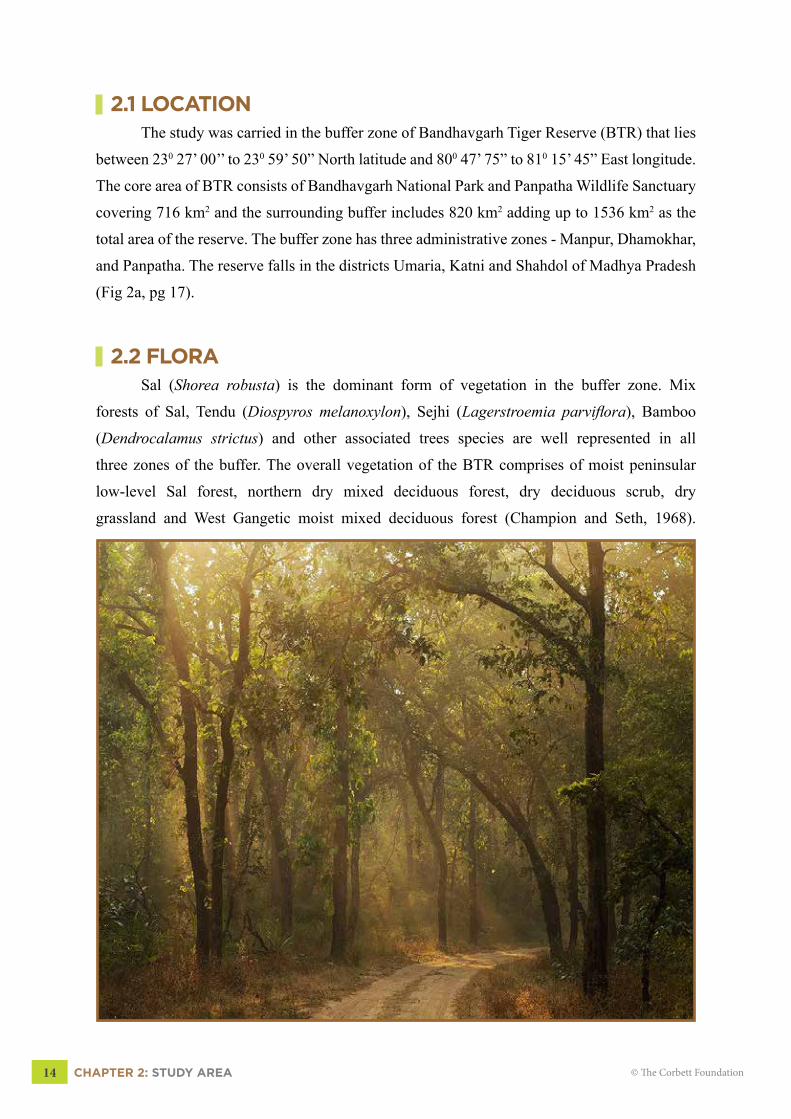
2.2 FLORA Sal (Shorea robusta) is the dominant form of vegetation in the buffer zone. Mix
forests of Sal, Tendu (Diospyros melanoxylon), Sejhi (Lagerstroemia parviflora), Bamboo
(Dendrocalamus strictus) and other associated trees species are well represented in all
three zones of the buffer. The overall vegetation of the BTR comprises of moist peninsular
low-level Sal forest, northern dry mixed deciduous forest, dry deciduous scrub, dry
grassland and West Gangetic moist mixed deciduous forest (Champion and Seth, 1968).

CHAPTER 2: STUDY AREA 15© The Corbett Foundation
2.3 FAUNAThe Bandhavgarh Tiger Reserve has a diverse assemblage of wildlife. Apart from the
tiger, major carnivore species are Common Leopard (Panthera pardus), Jungle Cat (Felis
chaus), Rusty-spotted Cat (Felis rubiginosa), Honey Badger or Ratel (Mellivora capensis),
Golden Jackal (Canis aureus), Indian Fox (Vulpes bengalensis), Grey Mongoose (Herpestes
edwardsii) and Ruddy Mongoose (Herpestes smithii). Two new smaller cat species, Asiatic
Wildcat (Felis silvestris ornata) and Fishing Cat (Prionailurus viverrinus) along with smooth-
coated otter (Lutrogale perspicillata) were recently reported from BTR. Asiatic Wildcat and
Smooth-coated Otter were reported during this study and Fishing Cat was reported in the core
zone of BTR during the camera trap survey conducted jointly by the Forest Department and
Wildlife Institute of India.
Major ungulates of BTR are Chital (Axis axis), Sambar (Rusa unicolor),
Nilgai (Boselaphus tragocamelus), Chinkara (Gazella gazelle), Indian wild
Pig or Wild Boar (Sus scrofa), Barking Deer (Muntiacus muntjak), Indian
Gaur (Bos gaurus) and Northern Plains Langur (Semnopithecus entellus).
The reserve also harbors more than 250 species of birds including three Critically
Endangered vulture species, Indian Vulture (Gyps indicus), White-rumped Vulture (Gyps
bengalensis) and Red-headed Vulture (Sarcogyps calvus) and globally endangered Egyptian
Vulture (Neophron percnopterus).
Chital Sambar Indian Gaur
Indian VultureLangurs
CHAPTER 2: STUDY AREA16 © The Corbett Foundation
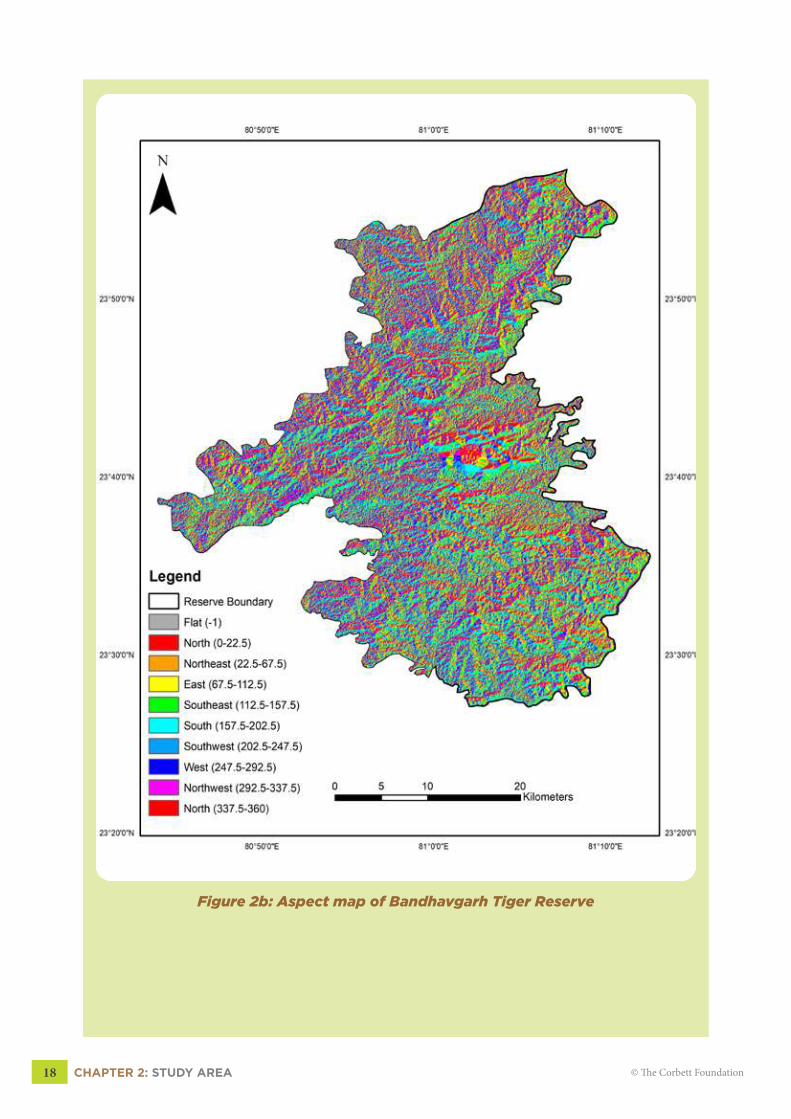
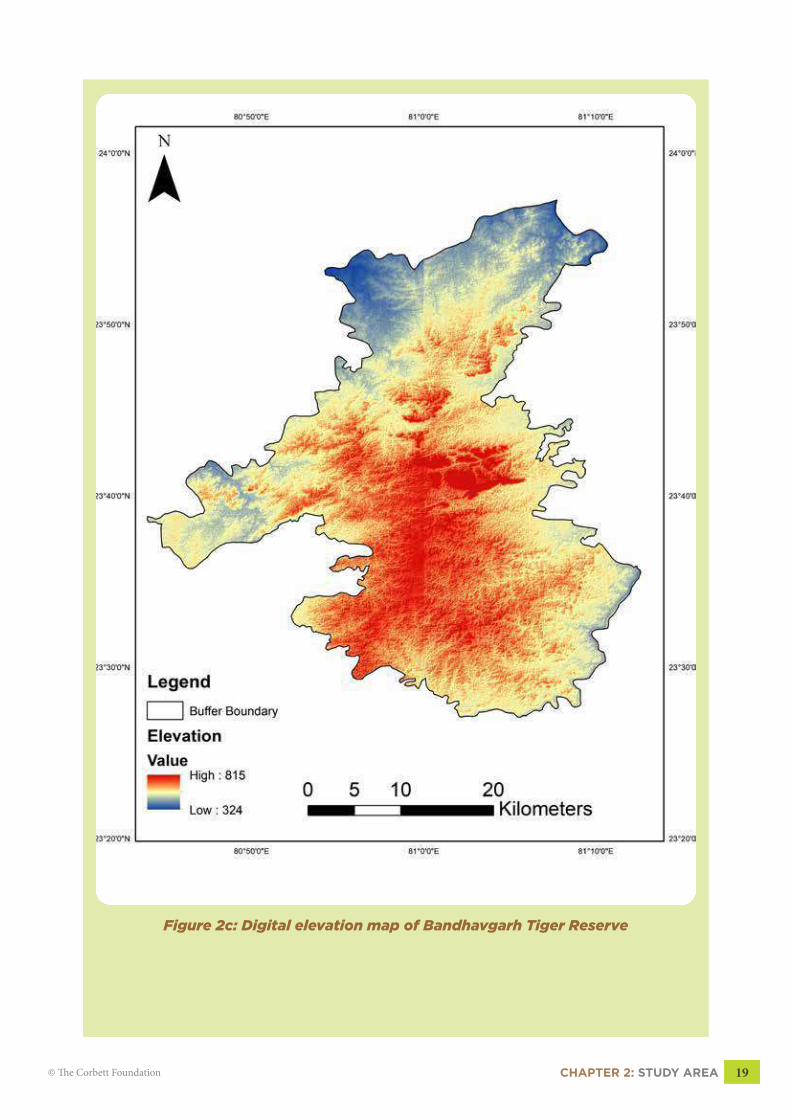
2.4 ELEVATION AND ASPECTThe terrain is the mosaic of both the flat and hilly surfaces which leads to the horizontal
heterogeneity in habitat features (Fig 2b, pg 18). The elevation ranges from 324-815 meters
above mean sea level (MSL) with a mean elevation of 570m MSL (Fig 2c, pg 19).
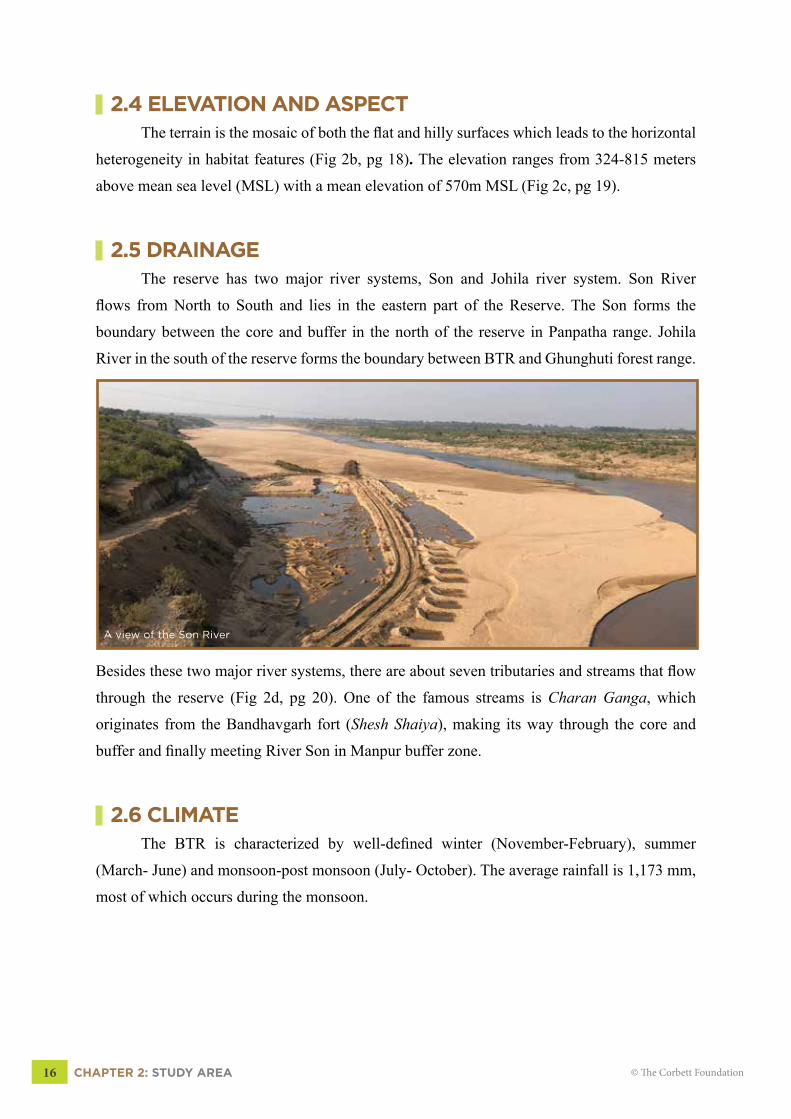
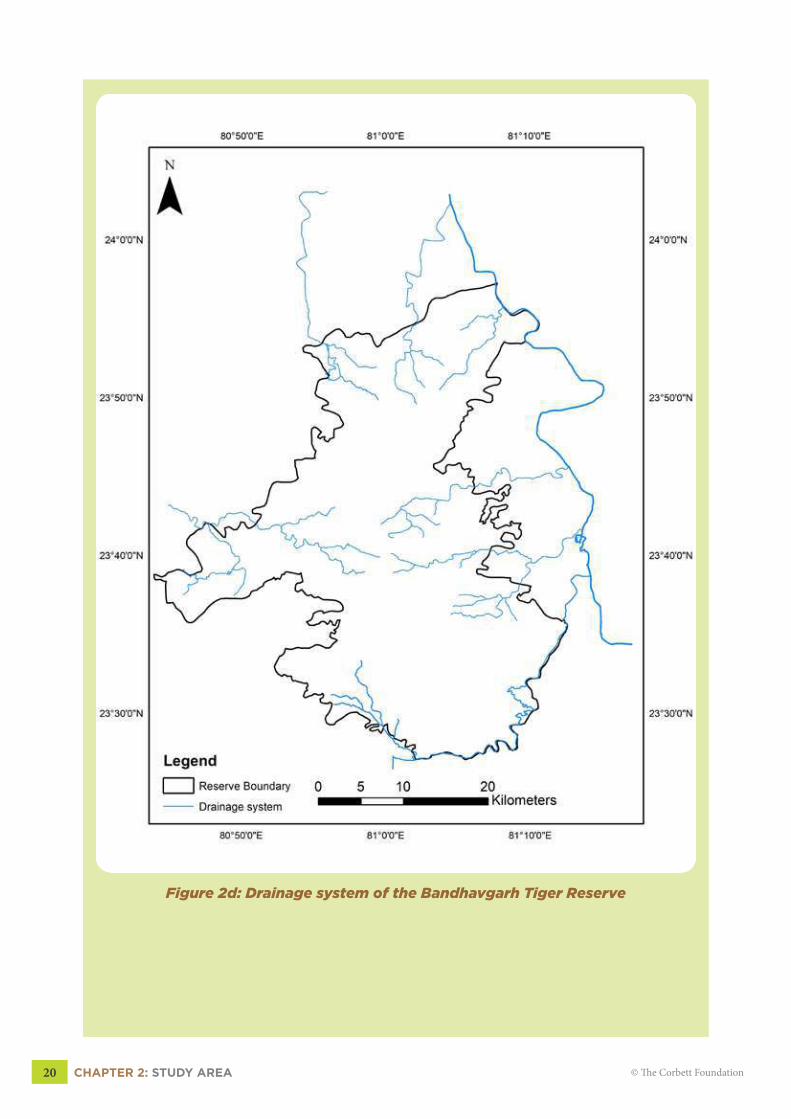
2.5 DRAINAGEThe reserve has two major river systems, Son and Johila river system. Son River
flows from North to South and lies in the eastern part of the Reserve. The Son forms the
boundary between the core and buffer in the north of the reserve in Panpatha range. Johila
River in the south of the reserve forms the boundary between BTR and Ghunghuti forest range.
Besides these two major river systems, there are about seven tributaries and streams that flow
through the reserve (Fig 2d, pg 20). One of the famous streams is Charan Ganga, which
originates from the Bandhavgarh fort (Shesh Shaiya), making its way through the core and
buffer and finally meeting River Son in Manpur buffer zone.
2.6 CLIMATEThe BTR is characterized by well-defined winter (November-February), summer
(March- June) and monsoon-post monsoon (July- October). The average rainfall is 1,173 mm,
most of which occurs during the monsoon.
A view of the Son River

CHAPTER 2: STUDY AREA 17© The Corbett Foundation
Figure 2a: Location of the Bandhavgarh Tiger Reserve
CHAPTER 2: STUDY AREA18 © The Corbett Foundation
Figure 2b: Aspect map of Bandhavgarh Tiger Reserve
CHAPTER 2: STUDY AREA 19© The Corbett Foundation
Figure 2c: Digital elevation map of Bandhavgarh Tiger Reserve
CHAPTER 2: STUDY AREA20 © The Corbett Foundation
Figure 2d: Drainage system of the Bandhavgarh Tiger Reserve
CHAPTER 3: DISPERSAL ROUTES OF TIGER AND LEOPARD 21© The Corbett Foundation
Chapter 3
DISPERSAL ROUTES Of TIgER AnD LEOPARD
CHAPTER 3: DISPERSAL ROUTES OF TIGER AND LEOPARD22 © The Corbett Foundation
3.1 INTRODUCTIONHabitat fragmentation at large spatial scales is recognized as one of the major threats
to the conservation of wide-ranging vertebrate carnivores (Wikramanayake et al., 2018).
Large carnivores like tiger and lion, are generally wide-ranging species occurring at lower
densities and need larger areas to sustain a viable population (Noss et al.,1996). The habitat
fragmentation leads to the disconnectivity among otherwise continuous landscapes or habitats
resulting into smaller and isolated populations. Once the populations become isolated and
genetically effective population size is not maintained, the stochastic events could lead to
extinction (Gilbert et al., 1998). Ecological corridors can help connect smaller populations
enabling individuals to disperse freely among themselves. The dispersal routes or ecological
corridors are important for ensuring gene flow, which minimizes the negative effects due to
isolation, inbreeding and random demographic processes. One of the striking capabilities of
large carnivores like tiger lies in their inherent ability to disperse over longer distances (Noss et
al., 1996). To enable long-distance dispersal movements, continuous wildlife habitats at larger
spatial scales are needed. Maintaining continuous wildlife habitats at larger landscape scale
are central to the theory of large carnivore conservation. “The traditional concept of designing
isolated nature reserves or protected areas will not suffice for large carnivores, except in those
rare cases where reserves of many thousands of square kilometers can be established (Noss et
al., 1996)”.
BTR is one of the important tiger reserves in the Central Indian Landscape that has
been recognized as global priority landscape for tiger conservation (Sanderson et al., 2010) and
holds more than 40% of total India’s tiger population (Jhala et al., 2011). A recent study that
investigated the connectivity among 16 protected areas in CIL found highest quality linkages
between Kanha-Phen/Bandhavgarh to Sanjay/ Gurughasidas (Dutta et al., 2016). Bandhavgarh
holds more than 90 individual tigers in an area of 1520 km2. The reserve connects to Sanjay-
Dubri Tiger Reserve (STR) in the northeast and the southeast via two separate linkages (Fig
3a, pg 23). The linkage in the northeast connects the Panpatha buffer zone of BTR to North
Shahdol Forest Division that finally merges with STR. The northeast linkage supposedly acts
as dispersal linkage or ecological corridor that should facilitate the movement of tigers between
BTR and STR.

CHAPTER 3: DISPERSAL ROUTES OF TIGER AND LEOPARD 23© The Corbett Foundation
Figure 3a: Map showing the two potential ecological corridors between
BTR and Sanjay-Dubri TR
The current study, however, focused on the areas of tiger movement at more local scale
and was confined to the buffer zone of the BTR. For the purpose of this study, we delineated the
areas at local scale determining which routes, based on camera trap captures and signs (scats,
scratches) of tiger and leopard, are being used for daily movement patterns from core zone
into the buffer and outside the reserve from the buffer zone. Our study shows that dispersing
individuals likely to take the identified routes is preliminary and thus the route delineations
from our study are more “subjective” rather than strictly “descriptive”.
3.2 FIELD METHODSCamera traps were installed along major roads and trails within the buffer zone of BTR
for the period of one year. Camera traps remained active at night only. Each camera trap station
consisted of two camera units mounted on tree trunks at the elevation of 30 cm from the ground.
We used grid-based sampling protocol for camera trap survey where each grid had an area of
4 km2. The distance between successive camera trap units ranged between 800 to 1200 meters.
Since the aim of the study was to identify the routes used by tiger and leopard to disperse from
core zone into the buffer zone and outside the reserve, we chose the roads and trails that were
leading from the buffer zone to the outside of BTR.
CHAPTER 3: DISPERSAL ROUTES OF TIGER AND LEOPARD24 © The Corbett Foundation
Our choice of using camera traps along roads and trails was based on prior sign survey.
We used the same roads and trails to record the indirect signs like scats, scratches, tree markings,
etc. The GPS location of every indirect sign was noted and later used as incident data points
for further analysis. The signs along roads and trails were recorded every 10-15 days so that
duplication of the signs could be avoided.
3.3 STATISTICAL ANALYSISWe used hotspot analysis of incident points (capture locations and indirect signs) and
created a map of statistically significant hot and cold spots using the Getis-Ord Gi* statistic
in Arc Map 10.2. This statistic creates a new output feature class with a z-score, p-value and
confidence level bin (Gi_Bin) for each input feature class.
The z-score and p-values are used to test the null hypothesis feature by feature and
test whether the observed spatial clustering (high or low values) is more pronounced than one
would expect in a random distribution.
3.4 RESULTSWe identified two major routes used by tigers for daily activity movements in the buffer
zone. The first route designated as Damna-Badkhera route is used by tigers to disperse from
the core zone into the surrounding buffer. One of the tigresses named T-45 or Mirchani female
raised a litter of three cubs in the year 2016 in the Badkhera beat. The route starts at core zone
near Damna village (locally named as Andhiyari Jhiriya), crosses through Damna, Badkhera,
Gobratal and Samarkoni beats in the buffer and finally merges into Kallwah Range in core
zone. The second route called Damokhar-Bartarai route starts in Dhamokhar buffer zone and
leads into the Bartarai beat in the buffer and merges into Khitauli Range in core.
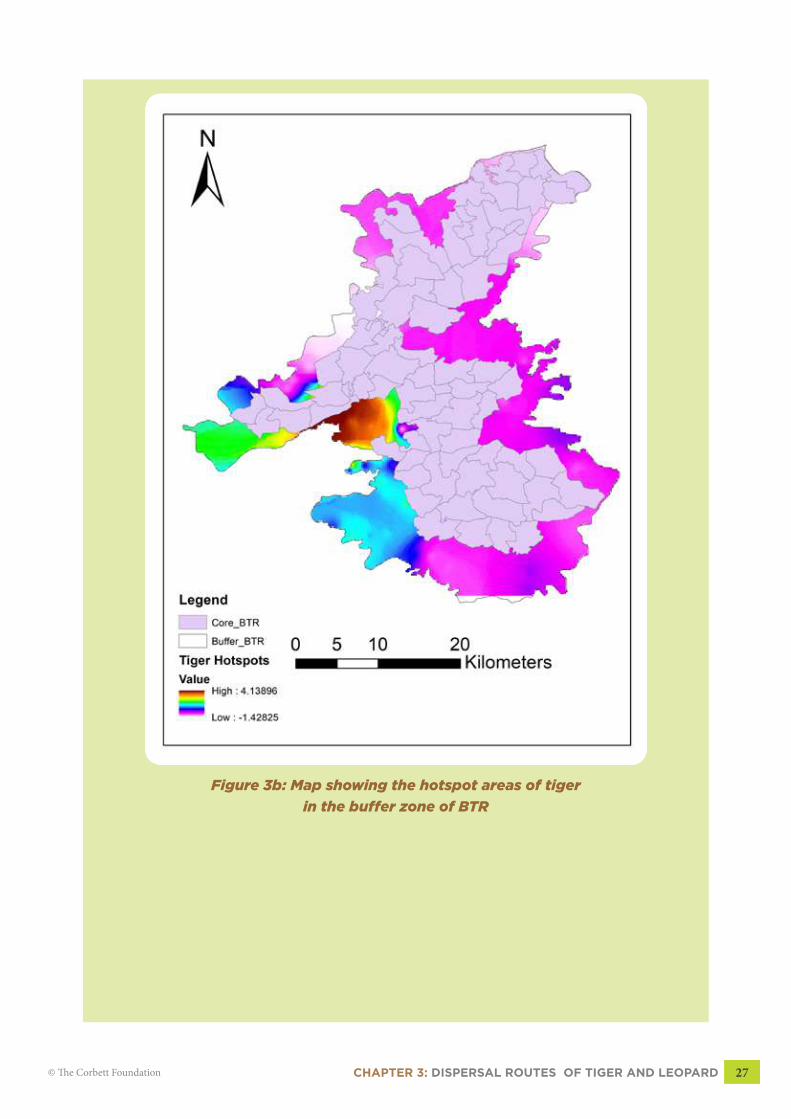
Based on hotspot analysis, statistically significant tiger hotspots occurred mostly in the
Dhamokhar buffer range. Very highly significant hotspots (99%) occurred in the Dhamokhar-
Bartarai route (Fig 3b). Other statistically significant (95%) hotspot occurred in the extreme
west, Tali, Dhaurkhoh and Salaiya beat in Dhamokhar range (Green color, Fig 3b, pg 27).
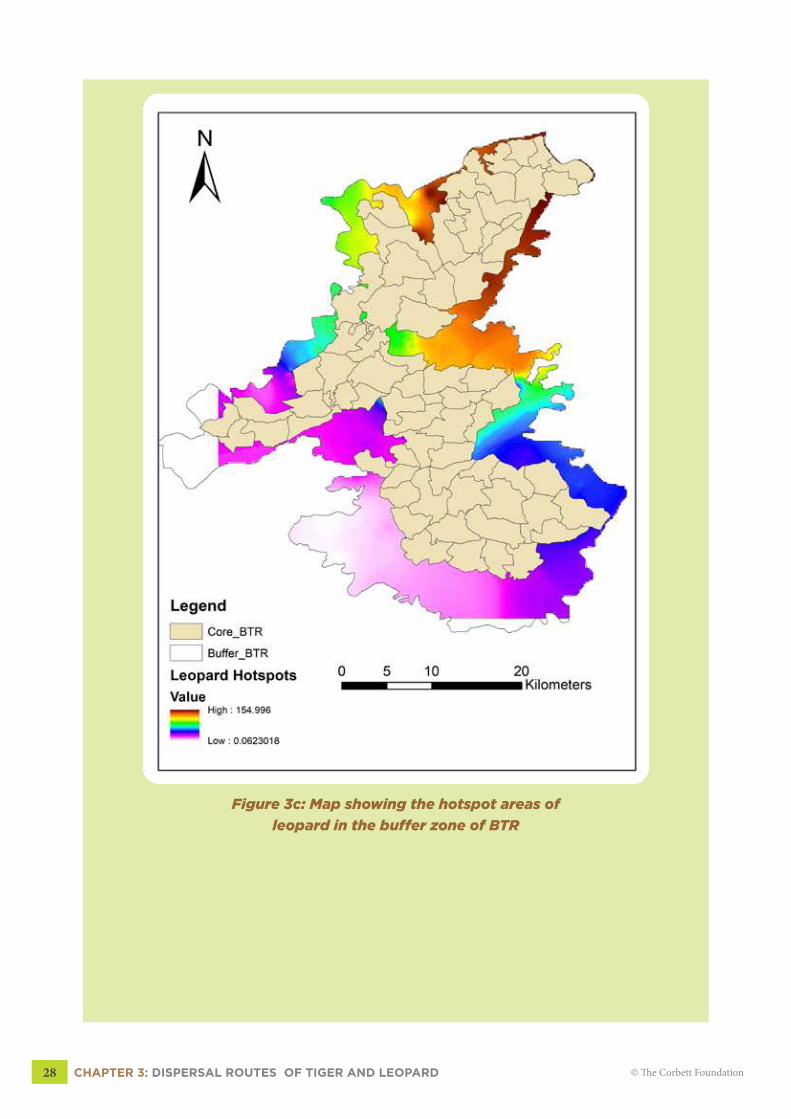
In case of leopard, the hotspots occurred in Panpatha buffer range of BTR (Fig 3c, pg
28). Close examination of the figures (3b & 3c), shows the indications of spatial segregation
between leopard and tiger. Tigers use the areas with dense cover, preferably with flat terrain
CHAPTER 3: DISPERSAL ROUTES OF TIGER AND LEOPARD 25© The Corbett Foundation
while leopards use the routes located in hilly terrain. Due to the greater flexibility in its behavior,
no single route could be delineated for leopard. However, hotspot map of leopard (Fig 3c, pg
28) shows highly significant (99%) use of trails for daily activity movements located in the
hilly terrains.
3.5 DISCUSSIONThere are three ranges in the buffer zone of the BTR - Dhamokhar, Manpur and
Panpatha - and both tiger and leopard captures were recorded in all the three ranges during
the camera trap survey. Surprisingly, the tigers that were captured in any one particular range
e.g., Manpur range, were not captured in either of other two ranges. Though all three buffer
ranges are in continuity with each other, no physical barriers exist that could hinder the
to-and-fro movement between these ranges. This behavior is indicative of the smaller and
may be exclusive home ranges for male tigers in BTR. Though we lack the concrete data
to support this claim, comprehensive studies making use of radio-telemetry may actually
provide better insights into the ranging and the territorial behaviors of tigers in BTR.
We found that among three buffer ranges, Damokhar range had the highest intensity of
tiger presence and movement. This may have occurred due to the relatively dense vegetation
cover, optimal prey presence and better connectivity of the Dhamokhar range with four core
CHAPTER 3: DISPERSAL ROUTES OF TIGER AND LEOPARD26 © The Corbett Foundation
zones. The regular movement of tigers from Damokhar to the forested areas located at the
village fringes was observed. The areas of prime concern regarding tiger monitoring and
chances of higher human-wildlife conflict include Dhamokhar, Khitauli, Medra and Bartari.
In case of leopards, the prime areas of interest are located in the northern part of BTR,
and Panpatha and the adjoining Manpur range in the east. In Manpur range, the leopard hotspots
were located in Patehra, Guruwahi, Lakhnauti and Chhapraud. Patehra and Guruwahi beats
merge into the Pataur core zone while as Lakhnauti and Chhapraud continue towards BTR
boundary. Leopard hotspots were also prominent in Biruhli, Jajagarh and Panpatha beats of the
Panpatha range (Map 3c, pg 28). Leopard showed a trend of spatially avoiding the tiger and the
highest intensity of leopard captures and indirect signs of leopard were recorded in Guruwahi,
Chhapraud, Patehra and Lakhnauti beats. These are also the areas where tiger presence was not
captured in camera trap survey, except a single tigress in Guruwahi on one occasion.
The study of delineating the actual dispersal routes that could facilitate the dispersal
between BTR and the adjoining STR was beyond the scope of the present study. Our main
focus was to prioritize the areas of higher tiger and leopard presence in the buffer zone so that
forest managers could focus on a longterm conservation and protection of these areas. These
are also the areas where the cases of human-wildlife conflict have increased in a couple of
years (pers. observ). So our study may be helpful to the ground staff whereby they could utilize
their resources much more effectively and divert the action towards the hotspot areas for better
monitoring and management.
CHAPTER 3: DISPERSAL ROUTES OF TIGER AND LEOPARD 27© The Corbett Foundation
Figure 3b: Map showing the hotspot areas of tiger
in the buffer zone of BTR
CHAPTER 3: DISPERSAL ROUTES OF TIGER AND LEOPARD28 © The Corbett Foundation
Figure 3c: Map showing the hotspot areas of
leopard in the buffer zone of BTR

CHAPTER 4: FOOD HABITS OF TIGER AND LEOPARD 29© The Corbett Foundation
Chapter 4
fOOD HABITS Of TIgER AnD LEOPARD
CHAPTER 4: FOOD HABITS OF TIGER AND LEOPARD30 © The Corbett Foundation
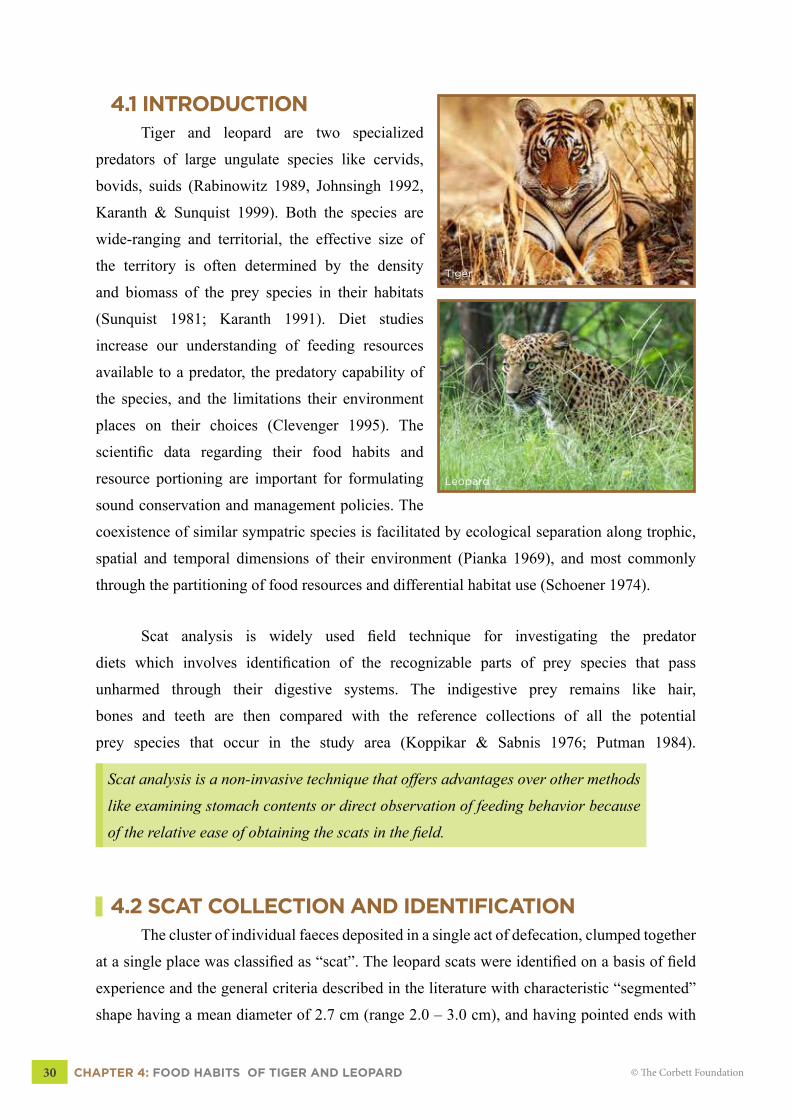
4.1 INTRODUCTIONTiger and leopard are two specialized
predators of large ungulate species like cervids,
bovids, suids (Rabinowitz 1989, Johnsingh 1992,
Karanth & Sunquist 1999). Both the species are
wide-ranging and territorial, the effective size of
the territory is often determined by the density
and biomass of the prey species in their habitats
(Sunquist 1981; Karanth 1991). Diet studies
increase our understanding of feeding resources
available to a predator, the predatory capability of
the species, and the limitations their environment
places on their choices (Clevenger 1995). The
scientific data regarding their food habits and
resource portioning are important for formulating
sound conservation and management policies. The
coexistence of similar sympatric species is facilitated by ecological separation along trophic,
spatial and temporal dimensions of their environment (Pianka 1969), and most commonly
through the partitioning of food resources and differential habitat use (Schoener 1974).
Scat analysis is widely used field technique for investigating the predator
diets which involves identification of the recognizable parts of prey species that pass
unharmed through their digestive systems. The indigestive prey remains like hair,
bones and teeth are then compared with the reference collections of all the potential
prey species that occur in the study area (Koppikar & Sabnis 1976; Putman 1984).
Scat analysis is a non-invasive technique that offers advantages over other methods
like examining stomach contents or direct observation of feeding behavior because
of the relative ease of obtaining the scats in the field.
4.2 SCAT COLLECTION AND IDENTIFICATIONThe cluster of individual faeces deposited in a single act of defecation, clumped together
at a single place was classified as “scat”. The leopard scats were identified on a basis of field
experience and the general criteria described in the literature with characteristic “segmented”
shape having a mean diameter of 2.7 cm (range 2.0 – 3.0 cm), and having pointed ends with
Tiger
Leopard
CHAPTER 4: FOOD HABITS OF TIGER AND LEOPARD 31© The Corbett Foundation
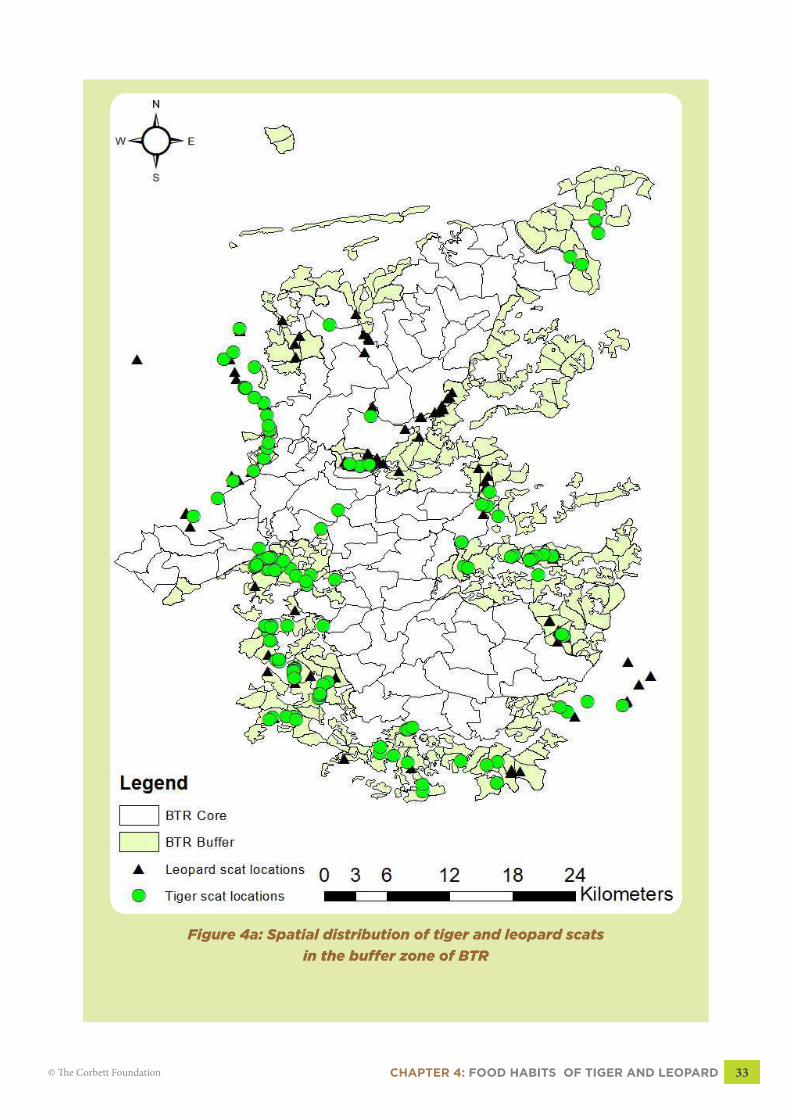
many lobes (Karanth et al.,1995). For scat collection, intensive search across the study area
particularly along roads, trails, and forest tracks was done while ensuring that all of the study
area was well covered. Tiger scats are clearly distinguishable from leopard scats and therefore
there was little chance of misclassification. However, signs associated with scats such as
pugmarks were also noted to avoid misidentification. The scat samples were preserved in a
tagged polythene bag and later washed thoroughly using a sieve with running tap water. Prey
remains such as hair, bones, hooves, feathers, quills and claws were air dried and later examined.
Features such as hair structure, colour, cuticular and medullary patterns were used to identify the
prey species (Koppikar and Sabins 1976) and standard protocols were adopted to arrive at the
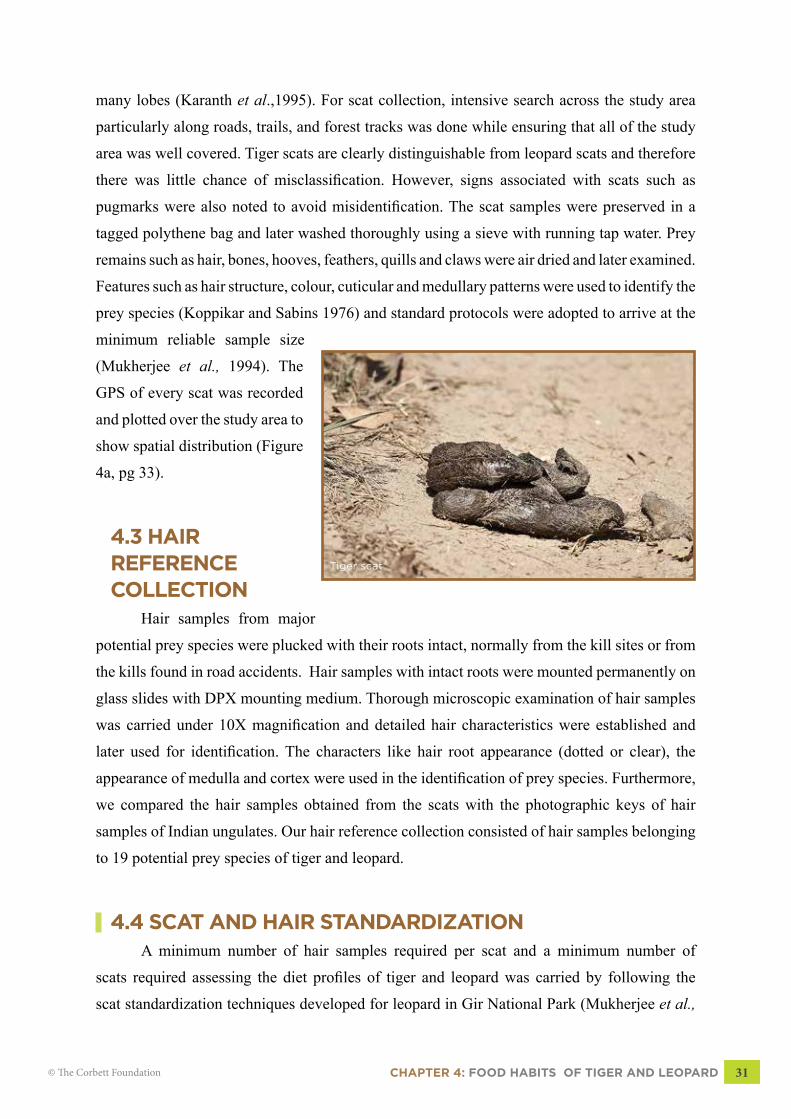
minimum reliable sample size
(Mukherjee et al., 1994). The
GPS of every scat was recorded
and plotted over the study area to
show spatial distribution (Figure
4a, pg 33).
4.3 HAIR REFERENCE COLLECTION
Hair samples from major
potential prey species were plucked with their roots intact, normally from the kill sites or from
the kills found in road accidents. Hair samples with intact roots were mounted permanently on
glass slides with DPX mounting medium. Thorough microscopic examination of hair samples
was carried under 10X magnification and detailed hair characteristics were established and
later used for identification. The characters like hair root appearance (dotted or clear), the
appearance of medulla and cortex were used in the identification of prey species. Furthermore,
we compared the hair samples obtained from the scats with the photographic keys of hair
samples of Indian ungulates. Our hair reference collection consisted of hair samples belonging
to 19 potential prey species of tiger and leopard.
4.4 SCAT AND HAIR STANDARDIZATIONA minimum number of hair samples required per scat and a minimum number of
scats required assessing the diet profiles of tiger and leopard was carried by following the
scat standardization techniques developed for leopard in Gir National Park (Mukherjee et al.,
Tiger scat
CHAPTER 4: FOOD HABITS OF TIGER AND LEOPARD32 © The Corbett Foundation
1994). Observation area curve or cumulative frequency curve (Figure 4b, 4c, 4d, 4e, pg 34-35)
was developed to estimate the required number of hair samples per scat and required a number
of scats to construct diet profiles of tiger and leopard.
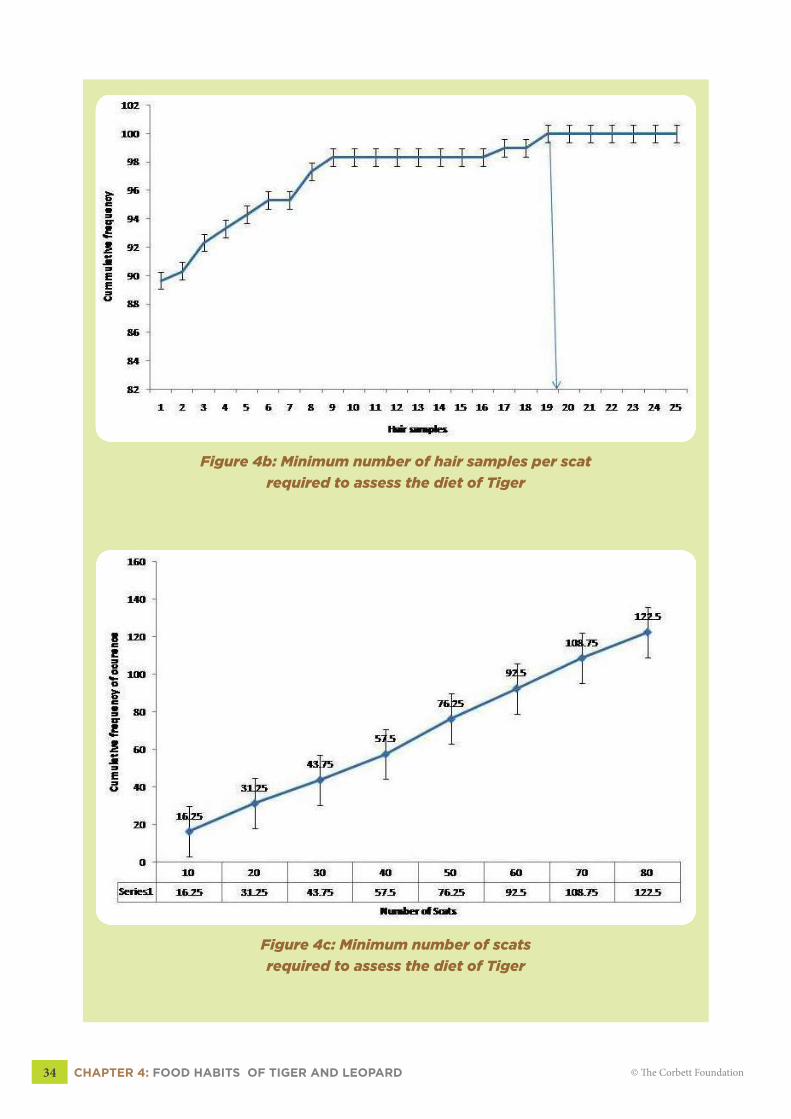
From the frequency graphs (Figure 4b), most of the tiger’s prey species in Bandhavgarh
Tiger Reserve could be detected by analyzing atleast 70 scat samples. The frequency graph (4b)
reached asymptote between 60 and 65 scats and we recommend that minimum of 70 scats be
analyzed for estimating the diet of the tiger in Bandhavgarh Tiger Reserve. In case of leopard
(Figure 4d), the asymptote occurred between 85 and 90 scats and we recommend 90 scats be
analyzed to estimate the diet of leopard in Bandhavgarh Tiger Reserve. From figures (4a &
4c), we recommend that at least 20 hair samples be analyzed every scat of tiger and leopard to
account for the occurrence of all the prey species in the scats.
CHAPTER 4: FOOD HABITS OF TIGER AND LEOPARD 33© The Corbett Foundation
Figure 4a: Spatial distribution of tiger and leopard scats
in the buffer zone of BTR
CHAPTER 4: FOOD HABITS OF TIGER AND LEOPARD34 © The Corbett Foundation
Figure 4b: Minimum number of hair samples per scat
required to assess the diet of Tiger
Figure 4c: Minimum number of scats
required to assess the diet of Tiger

CHAPTER 4: FOOD HABITS OF TIGER AND LEOPARD 35© The Corbett Foundation
Figure 4d: Minimum number of hair samples per scat
required to assess the diet of leopard
Figure 4e: Minimum number of scats
required to assess the diet of leopard

CHAPTER 4: FOOD HABITS OF TIGER AND LEOPARD36 © The Corbett Foundation
4.5 DATA ANALYSISEstimation of the frequency of occurrence
Representation of each food type was expressed as a frequency of occurrence (FO),
defined as:
[FO = s/N*100]
Where s is the number of samples containing each prey type and N is the
total number of samples, and as percent relative occurrence (RO), defined as:
[RO = p/T*100]
Where p is the number of occurrences of each prey type and T is a total occurrence of
all prey types in all samples, which represents the relative importance of a given food type in
the diet of the species (Loveridge and Macdonald 2003).
Quantification of the diet was based on both the frequency of occurrence (proportion of
total scats in which an item was found) and the percent occurrence (number of times a specific
item was found as a percentage of all items found) (Ackerman et al., 1984). Frequencies of
identifiable prey remain in scats do not give a representative picture of the consumed proportion
of different prey species when the prey types vary in size to a considerable extent. Smaller
prey species, having more hair per unit body weight produce more scats per unit prey weight
consumed, leading to an overestimation of smaller prey species in the carnivore diet (Floyd et
al., 1978, Ackerman et al., 1984). The correction factor developed by Ackerman et al., (1984)
from feeding trials on Cougar (Felis concolor) was used to estimate the relative proportion of
biomass of different prey species consumed by predators in the study area. The equation used
is as follows:
Y = 1.980 + 0.035X (for tiger and leopard)
The average weight (X) of individuals of wild prey species was taken from Karanth &
Sunquist (1995) and Khan et al., (1996) and that of domestic livestock from Schaller (1967).
Solving the equation for Y gave an estimate of biomass consumed per collectible scat for each
prey type. Multiplying each Y by the number of scats found to contain a particular prey species
gave the relative weight of each prey type consumed. These values were used to estimate
percent biomass contribution of different prey species to the predator diet. The term Y is used
as a correction factor and multiplied by the observed frequency of occurrence data, to correct
the over-representation of smaller prey. The details of this approach have been fully described
elsewhere (Floyd et al., 1978, Ackerman et al., 1984, Karanth & Sunquist, 1995).
CHAPTER 4: FOOD HABITS OF TIGER AND LEOPARD 37© The Corbett Foundation
4.6 RELATIVE BIOMASS AND RELATIVE NUMBER OF PREY CONSUMED
The live weights of different prey species (X) used in this analysis are based on Karanth
& Sunquist (1995). Using the correction factor Y, the relative biomass (D, the proportion of
meat of a specific prey item in the predator’s overall diet) and the relative number of a prey
species consumed (E, the proportion of numbers of that prey taken among all prey numbers
consumed by the predator) were estimated using following equations, (expressed as percent):
D = (A * Y)/∑ (A * Y)*100
E = (D/X)/∑ (D/X) * 100
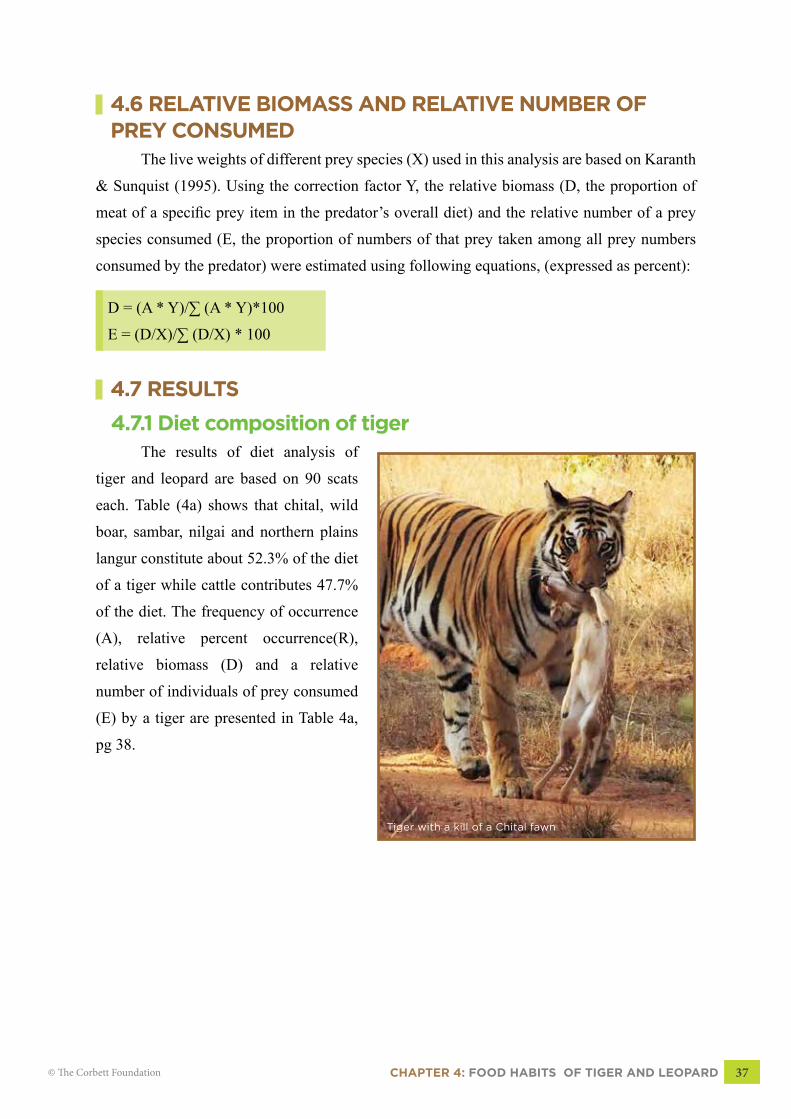
4.7 RESULTS4.7.1 Diet composition of tiger
The results of diet analysis of
tiger and leopard are based on 90 scats
each. Table (4a) shows that chital, wild
boar, sambar, nilgai and northern plains
langur constitute about 52.3% of the diet
of a tiger while cattle contributes 47.7%
of the diet. The frequency of occurrence
(A), relative percent occurrence(R),
relative biomass (D) and a relative
number of individuals of prey consumed
(E) by a tiger are presented in Table 4a,
pg 38.
Tiger with a kill of a Chital fawn
CHAPTER 4: FOOD HABITS OF TIGER AND LEOPARD38 © The Corbett Foundation
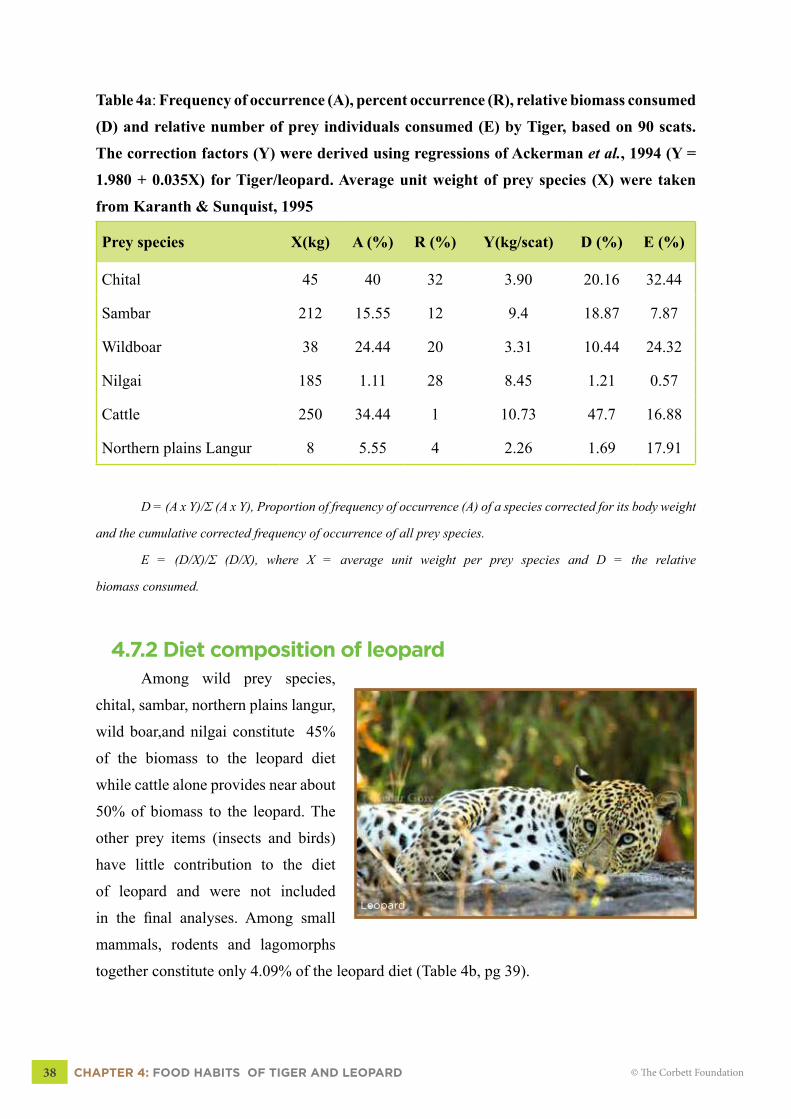
Table 4a: Frequency of occurrence (A), percent occurrence (R), relative biomass consumed
(D) and relative number of prey individuals consumed (E) by Tiger, based on 90 scats.
The correction factors (Y) were derived using regressions of Ackerman et al., 1994 (Y =
1.980 + 0.035X) for Tiger/leopard. Average unit weight of prey species (X) were taken
from Karanth & Sunquist, 1995
Prey species X(kg) A (%) R (%) Y(kg/scat) D (%) E (%)
Chital 45 40 32 3.90 20.16 32.44
Sambar 212 15.55 12 9.4 18.87 7.87
Wildboar 38 24.44 20 3.31 10.44 24.32
Nilgai 185 1.11 28 8.45 1.21 0.57
Cattle 250 34.44 1 10.73 47.7 16.88
Northern plains Langur 8 5.55 4 2.26 1.69 17.91
D = (A x Y)/Σ (A x Y), Proportion of frequency of occurrence (A) of a species corrected for its body weight
and the cumulative corrected frequency of occurrence of all prey species.
E = (D/X)/Σ (D/X), where X = average unit weight per prey species and D = the relative
biomass consumed.
4.7.2 Diet composition of leopardAmong wild prey species,
chital, sambar, northern plains langur,
wild boar,and nilgai constitute 45%
of the biomass to the leopard diet
while cattle alone provides near about
50% of biomass to the leopard. The
other prey items (insects and birds)
have little contribution to the diet
of leopard and were not included
in the final analyses. Among small
mammals, rodents and lagomorphs
together constitute only 4.09% of the leopard diet (Table 4b, pg 39).
Leopard

CHAPTER 4: FOOD HABITS OF TIGER AND LEOPARD 39© The Corbett Foundation
Table 4b: Frequency of occurrence (A), percent occurrence (R), relative biomass consumed
(D) by leopard, based on 90 scats. The correction factors (Y) were derived using regressions
of Ackerman et al., 1994 (Y = 1.980 + 0.035X) for Tiger/leopard. Average unit weight of
prey species (X) were taken from Karanth & Sunquist, 1995
Prey species X(kg) A (%) R (%) Y(kg/scat) D (%)
Chital 45 36.66 25.58 4.07 19.48
Sambar 212 5.55 3.87 10.36 7.27
Wildboar 38 8.88 6.20 3.19 3.70
Northern plains Langur 8 30 20.93 2.28 8.94
Cattle 250 33.33 23.25 11.48 49.95
Nilgai 184 5.55 3.87 9.01 6.53
Rodents 0.11 11.11 7.75 1.98 2.87
Black-napped hare 3 2.22 1.55 2.09 0.60
Rufous tailed hare 3 2.22 1.55 2.09 0.60
D = (A x Y)/Σ (A x Y), Proportion of frequency of occurrence (A) of a species corrected for its body weight
and the cumulative corrected frequency of occurrence of all prey species.
4.8 DISCUSSION There are several studies regarding the diet of both tiger and leopard in the Indian
sub-continent (Schaller 1967, Johnsingh 1992, Chundawat et al., 1992, Reddy et al., 2004).
However most of these studies have based their results only on the calculation of frequency
of occurrence of different prey species in the predator scats. It has however been suggested
that frequency of occurrence has the least ecological significance and results are highly biased
(Klare et al., 2011). These authors further argue that biomass calculation models or equations
should be used to best represent the diet profiles of the carnivore species. If biomass estimation
models are not available for the concerned species, the models that were developed for a closely
related species with similar food spectrum could be used to have the best approximation of the
true diet (Klare et al., 2011). In this study, we used the regression equations developed for
cougars by Ackerman (1995). These equations have been used elsewhere in India to estimate
and quantify the diet of tiger, leopard and dhole (Karanth and Sunquist, 1995).

CHAPTER 4: FOOD HABITS OF TIGER AND LEOPARD40 © The Corbett Foundation
Despite the size difference between Tiger and Leopard, there was substantial dietary
overlap between the two predators. We used Pianka’s index to quantify the dietary overlap
between tiger and leopard. There was 0.87% of the dietary overlap between the two predators. Our
results show that both the tiger and leopard used the resources according to their availabilities.
Almost 50% of the total biomass consumed by both the predators was provided by cattle alone
(Table 4a, 4b, pg 38-39). In addition to cattle, Chital and Sambar were the other common prey
species consumed significantly by both these predators. Indian Wild Pig or Wild Boar occurred
more frequently in the diet of Tiger and Northern Plains Langur occurred more frequently in
the diet of Leopard. Smaller prey species such as rodents and lagomorphs occurred only in the
diet of Leopard. Barking Deer and Chinkara did not occur at all in the diet profile of either of
these predators. The absence of Barking Deer and Chinkara in the diet of both these predators
may be due to the low population density of these animals in the buffer zone of BTR. In such
case, it may not be energetically profitable for Tiger and Leopard to follow rare prey species
when other resources are easily available. Among wild ungulates, Chital, Sambar and Wild
Boar provided 49.47% of the total biomass for Tiger and Leopard depended more on medium-
sized prey species particularly Chital and Northern Plains Langur. In both the predators, cattle
was the most important prey in terms of biomass consumption and provided 47.7% and 49.95%
of the total biomass to Tiger and Leopard, respectively. Among wild ungulates, Chital was most
important prey species for both the predators and contributed 20.16% and 19.48% to Tiger.
Sambar and Wild Boar were equally important prey species for Tiger and contributed 18.87%
and 10.44% of the total biomass, respectively.
Due to the heavy and year around presence of livestock in the buffer zone of BTR, the
higher presence of livestock in the diet profiles of both the tiger and leopard was expected.
The presence of livestock has negative impact on the population densities of wild prey species
especially Chital and Sambar (Khan 1996, Sankar 1994). Both Chital and Sambar are an
important prey species for tiger and leopard, and the uncontrolled presence of livestock in the
buffer zone of the BTR negatively effects the density and distribution of wild prey species. Big
cats tend to feed on livestock as they are easily available, thereby resulting into the human-
wildlife conflict.
This study suggests that the proper regulation of livestock grazing should be
implemented in order to reduce both the cattle depredation by tiger and leopard
and at the same time to increase the population densities of wild ungulates in the
buffer zone of BTR.
CHAPTER 5: DENSITY & BIOMASS OF MAJOR PREY SPECIES 41© The Corbett Foundation
Chapter 5
DEnSITY & BIOMASS Of MAJOR PREY SPECIES
CHAPTER 5: DENSITY & BIOMASS OF MAJOR PREY SPECIES42 © The Corbett Foundation
5.1 INTRODUCTIONThe critical role herbivores play in maintaining and regulation of forest ecosystem is well
validated. The energy and nutrient transfer, seed dispersal and acting as a prey base for large
carnivores are some of the important functions carried by herbivores. The densities of large
carnivores like tiger and leopard are largely correlated with the ungulate densities (Schaller,
1967; Seidensticker and McDougal, 1993; Karanth and Sunquist, 1995; Karanth and Nichols,
1998 and Gittleman, 2002) and thus maintaining a healthy prey population is important for the
maintenance of viable carnivore population.
5.2 METHODS
5.2.1 Line TransectWe used line transects to estimate the densities of wild prey species including ungulates,
primates and ground-nesting birds (Anderson et al.,1979; Burnham et al.,1980; Buckland et
al.,1993, 2001). Twelve transects were laid in the study area, each transect had an equal length
of 2km. All transects were walked thrice during winter (October-February) and summer (March-
June) seasons between 0630-0900 hrs in the morning and 1600-1830 hrs in the evening. Total
effort was 72 km every year. The data was analyzed by using DISTANCE 7.1 software and the
best model fit selection was based on Minimum Akaike Information Criterion (AIC) (Buckland
et al. 1993).
5.2.2 Road TransectSince the detections of most prey species along the foot (line) transects were very low,
we used existing road network in the buffer zone of BTR as road transect. We selected five road
transects for monitoring herbivore population. Transects varied in length from 10-14 km, each
transect was selected to cover most of the major habitat types within the study area. Each of
the road transects was monitored three times every season. A good road network provided easy
access to all transects with minor hindrance in monsoon.
At each sighting, we recorded species, herd size, number of animals in the herds,
gender and categorized animals into different age groups based on physical appearances. The
distances were recorded as perpendicular distances using Laser Rangefinder (Hawke L400),
and measurements were taken only when animals were at a perpendicular position to the
vehicle. In case, the animals moved in response to the vehicle, we levelled the vehicle to the
CHAPTER 5: DENSITY & BIOMASS OF MAJOR PREY SPECIES 43© The Corbett Foundation
point where perpendicular distances could be measured. The vehicle was driven at the speed
of 25 km/hr, with two observers recording the data. The data along the road transects was
recorded seasonally (winter and summer) with occasional monitoring in monsoons whenever
it was possible. The counts were conducted during early morning (0600-0830 hrs) and evening
(1600-1830 hrs).
5.3 ANALYSISWe used DISTANCE 7 to estimate densities of prey species. Prior to using DISTANCE
we constructed histograms in Microsoft Excel to analyze the distribution of perpendicular
distances and when necessary the data were grouped into small intervals to detect any
evidence of evasive movements and resulting “heaping and truncation” of the outlier
data was carried out to improve model fitting (Jathanna et al., 2003, Edgaonkar 2008 and
Wang, 2010). We used pooled data to increase the number of sightings on yearly basis for
each species. The model was selected on the basis of AIC values when the p-value for chi-
square goodness of fit for the model was greater than 0.05 (Burnham and Anderson, 2003).
We also used DISTANCE to calculate other population parameters like effective strip
width (ESW), mean cluster size (Y), the average probability of detection (p) and cluster
density (Ds).
5.4 BIOMASS ESTIMATIONThe biomass was calculated by multiplying the mean individual prey density with the
average body weight of the respective prey species (Mondal et al., 2011, Wegge et al.,2009).
We used the estimates of body weights for major prey species from Karanth and Sunquist
(1992).
5.5 POPULATION STRUCTUREThe individual prey species were grouped into different age classes (adult male, adult
female, sub-adult male, sub-adult female, yearling and fawn) during the regular line transect
sampling and sex of each individual was recorded as male or female. The grouping of the
individuals into different age classes was based on the physical characteristics derived from
earlier works (Schaller 1967, Prater 1980 and Mishra 1982).
CHAPTER 5: DENSITY & BIOMASS OF MAJOR PREY SPECIES44 © The Corbett Foundation
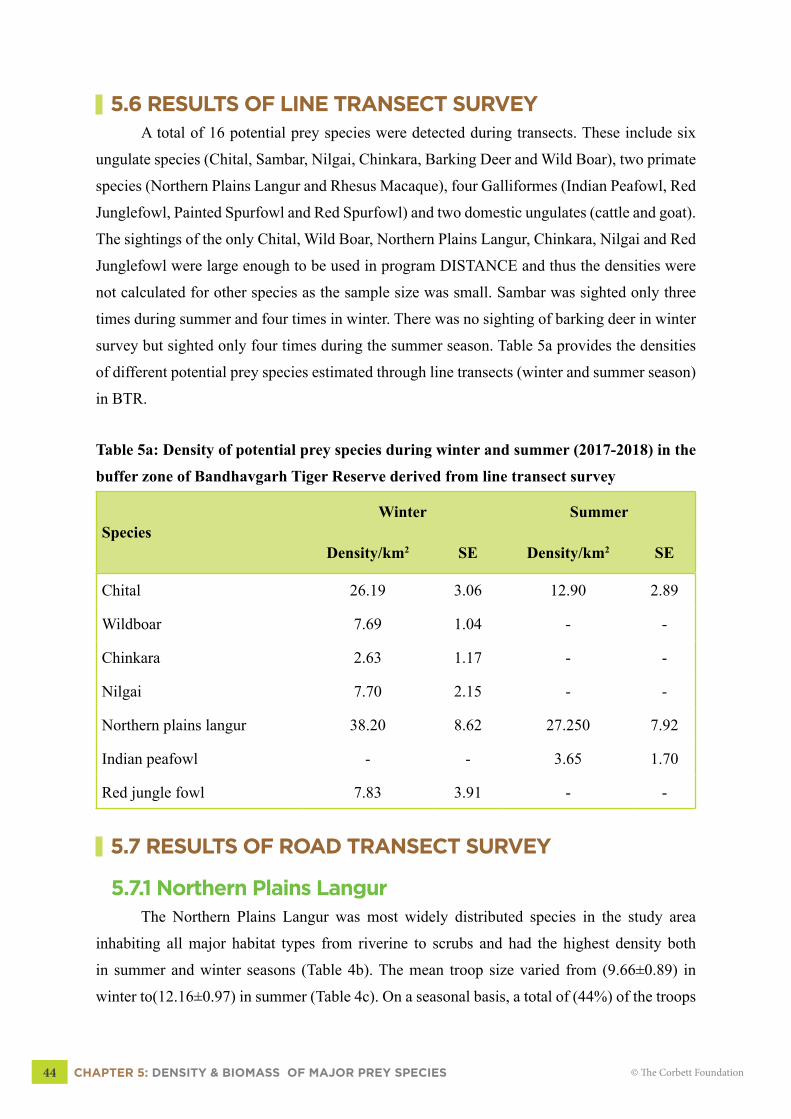
5.6 RESULTS OF LINE TRANSECT SURVEYA total of 16 potential prey species were detected during transects. These include six
ungulate species (Chital, Sambar, Nilgai, Chinkara, Barking Deer and Wild Boar), two primate
species (Northern Plains Langur and Rhesus Macaque), four Galliformes (Indian Peafowl, Red
Junglefowl, Painted Spurfowl and Red Spurfowl) and two domestic ungulates (cattle and goat).
The sightings of the only Chital, Wild Boar, Northern Plains Langur, Chinkara, Nilgai and Red
Junglefowl were large enough to be used in program DISTANCE and thus the densities were
not calculated for other species as the sample size was small. Sambar was sighted only three
times during summer and four times in winter. There was no sighting of barking deer in winter
survey but sighted only four times during the summer season. Table 5a provides the densities
of different potential prey species estimated through line transects (winter and summer season)
in BTR.
Table 5a: Density of potential prey species during winter and summer (2017-2018) in the
buffer zone of Bandhavgarh Tiger Reserve derived from line transect survey
SpeciesWinter Summer
Density/km2 SE Density/km2 SE
Chital 26.19 3.06 12.90 2.89
Wildboar 7.69 1.04 - -
Chinkara 2.63 1.17 - -
Nilgai 7.70 2.15 - -
Northern plains langur 38.20 8.62 27.250 7.92
Indian peafowl - - 3.65 1.70
Red jungle fowl 7.83 3.91 - -
5.7 RESULTS OF ROAD TRANSECT SURVEY
5.7.1 Northern Plains LangurThe Northern Plains Langur was most widely distributed species in the study area
inhabiting all major habitat types from riverine to scrubs and had the highest density both
in summer and winter seasons (Table 4b). The mean troop size varied from (9.66±0.89) in
winter to(12.16±0.97) in summer (Table 4c). On a seasonal basis, a total of (44%) of the troops
CHAPTER 5: DENSITY & BIOMASS OF MAJOR PREY SPECIES 45© The Corbett Foundation
contained less than 10 individuals and 56% of the troops contained more than 10 individuals.
In summer the largest troop size recorded was 36 individuals. In winter, 62% of the troops had
less than 10 individuals and 38% of the troops contained more than 10 individuals. The highest
number of individuals recorded in a troop during the winter season was 28.
The biomass of Northern Plains Langur was calculated as 769.72 kg/km2 in summer
and 684.18kg/km2 in winter (Table 4d).
5.7.2 Chital Chital was the most conspicuous ungulate species recorded during the survey with the
density varying from 23.15±3.57 in winter and 19.90±4.17 in summer (Table 5b). The mean
cluster size ranged from 4.50±0.48 in winter to 5.21±0.66 in summer (Table 5c). Seasonally,
61% of the times, chital were recorded in groups of less than five individuals and 39% of the
times in groups with more than five individuals in winter. In summer, 63% of the groups were
formed by less than five individuals and 37% of the times, chital was recorded in groups of
more than five individuals.
The biomass of Chital varied from 873.90kg/km2 in summer to 1041.75kg/km2 in
winter (Table 5d).
5.7.3 Blue Bull (Nilgai)Nilgai was the largest bovid prey species recorded within the study area and occurred
mostly in open sal forests. The density estimates ranged from 7.24±3.56 in winter to 4.02±1.91
in summer season (Table 5b). The group size was less than five individuals about 83% of
the times and only 17% of the times the group consisted of more than five individuals in the
summer season. Average cluster size remained almost same in both the seasons 3.83±0.74 in
winter and 3.25±0.75 in summer (Table 5c). The group size also did not vary much during both
seasons, 83% of the groups were sighted with individuals less than five and only 17% of the
groups had more than five individuals.
The biomass of nilgai ranged from 739.68kg/km2 in summer to
1332.16kg/km2 in winter.
CHAPTER 5: DENSITY & BIOMASS OF MAJOR PREY SPECIES46 © The Corbett Foundation
5.7.4 Wild Boar The densities of wildboar varied from 4.23±1.67 in winter to 6.97±1.97 in summer.
Average cluster size remained constant between the winter 5.28±1.87 and summer 4.08±0.95
seasons. Largest pack of 17 individuals was recorded during the summer season and in winter
the largest pack consisted of 14 individuals. In the summer season 75% of the packs consisted
of less than five individuals and 25% of the packs had more than five individuals. In winter, each
pack having more than five individuals and less than five individuals had an equal frequency
(50% each).
The biomass for wildboar was calculated to be 160.74kg/km2 in
winter to 264.86kg/km2 in summer.
5.7.5 Indian Gazelle (Chinkara)Chinkara was mainly associated with open habitats and scrubs. The densities ranged
from 7.99±2.34 in winter to 1.84±0.27 in summer. The mean cluster size remained more or less
same between summer 2.36±0.50 and winter 2.87±0.39. The largest group of 8 individuals was
sighted twice during the survey. Overall, chinkara occurred either as a single individual (37%)
or in the groups of 2 individuals (29%).
Chinkara provided 42.32kg/km2 biomass in summer season and
183.77kg/km2 in winter.
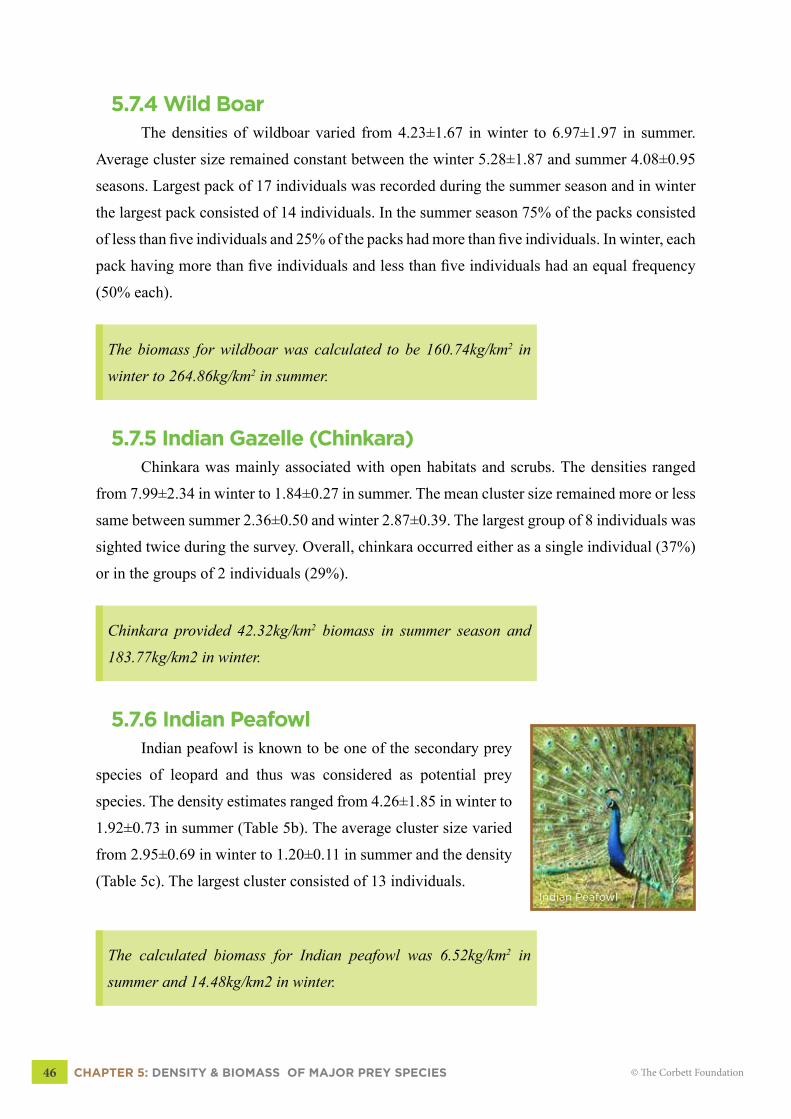
5.7.6 Indian PeafowlIndian peafowl is known to be one of the secondary prey
species of leopard and thus was considered as potential prey
species. The density estimates ranged from 4.26±1.85 in winter to
1.92±0.73 in summer (Table 5b). The average cluster size varied
from 2.95±0.69 in winter to 1.20±0.11 in summer and the density
(Table 5c). The largest cluster consisted of 13 individuals.
The calculated biomass for Indian peafowl was 6.52kg/km2 in
summer and 14.48kg/km2 in winter.
Indian Peafowl

CHAPTER 5: DENSITY & BIOMASS OF MAJOR PREY SPECIES 47© The Corbett Foundation
5.7.7 Red Jungle FowlThe density of Red jungle fowl (2.11±0.97)
was calculated for winter season only, the sightings in
summer season were not sufficient enough to be used in
the final analysis. The mean cluster size was 1.88±0.31.
5.7.8 SambarThe sambar was sighted only four times in winter and two times in summer during the
road transect survey. Sambar is known for its behavior to avoid human presence. The near
absence of sambar in the buffer zone of BTR may be regarded as an indicator of high human
intervention.
5.7.9 Barking DeerA very few sightings of barking
deer were recorded (only three in winter
and five in summer) during the survey
and thus quantitative assessment was not
possible.
5.7.10 Livestock (Cattle)Domestic cow and buffalo were recognized as cattle or livestock and thus combined
density was calculated for both the cow and buffalo. Cattle was sighted on each transect both
in morning and evening hours and in every season. The density varied from 76.00±11.06 in
the winter season to 89.90±14.89 in summer. The cluster size remained more or less same in
winter 34.23±4.87 and 32.21±5.22 in the summer season. About 60% of the herds consisted of
more than 25 individuals (highest=107) and 40% of the herds had less than 25 individuals in
the winter season. In summer, the frequency of herds having more than 25 individuals was 57%
and those having less than 25 individuals were 43%.
Cattle provided the most available biomass as 16182kg/km2 in
summer and 13680kg/km2 in winter (Table 5d).
Barking deer
Red Jungle fowl

CHAPTER 5: DENSITY & BIOMASS OF MAJOR PREY SPECIES48 © The Corbett Foundation
5.8 DISCUSSIONThe continuous presence of people and livestock in the buffer zone hindered the
detections of wild ungulates along the line transects. The degree of degradation, human
disturbance, occurrence of forest fires during the summer season, collection of Mahua flowers
and harvesting of Tendu leaves, coupled with the yearly organized cutting of mature trees by
the Forest Department in the buffer zone strongly hindered the detections of animals during the
transect survey.
Mahua collection in the buffer zone of BTR starts from March and continues through
April. Mahua collectors enter the forest as early as 0400 hrs in the morning and, often, fire
is set to the litter on the ground that occurs within the canopy circumference of the Mahua
trees to clear the ground from the litter. Such practice of setting fire to the litter easily gets
uncontrollable and spreads to rest of the forested areas.
The harvesting of Tendu leaves starts as soon as the Mahua collection season ends.
The villagers are hired to collect leaves as daily-wagers for the whole day. Tendu leaves are
harvested for the bidi factories and mostly the collection occurs at a large spatial scale. The
collectors stay inside the forest for a whole day and as a result of such disturbances, the line
transects produced fewer detections.
Sambar is well known for its behavior of avoiding the human-induced disturbances
(Sankar 1994) and the severity of disturbance can be judged by the fact that sambar was sighted
only six times during two-year survey along the line transect. Such avoidance behaviour in
sambar was also found in the areas of high human disturbance in Gir (Khan 1996).
The cattle as expected
had the highest density in both
the seasons (Table 5b, pg 49).
Cattle were observed on all
transects, at all times and in all
seasons. Seasonally the summer
densities were lower than the
densities in winter for most of
the prey species (Table 4b) with
the exception of livestock and

CHAPTER 5: DENSITY & BIOMASS OF MAJOR PREY SPECIES 49© The Corbett Foundation
northern plains langur. Such a trend occurred due to the huge disturbances in the summer
season. The availability of fresh forage strongly influences the seasonal densities of wild
ungulates (Khan 1994). Due to the frequent forest fires in summer, huge competition with
the cattle, less availability of forage and continuous presence of people in the forest during
the summer season, the lower densities were expected. The higher density of northern plains
langur in summer season may have occurred due to the increased visibility (most of the tree
species shed their leaves in summer) and their tolerance towards the people.
Chital is reported to be a grazer (Schaller 1967, Johnsingh and Shankar 1991) feeding
primarily on grasses and occasionally or conditionally supplement their diet with browse
(Khan 1994). The dry season with the scarcity of grasses in the buffer zone of BTR occurs
in the months of (March to May) and burning of grasses due to the forest fires, further limits
the distribution of chital to relatively less disturbed core zone. Currently, no seasonal density
estimates are available from the core zone of BTR with which our results can be compared and
hypothesis tested.
Table 5b: Density of potential prey species during winter and summer (2017-2018) in the
buffer zone of Bandhavgarh Tiger Reserve derived from road transect survey
SpeciesWinter Summer
Density/km2 SE Density/ km2 SE
Livestock 76.00 11.06 89.90 14.89
Chital 23.15 3.57 19.42 4.17
Chinkara 7.99 2.34 1.84 0.27
Nilgai 7.24 3.56 4.02 1.91
Northern Plains Langur 48.87 9.02 54.98 11.93
Indian Peafowl 4.26 1.85 1.92 0.73
Red Junglefowl 2.11 0.97 - -
Wild Boar 4.23 1.67 6.97 1.97
CHAPTER 5: POPULATION INDICES OF MAJOR CARNIVORE SPECIES50 © The Corbett Foundation
POPULATIOn InDICES Of MAJOR CARnIVORE SPECIES
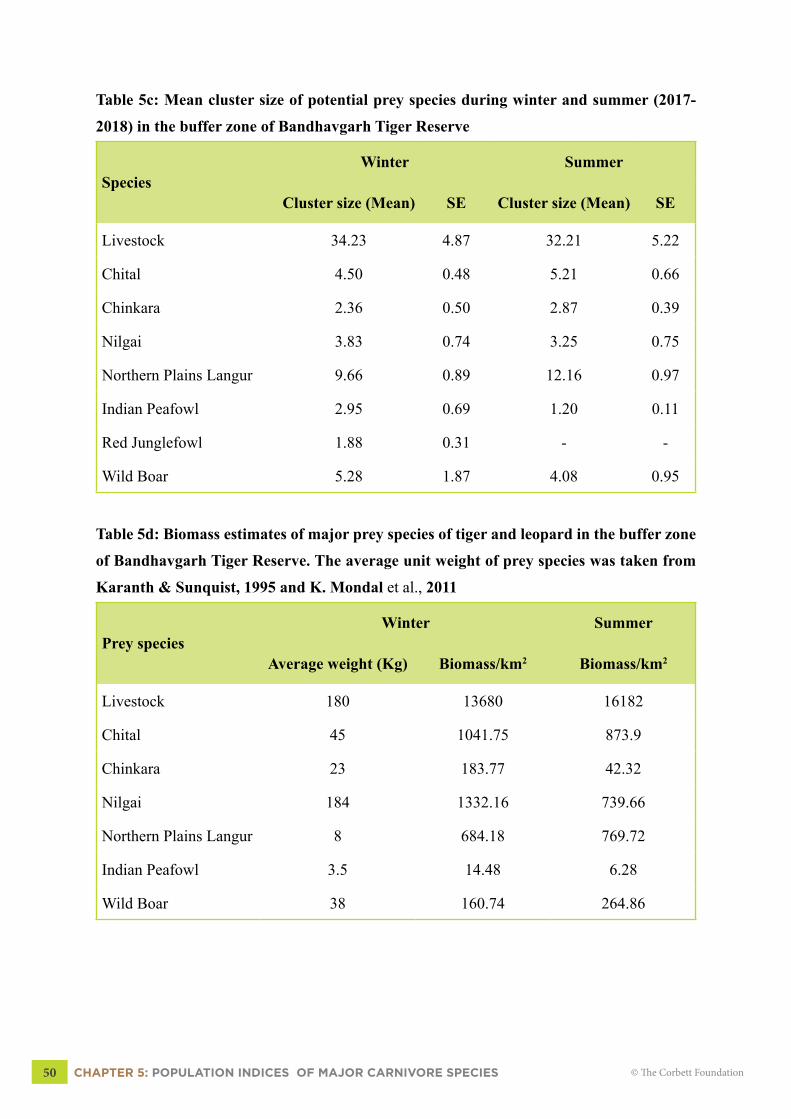
Table 5c: Mean cluster size of potential prey species during winter and summer (2017-
2018) in the buffer zone of Bandhavgarh Tiger Reserve
SpeciesWinter Summer
Cluster size (Mean) SE Cluster size (Mean) SE
Livestock 34.23 4.87 32.21 5.22
Chital 4.50 0.48 5.21 0.66
Chinkara 2.36 0.50 2.87 0.39
Nilgai 3.83 0.74 3.25 0.75
Northern Plains Langur 9.66 0.89 12.16 0.97
Indian Peafowl 2.95 0.69 1.20 0.11
Red Junglefowl 1.88 0.31 - -
Wild Boar 5.28 1.87 4.08 0.95
Table 5d: Biomass estimates of major prey species of tiger and leopard in the buffer zone
of Bandhavgarh Tiger Reserve. The average unit weight of prey species was taken from
Karanth & Sunquist, 1995 and K. Mondal et al., 2011
Prey speciesWinter Summer
Average weight (Kg) Biomass/km2 Biomass/km2
Livestock 180 13680 16182
Chital 45 1041.75 873.9
Chinkara 23 183.77 42.32
Nilgai 184 1332.16 739.66
Northern Plains Langur 8 684.18 769.72
Indian Peafowl 3.5 14.48 6.28
Wild Boar 38 160.74 264.86

CHAPTER 6: POPULATION INDICES OF MAJOR CARNIVORE SPECIES 51© The Corbett Foundation
Chapter 6
POPULATIOn InDICES Of MAJOR CARnIVORE SPECIES
CHAPTER 6: POPULATION INDICES OF MAJOR CARNIVORE SPECIES52 © The Corbett Foundation
6.1 INTRODUCTIONEstimating reliable population indices of cryptic carnivore species that live in forested
habitats can be difficult and are often expensive (Carbone et al., 2001). Automatic cameras
that are remotely triggered by passing animals are an effective way of estimating densities of
individually identifiable animals (Karanth & Nichols, 1998; Marker, Fabiano, & Nghikembua,
2008; Silver et al., 2004; Soisalo & Cavalcanti, 2006). Furthermore, camera traps are efficient at
collecting additional information regarding habitat use, species distribution and activity pattern
of cryptic carnivore species (Di Bitetti et al., 2006; Gerber, Karpanty, & Randrianantenaina,
2012; Lynam et al., 2013). However, the use of camera traps to estimate animal density has
been limited to mark capture-recapture models or the animals which can be individually
identified. Recently, a new approach that eliminates the need to individually recognize the
animals for density estimates has been developed (Lucas et al., 2015, Rowcliffe et al., 2008).
Such approaches are best suited in situations where animals cannot be individually recognized,
lack of required model parameters and high costs in undertaking the survey (Rovero & Marshall,
2009). The model makes use of photographic encounter rates (photographs per unit time) as
an index of abundance (Rovero & Marshall, 2009, Rowcliffe et al., 2008). Such models have
wide applicability to the major terrestrial mammals where capture-recapture models cannot be
used or where individuals cannot be identified. One of the controversies regarding the model
has been its limitation in modeling the detection probability or capture probability (Karanth et
al., 2003), a prerequisite for density estimation using capture-recapture models. Despite this
limitation, (Rovero & Marshall, 2009) found a strong correlation (R2 = 90%) between density
estimates and photographic encounter rates as soon as the sampling effort reaches 250-300 trap
nights/days.
In this study, we used the photographic encounter rate as an index of population abundance.
Our use of photographic encounter rates is based on the presumption that sampling period was
long enough to have violated the population closure assumption. On many occasions, we lost
camera trap units (either nonfunctional or stolen), sometimes only single flanks of the animals
were photographed (tiger and leopard). This limitation could induce potential bias in density
estimates and moreover, majority of our target species were without the natural markings.
6.2 CAMERA TRAPPINGWe conducted camera trapping between January 2016 and December 2016 in three
buffer ranges (Manpur, Damokhar and Panpatha) having an area of 820 km2. Camera traps
CHAPTER 6: POPULATION INDICES OF MAJOR CARNIVORE SPECIES 53© The Corbett Foundation
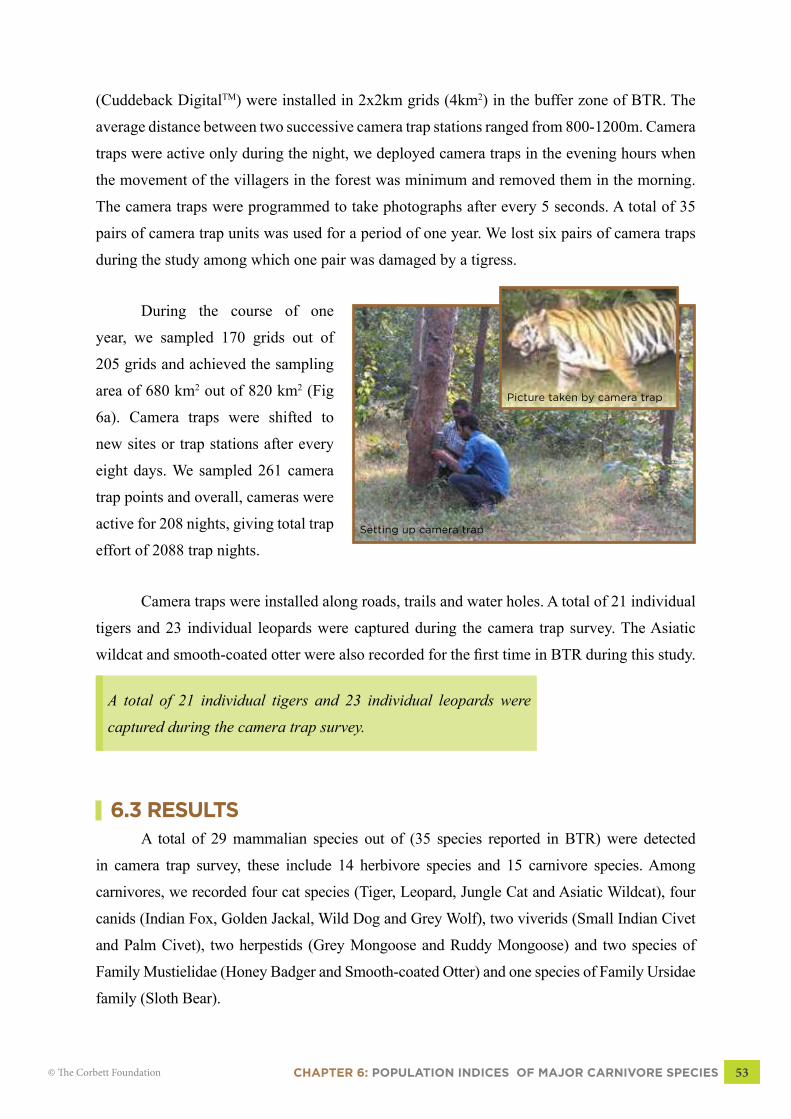
(Cuddeback DigitalTM) were installed in 2x2km grids (4km2) in the buffer zone of BTR. The
average distance between two successive camera trap stations ranged from 800-1200m. Camera
traps were active only during the night, we deployed camera traps in the evening hours when
the movement of the villagers in the forest was minimum and removed them in the morning.
The camera traps were programmed to take photographs after every 5 seconds. A total of 35
pairs of camera trap units was used for a period of one year. We lost six pairs of camera traps
during the study among which one pair was damaged by a tigress.
During the course of one
year, we sampled 170 grids out of
205 grids and achieved the sampling
area of 680 km2 out of 820 km2 (Fig
6a). Camera traps were shifted to
new sites or trap stations after every
eight days. We sampled 261 camera
trap points and overall, cameras were
active for 208 nights, giving total trap
effort of 2088 trap nights.
Camera traps were installed along roads, trails and water holes. A total of 21 individual
tigers and 23 individual leopards were captured during the camera trap survey. The Asiatic
wildcat and smooth-coated otter were also recorded for the first time in BTR during this study.
A total of 21 individual tigers and 23 individual leopards were
captured during the camera trap survey.
6.3 RESULTSA total of 29 mammalian species out of (35 species reported in BTR) were detected
in camera trap survey, these include 14 herbivore species and 15 carnivore species. Among
carnivores, we recorded four cat species (Tiger, Leopard, Jungle Cat and Asiatic Wildcat), four
canids (Indian Fox, Golden Jackal, Wild Dog and Grey Wolf), two viverids (Small Indian Civet
and Palm Civet), two herpestids (Grey Mongoose and Ruddy Mongoose) and two species of
Family Mustielidae (Honey Badger and Smooth-coated Otter) and one species of Family Ursidae
family (Sloth Bear).
Setting up camera trap
Picture taken by camera trap
CHAPTER 6: POPULATION INDICES OF MAJOR CARNIVORE SPECIES54 © The Corbett Foundation
Among herbivores we recorded six ungulate species (Chital, Sambar, Barking Deer,
Nilgai, Chinkara, Four-horned Antelope and Wild Boar) two primate species (Northern Plains
Langur and Rhesus Macaque), two rodents (Indian Gerbil and Indian Crested Porcupine), two
sub-species of Indian Hare (Rufous-tailed Hare and Black-naped Hare), two squirrels (Three-
striped Palm Squirrel and Five-striped Palm Squirrel), four galliformes species (Indian Peafowl,
Red Junglefowl, Painted Spurfowl and Red Spurfowl).
Indian Gaur, Rusty-spotted Cat and Fishing Cat were not captured during the camera
trap survey which suggests their restrictive distribution to the core zone of BTR.
6.4 PHOTOGRAPHIC INDEx RATE OF MAJOR CARNIVORE SPECIES
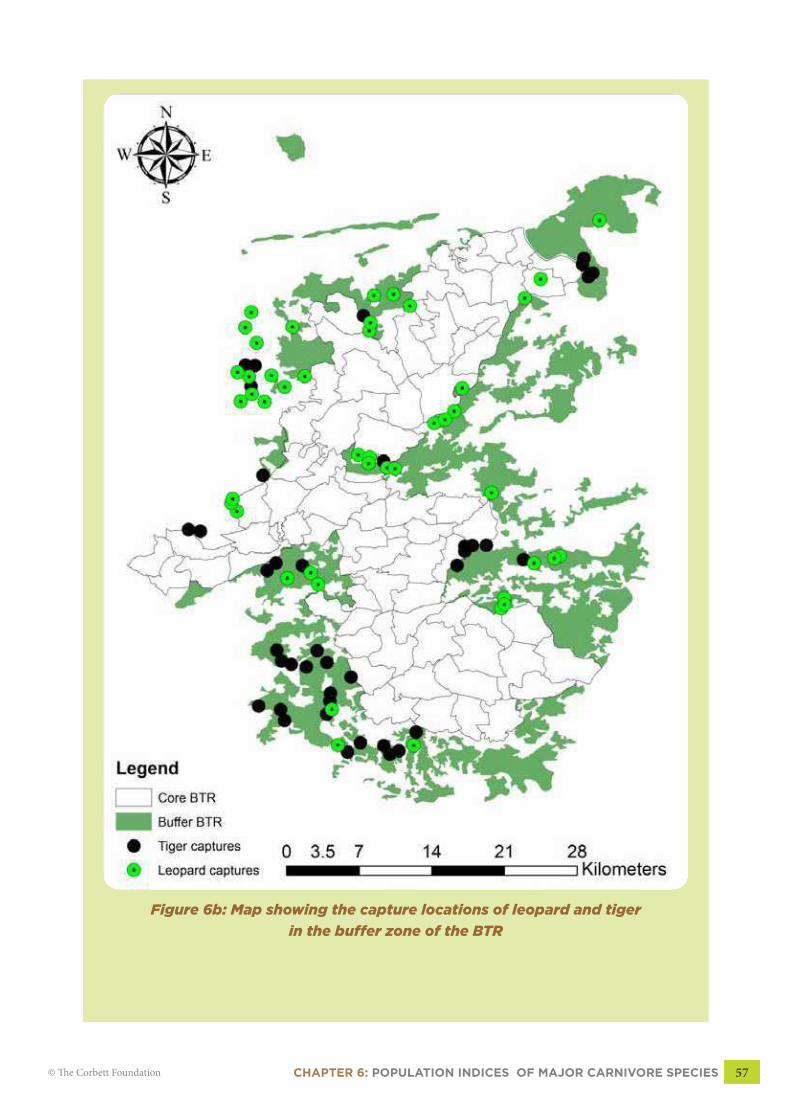
6.4.1 TigerTiger was one of the most conspicuous carnivore species captured in camera traps. Tiger
was captured in all three buffer ranges (Fig 6b, pg 57). The photographic index rate of the tiger
was calculated to be 4.25±0.97 per 100 trap nights.
6.4.2 LeopardLeopard was captured more often than the Tiger. There was the indication of spatial
segregation between Leopard and Tiger (Fig 6b, pg 57). The encounter rate of Leopard was
4.51±1.01 per 100 trap nights.
6.4.3 Sloth bearThe capture probability of Sloth Bear showed seasonal variation. During the course of
first two months (January to February) of camera trap survey, there were no sloth bear captures.
The capture frequency increased during March when the Mahua flowers are available. Sloth
Bear had the photographic encounter rate of 1.65±0.61 per 100 trap nights.
6.4.4 Golden Jackal Golden Jackal was most frequently captured carnivore in camera traps and had the
highest encounter rate of 11.98±3.75 per 100 trap nights. Jackal was also the most widely
distributed carnivore species in the buffer zone of the BTR.
CHAPTER 6: POPULATION INDICES OF MAJOR CARNIVORE SPECIES 55© The Corbett Foundation
6.4.5 Indian FoxIndian fox had an encounter rate of 8.55±2.58 per 100 trap nights. Indian Fox also
shares wide distribution with the Jackal.
6.4.6 Jungle CatOne of the most familiar smaller cats, Jungle Cat had an encounter rate of 3.26±1.07 per
100 trap nights. Jungle Cat is also widely distributed lesser cat in the buffer zone of the BTR.
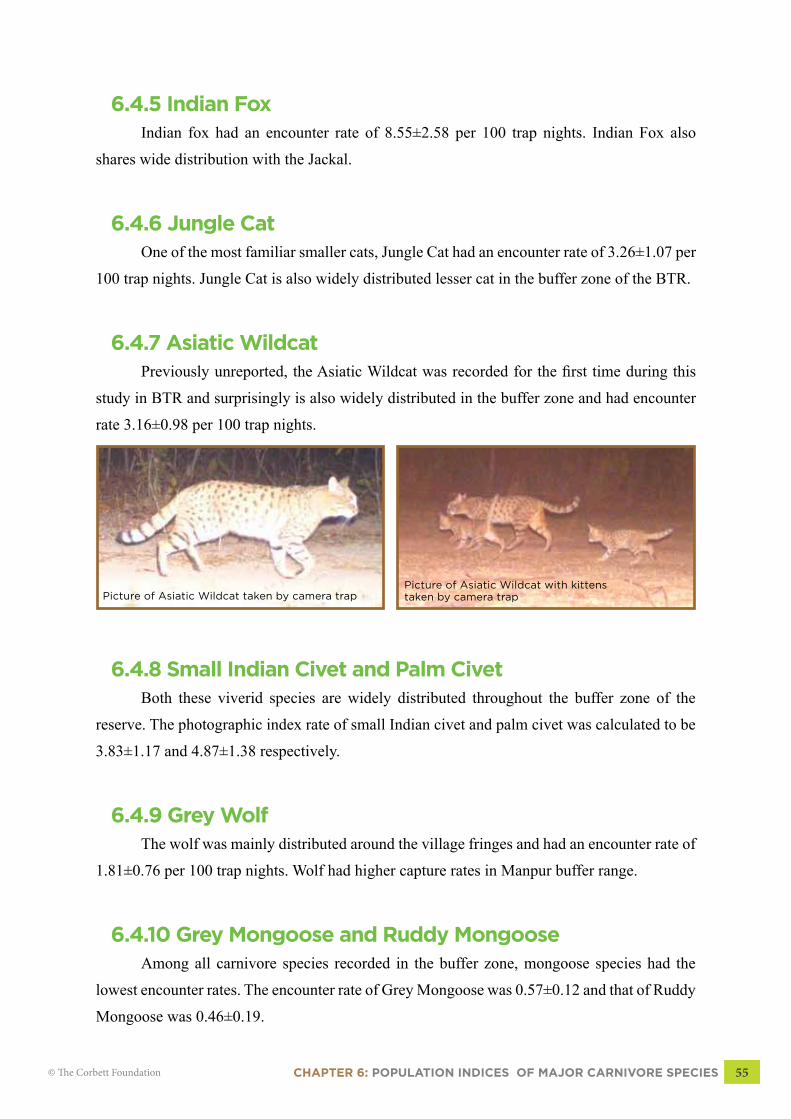
6.4.7 Asiatic WildcatPreviously unreported, the Asiatic Wildcat was recorded for the first time during this
study in BTR and surprisingly is also widely distributed in the buffer zone and had encounter
rate 3.16±0.98 per 100 trap nights.
6.4.8 Small Indian Civet and Palm CivetBoth these viverid species are widely distributed throughout the buffer zone of the
reserve. The photographic index rate of small Indian civet and palm civet was calculated to be
3.83±1.17 and 4.87±1.38 respectively.
6.4.9 Grey WolfThe wolf was mainly distributed around the village fringes and had an encounter rate of
1.81±0.76 per 100 trap nights. Wolf had higher capture rates in Manpur buffer range.
6.4.10 Grey Mongoose and Ruddy MongooseAmong all carnivore species recorded in the buffer zone, mongoose species had the
lowest encounter rates. The encounter rate of Grey Mongoose was 0.57±0.12 and that of Ruddy
Mongoose was 0.46±0.19.
Picture of Asiatic Wildcat taken by camera trapPicture of Asiatic Wildcat with kittens taken by camera trap

CHAPTER 6: POPULATION INDICES OF MAJOR CARNIVORE SPECIES56 © The Corbett Foundation
Figure 6a: Map showing the distribution of camera trap location
in the buffer zone of the BTR
CHAPTER 6: POPULATION INDICES OF MAJOR CARNIVORE SPECIES 57© The Corbett Foundation
Figure 6b: Map showing the capture locations of leopard and tiger
in the buffer zone of the BTR

CHAPTER 6: VEGETATION STRUCTURE & COMPOSITION58 © The Corbett Foundation
VEgETATIOn STRUCTURE & COMPOSITIOn
6.5 DISCUSSIONThe use of photographic index rates as an index of animal abundance has been widely
debated (Carbone et al., 2002, Karanthet al., 2003). It has been argued that as the density
increases, the encounter rates between the camera traps and animals are also expected to increase
(Rovero & Marshall, 2009). Previous studies have shown strong relationships between the
density estimates and photographic encounter rates (Obrien et al., 2003- R2=0.79, Rowcliffe et
al., 2008- R2=0.69, Rovero & Marshall, 2009-R2=0.90). These studies thus provide convincing
application of photographic index rates as the measure of animal abundances. Moreover, our
prolonged and continuous sampling period (208 nights of continuous camera trapping) violated
the most important assumption of population closure, an assumption that is central to the theory
of closed capture-recapture models (Otis et al., 1978).
Our aim of camera trapping was to document the species presence
and generate population indices for major carnivore species.
Apart from the reappearance of Four-horned Antelope, we
documented two new species - Asiatic Wildcat and Smooth-coated
Otter - that were previously unreported from BTR. The occurrence
of Asiatic Wildcat in BTR was surprising, as the species was
previously thought to be distributed in the arid and semi-arid parts
of India (Nowell and Jackson, 1996).
The buffer zone of the reserve harbors important carnivore
assemblages including Tiger, Leopard and Sloth bear. Among large carnivores, tiger and leopard
were widely distributed species and occurred in all three ranges. Sloth Bear showed seasonal
variations in capture probability and encounter rates increased with the flowering of Mahua
trees. Sloth Bear also had the lowest encounter rate (1.65±0.61) among large carnivores. The
low encounter rate may be due to the seasonal variation in the capture probability of sloth bear.
Among the lesser cats, Jungle Cat and Asiatic Wildcat occurred in all three buffer
ranges and were also widely distributed. There was no apparent indication of any spatial
segregation between the two species. Among canids, Golden Jackal was the most abundant
species alongside with the Indian Fox. Striped Hyaena (Hyaena hyaena) was never captured
in camera traps and the Wild Dog or Dhole was captured only once during the entire survey,
suggesting very low and restrictive population of the Wild Dog in the reserve. The presence of
Striped Hyaena in the reserve is debatable, though individual sightings are often reported by
forest officials in the buffer zone.
Four-horned Antelope
CHAPTER 7: VEGETATION STRUCTURE & COMPOSITION 59© The Corbett Foundation
Chapter 7
VEgETATIOn STRUCTURE & COMPOSITIOn
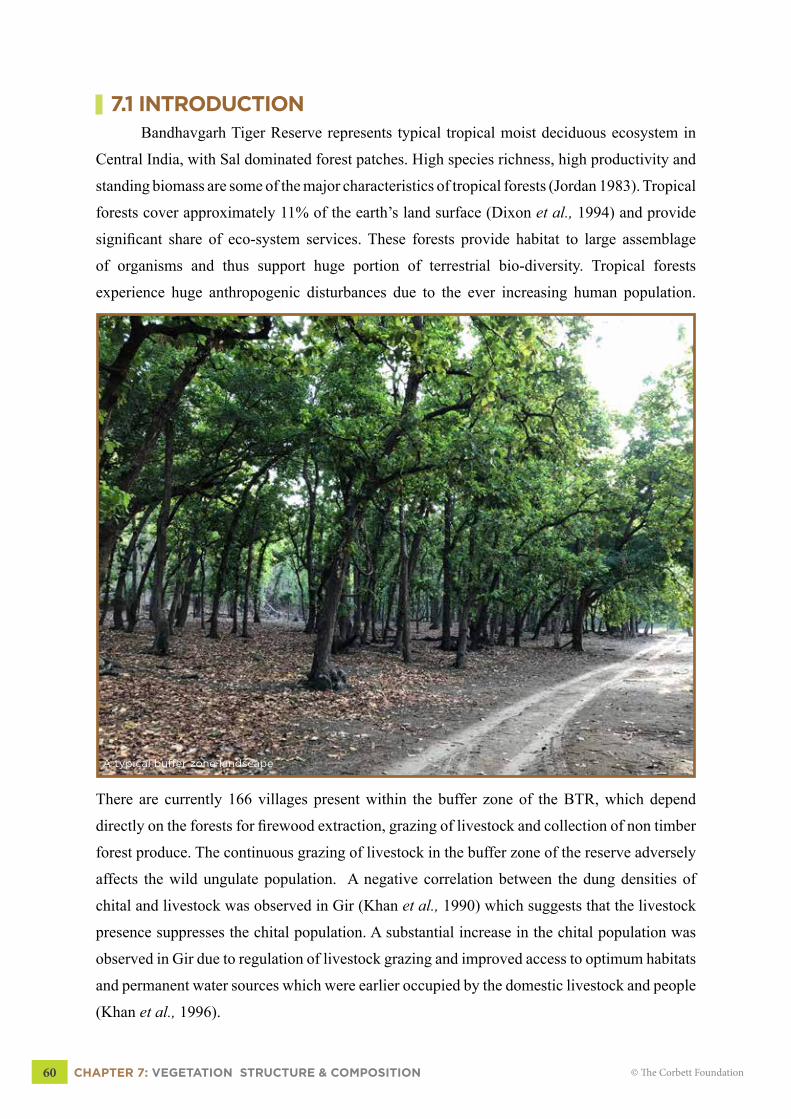
CHAPTER 7: VEGETATION STRUCTURE & COMPOSITION60 © The Corbett Foundation
7.1 INTRODUCTION Bandhavgarh Tiger Reserve represents typical tropical moist deciduous ecosystem in
Central India, with Sal dominated forest patches. High species richness, high productivity and
standing biomass are some of the major characteristics of tropical forests (Jordan 1983). Tropical
forests cover approximately 11% of the earth’s land surface (Dixon et al., 1994) and provide
significant share of eco-system services. These forests provide habitat to large assemblage
of organisms and thus support huge portion of terrestrial bio-diversity. Tropical forests
experience huge anthropogenic disturbances due to the ever increasing human population.
There are currently 166 villages present within the buffer zone of the BTR, which depend
directly on the forests for firewood extraction, grazing of livestock and collection of non timber
forest produce. The continuous grazing of livestock in the buffer zone of the reserve adversely
affects the wild ungulate population. A negative correlation between the dung densities of
chital and livestock was observed in Gir (Khan et al., 1990) which suggests that the livestock
presence suppresses the chital population. A substantial increase in the chital population was
observed in Gir due to regulation of livestock grazing and improved access to optimum habitats
and permanent water sources which were earlier occupied by the domestic livestock and people
(Khan et al., 1996).
A typical buffer zone landscape
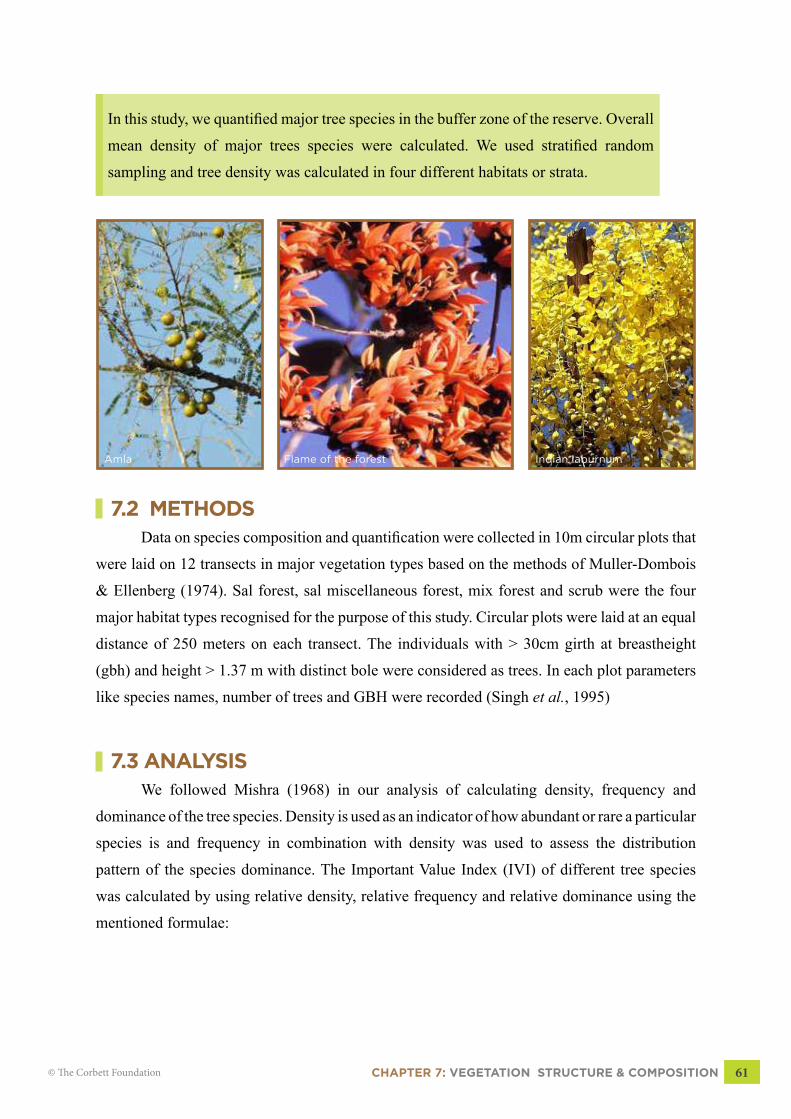
CHAPTER 7: VEGETATION STRUCTURE & COMPOSITION 61© The Corbett Foundation
In this study, we quantified major tree species in the buffer zone of the reserve. Overall
mean density of major trees species were calculated. We used stratified random
sampling and tree density was calculated in four different habitats or strata.
7.2 METHODSData on species composition and quantification were collected in 10m circular plots that
were laid on 12 transects in major vegetation types based on the methods of Muller-Dombois
& Ellenberg (1974). Sal forest, sal miscellaneous forest, mix forest and scrub were the four
major habitat types recognised for the purpose of this study. Circular plots were laid at an equal
distance of 250 meters on each transect. The individuals with > 30cm girth at breastheight
(gbh) and height > 1.37 m with distinct bole were considered as trees. In each plot parameters
like species names, number of trees and GBH were recorded (Singh et al., 1995)
7.3 ANALYSISWe followed Mishra (1968) in our analysis of calculating density, frequency and
dominance of the tree species. Density is used as an indicator of how abundant or rare a particular
species is and frequency in combination with density was used to assess the distribution
pattern of the species dominance. The Important Value Index (IVI) of different tree species
was calculated by using relative density, relative frequency and relative dominance using the
mentioned formulae:
Amla Flame of the forest Indian laburnum
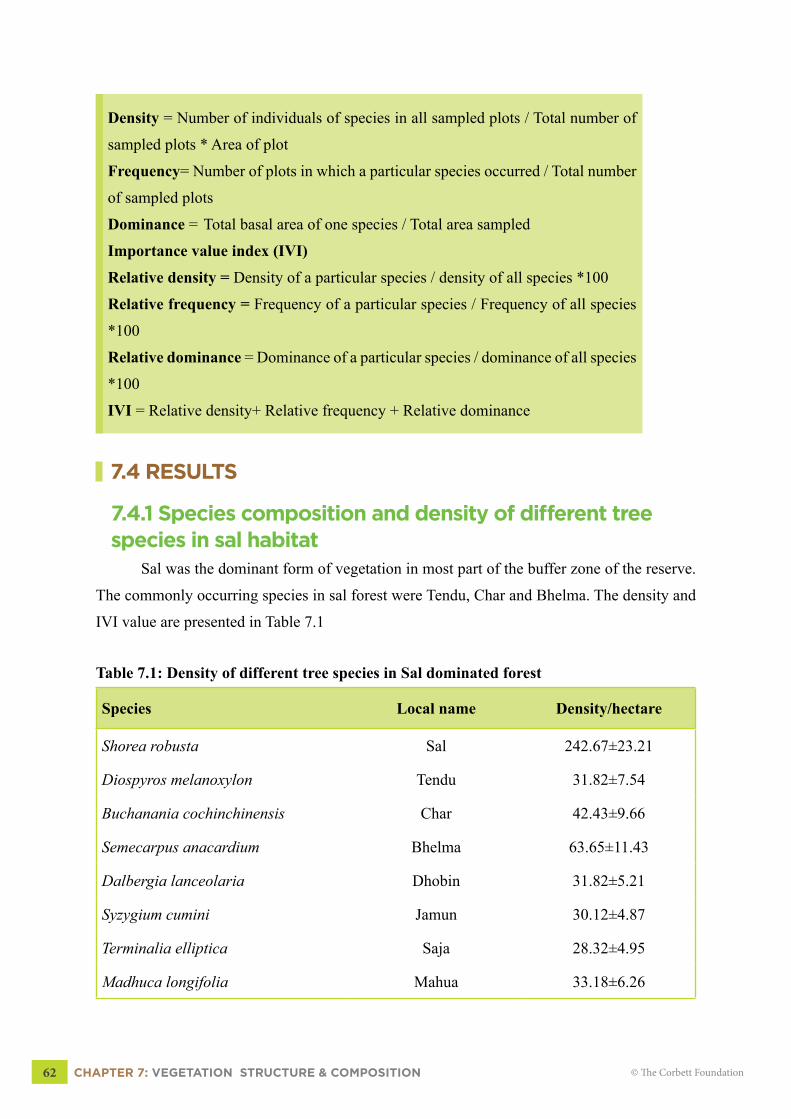
CHAPTER 7: VEGETATION STRUCTURE & COMPOSITION62 © The Corbett Foundation
Density = Number of individuals of species in all sampled plots / Total number of
sampled plots * Area of plot
Frequency= Number of plots in which a particular species occurred / Total number
of sampled plots
Dominance = Total basal area of one species / Total area sampled
Importance value index (IVI)
Relative density = Density of a particular species / density of all species *100
Relative frequency = Frequency of a particular species / Frequency of all species
*100
Relative dominance = Dominance of a particular species / dominance of all species
*100
IVI = Relative density+ Relative frequency + Relative dominance
7.4 RESULTS
7.4.1 Species composition and density of different tree species in sal habitat
Sal was the dominant form of vegetation in most part of the buffer zone of the reserve.
The commonly occurring species in sal forest were Tendu, Char and Bhelma. The density and
IVI value are presented in Table 7.1
Table 7.1: Density of different tree species in Sal dominated forest
Species Local name Density/hectare
Shorea robusta Sal 242.67±23.21
Diospyros melanoxylon Tendu 31.82±7.54
Buchanania cochinchinensis Char 42.43±9.66
Semecarpus anacardium Bhelma 63.65±11.43
Dalbergia lanceolaria Dhobin 31.82±5.21
Syzygium cumini Jamun 30.12±4.87
Terminalia elliptica Saja 28.32±4.95
Madhuca longifolia Mahua 33.18±6.26

CHAPTER 7: VEGETATION STRUCTURE & COMPOSITION 63© The Corbett Foundation
7.4.2 Species composition, density of different tree species in mix forest
A total of 279 individuals of 22 tree species were recorded in mixed forest. Bhirra,
Tendu and Ghont were the most abundant trees species in mixed forest with the densities of
109.94±18.67 per hectare, 82.37±21.70 per hactare and 63.65±15.73 per hectare, respectively.
Total tree density in this habitat was 1143.61±10.15 per hectare. See table 7.2 for further details.
Table 7.2: Density of different tree species in mix forest
Species Local name Density/hectare
Cassia fistula Amaltas 31.82±8.56
Phyllanthus emblica Amla 47.74±9.18
Pterocarpus marsupium Beeja 31.82±7.45
Casearia elliptica Bheri 50.92±11.23
Chloroxylon swietenia Bhirra 109.94±18.67
Buchanania cochinchinensis Char 58.34±13.39
Mitragyna parvifolia Kadam 31.82±7.50
Dalbergia lanceolaria Dhobin 53.04±17.88
Wrightia tinctoria Doodhi 42.43±9.78
Ziziphus xylopyrus Ghont 63.65±15.73
Lannea coromandelica Gurja 37.13±7.25
Haldina cordifolia Haldu 31.82±8.19
Terminalia chebula Harra 33.18±11.16
Syzygium cumini Jamun 57.74±13.88
Acacia catechu Khair 74.26±17.33
Madhuca longifolia Muhua 33.54±9.10
Diospyros montana Patvan 28.65±7.67
Terminalia elliptica Saja 63.65±11.90
Shorea robusta Sal 99.87±17.56
Boswellia serrata Salieh 34.45±8.11
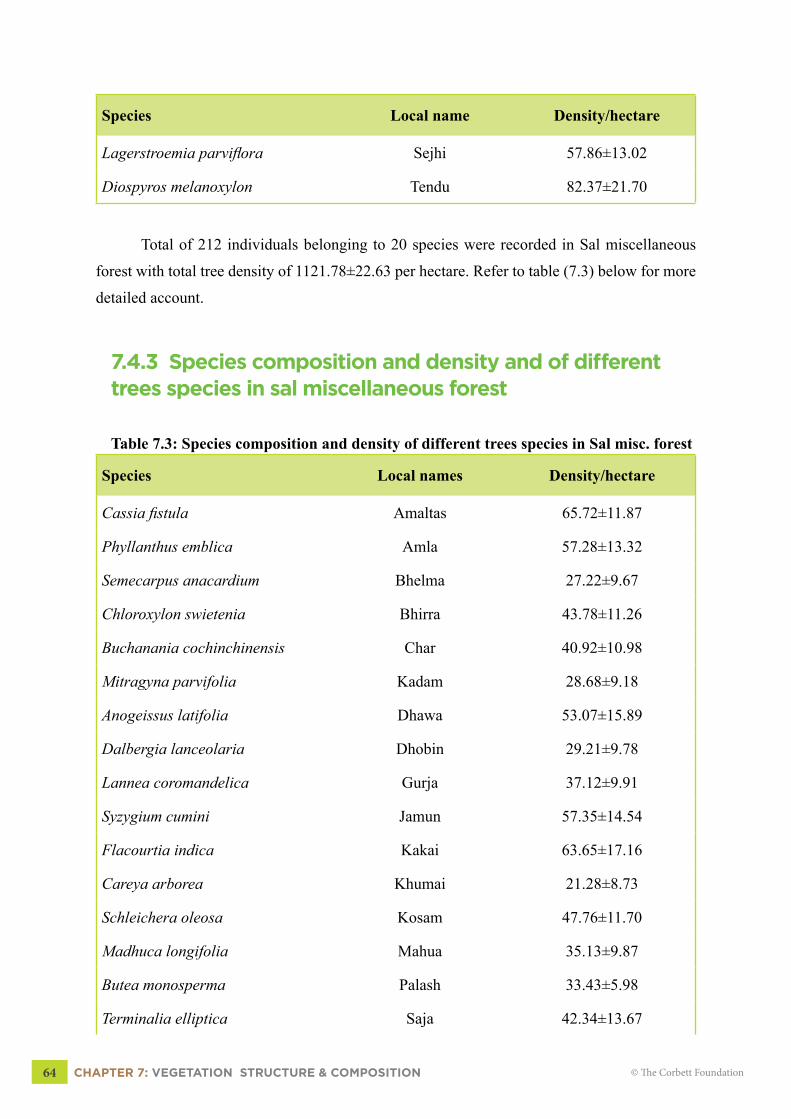
CHAPTER 7: VEGETATION STRUCTURE & COMPOSITION64 © The Corbett Foundation
Species Local name Density/hectare
Lagerstroemia parviflora Sejhi 57.86±13.02
Diospyros melanoxylon Tendu 82.37±21.70
Total of 212 individuals belonging to 20 species were recorded in Sal miscellaneous
forest with total tree density of 1121.78±22.63 per hectare. Refer to table (7.3) below for more
detailed account.
7.4.3 Species composition and density and of different trees species in sal miscellaneous forest Table 7.3: Species composition and density of different trees species in Sal misc. forest
Species Local names Density/hectare
Cassia fistula Amaltas 65.72±11.87
Phyllanthus emblica Amla 57.28±13.32
Semecarpus anacardium Bhelma 27.22±9.67
Chloroxylon swietenia Bhirra 43.78±11.26
Buchanania cochinchinensis Char 40.92±10.98
Mitragyna parvifolia Kadam 28.68±9.18
Anogeissus latifolia Dhawa 53.07±15.89
Dalbergia lanceolaria Dhobin 29.21±9.78
Lannea coromandelica Gurja 37.12±9.91
Syzygium cumini Jamun 57.35±14.54
Flacourtia indica Kakai 63.65±17.16
Careya arborea Khumai 21.28±8.73
Schleichera oleosa Kosam 47.76±11.70
Madhuca longifolia Mahua 35.13±9.87
Butea monosperma Palash 33.43±5.98
Terminalia elliptica Saja 42.34±13.67
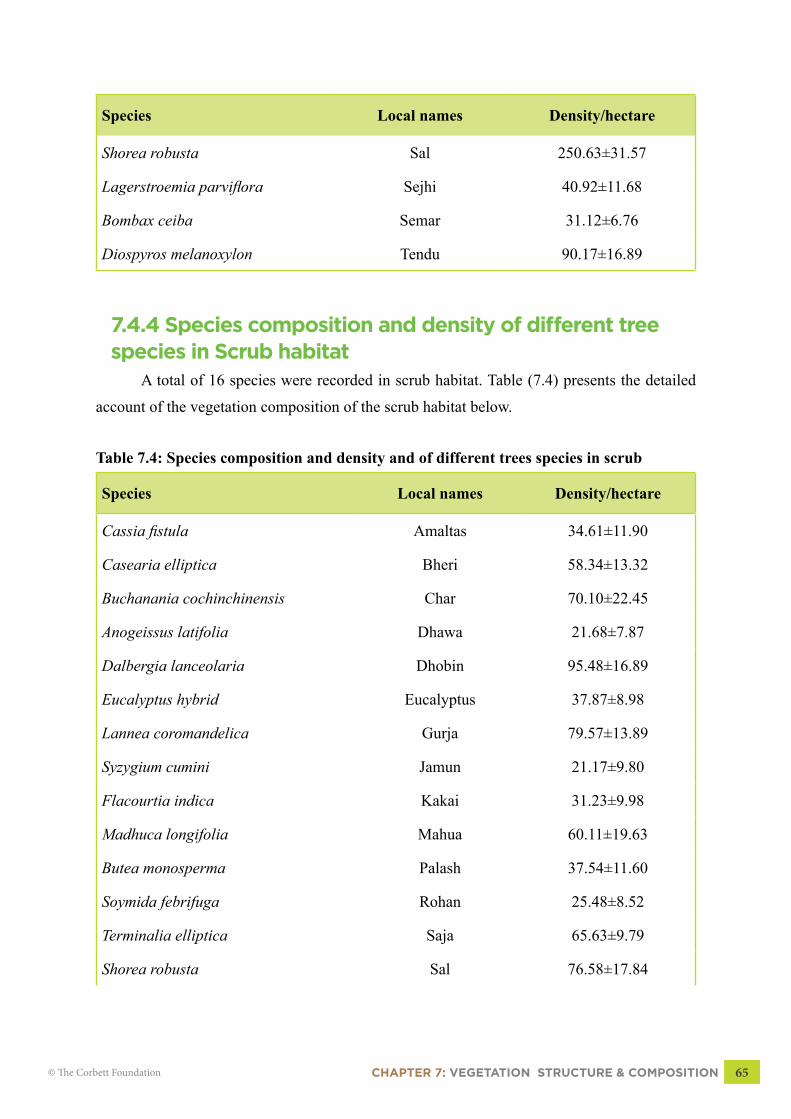
CHAPTER 7: VEGETATION STRUCTURE & COMPOSITION 65© The Corbett Foundation
Species Local names Density/hectare
Shorea robusta Sal 250.63±31.57
Lagerstroemia parviflora Sejhi 40.92±11.68
Bombax ceiba Semar 31.12±6.76
Diospyros melanoxylon Tendu 90.17±16.89
7.4.4 Species composition and density of different tree species in Scrub habitat
A total of 16 species were recorded in scrub habitat. Table (7.4) presents the detailed
account of the vegetation composition of the scrub habitat below.
Table 7.4: Species composition and density and of different trees species in scrub
Species Local names Density/hectare
Cassia fistula Amaltas 34.61±11.90
Casearia elliptica Bheri 58.34±13.32
Buchanania cochinchinensis Char 70.10±22.45
Anogeissus latifolia Dhawa 21.68±7.87
Dalbergia lanceolaria Dhobin 95.48±16.89
Eucalyptus hybrid Eucalyptus 37.87±8.98
Lannea coromandelica Gurja 79.57±13.89
Syzygium cumini Jamun 21.17±9.80
Flacourtia indica Kakai 31.23±9.98
Madhuca longifolia Mahua 60.11±19.63
Butea monosperma Palash 37.54±11.60
Soymida febrifuga Rohan 25.48±8.52
Terminalia elliptica Saja 65.63±9.79
Shorea robusta Sal 76.58±17.84

CHAPTER 7: VEGETATION STRUCTURE & COMPOSITION66 © The Corbett Foundation
Species Local names Density/hectare
Lagerstroemia parviflora Sejhi 24.31±10.34
Diospyros melanoxylon Tendu 78.52±21.87
7.5 IMPORTANT VALUE INDEx OF ALL TREE SPECIES IN THE BUFFER ZONE OF THE BTR
IVI values are used to determine the overall importance of each species in the community
structure. Graph 7 represents the IVI values of all the tree species encountered during vegetation
sampling in the buffer zone of the BTR.
160140120100806040200
Shorea
robu
sta
Diospy
ros m
elano
xylon
Bucha
nania
coch
inchin
esis
Lagers
troem
ia pa
rviflora
Chlorox
ylon s
wieten
ia
Madhu
ca lon
gifoli
a
Lanne
a coro
mande
lica
Termina
lia el
liptic
a
Caseria
ellip
tica
Dalberg
ia lan
ceolar
ia
Phylla
nthus
embli
ca
Syzyg
ium cu
mini
Cassia
fistula
Semeca
rpus a
nacar
dium
Graph 7: Graph showing the IVI value of major tree species
in the buffer zone of BTR
160140120100806040200
Shorea
robu
sta
Diospy
ros m
elano
xylon
Bucha
nania
coch
inchin
esis
Lagers
troem
ia pa
rviflora
Chlorox
ylon s
wieten
ia
Madhu
ca lon
gifoli
a
Lanne
a coro
mande
lica
Termina
lia el
liptic
a
Caseria
ellip
tica
Dalberg
ia lan
ceolar
ia
Phylla
nthus
embli
ca
Syzyg
ium cu
mini
Cassia
fistula
Semeca
rpus a
nacar
dium
CHAPTER 8: THREATS, LIMITATIONS & RECOMMENDATIONS 67© The Corbett Foundation
Chapter 8
THREATS, LIMITATIOnS & RECOMMEnDATIOnS
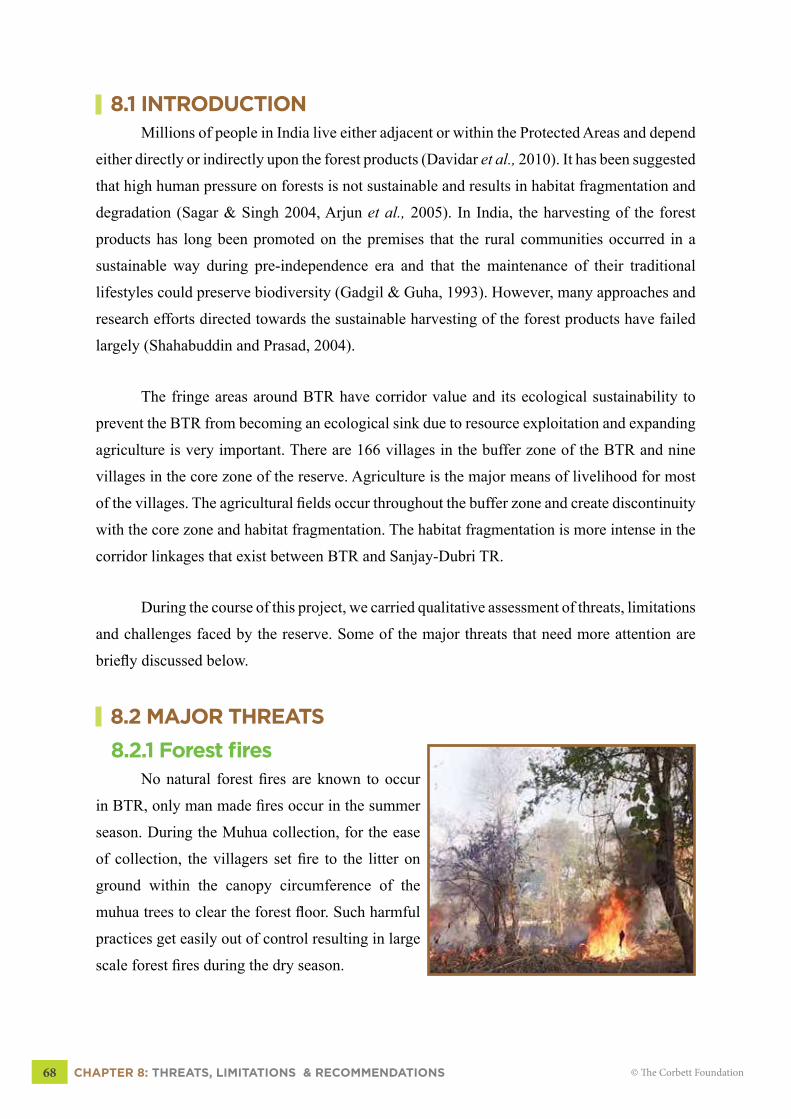
CHAPTER 8: THREATS, LIMITATIONS & RECOMMENDATIONS68 © The Corbett Foundation
8.1 INTRODUCTION
Millions of people in India live either adjacent or within the Protected Areas and depend
either directly or indirectly upon the forest products (Davidar et al., 2010). It has been suggested
that high human pressure on forests is not sustainable and results in habitat fragmentation and
degradation (Sagar & Singh 2004, Arjun et al., 2005). In India, the harvesting of the forest
products has long been promoted on the premises that the rural communities occurred in a
sustainable way during pre-independence era and that the maintenance of their traditional
lifestyles could preserve biodiversity (Gadgil & Guha, 1993). However, many approaches and
research efforts directed towards the sustainable harvesting of the forest products have failed
largely (Shahabuddin and Prasad, 2004).
The fringe areas around BTR have corridor value and its ecological sustainability to
prevent the BTR from becoming an ecological sink due to resource exploitation and expanding
agriculture is very important. There are 166 villages in the buffer zone of the BTR and nine
villages in the core zone of the reserve. Agriculture is the major means of livelihood for most
of the villages. The agricultural fields occur throughout the buffer zone and create discontinuity
with the core zone and habitat fragmentation. The habitat fragmentation is more intense in the
corridor linkages that exist between BTR and Sanjay-Dubri TR.
During the course of this project, we carried qualitative assessment of threats, limitations
and challenges faced by the reserve. Some of the major threats that need more attention are
briefly discussed below.
8.2 MAJOR THREATS8.2.1 Forest fires
No natural forest fires are known to occur
in BTR, only man made fires occur in the summer
season. During the Muhua collection, for the ease
of collection, the villagers set fire to the litter on
ground within the canopy circumference of the
muhua trees to clear the forest floor. Such harmful
practices get easily out of control resulting in large
scale forest fires during the dry season.
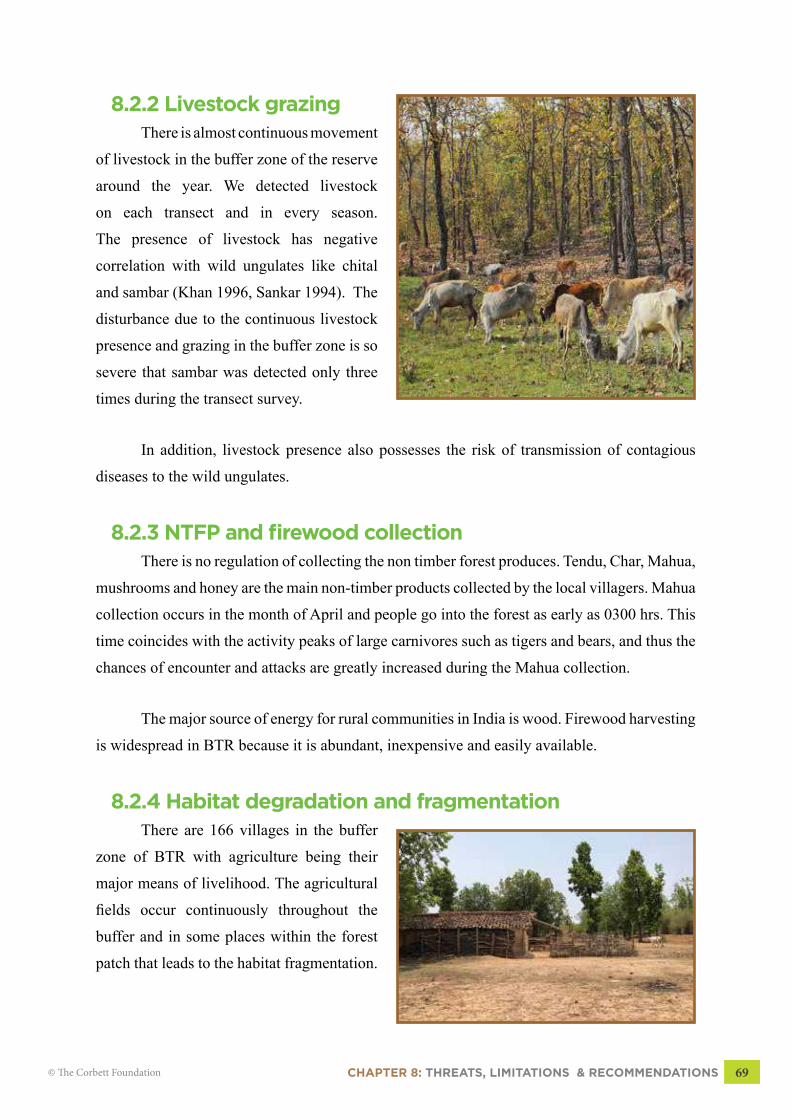
CHAPTER 8: THREATS, LIMITATIONS & RECOMMENDATIONS 69© The Corbett Foundation
8.2.2 Livestock grazingThere is almost continuous movement
of livestock in the buffer zone of the reserve
around the year. We detected livestock
on each transect and in every season.
The presence of livestock has negative
correlation with wild ungulates like chital
and sambar (Khan 1996, Sankar 1994). The
disturbance due to the continuous livestock
presence and grazing in the buffer zone is so
severe that sambar was detected only three
times during the transect survey.
In addition, livestock presence also possesses the risk of transmission of contagious
diseases to the wild ungulates.
8.2.3 NTFP and firewood collectionThere is no regulation of collecting the non timber forest produces. Tendu, Char, Mahua,
mushrooms and honey are the main non-timber products collected by the local villagers. Mahua
collection occurs in the month of April and people go into the forest as early as 0300 hrs. This
time coincides with the activity peaks of large carnivores such as tigers and bears, and thus the
chances of encounter and attacks are greatly increased during the Mahua collection.
The major source of energy for rural communities in India is wood. Firewood harvesting
is widespread in BTR because it is abundant, inexpensive and easily available.
8.2.4 Habitat degradation and fragmentationThere are 166 villages in the buffer
zone of BTR with agriculture being their
major means of livelihood. The agricultural
fields occur continuously throughout the
buffer and in some places within the forest
patch that leads to the habitat fragmentation.
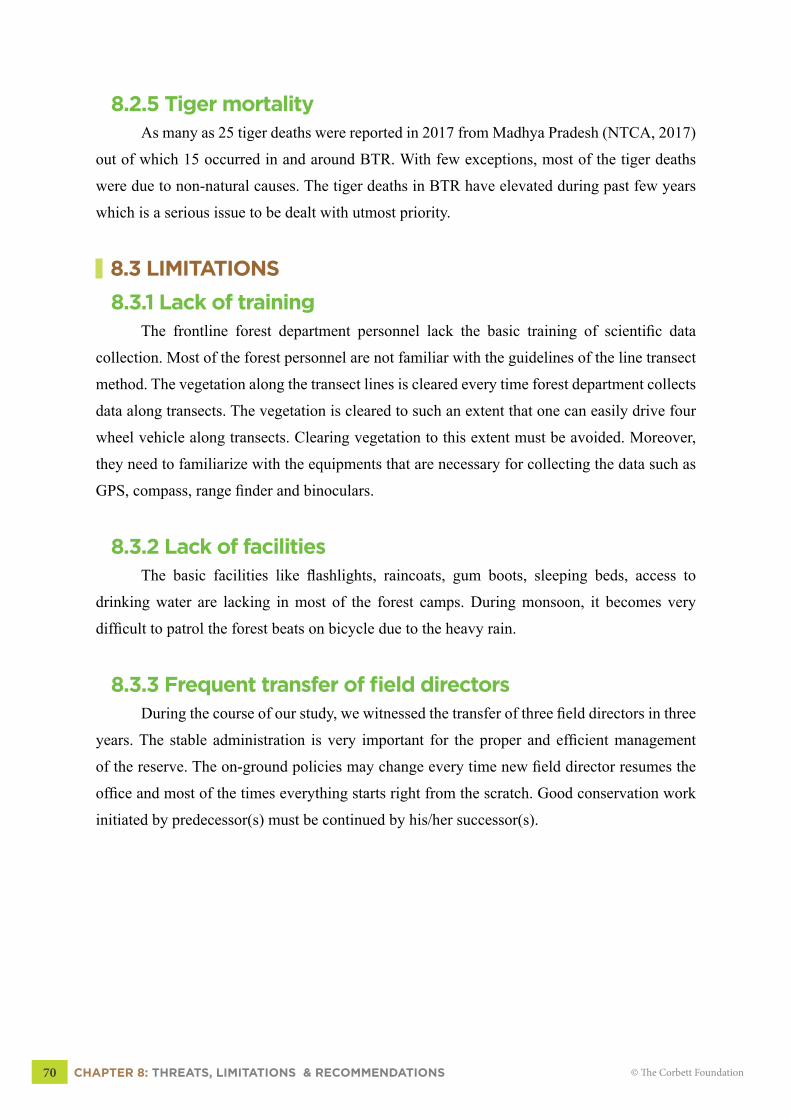
CHAPTER 8: THREATS, LIMITATIONS & RECOMMENDATIONS70 © The Corbett Foundation
8.2.5 Tiger mortalityAs many as 25 tiger deaths were reported in 2017 from Madhya Pradesh (NTCA, 2017)
out of which 15 occurred in and around BTR. With few exceptions, most of the tiger deaths
were due to non-natural causes. The tiger deaths in BTR have elevated during past few years
which is a serious issue to be dealt with utmost priority.
8.3 LIMITATIONS 8.3.1 Lack of training
The frontline forest department personnel lack the basic training of scientific data
collection. Most of the forest personnel are not familiar with the guidelines of the line transect
method. The vegetation along the transect lines is cleared every time forest department collects
data along transects. The vegetation is cleared to such an extent that one can easily drive four
wheel vehicle along transects. Clearing vegetation to this extent must be avoided. Moreover,
they need to familiarize with the equipments that are necessary for collecting the data such as
GPS, compass, range finder and binoculars.
8.3.2 Lack of facilitiesThe basic facilities like flashlights, raincoats, gum boots, sleeping beds, access to
drinking water are lacking in most of the forest camps. During monsoon, it becomes very
difficult to patrol the forest beats on bicycle due to the heavy rain.
8.3.3 Frequent transfer of field directorsDuring the course of our study, we witnessed the transfer of three field directors in three
years. The stable administration is very important for the proper and efficient management
of the reserve. The on-ground policies may change every time new field director resumes the
office and most of the times everything starts right from the scratch. Good conservation work
initiated by predecessor(s) must be continued by his/her successor(s).
CHAPTER 8: THREATS, LIMITATIONS & RECOMMENDATIONS 71© The Corbett Foundation
8.4 RECOMMENDATIONS
The present study was undertaken to study the dispersal routes of tigers and other wildlife in the buffer zone of Bandhavgarh Tiger Reserve (BTR). The study also highlighted potential of the buffer zone to support dispersing tigers, leopards and other animals and to identify the threats these animals encounter given the connectivity of BTR buffer zone with South and North Shahdol Forest Divisions that further connects to Sanjay Dubri Tiger Reserve. It identifies the areas being used by tigers and suggests strategies for the long-term protection and management of the areas that need immediate attention. Based on the study, The Corbett Foundation (TCF) has the following recommendations to offer to Madhya Pradesh Forest Department.
a. Inclusion of more areas in BTR buffer: Inclusion of the territorial forest areas around the buffer zone of BTR as the buffer zone is highly recommended to ensure forest connectivity; particularly Tikhwa circle, which connects Panpatha buffer zone of BTR in North, and Jaisinghnagar forest range, which connects Manpur buffer zone of BTR in the east and southeast. The camera trap images of the tigers from the Bandhavgarh have been found in the Jaisinghnagar forest range (study undergoing, TCF, 2018) and in one incident a dead tiger was found in the Jaisinghnagar forest range which was later identified as dispersed individual from BTR. This indicates the dispersal of tigers from Bandhavgarh to the adjacent territorial forest divisions.
b. Capacity building of frontline personnel: Intensive training of frontline forest personnel in the matters of scientific data collection and familiarization with modern equipments is needed. During the course of this study, we observed that the frontline forest personnel who deal with the data collection lacked the necessary skills and proper training about the data collection in the field.
c. Regulation on livestock grazing: With around 1.40 lakh cattle population in the buffer zone of BTR, uncontrolled grazing is a critical issue. Livestock grazing puts severe pressure on the habitat and livestock compete for food with wild ungulates. Areas frequented by livestock show no signs of forest regeneration and invasive weeds take over. To deal with this issue, local villagers should be encouraged to grow fodder species around the villages to reduce the pressure of grazing on natural forests. Areas overgrown with Lantana camara (and other weeds) could be converted to grass plots from where villagers could harvest grass in a controlled manner for their livestock. This could pave way for stall feeding cattle. In addition to this revenue patches available around the village can be developed into Gauchars (Grazing areas) to reduce pressure on forests.
d. Regulation on collection of NTFPs: Local communities enter the forest very early for the collection of Mahua flowers, which not only increase the incidents of human-wildlife conflict but also deprived the wild animals of this valuable food resource. There should be regulation on the time of entry in the forest for the locals. People often set fire to the leaf litter below the Mahua trees instead of cleaning the litter manually, which has negative impact on flora and fauna of the area. These fires often spread to nearby areas thus destroying the habitat. People often cut the entire tree or large branches while collecting Char or Amla. This should be controlled strictly.
e. Eradication of invasive species: During the study, we found large areas covered in Lantana camara in all three ranges of buffer zone of BTR. The presence of lantana on a large scale presents a high risk of this invasive species being spread to core zone forests by means of dispersal by birds and animals such as jackal, bear and langur. Removal of lantana should be taken up on a priority basis with the involvement of local communities. Lantana removed can be reused as firewood for households and local community members could also be trained to make handicrafts out of dried Lantana. This could earn them additional livelihood and thus a win-win situation. Ipomoea carnea is another invasive weed that has colonised itself along marshy areas, rivers and around lakes/ponds in villages of the buffer zone. It spreads quickly and eventually engulfs the water body
CHAPTER 8: THREATS, LIMITATIONS & RECOMMENDATIONS72 © The Corbett Foundation
completely making it useless for the local villagers, livestock and wild animals. Urgent measures should be undertaken to remove this weed from local water bodies and restore these wetlands. Other invasive species that need attention and eradication is Eichhornia crassipes that has spread over some of the water bodies. If not controlled, there is a risk of these plants covering the entire water surface killing the wetland ecosystem completely.
f. Construction and maintenance of waterholes: The low density of ungulates in the summer season may also be attributed to the absence of permanent water sources in the buffer zone. Therefore waterholes should be constructed in the buffer zone to ensure availability of water for wildlife during summer. These waterholes should be regularly monitored for wild animal presence, especially in the summers. These waterholes could be ‘hotspots’ for miscreants and therefore guarded properly.
g. Creating livelihood opportunities for local communities: Unemployed local youth need to be provided with alternative livelihood opportunities. Unemployed men and women should be provided vocational skills so that they are able to earn income in addition to their traditional farming. Local communities youths could be involved in forest conservation programs.
h. Discourage collection of firewood: Villagers cut trees to meet the demand for firewood. Villagers should be encouraged to use LPG and/or installation of energy-efficient cook stoves in their houses. Currently, most of the households use traditional chulah with almost 100% dependency on the firewood collected from forests. Unless the villagers shift from this traditional cooking style to using LPG or at least any energy-efficient cook stove, the demand for firewood will not come down. This is directly proportional to rising human-wildlife conflict. More the people enter the forests, higher the chances of them encountering wild animals that may lead to human-wildlife conflict. Villagers should be encouraged, convinced or forced to shift from this traditional way of cooking to a cleaner and energy-efficient alternatives. This is not only better for the health of the forest ecosystem but also good for people’s own health. Village common lands need to be brought under plantation of fast-growing species such as Albizia procera that will provide firewood to the people. This will help in reducing the demand for fire wood collection from forests. Such species should be promoted for plantation in school campuses throughout the buffer zone.
i. Increased surveillance: BTR is one of the best known tiger reserves in not only Madhya Pradesh but the entire country. Due the years of protection and good management practices, BTR has become a success story for tiger conservation. The core zones of Tala, Magadhi, Khitauli, Kallawah, Pataur and Panpatha serve as the best breeding areas for tigers and thus help in increased tiger numbers. However, every good tiger habitat has a carrying capacity and this applies to BTR too. Young tigers tend to disperse to the buffer zone ranges and the adjacent territorial divisions in pursuit of newer territory, prey and mate. Once these tigers are out of the core zones, they are moving about in human-dominated landscapes that have high numbers of livestock that become easy prey for these tigers. Preying on cattle puts these tigers in conflict with local villagers, who may resort to retaliatory measures if they are not compensated quickly for their losses. Buffer zones and territorial forest areas also become hotspots for poachers as they may indulge in killing of tigers using live electric wires, snares or poisoning. Therefore, it is necessary to increase surveillance in these areas to prevent any such eventualities.
j. Covering of open wells: There are 53 villages located in and adjoining the core zone of BTR (12 villages inside the core zone and 41 villages adjoining to the boundary) while 113 villages are located in and around the buffer zone. Agriculture is the primary occupation of the communities residing in these villages. The Government of Madhya Pradesh provides dug-wells to the local farmers for irrigation purpose and there are hundreds of such dug-wells in the vicinity of BTR. These wells pose a grave threat to wildlife species in BTR as they do not have boundary walls (parapet). Wild animals that move out of BTR core zone in search of water or for raiding the crops, accidentally fall in these wells (mostly during
CHAPTER 8: THREATS, LIMITATIONS & RECOMMENDATIONS 73© The Corbett Foundation
the night) and drown. Prevention of these accidental deaths of wild animals is a major challenge that needs to be addressed by covering the open wells with fencing or parapet walls.
k. Restoration of degraded habitat: Frequent grazing by domestic animals and cutting of trees for timber and firewood collection, has resulted in habitat degradation in several patches throughout the buffer zone. These degraded patches are colonized by invasive weeds such as lantana. Habitat restoration should be undertaken on a priority basis in buffer zone. Habitat restoration is a long process and will take at least 10 years for any habitat recovery. This provides for a huge opportunity to recreate wilderness by planting indigenous species of trees, shrubs and grasses to create a heterogeneous habitat.
l. Avoiding linear infrastructure: Linear infrastructure such as roads, railway lines and power lines poses threat to free movement of wild animals. Therefore, unless absolutely necessary, linear infrastructure must be avoided in any tiger reserve. Already several all weather roads pass through BTR connecting nearest town and cities such as Katni, Satna, Shahdol, Jabalpur and Umaria. These roads are well maintained and have huge traffic movement in the day and during the night. This road network cuts through several core and buffer zone areas of BTR. There have been several documented records of wild animals such as tigers, leopards, sloth bears, smaller cats, jackals, etc. that have been killed in road accidents. The road passing through BTR core zone (Bandhavgarh National Park and Panpatha WLS) have been repaired few years ago with underpasses created for free movement of wild animals and are closed for heavy vehicular traffic after dusk till dawn. BTR should identify wild animals crossing hotspots in the buffer and put speed control barriers to prevent road kills. Further, increase in linear infrastructure should be avoided in the interest of preventing accidents of wild animals.
m. Vaccination of domestic livestock: BTR has 1.40 lakhs domestic livestock in all its villages. Many of these animals are freely grazing in BTR and pose a direct risk to the health of wild ungulates as they share common grazing areas. Domestic livestock may be carriers of Foot and Mouth Disease (FMD), Hemorrhagic Septicemia (HS) and Black Quarter (BQ) that may transmit to wild ungulates. Therefore, it is necessary that domestic livestock populations are vaccinated against these diseases every year to prevent disease epidemic among the wild animals.
n. Solid waste disposal: With the increase in tourism infrastructure around BTR, disposal of solid waste generated in BTR has increased exponentially in past decade. Due to the absence of any formal waste disposal mechanism prescribed by the local administration, piles of non-biodegradable solid wastes have unfortunately become common sights around villages. Some of this waste is burnt (creating air pollution) but most of its remains thus attracting scavengers such as stray dogs. Solid waste management must be encouraged among the villages through Eco Development Committees (EDC) and local NGOs.
o. Controlling the population of stray dogs: Several research studies have identified free-ranging stray dogs as threat to wildlife populations. Dogs are known to predate on deers, hare by forming packs. Dogs are also known to drive away jackals and wolfs from their hunting grounds and vultures from carcasses. They also predate on ground-dwelling birds and other burrowing animals. Dogs can be are carriers of Canine Distemper Virus and thus pose a huge risk of spreading this to tigers and leopards. Their threat to human population due to rabies is also well known. Therefore, it is necessary to strictly control stray dog populations in BTR area by undertaking spay neuter programmes. These programmes, when implemented systematically, can eventually control the dog population from increasing and spreading to other areas.
CHAPTER 8: THREATS, LIMITATIONS & RECOMMENDATIONS74 © The Corbett Foundation
CHAPTER 8: REFERENCES 75© The Corbett Foundation
REfEREnCES
CHAPTER 8: REFERENCES76 © The Corbett Foundation
Ackerman, B.B., Lindzey, F.G. & Hernker, T.P. (1984). Cougar food habits in
southern Utah. Journal of Wildlife Management. 48, 147–155
Arjunan, M., Puyravaud, J.-Ph., Davidar, P. (2005). The impact of resource collection
by local communities on the dry forests of the Kalakad–Mundanthurai Tiger Reserve. Tropical
Ecology 46, 135–144.
Burnham, K.P., Anderson, D.R. & Laake, J.L. (1980) Estimation of density from line
transect sampling of biological populations. Wildlife Monographs, 72, 1-202.
Buckland, S.T., Anderson, D.R., Burnham, K.P. & Laake J.L. (1993) Distance Sampling.
Estimating Abundance of Biological Populations. Chapman and Hall, London.
Carbone, C., Christie, S., Conforti, K., Coulson, T., Franklin, N., Ginsberg, J. R., …
Wan Shahruddin, W. N. (2001). The use of photographic rates to estimate densities of tigers
and other cryptic mammals. Animal Conservation, 4(2001), 75–79. https://doi.org/10.1017/
S1367943002002172
Champion, H. G. and S. K. Seth. 2005. A Revised Survey of the Forest Typesof India.
Natraj Publishers, Dehradun.
Chundawat, R.S., Gogate, N. & Johnsingh, A.J.T. (1999).Tigers in Panna: preliminary
results from an Indian tropicaldry forest. In Riding the tiger: tiger conservation inhuman
dominated landscapes: 123–129. Seidensticker, J.,Christie, S. & Jackson, P. (Eds). Cambridge:
CambridgeUniversity Press.
Dixon, R. K., S, Brown, R. A. Houghon, A. M. Solomon, M. C. Trexler and J.Wisniewski.
1994. Carbon pools and flux of global ecosystems.Science 263, 185-190.
Di Bitetti, M. S., Paviolo, A., & De Angelo, C. (2006). Density, habitat use and activity
patterns of ocelots (Leopardus pardalis) in the Atlantic Forest of Misiones, Argentina. Journal
of Zoology, 270(1), 153–163. https://doi.org/10.1111/j.1469-7998.2006.00102.x
Dutta, T., Sharma, S., McRae, B. H., Roy, P. S., & DeFries, R. (2016). Connecting the
dots: mapping habitat connectivity for tigers in central India. Regional Environmental Change,
16(October), 53–67. https://doi.org/10.1007/s10113-015-0877-z
Davidar, P., Sahoo, S., Mammen, P. C., Acharya, P., Puyravaud, J., Arjunan, M., …
Roessingh, K. (2010). Assessing the extent and causes of forest degradation in India : Where
do we stand ? Biological Conservation, 143(12), 2937–2944.
Floyd, T.J., Mech, L.D. & Jordan, P.A. 1978: Relating wolf scat content to prey
consumed. - Journal of Wildlife Management 42 (3): 528-532.
Gerber, B. D., Karpanty, S. M., & Randrianantenaina, J. (2012). Activity patterns of
carnivores in the rain forests of Madagascar: implications for species coexistence. Journal of
Mammalogy, 93(3), 667–676. https://doi.org/10.1644/11-MAMM-A-265.1
CHAPTER 8: REFERENCES 77© The Corbett Foundation
Gilbert, F., Gonzalez, A., & Evans-freke, I. (1998). Corridors maintain species richness
in the fragmented landscapes of a microecosystem, (December 1997).
Gour, D. S., Bhagavatula, J., Bhavanishankar, M., Reddy, P. A., Gupta, J. A., Sarkar,
M. S., … Shivaji, S. (2013). Philopatry and Dispersal Patterns in Tiger (Panthera tigris). PLoS
ONE, 8(7), 14–17. https://doi.org/10.1371/journal.pone.0066956
Gadgil, M., Guha, R. (1993). This Fissured Land: An Ecological History of India.
University of California Press, USA.
Huck, M., Jêdrzejewski, W., Borowik, T., Osz-cielma, M. M. I., Schmidt, K.,
Jêdrzejewska, B., … Schmidt, K. (2010). Habitat suitability , corridors and dispersal barriers for
large carnivores in Poland, 55(2), 177–192. https://doi.org/10.4098/j.at.0001-7051.114.2009
Jhala YV, Qureshi Q, Gopal R, Sinha PR (2011) Status of tigers, copredators and prey in
India. National Tiger Conservation Authority, Govt. of India, New Delhi, and Wildlife Institute
of India, Dehra Dun. TR 2011/003 pp-302. http://projecttiger.nic.
Jordan, C.F. 1983. Productivity of tropical rain forest eco systems and the implications
for their use as future wood and energy sources. In: Golley, F.B. (ed.) Ecosystems of the world.
Tropical rain forest ecosystems, pp. 117-136. Elsevier, Amsterdam, NL.
Johnsingh, A.J.T. (1992). Prey selection in three sympatric carnivores in Bandipur.
Mammalia 56, 517–526.
Johnsingh A. J. T. and Shankar K. 1991. Food plants of chital, sambar and cattle on
Mundanthurai Plateau, Tamil Nadu, South India. Mammalia 55: 57-66.
Karanth, K. U., & Nichols, J. D. (1998). Estimation of tiger densities in India using
photographic captures and recaptures. Ecology, 79(8), 2852–2862. https://doi.org/10.1890/0012-
9658(1998)079[2852:EOTDII]2.0.CO;2
Karanth, K. U., Nichols, J. D., Seidensticker, J., Dinerstein, E., Smith, J. L. D., McDougal,
C., … Seidenstricker, J. (2003). Science deficiency in conservation practice: the monitoring
of tiger populations in India. Animal Conservation, 6(2), 141–146. https://doi.org/10.1017/
S1367943002004000
Karanth, K.U. 1991. Ecology and management of tigers in tropical Asia. In : Maruyama,
Bobek, B., Ono, Y., Regelin, W., Bartos, L., and Ratcliffe, R. (Ed.), Wildlife conservation:
Present trends and perspectives for the 21st century. Japan wildlife research center, Tokyo,
156-159.
Karanth, K.U. & Stith, B.M. (1999). Prey depletion as a critical determinant of tiger
population viability. In Riding the tiger: tiger conservation in human dominated landscapes:
100– 113. Siedensticker, J., Christie, S. & Jackson, P. (Eds). Cambridge: Cambridge University
Press.
CHAPTER 8: REFERENCES78 © The Corbett Foundation
Kanath K. Ullas and Melvine E. Sunquist. 1995. Prey selection by tiger, leopard and
dhole in tropical forests. Journal of Animal Ecology 64: 439-450.
Karanth, K. U. & Sunquist, M. E. (1992). Population structure,density and biomass of
large herbivores in the tropical forests ofNagarhole, India. J. trop. Ecol. 8: 21–35.
Khan, J. A., Rodgers, W. A., Johnsingh, A. J. T. & Mathur, P. K. 1990. Gir lion project:
ungulate habitat ecology in Gir. Final project report. Wildlife Institute of India. 214
Khan, J. A., Chellam, R., Rodgers, W. A. & Johnsingh, A. J. T.(1996). Ungulate densities
and biomass in tropical dry deciduousforests of Gir, Gujarat, India. J. trop. Ecol. 12: 149– 162.
Khan J. A. 1994. Food habits of ungulates in dry tropical forests of Gir Lion Sanctuary,
Gujarat, India. Acta theriol. 39: 185-193.
Koppikar, B.R. & Sabnis, J.H. (1976). Identification of hairs of some Indian mammals.
J. Bombay Nat. Hist. Soc. 73, 5–20.
Krishnendu Mondal, Shilpi Gupta, Qamar Qureshi and Kalyanasundaram Sankar (2011)
Prey selection and food habits of leopard (Panthera pardusfusca) in Sariska Tiger Reserve,
Rajasthan, India. Mammalia 75 (2011): 201–205
Klare, Unn, Jan F. Kamler, and David W. Macdonald. “A comparison and critique of
different scat‐analysis methods for determining carnivore diet.” Mammal Review 41, no. 4
(2011): 294-312.
Lucas, T. C. D., Moorcroft, E. A., Freeman, R., Rowcliffe, J. M., & Jones, K. E. (2015).
A generalised random encounter model for estimating animal density with remote sensor data.
Methods in Ecology and Evolution, 6(5), 500–509. https://doi.org/10.1111/2041-210X.12346
Lynam, A. J., Jenks, K. E., Tantipisanuh, N., Chutipong, W., Ngoprasert, D., Gale, G.
A., … Leimgruber, P. (2013). Terrestrial activity patterns of wild cats from camera-trapping.
Raffles Bulletin of Zoology, 61(1), 407–415.
Marker, L. L., Fabiano, E., & Nghikembua, M. (2008). The Use of Remote Camera
Traps to Estimate Density of Free- ranging Cheetahs in North-Central Namibia. CAT News,
49(1), 22–24.
Mondol, S., Bruford, M. W., & Ramakrishnan, U. (2013). Demographic loss, genetic
structure and the conservation implications for Indian tigers. Proceedings of The Royal Society
Biological Sciences, 280, 1–10. https://doi.org/10.1098/rspb.2013.0496
Mukherjee, S., Goyal, S. P. & Chellam, R. (1994b). Standardizationof scat analysis
techniques for leopard (Panthera pardus) in GirNational Park, western India. Mammalia 58:
139– 143.
Muller-Dombois, D. and Ellenberg, H. 1974. Aims and methods of vegetationecology.
John Walley and Sons. New York, London, Sydney, Toronto,547

CHAPTER 8: REFERENCES 79© The Corbett Foundation
Nowell, K., & Jackson, P. (Eds.). (1996). Wild cats: status survey and conservation
action plan (Vol. 382). Gland: IUCN.
Noss, R. F., Quigley, H. B., Hornocker, M. G., Merrill, T., & Paquet, P. C. (1996).
Conservation Biology and Carnivore Conservation in the Rocky Mountains, 10(4), 949–963.
Otis, D., Burnham, K., White, G., & Anderson, D. (1978). Statistical Inference from
Capture Data on Closed Animal Populations. Wildlife Monographs, (62), 3-135.
O’Brien, T.G., Kinnaird, M.F. & Wibisono, H.T. (2003) Crouching tigers, hidden prey:
Sumatran tiger and prey populations in a tropical forest landscape. Animal Conservation, 6,
131–139.
Putman, R.J. (1984). Facts from faeces. Mammal Rev. 14, 79–97
Pianka, E.R., 1969. Sympatry of desert lizards (Ctenotus) in Western
Australia. Ecology, 50(6), pp.1012-1030.
Prater, S.H. 1980. The book of Indian animals. Bombay NaturalHistory Society, Bombay.
Rabinowitz, A. (1989). The density and behavior of large cats in a dry tropical forest
mosaic in Huai Kha Khaeng Wildlife Sanctuary, Thailand. Nat. Hist. Bull. Siam. Soc. 37,
235–251.
Reddy, H.S., Srinivasulu, C. & Rao, K.T. (2004). Preyselection by the Indian tiger
(Panthera tigris tigris) inNagarjunasagar Srisailam Tiger Reserve, India. Mammal.Biol. 69,
384– 391.
Rovero, F. and Marshall, A. R. (2009), Camera trapping photographic rate as an index
of density in forest ungulates. Journal of Applied Ecology, 46: 1011-1017.
Rowcliffe, J. M., Field, J. Turvey, S. T. and Carbone, C. (2008), Estimating animal
density using camera traps without the need for individual recognition. Journal of Applied
Ecology, 45: 1228-1236.
Sankar, K.(1994). Ecology of three large sympatric herbivores (Chital, sambar and
nilgai) with special reference for reserve management in Sariska Tiger Reserve, Rajsthan.PhD
thesis.University of Rajsthan, Jaipur.p.190
Sanderson E, Forrest J, Loucks C, Ginsberg J, Dinerstein E, Seidensticker J, Leimgruber
P, Songer M, Heydlauff A, O’Brien T, Bryja G, Klenzendorf S, Wikramanayake ED (2010)
Setting priorities for conservation and recovery of wild tigers: 2005–2015. In: Tilson R, Nyhus
PJ (eds) Tigers of the world: the science, politics and conservation of Panthera tigris. Academic
Press, London, pp 143–161
Schaller, G.B. (1967) The Deer and the Tiger. University of Chicago Press, Chicago
Seidensticker, J. & McDougal, C. (1993) Tiger predatory behaviour, ecology and
conservation. Symposia of the Zoological Society of London, 65, 105-125.
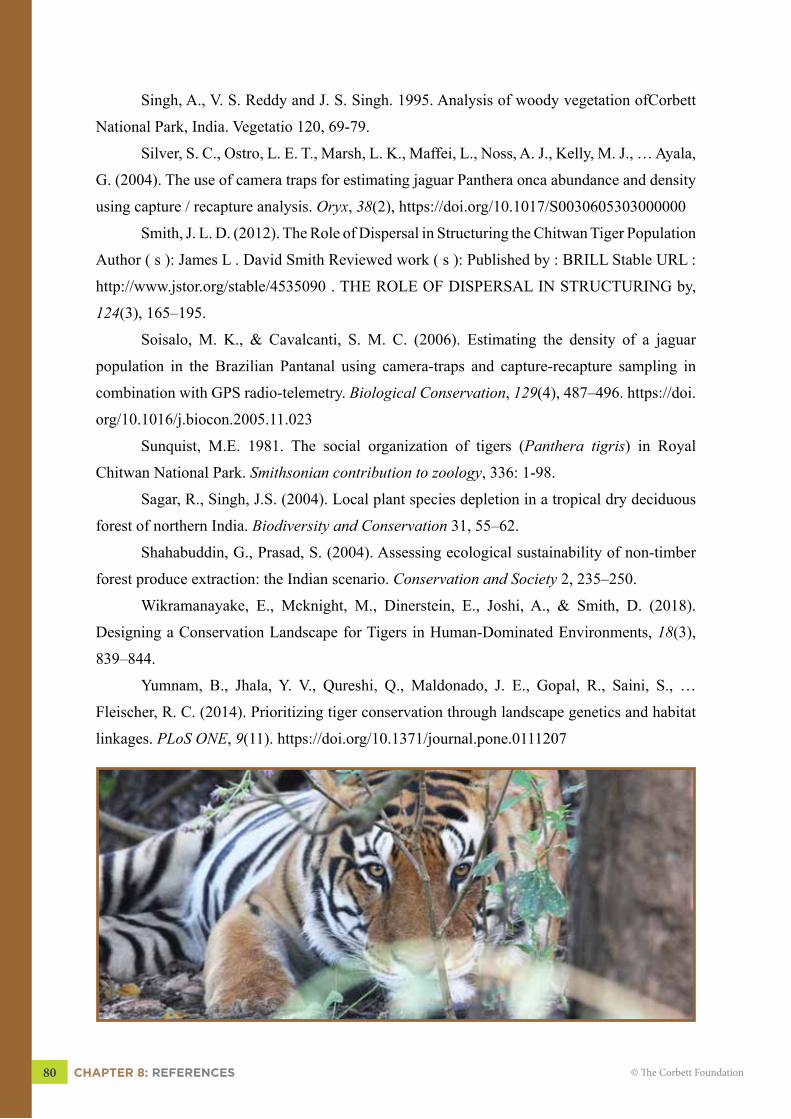
CHAPTER 8: REFERENCES80 © The Corbett Foundation
Singh, A., V. S. Reddy and J. S. Singh. 1995. Analysis of woody vegetation ofCorbett
National Park, India. Vegetatio 120, 69-79.
Silver, S. C., Ostro, L. E. T., Marsh, L. K., Maffei, L., Noss, A. J., Kelly, M. J., … Ayala,
G. (2004). The use of camera traps for estimating jaguar Panthera onca abundance and density
using capture / recapture analysis. Oryx, 38(2), https://doi.org/10.1017/S0030605303000000
Smith, J. L. D. (2012). The Role of Dispersal in Structuring the Chitwan Tiger Population
Author ( s ): James L . David Smith Reviewed work ( s ): Published by : BRILL Stable URL :
http://www.jstor.org/stable/4535090 . THE ROLE OF DISPERSAL IN STRUCTURING by,
124(3), 165–195.
Soisalo, M. K., & Cavalcanti, S. M. C. (2006). Estimating the density of a jaguar
population in the Brazilian Pantanal using camera-traps and capture-recapture sampling in
combination with GPS radio-telemetry. Biological Conservation, 129(4), 487–496. https://doi.
org/10.1016/j.biocon.2005.11.023
Sunquist, M.E. 1981. The social organization of tigers (Panthera tigris) in Royal
Chitwan National Park. Smithsonian contribution to zoology, 336: 1-98.
Sagar, R., Singh, J.S. (2004). Local plant species depletion in a tropical dry deciduous
forest of northern India. Biodiversity and Conservation 31, 55–62.
Shahabuddin, G., Prasad, S. (2004). Assessing ecological sustainability of non-timber
forest produce extraction: the Indian scenario. Conservation and Society 2, 235–250.
Wikramanayake, E., Mcknight, M., Dinerstein, E., Joshi, A., & Smith, D. (2018).
Designing a Conservation Landscape for Tigers in Human-Dominated Environments, 18(3),
839–844.
Yumnam, B., Jhala, Y. V., Qureshi, Q., Maldonado, J. E., Gopal, R., Saini, S., …
Fleischer, R. C. (2014). Prioritizing tiger conservation through landscape genetics and habitat
linkages. PLoS ONE, 9(11). https://doi.org/10.1371/journal.pone.0111207
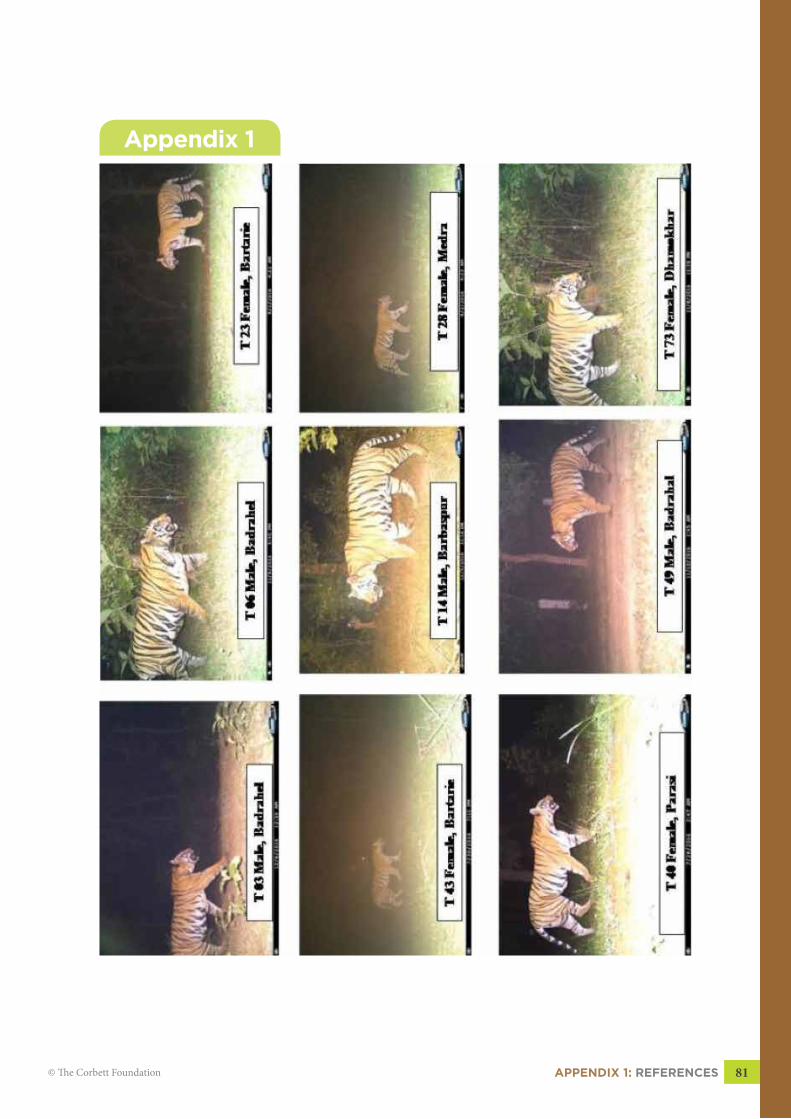
APPENDIx 1: REFERENCES 81© The Corbett Foundation
Appendix 1
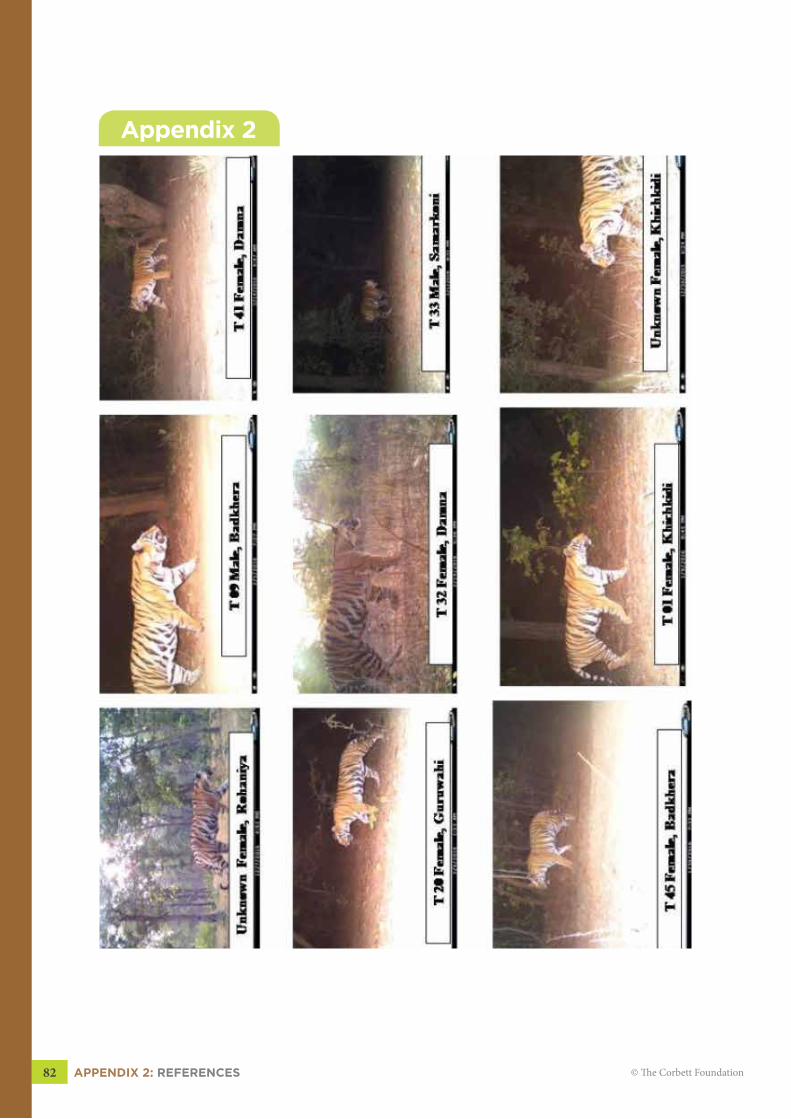
APPENDIx 2: REFERENCES82 © The Corbett Foundation
Appendix 2
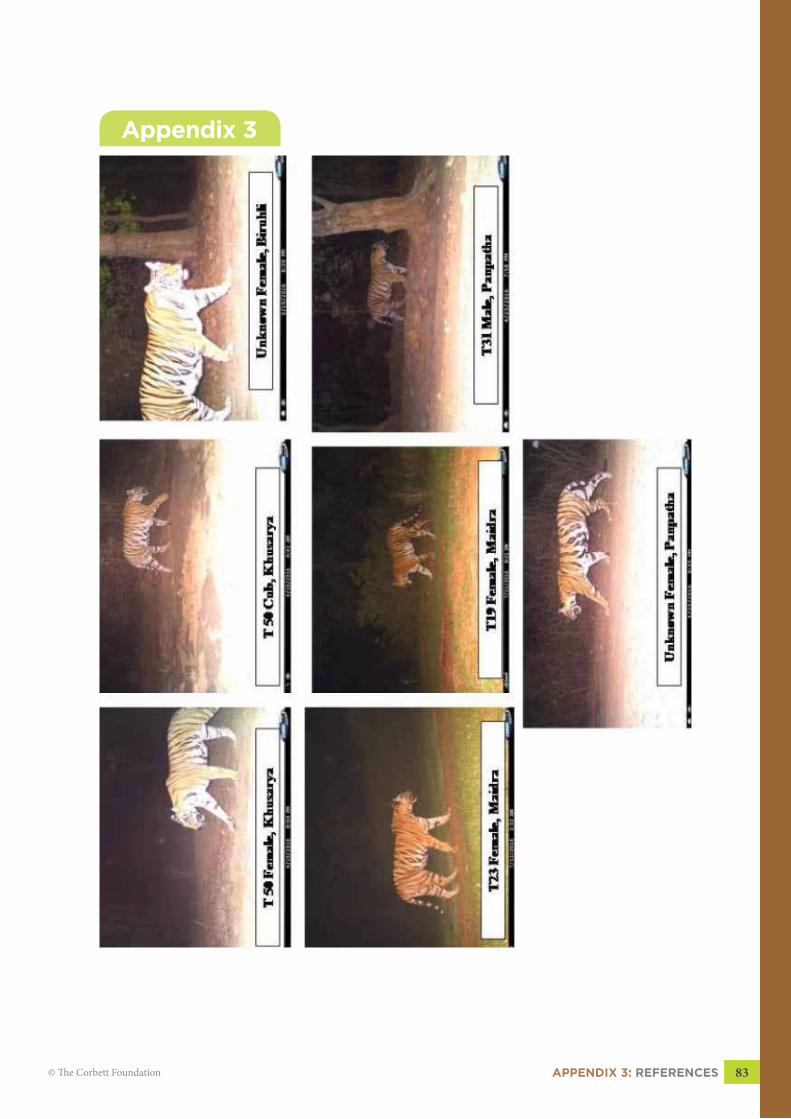
APPENDIx 3: REFERENCES 83© The Corbett Foundation
Appendix 3
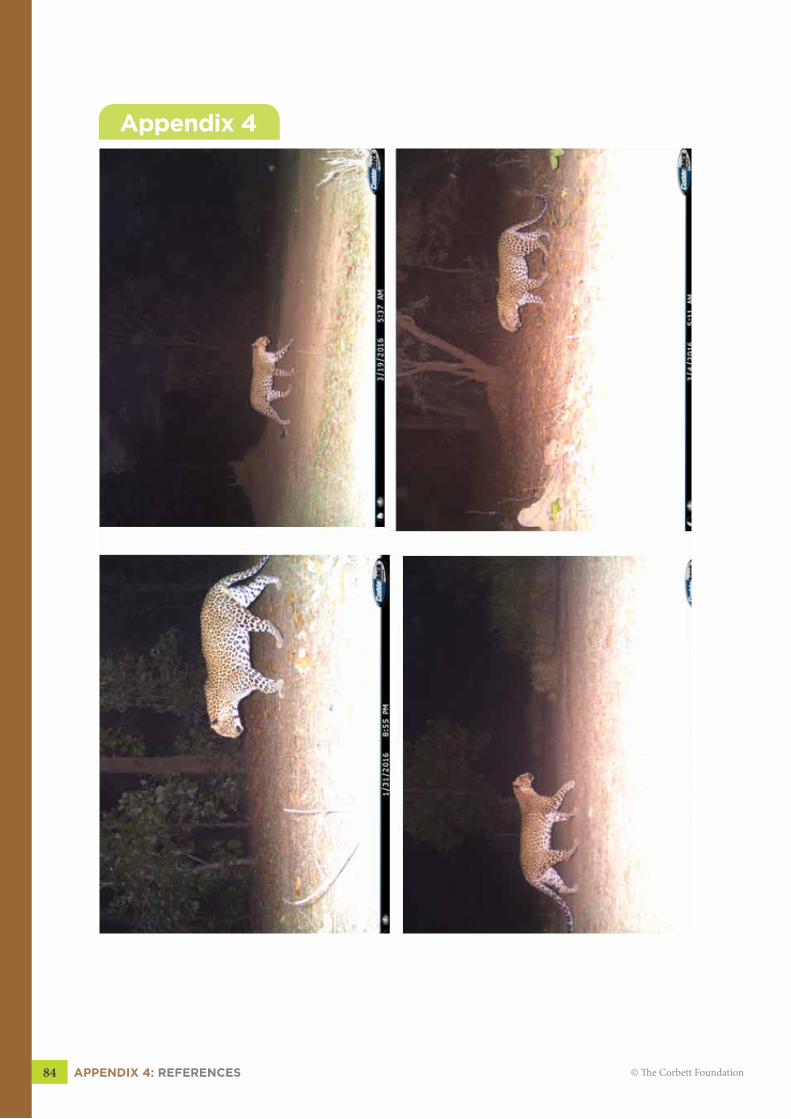
APPENDIx 4: REFERENCES84 © The Corbett Foundation
Appendix 4
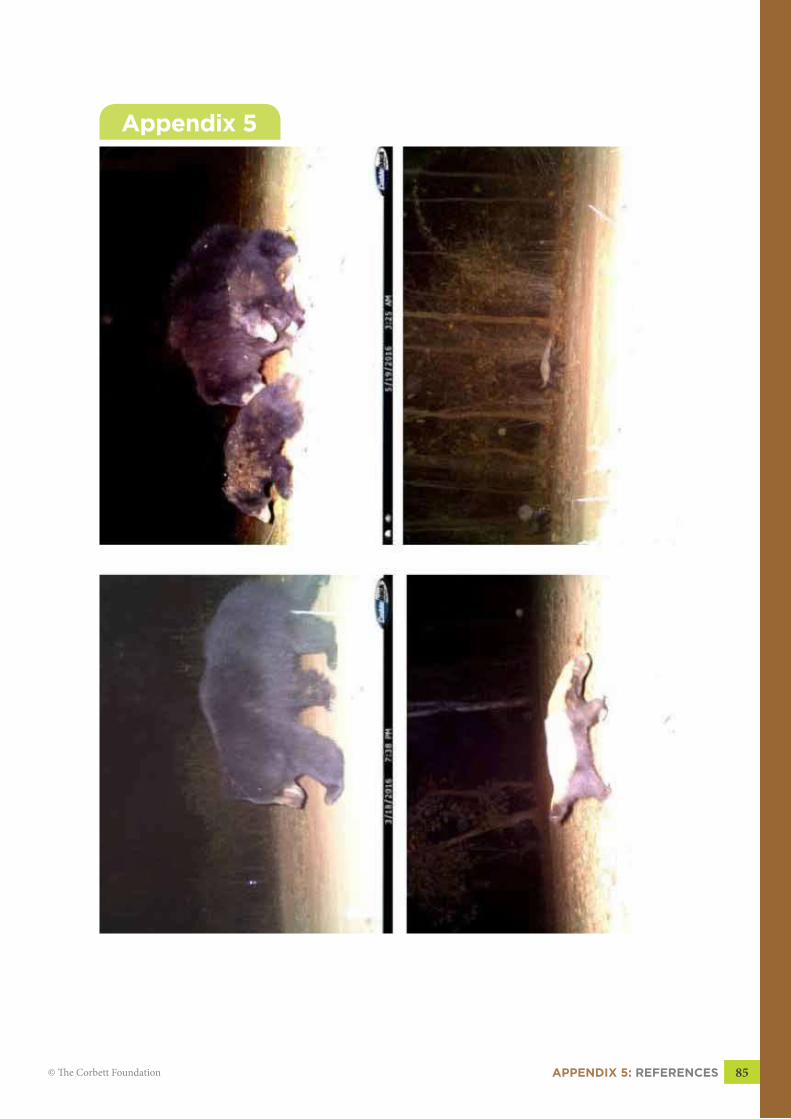
APPENDIx 5: REFERENCES 85© The Corbett Foundation
Appendix 5
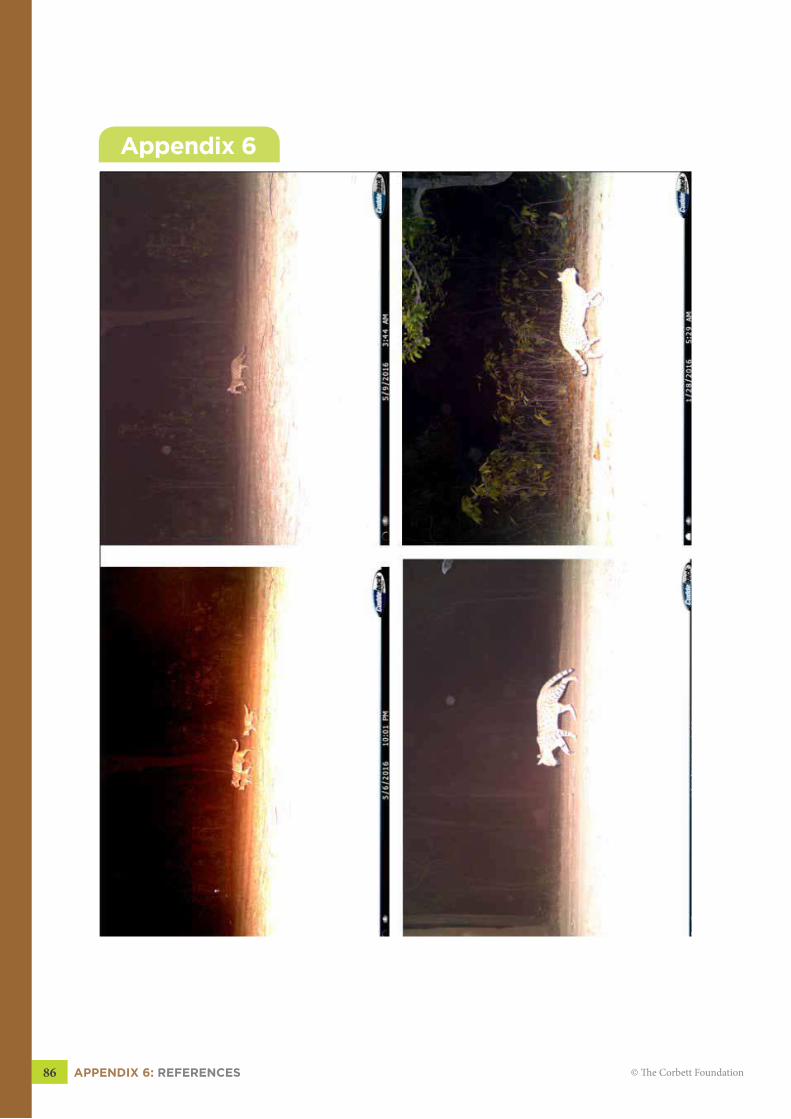
APPENDIx 6: REFERENCES86 © The Corbett Foundation
Appendix 6
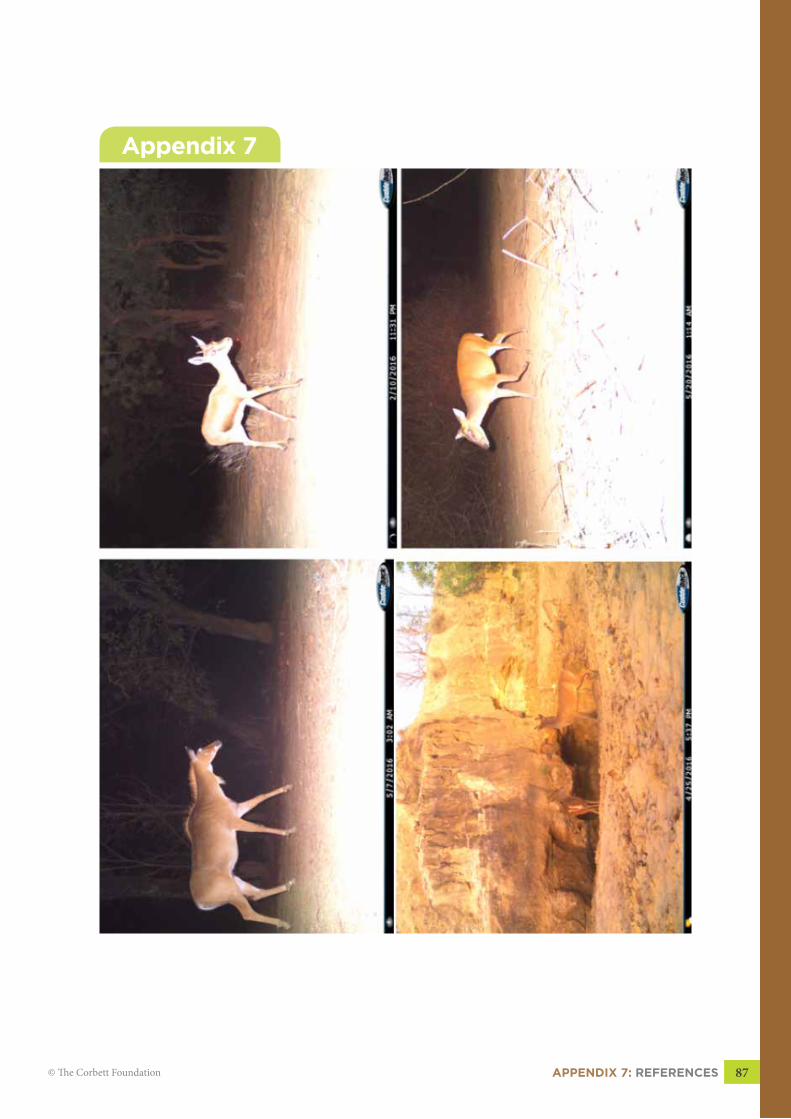
APPENDIx 7: REFERENCES 87© The Corbett Foundation
Appendix 7
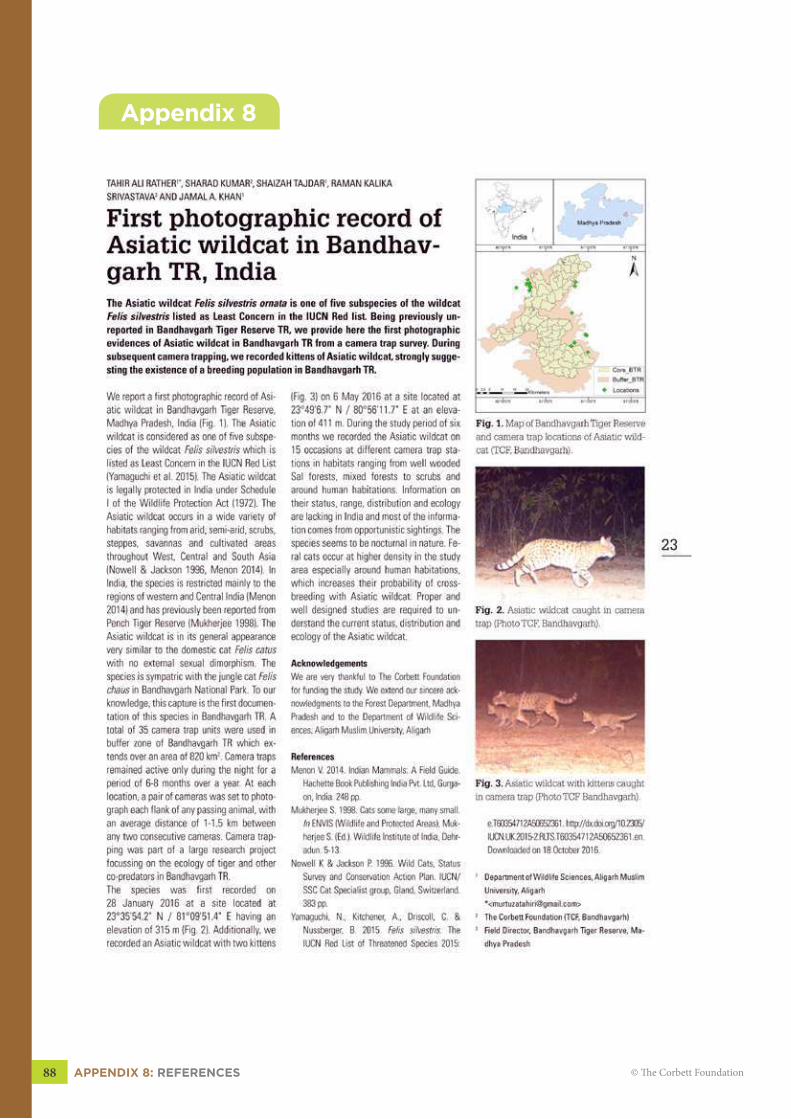
APPENDIx 8: REFERENCES88 © The Corbett Foundation
Appendix 8
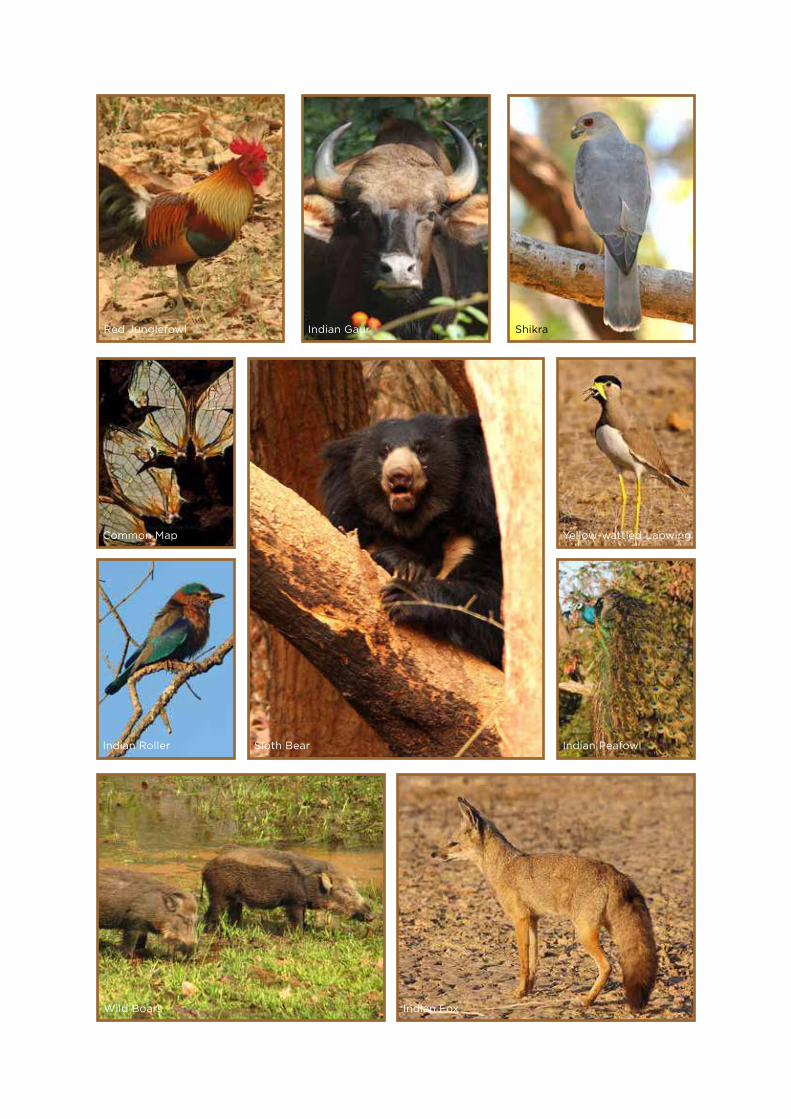
Red Junglefowl
Common Map Yellow-wattled Lapwing
Sloth Bear
Wild Boars Indian Fox
Indian Roller Indian Peafowl
Indian Gaur Shikra

Report Design and Art Direction: Krupa Thakur-Patil. Page Composition: Kushal Sutar.
DISPERSAL ROUTES OF TIGER AND OTHER WILDLIFE
IN THE BUFFER ZONE OF BANDHAVGARH TIGER RESERVE, MADHYA PRADESH, INDIA
Published byThe Corbett Foundation
Email: [email protected] Website: www.corbettfoundation.org
Administrative office81/88, ‘Atlanta’, 8th floor,
209 Nariman Point, Mumbai,Maharashtra 400021. Tel. +91 22 6146 6400
Bandhavgarh officeVillage Bijhariya,
P.O. Bandhavgarh (Tala), Umaria,Madhya Pradesh 484664.
Tel.: +91 7627 265345